Working with slides - Refinitiv
22
Canadian Venture Capital Review First Nine Months 2018 Carlos Osoriov, Reuters
-
Upload
khangminh22 -
Category
Documents
-
view
0 -
download
0
Transcript of Working with slides - Refinitiv
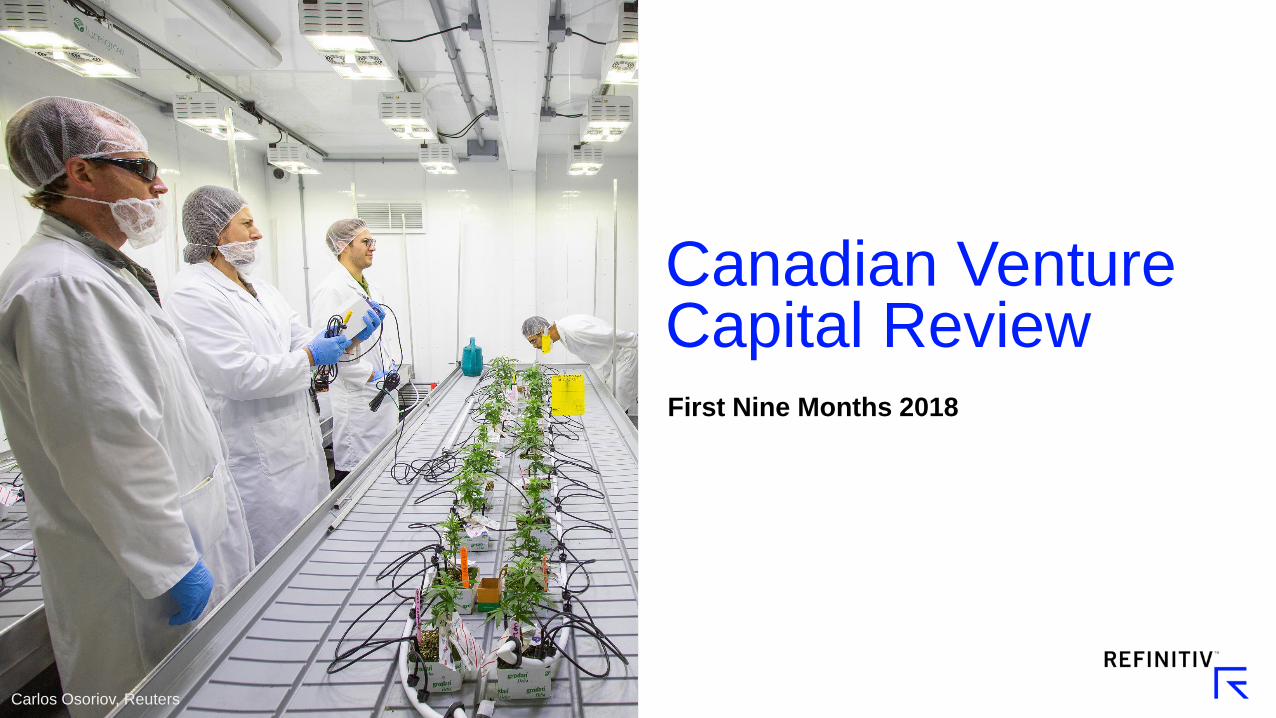
Canadian Venture Capital Review First Nine Months 2018
Carlos Osoriov, Reuters

2
Table of Contents
Canada’s VC Market in First 3Q 2018 3
$ Invested and # Companies Financed 5
Top VC Deals 7
Top VC Investors 8
North American Rankings 10
Investor Type & Nationality 14
Canada by Sector & Stage 16
Canadian Dealmaking Abroad 18
VC Funds Raised 19
Public and M&A Exits 20
Venture Capital Returns 21
Explanatory Notes & Contacts 22

3
Canadian Venture Capital Market Activity in the First Nine Months of 2018
Canadian VC Market Trends
Canadian venture capital activity slowed somewhat in the third quarter of 2018, with $694 million invested in 105 rounds of financing. While the third quarter is traditionally
the weakest for Canadian dealmaking, the three month period from July to September saw the least capital invested in a single quarter since Q2 2015, and the fewest
deals completed since Q3 2012. However, this marked only the second time in the past two years when quarterly Canadian investment volumes fell below $1 billion. In
year-to-date terms, Canadian companies raised $3.2 billion in the first nine months, the strongest first three quarters since 2001. Deal volumes were also up 4% from the
same period last year.
Leading the Top Deals list for the first nine months of the year was the $280 million February round into Montréal-based Enerkem, a company that turns solid waste into
biofuels and renewable chemical products. The round, which was Canada’s largest cleantech deal ever, included a consortium of Canadian investors including Cycle
Capital, Fondaction, Investissement Québec, and Fonds de Solidarité FTQ. Other top deals for the first nine months included cloud-based medical care platform
PointClickCare’s $187 million investment by Dragoneer Investment Group, and AI-powered search technologies company Coveo Solutions, which secured a $100 million
investment by Evergreen Coast Capital in April.
Canadian investors slightly outpaced United States-based investors in the first nine months of 2018, accounting for 48% of invested capital, a share that has been
consistently declining since 2014 when Canadian investors accounted for 57% of invested capital. United States-based investors accounted for 43% of venture capital
invested in Canadian companies in the first three quarters, while other overseas investors mostly from Asia and Western Europe accounted for the remaining 10% of
capital invested.
Canada VC Fundraising Trends
Though the third quarter saw only $392 million in fund closings, it came off the heels of a wildly successful second quarter, which saw $1.6 billion in venture capital funds
raised. Leading the way was the $715 million close of Georgian Partners Growth Fund IV, which will be used to expand the firm’s presence across the entirety of North
America. Other substantial closings during the year include the $257 million closing of Brookfield Ventures, White Star Capital’s oversubscribed Fund II at $233 million,
and BDC’s Women In Technology Fund at $200 million.

4
Canadian Venture Capital Market Activity in the First Nine Months of 2018
Canadian VC Trends by Region
Ontario-based companies received $1.6 billion, or half of all disclosed investment dollars during the first nine months. The represented a 45% increase from the same
period last year and landed Ontario in fifth place in North American rankings, behind Washington and ahead of Texas. Québec-based companies raised $940 million
during the same period, a decrease of 9% from the prior year. This earned Québec an eleventh place ranking overall, behind New Jersey and ahead of Florida. British
Columbia also made the top twenty with $539 million, earning it the 18th spot, between Connecticut and Minnesota, although this was a 27% decrease from the
investment level in the region during the first nine months of 2017.
Toronto-based companies were the reason behind Ontario’s surge, as they raised $1.4 billion during the first nine months, a solid 60% increase from the same period in
2017. Three quarters of all Ontario financings took place in the greater Toronto area, and this earned the city a 9th place finish in the North American rankings, ahead of
Denver and behind the Washington metro area. Montréal ranked 14th with $724 million invested in 97 deals, ahead of the Research Triangle but behind Orange County.
Canadian VC Trends by Sector
Canadian information technology companies continued to be the main driving force behind VC investment, raising $2.2 billion in the first nine months, representing a 17%
increase year-over-year. Information technology companies also accounted for a 70% share of overall VC in the period, a share that has consistently risen from a 50%
share in 2009.
The life sciences sector on the other hand saw its seventh straight quarter of declines, with only $71 million invested, the worst quarter for the sector since Q4 2015.
Cleantech companies raised $491 million during the first nine months, up 149% year-over-year, largely led by the $280 million Enerkem investment.
Canadian Fund Performance
Although investment activity continues to reach new heights, the performance of Canadian venture capital and growth equity funds had not quite attained the same levels.
Published data provided by Cambridge Associates shows Canadian venture capital & growth equity funds with vintage years of 2000 or greater returned a since inception
IRR of only 4.6% as of the end of Q2 2018, lagging behind both US counterparts and public market equivalents. The improvement of Canadian VC fund returns from 2014
through 2016 has not maintained momentum, and returns since have held flat.

5
Historical Investment in Canadian Companies: Venture Capital Deal Values
$3.2
$6.4
$4.2
$2.7
$1.6
$2.1 $1.8 $1.9
$2.3
$1.4
$1.0 $1.2
$1.6 $1.6
$1.9
$2.4
$2.8
$3.7
$4.1
$0
$1
$2
$3
$4
$5
$6
$7
2000 2001 2002 2003 2004 2005 2006 2007 2008 2009 2010 2011 2012 2013 2014 2015 2016 2017 2018
VC
De
al V
alu
es
($
Bil
lio
ns
)
Q1 Q2 Q3 Q4
Canadian companies raised $3.2 billion in the first three quarters, the strongest first nine months since 2001, but investment in
Q3 2018 was the weakest individual quarter since Q4 2015.

6
Historical Investment in Canadian Companies: Venture Capital Deal Volumes
393
1,332
972
855
774
674 679
512 499 490
409 388 442 447
475
569 595 576
509
0
200
400
600
800
1,000
1,200
1,400
2000 2001 2002 2003 2004 2005 2006 2007 2008 2009 2010 2011 2012 2013 2014 2015 2016 2017 2018
Q1 Q2 Q3 Q4
A total of 393 venture capital deals were completed in the first three quarters. While this was up 4% over the same period last
year, Q3 saw only 105 transactions, the weakest individual quarter in six years.
# o
f V
C D
ea
ls

7
Top Canadian Venture Capital Deals, First Nine Months 2018
Portfolio Company Investors
Rank Company Name Deal Value
($ Millions) Location Sector Investing Firms (Disclosed)
1 Enerkem $280.0 Montréal, QC Biofuels &
Renewables
Blackrock, Braemar Energy Ventures, Cycle Capital,
Fondaction, Fonds de Solidarité FTQ, Investissement
Québec, National Bank, Rho Capital Partners, Sinobioway,
Waste Management, Westly Group
2 PointClickCare Technologies $187.3 Mississauga, ON Healthcare Software Dragoneer Investment Group
3 Coveo Solutions $100.0 Québec, QC Enterprise Search Evergreen Coast Capital
4 Ritual Technologies $85.6 Toronto, ON Dining App Georgian Partners, Greylock Partners, Insight Venture
Partners, Mistral Venture Partners
5 Ecobee $78.8 Toronto, ON Smart Thermostats
Energy Impact Partners, Amazon Alexa Fund, Export
Development Canada, GXP Investments, Northleaf Capital
Partners, Ontario Capital Growth Corp, Relay
Ventures, Tech Capital , Thomvest
6 TouchBistro $67.8 Toronto, ON Mobile POS Solutions JPMorgan Chase, OMERS Ventures, BDC Venture Capital,
Relay Ventures, Napier Park Global Capital, Recruit
Holdings
7 Kira $65.9 Toronto, ON Machine Learning Insight Venture Partners
8 Wealthsimple $64.8 Toronto, ON Robo-Advisor Power Financial
9 Tilray Canada $63.5 Nanaimo, BC Cannabis Not Disclosed
10 Wattpad $63.0 Toronto, ON Multiplatform
Entertainment Tencent Holdings, BDC Venture Capital, Kickstart
Ventures, Peterson Group, The Raine Group

8
Top VC Investors in Canadian Companies: First Nine Months 2018
Canadian Private Independent Partnerships
Rank Firm Name # of Deals Estimated Investments
($ Millions) Location
1 Real Ventures 55 $83.8 Montréal, QC
2 iNovia Capital 21 $38.8 Montréal, QC
3 Cycle Capital - Ecofuel 18 $41.1 Montréal, QC
4 Anges Québec Capital 13 $9.1 Montréal, QC
5 Yaletown Venture Partners 9 $34.1 Vancouver, BC
6 Relay Ventures 8 $34.0 Toronto, ON
7 Vanedge Capital 8 $10.9 Vancouver, BC
8 iGan Partners 7 $11.2 Toronto, ON
9 Golden Ventures 6 $11.5 Toronto, ON
10 GeneChem 6 $6.8 Montréal, QC
11 Panache Ventures 6 $1.4 Montréal, QC
12 Espresso Capital Partners 4 $19.5 Toronto, ON
13 Genesys Capital 4 $18.9 Toronto, ON
14 Fonds Innovexport 4 $2.3 Québec, QC
9
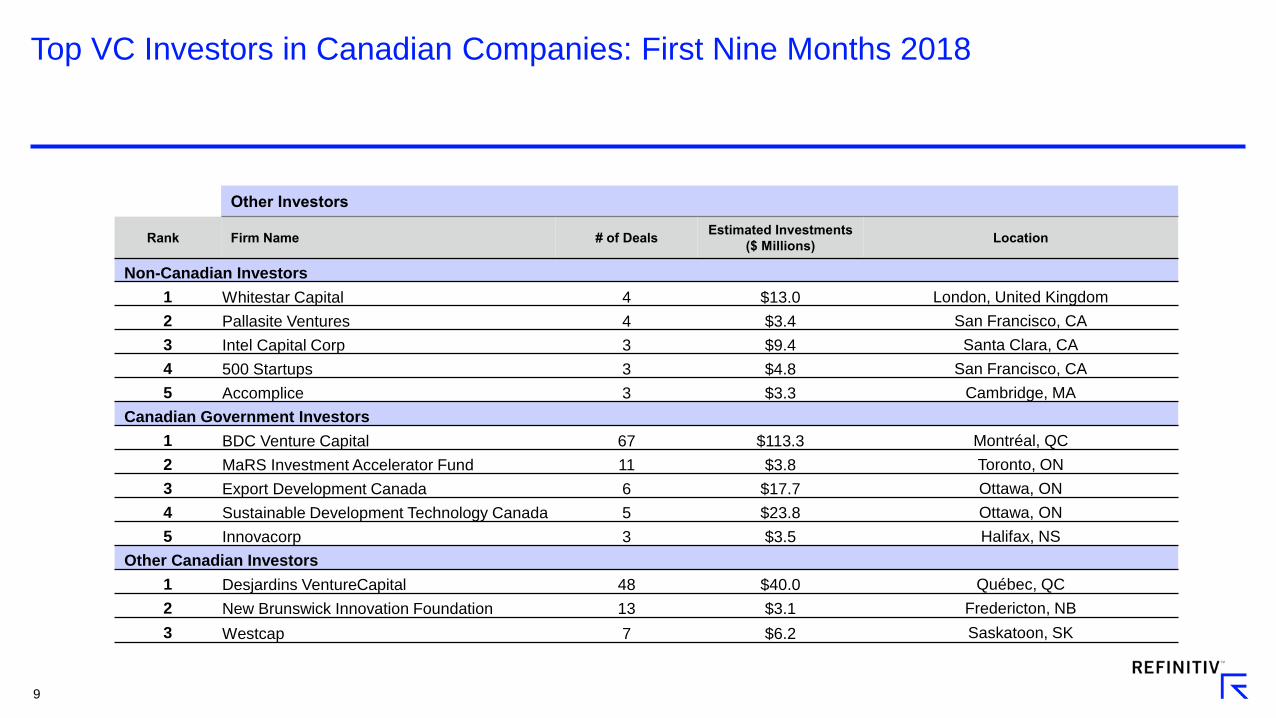
Top VC Investors in Canadian Companies: First Nine Months 2018
Other Investors
Rank Firm Name # of Deals Estimated Investments
($ Millions) Location
Non-Canadian Investors
1 Whitestar Capital 4 $13.0 London, United Kingdom
2 Pallasite Ventures 4 $3.4 San Francisco, CA
3 Intel Capital Corp 3 $9.4 Santa Clara, CA
4 500 Startups 3 $4.8 San Francisco, CA
5 Accomplice 3 $3.3 Cambridge, MA
Canadian Government Investors
1 BDC Venture Capital 67 $113.3 Montréal, QC
2 MaRS Investment Accelerator Fund 11 $3.8 Toronto, ON
3 Export Development Canada 6 $17.7 Ottawa, ON
4 Sustainable Development Technology Canada 5 $23.8 Ottawa, ON
5 Innovacorp 3 $3.5 Halifax, NS
Other Canadian Investors
1 Desjardins VentureCapital 48 $40.0 Québec, QC
2 New Brunswick Innovation Foundation 13 $3.1 Fredericton, NB
3 Westcap 7 $6.2 Saskatoon, SK

10
North American VC Rankings, by Province & State
North American Rankings – First Nine Months 2018
Rank State / Province # of Deals Deal Values
($ Millions)
Year-Over-Year
Change in $
Invested
1 California 1,323 $46,147 ▲ 46.2%
2 New York 418 $10,889 ▼ -14.3%
3 Massachusetts 308 $10,311 ▲ 54.9%
4 Washington 101 $1,987 ▲ 23.2%
5 Ontario 133 $1,565 ▲ 45.0%
6 Texas 126 $1,399 ▲ 17.4%
7 Colorado 91 $1,343 ▲ 34.9%
8 Maryland 50 $1,123 ▲ 93.9%
9 Illinois 78 $1,059 ▼ -5.4%
10 New Jersey 32 $964 ▲ 135.8%
11 Québec 132 $940 ▼-8.5%
12 Florida 43 $893 ▲ 51.1%
13 Pennsylvania 123 $873 ▲ 45.8%
14 North Carolina 49 $686 ▼ -0.2%
15 Ohio 66 $639 ▲ 85.5%

11
North American VC Rankings, by Province & State
North American Rankings – First Nine Months 2018
Rank State / Province # of Deals Deal Values
($ Millions)
Year-Over-Year
Change in $
Invested
16 Oregon 25 $632 ▲ 264.8%
17 Connecticut 38 $565 ▲ 92.0%
18 British Columbia 74 $539 ▼ -26.7%
19 Minnesota 31 $522 ▲ 17.5%
20 Utah 37 $494 ▼ -36.1%
21 Virginia 53 $458 ▼ -5.3%
22 Michigan 32 $397 ▲ 23.9%
23 Georgia 26 $306 ▼ -68.6%
24 District of Columbia 13 $283 ▼ -35.4%
25 Arizona 21 $254 ▲ 28.9%
26 Tennessee 23 $243 ▲ 163.0%
27 Missouri 22 $207 ▼ -13.9%
28 Kansas 4 $144 ▲ 773.3%
29 Indiana 28 $131 ▲ 45.0%
30 New Mexico 12 $115 ▼ -2.4%

12
34%
34%
19%
13%
Ontario Quebec British Columbia Other Regions
50%
30%
17%
3%
Canadian VC Investment by Province & Region With seven of the top ten deals of the first nine months falling within its borders, Ontario saw not only a 45% increase in
disbursements year-over-year, but also vaulted into 5th place in the North American rankings, between Washington & Texas.
$3,207
Million
Invested
393 Deals

13
North American VC Rankings, by Metro Region
North American Rankings – First Nine Months 2018
Rank Metro Region # of Deals Deal Values
($ Millions)
Year-Over-Year
Change in $
Invested
1 San Francisco 586 $20,594 ▲ 68.3%
2 San Jose 445 $16,543 ▲ 19.8%
3 New York City 451 $11,941 ▼ -8.5%
4 Boston 298 $10,231 ▲ 59.6%
5 Los Angeles 173 $5,282 ▲ 73.7%
6 San Diego 62 $2,538 ▲ 107.5%
7 Seattle 97 $1,942 ▲ 26.0%
8 Washington Metroplex 116 $1,864 ▲ 24.1%
9 Toronto 100 $1,398 ▲ 59.7%
10 Denver 82 $1,248 ▲ 36.7%
11 Chicago 75 $1,057 ▼ -4.1%
12 Philadelphia 71 $900 ▲ 89.4%
13 Orange County 41 $824 ▲ 24.9%
14 Montréal 97 $724 ▼ -15.8%
15 Research Triangle 35 $663 ▲ 267.9% Toronto Avg.:
$14.0 Million
Montréal Avg.:
$7.5 Million

14
0%
10%
20%
30%
40%
50%
60%
70%
80%
90%
100%
2014 2015 2016 2017 2018
Canada United States Other
Venture Capital Investment by Origin of Capital Over two thirds of VC investment was attributable to private independent funds in the first nine months of 2018. Canadian funds
accounted for under half of all investment in Canadian companies for the second consecutive year.
0%
10%
20%
30%
40%
50%
60%
70%
80%
90%
100%
2014 2015 2016 2017 2018
Private Independent Corporate Government
Institutional Retail Angels & Individuals
Other

15
Venture Capital to Canadian Companies from Non-Canadian Investors
UK: $32 M
China: $39 M
Hong Kong: $27 M
Singapore: $24 M
Australia: $24 M
California: $253 M New York: $251 M
Investment by United States-based firms accounted for 43% of all VC investment in Canadian companies. Other non-Canadian
investors, mostly from Europe and Asia, accounted for 9% of all activity, down from 15% in all 2017.
$3.2 B

16
Venture Capital by Sector
$0
$1
$2
$3
$4
$5
2009 2010 2011 2012 2013 2014 2015 2016 2017 2018Annualized
VC
De
al V
alu
es
($
Bil
lio
ns
)
Information Technology Life Sciences Other Sectors
Information Technology investment continued to grow in both gross and proportional terms, comprising less than 50% of all VC
investment in 2009 to over 70% in the first nine months of 2018.

17
0
100
200
300
400
500
600
700
2009 2010 2011 2012 2013 2014 2015 2016 2017 2018Annualized
Seed Early Stage Later Stage Expansion Other Advanced Stage
# o
f V
C D
ea
ls
Venture Capital by Stage With 212 early stage VC deals in Canada in the first nine months, early stage deals took a 40% share of all rounds of
financing, setting a new record.

18
Canadian Dealmaking Abroad, First Nine Months 2018
Portfolio Company Investors
Rank Company Name Deal Value
($ Millions) Location Sector Investing Firms (Disclosed)
1 Katerra $1,068 Menlo Park, CA Building Development
Optimization Canada Pension Plan Investment Board
2 Tradeshift $325 San Francisco, CA Supply Chain Platform Public Sector Pension Investment Board
3 Stem $200 Millbrae, CA Energy Storage
Intelligence Ontario Teachers’ Pension Plan
4 Convene Conference Centers $199 New York, NY Meeting Spaces Brookfield Property Partners
5 Collective Health $141 San Francisco, CA Workforce Health
Management Sun Life Financial
$0.0
$0.5
$1.0
$1.5
2009 2010 2011 2012 2013 2014 2015 2016 2017 2018Annualized
VC
Deal
Valu
es
($ B
illio
ns)
Canadian funds’ investments abroad in the first three quarters already doubled the amount invested in non-Canadian
companies in the entire 2016 calendar year.

19
Canadian Venture Capital Fundraising
$890
$45
$725
$563
$144
$475
$203
$453
$157
$1,576
$392
$0
$500
$1,000
$1,500
$2,000
Q1 2016 Q2 2016 Q3 2016 Q4 2016 Q1 2017 Q2 2017 Q3 2017 Q4 2017 Q1 2018 Q2 2018 Q3 2018
VC
Fu
nd
s R
ais
ed
($
Millio
ns
)
With 23 individual Canadian VC funds holding a closing in the first three quarters, Canada stays on pace for a record
fundraising year.

20
Exits from Canadian Portfolio Companies, First Nine Months 2018
Portfolio Company Investors
Rank Company Name Deal Value
($ Millions) Location Sector Investing Firms (Disclosed)
1 AurKa Pharma $736.6 Montréal, QC Pharmaceutical
Research TVM Capital
2 Napec $395.7 Drummondville, QC Energy & Industrial Business Development Bank of Canada, Caisse de dépôt et
placement du Québec, Fondaction, Fonds de Solidarité
FTQ, Investissement Québec
3 AlarmForce Industries $163.2 Toronto, ON Security Solutions Clearspring Capital Partners, GrowthWorks Capital
4 Bonfire $140.3 Kitchener, ON Sourcing Enablement Battery Ventures, Crosslink Capital, Spider Capital Partners
5 Jempak Canada $117.1 Oakville, ON Chemicals Roynat Capital, Acasta Enterprises
0
20
40
60
80
2009 2010 2011 2012 2013 2014 2015 2016 2017 2018Annualized
With 28 deals recorded in the first 9 months of 2018, Canadian exits were led by Eli Lilly’s buy of AurKa Pharma.
# o
f E
xits

21
-4%
-2%
0%
2%
4%
6%
8%
10%
Q2 2014 Q2 2015 Q2 2016 Q2 2017 Q2 2018
U.S. Venture Capital & Growth Equity Funds
mPME S&P 500 Index
Cambridge Associates: Venture Capital Fund Performance
-4%
-2%
0%
2%
4%
6%
8%
10%
Q2 2014 Q2 2015 Q2 2016 Q2 2017 Q2 2018
Canadian Venture Capital & Growth Equity Funds
mPME: S&P/TSX 60 Index
Canadian private independent funds holding positive returns following long stretch of negative performance, but still lagging
behind US-based funds and public markets.

22
Explanatory Notes
1. Data collected and analyzed by Refinitiv for this statistical report were drawn from a variety of sources including Refinitiv M&A databases, regulatory filings, press releases, and proprietary reports from Canadian and non-resident
venture capital firms, private equity firms, law firms, and other service providers.
2. The Refinitiv Canadian venture capital report measures cash for equity and quasi-equity investments by the professional venture capital community in emerging companies in Canada. These transactions are referred to as VCReporter
Deals on Refinitiv databases.
3. The report includes the investment activity of professional venture capital firms, whether Canadian-based or not, including private independent funds, retail funds (LSVCCs and PVCCs), venture arms of corporations, institutions,
government funds, angel funds, and similar entities whose primary activity is financial investing. Where there are additional participants such as angels, corporations, governments, or company officers in a qualified and verified
financing round, the entire amount of the round is included.
4. The report excludes venture debt, buyouts, recapitalizations, secondary purchases, IPO exits, and other forms of private equity that do not involve cash such as services-in-kind. Investments in capital pool companies (CPCs & JCPs)
are not eligible. Companies whose primary activity is the extraction of natural resources (agriculture, forestry, mining, and oil & gas exploration) without a specific focus on technology are not eligible.
5. Rounds are tracked based on investment location. This predominantly includes Canadian-headquartered companies, but companies headquartered outside of Canada with Canadian research & development facilities are also eligible.
6. Rankings of top VC investors include only investment activity made in Canadian portfolio companies. Estimated investment activity is based on the actual syndicate breakdown, where available, and is split equally among disclosed
investors where actual breakdowns are not available. Private independent, government, and other funds are independently ranked in their respective categories. Rankings capture the nine-month period from January 1st, 2018 to
September 30th, 2018.
7. Fund performance data and public market equivalents are produced via the Cambridge Associates Benchmark Calculator, available through Refinitiv Eikon. Returns are for Canadian and US venture capital and growth equity funds
with vintage years of 2000 or greater, on a first cash flow basis, in Canadian dollars, from inception to the end of the indicated quarter, under published data mode Q2 2018. Pooled internal rates of return are net of fees, expenses and
carried interest. CA Modified Public Market Equivalent (mPME) replicates private investment performance under public market conditions. The public index’s shares are purchased and sold according to the private fund cash flow
schedule, with distributions calculated in the same proportion as the private fund, and mPME NAV is a function of mPME cash flows and public index returns.
8. All current and previous years data is as of Wednesday, October 24th, 2018. Data is continuously updated and is therefore subject to change. All figures are in Canadian dollars unless otherwise noted.
For further information on Refinitiv venture capital and private equity offerings, please visit us at:
– https://financial.thomsonreuters.com/en/products/tools-applications/trading-investment-tools/eikon-trading-software/private-equity-data.html
For further reports on private equity, venture capital, and other asset classes, please visit us at:
– http://dmi.thomsonreuters.com/DealsIntelligence/QuarterlyReviews
Contributors to this analysis are provided with additional packages of data. If you would like to participate in the submission process, receive quarterly press releases, or have questions about our venture capital criteria, please contact us at:
Gavin Penny Greg Beaman
E-mail: [email protected] E-mail: [email protected]
Tel: 416-687-7577 Tel: 416-687-7510