Working memory, attention, and executive function in Alzheimer’s disease and frontotemporal...
18
Research report Working memory, attention, and executive function in Alzheimer’s disease and frontotemporal dementia Cheryl L. Stopford*, Jennifer C. Thompson, David Neary, Anna M.T. Richardson and Julie S. Snowden Cerebral Function Unit, Greater Manchester Neuroscience Centre, Salford Royal NHS Foundation Trust and Clinical Neurosciences Research Group, University of Manchester, UK article info Article history: Received 8 March 2010 Revised 21 May 2010 Accepted 7 December 2010 Action editor Sergio Della Sala Published online 21 December 2010 Keywords: Alzheimer’s disease Working memory Executive function Attention Phenotypic variation abstract Working memory deficits are a recognised feature of Alzheimer’s disease (AD). They are commonly ascribed to central executive impairment and assumed to relate to frontal lobe dysfunction. Performance failures on standard tests of attention and executive function reinforce this interpretation. Nevertheless, early-onset AD patients do not show the frank behavioural changes indicative of frontal lobe dysfunction, and the characteristic functional neuroimaging changes are in posterior hemispheres rather than frontal lobes. We explored this anomaly through a comparison of working memory, attention and executive test performance in patients with AD (a ‘typical’ early-onset group with deficits in memory, language and perceptuospatial function and an ‘amnesic’ group) and frontotemporal dementia (FTD). Typical-AD and FTD patients both showed impaired performance, whereas amnesic-AD patients performed well. Despite similar quantitative performance measures, typical-AD and FTD patients showed qualitatively distinct performance profiles. Impair- ments in FTD patients were interpreted in ‘frontal’ executive terms as deficits in attention, set shifting and response inhibition. AD patients’ performance appeared to be influenced by information load and was interpreted in terms of working memory capacity. In keeping with these different interpretations, neuroimaging showed characteristic frontal lobe abnor- malities in FTD and temporoparietal change in typical-AD. The findings highlight the importance of the posterior hemispheres in working memory and point to a need for caution in the automatic attribution of working memory, attention and executive test failures to frontal lobe failure. They underline also the phenotypic variation within AD. ª 2010 Elsevier Srl. All rights reserved. 1. Introduction Memory dysfunction is a core, defining characteristic of Alzheimer’s disease (AD) (McKhann et al., 1984; Perry et al., 2000; Welsh et al., 1991). It typically manifests as impair- ment in episodic memory (Huff et al., 1987; Perry et al., 2000), but may also include problems in semantic memory (Greene and Hodges, 1996; Hodges and Patterson, 1995; Hodges et al., Abbreviations: AD, Alzheimer’s disease; FTD, Frontotemporal dementia; MRI, Magnetic resonance imaging; SPECT, Single photon emission computed tomography. * Corresponding author. Cerebral Function Unit, Greater Manchester Neuroscience Centre, Salford Royal NHS Foundation Trust, Salford M6 8HD, UK. E-mail address: [email protected] (C.L. Stopford). Available online at www.sciencedirect.com Journal homepage: www.elsevier.com/locate/cortex cortex 48 (2012) 429 e446 0010-9452/$ e see front matter ª 2010 Elsevier Srl. All rights reserved. doi:10.1016/j.cortex.2010.12.002
-
Upload
manchester -
Category
Documents
-
view
1 -
download
0
Transcript of Working memory, attention, and executive function in Alzheimer’s disease and frontotemporal...
www.sciencedirect.com
c o r t e x 4 8 ( 2 0 1 2 ) 4 2 9e4 4 6
Available online at
Journal homepage: www.elsevier.com/locate/cortex
Research report
Working memory, attention, and executive function inAlzheimer’s disease and frontotemporal dementia
Cheryl L. Stopford*, Jennifer C. Thompson, David Neary, Anna M.T. Richardson andJulie S. Snowden
Cerebral Function Unit, Greater Manchester Neuroscience Centre, Salford Royal NHS Foundation Trust and Clinical Neurosciences
Research Group, University of Manchester, UK
a r t i c l e i n f o
Article history:
Received 8 March 2010
Revised 21 May 2010
Accepted 7 December 2010
Action editor Sergio Della Sala
Published online 21 December 2010
Keywords:
Alzheimer’s disease
Working memory
Executive function
Attention
Phenotypic variation
Abbreviations: AD, Alzheimer’s disease; Femission computed tomography.* Corresponding author. Cerebral Function U
M6 8HD, UK.E-mail address: cheryl.stopford@manche
0010-9452/$ e see front matter ª 2010 Elsevdoi:10.1016/j.cortex.2010.12.002
a b s t r a c t
Working memory deficits are a recognised feature of Alzheimer’s disease (AD). They are
commonly ascribed to central executive impairment and assumed to relate to frontal lobe
dysfunction. Performance failures on standard tests of attention and executive function
reinforce this interpretation. Nevertheless, early-onset AD patients do not show the frank
behavioural changes indicative of frontal lobe dysfunction, and the characteristic functional
neuroimaging changes are in posterior hemispheres rather than frontal lobes. We explored
this anomaly through a comparison of working memory, attention and executive test
performance in patients with AD (a ‘typical’ early-onset group with deficits in memory,
language and perceptuospatial function and an ‘amnesic’ group) and frontotemporal
dementia (FTD). Typical-AD and FTD patients both showed impaired performance, whereas
amnesic-AD patients performed well. Despite similar quantitative performance measures,
typical-AD and FTD patients showed qualitatively distinct performance profiles. Impair-
ments inFTDpatientswere interpreted in ‘frontal’ executive termsasdeficits inattention, set
shifting and response inhibition. AD patients’ performance appeared to be influenced by
information load andwas interpreted in terms ofworkingmemory capacity. In keepingwith
these different interpretations, neuroimaging showed characteristic frontal lobe abnor-
malities in FTD and temporoparietal change in typical-AD. The findings highlight the
importance of the posterior hemispheres inworkingmemory and point to a need for caution
in the automatic attribution of working memory, attention and executive test failures to
frontal lobe failure. They underline also the phenotypic variation within AD.
ª 2010 Elsevier Srl. All rights reserved.
1. Introduction 2000; Welsh et al., 1991). It typically manifests as impair-
Memory dysfunction is a core, defining characteristic of
Alzheimer’s disease (AD) (McKhann et al., 1984; Perry et al.,
TD, Frontotemporal dem
nit, Greater Manchester N
ster.ac.uk (C.L. Stopford).ier Srl. All rights reserved
ment in episodic memory (Huff et al., 1987; Perry et al., 2000),
but may also include problems in semantic memory (Greene
and Hodges, 1996; Hodges and Patterson, 1995; Hodges et al.,
entia; MRI, Magnetic resonance imaging; SPECT, Single photon
euroscience Centre, Salford Royal NHS Foundation Trust, Salford
.
c o r t e x 4 8 ( 2 0 1 2 ) 4 2 9e4 4 6430
1992; Lambon Ralph et al., 2003; Salmon et al., 1999), and
working memory (Baddeley et al., 1986, 1991b; Becker, 1988;
Kopelman, 1985; Miller, 1973; Morris, 1986; Morris and
Baddeley, 1988). It is recognised that working and long-term
memory impairments are dissociable in AD (Baddeley et al.,
1991a; Becker, 1988; Morris and Baddeley, 1988; Stopford
et al., 2007). Moreover, there is evidence that these distinc-
tions may have neurobiological relevance. In a study of over
500 AD patients referred to a specialist early-onset dementia
clinic (Snowden et al., 2007) we showed that patients pre-
senting with a dense yet relatively circumscribed classical
amnesia (labelled amnestic AD and accounting for 10% of
cases) were older and more likely to carry apolipoprotein
(ApoE) 34 alleles than those presenting with a constellation of
cortical symptomatology, which included working memory,
language and perceptuospatial deficits (labelled “typical” AD
on the basis that they accounted for 61% of cases). The ApoE 34
allele was also significantly more common in amnestic AD,
a clearly pathological group recognised in recently proposed
research criteria (Dubois et al., 2007), than in patients with
mild memory loss who fulfil criteria for mild cognitive
impairment (MCI). Such findings highlight the importance of
careful characterisation of individual patients, including the
precise nature of memory symptoms.
The basis of working memory deficits in AD is of particular
interest. In a factor analytic study of neuropsychological
profiles in early-onset AD (Stopford et al., 2008), we found that
tasks that place demands on working memory, such as digit
reversal, spelling, and calculation, loaded onto the ‘language’
factor, rather than onto factors representing the domains of
memory or executive function. Moreover, in such early-onset
patients, we have demonstrated links between working
memory problems, language impairment and functional
imaging changes in temporoparietal regions (Snowden et al.,
2007; Stopford et al., 2007, 2008). There was no relationship
between working memory deficits and frontal lobe abnor-
malities on clinical Single photon emission computed
tomography (SPECT) imaging (Stopford et al., 2007).
Such findings appear to conflict with prevailing views. The
most influential model of working memory, developed by
Baddeley (Baddeley et al., 1986; Baddeley and Hitch, 1974),
proposes the existence of a central executive, an attentional
component that has a coordinating and supervisory role over
the two slave systems, the phonological loop, responsible for
temporary storage and rehearsal of verbal information, and
the visuospatial sketchpad, for maintenance of visual and
spatial information. Later revision of the model (Baddeley,
2000) incorporates an episodic buffer, a temporary storage
system capable of integrating information from different
sources, purported to act as the interface between working
and episodic memory. Commonly, central executive impair-
ment is thought to play a major role in AD patients’ working
memory problems. Failure to carry out two tasks concurrently
is taken as evidence of this (Baddeley et al., 1991a, 1991b, 1986;
Belleville et al., 2007; Logie et al., 2004; Morris, 1984, 1986;
Morris and Baddeley, 1988). As component tasks are titrated
for individuals’ capabilities it is argued that failure is not
simply reflective of increased cognitive load, but rather
a deficit in the central executive component of working
memory (Baddeley et al., 1986).
Executive and supervisory aspects of cognition are known
to be linked to the function of the frontal lobes (e.g., Stuss and
Benson, 1984). Although some caution has been expressed
surrounding a direct relationship (Baddeley, 1996a, 1996b;
Baddeley and Wilson, 1988), the term ‘dysexecutive’ almost
invariably holds ‘frontal’ connotations. The central executive
component of working memory too is thought to be the
preserve of frontal regions (D’Esposito et al., 1995; Muller and
Knight, 2006).
AD patients frequently demonstrate deficits on a range of
standard tests of executive function and attention (e.g.,
Baddeley et al., 2001; Belleville et al., 2007; Belleville et al.,
2006; Collette et al., 1999b; Lafleche and Albert, 1995; Nedjam
et al., 2004; Perry et al., 2000). They perform poorly on tests
of planning (Lafleche and Albert, 1995), set-switching and
rule-abstraction (Nedjam et al., 2004; Perry et al., 2000), inhi-
bition (Calderon et al., 2001; Nedjam et al., 2004; Perry et al.,
2000), generation (Lafleche and Albert, 1995), and sustained,
divided, and selective attention (Baddeley et al., 2001, 1999;
Calderon et al., 2001; Perry et al., 2000). Such deficits rein-
force the notion of a core ‘frontal executive’ deficit in AD.
Indeed, some studies report similar executive performance in
AD patients and patients with prominent frontal lobe
dysfunction, such as those with frontotemporal dementia
(FTD) (Grossi et al., 2002; Nedjam et al., 2004; Pachana et al.,
1996). A natural interpretation is that such deficits in AD
reflect primary dysfunction of the frontal lobes. Some authors
even propose executive and attentional deficits as the earliest
features of AD (Perry et al., 2000), with others further sug-
gesting that executive deficits may be a predictive preclinical
feature (e.g., Albert et al., 2001).
In keepingwith a ‘frontal’ interpretation, there is substantial
evidence of frontal pathology in AD. Plaques have been shown
to accumulate at a high rate in frontal areas in AD (Morris and
Price, 2001; Price et al., 1991). In vivo visualisation of amyloid
plaques using positron emission tomography (PET) with the
Pittsburgh compound-B (PiB) tracer, has demonstrated high
amyloid burden in the frontal lobes early in the course of AD
(Klunk et al., 2004; Mintun, 2005; Rowe et al., 2007). However,
there is evidence that amyloid burden shows an inconsistent
relationship with cognitive symptoms, functional imaging and
disease severity (Rabinovici et al., 2010; Rabinovici and Jagust,
2009), suggesting that it might not be the best indicator of the
anatomical substrate of patients’ cognitive disturbance.
The characteristic changes on functional neuroimaging in
early-onset AD are in the posterior hemispheres rather than
the frontal lobes (e.g., Foster et al., 1983; Minoshima et al.,
1997; Salmon et al., 1994). Moreover, there is little indication
of a ‘frontal’ quality to patients’ clinical presentation. Behav-
iourally, patients are socially appropriate, motivated, show
good application and persistence on cognitive tasks, and are
concerned for performance accuracy. These characteristics
contrast strikingly with the behaviour of patients with
established degenerative disease affecting the frontal lobes,
namely frontotemporal dementia (FTD). FTD patients are
socially inappropriate, show economy of effort, poor persis-
tence and lack of concern for performance accuracy. Neuro-
psychological tests have been reported to discriminate poorly
between AD and FTD (Grossi et al., 2002) including tests of
executive function (Nedjam et al., 2004). Nevertheless, there
c o r t e x 4 8 ( 2 0 1 2 ) 4 2 9e4 4 6 431
are qualitative performance differences, suggesting distinct
contributions to performance failure (Thompson et al., 2005).
Features displayed in AD, such as phonological errors on
language tasks are not characteristic of FTD patients, who by
contrast make errors of perseveration, concrete thought,
misconstruction, and poor organisation.
There is already evidence that components other than
central executive dysfunction might contribute to working
memory deficits in AD. Impaired phonological processing has
been demonstrated (Belleville et al., 1996; Caza and Belleville,
2008; Collette et al., 1999a; Hulme et al., 1993), although, in
some studies, only in a subset of patients (Belleville et al.,
1996; Collette et al., 1999a), and in other studies in no
patients at all (Morris, 1984). One interpretation is that
phonological loop impairment reflectsmore advanced disease
(Collette et al., 1999a). AD patients are also known to display
deficits on immediate prose recall tests (Baddeley andWilson,
2002; Calderon et al., 2001; Chapman et al., 1997; Greene et al.,
1996; Lindeboom et al., 2002), suggesting that an episodic
buffer deficit might also contribute to patients’ working
memory problems.
The aim of the present study was to improve under-
standing of working memory, attention and executive
impairments in early-onset AD. A primary aim was to
address the potential ‘frontal’ contribution, through a direct,
novel comparison with a prototypical ‘frontal’ disorder, FTD.
The motivation was a wish to resolve anomalies as outlined
above. On the one hand, AD is clinically very different from
FTD so one might expect a priori very different patterns of test
performance on tests of working memory and attention. On
the other hand, if a major contribution to working memory
problems in AD is a central executive disorder with
a ‘frontal’ substrate, as much of the literature suggests, then
one would predict similar patterns of performance on
working memory and attention in AD compared to FTD,
albeit less severe. The inclusion of tests of working memory,
attention and executive functions in the same study is
potentially illuminating because it allows examination of
the relationship between performance across tasks in both
disease groups.
The main focus of the study were AD patients who display
a constellation of deficits in memory, language, and percep-
tuospatial functioning. Such patients are referred to hereafter
as “typical-AD” on the basis that they account for the largest
percentage of patients presenting to an early-onset dementia
clinic (Snowden et al., 2007). They may not be “typical” of an
older AD population. Amnesic-AD patients, whose perfor-
mance is characterised by severe yet circumscribed episodic
memory deficits, were included as a reference group. Such
patients were older, and may be more representative of an
older AD population. However, in keeping with our previous
work (Snowden et al., 2007) and that of others (Bondareff,
1994) which highlight age as having a highly important but
not exclusive relationship with disease presentation, age
ranges overlapped. Patients were therefore classified on the
basis of cognitive phenotype rather than age so that the labels
‘early onset’ and ‘late onset’ AD were avoided. A secondary
aim of the study was to explore the effects of amnesia per se
on performance and thereby increase understanding of the
phenotypic variation in AD.
We predicted that both typical-AD and FTD patients, but
not amnesic-AD patients would perform poorly on tests of
working memory, attention, and executive function,
compared to a healthy control group. However, we expected
that despite quantitative similarities in typical-AD and FTD,
there ought to be qualitative differences, reflecting different
underlying reasons for failure.
2. Participants
Patients were consecutive attendees at a regional dementia
clinic, who agreed to take part in the study. Diagnoses were
made by a consultant neurologist based on a detailed history
using a structured proforma designed to elicit information
about cognitive symptoms, and a full neurological examina-
tion. Diagnoses were supported by neuropsychological eval-
uation using a locally developed screening instrument,
tapping language, perceptuospatial function, praxis, memory,
and executive function, which has been found valuable in
discriminating discrete forms of dementia (see Neary et al.,
1987; Talbot et al., 1998; Thompson et al., 2005). No patient
had a history of cerebrovascular disease or showed evidence
of vascular disease on brain imaging. All patients had been
followed up for at least 1 year, confirming the progressive
nature of the disorder and exclusion of alternative diagnoses.
Participants were excluded if they had a history of alcohol
abuse or head injury. None of the patients had a fluctuating
confusional state or reported hallucinations. Neurological
examination was either normal or revealed the presence of
mild extrapyramidal signs in keeping with AD. Grasp reflexes
were reported in 27% of FTD cases. The studywas approved by
the Local Research Ethics Committee and all participants gave
written informed consent in accordance with the declaration
of Helsinki.
Classification of AD subgroups was based on characteristic
profiles demonstrated previously (Snowden et al., 2007),
determined by clinical history of symptoms obtained at initial
diagnostic assessment using a structured proforma and
performance on a locally developed neuropsychological
screening assessment.
2.1. Typical-AD group
The group comprised 20 AD patients (7 females, 13males) who
presented with a constellation of symptoms, confirmed on
cognitive testing, and fulfilled conventional criteria for AD
(McKhann et al., 1984). All patients showed a similar pattern,
with deficits in memory, language, and perceptuospatial
functioning, albeit with variable weightings of impairment
across domains, consistent with our previous work (Stopford
et al., 2008). Their mean age at the time of testing was
61 years [standard deviation (SD) 5, range 52e68], and duration
of symptoms 4.5 years (SD 2). Sixteen patients (80%) had
undergone magnetic resonance imaging (MRI) as part of their
diagnostic work-up. This revealed generalised atrophy in
8 cases (50%), localised parietal atrophy in 2 cases (13%) and no
abnormality in 6 patients (37%). Nine patients (45%) also
underwent SPECT imaging. In 6 (66%) therewas circumscribed
hypoperfusion in parietal and temporoparietal regions, in 1
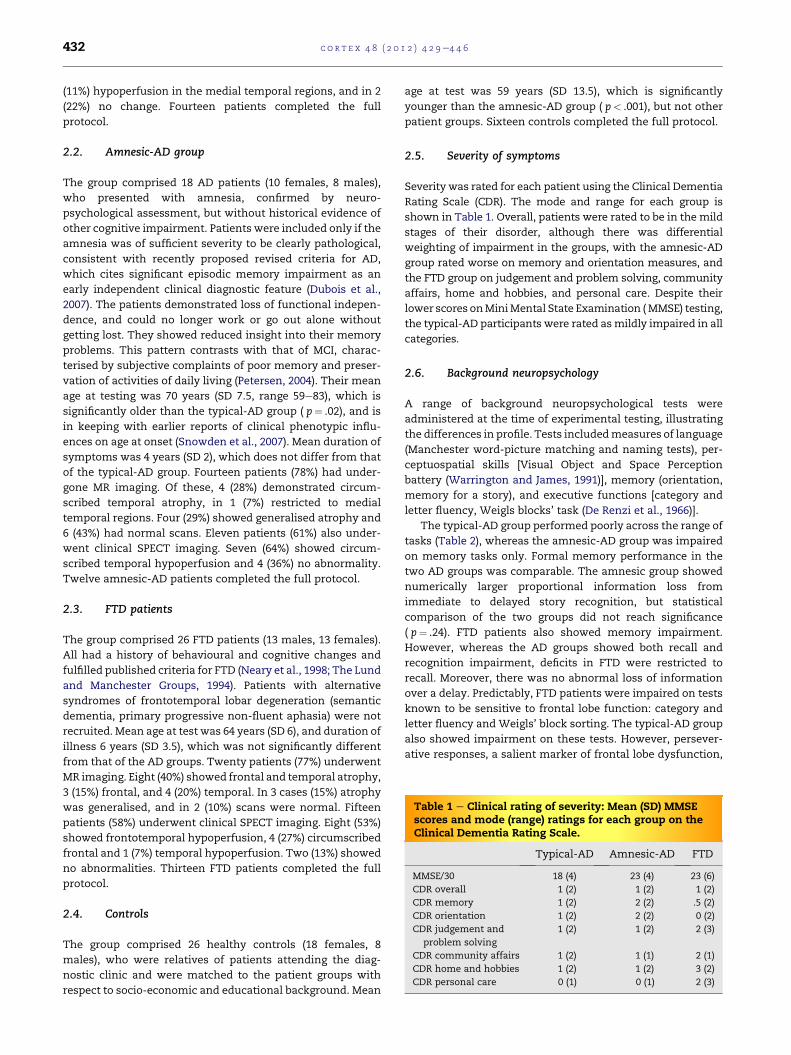
Table 1 e Clinical rating of severity: Mean (SD) MMSEscores and mode (range) ratings for each group on theClinical Dementia Rating Scale.
Typical-AD Amnesic-AD FTD
MMSE/30 18 (4) 23 (4) 23 (6)
CDR overall 1 (2) 1 (2) 1 (2)
CDR memory 1 (2) 2 (2) .5 (2)
CDR orientation 1 (2) 2 (2) 0 (2)
CDR judgement and
problem solving
1 (2) 1 (2) 2 (3)
CDR community affairs 1 (2) 1 (1) 2 (1)
CDR home and hobbies 1 (2) 1 (2) 3 (2)
CDR personal care 0 (1) 0 (1) 2 (3)
c o r t e x 4 8 ( 2 0 1 2 ) 4 2 9e4 4 6432
(11%) hypoperfusion in the medial temporal regions, and in 2
(22%) no change. Fourteen patients completed the full
protocol.
2.2. Amnesic-AD group
The group comprised 18 AD patients (10 females, 8 males),
who presented with amnesia, confirmed by neuro-
psychological assessment, but without historical evidence of
other cognitive impairment. Patients were included only if the
amnesia was of sufficient severity to be clearly pathological,
consistent with recently proposed revised criteria for AD,
which cites significant episodic memory impairment as an
early independent clinical diagnostic feature (Dubois et al.,
2007). The patients demonstrated loss of functional indepen-
dence, and could no longer work or go out alone without
getting lost. They showed reduced insight into their memory
problems. This pattern contrasts with that of MCI, charac-
terised by subjective complaints of poor memory and preser-
vation of activities of daily living (Petersen, 2004). Their mean
age at testing was 70 years (SD 7.5, range 59e83), which is
significantly older than the typical-AD group ( p¼ .02), and is
in keeping with earlier reports of clinical phenotypic influ-
ences on age at onset (Snowden et al., 2007). Mean duration of
symptoms was 4 years (SD 2), which does not differ from that
of the typical-AD group. Fourteen patients (78%) had under-
gone MR imaging. Of these, 4 (28%) demonstrated circum-
scribed temporal atrophy, in 1 (7%) restricted to medial
temporal regions. Four (29%) showed generalised atrophy and
6 (43%) had normal scans. Eleven patients (61%) also under-
went clinical SPECT imaging. Seven (64%) showed circum-
scribed temporal hypoperfusion and 4 (36%) no abnormality.
Twelve amnesic-AD patients completed the full protocol.
2.3. FTD patients
The group comprised 26 FTD patients (13 males, 13 females).
All had a history of behavioural and cognitive changes and
fulfilled published criteria for FTD (Neary et al., 1998; The Lund
and Manchester Groups, 1994). Patients with alternative
syndromes of frontotemporal lobar degeneration (semantic
dementia, primary progressive non-fluent aphasia) were not
recruited. Mean age at test was 64 years (SD 6), and duration of
illness 6 years (SD 3.5), which was not significantly different
from that of the AD groups. Twenty patients (77%) underwent
MR imaging. Eight (40%) showed frontal and temporal atrophy,
3 (15%) frontal, and 4 (20%) temporal. In 3 cases (15%) atrophy
was generalised, and in 2 (10%) scans were normal. Fifteen
patients (58%) underwent clinical SPECT imaging. Eight (53%)
showed frontotemporal hypoperfusion, 4 (27%) circumscribed
frontal and 1 (7%) temporal hypoperfusion. Two (13%) showed
no abnormalities. Thirteen FTD patients completed the full
protocol.
2.4. Controls
The group comprised 26 healthy controls (18 females, 8
males), who were relatives of patients attending the diag-
nostic clinic and were matched to the patient groups with
respect to socio-economic and educational background. Mean
age at test was 59 years (SD 13.5), which is significantly
younger than the amnesic-AD group ( p< .001), but not other
patient groups. Sixteen controls completed the full protocol.
2.5. Severity of symptoms
Severity was rated for each patient using the Clinical Dementia
Rating Scale (CDR). The mode and range for each group is
shown in Table 1. Overall, patients were rated to be in the mild
stages of their disorder, although there was differential
weighting of impairment in the groups, with the amnesic-AD
group rated worse on memory and orientation measures, and
the FTD group on judgement and problem solving, community
affairs, home and hobbies, and personal care. Despite their
lower scores onMiniMental State Examination (MMSE) testing,
the typical-AD participants were rated asmildly impaired in all
categories.
2.6. Background neuropsychology
A range of background neuropsychological tests were
administered at the time of experimental testing, illustrating
the differences in profile. Tests includedmeasures of language
(Manchester word-picture matching and naming tests), per-
ceptuospatial skills [Visual Object and Space Perception
battery (Warrington and James, 1991)], memory (orientation,
memory for a story), and executive functions [category and
letter fluency, Weigls blocks’ task (De Renzi et al., 1966)].
The typical-AD group performed poorly across the range of
tasks (Table 2), whereas the amnesic-AD group was impaired
on memory tasks only. Formal memory performance in the
two AD groups was comparable. The amnesic group showed
numerically larger proportional information loss from
immediate to delayed story recognition, but statistical
comparison of the two groups did not reach significance
( p¼ .24). FTD patients also showed memory impairment.
However, whereas the AD groups showed both recall and
recognition impairment, deficits in FTD were restricted to
recall. Moreover, there was no abnormal loss of information
over a delay. Predictably, FTD patients were impaired on tests
known to be sensitive to frontal lobe function: category and
letter fluency and Weigls’ block sorting. The typical-AD group
also showed impairment on these tests. However, persever-
ative responses, a salient marker of frontal lobe dysfunction,
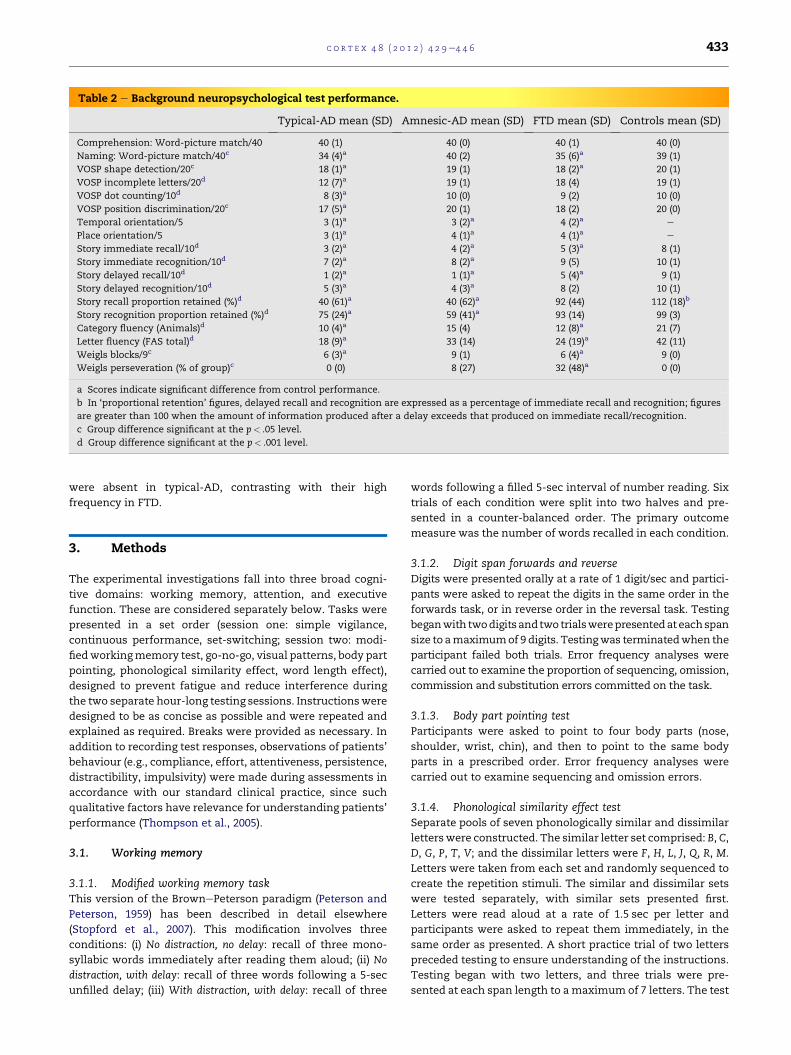
Table 2 e Background neuropsychological test performance.
Typical-AD mean (SD) Amnesic-AD mean (SD) FTD mean (SD) Controls mean (SD)
Comprehension: Word-picture match/40 40 (1) 40 (0) 40 (1) 40 (0)
Naming: Word-picture match/40c 34 (4)a 40 (2) 35 (6)a 39 (1)
VOSP shape detection/20c 18 (1)a 19 (1) 18 (2)a 20 (1)
VOSP incomplete letters/20d 12 (7)a 19 (1) 18 (4) 19 (1)
VOSP dot counting/10d 8 (3)a 10 (0) 9 (2) 10 (0)
VOSP position discrimination/20c 17 (5)a 20 (1) 18 (2) 20 (0)
Temporal orientation/5 3 (1)a 3 (2)a 4 (2)a e
Place orientation/5 3 (1)a 4 (1)a 4 (1)a e
Story immediate recall/10d 3 (2)a 4 (2)a 5 (3)a 8 (1)
Story immediate recognition/10d 7 (2)a 8 (2)a 9 (5) 10 (1)
Story delayed recall/10d 1 (2)a 1 (1)a 5 (4)a 9 (1)
Story delayed recognition/10d 5 (3)a 4 (3)a 8 (2) 10 (1)
Story recall proportion retained (%)d 40 (61)a 40 (62)a 92 (44) 112 (18)b
Story recognition proportion retained (%)d 75 (24)a 59 (41)a 93 (14) 99 (3)
Category fluency (Animals)d 10 (4)a 15 (4) 12 (8)a 21 (7)
Letter fluency (FAS total)d 18 (9)a 33 (14) 24 (19)a 42 (11)
Weigls blocks/9c 6 (3)a 9 (1) 6 (4)a 9 (0)
Weigls perseveration (% of group)c 0 (0) 8 (27) 32 (48)a 0 (0)
a Scores indicate significant difference from control performance.
b In ‘proportional retention’ figures, delayed recall and recognition are expressed as a percentage of immediate recall and recognition; figures
are greater than 100 when the amount of information produced after a delay exceeds that produced on immediate recall/recognition.
c Group difference significant at the p< .05 level.
d Group difference significant at the p< .001 level.
c o r t e x 4 8 ( 2 0 1 2 ) 4 2 9e4 4 6 433
were absent in typical-AD, contrasting with their high
frequency in FTD.
3. Methods
The experimental investigations fall into three broad cogni-
tive domains: working memory, attention, and executive
function. These are considered separately below. Tasks were
presented in a set order (session one: simple vigilance,
continuous performance, set-switching; session two: modi-
fiedworkingmemory test, go-no-go, visual patterns, body part
pointing, phonological similarity effect, word length effect),
designed to prevent fatigue and reduce interference during
the two separate hour-long testing sessions. Instructionswere
designed to be as concise as possible and were repeated and
explained as required. Breaks were provided as necessary. In
addition to recording test responses, observations of patients’
behaviour (e.g., compliance, effort, attentiveness, persistence,
distractibility, impulsivity) were made during assessments in
accordance with our standard clinical practice, since such
qualitative factors have relevance for understanding patients’
performance (Thompson et al., 2005).
3.1. Working memory
3.1.1. Modified working memory taskThis version of the BrownePeterson paradigm (Peterson and
Peterson, 1959) has been described in detail elsewhere
(Stopford et al., 2007). This modification involves three
conditions: (i) No distraction, no delay: recall of three mono-
syllabic words immediately after reading them aloud; (ii) No
distraction, with delay: recall of three words following a 5-sec
unfilled delay; (iii) With distraction, with delay: recall of three
words following a filled 5-sec interval of number reading. Six
trials of each condition were split into two halves and pre-
sented in a counter-balanced order. The primary outcome
measure was the number of words recalled in each condition.
3.1.2. Digit span forwards and reverseDigits were presented orally at a rate of 1 digit/sec and partici-
pants were asked to repeat the digits in the same order in the
forwards task, or in reverse order in the reversal task. Testing
beganwith twodigits andtwo trialswerepresentedat eachspan
size to amaximumof 9 digits. Testingwas terminatedwhen the
participant failed both trials. Error frequency analyses were
carried out to examine the proportion of sequencing, omission,
commission and substitution errors committed on the task.
3.1.3. Body part pointing testParticipants were asked to point to four body parts (nose,
shoulder, wrist, chin), and then to point to the same body
parts in a prescribed order. Error frequency analyses were
carried out to examine sequencing and omission errors.
3.1.4. Phonological similarity effect testSeparate pools of seven phonologically similar and dissimilar
letterswere constructed. The similar letter set comprised: B, C,
D, G, P, T, V; and the dissimilar letters were F, H, L, J, Q, R, M.
Letters were taken from each set and randomly sequenced to
create the repetition stimuli. The similar and dissimilar sets
were tested separately, with similar sets presented first.
Letters were read aloud at a rate of 1.5 sec per letter and
participants were asked to repeat them immediately, in the
same order as presented. A short practice trial of two letters
preceded testing to ensure understanding of the instructions.
Testing began with two letters, and three trials were pre-
sented at each span length to amaximum of 7 letters. The test
c o r t e x 4 8 ( 2 0 1 2 ) 4 2 9e4 4 6434
was discontinued when the participant failed all three trials.
The primary outcome measure was letter span, in the
phonologically similar and dissimilar conditions.
3.1.5. Word length effect testThe stimuli and procedure of the word length effect test were
based on those used by Belleville et al (1996). Two sets of nine
words were constructed, from which to compile word series for
repetition. One set consisted of short (monosyllabic) words: bag,
chain, draw, fun,meat, salt, phone, pick, tree. The other consisted of
long (four syllable) words: academic, automobile, competition,
discovery, emergency, institution, machinery, television, emotional.
Wordswere generatedusing theMedical ResearchCouncil (MRC)
Psycholinguistics Database (Wilson, 1988) andwerematched for
KuceraeFrancis frequency, imageability, and familiarity. Words
were taken from each set and randomly sequenced to create the
repetition stimuli. Short and long words were tested separately,
with shortwords tested first.Word sequenceswere readaloud to
participants at a rate of 1.5 sec per word, and participants were
asked to repeat them immediately in the same order. Prior to
testing, the words were read aloud to the participants for famil-
iarisationandashortpracticetrialof twowordswascompletedto
ensure comprehension of the instructions. The test began with
repetition of two words, and three trials were presented at
increasing span length (maximum 7 words). The test was dis-
continuedwhentheparticipant failedall threetrials.Theprimary
outcome measure was word span, in the short word and long
word conditions.
3.1.6. Visual patterns test (Della Sala et al., 1997)In this test of visual short-termmemory, participants are shown
a ‘checkerboard’ style grid and asked to remember a pattern of
filled and unfilled squares. After 3 sec the grid is covered and
participants are asked to reproduce the pattern by shading
squares onablankgridof the samedimensions. Itemsare scored
correct if the pattern is reproduced without error. The grids
increase in number of filled and empty squares over successive
trials, with three trials at each level of complexity. The test was
discontinued when the participant failed all three trials. The
primary outcome measure was the maximum number of filled
squares accurately recalled (i.e., the level of complexity reached).
For this study, prior-test familiarisation items involving grids of 2
squaresweredevelopedas somepatientswereoverloadedby the
demands of the published practice items.
3.2. Attention
3.2.1. Vigilance task A: simple sustained attention taskDuring this sustained attention task, participants viewed
a computer monitor upon which was displayed a central
fixation box. Participants were instructed to press a response
key as quickly as possible whenever a number (always 3)
appeared inside the fixation box. A total of 54 targets were
presented for 300 msec at intervals of 2800, 5800 or 8800 msec.
The intervals were presented in random order within blocks
in which each interval type occurred once, thus enabling
comparison of time periods. The full test ran for 6 min. A short
practice trial preceded the test to ensure comprehension of
the instructions. Outcome measures were reaction time (RT),
and number of targets accurately detected.
3.2.2. Vigilance task B: continuous performance testParticipants viewed a computer monitor upon which was
displayed a central fixation point (þ). Digits from 0 to 9 were
presented for 300 msec at ‘fast’ (1500 msec) or ‘slow’
(3500 msec) intervals. Participants were instructed to press
a response key as quickly as possible whenever the number 3
was displayed. The ratio of targets to non-targets was 1:2.
Three ‘fast’ and three ‘slow’ blocks were alternated (f/s/f/s/f/s)
during the test, which ran for 10 min. A short practice trial was
administered prior to testing to facilitate familiarity with the
task and stimuli. Primary outcome measures were RT to
detect targets and the number of targets accurately detected.
3.2.3. EquipmentFor the computerised tasks, stimuli presentation and
response collection were controlled by E-Prime (Psychological
Software Tools, Pittsburgh, PA) using a 19-inch TFT display.
3.3. Executive function
3.3.1. Inhibition: go-no-go taskParticipants viewed a computer monitor on which was dis-
played a central fixation point (þ). Digits from 0 to 9 were
presented for 300 msec at intervals of 1500 msec. In contrast
to the vigilance tasks, participants were instructed to press
a response key to every number (‘go’ trials) except the number
‘3’ (‘no-go’ trials). Responses were accepted as valid up to
1000 msec after stimulus presentation. The test was split into
6 blocks, separated by short breaks. Forty-five stimuli were
presented in each block and the ratio of ‘go’ and ‘no-go’
stimuli varied as follows:
1:1 22 no-go: 23 go
1:3 11 no-go: 34 go
1:8 5 no-go: 40 go
Two blocks of each ratio patternwere presented in random
order. The primary outcome measure was the error rate
(number of errors made/number of errors possible per ratio
condition). Both inhibition (failure to inhibit a ‘no-go’
response) and omission (failure to respond to a ‘go’ target)
errors were recorded.
3.3.2. Mental flexibility: set-switching taskParticipants viewed a computer monitor upon which pairs of
stimuli were presented. Pairs of stimuli consisted of coloured
shapes (blue square, red square, blue circle, red circle), and in
each pair, items were matched by one dimension but not the
other (e.g., shape: blue circle, red circle; colour: red square,
red circle). Twelve stimuli combinations were produced.
Participants were instructed to choose a dimension to attend
to and to verbally state whether the items were the same or
different according to that feature. They were told that
occasionally the dimension would change and they would be
expected to identify the change and adjust their responses
accordingly. Their initial response was treated as correct and
fixed the first response dimension (i.e., if they responded
‘same’ when the stimuli were the same colour, ‘colour’ was
set as the target dimension). Following six consecutive
c o r t e x 4 8 ( 2 0 1 2 ) 4 2 9e4 4 6 435
correct responses the target dimension was shifted.
Although they were not warned of the change, positive
(green tick) and negative (red cross) feedbacks were given,
and they were instructed to use this to inform their
responses. The stimuli remained visible until a response was
made. The examiner pressed the response buttons on the
keyboard in order to reduce output demands. A total of 48
stimuli were presented in random order. The computerised
task was preceded by an initial abstraction task in order to
familiarise participants with the stimuli and concepts
involved in the test. Sets of stimuli (e.g., two blue circles)
were presented and participants were asked to explain how
they were the same. Participants were encouraged to use the
word ‘shape’ and ‘colour’ in their responses in order to
highlight the importance of these dimensions in this task.
The primary outcome measures were the number of
dimension shifts achieved, RTs per dimension shift (i.e.,
amount of time taken to achieve six consecutive responses),
and RTs at dimension shift changeover.
4. Results and discussion
4.1. Working memory
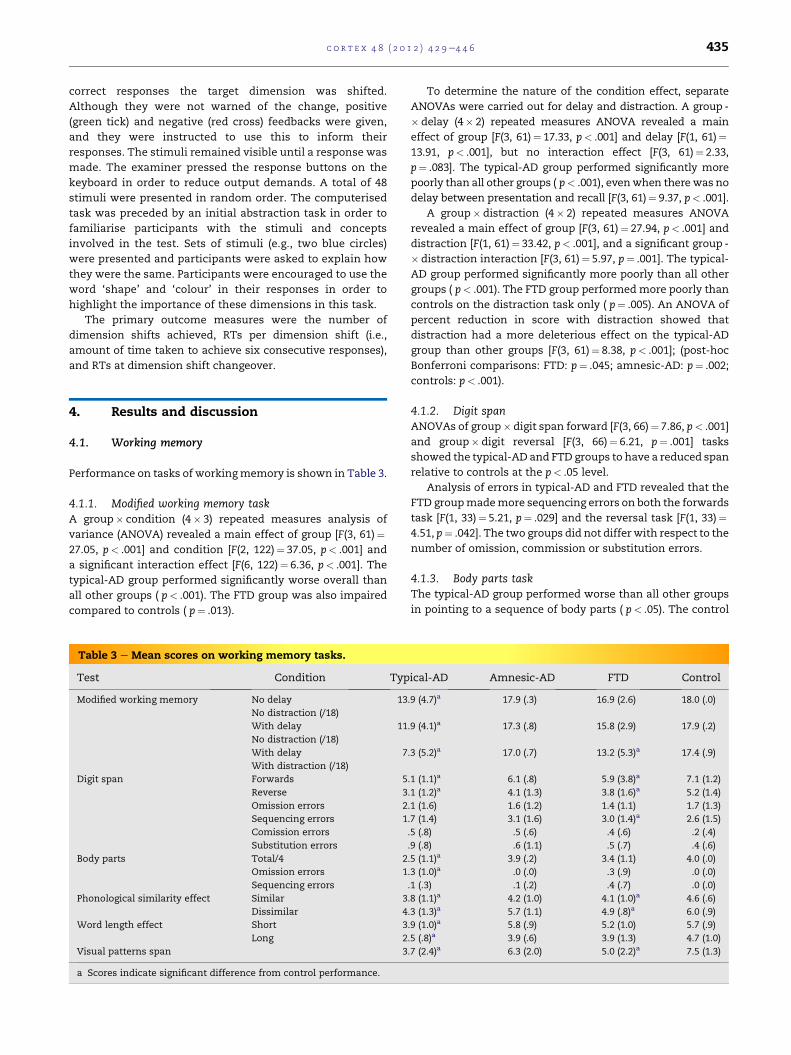
Performance on tasks of workingmemory is shown in Table 3.
4.1.1. Modified working memory taskA group� condition (4� 3) repeated measures analysis of
variance (ANOVA) revealed a main effect of group [F(3, 61)¼27.05, p< .001] and condition [F(2, 122)¼ 37.05, p< .001] and
a significant interaction effect [F(6, 122)¼ 6.36, p< .001]. The
typical-AD group performed significantly worse overall than
all other groups ( p< .001). The FTD group was also impaired
compared to controls ( p¼ .013).
Table 3 e Mean scores on working memory tasks.
Test Condition Typ
Modified working memory No delay
No distraction (/18)
13
With delay
No distraction (/18)
11
With delay
With distraction (/18)
7
Digit span Forwards 5
Reverse 3
Omission errors 2
Sequencing errors 1
Comission errors
Substitution errors
Body parts Total/4 2
Omission errors 1
Sequencing errors
Phonological similarity effect Similar 3
Dissimilar 4
Word length effect Short 3
Long 2
Visual patterns span 3
a Scores indicate significant difference from control performance.
To determine the nature of the condition effect, separate
ANOVAs were carried out for delay and distraction. A group -
� delay (4� 2) repeated measures ANOVA revealed a main
effect of group [F(3, 61)¼ 17.33, p< .001] and delay [F(1, 61)¼13.91, p< .001], but no interaction effect [F(3, 61)¼ 2.33,
p¼ .083]. The typical-AD group performed significantly more
poorly than all other groups ( p< .001), evenwhen there was no
delay between presentation and recall [F(3, 61)¼ 9.37, p< .001].
A group� distraction (4� 2) repeated measures ANOVA
revealed a main effect of group [F(3, 61)¼ 27.94, p< .001] and
distraction [F(1, 61)¼ 33.42, p< .001], and a significant group -
� distraction interaction [F(3, 61)¼ 5.97, p¼ .001]. The typical-
AD group performed significantly more poorly than all other
groups ( p< .001). The FTD group performedmore poorly than
controls on the distraction task only ( p¼ .005). An ANOVA of
percent reduction in score with distraction showed that
distraction had a more deleterious effect on the typical-AD
group than other groups [F(3, 61)¼ 8.38, p< .001]; (post-hoc
Bonferroni comparisons: FTD: p¼ .045; amnesic-AD: p¼ .002;
controls: p< .001).
4.1.2. Digit spanANOVAs of group� digit span forward [F(3, 66)¼ 7.86, p< .001]
and group� digit reversal [F(3, 66)¼ 6.21, p¼ .001] tasks
showed the typical-AD and FTD groups to have a reduced span
relative to controls at the p< .05 level.
Analysis of errors in typical-AD and FTD revealed that the
FTD groupmademore sequencing errors on both the forwards
task [F(1, 33)¼ 5.21, p¼ .029] and the reversal task [F(1, 33)¼4.51, p¼ .042]. The two groups did not differ with respect to the
number of omission, commission or substitution errors.
4.1.3. Body parts taskThe typical-AD group performed worse than all other groups
in pointing to a sequence of body parts ( p< .05). The control
ical-AD Amnesic-AD FTD Control
.9 (4.7)a 17.9 (.3) 16.9 (2.6) 18.0 (.0)
.9 (4.1)a 17.3 (.8) 15.8 (2.9) 17.9 (.2)
.3 (5.2)a 17.0 (.7) 13.2 (5.3)a 17.4 (.9)
.1 (1.1)a 6.1 (.8) 5.9 (3.8)a 7.1 (1.2)
.1 (1.2)a 4.1 (1.3) 3.8 (1.6)a 5.2 (1.4)
.1 (1.6) 1.6 (1.2) 1.4 (1.1) 1.7 (1.3)
.7 (1.4) 3.1 (1.6) 3.0 (1.4)a 2.6 (1.5)
.5 (.8) .5 (.6) .4 (.6) .2 (.4)
.9 (.8) .6 (1.1) .5 (.7) .4 (.6)
.5 (1.1)a 3.9 (.2) 3.4 (1.1) 4.0 (.0)
.3 (1.0)a .0 (.0) .3 (.9) .0 (.0)
.1 (.3) .1 (.2) .4 (.7) .0 (.0)
.8 (1.1)a 4.2 (1.0) 4.1 (1.0)a 4.6 (.6)
.3 (1.3)a 5.7 (1.1) 4.9 (.8)a 6.0 (.9)
.9 (1.0)a 5.8 (.9) 5.2 (1.0) 5.7 (.9)
.5 (.8)a 3.9 (.6) 3.9 (1.3) 4.7 (1.0)
.7 (2.4)a 6.3 (2.0) 5.0 (2.2)a 7.5 (1.3)
c o r t e x 4 8 ( 2 0 1 2 ) 4 2 9e4 4 6436
and amnesic-AD groups perform at or near ceiling on this task
and were not included in the error analysis.
Typical-AD patients made more omission errors than FTD
patients [F(1, 33)¼ 9.58, p¼ .004]. FTD patients show a numer-
ically higher frequency of sequencing errors than typical-AD
participants, although this difference did not reach statis-
tical significance [F(1, 33)¼ 3.23, p¼ .082].
4.1.4. Phonological similarity effect testA group� phonological similarity (4� 2) repeated measures
ANOVA revealed significant main effects of group [F(3, 59)¼8.04, p< .001] and phonological similarity [F(1, 59)¼ 69.65,
p< .001], and a significant group� phonological similarity
interaction [F(3, 59)¼ 3.86, p¼ .014].
The typical-AD group performed more poorly than both
controls ( p< .001) and the amnesic-AD group ( p¼ .030). The
FTD group was also impaired compared to controls ( p¼ .022).
The typical-AD and FTD groups did not differ significantly.
As expected, phonologically similar letters yielded poorer
repetition performance than dissimilar letters. The similarity
effect was statistically significant in the amnesic-AD (t¼�5.0,
p< .001), FTD (t¼�2.7, p¼ .018) and control (t¼�7.7, p< .001)
groups but not in the typical-AD group (t¼�2.0, p¼ .068).
4.1.5. Word length effect testA group�word length (4� 2) repeated measures ANOVA
revealed main effects of group [F(3, 60)¼ 18.37, p< .001] and
word length [F(1, 60)¼ 115.74, p< .001]. The interaction of
group�word length failed to reach statistical significance
[F(3, 60)¼ 2.73, p¼ .052].
The typical-AD group performedmore poorly than all other
groups ( p< .001), indicating a reduced overall word span.
Performance in amnesic-AD and FTD groups was comparable
to that of controls (amnesic-AD vs control: p¼ 1.000; FTD vs
control: p¼ .134). Shorter words elicited a longer word span
than longer words. A significant word length effect was
evident in all groups at the p< .001 level.
4.1.6. Visual patterns testA one way ANOVA showed a significant group difference for
visual span [F(3, 60)¼ 12.96, p< .001]. The typical-AD group
demonstrated a shorter visual span than both controls
( p< .001) and the amnesic-AD group ( p¼ .005). The FTD group
also demonstrated poorer performance than controls
( p¼ .002). Performance in typical-AD and FTD groups did not
differ significantly [t(25)¼�1.46, p¼ .157].
4.1.7. DiscussionPatient performance is summarised in Table 4a. The typical-AD
group showed striking impairment of working memory.
Performance on themodified working memory task and ability
to point to four body parts in sequence was impaired. Digit,
letter, word, and visual span were reduced. Remarkably, FTD
patients too demonstrated reduced performance on all tasks
excluding word span. However there were fundamental
differences in performance characteristics. Although both
groups showed significant effects of distraction on themodified
working memory task, only the AD group showed profound
impairment evenwithout delay or distraction,whereas the FTD
group was impaired with distraction only. On span tasks, FTD
patients showed a normal phonological similarity effect,
whereas typical-ADpatientsdidnot. FTDpatientswereprone to
sequencing error, whereas omission errors were more preva-
lent in AD. Taken together, the results suggest an attentional
andexecutive substrate inFTD,andaphonological contribution
to impairment in typical-AD, with suggestion of faulty assimi-
lation, rehearsal, and/or storage. Notably, the amnesic-AD
group performed within normal limits across tasks.
4.2. Attention
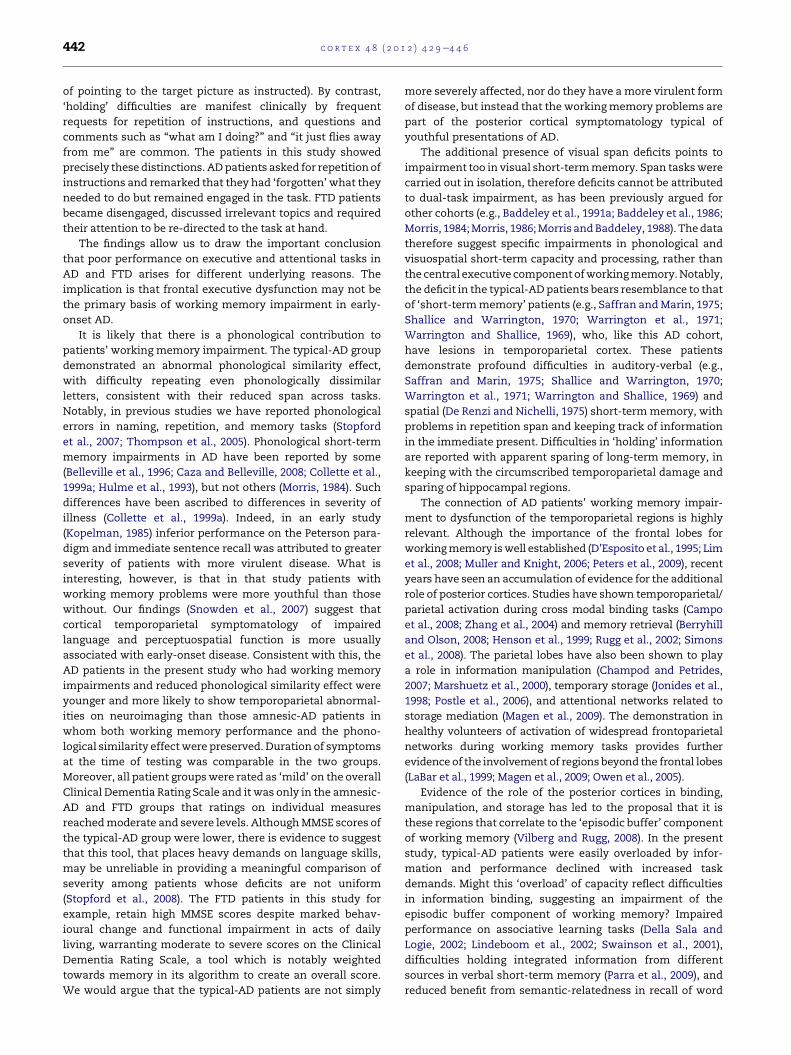
4.2.1. Vigilance task A: simple sustained attention taskData were separated into three blocks to examine perfor-
mance at the beginning, middle and end of the task, for each
rate of presentation. Accuracy performance is summarised in
Fig. 1.
A 4� 3� 3 (group� block� presentation rate) ANOVA
of accuracy data revealed significant main effects of group
[F(3, 69)¼ 10.12, p< .001] and presentation rate [F(2, 138)¼21.07, p< .001], but not of block [F(2, 138)¼ .55, p¼ .581]. There
were significant interactions of group x presentation rate [F(6,
138)¼ 3.62, p¼ .002] and block x presentation rate [F(4, 276)¼2.59, p¼ .037], but not group x block ( p¼ .360) or group -
� block� presentation rate ( p¼ .207).
The FTD group missed significantly more targets than the
typical-AD group ( p¼ .003), the amnesic-AD group ( p¼ .046)
and the healthy controls ( p< .001). Performance accuracy in
the typical-AD group did not differ significantly from that of
controls.
Patient groups made more errors with faster presentation.
Paired t-tests revealed that bothADgroupsmademore errors in
the 2800msec condition than in the 5800msec (typical-AD:
p¼ .006; amnesic-AD: p¼ .047) and 8800msec conditions
(typical-AD: p¼ .015; amnesic-AD: p¼ .029). No significant
differences were observed between the 5800 msec and
8800msec conditions in the AD groups. The FTD group made
moreerrors in the2800msec ( p¼ .016) and5800msec ( p¼ .033)
conditions compared to the 8800msec condition.No significant
differences were observed between conditions for controls.
Prior to RT analysis, outliers (�2.5 SD) were removed from
individual participants’ datasets. 1.24% of data were removed.
A 4� 3� 3 (group� block� presentation rate) repeated
measures ANOVA of RT data showed no significant main
effect of group [F(3, 61)¼ 2.59, p¼ .060], or block [F(2, 122)¼ .89,
p¼ .413], but there was a significant effect of presentation rate
on RT [F(2, 122)¼ 51.17, p< .001]. RTs for the 2800 msec
presentation rate (Mean 361.2msec; SD 50.1) were slower than
those for the 5800 msec (Mean 335.8msec; SD 50.0) (t¼ 8.6,
df¼ 64, p< .001) and the 8800 msec presentation rates (Mean
332.6 msec; SD 50.0) (t¼ 7.5, df¼ 64, p< .001). There were no
significant interactions.
4.2.2. Vigilance task B: continuous performance testAccuracy performance is summarised in Fig. 2. A 4� 3� 2
(group� block� delay) ANOVA of accuracy data (accurate
target detection) showed significantmain effects of group [F(3,
65)¼ 4.29, p¼ .008], block [F(2, 130)¼ 11.74, p< .001], and
presentation rate [F(1, 65)¼ 13.72, p< .001]. Accuracy wors-
ened over the course of the test and with slower speed of
presentation. There were no significant interactions.
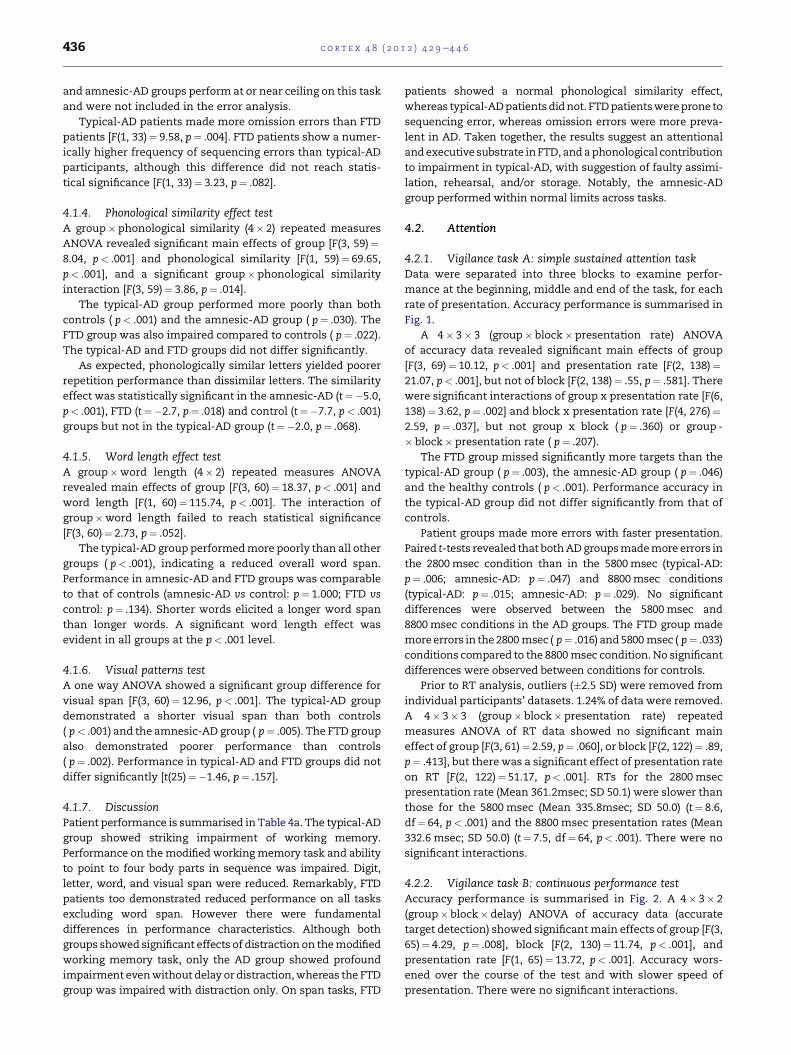
Table 4 e Summary table of findings.
Task Measure Result Comment
(a) Working memory
Modified working memory test Overall accuracy Typ-AD< FTD<Amn-AD¼ control Poorer performance in Typ-AD than other groups
Typ-AD impaired even without distraction or delay
FTD impaired only when distraction present
Amn-AD performance normal
No distraction, no delay Typ-AD< FTD¼Amn-AD¼ control
With delay Typ-AD< FTD¼Amn-AD¼ control
With distraction Typ-AD< FTD<Amn-AD¼ control
Digit span Forward and reverse Typ-AD¼ FTD<Amn-AD¼ control Span impaired in Typ-AD and FTD but not Amn-AD
More sequencing errors in FTDSequencing errors FTD>Typ-AD
Body part pointing Accuracy: four body parts Typ-AD< FTD<Amn-AD¼ control Poorer performance in Typ-AD than other groups
Typ-AD more prone to omission error (“forgetting” items),
FTD show tendency to misorder items
Omission errors Typ-AD> FTD
Sequencing errors FTD>Typ-AD (trend)
Phonological similarity task Overall letter span Typ-AD¼ FTD<Amn-AD¼ control Reduced letter span in both Typ-AD and FTD
Normal phonological similarity effect in FTD but not Typ-AD.Phonological similarity effect Absent in Typ-AD; Present in others
Word length Overall word span Typ-AD< FTD¼Amn-AD¼ control Reduced word span in Typ-AD only
Span affected by word length in all groupsWord length effect Present in all groups
Visual patterns Visual span Typ-AD¼ FTD<Amn-AD¼ control Reduced visual span in both Typ-AD and FTD
(b) Attention
Vigilance A: sustained attention Detection accuracy FTD<Typ-AD¼Amn-AD¼ control FTD impaired accuracy, Typ-AD perform normally
Accuracy in all patient groups affected by presentation speed
Speed of response normal in all groups
Presentation speed effect More errors with faster presentation
speed in patient groups, not controls
Reaction time Typ-AD¼ FTD¼Amn-AD¼ control
Vigilance B: continuous performance Overall accuracy Typ-AD¼ FTD<Amn-AD¼ control Typ-AD and FTD both show impaired accuracy
Response times normal in all groups
Behavioural observations show loss of track in Typ-AD
and distractibility in FTD
Reaction time Typ-AD¼ FTD¼Amn-AD¼ control
Loss of track of task Typ-AD present; FTD absent
Distractible behaviour FTD present; Typ-AD absent
(c) Executive function
Go-no-go Inhibition (no-go) errors FTD> other groups FTD make most ‘no-go’ responses and show marked effect
of ‘go’ to ‘no-go’ ratio
Both Typ-AD and FTD omit targets
Amn-AD perform normallyEffect go:no-go ratio FTD> other groups
Omission (go) errors Typ-AD¼ FTD<Amn-AD¼ controlSet-switching Accuracy FTD<Typ-AD<Amn-AD< control Impaired set-switching in all patient groups, worst in FTD
Response times slowed in Typ-AD and Amn-AD, not FTD
Typ-AD lose track, request repetition of instructions
FTD show erratic responding with poor use of feedback
Response time Typ-AD<Amn-AD< FTD¼ control
Loss of track Typ-AD present; FTD absent
Erratic, impulsive responses FTD present; Typ-AD absent
cortex
48
(2012)429e446
437
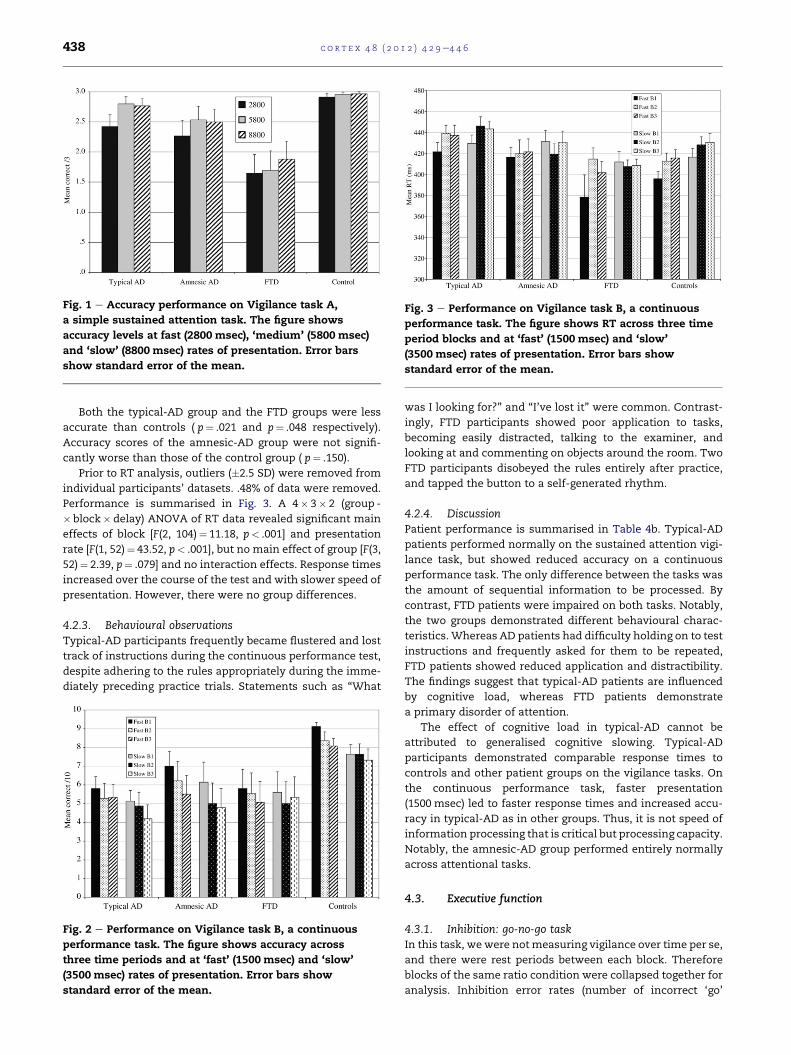
Fig. 3 e Performance on Vigilance task B, a continuous
performance task. The figure shows RT across three time
period blocks and at ‘fast’ (1500 msec) and ‘slow’
(3500 msec) rates of presentation. Error bars show
standard error of the mean.
Fig. 1 e Accuracy performance on Vigilance task A,
a simple sustained attention task. The figure shows
accuracy levels at fast (2800 msec), ‘medium’ (5800 msec)
and ‘slow’ (8800 msec) rates of presentation. Error bars
show standard error of the mean.
c o r t e x 4 8 ( 2 0 1 2 ) 4 2 9e4 4 6438
Both the typical-AD group and the FTD groups were less
accurate than controls ( p¼ .021 and p¼ .048 respectively).
Accuracy scores of the amnesic-AD group were not signifi-
cantly worse than those of the control group ( p¼ .150).
Prior to RT analysis, outliers (�2.5 SD) were removed from
individual participants’ datasets. .48% of data were removed.
Performance is summarised in Fig. 3. A 4� 3� 2 (group -
� block� delay) ANOVA of RT data revealed significant main
effects of block [F(2, 104)¼ 11.18, p< .001] and presentation
rate [F(1, 52)¼ 43.52, p< .001], but no main effect of group [F(3,
52)¼ 2.39, p¼ .079] and no interaction effects. Response times
increased over the course of the test and with slower speed of
presentation. However, there were no group differences.
4.2.3. Behavioural observationsTypical-AD participants frequently became flustered and lost
track of instructions during the continuous performance test,
despite adhering to the rules appropriately during the imme-
diately preceding practice trials. Statements such as “What
Fig. 2 e Performance on Vigilance task B, a continuous
performance task. The figure shows accuracy across
three time periods and at ‘fast’ (1500 msec) and ‘slow’
(3500 msec) rates of presentation. Error bars show
standard error of the mean.
was I looking for?” and “I’ve lost it” were common. Contrast-
ingly, FTD participants showed poor application to tasks,
becoming easily distracted, talking to the examiner, and
looking at and commenting on objects around the room. Two
FTD participants disobeyed the rules entirely after practice,
and tapped the button to a self-generated rhythm.
4.2.4. DiscussionPatient performance is summarised in Table 4b. Typical-AD
patients performed normally on the sustained attention vigi-
lance task, but showed reduced accuracy on a continuous
performance task. The only difference between the tasks was
the amount of sequential information to be processed. By
contrast, FTD patients were impaired on both tasks. Notably,
the two groups demonstrated different behavioural charac-
teristics. Whereas AD patients had difficulty holding on to test
instructions and frequently asked for them to be repeated,
FTD patients showed reduced application and distractibility.
The findings suggest that typical-AD patients are influenced
by cognitive load, whereas FTD patients demonstrate
a primary disorder of attention.
The effect of cognitive load in typical-AD cannot be
attributed to generalised cognitive slowing. Typical-AD
participants demonstrated comparable response times to
controls and other patient groups on the vigilance tasks. On
the continuous performance task, faster presentation
(1500 msec) led to faster response times and increased accu-
racy in typical-AD as in other groups. Thus, it is not speed of
information processing that is critical but processing capacity.
Notably, the amnesic-AD group performed entirely normally
across attentional tasks.
4.3. Executive function
4.3.1. Inhibition: go-no-go taskIn this task, wewere notmeasuring vigilance over time per se,
and there were rest periods between each block. Therefore
blocks of the same ratio condition were collapsed together for
analysis. Inhibition error rates (number of incorrect ‘go’
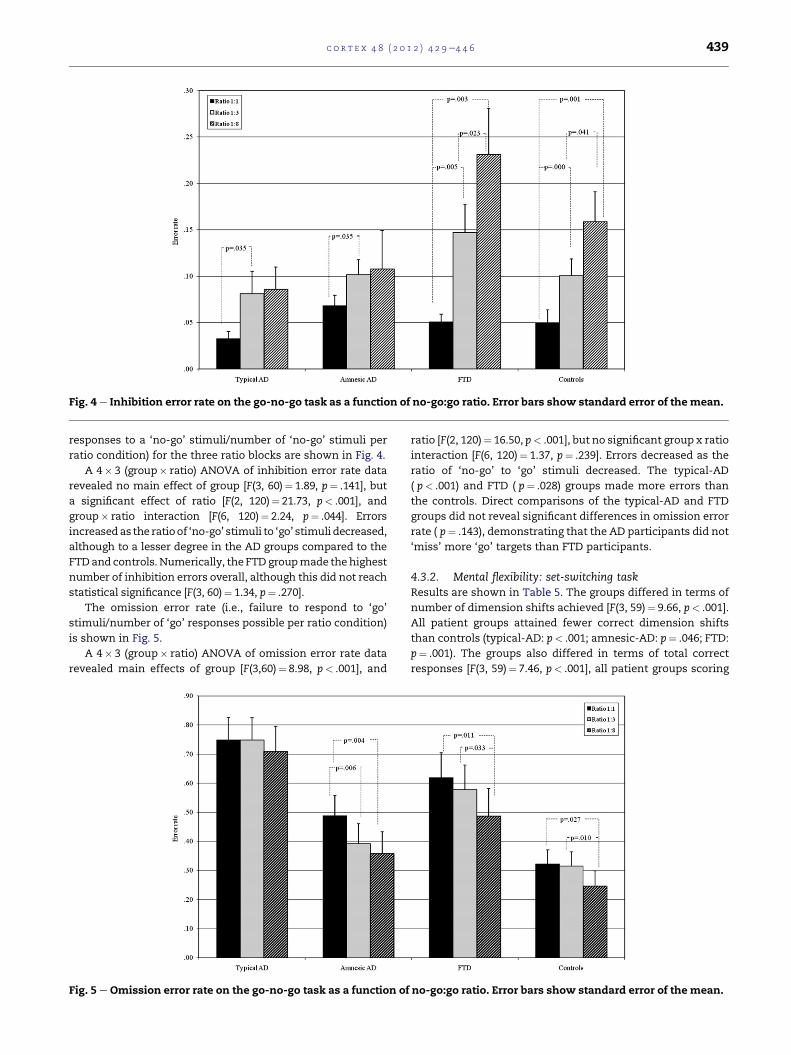
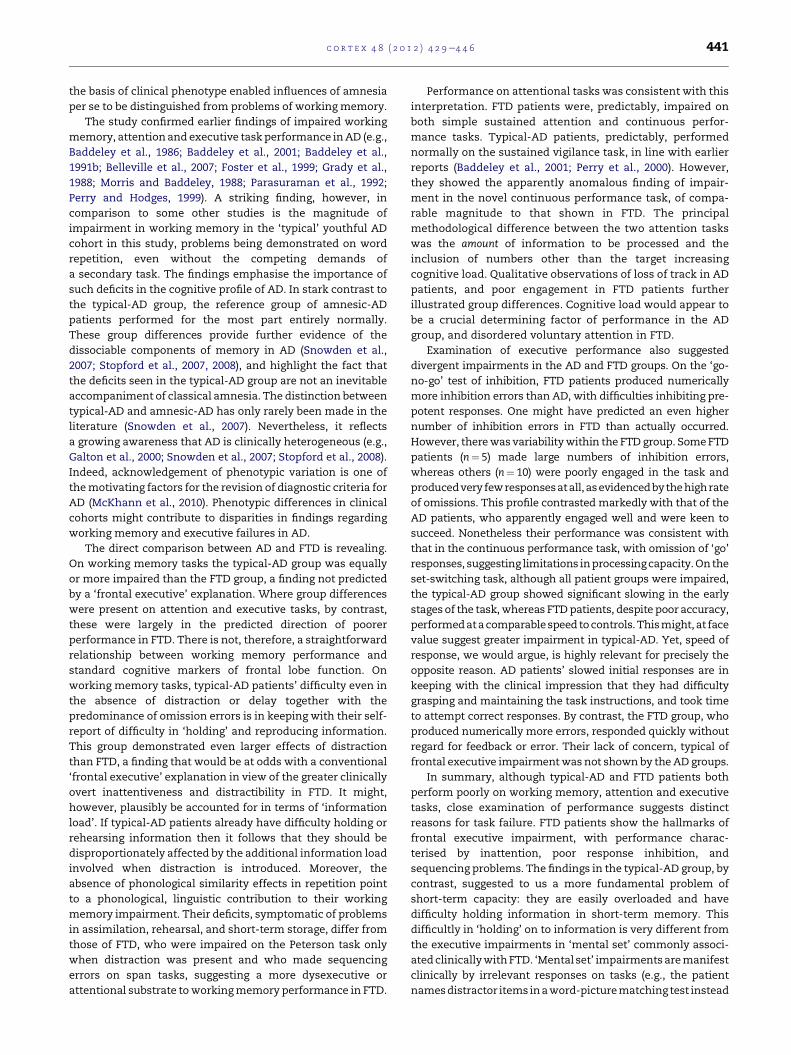
Fig. 4 e Inhibition error rate on the go-no-go task as a function of no-go:go ratio. Error bars show standard error of themean.
c o r t e x 4 8 ( 2 0 1 2 ) 4 2 9e4 4 6 439
responses to a ‘no-go’ stimuli/number of ‘no-go’ stimuli per
ratio condition) for the three ratio blocks are shown in Fig. 4.
A 4� 3 (group� ratio) ANOVA of inhibition error rate data
revealed no main effect of group [F(3, 60)¼ 1.89, p¼ .141], but
a significant effect of ratio [F(2, 120)¼ 21.73, p< .001], and
group� ratio interaction [F(6, 120)¼ 2.24, p¼ .044]. Errors
increasedas the ratioof ‘no-go’ stimuli to ‘go’ stimuli decreased,
although to a lesser degree in the AD groups compared to the
FTDand controls.Numerically, theFTDgroupmade thehighest
number of inhibition errors overall, although this did not reach
statistical significance [F(3, 60)¼ 1.34, p¼ .270].
The omission error rate (i.e., failure to respond to ‘go’
stimuli/number of ‘go’ responses possible per ratio condition)
is shown in Fig. 5.
A 4� 3 (group� ratio) ANOVA of omission error rate data
revealed main effects of group [F(3,60)¼ 8.98, p< .001], and
Fig. 5 e Omission error rate on the go-no-go task as a function of
ratio [F(2, 120)¼ 16.50, p< .001], but no significant group x ratio
interaction [F(6, 120)¼ 1.37, p¼ .239]. Errors decreased as the
ratio of ‘no-go’ to ‘go’ stimuli decreased. The typical-AD
( p< .001) and FTD ( p¼ .028) groups made more errors than
the controls. Direct comparisons of the typical-AD and FTD
groups did not reveal significant differences in omission error
rate ( p¼ .143), demonstrating that the AD participants did not
‘miss’ more ‘go’ targets than FTD participants.
4.3.2. Mental flexibility: set-switching taskResults are shown in Table 5. The groups differed in terms of
number of dimension shifts achieved [F(3, 59)¼ 9.66, p< .001].
All patient groups attained fewer correct dimension shifts
than controls (typical-AD: p< .001; amnesic-AD: p¼ .046; FTD:
p¼ .001). The groups also differed in terms of total correct
responses [F(3, 59)¼ 7.46, p< .001], all patient groups scoring
no-go:go ratio. Error bars show standard error of the mean.
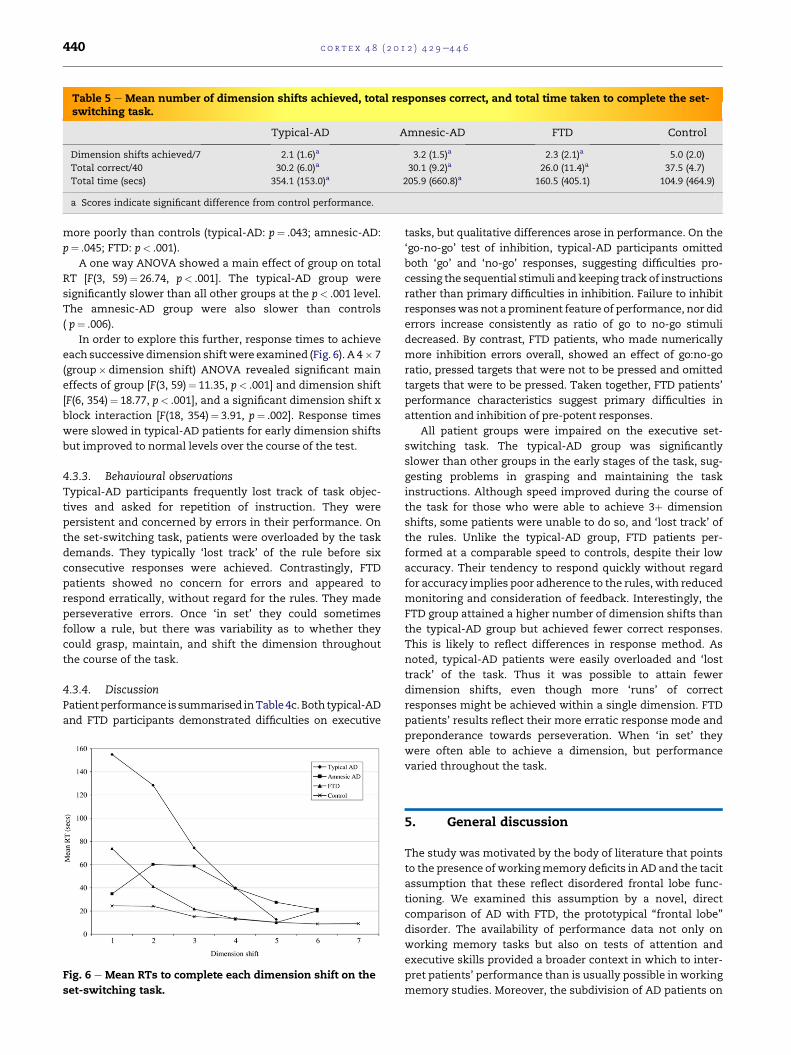
Table 5 e Mean number of dimension shifts achieved, total responses correct, and total time taken to complete the set-switching task.
Typical-AD Amnesic-AD FTD Control
Dimension shifts achieved/7 2.1 (1.6)a 3.2 (1.5)a 2.3 (2.1)a 5.0 (2.0)
Total correct/40 30.2 (6.0)a 30.1 (9.2)a 26.0 (11.4)a 37.5 (4.7)
Total time (secs) 354.1 (153.0)a 205.9 (660.8)a 160.5 (405.1) 104.9 (464.9)
a Scores indicate significant difference from control performance.
c o r t e x 4 8 ( 2 0 1 2 ) 4 2 9e4 4 6440
more poorly than controls (typical-AD: p¼ .043; amnesic-AD:
p¼ .045; FTD: p< .001).
A one way ANOVA showed a main effect of group on total
RT [F(3, 59)¼ 26.74, p< .001]. The typical-AD group were
significantly slower than all other groups at the p< .001 level.
The amnesic-AD group were also slower than controls
( p¼ .006).
In order to explore this further, response times to achieve
each successive dimension shiftwere examined (Fig. 6). A 4� 7
(group� dimension shift) ANOVA revealed significant main
effects of group [F(3, 59)¼ 11.35, p< .001] and dimension shift
[F(6, 354)¼ 18.77, p< .001], and a significant dimension shift x
block interaction [F(18, 354)¼ 3.91, p¼ .002]. Response times
were slowed in typical-AD patients for early dimension shifts
but improved to normal levels over the course of the test.
4.3.3. Behavioural observationsTypical-AD participants frequently lost track of task objec-
tives and asked for repetition of instruction. They were
persistent and concerned by errors in their performance. On
the set-switching task, patients were overloaded by the task
demands. They typically ‘lost track’ of the rule before six
consecutive responses were achieved. Contrastingly, FTD
patients showed no concern for errors and appeared to
respond erratically, without regard for the rules. They made
perseverative errors. Once ‘in set’ they could sometimes
follow a rule, but there was variability as to whether they
could grasp, maintain, and shift the dimension throughout
the course of the task.
4.3.4. DiscussionPatientperformance is summarised inTable 4c.Both typical-AD
and FTD participants demonstrated difficulties on executive
Fig. 6 e Mean RTs to complete each dimension shift on the
set-switching task.
tasks, but qualitative differences arose in performance. On the
‘go-no-go’ test of inhibition, typical-AD participants omitted
both ‘go’ and ‘no-go’ responses, suggesting difficulties pro-
cessing the sequential stimuli and keeping track of instructions
rather than primary difficulties in inhibition. Failure to inhibit
responseswas not a prominent feature of performance, nor did
errors increase consistently as ratio of go to no-go stimuli
decreased. By contrast, FTD patients, who made numerically
more inhibition errors overall, showed an effect of go:no-go
ratio, pressed targets that were not to be pressed and omitted
targets that were to be pressed. Taken together, FTD patients’
performance characteristics suggest primary difficulties in
attention and inhibition of pre-potent responses.
All patient groups were impaired on the executive set-
switching task. The typical-AD group was significantly
slower than other groups in the early stages of the task, sug-
gesting problems in grasping and maintaining the task
instructions. Although speed improved during the course of
the task for those who were able to achieve 3þ dimension
shifts, some patients were unable to do so, and ‘lost track’ of
the rules. Unlike the typical-AD group, FTD patients per-
formed at a comparable speed to controls, despite their low
accuracy. Their tendency to respond quickly without regard
for accuracy implies poor adherence to the rules, with reduced
monitoring and consideration of feedback. Interestingly, the
FTD group attained a higher number of dimension shifts than
the typical-AD group but achieved fewer correct responses.
This is likely to reflect differences in response method. As
noted, typical-AD patients were easily overloaded and ‘lost
track’ of the task. Thus it was possible to attain fewer
dimension shifts, even though more ‘runs’ of correct
responses might be achieved within a single dimension. FTD
patients’ results reflect their more erratic response mode and
preponderance towards perseveration. When ‘in set’ they
were often able to achieve a dimension, but performance
varied throughout the task.
5. General discussion
The study was motivated by the body of literature that points
to the presence of workingmemory deficits in AD and the tacit
assumption that these reflect disordered frontal lobe func-
tioning. We examined this assumption by a novel, direct
comparison of AD with FTD, the prototypical “frontal lobe”
disorder. The availability of performance data not only on
working memory tasks but also on tests of attention and
executive skills provided a broader context in which to inter-
pret patients’ performance than is usually possible in working
memory studies. Moreover, the subdivision of AD patients on
c o r t e x 4 8 ( 2 0 1 2 ) 4 2 9e4 4 6 441
the basis of clinical phenotype enabled influences of amnesia
per se to be distinguished from problems of working memory.
The study confirmed earlier findings of impaired working
memory, attentionand executive taskperformance inAD (e.g.,
Baddeley et al., 1986; Baddeley et al., 2001; Baddeley et al.,
1991b; Belleville et al., 2007; Foster et al., 1999; Grady et al.,
1988; Morris and Baddeley, 1988; Parasuraman et al., 1992;
Perry and Hodges, 1999). A striking finding, however, in
comparison to some other studies is the magnitude of
impairment in working memory in the ‘typical’ youthful AD
cohort in this study, problems being demonstrated on word
repetition, even without the competing demands of
a secondary task. The findings emphasise the importance of
such deficits in the cognitive profile of AD. In stark contrast to
the typical-AD group, the reference group of amnesic-AD
patients performed for the most part entirely normally.
These group differences provide further evidence of the
dissociable components of memory in AD (Snowden et al.,
2007; Stopford et al., 2007, 2008), and highlight the fact that
the deficits seen in the typical-AD group are not an inevitable
accompaniment of classical amnesia. The distinction between
typical-AD and amnesic-AD has only rarely been made in the
literature (Snowden et al., 2007). Nevertheless, it reflects
a growing awareness that AD is clinically heterogeneous (e.g.,
Galton et al., 2000; Snowden et al., 2007; Stopford et al., 2008).
Indeed, acknowledgement of phenotypic variation is one of
themotivating factors for the revision of diagnostic criteria for
AD (McKhann et al., 2010). Phenotypic differences in clinical
cohorts might contribute to disparities in findings regarding
working memory and executive failures in AD.
The direct comparison between AD and FTD is revealing.
On working memory tasks the typical-AD group was equally
or more impaired than the FTD group, a finding not predicted
by a ‘frontal executive’ explanation. Where group differences
were present on attention and executive tasks, by contrast,
these were largely in the predicted direction of poorer
performance in FTD. There is not, therefore, a straightforward
relationship between working memory performance and
standard cognitive markers of frontal lobe function. On
working memory tasks, typical-AD patients’ difficulty even in
the absence of distraction or delay together with the
predominance of omission errors is in keeping with their self-
report of difficulty in ‘holding’ and reproducing information.
This group demonstrated even larger effects of distraction
than FTD, a finding that would be at odds with a conventional
‘frontal executive’ explanation in view of the greater clinically
overt inattentiveness and distractibility in FTD. It might,
however, plausibly be accounted for in terms of ‘information
load’. If typical-AD patients already have difficulty holding or
rehearsing information then it follows that they should be
disproportionately affected by the additional information load
involved when distraction is introduced. Moreover, the
absence of phonological similarity effects in repetition point
to a phonological, linguistic contribution to their working
memory impairment. Their deficits, symptomatic of problems
in assimilation, rehearsal, and short-term storage, differ from
those of FTD, who were impaired on the Peterson task only
when distraction was present and who made sequencing
errors on span tasks, suggesting a more dysexecutive or
attentional substrate toworkingmemory performance in FTD.
Performance on attentional tasks was consistent with this
interpretation. FTD patients were, predictably, impaired on
both simple sustained attention and continuous perfor-
mance tasks. Typical-AD patients, predictably, performed
normally on the sustained vigilance task, in line with earlier
reports (Baddeley et al., 2001; Perry et al., 2000). However,
they showed the apparently anomalous finding of impair-
ment in the novel continuous performance task, of compa-
rable magnitude to that shown in FTD. The principal
methodological difference between the two attention tasks
was the amount of information to be processed and the
inclusion of numbers other than the target increasing
cognitive load. Qualitative observations of loss of track in AD
patients, and poor engagement in FTD patients further
illustrated group differences. Cognitive load would appear to
be a crucial determining factor of performance in the AD
group, and disordered voluntary attention in FTD.
Examination of executive performance also suggested
divergent impairments in the AD and FTD groups. On the ‘go-
no-go’ test of inhibition, FTD patients produced numerically
more inhibition errors than AD, with difficulties inhibiting pre-
potent responses. One might have predicted an even higher
number of inhibition errors in FTD than actually occurred.
However, therewas variabilitywithin the FTD group. SomeFTD
patients (n¼ 5) made large numbers of inhibition errors,
whereas others (n¼ 10) were poorly engaged in the task and
producedvery fewresponsesatall,asevidencedbythehighrate
of omissions. This profile contrasted markedly with that of the
AD patients, who apparently engaged well and were keen to
succeed. Nonetheless their performance was consistent with
that in the continuous performance task, with omission of ‘go’
responses, suggesting limitations inprocessingcapacity.Onthe
set-switching task, although all patient groups were impaired,
the typical-AD group showed significant slowing in the early
stages of the task,whereas FTDpatients, despite poor accuracy,
performedatacomparablespeed tocontrols.Thismight, at face
value suggest greater impairment in typical-AD. Yet, speed of
response, we would argue, is highly relevant for precisely the
opposite reason. AD patients’ slowed initial responses are in
keeping with the clinical impression that they had difficulty
grasping and maintaining the task instructions, and took time
to attempt correct responses. By contrast, the FTD group, who
produced numerically more errors, responded quickly without
regard for feedback or error. Their lack of concern, typical of
frontal executive impairmentwas not shown by theADgroups.
In summary, although typical-AD and FTD patients both
perform poorly on working memory, attention and executive
tasks, close examination of performance suggests distinct
reasons for task failure. FTD patients show the hallmarks of
frontal executive impairment, with performance charac-
terised by inattention, poor response inhibition, and
sequencing problems. The findings in the typical-AD group, by
contrast, suggested to us a more fundamental problem of
short-term capacity: they are easily overloaded and have
difficulty holding information in short-term memory. This
difficultly in ‘holding’ on to information is very different from
the executive impairments in ‘mental set’ commonly associ-
ated clinicallywith FTD. ‘Mental set’ impairments aremanifest
clinically by irrelevant responses on tasks (e.g., the patient
namesdistractor items inaword-picturematching test instead
c o r t e x 4 8 ( 2 0 1 2 ) 4 2 9e4 4 6442
of pointing to the target picture as instructed). By contrast,
‘holding’ difficulties are manifest clinically by frequent
requests for repetition of instructions, and questions and
comments such as “what am I doing?” and “it just flies away
from me” are common. The patients in this study showed
precisely these distinctions. ADpatients asked for repetitionof
instructions and remarked that they had ‘forgotten’ what they
needed to do but remained engaged in the task. FTD patients
became disengaged, discussed irrelevant topics and required
their attention to be re-directed to the task at hand.
The findings allow us to draw the important conclusion
that poor performance on executive and attentional tasks in
AD and FTD arises for different underlying reasons. The
implication is that frontal executive dysfunction may not be
the primary basis of working memory impairment in early-
onset AD.
It is likely that there is a phonological contribution to
patients’ working memory impairment. The typical-AD group
demonstrated an abnormal phonological similarity effect,
with difficulty repeating even phonologically dissimilar
letters, consistent with their reduced span across tasks.
Notably, in previous studies we have reported phonological
errors in naming, repetition, and memory tasks (Stopford
et al., 2007; Thompson et al., 2005). Phonological short-term
memory impairments in AD have been reported by some
(Belleville et al., 1996; Caza and Belleville, 2008; Collette et al.,
1999a; Hulme et al., 1993), but not others (Morris, 1984). Such
differences have been ascribed to differences in severity of
illness (Collette et al., 1999a). Indeed, in an early study
(Kopelman, 1985) inferior performance on the Peterson para-
digm and immediate sentence recall was attributed to greater
severity of patients with more virulent disease. What is
interesting, however, is that in that study patients with
working memory problems were more youthful than those
without. Our findings (Snowden et al., 2007) suggest that
cortical temporoparietal symptomatology of impaired
language and perceptuospatial function is more usually
associated with early-onset disease. Consistent with this, the
AD patients in the present study who had working memory
impairments and reduced phonological similarity effect were
younger and more likely to show temporoparietal abnormal-
ities on neuroimaging than those amnesic-AD patients in
whom both working memory performance and the phono-
logical similarity effect were preserved. Duration of symptoms
at the time of testing was comparable in the two groups.
Moreover, all patient groupswere rated as ‘mild’ on the overall
Clinical Dementia Rating Scale and it was only in the amnesic-
AD and FTD groups that ratings on individual measures
reachedmoderate and severe levels. AlthoughMMSE scores of
the typical-AD group were lower, there is evidence to suggest
that this tool, that places heavy demands on language skills,
may be unreliable in providing a meaningful comparison of
severity among patients whose deficits are not uniform
(Stopford et al., 2008). The FTD patients in this study for
example, retain high MMSE scores despite marked behav-
ioural change and functional impairment in acts of daily
living, warranting moderate to severe scores on the Clinical
Dementia Rating Scale, a tool which is notably weighted
towards memory in its algorithm to create an overall score.
We would argue that the typical-AD patients are not simply
more severely affected, nor do they have a more virulent form
of disease, but instead that the workingmemory problems are
part of the posterior cortical symptomatology typical of
youthful presentations of AD.
The additional presence of visual span deficits points to
impairment too in visual short-termmemory. Span taskswere
carried out in isolation, therefore deficits cannot be attributed
to dual-task impairment, as has been previously argued for
other cohorts (e.g., Baddeley et al., 1991a; Baddeley et al., 1986;
Morris, 1984;Morris, 1986;Morris andBaddeley, 1988). Thedata
therefore suggest specific impairments in phonological and
visuospatial short-term capacity and processing, rather than
the central executive component ofworkingmemory.Notably,
the deficit in the typical-ADpatients bears resemblance to that
of ‘short-termmemory’ patients (e.g., Saffran andMarin, 1975;
Shallice and Warrington, 1970; Warrington et al., 1971;
Warrington and Shallice, 1969), who, like this AD cohort,
have lesions in temporoparietal cortex. These patients
demonstrate profound difficulties in auditory-verbal (e.g.,
Saffran and Marin, 1975; Shallice and Warrington, 1970;
Warrington et al., 1971; Warrington and Shallice, 1969) and
spatial (De Renzi and Nichelli, 1975) short-termmemory, with
problems in repetition span and keeping track of information
in the immediate present. Difficulties in ‘holding’ information
are reported with apparent sparing of long-term memory, in
keeping with the circumscribed temporoparietal damage and
sparing of hippocampal regions.
The connection of AD patients’ working memory impair-
ment to dysfunction of the temporoparietal regions is highly
relevant. Although the importance of the frontal lobes for
workingmemory iswell established (D’Esposito et al., 1995; Lim
et al., 2008; Muller and Knight, 2006; Peters et al., 2009), recent
years have seen an accumulation of evidence for the additional
role of posterior cortices. Studies have shown temporoparietal/
parietal activation during cross modal binding tasks (Campo
et al., 2008; Zhang et al., 2004) and memory retrieval (Berryhill
and Olson, 2008; Henson et al., 1999; Rugg et al., 2002; Simons
et al., 2008). The parietal lobes have also been shown to play
a role in information manipulation (Champod and Petrides,
2007; Marshuetz et al., 2000), temporary storage (Jonides et al.,
1998; Postle et al., 2006), and attentional networks related to
storage mediation (Magen et al., 2009). The demonstration in
healthy volunteers of activation of widespread frontoparietal
networks during working memory tasks provides further
evidence of the involvement of regions beyond the frontal lobes
(LaBar et al., 1999; Magen et al., 2009; Owen et al., 2005).
Evidence of the role of the posterior cortices in binding,
manipulation, and storage has led to the proposal that it is
these regions that correlate to the ‘episodic buffer’ component
of working memory (Vilberg and Rugg, 2008). In the present
study, typical-AD patients were easily overloaded by infor-
mation and performance declined with increased task
demands. Might this ‘overload’ of capacity reflect difficulties
in information binding, suggesting an impairment of the
episodic buffer component of working memory? Impaired
performance on associative learning tasks (Della Sala and
Logie, 2002; Lindeboom et al., 2002; Swainson et al., 2001),
difficulties holding integrated information from different
sources in verbal short-term memory (Parra et al., 2009), and
reduced benefit from semantic-relatedness in recall of word
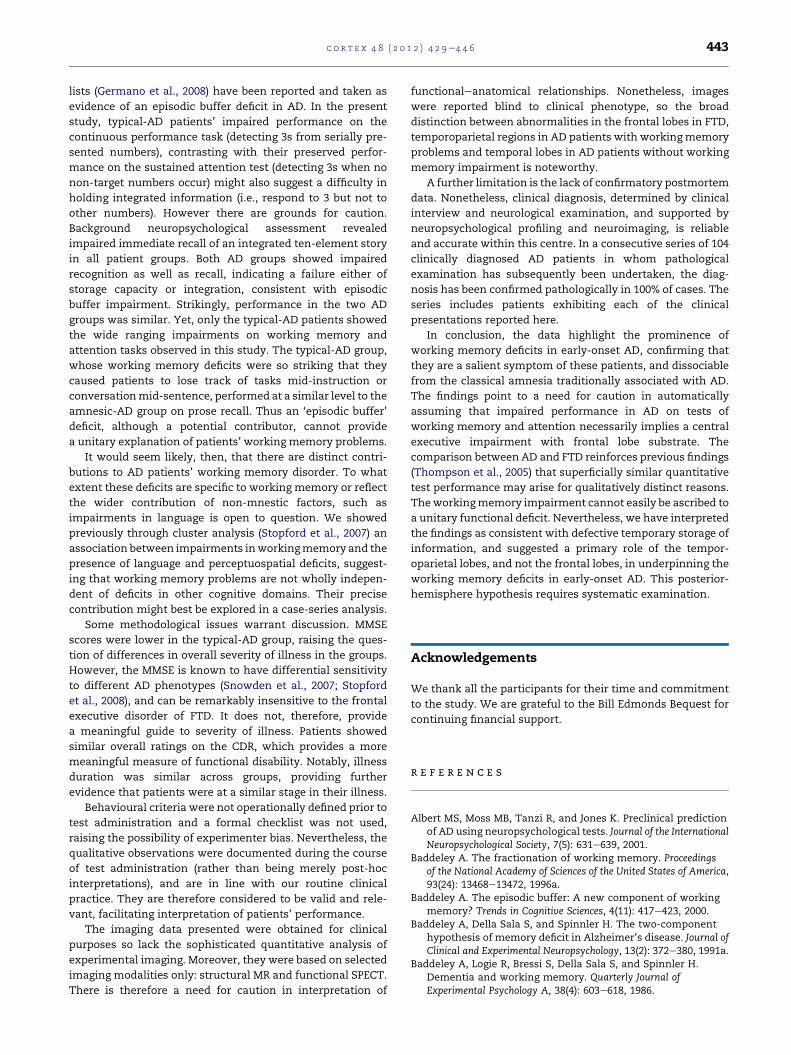
c o r t e x 4 8 ( 2 0 1 2 ) 4 2 9e4 4 6 443
lists (Germano et al., 2008) have been reported and taken as
evidence of an episodic buffer deficit in AD. In the present
study, typical-AD patients’ impaired performance on the
continuous performance task (detecting 3s from serially pre-
sented numbers), contrasting with their preserved perfor-
mance on the sustained attention test (detecting 3s when no
non-target numbers occur) might also suggest a difficulty in
holding integrated information (i.e., respond to 3 but not to
other numbers). However there are grounds for caution.
Background neuropsychological assessment revealed
impaired immediate recall of an integrated ten-element story
in all patient groups. Both AD groups showed impaired
recognition as well as recall, indicating a failure either of
storage capacity or integration, consistent with episodic
buffer impairment. Strikingly, performance in the two AD
groups was similar. Yet, only the typical-AD patients showed
the wide ranging impairments on working memory and
attention tasks observed in this study. The typical-AD group,
whose working memory deficits were so striking that they
caused patients to lose track of tasks mid-instruction or
conversationmid-sentence, performed at a similar level to the
amnesic-AD group on prose recall. Thus an ‘episodic buffer’
deficit, although a potential contributor, cannot provide
a unitary explanation of patients’ working memory problems.
It would seem likely, then, that there are distinct contri-
butions to AD patients’ working memory disorder. To what
extent these deficits are specific to working memory or reflect
the wider contribution of non-mnestic factors, such as
impairments in language is open to question. We showed
previously through cluster analysis (Stopford et al., 2007) an
association between impairments inworkingmemory and the
presence of language and perceptuospatial deficits, suggest-
ing that working memory problems are not wholly indepen-
dent of deficits in other cognitive domains. Their precise
contribution might best be explored in a case-series analysis.
Some methodological issues warrant discussion. MMSE
scores were lower in the typical-AD group, raising the ques-
tion of differences in overall severity of illness in the groups.
However, the MMSE is known to have differential sensitivity
to different AD phenotypes (Snowden et al., 2007; Stopford
et al., 2008), and can be remarkably insensitive to the frontal
executive disorder of FTD. It does not, therefore, provide
a meaningful guide to severity of illness. Patients showed
similar overall ratings on the CDR, which provides a more
meaningful measure of functional disability. Notably, illness
duration was similar across groups, providing further
evidence that patients were at a similar stage in their illness.
Behavioural criteria were not operationally defined prior to
test administration and a formal checklist was not used,
raising the possibility of experimenter bias. Nevertheless, the
qualitative observations were documented during the course
of test administration (rather than being merely post-hoc
interpretations), and are in line with our routine clinical
practice. They are therefore considered to be valid and rele-
vant, facilitating interpretation of patients’ performance.
The imaging data presented were obtained for clinical
purposes so lack the sophisticated quantitative analysis of
experimental imaging. Moreover, they were based on selected
imaging modalities only: structural MR and functional SPECT.
There is therefore a need for caution in interpretation of
functionaleanatomical relationships. Nonetheless, images
were reported blind to clinical phenotype, so the broad
distinction between abnormalities in the frontal lobes in FTD,
temporoparietal regions in AD patients with workingmemory
problems and temporal lobes in AD patients without working
memory impairment is noteworthy.
A further limitation is the lack of confirmatory postmortem
data. Nonetheless, clinical diagnosis, determined by clinical
interview and neurological examination, and supported by
neuropsychological profiling and neuroimaging, is reliable
and accurate within this centre. In a consecutive series of 104
clinically diagnosed AD patients in whom pathological
examination has subsequently been undertaken, the diag-
nosis has been confirmed pathologically in 100% of cases. The
series includes patients exhibiting each of the clinical
presentations reported here.
In conclusion, the data highlight the prominence of
working memory deficits in early-onset AD, confirming that
they are a salient symptom of these patients, and dissociable
from the classical amnesia traditionally associated with AD.
The findings point to a need for caution in automatically
assuming that impaired performance in AD on tests of
working memory and attention necessarily implies a central
executive impairment with frontal lobe substrate. The
comparison between AD and FTD reinforces previous findings
(Thompson et al., 2005) that superficially similar quantitative
test performance may arise for qualitatively distinct reasons.
Theworkingmemory impairment cannot easily be ascribed to
a unitary functional deficit. Nevertheless, we have interpreted
the findings as consistent with defective temporary storage of
information, and suggested a primary role of the tempor-
oparietal lobes, and not the frontal lobes, in underpinning the
working memory deficits in early-onset AD. This posterior-
hemisphere hypothesis requires systematic examination.
Acknowledgements
We thank all the participants for their time and commitment
to the study. We are grateful to the Bill Edmonds Bequest for
continuing financial support.
r e f e r e n c e s
Albert MS, Moss MB, Tanzi R, and Jones K. Preclinical predictionof AD using neuropsychological tests. Journal of the InternationalNeuropsychological Society, 7(5): 631e639, 2001.
Baddeley A. The fractionation of working memory. Proceedingsof the National Academy of Sciences of the United States of America,93(24): 13468e13472, 1996a.
Baddeley A. The episodic buffer: A new component of workingmemory? Trends in Cognitive Sciences, 4(11): 417e423, 2000.
Baddeley A, Della Sala S, and Spinnler H. The two-componenthypothesis of memory deficit in Alzheimer’s disease. Journal ofClinical and Experimental Neuropsychology, 13(2): 372e380, 1991a.
Baddeley A, Logie R, Bressi S, Della Sala S, and Spinnler H.Dementia and working memory. Quarterly Journal ofExperimental Psychology A, 38(4): 603e618, 1986.
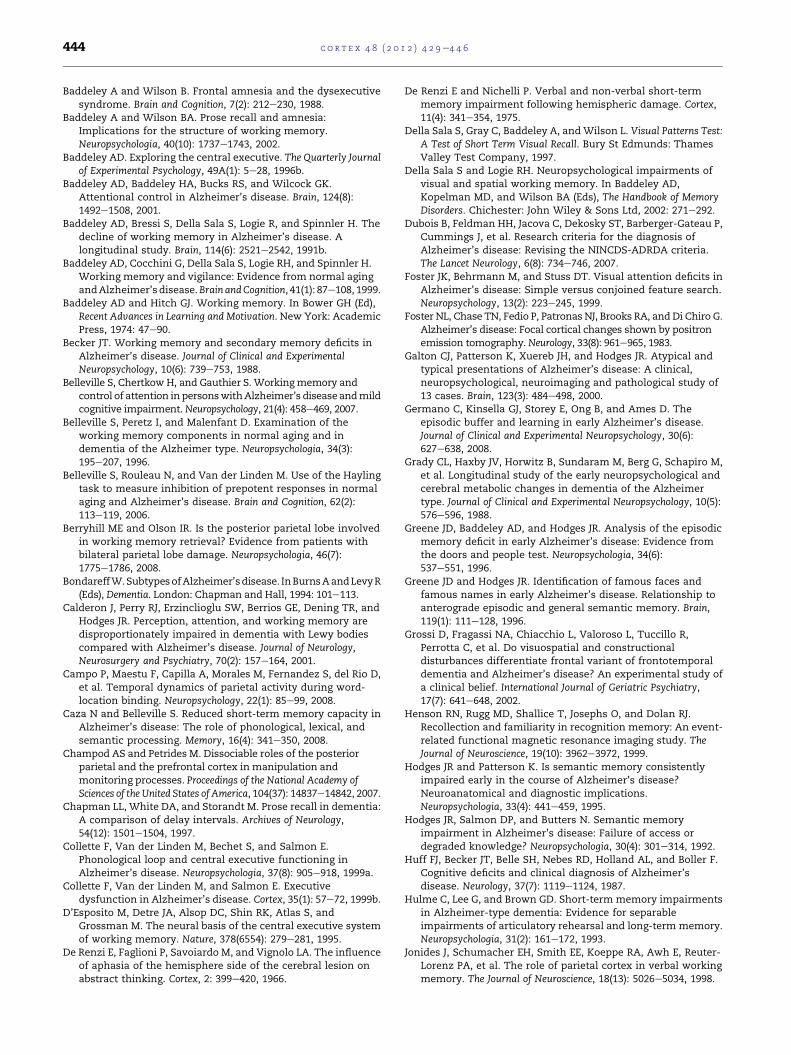
c o r t e x 4 8 ( 2 0 1 2 ) 4 2 9e4 4 6444
Baddeley A and Wilson B. Frontal amnesia and the dysexecutivesyndrome. Brain and Cognition, 7(2): 212e230, 1988.
Baddeley A and Wilson BA. Prose recall and amnesia:Implications for the structure of working memory.Neuropsychologia, 40(10): 1737e1743, 2002.
Baddeley AD. Exploring the central executive. The Quarterly Journalof Experimental Psychology, 49A(1): 5e28, 1996b.
Baddeley AD, Baddeley HA, Bucks RS, and Wilcock GK.Attentional control in Alzheimer’s disease. Brain, 124(8):1492e1508, 2001.
Baddeley AD, Bressi S, Della Sala S, Logie R, and Spinnler H. Thedecline of working memory in Alzheimer’s disease. Alongitudinal study. Brain, 114(6): 2521e2542, 1991b.
Baddeley AD, Cocchini G, Della Sala S, Logie RH, and Spinnler H.Working memory and vigilance: Evidence from normal agingandAlzheimer’s disease.Brain andCognition, 41(1): 87e108, 1999.
Baddeley AD and Hitch GJ. Working memory. In Bower GH (Ed),Recent Advances in Learning and Motivation. New York: AcademicPress, 1974: 47e90.
Becker JT. Working memory and secondary memory deficits inAlzheimer’s disease. Journal of Clinical and ExperimentalNeuropsychology, 10(6): 739e753, 1988.
Belleville S, Chertkow H, and Gauthier S. Workingmemory andcontrol of attention inpersonswithAlzheimer’s diseaseandmildcognitive impairment. Neuropsychology, 21(4): 458e469, 2007.
Belleville S, Peretz I, and Malenfant D. Examination of theworking memory components in normal aging and indementia of the Alzheimer type. Neuropsychologia, 34(3):195e207, 1996.
Belleville S, Rouleau N, and Van der Linden M. Use of the Haylingtask to measure inhibition of prepotent responses in normalaging and Alzheimer’s disease. Brain and Cognition, 62(2):113e119, 2006.
Berryhill ME and Olson IR. Is the posterior parietal lobe involvedin working memory retrieval? Evidence from patients withbilateral parietal lobe damage. Neuropsychologia, 46(7):1775e1786, 2008.
BondareffW.SubtypesofAlzheimer’sdisease. InBurnsAandLevyR(Eds), Dementia. London: Chapman and Hall, 1994: 101e113.
Calderon J, Perry RJ, Erzinclioglu SW, Berrios GE, Dening TR, andHodges JR. Perception, attention, and working memory aredisproportionately impaired in dementia with Lewy bodiescompared with Alzheimer’s disease. Journal of Neurology,Neurosurgery and Psychiatry, 70(2): 157e164, 2001.
Campo P, Maestu F, Capilla A, Morales M, Fernandez S, del Rio D,et al. Temporal dynamics of parietal activity during word-location binding. Neuropsychology, 22(1): 85e99, 2008.
Caza N and Belleville S. Reduced short-term memory capacity inAlzheimer’s disease: The role of phonological, lexical, andsemantic processing. Memory, 16(4): 341e350, 2008.
Champod AS and Petrides M. Dissociable roles of the posteriorparietal and the prefrontal cortex in manipulation andmonitoring processes. Proceedings of the National Academy ofSciences of the United States of America, 104(37): 14837e14842, 2007.
Chapman LL, White DA, and Storandt M. Prose recall in dementia:A comparison of delay intervals. Archives of Neurology,54(12): 1501e1504, 1997.
Collette F, Van der Linden M, Bechet S, and Salmon E.Phonological loop and central executive functioning inAlzheimer’s disease. Neuropsychologia, 37(8): 905e918, 1999a.
Collette F, Van der Linden M, and Salmon E. Executivedysfunction in Alzheimer’s disease. Cortex, 35(1): 57e72, 1999b.
D’Esposito M, Detre JA, Alsop DC, Shin RK, Atlas S, andGrossman M. The neural basis of the central executive systemof working memory. Nature, 378(6554): 279e281, 1995.
De Renzi E, Faglioni P, Savoiardo M, and Vignolo LA. The influenceof aphasia of the hemisphere side of the cerebral lesion onabstract thinking. Cortex, 2: 399e420, 1966.
De Renzi E and Nichelli P. Verbal and non-verbal short-termmemory impairment following hemispheric damage. Cortex,11(4): 341e354, 1975.
Della Sala S, Gray C, Baddeley A, andWilson L. Visual Patterns Test:A Test of Short Term Visual Recall. Bury St Edmunds: ThamesValley Test Company, 1997.
Della Sala S and Logie RH. Neuropsychological impairments ofvisual and spatial working memory. In Baddeley AD,Kopelman MD, and Wilson BA (Eds), The Handbook of MemoryDisorders. Chichester: John Wiley & Sons Ltd, 2002: 271e292.
Dubois B, Feldman HH, Jacova C, Dekosky ST, Barberger-Gateau P,Cummings J, et al. Research criteria for the diagnosis ofAlzheimer’s disease: Revising the NINCDS-ADRDA criteria.The Lancet Neurology, 6(8): 734e746, 2007.
Foster JK, Behrmann M, and Stuss DT. Visual attention deficits inAlzheimer’s disease: Simple versus conjoined feature search.Neuropsychology, 13(2): 223e245, 1999.
Foster NL, Chase TN, Fedio P, Patronas NJ, Brooks RA, and Di Chiro G.Alzheimer’s disease: Focal cortical changes shown by positronemission tomography.Neurology, 33(8): 961e965, 1983.
Galton CJ, Patterson K, Xuereb JH, and Hodges JR. Atypical andtypical presentations of Alzheimer’s disease: A clinical,neuropsychological, neuroimaging and pathological study of13 cases. Brain, 123(3): 484e498, 2000.
Germano C, Kinsella GJ, Storey E, Ong B, and Ames D. Theepisodic buffer and learning in early Alzheimer’s disease.Journal of Clinical and Experimental Neuropsychology, 30(6):627e638, 2008.
Grady CL, Haxby JV, Horwitz B, Sundaram M, Berg G, Schapiro M,et al. Longitudinal study of the early neuropsychological andcerebral metabolic changes in dementia of the Alzheimertype. Journal of Clinical and Experimental Neuropsychology, 10(5):576e596, 1988.
Greene JD, Baddeley AD, and Hodges JR. Analysis of the episodicmemory deficit in early Alzheimer’s disease: Evidence fromthe doors and people test. Neuropsychologia, 34(6):537e551, 1996.
Greene JD and Hodges JR. Identification of famous faces andfamous names in early Alzheimer’s disease. Relationship toanterograde episodic and general semantic memory. Brain,119(1): 111e128, 1996.
Grossi D, Fragassi NA, Chiacchio L, Valoroso L, Tuccillo R,Perrotta C, et al. Do visuospatial and constructionaldisturbances differentiate frontal variant of frontotemporaldementia and Alzheimer’s disease? An experimental study ofa clinical belief. International Journal of Geriatric Psychiatry,17(7): 641e648, 2002.
Henson RN, Rugg MD, Shallice T, Josephs O, and Dolan RJ.Recollection and familiarity in recognition memory: An event-related functional magnetic resonance imaging study. TheJournal of Neuroscience, 19(10): 3962e3972, 1999.
Hodges JR and Patterson K. Is semantic memory consistentlyimpaired early in the course of Alzheimer’s disease?Neuroanatomical and diagnostic implications.Neuropsychologia, 33(4): 441e459, 1995.
Hodges JR, Salmon DP, and Butters N. Semantic memoryimpairment in Alzheimer’s disease: Failure of access ordegraded knowledge? Neuropsychologia, 30(4): 301e314, 1992.
Huff FJ, Becker JT, Belle SH, Nebes RD, Holland AL, and Boller F.Cognitive deficits and clinical diagnosis of Alzheimer’sdisease. Neurology, 37(7): 1119e1124, 1987.
Hulme C, Lee G, and Brown GD. Short-term memory impairmentsin Alzheimer-type dementia: Evidence for separableimpairments of articulatory rehearsal and long-term memory.Neuropsychologia, 31(2): 161e172, 1993.
Jonides J, Schumacher EH, Smith EE, Koeppe RA, Awh E, Reuter-Lorenz PA, et al. The role of parietal cortex in verbal workingmemory. The Journal of Neuroscience, 18(13): 5026e5034, 1998.
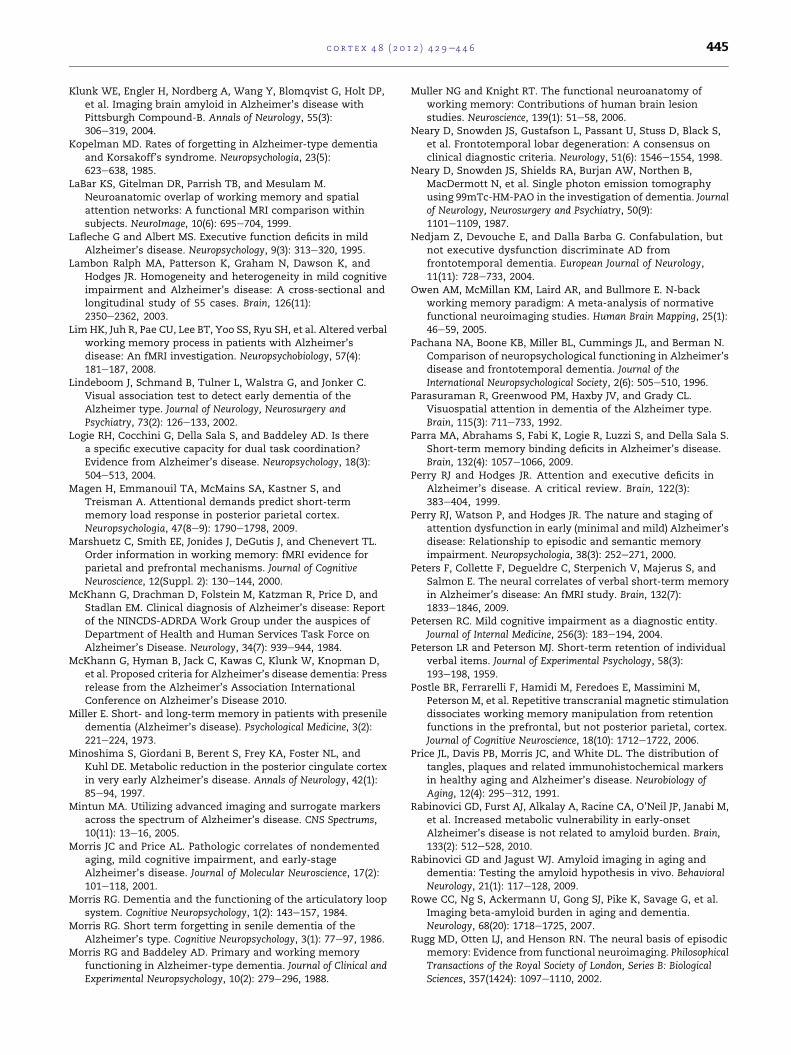
c o r t e x 4 8 ( 2 0 1 2 ) 4 2 9e4 4 6 445
Klunk WE, Engler H, Nordberg A, Wang Y, Blomqvist G, Holt DP,et al. Imaging brain amyloid in Alzheimer’s disease withPittsburgh Compound-B. Annals of Neurology, 55(3):306e319, 2004.
Kopelman MD. Rates of forgetting in Alzheimer-type dementiaand Korsakoff’s syndrome. Neuropsychologia, 23(5):623e638, 1985.
LaBar KS, Gitelman DR, Parrish TB, and Mesulam M.Neuroanatomic overlap of working memory and spatialattention networks: A functional MRI comparison withinsubjects. NeuroImage, 10(6): 695e704, 1999.
Lafleche G and Albert MS. Executive function deficits in mildAlzheimer’s disease. Neuropsychology, 9(3): 313e320, 1995.
Lambon Ralph MA, Patterson K, Graham N, Dawson K, andHodges JR. Homogeneity and heterogeneity in mild cognitiveimpairment and Alzheimer’s disease: A cross-sectional andlongitudinal study of 55 cases. Brain, 126(11):2350e2362, 2003.
Lim HK, Juh R, Pae CU, Lee BT, Yoo SS, Ryu SH, et al. Altered verbalworking memory process in patients with Alzheimer’sdisease: An fMRI investigation. Neuropsychobiology, 57(4):181e187, 2008.
Lindeboom J, Schmand B, Tulner L, Walstra G, and Jonker C.Visual association test to detect early dementia of theAlzheimer type. Journal of Neurology, Neurosurgery andPsychiatry, 73(2): 126e133, 2002.
Logie RH, Cocchini G, Della Sala S, and Baddeley AD. Is therea specific executive capacity for dual task coordination?Evidence from Alzheimer’s disease. Neuropsychology, 18(3):504e513, 2004.
Magen H, Emmanouil TA, McMains SA, Kastner S, andTreisman A. Attentional demands predict short-termmemory load response in posterior parietal cortex.Neuropsychologia, 47(8e9): 1790e1798, 2009.
Marshuetz C, Smith EE, Jonides J, DeGutis J, and Chenevert TL.Order information in working memory: fMRI evidence forparietal and prefrontal mechanisms. Journal of CognitiveNeuroscience, 12(Suppl. 2): 130e144, 2000.
McKhann G, Drachman D, Folstein M, Katzman R, Price D, andStadlan EM. Clinical diagnosis of Alzheimer’s disease: Reportof the NINCDS-ADRDA Work Group under the auspices ofDepartment of Health and Human Services Task Force onAlzheimer’s Disease. Neurology, 34(7): 939e944, 1984.
McKhann G, Hyman B, Jack C, Kawas C, Klunk W, Knopman D,et al. Proposed criteria for Alzheimer’s disease dementia: Pressrelease from the Alzheimer’s Association InternationalConference on Alzheimer’s Disease 2010.
Miller E. Short- and long-term memory in patients with preseniledementia (Alzheimer’s disease). Psychological Medicine, 3(2):221e224, 1973.
Minoshima S, Giordani B, Berent S, Frey KA, Foster NL, andKuhl DE. Metabolic reduction in the posterior cingulate cortexin very early Alzheimer’s disease. Annals of Neurology, 42(1):85e94, 1997.
Mintun MA. Utilizing advanced imaging and surrogate markersacross the spectrum of Alzheimer’s disease. CNS Spectrums,10(11): 13e16, 2005.
Morris JC and Price AL. Pathologic correlates of nondementedaging, mild cognitive impairment, and early-stageAlzheimer’s disease. Journal of Molecular Neuroscience, 17(2):101e118, 2001.
Morris RG. Dementia and the functioning of the articulatory loopsystem. Cognitive Neuropsychology, 1(2): 143e157, 1984.
Morris RG. Short term forgetting in senile dementia of theAlzheimer’s type. Cognitive Neuropsychology, 3(1): 77e97, 1986.
Morris RG and Baddeley AD. Primary and working memoryfunctioning in Alzheimer-type dementia. Journal of Clinical andExperimental Neuropsychology, 10(2): 279e296, 1988.
Muller NG and Knight RT. The functional neuroanatomy ofworking memory: Contributions of human brain lesionstudies. Neuroscience, 139(1): 51e58, 2006.
Neary D, Snowden JS, Gustafson L, Passant U, Stuss D, Black S,et al. Frontotemporal lobar degeneration: A consensus onclinical diagnostic criteria. Neurology, 51(6): 1546e1554, 1998.
Neary D, Snowden JS, Shields RA, Burjan AW, Northen B,MacDermott N, et al. Single photon emission tomographyusing 99mTc-HM-PAO in the investigation of dementia. Journalof Neurology, Neurosurgery and Psychiatry, 50(9):1101e1109, 1987.
Nedjam Z, Devouche E, and Dalla Barba G. Confabulation, butnot executive dysfunction discriminate AD fromfrontotemporal dementia. European Journal of Neurology,11(11): 728e733, 2004.
Owen AM, McMillan KM, Laird AR, and Bullmore E. N-backworking memory paradigm: A meta-analysis of normativefunctional neuroimaging studies. Human Brain Mapping, 25(1):46e59, 2005.
Pachana NA, Boone KB, Miller BL, Cummings JL, and Berman N.Comparison of neuropsychological functioning in Alzheimer’sdisease and frontotemporal dementia. Journal of theInternational Neuropsychological Society, 2(6): 505e510, 1996.
Parasuraman R, Greenwood PM, Haxby JV, and Grady CL.Visuospatial attention in dementia of the Alzheimer type.Brain, 115(3): 711e733, 1992.
Parra MA, Abrahams S, Fabi K, Logie R, Luzzi S, and Della Sala S.Short-term memory binding deficits in Alzheimer’s disease.Brain, 132(4): 1057e1066, 2009.
Perry RJ and Hodges JR. Attention and executive deficits inAlzheimer’s disease. A critical review. Brain, 122(3):383e404, 1999.
Perry RJ, Watson P, and Hodges JR. The nature and staging ofattention dysfunction in early (minimal and mild) Alzheimer’sdisease: Relationship to episodic and semantic memoryimpairment. Neuropsychologia, 38(3): 252e271, 2000.
Peters F, Collette F, Degueldre C, Sterpenich V, Majerus S, andSalmon E. The neural correlates of verbal short-term memoryin Alzheimer’s disease: An fMRI study. Brain, 132(7):1833e1846, 2009.
Petersen RC. Mild cognitive impairment as a diagnostic entity.Journal of Internal Medicine, 256(3): 183e194, 2004.
Peterson LR and Peterson MJ. Short-term retention of individualverbal items. Journal of Experimental Psychology, 58(3):193e198, 1959.
Postle BR, Ferrarelli F, Hamidi M, Feredoes E, Massimini M,Peterson M, et al. Repetitive transcranial magnetic stimulationdissociates working memory manipulation from retentionfunctions in the prefrontal, but not posterior parietal, cortex.Journal of Cognitive Neuroscience, 18(10): 1712e1722, 2006.
Price JL, Davis PB, Morris JC, and White DL. The distribution oftangles, plaques and related immunohistochemical markersin healthy aging and Alzheimer’s disease. Neurobiology ofAging, 12(4): 295e312, 1991.
Rabinovici GD, Furst AJ, Alkalay A, Racine CA, O’Neil JP, Janabi M,et al. Increased metabolic vulnerability in early-onsetAlzheimer’s disease is not related to amyloid burden. Brain,133(2): 512e528, 2010.
Rabinovici GD and Jagust WJ. Amyloid imaging in aging anddementia: Testing the amyloid hypothesis in vivo. BehavioralNeurology, 21(1): 117e128, 2009.
Rowe CC, Ng S, Ackermann U, Gong SJ, Pike K, Savage G, et al.Imaging beta-amyloid burden in aging and dementia.Neurology, 68(20): 1718e1725, 2007.
Rugg MD, Otten LJ, and Henson RN. The neural basis of episodicmemory: Evidence from functional neuroimaging. PhilosophicalTransactions of the Royal Society of London, Series B: BiologicalSciences, 357(1424): 1097e1110, 2002.
c o r t e x 4 8 ( 2 0 1 2 ) 4 2 9e4 4 6446
Saffran EM and Marin OS. Immediate memory for word lists andsentences in a patient with deficient auditory short-termmemory. Brain and Language, 2(4): 420e433, 1975.
Salmon DP, Heindel WC, and Lange KL. Differential decline inword generation from phonemic and semantic categoriesduring the course of Alzheimer’s disease: Implications for theintegrity of semantic memory. Journal of the InternationalNeuropsychological Society, 5(7): 692e703, 1999.
Salmon E, Sadzot B, Maquet P, Degueldre C, Lemaire C, Rigo P,et al. Differential diagnosis of Alzheimer’s disease with PET.Journal of Nuclear Medicine, 35(3): 391e398, 1994.
Shallice T and Warrington EK. Independent functioning of verbalmemory stores: A neuropsychological study. Quarterly Journalof Experimental Psychology, 22(2): 261e273, 1970.
Simons JS, Peers PV, Hwang DY, Ally BA, Fletcher PC, andBudson AE. Is the parietal lobe necessary for recollection inhumans? Neuropsychologia, 46(4): 1185e1191, 2008.
Snowden JS, Stopford CL, Julien CL, Thompson JC, Davidson Y,Gibbons L, et al. Cognitive phenotypes in Alzheimer’s diseaseand genetic risk. Cortex, 43(7): 835e845, 2007.
Stopford CL, Snowden JS, Thompson JC, and Neary D. Distinctmemory profiles in Alzheimer’s disease. Cortex, 43(7):846e857, 2007.
Stopford CL, Snowden JS, Thompson JC, and Neary D. Variabilityin cognitive presentation of Alzheimer’s disease. Cortex,44(2): 185e195, 2008.
Stuss DT and Benson DF. Neuropsychological studies of thefrontal lobes. Psychological Bulletin, 95(1): 3e28, 1984.
Swainson R, Hodges JR, Galton CJ, Semple J, Michael A,Dunn BD, et al. Early detection and differential diagnosis ofAlzheimer’s disease and depression with neuropsychologicaltasks. Dementia and Geriatric Cognitive Disorders, 12(4):265e280, 2001.
Talbot PR, Lloyd JJ, Snowden JS, Neary D, and Testa HJ. A clinicalrole for 99mTc-HMPAO SPECT in the investigation of
dementia? Journal of Neurology, Neurosurgery and Psychiatry,64(3): 306e313, 1998.
The Lund and Manchester Groups. Clinical and neuropathologicalcriteria for frontotemporal dementia. The Lund andManchester Groups. Journal of Neurology, Neurosurgery andPsychiatry, 57(4): 416e418, 1994.
Thompson JC, Stopford CL, Snowden JS, and Neary D.Qualitative neuropsychological performance characteristicsin frontotemporal dementia and Alzheimer’s disease.Journal of Neurology, Neurosurgery and Psychiatry, 76(7):920e927, 2005.
Vilberg KL and Rugg MD. Memory retrieval and the parietalcortex: A review of evidence from a dual-process perspective.Neuropsychologia, 46(7): 1787e1799, 2008.
Warrington EK and James M. Visual Object and Space PerceptionBattery. Bury St Edmunds: Thames Valley Test Company,1991.
Warrington EK, Logue V, and Pratt RT. The anatomicallocalisation of selective impairment of auditoryverbal short-term memory. Neuropsychologia, 9(4):377e387, 1971.
Warrington EK and Shallice T. The selective impairment ofauditory verbal short-term memory. Brain, 92(4):885e896, 1969.
Welsh K, Butters N, Hughes J, Mohs R, and Heyman A. Detectionof abnormal memory decline in mild cases of Alzheimer’sdisease using CERAD neuropsychological measures. Archivesof Neurology, 48(3): 278e281, 1991.
Wilson MD. The MRC psycholinguistic database: Machinereadable dictionary, Version 2. Behavioural Research Methods,Instruments and Computers, 20(1): 6e11, 1988.
Zhang D, Zhang X, Sun X, Li Z, Wang Z, He S, et al. Cross-modaltemporal order memory for auditory digits and visuallocations: An fMRI study. Human Brain Mapping, 22(4):280e289, 2004.