
Working-Capital Management - LMS-SPADA INDONESIA
30
Working-Capital Management CHAPTER 18 Chapter Outline 608 Objective 1. Describe the risk-return tradeoff involved in managing a firm’s working capital. Objective 3. Use the cash conversion cycle to measure the efficiency with which a firm manages its working capital. Objective 4. Evaluate the cost of financing as a key determinant of the management of a firm’s use of current liabilities. Objective 2. Explain the principle of self-liquidating debt as a tool for managing firm liquidity. Part 1 Introduction to Financial Management (Chapters 1, 2, 3, 4) Part 2 Valuation of Financial Assets (Chapters 5, 6, 7, 8, 9, 10) Part 3 Capital Budgeting (Chapters 11, 12, 13, 14) Part 4 Capital Structure and Dividend Policy (Chapters 15, 16) Part 5 Liquidity Management and Special Topics in Finance (Chapters 17, 18, 19, 20) 18.1 Working-Capital Management and the Risk-Return Tradeoff (pgs. 610–611) 18.2 Working-Capital Policy (pgs. 611–614) 18.3 Operating and Cash Conversion Cycles (pgs. 614–619) 18.4 Managing Current Liabilities (pgs. 619–623) 18.5 Managing the Firm’s Investment in Current Assets (pgs. 623–629) Objective 5. Understand the factors underlying a firm’s investment in cash and marketable securities, accounts receivable, and inventory.
-
Upload
khangminh22 -
Category
Documents
-
view
0 -
download
0
Transcript of Working-Capital Management - LMS-SPADA INDONESIA
Working-Capital ManagementCH
AP
TE
R 18
Chapter Outline
608
Objective 1. Describe the risk-return tradeoff involved in managing a firm’s working capital.
Objective 3. Use the cash conversion cycle to measure the efficiency with which a firm manages its working capital.
Objective 4. Evaluate the cost of financing as a key determinant of the management of a firm’s use of current liabilities.
Objective 2. Explain the principle of self-liquidating debt as a tool for managing firm liquidity.
Part 1 Introduction to Financial Management (Chapters 1, 2, 3, 4)
Part 2 Valuation of Financial Assets (Chapters 5, 6, 7, 8, 9, 10)
Part 3 Capital Budgeting (Chapters 11, 12, 13, 14)
Part 4 Capital Structure and Dividend Policy (Chapters 15, 16)
Part 5 Liquidity Management and Special Topics in Finance (Chapters 17, 18, 19, 20)
18.1 Working-Capital Management
and the Risk-Return Tradeoff
(pgs. 610–611)
18.2 Working-Capital Policy
(pgs. 611–614)
18.3 Operating and Cash
Conversion Cycles
(pgs. 614–619)
18.4 Managing Current Liabilities
(pgs. 619–623)
18.5 Managing the Firm’s
Investment in Current Assets
(pgs. 623–629)
Objective 5. Understand the factors underlying a firm’s investment in cash and marketable securities, accounts receivable, and inventory.
M18_TITM2189_13_GE_C18.indd 608 22/05/17 5:24 PM

609
In Chapter 17, we introduced financial forecasting and planning. Of particular relevance to this chapter was our discussion of the development of the firm’s long-term financial plan, which spans a period of three to five years. That planning process included estimates of the firm’s needs for current assets as well as predic-tions about current liabilities. In this chapter, we start by consider-ing the risk-return tradeoffs in the balance the firm strikes between
current assets and current liabilities. Our analysis of this tradeoff builds upon P Principle 2: There Is a Risk-Return Tradeoff. Next, we examine the principle of self-liquidating debt, which is a very useful tool for determining the optimal level of working capital. The objective we follow in examining the management of working capital is the same as it has been since Chapter 1, to find that balance that maximizes shareholder value.
Principle P2 Applied
Dell Raises the Bar for Working-Capital ManagementThe management at computer company Dell Inc. recognized early in the firm’s history that it could improve company per-formance by following a policy of minimizing its investment in net working capital (the difference between the firm’s investment in current assets and its current liabilities). At the time, Dell’s sales were dominated by retail customers who used credit cards to purchase computers. This meant that the firm’s investment in accounts receivable was minimal, so the firm focused its attention on reducing inventories and expanding its use of trade credit, which is a type of account payable that arises when a firm provides goods or services to a customer with an agreement to bill the customer later.
Dell used a two-pronged attack. First, to reduce inventories, the company convinced its suppliers to leave truckloads of the items that it needed at the back door of its plants. The trucks’ contents belonged to the suppliers until they were needed by Dell, at which time it moved the items from the trailers into its plant. At the same time, the company’s management took full advantage of the trade credit terms by paying for these items at the latest possible date. In combination, these actions didn’t just reduce the firm’s investment in working capital—they actually eliminated it! Without the drag of working capital on firm performance, the company’s profits soared, and its stock price rose dramatically.
It’s hard to overstate the importance of effectively managing the firm’s investment in working capital. Current assets make up about half of the total assets of a typical industrial or retail firm, so it is crucial that managers have a coherent strategy for managing their accounts receivable and payable as well as their cash balances. This was especially true during the recent economic downturn, when many firms found that having sufficient liquidity to weather the storm proved to be the difference between keeping their doors open and having to close them.
M18_TITM2189_13_GE_C18.indd 609 22/05/17 5:24 PM

610 PART 5 | Liquidity Management and Special Topics in Finance
18.1 Working-Capital Management and the Risk-Return Tradeoff
Working-capital management encompasses the day-to-day activities of managing the firm’s current assets and current liabilities. Because cash, accounts receivable, inventory, and accounts payable can change on a daily and even hourly basis, financial managers may spend more time on working-capital management than on any other part of their job. Working-capital management decisions include “How much inventory should we carry?” “To whom should credit be extended?” “Should the firm purchase items for its inventories on credit or pay cash?” and “If credit is used, when should payment be made?”
Measuring Firm LiquidityThe firm’s working-capital choices are critical determinants of its ability to pay its bills on time, which we defined in Chapter 4 as the firm’s liquidity. In Chapter 4, we also learned that the current ratio, which is equal to current assets divided by current liabilities, is a very popular measure of firm liquidity.
The rationale for using the current ratio as a measure of liquidity is as follows: The abil-ity of the firm to pay on time is roughly related to the value of its current assets, which are by definition those assets that will be converted to cash within one year or less. Similarly, the firm’s debts that must be repaid over the coming year are included in its current liabilities. Therefore, by comparing the firm’s current assets to its current liabilities, we get an indication of the firm’s liquidity.
The current ratio is closely linked to the firm’s net working capital (current assets minus current liabilities). If the current ratio is greater than 1, then net working capital is positive, and vice versa. Consequently, both measures of liquidity provide the same information. How-ever, the current ratio is more widely used because it allows for comparisons across firms of varying sizes. For example, consider the working capital of Firms A and B as follows:
Regardless of Your Major…
The management of working capital involves individuals from across the organization of a firm. For this reason, there are often conflicting points of view about how the firm should manage its working capital. For example, the firm’s accounts receivable balance arises from the firm’s credit sales and the payment terms that are offered to its customers. The sales force will push for lenient repayment terms as a method for enticing customers to buy the firm’s products and
services. However, offering more lenient payment terms will mean that the firm will need to make a larger investment in accounts receivable. In addition, inventories are held by the firm to support its production and sales operations. For example, a larger inventory of raw materials makes it easier to smooth out the firm’s production process because it allows the production managers to draw down available inventories of raw materials as they are needed for production. Consequently, the firm’s operating managers will find it to their advantage to hold large inventories of raw materials. Moreover, holding larger inventories of finished products makes it easier to sell these products because customers can be assured that they will be delivered on a timely basis. For this reason, the firm’s sales organization will push for larger finished-goods inventories. However, holding large inventories is costly and reduces the firm’s rate of return on invested capital.
These conflicting points of view within the firm make managing the firm’s working capital a difficult task, one that will clearly be easier if the firm’s marketing and production managers have a better understanding of the costs and benefits associated with investing in working capital.
Your Turn: See Study Question 18–2.
“Conflicting Objectives Lead to Problems in
Managing a Firm’s Working Capital”
M18_TITM2189_13_GE_C18.indd 610 22/05/17 5:24 PM

CHAPTER 18 | Working-Capital Management 611
Firm A Firm B
Current assets $50,000 $5,000
Current liabilities $25,000 $2,500
Net working capital $25,000 $2,500
Current ratio 2.0 2.0
The net working-capital figures for the two firms are very different because Firm A’s current assets and current liabilities are 10 times as large as those of Firm B. However, the current ratios are identical.
Managing Firm LiquidityTo manage a firm’s liquidity, managers must balance its investment in current assets in relation to its current liabilities. To accomplish this task, they can minimize the firm’s use of current assets by efficiently managing its inventories and accounts receivable, by seeking out the most favorable accounts payable terms, and by monitoring its use of short-term borrowing.
The current assets a firm has on hand and the current liabilities it faces can vary significantly across different firms. For example, retail giant Walmart (WMT) must carry a huge investment in inventory if it expects to be able to make sales, and it uses trade credit to finance these inventories. To illustrate, at the outset of 2016, Walmart had over $45 billion invested in inventory and had accounts payable of more than $38 billion.
A firm like Walmart can manage its liquidity by holding larger cash and marketable securities balances that can be drawn down in times of need. Alternatively, the firm can increase its liquidity by reducing its short-term borrowing and increasing its use of long-term debt or equity. Once again, the resulting increase in firm liquidity is not free because the cost of long-term debt is generally higher than that of short-term debt and the opportunity cost of equity funds is higher still.
Risk-Return TradeoffThe decisions a firm makes that affect its net working capital change the firm’s liquidity or ability to pay its bills on time. Thus, working-capital decisions involve a risk-return tradeoff. For example, the firm can enhance its profitability by reducing its cash and marketable securities balance because these assets typically earn very low rates of return. However, the increased profitability comes at a price. The firm is now exposed to a higher risk of not being able to pay its bills on time if an unexpected need for cash arises because it has a lower cash and marketable securities balance.
Concept Check | 18.11. How does investing more heavily in current assets, other things remaining the same, increase firm liquidity?
2. How does the use of short-term as opposed to long-term liabilities affect firm liquidity?
Before you move on to 18.2
18.2 Working-Capital PolicyManaging the firm’s net working capital involves deciding on a strategy for financing the firm’s current assets and current liabilities. Because each financing source comes with advantages and disadvantages, the financial manager must decide on the sources that are optimal for the firm.
The Principle of Self-Liquidating DebtA benchmark that is often used for setting working-capital policy is the principle of self-liquidating debt. This principle states that the maturity of the source of financing should be
M18_TITM2189_13_GE_C18.indd 611 22/05/17 5:24 PM

612 PART 5 | Liquidity Management and Special Topics in Finance
matched with the length of time the financing is needed.1 Following this policy, a seasonal expansion of inventories prior to the Christmas season should be financed with a short-term loan or current liability. The rationale underlying the principle is straightforward. Funds are needed for a limited period of time, and when that time has passed, the cash needed to repay the loan will be generated automatically by the sale of the extra inventory items. Obtaining the needed funds from a long-term source (longer than one year) means that the firm will still have the funds after the inventories they helped finance have been sold. In this case, the firm will have “excess” liquidity, which it might need to invest in low-yield marketable securities.
Alternatively, if the firm is purchasing new manufacturing equipment that will be used in its factories for many years, then longer-term financing will be better. In this instance, the manufacturing equipment might be financed with a long-term installment loan much like the loan you would use to finance a car or home purchase.
Permanent and Temporary Asset InvestmentsTo implement the principle of self-liquidating debt, or maturity matching, we will find it use-ful to think about the firm’s investments in assets as either temporary or permanent.
Temporary investments in assets, or simply temporary assets, are composed of current assets that will be liquidated and not replaced within the current year. These include cash and marketable securities, accounts receivable, and seasonal fluctuation in inventories.
Permanent investments in assets are composed of assets that the firm expects to hold for a period longer than one year. These include the firm’s minimum level of current assets, such as accounts receivable and inventories, as well as fixed assets.
Spontaneous, Temporary, and Permanent Sources of FinancingWe can categorize the sources of financing used by a firm into one of three subcategories: spontaneous, temporary, and permanent. In Chapter 17, we learned that spontaneous sources of financing arise naturally or spontaneously out of the day-to-day operations of the business and consist of trade credit and other forms of accounts payable. Trade credit exists when a firm provides goods or services to a customer with an agreement to bill the customer later. Trade credit, however, is only one form of accounts payable. Other examples include wages and salaries payable that arise when the firm pays employees once a month but accrues a liability for wages owed up until the date that payment is actually made. Similarly, interest and taxes are typically paid quarterly, but the firm accrues both interest and tax liabilities every day up until the date of the interest and tax payments, thereby creating balances for interest payable and taxes payable.
Temporary sources of financing typically consist of current liabilities the firm incurs on a discretionary basis. Unlike the spontaneous sources defined above, temporary sources of financing do not arise out of the firm’s day-to-day operations; rather, the firm’s management must make an overt decision to use one of the various sources of temporary financing. Exam-ples include unsecured bank loans, commercial paper (which is simply unsecured promissory notes that the firm sells in the money market, with maturities of 1 to 270 days), and short-term loans that are secured by the firm’s inventories or accounts receivable.
Permanent sources of financing include intermediate-term loans, long-term debt (such as installment loans and bonds), preferred stock, and common equity. These sources are considered permanent because the financing is available for a longer period of time than a current liability. However, like the temporary sources discussed above, permanent sources of financing are considered discretionary because they do not arise spontaneously out of the firm’s day-to-day operations and the use of each permanent source of funds requires an explicit decision by the firm’s management.
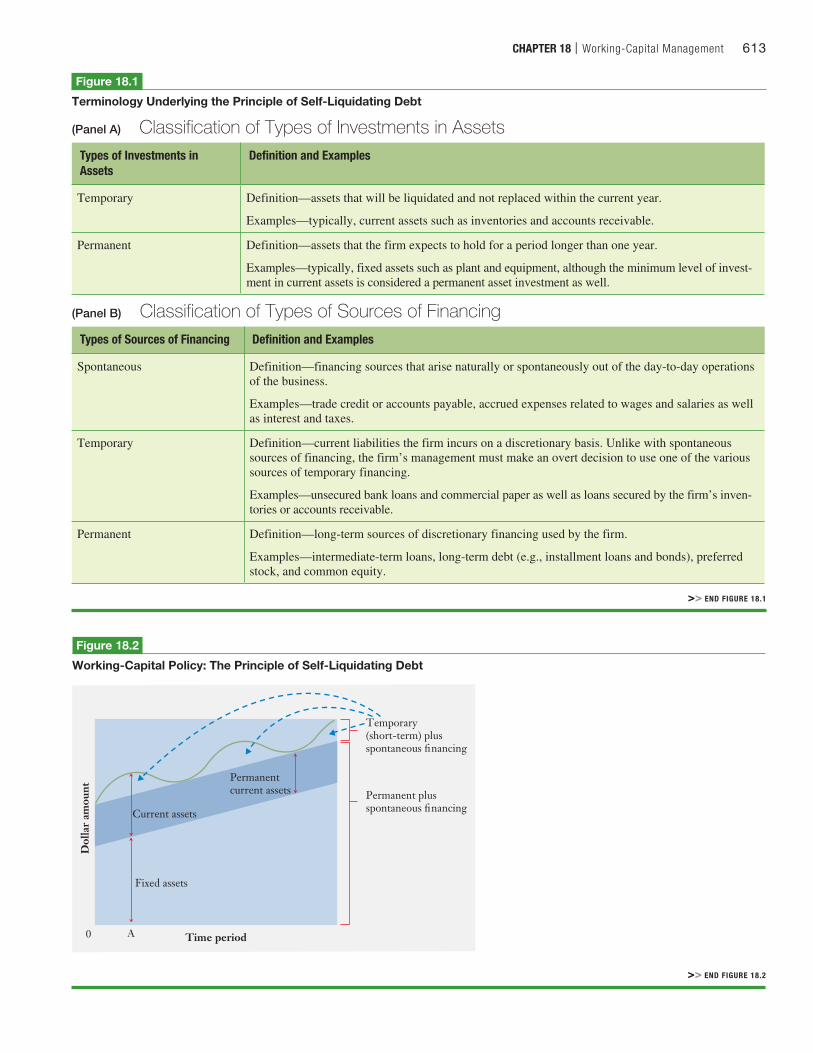
Figure 18.1 summarizes the terminology used in implementing the principle of self- liquidating debt to manage firm liquidity. We will refer to this terminology when discussing the working-capital policy illustrated in Figure 18.2.
1A value-maximizing approach to the management of the firm’s liquidity involves assessing the value of the benefits derived from increasing the firm’s investment in liquid assets and weighing those benefits against the added costs to the firm’s owners resulting from investing in low-yield current assets. Unfortunately, the benefits derived from increased liquidity relate to the expected costs of bankruptcy to the firm’s owners, and these costs are very difficult to measure. Thus, a valuation approach to liquidity management exists only in the theoretical realm.
M18_TITM2189_13_GE_C18.indd 612 22/05/17 5:24 PM
CHAPTER 18 | Working-Capital Management 613
Figure 18.1
Terminology Underlying the Principle of Self-Liquidating Debt
(Panel A) Classification of Types of Investments in AssetsTypes of Investments in Assets
Definition and Examples
Temporary Definition—assets that will be liquidated and not replaced within the current year.
Examples—typically, current assets such as inventories and accounts receivable.
Permanent Definition—assets that the firm expects to hold for a period longer than one year.
Examples—typically, fixed assets such as plant and equipment, although the minimum level of invest-ment in current assets is considered a permanent asset investment as well.
(Panel B) Classification of Types of Sources of FinancingTypes of Sources of Financing Definition and Examples
Spontaneous Definition—financing sources that arise naturally or spontaneously out of the day-to-day operations of the business.
Examples—trade credit or accounts payable, accrued expenses related to wages and salaries as well as interest and taxes.
Temporary Definition—current liabilities the firm incurs on a discretionary basis. Unlike with spontaneous sources of financing, the firm’s management must make an overt decision to use one of the various sources of temporary financing.
Examples—unsecured bank loans and commercial paper as well as loans secured by the firm’s inven-tories or accounts receivable.
Permanent Definition—long-term sources of discretionary financing used by the firm.
Examples—intermediate-term loans, long-term debt (e.g., installment loans and bonds), preferred stock, and common equity.
>> END FIGURE 18.1
>> END FIGURE 18.2
Fixed assets
A0 Time period
Current assets
Dol
lar
amou
nt
Permanentcurrent assets
Temporary (short-term) plusspontaneous financing
Permanent plus spontaneous financing
Figure 18.2
Working-Capital Policy: The Principle of Self-Liquidating Debt
M18_TITM2189_13_GE_C18.indd 613 22/05/17 5:24 PM

614 PART 5 | Liquidity Management and Special Topics in Finance
A Graphic Illustration of the Principle of Self-Liquidating DebtFigure 18.2 illustrates the use of the principle of self-liquidating debt to guide a firm’s financing decisions. To interpret the figure, select a point in time at which to examine the total dollar amount the firm has invested in assets (current plus fixed). For example, at point zero (0) in the figure, the firm’s fixed and current assets equal the sum of its permanent and spontaneous sources of financing. That is, there is no need for the firm to raise money us-ing temporary financing sources (the financing sources are noted on the right-hand side of the graph). As time progresses, we see that the firm’s total assets (as depicted by the solid green line cycling over the top of the graph) rise and fall with temporary expansions in the firm’s need for assets; for example, point A might depict a seasonal expansion in the firm’s inventories and accounts receivable. During these peak times, the firm uses discretionary temporary sources of financing (short-term bank loans, for example) to finance the tempo-rary expansion in asset needs.
The key observation we make from Figure 18.2 is that the firm’s temporary or short-term debt rises and falls with the rise and fall in the firm’s temporary investments in current as-sets. Thus, the principle of self-liquidating debt provides the firm’s financial manager with a guide to determining whether the firm should use a current liability or a longer-term source of financing to fund assets.
Concept Check | 18.21. What is the principle of self-liquidating debt, and how can it be used to help the firm manage its liquidity?
2. What are some examples of permanent and temporary investments in current assets?
3. What makes trade credit a source of spontaneous financing?
Before you move on to 18.3
18.3 Operating and Cash Conversion CyclesThe firm’s operating cycle and cash conversion cycle are two popular measures used to determine how effectively a firm has managed its working capital. The shorter these two cycles are (usually measured in days), the more efficient the firm’s working-capital man-agement is.
Measuring Working-Capital EfficiencyThe operating cycle measures the time period that elapses from the date that an inventory item is purchased until the firm collects the cash from its sale (if the firm sells on credit, this date is when the account receivable is collected). As can be seen in Figure 18.3, the operating cycle is the sum of the average number of days that an item is held in inventory before being sold, called the inventory conversion period, and the average number of days that it takes to collect an account receivable, which we defined in Chapter 4 as the average collection period.
Operating Cycle = Inventory Conversion Period + Average Collection Period (18–1)
In the example found in Figure 18.3, the operating cycle is 176 days and consists of an inventory conversion period of 91 days plus an average collection period of 85 days.
Note, however, that when the firm is able to purchase items of inventory on credit, it does not have cash tied up for the full length of its operating cycle. In the example found in Figure 18.3, the firm incurs accounts payable as it purchases items of inventory on credit
M18_TITM2189_13_GE_C18.indd 614 22/05/17 5:24 PM

CHAPTER 18 | Working-Capital Management 615
terms that allow it to pay after 61 days. The formula used to calculate the accounts payable deferral period is found in Equation (18–2):
Accounts PayableDeferral Period
=365
a Cost ofGoods Sold
, AccountsPayable
b (18–2)
Inventorypurchased
Inventorysold
Inventory conversionperiod (91 days)
Average collectionperiod (85 days)
Accounts payabledeferral period
(61 days)
Cash conversioncycle (115 days)
Receipt of cash fromaccounts receivable
Cash paid forinventory
Operating cycle (176 days)
Figure 18.3
The Cash Conversion CycleA firm’s operations typically follow a sequence of milestones: the purchase of items for inventory, the sale of items from inventory for credit, and the collection of accounts receivable. The period of time required for this entire process is called the operating cycle. However, for firms that are able to purchase items for their inventory on credit using accounts payable, the cash conversion cycle is shorter than the operating cycle by the number of days that the firm has to pay its accounts payable.
Formulas:
Operating Cycle = Inventory Conversion Period + Average Collection Period (18–1)
Accounts PayableDeferral Period
=365
a Cost ofGoods Sold
, AccountsPayable
b (18–2)
Cash Conversion Cycle = Operating Cycle - Accounts Payable Deferral Period (18–3)
InventoryConversion Period
=365
InventoryTurnover Ratio
(18–4)
InventoryTurnover Ratio
=
Cost ofGoods Sold
Inventory (18–5)
Average CollectionPeriod
=Accounts Receivable
Daily CreditSales
=Accounts Receivable
aAnnual CreditSales
, 365b (18–6)
>> END FIGURE 18.3
M18_TITM2189_13_GE_C18.indd 615 22/05/17 5:24 PM

616 PART 5 | Liquidity Management and Special Topics in Finance
Note that the accounts payable deferral period simply measures how many days on average the firm has to pay its suppliers who have provided the firm with the trade credit that is the source of accounts payable. Therefore, the cash conversion cycle is shorter than the operating cycle, as the firm does not have to pay for the items in its inventory for a period equal to the length of the accounts payable deferral period. The cash conversion cycle is defined in Equation (18–3):
Cash Conversion Cycle = Operating Cycle - Accounts Payable Deferral Period (18–3)
Managing the firm’s working capital impacts its cash conversion cycle in powerful ways. For example, consider the situation faced by computer firm Dell in 1989. Dell was a fledgling start-up whose cash conversion cycle was 121.88 days. By 2002, it had reduced this number to –37.59 days. How did the company reduce its cash conversion cycle below zero? There are two parts to the answer to this question. The first lies in the fact that Dell reduced the inventory conversion period dramatically, which, in turn, reduced the operating cycle. Second, Dell was able to stretch out its accounts payables longer than the operating cycle. In other words, the company was able to get credit terms that extended 37.59 days longer than the sum of the days it held inventory and the days it needed to collect its accounts receivable.
Dell’s strategy entailed ordering the needed parts for its inventories and building a computer only after an order was received. Moreover, parts were financed using trade credit. This strategy resulted in virtually no inventory as well as an accounts payable deferral period so long that, as discussed above, the cash conversion cycle was actually negative. As Dell’s sales grew, it actually generated cash flow from the growth in its accounts payable!
Today, Apple (APPL) employs a similar strategy and, as shown in Table 18.1, now has a cash conversion cycle of –57.3 days. As you can see from Table 18.1, the cash cycle can vary dramatically from one firm to another. While Apple holds very little inventory and makes many of its products on demand, other firms like Target (TGT), Wal-Mart (WMT), and The Gap (GAP) hold a good deal of inventory and as a result have longer cash conversion cycles. Looking at Boeing, you’ll notice an extremely long inventory conversion period; that’s because building an airplane generally takes at least three months and Boeing’s supply chain is complex, so it tries not to run out of raw materials during the production process.
Calculating the Operating and Cash Conversion CyclesThe operating and cash conversion cycle numbers found in Figure 18.3 were calculated using the following example. The example firm has $15 million in annual credit sales and $12 million in cost of goods sold. In addition, the firm maintains an inventory balance of $3 million, has $3.5 million in accounts receivable, and has $2 million in accounts payable outstanding.
To calculate the operating cycle, we need only the inventory conversion period and the average accounts receivable collection period. The inventory conversion period can be
Table 18.1 Cash Conversion Cycles
Company
Inventory Conversion
Period+
Average Collection
Period−
Accounts Payable
Deferral Period=
Cash Conversion
Cycle
Apple (APPL) 6.5 36.2 100.0 –57.3Target (TGT) 63.3 5.5 55.2 13.6Disney (DIS) 30.3 57.9 70.8 17.4Wal-Mart (WMT) 44.7 4.3 31.2 17.8PepsiCo (PEP) 46.2 41.2 65.8 21.6Gap (GAP) 80.2 6.2 44.7 41.7IBM (IBM) 18.6 122.0 60.6 80.0Boeing (BA) 225.3 32.7 50.1 207.9
Sources: Author’s calculations based on data from www.wsj.com, finance.yahoo.com, valueline.com, and www.fidelity.com, February 11, 2016.
M18_TITM2189_13_GE_C18.indd 616 22/05/17 5:24 PM

CHAPTER 18 | Working-Capital Management 617
calculated with a quick manipulation of the inventory turnover ratio (which we first encoun-tered in Chapter 4):
Inventory
Turnover Ratio=
Cost ofGoods SoldInventory
=$12,000,000$3,000,000
= 4.0 (18–5)
This tells us that we run through our average inventory 4.0 times a year, which translates into an inventory conversion period of 91 days:
Inventory
Conversion Period=
365Inventory
Turnover Ratio =
3654.0
= 91 days (18–4)
The inventory conversion period is simply the number of days it takes for the firm to convert its inventory to credit sales. For example, if the firm turns its inventory over 12 times a year, then it takes approximately 30 days to convert inventory to credit sales.
The second half of the operating cycle is the average number of days it takes to convert accounts receivable to cash, or the average collection period. If credit sales are $15 million per year and average accounts receivable are $3.5 million, then
Average Collection
Period=
Accounts ReceivableDaily Credit Sales
=$3,500,000
$15,000,000>365= 85 days (18–6)
We calculate the operating cycle, using Equation (18–1), as the sum of the inventory conver-sion period (91 days) and the average collection period (85 days), or 176 days.
We can calculate the cash conversion cycle using Equation (18–3), but first we need to calculate the accounts payable deferral period. The accounts payable balance is $2 million, so we can calculate the accounts payable deferral period using Equation (18–2) as follows:
Accounts PayableDeferral Period
=365
a Cost ofGoods Sold
, AccountsPayable
b (18–2)
=365
$12,000,000 , $2,000,000= 61 days
Substituting into Equation (18–3), we get a cash conversion period of 115 days, as follows:
Cash Conversion Cycle = Operating Cycle - Accounts Payable Deferral Period (18–3)
= 176 days - 61days = 115 days
Analyzing the Cash Conversion CycleHarrison Electronics is evaluating its cash conversion cycle and has estimated each of its components as follows:
Days of sales outstanding (DSO) = 38 daysDays of sales in inventory (DSI) = 41 daysDays of payables outstanding (DPO) = 30 daysWhat is the firm’s cash conversion cycle?
STEP 1: Picture the problem
We can visualize the operating and cash conversion cycles using the diagram found in Figure 18.3 as follows:
Checkpoint 18.1
M18_TITM2189_13_GE_C18.indd 617 22/05/17 5:24 PM

618 PART 5 | Liquidity Management and Special Topics in Finance
Inventorypurchased
Inventorysold
Inventory conversionperiod (41 days)
Average collectionperiod (38 days)
Accounts payabledeferral period
(30 days)
Cash conversioncycle (49 days)
Receipt of cash fromaccounts receivable
Cash paid forinventory
Operating cycle (79 days)
STEP 2: Decide on a solution strategy
The firm’s cash conversion cycle is defined as follows:
Cash Conversion Cycle = Operating Cycle - Accounts Payable Deferral Period (18–3)
or
CashConversionCycle (CCC)
= °Days of
Sales Outstanding(DSO)
¢ + °Days of
Sales in Inventory(DSI)
¢ - °Days of Payables
Outstanding(DPO)
¢
STEP 3: Solve
We substitute the following:Days of sales outstanding (DSO) = 38 daysDays of sales in inventory (DSI) = 41 daysDays of payables outstanding (DPO) = 30 days
into
Cash
ConversionCycle (CCC)
= °Days of
Sales Outstanding(DSO)
¢ + °Days of
Sales in Inventory(DSI)
¢ - °Days of Payables
Outstanding(DPO)
¢
CCC = DSO + DSI - DPO
49 days = 38 days + 41 days - 30 days
STEP 4: Analyze
We calculate the cash conversion cycle to be 49 days. Harrison can reduce its cash conversion cycle by reducing its DSO (for example, by offering a cash discount for early payment or simply reducing the firm’s credit terms) and its DSI (for example, by reducing the amount of inventory it carries) or by seeking better credit terms that increase its DPO.
STEP 5: Check yourself
If Harrison Electronics’ DSO = 25 days, its DSI = 38 days, and its DPO = 29 days, what is the firm’s cash con-version cycle?
ANSWER: 34 days.
Your Turn: For more practice, do related Study Problems 18–4 and 18–5 at the end of this chapter. >> END Checkpoint 18.1
M18_TITM2189_13_GE_C18.indd 618 22/05/17 5:24 PM
CHAPTER 18 | Working-Capital Management 619
18.4 Managing Current LiabilitiesThe firm’s current liabilities include all of its debt obligations that must be repaid in one year or less. These liabilities include unsecured and secured forms of credit (see Table 18.2). Un-secured current liabilities include trade credit, unsecured bank loans, and commercial paper. These forms of credit are unsecured in that they are backed only by the lender’s faith in the ability of the borrower to repay the funds when due.
Secured current liabilities include loans that involve the pledge of specific assets as collateral in the event the borrower defaults on the payment of principal or interest. Both ac-counts receivable and inventories can serve as collateral for short-term loans that are made by a variety of financial institutions, including commercial banks and finance companies. Factor-ing involves the sale of accounts receivable at a discount to a collections firm called a factor.
Calculating the Cost of Short-Term FinancingWhen deciding among alternative sources of short-term financing, it is critical that the firm’s financial analyst compute the costs incurred when using each source. The procedure for esti-mating the cost of short-term credit relies on the basic interest equation:
Interest = Principal * Rate * Time (18–7)where interest is the dollar amount of interest owed based on the principal amount borrowed, rate is the annual rate charged on the loan, and time is the fraction of the year the debt is outstanding. For example, a six-month loan for $1,000 that carries an 8 percent annual rate of interest requires an interest payment of $40:
Interest = $1,000 * .08 * 12 = $40
We use this basic relationship to calculate the cost of short-term financing, or the annual per-centage rate (APR), as follows:
Annual PercentageRate (APR)
=Interest
Principal * Timeor
Annual Percentage
Rate (APR)=
InterestPrincipal
* 1
Time (18–8)
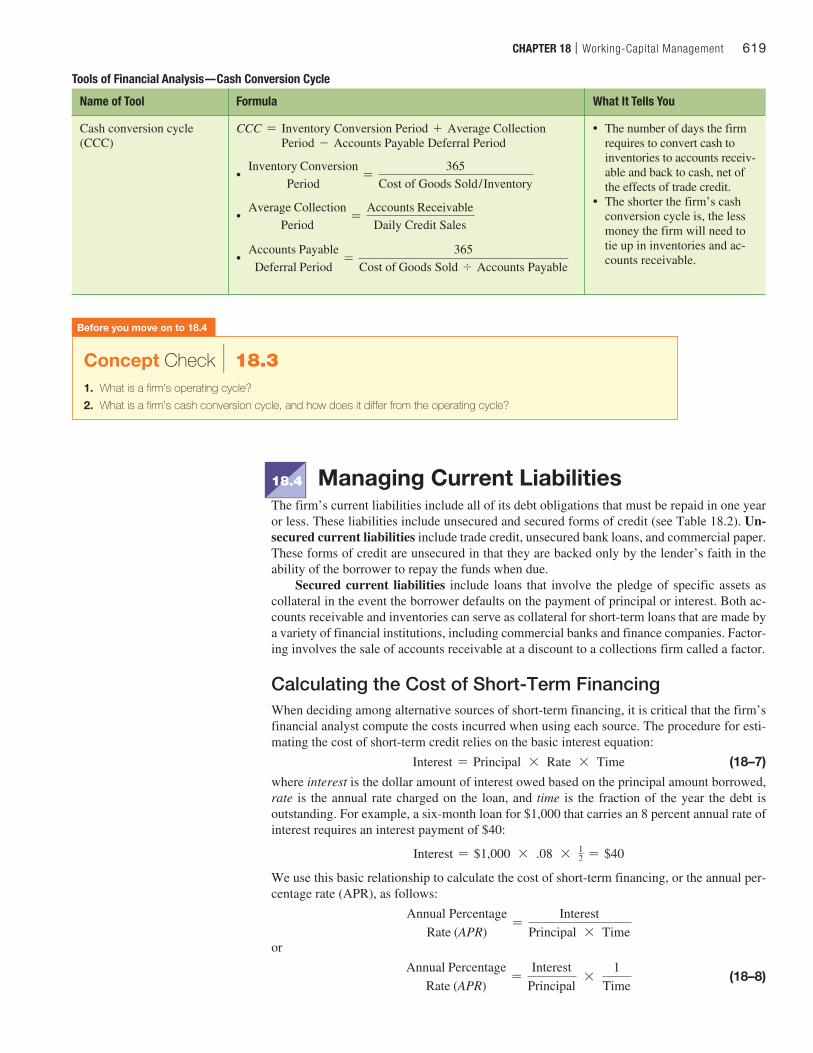
Tools of Financial Analysis—Cash Conversion Cycle
Name of Tool Formula What It Tells You
Cash conversion cycle (CCC)
CCC = Inventory Conversion Period + Average Collection Period - Accounts Payable Deferral Period
• Inventory Conversion
Period=
365Cost of Goods Sold / Inventory
• Average Collection
Period=
Accounts ReceivableDaily Credit Sales
• Accounts Payable
Deferral Period=
365Cost of Goods Sold , Accounts Payable
• The number of days the firm requires to convert cash to inventories to accounts receiv-able and back to cash, net of the effects of trade credit.
• The shorter the firm’s cash conversion cycle is, the less money the firm will need to tie up in inventories and ac-counts receivable.
Concept Check | 18.31. What is a firm’s operating cycle?
2. What is a firm’s cash conversion cycle, and how does it differ from the operating cycle?
Before you move on to 18.4
M18_TITM2189_13_GE_C18.indd 619 22/05/17 5:24 PM

620 PART 5 | Liquidity Management and Special Topics in Finance
Table 18.2 Sources of Short-Term Credit
(Panel A) Unsecured Sources of Credit
Trade CreditAccounts payable arise out of the normal course of business when the firm purchases from sup-pliers who allow the firm to make payment after the delivery of the merchandise or services.
Line of CreditA line of credit is generally an informal agreement or understanding between the borrower and the bank about the maximum amount of credit that the bank will provide the borrower at any one time. Under this type of agreement, there is no legal commitment on the part of the bank to provide the stated credit. In a revolving credit agreement, which is a variant of this form of financing, a legal obligation is involved. The line-of-credit agreement generally covers a period of one year corresponding to the borrower’s fiscal year.
Bank Transaction LoansBank transaction loans are a form of unsecured short-term bank credit made for a specific purpose. This type of loan is commonly associated with bank credit and is obtained by signing a promissory note.
Commercial PaperCommercial paper is a short-term debt obligation that is issued by the most creditworthy firms and is bought and sold in the money market. One of the advantages of commercial paper is that it generally carries a lower rate than do bank loans and comparable sources of short-term financing.
(Panel B) Secured Sources of Credit
Pledging Accounts Receivable (or Inventories)Under the pledging accounts receivable (inventories) arrangement, the borrower simply pledges accounts receivable (inventories) as collateral for a loan obtained from either a commercial bank or a finance company. The amount of the loan is stated as a percentage of the face value of the receivables (inventories) pledged. If the firm provides the lender with a general line on its receivables (inventories), then all of the borrower’s accounts (inventories) are pledged as security for the loan.
(Panel C) Raising Cash by Selling Accounts Receivables
Factoring Accounts ReceivableFactoring accounts receivable involves the outright sale of a firm’s accounts to a financial insti-tution called a factor. A factor is a firm that acquires the receivables of other firms. The factor-ing institution may be a commercial finance company that engages solely in the factoring of receivables (known as an old-line factor), or it may be a commercial bank. The factor, in turn, bears the risk of collection and, for a fee, services the accounts. The fee is stated as a percent-age of the face value of all receivables factored (usually 1 to 3 percent).
For example, the SKC Corporation plans to borrow $1,000 for a 90-day period. At maturity, the firm will repay the $1,000 principal amount plus $30 interest. Thus, the rate of interest for the loan can be estimated as follows:
APR =$30
$1,000 *
190>365
= .03 * 36590
= .1217, or 12.17%
Therefore, the annual cost of funds provided by the loan is 12.17 percent.
Evaluating the Cost of Trade CreditTrade credit provided by a firm’s suppliers creates accounts payable. Evaluating the cost of this trade credit requires that we understand the terms under which trade credit is typically given.
M18_TITM2189_13_GE_C18.indd 620 22/05/17 5:24 PM
CHAPTER 18 | Working-Capital Management 621
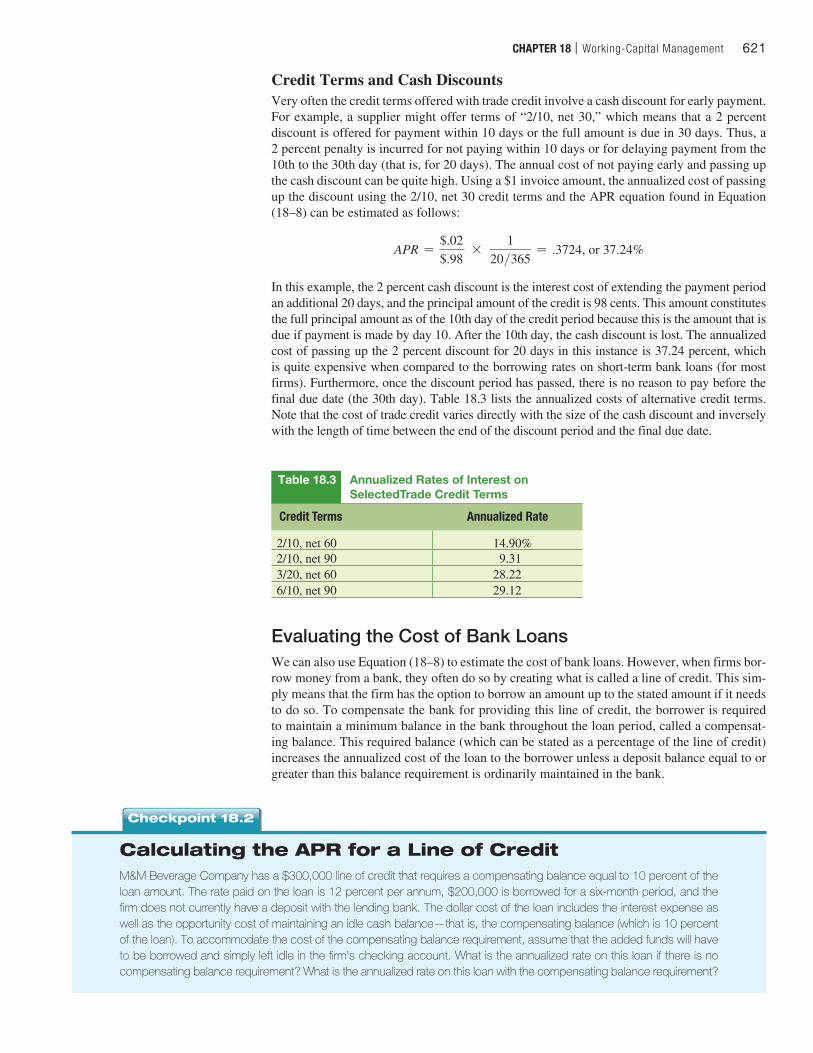
Credit Terms and Cash DiscountsVery often the credit terms offered with trade credit involve a cash discount for early payment. For example, a supplier might offer terms of “2/10, net 30,” which means that a 2 percent discount is offered for payment within 10 days or the full amount is due in 30 days. Thus, a 2 percent penalty is incurred for not paying within 10 days or for delaying payment from the 10th to the 30th day (that is, for 20 days). The annual cost of not paying early and passing up the cash discount can be quite high. Using a $1 invoice amount, the annualized cost of passing up the discount using the 2/10, net 30 credit terms and the APR equation found in Equation (18–8) can be estimated as follows:
APR =$.02$.98
* 1
20>365= .3724, or 37.24%
In this example, the 2 percent cash discount is the interest cost of extending the payment period an additional 20 days, and the principal amount of the credit is 98 cents. This amount constitutes the full principal amount as of the 10th day of the credit period because this is the amount that is due if payment is made by day 10. After the 10th day, the cash discount is lost. The annualized cost of passing up the 2 percent discount for 20 days in this instance is 37.24 percent, which is quite expensive when compared to the borrowing rates on short-term bank loans (for most firms). Furthermore, once the discount period has passed, there is no reason to pay before the final due date (the 30th day). Table 18.3 lists the annualized costs of alternative credit terms. Note that the cost of trade credit varies directly with the size of the cash discount and inversely with the length of time between the end of the discount period and the final due date.
Evaluating the Cost of Bank LoansWe can also use Equation (18–8) to estimate the cost of bank loans. However, when firms bor-row money from a bank, they often do so by creating what is called a line of credit. This sim-ply means that the firm has the option to borrow an amount up to the stated amount if it needs to do so. To compensate the bank for providing this line of credit, the borrower is required to maintain a minimum balance in the bank throughout the loan period, called a compensat-ing balance. This required balance (which can be stated as a percentage of the line of credit) increases the annualized cost of the loan to the borrower unless a deposit balance equal to or greater than this balance requirement is ordinarily maintained in the bank.
Table 18.3 Annualized Rates of Interest on SelectedTrade Credit Terms
Credit Terms Annualized Rate
2/10, net 60 14.90%2/10, net 90 9.313/20, net 60 28.226/10, net 90 29.12
Calculating the APR for a Line of CreditM&M Beverage Company has a $300,000 line of credit that requires a compensating balance equal to 10 percent of the loan amount. The rate paid on the loan is 12 percent per annum, $200,000 is borrowed for a six-month period, and the firm does not currently have a deposit with the lending bank. The dollar cost of the loan includes the interest expense as well as the opportunity cost of maintaining an idle cash balance—that is, the compensating balance (which is 10 percent of the loan). To accommodate the cost of the compensating balance requirement, assume that the added funds will have to be borrowed and simply left idle in the firm’s checking account. What is the annualized rate on this loan if there is no compensating balance requirement? What is the annualized rate on this loan with the compensating balance requirement?
Checkpoint 18.2
M18_TITM2189_13_GE_C18.indd 621 22/05/17 5:24 PM

622 PART 5 | Liquidity Management and Special Topics in Finance
STEP 1: Picture the problem
In the case where there is a required compensating balance, the amount actually borrowed (B) will be larger than the $200,000 needed. In fact, the needed $200,000 will constitute 90 percent of the total borrowed funds be-cause of the 10 percent compensating balance requirement. Hence, .90(B) = $200,000, and B = $222,222 ($200,000/.90), of which $22,222 will have to remain on deposit with the lender and will not be available for use by the firm. The firm will pay interest on a $222,222 loan—that is, $13,333.32 = $222,222 * .12 * 1/2—but will get the use of only $200,000.2 Thus, when there is a required compensating balance, we can visualize the problem as receiving $200,000 but paying interest as if $222,222 had been borrowed.
STEP 2: Decide on a solution strategy
To solve for the APR, use Equation (18–8):
APR =InterestPrincipal
*1
Time
STEP 3: Solve
Without the required compensating balance, M&M will have to borrow only $200,000 to have the use of $200,000; therefore, the annualized cost of credit (assuming a 365-day year) is 12 percent.
APR =$12,000$200,000
*1
1>2 = .12, or 12%
The interest expense on the $200,000 principal amount of the loan for half a year is $12,000 = .12 *$200,000 * 1/2. However, in the case where the M&M Beverage Company is required to maintain a com-pensating balance, it will need to borrow $222,222, and the interest becomes $13,333.32 at the end of the six-month loan period. In this case, the cost of credit rises to 13.33 percent because the firm owes $13,333.32 in interest but gets the use of only $200,000:
APR =$13,333.22$200,000
*1
1>2 = .1333, or 13.33%
Frequently, bank loans will be made on a “discounted interest” basis. That is, the loan interest will be deducted from the loan amount before the funds are transferred to the borrower. Extending the M&M Beverage Company example to consider discounted interest involves reducing the loan proceeds ($200,000) in the previous example by the amount of interest for the full six months ($13,333.32). The annualized rate of interest on the loan is now
APR =$13,333.22
$200,000 - $13,333.32*
11>2 = .1429, or 14.29%
STEP 4: Analyze
Note that the presence of a compensating balance requirement increases the cost of credit to M&M from 12 per-cent to 13.33 percent. Adding a requirement that interest be deducted from the loan proceeds (discounted inter-est) increases the cost of credit from 13.33 percent to 14.29 percent. This results from the fact that the firm pays interest on the same amount of funds as before ($222,222); however, this time it gets the use of $13,333.32 less: $200,000 - $13,333.32 = $186,666.68. If M&M needs the use of a full $200,000, then it will have to borrow more than $222,222 so that it can cover both the compensating balance requirement and the discounted interest.
STEP 5: Check yourself
Assume that your firm has a $1,000,000 line of credit that requires a compensating balance equal to 20 percent of the loan amount. The rate paid on the loan is 12 percent per annum, $500,000 is borrowed for a six-month period, and the firm does not currently have a deposit with the lending bank. To accommodate the cost of the compensat-ing balance requirement, assume that the added funds will have to be borrowed and simply left idle in the firm’s checking account. What would the annualized rate on this loan be with the compensating balance requirement?
ANSWER: 15 percent.
Your Turn: For more practice, do related Study Problems 18–6 through 18–13 at the end of this chapter. >> END Checkpoint 18.2
2We can also assume a total loan of $200,000, with 10 percent, or $20,000, held on deposit, and only 90 percent, or $180,000, available for use by the firm; interest is now calculated on the $200,000 loan amount—that is, $12,000 =$200,000 * .12 * 1>2.
M18_TITM2189_13_GE_C18.indd 622 22/05/17 5:24 PM

CHAPTER 18 | Working-Capital Management 623
18.5 Managing the Firm’s Investment in Current Assets
At any point in time, the primary types of current assets that most firms hold are cash and marketable securities, accounts receivable, and inventories. We will first look at cash and marketable securities and then move on to accounts receivable, followed by inventories.
Managing Cash and Marketable SecuritiesFirms hold cash in their bank accounts and invest in highly liquid investments known as marketable securities. When a firm runs short of the cash it needs to pay its bills on a timely basis, it can easily sell a portion of its marketable securities portfolio to replenish its bank balance. The obvious cost of holding too little cash and marketable securities is the potential for defaulting on one or more of the firm’s financial obligations, so holding sufficient cash and marketable securities is essential. How-ever, holding excessive amounts of these assets is costly because they earn very low rates of return.
Costs of Managing Cash and Marketable SecuritiesThe dilemma faced by the financial manager in managing the firm’s cash and marketable se-curities is a clear application of P Principle 2: There Is a Risk-Return Tradeoff. To accept the risk of not having sufficient cash on hand, the firm must be compensated with a return on the cash that is invested. Moreover, the greater the risk of the investment in which the cash is placed, the greater the return the firm demands.
What we have established is that firms need cash to pay their bills, and not having suf-ficient cash when needed can be very costly for them. Firms invest the bulk of their cash in a portfolio of relatively safe marketable securities that they can quickly and easily convert to cash in the event they need to replenish their bank accounts. Consequently, there are two fundamental problems of cash management:
1. Maintaining a sufficient cash balance to meet the firm’s cash disbursal requirements on a timely basis.
2. Managing the composition of the firm’s marketable securities portfolio.
Problem 1: Maintaining a Sufficient Cash BalanceMaintaining an adequate amount of cash to meet a firm’s needs requires an accurate forecast of its cash receipts and disbursements. The firm’s cash budget (discussed in Chapter 17) is the principal tool used to accomplish this objective.
Once projections of cash requirements have been made, the firm may want to look into various ways in which it might reduce its need for cash. One method for doing this is to speed up its cash collections and slow down its cash disbursements. Let’s take a look at this process in more detail.
Tools of Financial Analysis—Annual Percentage Rate
Name of Tool Formula What It Tells You
Annual percentage rate (APR) APR =
InterestPrincipal * Time
• The annual rate of interest for a source of short-term credit.
• The APR formula does not consider the effects of compound interest.
Concept Check | 18.41. Give some examples of unsecured and secured forms of current liabilities.
2. What does a factor do?
3. What is a bank line of credit?
4. What is the APR equation, and how is it used?
Before you move on to 18.5
M18_TITM2189_13_GE_C18.indd 623 22/05/17 5:24 PM
624 PART 5 | Liquidity Management and Special Topics in Finance
When a firm pays a bill by writing a check, it takes time for the check to be received by the recipient, for the recipient to process and deposit the check, and for the check to be cleared through the banking system. As a result, the cash balance on the firm’s ledger differs from the available balance shown in its bank account. This difference is called float. It should be obvi-ous that the payer and the payee have opposite motives when it comes to managing the float involved in the payment process. The paying firm would like to extend the float and retain use of the payment funds for as long as possible, whereas the payee firm would like to speed up or shorten the float as much as possible so as to gain use of the funds sooner.
Although float management is an important treasury management function, its significance has been dramatically reduced with the advent of electronic funds transfers and changes in check-clearing practices within the banking system. In particular, the growing practice of di-rect, electronic information exchange between businesses, known as electronic data interchange (EDI), effectively eliminates float. Moreover, the 2003 Check Clearing Act allows banks to transmit electronic copies of checks for collection rather than having to deliver the actual check.
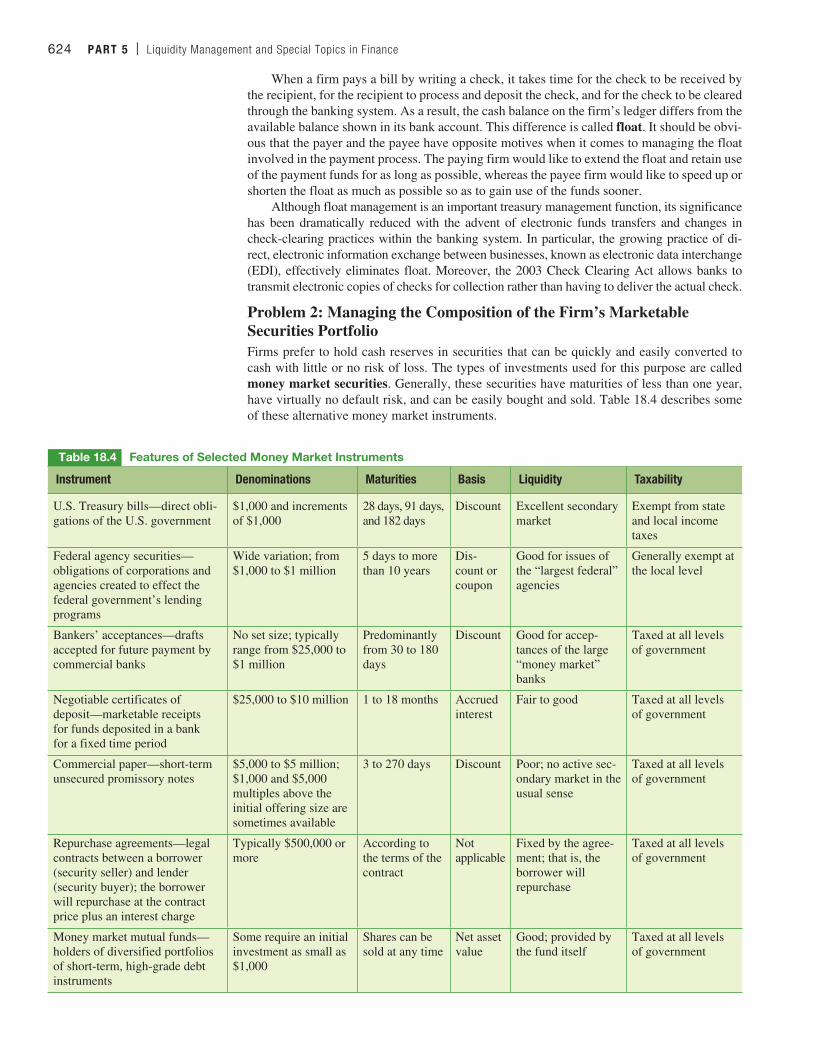
Problem 2: Managing the Composition of the Firm’s Marketable Securities PortfolioFirms prefer to hold cash reserves in securities that can be quickly and easily converted to cash with little or no risk of loss. The types of investments used for this purpose are called money market securities. Generally, these securities have maturities of less than one year, have virtually no default risk, and can be easily bought and sold. Table 18.4 describes some of these alternative money market instruments.
Table 18.4 Features of Selected Money Market Instruments
Instrument Denominations Maturities Basis Liquidity Taxability
U.S. Treasury bills—direct obli-gations of the U.S. government
$1,000 and increments of $1,000
28 days, 91 days, and 182 days
Discount Excellent secondary market
Exempt from state and local income taxes
Federal agency securities— obligations of corporations and agencies created to effect the federal government’s lending programs
Wide variation; from $1,000 to $1 million
5 days to more than 10 years
Dis-count or coupon
Good for issues of the “largest federal” agencies
Generally exempt at the local level
Bankers’ acceptances—drafts accepted for future payment by commercial banks
No set size; typically range from $25,000 to $1 million
Predominantly from 30 to 180 days
Discount Good for accep-tances of the large “money market” banks
Taxed at all levels of government
Negotiable certificates of deposit—marketable receipts for funds deposited in a bank for a fixed time period
$25,000 to $10 million 1 to 18 months Accrued interest
Fair to good Taxed at all levels of government
Commercial paper—short-term unsecured promissory notes
$5,000 to $5 million; $1,000 and $5,000 multiples above the initial offering size are sometimes available
3 to 270 days Discount Poor; no active sec-ondary market in the usual sense
Taxed at all levels of government
Repurchase agreements—legal contracts between a borrower (security seller) and lender (security buyer); the borrower will repurchase at the contract price plus an interest charge
Typically $500,000 or more
According to the terms of the contract
Not applicable
Fixed by the agree-ment; that is, the borrower will repurchase
Taxed at all levels of government
Money market mutual funds—holders of diversified portfolios of short-term, high-grade debt instruments
Some require an initial investment as small as $1,000
Shares can be sold at any time
Net asset value
Good; provided by the fund itself
Taxed at all levels of government
M18_TITM2189_13_GE_C18.indd 624 22/05/17 5:24 PM

CHAPTER 18 | Working-Capital Management 625
Managing Accounts ReceivableMost firms are involved in selling goods or services. Although some of these sales will be for cash, for many firms a large portion of these sales will involve credit. Whenever a sale is made on credit, it increases the firm’s accounts receivable balance.
Accounts receivable typically comprise more than 25 percent of a firm’s assets. Because cash flows from a sale cannot be invested until the account is collected, control of receivables takes on added importance; thus, efficient collection policies and procedures improve firm profitability and liquidity.
Determinants of the Size of a Firm’s Investment in Accounts ReceivableThe size of the investment in accounts receivable is determined by several factors. The first is the level of credit sales as a percentage of total sales. The nature of the business tends to determine the blend between credit sales and cash sales. Large grocery stores tend to sell exclusively on a cash basis, whereas most construction and lumber supply firms make their sales primarily with credit. Second, the level of sales is a factor in determining the size of the investment in accounts receivable. Very simply, the more sales, the greater accounts receivable. The third determinant of the level of investment in accounts receivable is credit and collection policies—more specifi-cally, the terms of sale, which include the time allowed until payment is due and any discount for early payment; the quality of the customer who is to receive credit (i.e., the likelihood that he or she will pay in a timely fashion); and the collection efforts put forth by the firm to eliminate its delinquent accounts. These factors are summarized in Figure 18.4.
Terms of SaleThe terms of sale identify the possible discount for early payment, the discount period, and the total credit period. They are generally stated in the form “a/b, net c,” indicating that the customer can deduct a percent if the account is paid within b days; otherwise, the account must be paid in full within c days. Thus, using the example discussed earlier, trade credit terms of 2/10, net 30 indicate that a 2 percent discount can be taken if the account is paid within 10 days; otherwise, it must be paid in full within 30 days. Failure to take the discount
Credit andcollectionpolicies
Non
deci
sion
var
iabl
esD
ecis
ion
vari
able
s
Terms of sale
Customer quality
Collection e�orts
Percentage ofcredit sales tototal sales
Level ofcredit sales
Level of sales
Length of timebefore credit salesare collected
Investment inaccountsreceivable
Figure 18.4
Determinants of the Investment in Accounts ReceivableA firm’s accounts receivable balance arises out of its sales on credit. Therefore, the level of accounts receivable the firm has outstanding at any point in time depends on the percentage of credit sales, the level of sales, the terms of sale offered to customers (i.e., how long they have to repay the firm), the quality of the customers to whom credit is offered (i.e., the likelihood they will repay in a timely manner), and the amount of effort the firm puts into collecting past-due accounts.
>> END FIGURE 18.4
M18_TITM2189_13_GE_C18.indd 625 22/05/17 5:24 PM
626 PART 5 | Liquidity Management and Special Topics in Finance
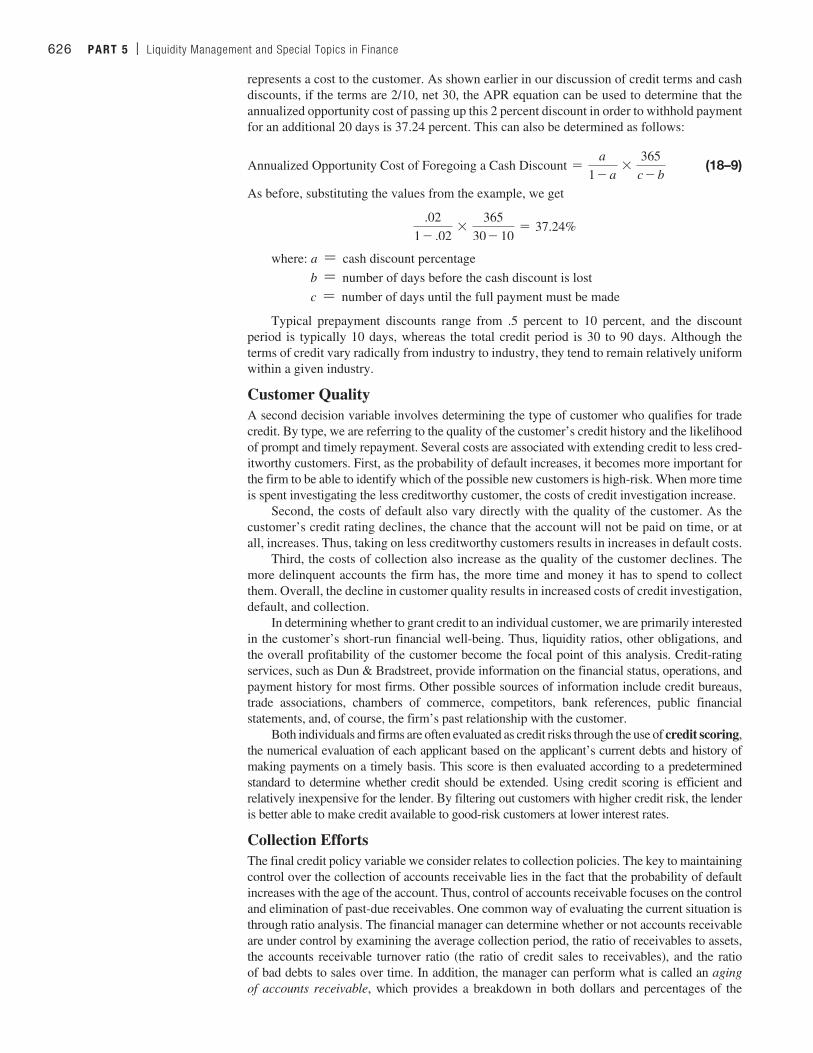
represents a cost to the customer. As shown earlier in our discussion of credit terms and cash discounts, if the terms are 2/10, net 30, the APR equation can be used to determine that the annualized opportunity cost of passing up this 2 percent discount in order to withhold payment for an additional 20 days is 37.24 percent. This can also be determined as follows:
Annualized Opportunity Cost of Foregoing a Cash Discount =a
1 - a*
365c - b
(18–9)
As before, substituting the values from the example, we get
.021 - .02
*365
30 - 10= 37.24%
where: a = cash discount percentage
b = number of days before the cash discount is lost
c = number of days until the full payment must be made
Typical prepayment discounts range from .5 percent to 10 percent, and the discount period is typically 10 days, whereas the total credit period is 30 to 90 days. Although the terms of credit vary radically from industry to industry, they tend to remain relatively uniform within a given industry.
Customer QualityA second decision variable involves determining the type of customer who qualifies for trade credit. By type, we are referring to the quality of the customer’s credit history and the likelihood of prompt and timely repayment. Several costs are associated with extending credit to less cred-itworthy customers. First, as the probability of default increases, it becomes more important for the firm to be able to identify which of the possible new customers is high-risk. When more time is spent investigating the less creditworthy customer, the costs of credit investigation increase.
Second, the costs of default also vary directly with the quality of the customer. As the customer’s credit rating declines, the chance that the account will not be paid on time, or at all, increases. Thus, taking on less creditworthy customers results in increases in default costs.
Third, the costs of collection also increase as the quality of the customer declines. The more delinquent accounts the firm has, the more time and money it has to spend to collect them. Overall, the decline in customer quality results in increased costs of credit investigation, default, and collection.
In determining whether to grant credit to an individual customer, we are primarily interested in the customer’s short-run financial well-being. Thus, liquidity ratios, other obligations, and the overall profitability of the customer become the focal point of this analysis. Credit-rating services, such as Dun & Bradstreet, provide information on the financial status, operations, and payment history for most firms. Other possible sources of information include credit bureaus, trade associations, chambers of commerce, competitors, bank references, public financial statements, and, of course, the firm’s past relationship with the customer.
Both individuals and firms are often evaluated as credit risks through the use of credit scoring, the numerical evaluation of each applicant based on the applicant’s current debts and history of making payments on a timely basis. This score is then evaluated according to a predetermined standard to determine whether credit should be extended. Using credit scoring is efficient and relatively inexpensive for the lender. By filtering out customers with higher credit risk, the lender is better able to make credit available to good-risk customers at lower interest rates.
Collection EffortsThe final credit policy variable we consider relates to collection policies. The key to maintaining control over the collection of accounts receivable lies in the fact that the probability of default increases with the age of the account. Thus, control of accounts receivable focuses on the control and elimination of past-due receivables. One common way of evaluating the current situation is through ratio analysis. The financial manager can determine whether or not accounts receivable are under control by examining the average collection period, the ratio of receivables to assets, the accounts receivable turnover ratio (the ratio of credit sales to receivables), and the ratio of bad debts to sales over time. In addition, the manager can perform what is called an aging of accounts receivable, which provides a breakdown in both dollars and percentages of the
M18_TITM2189_13_GE_C18.indd 626 22/05/17 5:24 PM

CHAPTER 18 | Working-Capital Management 627
Table 18.5 Representative Rates and Monthly Payments for Different FICO Scores on a $25,000, Three-Year Auto Loan in Mid-2016
FICO Score
Interest Rate
Monthly Payment
Total Interest Paid
760–850 3.353% $463 $2,189700–759 4.678% $468 $3,086660–699 6.756% $492 $4,529620–659 9.459% $525 $6,473580–619 13.748% $576 $9,707500–579 14.858% $593 $10,573
What’s a good credit score? The national MEDIAN is 711, but getting the best rate on a home mortgage requires a score of 760 or higher. A score of around 620 is often a cutoff point for receiving credit at any rate. In effect, a good credit score doesn’t just mean that you’ll get a loan; it also means that you’ll be paying less for it. For example, a person with a 760 score will be offered an interest rate of about 9 percent less on a loan than a person with a 550 score. Table 18.5 gives representative rates for differ-ent FICO scores along with what the monthly interest payments would be on a $25,000, three-year auto loan.
Now let’s look at the five factors that determine your credit score, with Figure 18.6 illustrating this breakdown.
1. Your payment history (35 percent of your score). Because a lender is considering extending credit to you, it only makes sense that the lender wants to know how you’ve handled your credit payments in the past.
Credit Scoring
Your credit score has an enormous effect on your financial life, influencing everything from the rate you pay on your credit cards and the size of your credit line to your insurance rates, your mort-gage rate, and the amount of junk mail you receive asking you to take on one more credit card. In short, when it comes to lending money, you’ll be evaluated by your credit score. With a strong credit score, you’ll also be paying a much lower interest rate on any money that you borrow.
Once your credit information has been assembled, it is trans-lated into a three-digit number—your credit score—which mea-sures your creditworthiness.
Figure 18.5 provides the percentages of the population falling within the different FICO score categories.3
Finance for Life
3 http://www.FICO.com.
30%
25%
20%
15%
10%
5%
0%Up to 499 500–549 550–599 600–649 650–699 700–749 750–799 800+
2%
5%
8%
12%
15%
18%
27%
13%
% o
f pop
ulat
ion
FICO score range
Figure 18.5
National Distribution of FICO Scores
>> END FIGURE 18.5
M18_TITM2189_13_GE_C18.indd 627 22/05/17 5:24 PM

628 PART 5 | Liquidity Management and Special Topics in Finance
4. The types of credit you have used (10 percent of your score). If you have several different types of credit outstanding (for example, credit cards, retail accounts, installment loans, auto loans, and a mortgage loan), that is taken as an indicator that you know how to handle your money.
5. The new credit you have applied for (10 percent of your score). Applying for lots of new credit is generally a bad sign. This is because individuals who are moving toward bankruptcy generally take one last grasp at credit, hoping it will keep them afloat. This will lower your score.
It’s important to monitor your credit score. First, you must ensure that there are no errors in your credit report because that’s what is used to calculate your credit score. To do this, you’ll need to get a copy of it annually. Some experts recommend getting a copy of your credit report every few months to monitor for identity theft. The Fair and Accurate Credit Transactions Act (FACT Act) allows you to request one free copy of your credit report each year from each of the three major credit bureaus: Experian, Equifax, and Trans Union. If you’d like more information on how to request your report, log on to www.annualcreditreport.com. Take care to ensure that you reach the FACT Act–supported site, as imposter websites are on the rise. Once you have your credit report, you should make sure that the information in it is correct. Look at all the credit accounts listed, and make sure both that they are yours and that they are correct.
2. The amounts you owe and your available credit (30 percent of your score). The amounts you owe on your credit cards, your mortgage, your car loans, and any other outstanding debt, along with whether you are close to or at your credit limit, are also factored in.
3. The length of your credit history (15 percent of your score). The longer your credit accounts have been open and the longer you have had accounts with the same credi-tors, the higher your credit score will be.
Figure 18.6
Factors That Determine Your Credit Score
Length of credithistory
New credit
Types of creditused
Payment history
Amounts owed
35%
30%
15%
10%
10%
Your Turn: See Study Questions 18–9 and 18–13.
Table 18.6 Aging Accounts Receivable
Age of Accounts Receivable (Days)
Value ($ hundreds) Percentage of Total
0–30 $2,340 39%31–60 1,500 2561–90 1,020 1791–120 720 12Over 120 420 7Total $6,000 100%
receivables that are past due. Comparing the current aging of receivables with past data offers even more control. An example of an aging account or schedule appears in Table 18.6.
The aging schedule provides a listing of how long accounts receivable have been out-standing. Once the delinquent accounts have been identified, the firm’s accounts receivable group makes an effort to collect them. For example, a past-due letter, called a dunning letter, is sent if payment is not received on time, followed by an additional dunning letter in a more serious tone if the account becomes 3 weeks past due, followed after 6 weeks by a telephone call. Finally, if the account becomes 12 weeks past due, it might be turned over to a collection agency. Again, a direct tradeoff exists between collection expenses and lost goodwill on one hand and no collection of accounts on the other; this tradeoff is always part of making the decision about when to pressure late-paying accounts.
>> END FIGURE 18.6
M18_TITM2189_13_GE_C18.indd 628 22/05/17 5:24 PM
CHAPTER 18 | Working-Capital Management 629
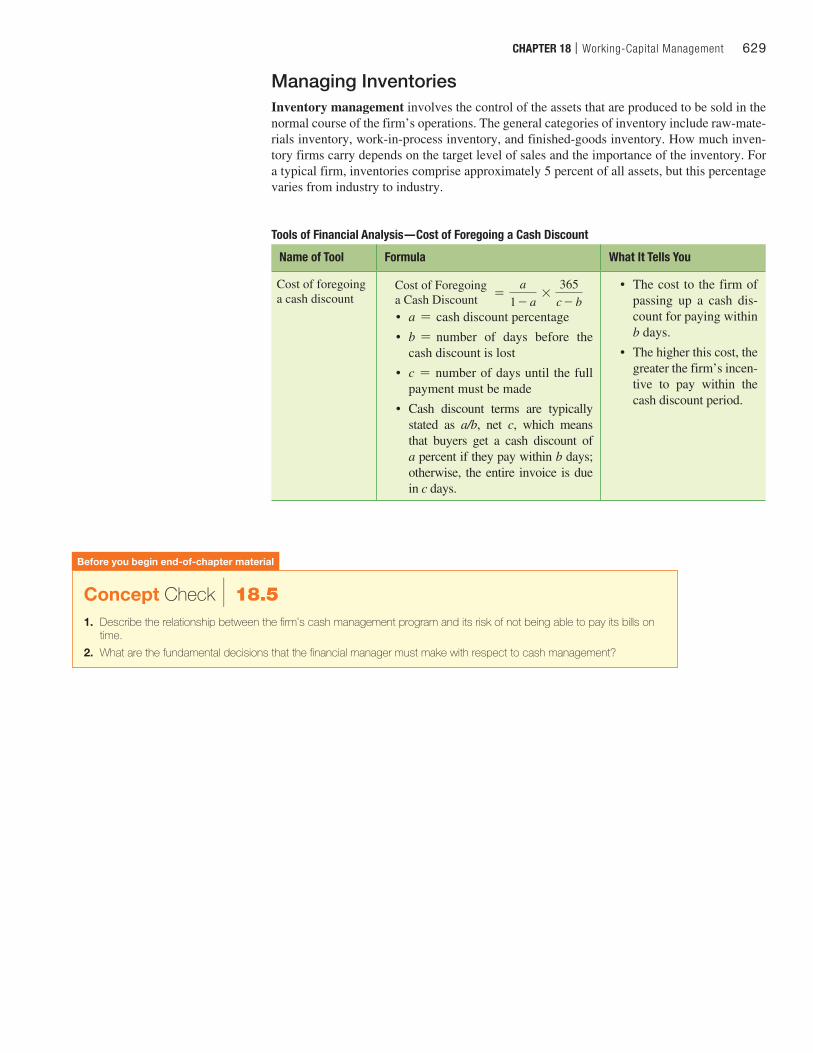
Tools of Financial Analysis—Cost of Foregoing a Cash Discount
Name of Tool Formula What It Tells You
Cost of foregoing a cash discount
Cost of Foregoing a Cash Discount =
a1 - a
*365
c - b• a = cash discount percentage
• b = number of days before the cash discount is lost
• c = number of days until the full payment must be made
• Cash discount terms are typically stated as a/b, net c, which means that buyers get a cash discount of a percent if they pay within b days; otherwise, the entire invoice is due in c days.
• The cost to the firm of passing up a cash dis-count for paying within b days.
• The higher this cost, the greater the firm’s incen-tive to pay within the cash discount period.
Concept Check | 18.51. Describe the relationship between the firm’s cash management program and its risk of not being able to pay its bills on
time.
2. What are the fundamental decisions that the financial manager must make with respect to cash management?
Before you begin end-of-chapter material
Managing InventoriesInventory management involves the control of the assets that are produced to be sold in the normal course of the firm’s operations. The general categories of inventory include raw-mate-rials inventory, work-in-process inventory, and finished-goods inventory. How much inven-tory firms carry depends on the target level of sales and the importance of the inventory. For a typical firm, inventories comprise approximately 5 percent of all assets, but this percentage varies from industry to industry.
M18_TITM2189_13_GE_C18.indd 629 22/05/17 5:24 PM

P Principle 2: There Is a Risk-Return Tradeoff An important source of risk to any business relates to the likelihood that the firm will have sufficient cash to pay its bills as they come due. This is known as the risk of
illiquidity. However, this risk is largely manageable if the firm routinely com-pares its reserves of cash and other current assets that can easily be converted to cash to its current liabilities.
Applying the Principles of Finance to Chapter 18
Chapter Summaries
18.1 Describe the risk-return tradeoff involved in managing a firm’s working capital. (pgs. 610–611)
SUMMARY: Working-capital management involves managing the firm’s liquidity, which, in turn, involves managing the firm’s current assets and its current liabilities. Each of these areas involves risk-return tradeoffs. For example, investing in current assets reduces the firm’s risk of illiquidity at the expense of lowering its overall rate of return on its investment in assets. Furthermore, reduc-ing the use of short-term sources of financing by using more long-term sources enhances the firm’s liquidity but reduces the firm’s profitability.
Concept Check | 18.1
1. How does investing more heavily in current assets, other things remaining the same, increase firm liquidity?
2. How does the use of short-term as opposed to long-term liabilities affect firm liquidity?
SUMMARY: Self-liquidating debt is a useful principle for guiding the firm’s liquidity manage-ment decisions. Basically, this principle involves matching the cash flow–generating character-istics of an asset with the maturity of the source of financing used to acquire it. Thus, temporary needs for inventories that will be sold down within a month or two should be financed using very short-term sources of financing that will be repaid when the need for the inventory has passed.
KEY TERMSPermanent investments in assets, page 612 Investments in assets that the firm expects to hold for a period longer than one year. These include the firm’s minimum level of current assets, such as accounts receivable and invento-ries, as well as fixed assets.
Permanent sources of financing, page 612 Sources of financing that are expected to be used by the firm for an extended period of time, such as an intermediate-term loan, bonds, or common equity.
Principle of self-liquidating debt, page 611 A guiding rule of thumb for managing firm liquidity that calls for financing permanent investments in assets with permanent sources of financing and temporary investments in assets with temporary sources of financing.
Spontaneous sources of financing, page 612 Sources of financing that arise naturally out of the course of doing business and that do not call for an explicit financing decision each time the firm uses them.
Temporary investments in assets, page 612 Investments in current assets—that is, those that will be liquidated and not replaced within the current year—including cash and marketable securities, accounts receivable, and seasonal fluctuations in inventories. Also referred to simply as temporary assets.
Temporary sources of financing, page 612 Sources of financing that typically consist of current liabilities the firm incurs on a discretion-ary basis. Examples include unsecured bank loans and commercial paper (which is simply unsecured promissory notes with maturities of 1 to 270 days that the firm sells in the money market) as well as short-term loans that are secured by the firm’s inventories or accounts receivable.
Trade credit, page 612 A type of account payable that arises when a firm provides goods or services to a customer with an agreement to bill the customer later.
18.2 Explain the principle of self-liquidating debt as a tool for managing firm liquidity. (pgs. 611–614)
Concept Check | 18.2
1. What is the principle of self-liquidating debt, and how can it be used to help the firm manage its liquidity?
2. What are some examples of permanent and temporary investments in current assets?
3. What makes trade credit a source of spontaneous financing?
CH
AP
TE
R 18
630
M18_TITM2189_13_GE_C18.indd 630 22/05/17 5:24 PM

CHAPTER 18 | Working-Capital Management 631CHAPTER 18 | Working-Capital Management 631
18.3 Use the cash conversion cycle to measure the efficiency with which a firm manages its working capital. (pgs. 614–619)
SUMMARY: A key measure of the efficiency with which a firm manages its working capital is the speed with which it cycles cash into inventory, inventory into accounts receivable, and accounts receivable back into cash. This cycle is called the firm’s operating cycle. The shorter this cycle time is, the less money the firm will have invested in inventories and accounts receivable.
The cash conversion cycle is similar to the operating cycle but nets out of the sum total of the operating cycle the number of days the firm has to pay its accounts payable. For example, if the firm’s operating cycle is 100 days but the firm has 60 days to pay for its items of inventory, then the firm has to finance only 40 days’ worth of inventory and accounts receivable, not the entire 100 days’ worth.
KEY TERMSAccounts payable deferral period, page 615 The average period of time the firm uses to repay its trade creditors.
Cash conversion cycle, page 616 The op-erating cycle (the average collection period plus the inventory conversion period or days of sales in inventories) less the accounts payable deferral period.
Inventory conversion period, page 614 The number of days a firm uses to convert its inventory to cash or accounts receivable fol-lowing a sale.
Operating cycle, page 614 The period of time (usually measured in days) that elapses from the time the firm acquires an item of inventory until that item has been sold and cash has been collected.
KEY EQUATIONS
Operating Cycle = Inventory Conversion Period + Average Collection Period (18–1)
Cash Conversion Cycle = Operating Cycle - Accounts Payable Deferral Period (18–3)
Concept Check | 18.3
1. What is a firm’s operating cycle?
2. What is a firm’s cash conversion cycle, and how does it differ from the operating cycle?
18.4 Evaluate the cost of financing as a key determinant of the management of a firm’s use of current liabilities. (pgs. 619–623)
SUMMARY: The key consideration in selecting a source of short-term financing is the annualized cost of credit. We use the following formula to solve for the annual percentage rate (APR) when the interest amount, the principal sum, and the time period for financing are known:
Annual Percentage
Rate (APR)=
InterestPrincipal
*1
Time (18–8)
KEY TERMS
Bank transaction loan, page 620 An unse-cured short-term bank credit made for a specific purpose.
Commercial paper, page 620 A money mar-ket security with a maturity of 1 to 270 days that is issued (sold) by large banks and corporations and that is backed by the issuing firm’s promise to pay the face amount on the maturity date specified on the note.
Factor, page 620 A financial institution that purchases accounts receivable from firms.
Line of credit, page 620 An informal agree-ment or understanding between the borrower and the bank about the maximum amount of credit that the bank will provide the borrower at any one time.
Secured current liabilities, page 619 Loans that involve the pledge of specific assets as collateral in the event the borrower defaults on the payment of principal or interest.
Unsecured current liabilities, page 619 Debts of the company that are due and payable within a period of one year and that are secured only by the promise of the firm to repay the debt.
Concept Check | 18.4
1. Give some examples of unsecured and secured forms of current liabilities.
2. What does a factor do?
3. What is a bank line of credit?
4. What is the APR equation, and how is it used?
M18_TITM2189_13_GE_C18.indd 631 22/05/17 5:24 PM

632 PART 5 | Liquidity Management and Special Topics in Finance632 PART 5 | Liquidity Management and Special Topics in Finance
Concept Check | 18.5
1. Describe the relationship between the firm’s cash management program and its risk of not being able to pay its bills on time.
2. What are the fundamental decisions that the financial manager must make with respect to cash management?
18–1. In the chapter introduction, we noted that computer company Dell is an industry leader in its working-capital management practices. Describe how the firm came to have this reputation.
18–2. In Regardless of Your Major: Conflicting Objectives Lead to Problems in Managing a Firm’s Working Capital on page 610, we learned that the objectives of a firm’s sales force and the goal of maximizing shareholder wealth are not always in sync when it comes to managing the firm’s working capital. Describe why the sales force might want to have lax credit terms and how this impacts the firm’s investment in working capital.
18–3. Why is inventory sometimes excluded from the current ratio?
18–4. Why does the management understanding of working capital need to move beyond the numerical?
18–5. What is the risk-return tradeoff that arises when a firm manages its working capital?
18–6. What is meant by the “operating cycle,” and why is it important?
18–7. What is the principle of self-liquidating debt, and how can it be used to manage a firm’s working capital?
18–8. Under normal circumstances, why would it not be advisable to use short-term bank borrowings to fund capital expenditure?
18–9. Finance for Life: Credit Scoring on page 627 described the credit scoring system used to determine whether credit will be extended. What is a good credit score?
Study Questions
18.5 Understand the factors underlying a firm’s investment in cash and marketable securities, accounts receivable, and inventory. (pgs. 623–629)
SUMMARY: The size of a firm’s investment in accounts receivable depends on three factors: the percentage credit sales are of total sales, the level of sales, and the credit and collection policies of the firm. The financial manager, however, generally has control only over the terms of the sale, the quality of the customer, and the collection efforts.
KEY TERMSCredit scoring, page 626 A numerical evalu-ation of the creditworthiness of an individual bor-rower based on the borrower’s current debts and history of making payments on a timely basis.
Float, page 624 The difference between the cash balance shown on a firm’s books and the available balance at the firm’s bank.
Inventory management, page 629 The control of the firm’s store of assets that are to be sold in the normal course of the firm’s operations.
The general categories of inventory include raw-materials inventory, work-in-process inventory, and finished-goods inventory.
Money market securities, page 624 Short-term, low-risk debt instruments that can be sold easily and with very low risk of loss.
Terms of sale, page 625 The time period until payment must be made, any discount for early payment.
KEY EQUATION
Annualized Opportunity Cost of Foregoing a Cash Discount =a
1 - a*
365c - b
(18–9)
M18_TITM2189_13_GE_C18.indd 632 26/06/17 10:33 AM

CHAPTER 18 | Working-Capital Management 633CHAPTER 18 | Working-Capital Management 633
Working-Capital Management and the Risk-Return Tradeoff
18–1. (Analyzing the risk-return tradeoff) CL Marshall Liquors owns and operates a chain of beer and wine shops throughout the Dallas–Fort Worth metroplex. As a result of the rapidly expanding population of the area, the firm requires a growing amount of funds. Historically, it has reinvested earnings and borrowed using short-term bank notes. Bal-ance sheets, in thousands, for the last five years are as follows:
2012 2013 2014 2015 2016
Current assets $100 $130 $160 $190 $220
Fixed assets 250 270 290 310 330
Total Assets $350 $400 $450 $500 $550
Current liabilities $50 $90 $130 $170 $210
Long-term liabilities 100 100 100 100 100
Owners’ equity 200 210 220 230 240
Total liabilities and owners’ equity $350 $400 $450 $500 $550
a. Compute the firm’s current ratio (current assets divided by current liabilities) and debt ratio (current plus long-term liabilities divided by total assets) for the five-year period found above. Describe the firm’s risk using both the current ratio and the debt ratio.
b. Alter the financial statements above so that current liabilities remain constant at $50 and long-term liabilities increase in the amount needed to meet the firm’s financing requirements. Compute the firm’s current ratio (current assets divided by current li-abilities) and debt ratio (current plus long-term liabilities divided by total assets) us-ing the revised financial statements you have prepared for the five-year period above. Describe the firm’s risk using both the current ratio and the debt ratio.
c. Which of the financing plans is more risky? Why?
Working-Capital Policy
18–2. (Identifying permanent and temporary asset investments) Classify each of the following investments in assets as either permanent or temporary, and explain your choice:a. A seasonal increase in a card shop’s inventory of Valentine cards.b. The acquisition of a new forklift truck that is expected to have a useful life of five
years.c. An increase in accounts receivable resulting from an expansion in the firm’s cus-
tomer base.
Study Problems
Go to www.myfinancelab.com to complete these exercises online
and get instant feedback.
MyLab Finance
18–10. How can the basic interest expense formula—Interest = Principle × Rate × Time—be used to estimate the annualized cost of short-term credit?
18–11. The management of a company can receive immediate payment from a customer by giving a 15 percent price discount or, alternatively, fund a trade-receivable position through the use of a bank overdraft. What will influence the decision?
18–12. What factors determine the size of the investment a firm makes in accounts receiv-able? Which of these factors are under the control of the financial manager?
18–13. In Finance for Life: Credit Scoring on page 627, we learned about the determinants of your credit score. Describe the five components of a credit score and the relative weight or importance of each.
M18_TITM2189_13_GE_C18.indd 633 26/06/17 10:36 AM

634 PART 5 | Liquidity Management and Special Topics in Finance634 PART 5 | Liquidity Management and Special Topics in Finance
18–3. (Identifying spontaneous, temporary, and permanent sources of financing) Classify each of the following sources of new financing as spontaneous, temporary, or perma-nent, and explain your choice:a. A manufacturing firm enters into a loan agreement with its bank that calls for an-
nual principal and interest payments spread over the next four years.b. A retail firm orders new items of inventory that are charged to the firm’s trade credit.c. A trucking firm issues common stock to the public and uses the proceeds to up-
grade its tractor fleet.
Operating and Cash Conversion Cycles
18–4. (Calculating the cash conversion cycle) (Related to Checkpoint 18.1 on page 617) A business can receive 20 days’ credit from its supplier on raw materials purchased. It will take the business 25 days to convert the raw material into a saleable product. Customers in this sector will pay their invoices 40 days after purchase.a. What is the length of the operating cycle, assuming products are sold as soon as
completed?b. How does this differ from the cash conversion cycle?
18–5. (Calculating the operating and cash conversion cycles) (Related to Checkpoint 18.1 on page 617) The Caraway Seed Company has for many years cultivated and sold what are known as heritage plants and seeds. For example, it has sought out older varieties of tomato plants that are no longer grown by commercial vegetable farmers because they take too long to mature, do not ship well, or do not hold up for long on store shelves. The company has recently been considering ways to reduce its invest-ment in working capital in order to make itself more profitable. At present, it has an inventory conversion period of 90 days and offers credit terms of 30 days, which are taken full advantage of by the majority of its customers. The company purchases its inventory items on credit terms that allow it 45 days to pay, but it has always followed a policy of making cash payments for invoices as soon as they are received, so the accounts payable deferral period is typically only 5 days.a. What are Caraway’s operating and cash conversion cycles?b. If Caraway decides to take full advantage of its credit terms and delay payment
until the last possible date, how will this impact its cash conversion cycle?c. What is your recommendation to the company with regard to its working-capital
management practices and why?
Managing Current Liabilities
18–6. (Estimating the cost of bank credit) (Related to Checkpoint 18.2 on page 621) Lotfield enterprises is just starting in business and the owner has heard about the need to understand her operating cycle and her cash conversion cycle. She asks you to illustrate and explain why this matters for her cashflow. Her plans are as follows:a. Conversion of raw materials to sold product will be 46 days.b. Customers will be required to pay within 34 days.c. Her raw material supplier will give her 10 days of interest-free credit.
18–7. (Calculating the cost of trade credit) (Related to Checkpoint 18.2 on page 621) You have an estimated working capital requirement for the next 180 days that varies be-tween £90,000 and £150,000. You are looking at short-term working capital finance for a period of 180 days, and you have been offered the following alternatives by your bank. (Remember the UK 365-day calculation basis.)a. A short-term loan for £150,000, repayable in 180 days based on an annual interest
rate of 7.5 percentb. An overdraft limit of £200,000 for a 12-month period at a rate of 7 percent but
with an up-front fee of £1,000
Suggest which option you would choose assuming you want to minimize your cost of finance.
M18_TITM2189_13_GE_C18.indd 634 26/06/17 10:40 AM

CHAPTER 18 | Working-Capital Management 635CHAPTER 18 | Working-Capital Management 635
18–8. (Calculating the cost of short-term financing) (Related to Checkpoint 18.2 on page 621) The R. Morin Construction Company needs to borrow $100,000 to help finance the cost of a new $150,000 hydraulic crane used in the firm’s commercial construc-tion business. The crane will pay for itself in one year, and the firm is considering the following alternatives for financing its purchase:
Alternative A. The firm’s bank has agreed to lend the $100,000 at a rate of 14 per-cent. Interest is to be discounted, and a 15 percent compensating balance is required. However, the compensating-balance requirement is not binding on the firm because it normally maintains a minimum demand deposit (checking account) balance of $25,000 in the bank.
Alternative B. The equipment dealer has agreed to finance the equipment with a one-year loan. The $100,000 loan requires payment of principal and interest totaling $116,300.a. Which alternative should Morin select?b. If the bank’s compensating-balance requirement had necessitated idle demand de-
posits equal to 15 percent of the loan, what effect would this have had on the cost of the bank loan alternative?
18–9. (Calculating the cost of a short-term bank loan) (Related to Checkpoint 18.2 on page 621) Return to the operating structure outlined in Study Problem 18–6. Lotfield have planned three different tranches of workflow to meet three orders received from a customer. There will be 50 days between the delivery/selling date of each tranche. If the raw materials cost £75,000 for each tranche and there is a profit margin of £40,000, what will the working capital requirement to fulfil the three orders be? Ignore any other costs and assume that cash received will be avail-able as free cashflow.
18–10. (Calculating the cost of short-term financing) (Related to Checkpoint 18.2 on page 621) You plan to borrow $20,000 from the bank to pay for inventories for a gift shop you have just opened. The bank offers to lend you the money at 10 percent annual interest for the six months the funds will be needed (assume a 365-day year).a. Calculate the annualized rate of interest on the loan.b. In addition, the bank requires you to maintain a 15 percent compensating bal-
ance in the bank. Because you are just opening your business, you do not have a demand deposit account at the bank that can be used to meet the compensating-balance requirement. This means that you will have to take an amount equal to 15 percent of the loan amount out of your own money (which you had planned to use to help finance the business) and put it in a checking account. What is the cost of the loan now?
c. The bank now tells you that not only do you have to meet the compensating-balance requirement in part b but also the interest on the loan will be discounted. What is the annualized rate of interest on the loan now?
18–11. (Calculating the cost of a short-term bank loan) (Related to Checkpoint 18.2 on page 621) Jimmy Hale is the owner and operator of the grain elevator in Brown-field, Texas, where he has lived for most of his 62 years. The rains during the spring have been the best in a decade, and Hale is expecting a bumper wheat crop. This has prompted him to rethink his current financing sources. He now believes he will need an additional $240,000 for the three-month period ending with the close of the harvest season. After meeting with his banker, Hale is puzzling over what the additional financing will actually cost. The banker quoted him a rate of 1 percent over prime (which is currently 7 percent) and also requested that the firm increase its current bank balance of $4,000 up to 20 percent of the loan.a. If interest and principal are all repaid at the end of the three-month loan term,
what is the annual percentage rate on the loan offer made by Hale’s bank?b. If the bank offers to lower the rate to prime if the interest is discounted, should
Hale accept this alternative?
M18_TITM2189_13_GE_C18.indd 635 26/06/17 10:44 AM

636 PART 5 | Liquidity Management and Special Topics in Finance636 PART 5 | Liquidity Management and Special Topics in Finance
18–12. (Evaluating trade credit discounts) (Related to Checkpoint 18.2 on page 621) Re-turn to Study Problems 18–6, 18–7, and 18–9. Lotfield are planning their financial requirements as outlined in Study Problem 18–9. They approach their bank for work-ing capital funding and are given the same two options that are presented in Study Problem 18–7.a. A short-term loan for £150,000, repayable in 180 days based on an annual interest
rate of 7.5 percentb. An overdraft limit of £200,000 for a 12-month period at a rate of 7 percent but
with an up-front fee of £1,000
If we assume that their cashflow forecast is accurate and they have a guarantee of payment from their customer, which is the best working capital funding option? (Remember the UK 365-day calculation basis.)
18–13. (Evaluating trade credit discounts) (Related to Checkpoint 18.2 on page 621) Your company makes a product that has a cash conversion cycle of 50 days. Your cash requirement is £250,000 and your interest cost is 4.5 percent. You have just offered a customer a 2 percent discount to pay an invoice of £20,000 10 days early. Was this a good idea?
M18_TITM2189_13_GE_C18.indd 636 26/06/17 10:46 AM

CHAPTER 18 | Working-Capital Management 637CHAPTER 18 | Working-Capital Management 637
Mini-CaseYour first major assignment after your recent promotion at Ice Nine involves overseeing the management of accounts receiv-able and inventory. The first item that you must attend to is a proposed change in credit policy that would relax credit terms from the existing 1/50, net 70 to 2/60, net 90 in hopes of se-curing new sales. The management at Ice Nine does not expect bad-debt losses on its current customers to change under the new credit policy. The following information should aid you in the analysis of this problem:
New sales level (all credit) $8,000,000Original sales level (all credit) $7,000,000Contribution margin 25%Percentage of bad-debt losses on new sales 8%New average collection period 75 daysOriginal average collection period 60 daysAdditional investment in inventory $50,000Pretax required rate of return 15%New cash discount percentage 2%Percentage of customers taking the new cash discount 50%Original cash discount percentage 1%Percentage of customers taking the old cash discount 50%
To help the firm in reaching a decision on whether to relax its credit terms, you have been asked to respond to the following questions:
a. What determines the size of the investment Ice Nine makes in accounts receivable?
b. If a firm currently buys from Ice Nine under the pres-ent trade credit terms of 1/50, net 70 and decides to forego the trade credit discount and pay on the net day, what is the annualized cost to that firm of foregoing the discount?
c. If Ice Nine changes its trade credit terms to 2/60, net 90, what is the annualized cost to a firm that buys on credit from Ice Nine and decides to forego the trade credit dis-count and pay on the net day?
d. What is the estimated change in profits resulting from the increased sales less any additional bad debts associated with the proposed change in credit policy?
e. Estimate the cost of the additional investment in accounts receivable and inventory associated with this change in credit policy.
f. Estimate the change in the cost of the cash discount if the proposed change in the credit policy is enacted.
g. Compare the incremental revenues with the incremental costs. Should the proposed change be enacted?
M18_TITM2189_13_GE_C18.indd 637 22/05/17 5:24 PM