Word Pro - Results - Universität Hohenheim (OPUS)
38
Results A. Sampling of Milkfish & Tilapia at Commercial Setups 1. Monthly Changes in Phytoplankton Biomass & Composition The results of the SEAFDEC plankton monitorings is shown in Fig. 5. It is obvious that the lake is, for most times of the year, dominated by diatoms, mainly belonging to the genus Coscinodiscus. There are occasional blooms of blue-green algae, mainly Anabaena spiroides Klebahn 1895 and members of the genus Oscillatoria which comprised the cyanobacterial blooms in May-June 1995 (both species) and June- August 1997 (Oscillatoria only). The other blue-green alga likely to occur in great numbers is Microcystis aeruginosa Kützing 1833, as was the case in September 1995 at Station C and September 1996 at Stations P & W. The third algal group conspicuous during the 3-year study period were the dinoflagellates, represented here by Ceratium hirundinella Dujardin 1841, which caused a short but intense bloom in July 1996. In contrast, the green algae never contributed much to algal biomass. There were obvious differences between stations for the same sampling months, even between Stations W & P which were geographically close to each other. These differences may to some extent be attributed to the fact that no station could be visited at the same time, and the difference between Stations P & W on the one hand and Stations S & C on the other was always about 24 hours. In this time, the weather could change dramatically and this would have influenced algal biomass. Nevertheless, the discrepancies would also have reflected differences between the different geographical sectors of the lake, showing not only that the algal populations differ between bays but also that the fishpens have an effect on algal biomass and community structure. This could be due to either the grazing effect of the cultured fish or the flow of water being impeded by the netting. The biggest difference between the years was the occurrence of dinoflagellates rather than blue-greens in 1996. One possible reason for this is that because of high lake levels following the strong typhoon in November 1995 and the subsequent closure of the NHCS, the water level did not fall sufficiently low for saltwater intrusion to take place that year. Nevertheless, this bloom took place to a greater or lesser degree at all stations. This shows that, regardless of these differences between years and bays, the results of the algal monitoring demonstrate some overall similarities for the lake, namely the dominance of the 52
-
Upload
khangminh22 -
Category
Documents
-
view
0 -
download
0
Transcript of Word Pro - Results - Universität Hohenheim (OPUS)
Results
A. Sampling of Milkfish & Tilapia at Commercial Setups
1. Monthly Changes in Phytoplankton Biomass & Composition
The results of the SEAFDEC plankton monitorings is shown in Fig. 5. It is obvious
that the lake is, for most times of the year, dominated by diatoms, mainly belonging to the
genus Coscinodiscus. There are occasional blooms of blue-green algae, mainly Anabaena
spiroides Klebahn 1895 and members of the genus Oscillatoria which comprised the
cyanobacterial blooms in May-June 1995 (both species) and June- August 1997 (Oscillatoria
only). The other blue-green alga likely to occur in great numbers is Microcystis aeruginosa
Kützing 1833, as was the case in September 1995 at Station C and September 1996 at
Stations P & W. The third algal group conspicuous during the 3-year study period were the
dinoflagellates, represented here by Ceratium hirundinella Dujardin 1841, which caused a
short but intense bloom in July 1996. In contrast, the green algae never contributed much to
algal biomass.
There were obvious differences between stations for the same sampling months, even
between Stations W & P which were geographically close to each other. These differences
may to some extent be attributed to the fact that no station could be visited at the same time,
and the difference between Stations P & W on the one hand and Stations S & C on the other
was always about 24 hours. In this time, the weather could change dramatically and this
would have influenced algal biomass. Nevertheless, the discrepancies would also have
reflected differences between the different geographical sectors of the lake, showing not only
that the algal populations differ between bays but also that the fishpens have an effect on
algal biomass and community structure. This could be due to either the grazing effect of the
cultured fish or the flow of water being impeded by the netting.
The biggest difference between the years was the occurrence of dinoflagellates rather
than blue-greens in 1996. One possible reason for this is that because of high lake levels
following the strong typhoon in November 1995 and the subsequent closure of the NHCS, the
water level did not fall sufficiently low for saltwater intrusion to take place that year.
Nevertheless, this bloom took place to a greater or lesser degree at all stations. This shows
that, regardless of these differences between years and bays, the results of the algal
monitoring demonstrate some overall similarities for the lake, namely the dominance of the
52

Figure 5. Phytoplankton biomass in a fishpen (Station P), in West Bay (Station W), South Bay(Station S) and Central Bay (Station C) from May 1995 to September 1997 inclusive. Nosampling at station C throughout 1996 and 1997 or at Station P in August 1997). Commonlegend shown at Station C. Note different Y-axis scales. Data taken from SEAFDEC (1996,1997, 1998)
53
Station P
Jul Oct Jan Apr Jul Oct Jan Apr Jul0
20
40
60
80
1995 1996 1997
Month
Bio
mas
s (m
gl-1
)
Station W
Jul Oct Jan Apr Jul Oct Jan Apr Jul0
10
20
30
40
1995 1996 1997
Month
Bio
mas
s (m
gl-1
)
Station C
Jul Oct Jan Apr Jul Oct Jan Apr Jul0
2
4
6
8
Blue-greensGreensDiatomsFlagellatesEuglenoids
19961995 1997
Month
Bio
mas
s (m
gl-1
)
Station S
Jul Oct Jan Apr Jul Oct Jan Apr Jul0
10
20
30
1995 1996 1997
Month
Bio
mas
s (m
gl-1
)

diatoms for most of the time, which are replaced by blooms of blue-greens or dinoflagellates
around the middle of the year.
2. Milkfish
a) Growth Rates
Milkfish were sampled on seven occasions in June and August 1995, October 1996
and February, April, June and August 1997. The strong typhoon in November 1995
destroyed all fishpens in the lake so that sampling was not possible for one year during which
the industry slowly recovered. The mean standard lengths, total and gutted weights of the
milkfish sampled are summarised in Tab. 2. In spite of their large maximum size, milkfish
are harvested in Laguna de Bay when they reach a marketable size of about 250-500g. In
fact, our final sampling (21.-22. August 1997) could not have been delayed much longer
since these fish were harvested only a few days later. The fish collected here therefore span
practically the entire size range found in the lake. The standard and metabolic growth rates
calculated from these figures (Tab. 3) contrast markedly between different seasons. Growth
is evidently far superior between mid-June and the beginning of August than at other times of
the year; at the same time, differences for practically the same time of year were observed
between 1995 and 1997.
Table 2. Details of milkfish sampling dates, fishpen code (cf. Fig. 2), number of fish collectedand standard lengths (SL), total (TW) and gutted (GW) weights (Mean ± Standard Deviation) ofthe fish sampled throughout the project
495.8 ± 63.3528.0 ± 66.730.5 ± 1.488M3 21.-22. August 1997
194.8 ± 44.5220.9 ± 50.222.8 ± 1.599M3 19.-20. June 1997
44.2 ± 25.948.6 ± 28.014.7 ± 2.885M2 29.-30. April 1997
40.4 ± 26.044.7 ± 30.314.1 ± 2.386M2 6.-7. February 1997
22.0 ± 13.526.5 ± 15.311.3 ± 1.9120M2 3.-4. October 1996
182.4 ± 32.6200.5 ± 34.921.9 ± 1.380M1 7.-8. August 1995
37.9 ± 9.745.8 ± 11.613.2 ± 1.180M1 16.-17. June 1995
GW (g)TW (g)SL (cm)No. of
fish
Fishpen
Code
Sampling Date
54
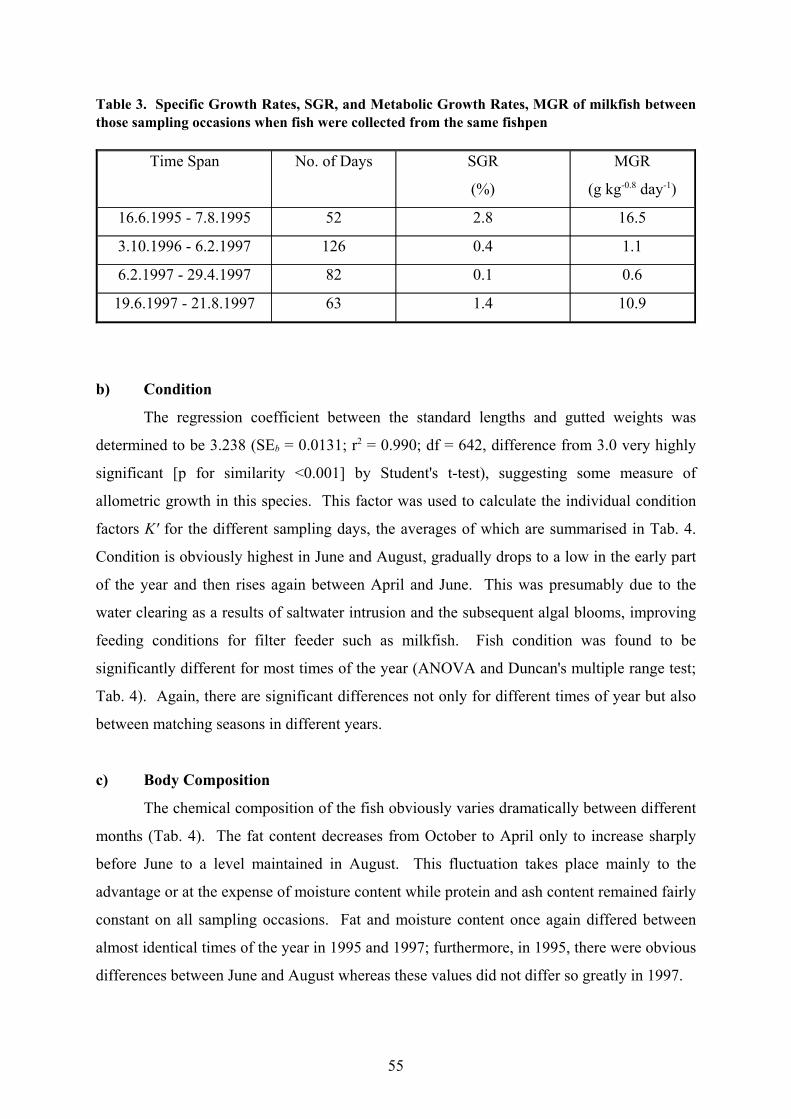
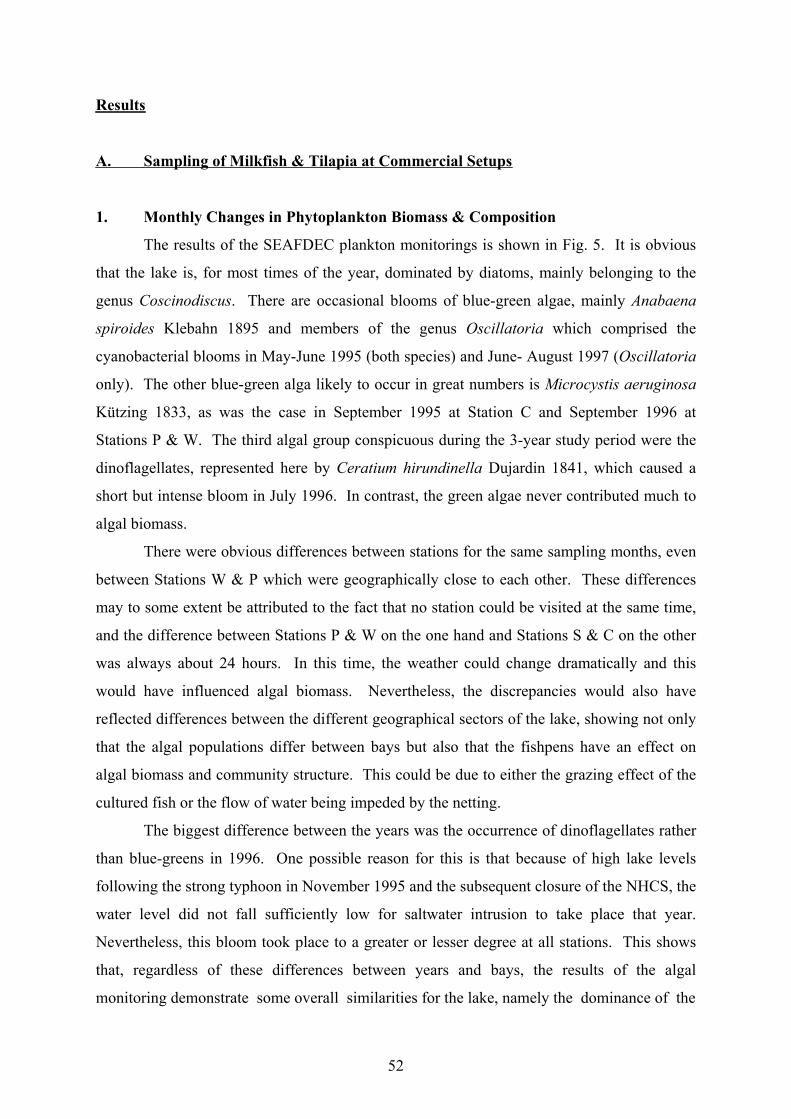
Table 3. Specific Growth Rates, SGR, and Metabolic Growth Rates, MGR of milkfish betweenthose sampling occasions when fish were collected from the same fishpen
10.91.46319.6.1997 - 21.8.1997
0.60.1826.2.1997 - 29.4.1997
1.10.41263.10.1996 - 6.2.1997
16.52.85216.6.1995 - 7.8.1995
MGR
(g kg-0.8 day-1)
SGR
(%)
No. of DaysTime Span
b) Condition
The regression coefficient between the standard lengths and gutted weights was
determined to be 3.238 (SEb = 0.0131; r2 = 0.990; df = 642, difference from 3.0 very highly
significant [p for similarity <0.001] by Student's t-test), suggesting some measure of
allometric growth in this species. This factor was used to calculate the individual condition
factors K' for the different sampling days, the averages of which are summarised in Tab. 4.
Condition is obviously highest in June and August, gradually drops to a low in the early part
of the year and then rises again between April and June. This was presumably due to the
water clearing as a results of saltwater intrusion and the subsequent algal blooms, improving
feeding conditions for filter feeder such as milkfish. Fish condition was found to be
significantly different for most times of the year (ANOVA and Duncan's multiple range test;
Tab. 4). Again, there are significant differences not only for different times of year but also
between matching seasons in different years.
c) Body Composition
The chemical composition of the fish obviously varies dramatically between different
months (Tab. 4). The fat content decreases from October to April only to increase sharply
before June to a level maintained in August. This fluctuation takes place mainly to the
advantage or at the expense of moisture content while protein and ash content remained fairly
constant on all sampling occasions. Fat and moisture content once again differed between
almost identical times of the year in 1995 and 1997; furthermore, in 1995, there were obvious
differences between June and August whereas these values did not differ so greatly in 1997.
55

Table 4. Mean condition factors and body composition (wet matter basis) of milkfish sampledthroughout the project. Condition factors with different superscripts differ at p<0.05
66.82.610.0 18.5 0.447cd 21.-22. August 1997
67.62.810.616.80.445d 19.-20. June 1997
77.61.9 0.617.10.378f 29.-30. April 1997
74.13.3 2.918.3 0.410e 6.-7. February 1997
75.82.7 3.9 16.0 0.456c 3.-4. October 1996
68.32.811.1 17.0 0.479b 7.-8. August 1995
74.0 2.7 6.317.30.510a 16.-17. June 1995
Moisture
(%)
Ash
(%)
Lipid
(%)
CrudeProtein
(%)
ConditionFactor
K'
Sampling Date
d) Food Composition
The most prominent item in the diet of milkfish in Laguna de Bay was amorphous
detritus which was not only found in considerable quantities in the stomachs of all fish
analysed here but made up well over half the contents at all times of day on several sampling
occasions (Fig. 6). The other component that was virtually never absent in the stomachs
analysed were diatoms of the genus Coscinodiscus, although these were frequently only
present at trace level. In February 1997, however, Coscinodiscus sp. made up a substantial
portion of the stomach contents (Fig. 6b). The October 1996 sampling caught the tail end of
the heavy September bloom of the blue-green alga M. aeruginosa, which was reflected in the
diet of milkfish sampled at that time (Fig. 6a). This was not the case with a similar,
protracted bloom of the cyanobacterium Oscillatoria sp. in June 1997: although this alga was
present in such numbers as to turn the water green, only small amounts were detected in the
stomach contents of milkfish sampled at the time (Fig. 6d).
There was very little variability over the 24-hour period in the stomach contents of
fish analysed on any particular sampling day. Most were obviously filter-feeding pelagically,
ingesting detritus and algae. Differences between fish caught on the same sampling
occasions were found mainly in June 1997 (Fig. 6d) when some individuals caught around
midnight had been feeding mainly on the bottom. This was demonstrated by the presence of
large amounts of sediment and fibrous detritus (probably dead plant material) as well as some
56
Figure 6. Stomach content composition of milkfish sampled throughout the project. Each barrepresents the average of up to five fish. Phytoplankton species not specifically listed werepresent only at trace level and have been grouped into the category Coscinodiscus. Notedifferent Y-axis scales. (a) October 1996 (b) February 1997 (c) April 1997
57
(a) October 1996
6 12 18 240.0
0.1
0.2
0.3
0.4
DetritusMicrocystisCoscinodiscusZooplankton/Benthos
Time of Day (hours)
Stom
ach
Con
tent
s(%
BW
E)
(b) February 1997
6 12 18 240.0
0.1
0.2
0.3
DetritusCoscinodiscus
Zooplankton/Benthos
Time of Day (hours)
Stom
ach
Con
tent
s(%
BW
E)
(c) April 1997
6 12 180.0
0.1
0.2DetritusCoscinodiscusZooplankton/Benthos
Time of Day (hours)
Stom
ach
Con
tent
s(%
BW
E)

Figure 6 (cont.). Stomach content composition of milkfish sampled throughout the project.Each bar represents the average of up to five fish. Phytoplankton species not specifically listedwere present only at trace level and have been grouped into the category Coscinodiscus. Notedifferent Y-axis scales. (d) June 1997 (e) August 1997
ostracods in their stomachs. These fish had a distinctly higher level of stomach fullness than
others which were filter-feeding so that they were deleted from the MAXIMS analysis in
order to avoid distortions in the regression curve.
The visual comparison between the stomach and rectal contents suggested that
Coscinodiscus sp. and Oscillatoria sp. were digested with great efficiency. There was no
trace of the latter in the rectal content of any fish analysed. In the case of diatoms, the
siliceous shells were perfectly preserved after passage through the gut but lacked any content
so that the organic material may again be presumed to have been completely digested. When
M. aeruginosa was ingested, on the other hand, large lumps consisting of numerous cells of
this species were discovered intact in the rectum. It is possible that these were protected by
58
(d) June 1997
6 12 18 240.00
0.05
0.10
0.15
DetritusCoscinodiscusOscillatoriaZooplankton/BenthosSediment
Time of Day (hours)
Stom
ach
Con
tent
s(%
BW
E)
(e) August 1997
6 12 18 240.000
0.025
0.050
0.075
Detritus
Coscinodiscus
Zooplankton/Benthos
Time of Day (hours)
Stom
ach
Con
tent
s(%
BW
E)

their gelatinous coating. It was not clear whether milkfish were able to remove this
protective layer, e.g. by abrasion, from at least some of the colonies and digest them, in
which case M. aeruginosa would have been at least of some use to this species. It is difficult
to estimate the digestibility of detritus since this material was practically without structure to
start with but it was noticed that the rectal contents consisted of appreciable quantities of
material of similar appearance. The same considerations therefore apply for detritus as for
M. aeruginosa: while it is possible that some of this was digested and assimilated, the
digestibility must have fallen well short of 100%.
e) Feeding Periodicity & Daily Ration
A comparison of the level of stomach fullness at different times of the day
demonstrates that milkfish in Laguna de Bay have a very prolonged feeding period, starting
before dawn and lasting well into the night. Indeed, the stomachs were generally found to be
wholly or nearly empty only for a short time after midnight (Fig. 7). The MAXIMS analysis
generally supports this (Tab. 5); the model predicted that feeding started between 3:00 and
5:00 hours and usually finished between 22:00 and 23:30. The feeding period observed in
October 1996 was particularly long (19h 38mins), while the shortest feeding period was
found in August 1997 (16h 9mins), mainly because on this occasion, the fish ceased feeding
only a little after sunset.
After deleting the data points pertaining to fish with sediment in their stomachs, the
daily rations calculated with the aid of the MAXIMS model for the 1996 and 1997 samplings
were fairly similar for most months (Tab. 5). A considerably lower value was only observed
in August 1997, partly attributable to the shorter feeding period for this sampling occasion.
Although bigger fish consume more than smaller ones under the same conditions, it is
known that bigger fish generally consume less relative to their body size (Jobling 1994).
Since the fish sampled here differed considerably in size between the sampling months, this
was compensated by converting the daily rations to g[food] kg[body-mass]-0.8 day-1 (Tab. 5) ,
a conversion previously employed by Dabrowski et al. (1986). When examined on this basis,
there were almost no differences in the daily rations recorded for the first few samplings in
1997, despite the strongly contrasting growth rates for these periods. The difference between
the relatively low daily ration calculated for August 1997 and the other months of that year
was reduced a little by allowing for metabolic fish size; nevertheless, even on a metabolic
59
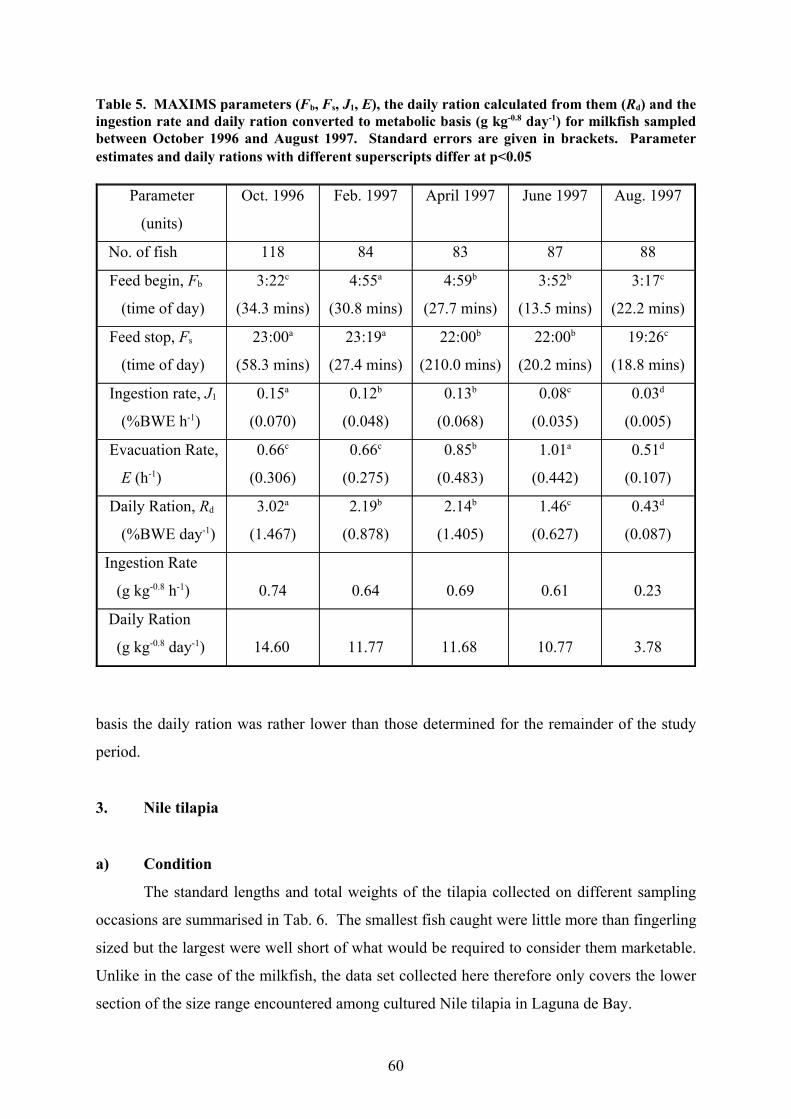
Table 5. MAXIMS parameters (Fb, Fs, J1, E), the daily ration calculated from them (Rd) and theingestion rate and daily ration converted to metabolic basis (g kg-0.8 day-1) for milkfish sampledbetween October 1996 and August 1997. Standard errors are given in brackets. Parameterestimates and daily rations with different superscripts differ at p<0.05
3.7810.7711.68 11.7714.60
Daily Ration
(g kg-0.8 day-1)
0.230.610.690.640.74
Ingestion Rate
(g kg-0.8 h-1)
0.43d
(0.087)
1.46c
(0.627)
2.14b
(1.405)
2.19b
(0.878)
3.02a
(1.467)
Daily Ration, Rd
(%BWE day-1)
0.51d
(0.107)
1.01a
(0.442)
0.85b
(0.483)
0.66c
(0.275)
0.66c
(0.306)
Evacuation Rate,
E (h-1)
0.03d
(0.005)
0.08c
(0.035)
0.13b
(0.068)
0.12b
(0.048)
0.15a
(0.070)
Ingestion rate, J1
(%BWE h-1)
19:26c
(18.8 mins)
22:00b
(20.2 mins)
22:00b
(210.0 mins)
23:19a
(27.4 mins)
23:00a
(58.3 mins)
Feed stop, Fs
(time of day)
3:17c
(22.2 mins)
3:52b
(13.5 mins)
4:59b
(27.7 mins)
4:55a
(30.8 mins)
3:22c
(34.3 mins)
Feed begin, Fb
(time of day)
88878384118 No. of fish
Aug. 1997June 1997April 1997Feb. 1997Oct. 1996Parameter
(units)
basis the daily ration was rather lower than those determined for the remainder of the study
period.
3. Nile tilapia
a) Condition
The standard lengths and total weights of the tilapia collected on different sampling
occasions are summarised in Tab. 6. The smallest fish caught were little more than fingerling
sized but the largest were well short of what would be required to consider them marketable.
Unlike in the case of the milkfish, the data set collected here therefore only covers the lower
section of the size range encountered among cultured Nile tilapia in Laguna de Bay.
60
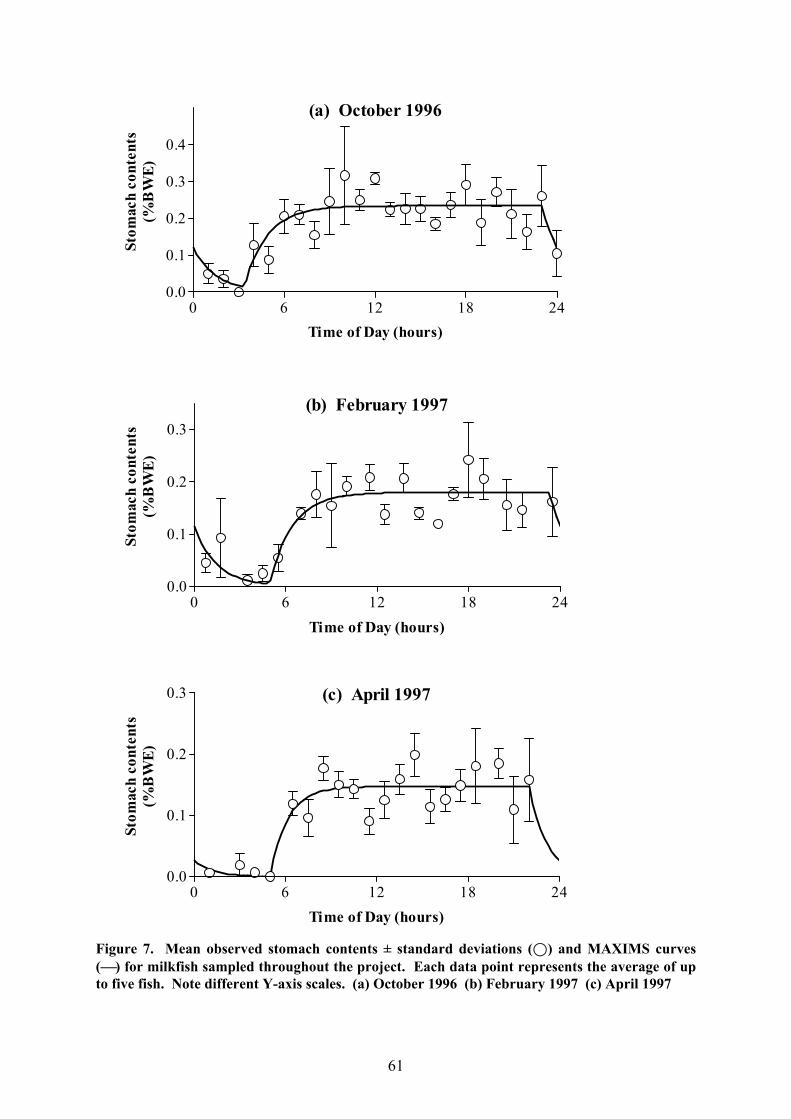
Figure 7. Mean observed stomach contents ± standard deviations (;) and MAXIMS curves() for milkfish sampled throughout the project. Each data point represents the average of upto five fish. Note different Y-axis scales. (a) October 1996 (b) February 1997 (c) April 1997
61
(a) October 1996
0 6 12 18 240.0
0.1
0.2
0.3
0.4
Time of Day (hours)
Stom
ach
cont
ents
(%B
WE
)
(b) February 1997
0 6 12 18 240.0
0.1
0.2
0.3
Time of Day (hours)
Stom
ach
cont
ents
(%B
WE
)
(c) April 1997
0 6 12 18 240.0
0.1
0.2
0.3
Time of Day (hours)
Stom
ach
cont
ents
(%B
WE
)

Figure 7 (cont.). Mean observed stomach contents ± standard deviations (;) and MAXIMScurves () for milkfish sampled throughout the project. Each data point represents theaverage of up to five fish. Note different Y-axis scales. (d) June 1997 (e) August 1997
The condition of this species follows a similar pattern to that of milkfish (Tab. 7): the
condition factors reach a peak around the middle of the year towards the end of the season
of clear water but, in contrast to milkfish, the lowest values were not recorded just before
saltwater intrusion but in January 1997. Differences were again observed for the same
seasons in different years with the results obtained in May 1995 significantly higher than
those for May 1996 and comparable to those collected in July 1996. It should be noted that
practically no differences were recorded for fish kept with and without supplemental feed in
62
(d) June 1997
0 6 12 18 240.00
0.05
0.10
0.15
Time of Day (hours)
Stom
ach
cont
ents
(%B
WE
)
(e) August 1997
0 6 12 18 240.000
0.025
0.050
0.075
Time of Day (hours)
Stom
ach
cont
ents
(%B
WE
)
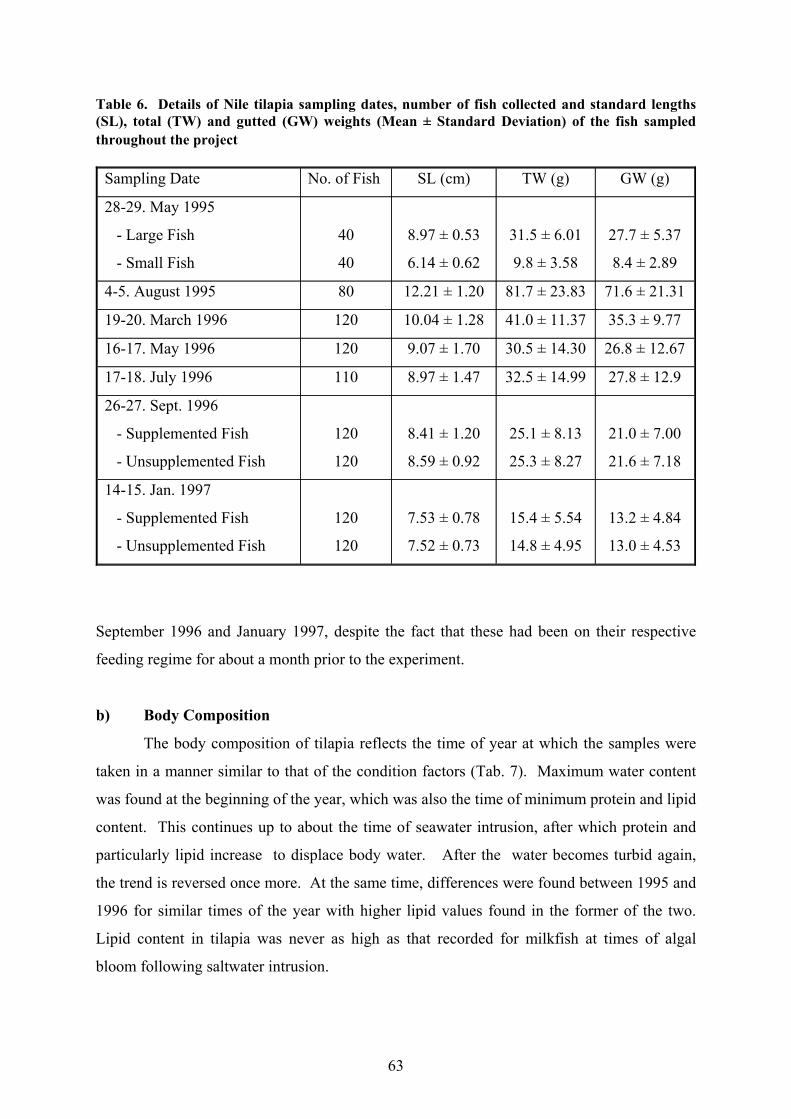
Table 6. Details of Nile tilapia sampling dates, number of fish collected and standard lengths(SL), total (TW) and gutted (GW) weights (Mean ± Standard Deviation) of the fish sampledthroughout the project
13.2 ± 4.84
13.0 ± 4.53
15.4 ± 5.54
14.8 ± 4.95
7.53 ± 0.78
7.52 ± 0.73
120
120
14-15. Jan. 1997
- Supplemented Fish
- Unsupplemented Fish
21.0 ± 7.00
21.6 ± 7.18
25.1 ± 8.13
25.3 ± 8.27
8.41 ± 1.20
8.59 ± 0.92
120
120
26-27. Sept. 1996
- Supplemented Fish
- Unsupplemented Fish
27.8 ± 12.932.5 ± 14.998.97 ± 1.4711017-18. July 1996
26.8 ± 12.6730.5 ± 14.309.07 ± 1.7012016-17. May 1996
35.3 ± 9.7741.0 ± 11.3710.04 ± 1.2812019-20. March 1996
71.6 ± 21.3181.7 ± 23.8312.21 ± 1.20804-5. August 1995
27.7 ± 5.37
8.4 ± 2.89
31.5 ± 6.01
9.8 ± 3.58
8.97 ± 0.53
6.14 ± 0.62
40
40
28-29. May 1995
- Large Fish
- Small Fish
GW (g)TW (g)SL (cm)No. of FishSampling Date
September 1996 and January 1997, despite the fact that these had been on their respective
feeding regime for about a month prior to the experiment.
b) Body Composition
The body composition of tilapia reflects the time of year at which the samples were
taken in a manner similar to that of the condition factors (Tab. 7). Maximum water content
was found at the beginning of the year, which was also the time of minimum protein and lipid
content. This continues up to about the time of seawater intrusion, after which protein and
particularly lipid increase to displace body water. After the water becomes turbid again,
the trend is reversed once more. At the same time, differences were found between 1995 and
1996 for similar times of the year with higher lipid values found in the former of the two.
Lipid content in tilapia was never as high as that recorded for milkfish at times of algal
bloom following saltwater intrusion.
63
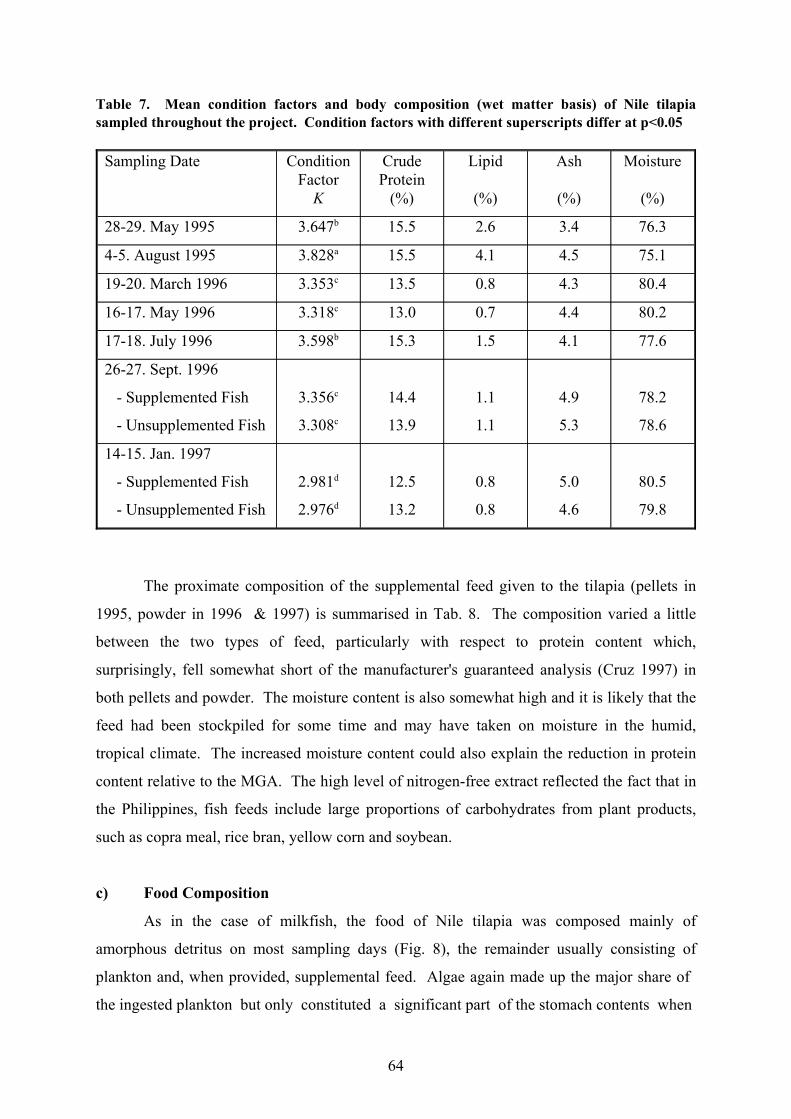
Table 7. Mean condition factors and body composition (wet matter basis) of Nile tilapiasampled throughout the project. Condition factors with different superscripts differ at p<0.05
80.5
79.8
5.0
4.6
0.8
0.8
12.5
13.2
2.981d
2.976d
14-15. Jan. 1997
- Supplemented Fish
- Unsupplemented Fish
78.2
78.6
4.9
5.3
1.1
1.1
14.4
13.9
3.356c
3.308c
26-27. Sept. 1996
- Supplemented Fish
- Unsupplemented Fish
77.64.11.515.33.598b17-18. July 1996
80.24.40.713.03.318c16-17. May 1996
80.44.30.813.53.353c19-20. March 1996
75.14.54.115.53.828a4-5. August 1995
76.33.42.615.53.647b28-29. May 1995
Moisture
(%)
Ash
(%)
Lipid
(%)
CrudeProtein
(%)
ConditionFactor
K
Sampling Date
The proximate composition of the supplemental feed given to the tilapia (pellets in
1995, powder in 1996 & 1997) is summarised in Tab. 8. The composition varied a little
between the two types of feed, particularly with respect to protein content which,
surprisingly, fell somewhat short of the manufacturer's guaranteed analysis (Cruz 1997) in
both pellets and powder. The moisture content is also somewhat high and it is likely that the
feed had been stockpiled for some time and may have taken on moisture in the humid,
tropical climate. The increased moisture content could also explain the reduction in protein
content relative to the MGA. The high level of nitrogen-free extract reflected the fact that in
the Philippines, fish feeds include large proportions of carbohydrates from plant products,
such as copra meal, rice bran, yellow corn and soybean.
c) Food Composition
As in the case of milkfish, the food of Nile tilapia was composed mainly of
amorphous detritus on most sampling days (Fig. 8), the remainder usually consisting of
plankton and, when provided, supplemental feed. Algae again made up the major share of
the ingested plankton but only constituted a significant part of the stomach contents when
64

Table 8. Proximate composition of the supplemental feed (Robina Starfeeds, Universal RobinaCorporation) given to Nile tilapia in August 1995, September 1996 and January 1997.Manufacturer's guaranteed analysis (MGA; minimum values for protein and lipid, maximumvalues for all other components) is included for the sake of comparison
14.4
13.0
38.1
-
4.6
9.0
8.9
12.0
5.3
4.0
28.6
35.0
9/96, 1/97
-
Starter (Crumble)
MGA
16.8
13.0
40.5
-
4.8
6.0
6.2
14.0
6.1
4.0
25.6
30.0
8/95
-
Grower (Pellets)
MGA
Moisture
(%)
NFE
(%)
Fibre
(%)
Ash
(%)
Lipid
(%)
Crude
Protein
(%)
Month(s)Feed Type
they were blooming, as was the case for Anabaena spiroides in May 1995, Ceratium
hirundinella in July 1996 and M. aeruginosa in September 1996. Coscinodiscus sp. was
present in practically all stomachs on all sampling occasions but once more contributed little
to the total contents. Zooplankton in the stomachs was mainly made up of the smaller
plankters, such as rotifers and the cladoceran Bosmina longirostris Müller 1785. While
unsupplemented tilapia evidently had a similar food spectrum to milkfish, the main difference
observed was in those items of benthic origin. Unlike milkfish, which consumed ostracods,
sediment and fibrous detritus, tilapia occasionally ingested filamentous green algae and
amphipods of the genus Corophium, particularly in March and May 1996. Both of these
were found growing on the netting which the fishcages were made of.
In contrast to milkfish, there were occasions when the stomach content composition
of tilapia fluctuated markedly over the daily cycle. This was most obvious in those cases
where supplemental feed was given (Fig. 8c,g,i) since this food type was provided in only
one or two doses per day. Just after feeding, supplemental feed usually made up the major
share of the stomach contents but its contribution to ingested matter rapidly declined as it was
evacuated and replaced by natural food. In consequence, it had usually disappeared almost
entirely from the stomach contents within 6 hours after supplementation (August 1995 and
September 1996; Fig. 8c,g) unless a second dose was given later (January 1997; Fig. 8i).
Marked differences in the stomach content composition over the day were, however,
observed even on some occasions when the fish were not provided with supplemental feed.
The most obvious case was the data for July 1996 (Fig. 8f). When the fish started feeding
65
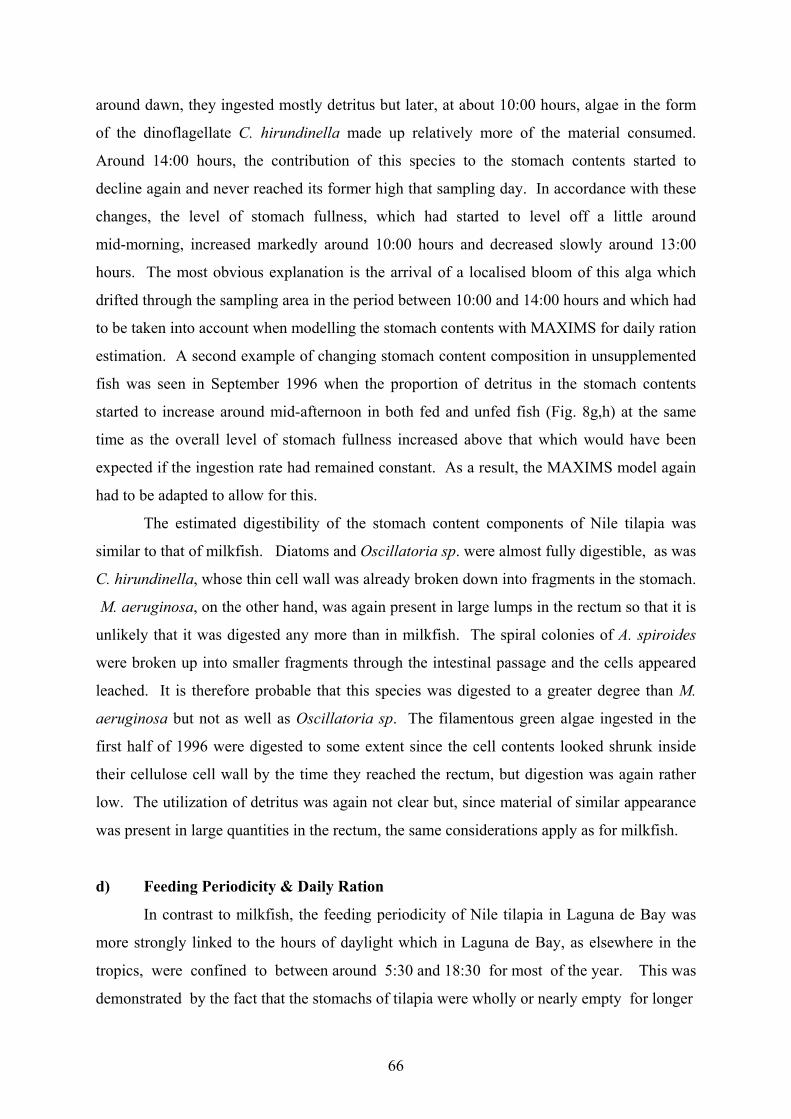
around dawn, they ingested mostly detritus but later, at about 10:00 hours, algae in the form
of the dinoflagellate C. hirundinella made up relatively more of the material consumed.
Around 14:00 hours, the contribution of this species to the stomach contents started to
decline again and never reached its former high that sampling day. In accordance with these
changes, the level of stomach fullness, which had started to level off a little around
mid-morning, increased markedly around 10:00 hours and decreased slowly around 13:00
hours. The most obvious explanation is the arrival of a localised bloom of this alga which
drifted through the sampling area in the period between 10:00 and 14:00 hours and which had
to be taken into account when modelling the stomach contents with MAXIMS for daily ration
estimation. A second example of changing stomach content composition in unsupplemented
fish was seen in September 1996 when the proportion of detritus in the stomach contents
started to increase around mid-afternoon in both fed and unfed fish (Fig. 8g,h) at the same
time as the overall level of stomach fullness increased above that which would have been
expected if the ingestion rate had remained constant. As a result, the MAXIMS model again
had to be adapted to allow for this.
The estimated digestibility of the stomach content components of Nile tilapia was
similar to that of milkfish. Diatoms and Oscillatoria sp. were almost fully digestible, as was
C. hirundinella, whose thin cell wall was already broken down into fragments in the stomach.
M. aeruginosa, on the other hand, was again present in large lumps in the rectum so that it is
unlikely that it was digested any more than in milkfish. The spiral colonies of A. spiroides
were broken up into smaller fragments through the intestinal passage and the cells appeared
leached. It is therefore probable that this species was digested to a greater degree than M.
aeruginosa but not as well as Oscillatoria sp. The filamentous green algae ingested in the
first half of 1996 were digested to some extent since the cell contents looked shrunk inside
their cellulose cell wall by the time they reached the rectum, but digestion was again rather
low. The utilization of detritus was again not clear but, since material of similar appearance
was present in large quantities in the rectum, the same considerations apply as for milkfish.
d) Feeding Periodicity & Daily Ration
In contrast to milkfish, the feeding periodicity of Nile tilapia in Laguna de Bay was
more strongly linked to the hours of daylight which in Laguna de Bay, as elsewhere in the
tropics, were confined to between around 5:30 and 18:30 for most of the year. This was
demonstrated by the fact that the stomachs of tilapia were wholly or nearly empty for longer
66
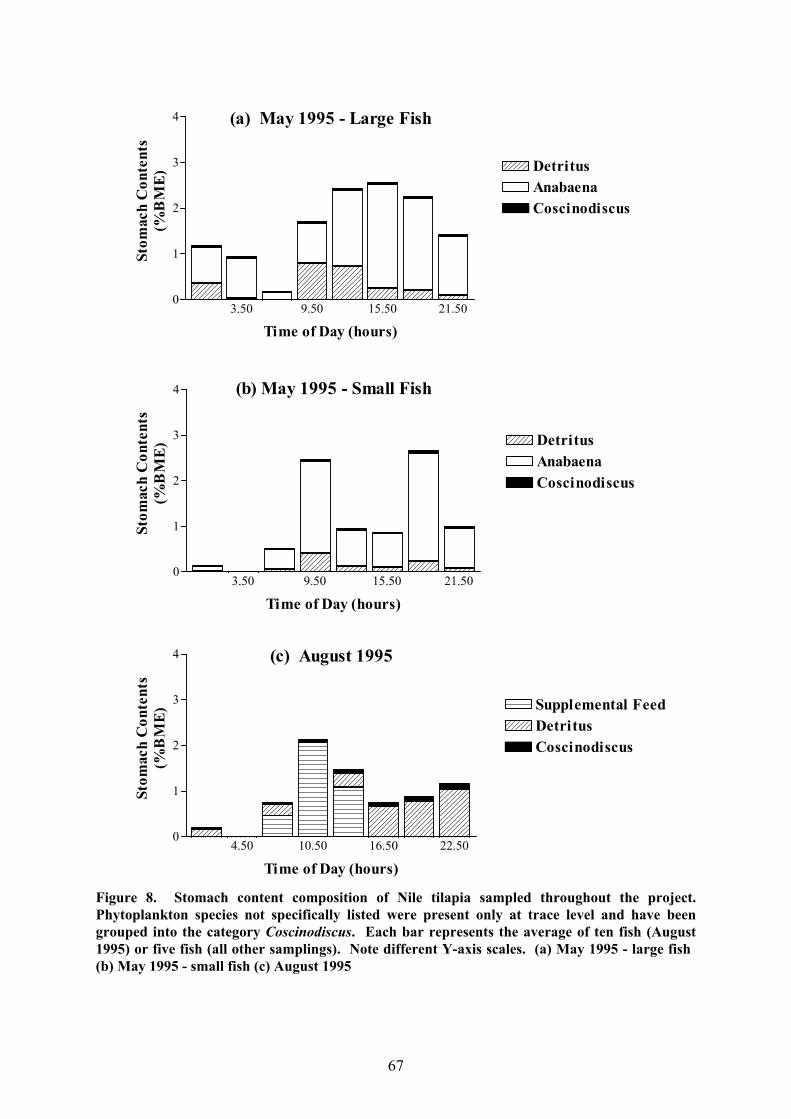
Figure 8. Stomach content composition of Nile tilapia sampled throughout the project.Phytoplankton species not specifically listed were present only at trace level and have beengrouped into the category Coscinodiscus. Each bar represents the average of ten fish (August1995) or five fish (all other samplings). Note different Y-axis scales. (a) May 1995 - large fish (b) May 1995 - small fish (c) August 1995
67
(a) May 1995 - Large Fish
3.50 9.50 15.50 21.500
1
2
3
4
DetritusAnabaenaCoscinodiscus
Time of Day (hours)
Stom
ach
Con
tent
s(%
BM
E)
(b) May 1995 - Small Fish
3.50 9.50 15.50 21.500
1
2
3
4
DetritusAnabaenaCoscinodiscus
Time of Day (hours)
Stom
ach
Con
tent
s(%
BM
E)
(c) August 1995
4.50 10.50 16.50 22.500
1
2
3
4
Supplemental FeedDetritusCoscinodiscus
Time of Day (hours)
Stom
ach
Con
tent
s(%
BM
E)

Figure 8 (cont.). Stomach content composition of Nile tilapia sampled throughout the project.Phytoplankton species not specifically listed were present only at trace level and have beengrouped into the category Coscinodiscus. Each bar represents the average of ten fish (August1995) or five fish (all other samplings). Note different Y-axis scales. (d) March 1996 (e) May1996 (f) July 1996
68
(d) March 1996
6 12 18 240.0
0.2
0.4
0.6
Zooplankton/BenthosCoscinodiscusDetritus
Time of Day (hours)
Stom
ach
Con
tent
s(%
BM
E)
(e) May 1996
6 12 18 240.0
0.2
0.4
0.6
Zooplankton/BenthosCoscinodiscusDetritus
Time of Day (hours)
Stom
ach
Con
tent
s(%
BM
E)
(f) July 1996
6 12 18 240.0
0.2
0.4
0.6
CeratiumZooplankton/BenthosCoscinodiscusDetritus
Time of Day (hours)
Stom
ach
Con
tent
s(%
BM
E)

Figure 8 (cont.). Stomach content composition of Nile tilapia sampled throughout the project.Phytoplankton species not specifically listed were present only at trace level and have beengrouped into the category Coscinodiscus. Each bar represents the average of ten fish (August1995) or five fish (all other samplings). Note different Y-axis scales. g) September 1996 -supplemented fish (h) September 1996 - unsupplemented fish (i) January 1997 - supplementedfish
69
(g) September 1996 - Fed Fish
6 12 18 240.0
0.2
0.4
0.6
Supplemental FeedZooplankton/BenthosMicrocystisCoscinodiscusDetritus
Time of Day (hours)
Stom
ach
Con
tent
s(%
BM
E)
(i) January 1997 - Fed Fish
6 12 18 240.00
0.25
0.50
0.75
Supplemental FeedCoscinodiscusZooplankton/BenthosMicrocystisDetritus
Time of Day (hours)
Stom
ach
Con
tent
s(%
BM
E)
(h) September 1996 - Unfed Fish
6 12 18 240.0
0.2
0.4
0.6
MicrocystisZooplankton/BenthosCoscinodiscusDetritus
Time of Day (hours)
Stom
ach
Con
tent
s(%
BM
E)
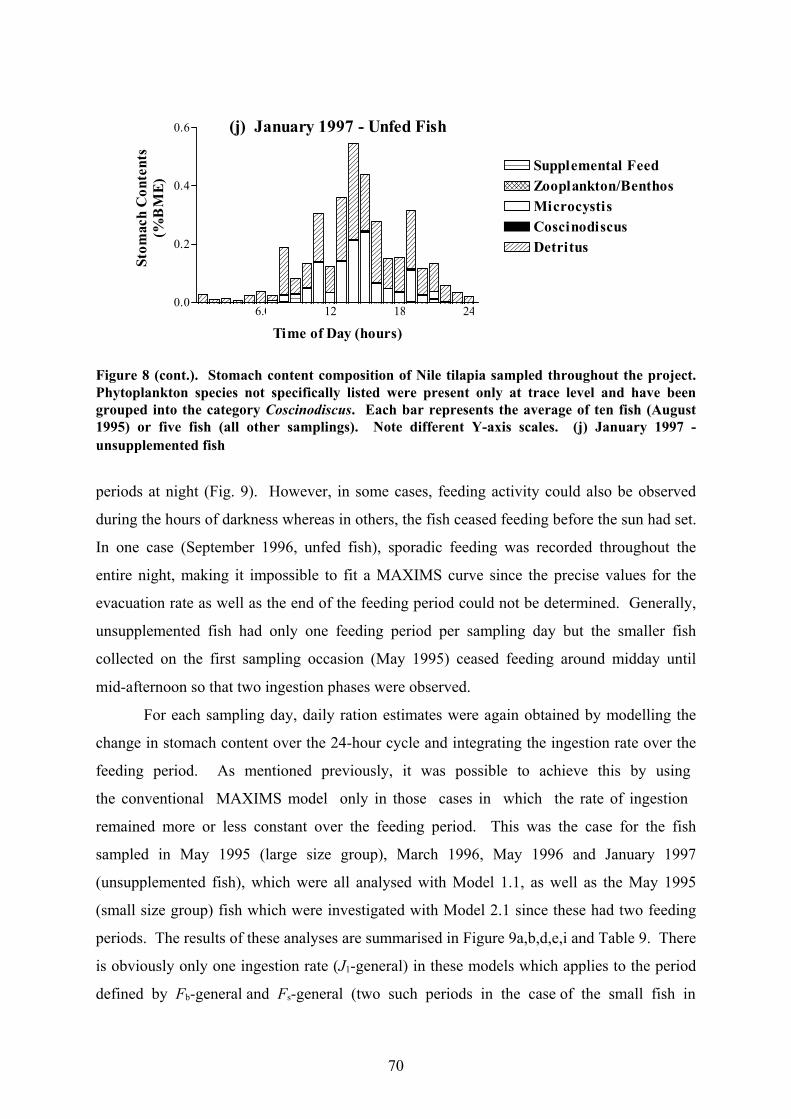
Figure 8 (cont.). Stomach content composition of Nile tilapia sampled throughout the project.Phytoplankton species not specifically listed were present only at trace level and have beengrouped into the category Coscinodiscus. Each bar represents the average of ten fish (August1995) or five fish (all other samplings). Note different Y-axis scales. (j) January 1997 -unsupplemented fish
periods at night (Fig. 9). However, in some cases, feeding activity could also be observed
during the hours of darkness whereas in others, the fish ceased feeding before the sun had set.
In one case (September 1996, unfed fish), sporadic feeding was recorded throughout the
entire night, making it impossible to fit a MAXIMS curve since the precise values for the
evacuation rate as well as the end of the feeding period could not be determined. Generally,
unsupplemented fish had only one feeding period per sampling day but the smaller fish
collected on the first sampling occasion (May 1995) ceased feeding around midday until
mid-afternoon so that two ingestion phases were observed.
For each sampling day, daily ration estimates were again obtained by modelling the
change in stomach content over the 24-hour cycle and integrating the ingestion rate over the
feeding period. As mentioned previously, it was possible to achieve this by using
the conventional MAXIMS model only in those cases in which the rate of ingestion
remained more or less constant over the feeding period. This was the case for the fish
sampled in May 1995 (large size group), March 1996, May 1996 and January 1997
(unsupplemented fish), which were all analysed with Model 1.1, as well as the May 1995
(small size group) fish which were investigated with Model 2.1 since these had two feeding
periods. The results of these analyses are summarised in Figure 9a,b,d,e,i and Table 9. There
is obviously only one ingestion rate (J1-general) in these models which applies to the period
defined by Fb-general and Fs-general (two such periods in the case of the small fish in
70
(j) January 1997 - Unfed Fish
6.0 12 18 240.0
0.2
0.4
0.6
Supplemental FeedZooplankton/BenthosMicrocystisCoscinodiscusDetritus
Time of Day (hours)
Stom
ach
Con
tent
s(%
BM
E)
Figure 9. Mean observed stomach contents ± standard deviations (;) and MAXIMS curves() for Nile tilapia sampled throughout the project. Each data point represents the average often fish (August 1995) or five fish (all other samplings). Note different Y-axis scales. (a) May1995 - large fish b) May 1995 - small fish (c) August 1995 denotes supplemental feedgiven at that time of day
71
(a) May 1995 - Large Fish
0 6 12 18 240
1
2
3
4
Time of Day (hours)
Stom
ach
Con
tent
s(%
BW
E)
(b) May 1995 - Small Fish
0 6 12 18 240
1
2
3
4
Time of Day (hours)
Stom
ach
Con
tent
s(%
BW
E)
(c) August 1995
0 6 12 18 240
1
2
3
Time of Day (hours)
Stom
ach
Con
tent
s(%
BW
E)

Figure 9 (cont.). Mean observed stomach contents ± standard deviations (;) and MAXIMScurves () for Nile tilapia sampled throughout the project. Each data point represents theaverage of ten fish (August 1995) or five fish (all other samplings). Note different Y-axis scales.(d) March 1996 (e) May 1996 (f) July 1996
72
(d) March 1996
0 6 12 18 240.0
0.2
0.4
0.6
0.8
Time of Day (hours)
Stom
ach
Con
tent
s(%
BW
E)
(e) May 1996
0 6 12 18 240.0
0.2
0.4
0.6
Time of Day (hours)
Stom
ach
Con
tent
s(%
BW
E)
(f) July 1996
0 6 12 18 240.0
0.2
0.4
0.6
Time of Day (hours)
Stom
ach
Con
tent
s(%
BW
E)
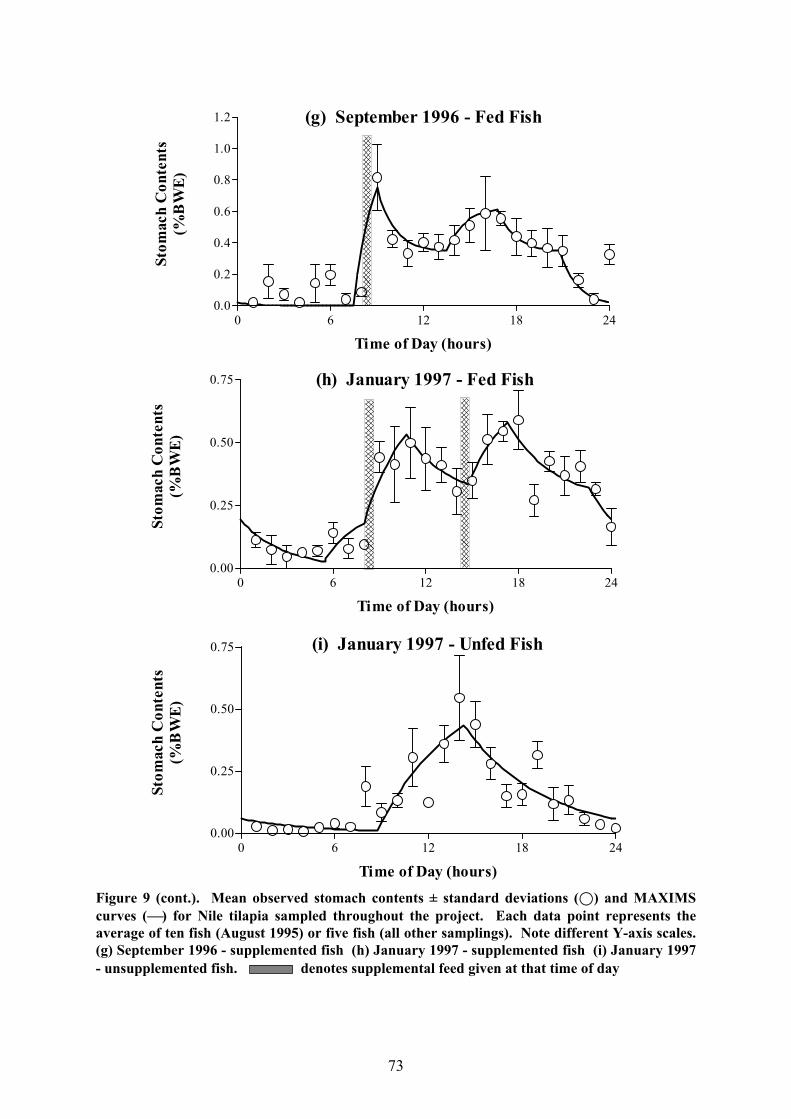
Figure 9 (cont.). Mean observed stomach contents ± standard deviations (;) and MAXIMScurves () for Nile tilapia sampled throughout the project. Each data point represents theaverage of ten fish (August 1995) or five fish (all other samplings). Note different Y-axis scales.(g) September 1996 - supplemented fish (h) January 1997 - supplemented fish (i) January 1997- unsupplemented fish. denotes supplemental feed given at that time of day
73
(g) September 1996 - Fed Fish
0 6 12 18 240.0
0.2
0.4
0.6
0.8
1.0
1.2
Time of Day (hours)
Stom
ach
Con
tent
s(%
BW
E)
(h) January 1997 - Fed Fish
0 6 12 18 240.00
0.25
0.50
0.75
Time of Day (hours)
Stom
ach
Con
tent
s(%
BW
E)
(i) January 1997 - Unfed Fish
0 6 12 18 240.00
0.25
0.50
0.75
Time of Day (hours)
Stom
ach
Con
tent
s(%
BW
E)
May 1995). The daily rations and their confidence limits have been determined in the same
way as for milkfish (App. 3).
The remaining samplings had to be treated with models specially designed for the
dataset in question in order to arrive at a daily ration estimate. For this purpose, the feeding
phase was split into several subphases (with or without non-feeding phases to separate them),
each with its own ingestion rate which was nevertheless kept constant for the subphase to
which it applied. These special models incorporated the following specific assumptions with
regard to the feeding rate:
w August 1995 (Fig. 9c) - two distinct feeding periods, ingestion rate high
(J1-feed) for the first period (Fb-feed 1 - Fs-feed 1), low (J1-general) for the
second period (Fb-general - Fs-general)
w July 1996 (Fig. 9f) - one feeding period, ingestion rate high (J1-Ceratium)
when Ceratium was ingested (Fb-Ceratium - Fs-Ceratium), low
(J1-general) at other times (Fb-general - Fb-Ceratium and Fs-Ceratium -
Fs-general)
w September 1996, supplemented fish (Fig. 9g) - one feeding period,
ingestion rate high (J1-feed) when supplemental feed was eaten (Fb-feed 1 -
Fs-feed 1), moderate (J1-detritus) when excessively large quantities of
detritus were consumed (Fb-detritus - Fs-detritus), low (J1-general) at other
times (Fs-feed 1 - Fb-detritus and Fs-detritus - Fs-general)
w January 1997, supplemented fish (Fig. 9h) - one feeding period, ingestion
rate high (J1-feed) during the two phases when feeding on supplemental
feed (Fb-feed 1 - Fs-feed 1 and Fb-feed 2 - Fs-feed 2), low (J1 - general) at
other times (Fb-general - Fb-feed 1, Fs-feed 1 - Fb-feed 2 and Fs-feed 2 -
Fs-general)
The parameter estimates and daily rations calculated with the conventional and
special models for the various sampling days are also summarised in Table 9. On those
occasions when supplemental feed was given, the separate contributions of this component
and natural food to the total ration were determined by integrating the feeding rate only over
74
that part of the feeding period during which the respective food type was consumed. As
mentioned previously, only the wet stomach weights were available for the May and August
1995 samplings. It was impossible to construct any type of model for the data set obtained in
September 1995 (unsupplemented fish) since there was no way of obtaining a reliable
evacuation rate estimate.
The average regression coefficients between back-calculated wet and observed dry
weights for the 1996 and 1997 samplings was 0.167 (range: 0.109-0.232). Despite the fact
that the dry matter content of supplemental feed is much higher than this, a comparison
between those fish with only this component in their stomachs (sampled immediately after
supplementation) and fish feeding only on natural food (sampled immediately before
supplementation) did not reveal great differences. This demonstrates that, once ingested,
supplemental feed is quickly moistened with the aid of gastric juices or water swallowed
specifically for this purpose before it can be processed. The ingestion rate and daily ration
estimates for the 1995 samplings were converted by multiplication with the factor 0.167.
None of the other parameters would have been affected and have been left unchanged. A
statistical comparison between the various sampling occasions was only possible for the
evacuation rate and the daily ration since these were the only factors common to all sampling
days. This was again done with the aid of a Tukey-Kramer test for unplanned comparisons at
a pñ0.05 significance level; the results of this analysis are included in Table 9.
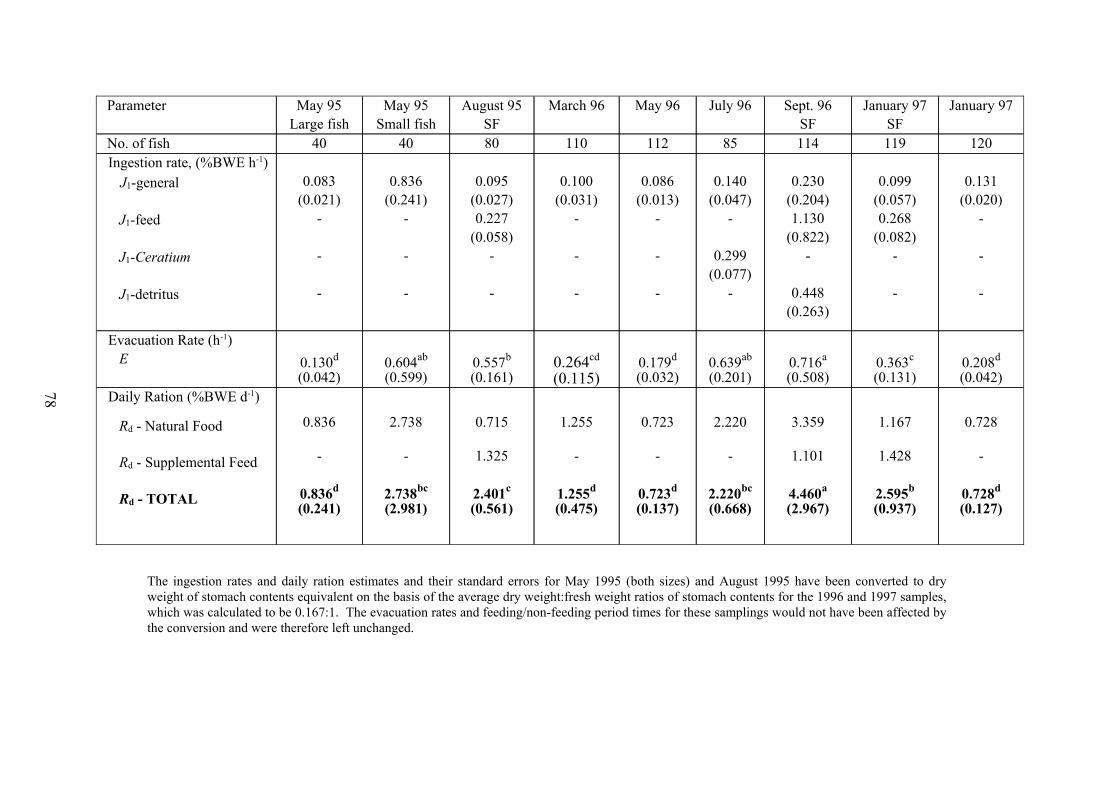
There was evidently more variation in the daily ration estimates between different
sampling days for Nile tilapia than for milkfish. In particular, the occurrence of algal blooms
(Anabaena in May 1995, Ceratium in July 1996, Microcystis in September 1997) was
reflected in the diet to a better degree: the three highest food consumption values for natural
food were recorded on these occasions and only the large fish sampled in May 1995 fell well
short of these. Supplemental feed, on the other hand, was consumed inefficiently, making up
only 65%, 25% and 55% of the total food in August 1995, September 1996 and January
1997 respectively, and even in August 1995 when comparatively least was given (5.4%
BME when converted to a [dry weight food] : [wet weight fish] basis), the fish consumed
only 1.26% BME, i.e. less than a quarter of the food provided.
75
B. Tilapia Growth & Water Quality Study
2. Water Quality
a) Secchi Depth
The Secchi depth fluctuated markedly over the study period as a whole, reaching
maximum values of 90cm and minimum values of 15cm (Fig. 10). Nevertheless, three
distinct phases can be identified in the pattern. The first phase (hereafter Phase 1) was
characterised by consistently low Secchi visibility (15cm) and lasted from the beginning of
the experiment up to the end of April when saltwater intrusion was first recorded in the lake
(SEAFDEC 1998). The spread of saline water to the study area in early May was aided by
light westerly winds around mid-May, initiating the second phase (hereafter Phase 2) in
which Secchi depth remained consistently high (90cm). This phase lasted until the end of
July when the onset of the monsoon winds stirred up the water, causing the Secchi depth to
drop to 20cm between 23. July and 12. August. Thereafter, the Secchi depth increased again
and for the remainder of the study period (hereafter Phase 3) fluctuated between 40-60cm but
never again reached its former high. In summary, the study period was divided into three
phases defined principally by environmental conditions, being separated by saltwater
intrusion in early May and the arrival of the monsoon season in early August.
b) Chlorophyll-a
There was no clear pattern in the overall Chl-a concentrations throughout the study
period; several peaks and troughs were recorded but these did not follow the three phase
pattern observed for Secchi depth. Nevertheless, once the three size fractions are analysed
separately, the three phases are once again evident (Fig. 11). In Phase 1, all Chl-a was found
in the small fraction where, despite the extremely turbid water conditions, it was sometimes
found at high levels. The results of the SEAFDEC phytoplankton samples suggest that the
most likely source of Chl-a in this fraction were small cycloid diatoms, particularly
Coscinodiscus sp. Phase 2 was characterised by the prevalence of Chl-a in the middle
fraction, probably due to Oscillatoria sp., although at the beginning of this phase, some
diatoms persisted in the small fraction. The return of turbid water conditions due to the
stirring of the lake at the beginning of Phase 3 again did not depress the overall Chl-a levels,
but this pigment was once again found mainly in the small fraction. Nevertheless, in contrast
76
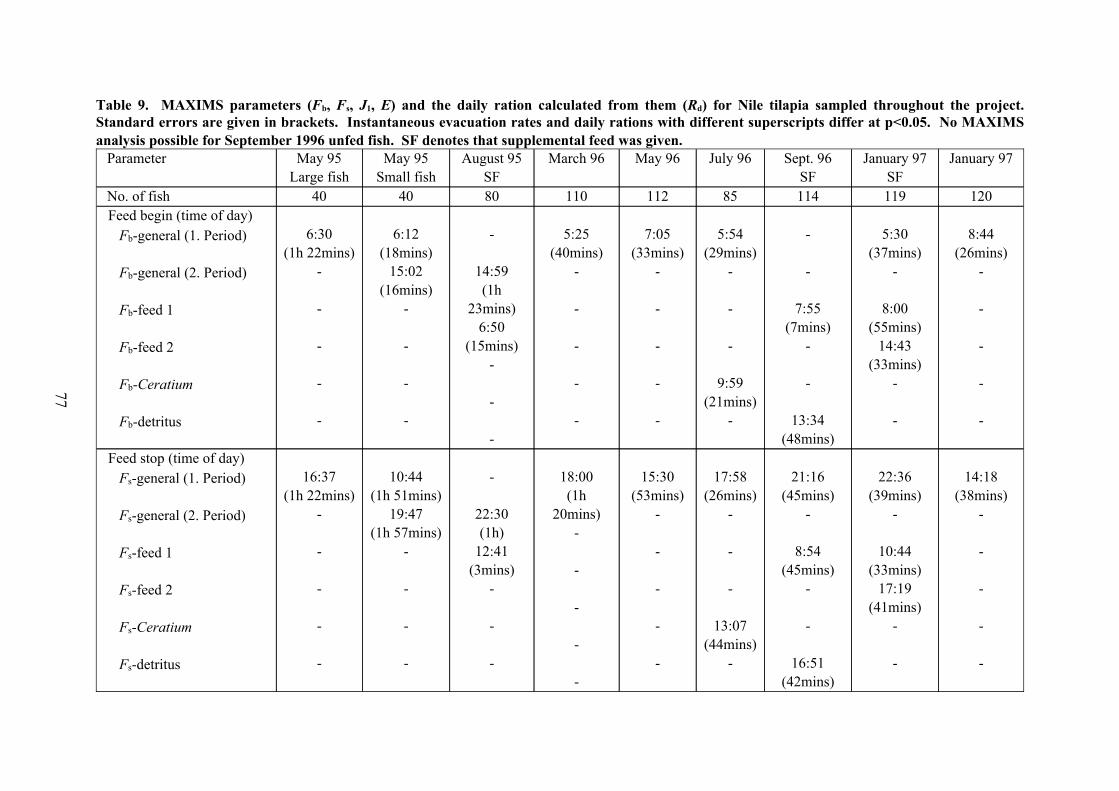
Table 9. MAXIMS parameters (Fb, Fs, J1, E) and the daily ration calculated from them (Rd) for Nile tilapia sampled throughout the project.Standard errors are given in brackets. Instantaneous evacuation rates and daily rations with different superscripts differ at p<0.05. No MAXIMSanalysis possible for September 1996 unfed fish. SF denotes that supplemental feed was given.
14:18(38mins)
-
-
-
-
-
22:36(39mins)
-
10:44(33mins)
17:19(41mins)
-
-
21:16(45mins)
-
8:54(45mins)
-
-
16:51(42mins)
17:58(26mins)
-
-
-
13:07(44mins)
-
15:30(53mins)
-
-
-
-
-
18:00(1h
20mins)-
-
-
-
-
-
22:30(1h)
12:41(3mins)
-
-
-
10:44(1h 51mins)
19:47(1h 57mins)
-
-
-
-
16:37(1h 22mins)
-
-
-
-
-
Feed stop (time of day) Fs-general (1. Period)
Fs-general (2. Period)
Fs-feed 1
Fs-feed 2
Fs-Ceratium
Fs-detritus
8:44(26mins)
-
-
-
-
-
5:30(37mins)
-
8:00(55mins)
14:43(33mins)
-
-
-
-
7:55(7mins)
-
-
13:34(48mins)
5:54(29mins)
-
-
-
9:59(21mins)
-
7:05(33mins)
-
-
-
-
-
5:25(40mins)
-
-
-
-
-
-
14:59(1h
23mins)6:50
(15mins)-
-
-
6:12(18mins)
15:02(16mins)
-
-
-
-
6:30(1h 22mins)
-
-
-
-
-
Feed begin (time of day) Fb-general (1. Period)
Fb-general (2. Period)
Fb-feed 1
Fb-feed 2
Fb-Ceratium
Fb-detritus
12011911485112110804040 No. of fish
January 97January 97SF
Sept. 96SF
July 96May 96March 96August 95SF
May 95Small fish
May 95Large fish
Parameter
77
77
0.728
-
0.728d
(0.127)
1.167
1.428
2.595b
(0.937)
3.359
1.101
4.460a
(2.967)
2.220
-
2.220bc
(0.668)
0.723
-
0.723d
(0.137)
1.255
-
1.255d
(0.475)
0.715
1.325
2.401c
(0.561)
2.738
-
2.738bc
(2.981)
0.836
-
0.836d
(0.241)
Daily Ration (%BWE d-1)
Rd - Natural Food
Rd - Supplemental Feed
Rd - TOTAL
0.208d
(0.042)0.363c
(0.131)0.716a
(0.508)0.639ab
(0.201)0.179d
(0.032)0.264cd
(0.115)0.557b
(0.161)0.604ab
(0.599)0.130d
(0.042)
Evacuation Rate (h-1) E
0.131(0.020)
-
-
-
0.099(0.057)0.268
(0.082)-
-
0.230(0.204)1.130
(0.822)-
0.448(0.263)
0.140(0.047)
-
0.299(0.077)
-
0.086(0.013)
-
-
-
0.100(0.031)
-
-
-
0.095(0.027)0.227
(0.058)-
-
0.836(0.241)
-
-
-
0.083(0.021)
-
-
-
Ingestion rate, (%BWE h-1) J1-general
J1-feed
J1-Ceratium
J1-detritus
120 119 114 85 112 110 80 40 40 No. of fish
January 97January 97SF
Sept. 96SF
July 96May 96March 96August 95SF
May 95Small fish
May 95Large fish
Parameter
The ingestion rates and daily ration estimates and their standard errors for May 1995 (both sizes) and August 1995 have been converted to dryweight of stomach contents equivalent on the basis of the average dry weight:fresh weight ratios of stomach contents for the 1996 and 1997 samples,which was calculated to be 0.167:1. The evacuation rates and feeding/non-feeding period times for these samplings would not have been affected bythe conversion and were therefore left unchanged.
78
78
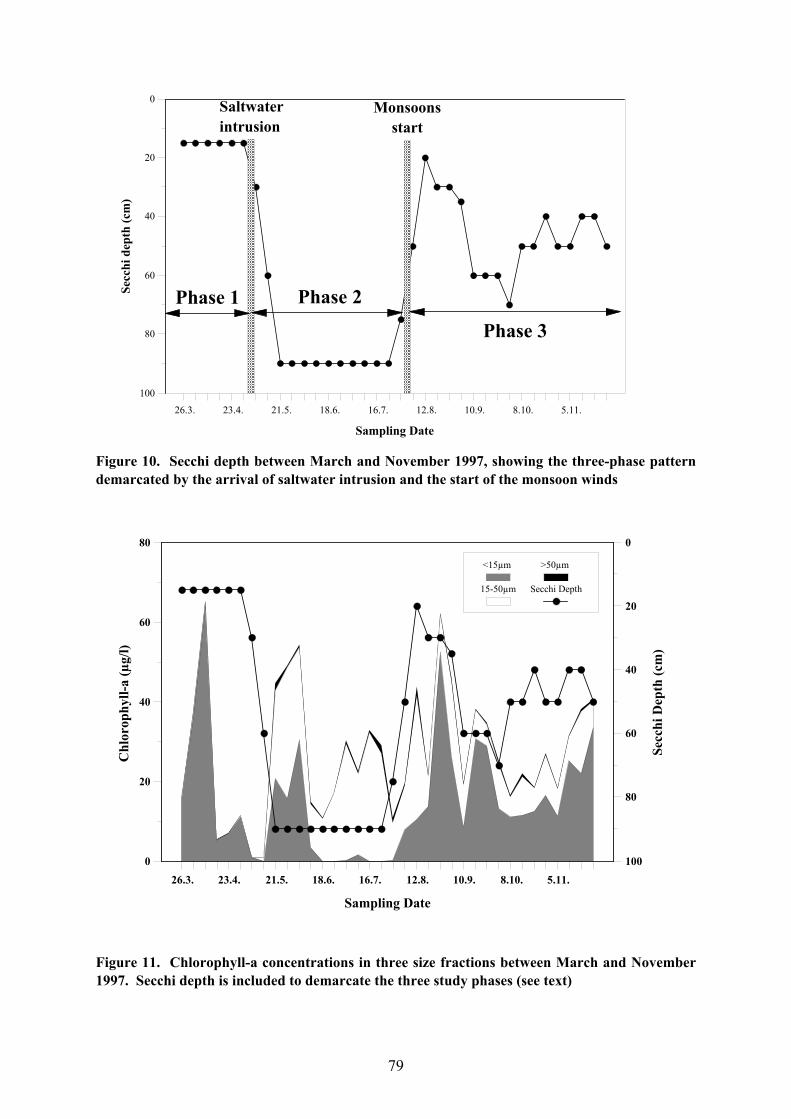
Figure 10. Secchi depth between March and November 1997, showing the three-phase patterndemarcated by the arrival of saltwater intrusion and the start of the monsoon winds
26.3. 23.4. 21.5. 18.6. 16.7. 12.8. 10.9. 8.10. 5.11.
Sampling Date
0
20
40
60
80
Chl
orop
hyll-
a (µ
g/l)
0
20
40
60
80
100
Secc
hi D
epth
(cm
)
<15µm
15-50µm
>50µm
Secchi Depth
Figure 11. Chlorophyll-a concentrations in three size fractions between March and November1997. Secchi depth is included to demarcate the three study phases (see text)
79
26.3. 23.4. 21.5. 18.6. 16.7. 12.8. 10.9. 8.10. 5.11.
Sampling Date
0
20
40
60
80
100
Secc
hi d
epth
(cm
)
Phase 1 Phase 2
Phase 3
Saltwaterintrusion
Monsoonsstart
to Phase 1, the larger algae were able to survive better under the prevailing light conditions
since Chl-a levels in the middle fraction did not drop to zero. Practically no Chl-a was found
in the large fraction throughout the entire study period.
c) Particulate Organic & Inorganic Matter
A comparison between the levels of total suspended solids between the three size
fractions shows that throughout the study period, the majority of this material was found in
the small fraction (Fig. 12a). Here, particulate inorganic matter (PIOM) always exceeded
particulate organic matter (POM), even in Phase 2 when the Secchi disk visibility was at its
highest (Fig 12b). There is, however, generally good agreement between Secchi depth and
levels of PIOM with the former peaking at times of low PIOM. This material will have been
made up not only of silt and clay particles but also of diatom shells at those times when these
were abundant.
In the middle fraction, there was very little of either POM or PIOM in Phase 1, which
indicates that practically all clay particles were <15µm and therefore found in the small
fraction (Fig. 12c). In Phases 2 and 3, PIOM rose as a result of increasing levels of diatoms.
These were the first algae to bloom immediately following saltwater intrusion (SEAFDEC
1998). POM in the middle fraction was somewhat higher in the second phase than in the
third, reflecting the higher concentrations of algae between saltwater intrusion and the return
of the monsoon season.
Levels of both POM and PIOM in the large fraction were well below those in the
other two fractions (Fig. 12d). Almost no discernible pattern can be identified; the only
characteristic peak was observed at the beginning of Phase 2, demonstrating that the diatom
bloom also had an effect on the concentration of suspended matter in the large size fraction.
The level of zooplankton was marginally higher between saltwater intrusion and the return
of turbid water but fluctuations within the three phases of the experiment were rather greater
than those between.
d) Zooplankton
The changing numbers and biomass of the three zooplankton groups are shown in Fig.
13. The copepods were evidently the dominant group, both in terms of numbers and
biomass. Although the rotifers were also well represented on a numerical basis, their
small size prevented them from ever contributing much to the biomass, the only exception
80

Figure 12. Concentration of total suspended solids in the three size fractions (a) and of particulate organic and inorganic matter in the small (b),middle (c) and large (d) size fractions between March and November 1997. Secchi depth is included in each case to demarcate the three study phases
26.3. 23.4. 21.5. 18.6. 16.7. 12.8. 10.9. 8.10. 5.11.
Sampling Date
0
1
2
Part
icul
ate
Mat
ter
(mg/
l)
0
20
40
60
80
100
Secc
hi D
epth
(cm
)
PIOM
POM
SecchiDepth
26.3. 23.4. 21.5. 18.6. 16.7. 12.8. 10.9. 8.10. 5.11.
Sampling Date
0
100
200
300
Inor
gani
c Su
spen
ded
Solid
s (m
g/l)
0
20
40
60
80
100
Secc
hi D
epth
(cm
)
<15µm
15-50µm
>50µm
Secchi Depth
26.3. 23.4. 21.5. 18.6. 16.7. 12.8. 10.9. 8.10. 5.11.
Sampling Date
0
100
200
300
Part
icul
ate
Mat
ter
(mg/
l)
0
20
40
60
80
100
Secc
hi D
epth
(cm
)
PIOM
POM
SecchiDepth
26.3. 23.4. 21.5. 18.6. 16.7. 12.8. 10.9. 8.10. 5.11.
Sampling Date
0
2
4
6
8
10
12
Part
icul
ate
Mat
ter
(mg/
l)
0
20
40
60
80
100
Secc
hi D
epth
(cm
)
PIOM
POM
SecchiDepth
(a) (b)
(c) (d)81
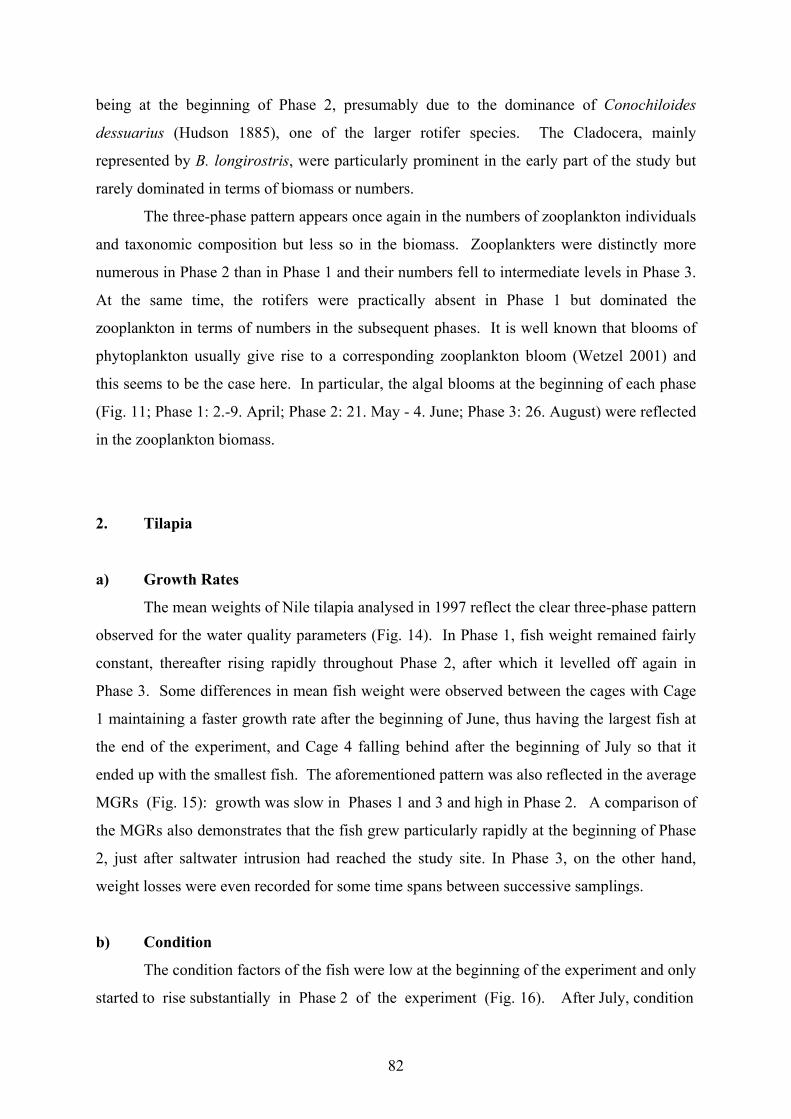
being at the beginning of Phase 2, presumably due to the dominance of Conochiloides
dessuarius (Hudson 1885), one of the larger rotifer species. The Cladocera, mainly
represented by B. longirostris, were particularly prominent in the early part of the study but
rarely dominated in terms of biomass or numbers.
The three-phase pattern appears once again in the numbers of zooplankton individuals
and taxonomic composition but less so in the biomass. Zooplankters were distinctly more
numerous in Phase 2 than in Phase 1 and their numbers fell to intermediate levels in Phase 3.
At the same time, the rotifers were practically absent in Phase 1 but dominated the
zooplankton in terms of numbers in the subsequent phases. It is well known that blooms of
phytoplankton usually give rise to a corresponding zooplankton bloom (Wetzel 2001) and
this seems to be the case here. In particular, the algal blooms at the beginning of each phase
(Fig. 11; Phase 1: 2.-9. April; Phase 2: 21. May - 4. June; Phase 3: 26. August) were reflected
in the zooplankton biomass.
2. Tilapia
a) Growth Rates
The mean weights of Nile tilapia analysed in 1997 reflect the clear three-phase pattern
observed for the water quality parameters (Fig. 14). In Phase 1, fish weight remained fairly
constant, thereafter rising rapidly throughout Phase 2, after which it levelled off again in
Phase 3. Some differences in mean fish weight were observed between the cages with Cage
1 maintaining a faster growth rate after the beginning of June, thus having the largest fish at
the end of the experiment, and Cage 4 falling behind after the beginning of July so that it
ended up with the smallest fish. The aforementioned pattern was also reflected in the average
MGRs (Fig. 15): growth was slow in Phases 1 and 3 and high in Phase 2. A comparison of
the MGRs also demonstrates that the fish grew particularly rapidly at the beginning of Phase
2, just after saltwater intrusion had reached the study site. In Phase 3, on the other hand,
weight losses were even recorded for some time spans between successive samplings.
b) Condition
The condition factors of the fish were low at the beginning of the experiment and only
started to rise substantially in Phase 2 of the experiment (Fig. 16). After July, condition
82
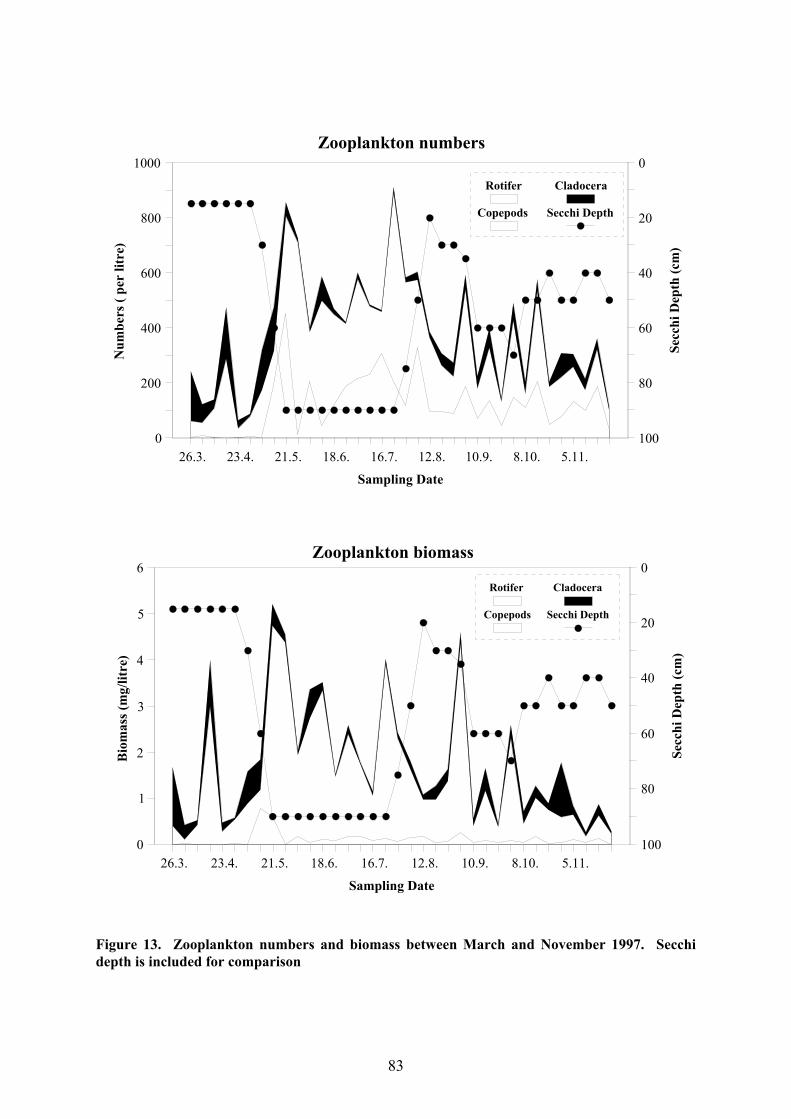
Figure 13. Zooplankton numbers and biomass between March and November 1997. Secchidepth is included for comparison
83
26.3. 23.4. 21.5. 18.6. 16.7. 12.8. 10.9. 8.10. 5.11.
Sampling Date
0
200
400
600
800
1000
Num
bers
( pe
r lit
re)
0
20
40
60
80
100
Secc
hi D
epth
(cm
)
Rotifer
Copepods
Cladocera
Secchi Depth
Zooplankton numbers
26.3. 23.4. 21.5. 18.6. 16.7. 12.8. 10.9. 8.10. 5.11.
Sampling Date
0
1
2
3
4
5
6
Bio
mas
s (m
g/lit
re)
0
20
40
60
80
100
Secc
hi D
epth
(cm
)
Rotifer
Copepods
Cladocera
Secchi Depth
Zooplankton biomass
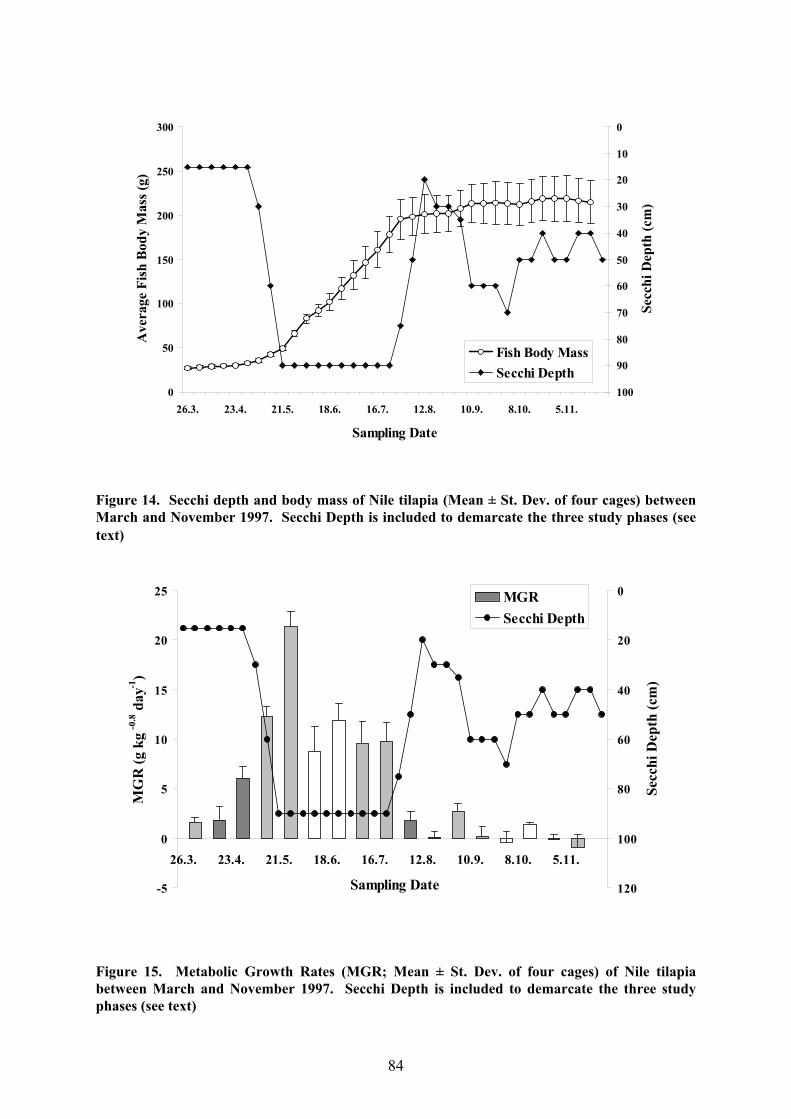
Figure 14. Secchi depth and body mass of Nile tilapia (Mean ± St. Dev. of four cages) betweenMarch and November 1997. Secchi Depth is included to demarcate the three study phases (seetext)
Figure 15. Metabolic Growth Rates (MGR; Mean ± St. Dev. of four cages) of Nile tilapiabetween March and November 1997. Secchi Depth is included to demarcate the three studyphases (see text)
84
0
50
100
150
200
250
300
26.3. 23.4. 21.5. 18.6. 16.7. 12.8. 10.9. 8.10. 5.11.
Sampling Date
Ave
rage
Fis
h B
ody
Mas
s (g)
0
10
20
30
40
50
60
70
80
90
100
Secc
hi D
epth
(cm
)
Fish Body MassSecchi Depth
-5
0
5
10
15
20
25
26.3. 23.4. 21.5. 18.6. 16.7. 12.8. 10.9. 8.10. 5.11.
Sampling Date
MG
R (g
kg
-0.8
day
-1)
0
20
40
60
80
100
120
Secc
hi D
epth
(cm
)
MGRSecchi Depth

Figure 16. Condition factors K of Nile tilapia between March and November 1997. Secchi Depthis included to demarcate the three study phases (see text)
dropped gradually throughout Phase 3, which in conjunction with the fact that growth had to
all intents ceased during this time, suggests that it is likely that the fish were living off their
reserves. Although the experiment was terminated in November, it is quite possible that
condition would have dropped more or less steadily until just before saltwater intrusion the
next year, as suggested by the results obtained for milkfish.
c) Mortality
Mortality in all cages was quite high, ranging from 20% to 52% (Fig. 17), but almost
all the mortality was observed in the first month of the experiment. This could be attributed
to an outbreak of the parasitic isopod Alitrophus typus Milne-Edwards 1840 which was in
evidence throughout large parts of the lake at the time. Indeed, the experiment had originally
been planned to start in early February but stocking was delayed because of this crustacean.
When stocking was finally carried out before the end of the infestation, it was because of
fears that the period before the expected arrival of saltwater intrusion would not be
adequately covered. Since each fish had such a large volume of water available even at the
lowest water:fish ratio (1.5 m3 fish-1 when the water depth was at a minimum of 1.5m), it is
85
3
3.2
3.4
3.6
3.8
4
4.2
4.4
4.6
26.3. 23.4. 21.5. 18.6. 16.7. 12.8. 10.9. 8.10. 5.11.
Sampling Date
Con
ditio
n Fa
ctor
(100
xBM
/SL
3 )
0
10
20
30
40
50
60
70
80
90
100
Secc
hi D
epth
(cm
)
ConditionSecchi Depth

Figure 17. Survival of Nile tilapia in four different experimental cages between March andNovember 1997
highly unlikely that the fish were competing for food. Restocking fish at any stage of the
experiment would have made the calculation of growth rates from one sampling to the next
problematic and, since the exact fish number per cage was not expected to have any effect on
fish growth at these low stocking densities, it was decided not to replace lost fish.
3. Calculation of Relative Proportions of Detritus & Phytoplankton fromChlorophyll-a & Particulate Matter
POM is made up principally of zooplankton, phytoplankton and detritus, the former
being confined mainly to the large size fraction. As demonstrated by the zooplankton
sampling, this component did not contribute much to overall POM Having quantified the
level of zooplankton as detailed above, there now remained the problem of distinguishing
between phytoplankton and detritus, particularly in the small fraction where most of the
overall POM was found. In order to achieve this, a comparison was made between POM and
Chl-a in the middle fraction in Phase 2. The underlying assumption was that during this
phase, any detritus present in this fraction should settle due to the calmer weather and
86
0
25
50
75
100
26.3. 23.4. 21.5. 18.6. 16.7. 12.8. 10.9. 8.10. 5.11.
Sampling Date
Surv
ival
(%)
Cage 1 Cage 2
Cage 3 Cage 4
possibly also due to the saltwater effect while at the same time, algal biomass would be
sufficiently high to overshadow any traces of detritus remaining in the water column.
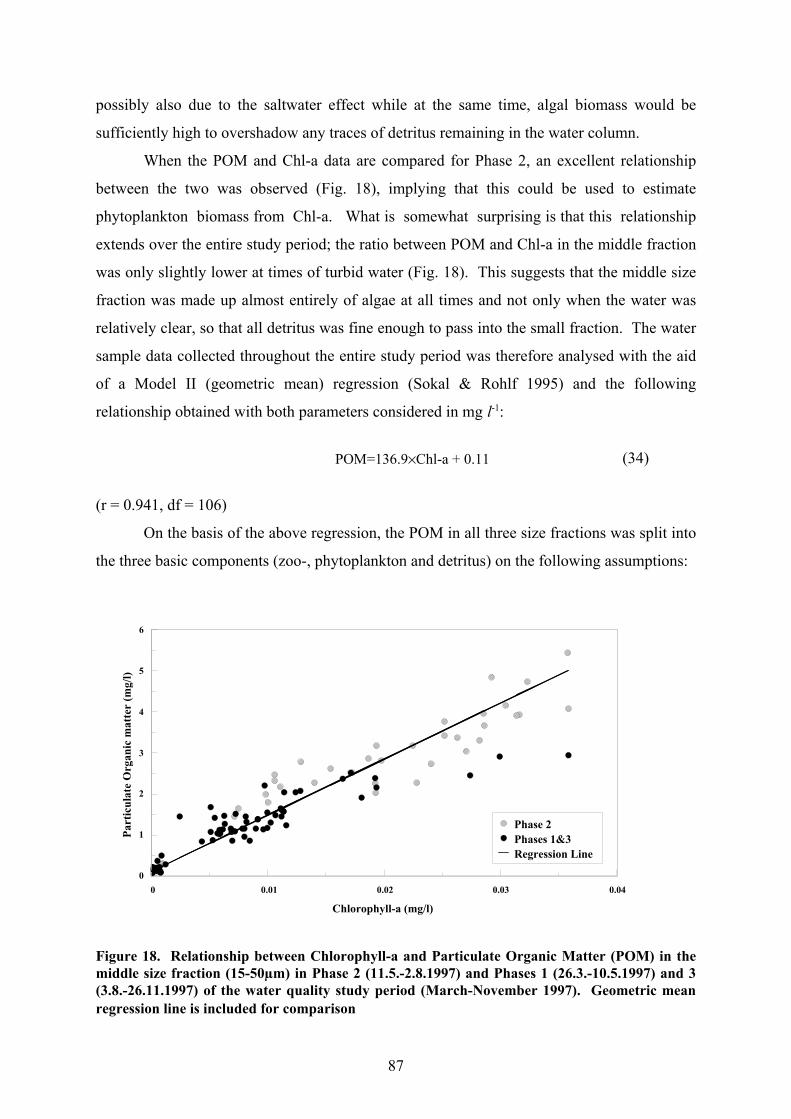
When the POM and Chl-a data are compared for Phase 2, an excellent relationship
between the two was observed (Fig. 18), implying that this could be used to estimate
phytoplankton biomass from Chl-a. What is somewhat surprising is that this relationship
extends over the entire study period; the ratio between POM and Chl-a in the middle fraction
was only slightly lower at times of turbid water (Fig. 18). This suggests that the middle size
fraction was made up almost entirely of algae at all times and not only when the water was
relatively clear, so that all detritus was fine enough to pass into the small fraction. The water
sample data collected throughout the entire study period was therefore analysed with the aid
of a Model II (geometric mean) regression (Sokal & Rohlf 1995) and the following
relationship obtained with both parameters considered in mg l-1:
(34)POM=136.9%Chl-a + 0.11
(r = 0.941, df = 106)
On the basis of the above regression, the POM in all three size fractions was split into
the three basic components (zoo-, phytoplankton and detritus) on the following assumptions:
0 0.01 0.02 0.03 0.04
Chlorophyll-a (mg/l)
0
1
2
3
4
5
6
Part
icul
ate
Org
anic
mat
ter
(mg/
l)
Phase 2Phases 1&3Regression Line
Figure 18. Relationship between Chlorophyll-a and Particulate Organic Matter (POM) in themiddle size fraction (15-50µm) in Phase 2 (11.5.-2.8.1997) and Phases 1 (26.3.-10.5.1997) and 3(3.8.-26.11.1997) of the water quality study period (March-November 1997). Geometric meanregression line is included for comparison
87

1. POM in the large fraction made up of zooplankton and larger phytoplankton
2. POM in the middle size fraction is made up entirely of algae
3. POM in the small fraction made up of phytoplankton and detritus
4. Eqn. 32 is valid also for the small fraction throughout the study period
The algal biomass in the small fraction was therefore calculated with the aid of the
above regression; the residue was attributed to detritus. All organic suspended matter in the
middle fraction was assumed to be made up of algae. Organic matter retained by the 50µm
plankton net was considered to consist of zooplankton and larger algae; the zooplankton
biomass was estimated from the microscopic counts after conversion to dry weights on the
basis of a 10:1 wet weight/dry weight ratio (Schwoerbel 1980). The phytoplankton estimates
for the middle and large size fractions were then combined for presentation purposes on the
assumption that they were equally available to tilapia.
The resulting breakdown of the organic suspended solids shows that total POM was
dominated by detritus, particularly the first phase of the experimental period (Fig. 19).
Nevertheless, in view of the results from the stomach content analysis, it is perhaps a little
surprising that no substantial differences in the level of detritus could be found between
Phases 2 and 3; if anything, there was a slight reduction in this material in the latter phase.
As indicated by the levels of Chl-a over the study period, there was no consistent pattern in
the total phytoplankton biomass enabling a distinction between the three experimental
phases; the principal difference was on the basis of size. Zooplankton contributed
comparatively little to POM at any time whereas the levels of phytoplankton fluctuated
somewhat.
88

Figure 19. Estimated composition of Particulate Organic Matter (POM) in the three size fractions on the basis of the geometric mean regressionbetween Chlorophyll-a and POM in the middle size fraction over the water quality study period (March-November 1997). Secchi depth is includedto demarcate the three study phases (see text)
89
89
26.3. 23.4. 21.5. 18.6. 16.7. 12.8. 10.9. 8.10. 5.11.
Sampling Date
0
20
40
60
Org
anic
Sus
pend
ed M
atte
r (m
g/l)
0
20
40
60
80
100
Secc
hi D
epth
(cm
)
Detritus
Algae <15µ
Algae >15µ
Zooplankton
Secchi Depth