Wong R.C.K., S.K.Y. Ma, R.H.C. Wong and Chau K.T. (2007). “Strength of concrete under direct...
10
This article was published in an Elsevier journal. The attached copy is furnished to the author for non-commercial research and education use, including for instruction at the author’s institution, sharing with colleagues and providing to institution administration. Other uses, including reproduction and distribution, or selling or licensing copies, or posting to personal, institutional or third party websites are prohibited. In most cases authors are permitted to post their version of the article (e.g. in Word or Tex form) to their personal website or institutional repository. Authors requiring further information regarding Elsevier’s archiving and manuscript policies are encouraged to visit: http://www.elsevier.com/copyright
Transcript of Wong R.C.K., S.K.Y. Ma, R.H.C. Wong and Chau K.T. (2007). “Strength of concrete under direct...
This article was published in an Elsevier journal. The attached copyis furnished to the author for non-commercial research and
education use, including for instruction at the author’s institution,sharing with colleagues and providing to institution administration.
Other uses, including reproduction and distribution, or selling orlicensing copies, or posting to personal, institutional or third party
websites are prohibited.
In most cases authors are permitted to post their version of thearticle (e.g. in Word or Tex form) to their personal website orinstitutional repository. Authors requiring further information
regarding Elsevier’s archiving and manuscript policies areencouraged to visit:
http://www.elsevier.com/copyright
Author's personal copy
Shear strength components of concrete under direct shearing
R.C.K. Wong a,⁎, S.K.Y. Ma a,1, R.H.C. Wong b, K.T. Chau b
a Schulich School of Engineering, Department of Civil Engineering, The University of Calgary, 2500 University Drive NW, Calgary, Alberta, Canada T2N 1N4b Department of Civil and Structural Engineering, Hong Kong Polytechnic University, Hong Kong, China
Received 29 July 2005; accepted 23 February 2007
Abstract
Direct shear tests on concrete specimens were conducted to investigate the shearing behaviour of the material under varying normal confiningstresses. Test results were analyzed to quantify the mobilization of shear strength components derived from hydrated cement paste–aggregateadhesion, contact friction, shear dilation, and cement–aggregate interlock along the sheared surface under direct shearing. It was found that eachcomponent has its unique response in terms of mobilized shear stress and shear displacement. In addition, different modes of failure observed inuniaxial compression, splitting tension, and direct shear tests were identified to delineate the Mohr–Coulomb failure envelope for shear strength ofconcrete material.© 2007 Elsevier Ltd. All rights reserved.
Keywords: Concrete; Hydrated cement paste–aggregate bond; Shear dilation; Friction; Interlock direct shear
1. Introduction
Shear design is one of the important criteria in design ofreinforced and prestressed concrete structural members. Differ-ent shear design methods have been developed depending on theshear transfer mechanism [1]. For example, in beam designcompression fieldmodel is used to explain the shear transfer nearsupport ends or in shorter beams with span-depth ratio rangingfrom 1 to 5. In such design cases, the compression field varies ateach beam section depending on the beam span-depth ratio andloading pattern. The shear compression failure plane iscontrolled by the orientation of the maximum shear stressderived in the compression field. Thus, the shear failure plane isnot restricted in the beam section, and could be at any inclinedangle. In design cases where the sheared section is morerestricted and the normal stress acting on the sheared section ismore uniform than those in beams, shear transfer mechanisminvolves direct shearing through the initially uncracked section.For this class of problem, shear friction approach is the preferredmethod of solution. Practical applications of direct shearing are
found in design of composite concrete beams [2], corbels [3],and offshore foundation caisson [4]. This paper focuses on sheartransfer in concrete by shear friction under direct shearing.
Shear design methods based on shear friction models (e.g.,[5–7]) require determination of shear strength envelope ofconcrete material, i.e., the relationship between the mobilizedshear stress and the applied normal stress in failure. In most ofprevious studies, shear strength of concrete was determinedfrom tests on reinforced concrete sections. The normal con-fining stress exerted at the sheared section was assumed to beequal to the forces derived from yielding of the steel rein-forcements. Mast [6] used an apparent friction angle higherthan the friction angle of concrete material to account for theadhesion developed in the transition zone between the hydratedcement paste (HCP) and the aggregates (referred to as HCP–aggregate transition zone adhesion herein) at normal confiningstresses less than 2 MPa. At such low normal confining stresses,the principal source of adhesion is the van der Waals forces ofattraction existed between the solid surfaces involved [8].Generally, the adhesive strength in the transition zone is weakerthan that in bulk HCP because water firms tend to developaround aggregates inducing a high local water-cement ratio.Hofbeck et al. [9] performed push-off tests on uncracked andcracked sections with reinforcement ratios of 0 to 2.8% or
Cement and Concrete Research 37 (2007) 1248–1256
⁎ Corresponding author. Tel.: +1 403 220 4998; fax: +1 403 282 7026.E-mail address: [email protected] (R.C.K. Wong).
1 Tel.: +1 403 220 4998; fax: +1 403 282 7026.
0008-8846/$ - see front matter © 2007 Elsevier Ltd. All rights reserved.doi:10.1016/j.cemconres.2007.02.021
Author's personal copy
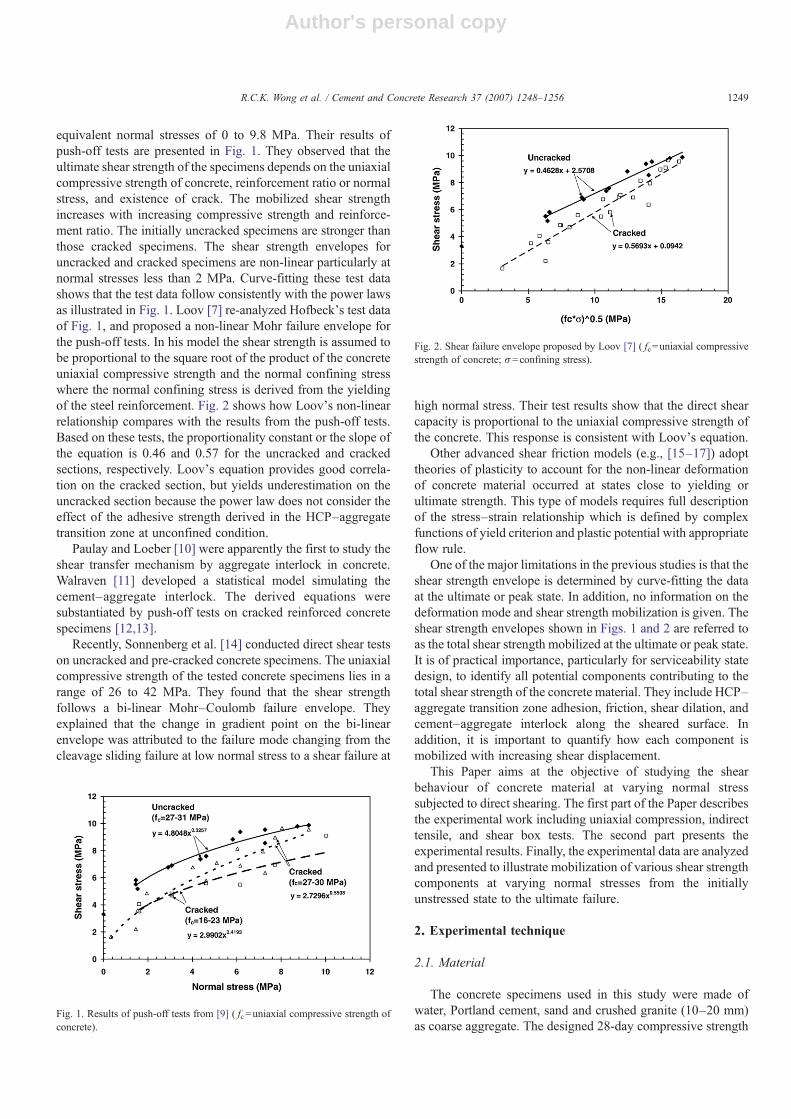
equivalent normal stresses of 0 to 9.8 MPa. Their results ofpush-off tests are presented in Fig. 1. They observed that theultimate shear strength of the specimens depends on the uniaxialcompressive strength of concrete, reinforcement ratio or normalstress, and existence of crack. The mobilized shear strengthincreases with increasing compressive strength and reinforce-ment ratio. The initially uncracked specimens are stronger thanthose cracked specimens. The shear strength envelopes foruncracked and cracked specimens are non-linear particularly atnormal stresses less than 2 MPa. Curve-fitting these test datashows that the test data follow consistently with the power lawsas illustrated in Fig. 1. Loov [7] re-analyzed Hofbeck's test dataof Fig. 1, and proposed a non-linear Mohr failure envelope forthe push-off tests. In his model the shear strength is assumed tobe proportional to the square root of the product of the concreteuniaxial compressive strength and the normal confining stresswhere the normal confining stress is derived from the yieldingof the steel reinforcement. Fig. 2 shows how Loov's non-linearrelationship compares with the results from the push-off tests.Based on these tests, the proportionality constant or the slope ofthe equation is 0.46 and 0.57 for the uncracked and crackedsections, respectively. Loov's equation provides good correla-tion on the cracked section, but yields underestimation on theuncracked section because the power law does not consider theeffect of the adhesive strength derived in the HCP–aggregatetransition zone at unconfined condition.
Paulay and Loeber [10] were apparently the first to study theshear transfer mechanism by aggregate interlock in concrete.Walraven [11] developed a statistical model simulating thecement–aggregate interlock. The derived equations weresubstantiated by push-off tests on cracked reinforced concretespecimens [12,13].
Recently, Sonnenberg et al. [14] conducted direct shear testson uncracked and pre-cracked concrete specimens. The uniaxialcompressive strength of the tested concrete specimens lies in arange of 26 to 42 MPa. They found that the shear strengthfollows a bi-linear Mohr–Coulomb failure envelope. Theyexplained that the change in gradient point on the bi-linearenvelope was attributed to the failure mode changing from thecleavage sliding failure at low normal stress to a shear failure at
high normal stress. Their test results show that the direct shearcapacity is proportional to the uniaxial compressive strength ofthe concrete. This response is consistent with Loov's equation.
Other advanced shear friction models (e.g., [15–17]) adopttheories of plasticity to account for the non-linear deformationof concrete material occurred at states close to yielding orultimate strength. This type of models requires full descriptionof the stress–strain relationship which is defined by complexfunctions of yield criterion and plastic potential with appropriateflow rule.
One of the major limitations in the previous studies is that theshear strength envelope is determined by curve-fitting the dataat the ultimate or peak state. In addition, no information on thedeformation mode and shear strength mobilization is given. Theshear strength envelopes shown in Figs. 1 and 2 are referred toas the total shear strength mobilized at the ultimate or peak state.It is of practical importance, particularly for serviceability statedesign, to identify all potential components contributing to thetotal shear strength of the concrete material. They include HCP–aggregate transition zone adhesion, friction, shear dilation, andcement–aggregate interlock along the sheared surface. Inaddition, it is important to quantify how each component ismobilized with increasing shear displacement.
This Paper aims at the objective of studying the shearbehaviour of concrete material at varying normal stresssubjected to direct shearing. The first part of the Paper describesthe experimental work including uniaxial compression, indirecttensile, and shear box tests. The second part presents theexperimental results. Finally, the experimental data are analyzedand presented to illustrate mobilization of various shear strengthcomponents at varying normal stresses from the initiallyunstressed state to the ultimate failure.
2. Experimental technique
2.1. Material
The concrete specimens used in this study were made ofwater, Portland cement, sand and crushed granite (10–20 mm)as coarse aggregate. The designed 28-day compressive strength
Fig. 1. Results of push-off tests from [9] ( fc=uniaxial compressive strength ofconcrete).
Fig. 2. Shear failure envelope proposed by Loov [7] ( fc=uniaxial compressivestrength of concrete; σ=confining stress).
1249R.C.K. Wong et al. / Cement and Concrete Research 37 (2007) 1248–1256
Author's personal copy
was about 40 MPa. The proportions of the designed mix areshown in Table 1.
The coarse aggregates were added to a concrete mixerfollowed by sand, cement, and water. The mixture was allowedto blend thoroughly for about 10 min to achieve a homogeneousstate. Then, the concrete mixture was poured into moldsmounted on a vibrating table. The cast was allowed to vibratefor about 5 min to reduce the air pores inside the mixture. Thespecimens were cured at room temperature for one day forinitial setting. Then, the specimens were removed from themolds and cured in water for 28 days. The above procedureswere applied to preparation of specimens for all tests includinguniaxial compression, indirect tensile, and shear box tests.
2.2. Uniaxial compressive strength (UCS) tests
Cylindrical metal molds of dimensions of 100×200mmwereused for concrete specimens for uniaxial compressive strengthtests. The end surfaces of the specimens were smoothenedwithin+/−0.025 mm using a grinding machine according to ASTMD2938-95 [18]. Two 66 mm TML polyester strain gauges,available from Senorcraft Technology, were mounted to thespecimen using P-2 adhesive. The vertically and horizontallymounted strain gauges were used to measure the axial and radialdeformations of the specimen, respectively.
The uniaxial compressive strength tests were carried out usingWykeham Farrance WF-55623 loading machine. A loading rateof 5 kN/min was used for all UCS tests. Data including axial load,axial and radial deformations were collected.
2.3. Indirect tensile strength tests (Brazilian tests)
For indirect tensile strength tests, cylindrical specimens of100 mm in length and 60 mm in diameter, respectively werecast. Then, the cylindrical specimens were cut into cores of30 mm in thickness according to ASTM C496-86 [18]. Aloading rate of 0.5 kN/min was applied to the test core graduallyuntil the occurrence of the first tensile crack developed acrossthe loaded diameter was observed. The maximum applied loadwas recorded using a data logger.
2.4. Direct shear tests
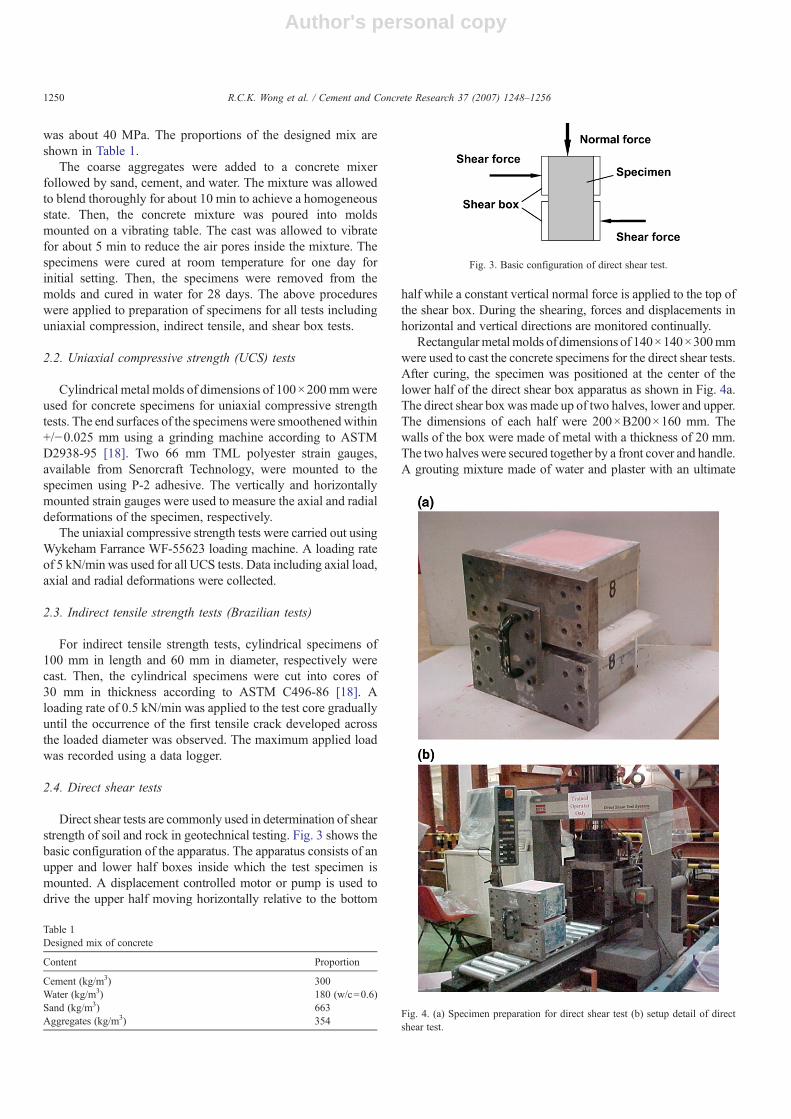
Direct shear tests are commonly used in determination of shearstrength of soil and rock in geotechnical testing. Fig. 3 shows thebasic configuration of the apparatus. The apparatus consists of anupper and lower half boxes inside which the test specimen ismounted. A displacement controlled motor or pump is used todrive the upper half moving horizontally relative to the bottom
half while a constant vertical normal force is applied to the top ofthe shear box. During the shearing, forces and displacements inhorizontal and vertical directions are monitored continually.
Rectangularmetalmolds of dimensions of 140×140×300mmwere used to cast the concrete specimens for the direct shear tests.After curing, the specimen was positioned at the center of thelower half of the direct shear box apparatus as shown in Fig. 4a.The direct shear box was made up of two halves, lower and upper.The dimensions of each half were 200×B200×160 mm. Thewalls of the box were made of metal with a thickness of 20 mm.The two halves were secured together by a front cover and handle.A grouting mixture made of water and plaster with an ultimate
Table 1Designed mix of concrete
Content Proportion
Cement (kg/m3) 300Water (kg/m3) 180 (w/c=0.6)Sand (kg/m3) 663Aggregates (kg/m3) 354
Fig. 3. Basic configuration of direct shear test.
Fig. 4. (a) Specimen preparation for direct shear test (b) setup detail of directshear test.
1250 R.C.K. Wong et al. / Cement and Concrete Research 37 (2007) 1248–1256
Author's personal copy
strength of 80 MPa was poured into the lower half to secure thespecimen inside the box. Then, the upper half was assembled tothe lower half by the front cover and handle. Dividers made of 20-mm thick Styrofoam were used to fill the gap between the upperand lower halves. Then, another batch of grouting mixture waspoured into the upper half, and allowed to cure inside at roomtemperature for 7 days to achieve the ultimate strength prior todirect shear testing.
After 7 days of curing, the Styrofoam divider was removed,and the shear box was positioned inside the servo-controlledMTS Direct Shear Machine (Fig. 4b). The machine is capable ofapplying a maximum load of 261 kN in normal (vertical) andshear (horizontal) directions. Then, a designated normal loadwas applied to the upper half of the shear box, and the specimenwas sheared at a rate of 0.05 mm/min until failure.
3. Data collection and analysis
3.1. Uniaxial compressive strength tests
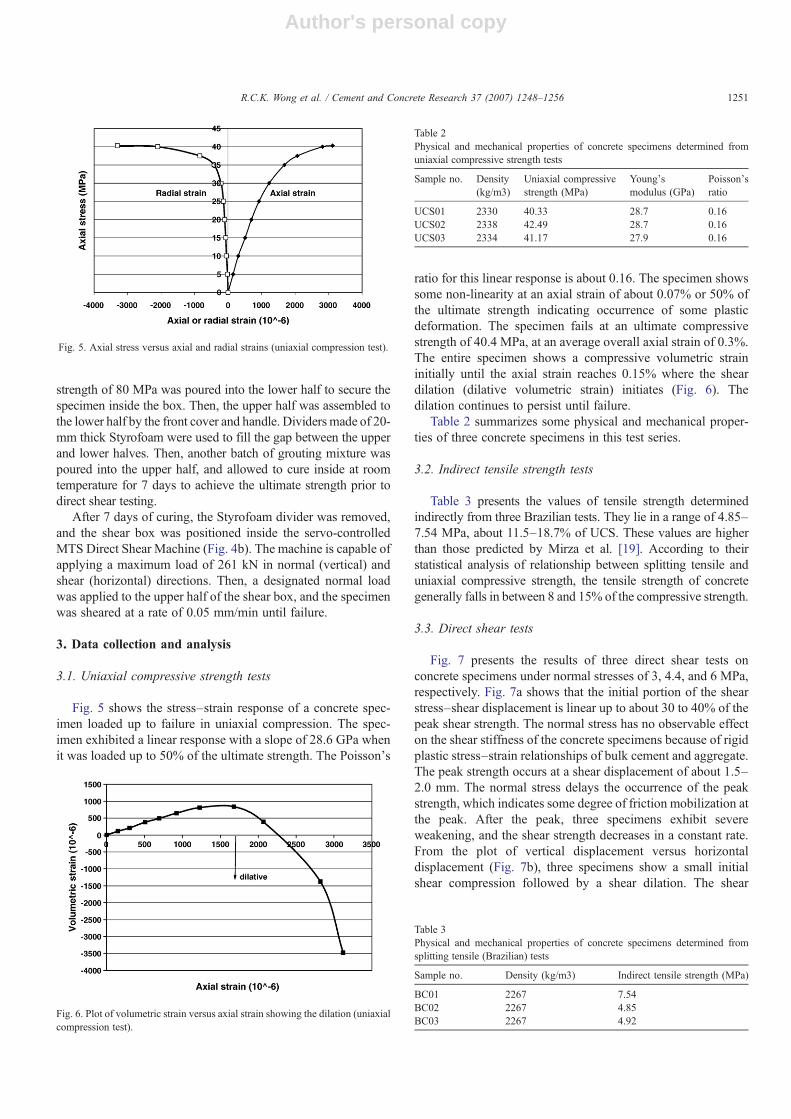
Fig. 5 shows the stress–strain response of a concrete spec-imen loaded up to failure in uniaxial compression. The spec-imen exhibited a linear response with a slope of 28.6 GPa whenit was loaded up to 50% of the ultimate strength. The Poisson's
ratio for this linear response is about 0.16. The specimen showssome non-linearity at an axial strain of about 0.07% or 50% ofthe ultimate strength indicating occurrence of some plasticdeformation. The specimen fails at an ultimate compressivestrength of 40.4 MPa, at an average overall axial strain of 0.3%.The entire specimen shows a compressive volumetric straininitially until the axial strain reaches 0.15% where the sheardilation (dilative volumetric strain) initiates (Fig. 6). Thedilation continues to persist until failure.
Table 2 summarizes some physical and mechanical proper-ties of three concrete specimens in this test series.
3.2. Indirect tensile strength tests
Table 3 presents the values of tensile strength determinedindirectly from three Brazilian tests. They lie in a range of 4.85–7.54 MPa, about 11.5–18.7% of UCS. These values are higherthan those predicted by Mirza et al. [19]. According to theirstatistical analysis of relationship between splitting tensile anduniaxial compressive strength, the tensile strength of concretegenerally falls in between 8 and 15% of the compressive strength.
3.3. Direct shear tests
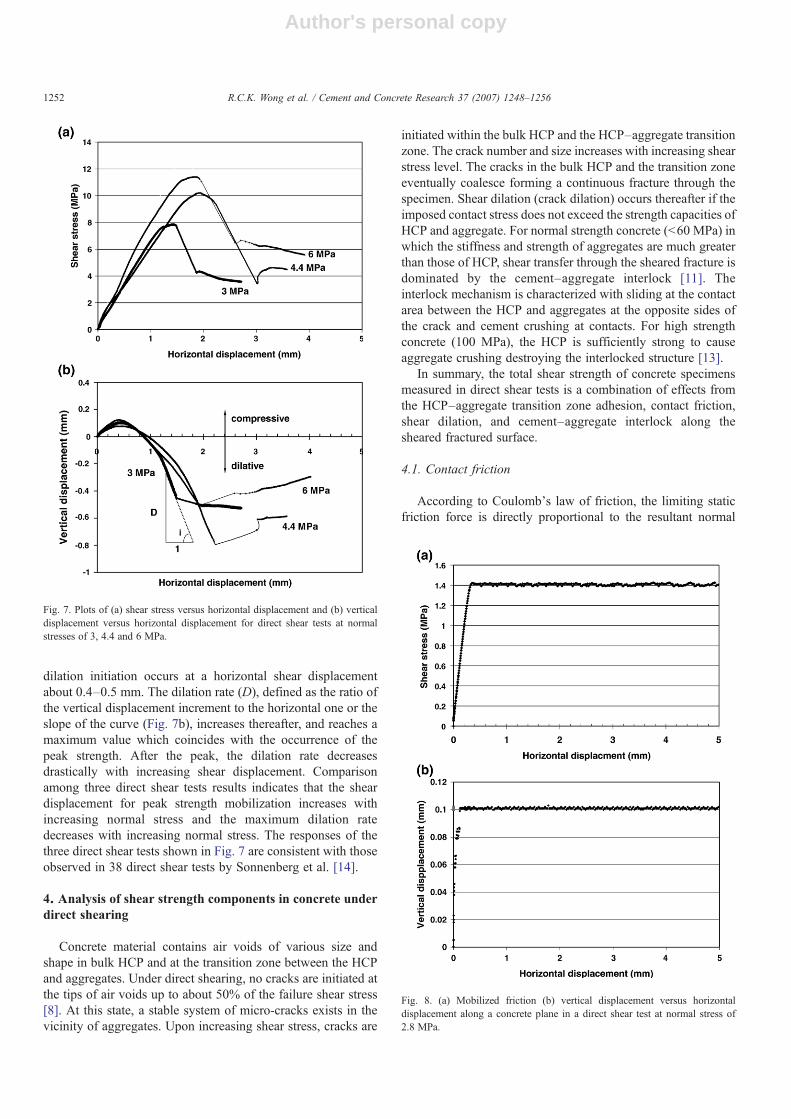
Fig. 7 presents the results of three direct shear tests onconcrete specimens under normal stresses of 3, 4.4, and 6 MPa,respectively. Fig. 7a shows that the initial portion of the shearstress–shear displacement is linear up to about 30 to 40% of thepeak shear strength. The normal stress has no observable effecton the shear stiffness of the concrete specimens because of rigidplastic stress–strain relationships of bulk cement and aggregate.The peak strength occurs at a shear displacement of about 1.5–2.0 mm. The normal stress delays the occurrence of the peakstrength, which indicates some degree of friction mobilization atthe peak. After the peak, three specimens exhibit severeweakening, and the shear strength decreases in a constant rate.From the plot of vertical displacement versus horizontaldisplacement (Fig. 7b), three specimens show a small initialshear compression followed by a shear dilation. The shear
Fig. 5. Axial stress versus axial and radial strains (uniaxial compression test).
Fig. 6. Plot of volumetric strain versus axial strain showing the dilation (uniaxialcompression test).
Table 2Physical and mechanical properties of concrete specimens determined fromuniaxial compressive strength tests
Sample no. Density(kg/m3)
Uniaxial compressivestrength (MPa)
Young'smodulus (GPa)
Poisson'sratio
UCS01 2330 40.33 28.7 0.16UCS02 2338 42.49 28.7 0.16UCS03 2334 41.17 27.9 0.16
Table 3Physical and mechanical properties of concrete specimens determined fromsplitting tensile (Brazilian) tests
Sample no. Density (kg/m3) Indirect tensile strength (MPa)
BC01 2267 7.54BC02 2267 4.85BC03 2267 4.92
1251R.C.K. Wong et al. / Cement and Concrete Research 37 (2007) 1248–1256
Author's personal copy
dilation initiation occurs at a horizontal shear displacementabout 0.4–0.5 mm. The dilation rate (D), defined as the ratio ofthe vertical displacement increment to the horizontal one or theslope of the curve (Fig. 7b), increases thereafter, and reaches amaximum value which coincides with the occurrence of thepeak strength. After the peak, the dilation rate decreasesdrastically with increasing shear displacement. Comparisonamong three direct shear tests results indicates that the sheardisplacement for peak strength mobilization increases withincreasing normal stress and the maximum dilation ratedecreases with increasing normal stress. The responses of thethree direct shear tests shown in Fig. 7 are consistent with thoseobserved in 38 direct shear tests by Sonnenberg et al. [14].
4. Analysis of shear strength components in concrete underdirect shearing
Concrete material contains air voids of various size andshape in bulk HCP and at the transition zone between the HCPand aggregates. Under direct shearing, no cracks are initiated atthe tips of air voids up to about 50% of the failure shear stress[8]. At this state, a stable system of micro-cracks exists in thevicinity of aggregates. Upon increasing shear stress, cracks are
initiated within the bulk HCP and the HCP–aggregate transitionzone. The crack number and size increases with increasing shearstress level. The cracks in the bulk HCP and the transition zoneeventually coalesce forming a continuous fracture through thespecimen. Shear dilation (crack dilation) occurs thereafter if theimposed contact stress does not exceed the strength capacities ofHCP and aggregate. For normal strength concrete (b60 MPa) inwhich the stiffness and strength of aggregates are much greaterthan those of HCP, shear transfer through the sheared fracture isdominated by the cement–aggregate interlock [11]. Theinterlock mechanism is characterized with sliding at the contactarea between the HCP and aggregates at the opposite sides ofthe crack and cement crushing at contacts. For high strengthconcrete (100 MPa), the HCP is sufficiently strong to causeaggregate crushing destroying the interlocked structure [13].
In summary, the total shear strength of concrete specimensmeasured in direct shear tests is a combination of effects fromthe HCP–aggregate transition zone adhesion, contact friction,shear dilation, and cement–aggregate interlock along thesheared fractured surface.
4.1. Contact friction
According to Coulomb's law of friction, the limiting staticfriction force is directly proportional to the resultant normal
Fig. 7. Plots of (a) shear stress versus horizontal displacement and (b) verticaldisplacement versus horizontal displacement for direct shear tests at normalstresses of 3, 4.4 and 6 MPa.
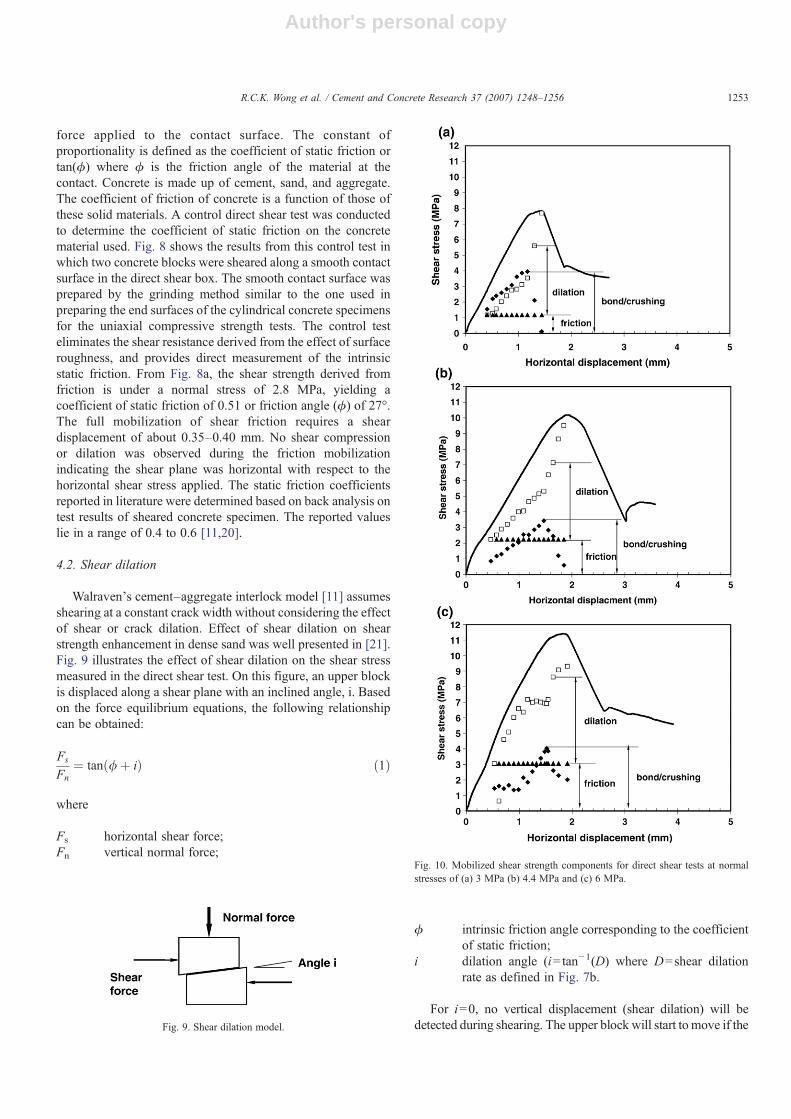
Fig. 8. (a) Mobilized friction (b) vertical displacement versus horizontaldisplacement along a concrete plane in a direct shear test at normal stress of2.8 MPa.
1252 R.C.K. Wong et al. / Cement and Concrete Research 37 (2007) 1248–1256
Author's personal copy
force applied to the contact surface. The constant ofproportionality is defined as the coefficient of static friction ortan(ϕ) where ϕ is the friction angle of the material at thecontact. Concrete is made up of cement, sand, and aggregate.The coefficient of friction of concrete is a function of those ofthese solid materials. A control direct shear test was conductedto determine the coefficient of static friction on the concretematerial used. Fig. 8 shows the results from this control test inwhich two concrete blocks were sheared along a smooth contactsurface in the direct shear box. The smooth contact surface wasprepared by the grinding method similar to the one used inpreparing the end surfaces of the cylindrical concrete specimensfor the uniaxial compressive strength tests. The control testeliminates the shear resistance derived from the effect of surfaceroughness, and provides direct measurement of the intrinsicstatic friction. From Fig. 8a, the shear strength derived fromfriction is under a normal stress of 2.8 MPa, yielding acoefficient of static friction of 0.51 or friction angle (ϕ) of 27°.The full mobilization of shear friction requires a sheardisplacement of about 0.35–0.40 mm. No shear compressionor dilation was observed during the friction mobilizationindicating the shear plane was horizontal with respect to thehorizontal shear stress applied. The static friction coefficientsreported in literature were determined based on back analysis ontest results of sheared concrete specimen. The reported valueslie in a range of 0.4 to 0.6 [11,20].
4.2. Shear dilation
Walraven's cement–aggregate interlock model [11] assumesshearing at a constant crack width without considering the effectof shear or crack dilation. Effect of shear dilation on shearstrength enhancement in dense sand was well presented in [21].Fig. 9 illustrates the effect of shear dilation on the shear stressmeasured in the direct shear test. On this figure, an upper blockis displaced along a shear plane with an inclined angle, i. Basedon the force equilibrium equations, the following relationshipcan be obtained:
Fs
Fn¼ tan /þ ið Þ ð1Þ
where
Fs horizontal shear force;Fn vertical normal force;
ϕ intrinsic friction angle corresponding to the coefficientof static friction;
i dilation angle (i=tan−1(D) where D=shear dilationrate as defined in Fig. 7b.
For i=0, no vertical displacement (shear dilation) will bedetected during shearing. The upper block will start to move if theFig. 9. Shear dilation model.
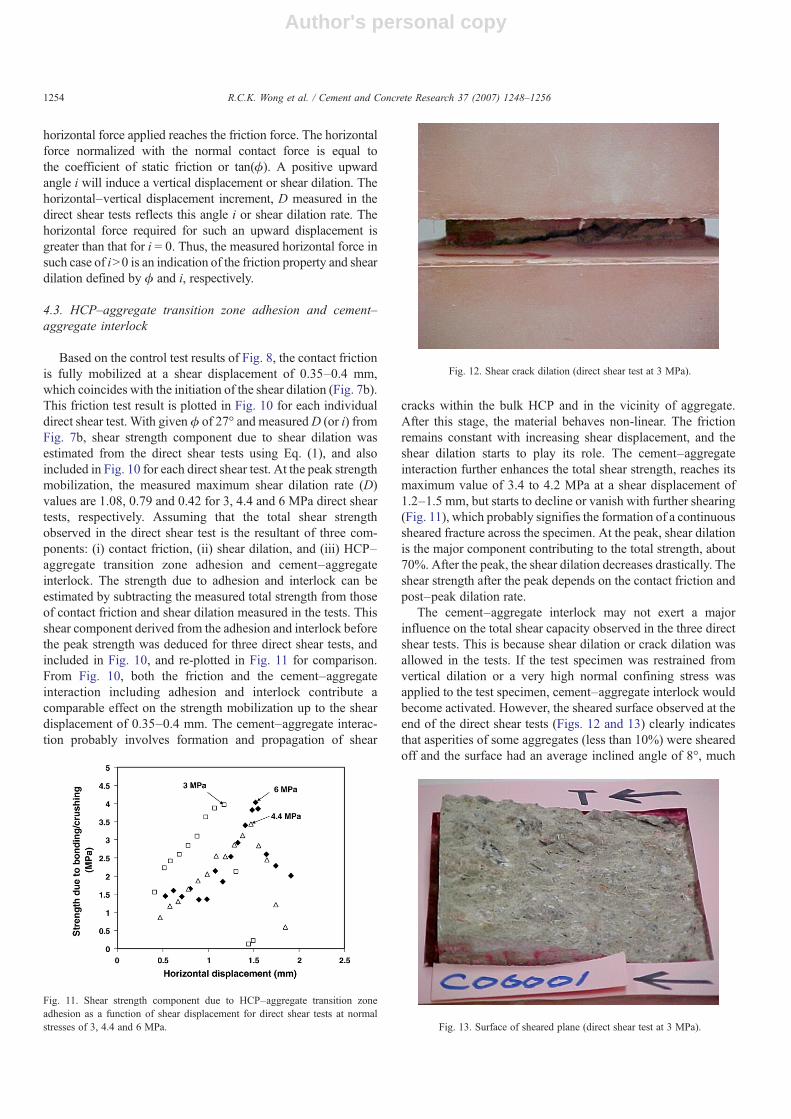
Fig. 10. Mobilized shear strength components for direct shear tests at normalstresses of (a) 3 MPa (b) 4.4 MPa and (c) 6 MPa.
1253R.C.K. Wong et al. / Cement and Concrete Research 37 (2007) 1248–1256
Author's personal copy
horizontal force applied reaches the friction force. The horizontalforce normalized with the normal contact force is equal tothe coefficient of static friction or tan(ϕ). A positive upwardangle i will induce a vertical displacement or shear dilation. Thehorizontal–vertical displacement increment, D measured in thedirect shear tests reflects this angle i or shear dilation rate. Thehorizontal force required for such an upward displacement isgreater than that for i = 0. Thus, the measured horizontal force insuch case of iN0 is an indication of the friction property and sheardilation defined by ϕ and i, respectively.
4.3. HCP–aggregate transition zone adhesion and cement–aggregate interlock
Based on the control test results of Fig. 8, the contact frictionis fully mobilized at a shear displacement of 0.35–0.4 mm,which coincides with the initiation of the shear dilation (Fig. 7b).This friction test result is plotted in Fig. 10 for each individualdirect shear test. With given ϕ of 27° and measuredD (or i) fromFig. 7b, shear strength component due to shear dilation wasestimated from the direct shear tests using Eq. (1), and alsoincluded in Fig. 10 for each direct shear test. At the peak strengthmobilization, the measured maximum shear dilation rate (D)values are 1.08, 0.79 and 0.42 for 3, 4.4 and 6 MPa direct sheartests, respectively. Assuming that the total shear strengthobserved in the direct shear test is the resultant of three com-ponents: (i) contact friction, (ii) shear dilation, and (iii) HCP–aggregate transition zone adhesion and cement–aggregateinterlock. The strength due to adhesion and interlock can beestimated by subtracting the measured total strength from thoseof contact friction and shear dilation measured in the tests. Thisshear component derived from the adhesion and interlock beforethe peak strength was deduced for three direct shear tests, andincluded in Fig. 10, and re-plotted in Fig. 11 for comparison.From Fig. 10, both the friction and the cement–aggregateinteraction including adhesion and interlock contribute acomparable effect on the strength mobilization up to the sheardisplacement of 0.35–0.4 mm. The cement–aggregate interac-tion probably involves formation and propagation of shear
cracks within the bulk HCP and in the vicinity of aggregate.After this stage, the material behaves non-linear. The frictionremains constant with increasing shear displacement, and theshear dilation starts to play its role. The cement–aggregateinteraction further enhances the total shear strength, reaches itsmaximum value of 3.4 to 4.2 MPa at a shear displacement of1.2–1.5 mm, but starts to decline or vanish with further shearing(Fig. 11), which probably signifies the formation of a continuoussheared fracture across the specimen. At the peak, shear dilationis the major component contributing to the total strength, about70%. After the peak, the shear dilation decreases drastically. Theshear strength after the peak depends on the contact friction andpost–peak dilation rate.
The cement–aggregate interlock may not exert a majorinfluence on the total shear capacity observed in the three directshear tests. This is because shear dilation or crack dilation wasallowed in the tests. If the test specimen was restrained fromvertical dilation or a very high normal confining stress wasapplied to the test specimen, cement–aggregate interlock wouldbecome activated. However, the sheared surface observed at theend of the direct shear tests (Figs. 12 and 13) clearly indicatesthat asperities of some aggregates (less than 10%) were shearedoff and the surface had an average inclined angle of 8°, much
Fig. 11. Shear strength component due to HCP–aggregate transition zoneadhesion as a function of shear displacement for direct shear tests at normalstresses of 3, 4.4 and 6 MPa.
Fig. 12. Shear crack dilation (direct shear test at 3 MPa).
Fig. 13. Surface of sheared plane (direct shear test at 3 MPa).
1254 R.C.K. Wong et al. / Cement and Concrete Research 37 (2007) 1248–1256
Author's personal copy
less than the measured peak angle (i) of 30–46° in the directshear tests. Local cement–aggregate interlock with aggregatecrushing could be developed at local contact areas subjected toextremely high concentrated stresses. Thus, the shear strengthcomponent shown in Fig. 11 is probably dominated by theHCP–aggregate transition zone adhesion. This mobilizedstrength of 3.4–4.2 MPa is about 8–10% of the UCS, whichis consistent with those observed by Sonnenberg et al. [14].
5. Discussion
5.1. Modes of failure
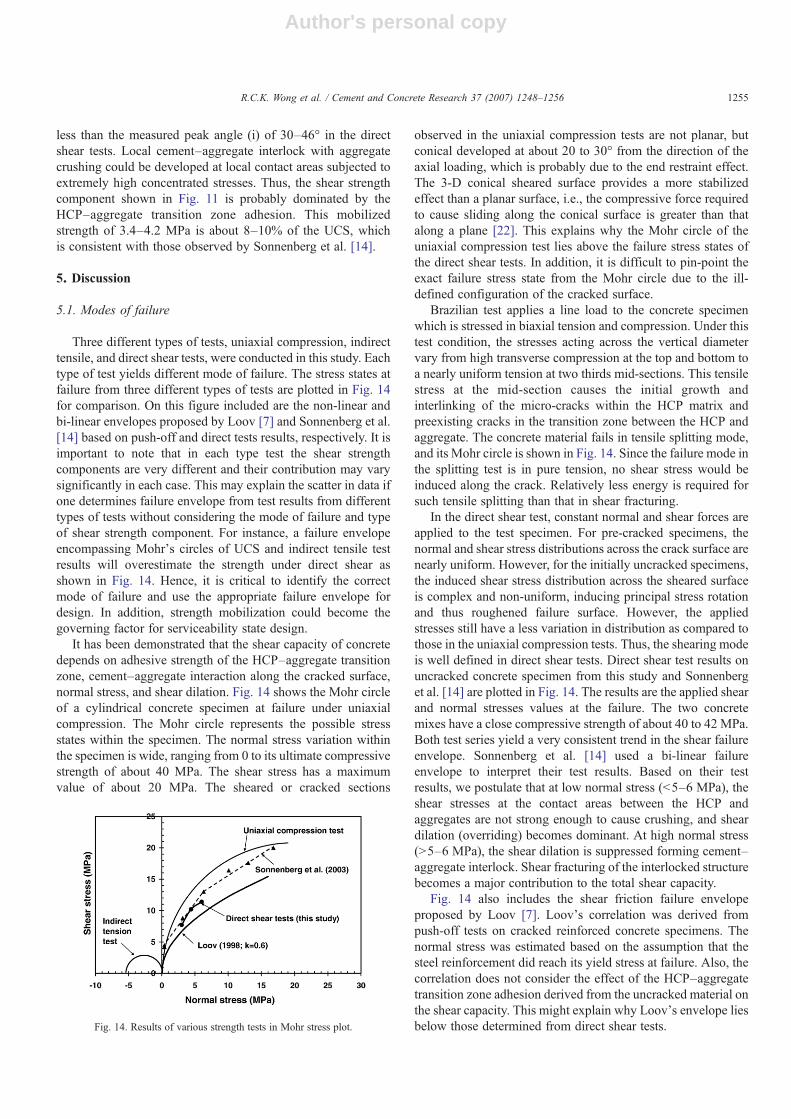
Three different types of tests, uniaxial compression, indirecttensile, and direct shear tests, were conducted in this study. Eachtype of test yields different mode of failure. The stress states atfailure from three different types of tests are plotted in Fig. 14for comparison. On this figure included are the non-linear andbi-linear envelopes proposed by Loov [7] and Sonnenberg et al.[14] based on push-off and direct tests results, respectively. It isimportant to note that in each type test the shear strengthcomponents are very different and their contribution may varysignificantly in each case. This may explain the scatter in data ifone determines failure envelope from test results from differenttypes of tests without considering the mode of failure and typeof shear strength component. For instance, a failure envelopeencompassing Mohr's circles of UCS and indirect tensile testresults will overestimate the strength under direct shear asshown in Fig. 14. Hence, it is critical to identify the correctmode of failure and use the appropriate failure envelope fordesign. In addition, strength mobilization could become thegoverning factor for serviceability state design.
It has been demonstrated that the shear capacity of concretedepends on adhesive strength of the HCP–aggregate transitionzone, cement–aggregate interaction along the cracked surface,normal stress, and shear dilation. Fig. 14 shows the Mohr circleof a cylindrical concrete specimen at failure under uniaxialcompression. The Mohr circle represents the possible stressstates within the specimen. The normal stress variation withinthe specimen is wide, ranging from 0 to its ultimate compressivestrength of about 40 MPa. The shear stress has a maximumvalue of about 20 MPa. The sheared or cracked sections
observed in the uniaxial compression tests are not planar, butconical developed at about 20 to 30° from the direction of theaxial loading, which is probably due to the end restraint effect.The 3-D conical sheared surface provides a more stabilizedeffect than a planar surface, i.e., the compressive force requiredto cause sliding along the conical surface is greater than thatalong a plane [22]. This explains why the Mohr circle of theuniaxial compression test lies above the failure stress states ofthe direct shear tests. In addition, it is difficult to pin-point theexact failure stress state from the Mohr circle due to the ill-defined configuration of the cracked surface.
Brazilian test applies a line load to the concrete specimenwhich is stressed in biaxial tension and compression. Under thistest condition, the stresses acting across the vertical diametervary from high transverse compression at the top and bottom toa nearly uniform tension at two thirds mid-sections. This tensilestress at the mid-section causes the initial growth andinterlinking of the micro-cracks within the HCP matrix andpreexisting cracks in the transition zone between the HCP andaggregate. The concrete material fails in tensile splitting mode,and its Mohr circle is shown in Fig. 14. Since the failure mode inthe splitting test is in pure tension, no shear stress would beinduced along the crack. Relatively less energy is required forsuch tensile splitting than that in shear fracturing.
In the direct shear test, constant normal and shear forces areapplied to the test specimen. For pre-cracked specimens, thenormal and shear stress distributions across the crack surface arenearly uniform. However, for the initially uncracked specimens,the induced shear stress distribution across the sheared surfaceis complex and non-uniform, inducing principal stress rotationand thus roughened failure surface. However, the appliedstresses still have a less variation in distribution as compared tothose in the uniaxial compression tests. Thus, the shearing modeis well defined in direct shear tests. Direct shear test results onuncracked concrete specimen from this study and Sonnenberget al. [14] are plotted in Fig. 14. The results are the applied shearand normal stresses values at the failure. The two concretemixes have a close compressive strength of about 40 to 42 MPa.Both test series yield a very consistent trend in the shear failureenvelope. Sonnenberg et al. [14] used a bi-linear failureenvelope to interpret their test results. Based on their testresults, we postulate that at low normal stress (b5–6 MPa), theshear stresses at the contact areas between the HCP andaggregates are not strong enough to cause crushing, and sheardilation (overriding) becomes dominant. At high normal stress(N5–6 MPa), the shear dilation is suppressed forming cement–aggregate interlock. Shear fracturing of the interlocked structurebecomes a major contribution to the total shear capacity.
Fig. 14 also includes the shear friction failure envelopeproposed by Loov [7]. Loov's correlation was derived frompush-off tests on cracked reinforced concrete specimens. Thenormal stress was estimated based on the assumption that thesteel reinforcement did reach its yield stress at failure. Also, thecorrelation does not consider the effect of the HCP–aggregatetransition zone adhesion derived from the uncracked material onthe shear capacity. This might explain why Loov's envelope liesbelow those determined from direct shear tests.Fig. 14. Results of various strength tests in Mohr stress plot.
1255R.C.K. Wong et al. / Cement and Concrete Research 37 (2007) 1248–1256
Author's personal copy
5.2. Shear reinforcement
Steel reinforcement for shear design in reinforced concretemembers is assumed to reach its yield stress. One can use theresults of direct shear tests to verify this important assumption.Consider the test results of the 6-MPa direct shear test (Fig. 7) asan illustrative example. The yield stress ( fy) and Young'smodulus (Es) of steel bars are assumed to be 345 MPa and200 GPa, respectively. The normal confining stress of 6 MPacorresponds to a steel reinforcement ratio (ρ) of 1.74% where ρis the ratio of steel reinforcement area to concrete area.Assuming that the tensile strain distribution along the embeddedsteel bar is a linear function increasing from zero at the end of itsanchored length to the yield strain at the sheared or crackedsection, the shear dilation (δv) in the sheared or cracked sectionrequired to induce yielding in steel bars is given by thefollowing equation:
dv ¼ fyEs
� �L ð2Þ
where L=reinforcement anchorage length. For L=305 mm, theshear interlocked dilation is equal to 0.53 mm. From Fig. 7b, thesteel bars do reach its yield stress at the peak strength in thiscase. However, such a dilative crack may not be acceptable toserviceability.
6. Conclusion
Shear strength mobilization observed in direct shear tests onconcrete specimens has been analyzed. The total shear strengthcomprises shear strength components derived from HCP–aggregate transition zone adhesion, contact friction, sheardilation, and cement–aggregate interlock along the shearedfractured surface. However, the behaviour in mobilization ofeach component varies and depends on the magnitude of sheardisplacement. Both HCP–aggregate transition zone adhesionand friction play a comparably important role in shear resistanceat small shear displacement up to 0.4 mm. Shear displacementof about 0.4 mm is required to fully mobilize the contactfriction, and the friction remains constant thereafter underconstant normal stress. The HCP–aggregate transition zoneadhesion (about 10% of unconfined compressive strength)becomes fully mobilized well before the peak strength, anddecreases drastically. At the stage close to the peak, sheardilation becomes dominant contributing to about 70% of thetotal shear capacity. After the peak, cement–aggregate interlockcould be developed at some local contact areas (less than 10%).Material brittle crushing along the rough sheared surfacereduces the shear dilation resulting in a severe post–peakstrength weakening. However, the cement–aggregate interlockmechanism was not dominant in the direct shear tests in thisstudy because the specimen was allowed to dilate and theapplied normal stress was not strong enough to suppress thedilation.
Acknowledgement
This study was made possible under collaboration betweenUniversity of Calgary and Hong Kong Polytechnic University.Financial supports from NSERC and PolyU Project No. GT-213are appreciated.
References
[1] ASCE-ACI committee 455, Recent approaches to shear design ofstructural concrete, Journal of Structural Engineering 124 (20) (1998)1375–1417.
[2] R.E. Loov, A.K. Patnaik, Horizontal shear strength of composite concretebeams with a rough interface, PCI Journal 39 (1) (1994) 48–65.
[3] A.H. Mattock, Design proposals for reinforced concrete corbels, PCIJournal 25 (3) (1976) 18–25.
[4] J.C. Walraven, J. Frenay, A. Pruijssers, Influence of concrete strength andload history on the shear friction capacity of concrete members, PCIJournal 32 (1) (1987) 66–84.
[5] P.W. Birkeland, H.W. Birkeland, Connections in precast concreteconstruction, Journal of The American Concrete Institute 63 (3) (1966)345–368.
[6] R.F. Mast, Auxiliary reinforcement in concrete connections, Journal of theStructural Division, ASCE 94 (ST6) (1968) 1485–1504.
[7] R.E. Loov, Review of A23.3-94 simplified method of shear design andcomparison with results using shear friction, Canadian Journal of CivilEngineering 25 (1998) 437–450.
[8] P.K. Mehta, P.J.M. Monteiro, Concrete: structure, properties, andmaterials. Prentice Hall, Englewood Cliffs, New Jersey.
[9] J.A. Hofbeck, I.O. Ibrahim, A.H. Mattock, Shear transfer in reinforcedconcrete, Journal of the American Concrete Institute 66 (2) (1969)119–128.
[10] T. Paulay, P. Loeber, Shear transfer by aggregate interlock, AmericanConcrete Institute, Special Publication SP 42–1 (1974) 1–15.
[11] J.C. Walraven, Fundamental analysis of aggregate interlock, Journal of theStructural Division, ASCE 107 (ST11) (1981) 2245–2270.
[12] J.C.Walraven, H.W. Reinhardt, Theory and experiments on the mechanicalbehaviour of cracks in plain and reinforced concrete subjected to shearloading, Heron 26 (1A) (1981) 1–68.
[13] J.C. Walraven, J. Stroband, Shear friction in high strength concrete, ACIInternational Conference on High Performance Concrete SP-149 (1994)311–330.
[14] A.M.C. Sonnenberg, R. Al-Mahaidi, G. Taplin, Behaviour of concreteunder shear and normal stresses, Magazine of Concrete Research 55 (4)(2003) 55–65.
[15] M.W. Braestrup, Plastic analysis of shear in reinforced concrete, Magazineof Concrete Research 26 (89) (1974) 221–228.
[16] M.P. Nielsen, Limit analysis and concrete plasticity, Prentice-Hall Inc,Englewood Cliffs, N.J., 1984.
[17] J.P. Zhang, Diagonal cracking and shear strength of reinforced concretebeams, Magazine of Concrete Research 49 (178) (1997) 55–65.
[18] ASTM, Volume 04.02 concrete and aggregates, American Society forTesting and Materials, 1998.
[19] S.A. Mirza, M. Hatzinikolas, J.G. MacGregor, Statistical descriptions ofthe strength of concrete, Journal of the Structural Division, ASCE 105(ST6) (1979) 1021–1037.
[20] J.G. MacGregor, F.M. Bartlett, Reinforced Concrete: Mechanics andDesign, 1st Canadian edition, Prentice Hall Canada Inc., Scarborough,Ontario, Canada, 2002.
[21] P.W. Rowe, The stress-dilatancy relation for static equilibrium of anassembly of particles in contacts, Proceedings, Royal Society of London269 (1962) 500–527.
[22] R.C.K. Wong, Mobilized strength components of oil sand in triaxialcompression, Canadian Geotechnical Journal 36 (2000) 718–735.
1256 R.C.K. Wong et al. / Cement and Concrete Research 37 (2007) 1248–1256