wodke.pdf - Humboldt-Universität zu Berlin
205
Organization and Integration of Large-scale Datasets for Designing a Metabolic Model and Re-annotating the Genome of Mycoplasma pneumoniae An Application of the Systems Biology Approach to a Minimal Bacterium DISSERTATION zur Erlangung des akademischen Grades Dr. rer. nat im Fach Biophysik eingereicht an der Mathematisch-Naturwissenschaftlichen Fakultät I Humboldt-Universität zu Berlin von M. Sc. Judith Andrea Heidrun Wodke Präsident der Humboldt-Universität zu Berlin: Prof. Dr. Jan-Hendrik Olbertz Dekan der Mathematisch-Naturwissenschaftlichen Fakultät I: Prof. Dr. Stefan Hecht Gutachter: 1. Prof. Dr. Dr. h.c. Edda Klipp 2. Prof. Dr. Luis Serrano 3. Prof. Dr. Hermann-Georg Holzhütter eingereicht am: 09.08.2012 Tag der mündlichen Prüfung: 29.10.2012
-
Upload
khangminh22 -
Category
Documents
-
view
3 -
download
0
Transcript of wodke.pdf - Humboldt-Universität zu Berlin

Organization and Integration of Large-scale Datasets forDesigning a Metabolic Model and Re-annotating the
Genome of Mycoplasma pneumoniae
An Application of the Systems Biology Approach to a Minimal Bacterium
D I S S E R T A T I O N
zur Erlangung des akademischen Grades
Dr. rer. natim Fach Biophysik
eingereicht an derMathematisch-Naturwissenschaftlichen Fakultät I
Humboldt-Universität zu Berlin
vonM. Sc. Judith Andrea Heidrun Wodke
Präsident der Humboldt-Universität zu Berlin:Prof. Dr. Jan-Hendrik Olbertz
Dekan der Mathematisch-Naturwissenschaftlichen Fakultät I:Prof. Dr. Stefan Hecht
Gutachter:1. Prof. Dr. Dr. h.c. Edda Klipp2. Prof. Dr. Luis Serrano3. Prof. Dr. Hermann-Georg Holzhütter
eingereicht am: 09.08.2012Tag der mündlichen Prüfung: 29.10.2012


Ich widme diese Arbeit dem Leben selbst,in all seinen vielfältigen Facetten


Abstract
Mycoplasma pneumoniae, one of the smallest known self-replicating organisms, isa promising model organism in systems biology when aiming to assess understand-ing of an entire living cell. One of the key steps towards this goal is the design ofmathematical models that describe the cellular processes by connecting the involvedcomponents and that allow to unravel underlying mechanisms. For Mycoplasmapneumoniae, a wealth of genome-wide datasets on genomics, transcriptomics, pro-teomics, and the metabolism has been produced in a collaborative research projectduring the past years. However, a proper system facilitating easy exchange of thegenerated information and mathematical models to integrate the different datasetsand to fill remaining knowledge gaps were lacking. In addition, the analysis ofthe metabolome was somewhat lagging behind and different in vivo observationsof metabolic behavior remained unexplained. This thesis presents a combinatorialapproach to design a metabolic model for Mycoplasma pneumoniae. First, we devel-oped a database, MyMpn, in order to provide access to structured and organizeddata, a prerequisite for successful modeling of biological systems. Second, we builta predictive, genome-scale, constraint-based metabolic model and, in parallel, weexplored the metabolome in vivo reaching unprecedented coverage of the in sil-ico predicted metabolome. We defined the biomass composition of a Mycoplasmapneumoniae cell, corrected the metabolic wiring diagram, showed that Mycoplasmapneumoniae dedicates a large proportion of its energy to cellular homeostasis, andanalyzed the metabolic behavior under different growth conditions and in deleteri-ous mutants. Finally, as suggested from the correction of the functional annotationof metabolic key enzymes and the in silico knock-out predictions, we manually re-annotated the genome of Mycoplasma pneumoniae. The database, despite not yetbeing released to the public, is internally already used for data analysis, integra-tion and visualization, as well as for the design of different mathematical models.The definition of the biomass composition of Mycoplasma pneumoniae provides thebasis for in silico growth simulations of wall-less bacteria. Unraveling the prin-ciples governing energy metabolism and adaptive capabilities upon gene deletionfacilitates the development of engineering tools and dynamic models for metabolicsub-systems. Our results highlight the impact of the reductive genome evolution onthe metabolism and especially the cellular energy balancing in a minimal bacteriumwhich reflects the high degree of adaptation to a relatively unchanging niche, thehuman lung. Furthermore, we revealed that the degree of complexity in which thegenome of Mycoplasma pneumoniae is organized far exceeds what has been consid-ered possible so far. We showed that different genes can be transcribed from thesame genomic region and identified numerous small RNAs. The 32 newly identi-fied genes together with the corrections of previously annotated genes allowed us tocorrect in total a 10% error rate in the annotation.
Keywords: Constraint-Based Modeling, Database Design, Genome Re-annotation,Metabolism, Mycoplasma pneumoniae
v


Zusammenfassung
Mycoplasma pneumoniae, einer der kleinsten lebenden Organismen, ist ein er-folgversprechender Modellorganismus der Systembiologie, um eine komplette leben-de Zelle zu verstehen. Ein wichtiger Schritt dahingehend ist die Konstruktion ma-thematischer Modelle, die zelluläre Prozesse beschreiben, indem sie die beteiligtenKomponenten vernetzen. Diese ermöglichen es, zugrundeliegende Mechanismen zuentschlüsseln. Für Mycoplasma pneumoniae wurden in einem kooperativen Projektwährend der letzten Jahre diverse genomweite Datensätze für Genomics, Trans-criptomics, Proteomics und Metabolomics produziert. Allerdings fehlten sowohl einSystem zum effizienten Informationsaustausch als auch mathematische Modelle, umdie vorhandenen Daten zu integrieren und verbleibende Wissenslücken zu füllen.Außerdem waren das Metabolome noch nicht detailliert in vivo untersucht wor-den und verschiedene Beobachtungen im metabolischen Verhalten ungeklärt. DieseDissertation präsentiert einen kombinatorischen Ansatz zur Entwicklung eines me-tabolischen Modells für Mycoplasma pneumoniae. Zuerst haben wir eine Datenbank,MyMpn, entwickelt, um Zugang zu strukturierten, organisierten Daten zu schaf-fen - eine Grundvoraussetzung für erfolgreiche Modellierung biologischer Systeme.Als nächstes haben wir ein genomweites, Constraint-basiertes metabolisches Modellmit Vorhersagekapazitäten konstruiert und parallel dazu das Metabolome in bei-spielloser Abdeckung des in silico Vorhergesagten experimentell charakterisiert. Wirhaben die Zusammensetzung einer Mycoplasma pneumoniae Zelle definiert, das me-tabolische Netzschema korrigiert, gezeigt, dass ein Grossteil der produzierten Ener-gie auf zelluläre Homeostase verwendet wird, und das Metabolismusverhalten unterverschiedenen Wachstumsbedingungen und in Gen-Knockout-Mutanten analysiert.Schließlich, suggeriert durch die Korrektur der funktionalen Annotation metabo-lischer Schlüsselenzyme und die in silico Knockoutvorhersage, haben wir manuelldas Genom von Mycoplasma pneumoniae reannotiert. Die Datenbank, obwohl nochnicht für die Öffentlichkeit zugänglich, wird bereits intern für Analyse, Integrati-on und Visualisierung von experimentellen Daten und in der Modellierung genutzt.Die Definition der Zusammensetzung der Biomasse Mycoplasma pneumoniaes legtden Grundstein für Wachstumssimulationen zellwandloser Bakterien. Die Entde-ckung der Prinzipien, die den Energiemetabolismus und die Anpassungsfähigkeitenbei Genausfall kontrollieren, erleichtert die Entwicklung von Manipulationstechni-ken und dynamischen Modellen metabolischer Teilsysteme. Unsere Ergebnisse hebenden Einfluss der reduktiven Genomevolution auf den Metabolismus und speziell dieEnergiebilanzierung eines Minimalbakteriums hervor, der die hochgradige Anpas-sung an einen gleich bleibenden Lebensraum, die menschliche Lunge, widerspiegelt.Überdies haben wir aufgedeckt, dass die Genomorganisation inMycoplasma pneumo-niae komplexer ist als bisher für möglich gehalten. Wir haben gezeigt, dass mehrereunterschiedliche Gene aus der gleichen Genomregion transkribiert werden, und eineVielzahl small RNAs identifiziert. Die Entdeckung von 32 bisher nicht annotiertenGenen und die Korrektur von diversen bereits annotierten Genen resultieren in derKorrektur einer 10%igen Fehlerrate.
Schlagwörter: Constraint-basierte Modellierung, Datenbankentwicklung, Genomrean-notation, Metabolismus, Mycoplasma pneumoniae
vii


Contents
List of Figures xi
List of Tables xiii
1. Introduction 11.1. Outline . . . . . . . . . . . . . . . . . . . . . . . . . . . . . . . . . . . . . 1
1.1.1. Objectives and Introduction into Research Projects . . . . . . . . . 11.1.2. Scope of the Thesis . . . . . . . . . . . . . . . . . . . . . . . . . . . 51.1.3. Thesis Organization . . . . . . . . . . . . . . . . . . . . . . . . . . 7
1.2. Biological Background . . . . . . . . . . . . . . . . . . . . . . . . . . . . . 81.2.1. Mycoplasma pneumoniae . . . . . . . . . . . . . . . . . . . . . . . 81.2.2. The Metabolism of M. pneumoniae . . . . . . . . . . . . . . . . . . 91.2.3. Genomics in M. pneumoniae . . . . . . . . . . . . . . . . . . . . . 11
1.3. Methodological Background . . . . . . . . . . . . . . . . . . . . . . . . . . 121.3.1. Systems Biology . . . . . . . . . . . . . . . . . . . . . . . . . . . . 121.3.2. Mathematical Modeling in Biology . . . . . . . . . . . . . . . . . . 131.3.3. Metabolomics . . . . . . . . . . . . . . . . . . . . . . . . . . . . . . 151.3.4. Genomics . . . . . . . . . . . . . . . . . . . . . . . . . . . . . . . . 171.3.5. Proteomics . . . . . . . . . . . . . . . . . . . . . . . . . . . . . . . 181.3.6. Biological Databases . . . . . . . . . . . . . . . . . . . . . . . . . . 19
1.4. Mathematical Background . . . . . . . . . . . . . . . . . . . . . . . . . . . 201.4.1. Constraint-based Modeling . . . . . . . . . . . . . . . . . . . . . . 211.4.2. Enzyme Kinetics . . . . . . . . . . . . . . . . . . . . . . . . . . . . 231.4.3. Model Parametrization . . . . . . . . . . . . . . . . . . . . . . . . . 24
2. An Interactive Database for M. pneumoniae: MyMpn 272.1. Introduction . . . . . . . . . . . . . . . . . . . . . . . . . . . . . . . . . . . 272.2. Results . . . . . . . . . . . . . . . . . . . . . . . . . . . . . . . . . . . . . . 28
2.2.1. Data Collection and Structural Design of the Database . . . . . . 282.2.2. Design and Implementation of the Database Tables . . . . . . . . . 302.2.3. Data Incorporation . . . . . . . . . . . . . . . . . . . . . . . . . . . 322.2.4. The Web Interface . . . . . . . . . . . . . . . . . . . . . . . . . . . 332.2.5. Analysis and Visualization Tools . . . . . . . . . . . . . . . . . . . 34
2.3. Discussion . . . . . . . . . . . . . . . . . . . . . . . . . . . . . . . . . . . . 36
3. Metabolome Analysis and Characterization of M. pneumoniae Metabolism 373.1. Introduction . . . . . . . . . . . . . . . . . . . . . . . . . . . . . . . . . . . 37
ix

Contents
3.2. Material and Methods . . . . . . . . . . . . . . . . . . . . . . . . . . . . . 383.2.1. Computational Procedures . . . . . . . . . . . . . . . . . . . . . . 383.2.2. Experimental Procedures . . . . . . . . . . . . . . . . . . . . . . . 43
3.3. Results . . . . . . . . . . . . . . . . . . . . . . . . . . . . . . . . . . . . . . 453.3.1. Model Construction . . . . . . . . . . . . . . . . . . . . . . . . . . 453.3.2. Metabolite Identification . . . . . . . . . . . . . . . . . . . . . . . . 473.3.3. Metabolite Quantification . . . . . . . . . . . . . . . . . . . . . . . 493.3.4. Defining the Biomass Composition of M. pneumoniae . . . . . . . 553.3.5. Model Refinement . . . . . . . . . . . . . . . . . . . . . . . . . . . 583.3.6. Model Validation . . . . . . . . . . . . . . . . . . . . . . . . . . . . 623.3.7. Model Application . . . . . . . . . . . . . . . . . . . . . . . . . . . 66
3.4. Discussion . . . . . . . . . . . . . . . . . . . . . . . . . . . . . . . . . . . . 77
4. Genome Re-annotation for Mycoplasma pneumoniae 834.1. Introduction . . . . . . . . . . . . . . . . . . . . . . . . . . . . . . . . . . . 834.2. Material and Methods . . . . . . . . . . . . . . . . . . . . . . . . . . . . . 84
4.2.1. Computational Procedures . . . . . . . . . . . . . . . . . . . . . . 844.2.2. Experimental Procedures . . . . . . . . . . . . . . . . . . . . . . . 85
4.3. Results . . . . . . . . . . . . . . . . . . . . . . . . . . . . . . . . . . . . . . 854.3.1. Transcriptome Analysis . . . . . . . . . . . . . . . . . . . . . . . . 854.3.2. In Silico Translation of the genome . . . . . . . . . . . . . . . . . . 864.3.3. Integration of In Silico and In Vivo Data . . . . . . . . . . . . . . 87
4.4. Discussion . . . . . . . . . . . . . . . . . . . . . . . . . . . . . . . . . . . . 89
5. Summarizing Discussion and Concluding Remarks 91
Appendix A. Chapter 3 Supplementary Material 97A.1. Sequence Alignments . . . . . . . . . . . . . . . . . . . . . . . . . . . . . . 97
A.1.1. Putative Succinate Dehydrogenase Subunit . . . . . . . . . . . . . 97A.1.2. Glycerol 3-phosphate Dehydrogenase/Oxidase (MPN051) . . . . . 97A.1.3. NADH Oxidase (NOX, MPN394) . . . . . . . . . . . . . . . . . . . 98A.1.4. Putative CTP Synthase . . . . . . . . . . . . . . . . . . . . . . . . 99
A.2. Comparative Calculations for M. pneumoniae and E. coli . . . . . . . . . 100A.3. Figures . . . . . . . . . . . . . . . . . . . . . . . . . . . . . . . . . . . . . 102A.4. Tables . . . . . . . . . . . . . . . . . . . . . . . . . . . . . . . . . . . . . . 107
Appendix B. Chapter 4 Supplementary Material 141B.1. Pseudocode . . . . . . . . . . . . . . . . . . . . . . . . . . . . . . . . . . . 141B.2. Tables . . . . . . . . . . . . . . . . . . . . . . . . . . . . . . . . . . . . . . 142
Bibliography 171
Acknowledgments 189
x

List of Figures
1.1. Thesis Outline . . . . . . . . . . . . . . . . . . . . . . . . . . . . . . . . . 41.2. Cellular Metabolism . . . . . . . . . . . . . . . . . . . . . . . . . . . . . . 101.3. Systems Biology . . . . . . . . . . . . . . . . . . . . . . . . . . . . . . . . 141.4. The Metabolomics Approach . . . . . . . . . . . . . . . . . . . . . . . . . 15
2.1. Workflow MyMpn Design . . . . . . . . . . . . . . . . . . . . . . . . . . 292.2. UML Class Diagram of MyMpn . . . . . . . . . . . . . . . . . . . . . . . 312.3. MyMpn Homepage . . . . . . . . . . . . . . . . . . . . . . . . . . . . . . 332.4. Mycoplasma pneumoniae Genome Browser . . . . . . . . . . . . . . . . . 35
3.1. Workflow . . . . . . . . . . . . . . . . . . . . . . . . . . . . . . . . . . . . 463.2. Metabolomics in M. pneumoniae . . . . . . . . . . . . . . . . . . . . . . . 483.3. Identified Metabolites and Proteins . . . . . . . . . . . . . . . . . . . . . . 503.4. Quantified Bases and Nucleosides . . . . . . . . . . . . . . . . . . . . . . . 513.5. NUBS Homeostasis . . . . . . . . . . . . . . . . . . . . . . . . . . . . . . . 523.6. Amino Acid Quantification . . . . . . . . . . . . . . . . . . . . . . . . . . 533.7. Fatty Acid Composition . . . . . . . . . . . . . . . . . . . . . . . . . . . . 553.8. Network Changes . . . . . . . . . . . . . . . . . . . . . . . . . . . . . . . . 593.9. In Silico Knock-Out Results . . . . . . . . . . . . . . . . . . . . . . . . . . 643.10. Transposon Insertions . . . . . . . . . . . . . . . . . . . . . . . . . . . . . 653.11. Synthetic Lethal and Sick Interactions Predicted from In Silico Double
Knock-outs . . . . . . . . . . . . . . . . . . . . . . . . . . . . . . . . . . . 663.12. Energetics . . . . . . . . . . . . . . . . . . . . . . . . . . . . . . . . . . . . 683.13. Mathematical Fittings . . . . . . . . . . . . . . . . . . . . . . . . . . . . . 713.14. Flux Changes Along the Exponential Growth Phase . . . . . . . . . . . . 723.15. In Vivo Flux Analysis . . . . . . . . . . . . . . . . . . . . . . . . . . . . . 743.16. Metabolic Overview . . . . . . . . . . . . . . . . . . . . . . . . . . . . . . 763.17. Glycolysis in M. pneumoniae . . . . . . . . . . . . . . . . . . . . . . . . . 78
4.1. Workflow Genomics Anlysis . . . . . . . . . . . . . . . . . . . . . . . . . . 844.2. Genome Structure . . . . . . . . . . . . . . . . . . . . . . . . . . . . . . . 864.3. Gene Functionality Analysis . . . . . . . . . . . . . . . . . . . . . . . . . . 88
A.1. Model Map . . . . . . . . . . . . . . . . . . . . . . . . . . . . . . . . . . . 102A.2. Metabolite Assays . . . . . . . . . . . . . . . . . . . . . . . . . . . . . . . 103A.3. Nucleoside Conversions . . . . . . . . . . . . . . . . . . . . . . . . . . . . . 103A.4. Amino Acid Analysis . . . . . . . . . . . . . . . . . . . . . . . . . . . . . . 104
xi

List of Figures
A.5. Fatty Acid Analysis . . . . . . . . . . . . . . . . . . . . . . . . . . . . . . 104A.6. FAD-binding Fingerprint . . . . . . . . . . . . . . . . . . . . . . . . . . . . 105A.7. 13C-flux Measurements . . . . . . . . . . . . . . . . . . . . . . . . . . . . . 105A.8. Protein-Flux-Alignment . . . . . . . . . . . . . . . . . . . . . . . . . . . . 106A.9. pH Rebuffering Experiment . . . . . . . . . . . . . . . . . . . . . . . . . . 106
xii

List of Tables
3.1. Biomass Composition . . . . . . . . . . . . . . . . . . . . . . . . . . . . . 563.2. Growth on Alternative Sugars . . . . . . . . . . . . . . . . . . . . . . . . . 623.3. Statistics of the Gene Essentiality Prediction . . . . . . . . . . . . . . . . 63
A.1. Reaction List . . . . . . . . . . . . . . . . . . . . . . . . . . . . . . . . . . 116A.2. Reaction Reversibilities . . . . . . . . . . . . . . . . . . . . . . . . . . . . 117A.3. Branching Metabolites . . . . . . . . . . . . . . . . . . . . . . . . . . . . . 119A.4. Experimentally Identified Metabolites . . . . . . . . . . . . . . . . . . . . 120A.5. Retention Times for NUBS and cholesterol . . . . . . . . . . . . . . . . . 121A.6. Retention Times for Amino Acids . . . . . . . . . . . . . . . . . . . . . . . 121A.7. Amino Acid Quantification . . . . . . . . . . . . . . . . . . . . . . . . . . 122A.8. Variables for Metabolite Fittings . . . . . . . . . . . . . . . . . . . . . . . 122A.9. Growth Constraints . . . . . . . . . . . . . . . . . . . . . . . . . . . . . . 123A.10.Qualitative In Silico Knock-out Results . . . . . . . . . . . . . . . . . . . 124A.11.Functional Orthologs of M. pneumoniae and M. genitalium . . . . . . . . 127A.12.Transposon Primer . . . . . . . . . . . . . . . . . . . . . . . . . . . . . . . 128A.13.In Silico Double Knock-outs . . . . . . . . . . . . . . . . . . . . . . . . . . 132A.14.Energetic Expenditures in M. pneumoniae . . . . . . . . . . . . . . . . . . 132A.15.In Silico Fluxes of M. pneumoniae . . . . . . . . . . . . . . . . . . . . . . 137A.16.Fitting Parameters for One-phase Exponential Decay Functions . . . . . . 138A.17.Fitting Parameters for Two-phase Exponential Decay Functions . . . . . . 138A.18.Comparative Calculations for M. pneumoniae and E. coli . . . . . . . . . 139
B.1. Genome Re-annotation . . . . . . . . . . . . . . . . . . . . . . . . . . . . . 156B.2. Newly and Re-annotated ORFs . . . . . . . . . . . . . . . . . . . . . . . . 157B.3. Molecular Weight of M. pneumoniae Proteins . . . . . . . . . . . . . . . . 170B.4. COG Categories . . . . . . . . . . . . . . . . . . . . . . . . . . . . . . . . 170
xiii


1. Introduction
1.1. Outline1.1.1. Objectives and Introduction into Research ProjectsSystems biology is a rapidly emerging research field aiming to understand biological sys-tems by bringing together knowledge from the different natural sciences [Auyang, 1999,Kitano, 2001]. It tackles the general aim of biology, science of life and living organ-isms, by applying the holism approach, i.e. by putting together information on differentsystem components rather than taking them apart (reductionism approach) [Auyang,1999, Oshry, 2007]. Thus, probably the greatest challenge within systems biology isthe understanding and computational simulation of a complete organism. Despite thetechnological advances on the field of experimental methods and computational analysistools, understanding of a multicellular organism, even a small one, is still not amenable.In contrast, the analysis of bacteria, prokaryotic organisms, on a genome-scale has be-come possible, providing insight into the basic principles of life common to all cells,regardless of the organism they compose or belong to. In addition to the putatively eas-ier analysis when compared to more complex cells such as yeast, new treatment strategiescan be developed based on the study of bacterial cells, pathogenic for humans, leadingto advances in health care [Gallagher et al., 2007].In 1962 Morowitz and Tourtellotte published an article on mycoplasmas, cell wall-less
minimal bacteria, as the smallest living organisms [Morowitz and Tourtellotte, 1962].Since then the research interest in mycoplasmas as minimal model organisms has beenincreasing constantly and gained special attention when the first whole-genome sequenc-ing techniques were developed [Fraser et al., 1995, Himmelreich et al., 1996] and withthe discovery of their ability to invade host cells [Andreev et al., 1995]. Mycoplasmapneumoniae (M. pneumoniae), an obligate human parasite preferentially colonizing thepulmonary epithelium and associated with a variety of diseases [Chiner et al., 2003,Waites and Talkington, 2004], has a genome size of 816,394 base pairs coding for only689 proteins [Himmelreich et al., 1996, Dandekar et al., 2000]. Contrary to other my-coplasmas, it can be grown relatively easy under laboratory conditions without additionof host cells, thus facilitating its experimental exploration.In a joint attempt to understand an organism in its entirety, a multidisciplinary re-
search project applying the systems biology approach to the minimal model organismM. pneumoniae has been initiated. Several genome-wide datasets on genomics, tran-scriptomics, proteomics, and the metabolism have been produced during the past years[Yus et al., 2012, Güell et al., 2009, 2011, Kühner et al., 2009, Maier et al., 2011, vanNoort et al., 2012, Yus et al., 2009]. The diversity of those large-scale datasets offers
1

1. Introduction
a great opportunity to obtain systems level understanding of this minimal bacteriumand to approach computational simulation of a whole cell. To this end, the differentcell components, such as DNA, RNAs, proteins, and metabolites, have to be identified,if possible quantified, and placed in their dynamic network context [Kitano, 2001]. Awide variety of different mathematical modeling approaches, for example Boolean net-works, constraint-based approaches, and dynamic approaches using partial or ordinarydifferential equations (PDEs or ODEs), can be employed for this aim [Klipp et al.,2005]. However, information exchange between the research groups involved in the ’my-coplasma project’ was not optimized and mathematical models for the different cellularsub-systems, connecting the wealth of available data, were lacking.One of the most important cellular sub-systems is the metabolism, which can be de-
fined as the particular sets of biochemical reactions that, taking place in the cells, sustainlife of every living organism [Alberts et al., 2008]. The constant performance of biochem-ical reactions allows the cell to create and maintain order in a universe that continuouslyevolves towards greater disorder. For survival and proliferation the cell needs to produceenergy and to newly synthesize and maintain the different cell components. Therefore,the biochemical reactions form mostly linear series, the metabolic pathways, in whichthe product of one reaction is the substrate of the following reaction. Two general typesof pathways can be distinguished: catabolic and anabolic pathways. Catabolic path-ways break down nutrients into smaller molecules, thus providing cell building blocksand energy, while anabolic pathways use the produced energy for the synthesis of cellcomponents. The different pathways are linked to each other, thus forming the metabolicnetwork of a cell [Alberts et al., 2008].The reduced genome of M. pneumoniae is accompanied by a lean metabolic network
[Himmelreich et al., 1996, Dandekar et al., 2000, Yus et al., 2009]. The lack of nearlyall anabolic pathways known from more complex organisms highly facilitates the directconnection of extracellular nutrient depletion to cellular processes [Yus et al., 2009]. Inaddition, most building blocks for the cell components, such as nucleobases, amino acidsand fatty acids, have to be taken up from the environment. For energy production M.pneumoniae relies on glycolysis and organic acid fermentation due to the absence of acitric acid cycle and a functional respiratory chain [Himmelreich et al., 1996, Dandekaret al., 2000, Yus et al., 2009]. As a result, this reduced metabolic network limits thechemical diversity of metabolites and the small cell size of M. pneumoniae limits theabundances of all molecules.Advances in analytical techniques monitoring cellular macromolecules, for example
mRNAs, proteins or metabolites, allow the determination and quantification of suchmolecules on a large scale, establishing the ”-omics” approach for the analysis of bi-ological systems. The high-throughput analysis of proteins (proteomics) and mRNAs(transcriptomics) facilitated new insights into cellular processes, such as transcription,translation, protein regulation, and metabolism. The study of cellular metabolites on aglobal scale (metabolomics), despite having shown to provide valuable information onthe phenotypic state of biological systems [Cornish-Bowden and Cárdenas, 2000, Nichol-son and Lindon, 2008, Buescher et al., 2012], is lagging behind due to several factors.In contrast to proteins and mRNAs which are produced from a limited set of build-
2

1.1. Outline
ing blocks, metabolites are chemically diverse and of very different abundances. Thus,it is technically impossible to address all of them using a single analytical approach[Goodacre et al., 2004, Liberman et al., 2012]. In addition, metabolites are often un-stable or short-lived due to rapid processing in the cellular context, thus posing greatchallenges for sample preparation and processing [Scalbert et al., 2009, van Gulik, 2010].Following the general trend in ”-omics” analyses of other organisms, the metabolomeof M. pneumoniae, contrary to the genome, the transcriptome, and the proteome, hasneither been characterized nor quantified yet.The decision which modeling approach to use depends on the size of the analyzed sys-
tem, i.e. the balance between model complexity (manageability) and model granularity(detail), and the specific question(s) the model is aimed to answer [Klipp et al., 2005].Constraint-based modeling is a static modeling approach that is used for the genome-scale reconstruction of biological networks [Fell and Small, 1986, Savinell and Palsson,1992a,b, Oberhardt et al., 2009, Feist et al., 2009]. Information about the network struc-ture, the connectivity of the network and the changes in network fluxes under differentconditions can be extracted. Flux balance analysis (FBA) is a mathematical methodthat determines a set of metabolic fluxes fulfilling the steady state condition for a givenset of available nutrients [Kauffman et al., 2003, Varma and Palsson, 1994b, Reed andPalsson, 2003]. Constraint-based modeling has been applied to different organisms andcells, among them Escherichia coli, Pseudomonas aeruginosa and Homo sapiens [Ed-wards and Palsson, 2000, Oberhardt et al., 2008, Duarte et al., 2007, Gille et al., 2010,Rolfsson et al., 2011], and was used for example to predict mutant phenotypes [Edwardsand Palsson, 2000], pathway activity [Covert et al., 2001], or metabolic flux distributions[Oberhardt et al., 2008].To tackle the comprehensive examination of the metabolism of M. pneumoniae we
designed a multi-layer approach integrating different experimental and computationalanalyses (Figure 1.1). First, to guarantee fast and easy information exchange within themycoplasma research community and to provide a basis for the successful design of agenome-scale metabolic model, we developed a database with interactive web interfacefor M. pneumoniae. In addition to the data access, this web interface also suppliesseveral data analysis and visualization tools, some of which can be run locally or beapplied with unpublished results by using a temporary memory. Furthermore, during thedata collection and organization process, we obtained a systematic overview about theavailable knowledge as well as gaps in our understanding of M. pneumoniae metabolism,leading to the questions a metabolic model could answer.As the main project of this thesis, we designed a predictive, genome-scale, constraint-
based metabolic model for M. pneumoniae, iJW145 (”i + initials of the model builder+ number of genes”). This model was built to validate the reconstructed network,to analyze the central carbon metabolism responsible for energy homeostasis, and toexplore the metabolic behavior under different conditions. The identification and pref-erentially quantification of system components is one of the pre-requisites for the cor-rect representation of biological networks by mathematical models. To complementthe available data and to address the complicated metabolomics analysis, we applied acombinatorial approach joining different analysis techniques, namely nuclear magnetic
3

1. Introduction
resonance spectroscopy (NMR), gas chromatography coupled to mass spectrometry (GC-MS), and liquid chromatography coupled to mass spectrometry (LC-MS), to characterizethe metabolome of M. pneumoniae in vivo. Iteratively integrating in silico growth sim-
collection of genome-scale datasets on
genomics, transcriptomics, proteomics, & metabolism
M. Pneumoniae database: MyMpn
metabolic characterization
genome re-annotation
metabolic model + in vivo metabolomics
study
enhance understanding of M. pneumoniae
mRNA expression, theoretical proteome,
expressed proteome
1
2
3
Figure 1.1.: Workflow for the thesis: Aiming to enhance our understanding of M. pneu-moniae, specifically of the metabolism, we conducted several sub-projects: 1.We designed and implemented a database, MyMpn, thereby structuring theavailable data. 2. We comprehensively characterized the metabolism of M.pneumoniae by integrating the development and application of a constraint-based metabolic model with an in vivo metabolomics study. 3. We charac-terized the genome of M. pneumoniae by manually re-annotating the genomeand subsequently defining its essential regions.
ulations with experimental validations and literature information, enabled us to correctthe metabolic network structure and to unravel principles governing metabolic flux dis-tributions in M. pneumoniae under a variety of conditions. Amongst other results,this comprehensive analysis pointed out several errors in the genome annotation of M.pneumoniae.The fundamental question which essential functions underlie sustained cellular growth
and proliferation, has been addressed by several organism-wide gene essentiality studiesin bacteria [Hutchison et al., 1999, Gerdes et al., 2003, Kobayashi et al., 2003, Glass et al.,
4
1.1. Outline
2006, French et al., 2008, Dybvig et al., 2010, Christen et al., 2011]. However, severalproblems prevented the final answering of this question up to now. One of the majorchallanges arises from the fact that automatic genome annotations based on sequencesimilarities have been shown to be highly error prone [Casari et al., 1995, Brenner,1999]. To assure a genome annotation as accurate as possible, we manually curatedthe annotation based on the integration of the theoretical coding capabilities of the M.pneumoniae genome with experimental data on transcriptomics [Güell et al., 2009, 2011]and proteomics.All results presented have been iteratively integrated amongst each other and are
incorporated into the MyMpn database to contribute to the attempt to understandthe minimal bacterium M. pneumoniae, one of the most promising model organisms insystems biology (Figure 1.1).I present in this thesis the development of the M. pneumoniae database, MyMpn,
and the metabolic model, iJW145, as well as the related projects of the experimentalexploration of the M. pneumoniae metabolome and of the genome re-annotation, all ofwhich contributing to the attempt to understand M. pneumoniae. Based on the appliedsystems biology approach, all of these projects have been carried out together withother researchers, combining knowledge from different research fields. Therefore, at thebeginning of each chapter, my contributions to the presented results are detailed.
1.1.2. Scope of the ThesisWith the technological advances for genome-scale analysis of different cellular com-ponents and the emergence of the systems biology field, for the first time it becameamenable to understand organisms as an entity, not only as a collection of largely inde-pendent sub-systems that can be analyzed in separation [Auyang, 1999, Oshry, 2007].While the established biological model organisms, yeast and E. coli, have been studiedfor decades, a new group of such model organisms emerged with the discovery of thegenome-reduced mycoplasmas, the smallest self-replicating organisms known today [Mo-rowitz and Tourtellotte, 1962]. In a combined effort several research groups from theCenter of Genomic Research (CRG), Barcelona, and the European Molecular BiologyLaboratory (EMBL), Heidelberg, initiated a scientific project aiming to gain full-detailedunderstanding of a living cell, M. pneumoniae. In the first phase of this project, severalhigh-throughput data sets have been produced to analyze the major cellular buildingblocks by a combination of complementary experimental techniques [Güell et al., 2009,Kühner et al., 2009, Yus et al., 2009, Maier et al., 2011, Güell et al., 2011, van Noortet al., 2012, Yus et al., 2012]. However, to understand a biological system, the goal ofall systems biologists, theoretical formalisms, such as mathematical models that allowto place the system components into their dynamic network context, are indispensable[Kitano, 2001, 2002b].For M. pneumoniae, not only a possibility to easily exchange information, the basis
of all successful multidisciplinary research projects, but also mathematical models thatcombine the diverse large-scale datasets intending to explain the underlying structuraland regulatory mechanisms were lacking. A database to store the produced experimental
5

1. Introduction
and computational data as well as to further enhance the information exchange amongstthe different groups involved in the mycoplasma project, was needed. Taking advan-tage of the expertise in database development in the Bioinformatics Core Facility atthe CRG, we designed and implemented a database for M. pneumoniae that facilitatesdata storage and exchange: MyMpn. In addition, via the web interface we provide aworking platform to analyze, integrate and visualize the available data. One effect of theassociated data organisation was the supply of structured data, necessary for the designof mathematical models.With the manual reconstruction of the metabolic network based on experimental data
[Yus et al., 2009] a thorough basis for metabolic research in M. pneumonoiae had beengenerated. However, the resulting wiring diagram (the metabolic map) had not beenevaluated and several observations during growth curve experiments, as for examplethe slow dubling times of M. pneumoniae grown in batch culture, remained unex-plained. For the design of genome-scalemetabolic models, static modeling approaches,such as constraint-based modeling, are generally applied. Building such a genome-scaleconstraint-based model (iJW145), we completed the wiring diagram by adding necessarytransport reactions and correcting mis-annotated reactions.Furthermore, the metabolome had not yet been characterized in vivo, while for tran-
scriptome and proteome quantitative data for various conditions was available. Sev-eral analysis techniques, such as NMR, GC-MS, or LC-MS have been applied to studymetabolites in different organisms [Soga et al., 2003, van der Werf et al., 2007, 2008,t’Kindt et al., 2010, Liebeke et al., 2011]. However, the coverage of the in silico pre-dicted metabolome reached in those studies amounted to only 9 - 25%. Combining theestablished analysis techniques, we obtained complementary results raising the obtainedcoverage to over 50%. The iterative combination of the experimental metabolome explo-ration and the development of the metabolic model enabled us to semi-quantitatively de-fine the biomass composition of an average M. pneumoniae and thus to simulate growthfor this organism in silico. Subsequently conducting growth simulations with iJW145,we unraveled general principles underlying energy balancing and metabolic adaptationto different environmental conditions or in knock-out mutants.Taking into account the available data on transcriptomics and proteomics as well as
the small size of M. pneumoniae, a manual re-annotation of the genome appeared to befeasible. Such an experimental validation would allow to complement for the high errorrate of an automatically obtained genome annotation, reported since the first sequencedgenome [Casari et al., 1995, Brenner, 1999]. We applied a combinatorial approach con-sidering the theoretical coding capabilities of the genome, analyzing available transcrip-tomics data, and conducting a proteomics study which focused on the size determinationof the produced proteins in order to manually refine the genome annotation of M. pneu-moniae. Our results highlight the importance of an experimental validation of genomeannotations that have been obtained automatically based on sequence alignments. Mostimportantly, we showed that bacterial genomes are highly structured and organized ina complexity far exceeding what has been assumed possible for prokaryotes in generaland especially for minimal bacteria.Taken together, the presented findings significantly increase understanding ofM. pneu-
6

1.1. Outline
moniae and prove that even minimal cells are finetuned on all cellular levels, therebyreflecting evolution, environment, and the specific cellular properties.
1.1.3. Thesis OrganizationIn systems biology expertise from different research fields as well as experimental andtheoretical data is combined to analyze complex biological processes. Thus, knowledgeabout the biology of the examined system, about the experimental exploration pos-sibilities, about the modeling methodology, and about the underlying mathematics isindispensable to successfully understand a biological system. The first chapter of thisthesis, apart from the thesis outline, contains an introduction into the biological, themethodological (computational and experimental) and the mathematical background forthe presented work (sections 1.2, 1.3, and 1.4, respectively). In section 1.2 the analyzedorganism M. pneumoniae, its reduced genome, and the peculiarities of its metabolismare described. In the methodological background section (1.3) the research field systemsbiology (section 1.3.1) and computational modeling in biology (section 1.3.2) are gen-erally introduced. Additionally, the metabolomics approach (section 1.3.3) and genomeannotation and essentiality studies (1.3.4), including the analysis techniques applied inthe presented work, as well as biological databases are introduced. The mathematicaltheories underlying the applied modeling approach are outlined in section 1.4.Chapters 2 to 4 describe the different research projects, each containing a short intro-
duction, a section for material and methods, a results section, and a discussion. The firstproject, relating to the development of MyMpn, the database and working platformfor M. pneumoniae, is described in chapter 2. Since the database itself is the result ofthis project, the different steps towards this result are outlined, namely the databasedevelopment process (section 2.2.1), the database implementation (section 2.2.2), thedata integration and maintenance (section 2.2.3), and the implementation of the webinterface (section 2.2.4) are briefly described. Furthermore, short descriptions of selecteddata analysis and visualization tools are provided (section 2.2.5).The second and main project of this thesis, detailed in chapter 3, involves the in vivo
exploration of the metabolite space and the development of a genome-scale constraint-based model for M. pneumoniae metabolism. In the Material and Methods section, theconducted computational (section 3.2.1) and experimental (section 3.2.2) proceduresare outlined. The results section represents the iterative combination of experimen-tal and computational analyses that allowed us to characterize key features of the M.pneumoniae metabolism. Subsections of the results describe the model building pro-cess (section 3.3.1), the identification (section 3.3.2) and quantification (section 3.3.3)of metabolites, and the definition of the M. pneumoniae biomass composition (sec-tion 3.3.4). Furthermore, the model refinement process (section 3.3.5) leading to thecorrection of the wiring diagram for metabolism and of the functional annotation ofmetabolic key enzymes, as well as the model validation by the qualitative determinationof in silico growth capabilities on different carbon sources and by an in silico knock-outstudy (section 3.3.6) are acquainted. Finally, the model has been applied for the insilico prediction of double mutant phenotypes and of metabolic flux distributions along
7

1. Introduction
the exponential growth phase (section 3.3.7). The subsequent integration of those fluxpredictions with in vivo monitoring of qualitative central carbon fluxes allowed us tocalculate in vivo catalytic rates for glycolytic key enzymes. The results are summarizedand placed in the context of actual literature in a broad discussion (section 3.4).Chapter 4, presents the third project covering the in-depth analysis of the mycoplasma
genome, which resulted in its re-annotation. To this end, we first analyzed availablemRNA expression data (section 4.3.1. Second, we designed an in silico peptide library re-flecting the theoretical coding capabilities of the M. pneumoniae genome (section 4.3.2).Finally, we combined our resuts with a proteomics analysis to integrate informationabout the correct size of translated genomic regions (section 4.3.3). The discussionof this chapter (section 4.4) apart from the presented results focuses on their ongoingintegration with a genome-wide in vivo essentiality studyA summarizing discussion is presented in chapter 5 connecting the different projects
to each other, interpreting the detailed results with respect to the state of the art in M.pneumoniae research and applied methodologies, and providing and outlook on ongoingan future projects related to the findings of this thesis.
1.2. Biological Background1.2.1. Mycoplasma pneumoniaeMycoplasmas, the smallest self-replicating organisms known [Morowitz and Tourtellotte,1962], belong to the class Mollicutes (lat: molis - soft, cutis - skin). These wall-lessbacteria evolved from more conventional progenitors in the Firmicutes taxon by a processof degenerative or reductive genome evolution [Razin et al., 1998]. Mycoplasmas areobligate parasites of humans, mammals, reptiles, fish, and plants, living in relativelyunchanging niches that require little adaptive capacity [Razin, 1978, Razin et al., 1998].They are composed of the minimum set of organelles: a plasma membrane, ribosomes anda circular DNA molecule [Razin et al., 1998]. The total number of known mycoplasmaspecies, despite counting already close to 400, is constantly increasing. Their small sizemakes them interesting candidates to apply genome-scale analyses and already for 46mycoplasma species the complete genome sequences can be found at the National Centerof Biotechnology Information (NCBI) [Tatusova et al., 1999]. In addition, they promiseto be the perfect candidates to assess the basic cellular functions of prokaryotes.M. pneumoniae, one of the smallest mycoplasmas, preferentially colonizes human lung
epithelial cells and is involved in a wide variety of diseases in children and adults [Waitesand Talkington, 2004]. Historically, it was considered a virus rather than a bacterium dueto problems in detection and laboratory cultivation [Eaton et al., 1945] and thereafterreferred to as ”Eaton’s agent” until in 1962 Hayflick and colleagues identified it as amycoplasma and named it Mycoplasma pneumoniae [Chanock et al., 1962a,b]. Due tothe lack of a cell wall, M. pneumoniae is resistant to antibiotics targeting the synthesisof the peptidoglycan layer, such as penicillin [Eaton et al., 1945].With a volume of only 0.067 femtoliters it has an oval shape with an attachment
organelle that is used for movement and attachment to cells and other surfaces [Seybert
8

1.2. Biological Background
et al., 2006, Yus et al., 2009]. In its natural environment, the human lung, it growsattached to epithelial or other M. pneumoniae cells, under laboratory conditions clumpssticking to the bottom of the growth flasks are found [Seybert et al., 2006, Yus et al.,2009]. It can divide in about 8 hours (maximum speed observed [Seybert et al., 2006]),although in batch culture growth experiments doubling times of about 20 hours duringthe exponential growth phase have been observed [Yus et al., 2009]. M. pneumoniaeM129, the M. pneumoniae strain used in our analyses, has a genome size of 816,394 basepairs encoding for only 689 proteins [Himmelreich et al., 1996, Dandekar et al., 2000].The reduced genome is accompanied by a lean metabolic network lacking most anabolicpathways involved in cell building block synthesis [Pollack et al., 1997, Yus et al., 2009].For ATP synthesis, it relies on glycolysis and organic acid fermentation due to the lackof a functional respiratory chain and a citric acid cycle [Dandekar et al., 2000, Yus et al.,2009].M. pneumoniae is an ideal organism for systems biology studies due to a number of
outstanding properties. The simple cell structure allows better analysis of cell compo-nents, for example with electron tomography [Seybert et al., 2006] or mass spectrometry[Maier et al., 2011], than would be possible in larger organisms. The small cell size alsolimits the abundance space of cell components to a minimum. mRNA expression datahas been analyzed for a large number of different conditions facilitating information onthe ability of M. pneumoniae to react on environmental perturbations, amongst themcold shock, heat shock, osmotic stress and starvation [Güell et al., 2009]. The proteomespans only 3 orders of magnitude in abundance and 60% of all supposed proteins in M.pneumoniae have been quantified by mass spectrometry, including 78.6% of all metabolicproteins [Maier et al., 2011]. In addition the relation between mRNA expression andprotein abundance has been studied suggesting complex regulatory mechanism for generegulation and protein synthesis. The minimal genome, the small number of encodedproteins, and the simple metabolic network allow the construction of genome-scale mod-els for gene regulation and transcription, for the protein interaction network, and for themetabolism. Due to the lack of many pathways, in vivo metabolite measurements can berelated directly to catabolic activity. Despite this apparent simplicity, M. pneumoniaeshows a differentiated response to a variety of stress conditions similar to more com-plex bacteria [Güell et al., 2009]. In addition, in contrast to the smallest mycoplasma,Mycoplasma genitalium, it can be cultivated relatively easy under laboratory conditionswithout host cells, predestining it as a model organism for systems biology.
1.2.2. The Metabolism of M. pneumoniaeThe metabolism of a cell, i.e. the respective set of biochemical reactions taking place init, allows to take up nutrients from the environment and to process them into energy andcellular building blocks (Figure 1.2). Thereby, pro- and eukaryotes have many pathwaysin common, for example central carbon metabolism or nucleotide metabolism pathways[Alberts et al., 2008]. Other pathways exist only in either pro- or eukaryotes, only in afew organisms or even in only a few cell lines allowing the respective cells to accomplishspecific functions, as for example functions related to specific organs in multi-cellular
9
1. Introduction
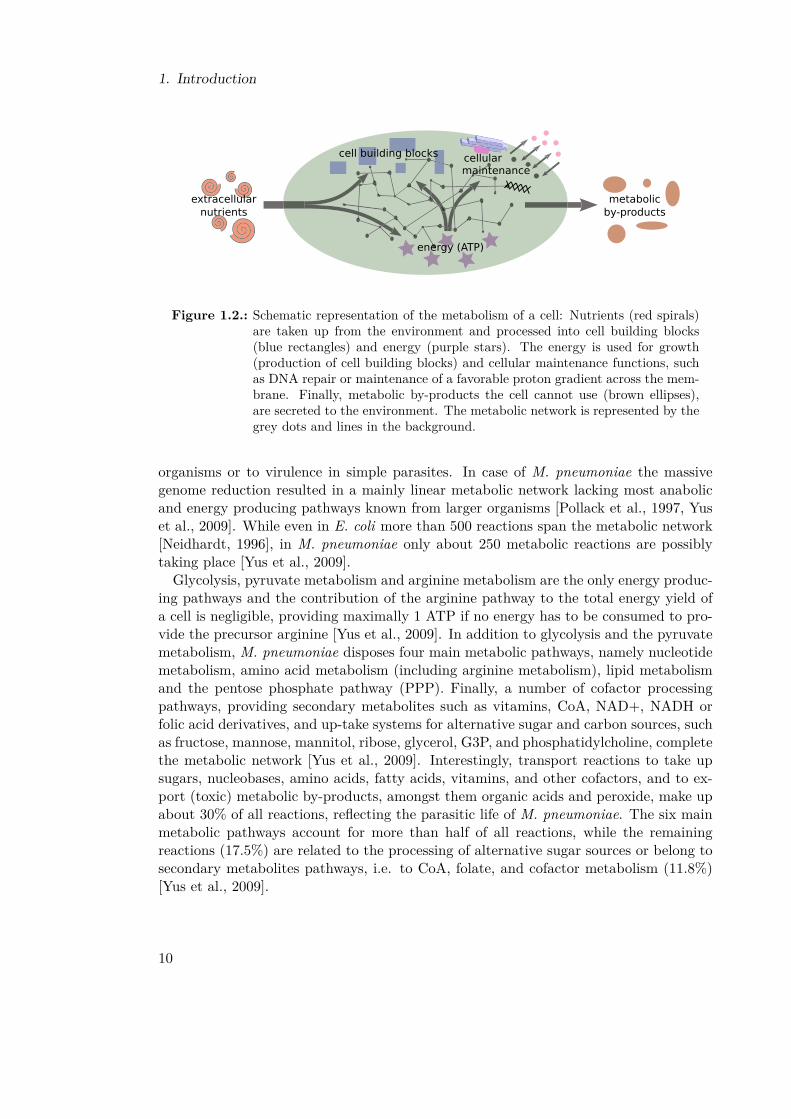
Figure 1.2.: Schematic representation of the metabolism of a cell: Nutrients (red spirals)are taken up from the environment and processed into cell building blocks(blue rectangles) and energy (purple stars). The energy is used for growth(production of cell building blocks) and cellular maintenance functions, suchas DNA repair or maintenance of a favorable proton gradient across the mem-brane. Finally, metabolic by-products the cell cannot use (brown ellipses),are secreted to the environment. The metabolic network is represented by thegrey dots and lines in the background.
organisms or to virulence in simple parasites. In case of M. pneumoniae the massivegenome reduction resulted in a mainly linear metabolic network lacking most anabolicand energy producing pathways known from larger organisms [Pollack et al., 1997, Yuset al., 2009]. While even in E. coli more than 500 reactions span the metabolic network[Neidhardt, 1996], in M. pneumoniae only about 250 metabolic reactions are possiblytaking place [Yus et al., 2009].Glycolysis, pyruvate metabolism and arginine metabolism are the only energy produc-
ing pathways and the contribution of the arginine pathway to the total energy yield ofa cell is negligible, providing maximally 1 ATP if no energy has to be consumed to pro-vide the precursor arginine [Yus et al., 2009]. In addition to glycolysis and the pyruvatemetabolism, M. pneumoniae disposes four main metabolic pathways, namely nucleotidemetabolism, amino acid metabolism (including arginine metabolism), lipid metabolismand the pentose phosphate pathway (PPP). Finally, a number of cofactor processingpathways, providing secondary metabolites such as vitamins, CoA, NAD+, NADH orfolic acid derivatives, and up-take systems for alternative sugar and carbon sources, suchas fructose, mannose, mannitol, ribose, glycerol, G3P, and phosphatidylcholine, completethe metabolic network [Yus et al., 2009]. Interestingly, transport reactions to take upsugars, nucleobases, amino acids, fatty acids, vitamins, and other cofactors, and to ex-port (toxic) metabolic by-products, amongst them organic acids and peroxide, make upabout 30% of all reactions, reflecting the parasitic life of M. pneumoniae. The six mainmetabolic pathways account for more than half of all reactions, while the remainingreactions (17.5%) are related to the processing of alternative sugar sources or belong tosecondary metabolites pathways, i.e. to CoA, folate, and cofactor metabolism (11.8%)[Yus et al., 2009].
10

1.2. Biological Background
M. pneumoniae takes up sugars (preferentially glucose, alternatively fructose, man-nose, mannitol, ribose, glycerol, glycerol 3-phosphate (G3P), ascorbate and glycero-3-phosphocholine (G3PC)) from the environment. These sugars are processed throughglycolysis and the produced pyruvate converted into either lactic or acidic acids. Thegenerated acids are exported from the cell and the energy obtained during their syn-thesis is used for cellular maintenance functions and proliferation. During the design ofa defined medium for M. pneumoniae, which from now on will be referred to as mini-mal medium, it has been shown that for RNA and DNA synthesis the two purine basesadenine and guanine and the ribosylated pyrimidine base cytidine have to be providedwith the medium to allow growth [Yus et al., 2009]. Additionally, different fatty acids,amino acids (also in form of short peptides), and the precursors of all cofactor processingpathways have to be provided [Yus et al., 2009]. Mycoplasma lipids and the membranecomposition have been studied already a long time ago [McElhaney and Tourtellotte,1969, Pollack et al., 1970, 1973] showing that the lipid composition of mycoplasmasvaries according to the fatty acids provided with the growth medium.Despite the identification and quantification of major cell building blocks, such as the
DNA, the total protein content, or the mRNAs, for most metabolites detailed informa-tion is lacking and the exact composition of an M. pneumoniae cell remains unknown.In addition, the contributions of many cellular maintenance processes, such as ATPasefunction, protein folding or DNA repair, on energy homeostasis are not known. Hence, adetailed characterization of the M. pneumoniae metabolism by combining mathematicalmodeling with in vivo analyses could provide the necessary information complementingthe available data.
1.2.3. Genomics in M. pneumoniaeThe essential genes of an organism are those genes that compose the minimum genecomplement allowing growth and replication under the most favorable external condi-tions [Koonin, 2003]. However, approaches to determine the minimal genome sustaininglife have not yet been successful which at least in part can be attributed to the errors ingenome annotations not validated experimentally [Brenner, 1999].The genome of M. pneumoniae has been sequenced twice and, in the current anno-
tation, contains 689 protein-coding genes [Himmelreich et al., 1996, Dandekar et al.,2000]. Nevertheless, mistakes in genome annotations have been made since the firstgenome annotation of Haemophilus influenza [Fleischmann et al., 1995] for which justone month after the initial publication 148 amendments have been released [Casari et al.,1995]. Once established, those annotation errors spread around very fast among newlyannotated organisms, since in absence of detailed experimental information many genesare annotated based on sequence similarity analyses. For M. genitalium the annotationerror rate has been estimated to be 8% [Brenner, 1999]. The errors in the functional an-notation of several genes detected due to sequence alignments and experimental results,as well as the three wrongly annotated genes detected with our constraint-based modelsuggest that the error rate in M. pneumoniae is not much smaller (chapter 3) [Yus et al.,2009].
11

1. Introduction
In addition to protein and RNA coding genes, other genomic regions have gainedattention during the past years. sRNAs, for instance, have been shown to account forup to 10 to 20% of the bacterial transcriptome [Sorek and Cossart, 2010, Güell et al.,2011] and the number of sRNAs in some cases equates the total amount of cellulartranscription factors [Hershberg et al., 2003, Irnov et al., 2010]. tRNAs, rRNAs, andsRNAs have been annotated for M. pneumoniae [Himmelreich et al., 1996, Dandekaret al., 2000, Güell et al., 2009] and for M. genitalium the existence of antisense RNA hasbeen proven [Lluch-Senar et al., 2007].A genome annotation of high quality, preferentially based on experimental evidence,
would facilitate the further analysis of cellular functions of M. pneumoniae and signifi-cantly improve the success probabilities for the determination of the minimal essentialgenome.
1.3. Methodological Background1.3.1. Systems BiologyThe origins of biology (greek: bios - life and -logia - study of) can be traced backto ancient times when Aristotle (384-322 BC) classified living things into categories,some of which in slightly altered definitions are still valid nowadays [Bohn, 1862]. Theterm biology for the first time appeared in German (as Biologie) at the end of the 18thcentury [Avila, 1995]. One of the first discovered principles underlying life was the theoryof evolution proposed by Darwin [Darwin, 1859]. Modern biology encompasses manydifferent disciplines attempting to study different aspects of life and living organisms[Avila, 1995]. In the middle of the 20th century the field of molecular biology arose,applying the so-called reductionist approach by studying the single molecules comprisingliving organisms are composed of [Auyang, 1999, Oshry, 2007]. Watson and Crick in1965 discovered the structure of the DNA double helix laying the foundation for genesand genomes [Watson and Crick, 1953a,b]. Probably the youngest biological discipline,systems biology, emerged at the beginning of the 21st century when more and morelarge-scale experimental datasets became available and the limitations of the reductionistapproach for the ambition to understand biological complexity became obvious [Kitano,2001, Friboulet and Thomas, 2005]. Systems biology, assuming that understanding ofa system is only possible by looking at it as a whole, brings together concepts andknowledge from all natural sciences and approaches unraveling of fundamental principlesand properties of complex biological systems by relating the interactive properties ofsingle system components to systemic functions [Noble, 2008, Westerhoff et al., 2009].Establishing a fruitful collaboration between experimental and theoretical researchers
is probably one of the biggest challenges within systems biology, since the researchconcepts and also the terminology used differ significantly from one scientific disciplineto the next. However, to obtain system-level understanding of biological processes thedevelopment of mathematical models formally describing the scrutinized system and theintegration of different experimental data, presumably provided by different researchers,is indispensable. Consequently, when designing experiments and mathematical models
12
1.3. Methodological Background
in close collaboration with all scientists involved in a project, the possible knowledge gainfar exceeds the simple sum of findings obtained by analyzing the different experimentaldatasets on their own.For me, systems biology offers the great opportunity to profit from very diverse scien-
tific expertise and the application of different research techniques and analysis tools inthe aim to understand living organisms as a whole.
1.3.2. Mathematical Modeling in BiologyThe integration of diverse experimental data into suitable computational models is ofupmost importance when aiming to understand complex biological systems. Using math-ematical formalisms to describe biological processes allows to unravel general principlesas well as specific details of an examined system that are not amenable to experimentalresearch. Additionally, when combining mathematical models with different experimen-tal data it is possible to iteratively draw and validate hypotheses concerning the behaviorof the scrutinized system [Kitano, 2002b].In general, mathematical models in the biological sciences are designed to answer one
or more specific questions about a biological process. In the first step, an appropriatemathematical approach has to be selected taking into account the size of the system, thetype(s) of experimental data that will be integrated, and the question(s) the model isaimed to answer. This is not a trivial task, since each of the multiple available modelingapproaches has different properties and restrictions that while perfectly granting thedescription of one process can frustrate knowledge gain over another. The differentmodeling approaches can be generally categorized according to the following criteria:
• Static modeling approaches describe a system under steady state conditions whiledynamic approaches include information about the time-dependent changes of thesystem components.
• In deterministic models every state is uniquely defined by parameters and initialvalues, in contrast to stochastic models which include randomness, i.e. the variablestates are described by probability distributions.
• Distributed parameter systems assume an infinite-dimensional state space, whilein lumped approaches spatially distributed field variables are represented as singlecharacters.
• In discrete modeling approaches formulas with discrete variables, often recurrencerelations such as f(x + 1) = y ∗ f(x), are used to fit data mostly obtained frompoint measurements, whereas continuous approaches normally apply differentialequations to fit data obtained from serial or sustained measurements.
The method of choice depends on the combination of the above-mentioned propertiesnecessary to describe the biological process of interest and the size of the modeled net-work in order to allow balancing of model complexity and model granularity. In addition,
13

1. Introduction
the type(s) of experimental data that can be used for the model building and the ques-tion(s) the model is aimed to answer have to be taken into account in order to select anapplicable mathematical formalism.
biological hypothesis
experimental valida5on
mathema5cal model
Systems Biology
predic5ons
experiment design m
odel im
provem
ent
Figure 1.3.: Schematic representation of an idealized integrative systems biology approach:Model predictions are used to draw biological hypothesis that are validatedexperimentally, resulting in an improved model, a new hypothesis and so on.
Despite that in reality science is neither straightforward nor exactly cyclic [Alon,2009], the model, the experimental data, and the drawn hypotheses should be refined inan iterative cycle until the model is able to accurately reproduce experimental findingsof the described biological system (Figure 1.3). To this end, the parameters of the modelhave to be either measured directly or fitted to experimental data. , new experimentsshould be designed to allow the validation of in silico predictions and the subsequentadaptation of the model. The integration of different experimental data obtained bystudying different aspects of the scrutinized system, for example data on proteins andmetabolites when modeling a cellular signaling or metabolic pathway, grants higheraccuracy then using only data of one kind.Once the model is able to reproduce experimental findings, the predictive capacity
of the model should be evaluated using experimental data not included in the modelgeneration process. Models with high accuracy and specificity in predictions can pro-vide information about properties of the examined system that have not been exploredexperimentally or that cannot be assessed due to lacking experimental techniques.For this work, the constraint-based modeling approach is of particular interest and,
therefore, outlined in section 1.4.1. It is important to note that in most of the casesdifferent modeling approaches could be used to model the same biological process whenfocusing on different aspects of such process. No preset mathematical method exists toscientifically explore biological systems ”the right way”. So, one of the most important
14
1.3. Methodological Background
principles for the usage of mathematical models in biology has been introduced by Boxand Draper [1987]:
”Remember that all models are wrong; the practical question is how wrong they haveto be to not be useful.”
1.3.3. MetabolomicsThe study of metabolomics deals with the high-throughput analysis of cellular metabo-lites. Despite their relevance for the phenotypic state of a biological system [Cornish-Bowden and Cárdenas, 2000, Fiehn, 2002, Nicholson and Lindon, 2008, Dunn et al.,2011, Buescher et al., 2012], metabolomics studies are lagging behind successes in ad-jacent fields, such as transcriptomics and proteomics. When examining the differentsteps of a metabolomics study (Figure 1.4), several reasons for this disequilibrium canbe identified.
Metabolomics
sampling of cells
cell lysis
quenching of metabolism
analy5cal methods
data analysis
data interpreta5on
GC-‐MS LC-‐MS NMR
batch culture growth experiment
peak detec5on & integra5on
database analysis
perchloric acid
hot ethanol
cold methanol
liquid nitrogen
boiling water
metabolic modeling
integra5on with other “-‐omics” data
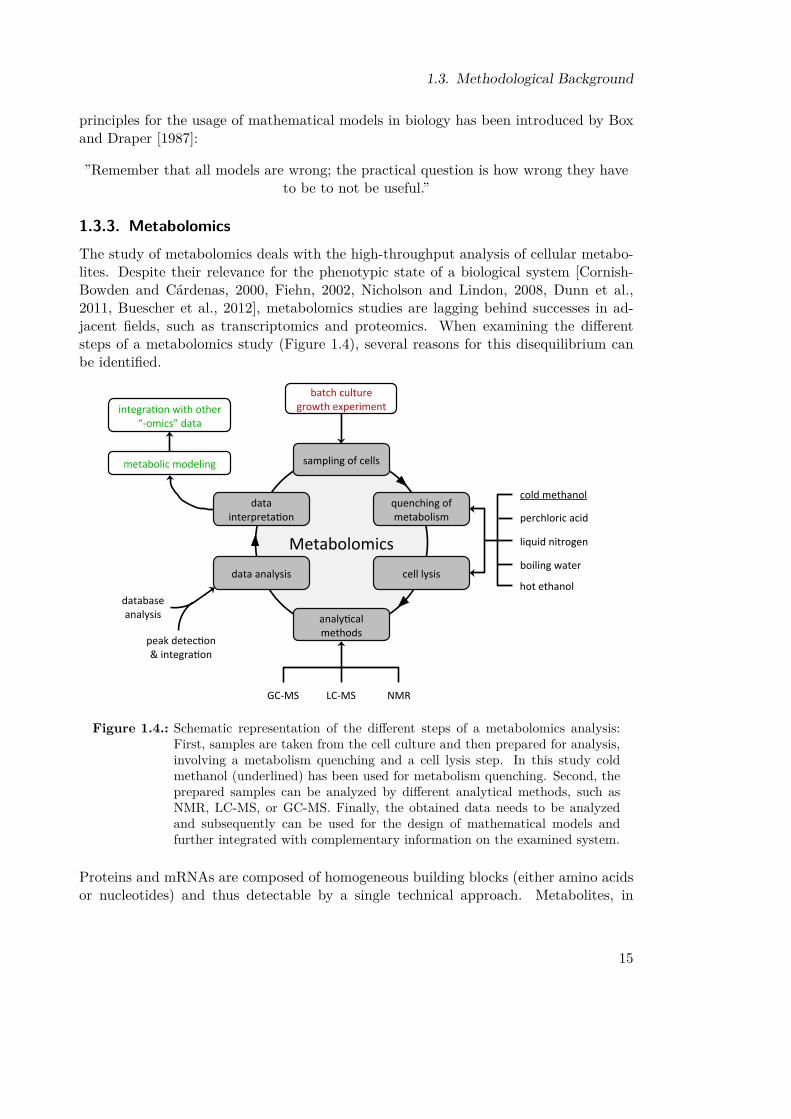
Figure 1.4.: Schematic representation of the different steps of a metabolomics analysis:First, samples are taken from the cell culture and then prepared for analysis,involving a metabolism quenching and a cell lysis step. In this study coldmethanol (underlined) has been used for metabolism quenching. Second, theprepared samples can be analyzed by different analytical methods, such asNMR, LC-MS, or GC-MS. Finally, the obtained data needs to be analyzedand subsequently can be used for the design of mathematical models andfurther integrated with complementary information on the examined system.
Proteins and mRNAs are composed of homogeneous building blocks (either amino acidsor nucleotides) and thus detectable by a single technical approach. Metabolites, in
15

1. Introduction
contrast, are difficult to assess experimentally on a large scale when applying a singleanalytical method due to their chemical diversity and vastly different cellular abundance[Goodacre et al., 2004, Creek et al., 2011, Geier et al., 2011, Liberman et al., 2012]. Inaddition, they are not encoded by cellular DNA and their presence largely depends ontransient cellular requirements. Finally, metabolites are often either unstable or short-lived, posing great challenges for sample preparation (Figure 1.4, cell lysis and metabolitequenching) and processing prior to analysis [Scalbert et al., 2009, van Gulik, 2010].The different techniques established for the identification and quantification of cellular
components are NMR and mass spectroscopy (MS), whereupon MS is normally coupledeither to gas chromatography (GC) or to liquid chromatography (LC). When aiming toidentify and quantify metabolites on a genome-scale, the combination of different ap-proaches is recommendable in order to cover the diverse metabolite space of an organism.The three techniques commonly applied for metabolomics analysis are introduced below.
Nuclear Magnetic Resonance Spectroscopy (NMR)
Nuclear magnetic resonance is a physical phenomenon based on the magnetic propertiesof the nuclei of atoms that dunked in a static magnetic field are exposed to another, os-cillating magnetic field. The subatomic particles, i.e. protons, electrons, and neutrons,have quantum mechanic spin. In some atoms, amongst them 12C and 16O, paired spinscounterbalance each other (net spin equal to zero), but most atoms, for example 1H,13C, and 15N, do possess an overall spin. When a particle has a net spin, it can absorb aphoton of frequency ν if placed in a magnetic field B. ν thereby depends on the specificgyromagnetic ratio γ, defined as the proportionality constant between the nuclear mag-netic moment and the nuclear angular momentum, of the respective particle and, thus,resulting in a particle-specific NMR signal. When combining the NMR signals obtainedfrom different particles of a complex molecule, it is possible to obtain information aboutthe chemical and physical properties of such molecule [Atta-Ur-Rahman, 1986].NMR is a technique that without requiring complex sample preparation steps allows to
directly identify and quantify metabolites. Furthermore it allows to determine unknowncomponents based on structural information. However, the application of NMR also hassome disadvantages. It is not very sensitive, thus especially low abundant compoundsare difficult to detect, and the technical equipment is expensive.
Chromatography
Chromatography is a laboratory technique to separate mixtures, such as cellular sam-ples, and to determine the relative proportions of the different components [Harwoodand Moody, 1989]. This separation is based on the components specific affinities towardstwo immiscible solvents, also called phases. When dissolved in one phase, the so-calledmobile phase, the sample is transported through the second phase, denominated thestationary phase. Based on their specific chemical partition coefficients, the componentsof the sample travel at different speeds causing them to separate. Analysis of the reten-tion times in the stationary phase grants the fast database powered identification of the
16

1.3. Methodological Background
sample components. In the oldest chromatography technique, the paper chromatogra-phy, the sample to examine is placed on a cellular chromatography paper which is thenset with the tip into a solvent. While the solvent rises through the paper the differentcomponents of the sample are taken along with different efficiency.In liquid chromatography (LC) the sample under examination is dissolved in a
fluid, with which it is moved through a column containing the stationary phase [Snyderet al., 2010]. LC is applicable to volatile and non-volatile compounds and a high numberof different detectors can be chosen. In high-performance liquid chromatography (HPLC)for example, the liquid phase is conducted through the stationary phase by a high-pressure pump. However, imprecisions can result from ion suppression and quantificationis only amenable with isotope-labeled reference compounds. Furthermore, LC alone doesnot positively identify all components since low abundant compounds can be hiddenbehind high abundant ones that have the same retention time.Gas chromatography (GC) is a chromatography type able to separate and analyze
(identify and quantify) biochemical molecules that can be vaporized without decompo-sition based on their volatility [Pavia et al., 2005]. The sample thereby is added to theliquid phase of a column and this column is heated. For the different sample compo-nents the retention time is measured and compared to retention times obtained frompure compounds. Disadvantages of GC are the limited range of available detectors andthat sample derivatization is often required, thus introducing a higher experimental errorwith every preparation step.
Mass Spectrometry (MS)
Mass spectrometry (MS), an analytical technique measuring the mass-to-charge ratio ofcharged particles [Sparkman, 2000], is commonly used for the identification of moleculesor sample compositions. To this end, the sample compounds are ionized and subse-quently separated by an electromagnetic field. Usually, the resulting ion signals aredetected quantitatively and then processed into so-called mass spectra. Those massspectra are evaluated based on database information, which can be complemented bythe determination of the mass spectra of known pure compounds.In general, MS is conducted in combination with gas or liquid chromatography (GC-
MS or LC-MS). By this combination the two techniques complement for their limitationsin complex sample analysis, thus allowing to separate even highly similar moleculesand to better identify (and quantify) the different sample components than would bepossible by using only one method. Apart from analyzing biological samples for scientificpurposes, GC-MS for example is also applied in drug testing, environmental analyses,or fire investigations.
1.3.4. GenomicsSurvival, growth, and reproduction of cells depend on their ability to store, retrieve, andmaintain the required genetic instructions [Alberts et al., 2008]. The genetic informationis inherited from mother to daughter cells and the genes, sections of the genome encoding
17
1. Introduction
proteins or functional RNAs, and their associated regulatory upstream regions constitutethe mayor information-containing fraction of each genome. The field of genetics emergedat the beginning of the 20th century, but the mechanism by which cells are able to copytheir genetic material literally thousands of times while maintaining it largely unchangedremained obscure until Watson and Crick [1953a,b] discovered the structure of DNA.When towards the end of the 20th century, the sequencing of whole genomes became
amenable [Fleischmann et al., 1995, Fraser et al., 1995], the analysis of genes and theirfunctions on a global scale (genomics) became popular. Once sequenced, a genome has tobe annotated, i.e. the different protein and RNA coding genes should be determined toallow the study of genes, of their expression, and of their translation into proteins in theparticular organism. The annotation of sequenced genomes is conducted mainly basedon sequence similarity to other, already annotated genes in other organisms. One of themajor challenges in the annotation of entire genomes is putative transfer of annotationerrors from other organisms, which can spread easily along newly annotated genomesdue to the lack of experimental evidence for the annotated functions. Especially forlarger genomes, an experimental validation of such automatically generated annotationsis merely impossible due to the simple amount of genes that can be or cannot be expressedunder varying conditions.For the reduced genome of M. pneumoniae such a manual curation of the automatic
annotation could reveal the impact of error propagation between the annotations of dif-ferent species. However, to this end experimental data on genomic products, i.e. allproduced transcripts and the translated proteins, has to be taken into account. Severalhigh-throughput sequencing methods have been developed, e.g. Solexa sequencing ordeep sequencing techniques, that allow to sequence DNA and also all expressed tran-scripts (transcriptomics). Other techniques, such as DNA microarrays and tiling arrays,provide information about the expression levels of mRNAs. Thus, it is possible to de-termine alternative transcriptions start sites (TSSs) inside operons but also inside anno-tated genes. While the transcriptome had been monitored under a sufficient amount ofdifferent growth conditions providing a comprehensive quantitative picture [Güell et al.,2009, 2011], for the proteome the available quantitative data did not allow to distinguishbetween different isoforms of the same protein [Maier et al., 2011].
1.3.5. ProteomicsProteins, cellular molecules build from polypeptides, comprise the major fraction ofthe cellular dry weight and are responsible for nearly all biological functions [Albertset al., 2008]. Their final physical shape, the conformation, is defined by four aspects.The amino acid sequence of each polypeptide, also called primary structure, is definedby the sequence of a gene and folds into the secondary structure, i.e. into regularlyrepeating local structures based on chain-internal hydrogen bonds, such as α-helices orβ-chains. The tertiary structure describes the 3-dimensional shape of a single proteinmolecule and the quarternary structure defines the conformation composed of differentprotein molecules, which in general represents a minimum in the energy landscape.Nevertheless, proteins are not rigid but able to change their conformation, for example
18

1.3. Methodological Background
upon interaction with binding partners, allowing them to carry out the diverse cellularfunctions [Alberts et al., 2008].Proteomics is the large-scale analysis of the proteins of an organism, i.e. of the pro-
teome, aiming to gain information on the translated fraction of the genome under dif-ferent conditions, the protein quantities, structures, and functions [Wilkins et al., 1996,Anderson and Anderson, 1998, Blackstock and Weir, 1999]. As in the analysis of metabo-lites, proteins are commonly quantified by MS and sequenced with high-throughputmethods just as genomic sequences or transcripts. Thereby, sample preparation can sig-nificantly increase the knowledge gain. A separation of the different proteins of a sampleby weight using western blots, can allow to determine the actually translated ORFs,thus revealing organism-specific versions for some proteins or the existence of differentisoforms. An example for the practical application of proteomics is the identificationof putative drug targets based on the determination of desease-related proteins. Be-sides, in proteogenomics proteomic analysis techique are employed for the improvementof gene annotations and have been shown to facilitate the discovery of post-translationalmodifications [Gupta et al., 2007].
1.3.6. Biological DatabasesInformation exchange, and to this end data storage and accessibility, is one of the fun-damental principles for scientific knowledge gain, not exclusively but especially in theelectronic era. In former times the information had to be stored physically at specificplaces and thus, access to it was only possible through direct physical contact, i.e. goingfor example to a library, an archive, or a museum, or written request transmitted bymail. In contrast, today the world wide web provides the possibility to make informationaccessible to the whole humanity at once and online databases collect information aboutevery imaginable topic. Some biological databases for example provide access to generalinformation on biological numbers, the Bionumbers database [Milo et al., 2010], aboutenzymes, BRENDA [Scheer et al., 2011], about genes and pathways, KEGG [Kanehisaand Goto, 2000], or biological models, BioModel database [Li et al., 2010]. Others focuson information related to a specific organism, such as EcoCyc covering genomic andmetabolomic information about E. coli [Keseler et al., 2011] or SubtiWiki for B. subtilis[Flórez et al., 2009].Generally, the database development process can be divided into three main steps
[Churcher, 2007]:
• The design of the database structure taking into account the information to bestored and the desired accessibility.
• The implementation of the database tables.
• The insertion of the data.
For the design of the database a relational scheme, also called unified modeling language(UML) class diagram or entity-relation (ER) diagram, is designed, which displays thedatabase structure. This structure is defined by different tables of the database and
19

1. Introduction
their internal connections by foreign keys. In addition, information on the unique key(s)of the table, that allow to distinguish the different database entries, and foreign keysused to connect data of different tables are indicated. Usually, also the type of datacontained in each column of a table, for instance if the stored data will be a number or astring (series of characters), is included in this formal description of the database, sincethe data type dictates the size of the storage that is reserved for the database entries.In most of the cases, subsequently or in parallel to the database development process
an interface that allows and defines access to the stored data is implemented. Thereby,it is important to note that often a huge effort is made to provide intuitive access to andinteraction with the information, thus granting the possible usage of the database to adiversity of people, not all being experts in database usage or familiar with the topic.When aiming to obtain full understanding of an entire, even though single cell or-
ganism, a properly designed database facilitating the exchange of results, methods, andtools between an increasing number of research groups, is crucial. Specifically for thedevelopment of mathematical models, such easy access to well annotated and structureddata is of upmost importance, since this data is not only pinpointing the question(s)a model is designed to answer but mainly dictating the applicable mathematical for-malisms. Wrong or sparse data could prevent the successful model design, if a formalismis chosen that cannot reliably reproduce the biological properties and behavior of themodeled system.
1.4. Mathematical BackgroundMathematical modelling offers a great variety of different approaches to determine spe-cific aspects of the investigated system [Klipp et al., 2005]. Static modeling approachesdescribe a system under steady state conditions, thus allowing to model large systemswithout requirement for information about time dependent quantitative changes of thesystem components. In metabolic modeling, the constraint-based modeling approach hasbeen established during the past two decades [Fell and Small, 1986, Savinell and Palsson,1992a,b, Oberhardt et al., 2009, Feist et al., 2009]. However, static approaches are of lim-ited viability when aiming to obtain insights into regulatory processes or to understandthe functional mechanisms of cellular sub-systems in detail. Instead, dynamic model-ing approaches, for example based on ODEs are utilized for studying time-dependentchanges of biological systems [Klipp et al., 2005].Independent of the modeling approach employed, some general properties apply to all
mathematical models. The numeric relations of the system components to the biochemi-cal reactions taking place in the examined system can be described by the stoichiometricmatrix N.
N =
n1,1 . . . n1,n...
...nm,1 . . . nm,n
(1.1)
20

1.4. Mathematical Background
The entries ni,j of N describe the quantitative involvement of component i into reaction j.The stoichiometric matrix can be used to extract information about the modeled system.For example, by calculating the rank of N, one can determine the linear independentcomponents of a system, i.e. those components that cannot be described by a multipleof one or the combination of several other components.
1.4.1. Constraint-based ModelingConstraint-based modeling is a static modeling approach applicable for large-scale meta-bolic networks. A constraint-based reconstruction is a union of (i) a stoichiometricallybalanced metabolic model, (ii) a set of constraints for metabolic fluxes, and (iii) the listof genes responsible for the catalysis of reactions included in the model. The pseudosteady state-assumption, which states that the concentrations of the metabolites do notchange over a certain period of time such that every discrete time point can be simulatedas if the system would be in a true steady state. Therefore, to build a constraint-basedmodel the knowledge of only the stoichiometry and the (ir)reversibility of the reactionsthat can occur within the modeled system is indispensable. Detailed knowledge onspecies quantities, reaction mechanisms and the respective kinetic parameters (whichare usually unknown) is not required. The genes are connected with the reactions bylogical expressions and do not mandatorily have to be defined. The relation of systemcomponents m and reactions n is defined by the stoichiometric matrix, a matrix of sizemxn. Under steady state conditions the concentrations of the network components donot change, i.e.
N · ν = 0 (1.2)
with ν = (v1, ..., vn) being the vector of reaction velocities fulfilling the steady statecondition.The constraints limit the metabolic fluxes and can be based on diverse experimen-
tal data, such as in vivo flux determinations, gene expression data or experimentallyquantified metabolite conversions. Constraints commonly limit the available nutrientsby setting maximum values for the source or the uptake reactions for sparse or knowngrowth limiting nutrients. In addition, constraints can be used to define essential func-tions of the modeled networks, such as detoxification from metabolic by-products or theturnover of cellular entities such as mRNAs or proteins.A number of analysis methods exist that allow to extract various features of the
metabolic network, such as maximal growth yields or gene essentiality, and enable pre-dictions about the flux distribution and the resulting behavior in different situations,some of which are described below.
Flux Balance Analysis (FBA)
FBA is an analysis method that predicts flux distributions of a metabolic reconstructionand is applicable to genome scale networks [Varma and Palsson, 1994a,b, Orth et al.,2010]. To this end, linear programming is used to optimize this flux distribution for agiven set of nutrients and minimal requirements (defined by constraints A · ν ≤ b) and
21
1. Introduction
towards one or several objective functions:
F = c> · ν (1.3)
with c> being a vector of weights indicating the contribution of each reaction to theobjective function. Common objective functions are biomass or energy production (max-imization of the respective flux) or detoxification (minimization of the synthesizing fluxand/or maximization of degrading flux). If the formulated FBA problem is feasible, i.e.the provided nutrients allow to match all requirements defined by the constraints of themodel, an optimal flux distribution is predicted. However, this may not necessarily bethe only optimal solution. Indeed, the analysis of flux distribution spaces showed that,especially in more complex networks with many branching components (i.e. componentsthat do interconnect different routes of the modeled system), it is highly probable thatmore than one optimal solution with respect to the objective function and the simulatedconditions exist [Mahadevan et al., 2002].
Growth Simulations
The prediction of flux distributions can also be used to assess growth rates for the sim-ulated organism, if the FBA is optimized towards growth. However, to this end thebiomass composition of the respective organism, i.e. the different cellular components,ranging from macromolecules, such as DNA, RNA, or proteins, to simple metabolicmolecules, has to be determined. The biomass composition of mycoplasmas differs sig-nificantly from those of higher prokaryotes, such as E. coli, due to the lacking cell walland the reduced cell size and genome. In a general form, the biomass equation definingthe average macromolecular cell composition of M. pneumoniae and putatively the othermycoplasmas reads:
DNA + RNA + proteins + lipids + freebases+free amino acids + fatty acids + cofactors
−→ Biomass (1.4)
The different cellular components have to be identified and at least in their majorityquantified to allow a realistic reproduction of the metabolic processes involved in theiruptake and synthesis.Once the biomass composition of the modeled organism is known, FBA can be used
to simulate growth and determine in silico doubling times. If growth, represented bybiomass production, is the objective function for the FBA problem, the resulting objec-tive value ov can be directly related to the growth rate tdoub. When exponential growthis simulated, this relation is in general described by:
tdoub = ln(2)ov
. (1.5)
If the cell population is maintained at a constant size, i.e. if the steady state assumptionalso applies to the total amount of cells simulated as assumed for the model presented
22

1.4. Mathematical Background
in this thesis, then this relation simply reads:
tdoub = 1ov. (1.6)
In Silico Knock-outs
To simulate gene knock-outs in silico, all reactions catalyzed by the gene that shall beknocked out are silenced (i.e. their maximum flux is set to zero). FBA with growth asobjective function is used to determine the knock-out effect on the system’s behaviorand the flux distribution. Thereby, the objective value of the knock-out simulation ovko
when compared to that of the wild type ovwt allows to distinguish between differentmutant phenotypes. If ovko equals ovwt, the knocked out gene has no effect on thegrowth rate of the organism under the simulated conditions. When 0 <ovko <ovwt,then the respective gene knock-outs produces a reduced fitness phenotype. An ovko = 0represents growth arrest but not death of the respective mutant and if no ovko is given,the in silico gene deletion rendered the FBA problem infeasible, i.e. at least one of theminimum requirements specified by the constraints cannot be matched by the knock-outmutant. When silencing the reactions of two different genes at the same time doubleknock-out phenotypes can be predicted.
1.4.2. Enzyme KineticsAs mentioned beforehand, several mathematical formalisms exist to describe differentaspects of biochemical reactions when aiming to analyze time-dependent changes of abiological system [Klipp et al., 2005]:
• Boolean Rules describe the qualitative time-dependent relation between the dif-ferent system components in form of ”if-then” statements for discrete steps, suchas C(t + 1) = A(t) + B(t) with A, B, and C being the system components andt the time. The components of a Boolean model have two possible states: theyare either present and active or not active (regardless of if they are present or not)with respect to the modeled process.
• The Law of Mass Action states that the velocity v of a reaction j is proportionalto the probability that the involved reactants Xi meet, i.e. to the product of theconcentrations of all reactants.
• Michaelis-Menten-like Kinetics are usually employed for the description ofenzyme-catalyzed reactions. They base on an enzymatic mechanism introduced byBrown [1902] for irreversible one substrate (S) reactions without effectors. Thismechanism assumes that in such enzyme-catalyzed reactions a reversible formationof an enzyme-substrate complex (ES) is followed by the irreversible release of theproduct (P):
E + Sk1−−−⇀↽−−−
k−1
ES −−→ E + P (1.7)
23

1. Introduction
To build a model that is able to reproduce experimentally observed behavior and possiblyeven has predictive power the kinetic laws describing the biochemical processes underdetermination have to be chosen with caution. Apart from the question the model isaimed to answer, quantity and quality of the available data can influence on this decision,since the appropriate kinetic law should avoid the problem of overfitting described insection 1.4.3. In the simplest case, i.e. when the reaction velocity v only depends on onesystem component, the Law of Mass Action is applied in its simplest form:
vj = k ·X (1.8)
When the reaction velocity depends on more than one system component, higher orderkinetics, considering the probability that the two components meet, have to be applied:
vj = k ·i∏Xi (1.9)
For enzyme catalyzed reactions, enzyme kinetics are usually employed. In general, themaximum velocity Vmax of a reaction is equal to the product of the enzyme concentrationE and its catalytic rate kcat.
Vmax = E · kcat (1.10)
Probably the most common kinetic applied in models for biological processes is theMichaelis Menten Kinetic, that for a simple reaction as described by Equation 1.7 reads:
v = Vmax · SKm + S
(1.11)
with Km being the Michaelis constant that represents the substrate concentration athalf maximum velocity.However, the more detailed the mathematical formalism, the less straight forward the
parametrization of the included variables. For large biological systems, such as metabolicnetworks, dynamic modeling approaches are difficult if not impossible to apply since theyrequire detailed experimental information on the majority of the system components.Hence, a possible extraction of information about the network dynamics already fromstatic metabolic models, provides a great advantage for the design of dynamic models forthe different metabolic sub-systems. To this end, the integration of knowledge on enzymekinetics with experimental data provides a powerful method, allowing, for example, tocalculate kinetic parameters directly from in vivo data by adapting Equation 1.10.
1.4.3. Model ParametrizationThe model parametrization is one of the greatest challenges during the model buildingprocess [Kitano, 2002b]. Parameters describe specific properties of the examined system,e.g. catalytic rates of enzymes, inhibitory and activatory regulation, binding or dissocia-tion constants or the velocity of a reaction. They have to be calibrated carefully to allowthe model to accurately describe the system properties and to reproduce experimentalfindings, which is indispensable when aiming to obtain biological knowledge gain from
24

1.4. Mathematical Background
model predictions.However, in most of the cases, the experimental data available is either sparse or not
suitable for the applied modeling approach. Furthermore, this data reflects the behaviorof the examined biological system under the specific conditions in which the experimenthas been accomplished. Indeed, when the physical and chemical conditions, for exam-ple the temperature or the pH of the growth medium in cell culture, are changed, thecellular behavior changes and thus do the parameters describing the modeled cellularsub-system. In addition, experimental data is generally not accurate due to experimen-tal errors introduced during sample preparation and analysis techniques. In contrast,mathematical equations are exact (based on their respective definitions), except fromrounding errors that result from limited accuracy in computational calculations. Theycan only consider a defined error, for instance by allowing a deviation for specific param-eters or by considering probabilities as in stochastic modeling approaches. Therefore, itis of upmost importance that the chosen mathematical formalism reflects the availabledata in order to avoid overfitting when many parameters are fitted to only few datapoints [Draper and Smith, 1998]. The term overfitting describes the determination of aparameter set for a mathematical model that despite being able to reproduce the dataused for fitting does not represent the actual biological properties of the system butonly a possible mathematical formalism to describe the training data. In general, thoseparameter sets do not reliably predict independent evaluation data, not used during thefitting process.In this work, the constraint-based modeling approach and FBA have been applied.
Based on the assumed steady state, no kinetic parameters as known from ODE basedapproaches are included. Instead, only the stoichiometric information, the reactionreversibilities, and the effective reaction velocities define the prediction results. The sto-ichiometric information and the reversibility base on the inherent biochemical propertiesof the modeled organism (genes, proteins, cellular composition) and have to be definedcarefully during the model reconstruction process. If possible, they should be based onin vivo metabolite measurements, either directly identifying the metabolic intermediatesor proving pathway activity based on end product quantifications, or on labeled isotopetracing experiments. The effective reaction velocities reflect the simulated growth condi-tions. To this end, they are limited by so-called constraints, either defining a minimumor a maximum flux for the respective reaction, in order to allow the in silico reproduc-tion of nutrient conditions and metabolic functions, such as detoxification or cellularhomeostasis.The modeling platform ToBiN (Toolbox for Biological Networks, the source code
is available at http://github.com/miguelgodinho/tobin), employed for the presentedmetabolic model, uses constraints of the unit mmol*g−1*h−1. Therefore, all experi-mental data, for example the number of glucose molecules taken up per cell and second,has to be converted into this unit. Once the constraints have been determined correctly,the FBA solver optimizes the flux distribution towards the defined objective function,growth in form of biomass production for M. pneumoniae. Changing sets of constraintsallow to simulate different growth conditions and the resulting flux distributions canprovide information about the metabolic behavior, the network connectivity, its adap-
25

1. Introduction
tive capacities towards conditional changes, and on the importance of single networkcomponents, especially of metabolic enzymes.The one correct formalism for the calculation all flux constraints of a constraint-
based model, which are needed to allow the correct description of the simulated networkbehavior, does not exist. Nevertheless, maximum constraints are often calculated fromcatalytic rates or in vivo metabolite depletion or synthesis rates. Minimum constraints,for instance, can be determined based on turnover rates or reflect qualitatively essentialfunctions, such as the degradation or secretion of toxic metabolic by-products. Finally,it is important to note that as for any other mathematical modeling approach, the dataused for evaluating the hypotheses drawn from the model should be independent of thetraining data used to determine the model parameters.
26

2. An Interactive Database for M.pneumoniae: MyMpn
This chapter aims to introduce into M. pneumoniae research by describing the devel-opment of an interactive database and working platform for M. pneumoniae, MyMpn,aimed to be released at the end of 2012. The database design and development havebeen finished and the manuscript is in preparation. However, additional data and acomparative analysis of M. pneumoniae and M. genitalium shall be included before thepublic release. This can lead to changes on the content of the database and on the dif-ferent sections of the interface when compared to the state of the art described herein.Since the design process of a database itself is the major result, there is no separateMaterial and Methods section contained in this chapter. Instead, the applied methodsare mentioned and detailed throughout the results section.
I am responsible for the design of the database structure, the data collection and format-ting, the coding of statistical analysis tools, the design of the clickable metabolic map,and the coordination of the database project. I further contributed to the developmentof most included analysis tools by accomplishing functional tests. The implementationof the database and the web interface, including the advanced search tool BioMart, thegenome browser, the interactive tool for the metabolic map, the comparative alignmentsof M. pneumoniae proteins to other organisms, and the embedding of the statistical andvisualization tools has been accomplished by the Bioinformatics core facility at the CRG,Barcelona.
2.1. IntroductionMathematical modeling of biological systems requires comprehensive (experimental)data that is properly annotated, well sorted, and easy accessible. During the past yearsa wealth of organism-wide datasets for the genome, the transcriptome, the proteome andthe metabolism of M. pneumoniae have been produced by the different groups involvedin the mycoplasma project [Güell et al., 2009, Lluch-Senar et al., manuscript in prepa-ration, Kühner et al., 2009, Maier et al., 2011, van Noort et al., 2012, Yus et al., 2009].This data was locally stored in the different research groups and exchanged upon re-quest. Obviously, this is not an optimal solution for information exchange based on datasharing, since each researcher has to know if the needed data is available and who pro-duced it. Furthermore, the data has to be requested each time what is time-consuming,especially if personal availability is taken into account. However, when aiming to studyan organism applying the systems biology approach, it is of upmost importance to know
27
2. An Interactive Database for M. pneumoniae: MyMpn
what kind and quantity of data is available, since this information directly influences onthe decision which modeling approaches to apply for the different cellular subsystems.We developed and implemented a database for M. pneumoniae that contains the avail-
able data on genomics, transcriptomics, proteomics, metabolomics, phylogenomics, andregulomics, as well as data analysis and visualization tools aimed to supply comprehen-sive information about one of the most promising model organisms in systems biology.
2.2. ResultsWe developed an interactive database, MyMpn, providing a data storage for M. pneu-moniae data produced by different research groups and a working platform for re-searchers interested in mycoplasmas (http://mycoplasma.crg.es). In addition, the cat-aloging of the data and the greatest possible standardization of its storage format fa-cilitates the development of mathematical models for M. pneumoniae. The databasedevelopment process can be divided into five main steps (Figure 2.1):
1. the collection of the experimental data to be included and the subsequent definitionof the general database structure,
2. the design and implementation of the database tables,
3. the entering of the available data into the database,
4. the implementation of the web interface,
5. the integration of existing and newly developed analysis and visualization tools,
Those steps are outlined in the following subsections.
2.2.1. Data Collection and Structural Design of the DatabaseIn a first step towards the design of a database for M. pneumoniae, we collected theexperimental data from the different research groups to get an overview about the datatypes and the possible interconnecting features. We obtained mRNA expression data[Güell et al., 2009], growth curve measurements [Yus et al., 2009], metabolite assaydata [Yus et al., 2009], protein quantification data [Maier et al., 2011], results fromphylogenomic studies (unpublished results) and the screening of a transposon library[Lluch-Senar et al., manuscript in preparation], information about protein complexes[Kühner et al., 2009] and about post-translational modification sites [van Noort et al.,2012], functional annotation data [Güell et al., 2009, Yus et al., 2009], sequencing results[Yus et al., 2009, Güell et al., 2009], the metabolic network [Yus et al., 2009], and picturesand videos obtained by light microscopy (unpublished results) and nuclear magneticresonance tomography [Seybert et al., 2006]. Due to the different format of of the data,varying from text files over vector-based and other graphics to movies, and the differingsize and content of the experimental datasets (e.g. different numbers of samples and
28

2.2. Results
database structure
table implementation
MyMpn
1
2
4
5
data access
3
mathematical modeling
6analysis and visualization
tools
web interface
genome-scale datasets on genomics, transcriptomics, proteomics, & metabolism
available tools adapted to
Mpn
analysis and visualization
tool
Figure 2.1.: Workflow for the design of the M. pneumoniae database, MyMon. 1: Datacollection and definition of the database structure; 2: Implementation of thedatabase tables; 3: Entering of the data; 4: Development of the web inter-face to provide data access; 5: Integration of data analysis and visualizationtools; 6: Applications of theMyMpn database. Database input from the my-coplasma project has red fonts, existing analysis tools that have been adaptedto M. pneumoniae (Mpn) orange fonts and the actual applications of thedatabase green fonts.
29

2. An Interactive Database for M. pneumoniae: MyMpn
replicates), the definition of appropriate tables that allow space efficient data storageand fast data access is not a trivial task.To provide organism-wide information, the database cannot put any restrictions on the
data types to be included, neither for the accessible data nor for data that may becomeavailable in the future. The different experimental results have been structured allowingnot only the simple storage but also the interconnection of different experimental resultsthat provide information on the same aspect of interest, for example mRNA and proteinabundances for the same gene, or all genes that have been specifically regulated undera certain perturbation condition. To this end, whenever possible data and informationhave been sorted associated to MPN IDs. Those IDs refer to different sections on thegenome, amongst them genes, non-coding RNAs, and regulatory regions, as well as tothe encoded proteins or RNAs. Data which cannot be assigned to different MPN IDs, forexample metabolite identification and quantification data, has to be organized in formof raw and processed data sheets which can later be used online for visualization or bedownloaded for further analysis.In conclusion of the data collection process, we identified two general rules according to
which the database has to be designed: i) experimental data needs to be stored allowingas well access to the raw data as also to connect results from different experiments andii) to provide practical tools for data analysis, a possibility to temporarily upload andstore unpublished data in the genome browser (’GBrowse’) without thereby providingfree access to this data is required. While the first rule seems to be obvious, the secondrule would provide the possibility to analyze newly produced data in a standardizedway, what implicates two major advantages. The results from different experimentsaccomplished by different researchers are comparable and the integration of new datainto the existing database structure is facilitated.
2.2.2. Design and Implementation of the Database TablesIn collaboration with the Bioinformatics Core Facility at the CRG Barcelona, we de-signed the structure of the MyMpn database based on the available experimental data,but taking into account that more and different data will be produced in the future(UML class diagram: Figure 2.2). To further allow the implementation of an advancedsearch tool, able to extract and combine information from the different data tables, wedesigned all data tables according to some general principles:
• Usage of separate tables for the different cellular entities, i.e. genes, mRNAs,proteins, etc.
• Usage of database internal IDs to uniquely identify the different database entries.
• Connection of information from different tables if possible based on the databaseinternal ’gene_id’ assigned to each annotated gene, which accordingly, should beincluded as a foreign key in all tables which store gene, RNA, or protein relatedinformation.
30
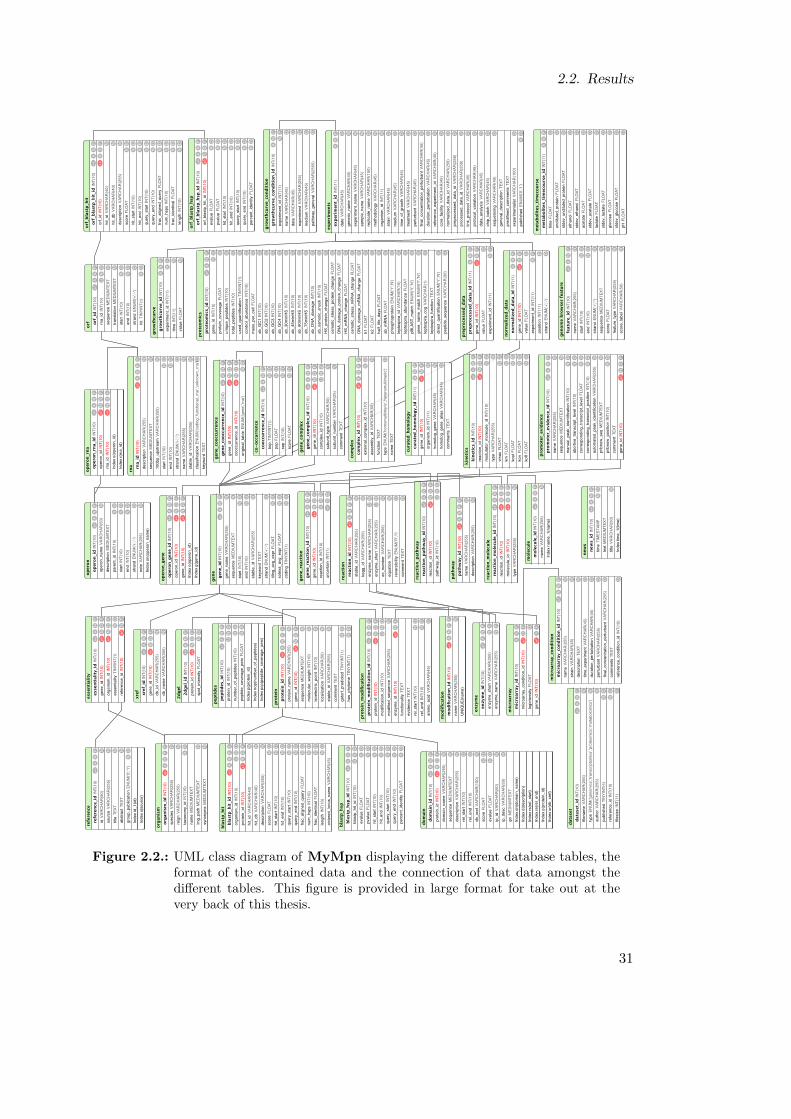
2.2. Results
mic
roar
ray_
cond
itio
nm
icro
arra
y_co
nd
itio
n_i
dIN
T(10
)P
NA
+/-
nam
eVA
RC
HAR
(255
)N
stra
inVA
RCHA
R(45
)N
desc
riptio
nTE
XTN
time_
expe
rimen
tVAR
CHAR
(45)
Ddu
ratio
n_pe
rturb
atio
nVA
RCHA
R(4
5)D
pertu
rban
tVAR
CH
AR(2
55)
Dfin
al_c
once
ntra
tion_
pertu
rban
tVAR
CH
AR(2
55)
Dco
mm
ents
TEXT
refe
renc
e_co
nditi
on_i
dIN
T(10
)D
mole
cule
mole
cule
_id
INT(
10)
PN
A+/
-na
me
VAR
CH
AR(2
55)
NIn
dex
nam
e_1(
nam
e)
met
abolite
s_ti
mec
ours
em
etab
olite
s_ti
mec
ours
e_id
INT(
11)
PN
Atim
eFL
OAT
Dun
dilu
ted_
prot
ein
FLO
ATD
stde
v_un
dilu
ted_
prot
ein
FLO
ATD
etha
nolF
LOAT
Dst
dev_
etha
nolF
LOAT
Dac
etat
eFL
OAT
Dst
dev_
acet
ate
FLO
ATD
lact
ate
FLO
ATD
stde
v_la
ctat
eFL
OAT
Dgl
ucos
eFL
OAT
Dst
dev_
gluc
ose
FLO
ATD
pHFL
OAT
D
new
snew
s_id
INT(
10)
PN
A+/
-tim
eTI
MES
TAM
PD
Nte
xtM
EDIU
MTE
XTtit
leVA
RCH
AR(5
0)N
Inde
x tim
e_1(
time)
op
eron
op
eron_i
dIN
T(10
)P
NA
+/-
oper
on_n
ame
VARC
HAR
(50)
Nde
scrip
tion
MED
IUM
TEXT
pare
nt_i
dIN
T(10
)D
Nst
artI
NT(1
0)D
Nen
dIN
T(10
)D
Nst
rand
ENUM
('+','-
')D
note
VAR
CH
AR(2
55)
NIn
dex
on(o
pero
n_na
me)
orf o
rf_i
dIN
T(10
)P
NA
+/-
rna_
idIN
T(10
)D
NU
sequ
ence
MED
IUM
TEXT
Ntra
nsla
tion
MED
IUM
TEXT
Nst
artI
NT(1
0)D
Nen
dIN
T(10
)D
Nst
rand
ENUM
('+','-
')D
hitT
INYI
NT(1
)D
N
gen
egen
e_id
INT(
10)
PN
A+/
-ge
ne_n
ame
VAR
CH
AR(2
55)
Nse
quen
ceM
EDIU
MTE
XTN
star
tINT
(10)
DN
end
INT(
10)
DN
stab
le_i
dVA
RC
HAR
(255
)N
keyw
ord
TEXT
stra
ndEN
UM('+
','-')
Dtil
ing_
avg_
expr
FLO
ATD
Nso
lexa
_avg
_exp
rFL
OAT
DN
codi
ngTI
NYIN
T(1)
DN
gen
om
e b
row
ser
feat
ure
feat
ure
_id
INT(
10)
PN
A+/
-na
me
VAR
CH
AR(2
55)
Nst
artI
NT(1
0)D
Nen
dIN
T(10
)D
Nst
rand
ENUM
('+','-
')D
sequ
ence
MED
IUM
TEXT
Nsc
ore
FLO
ATD
feat
ure_
type
VAR
CH
AR(2
55)
Nsc
ore_
labe
lVAR
CHA
R(5
0)N
exp
erim
ents
exp
erim
ent_
idIN
T(11
)P
NA
date
VAR
CHAR
(45)
Dge
neric
_nam
eVA
RCH
AR(4
5)N
expe
rimen
t_na
me
VARC
HAR(
45)
Nsa
mpl
e_na
me
VARC
HAR
(45)
Nre
plic
ate_
nam
eVA
RC
HAR
(150
)D
met
hodo
logy
VARC
HAR
(45)
Nor
gani
sm_i
dIN
T(11
)N
stra
inVA
RCH
AR(4
5)D
med
ium
VARC
HAR(
45)
Dtim
e_of
_gro
wth
VARC
HAR(
45)
Dtre
atm
entV
ARCH
AR(4
5)D
pertu
rban
tVAR
CHA
R(45
)D
final
_con
cent
ratio
n_pe
rturb
antV
ARC
HAR
(45)
Ddu
ratio
n_pe
rturb
atio
nVA
RCHA
R(45
)D
refe
renc
e_ex
perim
ent_
idVA
RCH
AR(4
5)D
core
_fac
ility
VARC
HAR(
45)
Dno
rmal
ized
_dat
a_id
VAR
CH
AR(2
56)
Dpr
epro
cess
ed_d
ata_
idVA
RC
HAR
(256
)D
proc
esse
d_da
ta_i
dVA
RC
HAR
(256
)D
link_
prot
ocol
VARC
HAR
(45)
Dpr
otoc
ol_v
aria
tion
VAR
CHAR
(45)
Dda
ta_a
naly
sis
VAR
CHAR
(45)
Dch
ip_b
atch
VARC
HAR
(45)
Dse
quen
cing
VARC
HAR
(45)
Dge
nera
l_de
scrip
tion
TEXT
pred
ifine
d_co
mm
ents
TEXT
expe
rimen
talis
tVAR
CH
AR(1
00)
Dpu
blis
hed
ENUM
('0','1
')D
N
pep
tid
esp
epti
des
_id
INT(
10)
PN
A+/
-pr
otei
n_id
INT(
10)
DN
Unu
mbe
r_of
_pep
tides
INT(
10)
DN
pept
ide_
cove
rage
_per
cFL
OAT
DN
Inde
x p(
prot
ein_
id)
Inde
x no
p(nu
mbe
r_of
_pep
tides
)In
dex
pcp(
pept
ide_
cove
rage
_per
c)
dat
aset
dat
aset
_id
INT(
10)
PN
A+/
-fil
enam
eVA
RC
HAR
(255
)N
type
ENUM
('gen
omics
','tra
nscr
ipto
mics
','pro
teom
ics','m
etab
olom
ics')
Nau
thor
VAR
CH
AR(2
55)
Npu
blis
hed
TINY
INT(
4)D
Nre
fere
nce_
idIN
T(10
)D
Nfil
esiz
eIN
T(11
)D
pro
teom
ics
pro
teom
ics_
idIN
T(10
)P
NA
+/-
gene
_id
INT(
10)
DN
prot
ein_
cove
rage
FLO
ATD
uniq
ue_p
eptid
esIN
T(10
)D
tota
l_pe
ptid
esIN
T(10
)D
used
_qua
ntifi
catio
nTI
NYIN
T(1)
Dco
ntro
l_ab
unda
nce
INT(
10)
Dm
ass_
per_
cell
FLO
ATD
ab_G
C1
INT(
10)
Dab
_GC
2IN
T(10
)D
ab_G
C3
INT(
10)
Dab
_GC
4IN
T(10
)D
ab_3
0min
HS
INT(
10)
Dab
_45m
inH
SIN
T(10
)D
ab_6
0min
HS
INT(
10)
Dab
_75m
inH
SIN
T(10
)D
ab_D
NA_
dam
age
INT(
10)
Dab
_osm
otic
_sho
ckIN
T(10
)D
HS_
prot
ein_
chan
geFL
OAT
Dos
mot
ic_s
tress
_pro
tein
_cha
nge
FLO
ATD
DN
A_da
mag
e_pr
otei
n_ch
ange
FLO
ATD
HS_
mR
NA_
chan
geFL
OAT
Dos
mot
ic_s
tress
_mRN
A_ch
ange
FLO
ATD
DN
A_da
mag
e_m
RN
A_ch
ange
FLO
ATD
k1FL
OAT
Dk2
FLO
ATD
half_
life_
days
FLO
ATD
ab_m
RN
AFL
OAT
Dph
osph
opro
tein
ENUM
('Y','N
')D
lept
ospi
ra_i
dVA
RCHA
R(1
5)D
lept
ospi
ra_a
bund
ance
FLO
ATD
pBLA
ST_m
atch
ENUM
('Y','N
')D
gene
_nam
e_m
atch
ENUM
('Y','N
')D
lept
ospi
ra_c
ogVA
RCHA
R(1)
Dle
ptos
pira
_fun
ctio
nTE
XTdi
rect
_qua
ntifi
catio
nEN
UM('Y
','N')
Dpe
ptid
e_se
quen
ceVA
RCHA
R(30
)D
co-occ
urr
ence
coocc
urr
ence
_id
INT(
10)
PN
A+/
-bo
pTI
NYIN
T(1)
DN
pop
FLO
ATD
Nse
pIN
T(10
)D
Nsc
ore
FLO
ATD
N
bla
stp
_hsp
bla
stp
_hsp
_id
INT(
10)
PN
A+/
-bl
astp
_hit_
idIN
T(10
)D
NU
eval
ueFL
OAT
DN
pval
ueFL
OAT
DN
hit_
star
tINT
(10)
DN
hit_
end
INT(
10)
DN
quer
y_st
artI
NT(1
0)D
Nqu
ery_
end
INT(
10)
DN
perc
ent_
iden
tity
FLO
ATD
N
refe
rence
refe
rence
_id
INT(
10)
PN
A+/
-id
VAR
CHAR
(50)
Nso
urce
VAR
CH
AR(2
55)
Ntit
leTE
XTN
abst
ract
TEXT
Ngr
oup_
publ
icat
ion
ENUM
('0','1
')D
NIn
dex
id_1
(id)
Inde
x s(
sour
ce)
mod
ifica
tion
mod
ifica
tion_i
dIN
T(10
)F
PN
A+/
-na
me
VAR
CH
AR(2
55)
NU
NIQ
UE(
nam
e)
mic
roar
ray
mic
roar
ray_
idIN
T(10
)P
NA
mic
roar
ray_
cond
ition
_id
INT(
10)
FD
+/-
logi
nten
sity
FLO
ATD
gene
_id
INT(
10)
FN
+/-
norm
aliz
ed_d
ata
norm
aliz
ed_d
ata_
idIN
T(11
)P
NA
gene
_id
INT(
10)
FD
+/-
valu
eFL
OAT
Dex
perim
ent_
idIN
T(11
)F
Npo
sitio
nIN
T(11
)D
stra
ndEN
UM('+
','-')
D
kin
etic
skin
etic
s_id
INT(
10)
PN
A+/
-re
actio
n_id
INT(
10)
FD
N+/
-m
odul
ator
_mol
ecul
e_id
INT(
10)
DN
type
VAR
CH
AR(2
55)
Nvm
axFL
OAT
DN
kmFL
OAT
DN
kcat
FLO
ATD
Nko
nFL
OAT
DN
koff
FLO
ATD
N
gro
wth
curv
e_co
nd
itio
ngro
wth
curv
e_co
nd
itio
n_i
dIN
T(10
)P
NA
expe
rimen
t_id
INT(
11)
FN
nam
eVA
RCH
AR(4
5)D
date
VAR
CHAR
(45)
Dex
perim
entV
ARC
HAR
(255
)D
med
ium
VARC
HAR(
45)
Dpa
thw
ay_g
ener
alVA
RC
HAR
(255
5)D
op
eron_g
ene
op
eron_g
ene_
idIN
T(10
)P
NA
+/-
oper
on_i
dIN
T(10
)F
DN
+/-
gene
_id
INT(
10)
FD
N+/
-In
dex
o(op
eron
_id)
Inde
x g(
gene
_id)
gro
wth
curv
egro
wth
curv
e_id
INT(
10)
PN
Aex
perim
ent_
idIN
T(11
)F
Ntim
eIN
T(11
)N
valu
eFL
OAT
N
op
eron_r
na
op
eron_r
na_
idIN
T(10
)P
NA
+/-
oper
on_i
dIN
T(10
)F
DN
+/-
rna_
idIN
T(10
)F
DN
+/-
Inde
x o(
oper
on_i
d)In
dex
r(rna
_id)
gen
e_re
acti
on
gen
e_re
acti
on_i
dIN
T(10
)P
NA
+/-
gene
_id
INT(
10)
FD
N+/
-re
actio
n_id
INT(
10)
DN
Uun
certa
inIN
T(1)
DN
+/-
gen
e_co
occ
urr
ence
gen
e_co
occ
urr
ence
_id
INT(
10)
PN
A+/
-ge
ne_i
dIN
T(10
)F
DN
+/-
cooc
curre
nce_
idIN
T(10
)F
DN
+/-
orig
inal
_tab
leEN
UM('g
ene'
,'rna
')D
N
orf
_bla
stp
_hit
orf
_bla
stp
_hit
_id
INT(
10)
PN
A+/
-or
f_id
INT(
10)
FD
N+/
-hi
t_id
VARC
HAR
(40)
Nhi
t_db
VARC
HAR
(40)
Nde
scrip
tion
VAR
CH
AR(2
55)
Nsc
ore
FLO
ATD
Nhi
t_st
artI
NT(1
0)D
Nhi
t_en
dIN
T(10
)D
Nqu
ery_
star
tINT
(10)
DN
quer
y_en
dIN
T(10
)D
Nfra
c_al
igne
d_qu
ery
FLO
ATD
Nnu
m_h
sps
INT(
10)
DN
frac_
iden
tical
FLO
ATD
Nle
ngth
INT(
10)
DN
gen
e_co
mp
lex
gen
e_co
mp
lex_
idIN
T(10
)P
NA
+/-
gene
_id
INT(
10)
FD
N+/
-co
mpl
ex_i
dIN
T(10
)D
NU
subu
nit_
type
VAR
CHAR
(50)
Nsu
buni
t_nu
mbe
rVA
RCHA
R(25
)N
com
men
tTEX
T
orf
_bla
stp
_hsp
orf
_bla
stp
_hsp
_id
INT(
10)
PN
A+/
-or
f_bl
astp
_hit_
idIN
T(10
)F
DN
+/-
eval
ueFL
OAT
DN
pval
ueFL
OAT
DN
hit_
star
tINT
(10)
DN
hit_
end
INT(
10)
DN
quer
y_st
artI
NT(1
0)D
Nqu
ery_
end
INT(
10)
DN
perc
ent_
iden
tity
FLO
ATD
N
org
anis
morg
anis
m_i
dIN
T(10
)F
PN
A+/
-sp
ecie
sVA
RC
HAR
(255
)D
reig
nVA
RC
HAR
(255
)N
taxo
nom
y_id
INT(
10)
DN
nam
eM
EDIU
MTE
XTim
g_pa
thM
EDIU
MTE
XTN
syno
nym
sM
EDIU
MTE
XTN
pat
hw
ayp
athw
ay_i
dIN
T(10
)F
PN
A+/
-na
me
VAR
CH
AR(2
55)
Nde
scrip
tion
VAR
CH
AR(2
55)
N
esse
nti
alit
yes
senti
alit
y_id
INT(
10)
PN
A+/
-ge
ne_i
dIN
T(10
)F
DN
+/-
orga
nism
_id
INT(
10)
FD
N+/
-es
sent
ialit
yTI
NYIN
T(1)
DN
refe
renc
e_id
INT(
10)
FN
+/-
pre
pro
cess
ed_d
ata
pre
pro
cess
ed_d
ata_
idIN
T(11
)P
NA
gene
_id
INT(
10)
FN
+/-
valu
eFL
OAT
Dex
perim
ent_
idIN
T(11
)F
N
enzy
me
enzy
me_
idIN
T(10
)P
NA
+/-
enzy
me_
shor
tVAR
CH
AR(2
55)
FN
enzy
me_
nam
eVA
RC
HAR
(255
)F
N
pro
mote
r_ev
iden
cep
rom
ote
r_ev
iden
ce_i
dIN
T(10
)P
NA
+/-
nam
eVA
RC
HAR
(255
)N
sequ
ence
MED
IUM
TEXT
Nm
anua
l_pe
ak_i
dent
ifica
tion
INT(
10)
DN
abor
tive_
trans
crip
t_le
velI
NT(1
0)D
Nco
rresp
ondi
ng_t
rans
crip
t_le
velF
LOAT
DN
corre
spon
ding
_tra
nscr
ipt_
posi
tion
INT(
10)
DN
auto
mat
ed_p
eak_
iden
tifica
tion
VAR
CH
AR(2
55)
Npr
ibno
w_s
eqM
EDIU
MTE
XTN
prib
now
_pos
ition
INT(
10)
DN
com
men
tTEX
Tge
ne_i
dIN
T(10
)F
DN
+/-
dom
ain
dom
ain_i
dIN
T(10
)P
NA
+/-
prot
ein_
idIN
T(10
)F
DN
+/-
dom
ain_
nam
eVA
RC
HAR
(255
)N
sequ
ence
MED
IUM
TEXT
Nde
scrip
tion
VAR
CH
AR(2
55)
Nre
l_st
artI
NT(1
0)D
rel_
end
INT(
10)
Ddb
_xre
fVAR
CH
AR(1
00)
Nsc
ore
FLO
ATD
Nev
alue
FLO
ATD
Nip
_id
VARC
HAR(
50)
Nip
_des
cVA
RCH
AR(5
0)N
goM
EDIU
MTE
XTIn
dex
dn(d
omai
n_na
me)
Inde
x d(
desc
riptio
n)In
dex
rs(re
l_st
art)
Inde
x re
(rel_
end)
Inde
x p(
prot
ein_
id)
Inde
x xr
(db_
xref
)
pro
tein
pro
tein
_id
INT(
10)
FP
NA
+/-
prot
ein_
nam
eVA
RC
HAR
(255
)N
gene
_id
INT(
10)
FD
N+/
-se
quen
ceM
EDIU
MTE
XTN
mol
ecul
ar_w
eigh
tINT
(10)
Dis
oele
ctric
_poi
ntIN
T(10
)D
loca
lizat
ion
VAR
CHAR
(50)
Nst
able
_id
VAR
CH
AR(2
55)
Nco
mm
entT
EXT
geto
rf_pr
edic
ted
TINY
INT(
1)D
Nha
s_ph
ylom
eTI
NYIN
T(1)
DN
pro
tein
_mod
ifica
tion
pro
tein
_mod
ifica
tion_i
dIN
T(10
)P
NA
+/-
prot
ein_
idIN
T(10
)F
DN
+/-
mod
ifica
tion_
idIN
T(10
)D
NU
mod
ified
_seq
uenc
eVA
RC
HAR
(255
)N
enzy
me_
idIN
T(10
)F
N+/
-fu
nctio
nalit
yTE
XTev
iden
ceTE
XTre
l_st
artI
NT(1
0)D
Nre
l_en
dIN
T(10
)D
Nam
ino_
acid
VAR
CHAR
(45)
D
cura
ted
_hom
olo
gy
cura
ted
_hom
olo
gy_
idIN
T(11
)P
NA
gene
_id
INT(
10)
FN
+/-
orga
nism
_id
INT(
11)
Nho
mol
og_g
ene
VAR
CHAR
(45)
Nho
mol
og_g
ene_
alia
sVA
RCH
AR(4
5)D
com
men
tsTE
XT
reac
tion
reac
tion_i
dIN
T(10
)F
PN
A+/
-st
able
_id
VAR
CH
AR(2
55)
Nke
gg_i
dVA
RC
HAR
(255
)N
enzy
me_
nam
eVA
RC
HAR
(255
)N
Uen
zym
e_sh
ortV
ARC
HAR
(255
)N
Uec
_num
ber
VAR
CH
AR(2
55)
Neq
uatio
nTE
XTN
reve
rsib
ility
ENUM
('R','I
')D
com
men
tTEX
TN
reac
tion_m
ole
cule
reac
tion_m
ole
cule
_id
INT(
10)
PN
A+/
-re
actio
n_id
INT(
10)
FD
N+/
-m
olec
ule_
idIN
T(10
)F
DN
+/-
type
VAR
CH
AR(2
55)
N
com
ple
xco
mp
lex_
idIN
T(10
)F
PN
A+/
-ex
tern
al_c
ompl
ex_i
dIN
T(10
)D
Nas
sem
bly_
idVA
RCHA
R(50
)N
func
tion
TEXT
type
ENUM
('hom
omul
timer
ic','h
eter
omul
timer
ic')
Dna
me
TEXT
reac
tion_p
athw
ayre
acti
on_p
athw
ay_i
dIN
T(10
)P
NA
+/-
reac
tion_
idIN
T(10
)F
DN
+/-
path
way
_id
INT(
10)
DN
U
bla
stp
_hit
bla
stp
_hit
_id
INT(
10)
FP
NA
+/-
orga
nism
_id
INT(
10)
DN
Upr
otei
n_id
INT(
10)
FD
N+/
-hi
t_id
VARC
HAR
(40)
Nhi
t_db
VARC
HAR(
40)
Nde
scrip
tion
VAR
CH
AR(2
55)
Nsc
ore
FLO
ATD
Nhi
t_st
artI
NT(1
0)D
Nhi
t_en
dIN
T(10
)D
Nqu
ery_
star
tINT
(10)
DN
quer
y_en
dIN
T(10
)D
Nfra
c_al
igne
d_qu
ery
FLO
ATD
Nnu
m_h
sps
INT(
10)
DN
frac_
iden
tical
FLO
ATD
Nle
ngth
INT(
10)
DN
orde
red_
locu
s_na
me
VARC
HAR(
45)
rna rn
a_id
INT(
10)
FP
NA
+/-
desc
riptio
nVA
RC
HAR
(255
)N
sequ
ence
MED
IUM
TEXT
N10
0bp_
upst
ream
VAR
CH
AR(2
55)
Nst
artI
NT(1
0)D
Nen
dIN
T(10
)D
Nst
rand
ENUM
('+','-
')D
nam
eVA
RC
HAR
(255
)N
stab
le_i
dVA
RC
HAR
(255
)N
clas
sific
atio
nEN
UM('c
odin
g','f
unct
iona
l_rn
a','u
nkno
wn_r
na')D
keyw
ord
TEXT
2d
gel
2d
gel
_id
INT(
10)
PN
A+/
-pr
otei
n_id
INT(
10)
FD
N+/
-sp
ot_i
nten
sity
FLO
ATD
N
xref xr
ef_i
dIN
T(10
)P
NA
+/-
gene
_id
INT(
10)
FD
N+/
-db
_id
VAR
CH
AR(2
55)
Ndb
_nam
eVA
RC
HAR
(255
)N
Figure 2.2.: UML class diagram of MyMpn displaying the different database tables, theformat of the contained data and the connection of that data amongst thedifferent tables. This figure is provided in large format for take out at thevery back of this thesis.
31
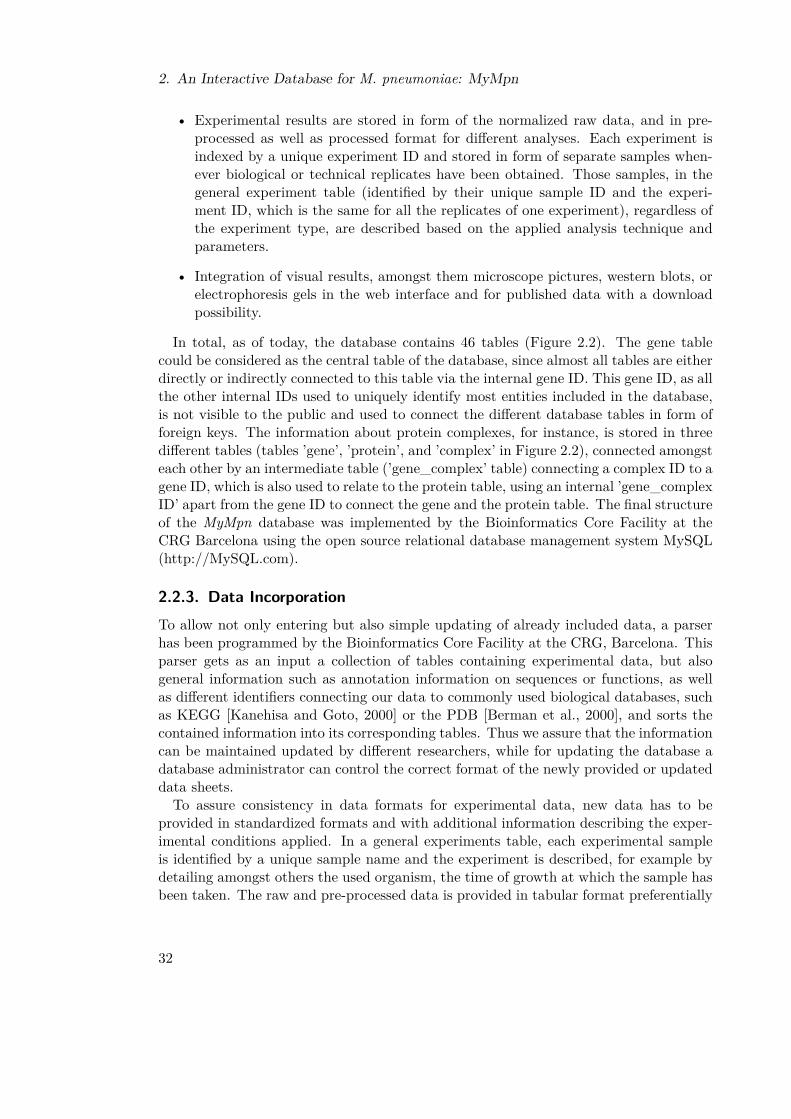
2. An Interactive Database for M. pneumoniae: MyMpn
• Experimental results are stored in form of the normalized raw data, and in pre-processed as well as processed format for different analyses. Each experiment isindexed by a unique experiment ID and stored in form of separate samples when-ever biological or technical replicates have been obtained. Those samples, in thegeneral experiment table (identified by their unique sample ID and the experi-ment ID, which is the same for all the replicates of one experiment), regardless ofthe experiment type, are described based on the applied analysis technique andparameters.
• Integration of visual results, amongst them microscope pictures, western blots, orelectrophoresis gels in the web interface and for published data with a downloadpossibility.
In total, as of today, the database contains 46 tables (Figure 2.2). The gene tablecould be considered as the central table of the database, since almost all tables are eitherdirectly or indirectly connected to this table via the internal gene ID. This gene ID, as allthe other internal IDs used to uniquely identify most entities included in the database,is not visible to the public and used to connect the different database tables in form offoreign keys. The information about protein complexes, for instance, is stored in threedifferent tables (tables ’gene’, ’protein’, and ’complex’ in Figure 2.2), connected amongsteach other by an intermediate table (’gene_complex’ table) connecting a complex ID to agene ID, which is also used to relate to the protein table, using an internal ’gene_complexID’ apart from the gene ID to connect the gene and the protein table. The final structureof the MyMpn database was implemented by the Bioinformatics Core Facility at theCRG Barcelona using the open source relational database management system MySQL(http://MySQL.com).
2.2.3. Data IncorporationTo allow not only entering but also simple updating of already included data, a parserhas been programmed by the Bioinformatics Core Facility at the CRG, Barcelona. Thisparser gets as an input a collection of tables containing experimental data, but alsogeneral information such as annotation information on sequences or functions, as wellas different identifiers connecting our data to commonly used biological databases, suchas KEGG [Kanehisa and Goto, 2000] or the PDB [Berman et al., 2000], and sorts thecontained information into its corresponding tables. Thus we assure that the informationcan be maintained updated by different researchers, while for updating the database adatabase administrator can control the correct format of the newly provided or updateddata sheets.To assure consistency in data formats for experimental data, new data has to be
provided in standardized formats and with additional information describing the exper-imental conditions applied. In a general experiments table, each experimental sampleis identified by a unique sample name and the experiment is described, for example bydetailing amongst others the used organism, the time of growth at which the sample hasbeen taken. The raw and pre-processed data is provided in tabular format preferentially
32

2.2. Results
MPN ID based, and otherwise depending on the data. Metabolite identification andquantification data, for example, is stored based on the metabolite name and the uniqueexperiment (sample) ID.
2.2.4. The Web InterfaceThe web interface aims to provide data access in an intuitive way (Figure 2.3). To this
Figure 2.3.: MyMpn homepage. A short introduction into the aims of the database,relevant statistics and news, such as recent publications, some nice microscopypictures ofM. pneumoniae as well as the different sections of the database inthe menu bar are shown.
end, the information provided by the MyMpn database is assorted into different sec-tions, namely ”homepage”, ”about”, ”data access”, ”omics”, ”comparative omics”, ”3Dorganization”, ”quantitative biology”, ”genome browser”, ”pathway maps”, ”biomart”,and ”tutorials”. The ”homepage” describes the general aim of theMyMpn database andlists the latest news, such as recent publications of the group. In the ”about” section, M.pneumoniae, the ”Mycoplasma project”, the MyMpn database, the involved researchgroups (related sites), and important literature are introduced. Thereby, descriptionsof the data contained in the database and information on the applied experimental orcomputational techniques to produce this data are given in the ’MyMpn database’subsection.To access specific information, for example information about a gene or protein in
M. pneumoniae, the ”data access” section provides different simple search possibilities.Amongst others those include a section for mathematical models, where M. pneumo-niae models will be provided for download upon publication. The genome-scale datasetsare amenable through the ”omics” section, which is further subdivided into ’Genomics’,’Transcriptomics’, ’Proteomics’, ’Metabolomics’, and ’Regulomics’, including amongstothers regularly updated lists of homologous proteins in other organisms (’Genomics’→
33

2. An Interactive Database for M. pneumoniae: MyMpn
’Homology based on pBLAST’), a visualization of gene expression (’Transcriptomics’→’Gene expression graphs’), protein quantification results (’Proteomics’→ ’Protein quan-tification (Mass spectrometry)’), and information about metabolites (’Metabolomics’→’Metabolites’). The ’Regulomics’ subsection will once available provide access to theChip-seq data analysis currently conducted.The ”comparative omics” section contains an analysis tool for synteny, and three
subsections for comparative genomics, transcriptomics, and proteomics, that are stillunder construction. The synteny tool, aligning genomic regions of M. pneumoniae andM. genitalium, facilitates information about common genomic features of the two closelyrelated organisms. In section ”3D organization” ER tomography results [Seybert et al.,2006] and light microscopy studies visualizing different properties ofM. pneumoniae cellsare shown. Statistical information on the biophysical properties of M. pneumoniae andfor selected other bacteria can be found in section ”quantitative biology”.Sections ”genome browser”, ”pathway maps”, and ”biomart” provide access to three
important data analysis tools described in detail in the next section (2.2.5). The ”tu-torials” section is aimed to teach the user the usage of the database, but also of thedifferent analysis and visualization tools either by short indicative descriptions or byvideo tutorials that step by step guide through the putatively more difficult applicationsof the MyMpn database.
2.2.5. Analysis and Visualization ToolsSeveral data analysis and visualization tools have been incorporated into the MyMpndatabase. As examples, the genome browser and the clickable metabolic map, are out-lined in detail.
Genome Browser
The MyMpn database provides two different genome browser. The ’MyGBrowser’ al-lows to browse the M. pneumoniae genome, thereby displaying a selection of genomicfeatures, such as operons, genes, ncRNAs, transcription start and transcription termi-nation sites (TSS and TTS), Pribnow boxes, as well as DNA and RNA hairpins forboth strands. In contrast, the Mycoplasma pneumoniae genome browser (’GBrowse’ inthe drop down menu of ”genome browsers”) does not only provide tracks for additionalselection, for example Chip-seq profiles or tiling array results, but also for uploadingpersonal data into a temporary storage (Figure 2.4). Since each time the ’GBrowse’section is selected, a personal version opens in a new window, tracks that are addedfor analysis by a researcher are not available for other people, thus providing an onlinepossibility to integrate new and unpublished data with the data already available in theMyMpn database (Figure 2.4, select and customize tracks in the upper menu bar). Inaddition, this genome browser enables the user to customize the view, for example byhighlighting specific features in the ’Preferences’ section.
34
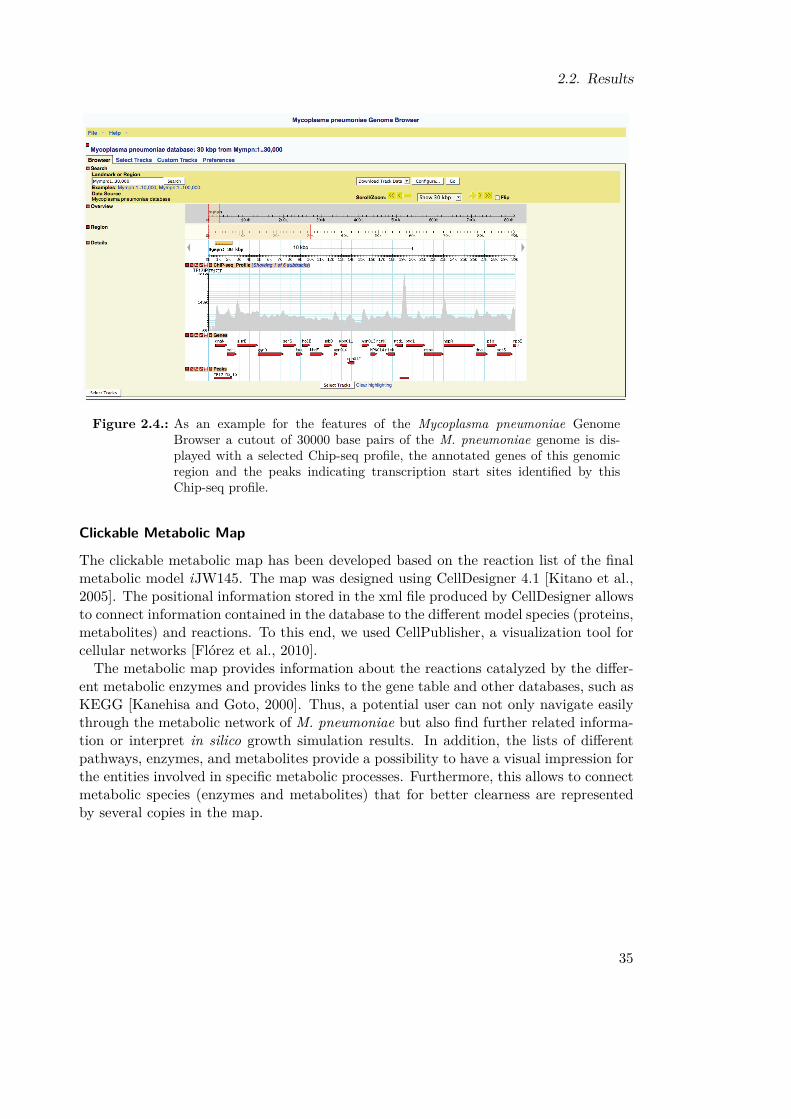
2.2. Results
Figure 2.4.: As an example for the features of the Mycoplasma pneumoniae GenomeBrowser a cutout of 30000 base pairs of the M. pneumoniae genome is dis-played with a selected Chip-seq profile, the annotated genes of this genomicregion and the peaks indicating transcription start sites identified by thisChip-seq profile.
Clickable Metabolic Map
The clickable metabolic map has been developed based on the reaction list of the finalmetabolic model iJW145. The map was designed using CellDesigner 4.1 [Kitano et al.,2005]. The positional information stored in the xml file produced by CellDesigner allowsto connect information contained in the database to the different model species (proteins,metabolites) and reactions. To this end, we used CellPublisher, a visualization tool forcellular networks [Flórez et al., 2010].The metabolic map provides information about the reactions catalyzed by the differ-
ent metabolic enzymes and provides links to the gene table and other databases, such asKEGG [Kanehisa and Goto, 2000]. Thus, a potential user can not only navigate easilythrough the metabolic network of M. pneumoniae but also find further related informa-tion or interpret in silico growth simulation results. In addition, the lists of differentpathways, enzymes, and metabolites provide a possibility to have a visual impression forthe entities involved in specific metabolic processes. Furthermore, this allows to connectmetabolic species (enzymes and metabolites) that for better clearness are representedby several copies in the map.
35

2. An Interactive Database for M. pneumoniae: MyMpn
2.3. DiscussionWe developed an interactive database that serves as a data storage and analysis plat-form for the mycoplasma community. The database contains data on genomics, tran-scriptomics, proteomics, metabolomics, and phylogenomics reflecting the state of the artof published data about M. pneumoniae and further data allowing to draw biologicallyrelevant conclusions for the database release. This data is connected by internal identi-fiers allowing to assign all information available about a gene and its encoded protein tothe MPN ID. Simple access to the data is provided by search masks for different topics,amongst others keywords, genes, and ncRNAs. Furthermore, the advanced search toolBioMart (which is still under construction to include the additional data being preparedfor inclusion at the moment) will facilitate the connection of different data types, forexample if one would like to know all the genes upregulated upon heat shock.Selected data can be analyzed with different statistical and visualization tools. The
Mycoplasma pneumoniae Genome Browser provides a framework for advanced sequenceanalysis as well as integration and comparison of different experimental data, for exampleon mRNA expression and protein sequencing. Despite not yet being released to thepublic, the database is already used by members of the mycoplasma project to analyzeand visualize experimental and computational results as well as to access the genome-wide datasets produced from other researchers.Information access is one of the most important prerequisites for the successful design
of mathematical models for biological systems. The available experimental data not onlydictates the questions most mathematical models are aimed to answer but also directlyinfluences on the decision which mathematical formalism to chose in each case. For M.pneumoniae, the collection of the available experimental data pinpointed open questionsin our understanding of the metabolism of this minimal organism, especially with respectto the cell composition, the essential metabolic functions, as well as the regulation ofthe central carbon metabolism responsible for energy homeostasis.
36

3. Metabolome Analysis andCharacterization of M. pneumoniaeMetabolism
This chapter addresses the experimental and computational analysis of the metabolismof M. pneumoniae, the major project of this thesis, presented in:
1. J.A.H. Wodke, J. Puchalka, M. Lluch-Senar, M. Godinho, V. Martins dos Santos,L. Serrano, E. Klipp, T. Maier: ”Metabolic modeling and quantitative biomass andenergy balancing in Mycoplasma pneumoniae”, in preparation for re-submission toMSB
2. T. Maier, J. Marcos, J.A.H. Wodke, M. Liebeke, R. Gutiérrez-Gallego, L. Ser-rano: ”Comprehensive metabolome analysis and quantitative integration with pro-teomics data in Mycoplasma pneumoniae”, in preparation for submission to PNAS
I was involved in the project design and development, I built the metabolic model, con-ducted the integration of the experimental data, defined the biomass composition, andI analyzed the in silico results. In addition, I carried out the bioinformatic analysis ofthe experimental results and was involved in figure and table generation for the secondpaper. I wrote the manuscript of the modeling paper (with help of Tobias Maier) and alsocommented on the experimental manuscript, especially with respect to the integration ofexperimental and computational results.
3.1. IntroductionWhen aiming to understand an organism in its entirety, accurate descriptions of thebiochemical composition of the respective organism and the reaction network responsiblefor the uptake and subsequent processing of nutrients into energy and cell building blocks,i.e. of the metabolism, are indispensable. Detailed experimental data on genomics,transcriptomics, proteomics, and metabolomics have been published [Yus et al., 2012,Güell et al., 2009, Kühner et al., 2009, Maier et al., 2011, van Noort et al., 2012, Yuset al., 2009] and integrated into our M. pneumoniae database, MyMpn. Analyzing theavailable data for its feasibility with respect to the development of mathematical modelsfor M. pneumoniae, we found that quantitative information on metabolites and theexact composition of a M. pneumoniae cell remain unknown. Hence, the experimentalexploration of the metabolome and the design of a metabolic model allowing to verify thereconstructed metabolic network and to assess the energy balancing and the presumably
37
3. Metabolome Analysis and Characterization of M. pneumoniae Metabolism
related slow growth in batch culture, occurred to be a key step towards understandingof this minimal bacteria.In a joint attempt of experimental and computational research we explored and char-
acterized the metabolism of M. pneumoniae. On one hand, we identified and quantifiedall cellular components assessable through NMR, GC-MS, and LC-MS and studied thecentral carbon flux using 13C-glucose tracer experiments. We accomplished a compara-tive analysis of absolute and relative metabolite abundances amongst different species.Our results indicate that metabolic pathways are regulated as functional units, thusallowing the simplification of adaptive responses. On the other hand, we developed apredictive genome-scale constraint-based model of the metabolic network of M. pneumo-niae: iJW145. We defined the biomass composition of an average M. pneumoniae cellbased on quantitative experimental data to allow the performance of growth simulations.Based on an iterative process of model predictions, their evaluation with experimentalfindings and consequential refinement of the model, we were able to correct the annota-tion of the metabolic network and, subsequently, also the functional annotation of keymetabolic enzymes. To validate our final reconstruction, we qualitatively predicted themetabolic capabilities of M. pneumoniae when grown on alternative carbon source insilico. In addition, we conducted an in silico knock-out study, prediction gene essential-ity with high accuracy (96%) and specificity (98%), thus proving the predictive capacityof the model. The resulting mutant phenotypes have been analyzed providing insightinto pathway regulation and adaptive capacities of M. pneumoniae.We applied the validated model to first, predict double mutant phenotypes, which so
far are difficult to analyze experimentally. Second, we quantitatively dissected the M.pneumoniae energy metabolism, showing that M. pneumoniae, in contrast to other bac-teria, at least under laboratory conditions uses most of its energy for cellular maintenanceand not growth. Finally, applying simple mathematical fittings to in vivo metaboliteconcentration data and maintenance costs determined in silico, we calculated constraintsets for different points of growth. This enabled us to analyze time-dependent changesin the metabolic behavior of M. pneumoniae without necessity to determine the exactunderlying kinetic parameters. Furthermore, integrating metabolite abundances andcarbon flux data with quantitative proteomics data, we were able to calculate in vivocatalytic parameters for several glycolytic enzymes.
3.2. Material and Methods3.2.1. Computational ProceduresMetabolic Reconstruction
We used the reconstruction and modeling platform ToBiN (Toolbox for BiologicalNetworks, the source code is available at http://github.com/miguelgodinho/tobin). Theinitial reconstruction was based on the reaction network published by Yus et al. [2009].To keep atoms and charges in the model balanced and to cope with reactions that cannotbe represented directly in stoichiometric models, for example DNA and RNA elongation
38

3.2. Material and Methods
reactions, some changes had to be introduced (see below). To allow the simulation ofcompound exchange with the environment, so-called source and sink reactions have beendefined, respectively, for all metabolites known to be taken up and/or secreted by M.pneumoniae (Appendix A, Table A.1). Reaction reversibilities and minimum and maxi-mum constraints were defined based on experimental data and literature (Appendix A,Table A.2).The applied FBA solver uses the simplex algorithm, a numeric optimization procedurethat after a finite number of steps ascertains either an exact solution or the infeasibilityof the problem. For the model visualization we used CellDesigner 4.1 [Kitano et al.,2005] and the CellPublisher [Flórez et al., 2010] for the clickable online version includedin the MyMpn database (Figure A.1, http://mycoplasma.crg.es/pathways.php). Allabbreviations used on the model map can be found in the List of Abbreviations at thebeginning of this thesis.
Curve Fittings
Metabolite Fittings: We used KaleidaGraph 4.0 to fit sigmoidal curves to the glu-cose consumption, acetic acid production, lactic acid production and protein synthesisdetermined in vivo (Appendix A, Figure A.2, and Figure 3.13). The general equationfor sigmoidal curves reads:
f(x) = a + b − a
1 + c(d− x) (3.1)
For glucose consumption this equation has been adapted to represent the inverted curveprogression:
f(x) = a + b − a
1 + c(d− (180− x)) (3.2)
To describe the progression of maintenance costs we fitted a logarithmic function to themanually determined maintenance costs at different times of growth:
f(x) = a · x3 + b · x2 + c · x + d (3.3)
The variable values for each fitted curve can be found in Appendix A, Table A.8. Theresulting curves allow to calculate constraints for 0 ≤ x ≤ 180 with x being the growthtime of a four days batch culture in hours. Still, we recommend to only use the presentedmodel with biomass production as single objective function for 24 ≤ x ≤ 60 since thisis the determined exponential growth phase (Figure reffig:fittings).
Fittings for Heavy Isotope Labeling of Metabolites: We used Prism5 to fit one-phase and two-phase exponential decay function to data on heavy isotope labeling inglycolytic intermediates.The one-phase exponential decay function is defined:
f(x) = span ∗ e(−K ∗ x) + plateau (3.4)
39

3. Metabolome Analysis and Characterization of M. pneumoniae Metabolism
The two-phase exponential decay function reads:
f(x) = span1∗ e(−K1 ∗ x) + span2
∗ e(−K2 ∗ x) + plateau (3.5)
with span1 = (Y 0 - plateau) ∗ part1, span2 = (Y 0 - plateau) ∗ (1 - part1), and part1 ∈ [0,1], defining the first exponential phase as fraction of the time until reachingplateau.The parameters for fitting the curves to the glycolytic intermediates can befound in Appendix A, Tables A.16 & A.17.
Definition of Flux Constraints
For the initial simulations, used to refine the network structure of the model, we calcu-lated maximum constraints for glucose consumption and acetic production based on theconcentration changes measured for glucose, acetic acid, and lactic acid in the growthmedium (Appendix A, Figure A.2). To this end, the glucose uptake and the lacticand acetic acid synthesis rates for one cell have been calculated from the populationmeasurements by the parallel determination of protein increase in the population. Ac-cording to Yus et al. [2009], one M. pneumoniae cell contains 10 fg of protein whichallows the determination of the described rates by converting the units from mmol*ml−1
of medium to molecules per cell. For instance, when assuming that 1.339969489 mMof glucose have been depleted from the medium by a M. pneumoniae colony on av-erage comprised of 1878886249.46534 cells during six hours, than one cell consumed19882.97753 molecules of glucose per second. By division of this glucose consumptionrate by the Avogadro constant (6.022E+23) and multiplication with 3600 (for the hour)and 1000 (to get mmole, not mole), the uptake of glucose per cell and hour amounts to1.19E-13 mmole*h−1. When taking into account the assumed total cell mass of 16.13 fg(Results, section 3.3.4), one gram of M. pneumoniae comprises 6.20E+13 cells, resultingin a final model constraint of 7.369004196 mmole*g−1*h−1. Those initial constraintsare not shown, since for later simulations refined constraints have been calculated forglucose availability, and acetic acid production as described below.We fitted sigmoidal curves (Equations 3.1 & 3.2) to the in vivo concentration courses of
external metabolites (Figure 3.13B-D). In addition, after manually fitting the minimumconstraint for cellular maintenance costs based on the integration of in vivo doublingtimes, we fitted a logarithmic function (Equation 3.3) to the constraints determined fordifferent time points (Figure 3.13F). Based on the fitted functions, we calculated the ra-tio of lactic acid to acidic acid and, subsequently, the maximum constraints for glucoseuptake and acetic acid production, as well as the minimum constraint for cellular main-tenance costs (Appendix A, Table A.9). Glycerol and G3P were limited to 2.5% of therespective glucose constraint based on the minimal medium composition in [Yus et al.,2009]. Ribose was limited to 2.5% of the respective glucose constraint, too, in order to ac-count for ribosylated bases in rich medium. All other sugar sources were silenced (set tozero), since it is known that bacteria generally use up one sugar source before switchingto another [Monod, 1966] and proteins involved in uptake and processing of alterna-tive sugars have been shown to be low abundant or not detectable [Maier et al., 2011].
40

3.2. Material and Methods
Arginine availability was constrained to 0.25 mmol∗g−1∗h−1 (value chosen arbitrarilydue to lack of experimental data) in order to prevent unlimited energy production fromarginine. mRNA and protein turnover have been accounted for by minimum constraintson the respective degradation reactions based on experimentally determine mRNA andprotein half-lives [Maier et al., 2011]. To represent known detoxification events, mini-mum constraints were set on dihydroxyacetone production (spontaneous) and 5-formyltetrahydrofolate (regulatory function). Based on the facts that the conversion of DHAPinto G3P is very slow (Results, section 3.3.7) and that glycerol is essential for growth inminimal medium [Yus et al., 2009] we constrained the conversion of DHAP into G3P to0.25 mmol∗g−1∗h−1 (value chosen arbitrarily) in order to allow the model to reproducethe experimental data. The ATPase reaction and two reactions describing the activ-ity of the chaperones DnaK/DnaJ/GrpE and GroEL/GroES have been included in themodel for completeness but have not been constrained, since there was no informationavailable about their exact contributions to energy consumption. Those and other notyet quantified energy sinks are accounted for by the maintenance energy. The constraintsets for different times of batch culture growth in rich medium and for minimal mediumcan be found in Appendix A, Table A.9. For the simulation of growth on alternativesugars, glucose has been limited to zero and the respective alternative sugar source waslimited to provide the same amount of carbon as when using the constraint for glucosefor 36 hours of batch culture growth.
Growth Simulations
Growth of an organism is defined as the production, leading in final consequence tothe duplication, of cellular material by the mother cell, that is then sub-divided intoseparate daughter cells. Therefore, to simulate growth in silico with a constraint-basedmetabolic model, the maximization of biomass production, i.e. the synthesis of allcellular building blocks as required for the biomass composition, is chosen as objectivefunction for the FBA problem. The resulting objective value ov gives information aboutthe doubling time tdoub of an average M. pneumoniae cell as described by Equation1.6. Thus, it is possible to distinguish between growth (ov larger than zero), catabolicactivity (growth arrest) (ov equal to zero), and cell death (infeasibility of the FBA).The FBA is considered infeasible if at least one of the minimum requirements specifiedcannot be satisfied under the given nutrient conditions, both defined by the respectiveconstraints.
Gene Essentiality Prediction
The gene-protein-relationship has been determined for all reactions for which the cat-alyzing enzyme is known. In each in silico knock-out all reactions catalyzed by thecorresponding gene product have been limited to zero flux. A gene is considered es-sential when its knock-out leads to an objective value of zero (no growth but minimumconstraints can be matched) or the infeasibility of the FBA (minimum constraints arenot fulfilled). Genes coding for proteins that catalyze DNA degradation, protein folding,
41
3. Metabolome Analysis and Characterization of M. pneumoniae Metabolism
and the ATPase reaction have been excluded from the essentiality prediction since theircorresponding functions have not been modeled explicitly. All simulations of this sectionhave been performed using rich medium conditions for 36 hours growth time (AppendixA, Table A.9). Maintenance expenses have been neglected, to prevent that knock-outsleading to significant slower energy production can result in infeasibility of the FBA.Subsequently, the obtained objective values give no information about the absolute dou-bling times but only about the relative changes in the growth rate between wild typeand knock-out simulation.For the prediction of double mutant phenotypes, we applied the same strategy as for
the single in silico gene knock-outs, but simultaneously silenced the reactions catalyzedby two different non-essential proteins at a time. Double knock-outs resulting in reducedfitness, i.e. the objective value is smaller than for each of the two single knock-outsalone, or in cell death, i.e. the objective value equals zero or the FBA is infeasible, wereconsidered for the analysis of synthetic lethal and sick interactions (Figure 3.11).For the statistical analysis of accuracy and specificity of the gene essentiality predic-
tion, we evaluated the prediction results based on a genome-wide transposon study inM. genitalium [Glass et al., 2006], transposon screens in M. pneumoniae (this work)and the simulation conditions. Computationally and experimentally essential genes areconsidered true positives, true negatives are computationally and experimentally notessential, computationally essential and experimentally non-essential genes are definedas false positives and computationally non-essential and experimentally essential genesaccordingly false negative hits.
Comparison of Qualitative Changes in Fluxes and Protein Abundances
First, linear fittings to the in silico reaction fluxes obtained at t=24h, 36h, 48h, 60h andto protein abundances measured at t=24h, 36h, 48h, 72h during batch culture growthexperiments in vivo [Maier et al., 2011], have been conducted. Second, we determinedthe qualitative overall change of fluxes and protein abundances during the exponentialgrowth phase, considering proteins to change only if the measured abundance differenceexceeds 25% of the abundance at t=24h, thus accounting for the reported experimentalerror that would otherwise have a high impact especially on the changes of low-abundantproteins [Maier et al., 2011]. Finally, we aligned protein concentration changes withthe change of the sum of fluxes of reactions catalyzed by the respective protein (Fig-ure 3.14B).
Sequence Comparison
All sequence analyses have been performed using the Basic Local Alignment Search Toolfor proteins (pBLAST, algorithm pblast) [Altschul et al., 1997]. pBLAST was used, sinceM. pneumoniae uses the TGA codon to encode for tryptophan instead of indicating theend of a gene as in most other organisms. Protein sequences of related organisms (orderedfor preference: other mycoplasmas, B. subtilis, L. lactis, E. coli) were obtained fromKEGG [Kanehisa and Goto, 2000] or the National Center of Biotechnology Information
42

3.2. Material and Methods
(NCBI) [Tatusova et al., 1999] and used to perform pBLAST against the M. pneumoniaeproteome. Alternatively, M. pneumoniae protein sequences were aligned to the nr-DBin order to detect possible homologies. This has been done so i) to search for enzymespossibly involved in fumarate and succinate processing, ii) to identify the cofactors usedby the GPO (MPN051), iii) to shed light on the NOX isoform (MPN394), iv) to confirmthat a reaction converting UTP into CTP does not exist in M. pneumoniae, and v) tosearch for proteins possibly catalyzing phospholipid production. All pBLAST results areshown in Appendix A, section A.1.
3.2.2. Experimental ProceduresSample Preparation
M. pneumoniae M129 cells were grown in batch culture in suitable culture flasks. Gen-erally, cells were grown as pre-culture for 96 hours, harvested and diluted into freshgrowth medium and seeded into new culture flasks for experiments. Cells were grownfor different time intervals, ranging from 24 to 96 hours. At indicated times, the growthmedium was discarded and the cells were washed twice with ice cold PBS containing0.05% glucose. After complete removal of the wash buffer, the culture flask was placed ona bed of dry ice and -80°C methanol was rapidly added for both quenching metabolismand lysing the cells. After cell scraping and collecting the sample, cell debris was spundown and the supernatant containing cellular metabolites were transferred to pre-cooledglass tubes containing internal standard as indicated below. Samples were immediatelyfrozen in liquid nitrogen and lyophilized to dryness for 24h-72h.
Protein Concentration and Enzyme Assays
Protein content was determined using the commercially available BCA kit (Thermo),essentially following the manufacturers recommendations and as described by Yus et al.[2009]. The determination of extracellular glucose, lactic acid, acetic acid and ethanolwas carried out using commercially available kits (BioVision #K606 and #K607, Mega-zyme K-ACETRM, K-ETOH) as described by Yus et al. [2009].
GC-MS Analysis
Different groups of compounds (free bases, free amino acids, fatty acids, and glycolysisproducts) were targeted specifically using tailored protocols as described in Maier et al.,under revision at MSB. Depending on the case, growth medium, total cell content, cellpellet, or cytoplasm was analyzed as described in each protocol.
NMR Measurements
Dried extracts were redissolved, centrifuged, and 600 µl supernatant were transferred intoNMR tubes as described in Maier et al., under revision at MSB. Spectra were acquiredwith an Avance 800 MHz NMR Spectrometer with triple resonance CryoProbe (Bruker
43

3. Metabolome Analysis and Characterization of M. pneumoniae Metabolism
Biospin, Coventry, UK) following a procedure described by [Beckonert et al., 2007] andstandard pulse sequences for 1D 1H-NOESY, 2D 1H-1H COSY, 1H-13C HSQC exper-iments. Metabolites were identified by comparing spectra from standard compoundsand spectra available from online repositories (HMBD [Wishart et al., 2009] and BMRBhttp://bmrb.cerm.unifi.it).
LC-MS Measurements
Dried extracts were redissolved, centrifuged and supernatants were transferred to HPLCglass-vials as described in Maier et al., under revision at MSB. Samples were ana-lyzed by UPLC-MS with a HILIC mode and a reversed phase mode separation [Spagouet al., 2011, Want et al., 2010]. In addition, samples were subjected to an ion-pairingmode HPLC-MS method [Liebeke et al., 2010] for the analysis of very polar metaboliteslike triphosphate nucleotides. LC-MS data was evaluated for predicted M. pneumoniametabolites (Appendix A, Table A.3), including possible ions for common adducts inESI mass spectrometry (e.g. [M + H]+, [M + NH4]+, [M + Na]+, or [M + K]+ and innegative ion mode [M-H]−) [Tong et al., 1999]. As LC-MS profiling data often containsa huge amount of uninformative ”noise” [Jankevics et al., 2012] we applied a filtering toour peak list, considering only peaks above a specified abundance threshold and withions not on the predicted metabolite list for further identification by database searchesin Metlin, massbank.jp [Smith et al., 2005, Horai et al., 2010].
Transposon Screens
The 64 pools of an ordered collection of M. pneumoniae transposon mutants generatedby ”haystack mutagenesis” [Halbedel et al., 2006] were assorted into 10 groups. Then, ge-nomic DNA extractions were performed using Illustrabacteria genomic KIT (GE). Thedisruptive insertions in genes mpn133, mpn321, mpn392, mpn533 and mpn595 weredetected by PCR (Figure 3.10). Fragments corresponding to junctions between genesand the mini-transposon were amplified using the primer 3JpMT85 and the primers5MPN133, 5MPN321, 5MPN392, 5MPN533 and 5MPN595, respectively (Appendix A,Table A.12). The position of the transposon insertion in the different genes was deter-mined by DNA sequencing.
pH Experiment
To check the influence of the medium pH on growth performance, M. pneumoniae cellswere grown in batch culture in 75 cm2 culture flasks. Cells were grown in pre-culturefor 96 hours in glucose containing medium, harvested by scraping and diluted into freshgrowth medium. Medium pH was adjusted back to pH7.7 after four days of growth bytitration with sterile 1 M NaOH. Samples from growth medium supplemented with 1%glucose (55.5 mM) were taken at indicated time points (Appendix A, Figure A.9). Glu-cose and lactic acid concentrations were determined with enzymatic assays as described(section 3.2.2).
44

3.3. Results
3.3. ResultsApplying the systems biology approach, we explored and characterized the metabolicnetwork of M. pneumoniae. We build a predictive constraint-based metabolic model tovalidate the wiring diagram, to explore the energy metabolism, and to predict metabolicphenotypes for single and double mutants: iJW145 (Appendix A, Table A.1). Themodel building process can be divided into three main steps: i) model construction,ii) biomass definition and assignment of reversibilities, and iii) model refinement. Ithas been shown that automatic metabolic reconstructions are likely error-prone due tothe one-dimensional annotation they are based on [Reed and Palsson, 2003]. Hence,we iteratively integrated different experimental data already during the model buildingprocess. To extract biologically relevant information, we accomplished different analysesconsecutive to the integration of experimental data and during the model validation pro-cess. In parallel, we monitored cellular and extracellular metabolites in vivo, applyinga combination of different technical approaches complementing each other. NMR, GC-MS, and LC-MS have been used to identify and in selected cases quantify metabolites,the concentration changes in external metabolites have been measured with metaboliteassays, and the central carbon flux has been examined using 13C-glucose tracer experi-ments. Model predictions and experimental results have been integrated with each otherrepeatedly, thus beneficially effecting experimental and computational design processesas well as the biological knowledge gain (Figure 3.1).
3.3.1. Model ConstructionUsing the modeling platform ToBiN we built a genome-scale constraint-based metabolicreconstruction of the minimal bacterium M. pneumoniae (iJW145_reconstruct; Ap-pendix A, Figure A.1 and Table A.1) based on a curated wiring diagram for metabolism[Yus et al., 2009]. We adjoined transport reactions, which were not defined in the reac-tion list from Yus et al. [2009], for components that are exchanged with the environmentand degradation reactions for proteins and RNA. Finally, we added source and sink reac-tions in order to account for the system boundaries, i.e. to enable the simulation of theexchange of metabolic compounds with the environment under steady state conditions.To properly assign reaction reversibilities, we integrated consensus information ob-
tained from the BRENDA enzyme database [Scheer et al., 2011] with reaction directionspublished for the metabolic network of E. coli [Fleming et al., 2009] and the metabolicmap for M. pneumoniae [Yus et al., 2009] (Appendix A, Table A.2). Thus, we coulddefine reversibilities of 65.1% of all model reactions. 8.5% of the reactions, for which con-trary information was available, were set irreversible, among them all tRNA biosynthesisreactions and six reactions of the lipid metabolism. The reversibilities for transport re-actions (12.7% of all reactions) and model specific reactions (source/sink, 21.8% of allreactions) have been set as required for the production of all metabolic componentsand to reproduce experimental findings. The NADH oxidase reaction (M017) has beenchanged to irreversible along with the functional re-annotation of the NADH oxidase(MPN394, see below). In case of new experimental evidence on reaction reversibilities,
45
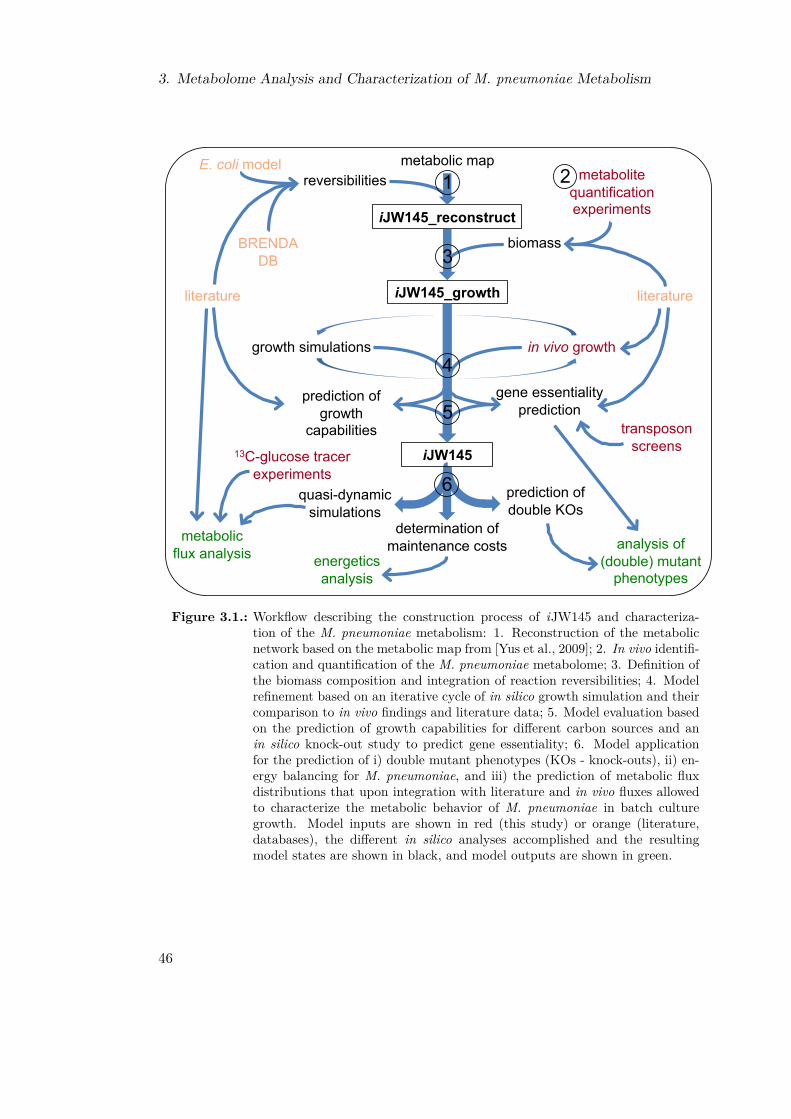
3. Metabolome Analysis and Characterization of M. pneumoniae Metabolism
iJW145_reconstruct
iJW145_growth
iJW145
metabolic map
in vivo growth
biomass
reversibilities
literature
growth simulations
gene essentiality prediction
literature
BRENDA DB
E. coli model 1
3
4
5transposon
screens
metabolite quantification experiments
prediction of growth
capabilities
analysis of (double) mutant
phenotypes
2
quasi-dynamic simulations
energetics analysis
6
metabolic flux analysis
13C-glucose tracer experiments
prediction of double KOs
determination of maintenance costs
Figure 3.1.: Workflow describing the construction process of iJW145 and characteriza-tion of the M. pneumoniae metabolism: 1. Reconstruction of the metabolicnetwork based on the metabolic map from [Yus et al., 2009]; 2. In vivo identifi-cation and quantification of the M. pneumoniae metabolome; 3. Definition ofthe biomass composition and integration of reaction reversibilities; 4. Modelrefinement based on an iterative cycle of in silico growth simulation and theircomparison to in vivo findings and literature data; 5. Model evaluation basedon the prediction of growth capabilities for different carbon sources and anin silico knock-out study to predict gene essentiality; 6. Model applicationfor the prediction of i) double mutant phenotypes (KOs - knock-outs), ii) en-ergy balancing for M. pneumoniae, and iii) the prediction of metabolic fluxdistributions that upon integration with literature and in vivo fluxes allowedto characterize the metabolic behavior of M. pneumoniae in batch culturegrowth. Model inputs are shown in red (this study) or orange (literature,databases), the different in silico analyses accomplished and the resultingmodel states are shown in black, and model outputs are shown in green.
46

3.3. Results
the model can be adjusted easily.To prove the completeness and the correct connectivity of the reconstructed metabolic
network, we used FBA to individually maximize the production of each network compo-nent. Contrary to more complex organisms, the metabolic network of M. pneumoniae ismainly composed of linear pathway modules which are interconnected by only very fewmetabolites apart from ubiquitous cofactors, such as AMP, ADP, ATP, H+, H2O, NAD+,NADH, Pi, PPi (Appendix A, Figure A.1 and Table A.3). These results and the lackof rescue pathways known from other organisms, amongst them the Entner-Doudoroff-Pathway to bypass glycolysis, facilitate the analysis of inter-pathway crosstalk and limitthe existence of multiple optima for FBA problems. Furthermore, the absence of mostcatabolic and anabolic routes in M. pneumoniae allows to relate external metabolitemeasurements directly to intracellular fluxes.
3.3.2. Metabolite IdentificationOut of 216 reactants included in the in silico metabolome ofM. pneumoniae we extracted150 that can be verified experimentally, excluding tRNAs, protein-based reactants, andinorganic compounds not amenable to experimental analysis (Appendix A, Table A.3).Combining GC-MS, LC-MS, and NMR, we identified 86 different cellular metabolitesin an organism-wide screen (Figure 3.2A and Appendix A, Table A.4). Those metabo-lites confirm 53% of the predicted metabolites (Figure 3.2B), surpassing experimentalcoverage of predicted metabolites in other prokaryotes [Soga et al., 2003, van der Werfet al., 2007, 2008, t’Kindt et al., 2010, Liebeke et al., 2011]. 83% of the metabolitesexperimentally detected in this study were identified in large-scale metabolic screens ofother bacteria as well [Soga et al., 2003, van der Werf et al., 2007, Liebeke et al., 2011](Figure 3.2C).Experimentally determined metabolites map to all pathways of the metabolic recon-
struction (Figure 3.3). High coverage was achieved for intermediates of the central carbonmetabolism, the nucleotide metabolism, and the amino acid metabolism. Metabolitesassociated to alternative sugar metabolism and pentose phosphate pathway are observedless frequently. This finding agrees with the low abundances determined for the respec-tive catalyzing proteins [Maier et al., 2011].73 predicted metabolites were not detected. 49 of those can technically be identified
using commercially available pure compounds as standards [Soga et al., 2003, van derWerf et al., 2007, Liebeke et al., 2011]. However, only 16 of them have been experimen-tally confirmed previously in E. coli, B. subtilis or S. aureus [Soga et al., 2003, van derWerf et al., 2007, Liebeke et al., 2011] suggesting general identification problems for allothers. Due to the small size of M. pneumoniae, metabolites that are unstable, rapidlyturned over, or of very low cellular abundance are likely to be present below the detectionlimit of the applied techniques. Furthermore, the 16 previously identified compoundsare mainly intermediates of the pentose phosphate pathway and the CoA metabolism,two pathways that are supposed to have high activity only, if the associated cellularbuilding blocks cannot be imported from the environment, which does not apply for therich medium used during batch culture growth.
47

3. Metabolome Analysis and Characterization of M. pneumoniae Metabolism
In addition to the metabolites contained in the metabolic model, we identified sevenmetabolites not predicted from the in silico metabolome, namely ADP-glucose, choles-terol, cytosine, ethanol, fumarate, succinate, and trans-4-hydroxyproline. ADP-glucose,
NMR (31)
GC-MS (43)
LC-MS (37)
5 4
16 10
0
23
28
A B
C
53
25
20
12 9
0
10
20
30
40
50
60
M. pneumoniae
E. coli L. donovani S. aureus B. subtilis
% o
f pre
dict
ed m
etab
olom
e id
entifi
ed
152 in silico predicted intermediates of the M. pneumoniae metabolic network
73 not identified experimentally 86 identified by GC-MS, LC-MS or NMR
7 new metabolites not part of the in silico reconstruction
71 identified in other organisms
15 not identified previously
135 technically identifiable using pure compounds as standards 24 not identifiable
57 not identified previously in other organisms
16 identified in other
organisms
Figure 3.2.: Metabolomics in M. pneumoniae. A: Specificity and overlap of different tech-nical approaches applied to detect M. pneumoniae metabolites. B: Integrationof in silico predicted and experimentally confirmed metabolites in different or-ganisms. C: Graphical representation of predicted, identified, and technicallyidentifiable metabolites in M. pneumoniae.
cholesterol, and cytidine, despite being detected experimentally, are not included in themetabolic reconstruction for technical reasons. ADP-glucose is functionally redundantwith UDP-glucose, which is included in the reconstruction and which also was identi-fied experimentally. M. pneumoniae is not able to synthesize sterols, amongst otherscholesterol, but directly imports them from the environment [Yus et al., 2009] and incor-porates them into the plasma membrane [Johnson and Somerson, 1980]. Nevertheless,since the lipid composition of mycoplasmas has been shown to vary depending on thefatty acids provided with the growth medium [McElhaney and Tourtellotte, 1969, Pol-lack et al., 1970, Rottem, 1980], cholesterol and other sterols are not included explicitlyin the model but merged into general artificial molecules (for details please refer to sec-tion 3.3.4). Experiments in defined growth medium showed that cytidine rather than
48
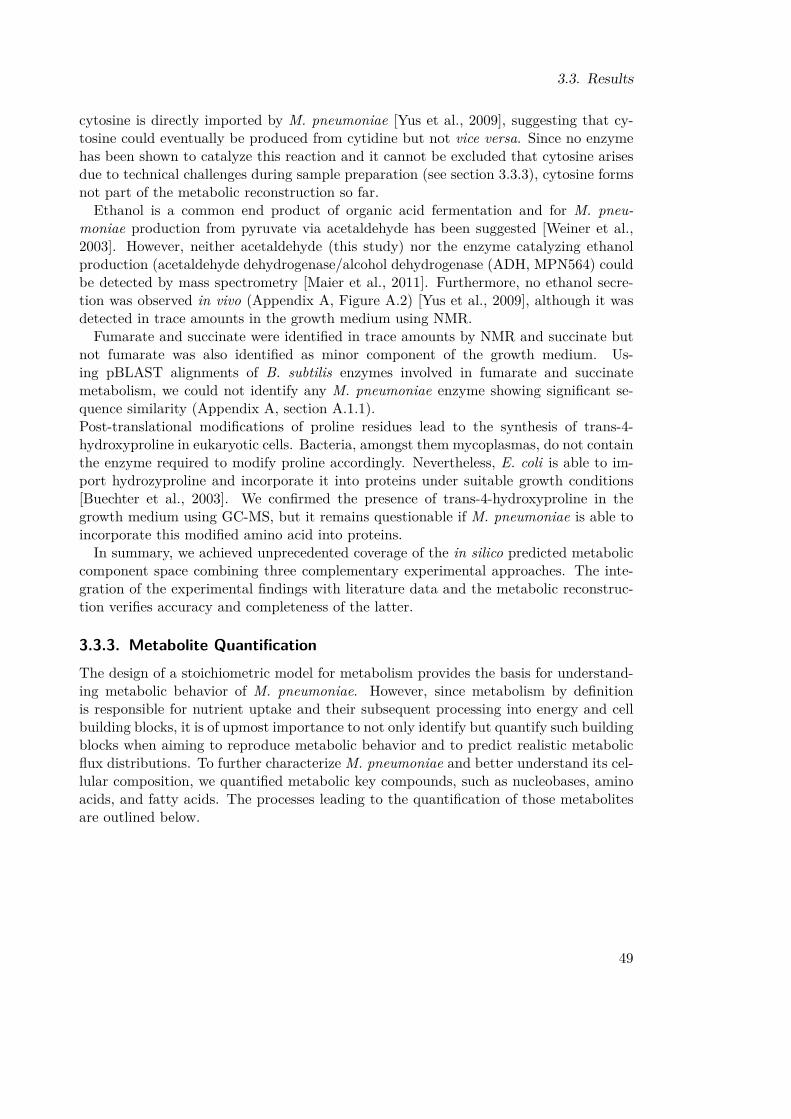
3.3. Results
cytosine is directly imported by M. pneumoniae [Yus et al., 2009], suggesting that cy-tosine could eventually be produced from cytidine but not vice versa. Since no enzymehas been shown to catalyze this reaction and it cannot be excluded that cytosine arisesdue to technical challenges during sample preparation (see section 3.3.3), cytosine formsnot part of the metabolic reconstruction so far.Ethanol is a common end product of organic acid fermentation and for M. pneu-
moniae production from pyruvate via acetaldehyde has been suggested [Weiner et al.,2003]. However, neither acetaldehyde (this study) nor the enzyme catalyzing ethanolproduction (acetaldehyde dehydrogenase/alcohol dehydrogenase (ADH, MPN564) couldbe detected by mass spectrometry [Maier et al., 2011]. Furthermore, no ethanol secre-tion was observed in vivo (Appendix A, Figure A.2) [Yus et al., 2009], although it wasdetected in trace amounts in the growth medium using NMR.Fumarate and succinate were identified in trace amounts by NMR and succinate but
not fumarate was also identified as minor component of the growth medium. Us-ing pBLAST alignments of B. subtilis enzymes involved in fumarate and succinatemetabolism, we could not identify any M. pneumoniae enzyme showing significant se-quence similarity (Appendix A, section A.1.1).Post-translational modifications of proline residues lead to the synthesis of trans-4-hydroxyproline in eukaryotic cells. Bacteria, amongst them mycoplasmas, do not containthe enzyme required to modify proline accordingly. Nevertheless, E. coli is able to im-port hydrozyproline and incorporate it into proteins under suitable growth conditions[Buechter et al., 2003]. We confirmed the presence of trans-4-hydroxyproline in thegrowth medium using GC-MS, but it remains questionable if M. pneumoniae is able toincorporate this modified amino acid into proteins.In summary, we achieved unprecedented coverage of the in silico predicted metabolic
component space combining three complementary experimental approaches. The inte-gration of the experimental findings with literature data and the metabolic reconstruc-tion verifies accuracy and completeness of the latter.
3.3.3. Metabolite QuantificationThe design of a stoichiometric model for metabolism provides the basis for understand-ing metabolic behavior of M. pneumoniae. However, since metabolism by definitionis responsible for nutrient uptake and their subsequent processing into energy and cellbuilding blocks, it is of upmost importance to not only identify but quantify such buildingblocks when aiming to reproduce metabolic behavior and to predict realistic metabolicflux distributions. To further characterize M. pneumoniae and better understand its cel-lular composition, we quantified metabolic key compounds, such as nucleobases, aminoacids, and fatty acids. The processes leading to the quantification of those metabolitesare outlined below.
49

3. Metabolome Analysis and Characterization of M. pneumoniae Metabolism
!"#$
%&'$
(')$
*+,$
!)-$
.!($
!(/$
012$
*!2$
342$
*12$
352$
*!$
312$
267$
2/2$
*82$
"#!$
!%2$
!"2$
9"2:
&-;<=-$
R00
1 M
PN
627
R00
2 M
PN
207
>)?@%2$
267$
2/2$
*2A$
R04
0 M
PN
251
R00
1 M
PN
627
R02
1 M
PN
078
R02
3 M
PN
025
R02
4 M
PN
564
R05
2 M
PN
547
R02
2 M
PN
079
R00
5 M
PN
025
R00
6 M
PN
629
R01
0 M
PN
606
R00
9 M
PN
628
R00
8/
R17
5-17
7 M
PN
429
R00
3 M
PN
250
R00
4 M
PN
302
267$
2/2$
B2*$
82*$
"*2$ >)
?@"2$
2C$
R00
7 M
PN
430
#BA$
>)?@%2$
>)?@"2$
R01
1 M
PN
303
("2:"!*$
"!*$
2!($
5,*82$
R01
2 M
PN
674
R05
5 M
PN
637
R05
3 M
PN
350/
546
R05
4 M
PN
299
!(2
:75$
!(2
:7B$
!(2
$
!(2
$
22C$(%
2$
!D(<!
$
!D:2$
(.$
E*.6$
#/F:"!*$
E*82$
(.G$
2*24
$
R05
8 ??
?
R05
7 ??
?
R05
6 M
PN
253
9"2$
#BA$ 2C$
("2:
"!*$
(02$
(02$
@!"#$
@!"H$
R03
8 ??
?
R01
9 M
PN
533
R01
8 M
PN
428
R01
5-01
7 M
PN
390-
393
@!"#$
@!"H$
2C$ !"2$
!%2$
(<!$
)FI2$
/J2$
0KL5
2$
R03
7 M
PN
082
R03
0 M
PN
652
R02
8 ??
?
R00
1 M
PN
627
R02
9 M
PN
651/
653
%!.$
7I2$
)7+I2$
*!2$
GM2$
752$
R03
9 M
PN
082
R04
3 M
PN
066
R03
6 ??
?
R04
1 M
PN
595
9.!*$
N*2"
($
9.!/$ L7+I2$
LFI2$
8)*12$
!12$
R04
2 M
PN
073
R03
4 M
PN
492
R03
3 M
PN
493
R03
2 M
PN
497
R00
1 M
PN
627
R03
1 M
PN
494-
496
R03
5 M
PN
498
9.!3$
#BA$
(AB$
*12$
*52$
9"2:*!.$
9"2:*.($
R06
2 M
PN
257
R06
1 M
PN
667
R06
0 M
PN
066
Glyc
olipid
s
Phos
pholipid
s
PURI
NE
MET
ABO
LISM
PYRI
MID
INE
MET
ABO
LISM
AB$
R02
0 M
PN
394
!!$
@!"H$#H$
#H$
#H$
(<!$
!"#$
@!"#$
@!"H$
#H$
9%2$
22C$
(<!$
(AB$
)!"2$
)*02$
)!02$
*02$
!02$
!)<
$)!
)<$
*+<
$)*
+<$
!"2$
)*"2$
*"2$
2722$
2722$
22C$
)752$
)752$
752$
2C$
752$
R06
6 M
PN
062
R07
3 M
PN
062
R08
0 ??
? R
074
MP
N38
6
"!N$
R08
7 M
PN
246
R08
1 M
PN
246
R07
5 M
PN
185
R06
8 M
PN
185
@%I$
R06
5 M
PN
395
R08
6 M
PN
386
"*N$
@%I$R
079
MP
N06
2 R
085
MP
N06
2
R07
8 M
PN
672
)!%2$
!%2$
)*%2$
*%2$
R07
6 M
PN
303
R08
8 M
PN
303
R08
3 M
PN
303
R01
1 M
PN
303
R06
9 M
PN
322-
324
R08
2 M
PN
322-
324
O-)%&C<$
O-)%&C<$
<;%&C<$
<;%&C<$
DNA
RNA
RNA
DNA
R07
7 M
PN
034/
378
R08
9 M
PN
034/
378
R07
1 M
PN
516
R08
4 M
PN
516
9O,$
("2$
(02$
9"2$
9O)$
902$
(%2$
9%2$
RNA
752$
2722$
922$
R09
1 M
PN
064
R09
7 M
PN
065
R09
3 M
PN
561
R09
2 ??
?
R09
0 M
PN
033
R10
0 M
PN
561
R10
2 M
PN
476
R09
5 M
PN
303
R10
3 M
PN
303
R10
1 ??
?
)9"2$
R09
6 M
PN
322-
324
@%I$
@#8$
R09
9 M
PN
516
R10
4 M
PN
516
R06
7 ??
?
)("2$
)(02$
)(%2$
R10
6 ??
?
R10
8 M
PN
476
R10
9 M
PN
303
R10
7 ??
?
@%I$
R10
5 M
PN
322-
324
)%02$
)%&)$
)%"2$
)%%2$
)752$
922$
R11
5 M
PN
064
R11
6 M
PN
044
R11
7 ??
?
R11
8 M
PN
006
R11
9 M
PN
303
@%I$
)902$
)9O)$
)752$
922$
R11
1 M
PN
064
R11
2 M
PN
044
R11
3 ??
?
@%I$
DNA
R12
0 M
PN
034/
387
R07
2 M
PN
528
R11
0 M
PN
034/
387
R11
4 M
PN
320
"#3$
0/%#3$
)9"2$
*82$
R05
9 M
PN
455
2C$
#BA$
("2:"*$
2"#$
@AF$
!(N
$
2%!$
7@!2$
"@!2$
%P0$2*P$
23N$
34!$
*!2"
#$
7@!2$
"@!2$
7@!2$
"@!2$
"@!2$
"(N
$/@
A$
*20
$
2*N$
26N$
."#$
7@!2$
PYRU
VATE
MET
ABO
LISM
267$
2/2$
267$
2/2$
@!"#$$
267$
2/2$
267$
2/2$
267$
2/2$
267$
2/2$
267$
2/2$
267$
2/2$
LIPI
D M
ETABO
LISM
)7I2$
)752$
R04
4 M
PN
066
*!2$
R04
6 M
PN
063
%#6$
2*2$
%N.$
%N.$
R17
4 M
PN
065
@#8$
R05
1 sp
onta
neou
s
379$
*.(
Q$0!@$
0%.$
!G($
9O,$
7P4$
!%2$
!%2$
!%2$
!"2$
!"2$
!"2$
@!"H$
@!"H$
@!"#$$
@!"#$$
#H$
#H$
#H$
!% 2$
!02$
!% 2$
!% 2$
!% 2$
!%2$
!%2$
!% 2$
!"2$
!"2$
!"2$
!"2$
!"2$
!"2$
#BA$
#BA$
#BA$
#BA$
22C$
22C$
22C$
22C$
22C$
2C$
2C$
2C$
2C$
2C$
2C$
2C$
2C$
2C$
2C$2C$
2C$
2C$
2C$
2C$2C$
2C$
!"2$
!%2$
!"2$
!%2$
!"2$
!%2$
!"2$
!%2$
!"2$
!%2$
!"2$
!%2$
!"2$
!%2$
!"2$
!%2$
!"2$
!%2$
#BA$
22C$
O-)%&C<$
<;%&C<$
O-)%&C<$
<;%&C<$
#BA$
#BA$
#BA$
#BA$
#BA$
#BA$
#BA$
#BA$
22C$
22C$
22C$
22C$
GLYC
OLY
SIS
379!$
02P$
2%GPR*$
379!$
0%.!$
0%."$
PENTO
SE P
HOSP
HATE
PATH
WAY
)FI2$
2%G!$
!%2$
!"2$
379N$
2722$
CARB
OHYD
RATE
M
ETABO
LISM
R06
3 R
064
MP
N48
3
MET
ABO
LISM
OF
COFA
CTORS
AND V
ITAM
INS
74GN$ 7I2$
R18
6 M
PN
051
Choline
met
abolism
#BA$
2C$
@%I$
#BA$
R04
7 M
PN
564
#BA
B$AB$
NUCL
EOTI
DE
MET
ABO
LISM
2F.$
R14
2 ??
?
2"FN$
2F.I2$
!%2$
!"2$
Vita
min B
6 met
abolism
SP4$
R14
3 ??
?
%#PN$
%2G$
%22$
R14
4 M
PN
550
!%2$
!%2$
!"2$
!"2$
Thiamine
met
abolism
AM
INO A
CID M
ETABO
LISM
R15
3-R
172
R15
1 M
PN
236-
238
R15
2 M
PN
236-
238
!=T$
!=E$
*L+$
*LT$
*L+:K7@
!*LT$
*LT:K7@
!*LT$
,,$
!02$22C$
!%2$
!%2$
!%2$
!"2$
!"2$ 2C$
2C$
G!0$
0-K$
R13
3 M
PN
060
G!#$
IUD"@!$
R13
4 M
PN
108
"(0$
!)<
$ &('=$!#($
R13
5 ??
?
Met
hion
ine
met
abolism
!%2$
#BA$
#BA$
22C$2C$
Arg
inine
ferm
enta
tion
!OV$
(CO$
@#8$
#BA$
!OD!$
AOT$
A%($
R12
3 M
PN
306
(AB$ R
124
MP
N30
7 (W,=-$
R12
1 M
PN
304/
305
R12
2 M
PN
560
!%2$
!"2$
2C$
@#8$
(42$
"@!$
K7@!$
,,:K7@
!$
R07
0 M
PN
240
#BA$
@!"2#
$@!"2 H
$
#H$
)(')$
R09
4 M
PN
632
R18
9 M
PN
006
!%2$
!"2$
267$
2/2$
3A.$
"#3$
%#3$
R12
5 M
PN
321
R19
4 M
PN
300
5XY%#3$
R12
7 M
PN
017
0.%#3$
R12
8 M
PN
017 R12
9 M
PN
543
U-K:
K7@!0-K$
3U-K:
K7@!0-K$
R13
0 M
PN
576
*L'$
G-O$
0/%#3$
R13
1 M
PN
017
@!"2#
$
@!"2H$
#H$
R11
4 M
PN
320 )%02$
)902$
"#37$
"#37$
@!"#$
@!"H$
(AB$
3"#$
R13
2 M
PN
348
!"2$
!%2$
2C$
%#6$
0%30%$
R18
1 ??
?
#BA$
#H$
!"2$
2C$
!%2$
#H$
#H$
#BA$
#H$
@!"#$
@!"H$
@!"#$
@!"H$
IY%#
3$
#H$
#H$
#BA$ R
185
MP
N57
6
3A7$
One
car
bon
pool b
y fo
late
30@$
743$
R14
0 M
PN
158
3!"$
R14
1 M
PN
158
!%2$
!%2$
!"2$
22C$
Ribo
flav
in m
etab
olism
R19
1 M
PN
258-
260 7P4$
!%2$
!"2$ 2C$
*.6$
*.6$
*LE3$
*82$
!%2$ !"2$ 2C$
R04
9 M
PN
050
R19
2 M
PN
043
R19
3 M
PN
133-
136
2722$
@(@
$R
136
MP
N04
7
@FF$
R13
7 M
PN
336
@!"H$
R13
8 M
PN
562
@!"2H
$R
139
MP
N26
7 @!"#$
@!"2#
$
R17
3 M
PN
267
!%2$
!%2$
!%2$
!%2$
!"2$
!"2$
22C$
!02$22C$
22C$
@#8$
Nicot
inat
e met
abolism
@PA$
"#!2$
7CZ!
4($
!)-$
*+,$
#H$#H$
#H$
#H$
"#!2$
#H$
!%2$
2!@J2$
2!@$
R14
5 ??
? 2!@N$
R14
6 M
PN
336
22C$
(<!$
R14
7 M
PN
382
(A!/$
,E<!
(2$
!(2
$
!)<
8[I2$
R15
0 ??
?
R14
8 M
PN
298
R14
9 M
PN
479
!(2:7$
!!G$
3!$
CoA m
etab
olism
!%2$
!%2$
!%2$
!02$
!"2$
22C$
!"2$
#BA$
)2(<
!$
42@%$
2C$
!02$#
BA$
R18
8 ??
?
#H$
#BA$
#BA$
#BA$
#BA$
2@2$
2@2$
!N$
!N$
2@2$
2@2$
!!G$
%02N$
%02N$
0%#
3"$
0%#
3($
3#G$
34!$
927
%$
%N$
%N$
2@(4$
*N$
0!%$
"/7!$
("!$
("!$
"/A
4$
"/A
4$$
2*0$
272G$
*L'!4(
$
73N$
3!"G$
%F@7"
$
*9N$
*9N$
9*/$
9*2$
@!"N$
@!"N$
!(2G$
!*2!
%$
26N$
26N$
26N$
26N$
26N$
26N$
26N$
26N$
7"7$
7"7$
7"7$
(A!G6$
@!""$
0%#3G$
*2!
0$
!27
%$
22%$
*%3$
*%3$
(02N$
(02N$
!(2#$
%#P.$
@!"/$
G#0%$
0%#3#$
"#!N$
72P!$
9(N
$9(N
$
902N$
#27
%$
22!$
!%2$
!"2$ 2C$
!%2$
!"2$
2C$
#H$ #H$
#H$
#H$
#H$ #H$
#H$
#H$
!%2,=-$!%2,=-$
*!%$ *!%$
R12
6 M
PN
321
R19
5 M
PN
300
R00
1 M
PN
627
R02
6 M
PN
078
267$
2/2$
267$
2/2$
72/$
7"7$
#BA$
#BA$
R19
0 M
PN
597-
604
("2:(#
A$
*82($
R17
8 M
PN
532
R18
0 M
PN
336
*82$ R18
2 M
PN
420
*LE\$#BA$
(%2$
!%2$
!"2$
22C$
2($
2K)(
#A$
B$#BA$
B$3!$
R18
7 M
PN
445
2(%$
2L)4
$
(#N$
R19
9 M
PN
243
R19
8 M
PN
243
R20
0 M
PN
243
R19
7 M
PN
243
7@,=-$
7@,=-$
7@,=-$
(#A$
FF$
gene
abs
ent i
n M
. ge
nita
lium
FF$
enzy
me-
com
plex
, not
all
com
pone
nts
dete
cted
FF$
unkn
own
enzy
me
met
abol
ite, n
ot d
etec
ted
in
Mpn
but
oth
er o
rgan
ism
s
FF$
FF$
tech
nica
lly n
ot d
etec
tabl
e m
etab
olite
FF$
not d
etec
ted
enzy
me
enzy
me
esse
ntia
l in
M. g
enita
lium
FF$
dete
cted
met
abol
ite
FF$
FF$
dete
cted
enz
yme
no s
tand
ard
avai
labl
e FF$
neve
r det
ecte
d m
etab
olite
FF$
met
abol
ite d
etec
ted
for
the
first
tim
e FF$
Figure 3.3.: The metabolic core network of M. pneumoniae: Metabolites and catalyzingenzymes have been colored according to results from genome-wide screens formetabolites (this work) and proteins [Maier et al., 2011] in M. pneumoniae.The color code is shown in the lower right corner of the figure, for informationabout the moonlighting enzymes please refer to Yus et al. [2009]. A largerversion of this figure is provided for take out at the very end of this thesis.
50

3.3. Results
Nucleobases
Nucleobases can be divided into two groups, purine and pyrimidine nucleobases. Ade-nine and guanine belong to the purine nucleobases, while cytosine, thymine, and uracilare pyrimidine nucleobases. Nucleobases are processed into nucleotides which i) areincorporated to different extent into DNA and RNA, ii) function as cellular energycarrier, mainly in form of ATP, iii) are incorporated into reaction cofactors, such asNAD+/NADH or coenzyme A, and iv) have functions in signal transduction [Albertset al., 2008].We measured nucleobases as well as nucleosides in the M. pneumoniae cytosol and in
the growth medium from samples taken at regular intervals during a four days growthexperiment (Figure 3.4). Methodological constraints in sample preparation prior toGC-MS analysis result in substantial chemical conversion of nucleosides and nucleotidesinto their cognate bases for most nucleosides. Thereby, conversion rates ranged fromabout 3% for adenosine to about 50% for thymidine (Appendix A, Figure A.3). To thisend, cumulative amounts of determined cytosolic nucleobases and nucleosides (NUBS)are assumed to represent the cellular inventory of free nucleobases, nucleosides, (labile)nucleotides and nucleobase containing coenzymes (Figure 3.5).
0.E+00
5.E+04
1.E+05
2.E+05
2.E+05
3.E+05
3.E+05
4.E+05
4.E+05
5.E+05
5.E+05
Uracil Thymine Cytosine Adenine Guanine Uridine Cy?dine Adenosine Guanosine Thymidine
Copies per cell
day1 day2 day3 day4
0
500
1000
1500
2000
2500
3000
3500
4000
4500
5000
Uracil Thymine Cytosine Adenine Guanine Uridine Cy?dine Adenosine Guanosine Thymidine
ng/ ml growth m
edium
GM Day 1 GM Day 2 GM Day 3 GM Day 4
A
B
Figure 3.4.: Free bases and nucleosides have been measured along a four days growthexperiment. A: in the M. pneumoniae cytosol; B: in the growth medium.
51

3. Metabolome Analysis and Characterization of M. pneumoniae Metabolism
Despite their constant depletion from the growth medium along the four days growthcourse, we found that NUBS are not growth limiting based on their final concentrationsafter 96 hours of growth (Figure 3.4). Compared to the growth medium, NUBS are foundon average 700 times enriched in the cytosol, suggesting a direct and active import byM. pneumoniae, although no transport protein has been identified so far. The observedextracellular changes are reflected by intracellular abundance changes for all NUBS butfor adenine/adenosine, which was maintained at a constant concentration of 5 mM at allexamined times. This finding indicates the existence of a separate mechanism responsiblefor maintaining the intracellular pools of ADP and ATP at constant levels independent ofalternations in the growth conditions. Compared to E. coli, the determined intracellularconcentrations in M. pneumoniae are on average three times lower [Bennett et al., 2009].
0.0E+00
5.0E+04
1.0E+05
1.5E+05
2.0E+05
2.5E+05
3.0E+05
3.5E+05
4.0E+05
A C G T U
copies per cell
DNA
rRNA
mRNA
tRNA
24 h
48 h
72 h
96 h
Figure 3.5.: NUBS (free + bound nucleobases) homeostasis: Bound nucleobases (red bars)and free NUBS determined for different days of a four days batch culturegrowth experiment (blue bars) in the M. pneumoniae cytosol.
To further analyze homeostasis of cellular nucleobase pools and their turnover, wequantified nucleobases bound in DNA, mRNA, and tRNA (Figure 3.5). To this end,we integrated available data on the genome sequence and ribosome, mRNA, and tRNAabundances [Yus et al., 2009, Maier et al., 2011]. We found that DNA and tRNA arethe mayor cellular nucleobase sinks and that the amount of bound molecules exceededthe freely available NUBS for all nucleobases except uracil. We conclude, that the largeintracellular pools of nucleobases determined in M. pneumoniae reflect their high func-tional diversity and the importance of especially adenine derivatives in living organisms.
Amino Acids
The initial reconstruction of the metabolic network [Yus et al., 2009], genetic evidence[Güell et al., 2009], and the proteome analysis [Maier et al., 2011] showed that M. pneu-moniae lacks almost all anabolic pathways for amino acid synthesis and modification.Instead, M. pneumoniae takes up single amino acids and peptides from the environment[Yus et al., 2009]. We determined amino acid concentrations for the cytosol and for the
52
3.3. Results
growth medium by GC-MS and integrated our results with quantitative information onthe proteome composition (Figure 3.6A).
A
B
0
0.5
1
1.5
2
2.5
3
3.5
4
0
0.5
1
1.5
2
2.5
3
3.5
Glu Gln Asp Asn
0
1
2
3
4
5
6
7
Asn Asp Gln Glu Cys Lys Gly Ala
Fold
incr
ease
Control Spiked
0
5
10
15
20
25
Glu Phe Arg Ala Pro Gly Leu Lys Asp Ile Asn Ser Met His Val Gln Trp Thr Tyr Cys
Rela
tive
Abu
danc
e (%
)
Proteome
Cytosol
Growth medium
Figure 3.6.: Amino acid quantification. A: Relative amino acid abundances in the pro-teome (black), the cytosol (dark grey), and the growth medium (light grey).B: In the upper part, abundance changes of specific amino acids upon artifi-cial enhancing of their concentrations in the growth medium (spiking). In thelower part, abundance changes for the labeled amino acids upon spiking oftheir respective vertically aligned amino acid in the upper part, proving theirreversibility of reactions M152 and M153.
Cytoplasmic amino acid concentrations range from 0.1 mM for cysteine to 3.3 mMfor glutamic acid which accounts for 21.1% of the total amount of free amino acids.
53

3. Metabolome Analysis and Characterization of M. pneumoniae Metabolism
As for nucleobases, we found intracellular amino acid concentrations to be significantlyenriched compared to the surrounding growth medium (Appendix A, Figure A.4). Arti-ficially increasing the concentrations of individual amino acids in the growth medium ledto a concomitant increase of the respective intracellular concentrations (Figure 3.6B).Nevertheless, the amino acid pools of the growth medium are only partially reflected bycytosolic pools (Pearson correlation coefficient of relative amino acid abundances rp =0.16) and the quantitative distribution in the proteome (rp = 0.33) [Maier et al., 2011](Figure 3.6A). These findings suggest that M. pneumoniae actively imports amino acidsfrom the growth medium but with different efficiencies.Interestingly, an artificial increase of extracellular concentrations of asparagine and
glutamine levels, resulted in an additional increase of intracellular concentrations ofaspartate and glutamate, respectively, while inversely this effect was not observed (Fig-ure 3.6B). The metabolic network of M. pneumoniae contains two reactions (M152 andM153) in which misacetylated Glu-tRNA(gln) is converted into Gln-tRNA(gln), therebyconsuming ATP and glutamine or asparagine and releasing glutamate or aspartate,respectively. We thus confirm that the glutamyl-tRNA-amidotransferase (MPN236-MPN238), compensates for the lack of a Gln-tRNA-synthetase in M. pneumoniae, aspreviously shown also for other gram-positive bacteria [Curnow et al., 1997].
Fatty Acids
It has been shown that the membrane composition in mycoplasmas varies depending onthe fatty acid composition of the growth medium [McElhaney and Tourtellotte, 1969,Pollack et al., 1970, Rottem, 1980]. To obtain insight into the uptake of fatty acids fromthe medium and their incorporation into the cell membrane, we quantified the fattyacids contained in the growth medium, present in the cytosol, and incorporated intomembrane lipids (Figure 3.7A). While in the growth medium 80% of all fatty acids haveC18 chains, in the cytosol as well as in the cellular membranes fatty acids with C16 chains(41% and 49% of all fatty acids, respectively) are dominant. In general, we found similarfatty acid profiles for the cytosol and the membranes, suggesting an actively regulatedimport of fatty acids but unregulated incorporation into membrane lipids.Since no significant depletion in the growth medium could be measured between begin-
ning and end of the growth course, we conclude that fatty acids are not growth limitingin M. pneumoniae (Appendix A, Figure A.5). While at early growth stages fatty acidswith longer chains are found commonly accounting for 17% of all fatty acids, towardslater growth stages they amount for only 3.5% of the total fatty acid pool (Figure 3.7B).Interestingly, cytoplasmic and membrane incorporated fatty acids are significantly en-riched in saturated fatty acids (71% and 70%, respectively) compared to the growthmedium (41%). This can be explained by their positive influence on membrane stabilityand integrity, since incorporation of unsaturated (cis) fatty acids disrupt the membranestructure [Lucy, 1972]. For M. pneumoniae membrane stability is of upmost importancedue to the lack of a protective cell wall.
54

3.3. Results
B
A
0% 10% 20% 30% 40% 50% 60% 70% 80% 90% 100%
Cell membrane
Cytoplasm
Growth medium
C16 C18 C18:2 C18:1 C18:3 C17 others
0% 10% 20% 30% 40% 50% 60% 70% 80% 90% 100%
day4
day3
day2
day1
C16:0 C18:0 C18:1 C18:2 C17:0 others
Figure 3.7.: Fatty acid composition analysis: Fatty acid chains of different length havebeen quantified. A: in the cytosol, the membranes, and the growth medium,B: in the cytosol at regular intervals of a four days batch culture growthexperiment.
3.3.4. Defining the Biomass Composition of M. pneumoniaeTo simulate cell growth and to allow the prediction of realistic metabolic flux distribu-tions, an accurate quantitative representation of the biomass composition of an averageM. pneumoniae cell, i.e. the macromolecules composing the cell, must be defined (Equa-tion 1.4). Mycoplasmas have been shown to comprise 54-62% protein, 12-20% lipids, 3-8% carbohydrates, 8-17% RNA, and 4-7% DNA [Razin et al., 1963] and M. pneumoniaecontains 10 fg of protein per cell [Yus et al., 2009]. Assuming that proteins account for62% of the total cell mass, one M. pneumoniae cell has a total weight of 16.13 fg whatallowed us to determine the different other biomass fractions (Table 3.1).To determine a realistic mathematical representation of a M. pneumoniae cell, sev-
eral assumptions and technical tricks necessary to allow iJW145 to simulate biomassproduction and growth have been made:
1. DNA and all RNA types have to be synthesized once de novo which is accom-plished by building artificial DNA and RNA molecules of 100 bases length each,displaying the natural GC content of the respective molecules. mRNA turnoveris considered by setting a minimal constraint on the degradation reaction (0.0028mmol∗g−1∗h−1) reflecting the minimum average mRNA half-life of about 1 minute[Maier et al., 2011]. In order to account for DNA degradation, DNA repair andmeasurement errors in the microarray data [Güell et al., 2009], the amount of DNAand RNA needed for biomass production has been determined to account for 5.2%and 6.5%, respectively, of the total biomass.
2. Protein production is modeled via building of artificial protein molecules of 345amino acids length (average protein length according to Yus et al. [2009] reflect-
55

3. Metabolome Analysis and Characterization of M. pneumoniae Metabolism
Table 3.1: Biomass Compositionbiomass biomass biomass
fraction in fraction in fraction in quantity% of total mmol/g molecules/ determined
biomass component cell mass of cells cell byDNA 5.00 1624 15774.70 sequenceRNA 6.50 2015 19572.67 sequenceprotein 62.00 16049 155891.74 sequenceACP 0.003 3 29.14 Maier et al. [2011]
glycolipid (Mpn) 10.00 63702 618768.49 GC/MS (fatty acid chains)phosphatidic acid (Mpn) 10.00 148168 1439227.79 GC/MS (fatty acid chains)
glycine 0.07 9220 89558.34 GC/MSL-alanine 0.09 9824 95425.29 GC/MSL-arginine 0.07 3913 38008.87 GC/MS
L-asparagine 0.001 54 524.53 GC/MSL-aspartate 0.12 9318 90510.26 GC/MSL-cysteine 0.001 67 650.80 GC/MSL-glutamate 0.27 18651 181166.23 GC/MSL-glutamine 0.004 294 2855.76 GC/MSL-histidine 0.04 2422 23526.06 GC/MSL-isoleucine 0.02 1858 18047.66 GC/MSL-leucine 0.28 21313 207023.53 GC/MSL-lysine 0.03 1741 16911.18 GC/MS
L-methionine 0.02 1370 13307.48 GC/MSL-phenylalanine 0.08 5122 49752.48 GC/MS
L-proline 0.08 6837 66411.10 GC/MSL-serine 0.03 3202 31102.58 GC/MS
L-threonine 0.03 2489 24176.87 GC/MSL-tryptophan 0.04 1864 18105.94 GC/MSL-tyrosine 0.02 1366 13268.62 GC/MSL-valine 0.03 2793 27129.77 GC/MSadenosine 0.05 1981 19242.42 GC/MScytidine 0.01 503 4885.88 GC/MSguanosine 0.05 1657 16095.25 GC/MSthymidine 0.03 1242 12064.15 GC/MSuridine 0.06 2541 24681.97 GC/MS
orthophosphate (Pi) 0.40 41537 403474.00E. coli
Amin and Peterkofsky [1995],Neidhardt [1996]
thiamin diphosphate 0.00 100 971.35 functionNADPH 0.01 100 971.35 functionNADP+ 0.01 100 971.35 functionCoA 0.01 100 971.35 functionFAD 0.01 100 971.35 function5fTHF 0.005 100 971.35 function
pyridoxal phosphate 0.002 100 971.35 functionS-adenosyl-L-met 0.004 100 971.35 function
CDP-CHO 0.0001 100 971.35 functionD-G6P 4.51 174748 1814216.37 100%biomass - rest
Table 3.1.: Biomass composition of an average M. pneumoniae cell: For the differentbiomass components information about their biomass fraction, the respectiveconstraint set (note that this value has been adjusted to 1000000*biomass inorder to avoid numerical problems of the solver), the equivalent number ofmolecules per cell, and the methods used to determine each constraint are pro-vided.
56
3.3. Results
ing the amino acid composition found in the quantified proteome [Maier et al.,2011]. An exception is the acyl-carrier-protein (ACP) that is modeled exactly, i.e.sequence-dependent, and also included in the biomass in the quantity it has beendetected on the second day of growth [Maier et al., 2011] as it plays an importantrole in CoA metabolism. M. pneumoniae is known to take up peptides using theOpp transporter and amino acids using ABC systems to import and proton sym-port to export them [Yus et al., 2009]. Since nothing is known about the specificityand activity of the proteases located on the surface of the M. pneumoniae cells andthe up-take of peptides of varying amino acid composition is more complicated tosimulate, in the model we only consider ABC transporters for the import of singleamino acids.
3. The exact lipid composition of M. pneumoniae is not known but fatty acids havebeen quantified based on the length of their carbon chains (section 3.3.3). Becauseof the varying lipid composition in mycoplasmas depending on the fatty acidsprovided with the medium [McElhaney and Tourtellotte, 1969, Pollack et al., 1970,Rottem, 1980] we made the following assumptions for lipids in our model:
• Lipids provide 20% of the total cell mass (assumption based on [Razin et al.,1963]).
• The ”average” lipid has two fatty acid chains, one composed of 16 and theother of 18 carbon atoms. Fatty acids with carbon chains of 16 and 18 carbonslength, respectively, have been found to be most abundant in M. pneumoniaecontributing about 95% of the total fatty acids encountered (Figure 3.7). Inaddition, the defined medium designed for M. pneumoniae [Yus et al., 2009]only contains fatty acids with 16 and 18 carbon atoms length. Cholesterol,despite having been shown to be essential for M. pneumoniae growth [Rottemet al., 1971, Johnson and Somerson, 1980, Yus et al., 2009] and found to beabundant in the cytosol (section 3.3.3), has not been included explicitly, sinceno information about the specific up-take mechanism could be found.
• Phosphatidic acid (PAC) and glycolipids provide half of the total lipid masseach.
• Cardiolipin (CL) was not included in the biomass as the phospholipid branch(conversion of PAC into CL) is not essential in M. genitalium [Glass et al.,2006] and the functionality of this pathway has not been proven for M. pneu-moniae. None of the intermediary metabolites nor CL have been detected(section 3.3.2), as neither have the two proteins assigned to this pathway[Maier et al., 2011].
• For glycolipids we assumed the attachment of three galactose and three glu-cose molecules to each diacylglycerol molecule to account for the diversity ofglycolipids.
• The total amount of lipids needed to duplicate one cell was calculated basedon the molecular masses of the ”average” glycolipid and PAC, respectively.
57
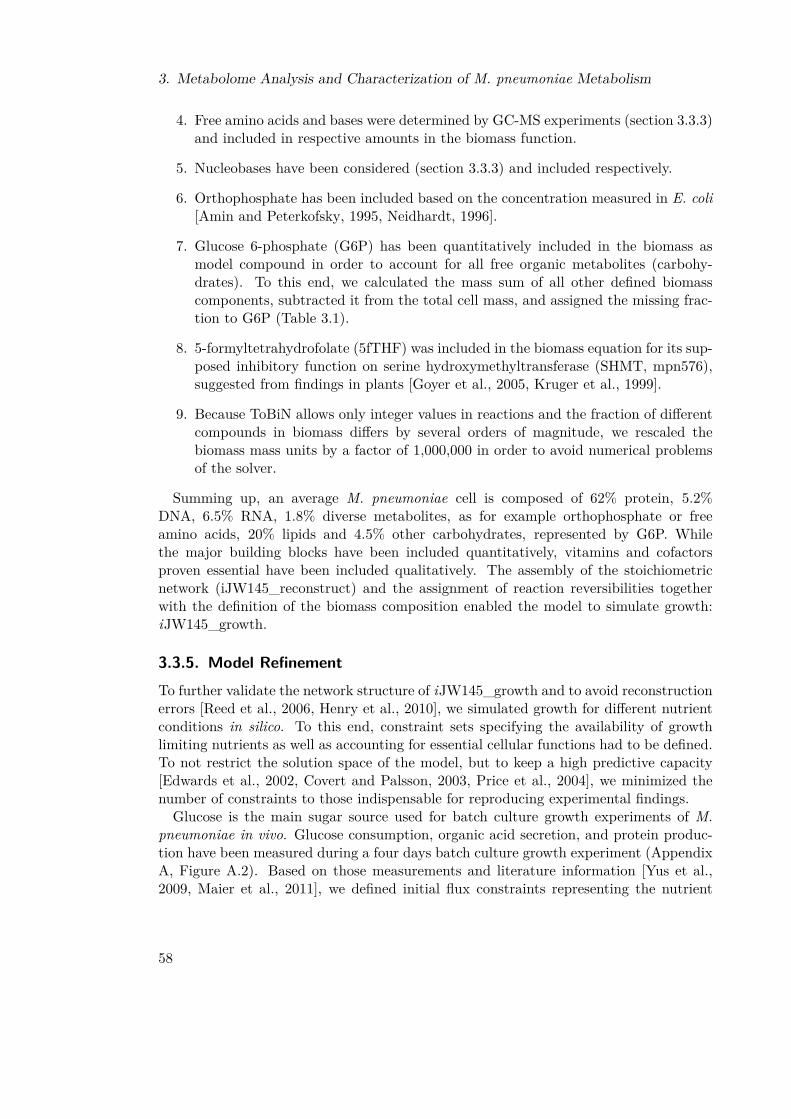
3. Metabolome Analysis and Characterization of M. pneumoniae Metabolism
4. Free amino acids and bases were determined by GC-MS experiments (section 3.3.3)and included in respective amounts in the biomass function.
5. Nucleobases have been considered (section 3.3.3) and included respectively.
6. Orthophosphate has been included based on the concentration measured in E. coli[Amin and Peterkofsky, 1995, Neidhardt, 1996].
7. Glucose 6-phosphate (G6P) has been quantitatively included in the biomass asmodel compound in order to account for all free organic metabolites (carbohy-drates). To this end, we calculated the mass sum of all other defined biomasscomponents, subtracted it from the total cell mass, and assigned the missing frac-tion to G6P (Table 3.1).
8. 5-formyltetrahydrofolate (5fTHF) was included in the biomass equation for its sup-posed inhibitory function on serine hydroxymethyltransferase (SHMT, mpn576),suggested from findings in plants [Goyer et al., 2005, Kruger et al., 1999].
9. Because ToBiN allows only integer values in reactions and the fraction of differentcompounds in biomass differs by several orders of magnitude, we rescaled thebiomass mass units by a factor of 1,000,000 in order to avoid numerical problemsof the solver.
Summing up, an average M. pneumoniae cell is composed of 62% protein, 5.2%DNA, 6.5% RNA, 1.8% diverse metabolites, as for example orthophosphate or freeamino acids, 20% lipids and 4.5% other carbohydrates, represented by G6P. Whilethe major building blocks have been included quantitatively, vitamins and cofactorsproven essential have been included qualitatively. The assembly of the stoichiometricnetwork (iJW145_reconstruct) and the assignment of reaction reversibilities togetherwith the definition of the biomass composition enabled the model to simulate growth:iJW145_growth.
3.3.5. Model RefinementTo further validate the network structure of iJW145_growth and to avoid reconstructionerrors [Reed et al., 2006, Henry et al., 2010], we simulated growth for different nutrientconditions in silico. To this end, constraint sets specifying the availability of growthlimiting nutrients as well as accounting for essential cellular functions had to be defined.To not restrict the solution space of the model, but to keep a high predictive capacity[Edwards et al., 2002, Covert and Palsson, 2003, Price et al., 2004], we minimized thenumber of constraints to those indispensable for reproducing experimental findings.Glucose is the main sugar source used for batch culture growth experiments of M.
pneumoniae in vivo. Glucose consumption, organic acid secretion, and protein produc-tion have been measured during a four days batch culture growth experiment (AppendixA, Figure A.2). Based on those measurements and literature information [Yus et al.,2009, Maier et al., 2011], we defined initial flux constraints representing the nutrient
58

3.3. Results
supply by defined and rich medium as described in Material and Methods, section 3.2.1.During four days of batch culture growth, a metabolic shift from mainly acetic acidfermentation towards mainly lactic acid fermentation can be observed (Appendix A,Figure A.2) [Yus et al., 2009]. In agreement, the abundance of the lactate dehydro-genase (LDH) increases from 203 copies per cell at early growth stages to above 1000copies per cell after four days of growth [Maier et al., 2011]. To represent this shift inour model, we directly constrained the favorable acetic acid production.Applying the defined constraint sets, the model was able to simulate growth under
different conditions using biomass synthesis as objective function for the FBA. Initialsimulations and flux distributions verified the network structure and confirmed a widerange of experimental data. Nevertheless, we also identified several conflicts betweenmodel predictions and available experimental results. These conflicts were resolved inan iterative process of model simulations and evaluation of the prediction results, thusguiding the correction of the wiring diagram (Figure 3.8). To this end, we accomplished
!"#$
!%&$
!'&$
(%&$
()#$
('&$
!*&$(*&$
RNA
+,&$
&+&&$
(&&$M092 MPN064 M098
MPN065
M094 MPN561
M093 ???
M091 MPN033
M101 MPN561
M103 MPN476
M096 MPN303
M104 MPN303
M102 ???
#(%&$ M097 MPN322/323/324
-*.$
-/0$
M100 MPN516
M105 MPN034/387
+-1&$ +-1&$
&2+$
&3&$
&2+$
&3&$
()4$
&5$ &5$
&5$&5$
&5$
1%&$
1*&$
1%&$
1*&$
1%&$
1*&$
1%&$
1*&$
/67$&&5$
)8#*95:$:;*95:$
/67$ /67$
&&5$ &&5$
-*.$
M070 MPN240
/67$
-1%&/$ -1%&<$/<$
M095 MPN632
/67$ /67$
(&+*$
!%1$
*=-+%$
&2>$ &2>$
+%+$
!'&>$
(!>$(!>$
('&>$
-/0$$$$$$$$$$$$$
!*&?$
&5$1%&$1*&$
C
@0&$
@&7
$
M047 MPN051
/676$76$
%/1&$
-1%/$-1%<$
@AB%
$
A
&2+$ 1C!:1$M012-014 MPN390-393
-1%/$-1%<$
76$
M017 MPN394
/<$!:1$ !76$
&%/$
-7=$/67$
B
==$ enzyme
==$ essential minimum medium component
==$ moonlighting enzyme ==$ exported metabolite
==$new enzymatic activity/gene assignation
enzyme essential in M. genitalium ==$
metabolite ==$
==$ imported metabolite
Figure 3.8.: Sub-networks of M. pneumoniae metabolism to which changes have been ap-plied. A: pyrimidine metabolism to illustrate the removal of the reactionconverting UTP into CTP; B: NOX reaction has been changed from produc-ing H2O2 to producing H2O; C: changes applied to the reaction convertingG3P into DHAP. Red crossed reactions have been removed from the network.
additional experiments and used sequence alignments, literature mining and repeatedsimulations with adjusted constraints, ultimately resulting in a refined metabolic net-work, iJW145. The processes leading to the correction of the wiring diagram are outlinedbelow.
59

3. Metabolome Analysis and Characterization of M. pneumoniae Metabolism
Redox state: For ATP generation, M. pneumoniae relies on glycolysis and the subse-quent organic acid fermentation. Pyruvate dehydrogenation, leading to the productionof acetic acid, causes an intracellular redox imbalance due to the accumulation of NADH.The model initially predicted a circular interconversion of DHAP and G3P to maintainthe redox balance, thereby producing toxic H2O2. According to the wiring diagramfrom [Yus et al., 2009], this interconversion was catalyzed by a coupled glycerol phos-phate dehydrogenase (GlpD)/glycerol phosphate oxidase (GPO) (MPN051). However,in 13C-glucose tracer experiments we examined only very low conversion rates of DHAPinto G3P (compare section 3.3.7). Additionally, sequence analysis (Appendix A, sec-tion A.1.2) and experimental results [Hames et al., 2009] independently characterizedMPN051 as a GPO without GlpD similarity. In consequence, we deleted the GlpDreaction (R050 in [Yus et al., 2009]) from the model (Figure 3.8A).Subsequently, in silico the NADH oxidase (NOX, MPN394) maintained the redox bal-
ance, thereby producing major quantities of H2O2 from oxygen. This hypothesis wasnot supported experimentally, since the GPO has been shown to be the major source forH2O2 production [Hames et al., 2009]. Nevertheless, the high abundance of the NOX(1763 copies per cell, [Maier et al., 2011]), suggest high cellular activity. Literaturesearch revealed that two NOX isoforms, one producing H2O2 and the other H2O, exist[Sakamoto et al., 1996]. According to sequence alignments using pBLAST (Appendix A,section A.1.3), the M. pneumoniae NOX was re-annotated as a H2O-producing isoformcontaining even the characteristic FAD-binding fingerprint conserved through a varietyof organisms (Appendix A, Figure A.6). The model has been adapted accordingly (Fig-ure 3.8B), now predicting NOX-dependent maintenance of the cellular redox balanceand the GPO being the major source of H2O2 production.
Pyrimidine requirements: In their minimal medium experiments [Yus et al., 2009]determined the nucleobase cytidine as essential and sufficient to synthesize all pyrim-idine nucleotides. Contradicting this finding, but confirming literature data on othermycoplasmas [Maniloff et al., 1992, Pachkov et al., 2007], iJW145 predicted that alsouracil could serve as precursor for the production of all pyrimidine nucleotides. One byone we silenced the reactions of the pyrimidine metabolism, thus identifying MPN256, aproposed CTP synthase, to be responsible for the sufficiency of uracil for in silico growth(Figure 3.8C). pBLAST results could not confirm this function assignment, showing thatneither MPN256 nor any other M. pneumoniae protein has significant sequence similar-ity with CTP synthases from other organisms, such as B. subtilis or E. coli (AppendixA, section A.1.4). After removing the respective reaction (R098 in [Yus et al., 2009])from the model (Figure 3.8C), only cytidine can be used as a precursor for the synthesisof all pyrimidine nucleotides.
Glycerol essentiality in minimal medium: Glycerol has been shown to be essen-tial for in vivo growth of M. pneumoniae under minimal medium conditions [Yus et al.,2009]. Growth simulations initially did not support this finding due to the fact thatglucose was used for the production of the lipid precursor G3P when silencing other
60
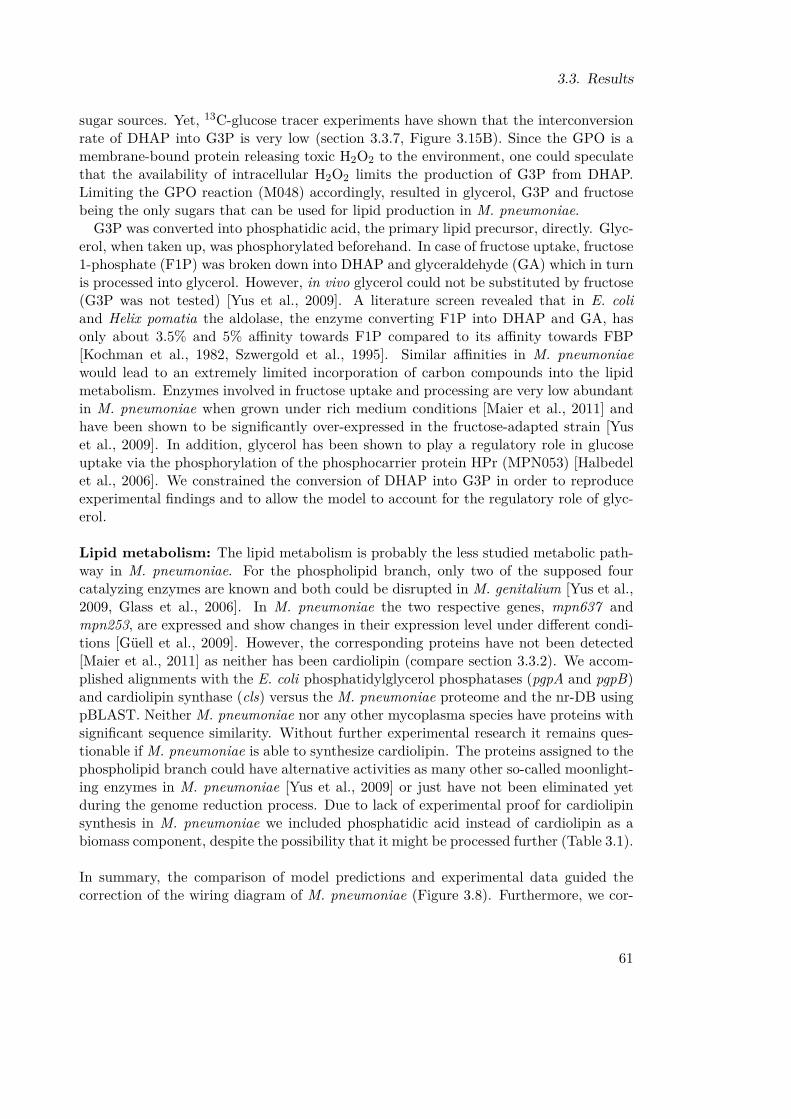
3.3. Results
sugar sources. Yet, 13C-glucose tracer experiments have shown that the interconversionrate of DHAP into G3P is very low (section 3.3.7, Figure 3.15B). Since the GPO is amembrane-bound protein releasing toxic H2O2 to the environment, one could speculatethat the availability of intracellular H2O2 limits the production of G3P from DHAP.Limiting the GPO reaction (M048) accordingly, resulted in glycerol, G3P and fructosebeing the only sugars that can be used for lipid production in M. pneumoniae.G3P was converted into phosphatidic acid, the primary lipid precursor, directly. Glyc-
erol, when taken up, was phosphorylated beforehand. In case of fructose uptake, fructose1-phosphate (F1P) was broken down into DHAP and glyceraldehyde (GA) which in turnis processed into glycerol. However, in vivo glycerol could not be substituted by fructose(G3P was not tested) [Yus et al., 2009]. A literature screen revealed that in E. coliand Helix pomatia the aldolase, the enzyme converting F1P into DHAP and GA, hasonly about 3.5% and 5% affinity towards F1P compared to its affinity towards FBP[Kochman et al., 1982, Szwergold et al., 1995]. Similar affinities in M. pneumoniaewould lead to an extremely limited incorporation of carbon compounds into the lipidmetabolism. Enzymes involved in fructose uptake and processing are very low abundantin M. pneumoniae when grown under rich medium conditions [Maier et al., 2011] andhave been shown to be significantly over-expressed in the fructose-adapted strain [Yuset al., 2009]. In addition, glycerol has been shown to play a regulatory role in glucoseuptake via the phosphorylation of the phosphocarrier protein HPr (MPN053) [Halbedelet al., 2006]. We constrained the conversion of DHAP into G3P in order to reproduceexperimental findings and to allow the model to account for the regulatory role of glyc-erol.
Lipid metabolism: The lipid metabolism is probably the less studied metabolic path-way in M. pneumoniae. For the phospholipid branch, only two of the supposed fourcatalyzing enzymes are known and both could be disrupted in M. genitalium [Yus et al.,2009, Glass et al., 2006]. In M. pneumoniae the two respective genes, mpn637 andmpn253, are expressed and show changes in their expression level under different condi-tions [Güell et al., 2009]. However, the corresponding proteins have not been detected[Maier et al., 2011] as neither has been cardiolipin (compare section 3.3.2). We accom-plished alignments with the E. coli phosphatidylglycerol phosphatases (pgpA and pgpB)and cardiolipin synthase (cls) versus the M. pneumoniae proteome and the nr-DB usingpBLAST. Neither M. pneumoniae nor any other mycoplasma species have proteins withsignificant sequence similarity. Without further experimental research it remains ques-tionable if M. pneumoniae is able to synthesize cardiolipin. The proteins assigned to thephospholipid branch could have alternative activities as many other so-called moonlight-ing enzymes in M. pneumoniae [Yus et al., 2009] or just have not been eliminated yetduring the genome reduction process. Due to lack of experimental proof for cardiolipinsynthesis in M. pneumoniae we included phosphatidic acid instead of cardiolipin as abiomass component, despite the possibility that it might be processed further (Table 3.1).
In summary, the comparison of model predictions and experimental data guided thecorrection of the wiring diagram of M. pneumoniae (Figure 3.8). Furthermore, we cor-
61

3. Metabolome Analysis and Characterization of M. pneumoniae Metabolism
rected the functional annotation of three M. pneumoniae proteins: MPN051 is a GPOwith no GlpD activity, MPN394 is producing water not H2O2, and MPN256 has no CTPsynthase activity.
3.3.6. Model ValidationMetabolic Capabilities When Grown on Alternative Sugar Sources
M. pneumoniae is able to process several alternative carbon sources despite from glucose:glycerol, G3P, fructose, ribose, mannose, mannitol, ascorbate, and G3PC [Yus et al.,2009, Schmidl et al., 2011]. To validate our metabolic reconstruction, we adjusted theconstraint sets for rich and minimal medium compositions for growth on different carbonsources and predicted the qualitative in silico growth capabilities of M. pneumoniae(Table 3.2). We verified the prediction by comparing our results to experimentallydetermined growth capabilities from different studies [Yus et al., 2009, Schmidl et al.,2011].
Table 3.2: Growth on Alternative Sugarsrich medium defined medium
sugar in silico growth in vivo growth[Yus et al., 2009]
in silico growth
glucose X X1,2 Xfructose X X1,2 0mannose X X2 Xmannitol X -2 Xribose X (X)2 X
ascorbate X (X)2 Xglycerol X (X)2 0G3P X not tested 0G3PC X (X)1 0
Table 3.2.: Comparison of the in silico predictions to in vitro results for growth on alterna-tive sugars. X- growth; (X) - catabolic activity (growth not proven by proteinmeasures); 0 - catabolic activity but no growth; not tested - growth on therespective sugar source has not been examined; 1 - this study, 2 - Yus et al.[2009].
In silico doubling times were comparable when the same amount of carbon was pro-vided. In contrast, the in vivo doubling times differed significantly (Appendix A, Fig-ure A.2) [Yus et al., 2009]. However, it has been also shown that several serial passagesare necessary to adapt the wild type M. pneumoniae to growth on fructose and that inthose adapted cells the enzymes involved in fructose uptake and processing are signifi-cantly overexpressed [Yus et al., 2009]. Comparing the abundances of the different sugaruptake proteins, we found that the glucose-specific protein (MPN207) has high copynumbers (∼385/cell), while all other known sugar transporters are about 14 - 100 times
62

3.3. Results
less abundant (fructose and mannose: 3-5 copies/cell; ribose: 25 copies/cell; glycerol,G3P, mannitol and ascorbate: not detectable) [Maier et al., 2011].For minimal medium conditions, the model predicted growth on glucose, ribose, man-
nose, mannitol, and ascorbate while no growth has been observed on fructose, glyc-erol, G3P, and phosphatidylcholine (Table 3.2). The inability to synthesize the pentosephosphate pathway precursor fructose 6-phosphate (F6P), indispensable for de novo nu-cleotide synthesis in absence of ribosylated nucleobases, has been identified as cause forthis growth limitations.
Gene Essentiality Prediction and Analysis of Mutant Phenotypes
To further validate the model on a global scale, we accomplished an in silico knock-outstudy for 131 metabolic genes (genes coding for proteins involved in DNA degradation,ATPase function, and chaperone activity have not been included in knock-out studysince the respective processes have not been modeled explicitly). To this end, we sys-tematically silenced, i.e. limited to zero, all reactions catalyzed by the same gene productand applied FBA for growth under rich medium conditions. 73 genes (56% of enzymesincluded in the prediction) were predicted to be essential, since the respective knock-outled to either growth arrest or cell death when not all minimum constraints could bematched (Figure 3.9A and Appendix A, Table A.10). Conversely, 58 enzymes (44%)were predicted to be not essential, since their in silico knock-out resulted in objectivevalues for the FBA larger than zero.The prediction results were evaluated by comparing them to a genome-wide transposon
mutagenesis study in the closely related bacterium M. genitalium [Glass et al., 2006].Therefore, we assigned functional orthologs of M. pneumoniae and M. genitalium basedon sequence alignments for the genes and the promotor regions and on an alignment ofCOG IDs (Appendix A, Table A.11). For 17 M. pneumoniae genes no ortholog in M.genitalium could be assigned. Those genes were considered to be not essential due totheir absence in M. genitalium and the high similarity of the metabolic networks of bothorganisms.
Table 3.3: Statistics for the gene essentiality predictioncomparisonto Glasset al. [2006]
comparisonalso to M.pneumoniaemutants
taking condi-tions into ac-count
TP (true positive) 72 72 72TN (true negative) 41 48 53FP (false positive) 1 1 1FN (false negative) 17 10 5ACC (prediction accuracy) 0.8626 0.9160 0.9542SPC (prediction specificity) 0.9762 0.9796 0.9815ACC in % 86.26 91.60 95.42SPC in % 97.62 97.96 98.15
Table 3.3.
63

3. Metabolome Analysis and Characterization of M. pneumoniae Metabolism
A B
C
25.19%
19.08%
33.59%
22.14%
Figure 3.9.: In silico knock-out study. A: Knock-out effects on growth separated into lethal(dark blue), growth inhibiting (light blue), reduced fitness (light grey), andgrowth not affecting (dark grey) mutant phenotypes; B: relative flux changesfor reduced fitness knock-out vs. wild type simulations (sink/source reactionsare excluded): down-regulation (blue) → up-regulation up to 100% (red),inverse fluxes (light green), new fluxes (dark green) and flux changes >100%(brown); C: relative flux changes of reactions predicted to have inverse, newor highly up-regulated flux under at least one knock-out condition.
64

3.3. Results
In a first, unbiased analysis using gene essentiality in M. genitalium and the complexassumption (see Material and Methods, section 3.2.1) as only criteria, we achieved 86%accuracy (correct predicted/total predicted) and 97% specificity (true negatives/(truenegatives + false negatives)) with the in silico gene essentiality prediction (Table 3.3). Incase of contradictions between model prediction and gene essentiality in M. genitalium,we screened a M. pneumoniae transposon library and could confirm the prediction of fivenon-essential genes (Figure 3.10). When further taking the simulated conditions (richmedium, growth on glucose) into account, the model predicts essentiality for metabolicgenes with a final accuracy of more than 95% and specificity higher than 98% (Ta-ble 3.3). We conclude that the metabolic model iJW145 possesses high predictive powerfor metabolic phenotypes.To obtain information on the impact of gene knock-outs on the metabolic behavior
of M. pneumoniae, we quantitatively assayed the flux changes in in silico knock-outsproducing reduced fitness phenotypes (Figure 3.9B). We performed unbiased clusteringfor genes and reactions, respectively, according to either their influence on reaction fluxesor their flux changes in reduced fitness phenotype producing knock-outs (Figure 3.9B).Genes of the acetate branch (pyruvate metabolism) are found to have similar influenceon the network behavior and reactions of the same pathway often show similar changesin the same in silico knock-out. The many small clusters (composed nearly exclusively of
A B
- + - + - + - + - +
MPN 133
MPN 392
MPN 321
MPN 595
MPN 533
mpn133
173183
172691
192 bp 381529 382011
140 bp
381698
716977 717435 188bp
717112
mpn595
656153
655990
341 bp 654981
mpn533
470357
470043
144 bp 469374
mpn392
172277
mpn132
Figure 3.10.: Isolated knock-out mutants of M. pneumoniae. A: schematic representationof the disrupted genes (big colored arrows) with genome positions, insertionsite (black triangle), and the length of the PCR fragment (indicated belowthe respective gene); B: Western Blot of positive screening results of a mutantlibrary, confirming the mutants predicted in silico.
the components of just one metabolic complex) and single enzyme clusters reflect the highpercentage of multifunctional enzymes, i.e. enzymes catalyzing more than one metabolicreaction, and transport proteins encoded by the non-essential genes (together 51.5%).When analyzing the qualitative flux changes, we found that most of the individualreaction fluxes (colored boxes in Figure 3.9B) are down-regulated (blue, ∼54%) or do notchange at all (white, ∼34%) in response to in silico gene deletions resulting in reducedfitness phenotypes. However, we also identified several highly up-regulated reactions(red-brown, ∼10.4%) and a few flux direction changes (dark green, ∼0.4%). Only 88new fluxes (light green, ∼1.1% of all fluxes) have been observed in a total number of
65

3. Metabolome Analysis and Characterization of M. pneumoniae Metabolism
15 reactions in the 32 analyzed knock-outs, highlighting the impact of the reductivegenome evolution and the resulting lack of metabolic rescue pathways on the metaboliccapabilities of M. pneumoniae.We analyzed the reactions with highly up-regulated, new or reverse fluxes under at
least one in silico knock-out (Figure 3.9C). As expected, the LDH reaction (M011) getssignificantly up-regulated in all knock-outs of genes related to the acetate branch ofthe pyruvate metabolism. Surprisingly, all other 28 selected reaction belong to eithernucleotide metabolism (and associated glycolysis or cofactor metabolism reactions) orthe pentose phosphate pathway. One could speculate that the non-essential genes inthose two pathways have been preserved during the reductive genome evolution to allowM. pneumoniae to presumably maintain growth ability in case of non-constant supplyof (some) nucleobases.
3.3.7. Model ApplicationIn Silico Double Knock-out Prediction
Synthetic genetic array analysis has been applied to study network connectivity and thefunctional relation amongst genes of different metabolic pathways [Tong et al., 2001,2004, Szappanos et al., 2011]. The analysis of sick and synthetic lethal interactions, i.e.
LIPID METABOLISM
CoA Metabolism
NUCLEOTIDE METABOLISM
AMINO ACID METABOLISM
PYRUVATE METABOLISM
PENTOSE PHOS-PHATE PATHWAY
Folate Metabolism
ALTERNATIVE SUGAR
METABOLISM
Figure 3.11.: Synthetic lethal (black) and sick (grey) interactions between in silico non-essential genes of M. pneumoniae; genes are sorted according to theirmetabolic pathways and sized based on the number of synthetic lethal andsick interactions.
66
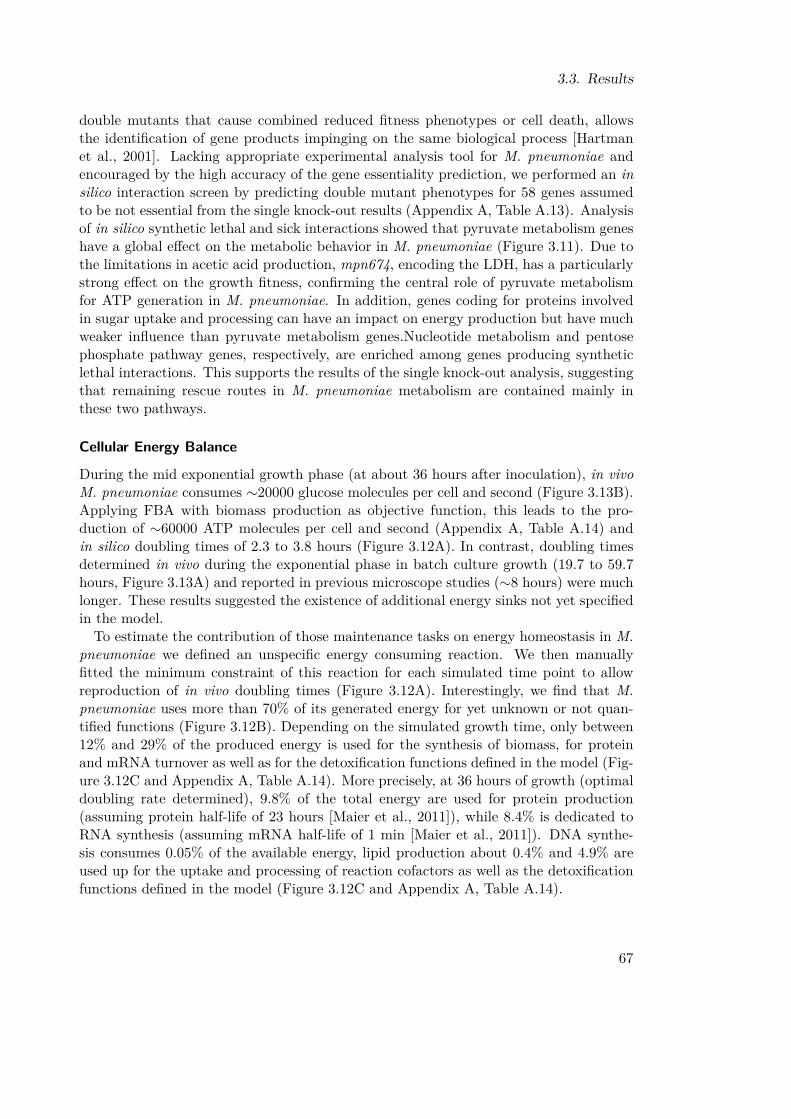
3.3. Results
double mutants that cause combined reduced fitness phenotypes or cell death, allowsthe identification of gene products impinging on the same biological process [Hartmanet al., 2001]. Lacking appropriate experimental analysis tool for M. pneumoniae andencouraged by the high accuracy of the gene essentiality prediction, we performed an insilico interaction screen by predicting double mutant phenotypes for 58 genes assumedto be not essential from the single knock-out results (Appendix A, Table A.13). Analysisof in silico synthetic lethal and sick interactions showed that pyruvate metabolism geneshave a global effect on the metabolic behavior in M. pneumoniae (Figure 3.11). Due tothe limitations in acetic acid production, mpn674, encoding the LDH, has a particularlystrong effect on the growth fitness, confirming the central role of pyruvate metabolismfor ATP generation in M. pneumoniae. In addition, genes coding for proteins involvedin sugar uptake and processing can have an impact on energy production but have muchweaker influence than pyruvate metabolism genes.Nucleotide metabolism and pentosephosphate pathway genes, respectively, are enriched among genes producing syntheticlethal interactions. This supports the results of the single knock-out analysis, suggestingthat remaining rescue routes in M. pneumoniae metabolism are contained mainly inthese two pathways.
Cellular Energy Balance
During the mid exponential growth phase (at about 36 hours after inoculation), in vivoM. pneumoniae consumes ∼20000 glucose molecules per cell and second (Figure 3.13B).Applying FBA with biomass production as objective function, this leads to the pro-duction of ∼60000 ATP molecules per cell and second (Appendix A, Table A.14) andin silico doubling times of 2.3 to 3.8 hours (Figure 3.12A). In contrast, doubling timesdetermined in vivo during the exponential phase in batch culture growth (19.7 to 59.7hours, Figure 3.13A) and reported in previous microscope studies (∼8 hours) were muchlonger. These results suggested the existence of additional energy sinks not yet specifiedin the model.To estimate the contribution of those maintenance tasks on energy homeostasis in M.
pneumoniae we defined an unspecific energy consuming reaction. We then manuallyfitted the minimum constraint of this reaction for each simulated time point to allowreproduction of in vivo doubling times (Figure 3.12A). Interestingly, we find that M.pneumoniae uses more than 70% of its generated energy for yet unknown or not quan-tified functions (Figure 3.12B). Depending on the simulated growth time, only between12% and 29% of the produced energy is used for the synthesis of biomass, for proteinand mRNA turnover as well as for the detoxification functions defined in the model (Fig-ure 3.12C and Appendix A, Table A.14). More precisely, at 36 hours of growth (optimaldoubling rate determined), 9.8% of the total energy are used for protein production(assuming protein half-life of 23 hours [Maier et al., 2011]), while 8.4% is dedicated toRNA synthesis (assuming mRNA half-life of 1 min [Maier et al., 2011]). DNA synthe-sis consumes 0.05% of the available energy, lipid production about 0.4% and 4.9% areused up for the uptake and processing of reaction cofactors as well as the detoxificationfunctions defined in the model (Figure 3.12C and Appendix A, Table A.14).
67

3. Metabolome Analysis and Characterization of M. pneumoniae Metabolism
To further characterize the additional energy sinks in M. pneumoniae, we first clas-sified them into GAM and NGAM tasks [Pirt, 1965, Varma and Palsson, 1994b]. To
!"
#!!!!"
$!!!!"
%!!!!"
&!!!!"
'!!!!"
(!!!!"
)!!!!"
*!!!!"
$&" %(" &*" (!"
!"#$%&
'()*+(),-*)((.,)*'/
01$
"2&)$'3$45'678$%8'+5,1$
+,-./00"12-3456-78" 470195,:93"./,7;97/759"5-0;0"
9$
!"
#!"
$!"
%!"
&!"
'!"
(!"
)!"
$!" $'" %!" %'" &!" &'" '!" ''" (!" ('"
:'+
;(2/4$<&)$%8'+
5,1$
"2&)$'3$45'678$%8'+5,1$
,7"<,<-"341=,5/6-7"6.9",7">-420" ,7"0,=,5-"341=,5/6-7"6.9"
!$
?@"A;"./,7;97/759"9792BC"
!" #!!!!" $!!!!" %!!!!" &!!!!" '!!!!" (!!!!" )!!!!" *!!!!"
$&"
%("
&*"
(!"
!"#$%&'()*+(),-*)((.,)*'/01$
"2&)$'3$45'678$%8
'+5,1$
DEF"4093"G-2"HID"12-3456-7"
DEF"4093"G-2"12-;9,7"12-3456-7"
DEF"4093"G-2"-;>92"39:793"9J197090"
DEF"4093"G-2"12-;9,7"39B2/3/6-7"
DEF"4093"G-2"=,1,3"12-3456-7"
DEF"4093"G-2"KID"12-3456-7"
DEF"4093"./JL"G-2"12-;9,7"G-=3,7B"
DEF"4093"./JL"G-2"KID"39B2/3/6-7"M"291/,2"
DEF"4093"./J"G-2"1-0;N;2/70=/6-7/=".-3,:5/6-70"
DEF"4093"+C"DEF/09"O#%!210P"
=$
Figure 3.12.: Analysis of energetic expenditures at different times of a four days batchculture growth: A: Comparison of in vivo (white circles) and in silico (blackcircles) doubling times leading to the definition of the maintenance energy; B:Energetic expenditures used for biomass and functions specifically defined inthe model (red) and for maintenance tasks (blue); C: ATP usage per cell andsecond for the different functions of a M. pneumoniae cell, f.l.t.r. synthesisof RNA, protein production, other specified functions, protein degradation,lipid production, synthesis of DNA, chaperone catalyzed protein folding,DNA maintenance, ATPase function. Red vertical bars indicate the totalnumber of ATP molecules produced at each time point.
estimate the contribution of GAM to the total energy costs, we calculated upper bound-aries for the ATP consumption by DNA repair (0.01%), post-translational modifications(0.03%), and chaperone-assisted protein folding (0.25%) based on available experimentaldata and literature (Appendix A, Table A.14) [van Noort et al., 2012, Drake et al., 1998,Naylor and Hartl, 2001, Maier et al., 2011].DNA Maintenance Costs: DNA-based microbes have mutation rates <0.005 pergenome per duplication [Drake et al., 1998]. In order to calculate the upper boundaryfor DNA maintenance costs we assumed a mutation rate of 0.05 for the M. pneumoniaegenome and find that DNA maintenance can account for a maximum of about 0.01% ofthe total generated energy.Post-translational Modification Costs: 93 phosphorylation sites and 720 acetylation
68

3.3. Results
sites on 72 and 221 proteins, respectively, have been detected in M. pneumoniae in vivo[van Noort et al., 2012]. Integrating this information with the abundances of the respec-tive proteins [Maier et al., 2011], we calculated the upper boundary for post-translationalmodifications.On one hand, we assumed that all phosphorylation and acetylation siteson all found proteins are modified once. This accounts for 0.01% of the total ATP ex-penses. Adding another 0.02% of the total ATP consumed at each time point in orderto account for cyclic phosphorylation-dephosphorylation events [Shacter et al., 1984], wefind that post-translational modifications account for 0.03% of the total energy. For lackof information about de-acetylation we did not consider it in further detail.Chaperone-catalyzed Protein Folding Costs: We integrated the abundances de-termined for the two M. pneumoniae chaperones (GroEL, a 14mer, and DnaK) [Maieret al., 2011] with catalytic rates described for E. coli (GroEL: 20 sec & usage of 7 ATPper folding cycle, DnaK: 15 sec & usage of 1 ATP per folding cycle) [Naylor and Hartl,2001]. Assuming constant activity of all chaperones we calculated the upper boundaryfor the ATP consumption for protein folding. Considering in addition protein turnovercosts (1.1%) and the other expenses defined in the model total expenses on GAM ac-count for a maximum of 6.9% of the total cellular energy.
Systematic literature screening identified proton translocation by the cellular ATPaseas most significant quantifiable NGAM task [Kobayashi, 1985]. The ATPase is mainlyinvolved in maintaining an optimal proton gradient across the cellular membrane to al-low nutrient import. Towards later growth stages, when the acidification of the growthmedium results in pH stress for the cells, the intracellular pH maintenance additionallychallenges ATPase function [Kobayashi, 1985, Moreno et al., 1998]. We determined theamount of ATPases per M. pneumoniae cell based on the abundance of the β-subunit(MPN598) of which three copies are contained in the ATPase core [Maier et al., 2011]. In-tegrating mechanistic information on the ATP hydrolysis rate of the ATPase [Watanabeet al., 2008] with in vivo measurement data on ATPase rotation speed [Watanabe et al.,2008, Wu et al., 2010] and abundances of ATPase components (99 - 150 complexes/cell,[Maier et al., 2011]), we estimated the energy consumption of the M. pneumoniae AT-Pase. Assuming constant ATPase activity at maximum speed (130 rps), the ATPaseuses a maximum of 38610 ATP per cell and second at 36 hours after inoculation insilico, accounting for about 57% of the total cellular energy, and an even higher fractionat later growth stages (Appendix A, Table A.14).Summing up, we combined our metabolic model and experimental results to quan-
titatively analyze the global energy balance of M. pneumoniae. We can explain theconsumption of 75% - 100% of the total energy produced, by considering all quantifiableATP consuming processes (Figure 3.12C). Biomass production accounts for about 11 -22%, GAM for about 2-7%, and NGAM for 57 - 80% of the total ATP generated duringthe exponential growth phase in silico. It is important to note that M. pneumoniaeduring the exponential growth phase of a batch culture experiment uses about 78% -89% of the total generated energy not for the production of cell building blocks butintracellular homeostasis.The definition of the maintenance energy sink and the subsequent determination of its
69

3. Metabolome Analysis and Characterization of M. pneumoniae Metabolism
constraint for different growth times, completed the construction and refinement of ourmetabolic model for M. pneumoniae, iJW145. The final model is composed of 306 reac-tions connecting 216 metabolites and 145 catalyzing enzymes (Appendix A, Figure A.1and Table A.1; http://mycoplasma.crg.es/pathways.php). It is able to reproduce exper-imentally determined doubling times as well as external metabolite measurements andto predict metabolic flux distributions for different selected time points during batchculture growth.
Analysis of Metabolic Flux Changes In Silico
For dynamic simulations, models based on ordinary differential equations (ODEs) areusually employed. However, these models have limited applicability for large-scale anal-ysis mainly caused by overfitting, i.e. the failure to determine biologically useful param-eter sets due to insufficient quantitative experimental data [Draper and Smith, 1998]. Toovercome the limitations of the static modeling approach used and to gain informationabout the changes in metabolic flux distributions during the exponential growth phase,we designed an approach for quasi-dynamic simulations of a constraint-based model.To this end, we fitted a logarithmic function (Equation 3.3) to the determined main-tenance costs in addition to the fitting of sigmoidal functions (Equations 3.1 & 3.2) tothe concentration data for glucose, acetic acid, lactic acid, and protein (Figure 3.13 andAppendix A, Table A.8). Although these functions do not allow the extraction of kineticparameters, they enabled us to calculate constraint sets for any given time point of theexponential growth phase, thereby also accounting for the experimental error.Simulating growth with respectively determined constraint sets allows to predict meta-
bolic flux distributions for different times of the exponential growth phase, thus provid-ing information about changes in metabolic behavior during batch culture growth (Fig-ure 3.14A and Appendix A, Table A.15). Analyzing the qualitative flux change betweenin silico flux distributions for 24, 36, 48, and 60 hours, we found that about 51.6% of allreactions show the same qualitative flux changes as biomass synthesis, i.e. the flux in-creases from 24 hour to 36 hours and decreases from 36 hours to 48 hours as well as from48 hours to 60 hours (Figure 3.14B). Another 2.6% of the reactions show flux changescontrary to biomass synthesis, i.e. first increase (24 - 36 hours) and then decrease (36 -48 - 60 hours). For 11.4% of the metabolic reactions the flux constantly increases duringthe exponential growth time while for 5.9% the flux constantly decreases. 1.6% shownow flux change during the exponential growth phase (minimum constraint reactions),0.7% show diverse changes, and 26.1% are not used under the simulated rich mediumconditions.Only in four pathways (for the assignment see Appendix A, Table A.1), namely in
glycolysis, pyruvate metabolism, energy metabolism, and biomass production, all reac-tions are active under rich medium conditions in silico (Figure 3.14C). Interestingly,in amino acid metabolism, nucleotide metabolism, and pentose phosphate pathway be-tween 25% and 35% of the reactions are not active. Lipid metabolism also contains 30%non-active reactions, which despite being considered a direct effect of the assumptions forthe biomass composition, is in agreement with detected proteins [Maier et al., 2011] and
70

3.3. Results
0
0.01
0.02
0.03
0.04
0.05
0.06
0.07
0 50 100 150 200
Concen
tra)
on (m
g/ml)
Time (hours)
in vitro protein fi4ed protein
A
0
10
20
30
40
50
60
70
0 50 100 150 200
Concen
tra)
on (m
M)
Time (hours)
average glucose fi4ed glucose
B
0 2 4 6 8 10 12 14 16 18
0 50 100 150 200
Concen
tra)
on (m
M)
Time (hours)
in vitro acetate fi4ed acetate
D
0
20
40
60
80
100
120
0 50 100 150 200
Concen
tra)
on (m
M)
Time (hours)
in vitro lactate fi4ed lactate
C
0
2
4
6
8
10
12
14
16
18
0 50 100 150 200
lac:ace ra)o
Mid interval )me (hours)
E
30000
35000
40000
45000
50000
55000
60000
65000
70000
20 30 40 50 60 70
ATP (m
olecules/cell.secon
d)
Time of growth (hours)
F
Figure 3.13.: Comparison of in vivo measurements of external metabolites and proteinquantities with the nonlinearly fitted curves used to determine constraintsto simulate different time points of growth in silico: A: protein, only theexponential growth phase (24-60 hours) for which iJW145 is defined haswhite background. B: glucose. C: lactic acid. D: acetic acid. E: lactate toacetate ratio (based on fittings). F: in silico maintenance costs.
71

3. Metabolome Analysis and Characterization of M. pneumoniae Metabolism
!"#$%&'
(#)"&'
((#(*&'
"#!(&'
+(#,(&'
!#"(&'*#,,&'!"
*'
!*'
$*'
"*'
-*'
(**'
(!*'
./012'3405'
/6738290:/'
;02/3::'
<=25>4?21'
@2.'
/6738290:/'
@2A3472='
/6738290:/'
B16=CD'
/6738290:/'
E9D429D:0:'' F0<05'
/6738290:/'
G>4962?56'
/6738290:/'
H16'43=821'
<229'8D'A29376'
I6172:6'
<J2:<J376'
<37JK3D'
I=27601'
/6738290:/'
ID=>L376'
/6738290:/'
:01MN:2>=46' .976=13?L6'
:>C3='
/6738290:/'
#$%&'()
*+,%-./%0"12
3"
,%-./%0"
16L6='>:65' 12'4J31C6' ><O><O><' 52K1O52K1O52K1' ><O52K1O52K1' 52K1O><O><' 27J6='4J31C6:'
4"
A
Figure 3.14.: A: qualitative flux changes between simulated time points (t = 24, 36, 48, 60hours). B: Reaction classification according to their qualitative flux changesalong the exponential growth phase. C: As in B, but distinguished for thedifferent pathways.
metabolites (see section 3.3.2). Based on the simulated conditions, reactions involved inthe processing of alternative sugars are not active. The constantly changing reactions,either belonging to glycolysis, to pyruvate metabolism, the energy producing argininefermentation (amino acid metabolism) or being associated cofactor transport reactions(Figure 3.14C), comprise all catabolic reactions of M. pneumoniae. Their behavior canbe attributed to the increase in maintenance costs during batch culture growth andthe adaptation of the catabolic pathways as well as to the imposed acetate produc-tion constraints. The two reactions showing diverse changes belong to the nucleotidemetabolism and a detailed analysis revealed that apparently the two routes producingdeoxy-CDP and deoxy-GDP, respectively, are energetically equal and therefore can beused interchangeably.We conclude, that the capability of M. pneumoniae to adapt to environmental stress
observed in vivo [Güell et al., 2009] is probably mainly owed to those pathways stillpreserving unused metabolic routes, i.e. nucleotide metabolism and pentose phosphatepathway. In general, the high activity of metabolic reactions in M. pneumoniae reflectsthe reduced genome and the parasitic life, as the simple linear network structure is fine-tuned to take up as many cell building blocks and cofactors from the environment aspossible.The description and analysis of a cellular subsystem in isolation holds the risk to miss
important regulatory influences from other subsystems of the cell. To gain insight intothe relation between protein abundances and metabolic activity we integrated experi-
72

3.3. Results
mentally determined protein quantification data [Maier et al., 2011] with in silico fluxpredictions for different time points of batch culture growth (Appendix A, Figure A.8).We aligned the qualitative trends of flux and protein abundance changes during the ex-ponential growth phase as described in Material and Methods, section 3.2.1, finding thatthey match in about 86% of the cases (Appendix A, Figure A.8A). These findings arein agreement with a recent study analyzing the dynamic adaptation of B. subtilis to nu-tritional shifts [Nicolas et al., 2012]. Pyruvate metabolism (83.3% hit enzymes), aminoacid metabolism (75% hits), nucleotide metabolism (76.5% hits), and folate metabolism(50% hits) are the only pathways for which not all enzyme abundance changes match thechanges in fluxes of respectively catalyzed reactions (Appendix A, Figure A.8B), whentaking into account the experimental error reported for protein quantification [Maieret al., 2011]. The integration of information about post-translational modifications [vanNoort et al., 2012] did not lead to further conclusions about the influence of proteinconcentrations on metabolic regulation. No significant enrichment of modified proteinsamong the proteins showing abundance changes contradicting the predicted flux changescompared to the modified fraction of hit enzymes could be determined.
Analysis of the Central Carbon Metabolism In Vivo
To further analyze the central carbon metabolism, we measured cellular concentrations ofkey metabolites in sugar processing pathways. We found considerably small intracellularpools of glycolysis intermediates, ranging from 994 molecules per cell (0.03 mM) forGAP to 33400 molecules per cell (1.1 mM) for FBP (Figure 3.15A). Considering thenonlinear fitting to in vivo measurements of extracellular glucose, we determined thatthe glucose uptake rate during the exponential growth phase ranges from 8,000 to 35,000molecules∗cell−1∗second−1 (Figure 3.13 and Appendix A, Figure A.2).To experimentally confirm the suggested fast turnover of intracellular pools of gly-
colytic intermediates, we accomplished 13C-glucose tracer experiments. To this end,M. pneumoniae cell were pulse-fed with heavy isotope labeled glucose (13C6H12O6) andmonitored the propagation of the labeled carbon atoms through glycolysis by GC-MS.Already 15 seconds after the supply of labeled glucose, the earliest time point for re-producible measurements, we found the intracellular pools of all detectable glycolyticintermediates labeled to high excess (Figure 3.15). Time-dependent incorporation ofcarbon 13 is well described by the curves shapes of one-phase exponential decay func-tions fitted to the fraction of labeled compound in percentage of the total intracellularpool of the respective compound (Appendix A, Figure A.7; R2 values can be found inAppendix A, Table A.16).The experimentally determined metabolic network [Yus et al., 2009] and the analysis
of branching metabolites (see section 3.3.1) suggested an unusually low inter-pathwayconnectivity for M. pneumoniae. Analyzing the incorporation of labeled glucose intoreporter compounds for lipid metabolism (G1P and G3P) and the pentose phosphatepathway (R5P), we explored the connectivity of glycolysis to other metabolic pathwaysin vivo (Figure 3.15B).The conversion of G6P into G1P, a precursor for glycolipid synthesis, constitutes the
73

3. Metabolome Analysis and Characterization of M. pneumoniae Metabolism
0.01
0.1
1
10
Glucose-‐6-‐phosphate
Fructose-‐6-‐phosphate
Fructose-‐1-‐6-‐bisphosphate
Glyceraledhyde-‐3-‐phopsphate
Dihydroxyacetonephosphate
Phosphoenol pyruvate
Cellular concentra?
on (m
M)
A
0.001
0.01
0.1
1
10
Glycerol-‐3-‐phosphate
Glucose-‐1-‐phosphate
Ribose-‐5-‐phosphate
Aspartate
Cellular concentra?
on (m
M)
B
GC
-MS
mea
sure
d io
n ra
tios
of 13
C/12
C
Incubation time with 13C-glucose
0
20
40
60
80
100
0 50 100 150 200 250 300 350 400 450
0 15" 75" 5' 15' 1h
Fru1,6P2
0
20
40
60
80
100
0
50
100
150
200
250
300
0 15" 75" 5' 15' 1h
DHAP
0
20
40
60
80
100
0
100
200
300
400
500
600
0 15" 75" 5' 15' 1h 24h 48h 72h 96 h
Glycerol-‐3-‐phosphate
0
20
40
60
80
100
0
100
200
300
400
500
600
700
800
0 15" 75" 5' 15' 1h 24h 48h 72h 96 h
Glucose-‐1-‐phosphate
0
20
40
60
80
100
0
50
100
150
200
250
300
0 15" 75" 5' 15' 1h 24h 48h 72h 96 h
Ribose-‐5-‐phosphate
0
20
40
60
80
100
0
1
2
3
4
5
0 15" 75" 5' 15' 1h 24h 48h 72h 96 h
Aspartate
Incubation time with 13C-glucose
%13
C m
etab
olite
%13
C m
etab
olite
GC
-MS
mea
sure
d io
n ra
tios
of 13
C/12
C
%13
C m
etab
olite
%
13C
met
abol
ite
%13
C m
etab
olite
%13
C m
etab
olite
GC
-MS
mea
sure
d io
n ra
tios
of 13
C/
12C
0
20
40
60
80
100
0
100
200
300
400
500
600
700
800
0 15" 75" 5' 15' 1h
Fru6P
0
20
40
60
80
100
0
200
400
600
800
1000
0 15" 75" 5' 15' 1h
Glc6P
%13
C m
etab
olite
GC
-MS
mea
sure
d io
n ra
tios
of 13
C/12
C
%13
C m
etab
olite
Figure 3.15.: Central carbon metabolism and flux analysis. A: Quantification of glycolyticintermediates and their turnover; light grey bars: 13C/12C ratios, black lines:% of labeled metabolite. B: Quantification and flux data for key metabolitesin pathways branching off glycolysis.
74

3.3. Results
first outgoing branch from glycolysis. As for glycolytic intermediates the saturationcurve for G1P labeling follows a one-phase exponential function (Equation 3.4 and Ap-pendix A, Figure A.7 and Table A.16), reflecting a fast and constant pool turnover. Onfirst sight this contradict model simulations, which predict only very slow incorporationof carbon from G1P into lipids when compared to glycolysis speed (see section 3.3.7and Appendix A, Table A.15). However, the phosphoglucomutase (MPN066) reversiblyconverts G1P and G6P, and this process is assumed to be close to equilibrium. In thesecond branch connecting glycolysis to lipid metabolism, DHAP is converted into G3P,which provides the polar head group for phospho- and glycolipids to which fatty acids arecovalently attached (Appendix A, Figure A.1). In contrast to glycolytic intermediates,G3P is highly abundant (5∗105 molecules/cell, 16.7 mM) and conversion of DHAP intoG3P found to be comparatively slow, reaching saturation not seconds but hours afterincubation with 13C-labeled glucose (Figure 3.15B). Accordingly, the saturation curvefor G3P labeling, in contrast to G1P and glycolytic intermediate saturation curves, fol-lows a two-phase exponential shape (Equation 3.5 and Appendix A, Figure A.7 andTable A.17).Before the carbon enters lower glycolysis, it is possibly fed into the pentose phosphate
pathway by transketolase (MPN082) and transaldolase (unknown MPN) catalyzed re-actions (Appendix A, Figure A.1). R5P, a key intermediate of the pentose phosphatepathway, has a intracellular pool of about 1500 molecules per cell (Figure 3.15B). Asfor G3P, the incorporation of heavy labeled carbon into R5P is minimal compared tothe conversion rates in glycolysis and the saturation curve is best fitted by a two-phaseexponential decay function (Equation 3.5 and Appendix A, Figure A.7 and Table A.17).In addition, the synthesis of aspartic acid via oxaloacetate from pyruvate or malate hasbeen suggested for M. pneumoniae [Manolukas et al., 1988]. Nevertheless, we could notobserve any incorporation of labeled carbon into aspartic acid during four days of batchculture growth (Figure 3.15B). In agreement, none of the enzymes proposed to catalyzesuch conversion has been detected [Maier et al., 2011]. Thus, a link between centralcarbon metabolism and amino acid metabolism can be discarded for M. pneumoniae,confirming the metabolic network structure.Integrating quantitative in silico fluxes with in vivo data on metabolite and enzyme
abundances as well as on qualitative carbon flux, provides a comprehensive picture ofmetabolic activity in M. pneumoniae (Figure 3.16). Confirming the massive carbon fluxshuttled through glycolysis observed in silico and in vivo, the glycolytic and pyruvatemetabolism proteins belong to the most abundant enzymes encountered in M. pneu-moniae ranging from hundreds to thousands of copies per cell [Maier et al., 2011].Theglycolytic intermediates have been covered to high extent, missing only a few presum-ably transient intermediates. The in part contrary directions of in vivo and in silicofluxes connecting glycolysis and other metabolic pathways can be explained by the lowabundances determined for the up-take systems of ribose, glycerol, and G3P in vivo.In the model, to qualitatively represent experimental findings on glycerol essentialityand the composition of the rich medium for M. pneumoniae [Chanock et al., 1962a, Yuset al., 2009], their sources have not been limited to zero as for the other alternativesugar sources. However, due to lacking quantitative information on their uptake by M.
75
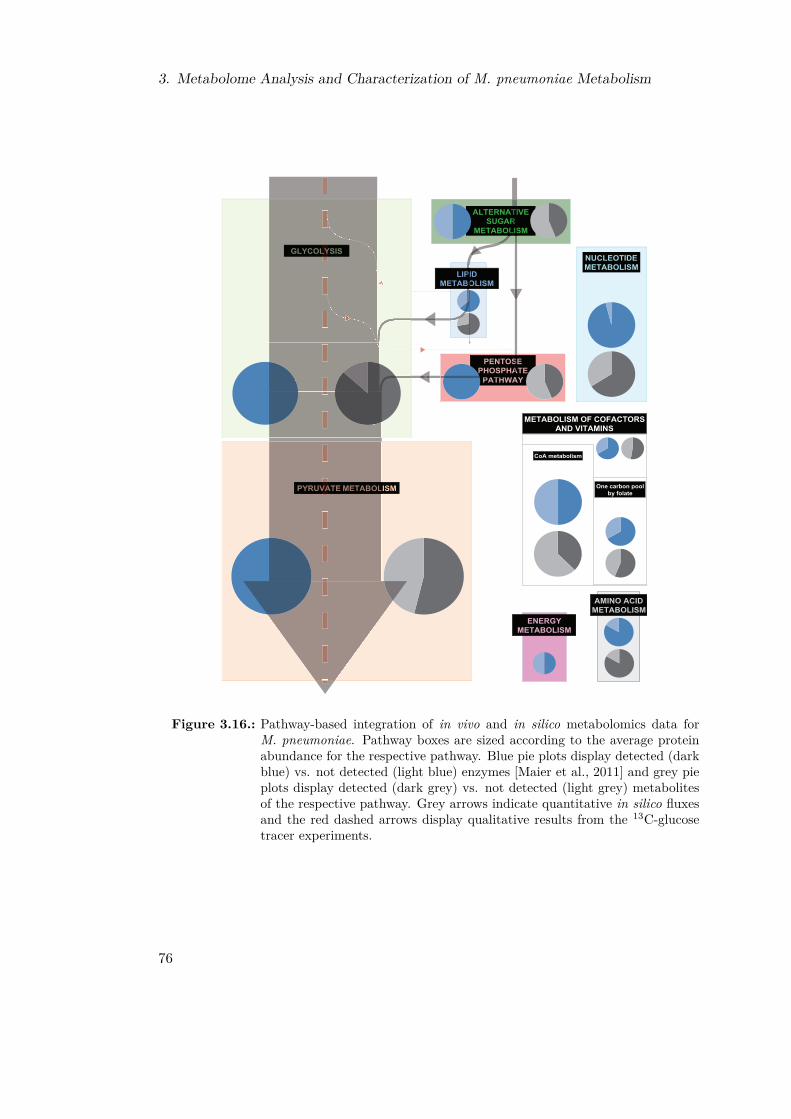
3. Metabolome Analysis and Characterization of M. pneumoniae Metabolism
Figure 3.16.: Pathway-based integration of in vivo and in silico metabolomics data forM. pneumoniae. Pathway boxes are sized according to the average proteinabundance for the respective pathway. Blue pie plots display detected (darkblue) vs. not detected (light blue) enzymes [Maier et al., 2011] and grey pieplots display detected (dark grey) vs. not detected (light grey) metabolitesof the respective pathway. Grey arrows indicate quantitative in silico fluxesand the red dashed arrows display qualitative results from the 13C-glucosetracer experiments.
76

3.4. Discussion
pneumoniae, their usage is probably overestimated in silico and the model will have tobe adjusted upon availability of new experimental evidence.
Determination of In Vivo Catalytic Rates in Glycolysis
Confirming the massive carbon flux shuttled through glycolysis in silico and in vivo,the enzymes involved in glycolysis and pyruvate metabolism belong to the most abun-dant enzymes encountered in M. pneumoniae ranging from hundreds to thousands ofcopies per cell [Maier et al., 2011]. Connecting this information to abundances of gly-colytic intermediates and to the glycolytic speed determined in silico based on in vivouptake rates for glucose, provides an overview about glycolytic activity (Figure 3.17A).Assuming that for reactions with large substrate pools, the effective reaction speed (veff )approaches the maximum velocity (Vmax), we calculated in vivo catalytic rates for se-lected glycolytic enzymes (Figure 3.17B) by transforming Equation 1.10 accordingly:
kcat(E) = veff
[E] (3.6)
with [E ] being the abundance of enzyme E in molecules per cell.The determined kcat values varied during batch culture growth for all enzymes, usu-
ally peaking at 72 hours of growth (Figure 3.17B), coinciding with the maximal glucoseconsumption rate determined (section 3.3.5, Figure 3.13). It is important to note that invivo kcat values represent apparent turnover numbers and do not represent maximal reac-tion rates.Phosphofructokinase had the highest kcat after 48 hours of growth (293∗s−1).Turnover numbers for several glycolytic enzymes could not be determined, either whenenzyme abundances far exceeded substrate pools (e.g. for GAPDH, M006) or when sub-strate metabolites could not be quantified (e.g. for enolase (ENO), M009). Apart frommetabolite and enzyme abundances, several additional factors, amongst them allostericand direct regulation of enzyme activity (regulatory feedbacks) or enzyme affinities andcompetition for common substrates, have an impact on the effective reaction rates. Togain further insight into those regulatory mechanisms for glycolysis in M. pneumoniae,the construction of a dynamic model based on quantitative data and time series fol-lowing perturbations, ideally on the sub-second time scale, is indispensable. Currently,technical limitations in sample preparations prevent such analyses for M. pneumoniaeor similar organisms, being 15 seconds the minimum time required to prepare metabolicsamples for M. pneumoniae.
3.4. DiscussionI present in this chapter a comprehensive systems biology study of the metabolism ofM. pneumoniae in silico and in vivo. To this end, we designed a predictive genome-scale metabolic model, iJW145 (comprising 306 reactions that connect 216 metabolites),and experimentally assessed the metabolic space. By integrating model predictions withexperimental data obtained in in vivo and literature information, we were able to explorethe metabolic network of an organism in unprecedented detail. We curated the wiring
77
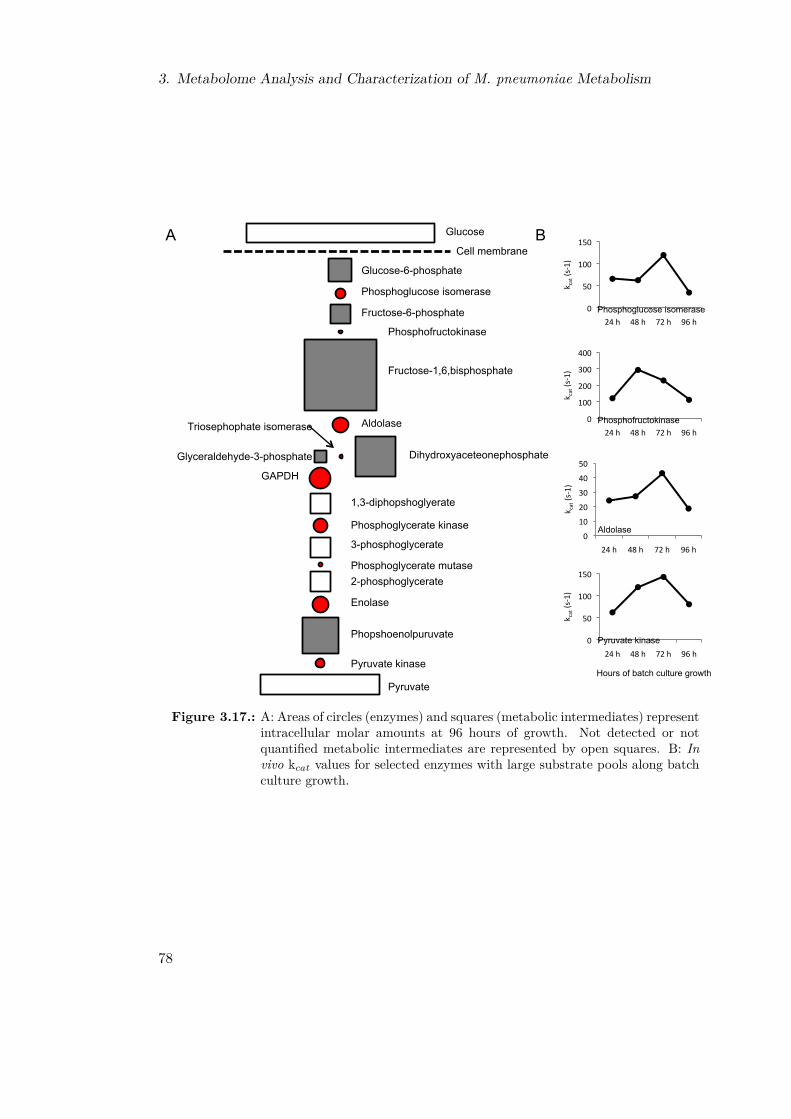
3. Metabolome Analysis and Characterization of M. pneumoniae Metabolism
Glucose
Cell membrane
Glucose-6-phosphate
Phosphoglucose isomerase
Fructose-6-phosphate
Phosphofructokinase
Fructose-1,6,bisphosphate
Aldolase
Dihydroxyaceteonephosphate
Triosephophate isomerase
Glyceraldehyde-3-phosphate
GAPDH
1,3-diphopshoglyerate
Phosphoglycerate kinase
3-phosphoglycerate
Phosphoglycerate mutase 2-phosphoglycerate
Enolase
Phopshoenolpuruvate
Pyruvate kinase
Pyruvate
0
50
100
150
24 h 48 h 72 h 96 h
k cat (s-‐1)
0
100
200
300
400
24 h 48 h 72 h 96 h
k cat (s-‐1)
0
10
20
30
40
50
24 h 48 h 72 h 96 h
k cat (s-‐1)
0
50
100
150
24 h 48 h 72 h 96 h
k cat (s-‐1)
Phosphoglucose isomerase
Phosphofructokinase
Aldolase
Pyruvate kinase
Hours of batch culture growth
A B
Figure 3.17.: A: Areas of circles (enzymes) and squares (metabolic intermediates) representintracellular molar amounts at 96 hours of growth. Not detected or notquantified metabolic intermediates are represented by open squares. B: Invivo kcat values for selected enzymes with large substrate pools along batchculture growth.
78

3.4. Discussion
diagram of the metabolic network and the related functional annotations of metabolic keyenzymes. Further, we identified and quantified M. pneumoniae metabolites, achievingextraordinary high coverage of the in silico predicted metabolome. Integrating additionalliterature data, we semi-quantitatively determined the biomass composition of an averageM. pneumoniae cell, thus allowing in silico growth simulations. This curated networkwas validated by predicting growth capabilities on alternative carbon sources and geneessentiality based on an in silico knock-out study with remarkably high accuracy andspecificity. Using the validated model, we theoretically analyzed the energy balancing ofM. pneumoniae grown in batch culture, finding that M. pneumoniae dedicates most ofits energy to cellular homeostasis. To analyze changes in the metabolic behavior duringthe exponential growth phase, we fitted equations to external metabolite measurementsand in silico predicted maintenance costs. In vivo, we monitored the central carbonflux by heavy isotope labeled glucose tracer experiments. Finally, based on protein andmetabolite quantification data as well as information on the overall speed of glycolysisin silico, we calculated in vivo catalytic rates for glycolytic key enzymes.Metabolic reconstructions have been generated during the past years for various organ-
isms, ranging from prokaryotes, the most prominent being E. coli, to different humantissues [Edwards and Palsson, 2000, Duarte et al., 2007, Gille et al., 2010, Rolfssonet al., 2011] (for a list of validated models see Feist et al. [2009], supplementary table 2).The original reconstruction for E. coli [Edwards and Palsson, 2000] has been constantlyimproved integrating new experimental data, for example mRNA expression data orthermodynamic information on reaction reversibilities [Covert et al., 2001, Shlomi et al.,2007, Feist et al., 2007, Fleming et al., 2009, Lewis et al., 2012]. The only mycoplasmafor which a metabolic reconstruction was available so far, is M. genitalium [Sutherset al., 2009]. However, this reconstruction has been generated automatically from theannotated genome and such automated network generations have been shown to be er-ror prone due to the one-dimensional annotation they are based on [Reed et al., 2006,Henry et al., 2010]. Taking advantage of the small size of M. pneumoniae and the largeamount of available genome-scale data sets, we directly integrated different experimentaldata during the metabolic reconstruction process. This allowed us to not only obtainan accurate description of the metabolic network of M. pneumoniae but even to cor-rect the network annotation and, subsequently, the functional annotation of related keymetabolic enzymes.Applying a cross-platform approach to analyze the metabolite space of M. pneumo-
niae, we were able to identify the majority of the in silico predicted metabolites and toquantify metabolic key components, such as nucleobases, amino acids, fatty acids, andglycolytic intermediates. Integrating determined pool sizes of free cytoplasmic metabo-lites with their corresponding bound forms and the respective abundances from thegrowth medium, permitted insight into regulatory mechanisms for the homeostasis ofcellular building blocks. One of the most interesting findings of this analysis is probablythe discovery that, as already observed for proteins [Maier et al., 2011], the relativeabundances of metabolites of a certain pathway or functional group correlate moder-ately between different organisms [Papagianni et al., 2007, Bennett et al., 2009]. Weconclude that different growth environments and the differences in network size and
79

3. Metabolome Analysis and Characterization of M. pneumoniae Metabolism
used metabolic routes do influence on absolute metabolite concentrations but not on therelative ratios, suggesting that metabolism is regulated on the pathway-level rather thanon the level of individual reactions. Regulating pathways as functional units presumablygreatly simplifies metabolic adjustments. This is in agreement with recent studies onthe evolution of flux distributions in bacteria showing that metabolic networks evolvedbalancing the maximization of biomass and energy production and the minimization ofchanges required to adapt to environmental changes Schuetz et al. [2012].We semi-quantitatively determined the biomass composition of an average M. pneu-
moniae cell based on the quantitative metabolite data and literature information [Razinet al., 1963, Razin, 1978, Pollack et al., 1970, Rottem, 1980, Yus et al., 2009, Maier et al.,2011]. This quantitative definition of the M. pneumoniae cell composition provides thebasis for in silico growth simulations for this model organism and possibly other closelyrelated wall-less bacteria. The further integration of doubling times monitored duringthe exponential growth phase of M. pneumoniae grown in batch culture enabled us toquantitatively dissect the energy metabolism in silico. Most strikingly, we found thatM. pneumoniae, at least under laboratory conditions, dedicates only a small part of itsgenerated energy to the production of cellular building blocks. Instead, the quantifica-tion of alternative energy consuming processes identified the ATPase to be the majorenergy sink, using up 57-88% of the total produced ATP to maintain a favorable protongradient across the membrane and a constant intracellular pH. This surprising findingcan be explained by different factors. On the one hand, due to the small size of M. pneu-moniae, membrane leaking and transport processes across the membrane have a higherimpact on the cytoplasmic conditions (M. pneumoniae has a surface to volume ratio2500 times higher than E. coli; Appendix A, section A.2 and Table A.18). On the otherhand, the acidification of the growth medium through the continuous secretion of organicacids further complicate intracellular pH maintenance of M. pneumoniae when grownin batch culture. We verified this hypothesis experimentally and found that artificiallyre-buffering the pH of the growth medium back to pH7.7, grants metabolic activity untilcomplete depletion of glucose from the growth medium and growth of M. pneumoniaecolonies beyond 96 hours, when under normal batch culture growth conditions a growtharrest is observed (Appendix A, Figure A.9).In contrast to the extraordinary high costs caused by the ATPase, the costs for
chaperone-assisted protein folding and maintenance are unexpectedly low, especiallytaking into account their high abundance (chaperones comprise 10% of the total quanti-fied proteome [Maier et al., 2011]). The energy used for GAM amounts to 2-6.9% of thetotal produced energy and to 2.5-10% of the NGAM costs. Contrarily, in E. coli, GAMcosts were far exceeding NGAM expenses (∼2.5fold to ∼7fold) [Feist et al., 2007, Varmaand Palsson, 1994a]. However, when artificially increasing E. coli doubling times to20 hours, approximating the values observed for M. pneumoniae, GAM costs per timedecrease amounting to only 8.5% of the NGAM costs and, thus, matching the valuesdetermined for M. pneumoniae. In summary, we could explain 75-100% of the energydemand of M. pneumoniae during the exponential phase of a four days batch culturegrowth experiment. The only known energy consuming processes not estimated by thepresented analysis, are movement and attachment. Surface gliding has been shown to
80

3.4. Discussion
be an energy consuming process in M. mobile [Jaffe et al., 2004] but details on the exactATP consumption are lacking. Furthermore, the missing expenses could be accredited toi) the assumed mRNA and protein turnover rates (we used average values [Maier et al.,2011]), ii) experimental errors in absolute protein quantifications for single proteins (atwofold error has been reported [Maier et al., 2011]), and iii) the estimation of doublingtimes (protein quantities up to 36 hours after inoculation are below the detection limitand, thus, supposed to have a higher error: Appendix A, Figure A.2A).Most bacteria follow a single objective function, the maximization of growth and
progeny, in metabolic models mainly accomplished for by the production of biomass[Neidhardt, 1996, Buescher et al., 2012]. Recent studies revealed, that metabolic fluxstates in addition evolved to minimize the adjustment costs upon environmental changes[Schuetz et al., 2012]. Integrating our metabolic model with the accomplished energycalculations allowed the quantitative balancing of the energy metabolism in M. pneu-moniae. The comparative analysis of energy expenses in M. pneumoniae and E. colirevealed fundamental differences, suggesting characteristic energy expense profiles fordifferent bacteria. Three parameters have been identified to govern the composition ofthose energy profiles, namely the network topology, the cell size, the growth rate, andthe environmental conditions. We conclude that the large fraction of energy dedicated tocellular homeostasis and the associated slow growth of M. pneumoniae in batch culturereflect the adaptation to the growth on human lung epithelial cells, a largely unchangingenvironment.Gene essentiality has been predicted for other organisms, such as E. coli, based on in
silico knock-out studies [Reed and Palsson, 2003, Feist et al., 2007]. We reach slightlyhigher accuracy and specificity with our prediction for M. pneumoniae than has beenachieved for E. coli so far [Feist et al., 2007], thus proving the high accuracy of themetabolic reconstruction and the predictive capacity of the model. In consistency withthe fact that M. pneumoniae has an exceptionally high fraction of essential metabolicgenes (56.6% vs. 19% in E. coli [Baba et al., 2006, Joyce et al., 2006]), we found thatrescue routes to buffer for loss of function causing gene deletions are only preservedin the nucleotide metabolism and the pentose phosphate pathway. In agreement withthe results from the energetic analysis, this finding suggests that the reductive genomeevolution process of M. pneumoniae eliminated most metabolic rescue pathways, whileadapting to a parasitic life in the human lung.Synthetic genetic array analysis has been used to automate the isolation and analysis
of double mutants in vivo [Tong et al., 2001, 2004]. Predicting double mutant phenotypesin silico, allowed to unravel the combinatory effects caused by different gene deletionson the metabolic behavior and to further analyze the remaining adaptive capabilities ofM. pneumoniae, confirming the single knock-out results. The applied in silico analysisprovides an auspicious alternative to experimental approaches, especially for the analysisof organisms lacking appropriate in vivo analysis tools.Since static modeling approaches, such as constraint-based modeling, by definition
cannot provide information about network dynamics, models based on ODEs are usuallyemployed for time-dependent simulations [Klipp et al., 2005]. However, dynamic modelshave limited applicability for large-scale networks, mainly due to overfitting [Draper and
81

3. Metabolome Analysis and Characterization of M. pneumoniae Metabolism
Smith, 1998]. To overcome the limitations of the static approach while avoiding theproblem of overfitting, we applied non-linear fittings to experimental data and in silicoresults. The resulting equations allow the calculation of growth constraints for everytime point of the exponential growth phase of M. pneumoniae grown in batch cultureand, subsequently, the analysis of changes in the metabolic behavior between those timepoints. Albeit not granting the extraction of kinetic parameters for the underlying bio-chemical reactions, this approach facilitates general information about network dynamicswithout requiring to determine the exact kinetics for the entire network.Integrating the predicted flux distributions with 13C-glucose tracing results as well as
metabolite and protein quantification data, provided a qualitative picture of metabolicpathway activity in M. pneumoniae, as well as quantitative understanding of networkconnectivity. Furthermore, we could not only estimate the velocities of different metabo-lic routes, but calculate in vivo kinetic parameters for key glycolytic enzymes.Presumably the most interesting general finding of the growth simulations is that
oxygen consumption is tightly coupled to acetic acid production in silico under all simu-lated conditions. This prediction agrees with findings in L. lactis, for which the limitedoxygen availability at later growth stages has been shown to prevent counterbalancingthe redox imbalance associated with acetic acid production, equilibrated by releasing thelactate dehydrogenase from its supposed oxygen-dependent inhibition [Gottschalk, 1986,Neves et al., 2005]. Therefore, we propose that oxygen could have a similar regulatoryrole on pyruvate metabolism in M. pneumoniae leading this organism to switch frommainly acetic to mainly lactic acid fermentation during a four days batch culture growthexperiment (this study, Yus et al. [2009]).Summing up, the iterative integration of in silico results with in vivo data and other
information granted understanding of the examined metabolic system beyond the staticlimitations of the mathematical approach. The presented metabolic model, iJW145, al-lows to predict metabolic behavior where it is not amenable to experimental analysis, forexample due to lacking M. pneumoniae specific analysis tools. The extracted biologicalfindings enlighten functional mechanisms of M. pneumoniae metabolism but also pin-point open questions that remain to be investigated. In addition, the examinations withrespect to the central energy producing carbon metabolism will facilitate the design ofa dynamic model for glycolysis to further investigate underlying regulatory mechanismscontrolling growth performance of this minimal bacteria.
82

4. Genome Re-annotation for Mycoplasmapneumoniae
In this chapter, the genome re-annotation of M. pneumoniae is presented. For publica-tion the results will be integrated with a genome-wide essentiality study currently underdevelopment in our group. The manuscript to be submitted to MSB is still in prepara-tion, but the combined project was already priced with the IOM Luis Denis Award (IOM- International Organization for Mycoplasmology) on the IOM congress 2012, 15-17/07,Toulouse, France.
I designed the theoretical peptide library for M. pneumoniae, analyzed the proteomicsdata, and conducted the bioinformatic analyses integrating in vivo and in silico results.Furthermore, I was involved in the project design and development and I participate inthe manuscript writing as well as figure and table design.
4.1. IntroductionThe interest in the minimal gene set sustaining life increased since the first genomesequences for minimal organisms became available. According to Koonin [2003], essentialgenes of an organism are defined as the minimum gene complement sustaining growthand cell division under the most favorable environmental conditions. In theoreticalapproaches, the number of essential genes has been predicted to be around 240 [Gilet al., 2004, Shuler et al., 2012]. Experimentally, gene essentiality has been studied indifferent organisms, including M. genitalium and M. pulmonis [Hutchison et al., 1999,Glass et al., 2006, Akerley et al., 2002, Jacobs et al., 2003, French et al., 2008, Langridgeet al., 2009, Dybvig et al., 2010, Christen et al., 2011, Griffin et al., 2011]. However, theoperon structure of the bacterial genome and the self-transposition of active transposonsso far prevented the successful determination of the minimum essential genome sustaininglife. In addition, the existence of antisense RNAs and other putative regulatory regionsin bacterial genomes [Lluch-Senar et al., 2007, Yus et al., 2012] suggest that even in thesimplest organism the genome is carefully regulated, leading to the essentiality of notonly genes but also other non-coding regions. Finally, the high error rates reported forgenome annotations [Casari et al., 1995, Brenner, 1999] pose another challenge withinthe aim to define the minimal genome able to sustain life of a cell.Aiming to provide a thorough basis to decipher the essential functional genome of M.
pneumoniae, we manually curated the genome annotation. To this end, we combined apeptide library obtained from translating all peptides encoded theoretically by the M.
83

4. Genome Re-annotation for Mycoplasma pneumoniae
pneumoniae genome with mRNA expression [Güell et al., 2009, 2011] as well as proteinsequencing and MS results (this study) (Figure 4.1).
genome re-annotation
errors in the genome annotation revealed by the metabolic model
in silico genome-wide peptide library proteomics
analysis by MS
gene function assignment
complex genome organization
mRNA ex-pression data
Figure 4.1.: Workflow of the M. pneumoniae genome analysis. 1: re-annotation of thegenome based on integration of a theoretical peptide library, mRNA expressionand protein MS data; 2: genome essentiality study based on HITS sequencingof a minitransposon mutant library and the definition of a distribution score(DSE) that allows to define essentiality for all genomic regions. Accomplishedanalyses integrated into the study have red fonts, literature data and themutant library obtained previously by ”haystack mutagenesis” [Halbedel andStülke, 2007] have orange fonts, and results of the study have green fonts.
4.2. Material and Methods4.2.1. Computational ProceduresPeptide Library Design
The three reading frames of the two strands of the genome of M. pneumoniae (referencegenome: M. pneumoniae M129, NC_000912, NCBI) were translated in silico into pep-tides as described by the pseudocode in Appendix B, section B.1. The resulting peptidelibrary contained all maximum length peptides encoded on the M. pneumoniae genome.Next, we applied a minimum length filter, discarding all predicted peptides shorter than19 amino acids, resulting in a library containing a total number of 12,426 peptides (datanot shown). This library has been used for the analysis of the MS results, to assure thatdetermined unique peptides do not additionally match putative proteins shorter than50 amino acids. The second minimum length filter, discarding all predicted peptidesshorter than 50 amino acids except the two annotated proteins MPN188 (37aa) andMPN682 (48aa), resulted in a library of 3,748 peptides used for the result analysis (data
84

4.3. Results
not shown). Annotated M. pneumoniae proteins have been matched to the peptidesin the library and a list of 151 putatively longer proteins has been generated includingthose proteins that do not match to the entire sequence but only to the C-terminus of amaximum length peptide (Appendix B, Table B.1).
4.2.2. Experimental ProceduresProtein Identification and Quantification by Mass Spectrometry
M. pneumoniae M129 cells were grown in two T75 flasks (75 cm2) in Hayflick mediaat 37°C. At 6 and 96 hours after inoculation, the attached cells were washed threetimes with PBS and lysated with 200 µl of urea 8M. 10 µl of the lysate were loadedin two NuPAGE 4-12% Bis-Tris and in one Tis-Glycine gels (Invitrogen). The differentlanes were divided into 16 bands of approximately 15 mm. Proteins were identified andquantified by MS analysis from the bands and from unfractionated solution samples,using the designed peptide library for the result analysis.
4.3. Results4.3.1. Transcriptome AnalysisUsing transcriptomics data [Güell et al., 2009] and information about a recently discov-ered new class of short RNAs which precisely map the transcriptional start sites (TSSs)ofM. pneumoniae genes (TSS RNAs) [Yus et al., 2012], we determined small RNAs (eachidentified by a M. pneumoniae ID short (MPNs) ID), TSSs, promoter sequences, and 5’-untranslated regions (5’-UTRs) for theM. pneumoniae genome (Appendix B, Table B.1).For 32 annotated genes, the experimentally detected TSS was located downstream ofthe annotated translational start codon (TSC), suggesting an erroneous annotated TSC.In all cases, the resulting transcript contained an alternative TSC in proximity to theTSS, giving rise to either a shorter version of the annotated protein or a completelydifferent protein encoded in one of the two other reading frames (Figure 4.2A and Ap-pendix B, Table B.1). According to multiple sequence alignments with ClustalW [Larkinet al., 2007], for six of those proteins exist orthologous short proteins in other organisms(Appendix B, tabletab:reannotated). Another 86 genes are found to contain multipleTSSs giving rise to different transcripts from which either size-differing versions of theannotated protein or completely different polypeptides can be translated (Figure 4.2Aand Appendix B, Table B.1). Furthermore, for a total number of 152 genes we detected5’-UTRs bigger than 40 nucleotides. Those large 5’-UTRs do possibly contain regulatoryelements or even encode for small peptides, previously not considered [Rasmussen et al.,2009]. 25 out of the 152 large 5’-UTRs presumably extend the annotated ORF, 29 couldencode for proteins of at least 50 amino acids length previously not annotated, and theremaining 98 could be involved in translational regulation (Appendix B, Table B.1). Ofthe 25 putative longer proteins, for 12 the additional amino acid sequence was commonto orthologous proteins in other bacterial species (Appendix B, Table B.2). Translating
85
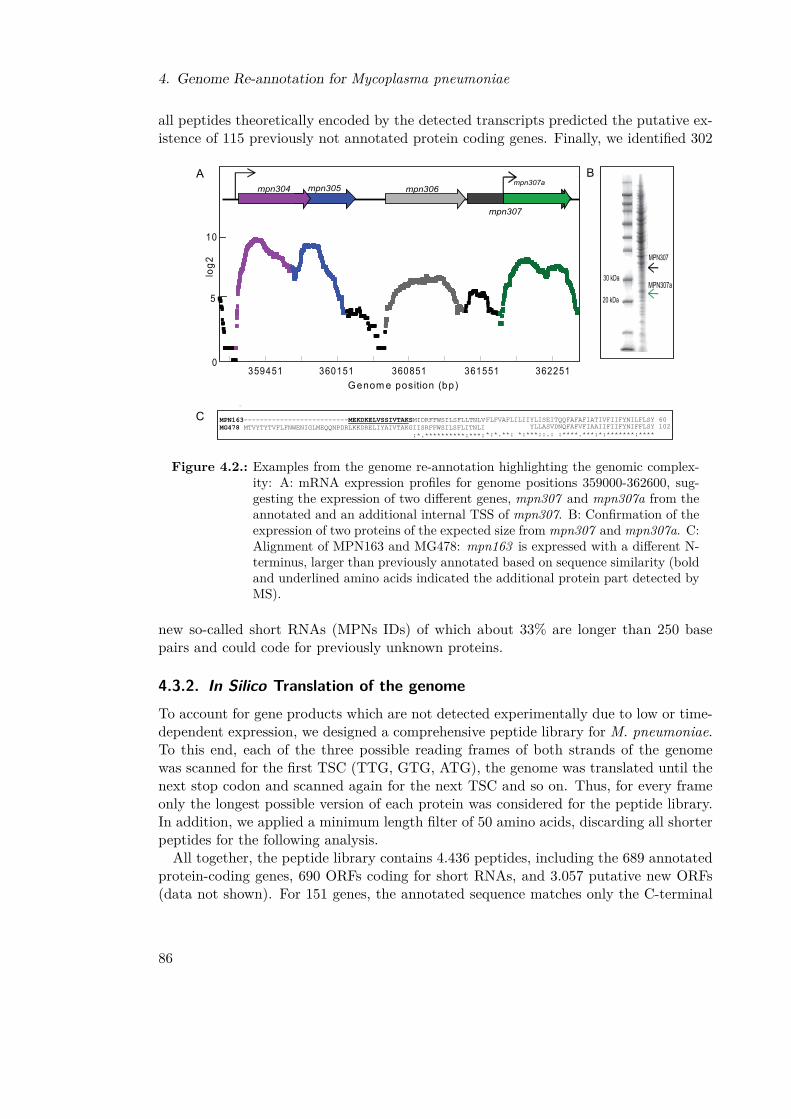
4. Genome Re-annotation for Mycoplasma pneumoniae
all peptides theoretically encoded by the detected transcripts predicted the putative ex-istence of 115 previously not annotated protein coding genes. Finally, we identified 302
C MPN163--------------------------MEKDKELVSSIVTAKSMIDRFFWSILSFLLTNLV MG478 MTVYTYTVFLFNWENIGLMEQQNPDRLKKDRELIYAIVTAKGIISRFFWSILSFLITNLI :*.**********:***:
FLFVAFLILIIYLISEITQQFAFAFIATIVFIIFYNILFLSY 60
YLLASVDNQFAFVFIAAIIFIIFYNIFFLSY 102*:*.**: *:***::.: :****.***:*:*******:****
A B
MPN307
MPN307a30 kDa
20 kDa
0
5
10
359451 360151 360851 361551 362251Genom e position (bp)
mpn307a
mpn307
mpn305mpn304 mpn306
log2
Figure 4.2.: Examples from the genome re-annotation highlighting the genomic complex-ity: A: mRNA expression profiles for genome positions 359000-362600, sug-gesting the expression of two different genes, mpn307 and mpn307a from theannotated and an additional internal TSS of mpn307. B: Confirmation of theexpression of two proteins of the expected size from mpn307 and mpn307a. C:Alignment of MPN163 and MG478: mpn163 is expressed with a different N-terminus, larger than previously annotated based on sequence similarity (boldand underlined amino acids indicated the additional protein part detected byMS).
new so-called short RNAs (MPNs IDs) of which about 33% are longer than 250 basepairs and could code for previously unknown proteins.
4.3.2. In Silico Translation of the genomeTo account for gene products which are not detected experimentally due to low or time-dependent expression, we designed a comprehensive peptide library for M. pneumoniae.To this end, each of the three possible reading frames of both strands of the genomewas scanned for the first TSC (TTG, GTG, ATG), the genome was translated until thenext stop codon and scanned again for the next TSC and so on. Thus, for every frameonly the longest possible version of each protein was considered for the peptide library.In addition, we applied a minimum length filter of 50 amino acids, discarding all shorterpeptides for the following analysis.All together, the peptide library contains 4.436 peptides, including the 689 annotated
protein-coding genes, 690 ORFs coding for short RNAs, and 3.057 putative new ORFs(data not shown). For 151 genes, the annotated sequence matches only the C-terminal
86

4.3. Results
part of a library peptide, suggesting the possible existence of a longer version or largerisoform of the same protein (Appendix B, Table B.1).
4.3.3. Integration of In Silico and In Vivo DataBased on the integration of this peptide library with the information about genome po-sitions of non-coding regions, as well as an analysis of the M. pneumoniae proteome,we re-annotated the genome (Appendix B, Table B.1). Therefore, to validate the pre-dictions from the transcriptomics analysis and the peptide library, we determined theproteome of M. pneumoniae applying MS to non-fractionated total protein extracts ob-tained after 6 and 96 hours of growth in batch culture. In total, 516 of the 689 annotatedproteins were identified (Appendix B, Table B.3), showing high overlap with a previ-ous protein identification studies in M. pneumoniae: a) 93% overlap (557 proteins havebeen detected) [Jaffe et al., 2004] and b) 100% out of 414 quantified proteins by Maieret al. [2011]. All genes with significant expression level of full-length transcripts (averagelog2 > 11 for tiling arrays and average log2 > 13 for deep sequencing results) havebeen detected, while for proteins with lower expression level 71% have been identified,confirming high coverage of the putatively expressed proteome.We fractionated protein extracts by high resolution SDS gel electrophoresis and an-
alyzed the different fractions separately by MS (Figure 4.2B), to further evaluate theprediction of putative longer or shorter proteins. Proteins have been detected for 84 outof the 151 genes possibly coding for longer proteins (Appendix B, Table B.3). However,to confirm the existence of the larger isoform, unique peptides matching the additionalpeptide sequence have to be identified. This was the case for five proteins (MPN006,MPN148, MPN163, MPN388, and MPN664), confirming that these proteins indeed areexpressed in a longer form than previously annotated (Figure 4.2C). In addition, for sixout of 34 genes found to have internal TSSs, we could prove the expression of two pro-teins of different size: MPN310 (200 and 19 kDa), MPN130 (16,5 and 10 kDa), MPN410(17,5 and 10 kDa), MPN073 (44 and 38 kDa), MPN196 (27 and 6,5 kDa), and MPN307(33 and 20 kDa) (Figure 4.2A & B and Appendix B, Table B.3). The two isoforms forMPN310 had been previously described by Boonmee et al. [2009].Analyzing the 32 genes with an annotated TSC outside the experimentally determined
transcript, revealed that 20 code for hypothetical proteins, 12 of those showing high sim-ilarity to the functionally uncharacterized mpn013 (Appendix B, Table B.2: underlinedgene IDs). In all 20 cases, the TSS gives rise to an ORF lacking the same fragment ofthe putative protein. Unique peptides have been identified for 8 out of the 13 supposedhomologs of mpn013, but no unique peptide corresponding to the fragment betweenTSC and TSS (56 aa length) could be determined. We conclude, that at least in M.pneumoniae this protein family is shorter than annotated.We identified 33 new proteins of which 19 are derived from an internal TSS of a pre-
viously annotated gene (Appendix B, Table B.1). Three of the new proteins, MPN060a,MPN198a, and MPN394a, are only expressed during the stationary growth phase (Ap-pendix B, Table B.3). Seven new proteins are homologs of otherM. pneumoniae proteins,respectively located in a different region of the genome. Additionally, another eight new
87

4. Genome Re-annotation for Mycoplasma pneumoniae
proteins have homologs in other mycoplasma species or other M. pneumoniae strains(Appendix B, Table B.2), most of them coding for hypothetical proteins.
D
E
Genom e position (bp)
log2
415200 415400 415600 4158000
5
10
HP antitoxin
MPNs322
mpn347a (toxin)
MYCKEGRLNIIDLINDIFCKVLTFHKLSNGNKRLATALLVNFLYTEGYYFKWTIPLKKEEYFKYAHMIKNFVVSFEEHKRENRDEFLAKQATKKFIMDNILLALNFWETKLN
mpn520a
mpn520A
B
PVLTGLFYLKANDVIIERLKQHHNFVFSESFLHREPHDWRSKTPVIYRASKQLFIKTKSI 420 ---------------MQPLNKHVKMVW---LLKTTRLYWH-------------------- 22
:: *::* ::*: :*: *: QSKLKRQIKRVKFVNNKNKERLQEMLLQRAEWCISRQRVWGLPIPLIYADNQPLLDVTTI 480
-------------------------------W------VWILLVQLI------------- * ** * : **
KYTIQQLKKYGIDSWFEK-DINFFLNPKKIQPGVEYKKETDTLEVWFDSGSTYNVLISNK 539 ----QRLVKH-LAVWLNVNQVNITNDPNEIK--VEHTDQVMCERCW-------------- 71
*:* *: : *:: ::*: :*::*: **:..:. . *
MPN520MPN520a
MPN520MPN520a
MPN520MPN520a
KDRAYAAIEQARQNGVITKNNQVVLTLGVDSTSAIDQRLVKHLAVWLNVN 850 ------------------------------------QRLVKHLAVWLNVN 46
**************
QVNITNDPNEIKVEHTDQVMCERCWNFQTQIYPKKGHQLCARCFTFLKR 899
QVNITNDPNEIKVEHTDQVMCERCWNFQTQIYPKKGHQLCARCFTFLKR 95 *************************************************
IleS 309MPN520a
IleS 309MPN520a
C
PDB IDs:1FFY/2V0G (superposed)
toxin-antitoxin module
Figure 4.3.: Functionality analysis for new M. pneumoniae genes. A-C: mpn520a, A:Alignment of MPN520a to MPN520, showing low sequence similarity. B:Alignment of MPN520a to the isoleucyl-tRNA synthetase of M. pneumoniae309 (IleS 309), showing a perfect match for the C-terminal of IleS. C: Su-perposed protein structures for two tRNA synthetases (IFFY/2V0G) [Silvianet al., 1999, Rock et al., 2007]; D-E: mpn341a, D: Conserved residues of theactive center of toxin proteins detected in MPN347a. E: mRNA expressionprofiles showing expression i) of an antisense RNA, MPNs322, overlappingwith two protein coding genes, which are expressed at the same time and ii)of the newly identified toxin (mpn347a).
88

4.4. Discussion
For example, MPN520a, expressed from an ORF located in an intergenic region, ishighly similar to the C-terminal region of isoleucyl-tRNA synthetase of the M. pneu-moniae 309 strain, but not to the isoleucyl-tRNA synthetase of M. pneumoniae M129i(Figure 4.3). This finding suggests an additional function for this C-terminal regionof the M. pneumoniae 309 isoleucyl-tRNA synthetase, that in M. pneumoniae 129 isaccounted for by MPN520a. Interestingly, MPN347a, also expressed from an intergenicregion, contains the same active site as the toxic death-on-curing (DOC) protein of phageP1 [Garcia-Pino et al., 2008] (Figure 4.3D). In E. coli, DOC is part of an operon con-taining two counteracting proteins known as toxin-antitoxin or addiction module [Butset al., 2005]. In M. pneumoniae, upstream to MPN347a locates an ORF encoding theantitoxin (Figure 4.3E) but the protein, which has been shown to be very unstable anddifficult to detect [Buts et al., 2005], has not been identified by MS (Appendix B, Ta-ble B.3). However, an antisense RNA (MPNs322) for the antitoxin has been identifiedby ultra-sequencing and tiling arrays [Güell et al., 2009] (Figure 4.3E). This antisenseRNA could inhibit the translation of the antitoxin favoring toxin activity.About two thirds of the new coding ORFs (21) are located in transgenic regions,
suggesting that the same region of the genome can codify for two different proteins.Mpn037a, for instance, is a cis-antisense RNA of mpn037 and contains two alternativeTSSs putatively originating two size-differing versions of the same protein (11 and 13kDa). In addition, mpn037a has high sequence similarity to mpn139, coding for a hy-pothetical protein of M. pneumoniae. We identified six unique peptides for MPN037a,proving that both strands of the same genomic regions can code for two different proteinsexpressed under the same conditions. This finding poses a formidable challenge on geneessentiality studies in bacteria, because genes could be wrongly considered essential dueto the existence of an overlapping essential ORF on the opposing strand.In summary, the integration of transcriptomics and proteomics data with the theoret-
ical peptidome encoded in the M. pneumoniae genome allowed to identify 115 putativenew ORFs (33 validated), to change the length of 44 proteins (12 longer and 32 shorter),to identify 53 proteins with putative isoforms of different length (6 validated), and todescribe 126 new MPNs encoding ORFs.
4.4. DiscussionDespite the fact, that the genome of M. pneumoniae has been sequenced twice [Himmel-reich et al., 1996, Dandekar et al., 2000], we were able to not only correct the annotationof 44 genes but to also identify and verify 33 new protein coding genes, thus correctingan error rate of about 10.7%. This rate even exceeds previous estimations for automat-ically derived genome annotations, amounting to 8% in M. genitalium [Brenner, 1999].The integration of the theoretical peptide library with mRNA expression data [Güellet al., 2009, 2011] and proteome characterization, in addition, allowed to identify sixgenes from which different isoforms of the same protein are expressed from differingTSSs which could not have been detected based on the genome sequence alone. Finally,we discovered a total number of 126 new sRNAs.
89

4. Genome Re-annotation for Mycoplasma pneumoniae
Carefully analyzing the newly detected protein-coding genes enabled us to unravel theprobable function of one of the newly annotated genes, showing high sequence similar-ity between the respective gene and the toxin of the toxin-antitoxin module in E. coli.Our results show that for an accurate genome annotation it is indispensable to considerexperimental data, preferentially of different cellular entities, such as mRNAs and pro-teins, and obtained under different growth condition, as well as the theoretical codingcapacities of the genome.Interestingly, we found that the reduced genome of M. pneumoniae is not at all sim-
ply structured but in contrast highly compact. In addition to the high number of smallRNAs, many of them antisense to protein coding ORFs, the genome even contains re-gions where both strands code for proteins found to be expressed under the appliedgrowth conditions. These findings have the potential to revolutionize understanding ofbacterial genomes, which are putatively structured and regulated in a far more com-plicated manner than previously assumed. For M. pneumoniae, we propose that themultitude of sense and antisense RNAs (MPNs) found to overlap with coding genes areinvolved in the regulation of mainly those overlapping genes and putatively others.To understand life, even if only of a single-cellular organisms, one has to determine
the functions and their related genes essential for survival of the cells. To study geneessentiality in bacteria, which are much smaller and simpler than eukaryotic cell, ingeneral genome-wide mutagenesis studies are accomplished despite being not entirelyaccurate due to several technical reasons. However, all attempts to define the minimalessential genome of a cell has not been successful so far. One possible reason is theapplied focus on protein and functional RNA encoding genes, thereby missing other,non-translated genomic regions. The detailed annotation of the M. pneumoniae genomeis currently used to define essential genomic regions, independent of localization, codingcapacities, and function. Upon finishing this in vivo essentiality study, the two projectwill be merged into a single manuscript for publication.
90

5. Summarizing Discussion and ConcludingRemarks
Objectives and SummaryUnderstanding life of an entire cell is a highly ambitious goal - at the current stateof technology and knowledge not amenable for eukaryotic cells. However, advances incomputer technology and high throughput analysis methods bring this goal into reachfor some of the most simple prokaryotes, mycoplasmas. The objective of this thesiswas to contribute to a collaborative systems biology research project to comprehensivelyexplore the minimal bacterium M. pneumoniae by conducting mathematical and com-putational analyses integrating high-throughput in vivo and in silico data. To this end,different sub-projects have been carried out, relating information on diverse aspects ofM. pneumoniae, such as the cellular composition, metabolic behavior, the proteomeorganization, as well as genome structure and gene expression.In science, the exchange of information is of upmost importance in order to produce
further knowledge gain. To allow fast and easy exchange of information within the my-coplasma project and the scientific community, to obtain an overview about the availabledata and to classify it according to putative utility for the design of mathematical models,we developed and implemented a database for M. pneumoniae, MyMpn. Apart fromdata access, the database interface allows to further integrate new and unpublished datawith the database content, providing advanced access to members of the mycoplasmaproject. The related data analysis revealed significant gaps in our understanding of theM. pneumoniae cell composition and the functional mechanisms governing metabolism,that in part could be addressed by a metabolic model.As the main project of this thesis, we developed a predictive genome-scale constraint-
based model for the M. pneumoniae metabolism, iJW145, based on a metabolic mappreviously designed in our group [Yus et al., 2009]. In addition, we qualitatively andquantitatively explored the metabolite space of M. pneumoniae in vivo, thereby as-sessing regulatory mechanisms for intracellular metabolite pools. This enabled us tosemi-quantitatively define the biomass composition of an average M. pneumoniae cell,thus providing the basis for in silico growth simulations for M. pneumoniae and puta-tively other wall-less bacteria. Simulating growth with our metabolic model allowed usto correct the network annotation, to unravel the energy balancing of M. pneumoniaegrown in batch culture, and to characterize the metabolic behavior during the exponen-tial growth phase as well as in diverse mutant phenotypes. The iterative integration ofin silico and in vivo results, as well as the collaborative effort put into experiment andmodel design, provided extraordinary insight into the metabolic behavior of M. pneumo-niae which in addition to the reduced genome also reflects the high degree of adaptation
91

5. Summarizing Discussion and Concluding Remarks
to parasitic life in the human lung.Analyzing the metabolism of M. pneumoniae, amongst other findings, pointed out
several errors in the genome annotation, both in the annotated ORFs and in the func-tional annotation of specific genes. Integrating information on the theoretical codingcapacities of the genome sequence with mRNA as well as protein sequencing and MSdata, enabled us to re-annotate the M. pneumoniae genome in unprecedented qualityand detail. Our results prove the importance of the validation of automatically generatedgenome annotations by preferentially complementing genome-scale experimental data.Additionally, they suggest that even the most simple bacterial genomes are carefullyorganized resulting in complex regulatory mechanisms for gene expression.The results from the different presented projects as well as from other ongoing studies
will be incorporated into theMyMpn database, thus adding up to the scientific attemptof understanding M. pneumoniae in full quantitative detail.
State of the Art in M. pneumoniae ResearchWhen I joined the mycoplasma project, several large-scale data sets had been produced,making available information on gene expression, protein-protein interactions, and themetabolic network of M. pneumoniae [Güell et al., 2009, Kühner et al., 2009, Yus et al.,2009]. Other studies on transcriptional regulation [Güell et al., 2011], proteomics [Maieret al., 2011], post-translational modifications [van Noort et al., 2012], and a new classof short RNAs (TSS RNAs) [Yus et al., 2012] were in preparation. However, a propersystem to share and exchange the information amongst the different groups and to stan-dardize their analysis was missing.Our database provides the previously lacking central data storage for the mycoplasma
community and significantly facilitates information exchange between the different re-search groups. Several of the analysis tools, as for example the genome browsers or theinteractive metabolic map have been built by adapting available tools to M. pneumo-niae and the necessities of the different scientists involved. The statistical analysis toolsand the Mycoplasma pneumoniae genome browser can be applied to unpublished datasince they allow to temporarily upload data that is not further stored or included in thedatabase. Despite being still under development and thus not released to the public, thedatabase is already used by the different groups of the mycoplasma project.With respect to the understanding of M. pneumoniae, the database design process
highlighted the requirement of a genome-scale metabolic model to further unravel un-derlying functional and regulatory mechanism. For the design of a dynamic model, de-scribing all metabolic components (e.g. metabolites and catalyzing enzymes) and theirbiochemical relations in a time-dependent manner, the available experimental data, espe-cially for metabolites, was still too sparse, suggesting the application of a static modelingapproach, such as constraint-based modeling [Varma and Palsson, 1994b].
The metabolic network of M. pneumoniae had been reconstructed by integration of genefunction assignments with growth curve measurements and subsequent manual gap fill-ing based on database information on metabolic pathways [Yus et al., 2009]. To validatethe reconstructed network and to further understand metabolism in M. pneumoniae,
92

the different metabolic components had to be identified, if possible quantified, and thenplaced into the context of their dynamic network.Based on the available metabolic network reconstruction [Yus et al., 2009], we de-
signed a genome-scale constraint-based model with predictive capacities: iJW145. Thepresented integration of this mathematical model with metabolite identification andquantification data as well as a broad literature screening allowed to draw a quantitativepicture of the M. pneumoniae metabolism despite the application of a static modelingapproach. Thereby, the combination of complementary experimental techniques facili-tated the detection of a substantial fraction of the metabolome, reaching higher coverageof the in silico predicted metabolome than obtained for any other organism [Soga et al.,2003, van der Werf et al., 2007, 2008, t’Kindt et al., 2010, Liebeke et al., 2011]. Thedetermination of the biomass composition of a cell wall-less bacteria, that significantlydiffers from that of higher prokaryotes, will serve as a basis for growth simulations inmycoplasmas and related organisms. By an in its complexity unprecedented iterativeintegration of in silico and in vivo results, we were able to unravel general principlesgoverning the energy homeostasis in M. pneumoniae. In general, the metabolism ofM. pneumoniae appears to be tightly adapted to growth in the constant environmentalconditions it encounters in its natural habitat.The extracted findings, such as the determined in vivo catalytic rates, are employed
in the design of dynamic models for metabolic sub-systems as well as for the design ofengineering tools for genetic manipulation of M. pneumoniae currently under develop-ment in our group. Besides, the correction of the functional annotation of metabolic keyenzymes, revealed that important errors remain in the genome annotation of M. pneu-moniae even after two annotation rounds [Himmelreich et al., 1996, Dandekar et al.,2000].
The determination of the minimal set of functions required to sustain life is unques-tionable one of the important challenges in current biological research attracting theattention of many different research groups [Hutchison et al., 1999, Gerdes et al., 2003,Kobayashi et al., 2003, Glass et al., 2006, French et al., 2008, Christen et al., 2011]. M.pneumoniae, due to its reduced genome and the large amount of genome-scale data setson transcriptomics and proteomics, is an ideal organism to tackle this question. Still, thehigh error rates reported for genome annotations in general [Casari et al., 1995, Brenner,1999] and the deficits in the annotation of M. pneumoniae pinpointed by the metabolicanalysis constituted a significant obstacle towards this aim.We showed that it is indispensable for a high-quality annotation of a genome to com-
plement the annotation obtained automatically based on sequence similarity with high-throughput in vivo data and the theoretical genomic coding capabilities. Our approachallowed us to correct the annotation of more than 10% of all protein-coding genes, in-cluding the 33 newly detected, and to annotate 126 new sRNA encoding ORFs.This analysis reveals higher complexity of bacterial genomes than previously assumed,
proving the existence of i) overlapping protein coding genes on opposing strands and ii)different protein isoforms expressed from the same gene (validated for six ORFs) in bac-teria. In addition, this accurate genome annotation provides a thorough basis to assess
93

5. Summarizing Discussion and Concluding Remarks
the minimal essential genome sustaining life of M. pneumoniae.
Advantages of the Collaborative Research Approach in Systems BiologyAll projects presented in this thesis have been accomplished in collaboration with re-searchers from different natural sciences, each contributing by adding his or her field-specific knowledge and personal views. Thus, each of the involved scientists could profitfrom the expertise of the different colleagues, learning about highly diverse topics, theadvantages and disadvantages of experimental and computational research, as well asa multitude of methodologies. This is of major importance, since one of the key aimsof systems biology is to incorporate the perspectives of different scientific disciplines,thus providing the possibility to study a biological system as a whole and from differentangles [Auyang, 1999, Kitano, 2002a, Oshry, 2007]. To this end, it is indispensable thatresearchers learn to communicate their work to people from different areas, not familiarwith many of the field-specific terms and definitions, thereby establishing a commonlanguage. As a result, the systems biology approach, when applied at all levels of a re-search project, grants a knowledge gain far beyond the sum of the results of each singlesub-project. Integration of different data sets with each other allows to complement forlimitations in the applied techniques, both for the same type of data (i.e. transcrip-tomics, proteomics, metabolomics) and for the relation of different cellular levels.As detailed in the different results chapters, the accomplished analyses and, especially,
the iterative integration of the different experimental and computational results, enabledus to obtain unprecedented insight into a biological system, the minimal bacterium M.pneumoniae. The developed database will allow to further improve the collaborationamongst the different research groups of the mycoplasma project and possibly attractthe interest of other scientists into this fascinating model organism for systems biology.Furthermore it provides an ideal starting point for the development of mathematicalmodels for M. pneumoniae.Mathematical modeling, especially if many different large-scale data sets for an organ-
ism are available, as in case of M. pneumoniae, provides a powerful tool to understand asystem as one big entity, rather than as a collection of sparsely connected sub-systems.Recently, a whole-cell model has been presented for M. genitalium, describing the lifecycle of the smaller relative of M. pneumoniae and deciphering previously unknownfunctions [Karr et al., 2012]. For M. pneumoniae, the metabolic model provided insightnot only into the network structure but also into the regulation of metabolic activityunder different conditions, especially with respect to energy usage. When compared tothe model building process in E. coli, where the initial metabolic model [Edwards andPalsson, 2000] has been improved by several different researchers over the past decade[Covert et al., 2001, Shlomi et al., 2007, Fleming et al., 2009, Lewis et al., 2012], incase of M. pneumoniae this process was much faster, which can be attributed to thesmall size and the resulting comparatively high coverage of the predicted transcriptome,proteome, and metabolome by experimental analyses.Despite being the probably best studied model organism for prokaryotes in the biolog-
ical sciences, E. coli still is quite complex for a bacterial cell when compared to minimalorganisms such as mycoplasmas (M. pneumoniae is about 10 times smaller). Taking into
94

account the small cell size, limiting the diversity and abundance of all cellular compo-nents, M. pneumoniae is of special interest for the study of essential cellular functions,common to all cells. We integrated data on genomics, transcriptomics, and proteomicswith the theoretical peptidome encoded by the M. pneumoniae genome. This allowed usto correct the genome annotation of M. pneumoniae, thereby re-defining more than 10%of the protein coding ORFs, what even exceeds the high error rate of 8% estimated forM. genitalium [Brenner, 1999]. Our analysis reveals a high degree of genome packaging,which allows to maintain diverse regulatory mechanisms, such as antisense RNAs forexample, contradicting the simplicity hitherto assumed for bacterial genomes.The presented work improves our understanding of M. pneumoniae significantly. The
drawn biological conclusions, for example with respect to energy homeostasis in bacteriaor the unexpected structural complexity of their genomes, will have general impact onthe research in related fields of biology. The metabolic model, the in vivo metabolomestudy, and the high-quality genome annotation, together with the genome-scale datasets on transcriptomics, proteomics, and metabolomics turn M. pneumoniae into one ofthe most promising model organisms for systems biology.
Future ProspectsSince the presented work only comprises a small part of a much bigger project, i.e. theaim to understand an organism in its entirety, a lot of future work remains to be doneuntil even approximating this goal. First of all, the presented data and results haveto be integrated into the MyMpn database for its release. In addition, a comparativeanalysis of M. pneumoniae and M. genitalium applying the data analysis and visualiza-tion tools provided by the database, will add up to our understanding of the two closelyrelated organisms. Another study on mycoplasma evolution with a focus on metabolismis currently under development and aims to allow the reconstruction of an ancestral my-coplasma genome as well as of its metabolic network by including more distant speciesthan M. genitalium in this analysis. This network would not only enable us to studythe specific effects of metabolic sub-networks on the general network behavior, but alsoconclude on metabolic functions related to the different niches and virulence functionsof various mycoplasma species. For our essentiality study, we are currently producingadditional datasets aimed to allow i) further finetuning of the applied scoring systemand, putatively, the sequential and functional (re-)annotation of additional genes.Several mathematical models are currently under development, one for the transcrip-
tion and translation of genes into proteins, one describing gene regulation by the fewTFs of M. pneumoniae, and another one to analyze chromosome structuring and theinfluence on transcriptional regulation by chromosome packaging. Those models allattempt to shed light on the mechanisms by which minimal bacteria that lack manycellular functions known from more complex organisms are still able to show the differ-entiated response to environmental stresses observed in vivo [Güell et al., 2009, 2011].Once finished, those models have to be connected to the metabolic model in order tostudy the connection between transcription, translation, and metabolic function. Fur-thermore, to deepen the knowledge obtained by the metabolic model and especially tounderstand regulatory mechanisms, for example the one governing the metabolic switch
95

5. Summarizing Discussion and Concluding Remarks
from mainly acetic to mainly lactic acid fermentation M. pneumoniae undergoes in afour days batch culture growth experiment, dynamic models for metabolic sub-systemshave to be designed. An ODE-based model for glycolysis, aimed to allow testing ofthe hypothesis that oxygen availability strongly influences the regulation of pyruvateprocessing, has been designed and will in the best case also provide information aboutkinetic parameters, which then can be compared to the estimates calculated from invivo and in silico results. To this end, experimentally we plan to measure growth andexternal metabolites in an LDH− strain in order to better understand the regulation ofthe mentioned metabolic switch. Despite the fact that M. pneumoniae will not be thefirst organism for which a whole-cell model is constructed with the recent one for M.genitalium [Karr et al., 2012], we are convinced that such a model would complementthat for M. genitalium based on the differing foci of the mathematical models and theexperimental analyses.Based on the curation of the genome annotation, we are currently conducting a
genome-wide essentiality study. A minitransposon mutant library obtained previouslyby ”haystack mutagenesis” [Halbedel and Stülke, 2007] has been sequenced, determiningthe insertion positions in the genomes of the transposon mutants. While up to now, thecriteria to define essentiality were only applicable to defined protein or functional RNAencoding ORFs, we are working on the establishment of a score allowing to decipher allessential genomic regions, regardless of their function, length, and transcription. Thisscore, in combination with the high-quality genome annotation and the in silico gene es-sentiality prediction of the metabolic model, will be used to unravel the minimal essentialgenome of M. pneumonaie and insights into mycoplasma-specific functional mechanisms.As a final conclusion from the presented work, we claim that mycoplasmas are ideal
model organisms for systems biology due to their small size and the many biological prin-ciples, as for instance the existence of antisense RNAs in bacteria [Lluch-Senar et al.,2007], recently discovered. Compared to its closest relative, M. genitalium, apart fromthe high quality of the available data, for example the new genome annotation, the ad-vantages in laboratory culturing of M. pneumoniae are putatively the major advantages.Nevertheless, research on both organisms will mutually profit from each other due totheir close relationship and an integration of findings from the recently published whole-cell model forM. genitalium with our results should reveal further functional mechanismsof these minimal organisms.
96
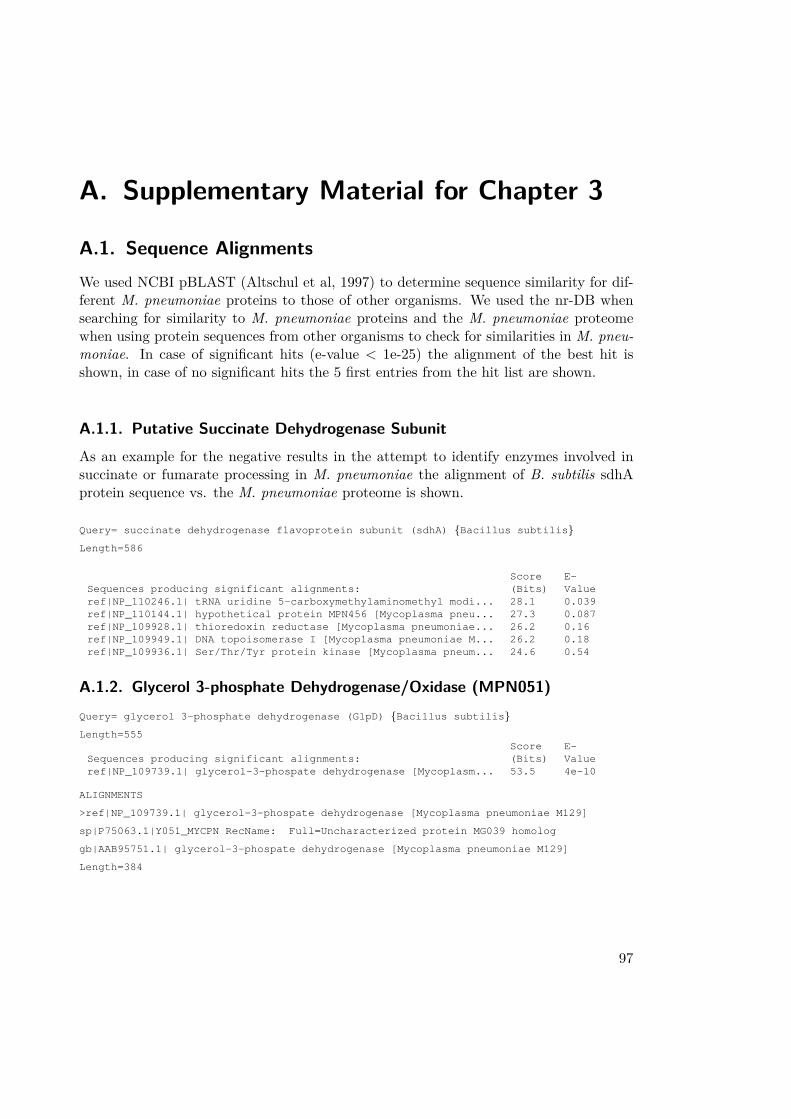
A. Supplementary Material for Chapter 3
A.1. Sequence AlignmentsWe used NCBI pBLAST (Altschul et al, 1997) to determine sequence similarity for dif-ferent M. pneumoniae proteins to those of other organisms. We used the nr-DB whensearching for similarity to M. pneumoniae proteins and the M. pneumoniae proteomewhen using protein sequences from other organisms to check for similarities in M. pneu-moniae. In case of significant hits (e-value < 1e-25) the alignment of the best hit isshown, in case of no significant hits the 5 first entries from the hit list are shown.
A.1.1. Putative Succinate Dehydrogenase SubunitAs an example for the negative results in the attempt to identify enzymes involved insuccinate or fumarate processing in M. pneumoniae the alignment of B. subtilis sdhAprotein sequence vs. the M. pneumoniae proteome is shown.
Query= succinate dehydrogenase flavoprotein subunit (sdhA) {Bacillus subtilis}Length=586
Score E-Sequences producing significant alignments: (Bits) Valueref|NP_110246.1| tRNA uridine 5-carboxymethylaminomethyl modi... 28.1 0.039ref|NP_110144.1| hypothetical protein MPN456 [Mycoplasma pneu... 27.3 0.087ref|NP_109928.1| thioredoxin reductase [Mycoplasma pneumoniae... 26.2 0.16ref|NP_109949.1| DNA topoisomerase I [Mycoplasma pneumoniae M... 26.2 0.18ref|NP_109936.1| Ser/Thr/Tyr protein kinase [Mycoplasma pneum... 24.6 0.54
A.1.2. Glycerol 3-phosphate Dehydrogenase/Oxidase (MPN051)Query= glycerol 3-phosphate dehydrogenase (GlpD) {Bacillus subtilis}Length=555
Score E-Sequences producing significant alignments: (Bits) Valueref|NP_109739.1| glycerol-3-phospate dehydrogenase [Mycoplasm... 53.5 4e-10
ALIGNMENTS
>ref|NP_109739.1| glycerol-3-phospate dehydrogenase [Mycoplasma pneumoniae M129]
sp|P75063.1|Y051_MYCPN RecName: Full=Uncharacterized protein MG039 homolog
gb|AAB95751.1| glycerol-3-phospate dehydrogenase [Mycoplasma pneumoniae M129]
Length=384
97
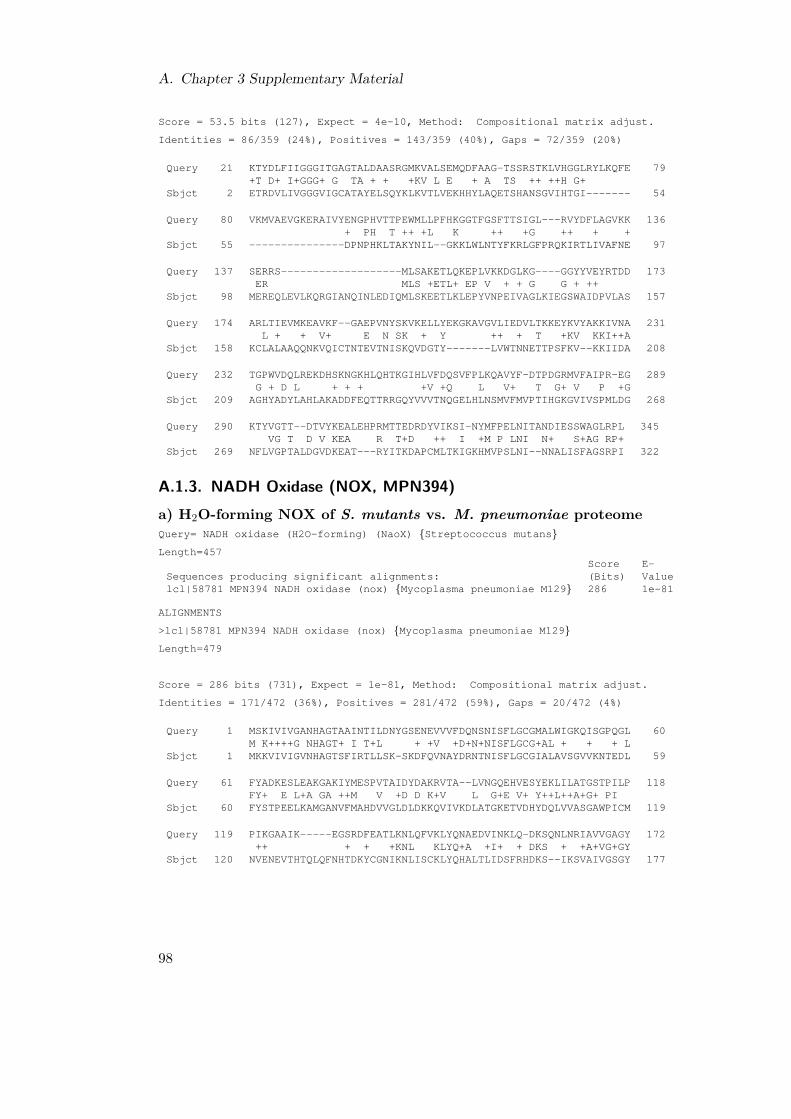
A. Chapter 3 Supplementary Material
Score = 53.5 bits (127), Expect = 4e-10, Method: Compositional matrix adjust.
Identities = 86/359 (24%), Positives = 143/359 (40%), Gaps = 72/359 (20%)
Query 21 KTYDLFIIGGGITGAGTALDAASRGMKVALSEMQDFAAG-TSSRSTKLVHGGLRYLKQFE 79+T D+ I+GGG+ G TA + + +KV L E + A TS ++ ++H G+
Sbjct 2 ETRDVLIVGGGVIGCATAYELSQYKLKVTLVEKHHYLAQETSHANSGVIHTGI------- 54
Query 80 VKMVAEVGKERAIVYENGPHVTTPEWMLLPFHKGGTFGSFTTSIGL---RVYDFLAGVKK 136+ PH T ++ +L K ++ +G ++ + +
Sbjct 55 ---------------DPNPHKLTAKYNIL--GKKLWLNTYFKRLGFPRQKIRTLIVAFNE 97
Query 137 SERRS-------------------MLSAKETLQKEPLVKKDGLKG----GGYYVEYRTDD 173ER MLS +ETL+ EP V + + G G + ++
Sbjct 98 MEREQLEVLKQRGIANQINLEDIQMLSKEETLKLEPYVNPEIVAGLKIEGSWAIDPVLAS 157
Query 174 ARLTIEVMKEAVKF--GAEPVNYSKVKELLYEKGKAVGVLIEDVLTKKEYKVYAKKIVNA 231L + + V+ E N SK + Y ++ + T +KV KKI++A
Sbjct 158 KCLALAAQQNKVQICTNTEVTNISKQVDGTY-------LVWTNNETTPSFKV--KKIIDA 208
Query 232 TGPWVDQLREKDHSKNGKHLQHTKGIHLVFDQSVFPLKQAVYF-DTPDGRMVFAIPR-EG 289G + D L + + + +V +Q L V+ T G+ V P +G
Sbjct 209 AGHYADYLAHLAKADDFEQTTRRGQYVVVTNQGELHLNSMVFMVPTIHGKGVIVSPMLDG 268
Query 290 KTYVGTT--DTVYKEALEHPRMTTEDRDYVIKSI-NYMFPELNITANDIESSWAGLRPL 345VG T D V KEA R T+D ++ I +M P LNI N+ S+AG RP+
Sbjct 269 NFLVGPTALDGVDKEAT---RYITKDAPCMLTKIGKHMVPSLNI--NNALISFAGSRPI 322
A.1.3. NADH Oxidase (NOX, MPN394)a) H2O-forming NOX of S. mutants vs. M. pneumoniae proteomeQuery= NADH oxidase (H2O-forming) (NaoX) {Streptococcus mutans}Length=457
Score E-Sequences producing significant alignments: (Bits) Valuelcl|58781 MPN394 NADH oxidase (nox) {Mycoplasma pneumoniae M129} 286 1e-81
ALIGNMENTS
>lcl|58781 MPN394 NADH oxidase (nox) {Mycoplasma pneumoniae M129}Length=479
Score = 286 bits (731), Expect = 1e-81, Method: Compositional matrix adjust.
Identities = 171/472 (36%), Positives = 281/472 (59%), Gaps = 20/472 (4%)
Query 1 MSKIVIVGANHAGTAAINTILDNYGSENEVVVFDQNSNISFLGCGMALWIGKQISGPQGL 60M K++++G NHAGT+ I T+L + +V +D+N+NISFLGCG+AL + + + L
Sbjct 1 MKKVIVIGVNHAGTSFIRTLLSK-SKDFQVNAYDRNTNISFLGCGIALAVSGVVKNTEDL 59
Query 61 FYADKESLEAKGAKIYMESPVTAIDYDAKRVTA--LVNGQEHVESYEKLILATGSTPILP 118FY+ E L+A GA ++M V +D D K+V L G+E V+ Y++L++A+G+ PI
Sbjct 60 FYSTPEELKAMGANVFMAHDVVGLDLDKKQVIVKDLATGKETVDHYDQLVVASGAWPICM 119
Query 119 PIKGAAIK-----EGSRDFEATLKNLQFVKLYQNAEDVINKLQ-DKSQNLNRIAVVGAGY 172++ + + +KNL KLYQ+A +I+ + DKS + +A+VG+GY
Sbjct 120 NVENEVTHTQLQFNHTDKYCGNIKNLISCKLYQHALTLIDSFRHDKS--IKSVAIVGSGY 177
98

A.1. Sequence Alignments
Query 173 IGVELAEAFKRLGKEVILIDVVDTCLAGYYDQDLSEMMRQNLEDHGIELAFGETVKA--I 230IG+ELAEA + GK+V +ID++D +D++ + + + ++ GI L G VK +
Sbjct 178 IGLELAEAAWQCGKQVTVIDMLDKPAGNNFDEEFTNELEKAMKKAGINLMMGSAVKGFIV 237
Query 231 EGDGKVER-IVTDKASHDVDMVILAVGFRPNTAL--GNAKLKTFRNGAFLVDKK-QETSI 286+ D V + + TDK D D+VI ++GFRPNT + + + RNG+ V++ Q +
Sbjct 238 DADKNVVKGVETDKGRVDADLVIQSIGFRPNTQFVPKDRQFEFNRNGSIKVNEYLQALNH 297
Query 287 PDVYAIGDCATVYDNAINDTNYIALASNALRSGIVAGHNAAGHKLESL-GVQGSNGISIF 345+VY IG A +YD A I LA+NA++SG+VA + G K L + G+N + +F
Sbjct 298 ENVYVIGGAAAIYDAASEQYENIDLATNAVKSGLVAAMHMIGSKAVKLESIVGTNALHVF 357
Query 346 GLNMVSTGLTQEKAKRFGYNPEVTAFTDFQKASFIEHDNYPVTLKIVYDKDSRLVLGAQM 405GLN+ +TGLT+++AK G++ V+ D + F+ + V K++YDK + +LGAQ+
Sbjct 358 GLNLAATGLTEKRAKMNGFDVGVSIVDDNDRPEFMGTFD-KVRFKLIYDKKTLRLLGAQL 416
Query 406 AS-KEDMSMGIHMFSLAIQEKVTIERLALLDYFFLPHFNQPYNYMTKAALKA 456S + S I +LA+Q+K+ I L L+D +FLPH+N+P+N++ A L+A
Sbjct 417 LSWNTNHSEIIFYIALAVQKKMLISELGLVDVYFLPHYNKPFNFVLAAVLQA 468
b) H2O2-forming NOX of S. mutants vs. M. pneumoniae proteomeQuery= NADH oxidase (H2O2-forming) (NaoX) {Streptococcus mutans}Length=457
Score E-Sequences producing significant alignments: (Bits) Valuelcl|2291 MPN394 NADH oxidase (nox) {Mycoplasma pneumoniae M129} 23.1 0.022
ALIGNMENTS
>lcl|2291 MPN394 NADH oxidase (nox) {Mycoplasma pneumoniae M129}Length=479
Score = 23.1 bits (48), Expect = 0.022, Method: Compositional matrix adjust.
Identities = 31/127 (24%), Positives = 53/127 (41%), Gaps = 16/127 (12%)
Query 348 KKVAVIGGGNSGLEAAIDLAGLASHVYILEFLPELKADKILQDRAEALDN------ITIL 401K VA++G G GLE A V +++ L + + ++ L+ I ++
Sbjct 168 KSVAIVGSGYIGLELAEAAWQCGKQVTVIDMLDKPAGNNFDEEFTNELEKAMKKAGINLM 227
Query 402 TNVATKEII---GNDHVEGLRYSDRTTNEEYLLDLEGVFVQIGLVPSTDWL-KDSGLALN 457A K I + V+G+ +D+ +D + V IG P+T ++ KD N
Sbjct 228 MGSAVKGFIVDADKNVVKGVE-TDKGR-----VDADLVIQSIGFRPNTQFVPKDRQFEFN 281
Query 458 EKGEIIV 464G I V
Sbjct 282 RNGSIKV 288
A.1.4. Putative CTP SynthaseAs an example for the negative results in the attempt of identifying a CTP synthase inM. pneumoniae the alignment of M. gallisepticum pyrG protein sequence vs. the M.pneumoniae proteome is shown.
Query= CTP synthase (pyrG) {Mycoplasma gallisepticum}Length=540
99

A. Chapter 3 Supplementary Material
Score E-Sequences producing significant alignments: (Bits) Valuelcl|57601 MPN001 DNA polymerase III beta subunit (dnaN) {Myco... 7.3 0.84lcl|57603 MPN003 DNA gyrase subunit B (gyrB) {Mycoplasma pneu... 18.5 0.30lcl|57604 MPN004 DNA gyrase subunit A (gyrA) {Mycoplasma pneu... 17.3 0.66lcl|57605 MPN005 seryl-tRNA synthetase (serS) {Mycoplasma pne... 16.2 1.7lcl|57606 MPN006 thymidylate kinase {Mycoplasma pneumoniae M129} 15.0 3.4
A.2. Comparative Calculations for M. pneumoniae and E. coliTo verify the surprising findings on energy consumption in M. pneumoniae, we comparedthe biophysical properties and the energy consuming processes in M. pneumoniae andE. coli. The numbers for biophysical properties of M. pneumoniae are taken from Yuset al. [2009] and the numbers for E. coli have been extracted from the Bionumbersdatabase [Milo et al., 2010]. We calculated the surface to volume ratio for both organismsin order to identify a possible influence on cellular homeostasis tasks. Furthermore,we determined the relative fractions of energy dedicated to the synthesis of the majorcellular building blocks in both organisms. The list of biophysical properties used andthe calculation results can be seen in Table A.18.
100

A.2. Comparative Calculations for M. pneumoniae and E. coli
101

A. Chapter 3 Supplementary Material
A.3. Figures
M019
M021
M020
M001
M022
M002
M026
M023
M003
M024
M004
M025
M005
M045
M048
M047
M049
M034
M044
M006
M046
M179
M184
M050
M035
M037
M007/M077/M085/M090
M057
M058
M008
M056
M051
M052
M053
M060
M054
M055
M059
M011
M010
M009
M062
M199 M178 M061
M064
M196
M063
M198
M012/M013/M014
M042
M043
M017
M015
M016
M041
M036
M039
M038
M040
M031
M032
M033
M027
M028
M030
M029
M067
M068
M069
M010a
M101a
M075
M066
M073
M174a
M065
M074
M076
M078a
M079
M174c
M189
M081
M080
M086
M083
M087
M183
M089
M078b
M088
M084
M082
M071b
M114
M109
M177
M181
M176
M110
M109
M111
M108
M104
M115
M113
M105
M117
M112
M116
M103
M106
M102
M107
M118
M188
M072
M078d
M078c
M099
M100
M101
M174b
M071c
M071d
M097
M096
M095
M094
M070
M093
M098
M174d
M018a
M018b
M091
M092
M147
M145
M146
M191
M148 M149
M151
M187
M240
M150
M239
M139
M136
M135
M190
M138
M137
M124
M131
M130
M129
M128
M113
M123
M127
M122
M125
M126
M215 M192
M225
M207
M186
M144
M185
M142
M195
M143
M180
M140
M141
M202
M228
M206
M230
M154-M173
M192/M193/M221-M238
M200-M219
M152
M153
M133
M134
M182
M132
M193
M121
M120
M119
M197 M175
M194
Figure A.1.: Reaction network implemented in the metabolic model for M. pneumoniae.Metabolites have oval shapes, while boxes display metabolic enzymes or en-zyme complexes. Blue colored metabolites are imported from the environ-ment, red colored metabolites are exported. The clickable version of themodel map is found in the MyMpn database, menu section ’pathway maps’,a larger version for take out at the very end of this thesis.
102

A.3. Figures
0
0.2
0.4
0.6
0.8
1
1.2
1.4
1.6
1.8
2
2.2
2.4
0
10
20
30
40
50
60
70
80
90
100
0 24 48 72 96 120 144 168 192
Protein (m
g)
Glucose, lactate, acetate, ethan
ol (m
M)
Glucose in mM
Lactate in mM
Actate in mM
Ethanol in mM
Protein in mg
Figure A.2.: Metabolite assays: Extracellular glucose and organic acid concentrations (lefty-axis), as well as protein concentration (right y-axis) during a four days batchculture growth experiment.
Figure A.3.: Conversion of nucleosides into nucleobases during sample preparation.
103

A. Chapter 3 Supplementary Material
0
2E+18
4E+18
6E+18
8E+18
1E+19
1.2E+19
1.4E+19
Ala Cys Asp Glu Phe Gly His Ile Lys Leu Met Asn Pro Gln Arg Ser Thr Val Trp Tyr
Num
ber of m
olecules
Amino acids in 3 mg protein
Amino acids in 100 ml growth medium
0
0.5
1
1.5
2
2.5
3
3.5
Glu Phe Arg Ala Pro Gly Leu Lys Asp Ile Asn Ser Met His Val Gln Trp Thr Tyr Cys
Molar con
centra1on
(mM)
Cytosol
Growth medium before
Growth medium aMer
A
B
Figure A.4.: Amino acid quantifications. A: Amino acid concentrations in the cytosol arehigher than in the growth medium suggesting active import. B: Amino acidsare not growth limiting.
others
C17
C18:3
C18:2
C18:1
C18
C16
Growth Medium Before
others C17
C18:3
C18:2
C18:1
C18
C16
Growth Medium After A B
Figure A.5.: Fatty acid composition. A: at the beginning (0h) and B: at the end (96h) ofa four days batch culture growth experiment.
104

A.3. Figures
Figure A.6.: Conserved FAD-binding fingerprint of the H2O-producing M. pneumoniaeNOX.
Figure A.7.: Analysis of heavy labeled carbon flux: Transparent blue arrows indicate gly-colysis and corresponding outfluxes towards lipid metabolism (left) and thepentose phosphate pathway (right). Experimental data (black circles) is welldescribed by single phase exponential decay functions for glycolytic com-pounds and for G1P (red rings). For G3P and R5P, two-phase exponentialdecay functions were fitted to the experimental data (green rings). See ta-bles A.16 & A.17 for all fitting parameters.
105

A. Chapter 3 Supplementary Material
67
79
543
not analyzed metabolic enzyems
analyzed metabolic enzymes
non-‐metabolic genes
A
0
20
40
60
80
100
120
Amino acid metabolism
CoA metabolism
Cofactor metabolism
Glycolysis Lipid metabolism
NucleoEde metabolism
One carbon pool by folate
Pentose phosphate pathway
Pyruvate metabolism
AlternaEve sugar
metabolism
Pathway enzyymes (%
)
Pathway
B
Figure A.8.: Alignment of qualitative changes of in vivo protein abundances and in silicofluxes during the exponential growth phase. A: Classification of M. pneu-moniae enzymes; blue - metabolic enzymes without available protein data oronly catalyzing metabolic reactions in complexes; red - metabolic enzymesfor which the concentration changes have been assigned to flux changes, thedark red shadow indicates those enzymes that show concentration changesthat qualitatively match the flux changes of their respective reactions (hitenzymes); grey - non-metabolic enzymes. B: Hit enzymes in percentage ofthe total number of enzymes involved in their respective pathways.
4.5
5
5.5
6
6.5
7
7.5
8
0
10
20
30
40
50
60
70
80
90
0 24 48 72 96 120 144 168 pH
met
abol
ite c
once
ntra
tion
(mM
)
time of growth (hours) lactate glucose lactate - re-buffered glucose - re-buffered pH re-buffering time
Figure A.9.: Glucose (red/orange) and lactic acid concentrations (blue/zyan) and themedium pH (grey triangles) for different time points of batch culture growth.At 96 hours the medium pH was re-buffered by NaOH titration to pH7.7(vertical black line). In normal batch culture growth without re-buffering themedium pH cell growth comes to a halt at about 96 hours of growth (glucose- red, lactic acid - blue). In re-buffered medium M. pneumoniae was able touse up the remaining glucose (orange), to produce further lactic acid (zyan)and, subsequently, to grow.
106

A.4. Tables
A.4. Tables
Table A.1: Reaction Listre-
reac- ver-tion ID in enzyme EC sibi-ID ’YUS’ equation gene ID (short) number pathway lityM001 R001/
R002D-glucose[e] + phosphoenolpyruvate[c] −→D-glucose 6-phosphate[c] + pyruvate[c]
MPN627/MPN207
PTSI/G 2.7.3.9/2.7.1.69
glycolysis I
M002 R003 [c]: D-glucose 6-phosphate ←→ D-fructose6-phosphate
MPN250 PGI 5.3.1.9 glycolysis R
M003 R004 [c]: D-fructose 6-phosphate + ATP −→ ADP+ D-fructose 1,6-bisphosphate + H+
MPN302 PFK 2.7.1.11 glycolysis I
M004 R005 [c]: D-fructose 1,6-bisphosphate ←→ dihy-droxyacetone phosphate + D-glyceraldehyde3-phosphate
MPN025 FBA 4.1.2.13 glycolysis R
M005 R006 [c]: D-glyceraldehyde 3-phosphate←→ dihy-droxyacetone phosphate
MPN629 TIM 5.3.1.1 glycolysis R
M006 R007 [c]: NAD+ + orthophosphate + D-glyceraldehyde 3-phosphate ←→ NADH +H+ + 1,3-bisphospho-D-glycerate
MPN430 GAPDH 1.2.1.12 glycolysis R
M007 R008 [c]: 3-phospho-D-glycerate + ATP←→ ADP+ 1,3-bisphospho-D-glycerate
MPN429 PGK 2.7.2.3 glycolysis R
M008 R009 [c]: 2-phospho-D-glycerate ←→ 3-phospho-D-glycerate
MPN628 PGM 5.4.2.1 glycolysis R
M009 R010 [c]: 2-phospho-D-glycerate ←→ phospho-enolpyruvate + H2O
MPN606 ENO 4.2.1.11 glycolysis R
M010 R011 [c]: ADP + phosphoenolpyruvate + H+ −→ATP + pyruvate
MPN303 PYK 2.7.1.40 glycolysis I
M011 R012 [c]: (S)-lactate + NAD+ ←→ NADH + H++ pyruvate
MPN674 LDH 1.1.1.27 pyruvatemetabolism
R
M012 R015 [c]: lipoamide + H+ + pyruvate −→ S-acetyldihydrolipoamide + CO2
MPN392/MPN393
PDH-E1 1.2.4.1 pyruvatemetabolism
I
M013 R016 [c]: acetyl-CoA + dihydrolipoamide ←→ S-acetyldihydrolipoamide + CoA
MPN391 PDH-E2 2.3.1.12 pyruvatemetabolism
R
M014 R017 [c]: dihydrolipoamide + NAD+ ←→lipoamide + NADH + H+
MPN390 PDH-E3 1.8.1.4 pyruvatemetabolism
R
M015 R018 [c]: acetyl-CoA + orthophosphate ←→acetyl phosphate + CoA
MPN428 PTA 2.3.1.8 pyruvatemetabolism
R
M016 R019 [c]: acetate + ATP←→ ADP + acetyl phos-phate
MPN533 ACK 2.7.2.1 pyruvatemetabolism
R
M017 R020 [c]: (2) NADH + oxygen + (2) H+ ←→ (2)H2O + (2) NAD+
MPN394 NOX 1.6.99.3 pyruvatemetabolism
R
M018 R190 (4) H+[e] + ADP[c] + orthophosphate[c]←→ H2O[c] + (3) H+[c] + ATP[c]
MPN597-MPN604
ATPase 3.6.3.14 Energymetabolism
R
M019 R021 D-fructose[e] + phosphoenolpyruvate[c] −→D-fructose 1-phosphate[c] + pyruvate[c]
MPN078 FRUA 2.7.1.69 Alternativesugarmetabolism
I
M020 R022 [c]: D-fructose 1-phosphate + ATP −→ ADP+ D-fructose 1,6-bisphosphate + H+
MPN079 FRUK 2.7.1.56 Alternativesugarmetabolism
I
M021 R023 [c]: D-fructose 1-phosphate −→ D-glyceraldehyde + dihydroxyacetone phos-phate
MPN025 FBA 4.1.2.13 Alternativesugarmetabolism
I
M022 R024 [c]: glycerol + NAD+←→ D-glyceraldehyde+ NADH + H+
MPN564 ADH 1.1.1.1 Alternativesugarmetabolism
R
M023 R026 D-mannose[e] + phosphoenolpyruvate[c] −→D-mannose 6-phosphate[c] + pyruvate[c]
MPN078 FRUA 2.7.1.69 Alternativesugarmetabolism
I
M024 R028 [c]: D-mannose 6-phosphate ←→ D-fructose6-phosphate
? MPI 5.3.1.8 Alternativesugarmetabolism
R
M025 R029 mannitol[e] + phosphoenolpyruvate[c] −→pyruvate[c] + D-mannitol 1-phosphate[c]
MPN651/MPN653
MTLA 2.7.1.69 Alternativesugarmetabolism
I
M026 R030 [c]: NAD+ + D-mannitol 1-phosphate ←→NADH + D-fructose 6-phosphate + H+
MPN652 MTLD 1.1.1.17 Alternativesugarmetabolism
R
M027 R031 L-ascorbate[e] + phosphoenolpyruvate[c] +(2) H+[c] −→ L-ascorbate 6-phosphate[c] +pyruvate[c]
MPN494-MPN496
PTSA 2.7.1.69 Alternativesugarmetabolism
I
M028 R032 [c]: H2O + L-ascorbate 6-phosphate ←→ 3-keto-L-gulonate 6-phosphate + (3) H+
MPN497 ULAG 3.1.1.- Alternativesugarmetabolism
R
M029 R033 [c]: 3-keto-L-gulonate 6-phosphate + H+−→ CO2 + L-xylulose 5-phosphate
MPN493 KGPDC 4.1.1.85 Alternativesugarmetabolism
I
M030 R034 [c]: L-ribulose 5-phosphate ←→ L-xylulose5-phosphate
MPN492 ULAE 5.1.3.22 Alternativesugarmetabolism
R
Continued on next page
107

A. Chapter 3 Supplementary Material
Table A.1 – continued from previous pagere-
reac- ver-tion ID in enzyme EC sibi-ID ’YUS’ equation gene ID (short) number pathway lityM031 R035 [c]: L-ribulose 5-phosphate ←→ D-xylulose
5-phosphateMPN498 ULAF 5.1.3.4 Alternative
sugarmetabolism
R
M032 R191 D-ribose[e] −→ D-ribose[c] MPN258-MPN260
RibABC 3.6.3.17 pentose phos-phate pathway
I
M033 R036 [c]: D-ribose + ATP −→ ADP + D-ribose5-phosphate + H+
? RBSK 2.7.1.15 pentose phos-phate pathway
I
M034 R037 [c]: D-fructose 6-phosphate + D-glyceraldehyde 3-phosphate ←→ D-xylulose5-phosphate + D-erythrose 4-phosphate
MPN082 TKL 2.2.1.1 pentose phos-phate pathway
R
M035 R038 [c]: sedoheptulose 7-phosphate + D-glyceraldehyde 3-phosphate ←→ D-erythrose 4-phosphate + D-fructose 6-phosphate
? TAL 2.2.1.2 pentose phos-phate pathway
R
M036 R039 [c]: sedoheptulose 7-phosphate + D-glyceraldehyde 3-phosphate ←→ D-xylulose5-phosphate + D-ribose 5-phosphate
MPN082 TKL 2.2.1.1 pentose phos-phate pathway
R
M037 R040 [c]: D-ribulose 5-phosphate ←→ D-xylulose5-phosphate
MPN251 RPE 5.1.3.1 pentose phos-phate pathway
R
M038 R041 [c]: D-ribose 5-phosphate ←→ D-ribulose 5-phosphate
MPN595 RPIA 5.3.1.6 pentose phos-phate pathway
R
M039 R042 [c]: D-ribose 5-phosphate + ATP −→ AMP+ 5-phospho-alpha-D-ribose 1-diphosphate+ H+
MPN073 PRPS 2.7.6.1 pentose phos-phate pathway
I
M040 R043 [c]: D-ribose 1-phosphate ←→ D-ribose 5-phosphate + (2) H+
MPN066 DEOB 5.4.2.7 pentose phos-phate pathway
R
M041 R044 [c]: 2-deoxy-D-ribose 1-phosphate ←→ 2-deoxy-D-ribose 5-phosphate
MPN066 DEOB 5.4.2.7 pentose phos-phate pathway
R
M042 R046 [c]: 2-deoxy-D-ribose 5-phosphate −→ ac-etaldehyde + D-glyceraldehyde 3-phosphate
MPN063 DERA 4.1.2.4 pentose phos-phate pathway
I
M043 R047 [c]: acetaldehyde + NAD+ + CoA ←→acetyl-CoA + NADH + H+
MPN564 ADH 1.2.1.10 Alternativesugarmetabolism
R
M044 R192 glycerol[c] ←→ glycerol[e] MPN043 GlpF - lipidmetabolism
R
M045 R049 [c]: glycerol + ATP −→ ADP + sn-glycerol3-phosphate + H+
MPN050 GK 2.7.1.30 lipidmetabolism
I
M046 R193 sn-glycerol 3-phosphate[e] + H2O[c] +ATP[c] −→ ADP[c] + orthophosphate[c] +H+[c] + sn-glycerol 3-phosphate[c]
MPN133-MPN136
GlyABC - lipidmetabolism
I
M047 R186 [c]: oxygen + sn-glycerol 3-phosphate ←→H2O2 + dihydroxyacetone phosphate
MPN051 GPO 1.1.3.21 lipidmetabolism
R
M048 R051 [c]: H2O + dihydroxyacetone phosphate −→dihydroxyacetone + orthophosphate
- - - lipidmetabolism
I
M049 R052 [c]: dihydroxyacetone + ATP −→ ADP +dihydroxyacetone phosphate + H+
MPN547 DHAK 2.7.1.29 lipidmetabolism
I
M050 R053 [c]: ACP-R (Mpn) + sn-glycerol 3-phosphate−→ 1-acyl-glycerol 3-phosphate (Mpn) +acyl carrier protein
MPN350/MPN546
GPAM 2.3.1.15 lipidmetabolism
I
M051 R054 [c]: ACP-R (Mpn) + 1-acyl-glycerol 3-phosphate (Mpn) −→ phosphatidic acid(Mpn) + acyl carrier protein
MPN299 AGPAT 2.3.1.51 lipidmetabolism
I
M052 R055 [c]: phosphatidic acid (Mpn) + CTP + H+−→ CDP-diacylglycerol (Mpn) + pyrophos-phate
MPN637 CDP-DG
2.7.7.41 lipidmetabolism
I
M053 R056 [c]: CDP-diacylglycerol (Mpn) + sn-glycerol3-phosphate −→ CMP + phosphatidylglyc-erol 3-phosphate (Mpn) + H+
MPN253 PGP 2.7.8.5 lipidmetabolism
I
M054 R057 [c]: H2O + phosphatidylglycerol 3-phosphate (Mpn) −→ orthophosphate+ phosphatidylglycerol (Mpn)
? PGPB 3.1.3.27 lipidmetabolism
I
M055 R058 [c]: CDP-diacylglycerol (Mpn) + phos-phatidylglycerol (Mpn) −→ cardiolipin(Mpn) + CMP + H+
? CLS 2.7.8.- lipidmetabolism
I
M056 R059 [c]: H2O + phosphatidic acid (Mpn) −→ di-acylglycerol (Mpn) + orthophosphate
MPN455 PPT 3.1.3.4 lipidmetabolism
I
M057 R060 [c]: D-glucose 1-phosphate ←→ D-glucose 6-phosphate
MPN066 PGM 5.4.2.2 lipidmetabolism
R
M058 R061 [c]: D-glucose 1-phosphate + UTP + H+←→ UDP-glucose + pyrophosphate
MPN667 UGP 2.7.7.9 lipidmetabolism
R
M059 R062 [c]: UDP-glucose ←→ UDP-galactose MPN257 UGE 5.1.3.2 lipidmetabolism
R
M060 R063/R064
[c]: diacylglycerol (Mpn) + (3) UDP-galactose + (3) UDP-glucose −→ glycolipid(Mpn) + (6) H+ + (6) UDP
MPN483 GTF - lipidmetabolism
I
M061 R178 [c]: choline + ATP −→ ADP + H+ + cholinephosphate
MPN532 CHK 2.7.1.32 lipidmetabolism
I
M062 R180 [c]: CTP + H+ + choline phosphate −→CDP-choline + pyrophosphate
MPN336 PCT 2.7.7.15 lipidmetabolism
I
Continued on next page
108

A.4. Tables
Table A.1 – continued from previous pagere-
reac- ver-tion ID in enzyme EC sibi-ID ’YUS’ equation gene ID (short) number pathway lityM063 R182 [c]: sn-glycero-3-phosphocholine + H2O←→
choline + sn-glycerol 3-phosphate + H+MPN420 GlpQ 3.1.4.46 lipid
metabolismR
M064 R187 [c]: phosphatidylcholine + (2) H2O ←→sn-glycero-3-phosphocholine + (2) fatty acid(Mpn)
MPN445 PldB 3.1.1.5 lipidmetabolism
R
M065 R065 [c]: AMP + pyrophosphate ←→ adenine +5-phospho-alpha-D-ribose 1-diphosphate
MPN395 APRT 2.4.2.7 nucleotidemetabolism
R
M066 R066 [c]: adenosine + orthophosphate + (2) H+←→ D-ribose 1-phosphate + adenine
MPN062 PNP 2.4.2.1 nucleotidemetabolism
R
M067 R067 [c]: H2O + AMP −→ adenosine + or-thophosphate
? NT5 3.1.3.5 nucleotidemetabolism
I
M068 R068 [c]: AMP + ATP ←→ (2) ADP MPN185 AK 2.7.4.3 nucleotidemetabolism
R
M069 R069 [c]: ADP + reduced thioredoxin −→ dADP+ H2O + oxidized thioredoxin
MPN322-MPN324
RDR 1.17.4.1 nucleotidemetabolism
I
M070 R070 [c]: oxidized thioredoxin + H+ + NADPH←→ NADP+ + reduced thioredoxin
MPN240 TXNRD 1.8.1.9 nucleotidemetabolism
R
M071 R071/R084/R099/R104
[c]: (28) GTP + (25) UTP + (40) H2O +(18) CTP + (69) ATP −→ (40) ADP + RNA(Mpn) + (40) orthophosphate + (40) H+ +(100) pyrophosphate
MPN516 RNAP - nucleotidemetabolism
I
M072 R072 [c]: H2O + pyrophosphate −→ (2) or-thophosphate + H+
MPN528 PPA 3.6.1.1 nucleotidemetabolism
I
M073 R073 [c]: deoxyadenosine + orthophosphate ←→2-deoxy-D-ribose 1-phosphate + adenine
MPN062 PNP 2.4.2.1 nucleotidemetabolism
R
M074 R074 [c]: deoxyadenosine + ATP ←→ ADP + H++ dAMP
MPN386 DAK 2.7.1.76 nucleotidemetabolism
R
M075 R075 [c]: dAMP + ATP ←→ dADP + ADP MPN185 AK 2.7.4.3 nucleotidemetabolism
R
M076 R076 [c]: phosphoenolpyruvate + dADP + H+−→ dATP + pyruvate
MPN303 PYK 2.7.1.40 nucleotidemetabolism
I
M077 R175 [c]: 3-phospho-D-glycerate + dATP ←→dADP + 1,3-bisphospho-D-glycerate
MPN429 PGK 2.7.2.3 nucleotidemetabolism
R
M078 R077/R089/R110/R120
[c]: (20) dGTP + (140) H2O + (30) dTTP+ (20) dCTP + (140) ATP + (30) dATP−→ (140) ADP + DNA (Mpn) + (140) or-thophosphate + (140) H+ + (100) pyrophos-phate
MPN034/MPN378
DNAP - nucleotidemetabolism
I
M079 R078 [c]: GMP + pyrophosphate ←→ 5-phospho-alpha-D-ribose 1-diphosphate + guanine
MPN672 HPRT 2.4.2.8 nucleotidemetabolism
R
M080 R079 [c]: guanosine + orthophosphate + (2) H+←→ D-ribose 1-phosphate + guanine
MPN062 PNP 2.4.2.1 nucleotidemetabolism
R
M081 R080 [c]: GMP + H2O −→ guanosine + or-thophosphate
? NT5 3.1.3.5 nucleotidemetabolism
I
M082 R081 [c]: GMP + ATP ←→ ADP + GDP MPN246 GUK 2.7.4.8 nucleotidemetabolism
R
M083 R082 [c]: reduced thioredoxin + GDP −→ H2O +oxidized thioredoxin + dGDP
MPN322-MPN324
RDR 1.17.4.1 nucleotidemetabolism
I
M084 R083 [c]: phosphoenolpyruvate + H+ + GDP −→GTP + pyruvate
MPN303 PYK 2.7.1.40 nucleotidemetabolism
I
M085 R176 [c]: GTP + 3-phospho-D-glycerate ←→GDP + 1,3-bisphospho-D-glycerate
MPN429 PGK 2.7.2.3 nucleotidemetabolism
R
M086 R085 [c]: deoxyguanosine + orthophosphate ←→2-deoxy-D-ribose 1-phosphate + guanine
MPN062 PNP 2.4.2.1 nucleotidemetabolism
R
M087 R086 [c]: deoxyguanosine + ATP←→ ADP + H++ dGMP
MPN386 DGK 2.7.1.113 nucleotidemetabolism
R
M088 R087 [c]: ATP + dGMP ←→ ADP + dGDP MPN246 GUK 2.7.4.8 nucleotidemetabolism
R
M089 R088 [c]: phosphoenolpyruvate + dGDP + H+−→ dGTP + pyruvate
MPN303 PYK 2.7.1.40 nucleotidemetabolism
I
M090 R177 [c]: 3-phospho-D-glycerate + dGTP ←→dGDP + 1,3-bisphospho-D-glycerate
MPN429 PGK 2.7.2.3 nucleotidemetabolism
R
M091 R090 [c]: UMP + pyrophosphate ←→ uracil + 5-phospho-alpha-D-ribose 1-diphosphate
MPN033 UPRT 2.4.2.9 nucleotidemetabolism
R
M092 R091 [c]: orthophosphate + (2) H+ + uridine←→uracil + D-ribose 1-phosphate
MPN064 UPP 2.4.2.3 nucleotidemetabolism
R
M093 R092 [c]: H2O + UMP −→ orthophosphate + uri-dine
? NT5 3.1.3.5 nucleotidemetabolism
I
M094 R093 [c]: ATP + uridine −→ ADP + UMP + H+ MPN561 UCK 2.7.1.48 nucleotidemetabolism
I
M095 R094 [c]: UMP + ATP ←→ ADP + UDP MPN632 UMPK 2.7.4.22 nucleotidemetabolism
R
M096 R095 [c]: phosphoenolpyruvate + H+ + UDP −→UTP + pyruvate
MPN303 PYK 2.7.1.40 nucleotidemetabolism
I
M097 R096 [c]: reduced thioredoxin + UDP −→ H2O +oxidized thioredoxin + dUDP
MPN322-MPN324
RDR 1.17.4.1 nucleotidemetabolism
I
M098 R097 [c]: cytidine + H2O −→ NH3 + uridine MPN065 CDA 3.5.4.5 nucleotidemetabolism
I
M099 R100 [c]: cytidine + ATP −→ ADP + CMP + H+ MPN561 UCK 2.7.1.48 nucleotidemetabolism
I
Continued on next page
109

A. Chapter 3 Supplementary Material
Table A.1 – continued from previous pagere-
reac- ver-tion ID in enzyme EC sibi-ID ’YUS’ equation gene ID (short) number pathway lityM100 R101 [c]: H2O + CMP −→ cytidine + orthophos-
phate? NT5 3.1.3.5 nucleotide
metabolismI
M101 R102 [c]: CMP + ATP ←→ ADP + CDP MPN476 CMPK 2.7.4.14 nucleotidemetabolism
R
M102 R103 [c]: phosphoenolpyruvate + CDP + H+ −→CTP + pyruvate
MPN303 PYK 2.7.1.40 nucleotidemetabolism
I
M103 R105 [c]: CDP + reduced thioredoxin −→ H2O +oxidized thioredoxin + dCDP
MPN322-MPN324
RDR 1.17.4.1 nucleotidemetabolism
I
M104 R106 [c]: deoxycytidine + ATP −→ ADP + dCMP+ H+
MPN386 DCK 2.7.1.74 nucleotidemetabolism
I
M105 R107 [c]: H2O + dCMP −→ deoxycytidine + or-thophosphate
? NT5 3.1.3.5 nucleotidemetabolism
I
M106 R108 [c]: dCMP + ATP ←→ ADP + dCDP MPN476 CMPK 2.7.4.14 nucleotidemetabolism
R
M107 R109 [c]: phosphoenolpyruvate + dCDP + H+−→ dCTP + pyruvate
MPN303 PYK 2.7.1.40 nucleotidemetabolism
I
M108 R174 [c]: H2O + deoxycytidine −→ deoxyuridine+ NH3
MPN065 CDA 3.5.4.5 nucleotidemetabolism
I
M109 R111 [c]: deoxyuridine + orthophosphate ←→uracil + 2-deoxy-D-ribose 1-phosphate
MPN064 UPP 2.4.2.3 nucleotidemetabolism
R
M110 R112 [c]: deoxyuridine + ATP −→ ADP + dUMP+ H+
MPN044 TK 2.7.1.21 nucleotidemetabolism
I
M111 R113 [c]: H2O + dUMP −→ deoxyuridine + or-thophosphate
? NT5 3.1.3.5 nucleotidemetabolism
I
M112 R189 [c]: dUMP + ATP ←→ ADP + dUDP MPN006 TMPK 2.7.4.9 nucleotidemetabolism
R
M113 R114 [c]: 5,10-methylenetetrahydrofolate +dUMP ←→ dTMP + dihydrofolate
MPN320 THY 2.1.1.45 nucleotidemetabolism
R
M114 R115 [c]: thymidine + orthophosphate ←→ 2-deoxy-D-ribose 1-phosphate + thymine
MPN064 UPP 2.4.2.4 nucleotidemetabolism
R
M115 R116 [c]: thymidine + ATP −→ ADP + dTMP +H+
MPN044 TK 2.7.1.21 nucleotidemetabolism
I
M116 R117 [c]: H2O + dTMP −→ thymidine + or-thophosphate
? NT5 3.1.3.5 nucleotidemetabolism
I
M117 R118 [c]: dTMP + ATP ←→ ADP + dTDP MPN006 TMPK 2.7.4.9 nucleotidemetabolism
R
M118 R119 [c]: phosphoenolpyruvate + dTDP + H+−→ dTTP + pyruvate
MPN303 PYK 2.7.1.40 nucleotidemetabolism
I
M119 R121/R122
[c]: L-arginine + H2O −→ NH3 + L-citrulline + H+
MPN304/MPN305;MPN560
ArcA 3.5.3.6 amino acidmetabolism
I
M120 R123 [c]: carbamoyl phosphate + L-ornithine←→orthophosphate + H+ + L-citrulline
MPN306 OTC 2.1.3.3 amino acidmetabolism
R
M121 R124 [c]: CO2 + NH3 + ATP ←→ ADP + car-bamoyl phosphate + H+
MPN307 Ckase 2.7.2.2 amino acidmetabolism
R
M122 R125/R194
[c]: NAD+ + dihydrofolate ←→ NADH +folic acid
MPN321;MPN300
DHFR 1.5.1.3 one carbonpool by folate
R
M123 R126/R195
[c]: tetrahydrofolate + NAD+←→ NADH +dihydrofolate + H+
MPN321;MPN300
DHFR 1.5.1.3 one carbonpool by folate
R
M124 R127 [c]: tetrahydrofolate + ATP + for-mate −→ ADP + orthophosphate + 10-formyltetrahydrofolate
MPN017 FHS 6.3.4.3 one carbonpool by folate
I
M125 R128 [c]: H2O + 5,10-methenyltetrahydrofolate←→ 10-formyltetrahydrofolate
MPN017 MTHFC 3.5.4.9 one carbonpool by folate
R
M126 R129 [c]: L-methionyl-tRNA(Met) + 10-formyltetrahydrofolate −→ tetrahydrofolate+ N-formylmethionyl-tRNA(Met)
MPN543 MTFMT 2.1.2.9 one carbonpool by folate
I
M127 R130 [c]: glycine + H2O + 5,10-methylenetetrahydrofolate ←→ tetrahy-drofolate + L-serine
MPN576 SHMT 2.1.2.1 one carbonpool by folate
R
M128 R131 [c]: NADP+ + 5,10-methylenetetrahydrofolate ←→ H+ +5,10-methenyltetrahydrofolate + NADPH
MPN017 MTHFD 1.5.1.5 one carbonpool by folate
R
M129 R132 [c]: ATP + 5-formyltetrahydrofolate −→ADP + orthophosphate + (2) H+ + 5,10-methenyltetrahydrofolate
MPN348 MTHFS 6.3.3.2 one carbonpool by folate
I
M130 R185 [c]: H2O + H+ + 5,10-methenyltetrahydrofolate −→ 5-formyltetrahydrofolate
MPN576 MTHFH ? one carbonpool by folate
I
M131 R181 [c]: NAD+ + formate ←→ CO2 + NADH ? FDH 1.2.1.2 one carbonpool by folate
R
M132 R133 [c]: H2O + ATP + L-methionine −→orthophosphate + pyrophosphate + S-adenosyl-L-methionine
MPN060 MAT 2.5.1.6 amino acidmetabolism
I
M133 R134 [c]: DNA (Mpn) + S-adenosyl-L-methionine−→ 5mcDNA (Mpn) + S-adenosyl-L-homocysteine
MPN108 DCM 2.1.1.37 amino acidmetabolism
I
M134 R135 [c]: H2O + S-adenosyl-L-homocysteine −→L-homocysteine + adenosine
? AHC 3.3.1.1 amino acidmetabolism
I
Continued on next page
110

A.4. Tables
Table A.1 – continued from previous pagere-
reac- ver-tion ID in enzyme EC sibi-ID ’YUS’ equation gene ID (short) number pathway lityM135 R136 [c]: nicotinate D-ribonucleotide + pyrophos-
phate ←→ nicotinate + 5-phospho-alpha-D-ribose 1-diphosphate + H+
MPN047 PNCB 2.4.2.12 cofactormetabolism
R
M136 R137 [c]: nicotinate D-ribonucleotide + H+ +ATP ←→ deamino-NAD+ + pyrophosphate
MPN336 NADD 2.7.7.18 cofactormetabolism
R
M137 R138 [c]: deamino-NAD+ + NH3 + ATP −→AMP + NAD+ + pyrophosphate
MPN562 NADE 6.3.1.5 cofactormetabolism
I
M138 R139 [c]: NAD+ + ATP −→ ADP + NADP+ +H+
MPN267 NADK 2.7.1.23 cofactormetabolism
I
M139 R173 [c]: NADH + ATP −→ ADP + H+ +NADPH
MPN267 NADK 2.7.1.23 cofactormetabolism
I
M140 R140 [c]: riboflavin + ATP −→ ADP + FMN +H+
MPN158 RFK 2.7.1.26 cofactormetabolism
I
M141 R141 [c]: FMN + H+ + ATP −→ pyrophosphate+ FAD
MPN158 FAD 2.7.7.2 cofactormetabolism
I
M142 R142 [c]: pyridoxal + ATP −→ ADP + pyridoxalphosphate + H+
? PDXK 2.7.1.35 cofactormetabolism
I
M143 R143 [c]: ATP + thiamin −→ ADP + H+ + thi-amin monophosphate
? THIK 2.7.1.89 cofactormetabolism
I
M144 R144 [c]: thiamin monophosphate + ATP −→ADP + thiamin diphosphate
MPN550 THIL 2.7.4.16 cofactormetabolism
I
M145 R145 [c]: pantetheine + ATP −→ ADP + H+ +pantetheine 4-phosphate
? PANK 2.7.1.33 CoAmetabolism
I
M146 R146 [c]: H+ + ATP + pantetheine 4-phosphate−→ pyrophosphate + dephospho-CoA
MPN336 COASY 2.7.7.3 CoAmetabolism
I
M147 R147 [c]: ATP + dephospho-CoA −→ ADP + CoA+ H+
MPN382 COAE 2.7.1.24 CoAmetabolism
I
M148 R148 [c]: apoprotein [acyl carrier protein] + CoA−→ adenosine 3’,5’-bisphosphate + acyl car-rier protein + H+
MPN298 ACPS 2.7.8.7 CoAmetabolism
I
M149 R149 [c]: H2O + acyl carrier protein −→ apopro-tein [acyl carrier protein] + H+ + panteth-eine 4-phosphate
MPN479 ACPH 3.1.4.14 CoAmetabolism
I
M150 R188 [c]: H2O + adenosine 3’,5’-bisphosphate −→AMP + orthophosphate
? BPNT 3.1.3.7 CoAmetabolism
I
M151 R150 [c]: fatty acid (Mpn) + acyl carrier protein+ ATP −→ ACP-R (Mpn) + AMP + H+ +pyrophosphate
? AAS 6.2.1.20 CoAmetabolism
I
M152 R151 [c]: H2O + L-glutamyl-tRNA(Gln) +L-asparagine + ATP −→ L-glutaminyl-tRNA(Gln) + ADP + orthophosphate + H++ L-aspartate
MPN236-MPN238
GAT 6.3.5.7 amino acidmetabolism
I
M153 R152 [c]: L-glutamine + H2O + L-glutamyl-tRNA(Gln) + ATP −→ L-glutaminyl-tRNA(Gln) + ADP + L-glutamate + or-thophosphate + H+
MPN236-MPN238
GAT 6.3.5.7 amino acidmetabolism
I
M154 R153 [c]: tRNA(Met) + L-methionine + ATP−→ L-methionyl-tRNA(Met) + AMP + py-rophosphate
MPN023 METS 6.1.1.10 amino acidmetabolism
I
M155 R154 [c]: tRNA(Ile) + L-isoleucine + ATP −→L-isoleucyl-tRNA(Ile) + AMP + pyrophos-phate
MPN520 ILES 6.1.1.5 amino acidmetabolism
I
M156 R155 [c]: tRNA(Val) + L-valine + ATP −→ L-valyl-tRNA(Val) + AMP + pyrophosphate
MPN480 VALS 6.1.1.9 amino acidmetabolism
I
M157 R156 [c]: tRNA(Leu) + L-leucine + ATP −→AMP + L-leucyl-tRNA(Leu) + pyrophos-phate
MPN384 LEUS 6.1.1.4 amino acidmetabolism
I
M158 R157 [c]: tRNA(Cys) + ATP + L-cysteine−→ AMP + pyrophosphate + L-cysteinyl-tRNA(Cys)
MPN356 CYSS 6.1.1.16 amino acidmetabolism
I
M159 R158 [c]: tRNA(Glu) + L-glutamate + ATP −→L-glutamyl-tRNA(Glu) + AMP + pyrophos-phate
MPN678 GLTX 6.1.1.17 amino acidmetabolism
I
M160 R159 [c]: L-glutamate + ATP + tRNA(Gln) −→L-glutamyl-tRNA(Gln) + AMP + pyrophos-phate
MPN678 GLTX 6.1.1.17 amino acidmetabolism
I
M161 R160 [c]: L-arginine + tRNA(Arg) + ATP −→AMP + L-arginyl-tRNA(Arg) + pyrophos-phate
MPN556 ARGS 6.1.1.19 amino acidmetabolism
I
M162 R161 [c]: L-tyrosine + tRNA(Tyr) + ATP −→AMP + L-tyrosyl-tRNA(Tyr) + pyrophos-phate
MPN669 TYRS 6.1.1.1 amino acidmetabolism
I
M163 R162 [c]: tRNA(Trp) + L-tryptophan + ATP −→AMP + L-tryptophanyl-tRNA(Trp) + py-rophosphate
MPN265 TRPS 6.1.1.2 amino acidmetabolism
I
M164 R163 [c]: tRNA(Ser) + L-serine + ATP −→ L-seryl-tRNA(Ser) + AMP + pyrophosphate
MPN005 SERS 6.1.1.11 amino acidmetabolism
I
M165 R164 [c]: L-threonine + tRNA(Thr) + ATP −→AMP + L-threonyl-tRNA(Thr) + pyrophos-phate
MPN553 THRS 6.1.1.3 amino acidmetabolism
I
Continued on next page
111

A. Chapter 3 Supplementary Material
Table A.1 – continued from previous pagere-
reac- ver-tion ID in enzyme EC sibi-ID ’YUS’ equation gene ID (short) number pathway lityM166 R165 [c]: tRNA(Pro) + ATP + L-proline −→ L-
prolyl-tRNA(Pro) + AMP + pyrophosphateMPN402 PROS 6.1.1.15 amino acid
metabolismI
M167 R166 [c]: tRNA(Asp) + L-aspartate + ATP −→AMP + L-aspartyl-tRNA(Asp) + pyrophos-phate
MPN046 ASPS 6.1.1.12 amino acidmetabolism
I
M168 R167 [c]: tRNA(Asn) + L-asparagine + ATP−→ AMP + L-asparaginyl-tRNA(Asn) + py-rophosphate
MPN252 ASNS 6.1.1.22 amino acidmetabolism
I
M169 R168 [c]: tRNA(Lys) + L-lysine + ATP −→ AMP+ pyrophosphate + L-lysyl-tRNA(Lys)
MPN277 LYSS 6.1.1.6 amino acidmetabolism
I
M170 R169 [c]: L-histidine + ATP + tRNA(His) −→AMP + L-histidyl-tRNA(His) + pyrophos-phate
MPN045 HISS 6.1.1.21 amino acidmetabolism
I
M171 R170 [c]: tRNA(Phe) + L-phenylalanine + ATP−→ AMP + L-phenylalanyl-tRNA(Phe) +pyrophosphate
MPN105/MPN106
PHES 6.1.1.20 amino acidmetabolism
I
M172 R171 [c]: L-alanine + tRNA(Ala) + ATP −→ L-alanyl-tRNA(Ala) + AMP + pyrophosphate
MPN418 ALAS 6.1.1.7 amino acidmetabolism
I
M173 R172 [c]: glycine + tRNA(Gly) + ATP −→ glycyl-tRNA(Gly) + AMP + pyrophosphate
MPN354 GLYS 6.1.1.14 amino acidmetabolism
I
M174 - [c]: (100) H2O + RNA (Mpn) −→ (28) GMP+ (29) AMP + (18) CMP + (25) UMP +(100) H+
- - - nucleotidemetabolism
I
M175 - CO2[e] ←→ CO2[c] ? - - cofactormetabolism
R
M176 - uracil[e] + H+[e] ←→ uracil[c] + H+[c] ? - - nucleotidemetabolism
R
M177 - thymine[e] + H+[e] −→ thymine[c] + H+[c] ? - - nucleotidemetabolism
I
M178 - (S)-lactate[c] + H+[c] −→ (S)-lactate[e] +H+[e]
? - - pyruvatemetabolism
I
M179 - oxygen[e] ←→ oxygen[c] ? - - cofactormetabolism
R
M180 - riboflavin[e] −→ riboflavin[c] ? - - cofactormetabolism
I
M181 - cytidine[e] + H+[e] ←→ cytidine[c] + H+[c] ? - - nucleotidemetabolism
R
M182 - L-homocysteine[c] −→ L-homocysteine[e] ? - - amino acidmetabolism
I
M183 - guanine[e] + H+[e] −→ guanine[c] + H+[c] ? - - nucleotidemetabolism
I
M184 - H2O2[e] ←→ H2O2[c] ? - - cofactormetabolism
R
M185 - pyridoxal[e] −→ pyridoxal[c] ? - - cofactormetabolism
I
M186 - folic acid[e] −→ folic acid[c] ? - - one carbonpool by folate
I
M187 - fatty acid (Mpn)[e] ←→ fatty acid (Mpn)[c] ? - - CoAmetabolism
R
M188 - H2O[e] ←→ H2O[c] ? - - cofactormetabolism
R
M189 - adenine[c] + H+[c] ←→ adenine[e] + H+[e] ? - - nucleotidemetabolism
R
M190 - nicotinate[e] −→ nicotinate[c] ? - - cofactormetabolism
I
M191 - pantetheine[e] −→ pantetheine[c] ? - - CoAmetabolism
I
M192 - L-serine[e] + H2O[c] + ATP[c] −→ ADP[c]+ L-serine[c] + orthophosphate[c] + H+[c]
? - - one carbonpool by folate
I
M193 - L-methionine[e] + H2O[c] + ATP[c]−→ ADP[c] + orthophosphate[c] + L-methionine[c] + H+[c]
? - - amino acidmetabolism
I
M194 - NH3[c] ←→ NH3[e] ? - - cofactormetabolism
R
M195 - thiamin[e] + H2O[c] + ATP[c] −→ ADP[c]+ orthophosphate[c] + H+[c] + thiamin[c]
? - - cofactormetabolism
I
M196 - H+[e] + choline[e] ←→ H+[c] + choline[c] ? - - lipidmetabolism
R
M197 - L-arginine[e] + L-ornithine[c] ←→ L-ornithine[e] + L-arginine[c]
? - - amino acidmetabolism
R
M198 - H+[c] + acetate[c] −→ H+[e] + acetate[e] ? - - pyruvatemetabolism
I
M199 - phosphatidylcholine[e] + ATP[c] + H2O[c]−→ phosphatidylcholine[c] + ADP[c] + or-thophosphate[c] + H+[c]
? - - lipidmetabolism
I
M200 - L-alanine[c] + H+[c] −→ L-alanine[e] +H+[e]
? - - amino acidmetabolism
I
M201 - L-arginine[c] + H+[c] −→ L-arginine[e] +H+[e]
? - - amino acidmetabolism
I
Continued on next page
112
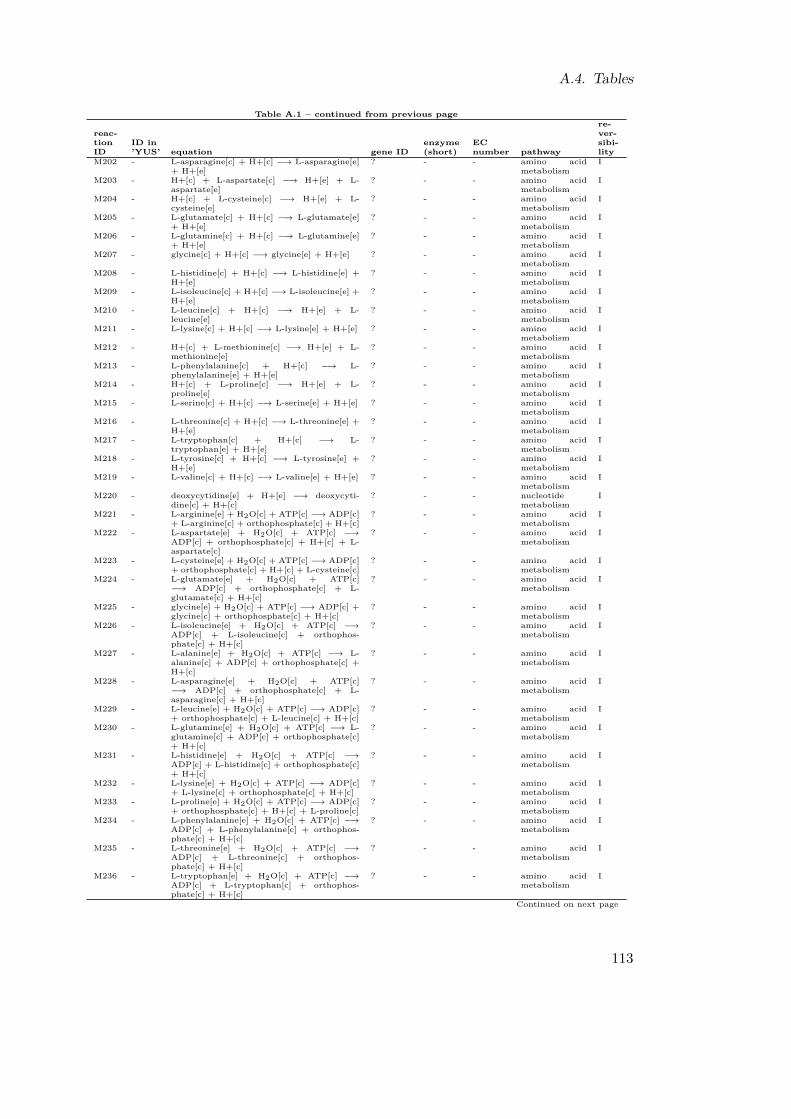
A.4. Tables
Table A.1 – continued from previous pagere-
reac- ver-tion ID in enzyme EC sibi-ID ’YUS’ equation gene ID (short) number pathway lityM202 - L-asparagine[c] + H+[c] −→ L-asparagine[e]
+ H+[e]? - - amino acid
metabolismI
M203 - H+[c] + L-aspartate[c] −→ H+[e] + L-aspartate[e]
? - - amino acidmetabolism
I
M204 - H+[c] + L-cysteine[c] −→ H+[e] + L-cysteine[e]
? - - amino acidmetabolism
I
M205 - L-glutamate[c] + H+[c] −→ L-glutamate[e]+ H+[e]
? - - amino acidmetabolism
I
M206 - L-glutamine[c] + H+[c] −→ L-glutamine[e]+ H+[e]
? - - amino acidmetabolism
I
M207 - glycine[c] + H+[c] −→ glycine[e] + H+[e] ? - - amino acidmetabolism
I
M208 - L-histidine[c] + H+[c] −→ L-histidine[e] +H+[e]
? - - amino acidmetabolism
I
M209 - L-isoleucine[c] + H+[c] −→ L-isoleucine[e] +H+[e]
? - - amino acidmetabolism
I
M210 - L-leucine[c] + H+[c] −→ H+[e] + L-leucine[e]
? - - amino acidmetabolism
I
M211 - L-lysine[c] + H+[c] −→ L-lysine[e] + H+[e] ? - - amino acidmetabolism
I
M212 - H+[c] + L-methionine[c] −→ H+[e] + L-methionine[e]
? - - amino acidmetabolism
I
M213 - L-phenylalanine[c] + H+[c] −→ L-phenylalanine[e] + H+[e]
? - - amino acidmetabolism
I
M214 - H+[c] + L-proline[c] −→ H+[e] + L-proline[e]
? - - amino acidmetabolism
I
M215 - L-serine[c] + H+[c] −→ L-serine[e] + H+[e] ? - - amino acidmetabolism
I
M216 - L-threonine[c] + H+[c] −→ L-threonine[e] +H+[e]
? - - amino acidmetabolism
I
M217 - L-tryptophan[c] + H+[c] −→ L-tryptophan[e] + H+[e]
? - - amino acidmetabolism
I
M218 - L-tyrosine[c] + H+[c] −→ L-tyrosine[e] +H+[e]
? - - amino acidmetabolism
I
M219 - L-valine[c] + H+[c] −→ L-valine[e] + H+[e] ? - - amino acidmetabolism
I
M220 - deoxycytidine[e] + H+[e] −→ deoxycyti-dine[c] + H+[c]
? - - nucleotidemetabolism
I
M221 - L-arginine[e] + H2O[c] + ATP[c] −→ ADP[c]+ L-arginine[c] + orthophosphate[c] + H+[c]
? - - amino acidmetabolism
I
M222 - L-aspartate[e] + H2O[c] + ATP[c] −→ADP[c] + orthophosphate[c] + H+[c] + L-aspartate[c]
? - - amino acidmetabolism
I
M223 - L-cysteine[e] + H2O[c] + ATP[c] −→ ADP[c]+ orthophosphate[c] + H+[c] + L-cysteine[c]
? - - amino acidmetabolism
I
M224 - L-glutamate[e] + H2O[c] + ATP[c]−→ ADP[c] + orthophosphate[c] + L-glutamate[c] + H+[c]
? - - amino acidmetabolism
I
M225 - glycine[e] + H2O[c] + ATP[c] −→ ADP[c] +glycine[c] + orthophosphate[c] + H+[c]
? - - amino acidmetabolism
I
M226 - L-isoleucine[e] + H2O[c] + ATP[c] −→ADP[c] + L-isoleucine[c] + orthophos-phate[c] + H+[c]
? - - amino acidmetabolism
I
M227 - L-alanine[e] + H2O[c] + ATP[c] −→ L-alanine[c] + ADP[c] + orthophosphate[c] +H+[c]
? - - amino acidmetabolism
I
M228 - L-asparagine[e] + H2O[c] + ATP[c]−→ ADP[c] + orthophosphate[c] + L-asparagine[c] + H+[c]
? - - amino acidmetabolism
I
M229 - L-leucine[e] + H2O[c] + ATP[c] −→ ADP[c]+ orthophosphate[c] + L-leucine[c] + H+[c]
? - - amino acidmetabolism
I
M230 - L-glutamine[e] + H2O[c] + ATP[c] −→ L-glutamine[c] + ADP[c] + orthophosphate[c]+ H+[c]
? - - amino acidmetabolism
I
M231 - L-histidine[e] + H2O[c] + ATP[c] −→ADP[c] + L-histidine[c] + orthophosphate[c]+ H+[c]
? - - amino acidmetabolism
I
M232 - L-lysine[e] + H2O[c] + ATP[c] −→ ADP[c]+ L-lysine[c] + orthophosphate[c] + H+[c]
? - - amino acidmetabolism
I
M233 - L-proline[e] + H2O[c] + ATP[c] −→ ADP[c]+ orthophosphate[c] + H+[c] + L-proline[c]
? - - amino acidmetabolism
I
M234 - L-phenylalanine[e] + H2O[c] + ATP[c] −→ADP[c] + L-phenylalanine[c] + orthophos-phate[c] + H+[c]
? - - amino acidmetabolism
I
M235 - L-threonine[e] + H2O[c] + ATP[c] −→ADP[c] + L-threonine[c] + orthophos-phate[c] + H+[c]
? - - amino acidmetabolism
I
M236 - L-tryptophan[e] + H2O[c] + ATP[c] −→ADP[c] + L-tryptophan[c] + orthophos-phate[c] + H+[c]
? - - amino acidmetabolism
I
Continued on next page
113

A. Chapter 3 Supplementary Material
Table A.1 – continued from previous pagere-
reac- ver-tion ID in enzyme EC sibi-ID ’YUS’ equation gene ID (short) number pathway lityM237 - L-tyrosine[e] + H2O[c] + ATP[c] −→ ADP[c]
+ L-tyrosine[c] + orthophosphate[c] + H+[c]? - - amino acid
metabolismI
M238 - L-valine[e] + H2O[c] + ATP[c] −→ ADP[c]+ L-valine[c] + orthophosphate[c] + H+[c]
? - - amino acidmetabolism
I
M239 - orthophosphate[e] + H2O[c] + ATP[c] −→ADP[c] + (2) orthophosphate[c] + H+[c]
MPN609-MPN611
- - cofactormetabolism
I
M240 - orthophosphate[c] −→ orthophosphate[e] ? - - cofactormetabolism
I
M241 - [e]: (S)-lactate −→ - - - sink/source IM242 - [c]: 5mcDNA (Mpn) −→ - - - sink/source IM243 - [e]: acetate −→ - - - sink/source IM244 - [e]: adenine ←→ - - - sink/source RM245 - [c]: adenosine 3’,5’-bisphosphate −→ - - - sink/source IM246 - [e]: biomass −→ - - - sink/source RM247 - [e]: CO2 ←→ - - - sink/source RM248 - [e]: glycine ←→ - - - sink/source RM249 - [e]: H2O2 −→ - - - sink/source IM250 - [e]: L-alanine ←→ - - - sink/source RM251 - [e]: L-arginine ←→ - - - sink/source RM252 - [e]: L-asparagine ←→ - - - sink/source RM253 - [e]: L-aspartate ←→ - - - sink/source RM254 - [e]: L-cysteine ←→ - - - sink/source RM255 - [e]: L-glutamate ←→ - - - sink/source RM256 - [e]: L-glutamine ←→ - - - sink/source RM257 - [e]: L-histidine ←→ - - - sink/source RM258 - [e]: L-homocysteine −→ - - - sink/source IM259 - [e]: L-isoleucine ←→ - - - sink/source RM260 - [e]: L-leucine ←→ - - - sink/source RM261 - [e]: L-lysine ←→ - - - sink/source RM262 - [e]: L-methionine ←→ - - - sink/source RM263 - [e]: L-ornithine −→ - - - sink/source IM264 - [e]: L-phenylalanine ←→ - - - sink/source RM265 - [e]: L-proline ←→ - - - sink/source RM266 - [e]: L-serine ←→ - - - sink/source RM267 - [e]: L-threonine ←→ - - - sink/source RM268 - [e]: L-tryptophan ←→ - - - sink/source RM269 - [e]: L-tyrosine ←→ - - - sink/source RM270 - [e]: L-valine ←→ - - - sink/source RM271 - [c]: NADP+ −→ - - - sink/source IM272 - [e]: NH3 ←→ - - - sink/source RM273 - [e]: −→ ascorbate - - - sink/source IM274 - [e]: ←→ choline - - - sink/source RM275 - [e]: −→ cytidine - - - sink/source IM276 - [e]: −→ deoxycytidine - - - sink/source IM277 - [e]: −→ D-fructose - - - sink/source IM278 - [e]: −→ D-mannose - - - sink/source IM279 - [e]: −→ D-ribose - - - sink/source IM280 - [e]: ←→ fatty acid (Mpn) - - - sink/source RM281 - [e]: −→ folic acid - - - sink/source IM282 - [e]: −→ D-glucose - - - sink/source IM283 - [e]: −→ glycerol - - - sink/source IM284 - [e]: −→ guanine - - - sink/source IM285 - [e]: ←→ H+ - - - sink/source RM286 - [e]: −→ mannitol - - - sink/source IM287 - [e]: −→ nicotinate - - - sink/source IM288 - [e]: ←→ orthophosphate - - - sink/source RM289 - [e]: −→ oxygen - - - sink/source IM290 - [e]: −→ pantetheine - - - sink/source IM291 - [e]: −→ phosphatidylcholine - - - sink/source IM292 - [e]: −→ pyridoxal - - - sink/source IM293 - [e]: −→ riboflavin - - - sink/source IM294 - [e]: −→ sn-glycerol 3-phosphate - - - sink/source IM295 - [e]: −→ thiamin - - - sink/source IM296 - [e]: −→ thymine - - - sink/source IM297 - [e]: −→ uracil - - - sink/source IM298 - [e]: ←→ H2O - - - sink/source R
Continued on next page
114

A.4. Tables
Table A.1 – continued from previous pagere-
reac- ver-tion ID in enzyme EC sibi-ID ’YUS’ equation gene ID (short) number pathway lityM299 - [c]: (25) L-valyl-tRNA(Val) + (18) L-
aspartyl-tRNA(Asp) + (13) L-arginyl-tRNA(Arg) + N-formylmethionyl-tRNA(Met) + (826) ATP + (32) L-lysyl-tRNA(Lys) + (17) L-glutaminyl-tRNA(Gln)+ (22) L-isoleucyl-tRNA(Ile) + (482) H2O+ (21) L-seryl-tRNA(Ser) + (14) L-prolyl-tRNA(Pro) + (21) glycyl-tRNA(Gly) +(27) L-alanyl-tRNA(Ala) + (10) L-tyrosyl-tRNA(Tyr) + (21) L-threonyl-tRNA(Thr)+ (20) L-asparaginyl-tRNA(Asn) + (5)L-methionyl-tRNA(Met) + (6) L-histidyl-tRNA(His) + (3) L-cysteinyl-tRNA(Cys)+ (22) L-glutamyl-tRNA(Glu) + (3)L-tryptophanyl-tRNA(Trp) + (15) L-phenylalanyl-tRNA(Phe) + (29) L-leucyl-tRNA(Leu) −→ (3) tRNA(Trp) + (14)tRNA(Pro) + (10) tRNA(Tyr) + (29)tRNA(Leu) + (6) tRNA(Met) + (13)tRNA(Arg) + (22) tRNA(Glu) + (3)tRNA(Cys) + (27) tRNA(Ala) + (6)tRNA(His) + (32) tRNA(Lys) + (18)tRNA(Asp) + (25) tRNA(Val) + (826) H++ (22) tRNA(Ile) + (21) tRNA(Ser) + (826)orthophosphate + (17) tRNA(Gln) + (826)ADP + (15) tRNA(Phe) + (21) tRNA(Gly)+ (20) tRNA(Asn) + protein (Mpn) + (21)tRNA(Thr)
- - - Proteinmetabolism
I
M300 - [c]: H2O + protein (Mpn) + ATP −→ ADP+ orthophosphate + DnaK-folded protein(Mpn) + H+
MPN434/MPN002/MPN120
DnaK - Proteinmetabolism
I
M301 - [c]: (7) H2O + protein (Mpn) + (7) ATP−→ (7) ADP + GroEL-folded protein (Mpn)+ (7) orthophosphate + (7) H+
MPN573/MPN574
GroEL - Proteinmetabolism
I
M302 - [c]: (1032) H2O + protein (Mpn) + (688)ATP −→ (27) L-alanine + (10) L-tyrosine+ (21) glycine + (3) L-tryptophan + (21)L-serine + (20) L-asparagine + (22) L-glutamate + (29) L-leucine + (688) H+ +(14) L-proline + (3) L-cysteine + (13) L-arginine + (32) L-lysine + (21) L-threonine+ (15) L-phenylalanine + (688) orthophos-phate + (18) L-aspartate + (6) L-methionine+ (688) ADP + (17) L-glutamine + (22) L-isoleucine + (25) L-valine + (6) L-histidine
- - - Proteinmetabolism
I
M303 - [c]: (5) L-valyl-tRNA(Val) + (6) L-aspartyl-tRNA(Asp) + (2) L-arginyl-tRNA(Arg)+ N-formylmethionyl-tRNA(Met) +(199) ATP + (11) L-lysyl-tRNA(Lys)+ (4) L-glutaminyl-tRNA(Gln) + (8) L-isoleucyl-tRNA(Ile) + (199) H2O + (5)L-seryl-tRNA(Ser) + L-prolyl-tRNA(Pro)+ glycyl-tRNA(Gly) + (4) L-alanyl-tRNA(Ala) + L-threonyl-tRNA(Thr)+ (3) L-asparaginyl-tRNA(Asn) + (3)L-methionyl-tRNA(Met) + L-histidyl-tRNA(His) + (11) L-glutamyl-tRNA(Glu)+ (5) L-phenylalanyl-tRNA(Phe) + (12)L-leucyl-tRNA(Leu) −→ tRNA(Pro) +(12) tRNA(Leu) + (4) tRNA(Met) +(2) tRNA(Arg) + (11) tRNA(Glu) + (4)tRNA(Ala) + tRNA(His) + (11) tRNA(Lys)+ (6) tRNA(Asp) + (5) tRNA(Val) + (282)H+ + (8) tRNA(Ile) + apoprotein [acylcarrier protein] + (5) tRNA(Ser) + (199)orthophosphate + (4) tRNA(Gln) + (199)ADP + (5) tRNA(Phe) + tRNA(Gly) + (3)tRNA(Asn) + tRNA(Thr)
- - - Proteinmetabolism
I
M304 - [c]: H2O + ATP −→ ADP + orthophosphate+ H+
- - - Energymetabolism
I
Continued on next page
115

A. Chapter 3 Supplementary Material
Table A.1 – continued from previous pagere-
reac- ver-tion ID in enzyme EC sibi-ID ’YUS’ equation gene ID (short) number pathway lityM305 - [c]: (1657) guanosine + (1366) L-tyrosine
+ (9220) glycine + (1864) L-tryptophan+ (54) L-asparagine + (100) S-adenosyl-L-methionine + (100) pyridoxal phosphate+ (67) L-cysteine + a100) thiamin diphos-phate + (2489) L-threonine + (100) 5-formyltetrahydrofolate + (1242) thymidine+ (2793) L-valine + (1681) DNA (Mpn)+ (1981) adenosine + (100) CoA + (9824)L-alanine + (3202) L-serine + (2015)RNA (Mpn) + (63702) glycolipid (Mpn)+ (503) cytidine + (167760) D-glucose 6-phosphate + (3) acyl carrier protein +(100) CDP-choline + (18651) L-glutamate+ (21313) L-leucine + (6837) L-proline+ (100) NADP+ + (3913) L-arginine +(1741) L-lysine + (5122) L-phenylalanine +(1370) L-methionine + (9318) L-aspartate +(100) FAD + (294) L-glutamine + (1858)L-isoleucine + (148168) phosphatidic acid(Mpn) + (16949) protein (Mpn) + (2422) L-histidine + (100) NADPH + (2541) uridine−→ (1000000) biomass
- - - Biomass pro-duction
I
M306 - biomass[c] + (25) H2O[c] + (25) ATP[c] −→biomass[e] + (25) ADP[c] + (25) orthophos-phate[c] + (25) H+[c]
- - - Biomass pro-duction
I
Table A.1.: Reactions included in the model: reaction ID (used throughout the main textand in Appendix A, figure A.1 to identify the model reactions), ID in ’YUS’(given for reactions also included in the metabolic network published by Yuset al. [2009]), equation (reaction equation), gene ID (the M. pneumoniae en-zyme catalyzing the reaction), enzyme (short) (shortcut used throughout thetext and in the figures), EC number , pathway (pathway a reactions is assignedto), and reversibility (reaction reversibility) are specified.
Table A.2 : Reaction Reversibilitiesmodel ID A B C D E model ID A B C D E model ID A B C D E
M001 I I I - I M104 I - - - I M207 I I I - -M002 R R R - R M105 I I R - I M208 I R R - -M003 I I R - R M106 R R R - R M209 I R I - -M004 R R R R R M107 I - - - I M210 I R I - -M005 R R R - R M108 I I R - R M211 I I I - -M006 R R R - R M109 R R R - R M212 I - - - -M007 R R R - R M110 I I R - I M213 I R I - -M008 R R I - R M111 I I R - I M214 I R R - -M009 R R I - R M112 R R R - R M215 I R I - -M010 I I R - I M113 R I R - I M216 I R I - -M011 R - - - R M114 R R R - R M217 I R I - -M012 I - - - I M115 I I R - I M218 I R I - -M013 R - - - R M116 I I R - I M219 I R I - -M014 R - - - R M117 R R R R R M220 I I R - -M015 R R R - R M118 I - - - I M221 I - - - -M016 R R R R R M119 I - - - I M222 I - - - -M017 R - - - I M120 R R R - R M223 I - - - -M018 R R I - R M121 R R I - R M224 I - - - -M019 I I I - I M122 R - - - R M225 I - - - -M020 I I R - I M123 R - - - R M226 I - - - -M021 I - - R R M124 I - - - R M227 I - - - -M022 R R R - R M125 R R R - R M228 I - - - -M023 I I I - I M126 I - - - I M229 I - - - -M024 R R R - R M127 R R R - R M230 I - - - -M025 I I I - I M128 R R R - R M231 I - - - -M026 R R R - R M129 I - - - I M232 I - - - -M027 I - - - I M130 I - - - I M233 I - - - -M028 R - - - R M131 R - - - R M234 I - - - -M029 I I I - I M132 I I I - I M235 I - - - -M030 R I R - R M133 I - - - I M236 I - - - -M031 R R R - R M134 I I R R R M237 I - - - -M032 I - - - I M135 R - - R I M238 I - - - -
Continued on next page
116

A.4. Tables
Table A.2 – continued from previous pagemodel ID A B C D E model ID A B C D E model ID A B C D E
M033 I - - - I M136 R R R R R M239 I - - - -M034 R R R - R M137 I I I - I M240 I - - - -M035 R R R - R M138 I I R - I M241 I - - - -M036 R - - - R M139 I - - - I M242 I - - - -M037 R R R - R M140 I I I - I M243 I - - - -M038 R - - - R M141 I I I R R M244 R - - - -M039 I - - R R M142 I I R - I M245 I - - - -M040 R - - - R M143 I I R - I M246 R - - - -M041 R R R - R M144 I I R - I M247 R - - - -M042 I I R - R M145 I - - - I M248 R - - - -M043 R R R - R M146 I I R R R M249 I - - - -M044 R R R - R M147 I I I - I M250 R - - - -M045 I I R - I M148 I I I R R M251 R - - - -M046 I I R - I M149 I - - - I M252 R - - - -M047 R - - R R M150 I I R - R M253 R - - - -M048 I - - - I M151 I - - - I M254 R - - - -M049 I - - - I M152 I - - - I M255 R - - - -M050 I - - - I M153 I - - - I M256 R - - - -M051 I - - - R M154 I - - - R M257 R - - - -M052 I - - - R M155 I - - - R M258 I - - - -M053 I - - - R M156 I - - - R M259 R - - - -M054 I - - - R M157 I - - - R M260 R - - - -M055 I - - - I M158 I - - - R M261 R - - - -M056 I - - - I M159 I I I - R M262 R - - - -M057 R R R - R M160 I - - - R M263 I - - - -M058 R I R - R M161 I - - - R M264 R - - - -M059 R R R - R M162 I - - - R M265 R - - - -M060 I - - - I M163 I - - - R M266 R - - - -M061 I - - - R M164 I - - - R M267 R - - - -M062 I - - - R M165 I - - - R M268 R - - - -M063 R - - - R M166 I - - - R M269 R - - - -M064 R - - - R M167 I - - - R M270 R - - - -M065 R I R R R M168 I - - - R M271 I - - - -M066 R R R - R M169 I - - - R M272 R - - - -M067 I I I - I M170 I - - - R M273 R - - - -M068 R R R - R M171 I - - - R M274 I - - - -M069 I I I - I M172 I - - - R M275 R - - - -M070 R I R - I M173 I - - - R M276 I - - - -M071 I - - - I M174 I - - - - M277 I - - - -M072 I I I - I M175 R R I - - M278 I - - - -M073 R R R - R M176 R R R - - M279 I - - - -M074 R - - R I M177 I - - - - M280 I - - - -M075 R R R - R M178 I - - - - M281 R - - - -M076 I - - - I M179 R R R - - M282 I - - - -M077 R - - - R M180 I - - - - M283 I - - - -M078 I - - - I M181 R R R - - M284 I - - - -M079 R I R R R M182 I - - - - M285 I - - - -M080 R R R - R M183 I I R - - M286 R - - - -M081 I I R - I M184 R - - - - M287 I - - - -M082 R R R - R M185 I - - - - M288 I - - - -M083 I I R - I M186 I - - - - M289 R - - - -M084 I - - - I M187 R - - - - M290 I - - - -M085 R - - - R M188 R R R - - M291 I - - - -M086 R R R - R M189 R R I - - M292 I - - - -M087 R - - R I M190 I - - - - M293 I - - - -M088 R R R - R M191 I - - - - M294 I - - - -M089 I - - - I M192 I - - - - M295 I - - - -M090 R - - - R M193 I I I - - M296 I - - - -M091 R I R R R M194 R - - - - M297 I - - - -M092 R R R - R M195 I I R - - M298 I - - - -M093 I I R - I M196 R I R - - M299 R - - - -M094 I - - - I M197 R R R - - M300 I - - - -M095 R R R - R M198 I - - - - M301 I - - - -M096 I - - - I M199 I - - - - M302 I - - - -M097 I I R - I M200 I I I - - M303 I - - - -M098 I I R - R M201 I - - - - M304 I - - - -M099 I - - - I M202 I R I - - M305 I - - - -M100 I I R - I M203 I I R - - M306 I - - - -M101 R R R - R M204 I - - - - M307 I - - - -M102 I - - - I M205 I R R - -M103 I I R - I M206 I - - - -
Table A.2.: Reaction reversibilities. A: in the presented model. B: according to quantita-tive reversibilities in E.coli [Fleming et al., 2009]. C: according to qualitativereversibilities in E.coli [Fleming et al., 2009]. D: according to BRENDA en-zyme DB [Scheer et al., 2011]. E: in the initial reconstruction from Yus et al.[2009].
117

A. Chapter 3 Supplementary Material
Table A.3 : Branching MetabolitesMetabolite No of
reac-tions
experi-mentallyamenable
Metabolite No ofreac-tions
experi-mentallyamenable
(S)-lactate 2 Y L-ascorbate 6-phosphate 2 Y1-acyl-glycerol 3-phosphate 2 Y L-asparagine 6 Y1,3-bisphospho-D-glycerate 5 Y L-asparaginyl-tRNA(Asn) 3 N10-formyltetrahydrofolate 3 Y L-aspartate 6 Y
2-deoxy-D-ribose 1-phosphate 5 Y L-aspartyl-tRNA(Asp) 3 N2-deoxy-D-ribose 5-phosphate 2 Y L-citrulline 2 Y
2-phospho-D-glycerate 2 Y L-cysteine 5 Y3-keto-L-gulonate 6-phosphate 2 Y L-cysteinyl-tRNA(Cys) 2 N
3-phospho-D-glycerate 5 Y L-glutamate 7 Y5-formyltetrahydrofolate 3 Y L-glutamine 5 Y
5-phospho-alpha-D-ribose 1-diphosphate 5 Y L-glutaminyl-tRNA(Gln) 4 N5,10-methenyltetrahydrofolate 4 Y L-glutamyl-tRNA(Gln) 3 N5,10-methylenetetrahydrofolate 3 Y L-glutamyl-tRNA(Glu) 3 N
5mcDNA (Mpn) 1 N L-histidine 5 Yacetaldehyde 2 Y L-histidyl-tRNA(His) 3 N
acetate 2 Y L-homocysteine 2 Yacetyl phosphate 2 Y L-isoleucine 5 Y
acetyl-CoA 3 Y L-isoleucyl-tRNA(Ile) 3 NACP-R (Mpn) 3 N L-leucine 5 Y
acyl carrier protein 6 N L-leucyl-tRNA(Leu) 3 Nadenine 4 Y L-lysine 5 Yadenosine 4 Y L-lysyl-tRNA(Lys) 3 N
adenosine 3’,5’-bisphosphate 2 Y L-methionine 6 YADP 73 Y L-methionyl-tRNA(Met) 4 NAMP 28 Y L-ornithine 2 Y
apoprotein [acyl carrier protein] 3 N L-phenylalanine 5 YATP 99 Y L-phenylalanyl-tRNA(Phe) 3 N
biomass 2 N L-proline 5 Ycarbamoyl phosphate 2 Y L-prolyl-tRNA(Pro) 3 N
cardiolipin 1 N L-ribulose 5-phosphate 2 YCDP 3 Y L-serine 6 Y
CDP-choline 1 Y L-seryl-tRNA(Ser) 3 NCDP-diacylglycerol (Mpn) 3 Y L-threonine 5 Y
choline 3 Y L-threonyl-tRNA(Thr) 3 Ncholine phosphate 2 Y L-tryptophan 5 Y
CMP 6 Y L-tryptophanyl-tRNA(Trp) 2 NCO2 5 N L-tyrosine 5 YCoA 6 Y L-tyrosyl-tRNA(Tyr) 2 NCTP 4 Y L-valine 5 Y
cytidine 5 Y L-valyl-tRNA(Val) 3 ND-erythrose 4-phosphate 2 Y L-xylulose 5-phosphate 2 Y
D-fructose 1 Y lipoamide 2 YD-fructose 1-phosphate 3 Y mannitol 1 Y
D-fructose 1,6-bisphosphate 3 Y N-formylmethionyl-tRNA(Met) 3 ND-fructose 6-phosphate 6 Y NAD+ 12 Y
D-glucose 1 Y NADH 11 YD-glucose 1-phosphate 2 Y NADP+ 4 YD-glucose 6-phosphate 4 Y NADPH 4 Y
D-glyceraldehyde 2 Y NH3 6 ND-glyceraldehyde 3-phosphate 7 Y nicotinate 2 Y
D-mannitol 1-phosphate 2 Y nicotinate D-ribonucleotide 2 YD-mannose 1 Y orthophosphate 62 N
D-mannose 6-phosphate 2 Y oxidized thioredoxin 5 ND-ribose 2 Y oxygen 3 N
D-ribose 1-phosphate 4 Y pantetheine 2 YD-ribose 5-phosphate 5 Y pantetheine 4-phosphate 3 YD-ribulose 5-phosphate 2 Y phosphatidic acid (Mpn) 4 YD-xylulose 5-phosphate 4 Y phosphatidylcholine 2 Y
dADP 4 Y phosphatidylglycerol (Mpn) 2 YdAMP 2 Y phosphatidylglycerol 3-phosphate (Mpn) 2 YdATP 3 Y phosphoenolpyruvate 14 YdCDP 3 Y protein (Mpn) 5 NdCMP 3 Y pyridoxal 2 YdCTP 2 Y pyridoxal phosphate 2 Y
deamino-NAD+ 2 Y pyrophosphate 36 Ndeoxyadenosine 2 Y pyruvate 15 Ydeoxycytidine 4 Y reduced thioredoxin 5 Ndeoxyguanosine 2 Y riboflavin 2 Ydeoxyuridine 4 Y RNA (Mpn) 3 N
dephospho-CoA 2 Y S-acetyldihydrolipoamide 2 YdGDP 4 Y S-adenosyl-L-homocysteine 2 YdGMP 2 Y S-adenosyl-L-methionine 3 YdGTP 3 Y sedoheptulose 7-phosphate 2 Y
diacylglycerol (Mpn) 2 Y sn-glycero-3-phosphocholine 2 Ydihydrofolate 3 Y sn-glycerol 3-phosphate 6 Y
dihydrolipoamide 2 Y tetrahydrofolate 4 Ydihydroxyacetone phosphate 6 Y thiamin 2 Y
DNA (Mpn) 3 N thiamin diphosphate 2 YDnaK-folded protein (Mpn) 1 N thiamin monophosphate 2 Y
dTDP 2 Y thymidine 4 YContinued on next page
118
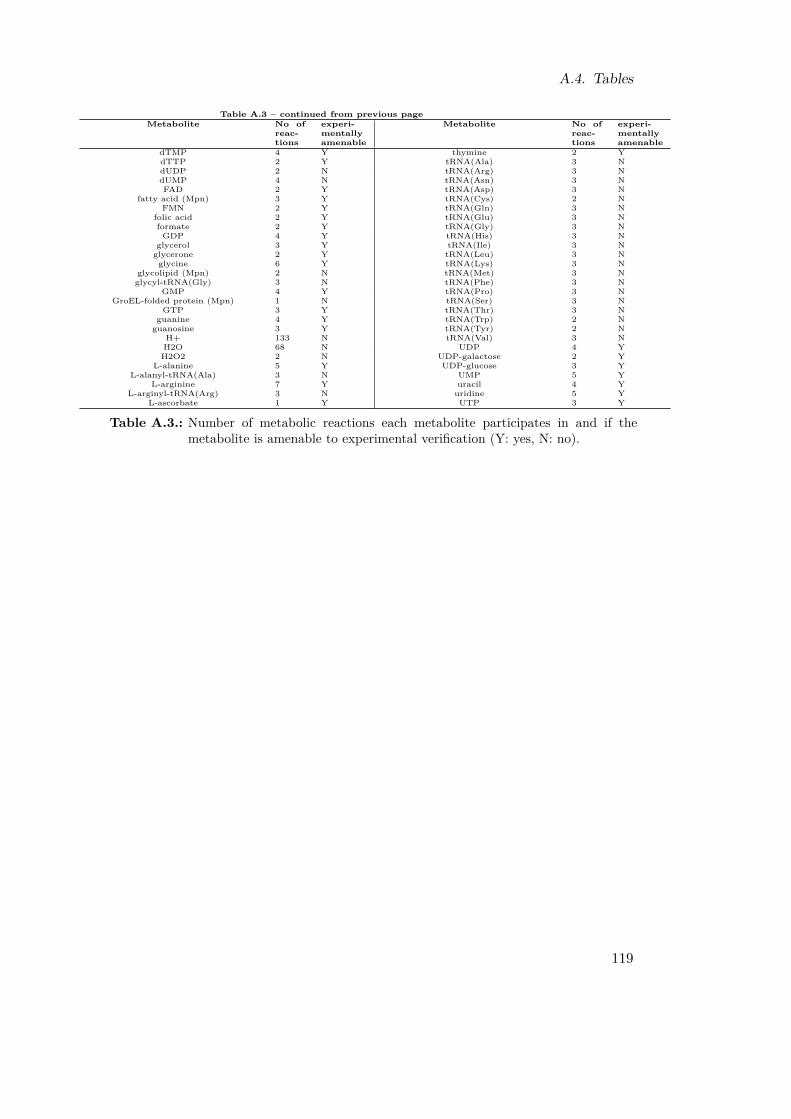
A.4. Tables
Table A.3 – continued from previous pageMetabolite No of
reac-tions
experi-mentallyamenable
Metabolite No ofreac-tions
experi-mentallyamenable
dTMP 4 Y thymine 2 YdTTP 2 Y tRNA(Ala) 3 NdUDP 2 N tRNA(Arg) 3 NdUMP 4 N tRNA(Asn) 3 NFAD 2 Y tRNA(Asp) 3 N
fatty acid (Mpn) 3 Y tRNA(Cys) 2 NFMN 2 Y tRNA(Gln) 3 N
folic acid 2 Y tRNA(Glu) 3 Nformate 2 Y tRNA(Gly) 3 NGDP 4 Y tRNA(His) 3 N
glycerol 3 Y tRNA(Ile) 3 Nglycerone 2 Y tRNA(Leu) 3 Nglycine 6 Y tRNA(Lys) 3 N
glycolipid (Mpn) 2 N tRNA(Met) 3 Nglycyl-tRNA(Gly) 3 N tRNA(Phe) 3 N
GMP 4 Y tRNA(Pro) 3 NGroEL-folded protein (Mpn) 1 N tRNA(Ser) 3 N
GTP 3 Y tRNA(Thr) 3 Nguanine 4 Y tRNA(Trp) 2 Nguanosine 3 Y tRNA(Tyr) 2 N
H+ 133 N tRNA(Val) 3 NH2O 68 N UDP 4 YH2O2 2 N UDP-galactose 2 Y
L-alanine 5 Y UDP-glucose 3 YL-alanyl-tRNA(Ala) 3 N UMP 5 Y
L-arginine 7 Y uracil 4 YL-arginyl-tRNA(Arg) 3 N uridine 5 Y
L-ascorbate 1 Y UTP 3 Y
Table A.3.: Number of metabolic reactions each metabolite participates in and if themetabolite is amenable to experimental verification (Y: yes, N: no).
119
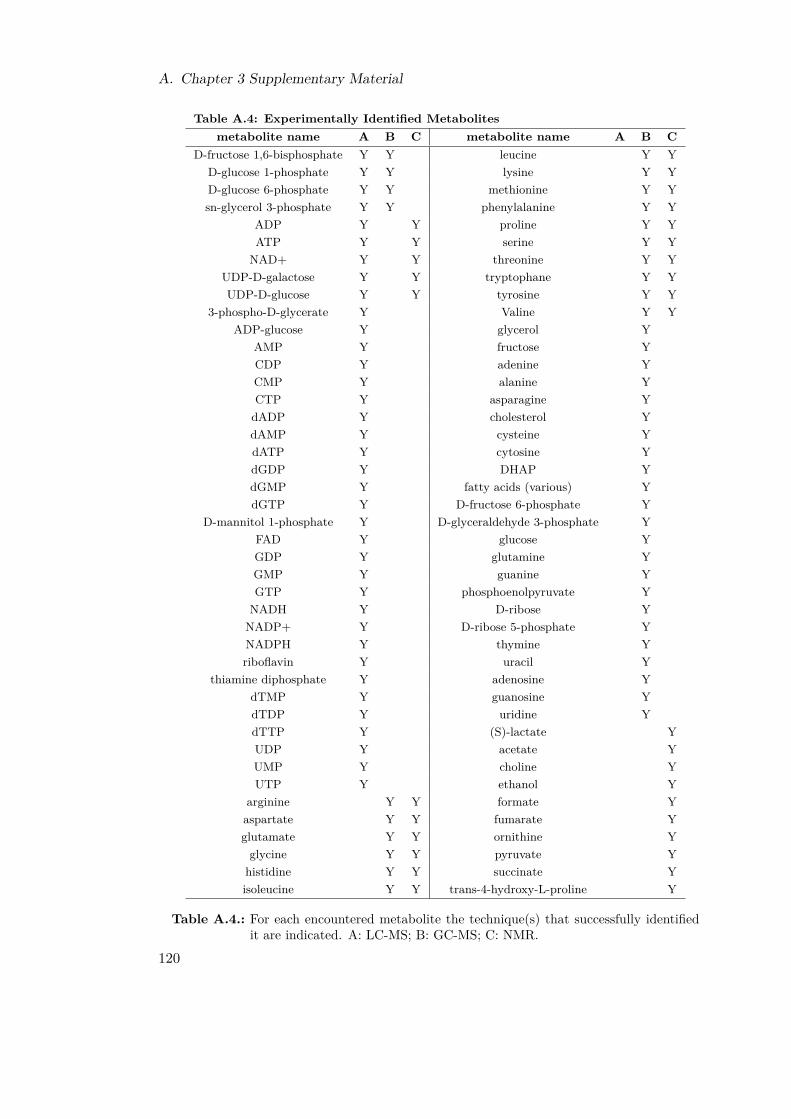
A. Chapter 3 Supplementary Material
Table A.4: Experimentally Identified Metabolitesmetabolite name A B C metabolite name A B C
D-fructose 1,6-bisphosphate Y Y leucine Y YD-glucose 1-phosphate Y Y lysine Y YD-glucose 6-phosphate Y Y methionine Y Ysn-glycerol 3-phosphate Y Y phenylalanine Y Y
ADP Y Y proline Y YATP Y Y serine Y YNAD+ Y Y threonine Y Y
UDP-D-galactose Y Y tryptophane Y YUDP-D-glucose Y Y tyrosine Y Y
3-phospho-D-glycerate Y Valine Y YADP-glucose Y glycerol Y
AMP Y fructose YCDP Y adenine YCMP Y alanine YCTP Y asparagine YdADP Y cholesterol YdAMP Y cysteine YdATP Y cytosine YdGDP Y DHAP YdGMP Y fatty acids (various) YdGTP Y D-fructose 6-phosphate Y
D-mannitol 1-phosphate Y D-glyceraldehyde 3-phosphate YFAD Y glucose YGDP Y glutamine YGMP Y guanine YGTP Y phosphoenolpyruvate YNADH Y D-ribose YNADP+ Y D-ribose 5-phosphate YNADPH Y thymine Yriboflavin Y uracil Y
thiamine diphosphate Y adenosine YdTMP Y guanosine YdTDP Y uridine YdTTP Y (S)-lactate YUDP Y acetate YUMP Y choline YUTP Y ethanol Y
arginine Y Y formate Yaspartate Y Y fumarate Yglutamate Y Y ornithine Yglycine Y Y pyruvate Yhistidine Y Y succinate Yisoleucine Y Y trans-4-hydroxy-L-proline Y
Table A.4.: For each encountered metabolite the technique(s) that successfully identifiedit are indicated. A: LC-MS; B: GC-MS; C: NMR.
120

A.4. Tables
Table A.5: Retention Times for NUBS and cholesterolCompound RT (min) Ions (m/z)
adenine 7.66 279, 264, 192thymine 5.33 270, 255, 113cytosine 6.03 254, 240, 170guanine 8.76 367, 352, 280uracil 4.94 256, 241, 147
adenosine 10.56 540, 322, 230guanosine 11.02 643, 410, 324thymidine 10 458, 353, 199uridine 9.98 517, 348, 217cytidine 10.75 516, 348, 223
cholesterol 12.07 458, 368, 329nLeu (ISTD) 4.83 260,232, 158
Table A.5.: Retention times (RT) and characteristic ions used for monitoring bases, nucle-osides, and cholesterol after per-trimethylsilyl derivatisation; underlined ionswere used for quantification.
Table A.6: Retention Times foi Amino AcidsAmino acid RT (min) Ions (m/z)
arginine 6.89 630, 573, 286alanine 3.65 260, 232, 158glycine 3.77 246, 218, 144valine 4.26 288, 260, 186leucine 4.46 302, 274, 200
isoleucine 4.62 302, 274, 200methionine 5.67 320, 292, 218
serine 5.77 390, 362, 288threonin 5.9 404, 376, 303
phenylalanine 6.17 336, 302, 234aspartate 6.43 418, 390, 316cystein 6.62 406, 378, 304
glutamate 6.87 432, 330, 272prolin 4.78 286, 258, 184
asparagine 6.99 417, 302, 315lysin 7.26 431, 329, 300
glutamine 7.41 431, 357, 329histidine 7.97 440, 338, 196tyrosine 8.14 466, 364, 302
tryptophan 8.94 489, 302, 244nLeu (ISTD) 4.7 302, 274, 200
Table A.6.: Retention times (RT) and characteristic ions for monitoring amino acids; un-derlined ions were used for quantification.
121

A. Chapter 3 Supplementary Material
Table A.7: Amino Acid Quantificationinternal
import/min poolno of aa no of aa enrichment for turnover
amino acid in proteome in cytosol factor td = 20 hours (min)leucine 2393036 25097.06 95.35 1994.20 12.59
glutamate 1672072 98709.28 16.94 1393.39 70.84alanine 2032737 38012.46 53.48 1693.95 22.44valine 1864124 12050.33 154.69 1553.44 7.76
isoleucin 1724690 17162.65 100.49 1437.24 11.94serine 1515135 12566.03 120.57 1262.61 9.95glycin 1588085 34936.66 45.46 1323.40 26.40
aspartate 1305481 23289.71 56.05 1087.90 21.41threonine 1533247 6433.41 238.33 1277.71 5.04
phenylalanine 1102859 39005.54 28.27 919.05 42.44arginine 907229 38302.25 23.69 756.02 50.66prolin 974850 35012.34 27.84 812.38 43.10
asparagine 1473974 13655.65 107.94 1228.31 11.12methionine 469166 12369.48 37.93 390.97 31.64glutamine 1179691 7692.71 153.35 983.08 7.83
lysin 2149849 24800.01 86.69 1791.54 13.84histidine 478238 12279.47 38.95 398.53 30.81cystein 197940 3627.55 54.57 164.95 21.99tyrosin 748700 5417.45 138.20 623.92 8.68
tryptophan 211534 6470.83 32.69 176.28 36.71
Table A.7.: Amino acids detected experimentally in the M. pneumoniae cytosol and thegrowth medium. In addition, the enrichment factor for amino acids in thecytosol, the import rate per minute when assuming exponential growth (dt :=doubling time) and the turnover time for the intracellular amino acid poolshave been calculated.
Table A.8: Variables for Metabolite Fittingsvariable name a b c d
glucose concentration 10.15 59.788 1.0797 111.62acetic acid concentration -0.40559 16.414 1.0455 44.465lactic acid concentration 3.4644 91.127 1.1056 69.738protein concentration 0.0055678 0.048346 1.0956 41.969maintenance costs 0.4364 -50.722 2716.5 -6656
Table A.8.: Variable values for the applied fittings of mathematical equations (see sec-tion 3.2.1, Equations 3.1 - 3.3) to metabolite and protein concentration changesdetermined in vivo, as well as to the maintenance costs in silico.
122

A.4. Tables
Tab
leA.9:Growth
Con
straints
24h
36h
48h
60h
defin
edmed
ium
reaction
IDmin
max
min
max
min
max
min
max
min
max
M04
80.01
inf
0.01
inf
0.01
inf
0.01
inf
0.01
inf
M13
00.01
inf
0.01
inf
0.01
inf
0.01
inf
0.01
inf
M30
20.00
0349
inf
0.00
0349
inf
0.000349
inf
0.000349
inf
0.000349
inf
M17
40.00
7741
inf
0.00
7741
inf
0.007741
inf
0.007741
inf
0.007741
inf
M25
10
0.25
00.25
00.25
00.25
00.25
M27
30
00
00
00
00
0M27
70
00
00
00
00
0M27
80
00
00
00
00
0M27
90
0.12
7709
00.184225
00.242428
00.309440
00
M28
20
5.10
8358
07.369004
09.697136
012.377609
07.369004
M28
30
0.12
7709
00.184225
00.242428
00.309440
00.184225
M28
60
00
00
00
00
0M29
10
00
00
00
00
0M29
40
0.12
7709
00.184225
00.242428
00.309440
00.184225
M24
30
7.44
360
6.9311
04.6191
02.6777
06.9311
M30
413
.105
inf
16.962
5inf
20.435
inf
25.2015
inf
--
Tab
leA.9.:
Fina
lcon
straints
asused
forsim
ulatinggrow
thof
M.pn
eumon
iaeat
diffe
rent
timepo
ints
oftheexpo
nentialg
rowth
phaseun
derric
hmed
ium
cond
ition
san
dto
simulategrow
thin
minim
almed
ium.Fo
rminim
almed
ium
simulations,
gluc
osean
dacetateha
vebe
enconstraine
das
forthe36
hour
timepo
intun
derric
hmed
ium
cond
ition
s(for
details
see
section3.2.1).
123
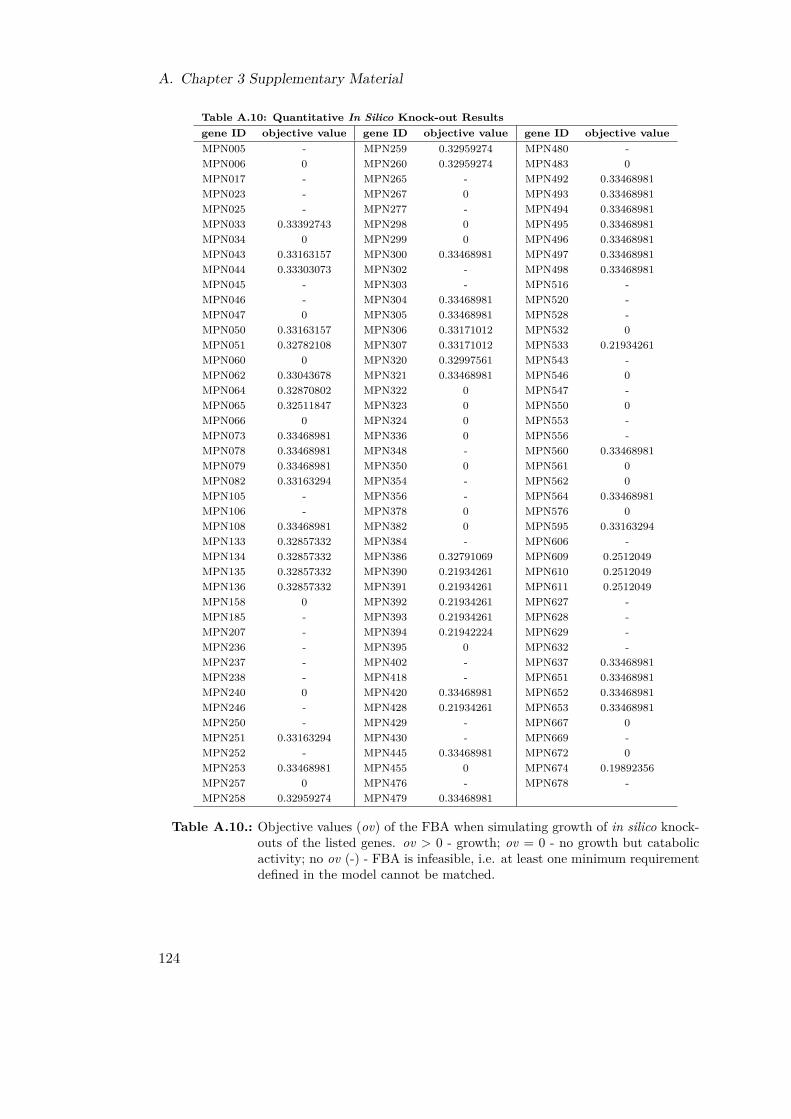
A. Chapter 3 Supplementary Material
Table A.10: Quantitative In Silico Knock-out Resultsgene ID objective value gene ID objective value gene ID objective valueMPN005 - MPN259 0.32959274 MPN480 -MPN006 0 MPN260 0.32959274 MPN483 0MPN017 - MPN265 - MPN492 0.33468981MPN023 - MPN267 0 MPN493 0.33468981MPN025 - MPN277 - MPN494 0.33468981MPN033 0.33392743 MPN298 0 MPN495 0.33468981MPN034 0 MPN299 0 MPN496 0.33468981MPN043 0.33163157 MPN300 0.33468981 MPN497 0.33468981MPN044 0.33303073 MPN302 - MPN498 0.33468981MPN045 - MPN303 - MPN516 -MPN046 - MPN304 0.33468981 MPN520 -MPN047 0 MPN305 0.33468981 MPN528 -MPN050 0.33163157 MPN306 0.33171012 MPN532 0MPN051 0.32782108 MPN307 0.33171012 MPN533 0.21934261MPN060 0 MPN320 0.32997561 MPN543 -MPN062 0.33043678 MPN321 0.33468981 MPN546 0MPN064 0.32870802 MPN322 0 MPN547 -MPN065 0.32511847 MPN323 0 MPN550 0MPN066 0 MPN324 0 MPN553 -MPN073 0.33468981 MPN336 0 MPN556 -MPN078 0.33468981 MPN348 - MPN560 0.33468981MPN079 0.33468981 MPN350 0 MPN561 0MPN082 0.33163294 MPN354 - MPN562 0MPN105 - MPN356 - MPN564 0.33468981MPN106 - MPN378 0 MPN576 0MPN108 0.33468981 MPN382 0 MPN595 0.33163294MPN133 0.32857332 MPN384 - MPN606 -MPN134 0.32857332 MPN386 0.32791069 MPN609 0.2512049MPN135 0.32857332 MPN390 0.21934261 MPN610 0.2512049MPN136 0.32857332 MPN391 0.21934261 MPN611 0.2512049MPN158 0 MPN392 0.21934261 MPN627 -MPN185 - MPN393 0.21934261 MPN628 -MPN207 - MPN394 0.21942224 MPN629 -MPN236 - MPN395 0 MPN632 -MPN237 - MPN402 - MPN637 0.33468981MPN238 - MPN418 - MPN651 0.33468981MPN240 0 MPN420 0.33468981 MPN652 0.33468981MPN246 - MPN428 0.21934261 MPN653 0.33468981MPN250 - MPN429 - MPN667 0MPN251 0.33163294 MPN430 - MPN669 -MPN252 - MPN445 0.33468981 MPN672 0MPN253 0.33468981 MPN455 0 MPN674 0.19892356MPN257 0 MPN476 - MPN678 -MPN258 0.32959274 MPN479 0.33468981
Table A.10.: Objective values (ov) of the FBA when simulating growth of in silico knock-outs of the listed genes. ov > 0 - growth; ov = 0 - no growth but catabolicactivity; no ov (-) - FBA is infeasible, i.e. at least one minimum requirementdefined in the model cannot be matched.
124

A.4. Tables
Table A.11: Functional Orthologs in M. pneumoniae and M. genitaliumMpn gene Mg gene Mg alias Mpn gene Mg gene Mg alias Mpn gene Mg gene Mg aliasMPN001 MG001 MPN231 MG093 MPN461 MG323MPN002 MG002 MPN232 MG094 MPN462MPN003 MG003 MPN233 MG095 MPN463MPN004 MG004 MPN234 MPN464 MG192MPN005 MG005 MPN235 MG097 MPN465MPN006 MG006 MPN236 MG098 MPN466MPN007 MG007 MPN237 MG099 MPN467MPN008 MG008 MPN238 MG100 MPN468MPN009 MG009 MPN239 MG101 MPN469 MG515 MG323.1MPN010 MPN240 MG102 MPN470 MG324MPN011 MPN241 MG103 MPN471 MG325MPN012 MPN242 MG476 MPN472 MG326MPN013 MPN243 MG104 MPN473 MG327MPN014 MG010 MPN244 MG105 MPN474 MG328MPN015 MG011 MPN245 MG106 MPN475 MG329MPN016 MG012 MPN246 MG107 MPN476 MG330MPN017 MG013 MPN247 MG108 MPN477 MG331MPN018 MG014 MPN248 MG109 MPN478 MG332MPN019 MG015 MPN249 MG110 MPN479 MG333MPN020 MG018 MPN250 MG111 MPN480 MG334MPN021 MG019 MPN251 MG112 MPN481 MG335MPN022 MG020 MPN252 MG113 MPN482 MG516 MG335.1MPN023 MG021 MPN253 MG114 MPN483 MG517 MG335.2MPN024 MG022 MPN254 MG115 MPN484MPN025 MG023 MPN255 MG116 MPN485MPN026 MG024 MPN256 MG117 MPN486MPN027 MPN257 MG118 MPN487 MG336MPN028 MG025 MPN258 MG119 MPN488 MG337MPN029 MG026 MPN259 MG120 MPN489 MG338MPN030 MG027 MPN260 MG121 MPN490 MG339MPN031 MG028 MPN261 MG122 MPN491MPN032 MG029 MPN262 MG123 MPN492MPN033 MG030 MPN263 MG124 MPN493MPN034 MG031 MPN264 MG125 MPN494MPN035 MPN265 MG126 MPN495MPN036 MG032 MPN266 MG127 MPN496MPN037 MPN267 MG128 MPN497MPN038 MPN268 MG129 MPN498MPN039 MPN269 MG130 MPN499MPN040 MPN270 MG131 MPN500 MG191MPN041 MPN271 MPN501MPN042 MPN272 MPN502MPN043 MG033 MPN273 MG132 MPN503MPN044 MG034 MPN274 MG133 MPN504MPN045 MG035 MPN275 MG134 MPN505MPN046 MG036 MPN276 MG135 MPN506MPN047 MG037 MPN277 MG136 MPN507MPN048 MPN278 MG137 MPN508 MG288MPN049 MPN279 MG138 MPN509MPN050 MG038 MPN280 MG139 MPN510MPN051 MG039 MPN281 MPN511MPN052 MG040 MPN282 MPN512MPN053 MG041 MPN283 MPN513MPN054 MPN284 MG260 MPN514MPN055 MG042 MPN285 MPN515 MG340MPN056 MG043 MPN286 MPN516 MG341MPN057 MG044 MPN287 MPN517 MG342MPN058 MG045 MPN288 MPN518 MG343MPN059 MG046 MPN289 MPN519 MG344MPN060 MG047 MPN290 MPN520 MG345MPN061 MG048 MPN291 MG208 MPN521 MG346MPN062 MG049 MPN292 MG209 MPN522 MG347MPN063 MG050 MPN293 MG210 MPN523 MG348MPN064 MG051 MPN294 MPN524MPN065 MG052 MPN295 MG480 MG210.1 MPN525 MG349MPN066 MG053 MPN296 MG481 MG210.2 MPN526 MG350MPN067 MG054 MPN297 MG211 MPN527 MG521 MG350.1MPN068 MG055 MPN298 MG482 MG211.1 MPN528 MG351MPN069 MG473 MG055.1 MPN299 MG212 MPN528a MG352MPN070 MG474 MG055.2 MPN300 MG213 MPN529 MG353MPN071 MG056 MPN301 MG214 MPN530 MG354MPN072 MG057 MPN302 MG215 MPN531 MG355MPN073 MG058 MPN303 MG216 MPN532 MG356MPN074 MG059 MPN304 MPN533 MG357MPN075 MG060 MPN305 MPN534MPN076 MG061 MPN306 MPN535 MG358MPN077 MG061 MPN307 MPN536 MG359MPN078 MG062 MPN308 MPN537 MG360MPN079 MG063 MPN309 MG217 MPN538 MG361MPN080 MG064 MPN310 MG218 MPN539 MG362MPN081 MG065 MPN311 MG491 MG218.1 MPN540 MG363MPN082 MG066 MPN312 MPN541 MG522 MG363.1
Continued on next page
125

A. Chapter 3 Supplementary Material
Table A.11 – continued from previous pageMpn gene Mg gene Mg alias Mpn gene Mg gene Mg alias Mpn gene Mg gene Mg aliasMPN083 MG067 MPN313 MG220 MPN542 MG364MPN084 MG068 MPN314 MG221 MPN543 MG365MPN085 MPN315 MG222 MPN544 MG366MPN086 MPN316 MG223 MPN545 MG367MPN087 MPN317 MG224 MPN546 MG368MPN088 MPN318 MG225 MPN547 MG369MPN089 MPN319 MG226 MPN548 MG370MPN090 MPN320 MG227 MPN549 MG371MPN091 MPN321 MG228 MPN550 MG372MPN092 MPN322 MG229 MPN551 MG373MPN093 MPN323 MG230 MPN552 MG374MPN094 MPN324 MG231 MPN553 MG375MPN095 MPN325 MG232 MPN554 MG376MPN096 MPN326 MG233 MPN555 MG377MPN097 MPN327 MG234 MPN556 MG378MPN098 MPN328 MG235 MPN557 MG379MPN099 MPN329 MG236 MPN558 MG380MPN100 MPN330 MG237 MPN559 MG381MPN101 MPN331 MG238 MPN560MPN102 MPN332 MG239 MPN561 MG382MPN103 MPN333 MPN562 MG383MPN104 MPN334 MPN563 MG384MPN105 MG194 MPN335 MPN564MPN106 MG195 MPN336 MG240 MPN565 MG524 MG384.1MPN107 MPN337 MG241 MPN566 MG385MPN108 MPN338 MG242 MPN567 MG386MPN109 MPN339 MPN568 MG387MPN110 MPN340 MPN569 MG388MPN111 MPN341 MG244 MPN570 MG389MPN112 MPN342 MPN571 MG390MPN113 MPN343 MPN572 MG391MPN114 MPN344 MPN573 MG392MPN115 MG196 MPN345 MPN574 MG393MPN116 MG197 MPN346 MPN575MPN117 MG198 MPN347 MPN576 MG394MPN118 MG199 MPN348 MG245 MPN577MPN119 MG200 MPN349 MG246 MPN578MPN120 MG201 MPN350 MG247 MPN579MPN121 MG202 MPN351 MG248 MPN580MPN122 MG203 MPN352 MG249 MPN581MPN123 MG204 MPN353 MG250 MPN582MPN124 MG205 MPN354 MG251 MPN583MPN125 MG206 MPN355 MG252 MPN584MPN126 MG207 MPN356 MG253 MPN585MPN127 MPN357 MG254 MPN586MPN128 MPN358 MG255 MPN587MPN129 MPN359 MG256 MPN588 MG395MPN130 MPN360 MG257 MPN589MPN131 MPN361 MG258 MPN590MPN132 MPN362 MG259 MPN591MPN133 MG186 MPN363 MPN592 MG395MPN134 MG187 MPN364 MPN593MPN135 MG188 MPN365 MPN594MPN136 MG189 MPN366 MPN595 MG396MPN137 MPN367 MPN596 MG397MPN138 MPN368 MPN597 MG398MPN139 MPN369 MPN598 MG399MPN140 MG190 MPN370 MPN599 MG400MPN141 MG191 MPN371 MPN600 MG401MPN142 MG192 MPN372 MPN601 MG402MPN143 MPN373 MPN602 MG403MPN144 MPN374 MPN603 MG404MPN145 MPN375 MPN604 MG405MPN146 MPN376 MPN605 MG406MPN147 MPN377 MPN606 MG407MPN148 MPN378 MG261 MPN607 MG408MPN149 MPN379 MG262 MPN608 MG409MPN150 MPN380 MG498 MG262.1 MPN609 MG410MPN151 MPN381 MG263 MPN610 MG411MPN152 MPN382 MG264 MPN611 MG412MPN153 MG140 MPN383 MG265 MPN612 MG414MPN154 MG141 MPN384 MG266 MPN613 MG525MPN155 MG142 MPN385 MG267 MPN614 MG525MPN156 MG143 MPN386 MG268 MPN615MPN157 MG144 MPN387 MG269 MPN616 MG417MPN158 MG145 MPN388 MPN617 MG418MPN159 MG146 MPN389 MG270 MPN618 MG419MPN160 MG147 MPN390 MG271 MPN619 MG421MPN161 MG148 MPN391 MG272 MPN620 MG422MPN162 MG149 MPN392 MG273 MPN621 MG423MPN163 MG478 MG149.1 MPN393 MG274 MPN622 MG424MPN164 MG150 MPN394 MG275 MPN623 MG425
Continued on next page
126

A.4. Tables
Table A.11 – continued from previous pageMpn gene Mg gene Mg alias Mpn gene Mg gene Mg alias Mpn gene Mg gene Mg aliasMPN165 MG151 MPN395 MG276 MPN624 MG426MPN166 MG152 MPN396 MG277 MPN625 MG427MPN167 MG153 MPN397 MG278 MPN626 MG428MPN168 MG154 MPN398 MG279 MPN627 MG429MPN169 MG155 MPN399 MG280 MPN628 MG430MPN170 MG156 MPN400 MG281 MPN629 MG431MPN171 MG157 MPN401 MG282 MPN630 MG432MPN172 MG158 MPN402 MG283 MPN631 MG433MPN173 MG159 MPN403 MG284 MPN632 MG434MPN174 MG160 MPN404 MG285 MPN633MPN175 MG161 MPN405 MG286 MPN634MPN176 MG162 MPN406 MG287 MPN635MPN177 MG163 MPN407 MPN636 MG435MPN178 MG164 MPN408 MPN637 MG437MPN179 MG165 MPN409 MPN638 MG438MPN180 MG166 MPN410 MPN639MPN181 MG167 MPN411 MPN640MPN182 MG168 MPN412 MPN641MPN183 MG169 MPN413 MPN642MPN184 MG170 MPN414 MPN643 MG440MPN185 MG171 MPN415 MG289 MPN644 MG439MPN186 MG172 MPN416 MG290 MPN645MPN187 MG173 MPN417 MG291 MPN646MPN188 MPN418 MG292 MPN647MPN189 MG175 MPN419 MG505 MG291.1 MPN648 MG441MPN190 MG176 MPN420 MG293 MPN649MPN191 MG177 MPN421 MG294 MPN650MPN192 MG178 MPN422 MG295 MPN651MPN193 MG179 MPN423 MG296 MPN652MPN194 MG180 MPN424 MPN653MPN195 MG181 MPN425 MG297 MPN654MPN196 MG182 MPN426 MG298 MPN655MPN197 MG183 MPN427 MPN656 MG442MPN198 MG184 MPN428 MG299 MPN657 MG443MPN199 MG185 MPN429 MG300 MPN658 MG444MPN200 MPN430 MG301 MPN659 MG445MPN201 MPN431 MG302 MPN660 MG446MPN202 MPN432 MG303 MPN661 MG447MPN203 MPN433 MG304 MPN662 MG448MPN204 MPN434 MG305 MPN663MPN205 MPN435 MG306 MPN664 MG450MPN206 MPN436 MG307 MPN665 MG451MPN207 MG069 MPN437 MPN666 MG452MPN208 MG070 MPN438 MPN667 MG453MPN209 MG071 MPN439 MPN668 MG454MPN210 MG072 MPN440 MPN669 MG455MPN211 MG073 MPN441 MPN670 MG456MPN212 MG074 MPN442 MPN671 MG457MPN213 MG075 MPN443 MG308 MPN672 MG458MPN214 MG076 MPN444 MG309 MPN673 MG459MPN215 MG077 MPN445 MG310 MPN674 MG460MPN216 MG078 MPN446 MG311 MPN675MPN217 MG079 MPN447 MG312 MPN676MPN218 MG080 MPN448 MG313 MPN677 MG461MPN219 MG081 MPN449 MG314 MPN678 MG462MPN220 MG082 MPN450 MG315 MPN679 MG463MPN221 MG083 MPN451 MG316 MPN680 MG464MPN222 MG084 MPN452 MG317 MPN681 MG465MPN223 MG085 MPN453 MG318 MPN682 MG466MPN224 MG086 MPN454 MG319 MPN683 MG467MPN225 MG087 MPN455 MG320 MPN684 MG468MPN226 MG088 MPN456 MG321 MPN685 MG526 MG468.1MPN227 MG089 MPN457 MPN686 MG469MPN228 MG090 MPN458 MPN687MPN229 MG091 MPN459 MPN688 MG470MPN230 MG092 MPN460 MG322
Table A.11.: Functional orthologs of M. pneumoniae and M. genitalium.
127

A. Chapter 3 Supplementary Material
Table A.12: Transposon PrimerPCR inser- % of
primer fragment tion- trun-name sequence ORF (bp) site cation
5MPN133 CCCAAGATTCTTCTTCTGCATCCAC MPN321 140 381698 655MPN321 CGCCAGACCACGTTGCACCAAGATG MPN133 192 172691 545MPN392 TGGTGTTCAAGTGCTTTAATCCCAC MPN595 188 717112 275MPN533 TGTGTCAAAGACTGCCACATTCTTA MPN533 341 655990 865MPN595 TCTCATAAGCAATGATCTTACCGAC MPN392 144 470043 683JpMT85 GGTGGATCCGTACTAGTGTGTGTCCAAAG reverse primer
Table A.12.: Primer used for the identification of transposon insertion sites in M. pneu-moniae genes predicted to be not essential by the model but not found tobe disrupted in M. genitalium [Glass et al., 2006]. For each primer the se-quence, the ORF they have been used for, the PCR fragment, the transposoninsertion site, and the truncated fraction of the protein are listed.
Table A.13: In Silico Double Knock-outsinter- inter-action action
gene 1 pathway 1 gene 2 pathway 2 type gene 1 pathway 1 gene 2 pathway 2 typeMPN033 NT m. MPN043 sugar m. sick MPN108 aa m. MPN394 pyruvate m. sickMPN033 NT m. MPN044 NT m. sick MPN108 aa m. MPN428 pyruvate m. sickMPN033 NT m. MPN050 sugar m. sick MPN108 aa m. MPN533 pyruvate m. sickMPN033 NT m. MPN051 lipid m. sick MPN108 aa m. MPN595 PPP sickMPN033 NT m. MPN062 NT m. sick MPN108 aa m. MPN674 pyruvate m. sickMPN033 NT m. MPN064 NT m. sick MPN133 sugar m. MPN134 sugar m. sickMPN033 NT m. MPN065 NT m. sick MPN133 sugar m. MPN135 sugar m. sickMPN033 NT m. MPN073 PPP SL MPN133 sugar m. MPN136 sugar m. sickMPN033 NT m. MPN082 PPP sick MPN133 sugar m. MPN251 PPP sickMPN033 NT m. MPN133 sugar m. sick MPN133 sugar m. MPN258 sugar m. sickMPN033 NT m. MPN134 sugar m. sick MPN133 sugar m. MPN259 sugar m. sickMPN033 NT m. MPN135 sugar m. sick MPN133 sugar m. MPN260 sugar m. sickMPN033 NT m. MPN136 sugar m. sick MPN133 sugar m. MPN306 aa m. sickMPN033 NT m. MPN251 PPP sick MPN133 sugar m. MPN307 aa m. sickMPN033 NT m. MPN258 sugar m. sick MPN133 sugar m. MPN320 folate m. sickMPN033 NT m. MPN259 sugar m. sick MPN133 sugar m. MPN386 NT m. sickMPN033 NT m. MPN260 sugar m. sick MPN133 sugar m. MPN390 pyruvate m. sickMPN033 NT m. MPN306 aa m. sick MPN133 sugar m. MPN391 pyruvate m. sickMPN033 NT m. MPN307 aa m. sick MPN133 sugar m. MPN392 pyruvate m. sickMPN033 NT m. MPN320 folate m. sick MPN133 sugar m. MPN393 pyruvate m. sickMPN033 NT m. MPN386 NT m. sick MPN133 sugar m. MPN394 pyruvate m. sickMPN033 NT m. MPN390 pyruvate m. sick MPN133 sugar m. MPN428 pyruvate m. sickMPN033 NT m. MPN391 pyruvate m. sick MPN133 sugar m. MPN533 pyruvate m. sickMPN033 NT m. MPN392 pyruvate m. sick MPN133 sugar m. MPN595 PPP sickMPN033 NT m. MPN393 pyruvate m. sick MPN133 sugar m. MPN674 pyruvate m. sickMPN033 NT m. MPN394 pyruvate m. sick MPN134 sugar m. MPN135 sugar m. sickMPN033 NT m. MPN428 pyruvate m. sick MPN134 sugar m. MPN136 sugar m. sickMPN033 NT m. MPN533 pyruvate m. sick MPN134 sugar m. MPN251 PPP sickMPN033 NT m. MPN595 PPP sick MPN134 sugar m. MPN258 sugar m. sickMPN033 NT m. MPN674 pyruvate m. sick MPN134 sugar m. MPN259 sugar m. sickMPN043 sugar m. MPN044 NT m. sick MPN134 sugar m. MPN260 sugar m. sickMPN043 sugar m. MPN051 lipid m. sick MPN134 sugar m. MPN306 aa m. sickMPN043 sugar m. MPN062 NT m. sick MPN134 sugar m. MPN307 aa m. sickMPN043 sugar m. MPN064 NT m. sick MPN134 sugar m. MPN320 folate m. sickMPN043 sugar m. MPN065 NT m. sick MPN134 sugar m. MPN386 NT m. sickMPN043 sugar m. MPN082 PPP sick MPN134 sugar m. MPN390 pyruvate m. sickMPN043 sugar m. MPN133 sugar m. SL MPN134 sugar m. MPN391 pyruvate m. sickMPN043 sugar m. MPN134 sugar m. SL MPN134 sugar m. MPN392 pyruvate m. sickMPN043 sugar m. MPN135 sugar m. SL MPN134 sugar m. MPN393 pyruvate m. sickMPN043 sugar m. MPN136 sugar m. SL MPN134 sugar m. MPN394 pyruvate m. sickMPN043 sugar m. MPN251 PPP sick MPN134 sugar m. MPN428 pyruvate m. sickMPN043 sugar m. MPN258 sugar m. sick MPN134 sugar m. MPN533 pyruvate m. sickMPN043 sugar m. MPN259 sugar m. sick MPN134 sugar m. MPN595 PPP sickMPN043 sugar m. MPN260 sugar m. sick MPN134 sugar m. MPN674 pyruvate m. sickMPN043 sugar m. MPN306 aa m. sick MPN135 sugar m. MPN136 sugar m. sickMPN043 sugar m. MPN307 aa m. sick MPN135 sugar m. MPN251 PPP sickMPN043 sugar m. MPN320 folate m. sick MPN135 sugar m. MPN258 sugar m. sickMPN043 sugar m. MPN386 NT m. sick MPN135 sugar m. MPN259 sugar m. sickMPN043 sugar m. MPN390 pyruvate m. sick MPN135 sugar m. MPN260 sugar m. sickMPN043 sugar m. MPN391 pyruvate m. sick MPN135 sugar m. MPN306 aa m. sickMPN043 sugar m. MPN392 pyruvate m. sick MPN135 sugar m. MPN307 aa m. sick
Continued on next page
128

A.4. Tables
Table A.13 – continued from previous pageinter- inter-action action
gene 1 pathway 1 gene 2 pathway 2 type gene 1 pathway 1 gene 2 pathway 2 typeMPN043 sugar m. MPN393 pyruvate m. sick MPN135 sugar m. MPN320 folate m. sickMPN043 sugar m. MPN394 pyruvate m. sick MPN135 sugar m. MPN386 NT m. sickMPN043 sugar m. MPN428 pyruvate m. sick MPN135 sugar m. MPN390 pyruvate m. sickMPN043 sugar m. MPN533 pyruvate m. sick MPN135 sugar m. MPN391 pyruvate m. sickMPN043 sugar m. MPN595 PPP sick MPN135 sugar m. MPN392 pyruvate m. sickMPN043 sugar m. MPN674 pyruvate m. sick MPN135 sugar m. MPN393 pyruvate m. sickMPN044 NT m. MPN050 sugar m. sick MPN135 sugar m. MPN394 pyruvate m. sickMPN044 NT m. MPN051 lipid m. sick MPN135 sugar m. MPN428 pyruvate m. sickMPN044 NT m. MPN062 NT m. sick MPN135 sugar m. MPN533 pyruvate m. sickMPN044 NT m. MPN064 NT m. sick MPN135 sugar m. MPN595 PPP sickMPN044 NT m. MPN065 NT m. sick MPN135 sugar m. MPN674 pyruvate m. sickMPN044 NT m. MPN082 PPP sick MPN136 sugar m. MPN251 PPP sickMPN044 NT m. MPN133 sugar m. sick MPN136 sugar m. MPN258 sugar m. sickMPN044 NT m. MPN134 sugar m. sick MPN136 sugar m. MPN259 sugar m. sickMPN044 NT m. MPN135 sugar m. sick MPN136 sugar m. MPN260 sugar m. sickMPN044 NT m. MPN136 sugar m. sick MPN136 sugar m. MPN306 aa m. sickMPN044 NT m. MPN251 PPP sick MPN136 sugar m. MPN307 aa m. sickMPN044 NT m. MPN258 sugar m. sick MPN136 sugar m. MPN320 folate m. sickMPN044 NT m. MPN259 sugar m. sick MPN136 sugar m. MPN386 NT m. sickMPN044 NT m. MPN260 sugar m. sick MPN136 sugar m. MPN390 pyruvate m. sickMPN044 NT m. MPN306 aa m. sick MPN136 sugar m. MPN391 pyruvate m. sickMPN044 NT m. MPN307 aa m. sick MPN136 sugar m. MPN392 pyruvate m. sickMPN044 NT m. MPN320 folate m. SL MPN136 sugar m. MPN393 pyruvate m. sickMPN044 NT m. MPN386 NT m. sick MPN136 sugar m. MPN394 pyruvate m. sickMPN044 NT m. MPN390 pyruvate m. sick MPN136 sugar m. MPN428 pyruvate m. sickMPN044 NT m. MPN391 pyruvate m. sick MPN136 sugar m. MPN533 pyruvate m. sickMPN044 NT m. MPN392 pyruvate m. sick MPN136 sugar m. MPN595 PPP sickMPN044 NT m. MPN393 pyruvate m. sick MPN136 sugar m. MPN674 pyruvate m. sickMPN044 NT m. MPN394 pyruvate m. sick MPN251 PPP MPN258 sugar m. SLMPN044 NT m. MPN428 pyruvate m. sick MPN251 PPP MPN259 sugar m. SLMPN044 NT m. MPN533 pyruvate m. sick MPN251 PPP MPN260 sugar m. SLMPN044 NT m. MPN595 PPP sick MPN251 PPP MPN306 aa m. sickMPN044 NT m. MPN674 pyruvate m. sick MPN251 PPP MPN307 aa m. sickMPN050 sugar m. MPN051 lipid m. sick MPN251 PPP MPN320 folate m. sickMPN050 sugar m. MPN062 NT m. sick MPN251 PPP MPN386 NT m. sickMPN050 sugar m. MPN064 NT m. sick MPN251 PPP MPN390 pyruvate m. sickMPN050 sugar m. MPN065 NT m. sick MPN251 PPP MPN391 pyruvate m. sickMPN050 sugar m. MPN082 PPP sick MPN251 PPP MPN392 pyruvate m. sickMPN050 sugar m. MPN133 sugar m. SL MPN251 PPP MPN393 pyruvate m. sickMPN050 sugar m. MPN134 sugar m. SL MPN251 PPP MPN394 pyruvate m. sickMPN050 sugar m. MPN135 sugar m. SL MPN251 PPP MPN428 pyruvate m. sickMPN050 sugar m. MPN136 sugar m. SL MPN251 PPP MPN533 pyruvate m. sickMPN050 sugar m. MPN251 PPP sick MPN251 PPP MPN674 pyruvate m. sickMPN050 sugar m. MPN258 sugar m. sick MPN253 lipid m. MPN258 sugar m. sickMPN050 sugar m. MPN259 sugar m. sick MPN253 lipid m. MPN259 sugar m. sickMPN050 sugar m. MPN260 sugar m. sick MPN253 lipid m. MPN260 sugar m. sickMPN050 sugar m. MPN306 aa m. sick MPN253 lipid m. MPN306 aa m. sickMPN050 sugar m. MPN307 aa m. sick MPN253 lipid m. MPN307 aa m. sickMPN050 sugar m. MPN320 folate m. sick MPN253 lipid m. MPN320 folate m. sickMPN050 sugar m. MPN386 NT m. sick MPN253 lipid m. MPN386 NT m. sickMPN050 sugar m. MPN390 pyruvate m. sick MPN253 lipid m. MPN390 pyruvate m. sickMPN050 sugar m. MPN391 pyruvate m. sick MPN253 lipid m. MPN391 pyruvate m. sickMPN050 sugar m. MPN392 pyruvate m. sick MPN253 lipid m. MPN392 pyruvate m. sickMPN050 sugar m. MPN393 pyruvate m. sick MPN253 lipid m. MPN393 pyruvate m. sickMPN050 sugar m. MPN394 pyruvate m. sick MPN253 lipid m. MPN394 pyruvate m. sickMPN050 sugar m. MPN428 pyruvate m. sick MPN253 lipid m. MPN428 pyruvate m. sickMPN050 sugar m. MPN533 pyruvate m. sick MPN253 lipid m. MPN533 pyruvate m. sickMPN050 sugar m. MPN595 PPP sick MPN253 lipid m. MPN595 PPP sickMPN050 sugar m. MPN674 pyruvate m. sick MPN253 lipid m. MPN674 pyruvate m. sickMPN051 lipid m. MPN062 NT m. sick MPN258 sugar m. MPN306 aa m. sickMPN051 lipid m. MPN064 NT m. sick MPN258 sugar m. MPN307 aa m. sickMPN051 lipid m. MPN065 NT m. sick MPN258 sugar m. MPN320 folate m. sickMPN051 lipid m. MPN082 PPP sick MPN258 sugar m. MPN386 NT m. sickMPN051 lipid m. MPN251 PPP sick MPN258 sugar m. MPN390 pyruvate m. sickMPN051 lipid m. MPN258 sugar m. sick MPN258 sugar m. MPN391 pyruvate m. sickMPN051 lipid m. MPN259 sugar m. sick MPN258 sugar m. MPN392 pyruvate m. sickMPN051 lipid m. MPN260 sugar m. sick MPN258 sugar m. MPN393 pyruvate m. sickMPN051 lipid m. MPN306 aa m. sick MPN258 sugar m. MPN394 pyruvate m. sickMPN051 lipid m. MPN307 aa m. sick MPN258 sugar m. MPN428 pyruvate m. sickMPN051 lipid m. MPN320 folate m. sick MPN258 sugar m. MPN533 pyruvate m. sickMPN051 lipid m. MPN386 NT m. sick MPN258 sugar m. MPN595 PPP SLMPN051 lipid m. MPN390 pyruvate m. sick MPN258 sugar m. MPN674 pyruvate m. sickMPN051 lipid m. MPN391 pyruvate m. sick MPN259 sugar m. MPN306 aa m. sickMPN051 lipid m. MPN392 pyruvate m. sick MPN259 sugar m. MPN307 aa m. sickMPN051 lipid m. MPN393 pyruvate m. sick MPN259 sugar m. MPN320 folate m. sickMPN051 lipid m. MPN394 pyruvate m. sick MPN259 sugar m. MPN386 NT m. sickMPN051 lipid m. MPN428 pyruvate m. sick MPN259 sugar m. MPN390 pyruvate m. sickMPN051 lipid m. MPN533 pyruvate m. sick MPN259 sugar m. MPN391 pyruvate m. sickMPN051 lipid m. MPN595 PPP sick MPN259 sugar m. MPN392 pyruvate m. sickMPN051 lipid m. MPN674 pyruvate m. sick MPN259 sugar m. MPN393 pyruvate m. sick
Continued on next page
129

A. Chapter 3 Supplementary Material
Table A.13 – continued from previous pageinter- inter-action action
gene 1 pathway 1 gene 2 pathway 2 type gene 1 pathway 1 gene 2 pathway 2 typeMPN062 NT m. MPN064 NT m. sick MPN259 sugar m. MPN394 pyruvate m. sickMPN062 NT m. MPN065 NT m. sick MPN259 sugar m. MPN428 pyruvate m. sickMPN062 NT m. MPN082 PPP sick MPN259 sugar m. MPN533 pyruvate m. sickMPN062 NT m. MPN133 sugar m. sick MPN259 sugar m. MPN595 PPP SLMPN062 NT m. MPN134 sugar m. sick MPN259 sugar m. MPN674 pyruvate m. sickMPN062 NT m. MPN135 sugar m. sick MPN260 sugar m. MPN306 aa m. sickMPN062 NT m. MPN136 sugar m. sick MPN260 sugar m. MPN307 aa m. sickMPN062 NT m. MPN251 PPP sick MPN260 sugar m. MPN320 folate m. sickMPN062 NT m. MPN258 sugar m. sick MPN260 sugar m. MPN386 NT m. sickMPN062 NT m. MPN259 sugar m. sick MPN260 sugar m. MPN390 pyruvate m. sickMPN062 NT m. MPN260 sugar m. sick MPN260 sugar m. MPN391 pyruvate m. sickMPN062 NT m. MPN306 aa m. sick MPN260 sugar m. MPN392 pyruvate m. sickMPN062 NT m. MPN307 aa m. sick MPN260 sugar m. MPN393 pyruvate m. sickMPN062 NT m. MPN320 folate m. sick MPN260 sugar m. MPN394 pyruvate m. sickMPN062 NT m. MPN386 NT m. sick MPN260 sugar m. MPN428 pyruvate m. sickMPN062 NT m. MPN390 pyruvate m. sick MPN260 sugar m. MPN533 pyruvate m. sickMPN062 NT m. MPN391 pyruvate m. sick MPN260 sugar m. MPN595 PPP SLMPN062 NT m. MPN392 pyruvate m. sick MPN260 sugar m. MPN674 pyruvate m. sickMPN062 NT m. MPN393 pyruvate m. sick MPN300 folate m. MPN306 aa m. sickMPN062 NT m. MPN394 pyruvate m. sick MPN300 folate m. MPN307 aa m. sickMPN062 NT m. MPN428 pyruvate m. sick MPN300 folate m. MPN320 folate m. sickMPN062 NT m. MPN533 pyruvate m. sick MPN300 folate m. MPN321 folate m. SLMPN062 NT m. MPN595 PPP sick MPN300 folate m. MPN386 NT m. sickMPN062 NT m. MPN674 pyruvate m. sick MPN300 folate m. MPN390 pyruvate m. sickMPN064 NT m. MPN065 NT m. sick MPN300 folate m. MPN391 pyruvate m. sickMPN064 NT m. MPN073 PPP SL MPN300 folate m. MPN392 pyruvate m. sickMPN064 NT m. MPN082 PPP sick MPN300 folate m. MPN393 pyruvate m. sickMPN064 NT m. MPN133 sugar m. sick MPN300 folate m. MPN394 pyruvate m. sickMPN064 NT m. MPN134 sugar m. sick MPN300 folate m. MPN428 pyruvate m. sickMPN064 NT m. MPN135 sugar m. sick MPN300 folate m. MPN533 pyruvate m. sickMPN064 NT m. MPN136 sugar m. sick MPN300 folate m. MPN595 PPP sickMPN064 NT m. MPN251 PPP sick MPN300 folate m. MPN674 pyruvate m. sickMPN064 NT m. MPN258 sugar m. sick MPN304 aa m. MPN306 aa m. sickMPN064 NT m. MPN259 sugar m. sick MPN304 aa m. MPN307 aa m. sickMPN064 NT m. MPN260 sugar m. sick MPN304 aa m. MPN320 folate m. sickMPN064 NT m. MPN306 aa m. sick MPN304 aa m. MPN386 NT m. sickMPN064 NT m. MPN307 aa m. sick MPN304 aa m. MPN390 pyruvate m. sickMPN064 NT m. MPN320 folate m. SL MPN304 aa m. MPN391 pyruvate m. sickMPN064 NT m. MPN386 NT m. sick MPN304 aa m. MPN392 pyruvate m. sickMPN064 NT m. MPN390 pyruvate m. sick MPN304 aa m. MPN393 pyruvate m. sickMPN064 NT m. MPN391 pyruvate m. sick MPN304 aa m. MPN394 pyruvate m. sickMPN064 NT m. MPN392 pyruvate m. sick MPN304 aa m. MPN428 pyruvate m. sickMPN064 NT m. MPN393 pyruvate m. sick MPN304 aa m. MPN533 pyruvate m. sickMPN064 NT m. MPN394 pyruvate m. sick MPN304 aa m. MPN595 PPP sickMPN064 NT m. MPN428 pyruvate m. sick MPN304 aa m. MPN674 pyruvate m. sickMPN064 NT m. MPN533 pyruvate m. sick MPN305 aa m. MPN306 aa m. sickMPN064 NT m. MPN595 PPP sick MPN305 aa m. MPN307 aa m. sickMPN064 NT m. MPN674 pyruvate m. sick MPN305 aa m. MPN320 folate m. sickMPN065 NT m. MPN082 PPP sick MPN305 aa m. MPN386 NT m. sickMPN065 NT m. MPN133 sugar m. sick MPN305 aa m. MPN390 pyruvate m. sickMPN065 NT m. MPN134 sugar m. sick MPN305 aa m. MPN391 pyruvate m. sickMPN065 NT m. MPN135 sugar m. sick MPN305 aa m. MPN392 pyruvate m. sickMPN065 NT m. MPN136 sugar m. sick MPN305 aa m. MPN393 pyruvate m. sickMPN065 NT m. MPN251 PPP sick MPN305 aa m. MPN394 pyruvate m. sickMPN065 NT m. MPN258 sugar m. sick MPN305 aa m. MPN428 pyruvate m. sickMPN065 NT m. MPN259 sugar m. sick MPN305 aa m. MPN533 pyruvate m. sickMPN065 NT m. MPN260 sugar m. sick MPN305 aa m. MPN595 PPP sickMPN065 NT m. MPN306 aa m. sick MPN305 aa m. MPN674 pyruvate m. sickMPN065 NT m. MPN307 aa m. sick MPN306 aa m. MPN320 folate m. sickMPN065 NT m. MPN386 NT m. sick MPN306 aa m. MPN386 NT m. sickMPN065 NT m. MPN390 pyruvate m. sick MPN306 aa m. MPN390 pyruvate m. sickMPN065 NT m. MPN391 pyruvate m. sick MPN306 aa m. MPN391 pyruvate m. sickMPN065 NT m. MPN392 pyruvate m. sick MPN306 aa m. MPN392 pyruvate m. sickMPN065 NT m. MPN393 pyruvate m. sick MPN306 aa m. MPN393 pyruvate m. sickMPN065 NT m. MPN394 pyruvate m. sick MPN306 aa m. MPN394 pyruvate m. sickMPN065 NT m. MPN428 pyruvate m. sick MPN306 aa m. MPN428 pyruvate m. sickMPN065 NT m. MPN533 pyruvate m. sick MPN306 aa m. MPN533 pyruvate m. sickMPN065 NT m. MPN595 PPP sick MPN306 aa m. MPN595 PPP sickMPN065 NT m. MPN674 pyruvate m. sick MPN306 aa m. MPN674 pyruvate m. sickMPN073 PPP MPN082 PPP sick MPN307 aa m. MPN320 folate m. sickMPN073 PPP MPN133 sugar m. sick MPN307 aa m. MPN386 NT m. sickMPN073 PPP MPN134 sugar m. sick MPN307 aa m. MPN390 pyruvate m. sickMPN073 PPP MPN135 sugar m. sick MPN307 aa m. MPN391 pyruvate m. sickMPN073 PPP MPN136 sugar m. sick MPN307 aa m. MPN392 pyruvate m. sickMPN073 PPP MPN251 PPP sick MPN307 aa m. MPN393 pyruvate m. sickMPN073 PPP MPN258 sugar m. sick MPN307 aa m. MPN394 pyruvate m. sickMPN073 PPP MPN259 sugar m. sick MPN307 aa m. MPN428 pyruvate m. sickMPN073 PPP MPN260 sugar m. sick MPN307 aa m. MPN533 pyruvate m. sickMPN073 PPP MPN306 aa m. sick MPN307 aa m. MPN595 PPP sickMPN073 PPP MPN307 aa m. sick MPN307 aa m. MPN674 pyruvate m. sick
Continued on next page
130

A.4. Tables
Table A.13 – continued from previous pageinter- inter-action action
gene 1 pathway 1 gene 2 pathway 2 type gene 1 pathway 1 gene 2 pathway 2 typeMPN073 PPP MPN320 folate m. sick MPN320 folate m. MPN386 NT m. sickMPN073 PPP MPN386 NT m. sick MPN320 folate m. MPN390 pyruvate m. sickMPN073 PPP MPN390 pyruvate m. sick MPN320 folate m. MPN391 pyruvate m. sickMPN073 PPP MPN391 pyruvate m. sick MPN320 folate m. MPN392 pyruvate m. sickMPN073 PPP MPN392 pyruvate m. sick MPN320 folate m. MPN393 pyruvate m. sickMPN073 PPP MPN393 pyruvate m. sick MPN320 folate m. MPN394 pyruvate m. sickMPN073 PPP MPN394 pyruvate m. sick MPN320 folate m. MPN428 pyruvate m. sickMPN073 PPP MPN428 pyruvate m. sick MPN320 folate m. MPN533 pyruvate m. sickMPN073 PPP MPN533 pyruvate m. sick MPN320 folate m. MPN595 PPP sickMPN073 PPP MPN595 PPP sick MPN320 folate m. MPN674 pyruvate m. sickMPN073 PPP MPN674 pyruvate m. sick MPN321 folate m. MPN386 NT m. sickMPN078 sugar m. MPN082 PPP sick MPN321 folate m. MPN390 pyruvate m. sickMPN078 sugar m. MPN133 sugar m. sick MPN321 folate m. MPN391 pyruvate m. sickMPN078 sugar m. MPN134 sugar m. sick MPN321 folate m. MPN392 pyruvate m. sickMPN078 sugar m. MPN135 sugar m. sick MPN321 folate m. MPN393 pyruvate m. sickMPN078 sugar m. MPN136 sugar m. sick MPN321 folate m. MPN394 pyruvate m. sickMPN078 sugar m. MPN251 PPP sick MPN321 folate m. MPN428 pyruvate m. sickMPN078 sugar m. MPN258 sugar m. sick MPN321 folate m. MPN533 pyruvate m. sickMPN078 sugar m. MPN259 sugar m. sick MPN321 folate m. MPN595 PPP sickMPN078 sugar m. MPN260 sugar m. sick MPN321 folate m. MPN674 pyruvate m. sickMPN078 sugar m. MPN306 aa m. sick MPN386 NT m. MPN390 pyruvate m. sickMPN078 sugar m. MPN307 aa m. sick MPN386 NT m. MPN391 pyruvate m. sickMPN078 sugar m. MPN320 folate m. sick MPN386 NT m. MPN392 pyruvate m. sickMPN078 sugar m. MPN386 NT m. sick MPN386 NT m. MPN393 pyruvate m. sickMPN078 sugar m. MPN390 pyruvate m. sick MPN386 NT m. MPN394 pyruvate m. sickMPN078 sugar m. MPN391 pyruvate m. sick MPN386 NT m. MPN428 pyruvate m. sickMPN078 sugar m. MPN392 pyruvate m. sick MPN386 NT m. MPN533 pyruvate m. sickMPN078 sugar m. MPN393 pyruvate m. sick MPN386 NT m. MPN595 PPP sickMPN078 sugar m. MPN394 pyruvate m. sick MPN386 NT m. MPN674 pyruvate m. sickMPN078 sugar m. MPN428 pyruvate m. sick MPN390 pyruvate m. MPN394 pyruvate m. sickMPN078 sugar m. MPN533 pyruvate m. sick MPN390 pyruvate m. MPN595 PPP sickMPN078 sugar m. MPN595 PPP sick MPN390 pyruvate m. MPN674 pyruvate m. SLMPN078 sugar m. MPN674 pyruvate m. sick MPN391 pyruvate m. MPN394 pyruvate m. sickMPN079 sugar m. MPN082 PPP sick MPN391 pyruvate m. MPN420 lipid m. sickMPN079 sugar m. MPN133 sugar m. sick MPN391 pyruvate m. MPN595 PPP sickMPN079 sugar m. MPN134 sugar m. sick MPN391 pyruvate m. MPN674 pyruvate m. SLMPN079 sugar m. MPN135 sugar m. sick MPN392 pyruvate m. MPN394 pyruvate m. sickMPN079 sugar m. MPN136 sugar m. sick MPN392 pyruvate m. MPN595 PPP sickMPN079 sugar m. MPN251 PPP sick MPN392 pyruvate m. MPN674 pyruvate m. SLMPN079 sugar m. MPN258 sugar m. sick MPN393 pyruvate m. MPN394 pyruvate m. sickMPN079 sugar m. MPN259 sugar m. sick MPN393 pyruvate m. MPN595 PPP sickMPN079 sugar m. MPN260 sugar m. sick MPN393 pyruvate m. MPN674 pyruvate m. SLMPN079 sugar m. MPN306 aa m. sick MPN394 pyruvate m. MPN428 pyruvate m. sickMPN079 sugar m. MPN307 aa m. sick MPN394 pyruvate m. MPN533 pyruvate m. sickMPN079 sugar m. MPN320 folate m. sick MPN394 pyruvate m. MPN595 PPP sickMPN079 sugar m. MPN386 NT m. sick MPN394 pyruvate m. MPN674 pyruvate m. SLMPN079 sugar m. MPN390 pyruvate m. sick MPN420 lipid m. MPN428 pyruvate m. sickMPN079 sugar m. MPN391 pyruvate m. sick MPN420 lipid m. MPN533 pyruvate m. sickMPN079 sugar m. MPN392 pyruvate m. sick MPN420 lipid m. MPN595 PPP sickMPN079 sugar m. MPN393 pyruvate m. sick MPN420 lipid m. MPN674 pyruvate m. sickMPN079 sugar m. MPN394 pyruvate m. sick MPN428 pyruvate m. MPN595 PPP sickMPN079 sugar m. MPN428 pyruvate m. sick MPN428 pyruvate m. MPN674 pyruvate m. SLMPN079 sugar m. MPN533 pyruvate m. sick MPN445 lipid m. MPN533 pyruvate m. sickMPN079 sugar m. MPN595 PPP sick MPN445 lipid m. MPN595 PPP sickMPN079 sugar m. MPN674 pyruvate m. sick MPN445 lipid m. MPN674 pyruvate m. sickMPN082 PPP MPN133 sugar m. sick MPN479 CoA m. MPN533 pyruvate m. sickMPN082 PPP MPN134 sugar m. sick MPN479 CoA m. MPN595 PPP sickMPN082 PPP MPN135 sugar m. sick MPN479 CoA m. MPN674 pyruvate m. sickMPN082 PPP MPN136 sugar m. sick MPN492 PPP MPN533 pyruvate m. sickMPN082 PPP MPN258 sugar m. SL MPN492 PPP MPN595 PPP sickMPN082 PPP MPN259 sugar m. SL MPN492 PPP MPN674 pyruvate m. sickMPN082 PPP MPN260 sugar m. SL MPN493 sugar m. MPN533 pyruvate m. sickMPN082 PPP MPN306 aa m. sick MPN493 sugar m. MPN595 PPP sickMPN082 PPP MPN307 aa m. sick MPN493 sugar m. MPN674 pyruvate m. sickMPN082 PPP MPN320 folate m. sick MPN494 sugar m. MPN533 pyruvate m. sickMPN082 PPP MPN386 NT m. sick MPN494 sugar m. MPN595 PPP sickMPN082 PPP MPN390 pyruvate m. sick MPN494 sugar m. MPN674 pyruvate m. sickMPN082 PPP MPN391 pyruvate m. sick MPN495 sugar m. MPN533 pyruvate m. sickMPN082 PPP MPN392 pyruvate m. sick MPN495 sugar m. MPN595 PPP sickMPN082 PPP MPN393 pyruvate m. sick MPN495 sugar m. MPN674 pyruvate m. sickMPN082 PPP MPN394 pyruvate m. sick MPN496 sugar m. MPN533 pyruvate m. sickMPN082 PPP MPN428 pyruvate m. sick MPN496 sugar m. MPN595 PPP sickMPN082 PPP MPN533 pyruvate m. sick MPN496 sugar m. MPN674 pyruvate m. sickMPN082 PPP MPN674 pyruvate m. sick MPN497 sugar m. MPN533 pyruvate m. sickMPN108 aa m. MPN082 PPP sick MPN497 sugar m. MPN595 PPP sickMPN108 aa m. MPN133 sugar m. sick MPN497 sugar m. MPN674 pyruvate m. sickMPN108 aa m. MPN134 sugar m. sick MPN498 PPP MPN533 pyruvate m. sickMPN108 aa m. MPN135 sugar m. sick MPN498 PPP MPN595 PPP sickMPN108 aa m. MPN136 sugar m. sick MPN498 PPP MPN674 pyruvate m. sickMPN108 aa m. MPN251 PPP sick MPN533 pyruvate m. MPN595 PPP sick
Continued on next page
131

A. Chapter 3 Supplementary Material
Table A.13 – continued from previous pageinter- inter-action action
gene 1 pathway 1 gene 2 pathway 2 type gene 1 pathway 1 gene 2 pathway 2 typeMPN108 aa m. MPN258 sugar m. sick MPN533 pyruvate m. MPN674 pyruvate m. SLMPN108 aa m. MPN259 sugar m. sick MPN560 aa m. MPN674 pyruvate m. sickMPN108 aa m. MPN260 sugar m. sick MPN564 pyruvate m. MPN674 pyruvate m. sickMPN108 aa m. MPN306 aa m. sick MPN595 PPP MPN674 pyruvate m. sickMPN108 aa m. MPN307 aa m. sick MPN609 sugar m. MPN674 pyruvate m. sickMPN108 aa m. MPN320 folate m. sick MPN610 sugar m. MPN674 pyruvate m. sickMPN108 aa m. MPN386 NT m. sick MPN611 sugar m. MPN674 pyruvate m. sickMPN108 aa m. MPN390 pyruvate m. sick MPN637 lipid m. MPN674 pyruvate m. sickMPN108 aa m. MPN391 pyruvate m. sick MPN651 sugar m. MPN674 pyruvate m. sickMPN108 aa m. MPN392 pyruvate m. sick MPN652 sugar m. MPN674 pyruvate m. sickMPN108 aa m. MPN393 pyruvate m. sick MPN653 sugar m. MPN674 pyruvate m. sick
Table A.13.: Synthetic lethal and sick interactions: Pairs of genes with their respec-tive pathway affiliations and the type of interaction when simulating doubleknock-outs in silico are shown; metabolism is abbreviated by 'm.'.
Table A.14: Energetic Expenditures in M. pneumoniaetime of growth in hours 24 36 48 60 sourcetotal ATP produced 49359 60702 67683 77666 in silico resultATP used for DNA production 27 31 22 10 in silico resultATP used for RNA production 5071 5079 5059 5034 in silico resultATP used for protein production 5464 5961 4694 3168 in silico resultATP used for protein degradation 648 648 648 648 in silico result (based on half-
life [Maier et al., 2011])ATP used for lipid production 227 258 180 85 in silico resultATP used for other defined func-tions
2564 2962 1947 726 in silico result
ATP used max. for protein fold-ing
174 161 161 175 upper boundary calculation
ATP used max. for DNA degra-dation & repair
5 6 4 2 upper boundary calculation
ATP used max for post-translational modifications
14 17 18 20 upper boundary calculation
ATP used max by ATPase(130rps)
39780 38610 38610 58500 upper boundary calculation
rest ATP -4616 6970 16341 9297 total ATP - defined expenses
Table A.14.: The ATP produced and used for various cellular functions at different timepoints of the exponential growth phase in batch culture growth, as well asthe source for the respective amount are shown. In silico results have beenextracted from the respective predicted flux distributions, upper boundarycalculations are described in detail in section 3.3.7.
Table A.15: In Silico Fluxes of M. pneumoniaereaction ID 24h 36h 48h 60h
M001 5.10836 7.369 9.69714 12.3776M002 5.0835 7.34078 9.67749 12.3683M003 5.16243 7.45648 9.8343 12.5723M004 5.16243 7.45648 9.8343 12.5723M005 -5.40839 -7.81419 -10.3117 -13.1877M006 10.6103 15.3285 20.2244 25.862M007 -10.6103 -15.3285 -20.2244 -25.862M008 -10.6103 -15.3285 -20.2244 -25.862M009 10.6103 15.3285 20.2244 25.862
Continued on next page
132

A.4. Tables
Table A.15 – continued from previous pagereaction ID 24h 36h 48h 60h
M010 4.9216 7.37505 9.95335 12.9233M011 -3.16668 -8.39742 -15.6053 -23.1843M012 7.4436 6.9311 4.6191 2.6777M013 -7.4436 -6.9311 -4.6191 -2.6777M014 7.4436 6.9311 4.6191 2.6777M015 7.4436 6.9311 4.6191 2.6777M016 -7.4436 -6.9311 -4.6191 -2.6777M017 7.44291 6.93027 4.61863 2.67759M018 0.0922169 0.100645 0.0791637 0.0533939M019 0 0 0 0M020 0 0 0 0M021 0 0 0 0M022 0 0 0 0M023 0 0 0 0M024 0 0 0 0M025 0 0 0 0M026 0 0 0 0M027 0 0 0 0M028 0 0 0 0M029 0 0 0 0M030 0 0 0 0M031 0 0 0 0M032 0.127709 0.184225 0.242428 0.30944M033 0.127709 0.184225 0.242428 0.30944M034 -0.0394621 -0.0578489 -0.0784016 -0.102028M035 0.0394621 0.0578489 0.0784016 0.102028M036 -0.0394621 -0.0578489 -0.0784016 -0.102028M037 0.0789242 0.115698 0.156803 0.204056M038 0.0789242 0.115698 0.156803 0.204056M039 0 0 0 0M040 -0.00932266 -0.0106783 -0.00722312 -0.00335526M041 0 0 0 0M042 0 0 0 0M043 0 0 0 0M044 -0.127709 -0.184225 -0.242428 -0.30944M045 0.127709 0.184225 0.242428 0.30944M046 0.127709 0.184225 0.242428 0.30944M047 0.245959 0.357712 0.477379 0.615333M048 0.01 0.01 0.01 0.01M049 0.01 0.01 0.01 0.01M050 0.00945854 0.0107382 0.00747673 0.00354742M051 0.00945854 0.0107382 0.00747673 0.00354742M052 0 0 0 0M053 0 0 0 0M054 0 0 0 0M055 0 0 0 0M056 0.00284386 0.0032286 0.00224799 0.00106659M057 -0.0170631 -0.0193716 -0.013488 -0.00639952M058 0.0170631 0.0193716 0.013488 0.00639952M059 0.00853157 0.00968581 0.00674398 0.00319976M060 0.00284386 0.0032286 0.00224799 0.00106659M061 4.46E-06 5.07E-06 3.53E-06 1.67E-06M062 4.46E-06 5.07E-06 3.53E-06 1.67E-06M063 0 0 0 0M064 0 0 0 0M065 -0.00281929 -0.00468143 -0.00315359 -0.00146034M066 -8.84E-05 -0.000100403 -6.99E-05 -3.32E-05M067 0 0 0 0M068 0.613989 0.651928 0.558451 0.446129M069 0 0.00143352 0.000998121 0.00047357
Continued on next page
133

A. Chapter 3 Supplementary Material
Table A.15 – continued from previous pagereaction ID 24h 36h 48h 60h
M070 0.00126269 0.00143352 0.000998121 0.000621014M071 0.00783096 0.00784313 0.00781211 0.00777474M072 1.1943 1.23496 1.13134 1.00678M073 -0.00217501 -0.00103576 -0.000721171 -0.000342168M074 0.00217501 0.00103576 0.000721171 0.000342168M075 0.00217501 0.00103576 0.000721171 0.000342168M076 0.00217501 0.00246927 0.00171929 0.000815738M077 0 0 0 0M078 7.25E-05 8.23E-05 5.73E-05 2.72E-05M079 -0.00378145 -0.00285953 -0.00199102 -0.000944662M080 -7.40E-05 -8.40E-05 -5.85E-05 -2.77E-05M081 0 0 0 0M082 0.220529 0.219608 0.218739 0.217693M083 0.00126269 0 0 0M084 0.219267 0.219608 0.218739 0.217693M085 0 0 0 0M086 -0.000187323 -0.00164618 -0.00114619 -0.000543825M087 0.000187323 0.00164618 0.00114619 0.000543825M088 0.000187323 0.00164618 0.00114619 0.000543825M089 0.00145001 0.00164618 0.00114619 0.000543825M090 0 0 0 0M091 0.00679791 0.00781201 0.00522737 0.00240835M092 -0.00916025 -0.010494 -0.00709473 -0.00329435M093 0 0 0 0M094 0.00904681 0.0103652 0.00700506 0.0032518M095 0.195774 0.196078 0.195303 0.194368M096 0.212837 0.21545 0.208791 0.200768M097 0 0 0 0M098 0 0 0 0M099 0.00162367 0.00184334 0.00128347 0.000756401M100 0 0 0 0M101 0.140962 0.141181 0.140621 0.140094M102 0.140962 0.141181 0.140621 0.139947M103 0 0 0 0.000147444M104 0.00145001 0.00164618 0.00114619 0.000396382M105 0 0 0 0M106 0.00145001 0.00164618 0.00114619 0.000396382M107 0.00145001 0.00164618 0.00114619 0.000543825M108 0.00459279 0.00521416 0.00363049 0.00172253M109 0.00236234 0.00268194 0.00186737 0.000885993M110 0.00223046 0.00253222 0.00176312 0.000836533M111 0 0 0 0M112 0 0 0 0M113 0.00223046 0.00253222 0.00176312 0.000836533M114 0 0 0 0M115 0 0 0 0M116 5.54E-05 6.29E-05 4.38E-05 2.08E-05M117 0.00217501 0.00246927 0.00171929 0.000815738M118 0.00217501 0.00246927 0.00171929 0.000815738M119 0.240511 0.239227 0.242499 0.246441M120 -0.240511 -0.239227 -0.242499 -0.246441M121 -0.240511 -0.239227 -0.242499 -0.246441M122 -4.46E-06 -5.07E-06 -3.53E-06 -1.67E-06M123 -0.00223492 -0.00253729 -0.00176665 -0.000838208M124 0 0 0 0M125 0.00106551 0.00116246 0.000915358 0.000617665M126 0.00106551 0.00116246 0.000915363 0.000617665M127 -0.00330044 -0.00369975 -0.00268201 -0.00145587M128 0.00106998 0.00116753 0.000918892 0.000619339M129 0.00999554 0.00999493 0.00999647 0.00999833
Continued on next page
134
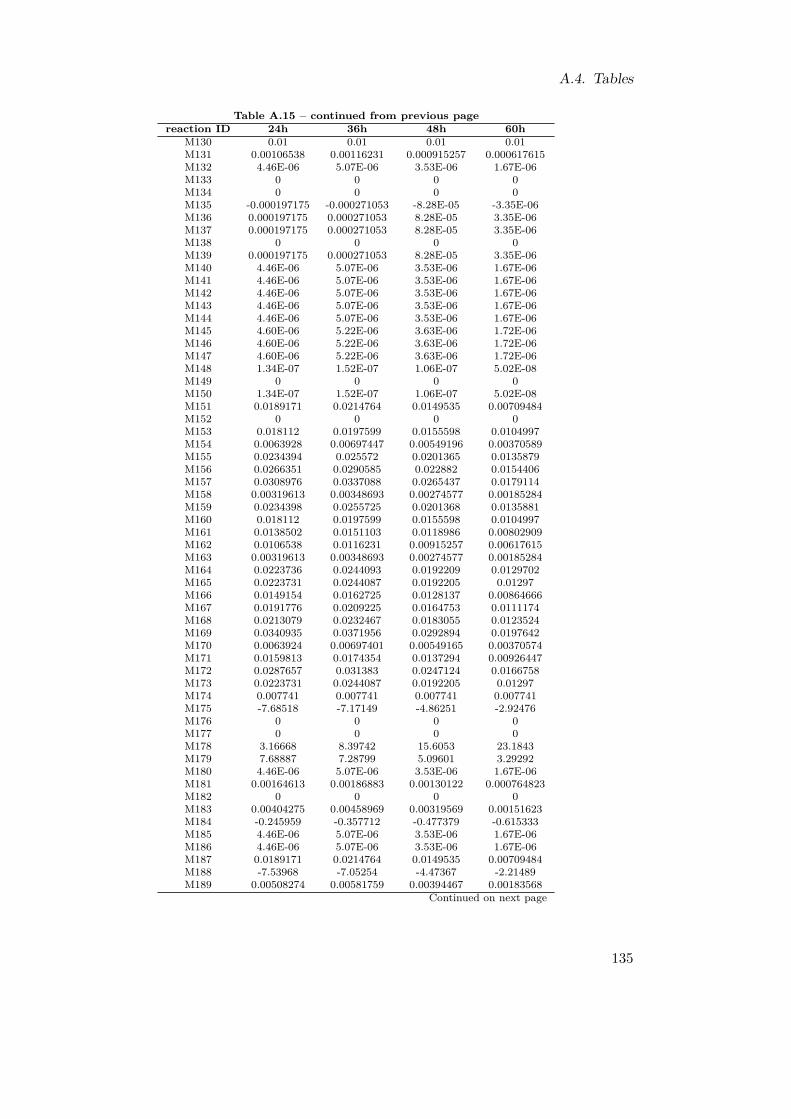
A.4. Tables
Table A.15 – continued from previous pagereaction ID 24h 36h 48h 60h
M130 0.01 0.01 0.01 0.01M131 0.00106538 0.00116231 0.000915257 0.000617615M132 4.46E-06 5.07E-06 3.53E-06 1.67E-06M133 0 0 0 0M134 0 0 0 0M135 -0.000197175 -0.000271053 -8.28E-05 -3.35E-06M136 0.000197175 0.000271053 8.28E-05 3.35E-06M137 0.000197175 0.000271053 8.28E-05 3.35E-06M138 0 0 0 0M139 0.000197175 0.000271053 8.28E-05 3.35E-06M140 4.46E-06 5.07E-06 3.53E-06 1.67E-06M141 4.46E-06 5.07E-06 3.53E-06 1.67E-06M142 4.46E-06 5.07E-06 3.53E-06 1.67E-06M143 4.46E-06 5.07E-06 3.53E-06 1.67E-06M144 4.46E-06 5.07E-06 3.53E-06 1.67E-06M145 4.60E-06 5.22E-06 3.63E-06 1.72E-06M146 4.60E-06 5.22E-06 3.63E-06 1.72E-06M147 4.60E-06 5.22E-06 3.63E-06 1.72E-06M148 1.34E-07 1.52E-07 1.06E-07 5.02E-08M149 0 0 0 0M150 1.34E-07 1.52E-07 1.06E-07 5.02E-08M151 0.0189171 0.0214764 0.0149535 0.00709484M152 0 0 0 0M153 0.018112 0.0197599 0.0155598 0.0104997M154 0.0063928 0.00697447 0.00549196 0.00370589M155 0.0234394 0.025572 0.0201365 0.0135879M156 0.0266351 0.0290585 0.022882 0.0154406M157 0.0308976 0.0337088 0.0265437 0.0179114M158 0.00319613 0.00348693 0.00274577 0.00185284M159 0.0234398 0.0255725 0.0201368 0.0135881M160 0.018112 0.0197599 0.0155598 0.0104997M161 0.0138502 0.0151103 0.0118986 0.00802909M162 0.0106538 0.0116231 0.00915257 0.00617615M163 0.00319613 0.00348693 0.00274577 0.00185284M164 0.0223736 0.0244093 0.0192209 0.0129702M165 0.0223731 0.0244087 0.0192205 0.01297M166 0.0149154 0.0162725 0.0128137 0.00864666M167 0.0191776 0.0209225 0.0164753 0.0111174M168 0.0213079 0.0232467 0.0183055 0.0123524M169 0.0340935 0.0371956 0.0292894 0.0197642M170 0.0063924 0.00697401 0.00549165 0.00370574M171 0.0159813 0.0174354 0.0137294 0.00926447M172 0.0287657 0.031383 0.0247124 0.0166758M173 0.0223731 0.0244087 0.0192205 0.01297M174 0.007741 0.007741 0.007741 0.007741M175 -7.68518 -7.17149 -4.86251 -2.92476M176 0 0 0 0M177 0 0 0 0M178 3.16668 8.39742 15.6053 23.1843M179 7.68887 7.28799 5.09601 3.29292M180 4.46E-06 5.07E-06 3.53E-06 1.67E-06M181 0.00164613 0.00186883 0.00130122 0.000764823M182 0 0 0 0M183 0.00404275 0.00458969 0.00319569 0.00151623M184 -0.245959 -0.357712 -0.477379 -0.615333M185 4.46E-06 5.07E-06 3.53E-06 1.67E-06M186 4.46E-06 5.07E-06 3.53E-06 1.67E-06M187 0.0189171 0.0214764 0.0149535 0.00709484M188 -7.53968 -7.05254 -4.47367 -2.21489M189 0.00508274 0.00581759 0.00394467 0.00183568
Continued on next page
135

A. Chapter 3 Supplementary Material
Table A.15 – continued from previous pagereaction ID 24h 36h 48h 60h
M190 0.000197175 0.000271053 8.28E-05 3.35E-06M191 4.60E-06 5.22E-06 3.63E-06 1.72E-06M192 0.0184901 0.0209444 0.014689 0.00715274M193 0.00436503 0.00495557 0.00345044 0.0016371M194 0.485417 0.483397 0.488546 0.494601M195 4.46E-06 5.07E-06 3.53E-06 1.67E-06M196 4.46E-06 5.07E-06 3.53E-06 1.67E-06M197 0.240511 0.239227 0.242499 0.246441M198 7.4436 6.9311 4.6191 2.6777M199 0 0 0 0M200 0 0 0 0M201 0 0 0 0M202 0 0 0 0M203 0 0 0 0M204 0 0 0 0M205 0 0 0 0M206 0 0 0 0M207 0 0 0 0M208 0 0 0 0M209 0 0 0 0M210 0 0 0 0M211 0 0 0 0M212 0 0 0 0M213 0 0 0 0M214 0 0 0 0M215 0 0 0 0M216 0 0 0 0M217 0 0 0 0M218 0 0 0 0M219 0 0 0 0M220 0.0060428 0.00686034 0.00477668 0.00211891M221 0.00948916 0.010773 0.00750094 0.00355891M222 0.0133134 0.0151146 0.0105239 0.00499318M223 0.00215242 0.00244363 0.00170144 0.000807266M224 0.0165966 0.018842 0.0131192 0.00622456M225 0.0121573 0.0138493 0.00953696 0.00434156M226 0.0158465 0.0179904 0.0125263 0.00594323M227 0.019784 0.0224606 0.0156387 0.00741998M228 0.0143324 0.0162714 0.0113294 0.00537535M229 0.0217309 0.0246709 0.0171777 0.00815018M230 0.0121938 0.0138435 0.00963887 0.00457327M231 0.00440712 0.00500337 0.00348372 0.00165289M232 0.0230065 0.026119 0.018186 0.00862857M233 0.010336 0.0117344 0.00817038 0.00387653M234 0.0109765 0.0124615 0.00867663 0.00411673M235 0.0151573 0.0172079 0.0119814 0.00568473M236 0.00223265 0.0025347 0.00176485 0.000837354M237 0.00722576 0.00820333 0.00571177 0.00271002M238 0.0180373 0.0204776 0.014258 0.00676488M239 0 0 0 0M240 0.0945652 0.146456 0.216448 0.297221M241 3.16668 8.39742 15.6053 23.1843M242 0 0 0 0M243 7.4436 6.9311 4.6191 2.6777M244 -0.00508274 -0.00581759 -0.00394467 -0.00183568M245 0 0 0 0M246 0.0446431 0.0506829 0.0352892 0.0167434M247 7.68518 7.17149 4.86251 2.92476M248 -0.0121573 -0.0138493 -0.00953696 -0.00434156M249 0.245959 0.357712 0.477379 0.615333
Continued on next page
136
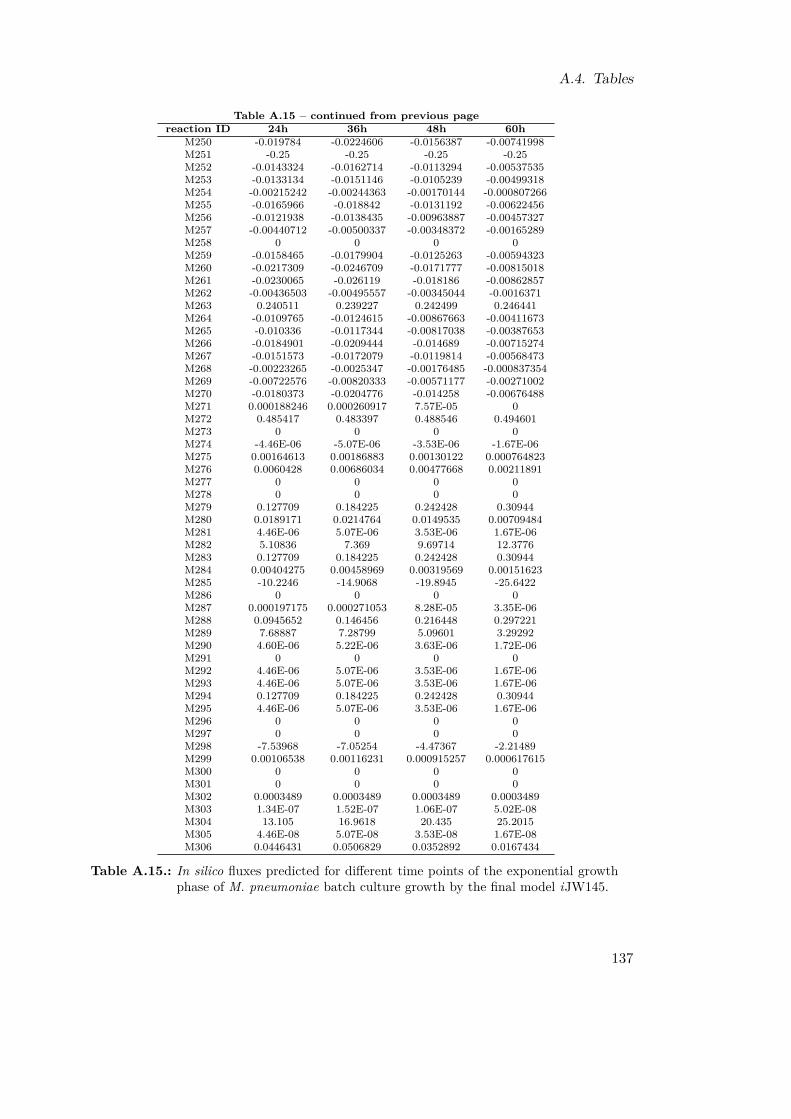
A.4. Tables
Table A.15 – continued from previous pagereaction ID 24h 36h 48h 60h
M250 -0.019784 -0.0224606 -0.0156387 -0.00741998M251 -0.25 -0.25 -0.25 -0.25M252 -0.0143324 -0.0162714 -0.0113294 -0.00537535M253 -0.0133134 -0.0151146 -0.0105239 -0.00499318M254 -0.00215242 -0.00244363 -0.00170144 -0.000807266M255 -0.0165966 -0.018842 -0.0131192 -0.00622456M256 -0.0121938 -0.0138435 -0.00963887 -0.00457327M257 -0.00440712 -0.00500337 -0.00348372 -0.00165289M258 0 0 0 0M259 -0.0158465 -0.0179904 -0.0125263 -0.00594323M260 -0.0217309 -0.0246709 -0.0171777 -0.00815018M261 -0.0230065 -0.026119 -0.018186 -0.00862857M262 -0.00436503 -0.00495557 -0.00345044 -0.0016371M263 0.240511 0.239227 0.242499 0.246441M264 -0.0109765 -0.0124615 -0.00867663 -0.00411673M265 -0.010336 -0.0117344 -0.00817038 -0.00387653M266 -0.0184901 -0.0209444 -0.014689 -0.00715274M267 -0.0151573 -0.0172079 -0.0119814 -0.00568473M268 -0.00223265 -0.0025347 -0.00176485 -0.000837354M269 -0.00722576 -0.00820333 -0.00571177 -0.00271002M270 -0.0180373 -0.0204776 -0.014258 -0.00676488M271 0.000188246 0.000260917 7.57E-05 0M272 0.485417 0.483397 0.488546 0.494601M273 0 0 0 0M274 -4.46E-06 -5.07E-06 -3.53E-06 -1.67E-06M275 0.00164613 0.00186883 0.00130122 0.000764823M276 0.0060428 0.00686034 0.00477668 0.00211891M277 0 0 0 0M278 0 0 0 0M279 0.127709 0.184225 0.242428 0.30944M280 0.0189171 0.0214764 0.0149535 0.00709484M281 4.46E-06 5.07E-06 3.53E-06 1.67E-06M282 5.10836 7.369 9.69714 12.3776M283 0.127709 0.184225 0.242428 0.30944M284 0.00404275 0.00458969 0.00319569 0.00151623M285 -10.2246 -14.9068 -19.8945 -25.6422M286 0 0 0 0M287 0.000197175 0.000271053 8.28E-05 3.35E-06M288 0.0945652 0.146456 0.216448 0.297221M289 7.68887 7.28799 5.09601 3.29292M290 4.60E-06 5.22E-06 3.63E-06 1.72E-06M291 0 0 0 0M292 4.46E-06 5.07E-06 3.53E-06 1.67E-06M293 4.46E-06 5.07E-06 3.53E-06 1.67E-06M294 0.127709 0.184225 0.242428 0.30944M295 4.46E-06 5.07E-06 3.53E-06 1.67E-06M296 0 0 0 0M297 0 0 0 0M298 -7.53968 -7.05254 -4.47367 -2.21489M299 0.00106538 0.00116231 0.000915257 0.000617615M300 0 0 0 0M301 0 0 0 0M302 0.0003489 0.0003489 0.0003489 0.0003489M303 1.34E-07 1.52E-07 1.06E-07 5.02E-08M304 13.105 16.9618 20.435 25.2015M305 4.46E-08 5.07E-08 3.53E-08 1.67E-08M306 0.0446431 0.0506829 0.0352892 0.0167434
Table A.15.: In silico fluxes predicted for different time points of the exponential growthphase of M. pneumoniae batch culture growth by the final model iJW145.
137

A. Chapter 3 Supplementary Material
Table A.16: Fitting Parameters for One-phase Exponential Decay FunctionsG3P G1P R5P G6P F6P FBP DHAP
span -77.1 -99.23 -88.62 -99.52 -99.36 -99.53 -98.9K 0.3716 31510000 0.3764 16.63 11.42 16.37 18.49
plateau 77.1 99.23 88.62 99.52 99.36 99.53 98.9R2 0.8173 0.9998 0.9679 0.9998 0.9996 1 0.9999
Table A.16.: Paramters for fitting a one-phase exponential decay function (section 3.2.1,Equation 3.4) to the incorporation rate of heavy labeled isotop incorporationinto intracellular pools of glycolytic intermediates and key metabolites ofpathway interconnecting branches.
Table A.17: Fitting Parameters for Two-phase Exponential Decay FunctionsG3P G1P R5P G6P F6P FBP DHAP
Y0 0.7979 0 0 0 0 1.911E-09 1.204E-08part1 0.4616 0.3242 0.7369 0.9782 0.9188 0.2902 0.3242span1 -45.58858536 -32.170366 -73.17417 -97.67327 -91.659488 -28.883606 -32.12822K1 1.478 2693 0.6003 707600000 28480000 16.43 18.38
span2 99.56 99.23 99.3 99.85 99.76 99.53 99.1K2 -53.17351464 -67.059634 -26.12583 -2.17673 -8.100512 -70.646394 -66.97177999
plateau 0.01663 2693 0.01574 0.404 0.6142 16.35 17.46R2 0.9973 0.9998 0.9995 1 1 1 0.9998
Table A.17.: Paramters for fitting a two-phase exponential decay function (section 3.2.1,Equation 3.5) to the incorporation rate of heavy labeled isotope into intra-cellular pools of glycolytic intermediates and key metabolites of pathwayinterconnecting branches.
138

A.4. Tables
Table A.18: Comparative Calculations for M. pneumoniae and E. coliproperty Mpn E.coli unitvolume 6.70E-17 1.10E-06 literproteins 130000 2350000 molecules/cellmRNA 230 4352 molecules/cell
average mRNA length 1035 705 bases/cellprotein:mRNA 565.22 540 proteins/mRNAmRNA half-life 1 3.69 minbases in mRNA 238050 3068056 molecules/cell
surface (assuming ideal sphere form) 7.97751E-11 0.000515323 m2
suface:volume 1190672.714 468.4750222 m2/literATP to de novo synthesize mRNA 1047420 13499444 molecules/replicationATP to account for mRNA half-life 338164308 175602529 molecules/replicationtotal ATP used for mRNA synthesis 339211728 189101974 molecules
during 1 cell replicationribosomes 190 20100 molecules/cell
average rRNA length 4523 4566 nucleotidesbases in rRNA 859370 91776600 nucleotides/cell
ATPs to replicate rRNA of 1 cell 3781228 403817040 molecules/replicationtRNA per cell 3300 58000 molecules
average tRNA length 80 80 nucleotidesbases in tRNA 264000 4640000 nucleotides/cell
ATP to replicate tRNA 1161600 20416000 molecules/replicationbases in DNA 1632788 9279350 nucleotides/cell
ATP for DNA replication 8817055.2 50108490 molecules/replicationaverage protein length 345 235 amino acids
peptide bonds in the proteome 44720000 549900000 cell−1
ATP for de novo protein synthesis 196768000 2419560000 molecules/replicationaverage protein half-life 23 - hours
ATP to account for protein 92068758 - molecules/replicationsynthesis due to turnover
ATP for protein degradation 76723965 - molecules/replicationATP to account for protein turnover 168792723 - molecules/replication
ATP used for DNA, RNA 718532335 3083003504 molecules/replication& protein replication
ATP used for DNA, RNA 18481 1284585 molecules/second& protein replication
ATP used for protein replication 50.88 78.48 % of total ATP used for pro-tein, DNA & RNA production
Table A.18.: In the upper part of the table, the information extracted from Yus et al. [2009]and the Bionumbers database [Milo et al., 2010] and used for the calculationsare listed, the second part contains calculations on the surface to volumeratio for both organisms and on the dedication of energy to the productionof major biomass building blocks.
139


B. Supplementary Material for Chapter 4
B.1. PseudocodeScript for Translating Nucleotide Sequences Into All Putatively EncodedPeptides:
var1 = 0pos = 0while (NT sequence != "") do {if (var1 = 0) do {if codon(pos) is TSC do {protein = ”M”determine start position from posvar1 = 1
}}else do {
if (codon(pos) != stop codon) do {add amino acid(codon) to protein
}else do {print protein sequence to the list of peptidesvar1 = 0
}}cut off the first 3 NTs from NT sequencepos = pos + 3if length(NT sequence < 3) do {NT sequence = ""
}}
Thereby, pos defines the position of the sequence, at which the script is momentaneouslyworking (this can be either an internal position of the sequence or a genome position),NT sequence is the DNA sequence that shall be translated into peptides, codon(pos)stands for the DNA codon starting at position pos, amino acid(codon) is the amino acidencoded by codon, and protein contains the translated amino acid sequence.
141

B. Chapter 4 Supplementary Material
B.2. TablesTable B.1: Genome Re-annotation
prediction fromgene ID TSC transcripts or re- 5’-(re-anno- TSC re-anno- theoretical anno- UTRtated) str. TSS1 TTS NCBI tated stop transcriptome tation >40bp
MPN001 + 655 692 692 1834 alternative TSS597 → 2 transcripts
MPN002 + 2720 1838 1838 2767MPN003 + 2800 2869 2869 4821 yesMPN004 + 4821 4821 7340MPN005 + 7225 7312 7312 8574 yesMPN006 + 8579 8549 9211 putative longer longer yesMPN007 + 10000 9184 9184 9945MPN008 + 11310 9947 9947 11275MPN009 + 11960 11275 11275 12060
MPN010 + 12342/ 12750 12257 12392 12652 alternative TSS → 2 shorter12372 transcripts or shorterMPN011 - 12865 13533 13533 12838MPN012 - 14310 13450 14265 14265 13558 yes
MPN013 + 15030/ 15800 14992 15088 15765 alternative TSS → 2 shorter15132 transcripts or shorter
MPN014 + 15890/ 160125 15867 15939 16505 alternative TSS → 2 shorter15880 transcripts or shorterMPN015 - 16170 17339 17339 16482MPN016 - 18345 17493 18205 18205 17339 yesMPN017 - 19032 18345 18989 18989 18180 yesMPN018 + 19314 19325 19325 21196MPN019 + 23120 21108 21108 23012MPN020 + 22876 23022 23022 26114 yesMPN021 + 26140 26160 26160 27332MPN022 + 28550 27316 27316 28245MPN023 + 29803 28245 28245 29783MPN024 + 29803 29804 29804 30244MPN025 + 31200 30244 30244 31110MPN026 + 31085 32900 31111 31111 32199MPN027 - 33036 31925 33026 33026 32202MPN028 + 33046 33960 33059 33059 33958MPN029 + 33800 33979 33979 34551 putative NEW yesMPN030 + 35000 34469 34469 34975MPN031 + 36000 34975 34975 35586MPN032 - 35800 36136 36136 35810MPN033 - 36760 36760 36140MPN034 - 41131 41131 36800MPN035 + 41322 43400 41409 41409 43409 yesMPN035a - 42050 42013 41696 alternative TSS → NEW NEWMPN036 + 43500 45640 43581 43581 45602 yesMPN037 + 45770 45770 46213MPN037a - 46145/ 45765 46068 45736 alternative TSS → NEW NEW
46025MPN038 - 46750 46480 46792 46711 46442 putative shorter shorter yesMPN039 + 47103 48050 47194 47194 48210 yesMPN040 - 48416 48416 48105MPN041 + 48550 48670 48670 49230 yesMPN042 + 48961 49292 49292 51310 putative NEW yesMPN043 + 51580 52600 51634 51634 52428 yesMPN044 - 53069 52400 53050 53050 52475MPN045 + 53073 54400 53077 53077 54321MPN046 + 54156 56000 54293 54293 55966 yesMPN047 + 57350 55942 55942 57297MPN047a - 56979 56759 56502 alternative TSS → NEW NEWMPN048 + 59488 57886 57886 59442MPN048a + 57000 57029 57229 alternative TSS → NEW NEWMPN049 + 59480 61495 59619 59619 61517 yesMPN050 - 61800 63503 63503 61977MPN051 - 64655 63200 64648 64648 63494MPN052 + 64805 64831 64831 66804MPN053 + 67250 66822 66822 67088MPN054 + 68627 68627 68998MPN055 + 70382 72200 70404 70404 72086MPN056 + 73600 72088 72088 72948MPN057 + 72941 72941 73801MPN058 + 75203 73786 73786 75243MPN059 + 75203 76100 75243 75243 76202MPN060 + 77100 76186 76186 77337MPN060a + 77198 77420 77280 77594 putative NEW NEWMPN061 - 78982 77575 0 78977 77625MPN062 + 79008 79033 79033 79749MPN063 + 79753 79753 80427MPN064 + 80414 80414 81679MPN065 + 82000 81690 81690 82091MPN066 + 83850 82081 82081 83745
Continued on next page
142

B.2. Tables
Table B.1 – continued from previous pageprediction from
ORF TSC transcripts or re- 5’-(re-anno- TSC re-anno- theoretical anno- UTRtated) str. TSS1 TTS NCBI tated stop transcriptome tation >40bpMPN067 - 83175 84675 84675 83713MPN068 - 85060 85060 84683
MPN069 - 85350/ 84975 85212 85212 85066 alternative TSS yes85220 → 2 transcriptsMPN070 - 85630 85290 85611 85611 85228MPN071 - 86485 85760 86428 86428 85598 yesMPN072 - 86485 86946 86946 86410
MPN073 - 88480/ 86920 88091 88091/ 86925 alternative TSS → 2 2 yes88005 87960 transcripts or NEWMPN074 - 88485 88341 88341 87898 yesMPN075 + 88348 88348 89247
MPN076 - 91057/ 89250 90993 90993 89299 alternative TSS yes89520 → longerMPN077 - 92905 91200 92839 92884 91199 putative longer longer yesMPN078 + 93165 93191 93191 95275MPN079 + 96171 95268 95268 96170MPN080 + 96407 96407 100567MPN081 + 101980 100567 100567 101964MPN082 + 101980 103900 101985 101985 103931MPN083 + 103930 103941 103941 105542MPN084 + 107250 105592 105592 107166MPN085 + 107273 108690 107273 107273 108595
MPN086 + 108780/ 109200 108857 108857 109174 alternative TSS yes108856 → 2 transcriptsMPN087 + 109346 109346 109798
MPN088 + 110230/ 111350 110813 110813 111118 alternative TSS → 2 yes110394 transcripts or NEWMPN089 + 111470 112600 111610 111610 112617 yesMPN090 + 112710 112772 112772 113761 yesMPN091 + 113646 113838 113838 114254 yesMPN091a - 114140 114043 113870 alternative TSS → NEW NEWMPN092 + 114572 114572 115093MPN093 + 116000 114948 114948 115853MPN094 + 116435 116287 116455 116709 putative shorter shorter yesMPN095 + 123250 123290 123290 124054MPN096 + 124998 124054 124054 124848MPN097 + 124998 126950 125024 125024 126649MPN098 + 126625 127400 126947 126947 127390 yesMPN099 + 128076 128076 129119MPN100 + 129608 130007 129458 129626 130009 putative shorter shorter yesMPN101 + 130466 130466 131752MPN101a + 131776 131848 132513 putative NEW NEWMPN102 + 132568 132568 133386MPN103 - 134570 134573 134055
MPN104 + 134175/ 134900 134583 134583 134897 alternative TSS yes134212 → longerMPN104a + 134985 135350 135088 135360 putative NEW NEWMPN105 + 135718 137100 135731 135731 136756MPN106 + 139000 136759 136759 139176MPN107 + 140200 139289 139289 140044MPN108 + 141600 140046 140046 141260MPN109 + 141936 142650 141940 141940 142437MPN110 + 143180 142361 142361 144517
MPN111 + 144431/ 147138 145021 145021 146289 alternative TSS → 2 yes144542 transcripts or NEWMPN112 + 147128 147750 147149 147149 147541MPN113 + 148090 148090 148761MPN114 + 150525 148751 148751 150553MPN115 + 150556/ 150643 150643 151248 alternative TSS yes
150588 → 2 transcriptsMPN116 + 151254 151254 151433MPN117 + 151790 151444 151444 151827MPN118 - 152520 151740 152512 152512 151802MPN119 + 152539 152568 152568 155300MPN120 + 155323 155323 155976MPN121 + 155976 155976 156341MPN122 + 158200 156467 156467 158374MPN123 + 160900 158374 158374 160743MPN124 - 161790 160080 161790 161785 160730MPN125 + 163600 161817 161817 163577MPN126 + 163604 164250 163613 163613 164092
MPN127 + 164598/ 165240 164484 164628 165026 alternative TSS → 2 trans- shorter yes164623 cripts or shorter or NEWMPN127a + 165786 165867 166262 putative NEW NEWMPN128 + 166310 166483 166483 166932 putative longer or NEW yes
MPN129 + 167600/ 167632 167632 168081 alternative TSS167795 → 2 transcripts
MPN130 + 169030/ 169510 169042 169042/ 169464 alternative TSS yes169190 169210 → 2 transcriptsContinued on next page
143
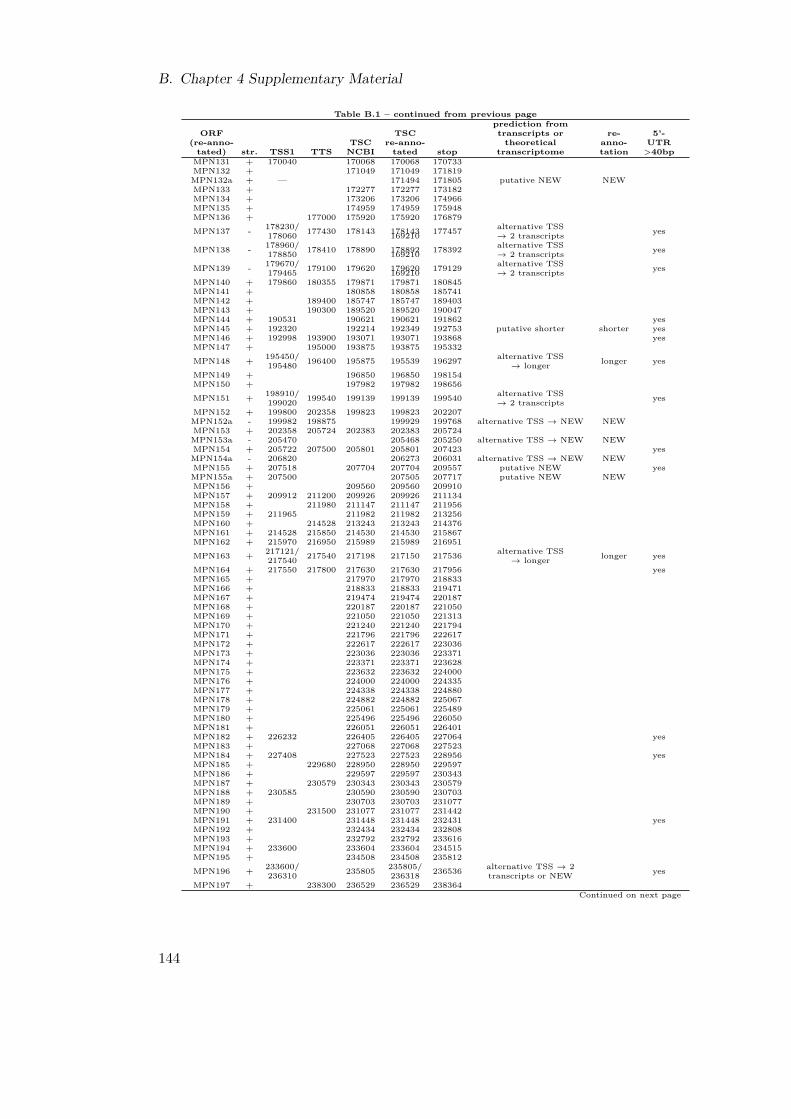
B. Chapter 4 Supplementary Material
Table B.1 – continued from previous pageprediction from
ORF TSC transcripts or re- 5’-(re-anno- TSC re-anno- theoretical anno- UTRtated) str. TSS1 TTS NCBI tated stop transcriptome tation >40bpMPN131 + 170040 170068 170068 170733MPN132 + 171049 171049 171819MPN132a + — 171494 171805 putative NEW NEWMPN133 + 172277 172277 173182MPN134 + 173206 173206 174966MPN135 + 174959 174959 175948MPN136 + 177000 175920 175920 176879
MPN137 - 178230/ 177430 178143 178143 177457 alternative TSS yes178060 169210 → 2 transcripts
MPN138 - 178960/ 178410 178890 178892 178392 alternative TSS yes178850 169210 → 2 transcripts
MPN139 - 179670/ 179100 179620 179620 179129 alternative TSS yes179465 169210 → 2 transcriptsMPN140 + 179860 180355 179871 179871 180845MPN141 + 180858 180858 185741MPN142 + 189400 185747 185747 189403MPN143 + 190300 189520 189520 190047MPN144 + 190531 190621 190621 191862 yesMPN145 + 192320 192214 192349 192753 putative shorter shorter yesMPN146 + 192998 193900 193071 193071 193868 yesMPN147 + 195000 193875 193875 195332
MPN148 + 195450/ 196400 195875 195539 196297 alternative TSS longer yes195480 → longerMPN149 + 196850 196850 198154MPN150 + 197982 197982 198656
MPN151 + 198910/ 199540 199139 199139 199540 alternative TSS yes199020 → 2 transcriptsMPN152 + 199800 202358 199823 199823 202207MPN152a - 199982 198875 199929 199768 alternative TSS → NEW NEWMPN153 + 202358 205724 202383 202383 205724MPN153a - 205470 205468 205250 alternative TSS → NEW NEWMPN154 + 205722 207500 205801 205801 207423 yesMPN154a - 206820 206273 206031 alternative TSS → NEW NEWMPN155 + 207518 207704 207704 209557 putative NEW yesMPN155a + 207500 207505 207717 putative NEW NEWMPN156 + 209560 209560 209910MPN157 + 209912 211200 209926 209926 211134MPN158 + 211980 211147 211147 211956MPN159 + 211965 211982 211982 213256MPN160 + 214528 213243 213243 214376MPN161 + 214528 215850 214530 214530 215867MPN162 + 215970 216950 215989 215989 216951
MPN163 + 217121/ 217540 217198 217150 217536 alternative TSS longer yes217540 → longerMPN164 + 217550 217800 217630 217630 217956 yesMPN165 + 217970 217970 218833MPN166 + 218833 218833 219471MPN167 + 219474 219474 220187MPN168 + 220187 220187 221050MPN169 + 221050 221050 221313MPN170 + 221240 221240 221794MPN171 + 221796 221796 222617MPN172 + 222617 222617 223036MPN173 + 223036 223036 223371MPN174 + 223371 223371 223628MPN175 + 223632 223632 224000MPN176 + 224000 224000 224335MPN177 + 224338 224338 224880MPN178 + 224882 224882 225067MPN179 + 225061 225061 225489MPN180 + 225496 225496 226050MPN181 + 226051 226051 226401MPN182 + 226232 226405 226405 227064 yesMPN183 + 227068 227068 227523MPN184 + 227408 227523 227523 228956 yesMPN185 + 229680 228950 228950 229597MPN186 + 229597 229597 230343MPN187 + 230579 230343 230343 230579MPN188 + 230585 230590 230590 230703MPN189 + 230703 230703 231077MPN190 + 231500 231077 231077 231442MPN191 + 231400 231448 231448 232431 yesMPN192 + 232434 232434 232808MPN193 + 232792 232792 233616MPN194 + 233600 233604 233604 234515MPN195 + 234508 234508 235812
MPN196 + 233600/ 235805 235805/ 236536 alternative TSS → 2 yes236310 236318 transcripts or NEWMPN197 + 238300 236529 236529 238364
Continued on next page
144
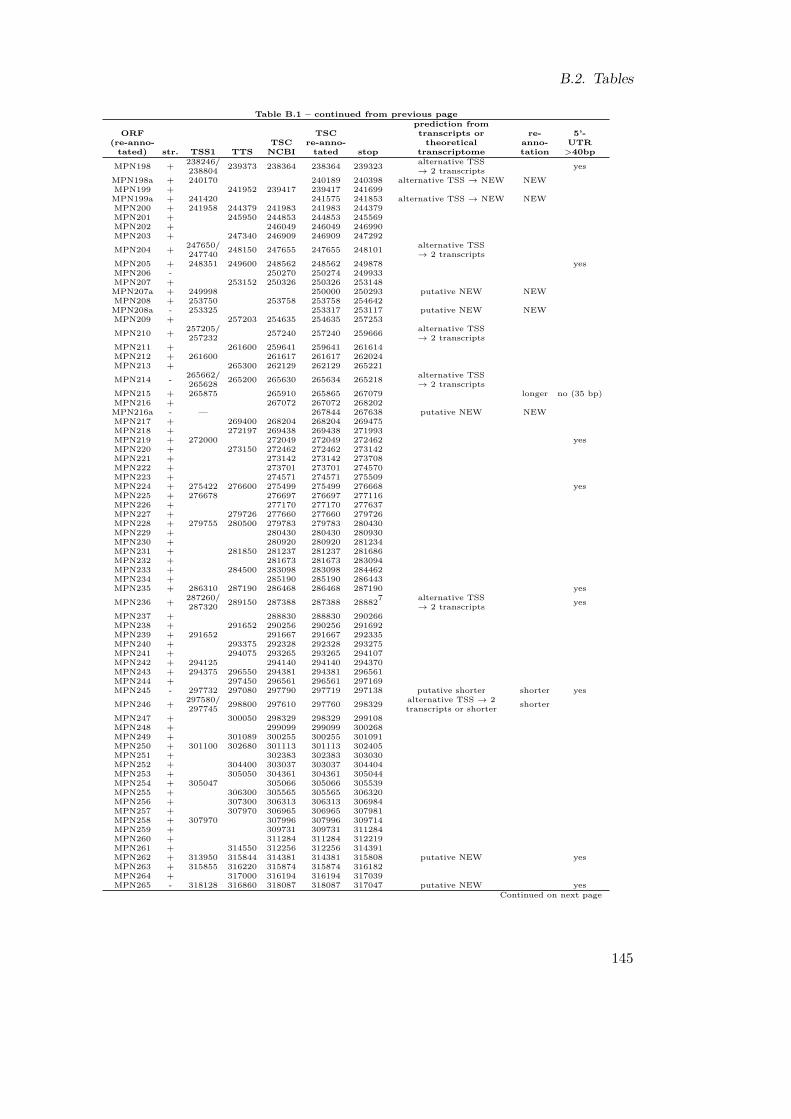
B.2. Tables
Table B.1 – continued from previous pageprediction from
ORF TSC transcripts or re- 5’-(re-anno- TSC re-anno- theoretical anno- UTRtated) str. TSS1 TTS NCBI tated stop transcriptome tation >40bp
MPN198 + 238246/ 239373 238364 238364 239323 alternative TSS yes238804 → 2 transcriptsMPN198a + 240170 240189 240398 alternative TSS → NEW NEWMPN199 + 241952 239417 239417 241699MPN199a + 241420 241575 241853 alternative TSS → NEW NEWMPN200 + 241958 244379 241983 241983 244379MPN201 + 245950 244853 244853 245569MPN202 + 246049 246049 246990MPN203 + 247340 246909 246909 247292
MPN204 + 247650/ 248150 247655 247655 248101 alternative TSS247740 → 2 transcripts
MPN205 + 248351 249600 248562 248562 249878 yesMPN206 - 250270 250274 249933MPN207 + 253152 250326 250326 253148MPN207a + 249998 250000 250293 putative NEW NEWMPN208 + 253750 253758 253758 254642MPN208a - 253325 253317 253117 putative NEW NEWMPN209 + 257203 254635 254635 257253
MPN210 + 257205/ 257240 257240 259666 alternative TSS257232 → 2 transcripts
MPN211 + 261600 259641 259641 261614MPN212 + 261600 261617 261617 262024MPN213 + 265300 262129 262129 265221
MPN214 - 265662/ 265200 265630 265634 265218 alternative TSS265628 → 2 transcripts
MPN215 + 265875 265910 265865 267079 longer no (35 bp)MPN216 + 267072 267072 268202MPN216a - — 267844 267638 putative NEW NEWMPN217 + 269400 268204 268204 269475MPN218 + 272197 269438 269438 271993MPN219 + 272000 272049 272049 272462 yesMPN220 + 273150 272462 272462 273142MPN221 + 273142 273142 273708MPN222 + 273701 273701 274570MPN223 + 274571 274571 275509MPN224 + 275422 276600 275499 275499 276668 yesMPN225 + 276678 276697 276697 277116MPN226 + 277170 277170 277637MPN227 + 279726 277660 277660 279726MPN228 + 279755 280500 279783 279783 280430MPN229 + 280430 280430 280930MPN230 + 280920 280920 281234MPN231 + 281850 281237 281237 281686MPN232 + 281673 281673 283094MPN233 + 284500 283098 283098 284462MPN234 + 285190 285190 286443MPN235 + 286310 287190 286468 286468 287190 yes
MPN236 + 287260/ 289150 287388 287388 288827 alternative TSS yes287320 → 2 transcriptsMPN237 + 288830 288830 290266MPN238 + 291652 290256 290256 291692MPN239 + 291652 291667 291667 292335MPN240 + 293375 292328 292328 293275MPN241 + 294075 293265 293265 294107MPN242 + 294125 294140 294140 294370MPN243 + 294375 296550 294381 294381 296561MPN244 + 297450 296561 296561 297169MPN245 - 297732 297080 297790 297719 297138 putative shorter shorter yes
MPN246 + 297580/ 298800 297610 297760 298329 alternative TSS → 2 shorter297745 transcripts or shorterMPN247 + 300050 298329 298329 299108MPN248 + 299099 299099 300268MPN249 + 301089 300255 300255 301091MPN250 + 301100 302680 301113 301113 302405MPN251 + 302383 302383 303030MPN252 + 304400 303037 303037 304404MPN253 + 305050 304361 304361 305044MPN254 + 305047 305066 305066 305539MPN255 + 306300 305565 305565 306320MPN256 + 307300 306313 306313 306984MPN257 + 307970 306965 306965 307981MPN258 + 307970 307996 307996 309714MPN259 + 309731 309731 311284MPN260 + 311284 311284 312219MPN261 + 314550 312256 312256 314391MPN262 + 313950 315844 314381 314381 315808 putative NEW yesMPN263 + 315855 316220 315874 315874 316182MPN264 + 317000 316194 316194 317039MPN265 - 318128 316860 318087 318087 317047 putative NEW yes
Continued on next page
145

B. Chapter 4 Supplementary Material
Table B.1 – continued from previous pageprediction from
ORF TSC transcripts or re- 5’-(re-anno- TSC re-anno- theoretical anno- UTRtated) str. TSS1 TTS NCBI tated stop transcriptome tation >40bpMPN266 + 318110 318144 318144 318581MPN267 + 318581 318581 319360MPN268 + 319350 319600 319360 319360 319713MPN269 + 319703 319703 321184MPN270 + 321500 321187 321187 321474MPN271 + 321715 322880 321736 321736 322491MPN272 + 324185 325000 324197 324197 324478MPN273 - 324400 324889 324889 324455MPN274 - 325807 325658 325658 324858 yes
MPN275 + 325620/ 325920 325680 325680 325982 alternative TSS yes325600 → 2 transcripts
MPN276 - 327065/ 325910 326811 326811 325954 alternative TSS yes326820 → longerMPN277 + 326832 328375 326856 326856 328325MPN278 + 328285 328285 329484MPN279 + 331293 329484 329484 331229MPN280 + 331290 333069 331360 331360 333069 yesMPN281 + 333255 334400 333280 333280 334413MPN282 + 335580 334768 334768 335268
MPN283 + 336620/ 337000 336479 336626 336826 alternative TSS → 2 shorter336511 transcripts or shorterMPN284 + 337743 340200 337770 337770 340154MPN285 + 340673 341400 340613 341207 341533 putative shorter shorter yesMPN286 + 343220 341636 341636 343033MPN287 + 343620 344158 343764 343764 344120 putative longer yesMPN288 + 344690 346660 344716 344716 347079MPN289 + 346937 347169 347169 347732 putative NEW yesMPN290 + 348250 347871 347871 348308MPN291 - 348300 348891 348891 348301MPN292 - 349804 349804 348875MPN293 - 350458 350358 350358 349804 yesMPN294 + 350392 350397 350397 351017MPN295 + 351066 351066 351728MPN296 + 351728 351728 351910MPN297 + 351935 351935 352384MPN298 + 352400 352387 352387 352746MPN299 + 353600 352734 352734 353534MPN300 + 353535 353535 355055MPN301 + 355675 355039 355039 355665MPN302 + 355675 355685 355685 356671MPN303 + 358180 356677 356677 358203
MPN304 + 359160/ 360200 359183 359183 359899 alternative TSS359168 → 2 transcripts
MPN305 + 359800 359800 360396MPN306 + 360644 360644 361465
MPN307 + 359160/ 361750 361468 361468/ 362397 alternative TSS → 2 yes361750 361783 transcripts or NEWMPN308 + 364120 362400 362400 364097MPN309 + 364188 365780 364231 364231 365448 yes
MPN310 + 365356/ 366000 365468 365468/ 370924 alternative TSS yes370344 3704124 → 2 transcriptsMPN311 + 370939 370939 372012MPN312 + 373000 372002 372002 372658MPN313 - 373013 373013 372741MPN314 + 373373 373414 373414 373839 yesMPN315 + 373829 373829 374755MPN316 + 374758 374758 376017MPN317 + 377250 376023 376023 377165MPN318 + 377208 377208 378683MPN319 + 378420 380175 378658 378658 380169 putative longer or NEW yesMPN320 + 380638 380541 380664 381527 putative shorter shorter yesMPN321 + 381529 381529 382011MPN322 + 382018 382018 383037MPN323 + 383040 383040 383501MPN324 + 385680 383525 383525 385690MPN325 + 385760 386120 385837 385837 386139 yesMPN326 + 386132 386132 386434MPN327 + 387050 386427 386427 386741MPN328 + 386670 386734 386734 387594 yesMPN329 + 387548 387548 388024MPN330 + 388500 388014 388014 388898MPN331 + 388910 388923 388923 390257MPN332 + 390282 392800 390328 390328 392715 putative longer yesMPN333 + 392910 392910 395162MPN334 + 395165 395165 396145MPN335 + 396380 396132 396132 398357MPN335a - 397770 397616 397269 alternative TSS → NEW NEWMPN336 - 399405 398150 399390 399392 398358MPN337 + 399440 399477 399477 401342
Continued on next page
146

B.2. Tables
Table B.1 – continued from previous pageprediction from
ORF TSC transcripts or re- 5’-(re-anno- TSC re-anno- theoretical anno- UTRtated) str. TSS1 TTS NCBI tated stop transcriptome tation >40bpMPN338 + 401345 401345 403243MPN339 + 404000 403243 403243 403917MPN340 + 403921 403921 405510MPN341 + 408150 405573 405573 407720MPN342 + 407804 409750 407861 407861 409492 yesMPN343 + 409438 409871 409871 410863 putative NEW yes
MPN344 + 411098/ 411850 411086 411383 411736 alternative TSS → 2 shorter411168 transcripts or shorterMPN345 + 412681 412681 412681 413301MPN346 + 413310 413750 413431 413431 413778 yesMPN347 + 413985 413985 415115MPN347a + 415550 415697 416032 putative NEW NEWMPN348 + 415140 416070 416070 416564 putative NEW yesMPN349 + 417800 416554 416554 417399MPN350 - 418115 417190 418110 418110 417391MPN351 - 418160 418760 418757 418116MPN352 - 420268 418740 420240 420240 418741MPN353 - 420725 422160 422155 420293MPN354 - 423493 422150 423490 423488 422139MPN355 - 424240 423575 424240 424238 423510MPN356 - 425460 424230 425550 425440 424241 putative shorter shorter yesMPN357 - 427511 427511 425535MPN358 + 427670 429300 427679 427679 429283MPN359 + 430335 429513 429513 430289MPN360 + 430310 430600 430334 430334 430627MPN361 + 431600 430628 430628 431707MPN362 + 433050 431707 431707 433068MPN363 + 433180 433540 433200 433200 433508MPN364 + 433547 433547 435580MPN365 + 435610 435924 435924 436730 yesMPN366 + 436814 436814 437632MPN367 + 437563 437563 438531MPN367a + 438480 438525 438827 alternative TSS → NEW NEWMPN368 + 439370 439220 439388 439762 putative shorter shorter yesMPN369 - 440670 439950 440655 440655 439894MPN370 + 442600 441296 441296 443509MPN371 - 444266 444085 444190 444187 443552 yesMPN372 + 444330 446500 444341 444341 446116MPN373 - 446606 446000 446740 446606 446127 putative shorter shorter yesMPN374 - 448632 448459 448459 447770 yesMPN375 - 449345 448600 449194 449194 448805 yesMPN376 - 452995 449500 452995 452995 449573MPN377 + 453392 453700 453422 453422 453646MPN378 + 453650 453650 456268MPN379 + 456054 457035 456272 456272 457147 putative NEW yesMPN380 + 457040 457900 457147 457147 457980 yesMPN381 + 458048 459000 458126 458126 459004 yesMPN382 + 459500 458998 458998 459600MPN383 - 459450 460378 460378 459530MPN384 - 462762 462762 460381MPN385 - 463107 463107 462763MPN386 - 463855 463100 463831 463831 463142MPN387 - 464000 465055 465055 463979MPN388 - 465434 465449 465048 putative longer longer yesMPN389 - 465360 466446 466446 465427MPN390 - 467846 467846 466473MPN391 - 469068 467900 469055 469055 467847MPN392 - 469365 470357 470357 469374MPN393 - 471455 471455 470379MPN393a - 472340 472203 472030 alternative TSS → NEW NEWMPN394 - 472927 472915 472915 471476MPN395 - 473530 473000 473516 473408 472983 putative shorter shorterMPN396 - 476487 473600 476466 476466 473551
MPN397 + 476485/ 478620 476470 476509 478671 alternative TSS → 2 shorter476500 transcripts or shorterMPN398 - 478450 479324 479324 478668MPN399 - 479250 480187 480187 479324MPN400 - 482110 480528 481997 481997 480249 yesMPN401 - 483269 482800 483247 483247 482765MPN402 + 484950 483529 483529 484980MPN403 + 485125 485125 485493MPN404 + 486450 485474 485474 486514MPN405 + 487120 486521 486521 487114MPN406 + 487135 487390 487149 487149 487403MPN407 - 490223 487500 490147 490147 487508 yesMPN408 + 492650 490375 490375 492657MPN409 + 494300 492730 492730 494331
MPN410 + 494680 495150 494694 494694/ 495140 alternative TSS yes494860 494862 → 2 transcriptsContinued on next page
147

B. Chapter 4 Supplementary Material
Table B.1 – continued from previous pageprediction from
ORF TSC transcripts or re- 5’-(re-anno- TSC re-anno- theoretical anno- UTRtated) str. TSS1 TTS NCBI tated stop transcriptome tation >40bpMPN411 - 496060 496040 496040 495282MPN412 + 496525 496634 496634 497470 yesMPN412a + 497073 497073 497474 alternative TSS → NEW NEWMPN413 + 497547 497547 497966MPN414 + 499550 498076 498076 499557MPN415 + 499800 501050 499808 499808 500950MPN416 + 500943 500943 501677MPN417 + 503250 501670 501670 503298MPN418 - 503150 503721 503721 503299MPN419 - 503925 506423 506423 503721MPN420 - 506450 507200 507200 506475
MPN421 - 508682/ 508620 508620 507193 alternative TSS yes508642 → 2 transcriptsMPN422 - 508682 509863 509863 508751MPN423 - 510255 510253 510253 509864MPN424 - 510255 510561 510561 510253MPN425 - 511588 511588 510542MPN426 - 514575 514542 514542 511594
MPN427 + 514480/ 515700 514727 514727 515599 alternative TSS yes514590 → 2 transcriptsMPN428 - 515600 516567 516567 515605MPN429 - 517834 517834 516605
MPN430 - 518890/ 517780 518850 518850 517837 alternative TSS518862 → 2 transcripts
MPN431 - 518900 519834 519834 518881MPN432 - 521685 519750 520972 520972 519824 putative NEW yesMPN433 - 521685 520800 521679 521679 520867MPN434 - 523635 521825 523624 523624 521837MPN435 - 523635 524867 524867 523680
MPN436 - 528761/ 528611 528611 524877 alternative TSS yes527402 → 2 transcriptsMPN437 - 530638 530638 528920MPN438 - 531893 531893 530856MPN439 - 532715 532662 532662 531949 yesMPN440 - 534998 534998 532818MPN441 + 535050 535468 535468 535776 putative longer or NEW yesMPN442 - 535900 536541 536541 536089MPN443 - 537755 537755 536526MPN444 - 541760 537750 541739 541739 537762MPN445 + 541770 542560 541734 541794 542603 putative shorter shorterMPN446 - 543283 542650 543281 543281 542664MPN447 - 546393 546360 546360 543304MPN448 - 546400 547281 547281 546424MPN449 - 547100 548678 548678 547332MPN450 - 549604 549630 549589 548690 putative shorter shorterMPN451 - 549590 550622 550622 549513MPN452 - 550750 552680 552680 550662MPN453 - 552750 553518 553518 552694
MPN454 - 554180/ 553600 554120 554120 553539 alternative TSS yes554138 → 2 transcriptsMPN455 - 555085 554258 555072 555072 554209MPN456 - 558430 555400 558415 558415 555398MPN457 - 559787 559787 558798MPN458 - 559550 560202 560202 559729MPN459 - 561945 560100 561898 561898 560123 yesMPN460 - 564365 562650 564355 564355 562658MPN461 + 564380 564390 564390 565085MPN462 + 565237 565237 566049MPN463 + 566124 566124 566597MPN464 + 568200 566891 566891 568228
MPN464a + 568540/ 569190 568625/ 568625/ 569155 putative NEW NEW568540 568793 568793 (with alternative TSS)MPN465 - 569244 569244 568645MPN466 - 569710 569710 569288MPN467 - 570060 570045 570045 569740MPN468 + 570782 570782 571408MPN469 - 572300 572985 573063 572254 putative longer longer yesMPN470 - 572990 574090 574090 573026MPN471 - 574255 574251 574251 574090MPN472 - 575170 574300 575151 575151 574270MPN473 - 575200 575963 575963 575157MPN474 - 577082 575900 579050 576942 575950 putative shorter shorterMPN474a - 579392 579389 579105 putative NEW NEWMPN475 - 579400 580757 580757 579408MPN476 - 580320 581412 581412 580759MPN477 - 582398 582068 582068 581439 putative NEW yesMPN478 - 582100 582778 582778 582071MPN479 - 583393 582670 583375 583375 582782MPN480 - 583500 585919 585919 583403
Continued on next page
148

B.2. Tables
Table B.1 – continued from previous pageprediction from
ORF TSC transcripts or re- 5’-(re-anno- TSC re-anno- theoretical anno- UTRtated) str. TSS1 TTS NCBI tated stop transcriptome tation >40bpMPN481 - 586484 586484 585903
MPN482 - 586885/ 586450 586686 586713 586492 alternative TSS longer yes586910 → longerMPN483 + 586760 587800 586772 586772 587797MPN484 - 588658 588300 588613 588613 588302 yesMPN485 - 590042 590920 589980 589980 589030 putative longer yesMPN486 + 589922 589922 590365MPN487 + 590500 590569 590569 591795 yesMPN488 + 592200 591798 591798 592220MPN488a - 592578 592479 592201 alternative TSS → NEW NEWMPN489 - 596335 592000 596300 596300 592398
MPN490 - 597842/ 596820 597826 597826 596816 alternative TSS597790 → 2 transcripts
MPN491 + 597836/ 599400 597900 597900 599324 alternative TSS yes597892 → 2 transcriptsMPN492 - 599500 600380 600380 599463MPN493 - 600972 600972 600316MPN494 - 601050 601453 601453 600974
MPN495 - 601882/ 601742 601742 601455 alternative TSS yes601755 → 2 transcriptsMPN496 - 601885 603727 603727 601745MPN497 - 604801 604200 604586 604586 604155 putative NEW yesMPN498 + 604897 604897 604897 605625MPN499 + 605579 605579 606070MPN500 + 606218 606218 607801MPN501 + 608320 608167 608335 608757 putative shorter shorter yesMPN502 + 609202 609202 610470MPN503 + 611025 611025 612170
MPN504 + 612880/ 613200 612740 612887 613120 alternative TSS → 2 shorter613000 transcripts or shorterMPN505 - 613960 612800 613949 613949 613188MPN506 + 614842 614865 614865 617246MPN506a - 616120 615980 615744 alternative TSS → NEW NEWMPN507 + 617350 617600 617366 617366 618457
MPN508 - 619746/ 618500 620010 619735 618485 alternative TSS → 2 shorter619782 transcripts or shorterMPN509 - 622592 620570 621844 621844 620561 putative longer or NEW yesMPN510 - 623450 624250 624250 622874MPN511 - 624778 625644 625644 624862MPN512 - 626858 625710 626139 626139 625675 putative longer or NEW yesMPN513 - 627369 627369 626917MPN514 - 628288 627920 628248 628248 627886MPN515 - 632282 632282 628410MPN516 - 636461 636461 632286MPN517 - 637070 636580 637054 637054 636554MPN518 - 639210 638170 639193 639193 638147MPN519 - 639218 640014 640014 639196MPN520 - 639950 642717 642717 640132MPN520a - 640400 640304 640017 alternative TSS → NEW NEWMPN521 + 642750 642760 642760 643260MPN522 + 643900 643251 643251 643883MPN523 - 644068 644955 644955 644038MPN524 - 645912 645520 646050 645904 645545 putative shorter shorter yesMPN525 + 646630 646644 646644 647885 putative NEW yesMPN526 + 648900 647866 647866 648852MPN527 - 649819 649000 649784 649784 649107MPN528 + 649838 650450 649839 649839 650393MPN528a + 650401 650402 650920MPN529 - 651315 650940 651246 651246 650917 yesMPN530 + 651338 652000 651395 651395 651805 yesMPN531 - 653975 651900 653949 653949 651802MPN532 - 654150 654973 654973 654125MPN533 - 656172 654750 656153 656153 654981MPN534 + 656494 656494 656916MPN535 + 656922 656922 657542MPN536 + 658400 657517 657517 658440
MPN537 - 659740/ 658470 659664 659664 658426 alternative TSS yes659668 → 2 transcriptsMPN538 + 659695 659782 659782 660267 putative NEW yesMPN539 + 660305 660305 660673MPN540 + 660825 660680 660680 660853
MPN541 - 661175/ 660838 661126 661126 660863 alternative TSS → 2 yes661155 transcripts or NEWMPN542 + 661170 661950 661187 661187 661843MPN543 + 661848 661848 662783
MPN544 + 662582/ 664700 662783 662783 664777 alternative TSS yes662582 → 2 transcriptsMPN545 - 664780 665609 665609 664761MPN546 - 666592 665650 666585 666585 665599
Continued on next page
149
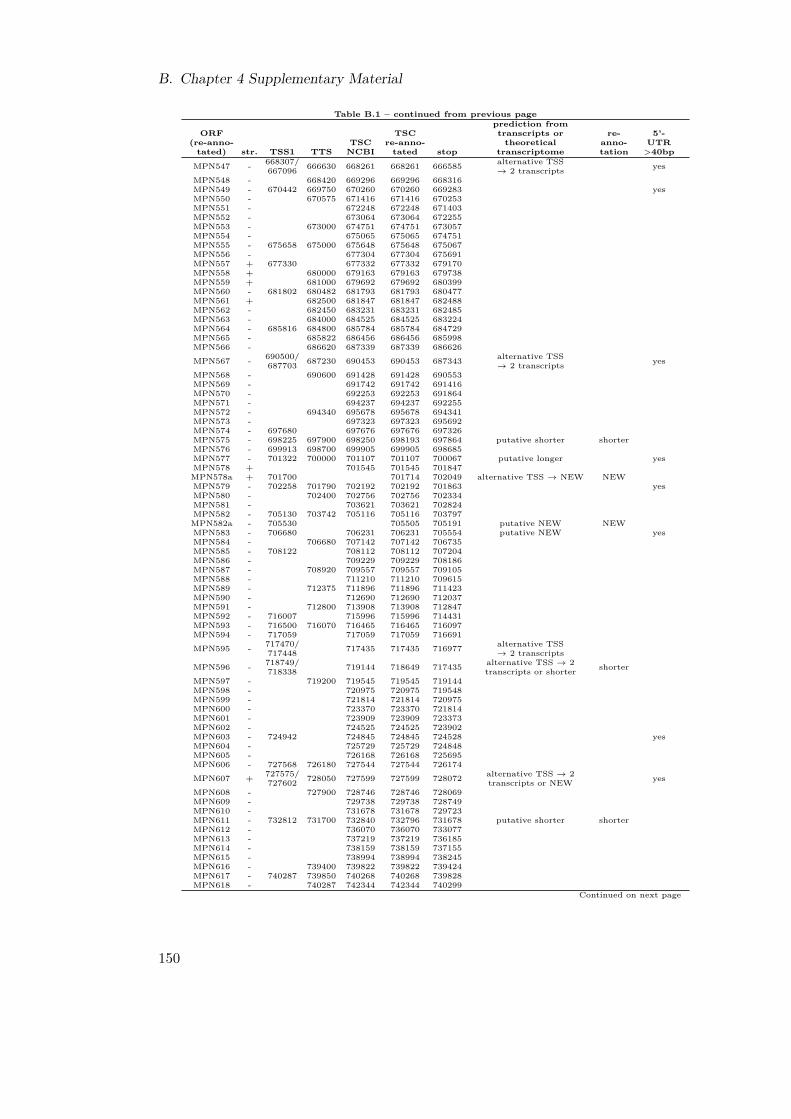
B. Chapter 4 Supplementary Material
Table B.1 – continued from previous pageprediction from
ORF TSC transcripts or re- 5’-(re-anno- TSC re-anno- theoretical anno- UTRtated) str. TSS1 TTS NCBI tated stop transcriptome tation >40bp
MPN547 - 668307/ 666630 668261 668261 666585 alternative TSS yes667096 → 2 transcriptsMPN548 - 668420 669296 669296 668316MPN549 - 670442 669750 670260 670260 669283 yesMPN550 - 670575 671416 671416 670253MPN551 - 672248 672248 671403MPN552 - 673064 673064 672255MPN553 - 673000 674751 674751 673057MPN554 - 675065 675065 674751MPN555 - 675658 675000 675648 675648 675067MPN556 - 677304 677304 675691MPN557 + 677330 677332 677332 679170MPN558 + 680000 679163 679163 679738MPN559 + 681000 679692 679692 680399MPN560 - 681802 680482 681793 681793 680477MPN561 + 682500 681847 681847 682488MPN562 - 682450 683231 683231 682485MPN563 - 684000 684525 684525 683224MPN564 - 685816 684800 685784 685784 684729MPN565 - 685822 686456 686456 685998MPN566 - 686620 687339 687339 686626
MPN567 - 690500/ 687230 690453 690453 687343 alternative TSS yes687703 → 2 transcriptsMPN568 - 690600 691428 691428 690553MPN569 - 691742 691742 691416MPN570 - 692253 692253 691864MPN571 - 694237 694237 692255MPN572 - 694340 695678 695678 694341MPN573 - 697323 697323 695692MPN574 - 697680 697676 697676 697326MPN575 - 698225 697900 698250 698193 697864 putative shorter shorterMPN576 - 699913 698700 699905 699905 698685MPN577 - 701322 700000 701107 701107 700067 putative longer yesMPN578 + 701545 701545 701847MPN578a + 701700 701714 702049 alternative TSS → NEW NEWMPN579 - 702258 701790 702192 702192 701863 yesMPN580 - 702400 702756 702756 702334MPN581 - 703621 703621 702824MPN582 - 705130 703742 705116 705116 703797MPN582a - 705530 705505 705191 putative NEW NEWMPN583 - 706680 706231 706231 705554 putative NEW yesMPN584 - 706680 707142 707142 706735MPN585 - 708122 708112 708112 707204MPN586 - 709229 709229 708186MPN587 - 708920 709557 709557 709105MPN588 - 711210 711210 709615MPN589 - 712375 711896 711896 711423MPN590 - 712690 712690 712037MPN591 - 712800 713908 713908 712847MPN592 - 716007 715996 715996 714431MPN593 - 716500 716070 716465 716465 716097MPN594 - 717059 717059 717059 716691
MPN595 - 717470/ 717435 717435 716977 alternative TSS717448 → 2 transcripts
MPN596 - 718749/ 719144 718649 717435 alternative TSS → 2 shorter718338 transcripts or shorterMPN597 - 719200 719545 719545 719144MPN598 - 720975 720975 719548MPN599 - 721814 721814 720975MPN600 - 723370 723370 721814MPN601 - 723909 723909 723373MPN602 - 724525 724525 723902MPN603 - 724942 724845 724845 724528 yesMPN604 - 725729 725729 724848MPN605 - 726168 726168 725695MPN606 - 727568 726180 727544 727544 726174
MPN607 + 727575/ 728050 727599 727599 728072 alternative TSS → 2 yes727602 transcripts or NEWMPN608 - 727900 728746 728746 728069MPN609 - 729738 729738 728749MPN610 - 731678 731678 729723MPN611 - 732812 731700 732840 732796 731678 putative shorter shorterMPN612 - 736070 736070 733077MPN613 - 737219 737219 736185MPN614 - 738159 738159 737155MPN615 - 738994 738994 738245MPN616 - 739400 739822 739822 739424MPN617 - 740287 739850 740268 740268 739828MPN618 - 740287 742344 742344 740299
Continued on next page
150
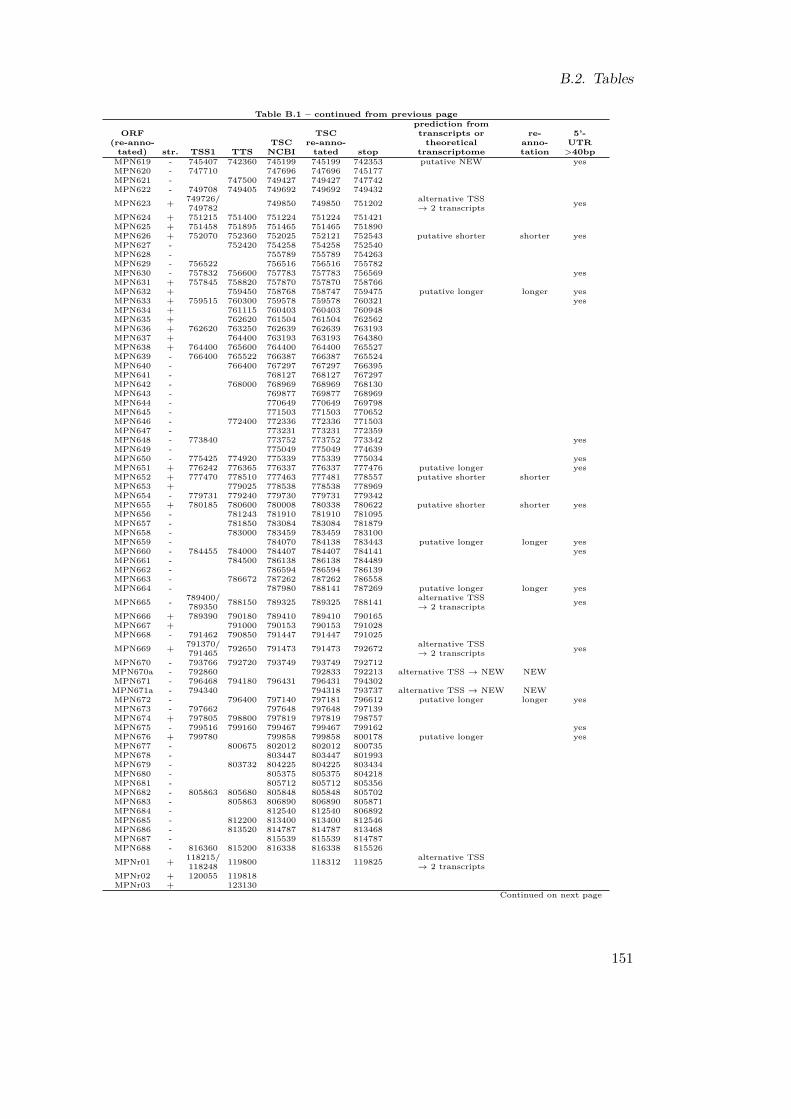
B.2. Tables
Table B.1 – continued from previous pageprediction from
ORF TSC transcripts or re- 5’-(re-anno- TSC re-anno- theoretical anno- UTRtated) str. TSS1 TTS NCBI tated stop transcriptome tation >40bpMPN619 - 745407 742360 745199 745199 742353 putative NEW yesMPN620 - 747710 747696 747696 745177MPN621 - 747500 749427 749427 747742MPN622 - 749708 749405 749692 749692 749432
MPN623 + 749726/ 749850 749850 751202 alternative TSS yes749782 → 2 transcriptsMPN624 + 751215 751400 751224 751224 751421MPN625 + 751458 751895 751465 751465 751890MPN626 + 752070 752360 752025 752121 752543 putative shorter shorter yesMPN627 - 752420 754258 754258 752540MPN628 - 755789 755789 754263MPN629 - 756522 756516 756516 755782MPN630 - 757832 756600 757783 757783 756569 yesMPN631 + 757845 758820 757870 757870 758766MPN632 + 759450 758768 758747 759475 putative longer longer yesMPN633 + 759515 760300 759578 759578 760321 yesMPN634 + 761115 760403 760403 760948MPN635 + 762620 761504 761504 762562MPN636 + 762620 763250 762639 762639 763193MPN637 + 764400 763193 763193 764380MPN638 + 764400 765600 764400 764400 765527MPN639 - 766400 765522 766387 766387 765524MPN640 - 766400 767297 767297 766395MPN641 - 768127 768127 767297MPN642 - 768000 768969 768969 768130MPN643 - 769877 769877 768969MPN644 - 770649 770649 769798MPN645 - 771503 771503 770652MPN646 - 772400 772336 772336 771503MPN647 - 773231 773231 772359MPN648 - 773840 773752 773752 773342 yesMPN649 - 775049 775049 774639MPN650 - 775425 774920 775339 775339 775034 yesMPN651 + 776242 776365 776337 776337 777476 putative longer yesMPN652 + 777470 778510 777463 777481 778557 putative shorter shorterMPN653 + 779025 778538 778538 778969MPN654 - 779731 779240 779730 779731 779342MPN655 + 780185 780600 780008 780338 780622 putative shorter shorter yesMPN656 - 781243 781910 781910 781095MPN657 - 781850 783084 783084 781879MPN658 - 783000 783459 783459 783100MPN659 - 784070 784138 783443 putative longer longer yesMPN660 - 784455 784000 784407 784407 784141 yesMPN661 - 784500 786138 786138 784489MPN662 - 786594 786594 786139MPN663 - 786672 787262 787262 786558MPN664 - 787980 788141 787269 putative longer longer yes
MPN665 - 789400/ 788150 789325 789325 788141 alternative TSS yes789350 → 2 transcriptsMPN666 + 789390 790180 789410 789410 790165MPN667 + 791000 790153 790153 791028MPN668 - 791462 790850 791447 791447 791025
MPN669 + 791370/ 792650 791473 791473 792672 alternative TSS yes791465 → 2 transcriptsMPN670 - 793766 792720 793749 793749 792712MPN670a - 792860 792833 792213 alternative TSS → NEW NEWMPN671 - 796468 794180 796431 796431 794302MPN671a - 794340 794318 793737 alternative TSS → NEW NEWMPN672 - 796400 797140 797181 796612 putative longer longer yesMPN673 - 797662 797648 797648 797139MPN674 + 797805 798800 797819 797819 798757MPN675 - 799516 799160 799467 799467 799162 yesMPN676 + 799780 799858 799858 800178 putative longer yesMPN677 - 800675 802012 802012 800735MPN678 - 803447 803447 801993MPN679 - 803732 804225 804225 803434MPN680 - 805375 805375 804218MPN681 - 805712 805712 805356MPN682 - 805863 805680 805848 805848 805702MPN683 - 805863 806890 806890 805871MPN684 - 812540 812540 806892MPN685 - 812200 813400 813400 812546MPN686 - 813520 814787 814787 813468MPN687 - 815539 815539 814787MPN688 - 816360 815200 816338 816338 815526
MPNr01 + 118215/ 119800 118312 119825 alternative TSS118248 → 2 transcripts
MPNr02 + 120055 119818MPNr03 + 123130
Continued on next page
151

B. Chapter 4 Supplementary Material
Table B.1 – continued from previous pageprediction from
ORF TSC transcripts or re- 5’-(re-anno- TSC re-anno- theoretical anno- UTRtated) str. TSS1 TTS NCBI tated stop transcriptome tation >40bp
MPNs001 - 463950 463875 non-coding RNAMPNs002 - 469317 463875 non-coding RNAMPNs003 - 571800 571478 putative NEW (no stop)MPNs004 + 571820 572220 non-coding RNAMPNs005 + 13390 14200 putative NEWMPNs006 + 15895 16000 putative NEW (no stop)MPNs007 + 57400 57920 putative NEW (no stop)
MPNs008 + 61723/ 62040 alternative TSS61723 → 2 transcripts
MPNs010 + 88180 88340 non-coding RNAMPNs011 + 88738 88840 putative NEW (no stop)MPNs012 + 91205 92600 putative NEWMPNs013 + 96173 96450 putative NEWMPNs014 + 99078 99175 putative NEW (no stop)MPNs015 + 108600 108680 non-coding RNAMPNs016 + 109300 109420 putative NEW (no stop)MPNs018 + 161700 162030 putative NEW (no stop)MPNs019 + 167025 167500 putative NEWMPNs021 + 172232 172400 putative NEW (no stop)MPNs022 + 229682 229950 putative NEW (no stop)MPNs024 + 238805 239015 putative NEWMPNs025 + 239373 239800 putative NEW (no stop)MPNs026 + 240997 241150 putative NEW (no stop)MPNs027 + 253203 253483 non-coding RNAMPNs028 + 265330 265450 putative NEW (no stop)MPNs029 + 265662 265770 non-coding RNAMPNs030 + 276675 276775 putative NEW (no stop)MPNs031 + 284500 284700 putative NEW (no stop)MPNs032 + 323470 323700 putative NEWMPNs033 + 336518 336700 putative NEW (no stop)MPNs034 + 348825 350250 non-coding RNAMPNs036 + 398612 398775 non-coding RNAMPNs037 + 411950 412210 putative NEWMPNs038 + 432403 432680 putative NEW (no stop)MPNs039 + 449750 450170 putative NEWMPNs040 + 450690 450750 non-coding RNAMPNs041 + 451000 452890 putative NEWMPNs042 + 457035 457200 putative NEW (no stop)MPNs043 + 459957 460408 putative NEWMPNs044 + 460418 460520 non-coding RNAMPNs045 + 460835 461290 putative NEWMPNs046 + 461290 461400 non-coding RNAMPNs047 + 468454 469000 putative NEWMPNs048 + 470460 470550 putative NEW (no stop)MPNs049 + 471462 471580 non-coding RNAMPNs050 + 480900 481180 non-coding RNAMPNs051 + 482020 482100 putative NEW (no stop)MPNs052 + 482240 482350 non-coding RNAMPNs053 + 483320 483640 putative NEW (no stop)MPNs054 + 485160 485380 putative NEW (no stop)MPNs055 + 490325 490650 putative NEW (no stop)MPNs056 + 505640 505890 non-coding RNAMPNs057 + 507805 508120 putative NEWMPNs058 + 509125 509220 non-coding RNAMPNs059 + 509880 509940 non-coding RNAMPNs060 + 511840 511930 non-coding RNAMPNs061 + 517155 517200 non-coding RNAMPNs062 + 518870 519080 non-coding RNAMPNs063 + 530410 530570 non-coding RNAMPNs064 + 531550 531700 putative NEW (no stop)MPNs065 + 532795 532960 non-coding RNAMPNs066 + 533810 533890 non-coding RNAMPNs067 + 538250 538420 non-coding RNAMPNs068 + 540657 540800 putative NEW (no stop)MPNs069 + 541487 541700 putative NEW (no stop)MPNs070 + 543310 543450 putative NEW (no stop)MPNs071 + 544638 544700 non-coding RNAMPNs072 + 544790 544900 non-coding RNAMPNs073 + 545910 546065 non-coding RNAMPNs074 + 547620 547800 non-coding RNAMPNs075 + 549062 549270 putative NEW (no stop)MPNs076 + 550540 550750 putative NEW (no stop)MPNs077 + 556300 556430 putative NEW (no stop)MPNs078 + 556612 556885 non-coding RNAMPNs079 + 557780 557860 non-coding RNAMPNs080 + 560140 560300 non-coding RNAMPNs081 + 562660 562740 non-coding RNAMPNs083 + 569330 569580 putative NEWMPNs084 + 570160 570310 putative NEW (no stop)
Continued on next page
152

B.2. Tables
Table B.1 – continued from previous pageprediction from
ORF TSC transcripts or re- 5’-(re-anno- TSC re-anno- theoretical anno- UTRtated) str. TSS1 TTS NCBI tated stop transcriptome tation >40bp
MPNs085 + 571560 571650 non-coding RNAMPNs086 + 572810 573000 putative NEW (no stop)MPNs087 + 576650 576800 putative NEW (no stop)MPNs088 + 596490 596720 non-coding RNAMPNs089 + 596760 597600 putative NEWMPNs090 + 599595 599900 putative NEWMPNs091 + 618643 618900 non-coding RNAMPNs092 + 623980 624210 non-coding RNAMPNs093 + 637870 638138 putative NEW (no stop)MPNs094 + 641225 641380 non-coding RNAMPNs095 + 645860 645970 non-coding RNAMPNs096 + 656095 656460 putative NEWMPNs097 + 664700 664820 non-coding RNAMPNs098 + 665160 665220 putative NEW (no stop)MPNs099 + 681820 682030 putative NEW (no stop)MPNs100 + 683647 684500 putative NEWMPNs101 + 684870 685090 non-coding RNAMPNs102 + 687560 687660 putative NEW (no stop)MPNs103 + 690525 690650 non-coding RNAMPNs104 + 702946 703380 non-coding RNAMPNs105 + 703758 703950 non-coding RNAMPNs106 + 708540 709300 putative NEWMPNs107 + 711420 711620 non-coding RNAMPNs108 + 716570 716800 non-coding RNAMPNs109 + 733795 734120 putative NEW (no stop)MPNs110 + 739840 740075 putative NEW (no stop)MPNs111 + 752360 753150 putative NEWMPNs112 + 757437 757550 non-coding RNAMPNs113 + 761115 761400 non-coding RNAMPNs114 + 770075 770250 non-coding RNAMPNs115 + 776010 776360 putative NEWMPNs116 + 778610 778730 putative NEW (no stop)MPNs117 + 780180 780310 putative NEW (no stop)MPNs118 + 780800 781560 putative NEWMPNs119 + 782321 782410 non-coding RNAMPNs120 + 783890 784000 non-coding RNAMPNs121 + 785298 785420 non-coding RNAMPNs122 + 786500 786850 putative NEWMPNs123 + 787600 787700 non-coding RNAMPNs124 + 797290 797800 putative NEWMPNs125 + 800647 800780 putative NEW (no stop)MPNs126 + 807600 807780 putative NEW (no stop)MPNs127 + 813618 813700 non-coding RNAMPNs128 + 701170 701260 non-coding RNAMPNs200 - 180 45 putative NEW (no stop)MPNs201 - 575 395 non-coding RNAMPNs202 - 15690 15150 non-coding RNAMPNs203 - 16038 15922 non-coding RNAMPNs204 - 17493 17300 putative NEW (no stop)MPNs205 - 19340 19295 non-coding RNAMPNs206 - 19408 19370 non-coding RNAMPNs208 - 23165 22750 putative NEWMPNs209 - 27205 26525 putative NEWMPNs210 - 28960 28505 putative NEWMPNs211 - 30400 30025 putative NEW (no stop)MPNs212 - 30725 30670 putative NEW (no stop)MPNs213 - 33795 33505 non-coding RNA
MPNs214 - 41195/ 41040 alternative TSS41148 → 2 transcripts
MPNs215 - 45720 45100 non-coding RNAMPNs217 - 48820 48720 non-coding RNAMPNs218 - 55493 55375 putative NEW (no stop)MPNs219 - 56440 56260 non-coding RNAMPNs220 - 57462 57240 non-coding RNAMPNs221 - 65550 64890 putative NEW (no stop)MPNs222 - 66790 66600 non-coding RNAMPNs223 - 67905 67200 putative NEWMPNs224 - 68400 68220 non-coding RNAMPNs225 - 68970 68820 non-coding RNAMPNs226 - 82028 81720 putative NEWMPNs227 - 69100 69038 non-coding RNAMPNs228 - 82625 82375 non-coding RNAMPNs229 - 69293 69150 putative NEW (no stop)MPNs230 - 72525 71625 putative NEW (from MPNs)MPNs231 - 93233 93185 non-coding RNAMPNs232 - 73020 72825 non-coding RNAMPNs233 - 96150 96005 non-coding RNAMPNs234 - 106760 106600 putative NEW (no stop)MPNs235 - 108240 108030 non-coding RNA
Continued on next page
153
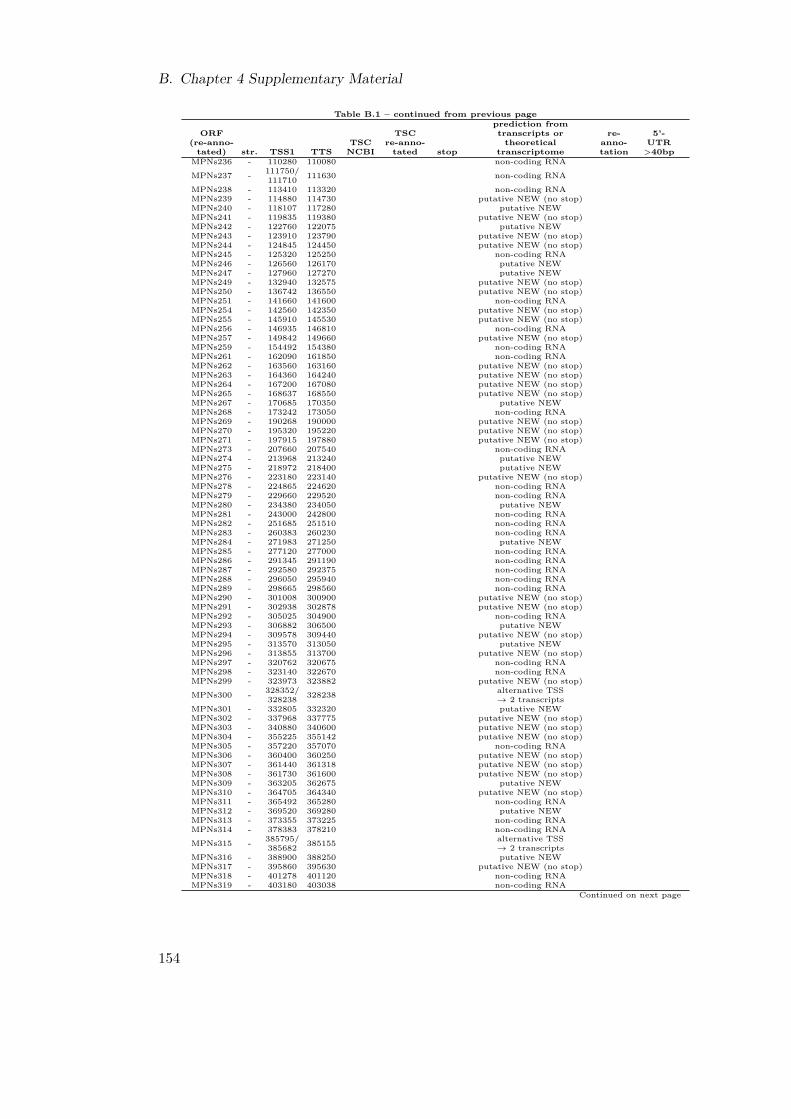
B. Chapter 4 Supplementary Material
Table B.1 – continued from previous pageprediction from
ORF TSC transcripts or re- 5’-(re-anno- TSC re-anno- theoretical anno- UTRtated) str. TSS1 TTS NCBI tated stop transcriptome tation >40bp
MPNs236 - 110280 110080 non-coding RNA
MPNs237 - 111750/ 111630 non-coding RNA111710MPNs238 - 113410 113320 non-coding RNAMPNs239 - 114880 114730 putative NEW (no stop)MPNs240 - 118107 117280 putative NEWMPNs241 - 119835 119380 putative NEW (no stop)MPNs242 - 122760 122075 putative NEWMPNs243 - 123910 123790 putative NEW (no stop)MPNs244 - 124845 124450 putative NEW (no stop)MPNs245 - 125320 125250 non-coding RNAMPNs246 - 126560 126170 putative NEWMPNs247 - 127960 127270 putative NEWMPNs249 - 132940 132575 putative NEW (no stop)MPNs250 - 136742 136550 putative NEW (no stop)MPNs251 - 141660 141600 non-coding RNAMPNs254 - 142560 142350 putative NEW (no stop)MPNs255 - 145910 145530 putative NEW (no stop)MPNs256 - 146935 146810 non-coding RNAMPNs257 - 149842 149660 putative NEW (no stop)MPNs259 - 154492 154380 non-coding RNAMPNs261 - 162090 161850 non-coding RNAMPNs262 - 163560 163160 putative NEW (no stop)MPNs263 - 164360 164240 putative NEW (no stop)MPNs264 - 167200 167080 putative NEW (no stop)MPNs265 - 168637 168550 putative NEW (no stop)MPNs267 - 170685 170350 putative NEWMPNs268 - 173242 173050 non-coding RNAMPNs269 - 190268 190000 putative NEW (no stop)MPNs270 - 195320 195220 putative NEW (no stop)MPNs271 - 197915 197880 putative NEW (no stop)MPNs273 - 207660 207540 non-coding RNAMPNs274 - 213968 213240 putative NEWMPNs275 - 218972 218400 putative NEWMPNs276 - 223180 223140 putative NEW (no stop)MPNs278 - 224865 224620 non-coding RNAMPNs279 - 229660 229520 non-coding RNAMPNs280 - 234380 234050 putative NEWMPNs281 - 243000 242800 non-coding RNAMPNs282 - 251685 251510 non-coding RNAMPNs283 - 260383 260230 non-coding RNAMPNs284 - 271983 271250 putative NEWMPNs285 - 277120 277000 non-coding RNAMPNs286 - 291345 291190 non-coding RNAMPNs287 - 292580 292375 non-coding RNAMPNs288 - 296050 295940 non-coding RNAMPNs289 - 298665 298560 non-coding RNAMPNs290 - 301008 300900 putative NEW (no stop)MPNs291 - 302938 302878 putative NEW (no stop)MPNs292 - 305025 304900 non-coding RNAMPNs293 - 306882 306500 putative NEWMPNs294 - 309578 309440 putative NEW (no stop)MPNs295 - 313570 313050 putative NEWMPNs296 - 313855 313700 putative NEW (no stop)MPNs297 - 320762 320675 non-coding RNAMPNs298 - 323140 322670 non-coding RNAMPNs299 - 323973 323882 putative NEW (no stop)
MPNs300 - 328352/ 328238 alternative TSS328238 → 2 transcripts
MPNs301 - 332805 332320 putative NEWMPNs302 - 337968 337775 putative NEW (no stop)MPNs303 - 340880 340600 putative NEW (no stop)MPNs304 - 355225 355142 putative NEW (no stop)MPNs305 - 357220 357070 non-coding RNAMPNs306 - 360400 360250 putative NEW (no stop)MPNs307 - 361440 361318 putative NEW (no stop)MPNs308 - 361730 361600 putative NEW (no stop)MPNs309 - 363205 362675 putative NEWMPNs310 - 364705 364340 putative NEW (no stop)MPNs311 - 365492 365280 non-coding RNAMPNs312 - 369520 369280 putative NEWMPNs313 - 373355 373225 non-coding RNAMPNs314 - 378383 378210 non-coding RNA
MPNs315 - 385795/ 385155 alternative TSS385682 → 2 transcripts
MPNs316 - 388900 388250 putative NEWMPNs317 - 395860 395630 putative NEW (no stop)MPNs318 - 401278 401120 non-coding RNAMPNs319 - 403180 403038 non-coding RNA
Continued on next page
154

B.2. Tables
Table B.1 – continued from previous pageprediction from
ORF TSC transcripts or re- 5’-(re-anno- TSC re-anno- theoretical anno- UTRtated) str. TSS1 TTS NCBI tated stop transcriptome tation >40bp
MPNs320 - 406625 406350 non-coding RNAMPNs321 - 407738 407622 non-coding RNAMPNs322 - 415460 415300 non-coding RNAMPNs323 - 409390 409295 non-coding RNAMPNs324 - 416880 416683 non-coding RNAMPNs326 - 431605 431400 putative NEW (no stop)MPNs327 - 443075 441770 putative NEWMPNs328 - 447072 446962 putative NEW (no stop)MPNs329 - 457902 457600 putative NEW (no stop)MPNs330 - 473207 473000 putative NEW (no stop)MPNs331 - 477250 477180 non-coding RNAMPNs333 - 491444 491280 non-coding RNAMPNs334 - 491740 491520 non-coding RNAMPNs335 - 493524 492700 putative NEWMPNs336 - 499965 499850 putative NEW (no stop)MPNs337 - 501498 501300 non-coding RNAMPNs339 - 563350 562850 putative NEWMPNs340 - 591265 591120 putative NEW (no stop)MPNs341 - 591705 591500 non-coding RNAMPNs342 - 596738 596653 non-coding RNAMPNs343 - 607514 605500 putative NEWMPNs344 - 620510 620220 putative NEW (no stop)MPNs345 - 624778 624640 putative NEW (no stop)MPNs346 - 625128 624920 putative NEW (no stop)MPNs347 - 627540 627388 non-coding RNAMPNs348 - 636558 636420 putative NEW (no stop)MPNs349 - 642723 642575 putative NEW (no stop)MPNs350 - 643850 642900 putative NEWMPNs351 - 644000 643920 non-coding RNAMPNs352 - 651280 650925 putative NEW (no stop)MPNs353 - 657224 656675 putative NEWMPNs354 - 663380 662700 putative NEWMPNs355 - 664437 664200 non-coding RNAMPNs356 - 666596 666400 putative NEW (no stop)MPNs357 - 670575 670480 putative NEW (no stop)MPNs358 - 677306 non-coding RNAMPNs359 - 678640 678550 putative NEW (no stop)MPNs360 - 691910 691820 putative NEW (no stop)MPNs361 - 703742 703270 putative NEW (no stop)MPNs362 - 711220 710925 putative NEW (no stop)MPNs363 - 718750 718500 putative NEW (no stop)MPNs364 - 738930 738320 putative NEW (no stop)MPNs365 - 742355 741810 putative NEW (no stop)MPNs366 - 749770 749750 putative NEW (no stop)MPNs367 - 759226 758925 putative NEWMPNs368 - 765522 765395 non-coding RNAMPNs369 - 776443 776220 putative NEWMPNs370 - 778310 778160 non-coding RNAMPNs371 - 781243 781120 non-coding RNAMPNs372 - 786672 786330 putative NEW (no stop)MPNs373 - 789578 789540 putative NEW (no stop)MPNs374 - 791993 791943 non-coding RNA
MPNs375 - 800080/ 799800 alternative TSS800042 → 2 transcripts
MPNs376 - 800460 800400 non-coding RNAMPNs377 - 800535 800495 non-coding RNAMPNs378 - 803732 803500 putative NEW (no stop)MPNs379 - 813458 813000 putative NEW (no stop)MPNs380 - 813522 813485 non-coding RNAMPNs381 + 596 633 non-coding RNAMPNs382 + 134175 134430 putative NEW (no stop)MPNs383 - 180395 180030 putative NEW (no stop)MPNt01 - 19078 19149 19073MPNt02 - 19256 19231 19154MPNt03 - 93150 93050 93140 93051MPNt04 - 156432 156350 156430 156350MPNt05 + 358232 358243 358320MPNt06 + 358372 358449MPNt07 + 358452 358529MPNt08 + 358539 358615MPNt09 + 358655 358746MPNt10 + 358758 358835MPNt11 + 358900 358836 358910MPNt12 + 358978 358911 358987MPNt13 + 373075 373158 373083 373160MPNt14 - 427650 427580 427650 427580
MPNt15 + 429258/ 429359 429284 429359 alternative TSS429280 → 2 transcripts
MPNt16 + 429420 429500 429432 429506Continued on next page
155
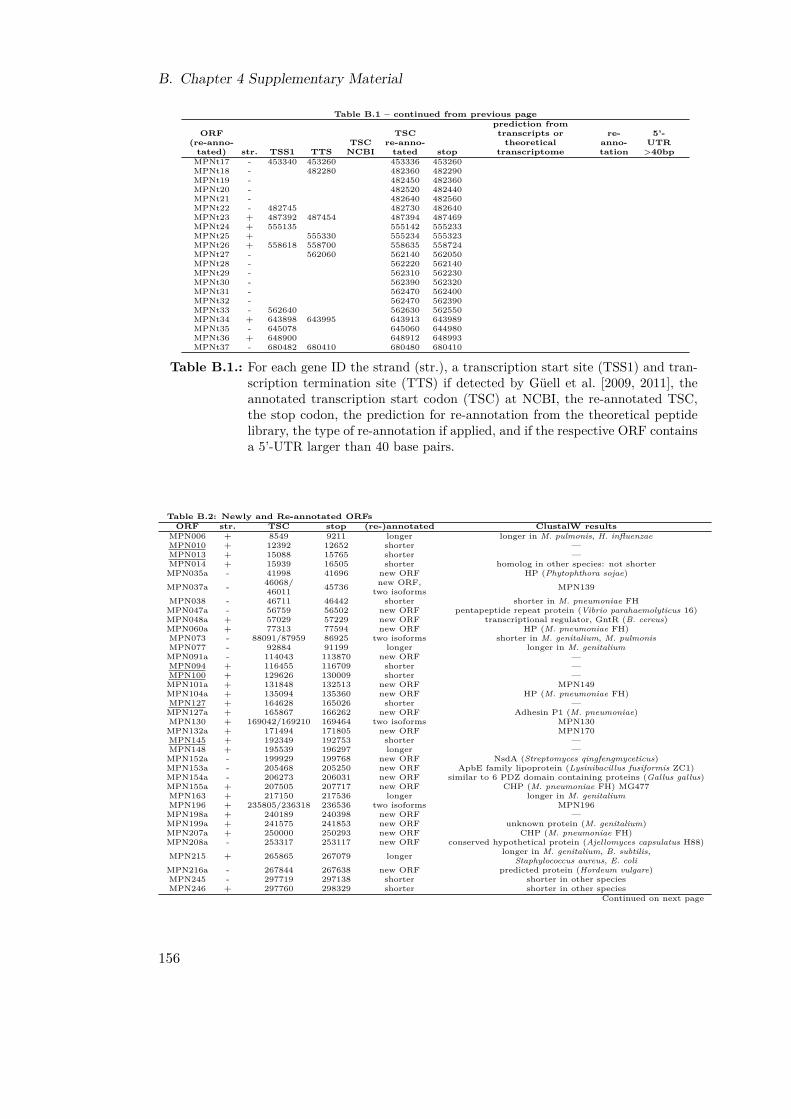
B. Chapter 4 Supplementary Material
Table B.1 – continued from previous pageprediction from
ORF TSC transcripts or re- 5’-(re-anno- TSC re-anno- theoretical anno- UTRtated) str. TSS1 TTS NCBI tated stop transcriptome tation >40bpMPNt17 - 453340 453260 453336 453260MPNt18 - 482280 482360 482290MPNt19 - 482450 482360MPNt20 - 482520 482440MPNt21 - 482640 482560MPNt22 - 482745 482730 482640MPNt23 + 487392 487454 487394 487469MPNt24 + 555135 555142 555233MPNt25 + 555330 555234 555323MPNt26 + 558618 558700 558635 558724MPNt27 - 562060 562140 562050MPNt28 - 562220 562140MPNt29 - 562310 562230MPNt30 - 562390 562320MPNt31 - 562470 562400MPNt32 - 562470 562390MPNt33 - 562640 562630 562550MPNt34 + 643898 643995 643913 643989MPNt35 - 645078 645060 644980MPNt36 + 648900 648912 648993MPNt37 - 680482 680410 680480 680410
Table B.1.: For each gene ID the strand (str.), a transcription start site (TSS1) and tran-scription termination site (TTS) if detected by Güell et al. [2009, 2011], theannotated transcription start codon (TSC) at NCBI, the re-annotated TSC,the stop codon, the prediction for re-annotation from the theoretical peptidelibrary, the type of re-annotation if applied, and if the respective ORF containsa 5’-UTR larger than 40 base pairs.
Table B.2: Newly and Re-annotated ORFsORF str. TSC stop (re-)annotated ClustalW results
MPN006 + 8549 9211 longer longer in M. pulmonis, H. influenzaeMPN010 + 12392 12652 shorter —MPN013 + 15088 15765 shorter —MPN014 + 15939 16505 shorter homolog in other species: not shorterMPN035a - 41998 41696 new ORF HP (Phytophthora sojae)
MPN037a - 46068/ 45736 new ORF, MPN13946011 two isoformsMPN038 - 46711 46442 shorter shorter in M. pneumoniae FHMPN047a - 56759 56502 new ORF pentapeptide repeat protein (Vibrio parahaemolyticus 16)MPN048a + 57029 57229 new ORF transcriptional regulator, GntR (B. cereus)MPN060a + 77313 77594 new ORF HP (M. pneumoniae FH)MPN073 - 88091/87959 86925 two isoforms shorter in M. genitalium, M. pulmonisMPN077 - 92884 91199 longer longer in M. genitaliumMPN091a - 114043 113870 new ORF —MPN094 + 116455 116709 shorter —MPN100 + 129626 130009 shorter —MPN101a + 131848 132513 new ORF MPN149MPN104a + 135094 135360 new ORF HP (M. pneumoniae FH)MPN127 + 164628 165026 shorter —MPN127a + 165867 166262 new ORF Adhesin P1 (M. pneumoniae)MPN130 + 169042/169210 169464 two isoforms MPN130MPN132a + 171494 171805 new ORF MPN170MPN145 + 192349 192753 shorter —MPN148 + 195539 196297 longer —MPN152a - 199929 199768 new ORF NsdA (Streptomyces qingfengmyceticus)MPN153a - 205468 205250 new ORF ApbE family lipoprotein (Lysinibacillus fusiformis ZC1)MPN154a - 206273 206031 new ORF similar to 6 PDZ domain containing proteins (Gallus gallus)MPN155a + 207505 207717 new ORF CHP (M. pneumoniae FH) MG477MPN163 + 217150 217536 longer longer in M. genitaliumMPN196 + 235805/236318 236536 two isoforms MPN196MPN198a + 240189 240398 new ORF —MPN199a + 241575 241853 new ORF unknown protein (M. genitalium)MPN207a + 250000 250293 new ORF CHP (M. pneumoniae FH)MPN208a - 253317 253117 new ORF conserved hypothetical protein (Ajellomyces capsulatus H88)
MPN215 + 265865 267079 longer longer in M. genitalium, B. subtilis,Staphylococcus aureus, E. coli
MPN216a - 267844 267638 new ORF predicted protein (Hordeum vulgare)MPN245 - 297719 297138 shorter shorter in other speciesMPN246 + 297760 298329 shorter shorter in other species
Continued on next page
156

B.2. Tables
Table B.2 – continued from previous pageORF str. TSC stop (re-)annotated ClustalW results
MPN283 + 336626 336826 shorter —MPN285 + 341207 341533 shorter —MPN307 + 361468/361783 362397 two isoforms MPN307MPN310 + 365468/370424 370924 two isoforms other experimental evidences*MPN320 + 380664 381527 shorter homolog in other species: not shorterMPN335a - 397616 397269 new ORF HP (Coprobacillus)MPN344 + 411383 411736 shorter —MPN347a + 415697 416032 new ORF death-on-curing family protein (M. pneumoniae FH)MPN356 - 425440 424241 shorter shorter in other speciesMPN367a + 438615 438827 new ORF MPN150MPN368 + 439388 439762 shorter —MPN373 - 446606 446127 shorter —MPN388 - 465449 465048 longer —MPN393a - 472203 472030 new ORF —MPN395 - 473408 472983 shorter shorter in other speciesMPN397 + 476509 478671 shorter shorter in other speciesMPN410 + 494694/494862 495140 two isoforms —MPN412a + 497073 497474 new ORF hypothetical protein VCJ_001109 (Vibrio)MPN445 + 541794 542603 shorter shorter in other speciesMPN450 - 549589 548690 shorter shorter in M. genitalium
MPN464a + 568625/ 569155 new ORF, altern. MPN100568793 TSS & TSCMPN469 - 573063 572254 longer longer in M. genitaliumMPN474 - 576942 575950 shorter shorter in M. genitaliumMPN474a - 579389 579105 new ORF CHP (M. pneumoniae FH) MG328MPN482 - 586713 586492 longer longer in M. genitalium, M. pulmonisMPN488a - 592377 592201 new ORF MG338MPN501 + 608335 608757 shorter —MPN504 + 612887 613120 shorter —
MPN506a - 615980 615744 new ORF 2,4-dienoyl-CoA reductase (NADPH) precursor relatedprotein (Leeuwenhoekiella blandensis)
MPN508 - 619735 618485 shorterMPN520a - 640304 640017 new ORF isoleucyl-tRNA synthetase (M. pneumoniae 309)MPN524 - 645904 645545 shorter —MPN575 - 698193 697864 shorter —MPN578a + 701714 702049 new ORF cyclopropane fatty acid synthase B (P. putida)MPN582a - 705505 705191 new ORF MPN584MPN596 - 718649 717435 shorter homolog in M. genitalium: not shorterMPN611 - 732796 731678 shorter shorter in M. genitaliumMPN626 + 752121 752543 shorter homolog in M. genitalium: not shorterMPN632 + 758747 759475 longer longer in M. genitalium, B. subtilis
MPN652 + 777481 778557 shorter shorter in M. pulmonis, B. subtilis,E. coli, S. pneumoniae
MPN655 + 780338 780622 shorter shorter in M. pneumoniae FH and 309 strains
MPN659 - 784138 783443 longer longer in M. genitalium, M. pulmonis, B. subtilis,extitC. crescentus, E. coli, S. pneumoniae, H. influenzae
MPN664 - 788141 787269 longer longer in M. genitalium
MPN670a - 792833 792213 new ORF gamma-glutamyltransferase 7-like(Acyrthosiphon pisum)
MPN671a - 794318 793737 new ORF HP (M. pneumoniae FH)MPN672 - 797181 796612 longer longer in M. pulmonis
Table B.2.: ClustalW results for newly and re-annotated M. pneumoniae ORFs; ’altern.’abbreviates alternative.
Table B.3: Molecular Weight of M. pneumoniae Proteinsprotein protein COG
copies/cell copies/cell cate- MW1 MW2 MW3MPN at 6h at 96h gory MS ID (kDa) (kDa) (kDa)
MPN001 398.66 393.22 L id00013 45 210 -MPN002 13.01 12.78 L id00032 32.5 210 45MPN003 92.56 96.48 L id00049 60 210 -MPN004 95.03 93.07 L id00081 70 210 -MPN005 83.1 90.77 J id00114 45 70 210MPN006 26.39 25.22 F id00133 22.5 - -MPN007 10.91 9.61 L id00143 27.5 - -MPN008 8.3 7.62 J id00153 45 - -MPN009 7.06 5.75 L id00174 27.5 - -MPN010 0 0 N - - - -MPN011 12.47 16.89 M id00207 22.5 10 -
Continued on next page
157
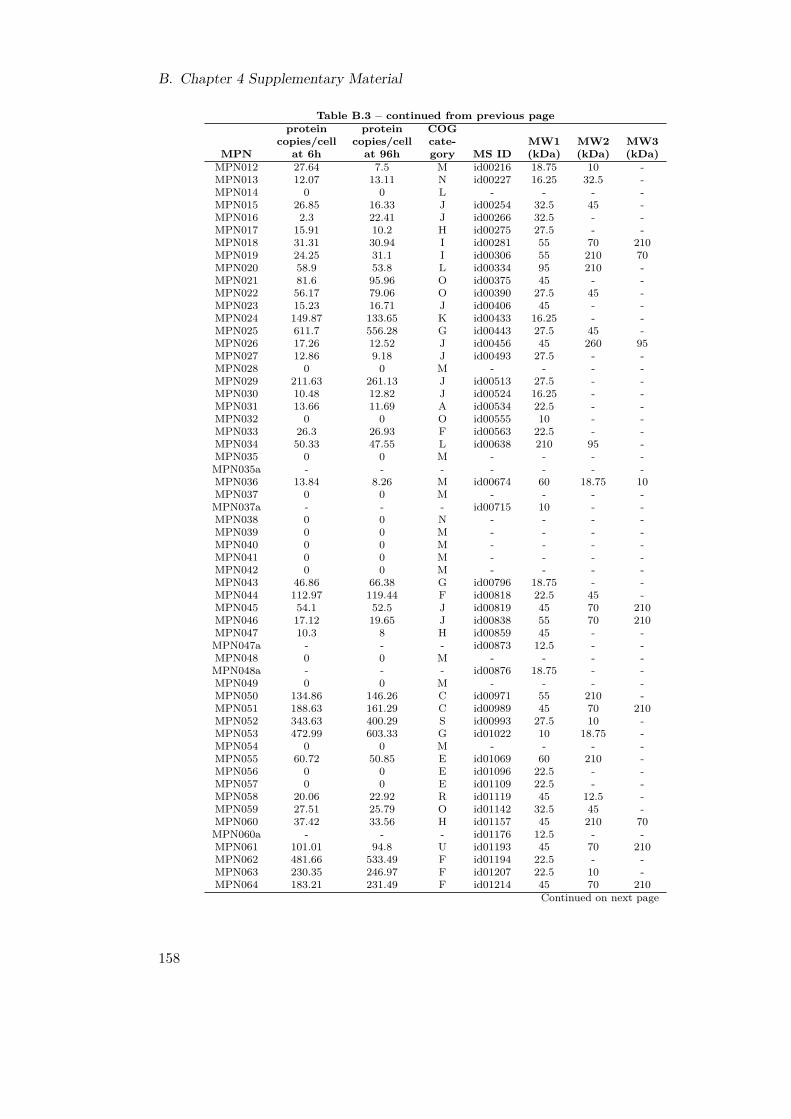
B. Chapter 4 Supplementary Material
Table B.3 – continued from previous pageprotein protein COG
copies/cell copies/cell cate- MW1 MW2 MW3MPN at 6h at 96h gory MS ID (kDa) (kDa) (kDa)
MPN012 27.64 7.5 M id00216 18.75 10 -MPN013 12.07 13.11 N id00227 16.25 32.5 -MPN014 0 0 L - - - -MPN015 26.85 16.33 J id00254 32.5 45 -MPN016 2.3 22.41 J id00266 32.5 - -MPN017 15.91 10.2 H id00275 27.5 - -MPN018 31.31 30.94 I id00281 55 70 210MPN019 24.25 31.1 I id00306 55 210 70MPN020 58.9 53.8 L id00334 95 210 -MPN021 81.6 95.96 O id00375 45 - -MPN022 56.17 79.06 O id00390 27.5 45 -MPN023 15.23 16.71 J id00406 45 - -MPN024 149.87 133.65 K id00433 16.25 - -MPN025 611.7 556.28 G id00443 27.5 45 -MPN026 17.26 12.52 J id00456 45 260 95MPN027 12.86 9.18 J id00493 27.5 - -MPN028 0 0 M - - - -MPN029 211.63 261.13 J id00513 27.5 - -MPN030 10.48 12.82 J id00524 16.25 - -MPN031 13.66 11.69 A id00534 22.5 - -MPN032 0 0 O id00555 10 - -MPN033 26.3 26.93 F id00563 22.5 - -MPN034 50.33 47.55 L id00638 210 95 -MPN035 0 0 M - - - -MPN035a - - - - - - -MPN036 13.84 8.26 M id00674 60 18.75 10MPN037 0 0 M - - - -MPN037a - - - id00715 10 - -MPN038 0 0 N - - - -MPN039 0 0 M - - - -MPN040 0 0 M - - - -MPN041 0 0 M - - - -MPN042 0 0 M - - - -MPN043 46.86 66.38 G id00796 18.75 - -MPN044 112.97 119.44 F id00818 22.5 45 -MPN045 54.1 52.5 J id00819 45 70 210MPN046 17.12 19.65 J id00838 55 70 210MPN047 10.3 8 H id00859 45 - -MPN047a - - - id00873 12.5 - -MPN048 0 0 M - - - -MPN048a - - - id00876 18.75 - -MPN049 0 0 M - - - -MPN050 134.86 146.26 C id00971 55 210 -MPN051 188.63 161.29 C id00989 45 70 210MPN052 343.63 400.29 S id00993 27.5 10 -MPN053 472.99 603.33 G id01022 10 18.75 -MPN054 0 0 M - - - -MPN055 60.72 50.85 E id01069 60 210 -MPN056 0 0 E id01096 22.5 - -MPN057 0 0 E id01109 22.5 - -MPN058 20.06 22.92 R id01119 45 12.5 -MPN059 27.51 25.79 O id01142 32.5 45 -MPN060 37.42 33.56 H id01157 45 210 70MPN060a - - - id01176 12.5 - -MPN061 101.01 94.8 U id01193 45 70 210MPN062 481.66 533.49 F id01194 22.5 - -MPN063 230.35 246.97 F id01207 22.5 10 -MPN064 183.21 231.49 F id01214 45 70 210
Continued on next page
158

B.2. Tables
Table B.3 – continued from previous pageprotein protein COG
copies/cell copies/cell cate- MW1 MW2 MW3MPN at 6h at 96h gory MS ID (kDa) (kDa) (kDa)
MPN065 18.31 16.68 F id01230 12.5 18.75 -MPN066 76.59 90.09 G id01237 55 70 210MPN067 176.58 193.15 K id01282 45 32.5 95MPN068 13.16 14.33 U id01288 16.25 - -MPN069 15.66 6.61 J id01291 10 - -MPN070 7.96 4.26 M id01296 16.25 - -MPN071 15.04 12.54 R id01315 27.5 - -MPN072 12.56 9.08 J id01319 22.5 - -MPN073 128.56 149.77 F id01336 32.5 45 70MPN074 3.35 0 J id01340 18.75 - -MPN075 7.29 5.11 M id01341 32.5 10 -MPN076 240.08 233.95 G id01388 45 210 70MPN077 87.14 108.58 R id01412 260 95 60MPN078 15.65 19.67 G id01418 55 70 210MPN079 13.68 12.78 G id01451 32.5 45 -MPN080 12.62 24.05 L id01464 18.75 27.5 55MPN081 10.78 12.68 E id01511 45 - -MPN082 290.1 311.53 G id01539 60 210 -MPN083 12.54 9.72 S id01566 55 18.75 10MPN084 10.59 17.2 S id01595 55 27.5 -MPN085 0 0.41 M - - - -MPN086 0 0 M - - - -MPN087 0 0 M - - - -MPN088 0 0 S - - - -MPN089 0 0 V - - - -MPN090 21.88 4.82 M id01695 27.5 10 -MPN091 0 0 S - - - -MPN091a - - - id01712 - - -MPN092 0 0 M - - - -MPN093 34.81 44.01 M - - - -MPN094 50.45 18.38 N id01748 10 - -MPN095 0.12 9.24 E - - - -MPN096 0 0 E - - - -MPN097 0 0.06 M - - - -MPN098 12.93 15.14 M - - - -MPN099 88.51 70.22 M id01956 210 - -MPN100 18.7 14.08 N - - - -MPN101 227.16 207.06 M - - - -MPN101a - - - - - - -MPN102 0 8.8 M - - - -MPN103 0 0 S - - - -MPN104 23.12 16.84 N id02053 16.25 - -MPN104a - - - id02064 12.5 - -MPN105 60.24 54.03 J id02077 32.5 45 260MPN106 68.06 65.77 J id02091 70 210 -MPN107 0 0 L - - - -MPN108 0 0 L - - - -MPN109 42.02 41.08 V id02159 18.75 - -MPN110 0 0 V - - - -MPN111 0 0 V - - - -MPN112 0 0 U - - - -MPN113 0 0 U - - - -MPN114 0 0 I - - - -MPN115 134.42 124.74 J id02306 22.5 - -MPN116 16.7 14.47 J id02314 12.5 - -MPN117 31.35 33.28 J id02319 18.75 - -MPN118 15.68 12.62 L id02337 22.5 - -MPN119 103.49 100.82 O id02338 210 95 -
Continued on next page
159

B. Chapter 4 Supplementary Material
Table B.3 – continued from previous pageprotein protein COG
copies/cell copies/cell cate- MW1 MW2 MW3MPN at 6h at 96h gory MS ID (kDa) (kDa) (kDa)
MPN120 261.04 222.59 O id02379 22.5 - -MPN121 113.89 110.15 S id02386 12.5 18.75 -MPN122 12.34 9.27 L id02395 60 260 95MPN123 8.98 7.56 L id02422 70 210 -MPN124 111.36 62.67 K id02467 45 210 -MPN125 9.7 8.02 L id02468 60 260 -MPN126 29.3 31.13 R id02498 18.75 - -MPN127 2.31 0.88 N id02514 55 - -MPN127a - - - - - - -MPN128 85.32 89.03 M - - - -MPN129 0 0 M - - - -MPN130 68.9 25.12 N id02580 16.25 10 -MPN131 0 0 M - - - -MPN132 87.68 48.39 M - - - -MPN132a - - - id02622 10 - -MPN133 2.61 1.48 L id02636 18.75 27.5 12.5MPN134 139.47 122.39 G id02653 60 260 -MPN135 11.56 7.77 G id02678 27.5 - -MPN136 10 18.35 G id02694 27.5 18.75 -MPN137 0 1.84 N - - - -MPN138 0.48 0 N - - - -MPN139 8.4 16.44 N id02747 12.5 - -MPN140 186.67 160.18 J id02752 32.5 45 210MPN141 312.74 269.96 M id02773 210 95 -MPN142 121.02 130.37 M id02838 70 32.5 210MPN143 0 0 S - - - -MPN144 189.94 174.57 M - - - -MPN145 0 0 N - - - -MPN146 0 0 M - - - -MPN147 0 0 M - - - -MPN148 8.34 4.23 M id02983 27.5 - -MPN149 68.78 7.85 M - - - -MPN150 0 0 M - - - -MPN151 16.33 16.44 N id03032 16.25 - -MPN152 27.86 32.6 M id03047 10 - -MPN152a - - - - - - -MPN153 105.96 104.9 L id03087 210 95 -MPN153a - - - id03131 260 - -MPN154 170.56 149.49 K id03137 60 210 -MPN154a - - - - - - -MPN155 89.83 79.65 J id03163 60 210 -MPN155a - - - - - - -MPN156 16.47 18.33 J id03189 12.5 - -MPN157 48.25 48.52 M id03196 32.5 45 -MPN158 12.41 11.25 H id03211 27.5 - -MPN159 11.94 19.9 V id03223 70 45 -MPN160 8.58 8.97 M - - - -MPN161 67.44 55.24 S id03259 45 210 -MPN162 69.6 30.57 M id03281 10 18.75 -MPN163 31.59 22.79 M id03301 22.5 - -MPN164 92.89 80.44 J id03308 12.5 - -MPN165 73.11 101.18 J id03313 32.5 45 -MPN166 115.14 120.72 J id03329 22.5 - -MPN167 161.85 159.79 J id03336 27.5 45 -MPN168 76.59 102.63 J id03341 32.5 45 -MPN169 40.57 61.8 J id03357 10 - -MPN170 51.61 44.49 J id03359 18.75 - -MPN171 87.46 93.11 J id03367 27.5 45 -
Continued on next page
160

B.2. Tables
Table B.3 – continued from previous pageprotein protein COG
copies/cell copies/cell cate- MW1 MW2 MW3MPN at 6h at 96h gory MS ID (kDa) (kDa) (kDa)
MPN172 39.76 48.19 J id03383 16.25 - -MPN173 35.5 30.34 J id03391 12.5 - -MPN174 44.54 56.94 J id03394 12.5 18.75 -MPN175 24.95 31.33 J id03398 16.25 - -MPN176 83.92 92.34 J id03403 16.25 - -MPN177 101.93 121.09 J id03409 18.75 - -MPN178 52.46 52.58 J id03417 10 - -MPN179 41.29 48.38 J id03422 18.75 - -MPN180 96.38 103.69 J id03427 22.5 - -MPN181 60.7 68.48 J id03434 12.5 - -MPN182 86.57 91.08 J id03441 27.5 45 -MPN183 56.95 44.74 J id03452 18.75 - -MPN184 23.92 20.14 U id03458 32.5 55 210MPN185 66.28 62.01 F id03477 22.5 - -MPN186 20.34 11.19 J id03490 27.5 - -MPN187 33.88 33.83 J id03504 10 - -MPN188 0.42 16.01 J - - - -MPN189 72.76 67.03 J id03510 16.25 - -MPN190 66.45 54.19 J id03518 12.5 - -MPN191 329.64 325.62 K id03522 32.5 45 210MPN192 44.69 33.43 J id03539 16.25 - -MPN193 40.55 32.98 P id03545 27.5 45 -MPN194 47.93 41.8 P id03558 32.5 45 -MPN195 23.75 25.95 P id03572 32.5 45 -MPN196 5.82 3.27 J id03592 27.5 10 -MPN197 143.46 146.9 E id03609 60 210 -MPN198 4.61 2.36 V id03635 32.5 - -MPN198a - - - - - - -MPN199 2.6 3.37 M id03651 27.5 - -MPN199a - - - id03681 27.5 - -MPN200 31.63 29.7 M id03686 18.75 27.5 10MPN201 2.73 0 V id03725 - - -MPN202 105.83 130.17 M - - - -MPN203 0 0 M - - - -MPN204 61.69 22.85 N id03769 10 - -MPN205 181.26 175.6 M - - - -MPN206 0 0 S - - - -MPN207 430.31 442.76 G id03807 70 210 45MPN207a - - - id03803 12.5 - -MPN208 117.17 106.58 J id03848 32.5 45 -MPN208a - - - id03840 27.5 - -MPN209 13.59 10.57 P id03861 70 260 -MPN210 135.46 138.07 U id03897 70 210 -MPN211 41.78 37.4 L id03931 60 260 -MPN212 - - S id03955 22.5 - -MPN213 19.36 54.02 M id03965 95 210 -MPN214 11.15 35.23 M id04011 16.25 - -MPN215 40.78 43.69 E id04015 32.5 45 -MPN216 60.6 59.48 E id04032 32.5 45 260MPN216a - - - id04047 - - -MPN217 50.59 48.73 E id04052 45 210 -MPN218 72.58 94.7 E id04070 70 210 -MPN219 88.59 87.66 J id04113 16.25 - -MPN220 115.04 126.97 J id04118 27.5 - -MPN221 32.16 35.19 J id04129 22.5 - -MPN222 7.26 5.77 J - - - -MPN223 16.72 16.38 T id04151 32.5 45 -MPN224 15.34 7.89 U id04163 32.5 - -
Continued on next page
161

B. Chapter 4 Supplementary Material
Table B.3 – continued from previous pageprotein protein COG
copies/cell copies/cell cate- MW1 MW2 MW3MPN at 6h at 96h gory MS ID (kDa) (kDa) (kDa)
MPN225 78.34 69.37 J id04178 18.75 - -MPN226 102.23 96.53 J id04187 18.75 10 -MPN227 231.47 243.73 J id04194 70 210 -MPN228 138.62 142.07 J id04222 27.5 45 -MPN229 103.69 90.2 L id04235 18.75 - -MPN230 119.29 115.06 J id04243 16.25 - -MPN231 40.78 50.13 J id04249 18.75 - -MPN232 30.9 29.81 L id04254 55 70 -MPN233 73.12 40.81 M id04274 16.25 27.5 -MPN234 3.64 0 M - - - -MPN235 3.78 0.85 L id04322 27.5 - -MPN236 24.36 23.73 J id04337 45 12.5 -MPN237 69.43 73.56 J id04359 45 210 -MPN238 44.84 42.3 J id04386 45 - -MPN239 92.46 103.53 K id04405 22.5 - -MPN240 84.72 83.49 O id04421 32.5 45 -MPN241 260.06 3.37 R - - - -MPN242 0 0 U - - - -MPN243 93.09 98.33 K id04457 70 210 -MPN244 33.97 35.31 L id04492 18.75 - -MPN245 97.97 94.81 J id04515 22.5 - -MPN246 145.6 134.84 F id04510 18.75 - -MPN247 63.33 51.16 T id04520 27.5 - -MPN248 12.53 11.14 T id04531 - - -MPN249 0 0 J - - - -MPN250 432.42 463.01 G id04560 45 70 260MPN251 20.71 22.89 G id04578 22.5 - -MPN252 68.1 77.15 J id04587 45 70 210MPN253 0 0 I id04602 18.75 - -MPN254 52.97 93.44 L id04614 16.25 - -MPN255 111.66 129.88 I id04625 27.5 - -MPN256 86.95 93.12 R id04633 27.5 - -MPN257 36.52 38.62 I id04646 32.5 45 70MPN258 145.85 158.03 G id04660 55 70 210MPN259 51.44 67.86 G id04687 45 210 70MPN260 91.42 63.85 G id04710 22.5 - -MPN261 133.99 132.88 L id04728 70 210 -MPN262 34.51 32.63 M id04765 45 - -MPN263 956.35 832.69 O id04786 10 18.75 -MPN264 41.59 26.59 R id04794 27.5 - -MPN265 46.48 59.88 J id04831 32.5 45 -MPN266 128.95 123.69 K id04833 16.25 - -MPN267 278.98 266.07 H id04837 27.5 45 -MPN268 59.03 60.5 G id04855 12.5 18.75 -MPN269 25.57 27.25 R id04861 55 70 210MPN270 0 0 M - - - -MPN271 18.87 7.71 M id04891 27.5 - -MPN272 54.37 39.83 S id04936 10 - -MPN273 275.02 253.17 F id04946 16.25 - -MPN274 0 0 P - - - -MPN275 57.02 43.2 L id04957 10 - -MPN276 24.81 29.88 S id04978 27.5 45 60MPN277 91.89 84.58 J id04977 55 70 210MPN278 14.33 10.5 M id05004 45 - -MPN279 16.09 21.36 J id05023 60 210 -MPN280 115.22 106.77 J id05051 55 210 -MPN281 29.7 26.83 M id05076 10 22.5 -MPN282 0 0 M - - - -
Continued on next page
162

B.2. Tables
Table B.3 – continued from previous pageprotein protein COG
copies/cell copies/cell cate- MW1 MW2 MW3MPN at 6h at 96h gory MS ID (kDa) (kDa) (kDa)
MPN283 0 0 N - - - -MPN284 98.78 118.54 M id05146 16.25 60 27.5MPN285 4.41 0 V - - - -MPN286 136.58 71.29 M - - - -MPN287 0 6.41 N id05241 12.5 18.75 -MPN288 56.52 66.25 M id05259 27.5 18.75 12.5MPN289 0 0 V - - - -MPN290 0 0 V - - - -MPN291 18.41 18.41 O id05326 22.5 - -MPN292 9.58 9.31 J id05335 32.5 45 -MPN293 0 0.22 U id05340 18.75 - -MPN294 351.29 311.65 O id05341 22.5 - -MPN295 404.69 387.09 K id05356 27.5 - -MPN296 27.64 24.46 J id05366 10 18.75 -MPN297 112.43 118.12 D id05369 16.25 - -MPN298 0 3.43 I id05376 12.5 - -MPN299 62.4 62.36 I id05382 27.5 45 -MPN300 10.98 8.31 D id05392 55 210 -MPN301 17.63 17.91 D id05415 22.5 - -MPN302 224.48 243.62 G id05426 27.5 45 -MPN303 320.57 359.48 G id05444 55 70 210MPN304 5.7 6.98 C id05492 27.5 - -MPN305 0 0 C - - - -MPN306 0 0 C - - - -MPN307 6.56 17.02 C id05530 32.5 22.5 -MPN308 7.42 16.55 E id05544 - - -MPN309 69.12 68.92 S id05570 55 95 -MPN310 146.38 148.75 M id05589 210 22.5 -MPN311 81.74 93.59 D id05659 45 - -MPN312 21.38 22.81 S id05674 32.5 - -MPN313 0 0 S - - - -MPN314 977.59 809.35 D id05694 16.25 - -MPN315 217.05 171.58 D id05699 32.5 45 -MPN316 11.72 6.74 D id05714 45 - -MPN317 17.99 6.74 D id05732 - - -MPN318 15.28 14.19 E id05748 45 32.5 60MPN319 7.16 10.34 E - - - -MPN320 480.14 400.85 F id05805 32.5 45 -MPN321 212.48 221.03 FH id05824 18.75 - -MPN322 827.73 921.4 F id05833 32.5 45 70MPN323 492.23 664.84 F id05849 18.75 - -MPN324 737.03 778.53 F id05859 70 210 -MPN325 51.96 79.44 J id05896 12.5 18.75 -MPN326 26.78 16.34 J id05902 10 - -MPN327 38.11 54.74 J id05906 12.5 - -MPN328 53.84 46.92 L id05915 32.5 45 -MPN329 11.98 12.22 K id05925 18.75 - -MPN330 11.34 12.17 S id05934 32.5 - -MPN331 215.57 226.96 O id05949 55 210 -MPN332 82.05 76.23 O id05968 70 210 -MPN333 0 0 R - - - -MPN334 0 0 R - - - -MPN335 0 0 R - - - -MPN335a - - - - - - -MPN336 35.16 34.87 H id06098 32.5 45 210MPN337 30.54 25.21 A id06100 55 70 210MPN338 38.35 47.1 A id06125 60 210 -MPN339 2.74 2.24 A id06153 22.5 - -
Continued on next page
163

B. Chapter 4 Supplementary Material
Table B.3 – continued from previous pageprotein protein COG
copies/cell copies/cell cate- MW1 MW2 MW3MPN at 6h at 96h gory MS ID (kDa) (kDa) (kDa)
MPN340 8.63 9.39 L id06165 55 - -MPN341 2.1 1.51 L id06195 - - -MPN342 19.53 9.16 V id06224 55 260 -MPN343 2.73 0 V - - - -MPN344 10.48 25.22 N id06266 12.5 18.75 -MPN345 0 0 V - - - -MPN346 0 0 V - - - -MPN347 0 0 V - - - -MPN347a - - - - - - -MPN348 18.32 13.53 H id06339 18.75 - -MPN349 56.83 51.56 R id06346 27.5 45 -MPN350 0.55 0 I id06366 22.5 - -MPN351 0 0 V - - - -MPN352 111.19 107.74 K id06391 55 70 210MPN353 20.46 19.27 L id06420 60 210 -MPN354 58.84 64.23 J id06442 45 70 210MPN355 13.45 15.06 J id06452 27.5 - -MPN356 10.16 7.43 J id06477 45 - -MPN357 21.3 21.45 L id06502 60 210 -MPN358 46.13 41.61 A id06503 45 210 70MPN359 31.35 35.65 A id06529 22.5 - -MPN360 40.8 39.76 J id06542 12.5 - -MPN361 24.47 23.52 J id06546 45 - -MPN362 7.43 7.1 J id06562 45 - -MPN363 9.78 10.65 M - - - -MPN364 19.58 16.92 M - - - -MPN365 2.73 0 V - - - -MPN366 59.77 42.27 M - - - -MPN367 59.32 50.76 M - - - -MPN367a - - - - - - -MPN368 14.71 5.33 N id06679 12.5 - -MPN369 40.03 0 M - - - -MPN370 219.28 198.7 M - - - -MPN371 0 0 S - - - -MPN372 159.46 156.56 V id06748 60 210 -MPN373 0 0 M - - - -MPN374 0 0 M - - - -MPN375 0 0 M - - - -MPN376 131.22 227.52 A id06896 32.5 95 210MPN377 576.82 525.35 A id06907 10 18.75 -MPN378 35.75 35.21 L id06912 70 210 -MPN379 29 27.62 L id06950 32.5 - -MPN380 31.76 34.06 L id06960 27.5 - -MPN381 84.01 91.31 R id06976 32.5 45 -MPN382 0 2.17 H id06995 22.5 - -MPN383 102.58 71.48 R id07023 27.5 45 -MPN384 109.06 82.6 J id07056 70 210 -MPN385 0 9.9 A - - - -MPN386 333.18 345.29 F id07070 22.5 - -MPN387 60.56 68.99 S id07090 45 - -MPN388 54.26 24.1 S id07098 12.5 - -MPN389 521.01 539.55 O id07110 45 32.5 210MPN390 736.37 651.63 C id07133 45 210 -MPN391 740.46 755.66 C id07155 45 210 -MPN392 2017.58 2077.91 C id07174 32.5 45 70MPN393 2228.58 2269.69 C id07190 45 210 32.5MPN393a - - - - - - -MPN394 1271.12 1095.2 C id07211 45 210 -
Continued on next page
164
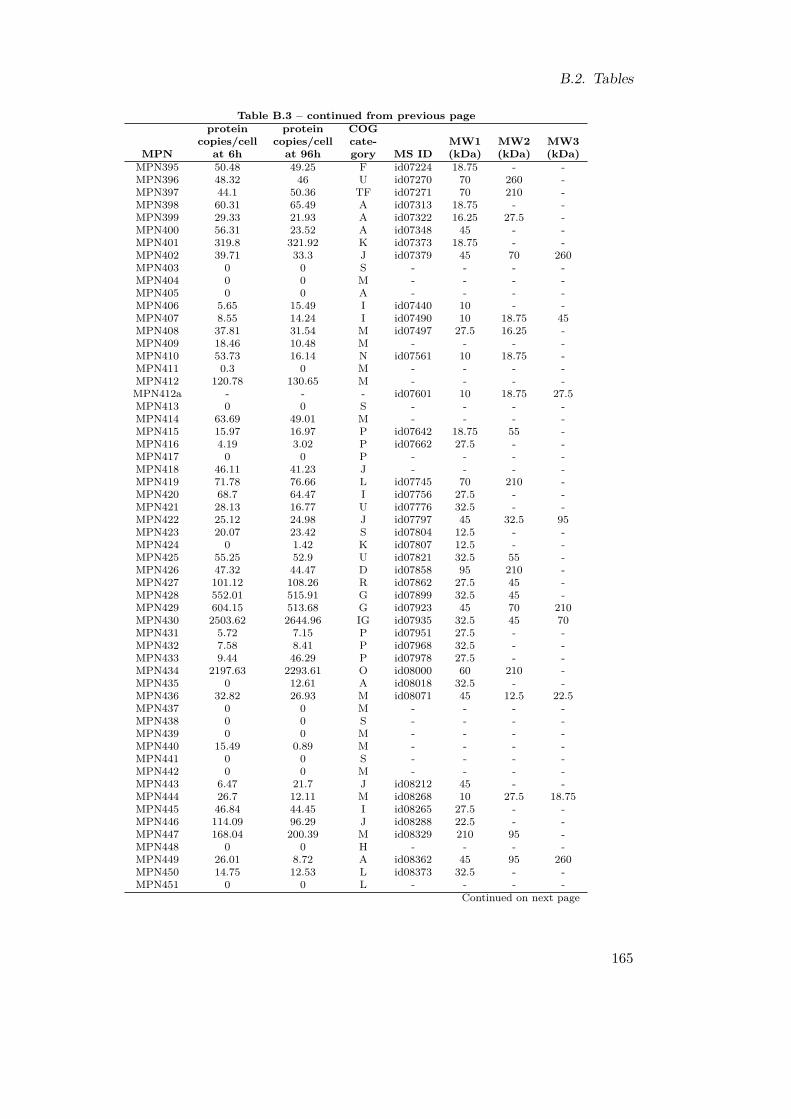
B.2. Tables
Table B.3 – continued from previous pageprotein protein COG
copies/cell copies/cell cate- MW1 MW2 MW3MPN at 6h at 96h gory MS ID (kDa) (kDa) (kDa)
MPN395 50.48 49.25 F id07224 18.75 - -MPN396 48.32 46 U id07270 70 260 -MPN397 44.1 50.36 TF id07271 70 210 -MPN398 60.31 65.49 A id07313 18.75 - -MPN399 29.33 21.93 A id07322 16.25 27.5 -MPN400 56.31 23.52 A id07348 45 - -MPN401 319.8 321.92 K id07373 18.75 - -MPN402 39.71 33.3 J id07379 45 70 260MPN403 0 0 S - - - -MPN404 0 0 M - - - -MPN405 0 0 A - - - -MPN406 5.65 15.49 I id07440 10 - -MPN407 8.55 14.24 I id07490 10 18.75 45MPN408 37.81 31.54 M id07497 27.5 16.25 -MPN409 18.46 10.48 M - - - -MPN410 53.73 16.14 N id07561 10 18.75 -MPN411 0.3 0 M - - - -MPN412 120.78 130.65 M - - - -MPN412a - - - id07601 10 18.75 27.5MPN413 0 0 S - - - -MPN414 63.69 49.01 M - - - -MPN415 15.97 16.97 P id07642 18.75 55 -MPN416 4.19 3.02 P id07662 27.5 - -MPN417 0 0 P - - - -MPN418 46.11 41.23 J - - - -MPN419 71.78 76.66 L id07745 70 210 -MPN420 68.7 64.47 I id07756 27.5 - -MPN421 28.13 16.77 U id07776 32.5 - -MPN422 25.12 24.98 J id07797 45 32.5 95MPN423 20.07 23.42 S id07804 12.5 - -MPN424 0 1.42 K id07807 12.5 - -MPN425 55.25 52.9 U id07821 32.5 55 -MPN426 47.32 44.47 D id07858 95 210 -MPN427 101.12 108.26 R id07862 27.5 45 -MPN428 552.01 515.91 G id07899 32.5 45 -MPN429 604.15 513.68 G id07923 45 70 210MPN430 2503.62 2644.96 IG id07935 32.5 45 70MPN431 5.72 7.15 P id07951 27.5 - -MPN432 7.58 8.41 P id07968 32.5 - -MPN433 9.44 46.29 P id07978 27.5 - -MPN434 2197.63 2293.61 O id08000 60 210 -MPN435 0 12.61 A id08018 32.5 - -MPN436 32.82 26.93 M id08071 45 12.5 22.5MPN437 0 0 M - - - -MPN438 0 0 S - - - -MPN439 0 0 M - - - -MPN440 15.49 0.89 M - - - -MPN441 0 0 S - - - -MPN442 0 0 M - - - -MPN443 6.47 21.7 J id08212 45 - -MPN444 26.7 12.11 M id08268 10 27.5 18.75MPN445 46.84 44.45 I id08265 27.5 - -MPN446 114.09 96.29 J id08288 22.5 - -MPN447 168.04 200.39 M id08329 210 95 -MPN448 0 0 H - - - -MPN449 26.01 8.72 A id08362 45 95 260MPN450 14.75 12.53 L id08373 32.5 - -MPN451 0 0 L - - - -
Continued on next page
165

B. Chapter 4 Supplementary Material
Table B.3 – continued from previous pageprotein protein COG
copies/cell copies/cell cate- MW1 MW2 MW3MPN at 6h at 96h gory MS ID (kDa) (kDa) (kDa)
MPN452 241.71 209.54 M id08410 95 210 -MPN453 46.95 46.92 M id08418 27.5 60 -MPN454 77.64 95.78 S id08427 18.75 12.5 -MPN455 57.26 10.82 I id08439 27.5 45 -MPN456 82.75 84.05 E id08490 18.75 10 45MPN457 53.92 64.11 S - - - -MPN458 55.34 65.75 S - - - -MPN459 35.3 40.55 E id08552 10 - -MPN460 11.12 0 P id08590 - - -MPN461 40.6 42.79 P id08591 27.5 18.75 -MPN462 53.82 96.87 M - - - -MPN463 0 0 S - - - -MPN464 44.2 43.01 M - - - -MPN464a - - - id08650 12.5 - -MPN465 0 0 M - - - -MPN466 5.48 5.29 M - - - -MPN467 40.03 0 M - - - -MPN468 136.58 71.29 M - - - -MPN469 13.49 8.72 A id08722 22.5 - -MPN470 431 438.32 E id08741 45 32.5 70MPN471 20.56 11.32 J id08743 10 - -MPN472 37.85 31.95 I id08754 27.5 45 -MPN473 7.9 5.67 I id08766 27.5 - -MPN474 496.82 461.72 N id08809 210 95 -MPN474a - - - id08811 210 95 -MPN475 13.47 16.51 T id08827 45 95 -MPN476 36.2 41.25 F id08830 22.5 - -MPN477 9.01 7.98 A id08842 22.5 - -MPN478 50.29 46.79 F id08852 27.5 - -MPN479 466.06 451.84 I id08864 18.75 - -MPN480 25.16 30.15 J id08906 70 210 -MPN481 15.22 14.51 T id08917 22.5 - -MPN482 3.04 2.77 A id08921 10 - -MPN483 20.24 22.68 I id08922 32.5 - -MPN484 22.59 9.4 N id08952 10 - -MPN485 10.95 7.3 S - - - -MPN486 0 0 S - - - -MPN487 26.97 26.58 O id08982 45 210 -MPN488 15.46 23.17 O id09001 10 - -MPN488a - - - id09007 27.5 - -MPN489 26.19 12.6 M id09062 27.5 12.5 18.75MPN490 3.93 16.33 L id09086 32.5 - -MPN491 66.07 79.2 L id09089 27.5 18.75 12.5MPN492 10.63 12.85 G id09129 32.5 - -MPN493 13.72 11.01 G id09138 22.5 70 -MPN494 35.37 26.95 G id09145 18.75 - -MPN495 35.54 30.26 G id09150 10 - -MPN496 13.88 1.86 G id09178 45 - -MPN497 0 0 G - - - -MPN498 24.77 26.94 G id09202 27.5 - -MPN499 13.24 10.77 S id09212 18.75 - -MPN500 63.2 69.53 M - - - -MPN501 44.56 16.53 N id09244 12.5 - -MPN502 195.92 174.84 M id09262 210 - -MPN503 2.77 5.88 M - - - -MPN504 4.54 13.3 N id09316 10 - -MPN505 18.99 9.44 M id09333 10 - -MPN506 32.43 51.42 M id09348 18.75 27.5 10
Continued on next page
166
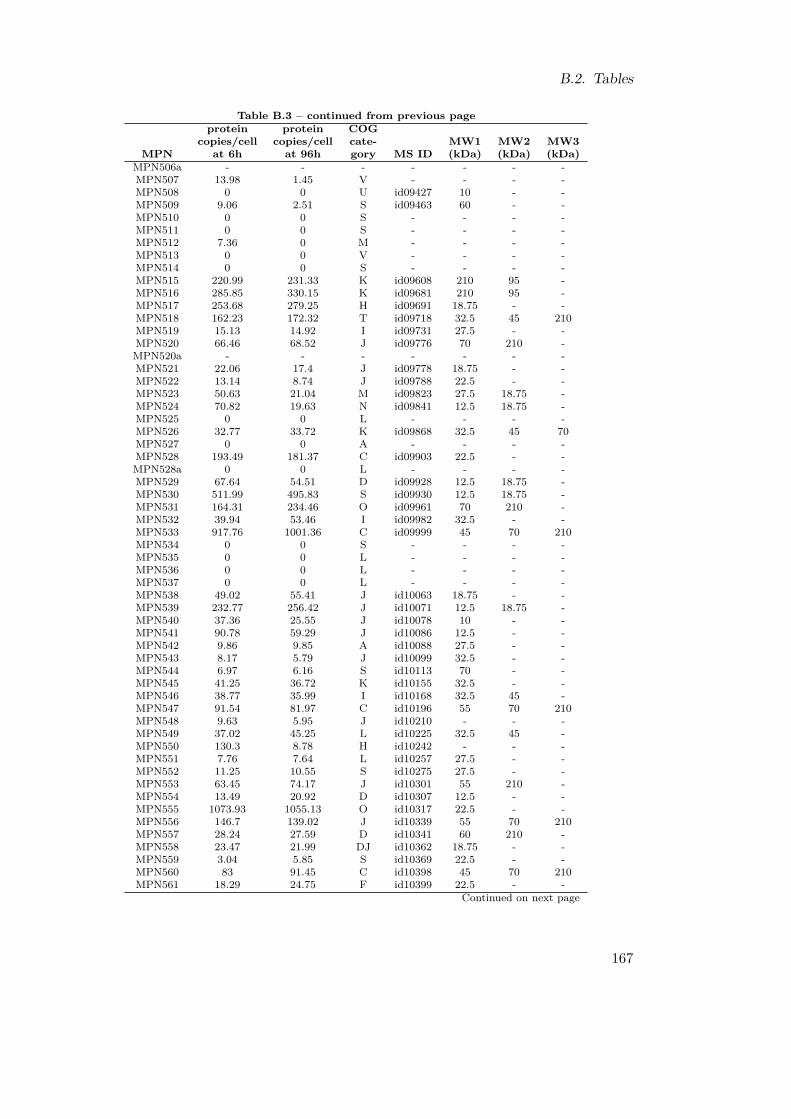
B.2. Tables
Table B.3 – continued from previous pageprotein protein COG
copies/cell copies/cell cate- MW1 MW2 MW3MPN at 6h at 96h gory MS ID (kDa) (kDa) (kDa)
MPN506a - - - - - - -MPN507 13.98 1.45 V - - - -MPN508 0 0 U id09427 10 - -MPN509 9.06 2.51 S id09463 60 - -MPN510 0 0 S - - - -MPN511 0 0 S - - - -MPN512 7.36 0 M - - - -MPN513 0 0 V - - - -MPN514 0 0 S - - - -MPN515 220.99 231.33 K id09608 210 95 -MPN516 285.85 330.15 K id09681 210 95 -MPN517 253.68 279.25 H id09691 18.75 - -MPN518 162.23 172.32 T id09718 32.5 45 210MPN519 15.13 14.92 I id09731 27.5 - -MPN520 66.46 68.52 J id09776 70 210 -MPN520a - - - - - - -MPN521 22.06 17.4 J id09778 18.75 - -MPN522 13.14 8.74 J id09788 22.5 - -MPN523 50.63 21.04 M id09823 27.5 18.75 -MPN524 70.82 19.63 N id09841 12.5 18.75 -MPN525 0 0 L - - - -MPN526 32.77 33.72 K id09868 32.5 45 70MPN527 0 0 A - - - -MPN528 193.49 181.37 C id09903 22.5 - -MPN528a 0 0 L - - - -MPN529 67.64 54.51 D id09928 12.5 18.75 -MPN530 511.99 495.83 S id09930 12.5 18.75 -MPN531 164.31 234.46 O id09961 70 210 -MPN532 39.94 53.46 I id09982 32.5 - -MPN533 917.76 1001.36 C id09999 45 70 210MPN534 0 0 S - - - -MPN535 0 0 L - - - -MPN536 0 0 L - - - -MPN537 0 0 L - - - -MPN538 49.02 55.41 J id10063 18.75 - -MPN539 232.77 256.42 J id10071 12.5 18.75 -MPN540 37.36 25.55 J id10078 10 - -MPN541 90.78 59.29 J id10086 12.5 - -MPN542 9.86 9.85 A id10088 27.5 - -MPN543 8.17 5.79 J id10099 32.5 - -MPN544 6.97 6.16 S id10113 70 - -MPN545 41.25 36.72 K id10155 32.5 - -MPN546 38.77 35.99 I id10168 32.5 45 -MPN547 91.54 81.97 C id10196 55 70 210MPN548 9.63 5.95 J id10210 - - -MPN549 37.02 45.25 L id10225 32.5 45 -MPN550 130.3 8.78 H id10242 - - -MPN551 7.76 7.64 L id10257 27.5 - -MPN552 11.25 10.55 S id10275 27.5 - -MPN553 63.45 74.17 J id10301 55 210 -MPN554 13.49 20.92 D id10307 12.5 - -MPN555 1073.93 1055.13 O id10317 22.5 - -MPN556 146.7 139.02 J id10339 55 70 210MPN557 28.24 27.59 D id10341 60 210 -MPN558 23.47 21.99 DJ id10362 18.75 - -MPN559 3.04 5.85 S id10369 22.5 - -MPN560 83 91.45 C id10398 45 70 210MPN561 18.29 24.75 F id10399 22.5 - -
Continued on next page
167
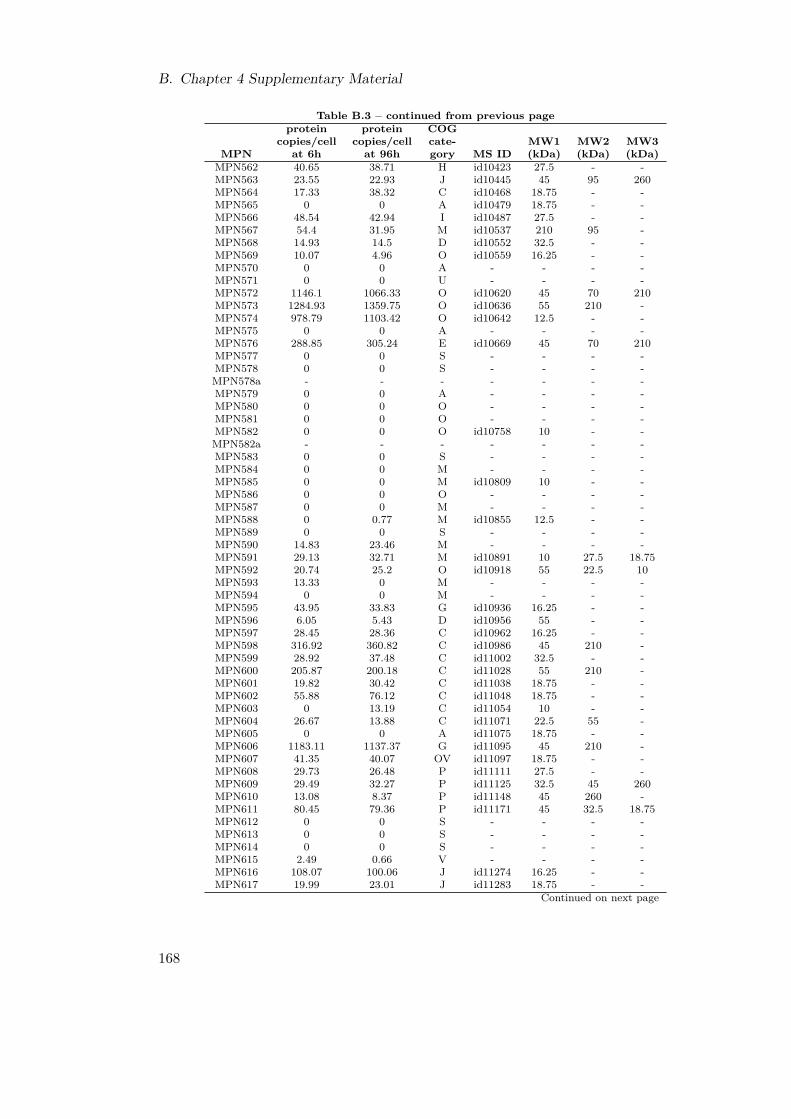
B. Chapter 4 Supplementary Material
Table B.3 – continued from previous pageprotein protein COG
copies/cell copies/cell cate- MW1 MW2 MW3MPN at 6h at 96h gory MS ID (kDa) (kDa) (kDa)
MPN562 40.65 38.71 H id10423 27.5 - -MPN563 23.55 22.93 J id10445 45 95 260MPN564 17.33 38.32 C id10468 18.75 - -MPN565 0 0 A id10479 18.75 - -MPN566 48.54 42.94 I id10487 27.5 - -MPN567 54.4 31.95 M id10537 210 95 -MPN568 14.93 14.5 D id10552 32.5 - -MPN569 10.07 4.96 O id10559 16.25 - -MPN570 0 0 A - - - -MPN571 0 0 U - - - -MPN572 1146.1 1066.33 O id10620 45 70 210MPN573 1284.93 1359.75 O id10636 55 210 -MPN574 978.79 1103.42 O id10642 12.5 - -MPN575 0 0 A - - - -MPN576 288.85 305.24 E id10669 45 70 210MPN577 0 0 S - - - -MPN578 0 0 S - - - -MPN578a - - - - - - -MPN579 0 0 A - - - -MPN580 0 0 O - - - -MPN581 0 0 O - - - -MPN582 0 0 O id10758 10 - -MPN582a - - - - - - -MPN583 0 0 S - - - -MPN584 0 0 M - - - -MPN585 0 0 M id10809 10 - -MPN586 0 0 O - - - -MPN587 0 0 M - - - -MPN588 0 0.77 M id10855 12.5 - -MPN589 0 0 S - - - -MPN590 14.83 23.46 M - - - -MPN591 29.13 32.71 M id10891 10 27.5 18.75MPN592 20.74 25.2 O id10918 55 22.5 10MPN593 13.33 0 M - - - -MPN594 0 0 M - - - -MPN595 43.95 33.83 G id10936 16.25 - -MPN596 6.05 5.43 D id10956 55 - -MPN597 28.45 28.36 C id10962 16.25 - -MPN598 316.92 360.82 C id10986 45 210 -MPN599 28.92 37.48 C id11002 32.5 - -MPN600 205.87 200.18 C id11028 55 210 -MPN601 19.82 30.42 C id11038 18.75 - -MPN602 55.88 76.12 C id11048 18.75 - -MPN603 0 13.19 C id11054 10 - -MPN604 26.67 13.88 C id11071 22.5 55 -MPN605 0 0 A id11075 18.75 - -MPN606 1183.11 1137.37 G id11095 45 210 -MPN607 41.35 40.07 OV id11097 18.75 - -MPN608 29.73 26.48 P id11111 27.5 - -MPN609 29.49 32.27 P id11125 32.5 45 260MPN610 13.08 8.37 P id11148 45 260 -MPN611 80.45 79.36 P id11171 45 32.5 18.75MPN612 0 0 S - - - -MPN613 0 0 S - - - -MPN614 0 0 S - - - -MPN615 2.49 0.66 V - - - -MPN616 108.07 100.06 J id11274 16.25 - -MPN617 19.99 23.01 J id11283 18.75 - -
Continued on next page
168

B.2. Tables
Table B.3 – continued from previous pageprotein protein COG
copies/cell copies/cell cate- MW1 MW2 MW3MPN at 6h at 96h gory MS ID (kDa) (kDa) (kDa)
MPN618 86.28 59.85 L id11316 70 210 -MPN619 36.35 35.53 L id11361 95 210 -MPN620 15.29 16.82 S id11389 70 210 -MPN621 82.05 83.58 J id11413 55 70 210MPN622 13.52 16.57 J id11416 10 - -MPN623 32.14 10.04 KJ id11420 45 260 95MPN624 30.41 18.04 J id11447 10 - -MPN625 330.04 350.61 OV id11453 16.25 - -MPN626 0 0 K - - - -MPN627 186.61 199.76 G id11500 55 210 -MPN628 94.91 117.79 G id11524 55 70 260MPN629 127.05 126.62 G id11538 27.5 - -MPN630 13.73 14.34 M id11562 32.5 55 -MPN631 195.74 195.05 J id11564 32.5 45 -MPN632 13.05 13.14 F id11578 22.5 - -MPN633 0 0 O - - - -MPN634 0 0 TF - - - -MPN635 0 0 S - - - -MPN636 279.69 265.26 J id11646 22.5 - -MPN637 0 4.06 I - - - -MPN638 321.78 277.22 V id11672 45 70 210MPN639 11.59 5.3 M id11692 27.5 10 -MPN640 0 0 M - - - -MPN641 8.06 1.81 M id11718 27.5 12.5 -MPN642 8.98 4.65 M id11731 27.5 - -MPN643 6.79 4.16 M id11737 27.5 - -MPN644 0 0 M - - - -MPN645 0 0 M id11756 - - -MPN646 0 0 M id11768 27.5 - -MPN647 0 2.83 M id11780 27.5 - -MPN648 0 0 S - - - -MPN649 0 0 M - - - -MPN650 0 0 M - - - -MPN651 0 0 G - - - -MPN652 9.5 18.21 G id11845 - - -MPN653 27.43 18.89 G id11853 16.25 - -MPN654 29.7 0 M - - - -MPN655 7.66 26.61 N id11877 27.5 12.5 18.75MPN656 7.17 0.58 J id11900 27.5 - -MPN657 0 1.66 A - - - -MPN658 89.49 109.31 J id11925 16.25 10 -MPN659 14.33 5.61 J id11936 22.5 - -MPN660 61.11 77.69 J id11941 12.5 - -MPN661 16.13 18.97 V id11968 45 95 -MPN662 162.33 143.14 EV id11977 16.25 - -MPN663 30.4 30.12 J id11986 27.5 - -MPN664 57.99 49.23 I id12002 27.5 45 -MPN665 2630.78 2477.83 J id12024 45 210 -MPN666 19.15 15.68 R id12025 22.5 - -MPN667 37.14 35.55 M id12043 27.5 - -MPN668 412.08 381.82 O id12065 12.5 - -MPN669 31.93 32.86 J id12066 45 - -MPN670 73.44 80.23 S id12096 32.5 45 210MPN670a - - - - - - -MPN671 197.78 188.49 O id12132 60 210 -MPN671a - - - id12104 18.75 - -MPN672 8.37 35.15 F id12145 18.75 - -MPN673 164.43 155.87 I id12151 18.75 - -
Continued on next page
169

B. Chapter 4 Supplementary Material
Table B.3 – continued from previous pageprotein protein COG
copies/cell copies/cell cate- MW1 MW2 MW3MPN at 6h at 96h gory MS ID (kDa) (kDa) (kDa)
MPN674 960.99 995.72 C id12153 32.5 45 -MPN675 5.76 0 N id12181 10 - -MPN676 0 0 S - - - -MPN677 40.29 46.54 R id12223 45 - -MPN678 89.52 95.2 J id12248 45 70 210MPN679 12.27 6.93 J id12259 27.5 - -MPN680 13.48 12.91 U id12272 32.5 45 -MPN681 0 0 J - - - -MPN682 10.31 25.94 J - - - -MPN683 39.88 20.73 P id12291 32.5 45 -MPN684 60.98 26.78 P id12369 95 210 27.5MPN685 104.82 78.4 P id12385 27.5 45 -MPN686 45.6 32.35 LD id12405 45 260 95MPN687 24.95 17.87 S id12414 45 - -MPN688 201.07 199.15 D id12426 27.5 45 -
Table B.3.: Applying MS to fractionated protein extracts allowed to identify genes fromwhich proteins of different sizes are expressed; the functions encoded by thediffeernt COG classes can be found in Appendix B, Table B.4.
Table B.4: COG CategoriesCOG category function
A membrane Proteins of unknown functionC energy production and conversion, coenzyme metabolismD cell division and chromosome partitioningE amino acid transport and metabolismF nucleotide transport and metabolism; coenzyme metabolismG carbohydrate transport and metabolismH coenzyme metabolismI lipid metabolismJ translation, ribosomal structure and biogenesisK transcriptionL DNA replication, recombination and repairM cell envelope biogenesis, outer membraneN cell motility and secretionO post-translational modification, protein turnover, chaperonesP inorganic ion transport and metabolismR general function prediction onlyS function unknownT signal transduction mechanismsU intracellular trafficking, secretion and vesicular transportV defense mechanisms
Table B.4.: Abbreviations for COG categories and the associated functions.
170
BibliographyB. J. Akerley, E. J. Rubin, V. L. Novick, K. Amaya, N. Judson, and J. J. Mekalanos. A
genome-scale analysis for identification of genes required for growth or survival of haemophilusinfluenzae. Proc Natl Acad Sci U S A, 99(2):966–971, Jan 2002.
B. Alberts, A. Johnson, and J. Lewis. Molecular Biology of the Cell. Garland Science, 2008.
U. Alon. How to choose a good scientific problem. Mol Cell, 35(6):726–728, Sep 2009.
R. B. Altman. Building successful biological databases. Brief Bioinform, 5(1):4–5, Mar 2004.
S. F. Altschul, T. L. Madden, A. A. Schäffer, J. Zhang, Z. Zhang, W. Miller, and D. J. Lipman.Gapped blast and psi-blast: a new generation of protein database search programs. NucleicAcids Res, 25(17):3389–3402, Sep 1997.
N. Amin and A. Peterkofsky. A dual mechanism for regulating camp levels in escherichia coli. JBiol Chem, 270(20):11803–11805, May 1995.
N. L. Anderson and N. G. Anderson. Proteome and proteomics: new technologies, new concepts,and new words. Electrophoresis, 19(11):1853–1861, Aug 1998.
J. Andreev, Z. Borovsky, I. Rosenshine, and S. Rottem. Invasion of hela cells by mycoplasmapenetrans and the induction of tyrosine phosphorylation of a 145-kda host cell protein. FEMSMicrobiol Lett, 132(3):189–194, Oct 1995.
B. P. Anton and E. A. Raleigh. Transposon-mediated linker insertion scanning mutagenesis ofthe escherichia coli mcra endonuclease. J Bacteriol, 186(17):5699–5707, Sep 2004.
L. Arvestad, A.-C. Berglund, J. Lagergren, and B. Sennblad. Bayesian gene/species tree recon-ciliation and orthology analysis using mcmc. Bioinformatics, 19 Suppl 1:i7–15, 2003.
Atta-Ur-Rahman. Nuclear Magnetic Resonance: Basic Principles. Springer Verlag, Berlin, 1986.
S. Y. Auyang. Foundations of Complex-system Theories: in Economics, Evolutionary Biology,and Statistical Physics. Cambridge University Press, 1999.
V. L. Avila. Biology: Investigating life on earth. Jones and Bartlett, Boston, 1995.
G. J. E. Baart and D. E. Martens. Genome-scale metabolic models: reconstruction and analysis.Methods Mol Biol, 799:107–126, 2012.
T. Baba, T. Ara, M. Hasegawa, Y. Takai, Y. Okumura, M. Baba, K. A. Datsenko, M. Tomita,B. L. Wanner, and H. Mori. Construction of escherichia coli k-12 in-frame, single-gene knockoutmutants: the keio collection. Mol Syst Biol, 2:2006.0008, 2006.
M. Babu, J. J. Díaz-Mejía, J. Vlasblom, A. Gagarinova, S. Phanse, C. Graham, F. Yousif,H. Ding, X. Xiong, A. Nazarians-Armavil, M. Alamgir, M. Ali, O. Pogoutse, A. Pe’er,R. Arnold, M. Michaut, J. Parkinson, A. Golshani, C. Whitfield, S. J. Wodak, G. Moreno-Hagelsieb, J. F. Greenblatt, and A. Emili. Genetic interaction maps in escherichia coli reveal
171
Bibliography
functional crosstalk among cell envelope biogenesis pathways. PLoS Genet, 7(11):e1002377,Nov 2011.
O. Beckonert, H. C. Keun, T. M. D. Ebbels, J. Bundy, E. Holmes, J. C. Lindon, and J. K. Nichol-son. Metabolic profiling, metabolomic and metabonomic procedures for nmr spectroscopy ofurine, plasma, serum and tissue extracts. Nat Protoc, 2(11):2692–2703, 2007.
B. D. Bennett, E. H. Kimball, M. Gao, R. Osterhout, S. J. Van Dien, and J. D. Rabinowitz.Absolute metabolite concentrations and implied enzyme active site occupancy in escherichiacoli. Nat Chem Biol, 5(8):593–599, Aug 2009.
H. M. Berman, J. Westbrook, Z. Feng, G. Gilliland, T. N. Bhat, H. Weissig, I. N. Shindyalov,and P. E. Bourne. The protein data bank. Nucleic Acids Res, 28(1):235–242, Jan 2000.
W. P. Blackstock and M. P. Weir. Proteomics: quantitative and physical mapping of cellularproteins. Trends Biotechnol, 17(3):121–127, Mar 1999.
H. G. Bohn. Aristotle’s History of Animals (Translated by Cresswell, R.). Adamant MediaCorporation, elibron classics replica edition edition, 1862.
A. Boonmee, T. Ruppert, and R. Herrmann. The gene mpn310 (hmw2) from mycoplasmapneumoniae encodes two proteins, hmw2 and hmw2-s, which differ in size but use the samereading frame. FEMS Microbiol Lett, 290(2):174–181, Jan 2009.
G. E. P. Box and N. R. Draper. Empirical Model-Building and Response Surfaces. Wiley, NewYork, 1987.
S. E. Brenner. Errors in genome annotation. Trends Genet, 15(4):132–133, Apr 1999.
A. J. Brown. Enzyme action. J. Chem. Society, 81:373–386, 1902.
D. D. Buechter, D. N. Paolella, B. S. Leslie, M. S. Brown, K. A. Mehos, and E. A. Gruskin. Co-translational incorporation of trans-4-hydroxyproline into recombinant proteins in bacteria. JBiol Chem, 278(1):645–650, Jan 2003.
J. M. Buescher, W. Liebermeister, M. Jules, M. Uhr, J. Muntel, E. Botella, B. Hessling, R. J.Kleijn, L. Le Chat, F. Lecointe, U. Mäder, P. Nicolas, S. Piersma, F. Rügheimer, D. Becher,P. Bessieres, E. Bidnenko, E. L. Denham, E. Dervyn, K. M. Devine, G. Doherty, S. Drulhe,L. Felicori, M. J. Fogg, A. Goelzer, A. Hansen, C. R. Harwood, M. Hecker, S. Hubner,C. Hultschig, H. Jarmer, E. Klipp, A. Leduc, P. Lewis, F. Molina, P. Noirot, S. Peres, N. Pi-geonneau, S. Pohl, S. Rasmussen, B. Rinn, M. Schaffer, J. Schnidder, B. Schwikowski, J. M.Van Dijl, P. Veiga, S. Walsh, A. J. Wilkinson, J. Stelling, S. Aymerich, and U. Sauer. Globalnetwork reorganization during dynamic adaptations of bacillus subtilis metabolism. Science,335(6072):1099–1103, Mar 2012.
L. Buts, J. Lah, M.-H. Dao-Thi, L. Wyns, and R. Loris. Toxin-antitoxin modules as bacterialmetabolic stress managers. Trends Biochem Sci, 30(12):672–679, Dec 2005.
M. A. Canonaco, C. O. Gualerzi, and C. L. Pon. Alternative occupancy of a dual ribosomalbinding site by mrna affected by translation initiation factors. Eur J Biochem, 182(3):501–506, Jul 1989.
G. Casari, M. A. Andrade, P. Bork, J. Boyle, A. Daruvar, C. Ouzounis, R. Schneider, J. Tamames,A. Valencia, and C. Sander. Challenging times for bioinformatics. Nature, 376(6542):647–648,Aug 1995.
172

Bibliography
E. C. Y. Chan, K. K. Pasikanti, and J. K. Nicholson. Global urinary metabolic profiling proce-dures using gas chromatography-mass spectrometry. Nat Protoc, 6(10):1483–1499, Oct 2011.
B. S. W. Chang, K. Jönsson, M. A. Kazmi, M. J. Donoghue, and T. P. Sakmar. Recreating afunctional ancestral archosaur visual pigment. Mol Biol Evol, 19(9):1483–1489, Sep 2002.
R. M. Chanock, L. Hayflick, and M. F. Barile. Growth on artificial medium of an agent associatedwith atypical pneumonia and its identification as a pplo. Proc Natl Acad Sci U S A, 48:41–49,Jan 1962a.
R. M. Chanock, W. D. James, H. H. Fox, H. C. Turner, M. A. Mufson, and L. Hayflick. Growthof eaton pplo in broth and preparation of complement fixing antigen. Proc Soc Exp Biol Med,110:884–889, 1962b.
E. Chiner, J. Signes-Costa, A. L. Andreu, and L. Andreu. Mycoplasma pneumoniae pneumonia:an uncommon cause of adult respiratory distress syndrome. An Med Interna, 20(11):597–598,Nov 2003.
B. Christen, E. Abeliuk, J. M. Collier, V. S. Kalogeraki, B. Passarelli, J. A. Coller, M. J. Fero,H. H. McAdams, and L. Shapiro. The essential genome of a bacterium. Mol Syst Biol, 7:528,2011.
C. Churcher. Beginning Database Design: From Novice to Professional. Springer, 2007.
F. D. Ciccarelli, T. Doerks, C. von Mering, C. J. Creevey, B. Snel, and P. Bork. Toward automaticreconstruction of a highly resolved tree of life. Science, 311(5765):1283–1287, Mar 2006.
A. Cornish-Bowden and M. L. Cárdenas. From genome to cellular phenotype–a role for metabolicflux analysis? Nat Biotechnol, 18(3):267–268, Mar 2000.
G. Corso, M. Esposito, and M. Gallo. Transformation of arginine into ornithine during thepreparation of its tert-butyldimethylsilyl derivative for analysis by gas chromatography/massspectrometry. Biological Mass Spectrometry, 22:698–702, 1993.
M. W. Covert and B. O. Palsson. Constraints-based models: regulation of gene expressionreduces the steady-state solution space. J Theor Biol, 221(3):309–325, Apr 2003.
M. W. Covert, C. H. Schilling, I. Famili, J. S. Edwards, I. I. Goryanin, E. Selkov, and B. O.Palsson. Metabolic modeling of microbial strains in silico. Trends Biochem Sci, 26(3):179–186,Mar 2001.
D. J. Creek, A. Jankevics, R. Breitling, D. G. Watson, M. P. Barrett, and K. E. V. Burgess.Toward global metabolomics analysis with hydrophilic interaction liquid chromatography-massspectrometry: improved metabolite identification by retention time prediction. Anal Chem,83(22):8703–8710, Nov 2011.
A. W. Curnow, K. Hong, R. Yuan, S. Kim, O. Martins, W. Winkler, T. M. Henkin, and D. Söll.Glu-trnagln amidotransferase: a novel heterotrimeric enzyme required for correct decoding ofglutamine codons during translation. Proc Natl Acad Sci U S A, 94(22):11819–11826, Oct1997.
T. Dandekar, M. Huynen, J. T. Regula, B. Ueberle, C. U. Zimmermann, M. A. Andrade, T. Do-erks, L. Sánchez-Pulido, B. Snel, M. Suyama, Y. P. Yuan, R. Herrmann, and P. Bork. Re-annotating the mycoplasma pneumoniae genome sequence: adding value, function and readingframes. Nucleic Acids Res, 28(17):3278–3288, Sep 2000.
173

Bibliography
C. Darwin. On the Origin of Species by Means of Natural Selection: The Preservation of FavoredRaces in the Struggle of Life. Murray, London, 1859.
J. W. Drake, B. Charlesworth, D. Charlesworth, and J. F. Crow. Rates of spontaneous mutation.Genetics, 148(4):1667–1686, Apr 1998.
N. Draper and H. Smith. Applied Regression Analysis. Wiley, 1998.
N. C. Duarte, S. A. Becker, N. Jamshidi, I. Thiele, M. L. Mo, T. D. Vo, R. Srivas, and B. Ã. Pals-son. Global reconstruction of the human metabolic network based on genomic and bibliomicdata. Proc Natl Acad Sci U S A, 104(6):1777–1782, Feb 2007.
W. B. Dunn, D. I. Broadhurst, H. J. Atherton, R. Goodacre, and J. L. Griffin. Systems levelstudies of mammalian metabolomes: the roles of mass spectrometry and nuclear magneticresonance spectroscopy. Chem Soc Rev, 40(1):387–426, Jan 2011.
K. Dybvig, P. Lao, D. S. Jordan, and W. L. Simmons. Fewer essential genes in mycoplasmasthan previous studies suggest. FEMS Microbiol Lett, Jul 2010.
M. D. Eaton, G. Meiklejohn, W. van Herick, and M. Corey. Studies on the etiology of primaryatypical pneumonia: Ii. properties of the virus isolated and propagated in chick embryos. JExp Med, 82(5):317–328, Oct 1945.
J. S. Edwards and B. O. Palsson. Metabolic flux balance analysis and the in silico analysis ofescherichia coli k-12 gene deletions. BMC Bioinformatics, 1:1, 2000.
J. S. Edwards, M. W. Covert, and B. O. Palsson. Metabolic modelling of microbes: the flux-balance approach. Environ Microbiol, 4(3):133–140, Mar 2002.
J. A. Eisen and C. M. Fraser. Phylogenomics: intersection of evolution and genomics. Science,300(5626):1706–1707, Jun 2003.
A. M. Feist, C. S. Henry, J. L. Reed, M. Krummenacker, A. R. Joyce, P. D. Karp, L. J. Broadbelt,V. Hatzimanikatis, and B. O. Palsson. A genome-scale metabolic reconstruction for escherichiacoli k-12 mg1655 that accounts for 1260 orfs and thermodynamic information. Mol Syst Biol,3:121, 2007.
A. M. Feist, M. J. Herrgård, I. Thiele, J. L. Reed, and B. O. Palsson. Reconstruction of bio-chemical networks in microorganisms. Nat Rev Microbiol, 7(2):129–143, Feb 2009.
D. A. Fell and J. R. Small. Fat synthesis in adipose tissue. an examination of stoichiometricconstraints. Biochem J, 238(3):781–786, Sep 1986.
O. Fiehn. Metabolomics–the link between genotypes and phenotypes. Plant Mol Biol, 48(1-2):155–171, Jan 2002.
W. M. Fitch. Distinguishing homologous from analogous proteins. Syst Zool, 19(2):99–113, Jun1970.
R. D. Fleischmann, M. D. Adams, O. White, R. A. Clayton, E. F. Kirkness, A. R. Kerlavage,C. J. Bult, J. F. Tomb, B. A. Dougherty, and J. M. Merrick. Whole-genome random sequencingand assembly of haemophilus influenzae rd. Science, 269(5223):496–512, Jul 1995.
R. M. T. Fleming and I. Thiele. von bertalanffy 1.0: a cobra toolbox extension to thermody-namically constrain metabolic models. Bioinformatics, 27(1):142–143, Jan 2011.
174

Bibliography
R. M. T. Fleming, I. Thiele, and H. P. Nasheuer. Quantitative assignment of reaction direction-ality in constraint-based models of metabolism: application to escherichia coli. Biophys Chem,145(2-3):47–56, Dec 2009.
L. A. Flórez, S. F. Roppel, A. G. Schmeisky, C. R. Lammers, and J. Stülke. A community-curated consensual annotation that is continuously updated: the bacillus subtilis centred wikisubtiwiki. Database (Oxford), 2009:bap012, 2009.
L. A. Flórez, C. R. Lammers, R. Michna, and J. Stülke. Cellpublisher: a web platform for theintuitive visualization and sharing of metabolic, signalling and regulatory pathways. Bioin-formatics, 26(23):2997–2999, Dec 2010.
A. C. Forster and G. M. Church. Towards synthesis of a minimal cell. Mol Syst Biol, 2:45, 2006.
C. M. Fraser, J. D. Gocayne, O. White, M. D. Adams, R. A. Clayton, R. D. Fleischmann, C. J.Bult, A. R. Kerlavage, G. Sutton, J. M. Kelley, R. D. Fritchman, J. F. Weidman, K. V. Small,M. Sandusky, J. Fuhrmann, D. Nguyen, T. R. Utterback, D. M. Saudek, C. A. Phillips, J. M.Merrick, J. F. Tomb, B. A. Dougherty, K. F. Bott, P. C. Hu, T. S. Lucier, S. N. Peterson, H. O.Smith, C. A. Hutchison, 3rd, and J. C. Venter. The minimal gene complement of mycoplasmagenitalium. Science, 270(5235):397–403, Oct 1995.
C. T. French, P. Lao, A. E. Loraine, B. T. Matthews, H. Yu, and K. Dybvig. Large-scaletransposon mutagenesis of mycoplasma pulmonis. Mol Microbiol, 69(1):67–76, Jul 2008.
A. Friboulet and D. Thomas. Systems biology-an interdisciplinary approach. Biosens Bioelectron,20(12):2404–2407, Jun 2005.
T. Gabaldón and M. A. Huynen. Shaping the mitochondrial proteome. Biochim Biophys Acta,1659(2-3):212–220, Dec 2004.
T. Gabaldón and M. A. Huynen. Lineage-specific gene loss following mitochondrial endosymbiosisand its potential for function prediction in eukaryotes. Bioinformatics, 21 Suppl 2:ii144–ii150,Sep 2005.
T. Gabaldón and M. A. Huynen. Reconstruction of ancestral proteomes. In Ancestral SequenceReconstruction, edited by Liberles, D. A. Oxford University Press, 2007.
L. A. Gallagher, E. Ramage, M. A. Jacobs, R. Kaul, M. Brittnacher, and C. Manoil. A compre-hensive transposon mutant library of francisella novicida, a bioweapon surrogate. Proc NatlAcad Sci U S A, 104(3):1009–1014, Jan 2007.
A. Garcia-Pino, M. Christensen-Dalsgaard, L. Wyns, M. Yarmolinsky, R. D. Magnuson,K. Gerdes, and R. Loris. Doc of prophage p1 is inhibited by its antitoxin partner phd throughfold complementation. J Biol Chem, 283(45):30821–30827, Nov 2008.
E. A. Gaucher, J. M. Thomson, M. F. Burgan, and S. A. Benner. Inferring the palaeoenvironmentof ancient bacteria on the basis of resurrected proteins. Nature, 425(6955):285–288, Sep 2003.
F. M. Geier, E. J. Want, A. M. Leroi, and J. G. Bundy. Cross-platform comparison of caenorhab-ditis elegans tissue extraction strategies for comprehensive metabolome coverage. Anal Chem,83(10):3730–3736, May 2011.
S. Y. Gerdes, M. D. Scholle, J. W. Campbell, G. Balázsi, E. Ravasz, M. D. Daugherty,A. L. Somera, N. C. Kyrpides, I. Anderson, M. S. Gelfand, A. Bhattacharya, V. Kapatral,M. D’Souza, M. V. Baev, Y. Grechkin, F. Mseeh, M. Y. Fonstein, R. Overbeek, A.-L. Barabási,
175

Bibliography
Z. N. Oltvai, and A. L. Osterman. Experimental determination and system level analysis ofessential genes in escherichia coli mg1655. J Bacteriol, 185(19):5673–5684, Oct 2003.
S. Ghaemmaghami, W.-K. Huh, K. Bower, R. W. Howson, A. Belle, N. Dephoure, E. K. O’Shea,and J. S. Weissman. Global analysis of protein expression in yeast. Nature, 425(6959):737–741,Oct 2003.
F. M. Ghanem, A. C. Ridpath, W. E. Moore, and L. V. Moore. Identification of clostridiumbotulinum, clostridium argentinense, and related organisms by cellular fatty acid analysis. JClin Microbiol, 29(6):1114–1124, Jun 1991.
D. G. Gibson, G. A. Benders, C. Andrews-Pfannkoch, E. A. Denisova, H. Baden-Tillson, J. Za-veri, T. B. Stockwell, A. Brownley, D. W. Thomas, M. A. Algire, C. Merryman, L. Young,V. N. Noskov, J. I. Glass, J. C. Venter, C. A. Hutchison, 3rd, and H. O. Smith. Completechemical synthesis, assembly, and cloning of a mycoplasma genitalium genome. Science, 319(5867):1215–1220, Feb 2008.
D. G. Gibson, J. I. Glass, C. Lartigue, V. N. Noskov, R.-Y. Chuang, M. A. Algire, G. A.Benders, M. G. Montague, L. Ma, M. M. Moodie, C. Merryman, S. Vashee, R. Krishnakumar,N. Assad-Garcia, C. Andrews-Pfannkoch, E. A. Denisova, L. Young, Z.-Q. Qi, T. H. Segall-Shapiro, C. H. Calvey, P. P. Parmar, C. A. Hutchison, 3rd, H. O. Smith, and J. C. Venter.Creation of a bacterial cell controlled by a chemically synthesized genome. Science, 329(5987):52–56, Jul 2010.
R. Gil, F. J. Silva, J. Peretó, and A. Moya. Determination of the core of a minimal bacterialgene set. Microbiol Mol Biol Rev, 68(3):518–537, Sep 2004.
C. Gille, C. Bölling, A. Hoppe, S. Bulik, S. Hoffmann, K. Hübner, A. Karlstädt, R. Ganeshan,M. König, K. Rother, M. Weidlich, J. Behre, and H.-G. Holzhütter. Hepatonet1: a compre-hensive metabolic reconstruction of the human hepatocyte for the analysis of liver physiology.Mol Syst Biol, 6:411, Sep 2010.
J. I. Glass, N. Assad-Garcia, N. Alperovich, S. Yooseph, M. R. Lewis, M. Maruf, C. A. Hutchison,3rd, H. O. Smith, and J. C. Venter. Essential genes of a minimal bacterium. Proc Natl AcadSci U S A, 103(2):425–430, Jan 2006.
R. Goodacre, S. Vaidyanathan, W. B. Dunn, G. G. Harrigan, and D. B. Kell. Metabolomicsby numbers: acquiring and understanding global metabolite data. Trends Biotechnol, 22(5):245–252, May 2004.
G. Gottschalk. Bacterial Metabolism. Springer, 1st edition, 1986.
A. Goyer, E. Collakova, R. DÃaz de la Garza, E. P. Quinlivan, J. Williamson, J. F. Gregory, 3rd,Y. Shachar-Hill, and A. D. Hanson. 5-formyltetrahydrofolate is an inhibitory but well toleratedmetabolite in arabidopsis leaves. Journal of Biological Chemistry, 280(28):26137–26142, Jul2005.
J. E. Griffin, J. D. Gawronski, M. A. Dejesus, T. R. Ioerger, B. J. Akerley, and C. M. Sas-setti. High-resolution phenotypic profiling defines genes essential for mycobacterial growthand cholesterol catabolism. PLoS Pathog, 7(9):e1002251, Sep 2011.
M. Güell, V. van Noort, E. Yus, W.-H. Chen, J. Leigh-Bell, K. Michalodimitrakis, T. Yamada,M. Arumugam, T. Doerks, S. Kühner, M. Rode, M. Suyama, S. Schmidt, A.-C. Gavin, P. Bork,and L. Serrano. Transcriptome complexity in a genome-reduced bacterium. Science, 326(5957):
176

Bibliography
1268–1271, Nov 2009.
M. Güell, E. Yus, M. Lluch-Senar, and L. Serrano. Bacterial transcriptomics: what is beyondthe rna horiz-ome? Nat Rev Microbiol, 9(9):658–669, Sep 2011.
N. Gupta, S. Tanner, N. Jaitly, J. N. Adkins, M. Lipton, R. Edwards, M. Romine, A. Osterman,V. Bafna, R. D. Smith, and P. A. Pevzner. Whole proteome analysis of post-translationalmodifications: applications of mass-spectrometry for proteogenomic annotation. Genome Res,17(9):1362–1377, Sep 2007.
S. Halbedel and J. Stülke. Tools for the genetic analysis of mycoplasma. Int J Med Microbiol,297(1):37–44, Feb 2007.
S. Halbedel, J. Busse, S. R. Schmidl, and J. Stülke. Regulatory protein phosphorylation inmycoplasma pneumoniae. a pp2c-type phosphatase serves to dephosphorylate hpr(ser-p). JBiol Chem, 281(36):26253–26259, Sep 2006.
C. Hames. Glycerolmetabolismus und Pathogenitaet von Mycoplasma pneumoniae. PhD thesis,Georg-August-Universitaet Goettingen, 2008.
C. Hames, S. Halbedel, M. Hoppert, J. Frey, and J. Stülke. Glycerol metabolism is importantfor cytotoxicity of mycoplasma pneumoniae. J Bacteriol, 191(3):747–753, Feb 2009.
J. L. Hartman, 4th, B. Garvik, and L. Hartwell. Principles for the buffering of genetic variation.Science, 291(5506):1001–1004, Feb 2001.
L. M. Harwood and C. J. Moody. Experimental Organic Chemistry: Principles and Practice.Blackwell Scientific Publications, 1989.
C. S. Henry, M. DeJongh, A. A. Best, P. M. Frybarger, B. Linsay, and R. L. Stevens. High-throughput generation, optimization and analysis of genome-scale metabolic models. NatBiotechnol, 28(9):977–982, Sep 2010.
R. Hershberg, S. Altuvia, and H. Margalit. A survey of small rna-encoding genes in Escherichiacoli. Nucleic Acids Res, 31(7):1813–1820, Apr 2003.
R. Himmelreich, H. Hilbert, H. Plagens, E. Pirkl, B. C. Li, and R. Herrmann. Complete sequenceanalysis of the genome of the bacterium mycoplasma pneumoniae. Nucleic Acids Res, 24(22):4420–4449, Nov 1996.
M. H. N. Hoefnagel, A. van der Burgt, D. E. Martens, J. Hugenholtz, and Snoep. Time dependentresponses of glycolytic intermediates in a detailed glycolytic model of lactococcus lactis duringglucose run-out experiments. Mol Biol Rep, 29(1-2):157–161, 2002.
H. Horai, M. Arita, S. Kanaya, Y. Nihei, T. Ikeda, K. Suwa, Y. Ojima, K. Tanaka, S. Tanaka,K. Aoshima, Y. Oda, Y. Kakazu, M. Kusano, T. Tohge, F. Matsuda, Y. Sawada, M. Y. Hirai,H. Nakanishi, K. Ikeda, N. Akimoto, T. Maoka, H. Takahashi, T. Ara, N. Sakurai, H. Suzuki,D. Shibata, S. Neumann, T. Iida, K. Tanaka, K. Funatsu, F. Matsuura, T. Soga, R. Taguchi,K. Saito, and T. Nishioka. Massbank: a public repository for sharing mass spectral data forlife sciences. J Mass Spectrom, 45(7):703–714, Jul 2010.
C. A. Hutchison, 3rd, S. N. Peterson, S. R. Gill, R. T. Cline, O. White, C. M. Fraser, H. O.Smith, and J. C. Venter. Global transposon mutagenesis and a minimal mycoplasma genome.Science, 286(5447):2165–2169, Dec 1999.
177

Bibliography
M. A. Huynen and P. Bork. Measuring genome evolution. Proc Natl Acad Sci U S A, 95(11):5849–5856, May 1998.
I. Irnov, C. M. Sharma, J. Vogel, and W. C. Winkler. Identification of regulatory rnas in bacillussubtilis. Nucleic Acids Res, 38(19):6637–6651, Oct 2010.
M. A. Jacobs, A. Alwood, I. Thaipisuttikul, D. Spencer, E. Haugen, S. Ernst, O. Will, R. Kaul,C. Raymond, R. Levy, L. Chun-Rong, D. Guenthner, D. Bovee, M. V. Olson, and C. Manoil.Comprehensive transposon mutant library of pseudomonas aeruginosa. Proc Natl Acad Sci US A, 100(24):14339–14344, Nov 2003.
J. D. Jaffe, M. Miyata, and Berg. Energetics of gliding motility in mycoplasma mobile. JBacteriol, 186(13):4254–4261, Jul 2004.
A. Jankevics, M. E. Merlo, M. de Vries, R. J. Vonk, E. Takano, and R. Breitling. Separatingthe wheat from the chaff: a prioritisation pipeline for the analysis of metabolomics datasets.Metabolomics, 8(Suppl 1):29–36, Jun 2012.
J. K. Johnson and N. L. Somerson. Cholesterol as a limiting factor in the growth of mycoplasmapneumoniae. Appl Environ Microbiol, 40(2):391–399, Aug 1980.
A. Joshi and B. O. Palsson. Metabolic dynamics in the human red cell. part i–a comprehensivekinetic model. J Theor Biol, 141(4):515–528, Dec 1989.
A. R. Joyce, J. L. Reed, A. White, R. Edwards, A. Osterman, T. Baba, H. Mori, S. A. Lesely,B. O. Palsson, and S. Agarwalla. Experimental and computational assessment of conditionallyessential genes in escherichia coli. J Bacteriol, 188(23):8259–8271, Dec 2006.
B. K. Kaiser, M. C. Clifton, B. W. Shen, and B. L. Stoddard. The structure of a bacterialduf199/whia protein: domestication of an invasive endonuclease. Structure, 17(10):1368–1376,Oct 2009.
M. Kanehisa and S. Goto. Kegg: kyoto encyclopedia of genes and genomes. Nucleic Acids Res,28(1):27–30, Jan 2000.
J. R. Karr, J. C. Sanghvi, D. N. Macklin, M. V. Gutschow, J. M. Jacobs, B. Bolival, Jr, N. Assad-Garcia, J. I. Glass, and M. W. Covert. A whole-cell computational model predicts phenotypefrom genotype. Cell, 150(2):389–401, Jul 2012.
K. J. Kauffman, P. Prakash, and Edwards. Advances in flux balance analysis. Curr OpinBiotechnol, 14(5):491–496, Oct 2003.
I. M. Keseler, J. Collado-Vides, A. Santos-Zavaleta, M. Peralta-Gil, S. Gama-Castro, L. MuñizRascado, C. Bonavides-Martinez, S. Paley, M. Krummenacker, T. Altman, P. Kaipa,A. Spaulding, J. Pacheco, M. Latendresse, C. Fulcher, M. Sarker, A. G. Shearer, A. Mackie,I. Paulsen, R. P. Gunsalus, and P. D. Karp. Ecocyc: a comprehensive database of escherichiacoli biology. Nucleic Acids Res, 39(Database issue):D583–D590, Jan 2011.
H. Kitano. Foundations of Systems Biology. MIT Press, Cambridge, Massachusetts, 2001.
H. Kitano. Systems biology: a brief overview. Science, 295(5560):1662–1664, Mar 2002a.
H. Kitano. Computational systems biology. Nature, 420(6912):206–210, Nov 2002b.
H. Kitano. Introductions to systems biology. Tanpakushitsu Kakusan Koso, 48(7):789–793, Jun2003.
178
Bibliography
H. Kitano, A. Funahashi, Y. Matsuoka, and K. Oda. Using process diagrams for the graphicalrepresentation of biological networks. Nat Biotechnol, 23(8):961–966, Aug 2005.
E. Klipp, R. Herwig, A. Kowald, C. Wierling, and Lehrach. Systems Biology in Practice. Wiley-VCH, 2005.
H. Kobayashi. A proton-translocating atpase regulates ph of the bacterial cytoplasm. J BiolChem, 260(1):72–76, Jan 1985.
K. Kobayashi, S. D. Ehrlich, A. Albertini, G. Amati, K. K. Andersen, M. Arnaud, K. Asai,S. Ashikaga, S. Aymerich, P. Bessieres, F. Boland, S. C. Brignell, S. Bron, K. Bunai, J. Cha-puis, L. C. Christiansen, A. Danchin, M. Débarbouille, E. Dervyn, E. Deuerling, K. Devine,S. K. Devine, O. Dreesen, J. Errington, S. Fillinger, S. J. Foster, Y. Fujita, A. Galizzi, R. Gar-dan, C. Eschevins, T. Fukushima, K. Haga, C. R. Harwood, M. Hecker, D. Hosoya, M. F.Hullo, H. Kakeshita, D. Karamata, Y. Kasahara, F. Kawamura, K. Koga, P. Koski, R. Kuwana,D. Imamura, M. Ishimaru, S. Ishikawa, I. Ishio, D. Le Coq, A. Masson, C. Mauël, R. Meima,R. P. Mellado, A. Moir, S. Moriya, E. Nagakawa, H. Nanamiya, S. Nakai, P. Nygaard,M. Ogura, T. Ohanan, M. O’Reilly, M. O’Rourke, Z. Pragai, H. M. Pooley, G. Rapoport,J. P. Rawlins, L. A. Rivas, C. Rivolta, A. Sadaie, Y. Sadaie, M. Sarvas, T. Sato, H. H. Sax-ild, E. Scanlan, W. Schumann, J. F. M. L. Seegers, J. Sekiguchi, A. Sekowska, S. J. Séror,M. Simon, P. Stragier, R. Studer, H. Takamatsu, T. Tanaka, M. Takeuchi, H. B. Thomaides,V. Vagner, J. M. van Dijl, K. Watabe, A. Wipat, H. Yamamoto, M. Yamamoto, Y. Yamamoto,K. Yamane, K. Yata, K. Yoshida, H. Yoshikawa, U. Zuber, and N. Ogasawara. Essential bacil-lus subtilis genes. Proc Natl Acad Sci U S A, 100(8):4678–4683, Apr 2003.
M. Kochman, P. A. Hargrave, and J. Buczylko. Fructose-bisphosphate aldolase from helix po-matia. Methods Enzymol, 90 Pt E:259–263, 1982.
E. V. Koonin. Comparative genomics, minimal gene-sets and the last universal common ancestor.Nat Rev Microbiol, 1(2):127–136, Nov 2003.
N. J. Kruger, S. A. Hill, and R. Ratcliffe. Regulation of primary metabolic pathways in plants.Springer Verlag, 1999.
S. Kühner, V. van Noort, M. J. Betts, A. Leo-Macias, C. Batisse, M. Rode, T. Yamada, T. Maier,S. Bader, P. Beltran-Alvarez, D. Castaño Diez, W.-H. Chen, D. Devos, M. Güell, T. Noram-buena, I. Racke, V. Rybin, A. Schmidt, E. Yus, R. Aebersold, R. Herrmann, B. Böttcher, A. S.Frangakis, R. B. Russell, L. Serrano, P. Bork, and A.-C. Gavin. Proteome organization in agenome-reduced bacterium. Science, 326(5957):1235–1240, Nov 2009.
M. J. Lambeth and M. J. Kushmerick. A computational model for glycogenolysis in skeletalmuscle. Ann Biomed Eng, 30(6):808–827, Jun 2002.
G. C. Langridge, M.-D. Phan, D. J. Turner, T. T. Perkins, L. Parts, J. Haase, I. Charles, D. J.Maskell, S. E. Peters, G. Dougan, J. Wain, J. Parkhill, and A. K. Turner. Simultaneous assayof every salmonella typhi gene using one million transposon mutants. Genome Res, 19(12):2308–2316, Dec 2009.
M. A. Larkin, G. Blackshields, N. P. Brown, R. Chenna, P. A. McGettigan, H. McWilliam,F. Valentin, I. M. Wallace, A. Wilm, R. Lopez, J. D. Thompson, T. J. Gibson, and D. G.Higgins. Clustal w and clustal x version 2.0. Bioinformatics, 23(21):2947–2948, Nov 2007.
C. Lartigue, J. I. Glass, N. Alperovich, R. Pieper, P. P. Parmar, C. A. Hutchison, 3rd, H. O.Smith, and J. C. Venter. Genome transplantation in bacteria: changing one species to another.
179

Bibliography
Science, 317(5838):632–638, Aug 2007.
N. E. Lewis, H. Nagarajan, and B. O. Palsson. Constraining the metabolic genotype-phenotyperelationship using a phylogeny of in silico methods. Nat Rev Microbiol, Feb 2012.
C. Li, M. Donizelli, N. Rodriguez, H. Dharuri, L. Endler, V. Chelliah, L. Li, E. He, A. Henry,M. I. Stefan, J. L. Snoep, M. Hucka, N. Le Novère, and C. Laibe. Biomodels database: Anenhanced, curated and annotated resource for published quantitative kinetic models. BMCSystems Biology, 4:92, Jun 2010.
L. M. Liberman, R. Sozzani, and P. N. Benfey. Integrative systems biology: an attempt todescribe a simple weed. Curr Opin Plant Biol, 15(2):162–167, Apr 2012.
M. Liebeke, H. Meyer, S. Donat, K. Ohlsen, and M. Lalk. A metabolomic view of staphylococcusaureus and its ser/thr kinase and phosphatase deletion mutants: involvement in cell wallbiosynthesis. Chem Biol, 17(8):820–830, Aug 2010.
M. Liebeke, K. Dörries, D. Zühlke, J. Bernhardt, S. Fuchs, J. Pané-Farré, S. Engelmann,U. Völker, R. Bode, T. Dandekar, U. Lindequist, M. Hecker, and M. Lalk. A metabolomicsand proteomics study of the adaptation of staphylococcus aureus to glucose starvation. MolBiosyst, 7(4):1241–1253, Apr 2011.
M. Lluch-Senar, M. Vallmitjana, E. Querol, and J. Piñol. A new promoterless reporter vectorreveals antisense transcription in mycoplasma genitalium. Microbiology, 153(Pt 8):2743–2752,Aug 2007.
M. Lluch-Senar, E. Querol, and J. Piñol. Cell division in a minimal bacterium in the absence offtsz. Mol Microbiol, 78(2):278–289, Oct 2010.
M. Lluch-Senar, J. Delgado, J. Wodke, and L. Serrano. Deciphering the minimal functionalgenomes. MSB, manuscript in preparation.
J. A. Lucy. Functional and structural aspects of biological membranes: a suggested structuralrole for vitamin e in the control of membrane permeability and stability. Ann N Y Acad Sci,203:4–11, Dec 1972.
U. Mäder, A. G. Schmeisky, L. A. Flórez, and J. Stülke. Subtiwiki–a comprehensive communityresource for the model organism bacillus subtilis. Nucleic Acids Res, 40(Database issue):D1278–D1287, Jan 2012.
R. Mahadevan, J. S. Edwards, and F. J. Doyle, 3rd. Dynamic flux balance analysis of diauxicgrowth in escherichia coli. Biophys J, 83(3):1331–1340, Sep 2002.
T. Maier, A. Schmidt, M. Güell, S. Kühner, A.-C. Gavin, R. Aebersold, and L. Serrano. Quan-tification of mrna and protein and integration with protein turnover in a bacterium. Mol SystBiol, 7:511, 2011.
J. Maniloff, R. N. McElhany, L. R. Finch, and J. B. Baseman. Mycoplasmas. Molecular Biologyand Pathogenesis. - Source of nucleotides. American Society for Microbiology, 1992.
J. T. Manolukas, M. F. Barile, D. K. Chandler, and J. D. Pollack. Presence of anapleroticreactions and transamination, and the absence of the tricarboxylic acid cycle in mollicutes. JGen Microbiol, 134(3):791–800, Mar 1988.
B. McClintock. The origin and behavior of mutable loci in maize. Proc Natl Acad Sci U S A, 36
180

Bibliography
(6):344–355, Jun 1950.
R. N. McElhaney and M. E. Tourtellotte. Mycoplasma membrane lipids: variations in fatty acidcomposition. Science, 164(3878):433–434, Apr 1969.
S. McKnight. Gene switching by metabolic enzymes–how did you get on the invitation list? Cell,114(2):150–152, Jul 2003.
M. Merzbacher, C. Detsch, W. Hillen, and J. Stülke. Mycoplasma pneumoniae hpr ki-nase/phosphorylase. Eur J Biochem, 271(2):367–374, Jan 2004.
R. Milo, P. Jorgensen, U. Moran, G. Weber, and M. Springer. Bionumbers–the database of keynumbers in molecular and cell biology. Nucleic Acids Res, 38(Database issue):D750–D753, Jan2010.
J. Monod. From enzymatic adaptation to allosteric transitions. Science, 154(3748):475–483, Oct1966.
S. N. Moreno, L. Zhong, H. G. Lu, W. D. Souza, and M. Benchimol. Vacuolar-type h+-atpaseregulates cytoplasmic ph in toxoplasma gondii tachyzoites. Biochem J, 330 ( Pt 2):853–860,Mar 1998.
H. J. Morowitz and Tourtellotte. The smallest living cells. Sci Am, 206:117–126, Mar 1962.
D. Nagrath, M. Avila-Elchiver, F. Berthiaume, A. W. Tilles, A. Messac, and Yarmush. Integratedenergy and flux balance based multiobjective framework for large-scale metabolic networks.Ann Biomed Eng, 35(6):863–885, Jun 2007.
D. J. Naylor and F. U. Hartl. Contribution of molecular chaperones to protein folding in thecytoplasm of prokaryotic and eukaryotic cells. Biochem Soc Symp, pages 45–68, 2001.
F. C. Neidhardt. Escherichia coli and Salmonella: Cellular and Molecular Biology. ASM press,1996.
A. R. Neves, A. Ramos, M. C. Nunes, M. Kleerebezem, J. Hugenholtz, W. M. de Vos, J. Almeida,and H. Santos. In vivo nuclear magnetic resonance studies of glycolytic kinetics in lactococcuslactis. Biotechnol Bioeng, 64(2):200–212, Jul 1999.
A. R. Neves, W. A. Pool, J. Kok, O. P. Kuipers, and Santos. Overview on sugar metabolismand its control in lactococcus lactis - the input from in vivo nmr. FEMS Microbiol Rev, 29(3):531–554, Aug 2005.
J. K. Nicholson and J. C. Lindon. Systems biology: Metabonomics. Nature, 455(7216):1054–1056,Oct 2008.
P. Nicolas, U. Mäder, E. Dervyn, T. Rochat, A. Leduc, N. Pigeonneau, E. Bidnenko, E. Mar-chadier, M. Hoebeke, S. Aymerich, D. Becher, P. Bisicchia, E. Botella, O. Delumeau, G. Do-herty, E. L. Denham, M. J. Fogg, V. Fromion, A. Goelzer, A. Hansen, E. Härtig, C. R.Harwood, G. Homuth, H. Jarmer, M. Jules, E. Klipp, L. Le Chat, F. Lecointe, P. Lewis,W. Liebermeister, A. March, R. A. T. Mars, P. Nannapaneni, D. Noone, S. Pohl, B. Rinn,F. Rügheimer, P. K. Sappa, F. Samson, M. Schaffer, B. Schwikowski, L. Steil, J. Stülke,T. Wiegert, K. M. Devine, A. J. Wilkinson, J. M. van Dijl, M. Hecker, U. Völker, P. Bessières,and P. Noirot. Condition-dependent transcriptome reveals high-level regulatory architecturein bacillus subtilis. Science, 335(6072):1103–1106, Mar 2012.
181

Bibliography
D. Noble. The Music of Life: Biology beyond genes. Oxford University Press, 2008.
M. A. Oberhardt, J. Puchalka, K. E. Fryer, V. A. P. Martins dos Santos, and Papin. Genome-scale metabolic network analysis of the opportunistic pathogen pseudomonas aeruginosa pao1.J Bacteriol, 190(8):2790–2803, Apr 2008.
M. A. Oberhardt, B. O. Palsson, and J. A. Papin. Applications of genome-scale metabolicreconstructions. Mol Syst Biol, 5:320, 2009.
J. D. Orth, I. Thiele, and B. Ã. Palsson. What is flux balance analysis? Nat Biotechnol, 28(3):245–248, Mar 2010.
B. Oshry. Seeing Systems: Unlocking the Mysteries of Organizational Life. Mcgraw-Hill Profes-sionals, 2007.
M. Pachkov, T. Dandekar, J. Korbel, P. Bork, and Schuster. Use of pathway analysis and genomecontext methods for functional genomics of mycoplasma pneumoniae nucleotide metabolism.Gene, 396(2):215–225, Jul 2007.
M. Papagianni, N. Avramidis, and G. Filiousis. Glycolysis and the regulation of glucose transportin lactococcus lactis spp. lactis in batch and fed-batch culture. Microb Cell Fact, 6:16, 2007.
D. L. Pavia, G. M. Lampman, G. S. Kriz, and R. G. Engel. Introduction to Organic LaboratoryTechniques: A Microscale Approach. David Harris, 2005.
S. J. Pirt. The maintenance energy of bacteria in growing cultures. Proc R Soc Lond B Biol Sci,163(991):224–231, Oct 1965.
J. D. Pollack, N. L. Somerson, and L. Senterfit. Isolation, characterization, and immunogenicityof mycoplasma pneumoniae membranes. Infect Immun, 2(3):326–339, Sep 1970.
J. D. Pollack, N. L. Somerson, and Senterfit. Chemical composition and serology of mycoplasmapneumoniae lipids. J Infect Dis, 127:Suppl:S32–Suppl:S35, Mar 1973.
J. D. Pollack, M. V. Williams, and McElhaney. The comparative metabolism of the mollicutes(mycoplasmas): the utility for taxonomic classification and the relationship of putative geneannotation and phylogeny to enzymatic function in the smallest free-living cells. Crit RevMicrobiol, 23(4):269–354, 1997.
N. D. Price, J. L. Reed, and B. O. Palsson. Genome-scale models of microbial cells: evaluatingthe consequences of constraints. Nat Rev Microbiol, 2(11):886–897, Nov 2004.
J. Puchalka, M. A. Oberhardt, M. Godinho, A. Bielecka, D. Regenhardt, K. N. Timmis, J. A.Papin, and V. A. P. Martins dos Santos. Genome-scale reconstruction and analysis of thepseudomonas putida kt2440 metabolic network facilitates applications in biotechnology. PLoSComput Biol, 4(10):e1000210, Oct 2008.
T. Pupko, I. Pe’er, M. Hasegawa, D. Graur, and N. Friedman. A branch-and-bound algorithmfor the inference of ancestral amino-acid sequences when the replacement rate varies amongsites: Application to the evolution of five gene families. Bioinformatics, 18(8):1116–1123, Aug2002.
A. Ramos, A. R. Neves, R. Ventura, C. Maycock, P. López, and H. Santos. Effect of pyruvatekinase overproduction on glucose metabolism of lactococcus lactis. Microbiology, 150(Pt 4):1103–1111, Apr 2004.
182

Bibliography
S. Rasmussen, H. B. Nielsen, and H. Jarmer. The transcriptionally active regions in the genomeof bacillus subtilis. Mol Microbiol, 73(6):1043–1057, Sep 2009.
S. Razin. The mycoplasmas. Microbiol Rev, 42(2):414–470, Jun 1978.
S. Razin, M. Aragaman, and J. Avigan. Chemical composition of mycoplasma cells and mem-branes. J Gen Microbiol, 33:477–487, Dec 1963.
S. Razin, D. Yogev, and Y. Naot. Molecular biology and pathogenicity of mycoplasmas. MicrobiolMol Biol Rev, 62(4):1094–1156, Dec 1998.
J. L. Reed and B. O. Palsson. Thirteen years of building constraint-based in silico models ofescherichia coli. J Bacteriol, 185(9):2692–2699, May 2003.
J. L. Reed, I. Famili, I. Thiele, and B. O. Palsson. Towards multidimensional genome annotation.Nat Rev Genet, 7(2):130–141, Feb 2006.
M. Ridley, editor. Evolution. Oxford Readers, 2003.
M. Rizzi, U. Theobald, E. Querfurth, T. Rohrhirsch, M. Baltes, and Reuss. In vivo investigationsof glucose transport in saccharomyces cerevisiae. Biotechnol Bioeng, 49(3):316–327, Feb 1996.
M. Rizzi, M. Baltes, U. Theobald, and M. Reuss. In vivo analysis of metabolic dynamics insaccharomyces cerevisiae: Ii. mathematical model. Biotechnol Bioeng, 55(4):592–608, Aug1997.
F. L. Rock, W. Mao, A. Yaremchuk, M. Tukalo, T. Crépin, H. Zhou, Y.-K. Zhang, V. Hernandez,T. Akama, S. J. Baker, J. J. Plattner, L. Shapiro, S. A. Martinis, S. J. Benkovic, S. Cusack,and M. R. K. Alley. An antifungal agent inhibits an aminoacyl-trna synthetase by trappingtrna in the editing site. Science, 316(5832):1759–1761, Jun 2007.
O. Rolfsson, B. O. Palsson, and I. Thiele. The human metabolic reconstruction recon 1 directshypotheses of novel human metabolic functions. BMC Syst Biol, 5:155, 2011.
K. Römer. Programming paradigms and middleware for sensor networks. GI/ITG FachgesprächSensornetze, Karlsruhe, Jahrgang 3(3):33–35, Feb 2004.
Rottem. Membrane lipids of mycoplasmas. Biochim Biophys Acta, 604(1):65–90, May 1980.
S. Rottem, E. A. Pfendt, and L. Hayflick. Sterol requirements of t-strain mycoplasmas. JBacteriol, 105(1):323–330, Jan 1971.
M. Sakamoto, T. Uchimera, and Komagata. Comparison of h2o-forming nadh oxidase fromleuconostoc mesenteroides subsp. mesenteroides nric 1541t and h2o2-forming nadh oxidasefrom sporolactobacillus inulinus nric 1133t. Journal of Fermentation and Bioengineering, 82:531 – 537, 1996.
J. M. Savinell and B. O. Palsson. Optimal selection of metabolic fluxes for in vivo measurement.ii. application to escherichia coli and hybridoma cell metabolism. J Theor Biol, 155(2):215–242,Mar 1992a.
J. M. Savinell and B. O. Palsson. Optimal selection of metabolic fluxes for in vivo measurement.i. development of mathematical methods. J Theor Biol, 155(2):201–214, Mar 1992b.
A. Scalbert, L. Brennan, O. Fiehn, T. Hankemeier, B. S. Kristal, B. van Ommen, E. Pujos-Guillot, E. Verheij, D. Wishart, and S. Wopereis. Mass-spectrometry-based metabolomics:
183

Bibliography
limitations and recommendations for future progress with particular focus on nutrition re-search. Metabolomics, 5(4):435–458, Dec 2009.
M. Scheer, A. Grote, A. Chang, I. Schomburg, C. Munaretto, M. Rother, C. Söhngen, M. Stelzer,J. Thiele, and D. Schomburg. Brenda, the enzyme information system in 2011. Nucleic AcidsRes, 39(Database issue):D670–D676, Jan 2011.
J. Schellenberger, R. Que, R. M. T. Fleming, I. Thiele, J. D. Orth, A. M. Feist, D. C. Zielinski,A. Bordbar, N. E. Lewis, S. Rahmanian, J. Kang, D. R. Hyduke, and B. O. Palsson. Quanti-tative prediction of cellular metabolism with constraint-based models: the cobra toolbox v2.0.Nat Protoc, 6(9):1290–1307, Sep 2011.
S. R. Schmidl, A. Otto, M. Lluch-Senar, J. Piñol, J. Busse, D. Becher, and J. Stülke. A triggerenzyme in mycoplasma pneumoniae: impact of the glycerophosphodiesterase glpq on virulenceand gene expression. PLoS Pathog, 7(9):e1002263, Sep 2011.
R. Schuetz, N. Zamboni, M. Zampieri, M. Heinemann, and U. Sauer. Multidimensional optimalityof microbial metabolism. Science, 336(6081):601–604, May 2012.
S. Seto, A. Uenoyama, and Miyata. Identification of a 521-kilodalton protein (gli521) involvedin force generation or force transmission for mycoplasma mobile gliding. J Bacteriol, 187(10):3502–3510, May 2005.
A. Seybert, R. Herrmann, and A. S. Frangakis. Structural analysis of mycoplasma pneumoniaeby cryo-electron tomography. J Struct Biol, 156(2):342–354, Nov 2006.
E. Shacter, P. B. Chock, and E. R. Stadtman. Energy consumption in a cyclic phosphoryla-tion/dephosphorylation cascade. J Biol Chem, 259(19):12260–12264, Oct 1984.
T. Shlomi, Y. Eisenberg, R. Sharan, and E. Ruppin. A genome-scale computational study of theinterplay between transcriptional regulation and metabolism. Mol Syst Biol, 3:101, 2007.
M. L. Shuler, P. Foley, and J. Atlas. Modeling a minimal cell. Methods Mol Biol, 881:573–610,2012.
L. F. Silvian, J. Wang, and T. A. Steitz. Insights into editing from an ile-trna synthetase structurewith trnaile and mupirocin. Science, 285(5430):1074–1077, Aug 1999.
C. A. Smith, G. O’Maille, E. J. Want, C. Qin, S. A. Trauger, T. R. Brandon, D. E. Custodio,R. Abagyan, and G. Siuzdak. Metlin: a metabolite mass spectral database. Ther Drug Monit,27(6):747–751, Dec 2005.
L. R. Snyder, J. J. Kirkland, and J. W. Dolan. Introduction to Modern Liquid Chromatography,Third Edition. Wiley, 2010.
T. G. Sobolevsky, A. I. Revelsky, B. Miller, V. Oriedo, E. S. Chernetsova, and I. Revelsky.Comparison of sitylation and esterificationacylation procedures in gc-ms analysis of aminoacids. Journal of Separation Science, 26:1474–1478, 2003.
T. Soga, Y. Ohashi, Y. Ueno, H. Naraoka, M. Tomita, and T. Nishioka. Quantitative metabolomeanalysis using capillary electrophoresis mass spectrometry. J Proteome Res, 2(5):488–494,2003.
R. Sorek and P. Cossart. Prokaryotic transcriptomics: a new view on regulation, physiology andpathogenicity. Nat Rev Genet, 11(1):9–16, Jan 2010.
184
Bibliography
K. Spagou, I. D. Wilson, P. Masson, G. Theodoridis, N. Raikos, M. Coen, E. Holmes, J. C.Lindon, R. S. Plumb, J. K. Nicholson, and E. J. Want. Hilic-uplc-ms for exploratory urinarymetabolic profiling in toxicological studies. Anal Chem, 83(1):382–390, Jan 2011.
O. D. Sparkman. Mass Spec Desk Reference. Global View Publishing, 2000.
J. Stelling. Mathematical models in microbial systems biology. Curr Opin Microbiol, 7(5):513–518, Oct 2004.
C. E. V. Storm and E. L. L. Sonnhammer. Automated ortholog inference from phylogenetic treesand calculation of orthology reliability. Bioinformatics, 18(1):92–99, Jan 2002.
P. F. Suthers, M. S. Dasika, V. S. Kumar, G. Denisov, J. I. Glass, and C. D. Maranas. Agenome-scale metabolic reconstruction of mycoplasma genitalium, ips189. PLoS Comput Biol,5(2):e1000285, Feb 2009.
B. Szappanos, K. Kovács, B. Szamecz, F. Honti, M. Costanzo, A. Baryshnikova, G. Gelius-Dietrich, M. J. Lercher, M. Jelasity, C. L. Myers, B. J. Andrews, C. Boone, S. G. Oliver,C. Pál, and B. Papp. An integrated approach to characterize genetic interaction networks inyeast metabolism. Nat Genet, 43(7):656–662, Jul 2011.
B. S. Szwergold, K. Ugurbil, and T. R. Brown. Properties of fructose-1,6-bisphosphate aldolasefrom escherichia coli: an nmr analysis. Arch Biochem Biophys, 317(1):244–252, Feb 1995.
Y. Taniguchi, P. J. Choi, G.-W. Li, H. Chen, M. Babu, J. Hearn, A. Emili, and X. S. Xie.Quantifying e. coli proteome and transcriptome with single-molecule sensitivity in single cells.Science, 329(5991):533–538, Jul 2010.
R. L. Tatusov, E. V. Koonin, and D. J. Lipman. A genomic perspective on protein families.Science, 278(5338):631–637, Oct 1997.
T. A. Tatusova, I. Karsch-Mizrachi, and J. A. Ostell. Complete genomes in www entrez: datarepresentation and analysis. Bioinformatics, 15(7-8):536–543, 1999.
B. Teusink, J. Passarge, C. A. Reijenga, E. Esgalhado, C. C. van der Weijden, M. Schepper,M. C. Walsh, B. M. Bakker, K. van Dam, H. V. Westerhoff, and J. L. Snoep. Can yeastglycolysis be understood in terms of in vitro kinetics of the constituent enzymes? testingbiochemistry. Eur J Biochem, 267(17):5313–5329, Sep 2000.
L. Thiele, K. Miettinen, P. J. Korhonen, and J. Molina. A preference-based evolutionary algo-rithm for multi-objective optimization. Evol Comput, 17(3):411–436, 2009.
S. G. Thorleifsson and I. Thiele. rbionet: A cobra toolbox extension for reconstructing high-quality biochemical networks. Bioinformatics, 27(14):2009–2010, Jul 2011.
R. t’Kindt, R. A. Scheltema, A. Jankevics, K. Brunker, S. Rijal, J.-C. Dujardin, R. Breitling,D. G. Watson, G. H. Coombs, and S. Decuypere. Metabolomics to unveil and understandphenotypic diversity between pathogen populations. PLoS Negl Trop Dis, 4(11):e904, 2010.
A. H. Tong, M. Evangelista, A. B. Parsons, H. Xu, G. D. Bader, N. Pagé, M. Robinson,S. Raghibizadeh, C. W. Hogue, H. Bussey, B. Andrews, M. Tyers, and C. Boone. Systematicgenetic analysis with ordered arrays of yeast deletion mutants. Science, 294(5550):2364–2368,Dec 2001.
A. H. Y. Tong, G. Lesage, G. D. Bader, H. Ding, H. Xu, X. Xin, J. Young, G. F. Berriz,
185

Bibliography
R. L. Brost, M. Chang, Y. Chen, X. Cheng, G. Chua, H. Friesen, D. S. Goldberg, J. Haynes,C. Humphries, G. He, S. Hussein, L. Ke, N. Krogan, Z. Li, J. N. Levinson, H. Lu, P. Ménard,C. Munyana, A. B. Parsons, O. Ryan, R. Tonikian, T. Roberts, A.-M. Sdicu, J. Shapiro,B. Sheikh, B. Suter, S. L. Wong, L. V. Zhang, H. Zhu, C. G. Burd, S. Munro, C. Sander,J. Rine, J. Greenblatt, M. Peter, A. Bretscher, G. Bell, F. P. Roth, G. W. Brown, B. Andrews,H. Bussey, and C. Boone. Global mapping of the yeast genetic interaction network. Science,303(5659):808–813, Feb 2004.
H. Tong, D. Bell, and K. Tabei. Automated data massaging, interpretation, and e-mailingmodules for high throughput open access mass spectrometry. Society for Mass Spectrometry,0305:1174–1187, 1999.
A. Uenoyama and M. Miyata. Identification of a 123-kilodalton protein (gli123) involved inmachinery for gliding motility of mycoplasma mobile. J Bacteriol, 187(16):5578–5584, Aug2005.
A. Uenoyama, A. Kusumoto, and M. Miyata. Identification of a 349-kilodalton protein (gli349)responsible for cytadherence and glass binding during gliding of mycoplasma mobile. J Bac-teriol, 186(5):1537–1545, Mar 2004.
unpublished results. Proteomics data for mycoplasma pneumoniae. Lluch-Senar, M. and Yus.,E.
M. J. van der Werf, K. M. Overkamp, B. Muilwijk, L. Coulier, and T. Hankemeier. Microbialmetabolomics: toward a platform with full metabolome coverage. Anal Biochem, 370(1):17–25,Nov 2007.
M. J. van der Werf, K. M. Overkamp, B. Muilwijk, M. M. Koek, B. J. C. van der Werff-van derVat, R. H. Jellema, L. Coulier, and T. Hankemeier. Comprehensive analysis of the metabolomeof pseudomonas putida s12 grown on different carbon sources. Mol Biosyst, 4(4):315–327, Apr2008.
W. M. van Gulik. Fast sampling for quantitative microbial metabolomics. Curr Opin Biotechnol,21(1):27–34, Feb 2010.
V. van Noort, J. Seebacher, S. Bader, S. Mohammed, I. Vonkova, M. J. Betts, S. Kühner,R. Kumar, T. Maier, M. O’Flaherty, V. Rybin, A. Schmeisky, E. Yus, J. Stülke, L. Serrano,R. B. Russell, A. J. R. Heck, P. Bork, and A.-C. Gavin. Cross-talk between phosphorylationand lysine acetylation in a genome-reduced bacterium. Mol Syst Biol, 8:571, 2012.
T. van Opijnen and A. Camilli. Genome-wide fitness and genetic interactions determined bytn-seq, a high-throughput massively parallel sequencing method for microorganisms. CurrProtoc Microbiol, Chapter 1:Unit1E.3, Nov 2010.
T. van Opijnen, K. L. Bodi, and A. Camilli. Tn-seq: high-throughput parallel sequencing forfitness and genetic interaction studies in microorganisms. Nat Methods, 6(10):767–772, Oct2009.
A. Varma and B. O. Palsson. Stoichiometric flux balance models quantitatively predict growthand metabolic by-product secretion in wild-type escherichia coli w3110. Appl Environ Micro-biol, 60(10):3724–3731, Oct 1994a.
A. Varma and B. O. Palsson. Metabolic flux balancing: Basic concepts, scientific and practicaluse. Nature Bio/Technology, 12, 1994b.
186

Bibliography
V. E. Velculescu, L. Zhang, B. Vogelstein, and K. W. Kinzler. Serial analysis of gene expression.Science, 270(5235):484–487, Oct 1995.
K. B. Waites and Talkington. Mycoplasma pneumoniae and its role as a human pathogen. ClinMicrobiol Rev, 17(4):697–728, table of contents, Oct 2004.
E. J. Want, I. D. Wilson, H. Gika, G. Theodoridis, R. S. Plumb, J. Shockcor, E. Holmes, andJ. K. Nicholson. Global metabolic profiling procedures for urine using uplc-ms. Nat Protoc, 5(6):1005–1018, Jun 2010.
V. C. Wasinger, S. J. Cordwell, A. Cerpa-Poljak, J. X. Yan, A. A. Gooley, M. R. Wilkins, M. W.Duncan, R. Harris, K. L. Williams, and I. Humphery-Smith. Progress with gene-productmapping of the mollicutes: Mycoplasma genitalium. Electrophoresis, 16(7):1090–1094, Jul1995.
R. Watanabe, R. Iino, K. Shimabukuro, M. Yoshida, and H. Noji. Temperature-sensitive reactionintermediate of f1-atpase. EMBO Rep, 9(1):84–90, Jan 2008.
J. D. Watson and F. H. Crick. Molecular structure of nucleic acids; a structure for deoxyribosenucleic acid. Nature, 171(4356):737–738, Apr 1953a.
J. D. Watson and F. H. Crick. Genetical implications of the structure of deoxyribonucleic acid.Nature, 171(4361):964–967, May 1953b.
J. Weiner, 3rd, C.-U. Zimmerman, H. W. H. Göhlmann, and R. Herrmann. Transcription profilesof the bacterium mycoplasma pneumoniae grown at different temperatures. Nucleic Acids Res,31(21):6306–6320, Nov 2003.
H. V. Westerhoff, C. Winder, H. Messiha, E. Simeonidis, M. Adamczyk, M. Verma, F. J. Brugge-man, and W. Dunn. Systems biology: the elements and principles of life. FEBS Lett, 583(24):3882–3890, Dec 2009.
M. R. Wilkins, C. Pasquali, R. D. Appel, K. Ou, O. Golaz, J. C. Sanchez, J. X. Yan, A. A. Gooley,G. Hughes, I. Humphery-Smith, K. L. Williams, and D. F. Hochstrasser. From proteins toproteomes: large scale protein identification by two-dimensional electrophoresis and aminoacid analysis. Biotechnology (N Y), 14(1):61–65, Jan 1996.
D. S. Wishart, C. Knox, A. C. Guo, R. Eisner, N. Young, B. Gautam, D. D. Hau, N. Psychogios,E. Dong, S. Bouatra, R. Mandal, I. Sinelnikov, J. Xia, L. Jia, J. A. Cruz, E. Lim, C. A.Sobsey, S. Shrivastava, P. Huang, P. Liu, L. Fang, J. Peng, R. Fradette, D. Cheng, D. Tzur,M. Clements, A. Lewis, A. De Souza, A. Zuniga, M. Dawe, Y. Xiong, D. Clive, R. Greiner,A. Nazyrova, R. Shaykhutdinov, L. Li, H. J. Vogel, and I. Forsythe. Hmdb: a knowledgebasefor the human metabolome. Nucleic Acids Res, 37(Database issue):D603–D610, Jan 2009.
S. M. S. Wong, J. D. Gawronski, D. Lapointe, and B. J. Akerley. High-throughput insertiontracking by deep sequencing for the analysis of bacterial pathogens. Methods Mol Biol, 733:209–222, 2011.
D. Wu, P. Hugenholtz, K. Mavromatis, R. Pukall, E. Dalin, N. N. Ivanova, V. Kunin, L. Good-win, M. Wu, B. J. Tindall, S. D. Hooper, A. Pati, A. Lykidis, S. Spring, I. J. Anderson,P. D’haeseleer, A. Zemla, M. Singer, A. Lapidus, M. Nolan, A. Copeland, C. Han, F. Chen,J.-F. Cheng, S. Lucas, C. Kerfeld, E. Lang, S. Gronow, P. Chain, D. Bruce, E. M. Rubin,N. C. Kyrpides, H.-P. Klenk, and J. A. Eisen. A phylogeny-driven genomic encyclopaedia ofbacteria and archaea. Nature, 462(7276):1056–1060, Dec 2009.
187

Bibliography
W.-X. Wu, Y. Zhan, T.-J. Zhao, Y.-R. Han, and Y.-F. Chen. Stochastic four-state mechanochem-ical model of f1-atpase. Commun. Theor. Phys., 54:630–634, 2010.
R. Yasuda, H. Noji, K. Kinosita, Jr, and M. Yoshida. F1-atpase is a highly efficient molecularmotor that rotates with discrete 120 degree steps. Cell, 93(7):1117–1124, Jun 1998.
E. Yus, T. Maier, K. Michalodimitrakis, V. van Noort, T. Yamada, W.-H. Chen, J. A. H.Wodke, M. Güell, S. Martínez, R. Bourgeois, S. Kühner, E. Raineri, I. Letunic, O. V. Kalin-ina, M. Rode, R. Herrmann, R. Gutiérrez-Gallego, R. B. Russell, A.-C. Gavin, P. Bork, andL. Serrano. Impact of genome reduction on bacterial metabolism and its regulation. Science,326(5957):1263–1268, Nov 2009.
E. Yus, M. Güell, A. P. Vivancos, W.-H. Chen, M. Lluch-Senar, J. Delgado, A.-C. Gavin, P. Bork,and L. Serrano. Transcription start site associated rnas in bacteria. Mol Syst Biol, 8:585, 2012.
P. Zipori, L. Bosch, and J. van Duin. Translation of ms2 rna in vitro in the absence of initiationfactor if-3. Eur J Biochem, 92(1):235–241, Dec 1978.
188

Acknowledgments
First of all, I want to thank my two supervisors, Edda Klipp and Luis Serrano, whoenabled me to accomplish this special interdisciplinary thesis and who supported meduring all this time, scientifically and humanly.
Next, i am indebted to Konstantinos Michalodimitrakis and Tobias Maier whonot only tought me experimental basics and chemistry but supervised my all day workand my mental health during the hard times in Barcelona.
Another big thank goes to Clemens Kühn, Maria Lluch-Senar, Javier Delgado,Almer van der Slot, and Julia Riedl for fruitful discussions and for their great sup-port for my personal well-being.
Also, I am very grateful towards all my other colleagues, that were working togetherwith me in the mycoplasma project: Jacek Puchalka,Miguel Godinho, Andreu Al-ibes, Toni Hermoso, Luca Cozzuto, Guglielmo Roma, Eva Yus, Bernhard Pet-zold, Sira Martínez, Tony Ferrar, Marie Trussart, Vitor Martins dos Santos,Hinnerk Eilers, Jörg Stülke, Francesco Mancuso, Ricardo Gutíerrez-Gallego,Josep Marcos de Aguila, and members of the different facilities at the CRG and theEMBL Heidelberg.
Furthermore, i thank all not yet mentioned past and present members of the ’TheoreticalBiophysics Group’ at the HU Berlin and the ’Design of Biological Systems Group’ at theCRG in Barcelona with whom I had the pleasure to work, to pass lunch hours together,and to share quite some out-of-work activities.
As of working with computers that do not always react on nice persuasive talking, Iowe the successful finishing of the thesis to Ivo Mainz, system administrator in theTBP group, and to the TIC department of the CRG, naming amongs all of them Is-mael De Mingo Benitez. Further great support has been provided by the programsecretaries, Blanka Wysocka, Eva Navarette, and Reyes Perza, by Nicola Collufrom the purchase department, and by the human resources members in Barcelona andby Sabine Wagnitz in Berlin. You made my life much more easy.
In addition, I want to thank the people reviewing this thesis and thus granting thefinal quality. Unless already mentioned, these were Thomas Spiesser and the last-minute reader.
189
Acknowledgments
This thesis was funded by a fellowship from Obra Social, Fundacíon ”laCaixa”.
As many of you may know by personal or indirect experience, the time of a PhD thesisis not always ease and fun and each PhD student presumably thinks about quitting itall quite a few times. However, I did not quit but finished and this was possible thanksto many people, sharing parts of their lives with me (friends, flatmates, sports mates,...). Representative for all of them I want to mention some that stayed true throughoutall the years and over the distance: Lisa, Stefan, Tobse, Juri, Felix, Ingo, Anne-Katrin, Carlos, Maria, Iván, Brito, Rebe, as well as the one who left: Christian.
Last but not least, I want to thank my family who supported me on all possible lev-els. First, those given to me by birth, especially my parents Andrea and Horst, mysister Birgitta and my brother Tino, my grandparents Johanna and Joachim, andall the others who obstained from my presence during so many important events of thereal life. Second, those chosen freely, especially Anke + family, Alex + family, andCristóbal & Jose Miguel who gave me a second home. I love you all!
190

Selbständigkeitserklärung
Ich erkläre, dass ich die vorliegende Arbeit selbständig und nur unter Verwendung derangegebenen Literatur, Quellen und Hilfsmittel angefertigt habe.
Berlin, den 08.08.2012 Judith Andrea Heidrun Wodke
191