with special reference to the constru - Eindhoven University of ...
143
Eindhoven University of Technology MASTER Production and application of lime in Tanzania : with special reference to the construction sector Esmeijer, Casper Award date: 1997 Link to publication Disclaimer This document contains a student thesis (bachelor's or master's), as authored by a student at Eindhoven University of Technology. Student theses are made available in the TU/e repository upon obtaining the required degree. The grade received is not published on the document as presented in the repository. The required complexity or quality of research of student theses may vary by program, and the required minimum study period may vary in duration. General rights Copyright and moral rights for the publications made accessible in the public portal are retained by the authors and/or other copyright owners and it is a condition of accessing publications that users recognise and abide by the legal requirements associated with these rights. • Users may download and print one copy of any publication from the public portal for the purpose of private study or research. • You may not further distribute the material or use it for any profit-making activity or commercial gain
-
Upload
khangminh22 -
Category
Documents
-
view
3 -
download
0
Transcript of with special reference to the constru - Eindhoven University of ...

Eindhoven University of Technology
MASTER
Production and application of lime in Tanzania : with special reference to the constructionsector
Esmeijer, Casper
Award date:1997
Link to publication
DisclaimerThis document contains a student thesis (bachelor's or master's), as authored by a student at Eindhoven University of Technology. Studenttheses are made available in the TU/e repository upon obtaining the required degree. The grade received is not published on the documentas presented in the repository. The required complexity or quality of research of student theses may vary by program, and the requiredminimum study period may vary in duration.
General rightsCopyright and moral rights for the publications made accessible in the public portal are retained by the authors and/or other copyright ownersand it is a condition of accessing publications that users recognise and abide by the legal requirements associated with these rights.
• Users may download and print one copy of any publication from the public portal for the purpose of private study or research. • You may not further distribute the material or use it for any profit-making activity or commercial gain

Title:
Author: Date:
Supervisors:
Production and application of lime in Tanzania; with special reference to the construction sector.
Casper Esmeijer (346550) June 1997
Ir. E. van Egmond Ir. L.A. van Schaijk Dr. P. Laperre J. Mamiro
(Faculty of Technology Management) (Faculty of Architecture) (Faculty of Technology Management) (National Construction Council)
International Technological Development Sciences Faculty of Technology Management Eindhoven University of Technology, The Netherlands.
Production and Application of
Lime in Tanzania with special reference to the
Construction Sector
Casper Esmeijer
Swmnmy
Summary
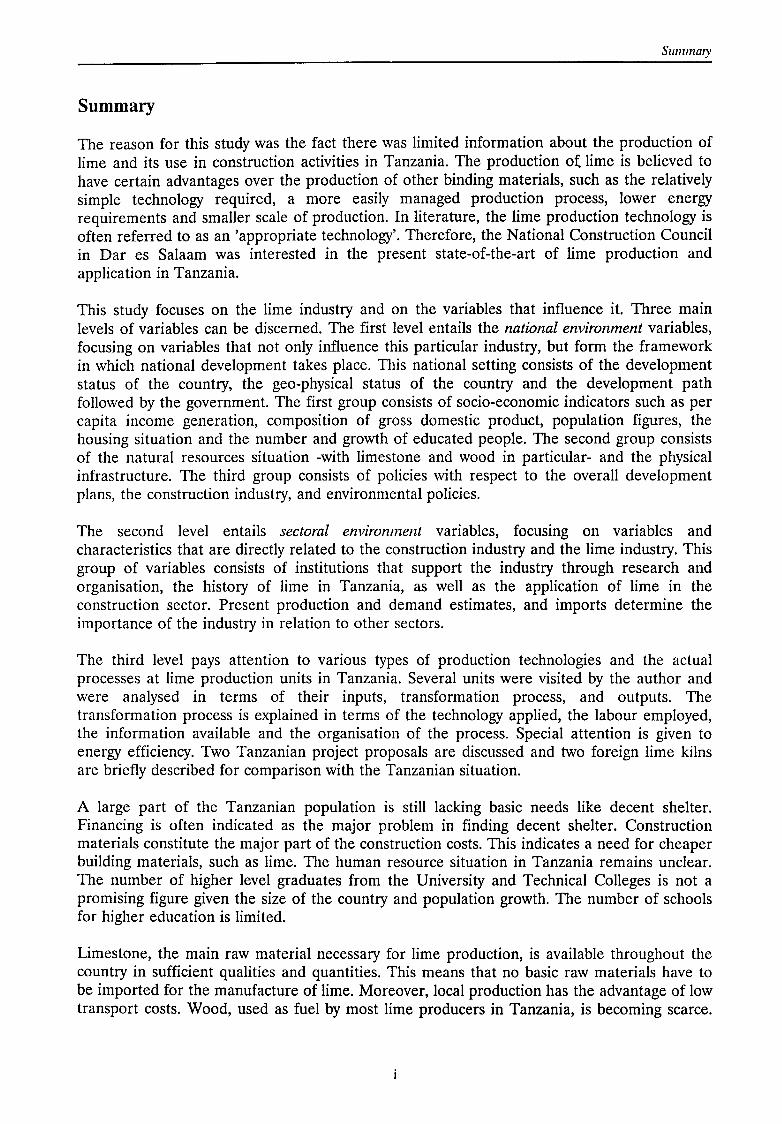
The reason for this study was the fact there was limited information about the production of lime and its use in construction activities in Tanzania. The production of lime is believed to have certain advantages over the production of other binding materials, such as the relatively simple technology required, a more easily managed production process, lower energy requirements and smaller scale of production. In literature, the lime production technology is aften referred to as an 'appropriate technology'. Therefore, the National Construction Council in Dar es Salaam was interested in the present state-af-the-art of lime production and application in Tanzania.
This study focuses on the lime industry and on the variables that influence it. Three main levels of variables can be discerned. The first level entails the national environment variables, focusing on variables that not only influence this particular industry, but farm the framework in which national development takes place. This national setting consists of the development status of the country, the geo-physical status of the country and the development path foliowed by the government. The first group consists of socio-economie indicators such as per capita income generation, composition of gross dornestic product, population figures, the housing situation and the number and growth of educated people. The second group consists of the natural resources situation -with limestone and wood in particular- and the physical infrastructure. The third group consists of policies with respect to the overall development plans, the construction industry, and environmental policies.
The second level entails sectoral environment variables, focusing on variables and characteristics that are directly related to the construction industry and the lime industry. This group of variables consists of institutions that support the industry through research and organisation, the history of lime in Tanzania, as well as the application of lime in the construction sector. Present production and demand estimates, and imparts determine the importance of the industry in relation to other sectors.
The third level pays attention to various types of production technologies and the actual processes at lime production units in Tanzania. Several units were visited by the author and were analysed in terms of their inputs, transformation process, and outputs. The transformation process is explained in terms of the technology applied, the labour employed, the information available and the organisation of the process. Special attention is given to energy efficiency. Two Tanzanian project proposals are discussed and two foreign lime kilns are briefly described for comparison with the Tanzanian situation.
A large part of the Tanzanian population is still lacking basic needs like decent shelter. Financing is aften indicated as the major problem in finding decent shelter. Construction materials constitute the major part of the construction casts. This indicates a need for cheaper building materials, such as lime. The human resource situation in Tanzania remains unclear. The number of higher level graduates from the University and Technica! Colleges is not a promising figure given the size of the country and population growth. The number of schools for higher education is limited.
Limestone, the main raw material necessary for lime production, is available throughout the country in sufficient qualities and quantities. This means that no basic raw materials have to be imported for the manufacture of lime. Moreover, local production has the advantage of low transport casts. Wood, used as fuel by most lime producers in Tanzania, is becoming scarce.

Summary
Worrying figures on deforestation were found. The actual situation is not sustainable and efforts should be undertaken to change this situation, in order to prevent a shortage of wood.
Despite the fact that lime is explicitly mentioned in government policy doc.uments the actual influence of policies was not noticable at the production units that were visited.
Research and supporting organisations with respect to the construction industry are present in Tanzania, though they are mainly located in Dar es Salaam. Research findings on low-cost housing materials are not available to manufacturers. Organisation and cooperation between institutions as well as dissemination of findings is rare. It is reeommendeel that communication be optimised.
The use and production of lime in Tanzania probably dates back to the 121h and 131
h century. During the colonial period, the technology of lime production was re-introduced and spread around the country by missionaries. Although there have been development programmes for lime production in the past, experiments with the production of lime and lime pozzolanas did not come to much. The programmes were undertaken between 1974 and 1980 and supported by SIDO.
With respect to the present use of lime, plastering and whitewash are the main applications in construction. The use of lime in mortar is ve:ry rare. The consumption of lime in construction is expected to decrease, which is mainly due to the development of other materials, industries and the country's infrastructure.
The demand for lime is estimated at 71,000 tonnes per year. This figure should be treated carefully though. Annual production of lime is estimated at 12,000 tonnes. One factor that remains unknown is the amount of lime produced in informal heap-burning activities. .t\n inventory could not be made of this.
Lime imperts were found for the past 27 years. The price per tonne of imported lime shows strange ups and downs, especially in the last 20 years. The reliability of trade statistics can not be guaranteed. The export of lime is negligible. The volume of lime imperts has decreased during the past 10 years.
The lime industry is a smali-scale industry, consisting for a large part of informal heap burning activities. The largest producer in Tanzania employs a vertical shaft kiln with an installed capacity of 45 tonnes per day, but reaches an actual production of approximately 13 tonnes per day. Lime production in Tanzania typically is Iabour intensive and decentralised. Most Iabour is unskilled and consists of temporary workers from local villages. There is little indigenous knowledge on lime burning and there is no real tradition on the mainland. Even at the larger factories, knowledge on the chemica! composition of the lime is lacking. Units are operateel on a day-to-day basis. The technology at the small production units is fuel inefficient.
The larger part of the final product is sold in the region where the producers are located. The national market is presently dominateel by the two larger factories in Tanga.
In its present application, lime is an unpopular construction materiaL Despite the favourable properties of lime, people tend to choose a cement plaster. Cement is associated with a high status. The main recommendation made in this report is to study the feasibility of sand-lime brick production.
i i
Muhtasari (Kitabu hiki kwa kifupi)
Muhtasari
Sababu ya kutunga kitabu hiki ilikuwa uhaba wa habari ya utengenezaji wa chokaa na namna itumiwavyo katika kazi za kujenga hapa Tanzania. Utengenezaji wa chokaa unatazamiwa kuwa na faida kubwa zaidi ukiupambanisha (ukiufananisha) na utengenezaji wa zana nyingine za kuambatisha zinazotumiwa katika kazi ya kujenga. Faida zile ni hizi: -kwanza ufundi utakiwao ni rahisi kidogo -utaratibu na mpango wa kuitengeneza ni rahisi pia -kiasi cha vitu vinavyotakiwa katika kazi ya utengenezaji (k.m. makaa, mafuta au miti) ni chini za i di - kiasi cha chokaa kinachoweza kutengenezwa kwa mara moja ni kidogo zaidi.
Katika vitabu vihusuvyo elimu ya utengenezaji wa chokaa inasemwa kwamba utengenezaji huo ni maarifa ya kufaa ('appropriate technology'). Kwa hiyo Baraza la Taifa la Ujenzi huko Dar es Salaam lilipenda kujua hali ya sasa ya ufundi wa utengenezaji wa chokaa na namna ya inavyotumiwa nchini.
Shabaha ya habari zifuatazo ni kuchunguza namna chokaa inavyotengenezwa na pia mambo mbalimbali yaliyo ya maana kwa ajili ya utengenezaji huo. Tunaweza kupambanua madaraja matatu makuu: 1) Daraja la kwanza linahusu siyo kwanza utengenezaji wa chokaa yenyewe peke yake, bali zaidi jinsi habari hizo zinavyofanyika ndani ya mpango wa rnaendelee yote ya kitaifa. Sehemu za mpango huo wa kitaifa ni kwanza (a) hali ya maendeleo ya nchi yenyewe, (b) pia hali ya udongo (ardhi) na mawe ya nchi na (c) mwishowe utaratibu na mipango ya maendeleo inayofuatwa na Serikali: • Fungu (grupu) la kwanza (hali ya maendeleo) linahusu 'socio-economie indicators', kama uundaji wa mapato ya wastani ya watu kwa mwaka, utungaji wa jumla ya kazi na mazao, namba zahusuzo jumla ya wananchi, hali ya nyumba na ukaaji katika nyumba hizo (hesabu na hal i za nyumba ), mwishowe hesabu ya jumla ya wananchi walio na elimu zaidi na namna hesabu hiyo inavyoongezeka. • Fungu la pili (udongo/ardhi) linahusu hali ya njia za kujipatia vifaa vya kitenegenezea chokaa (hapo ni ya maana hasa gange na miti na madini) na 'physical infrastructure' (k.m. barabara na njia, reli na umeme na njia za kupeana habari: kwa kijumla 'communication). • Fungu la tatu linahusu mipango ya siasa kuhusu maendeleo yote wa kijumla, viwanda na kazi yote ya ujenzi en siasa ya mazingira ('environmental policies').
2) Daraja la pili linaeleza mambo yawezayo kubadilika katika sehemu za mazingira: tukikaza hasa mambo yale na alama za pekee zihusianazo mara moja na kazi za ujenzi na za utengenezaji wa chokaa. Fungu hilo la mambo yawezavyo kubadilika linahusu idara zinazosaidia na kutegemeza utengenezaji wa chokaa kwa njia ya uchunguzi na upangaji wa utengenezaji huo; pia historia ya kutengeneza chokaa katika nchi ya Tanzania; vilevile utumiaji wa chokaa katika ujenzi. Utengenezaji wa chokaa wa siku hizi, hesabu ya kisio inayohiyajiwa na kutakiwa, na vile vile kiasi kinachoingizwa nchini: hayo yote yanaonyesha maana wa utengenezaji wa chokaa.
3) Daraja la tatu linaeleza hasa aina mbalimbali za ufundi wa utengenezaji na utaratibu wa sasa wa utengenezaji wa gauge katika mahali mbalimbali panapotengenezwa chokaa hapa Tanzania. Mtunga wa kitabu hiki alipatembelea mahali pengi panapotengenezwa chokaa na alipachanganua alipokuwa akiangalia hasa vifaa vitakiwavyo kwa ajili ya utengenezaji, utaratibu katika kazi ya kutegeneza chokaa na kuhusu mapato (ukubwa wa mavuno ya kazi hiyo; yaani kiasi cha ckokaa kilichopatikana mwishoni). Njia hiyo ya kutenegenza chokaa
iii
Muhtasari ( Kitabu hiki kw a kifttpi)
inaelezwa kwa maneno yaelimu ya ufundi iliyotumiwa, ya kazi iliyofanywa, ya habari zilizopatikana na ya utaratibu wa mpango wa kazi. Kwa namna ya pekee tuliangalia utumiaji wa vitu vya kuchoma vilivyotumiwa na pia kama vitu hivyo vilipotezwa bure. Mipango miwili ya kitanzania ya kutengeneza chokaa imejadiliwa; na tanuru mbili za nje zinaonyeshwa kwa kifupi, kusudi tuzifananishe na zile za kitanzania.
Sehemu kubwa ya wananchi wa Tanzania hawana bado mahitaji na vifaa vya kawaida vya kila siku kama nyumba nzuri na ya kufaa. Uhaba na ukosefu wa fedha unatajwa kuwa sababu kuu hasa katika mipango ya kujipatia nyumba safi. Sehemu kubwa ya gharama ya kujenga inahitajiwa hasa kwa vifaa vya kuzitengenezea nyumba. Maana yake, hii ni dalili kwamba lazima vifaa vile viwe vya bei rahisi zaidi; (mara nyingi vinakula pesa nyingi mno).
Namba ya watu wenye ufundi wa juu zaidi wanaopatikana huko Tanzania haijulikani sawasawa. Hesabu ya wenye digrii wa Chuo Kikuu na Chuo cha Ufundi si ya kuleta matumaini makubwa, hasa ukiangalia ukubwa wa nchi na namna hesabu ya wenyeji inavyokua kila mwaka. Hesabu ya shule za elimu ya juu zaidi ni pungufu.
Gange, kitu cha maana kuu kinachotakiwa hasa kwa ajili ya utengenezaji wa chokaa, linapatikana kwa kiasi cha kutosha katika nchi yenyewe; na ubora wake ni wa kufaa. Maana yake, watu wakipenda kutengeneza chokaa, hawana lazima kuviagiza toka nje vitu vinavyotakiwa kwa ajili ya utengenezaji huo. Zaidi ya hayo, chokaa ikitengenezwa mahali penyewe ni faida kwa kuwa gharama ya usafirishaji ni ndogo zaidi. Miti, inayotumiwa na watengenezaji karibu wote wa chokaa (kwa ajili ya kuchoma katika tanuru), inaanza kuwa ya ghali. Tumegundua kwamba hesabu ya maeka ya miti inayokatwa ni ya kuleta wasiwasi. Hapo hali ya sasa haiwezi kuendelea na ni lazima sana kufanya bidii kubwa kubadili hali hiyo, kusudi uhaba wa miti uepushwe.
Ingawa utengenezaji wa chokaa unatajwa katika maandishi ya kisiasa ya serikali, lazima tuseme kwamba hatukuweza kugundua uongozi wa serikali katika mahali inapotentengenezwa chokaa palipotembelewa nasi.
Shirika zinazofanya utafiti na kutoa maegemeo kwa ajili ya kazi za ujenzi zinapatikana Tanzania, lakini makao yao, maofisi yao, yapo hasa huko Dar es Salaam tu. Kwa hiyo mambo yanayogunduliwa kuhusu vifaa vya kujenga nyumba vilivyo vya bei nafuu au vya bei iliyo rahisi zaidi, hayajulikani palepale wafanyakazi na rnafundi wanapotimiza kazi ya ujenzi; hawana habari sawasawa kuhusu bei. Upangaji na ushirikiano wa pamoja baina ya shirika na shirika si jambo la kawaida tena ni haba sana. Vile vile uenezaji wa habari mpya, wa aina za ufundi na wa mambo mapya yanayogunduliwa tunauona mara chache sana. Kwa hiyo tunawashauri viongozi wanaohusika kupeana habari hizo za kazi zaidi na zaidi.
Utengenezaji na utumiaji wa chokaa hapa Tanzania zinajulikana tayari katika karne la 12 na la 13 (baadaye zilififia tena). Wakati wa miaka ya ukoloni ujuzi na ufundi wa utengenezaji wa chokaa zilifufuliwa tena na kuenezwa katika nchi yote hasa na watu ma misheni (mabruda na mapadre na wasaidizi wao ). Ingawa miaka îliyopita ilifanywa mipango ya maendeleo kuhusu utengenezaji wa chokaa, majaribio hayo (ya kutengeneza tena chokaa na pozzolana) ilitokea mwishoni kuwa kazi bure; mipango hiyo ilifanywa kati ya mwaka 1974 na 1980; iliegemezwa na SIDO.
Kuhusu utumiaji wa chokaa wa siku hizi twaweza kuserna kwamba namna kuu za kuzitumia katika ujenzi ni hasa kwa kutia lipu na kupaka rangi (nyeupe). Utumizi wa chokaa katika 'mortar' twaona mara chache tu. Inatazamiwa kwamba siku za mbele utumizi wa chokaa kwa
IV
Muhtasari (Kitabu hiki kwa kifupi)
kazi za kujenga utapunguka. Sababu yake ni hasa usitawi na ugunduzi wa vitu vingine vya kujenga, aina nyingine za kazi zinatotokea na vitu vingine ambavyo ni msingi na nguzo wa maendeleo ya jamii ya watu na ya nchi.
Kiasi cha chokaa kinachotakiwa kwa mwaka kinakadiriwa kuwa tani 71,000. Lakini lazima tutumie habari ya hesabu hii kwa uangalifu mkubwa. Kiasi cha chokaa kinachotengenezwa kwa mwaka mmoja kinakisiwa kuwa tani 12,000. Jambo moja ambalo nalo hatuna bado habari sawasawa ni kiasi cha chokaa kinachotengenezwa kwa njia ya 'heap burning' (yaani bila kutumia tanuru, miti ya kuchoma ikipangwa juu ya chokaa). Mwandishi wa kitabu hiki hakuwe za kukusanya habari maalurn kubusu 'heap-burning'.
Kiasi ya chokaa kilichoingizwa toka nje tangu muda wa miaka 27 iliyopita tumefaulu kukigundua. Bei ya tani moja ya chokaa inayoingizwa toka nje ilikwenda mara juu, mara chini kwa namna ya ajabu, hasa wakati wa miaka 20 iliyopita. Vkweli na uaminifu wa namba mbalimbali za biashara hauwezi kuhakikihswa. Upelekaji wa chokaa katika nchi za nje karibu haina maana. Kiasi cha chokaa kinachoingizwa toka nje inaonyesha kwamba kinarudi nyuma miaka kumi iliyopita.
Kazi ya kutengeneza chokaa ni kwa vidogo tu (hakuna matanuru makubwa sana). Kazi hii inatendeka hasa kwa namna ya 'heap burning' inayofanywa kwa namna ya kiyenyeji. Mtengenezaji chokaa mkuu kuliko wote hapa Tanzania anatumia tanuru lenye umbo la dohani inendayo juu naye anatengeneza (ilivyotazamiwa) kila siku tani 45, lakini kiasi chake wa kweli ni kadiri ya tani 13 kwa kutwa. Utengenezaji wa chokaa hapa Tanzania ni - kama tunavyoona mara nyingi nyingine - shauri la bidii na nguvu za watu wengi na kazi nyingi; tena unafanywa mahali mbalimbali huko na huko. Kazi nyingi katika utaratibu wa utengenezaji wa chokaa si za ufundi na zinatimizwa na wafanya kazi wa muda tu wa vijiji vya palepale.
Ujuzi (wa kuchoma chokaa) wa wenyeji wenyewe ni hafifu tu, na kwa kweli katika bara za Tanzania hakuna desturi na mazoezi ya kufanya kazi hiyo toka zamani. Hata kwenye tanuru kubwa zaidi ujuzi wa namna ilivyoumbwa chokaa kadiri ya elimu kemistri haupatikani. Mahali papapotengenezwa chokaa panatumiwa siku kwa siku tu, bila kuangalia sana siku za mbele zaidi. Utengenezaji wa chokaa katika mahali padogopadogo unaonyesha kwamba hawana desturi ya kutimia vifaa (miti, makaa na mafuta) kwa utaratibu na polepole; kiasi kikubwa cha vitu hivyo vinapotea bure na havitumiwi kwa namna ya kuleta faida kubwa iwezekanayo.
Kiasi kikubwa zaidi ya chokaa kilicho kimetengenezwa tayari kinauzwa mahali (jimboni/mtaa) pale wanapokaa watengenezaji wenyewe. Mahali chokaa inapouzwa hasa panatawaliwa siku hizi na viwanda vikubwa viwili huko mji wa Tanga.
Tukiangalia namna na kiasi cha chokaa inavyotumiwa siku hizi, kifaa hicho kinaonekana kutokupendwa sana kwa ajili ya kujenga. Hata ingawa hali ya chokaa ni bora zaidi, watu wanavutwa zaidi kuchagua sementi kwa plasta. Sementi (udongo ulaya) inasababisha kwamba unafikiriwa kuwa mtu wa maana na mwenye cheo. Jambo kuu linaloshauriwa kwa Tanzania katika ripoti hiyo ni kuchunguza zaidi uwezekano wa kutengeneza matofali yaliyo mchanganyiko wa mchanga na chokaa pamoja.
V

Preface
Preface
The report laying in front of you is the result of more than one year of reading, talking, thinking and writing. The research it covers, has been executed for the purpose of takinga M.Sc. degree in International Technological Development Sciences at the faculty of Technology Management at the Eindhoven University of Technology, the Netherlands. The practical part of the research took place in Tanzania during the period April until November 1996. Base of operations was the National Construction Council in Dar es Salaam.
With this final report in my hands, I hope to have offered useful information out of the fragmented data with respect to the situation on lime in Tanzania.
The many impressions gathered in Tanzania still pass my mind every now and then (and will continue to do so in the future, I reckon). The crowded Kilwa road withits traders and coloured kangas wearing women. Maryland, the FM-club or the anthill-like Kariakoo market Numerous palmtrees in Mjimwema and only a single baobab in Mvumi-Ilinga. However, this is not the place to get sentimentaL
There are many people I would like to thank for supporting me during my stay in Tanzania and most important of them has been my supervisor in Dar es Salaam, Mr. J. Mamiro, for his actvice and suggestions 'in the field'.
I would like to thank Emilia van Egmond, Bert van Schaijk and Paul Laperre, my supervisors at the Eindhoven University of Technology, for their critica! notes and patience.
Furthermore, I would like to thank everyone at the lime production units who cooperated and contributed in my research. Especially James Kisarika for showing me his projects and driving me around with the Landrover through the fascinating vast sandy landscape of the central plains.
My appreciation tomzee Frans Bakker for the timehespent on the kiswahili summary.
I owe my family and friends for the letters they wrote and the encouragement they gave me. Of course, David, Donné and Frits: Thanks for showing me around during the first few weeks and Marco for writing 9 new songs. I would also like to thank Yerome and Warner ('the guys from E3') with whom I had a wonderful time in Kijitonyama. And thanks to everyone I have forgotten to mention here.
Finally, I cannot end this preface without thanking Natasja for her dedicated support.
Casper Esmeijer Eindhoven June 1997
vii
List of Contents
List of Contents
English Summary . . . . . . . . . . . . . . . . . . . . . . . . . . . . . . . . . . . . . . . . . . . . . . . . . . . . . . . i Ki h'l' s ... swa 1 1 ummary . . . . . . . . . . . . . . . . . . . . . . . . . . . . . . . . . . . . . . . . . . . . . . . . . . . . . 111
Preface . . . . . . . . . . . . . . . . . . . . . . . . . . . . . . . . . . . . . . . . . . . . . . . . . . . . . . . . . . . . . vii List of abbreviations ..................................................... x
Part One
Theoretica! Framewerk 1.1 Problem Definition ............................................. 2 1.2 Chemistry of Iime .............................................. 3 1.3 Objectives of the study . . . . . . . . . . . . . . . . . . . . . . . . . . . . . . . . . . . . . . . . . . 4
1.3.1 Target group 4 1.3.2 Definitions 4
1.4 Research question .............................................. 5 1.5 Framework ................................................... 5 1.6 Lay out of the report . . . . . . . . . . . . . . . . . . . . . . . . . . . . . . . . . . . . . . . . . . . 10
Part Two
National Environment Variables 2.1 Introduetion ................................................. 14 2.2 Socio-economie development in Tanzania . . . . . . . . . . . . . . . . . . . . . . . . . . . . 14
2.3
2.4 2.5 2.6
2.2.1 Shelter in Tanzania 15 2.2.2 Human Resources Natural Resources ............................................ . 2.3.1 Limestone 2.3.2 Wood and other fuels Infrastructure ............................................... . Government policies .......................................... . Concluding Remarks .......................................... .
15 18 18 19 21 22 25
Sectoral Environment Variables 3.1 Introduetion ................................................. 28 3.2 Construction materials industry . . . . . . . . . . . . . . . . . . . . . . . . . . . . . . . . . . . 28
3.2.1 Relevanee of the industry 28 3.2.2 R&D, Support and Organisation 29
3.3 Lime in Tanzania ............................................. 34 3.3.1 A short history 34 3.3.2 The use of lime in construction 37 3.3.3 Supply of lime 39
3.4 Demand for lime in Tanzania . . . . . . . . . . . . . . . . . . . . . . . . . . . . . . . . . . . . 40 3.4.1 Construction 40 3.4.2 Imports and Exports 43
3.5 Concluding remarks ........................................... 44
viii

List of Contents
The Lime Production Process 4.1 Introduetion . . . . . . . . . . . . . . . . . . . . . . . . . . . . . . . . . . . . . . . . . . . . . . . . . 46 4.2 Technology . . . . . . . . . . . . . . . . . . . . . . . . . . . . . . . . . . . . . . . . . . . . . . . . . . 46 4.3 Flow Chart . . . . . . . . . . . . . . . . . . . . . . . . . . . . . . . . . . . . . . . . . . . . . . . . . . 50 4.4 The Case Studies . . . . . . . . . . . . . . . . . . . . . . . . . . . . . . . . . . . . . . . . . . . . . 52
4.4.1 Mvumi Lime Factory - Dodoma 52 4.4.2 Hombolo Bwawani - Dodoma 56 4.4.3 Simba Lime Factory - Tanga 57 4.4.4 Super Amboni Lime Product - Tanga 60 4.4.5 Amboni Lime - Tanga 62 4.4.6 Ruhembe White Lime Project - Kigoma 63 4.4. 7 Th ree projects - Dar es Salaam 63 4.4.8 Magereza (Prisons) 64 4.4.9 Two proposed projects 65
4.5 International Developments . . . . . . . . . . . . . . . . . . . . . . . . . . . . . . . . . . . . . . 66 4.6 Concluding Remarks . . . . . . . . . . . . . . . . . . . . . . . . . . . . . . . . . . . . . . . . . . . 67
Part Three
Evaluation 5.1 Introduetion ................................................. 70 5.2 Effectiveness Characteristics ..................................... 70
5.3 5.4 5.5
5.2.1 Micro-Ievel effectiveness characteristics 5.2.2 Meso-Ievel effectiveness characteristics 5.2.3 Macro-Ievel effectiveness characteristics Production Capabilities ........................................ . Conclusions ................................................ . Recommendations ............................................ .
70 71 72 73 74 76
List of References ...................................................... 77
Epilogue . . . . . . . . . . . . . . . . . . . . . . . . . . . . . . . . . . . . . . . . . . . . . . . . . . . . . . . . . . . . 82
Annexes A: General information on Tanzania .................................... 2 B: Status of Geological Mapping ....................................... 6 C: Import statistics . . . . . . . . . . . . . . . . . . . . . . . . . . . . . . . . . . . . . . . . . . . . . . . . 17 D: Addresses of R&D and supporting organisations in Tanzania . . . . . . . . . . . . . . . 20 E: Questionnaire for contractors . . . . . . . . . . . . . . . . . . . . . . . . . . . . . . . . . . . . . . 21 F: Results from the contractors' questionnaire . . . . . . . . . . . . . . . . . . . . . . . . . . . . 25 G: Lime Production Units in Tanzania .................................. 29 H: Questionnaire for lime production units ............................... 31 I: Simba Lime Factory Electrical Equipment . . . . . . . . . . . . . . . . . . . . . . . . . . . . . . 38 J: Construction Materials- ISIC Codes ................................. 39 K: Illustrations and photographs . . . . . . . . . . . . . . . . . . . . . . . . . . . . . . . . . . . . . . . 40
i x
List of Abbreviations
List of abbreviations
AIS CO BRE BRU BS(I) c.i.f. DANIDA ESAMRDC ES CAP EUT FINNIDA GNP p.c. HQ IHS ISIC ITC ITDG JICA KVIC kWh LOl MIT MJ MWEM NBAQS&BC NCC NHC OXFAM PTA R&D SADC S&T STAM! CO SUDECO TBS TIB TIRDO TISCO TPCC tpd, tpm, tpy TSC UDSM UNCHS UNDP UNI DO
Agricultural and lndustrial Supplies Corporatien Building Research Establishment (U.K.) Building Research Unit (Tanzania) British Standards (Institution) cost, insurance, freight Danish International Development Assistance Eastern and South African Mineral Resource Development Centre Economie and Social Commission for Asia and the Pacific Eindhoven University of Technology Finnish International Development Assistance Gross National Product per capita Headquarters Institute for Housing Studies (the Netherlands) International Standard lndustrial Classification of all economie activities Institute for Earth Sciences and Aerial Photography (the Netherlands) Intermediate Technology Development Group Japanese International Cooperation Agency Khadi and Village Industries Commission (India) kilowatt-hom (1 kWh = 3.6 MJ) Loss On Ignition Ministry of Industries and Trade MegaJoule or: 106 Joule (1 MJ = 239 kcal= 948 Btu) (energy) Ministry of Water, Energy and Minerals National Board of Architects, Quantity Surveyers and Building Contractors National Construction Council National Housing Corporatien Development organisation (U.K.) Preferred Trade Area Research and Development South African Development Cooperation Science and Technology State Mining Corporatien Sugar Development Corporatien Tanzania Bureau of Standards Tanzania lnvestment Bank Tanzania lndustrial Research and Development Organisation Tanzania lndustrial Studies and Consulting Organisation Tanzania Portland Cement Company (at Wazo Hili) tonnes per day, tonnes per month, tonnes per year; referring to output Tanzania Saruji Corporatien University of Dar es Salaam United Nations Centre for Human Settlements United Nations Development Programme United Nations Industrial Development Organisation
x

PARTÜNE
Chapter 1
1 Theoretica} Framework
1.1 Problem Definition
The production of building materials is probably as old as the first attempt for man to seek shelter. Prehistorical structures were made of natural, non-processed materials using no or only simple tools. The discovery of techniques to produce more sophisticated materials made a contribution to the technological and socio-economie development of societies. The opposite is true as well. The development of societies created a need and possibilities for new materials and new production technologies.
The different pace and manner in which societies are developing has created various technologies and visions on technology in each society, which is reflected -among a lot of other things- in the way people construct their houses. Construction methods vary from region to region and from country to country. This can still be seen today in Europe, although regulations tend to fade away traditional building methods. The situation is more visible in Tanzania, where people are less mobile and organisation of the construction sector remains low. Every region still has its characteristic style of building.
The invention of new materials has -in genera!- improved housing conditions. However, on the basis of these inventions one fincts a physical and institutional infrastructure, which makes it possible and useful to make new materials. Inventors have benefited from institutions that provide knowledge, equipment, promotion, funds, demand, regulations etc. to come to an innovation in the construction sector.
In developing countries like Tanzania, such infrastructure is often not, or only partially, available. The situation with respect to institutions, as well as economie development, labour and resource endowments, is different in every country. Given the fact that all countries have a need for sufficient building materials to provide shelter for their people, it seems justified to promote materials of which the production, use and maintenance are adapted to the circumstances in a society.
The idea behind this, is the concept of appropriate technology. Frances Stewart gives a concise definition of appropriate technology; being a technology which is suited to the environment in which it is used1
• Much of the technology that is imported from actvaneed countries is seen as inappropriate because it either costs too much per workplace, creates too few jobs, involves an excessive scale of production or produces products that do not meet basic human needs.
A building material that can be manufactured using appropriate technology is lime. Almost every handbock on building materials in developing countries dedicates a chapter to the production and use of lime2
, suggesting a great future for the materiaL Before the development of cement, lime was used in many of the situations where cement is used today.
2
F. Stewart in: Carr, M. (ed.) The AT Reader; tlze01y and practice in appropriate technology, ITDG, London, 1985.
see for example: Spence, R.J.S., Cook, D.J. Building matenals indeveloping countries, Wiley, New York, 1983; and BRE, Building in hot climates, a selection of overseas building notes, Garston, UK, 1980.
Theoretica! Framework
However, in many applications lime is still considered a suitable replacement for cement, because it is easier to work with and lime requires a relatively simple production process which makes it cheaper and suitable for village-scale adoption.
Since not much is known about the production and application of lime in Tanzania at the momene, this study will address questions like if the technology is as appropriate as is suggested in the classic handhooks and whether it deserves attention as a low-cost building materiaL
In short, there is insufficient information on lime use and production and given the economical, geographical, technological and geological situation in Tanzania, which will be described in the following chapters, there is a need to study the potential indigenous lime industry. The need for developing this potential is stressed by several independent organisations4
•
1.2 Chemistry of lime
Lime is the final product in the lime production process. In its dry form it is a white powdery materiaL Whenever lime is mentioned in this report, it refers to hydrated or slaked lime. Chemica! formula: Ca(OH)I, sametimes in combination with Mg(OH)z. Quicklime is an intermediate product and is in fact a (mostly pulverised) calcined or burnt limestone. Chemica! formula: CaO, sametimes in combination with MgO.
Limestone is a natura! mineral resource and main input in the lime production process. Boynton5 refers to limestone as 'the most important and abundant of all sedimentary rocks and usually of organic origin'. Some of the limestone was deposited by natura! chemica! reactions or precipitated through plant and animal organisms (indirect). Direct precipitation through a saturated carbonate salution is caused by an increase in temperature or through evaporation. Limestone is primarily composed of calciumcarbonate (CaC03) or a combination of calciumcarbonate and magnesiumcarbonate (MgC03). Several varieties and purities of limestone exist. Pure calcium limestone consistsof 100% CaC03• The most occurring variety is dolomite. Pure dolomite consistsof 54.3% CaC03 and 45.7% MgC03• The ASTM6 makes a distinction between high-calcium limestone ( containing 0 to 5% MgC03), a magnesian limestone (containing 5 to 35% MgC03) and dolomitic limestone containing 35 to 46 % MgC03•
Reactions that occur during the lime production process (1 + 2) and in application (3):
6
calcination: CaC03(s) + heat ---+ CaO(s) + C02(g) (la) MgCOJ(s) + heat---+ MgO(s) + COlg) (lb)
hydration ar slaking: CaO(s) + H20(1) ---+ Ca(OH)2(s) + heat (2a) MgO(s) + H20(1) ---+ Mg(OH)2 + heat (2b)
Agevi, E., Ruskulis, 0., Schilderman, Th. (eds.) Lime and alternative binders in East Africa, IT Publications, London, 1995.
This study is executed for the National Construction Council, Dar es Salaam.
Boynton, R.S. Chemistry and technology of lime and limestone, Wiley & Sons, New York, 1966.
American Society of Testing Materials, designation C 51-90, Standard tenninology related to lime and limestone.
3
Chapter 1
carbonation: ea(OH)2(s) + e02(g) __. eae03(s) + H20(g) (3a) Mg(OH)2(s) + e02(g) __. Mge03(s) + H20(g) (3b)
Reactions la and lb are endothermic, i.e. energy is consumed in the form of heat. Reactions 2a and 2b are exothermic, i.e. energy is released in the form of heat. e02(g) is the chemica! notatien for carbondioxide gas and H20(1) is the chemica! formula for water in liquid form.
During calcination, the limestone is heated until it dissociates. Three aspects influence the calcination process. First, the temperature necessary for dissociation. Second, the period of heating and third, theevolving carbon dioxide gas, that should be able to escape. Atmospheric and e02 pressure influence these latter two aspects.
The dissociation temperature of eae03 is 898 °e at 1 atm. The dissodatien temperature for Mge03 is not exactly known, but dissodatien starts between 400 and 480 °e. Since the proportion of magnesium carbonate to calcium carbonate varies in the many species of limestone, the dissodatien temperature naturally also differs and is difficult to calculate. Differences in crystallinity and density add to the disparity of temperatures7
•
1.3 Objectives of the study
The objective of this study is to determine the state-of-the-art of the lime industry m Tanzania, with reference to the construction sector.
The key-issue is to gain insight in the application of lime in the construction sector and the production techniques employed to manufacture lime in Tanzania. The report will assess strengths and weaknesses and evaluate these to finally make recommendations with respect to points of interest and future developments.
1.3.1 Target group The target group for which this report is written, consists of policy makers and executives. The information 'from the field' that results from this study may serve as input for new polides and can be useful to develop new ideas. It is important background information for these who are engaged in the design and development of materials, but do not have the time and assets to dive into the matter deep enough. Furthermore, it will present useful information for the persons engaged in the production of lime in Tanzania and anyone working in or with the construction sector and dealing with materials.
1.3.2 Definitions Appropriate: suited to the environment in which it is used. In which the environment refers to Tanzania's physical, technological and socio-economical environment. An appropriate technology should make optima! use of the physical and technological environment and fit into the socio-economie and politica! environment. On the ether hand, it should satisfy the economie and social neects of the society.
Physical environment: refers to physical elements, such as infrastructure and resource endowments.
For more and elaborate information, see R.S. Boynton, 1966.
4

Theoretica/ Framework
Technological environment: the specific setting in which technology research, development, and implementation takes splace.
Socio-economie environment: body of human and financial means and capacities.
Politica} environment: conditions set by policy making and regulating institutions.
Process: transformation from resources into final products, here: transformation from limestone into hydrated or slaked lime.
Institution: a single organisation, established to fulfill a function in society with a collective or public interest.
Physical infrastructure: network of roads, railways, airports, electricity lines and telecommunications.
Institutional infrastructure: network of institutions.
Sector: all companies that share the same type or colleetien of endproducts or services.
Lime industry: all companies that are concerned with the production of lime or quicklime. The lime industry is part of ISIC 3692. No discriminatien on the basis of scale of production is made in this report.
Both nominations 'building materials' and 'construction materials' will be used in this report. They cover the same materials, which will be explained in the third chapter.
1.4 Research question
What is the state-af-the-art of the lime industry in Tanzania, in particu/ar for the constntction sector?
The research question should give notice to the actual state of the industry, the use of lime and its strong and weak points. Whenever possible, the reasans for the strengtbs and weaknesses will be explained. Throughout the study, questions that have to be answered are:
1. What are the characteristics of the lime production units in Tanzania?
2. How is lime applied in the construction sector in Tanzania and how much lime is applied?
3. Which are the secteral and national environment variables that influence or characterise the time industry in Tanzania?
1.5 Framework
This paragraph elaborates the analytica! framewerk that will be applied and that is designed to attend all points mentioned in the research questions. The analytica! framewerk is derived
5
Chapter 1
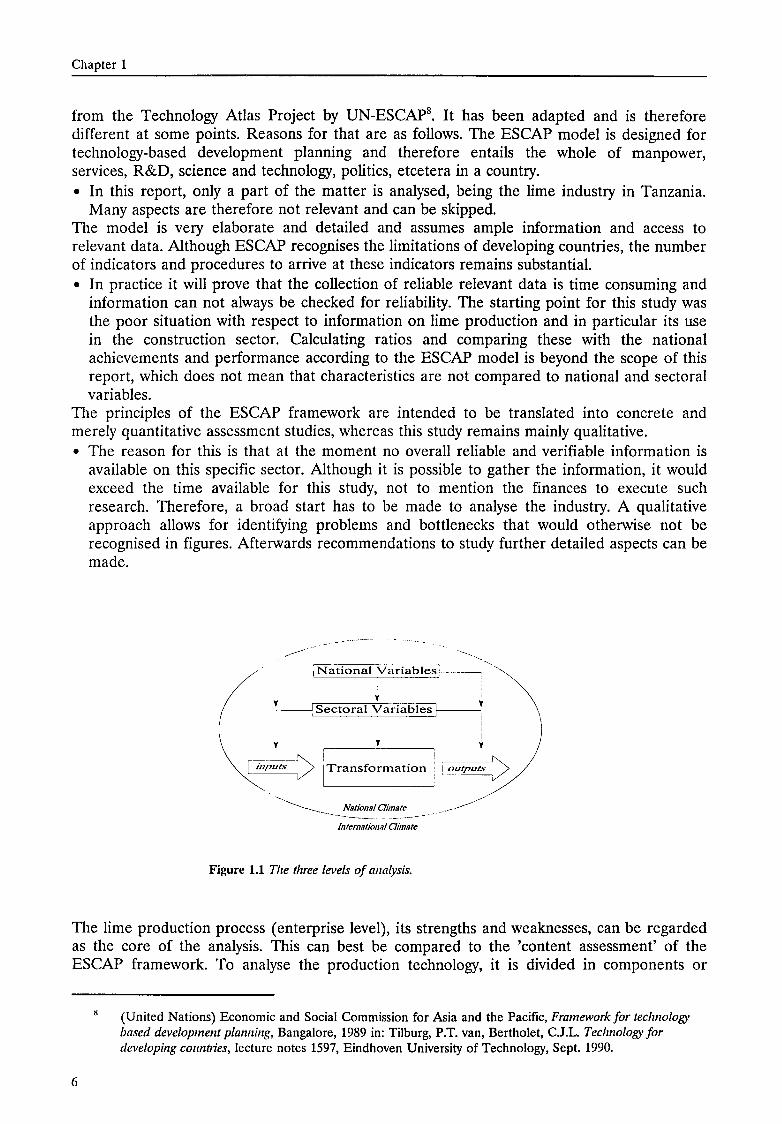
from the Technology Atlas Project by UN-ESCAP8• lt has been adapted and is therefore
different at some points. Reasons for that are as follows. The ESCAP model is designed for technology-based development planning and therefore entails the whole of manpower, services, R&D, science and technology, polities, etcetera in a country. • In this report, only a part of the matter is analysed, being the lime industry in Tanzania.
Many aspects are therefore not relevant and can be skipped. The model is very elaborate and detailed and assumes ample information and access to relevant data. Although ESCAP recognises the limitations of developing countries, the number of indicators and procedures to arrive at these indicators remains substantial. • In practice it will prove that the coneetion of reliable relevant data is time consuming and
information can not always be checked for reliability. The starting point for this study was the poor situation with respect to information on lime production and in particular its use in the construction sector. Calculating ratios and camparing these with the national achievements and performance according to the ESCAP model is beyond the scope of this report, which does not mean that characteristics are not compared to national and sectoral variables.
The principles of the ESCAP framework are intended to be translated into concrete and merely quantitative assessment studies, whereas this study remains mainly qualitative. • The reason for this is that at the moment no overall reliable and verifiable information is
available on this specific sector. Although it is possible to gather the information, it would exceed the time available for this study, not to mention the finances to execute such research. Therefore, a broad start has to be made to analyse the industry. A qualitative approach allows for identifying problems and bottlenecks that would otherwise not be recognised in figures. Afterwards recommendations to study further detailed aspects can be made.
(
- Y--,National :ariablesf--~
1 ~riablesl i
\ r-o--y->1 y . !. ~> ~~'uts 1Transformat1on i ! outputs
. ~ Nationa! C/imate ___ _ ----------- ---------~--- --
International C/imate
Figure 1.1 Tlze three levels of analysis.
The lime production process ( enterprise level), its strengths and weaknesses, can be regarded as the core of the analysis. This can best be compared to the 'content assessment' of the ESCAP framework. To analyse the production technology, it is divided in components or
6
(United Nations) Economie and Social Commission for Asia and the Pacific, Framework for teclznology based development planning, Bangalore, 1989 in: Tilburg, P.T. van, Bertholet, C.J.L. Technology for developing countries, lecture notes 1597, Eindhoven University of Technology, Sept. 1990.
Theoretica/ Framework
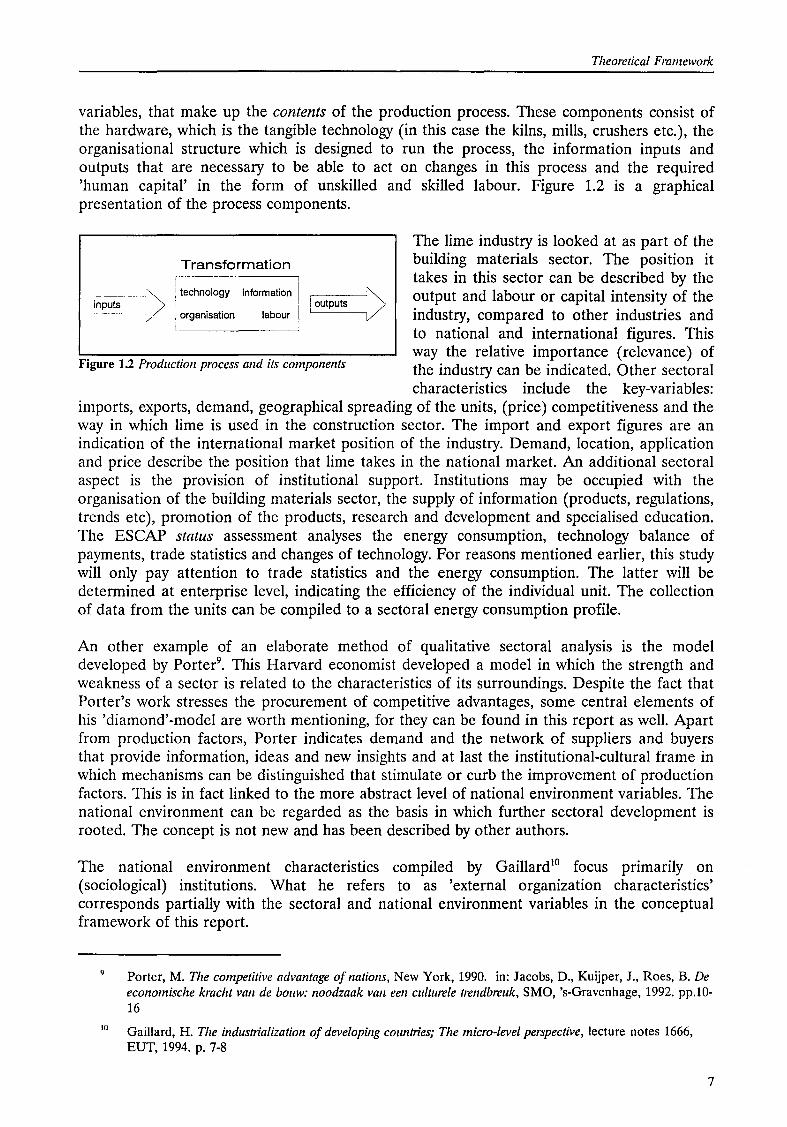
variables, that make up the contents of the production process. These components consist of the hardware, which is the tangible technology (in this case the kilns, mills, crushers etc.), the organisational structure which is designed to run the process, the information inputs and outputs that are necessary to be able to act on changes in this process and the required 'human capita!' in the form of unskilled and skilied labour. Figure 1.2 is a graphical presentation of the process components.
Transformation I : technology information
1
organisation Iabour I ,---_j['.._ !outputs )
Figure 1.2 Production process and its components
The Iime industry is looked at as part of the building materials sector. The position it takes in this sector can be described by the output and labour or capita! intensity of the industry, compared to other industries and to national and international figures. This way the relative importance (relevance) of the industry can be indicated. Other sectoral characteristics include the key-variables:
imports, exports, demand, geographical spreading of the units, (price) competitiveness and the way in which Iime is used in the construction sector. The import and export figures are an indication of the international market position of the industry. Demand, location, application and price describe the position that lime takes in the national market An additional sectoral aspect is the provision of institutional support. Institutions may be occupied with the organisation of the building materials sector, the supply of information (products, regulations, trends etc), promotion of the products, research and development and specialised education. The ESCAP status assessment analyses the energy consumption, technology balance of payments, trade statistics and changes of technology. For reasons mentioned earlier, this study will only pay attention to trade statistics and the energy consumption. The latter will be determined at enterprise level, indicating the efficiency of the individual unit. The collection of data from the unitscan be compiled to a sectoral energy consumption profile.
An other example of an elaborate method of qualitative sectoral analysis is the model developed by Porter9
• This Harvard economist developed a model in which the strength and weakness of a sector is related to the characteristics of its surroundings. Despite the fact that Porter's work stresses the praeurement of competitive advantages, some central elements of his 'diamond'-model are worth mentioning, for they can be found in this report as well. Apart from production factors, Porter indicates demand and the network of suppliers and buyers that provide information, ideas and new insights and at last the institutional-cultural frame in which mechanisms can be distinguished that stimulate or curb the impravement of production factors. This is in fact linked to the more abstract level of national environment variables. The national environment can be regarded as the basis in which further sectoral development is rooted. The concept is not new and has been described by other authors.
The national environment characteristics compiled by Gaillard10 focus primarily on (sociological) institutions. What he refers to as 'external organization characteristics' corresponds partially with the sectoral and national environment variables in the conceptual framework of this report.
9
Hl
Porter, M. The competitive advantage ofnations, New York, 1990. in: Jacobs, D., Kuijper, J., Roes, B. De economische kracht van de bouw: noodzaak van een culturele trendbreuk, SMO, 's-Gravenhage, 1992. pp.l0-16
Gaillard, H. The industrialization of developing countries; The micro-level perspective, lecture notes 1666, EUT, 1994. p. 7-8
7
Chapter 1
For the technology elimate of a country, ESCAP developed seven areas of indicators. They are: 1. status of socio-economie development
2. status of physical infrastructure and support facilities 3. stock of science & technology personnel and R&D expenditure 4. S&T performance in the production system 5. academie S&T performance 6. actvances and efforts in selected areas of specialisation 7. macro-level commitment to S&T for development
However, this is difficult to relate to actual practice. The indicators try to cover the whole economy, while only part of it is analysed in this report. In studying the lime industry, the scope can be narrowed significantly, without altering the intention of the model. The aspects that are relevant to the subject of this report will be called national environment variables and are limited to relevant socio-economie indicators, the housing situation, the stock of human resources, educational institutions and the natura! environment, the stock of natura! resources included. Government policies form a determining factor in the development of the sector at the national level. The policies reflect the neects and demand that come from within the society. Formulated needs are in most cases aimed at a desired situation and are an indication of the direction of development. ldeally, the needs, which are laid down in policies, should even be formulated one step ahead of the actual situation to function as an incentive for development.
In short, one could state that two aspects play a central role in this study. What means are available in a country (specifically for lime production) and what are the needs (quality and quantity of building materials) in the same society. The latter is composed of neects laid down in government policies11 and of the demand for lime in the construction sector.
Now that the process and its variables have been discussed it seems obvious to start with an evaluation of the industry, i.e. make a statement on the efficiency and effectiveness of the lime industry. Bertholet and Gaillard12 proposed a model in which the effectiveness characteristics of industrial enterprises are described. Three levels are discerned; macro, meso and micro socio-economie characteristics. •The first level refers to the 'interests of a nation' and assesses employment generation, direct and indirect, learning effects, profit spending, foreign dependence, income distribution, migration, the use of capita!, gross value added. •The second level gives attention to regional employment effects and regional mobility. •The micro level focuses on entrepreneur and personnet satisfaction, the market share or growth potential and profitability. An important missing issue is the proportion of environmental pollution accounted for by the enterprise and/or the extend to which pollution is prevented. The underlined effectiveness characteristics are attended in this report. Apart from the four process components (figure 1.2), they are deduced from the economy and ecology of the transformation process and the influencing sectoral and national environment variables.
The effectiveness characteristics, i.e. the extent to which means and neects connect, can be regarded as a translation of technological capabilities. Which means that the necessary increase in effectiveness (bridging gaps) should be established through techno logica!
11
12
8
ES CAP (1989) distinguishes 'Operational objectives' and 'Guiding objectives' of which the former focuses on actions and the latter on the principles upon which certain actions should be based.
in: ibid. and Iecture notes 1538, lndustrial organizations in developing countries by H. Gaillard.
Theoretica! Framework
capabilities. A lack of capabilities inhibits the increase in effectiveness; or to put it in a different way, binders development13
• This requires a definition of the term capabilities. The ESCAP framework defines a country's capabilities as a combination of: 1. the ability to search for and select the chosen technology, 2. the ability to master the chosen technology, 3. the ability to adapt and improve this technology, 4. the ability to create new technology. This is basically a national resources analysis, based on natura! resources, human resources, information and technology. Many other definitions for technological capabilities can be found in literature. Lall 14 states that 'capability development is determined, at the national level, by the policy regime on trade and industry and by investments in skills, information flows, infrastructure and supporting institutions'. Van Engelen15 points out that 'a lack of local capabilities refers to a shortage of managerial and technica! manpower, whilst a lack of appropriate supporting institutions emphasizes the inadequate provision of research and development support and infrastructure.' Biggs, Shah and Srivastava 16 define technological capabilities as the information and skilis -technica!, managerial and institutional - that allow productive enterprises to utilize equipment and technology efficiently. Such capabilities are in general sector and firm specific. Technological development is the process of building up such capabilities, according to these authors.
Many definitions exist and many authors have dealt with the capabilities issue. Each definition applies to a specific subject or context. For this report the same narrowing should take place, to make a statement on technologkal capabilities. Biggs, Shah and Srivastava come very close with their definition, which shows similarities with the ESCAP description. Consictering the relevant aspects in the analysis of the lime industry leads to the following formulation: Sufficiently developed technological capabilities enable an enterprise to 1) produce, 2) reinvest and 3) innovate in such a way as to be able to meet the demands and needs in a society. The attention will be focused on the first step, so that capabilities make possible the effective handling and rnanaging of the technology and the production process in such way as
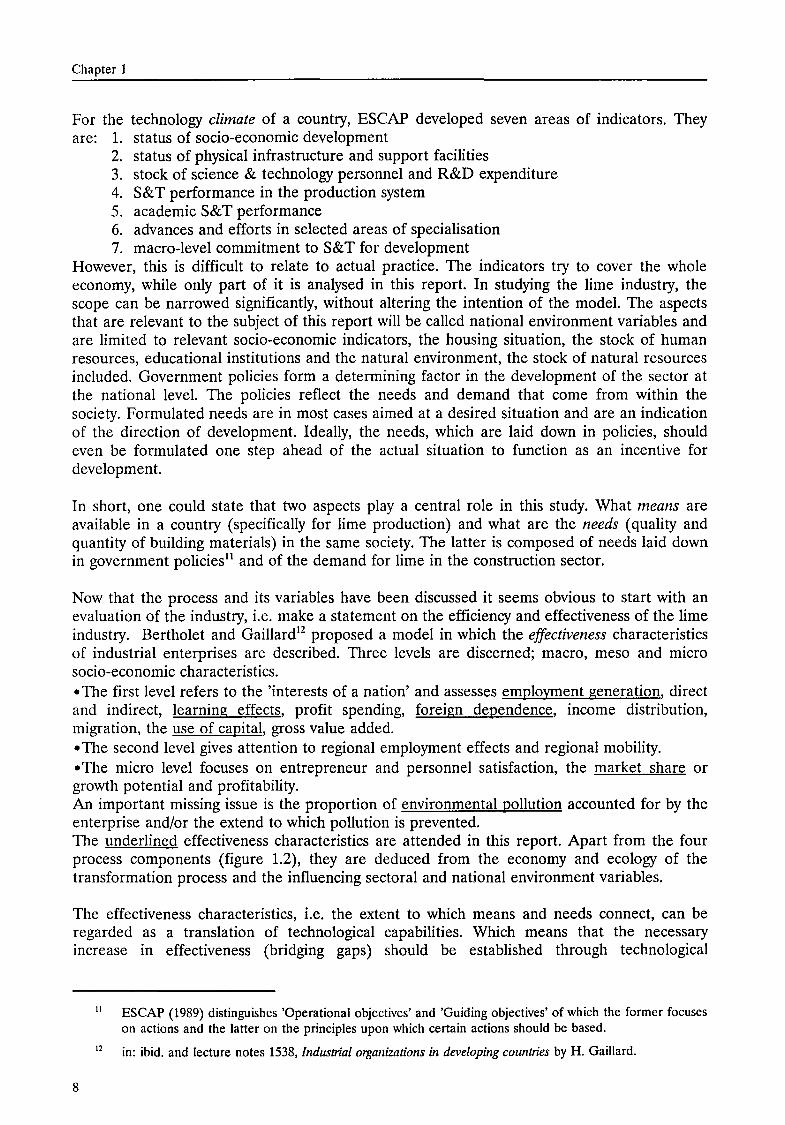
means needs !
~~~--___ _j
to achieve the desired output quality and quantity necessary to meet the demands and needs. Therefore, the expression 'production capabilities' will be used throughout the report. The 'drive' to a successive higher level -from production to re-investment to innovation- is urged by society, expressed in stricter requirements and demands.
n,1tional environment
lf the industry is capable of fulfilling the requirements and satisfying the demand, it is assumed that the sectoral as well as the national environment variables have contributed positively in this achievement. This
international environment
Figure 1.3 Conceptual framework.
13
14
15
compare: a fertile soil enables a flower to grow to its full capacity.
Lall, S. Promoting Technology Development: The role of technology transfer and indigenous effOJt, in: Third World Quarterly, vol.14, no. 1, 1993. pp.95-108
Engelen, D.M. van, Pub/ie policy making and the rise and fall of the Tanzanian Manufacturing Sector, M.Sc thesis, EUT, July 1996. p.72
Biggs, T., Shah, M., Srivastava, P. Technological capabilities and leaming in Afi·ican enterprises, World Bank technica! paper 288, Washington D.C., 1995. p.16
9

Chapter 1
reasoning is not completely correct. However, in the case of a 100% indigenous industry in which no foreign counterpart participates, and which consists of only small-scale enterprises, this assumption comes close to reality. The influence of sectoral or national variables will come to the surface in the case studies.
Summarizing the above, one can state that many models exist which all contain at least some relevant aspects for analysing the lime industry. These aspects have been selected and incorporated in the framework that is adopted to analyse and evaluate the lime industry in Tanzania. Figure 1.3 depiets a graphical presentation of the framework.
The international environment is dealt with only to illustrate the national Tanzanian situation. The information presented in the report will be more comprehensible when compared to information from other countries. The international environment will not be treated elaborately however.
1.6 Lay out of the report
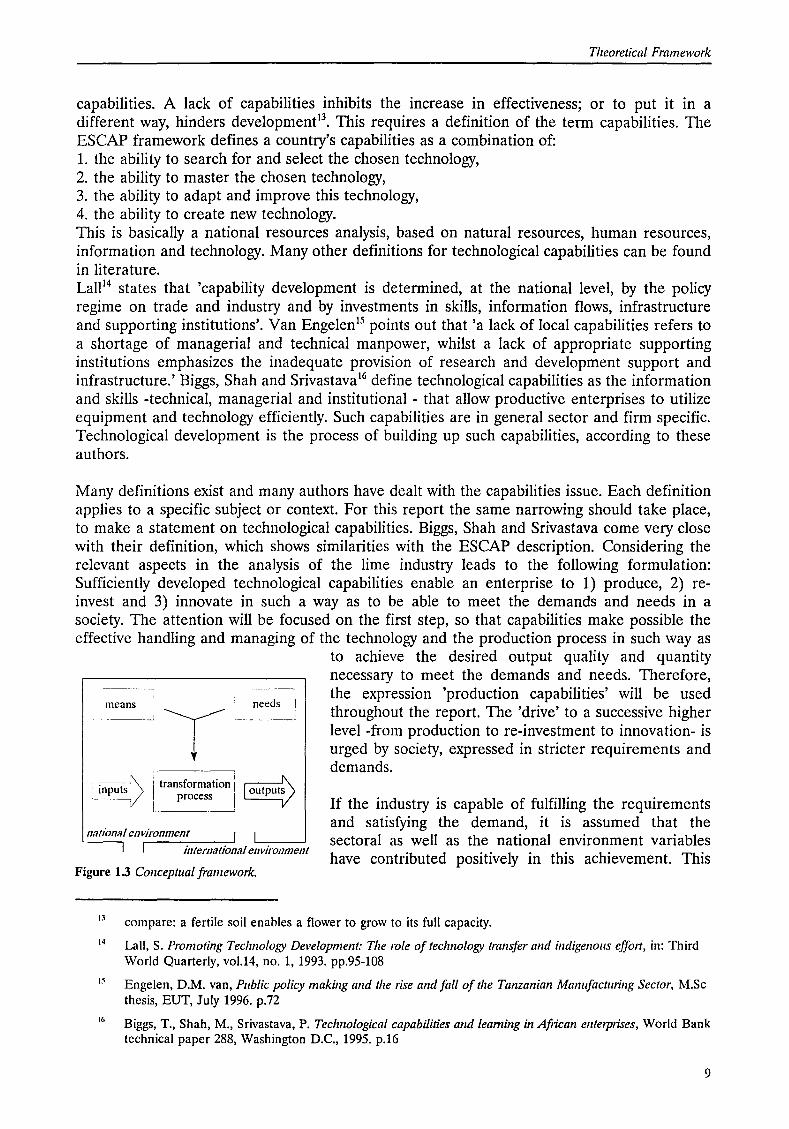
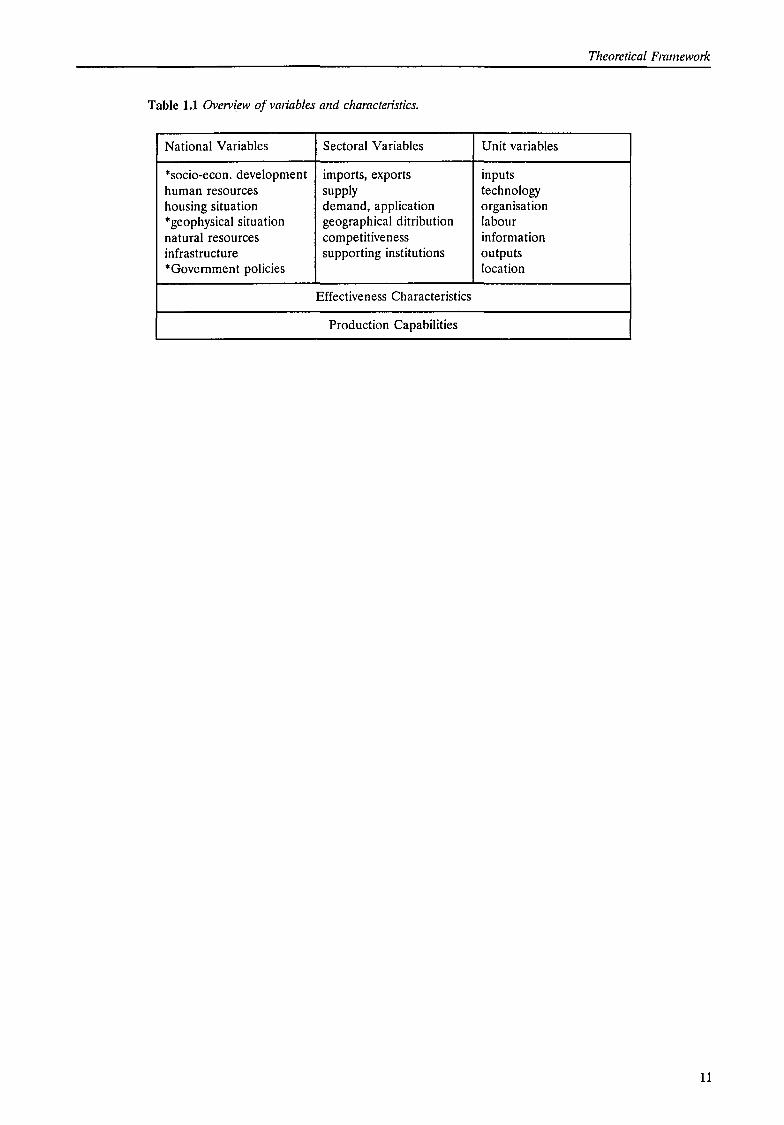
This paragraph elaborates the division of the report. The chapters are named according to the concepts mentioned in the previous paragraph. It was outlined that the contents of each chapter deviate from the original ESCAP set-up. An overview of the variables and attention points and their location in the report is given in table 1.1. The report consists of three parts. The first part camprises the research framework (this chapter), the second part contains the three 'core' chapters ( chapter 2 to 4) and the third part contains the evaluation ( chapter 5). Chapter 2. National Variables. Some socio-economie indicators are compared to Sub-Sahara
African indicators, as well as from the Netherlands. The development status, development path and geophysical situation are given as far as these are relevant.
Chapter 3. Sectoral Variables. Apart from a short history on Tanzanian lime production and an assessment of its relevance, an attempt is made to set up a model for determining the demand for lime in the construction sector. To gather information on the use and availability of lime, building contractors in Tanzania have been consulted. A close look at imparts and exports is taken in the final paragraph of this chapter.
Chapter 4. The Lime Production Process. In which the process technology is explained, its different varieties and the fuel consumption. Report of 2 elaborate case studies, 5 less elaborate ones and 2 proposed lime factories. A lime factory in Malawi and a modern European lime kiln will be described.
Chapter 5. Evaluation. In this final chapter the effectiveness characteristics and production capabilities are assessed. The chapter will be composed of information from the preceding chapters.
Every chapter starts with a brief introduetion of the information that will be presented and is round off with a summary of the information, if necessary provided with some remarks.
10
Theoretica/ Framework
Table 1.1 OveTView of variables and characteristics.
National Variables Sectoral Variables Unit variables
*socio-econ. development imports, exports inputs human resources supply technology housing situation demand, application organisation *geophysical situation geographical ditribution Iabour natura! resources competitiveness information infrastructure supporting institutions outputs *Government policies location
Effectiveness Characteristics
Production Capabilities
11


Chapter 2
2 National Environment Variables
2.1 Introduetion
In this chapter the national environment variables relevant for the lime industry will be discussed. The chapter aims at giving a contiguous overview that is composed in accordance with suggestions made by persons in the field as well as in literature.
In the first paragraphs, a general outline of the economie development of Tanzania is given. Social development indicators are highlighted. Among these, the lack of adequate shelter, growth of the popuiatien and the limited 'stock' of human capita! are the most important. Educational institutions are reviewed to give an indication of their output in terms of skilied manpower. Only these schools and colleges will be treated that have a relation with the construction sector. A short overview of the country's infrastructure is given. The natura! environment, including the resource endowments, is another national variable. lt is setting boundaries for the development of the technology. There is a mutual impact which is given attention. Limestone and wood resources are assessed in two subparagraphs. In the final part of this chapter, relevant policies are examined for the development objectives set by the government and its ministries.
2.2 Socio-economie development in Tanzania
Indicators on the socio-economie development of Tanzania will give an overview of its position compared to the Sub-Saharan Region and the Netherlands. This background information is meant to give an idea of the differences between a socalled developing country and a developed country. Annex A gives general background information on Tanzania.
14
Table 2.1 An ove1view of selected indicators. source: World Development Report 1995 and 1996.
Tanzania Sub-Saharan Netherlands Africa
GNP per capita (US$) 140 460 22,010 GDP growth '90-'94 (%) 3.1 0.9 1.5 Agriculture % of GDP 57 20 3 Manufacturing % of GDP 8 15 18 Exports - Imports (million $) -1,212 -21,698 16,649
Population (millions) 28.8 571.9 15.4 Population growth (%) 3.0 2.7 0.7 Urban Pop. growth (%) 6.4 4.8 0.8 People I km2 30 24 416

PARTTWO

National Environment Variables
2.2.1 Shelter in Tanzania Tanzania is divided into 20 mainland regions each consisting of more districts. Together, there are 104 districts in Mainland Tanzania 1• Dar es Salaam is by far the largest city in Tanzania, counting 2.3 million inhabitants2 and a population growth rate of 4.3%. The second largest town is Mwanza where 321,000 people are living. The population growth for Mwanza accounts for 7.2%. Arusha has the highest growth rate being 9.5% with a population of 153,000. I t is estimated that between 40-70% of the urban population of Tanzania lives in squatter settlements3
• Most of the houses built in these areas lack basic services. In Dar es Salaam, only 6% of all houses is connected to sewerage. Another 22% is connected to water. 53% makes use of pit-latrines for sewage disposal.
Kyessi4 states that 'housing structures in both rural and urban settlements continue to be in poor condition due to low individual savings and lack of mortgage facilities especially for the poor. Sustainable human settlements and adequate shelter for all need to be promoted in order to imprave the social, economie and environment quality of settlements and the living and working environments of all people in particular the urban and the rural poor.' The Tanzania Housing Bank, that used to be the main public financial institution providing mortgages and loans, went bankrupt in 1995. Of all construction problems mentioned by households, those related to financing are the most urgent5
• Smali-scale informal contractors experience the same problem, since their souree of capital consists mainly of actvaneed payments made by the client6
• The problem of financing is directly related to the price of building materials and the costs of labour.
2.2.2 Human Resources No reliable data on manpower in the construction industry in Tanzania is readily available as is stated by the NCC7
• The same publication reports that there appears to be an overall shortage of skilied manpower in this sector. Registered professionals for the year 1993 accounted forsome 953 people. This group consisted of 781 engineers, 125 architects and 47 quantity surveyors. However, there are still many unregistered professionals in industry.
Registered building contractors for the year 1992, were some 1126 against 988 in 1991. In 1995 some 1070 local contractors were registered, 114 architects and 50 quantity surveyors8
•
There were 227 civil contractors in 1992 compared to 66 in 1991 and the stock of consultants accounted for some 110 against 101 in 1991. It has to be noted that foreign firms played a
7
with 'Mainland' is meant the Republic of Tanzania without Zanzibar, Pemba and Mafia lslands.
figures from: Ardhi/CHS Proceedings of the urban and housing indicators workshop held at Ardhi Institute, Dar es Salaam, Tanzania, 26-27th September 1995, in preparation of the HABITAT II Conference City Summit, Istanbul, June 1996.
Kyessi, A.G. Overview of Human Settlements and Shelter Development and management in Tanzania, in: Seminar on innovative bamboa construction technologies, CHS/Ardhi, Dar es Salaam, April 1996. p.6
ibid. p.S
Treffers, M. The infonnal building process for houses in Dar es Sa/aam, Tanzania, M.Sc. thesis, EUT, July 1996. p. 89
97% according to: Tegelaers, M. Peifonnance upgrading of infonnal building contractors in Dar es Sa/aam, M.Sc. thesis, EUT, August 1995. p. 53, 63-64
NCC, Eleventh Annual Report and Accounts for tlze Year Ended June 30, 1993, Dar es Salaam, 1994. p.lO
National Board of Architects, Quantity Surveyars and Building Contractors (T), Registered Architects, Quantity Surveyars and Building Contractors as at 31-12-1995, Dar es Salaam, 1996.
15
Chapter 2
leading role in the execution of civil works in Tanzania, which is mainly caused by a shortage in capacity of local contractors. The building sub-sector however, was dominated by local firms.
A large part of all construction activities is covered by the informal sector9• This is the case in
the production of building materials as well10• Many people build their houses on a self-help
basis 11•
The growth of the 'stock' of skilied manpower in construction each year can be indicated by the number of graduates from the various training institutions in Tanzania. Most important are the University of Dar es Salaam and the University College of Lands and Architectmal Studies, the farmer Ardhi Institute. Dar es Salaam, Mbeya and Arusha also have a Technica! College. Vocational training eentres are to be found all over the country, providing courses for various crafts.
University of Dar Es Salaam 12•
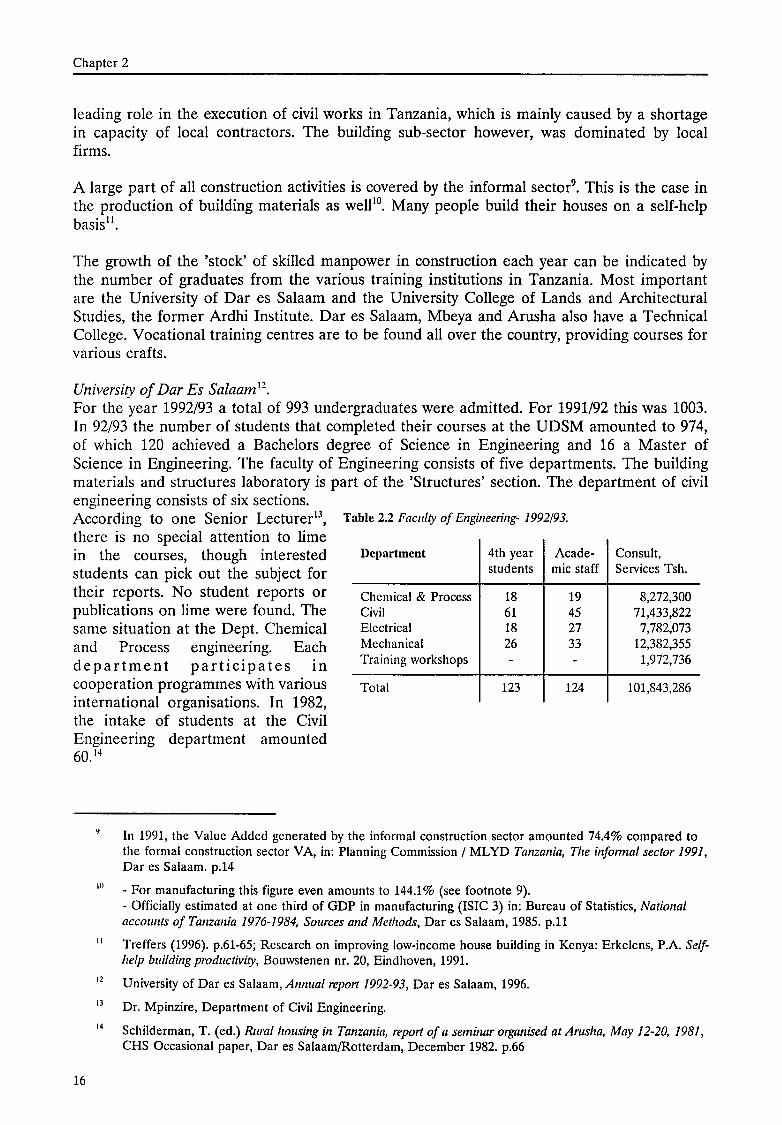
For the year 1992/93 a total of 993 undergraduates were admitted. For 1991!92 this was 1003. In 92/93 the number of students that completed their courses at the UDSM amounted to 974, of which 120 achieved a Bachelors degree of Science in Engineering and 16 a Master of Science in Engineering. The faculty of Engineering consists of five departments. The building materials and structures Iaberatory is part of the 'Structures' section. The department of civil engineering consists of six sections. According to one Senior Lecturer13, Table 2.2 Faculty of Engineeling- 1992!93.
there is no special attention to lime in the courses, though interested students can piek out the subject for their reports. No student reports or publications on lime were found. The same situation at the Dept. Chemica! and Process engineering. Each department part1c1pates in cooperation programmes with various international organisations. In 1982, the intake of students at the Civil Engineering department amounted 60.14
Department
Chemical & Process Civil Electrical Mechanical Training workshops
Total
4th year students
18 61 18 26
123
Acade-mie staff
19 45 27 33
124
Consult, Services Tsh.
8,272,300 71,433,822 7,782,073
12,382,355 1,972,736
101,843,286
In 1991, the Value Added generated by the informal construction sector amounted 74.4% compared to the forma i construction sector V A, in: Planning Commission I ML YD Tanzania, The infonnal sector 1991, Dar es Salaam. p.14
10
11
12
13
14
16
- For manufacturing this figure even amounts to 144.1% (see footnote 9). - Officially estimated at one third of GDP in manufacturing (ISIC 3) in: Bureau of Statistics, National accounts of Tanzania 1976-1984, Sourees and Methods, Dar es Salaam, 1985. p.ll
Treffers (1996). p.61-65; Research on improving law-ineome house building in Kenya: Erkelens, P.A. Selfhelp building productivity, Bouwstenen nr. 20, Eindhoven, 1991.
University of Dar es Salaam, Annual report 1992-93, Dar es Salaam, 1996.
Dr. Mpinzire, Department of Civil Engineering.
Schilderman, T. (ed.) Rural housing in Tanzania, report of a seminar organised at Arusha, May 12-20, 1981, CHS Occasional paper, Dar es Salaam/Rotterdam, December 1982. p.66
National Environment Variables
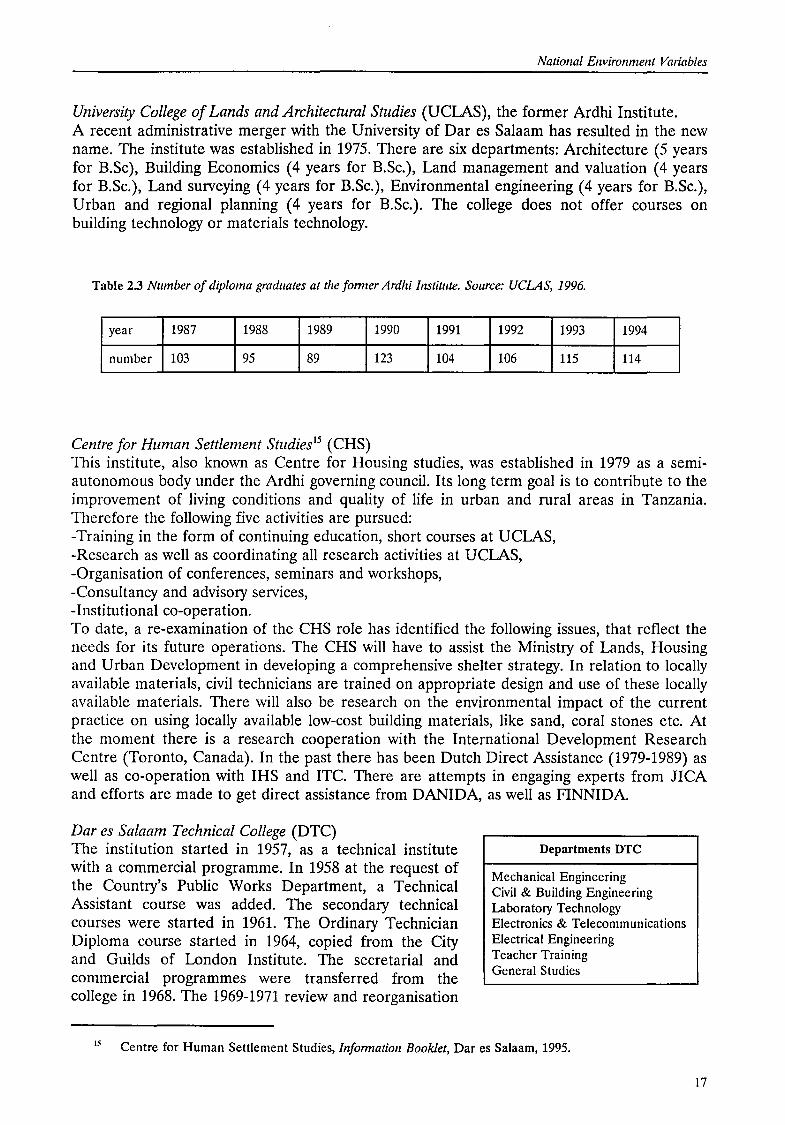
University College of Lands and Architectural Studies (UCLAS), the former Ardhi Institute. A recent administrative merger with the University of Dar es Salaam has resulted in the new name. The institute was established in 1975. There are six departments: Architecture (5 years for B.Sc), Building Beonornies (4 years for B.Sc.), Land management and valuation (4 years for B.Sc.), Land surveying (4 years for B.Sc.), Environmental engineering (4 years for B.Sc.), Urban and regional planning (4 years for B.Sc.). The college does not offer courses on building technology or materials technology.
Table 2.3 Nlunber of diploma graduates at the fonner Ardhi Institute. Source: UCLAS, 1996.
year 1987 1988 1989 1990 1991 1992 1993 1994
number 103 95 89 123 104 106 115 114
Centre for Human Settiement Studies 15 (CHS) This institute, also known as Centre for Housing studies, was established in 1979 as a semiautonomous body under the Ardhi governing council. lts long term goal is to contribute to the impravement of living conditions and quality of life in urban and rural areas in Tanzania. Therefore the following five activities are pursued: -Training in the form of continuing education, short courses at UCLAS, -Research as well as coordinating all research activities at UCLAS, -Organisation of conferences, seminars and workshops, -Consultancy and advisory services, -Institutional co-operation. To date, a re-examination of the CHS role has identified the following issues, that reflect the needs for its future operations. The CHS will have to assist the Ministry of Lands, Housing and Urban Development in developing a comprehensive shelter strategy. In relation to locally available materials, civil technicians are trained on appropriate design and use of these locally available materials. There will also be research on the environmental impact of the current practice on using locally available low-cost building materials, like sand, coral stones etc. At the moment there is a research cooperation with the International Development Research Centre (Toronto, Canada). In the past there has been Dutch Direct Assistance (1979-1989) as well as co-operation with IHS and ITC. There are attempts in engaging experts from JICA and efforts are made to get direct assistance from DANIDA, as wellas FINNIDA.
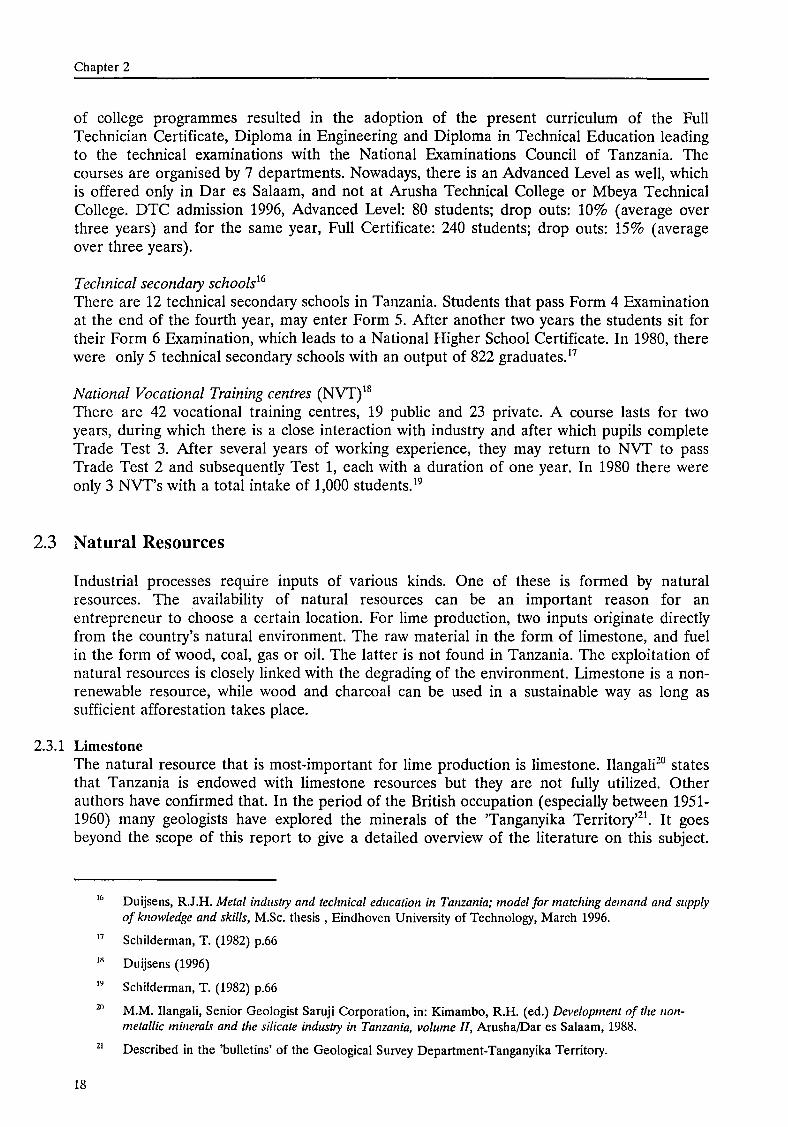
Dar es Sa/aam Technica[ College (DTC) The institution started in 1957, as a technica! institute with a commercial programme. In 1958 at the request of the Country's Public Works Department, a Technica! Assistant course was added. The secondary technica! courses were started in 1961. The Ordinary Technician Diploma course started in 1964, copied from the City and Guilds of London Institute. The secretarial and commercial programmes were transferred from the college in 1968. The 1969-1971 review and reorganisation
Departments DTC
Mechanical Engineering Civil & Building Engineering Labaratory Technalagy Electranies & Telecammunicatians Electrical Engineering Teacher Training General Studies
15 Centre far Human Settiement Studies, Infonnation Booklet, Dar es Salaam, 1995.
17
Chapter 2
of college programmes resulted in the adeption of the present curriculum of the Pull Technician Certificate, Diploma in Engineering and Diploma in Technica! Education leading to the technica! examinations with the National Examinatiens Council of Tanzania. The courses are organised by 7 departments. Nowadays, there is an Actvaneed Level as well, which is effered only in Dar es Salaam, and not at Arusha Technica! College or Mbeya Technica! College. DTC actmission 1996, Actvaneed Level: 80 students; drop outs: 10% ( average over three years) and for the same year, Pull Certificate: 240 students; drop outs: 15% (average over three years).
Technica! secondary schools16
There are 12 technica! secondary schools in Tanzania. Students that pass Porm 4 Examinatien at the end of the fourth year, may enter Porm 5. After another two years the students sit for their Porm 6 Examination, which leadstoa National Higher School Certificate. In 1980, there were only 5 teehoical secondary schools with an output of 822 graduates. 17
National Vocational Training eentres (NVT)18
There are 42 vocational training centres, 19 public and 23 private. A course lasts for two years, during which there is a close interaction with industry and after which pupils complete Trade Test 3. After several years of werking experience, they may return to NVT to pass Trade Test 2 and subsequently Test 1, each with a duration of one year. In 1980 there were only 3 NVT's with a total intake of 1,000 students. 19
2.3 Natoral Resources
Industrial processes require inputs of various kinds. One of these is formed by natural resources. The availability of natural resources can be an important reason for an entrepreneur to choose a certain location. Por lime production, two inputs originate directly from the country's natura! environment. The raw material in the form of limestone, and fuel in the form of wood, coal, gas or oil. The latter is not found in Tanzania. The exploitation of natura! resources is closely linked with the degrading of the environment. Limestone is a nonrenewable resource, while wood and charcoal can be used in a sustainable way as long as sufficient afforestation takes place.
2.3.1 Limestone The natura! resource that is most-important for lime production is limestone. Ilangali20 states that Tanzania is endewed with limestone resources but they are not fully utilized. Other authors have confirmed that. In the period of the British occupation ( especially between 1951-1960) many geologists have explored the minerals of the 'Tanganyika Territory'21
• It goes beyond the scope of this report to give a detailed overview of the literature on this subject.
16
17
IX
IY
20
21
18
Duijsens, R.J.H. Meta/ industry and technica/ education in Tanzania,· model for matching demand and supply of know/edge and skil/s, M.Sc. thesis , Eindhoven University of Technology, March 1996.
Schilderman, T. (1982) p.66
Duijsens (1996)
Schilderman, T. (1982) p.66
M.M. llangali, Senior Geologist Saruji Corporation, in: Kimambo, R.H. (ed.) Development of the nonmetallic minerals and the silicate industry in Tanzania, volume IJ, Arusha/Dar es Salaam, 1988.
Described in the 'bulletins' of the Geological Survey Department-Tanganyika Territory.
National Environment Variables
Annex B gives an up-to-date list of geological maps available at the Geological Survey in Dodoma. These maps serve as indications from where to start more specific qualitative and quantitative explorations when serious mineral exploitation is considered. Probably the most extensive list of limestone occurrences in Tanzania is summarised by Kimambo22
• This list is mainly based on literature from the Geological Survey Department
Quarrying of limestone, through open pit quarry, bas the disadvantage of leaving open areas in the landscape (land degradation). Unless attention is paid to the re-use of these open pits, they form a distartion in the natura! surroundings. According to Shaghude, Mutakyahwa and Mohamed23
, the impact can be very complicated. They describe in a very worrying report that the coastline changes in Tanzania are caused by natura! and anthropogenic (man made) factors. Of this last group a few of the reasoos for coastal erosion are the quarrying of beach rocks and limestone for house construction, which is common in some places, and in Zanzibar the mining of coral limestone for lime making. The report also mentions that the blasting of rocks, e.g. limestone at Wazo Hili, Dar es Salaam for industrial purposes (cement production), creates land instability leading to landslides, which can be a reason for coastal erosion. Griffiths24
, referred to in the same report, states that she analysed both the Register of Mines and the Rent Claim ledger and found only very few claims in spite of the fact that a lot of sand extraction along the beaches north of Dar es Salaam had taken place over the years. This indicates that most of the sand extraction was taking place illegaliy. Attempts from the Ministry of Lands, Housing and Urban Development to stop these illegal activities were of very little success.
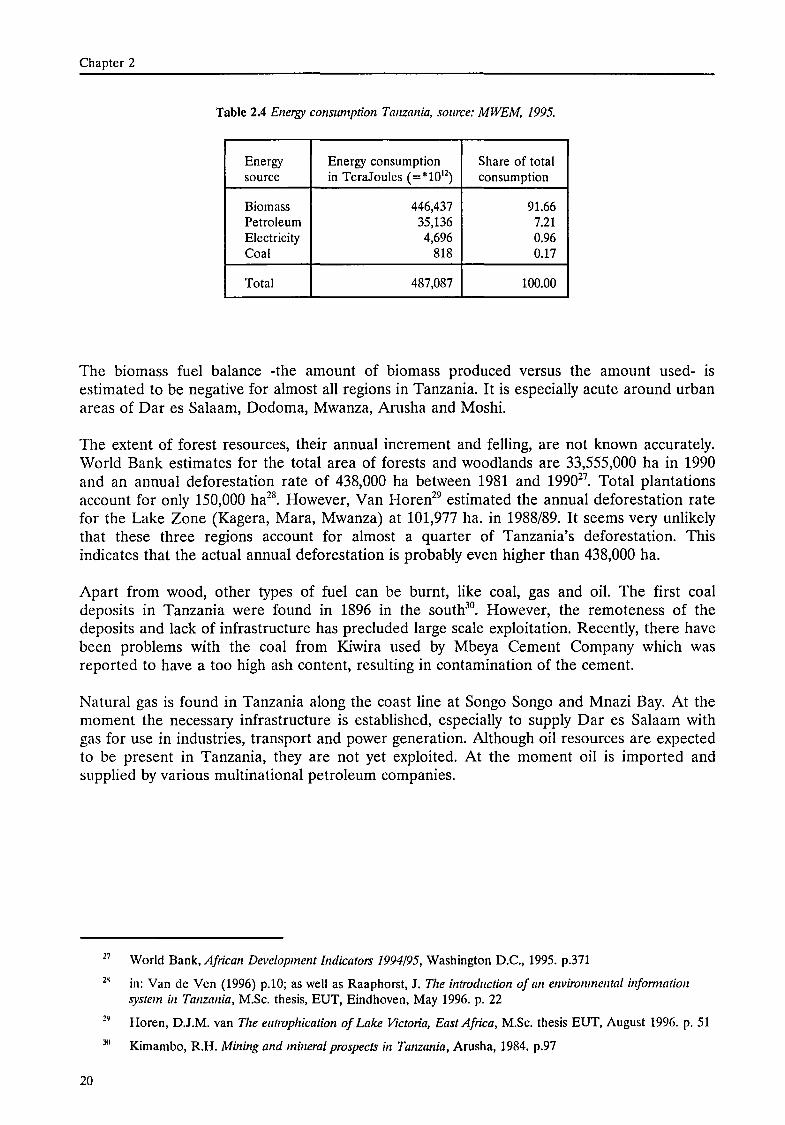
2.3.2 Wood and other fuels The situation with respect to wood that is used as fuel in many smali-scale activities is slightly different from that of limestone. Most smali-scale lime burning uses woodfuel as their souree of energy25
• It is by far the most widely used fuel in Tanzania. Biomass accounted for 92 percent of all final energy consumption in Tanzania in 1989 and will continue to dominate the national energy balance for the near future26
• Biomass camprises fuelwood as weli as charcoal from plantation forests and natura! forests, agricultural residues and wastes. The Ministry of Water, Energy and Minerals gives the foliowing overview (table 2.4).
22
23
24
2S
26
Kimambo, R.H. (ed.) Development of tlze non-metallic minerats and the silicate industry in Tanzania, vol /1, Eastern Africa Publications, Arusha/Dar es Salaam, 1988. p.337-365
Shaghude, Y.W., Mutakyahwa, M.K.D., Shufaa K. Mohamed National report on tlze status of coastal erosion, sea-level changes mzd tlzeir impacts, Tanzanian case, in: IOC Workshop report no.96, suppl 1, p.85, UNESCO, 1994.
Griffiths, C.J., Report for National Environmental Management Council by Beac/z Erosion Monitoring Committee, Dar es Salaam, 1987.
Sawe, N. Bioenergy based industries in Tanzania, Ministry of Water, Energy and Minerals, Dar es Salaam, 1995. See also chapter 4.
Ministry of Water, Energy and Minerals, The Energy Policy of Tanzania, Dar es Salaam, 1992.
19
Chapter 2
Table 2.4 Energy consumption Tanzania, source: MWEM, 1995.
Energy Energy consumption Share of tata! souree inTeraJoules (=*1012
) consumption
Biomass 446,437 91.66 Petroleum 35,136 7.21 Electricity 4,696 0.96 Co al 818 0.17
Tata! 487,087 100.00
The biomass fuel balance -the amount of biomass produced versus the amount used- is estimated to be negative for almast all regions in Tanzania. It is especially acute around urban areas of Dar es Salaam, Dodoma, Mwanza, Arusha and Moshi.
The extent of forest resources, their annual increment and felling, are nat known accurately. World Bank estimates for the total area of forests and woodlands are 33,555,000 ha in 1990 and an annual deforestation rate of 438,000 ha between 1981 and 199027
• Total plantations account for only 150,000 ha28
• However, Van Horen29 estimated the annual deforestation rate for the Lake Zone (Kagera, Mara, Mwanza) at 101,977 ha. in 1988/89. It seems very unlikely that these three regions account for almast a quarter of Tanzania's deforestation. This indicates that the actual annual deforestation is probably even higher than 438,000 ha.
Apart from wood, other types of fuel can be burnt, like coal, gas and oil. The first coal deposits in Tanzania were found in 1896 in the south30
• However, the remoteness of the deposits and lack of infrastructure has preelucled large scale exploitation. Recently, there have been problems with the coal from Kiwira used by Mbeya Cement Company which was reported to have a toa high ash content, resulting in contamination of the cement.
Natura! gas is found in Tanzania along the coast line at Songo Songo and Mnazi Bay. At the moment the necessary infrastructure is established, especially to supply Dar es Salaam with gas for use in industries, transport and power generation. Although oil resources are expected to be present in Tanzania, they are nat yet exploited. At the moment oil is imported and supplied by various multinational petroleum companies.
27
2X
3U
20
World Bank, African Development Indicators 1994!95, Washington D.C., 1995. p.371
in: Van de Ven (1996) p.lO; as weU as Raaphorst, J. The introduetion of an environmental infomwtion system in Tanzania, M.Sc. thesis, EUT, Eindhoven, May 1996. p. 22
Horen, D.J.M. van The eutrophication of Lake Victoria, East Africa, M.Sc. thesis EUT, August 1996. p. 51
Kimambo, R.H. Mining and mineral prospects in Tanzania, Arusha, 1984. p.97
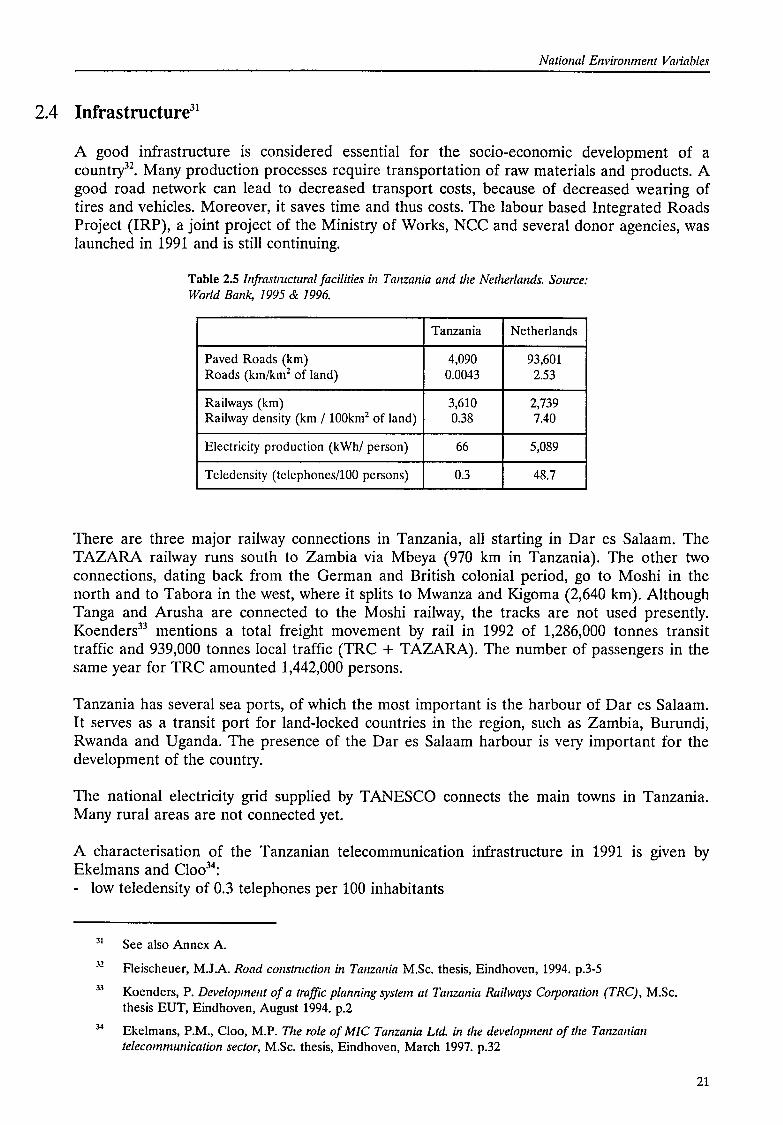
--------- --- -------------------------------------------,
National Environment Vmiables
2.4 Infrastructure31
A goed infrastructure is considered essential for the socio-economie development of a countlj2
• Many production processes require transportation of raw materials and products. A goed road netwerk can lead to decreased transport costs, because of decreased wearing of tires and vehicles. Moreover, it saves time and thus costs. The Iabour based Integrated Roads Project (IRP), a joint project of the Ministry of Works, NCC and several donor agencies, was launched in 1991 and is still continuing.
Table 2.5 lnfrastmctural facilities in Tanzania and the Netlzerlands. Source: World Bank, 1995 & 1996.
Tanzania Netherlands
Paved Roads (km) 4,090 93,601 Roads (km/km2 of land) 0.0043 2.53
Railways (km) 3,610 2,739 Railway density (km I 100km2 of land) 0.38 7.40
Electricity production (kWh/ person) 66 5,089
Teledensity (telephones/100 persons) 0.3 48.7
There are three major railway connections in Tanzania, all starting in Dar es Salaam. The TAZARA railway runs south to Zambia via Mbeya (970 km in Tanzania). The ether two connections, dating back from the German and British colonial period, go to Moshi in the north and to Tabora in the west, where it splits to Mwanza and Kigoma (2,640 km). Although Tanga and Arusha are connected to the Moshi railway, the tracks are not used presently. Koenders33 mentions a total freight movement by rail in 1992 of 1,286,000 tonnes transit traffic and 939,000 tonnes local traffic (TRC + TAZARA). The number of passengers in the same year for TRC amounted 1,442,000 persons.
Tanzania has several sea ports, of which the most important is the harbeur of Dar es Salaam. It serves as a transit port for land-locked countries in the region, such as Zambia, Burundi, Rwanda and Uganda. The presence of the Dar es Salaam harbour is very important for the development of the country.
The national electricity grid supplied by TANESCO connects the main towns in Tanzania. Many rural areas are not connected yet.
A characterisation of the Tanzanian telecommunication infrastructure m 1991 is given by Ekelmans and Cloo34
:
- low teledensity of 0.3 telephones per 100 inhabitants
31
31
33
34
See also Annex A.
Fleischeuer, M.J.A. Raad constmction in Tanzania M.Sc. thesis, Eindhoven, 1994. p.3-5
Koenders, P. Development of a traffic planning system at Tanzania Railways Corporation (TRC), M.Sc. thesis EUT, Eindhoven, August 1994. p.2
Ekelmans, P.M., Cloo, M.P. Tlze ro/e of MIC Tanzania Ltd. in the development of the Tanzanian telecommunication sector, M.Sc. thesis, Eindhoven, March 1997. p.32
21
Chapter 2
- low supply of lines, only 37% of the demand was satisfied - relatively small growth, 7% of the telephone netwerk - many unsuccessful calls due to limited capacity of the netwerk - many faults due to inadequate maintenance
Although the infrastructure in Tanzania is developing rapidly, still many parts of the country are difficult to reach. The future outlook however, is positive given the present efforts in developing the country's infrastructure. The IRP is accompanied by training of the local contracting industry. lts success and sustainability depend to a large extent on this industtj5
•
2.5 Government polides
Policies aim at a desired situation and in this paragraph the direction or development path the national government intends to fellow to reach this situation will be examined. Relevant policy documents are: - The Rolling Plan and Forward Budgee6
·37
- National Construction Industry Development Strategy - National Environmental Action Plan
In August 1996, the fourth Rolling Plan and Forward Budget was issued by the Planning Commission. It is described as the major annual statement of the Government's development strategy, economie targets and budgetary projections and surpasses other lower level policies. The document is updated every year, however policy statements are based on a langer term perspective. The policies in relevant areas in the fourth edition of the RPFB are exactly the same as in the third edition. Recently, the government has decided to reduce its role in productive activities and to emphasize private sector development. Still, the Tanzanian Government states that it will need to provide the necessary economie services and infrastructure to enable development of productive activities by the private sector.
The RPFB distinguishes several sectors: productive sectors, economie services, social services, administration and cross-seetaral issues. Of relevanee for this report are the industrial sector and minerals belonging to the first group, construction which belengs to the secend group and housing which is part of the third group. For all separate sectors it applies that the main objective is to increase output and the share in the overall economy through more efficiency and improved capacity utilisation. Other objectives are the expansion of employment opportunities, an increase and diversification of the sourees of export earnings, eneauraging the best use of scarce resources and to proteet the natural environment from industrial pollution.
In the industrial sector the lack of provision of supporting infrastructure or the reliability of these services as well as technica! and management skilis at firm level are mentioned to cause difficulties for they are nat developed to face market competition. To promate smali-scale and medium scale industries, credit facilities and infrastructural support services will be provided,
35
36
37
22
NCC, Eleventh Annual Repo1t and Accounts for the Year Ended June 30, 1993, Dar es Salaam, 1994. p.ll
Planning Commission/Ministry of Finance, The Rolling Plan and Fonvard Budget for Tanzania for the period 1995/96-1997/98, volume 1, Dar es Salaam, August 1995.
Planning Commission/Ministry of Finance, The Rolling Plan and Fonvard Budget for Tanzania for the period 1996/97-1998/99, vol.1, Dar es Salaam, August 1996. (yet unpublished)
National Environment Vmiables
regulatory obstacles will be eased and environmentally sound technologies encouraged. Local industrial research and development institutions will be strengthened by providing them with adequate facilities and qualified personnet The issue of quality and standards will greatly be emphasized in the liberalisation trend that is set in motion.
The RPFB states that the mining sector is becoming an important foreign exchange earner for the country. However, it is recognised that the mining sector (principally diamonds and gold) is still constrained by marketing problems, as well as a lack of funds, smuggling, inadequate infrastructure, lack of skilied manpower and supply of modern tools and laboratories. The lack of reliable and accurate data is slowing down development of this sector. To promate private sector participation geological, geochemica! and geophysical investigations for obtaining basic data on mineral occurrences in the country will have to be carried out. The Mineral Resource Department will establish comprehensive guidelines and regulations to ensure human and physical environment protection. Areas that will be given high priority are mineral explorations, geological mapping, dissemination of information on potential mineral deposits and proteetion and conservation of the environment.
The objective for the construction industry during the period for which the RPFB is valid, will be to develop a self-sustainable construction industry. Therefore, the development and efficiency of local contractors and consultants will be promoted and improved. They will be trained in bath Iabour and capital intensive techniques. Research and development will constitute a substantial part in stimulating this.
Publicly owned housing is managed mainly by the National Housing Corporation, which has since 1990 absorbed the activities of the Registrar of Buildings (Ministry of Lands, Housing and Urban Development). The parastatal Tanzania Housing Bank used to be the main financial institution providing mortgages, but this bank went bankrupt in 1995. The objective of the housing 'sector' is to ensure that all Tanzanians have decent shelter. Reviewing the regulatory laws and encouragement of housing cooperatives should ensure the supply of building plots and eventually an increase in private sector housing development and provision.
At the moment, the only valid policy with respect to the construction industry is the National Construction Industry Development Strategf839 (NCIDS). Apart from some general objectives as to increase efficiency and productivity the NCIDS aims at ensuring an even distribution of capacity for construction, technica! services, manufacture and standardisation of construction materials, equipment and tools throughout the country. Research will be promoted into all aspects of the industry and the optimum documentation, dissemination and application of the research findings will be ensured. Apart from that, the NCIDS states that construction materials production activities at alllevels where economically appropriate will be encouraged. The optimum utilisation and development of local design, construction and construction materials in order to achieve self-sufficiency through optimum exploitation and use of local resources will be promoted.
Two interesting objectives are to establish relevant standards and regulations and enforce usage through a centrally coordinated system; and to streamline the composition and activities of all advisory and regulatory bocties to ensure their optimum level of performance and relevance.
39
Ministry of Works, National Constmction Jndustry Development Strategy Dar es Salaam, February 1991.
Ministry of Works, Proposed National Consintelion Development Strategy, draft, Dar es Salaam, 1995.
23

Chapter 2
With respect to minimum requirements, the NCIDS proposes design manuals that prescribe these minimum requirements of quality in the construction industry. It announces that efforts are being undertaken by the TBS and the BRU to prepare codes of practice, design manuals and guidelines.
In the future, foreign contractors and donor agencies shall be encouraged to make increasing use of the local construction capacity through joint ventures or sub-contracting. It will be necessary to increase the availability of the required resources for the construction industry particularly by developing the national capacity to produce and make use of locally available resources.
Production and manufacture of materials locally has had many problems. In the first place, little effort has been made on research and exploitation of naturally occurring materials. Secondly, operational probieros occasioned by machine breakdowns and the lack of basic services such as water, electricity and fuel have been identified as the major causes of under utilisation of the few available plants. In addition, there is no adequate organisation for production of locally available materials such as aggregates and lime to meet demand and quality. Steps that will be taken to alleviate the probieros of materials availability are as follows. 1. more concerted effort will be made to promate the use of suitable naturally occurring
materials and to boost local production of these materials 2. establishment of the new and expansion of the existing production eentres for materials
such as tools, cement, sheet glass, bricks and ceramics will be carried out on a decentralised basis mainly for the purpose of cutting down on transportation casts of bath raw materials and finished products
3. more concerted effort will be made to educate people on the use of locally available materials and guidelines on standards and quality control for producing and using the materials shall be given
4. means to enhance availability of foreign exchange shall be sought for the importation of adequate materials which are nat locally produced.
A remarkable passage in the document reads as follows; 'it is recognised by Government that there exists in Tanzania a generally low level of productivity resulting from a lack of motivation, particularly in the public sector. The recently introduced policy of motivating workers to increase their productivity will be continued and enhanced. This is considered to be an essential factor in the development of an efficient and cast effective construction industry.'
Research activities will focus on -among other subjects- optimum utilisation of local materials to minimise casts and dependenee on imported materials, development of appropriate production technologies to suit local conditions, identification of materials and components suitable and available for indigenous manufacture.
The scope of the National Environmental Policy40 is braad, since it involves almast all sectors. Probieros include deforestation and soil erosion, air and water pollution and disturbance of vegetation and wildlife. Among the list of objectives one finds that the policy aims at raising public awareness and understanding of the essential linkages between environment and development and tries to promate individual and community participation in environmental action.
40 Vice President's Office, National Environmental Policy, Dar es Salaam, February 1996. (draft)
24
National Environment Variables
The document acknowledges that science and technology have a central role in the exploitation, processing and utilisation of natura! resources and in the resulting environmental impacts. The technology used has a hearing in the quality of a product and in the type and amount of the resulting waste and emissions. Environmentally sound technologies are technologies that proteet the environment, are less polluting, use all resources in a more sustainable manner, recycle more of their waste and products and handle residue wastes in a more acceptable manner than the technologies for which they are a substitute.
The policy objectives with respect to industry and trade are the prevention, reduction, control and limitation of damage and administration of the risk from the generation, management, transport, handling and disposal of haphazard wastes, other wastes and emissions. An important measure promotes the widespread use of environmental impact assessment (EIA) as an essential element in industrial planning and development of assessing the effects of potentially harmful activities on the environment.
2.6 Condoding Remarks
In the first paragraph of this chapter a general indication is given on the characteristics of Tanzania as a developing country. Knowledge on the background of a country remains essential if one wants to analyse a single detail like the lime industry. Therefore, information on shelter, human resources, natura! resources and infrastructure is given. The actual state of the lime industry is not determined or influenced by a single aspect, but by a variety of factors. The variables given in this chapter are not exclusively related to the building materials industry or the lime industry and are therefore difficult if not impossible to influence by actars in these industries. The variables presented here form the frame in which the development of the lime industry takes place.
A large part of the Tanzanian population is lacking basic needs like decent shelter. It is not an easy task to imprave that situation. The Global Strategy for Shelter to the year 2000, adopted by the United Nations General Assembly, recognises building materials as one of the key physical resources in the production and impravement of shelter and identifies several priority action areas to support local production and the use of indigenous building materials41
• This is confirmed by other reports in which financing was indicated as the major problem in finding decent shelter. Construction materials constitute the major part of the construction costs and thus form the first aspect that can be economised.
To produce materials, knowledge is required. Apart from technica! knowledge, one has to know which materials are demanded and how the production should be managed. The human resource situation in Tanzania is unclear. The number of higher level graduates from the University and Technica! Colleges is not a promising figure given the size of the country and population growth. The number of schools for higher education is limited. Educated people form the basis for self-reliance in many sectors. It should be noted that most industrial activities that attract educated people will take place in the larger cities; the same places where the education facilities are. Human capita! will show a movement towards cities where the challenges can be found. Smali-scale and village scale technologies therefore tend to get less attention.
41 NCC, Seminar on dornestic capacity building in the production of construction materlafs in Tanzania, Dar es Salaam, 1994.
25
Chapter 2
The geophysical situation of Tanzania, with respect to the production of building materials, has some favourable characteristics. The raw material necessary for lime production is available in the country in sufficient qualities and quantities. This means that for the manufacture of lime no basic raw materials have to be imported. Moreover, local production has the advantage of little transport costs.
Wood, the main type of fuel used in the lime production process, is becoming scarce in Tanzania. Worrying figures on deforestation are presented in the preceding paragraphs. The actual situation is not sustainable and efforts should be undertaken to change this situation, otherwise a shortage will lead to higher prices. Low-income householcts will be the first victims of such a development. Consequently, lime producers have to get their woodfuel from further away and they will be forced to raise the price of their product to cover expenses.
The physical infrastructure is still in a premature state. Although the NCC, Ministry of Works and some foreign counterparts embarked on the Integrated Roads Project (IRP), the density of paved roads is still low. Telecommunications and electricity connections face the same lowdensity situation.
The RPFB formulates policies in a long term perspective. They should be viewed as general policies, that need to be specified by the ministries concerned. The way in which each ministry translates the general policies into action plans determines the actual effect of the policies. The government has decided to reduce its role in productive activities, which mainly comes down to the parastatal sector reform, i.e. privatizing parastatal companies. There are no parastatal lime factories in Tanzania.
It should be acknowledged that the plans that are formulated in the NCIDS all sound very promising. The constraints that face the construction sector are recognised in the NCIDS. The action plan, which is part of the strategy, dedicates a paragraph to construction materials. However, actions are formulated more in terms of objectives than as specificly outlined operations. An example of this is: 'In order to decentralise the production of construction materials and to reduce transportation costs, smali-scale local industries will be enhanced and their levels and range of production developed'42
• One would expect that an action plan indicates how this should be done.
The National Environmental Policy indicates that awareness exists at government level on the major environmental problems. The cross-seetaral character of those problems complicates a structured approach and a detailed strategy for tackling these complications is still missing.
Shemakame43 mentions problems that still affect the set up of machinery on industrial development. According to him, they can be found in terms of: a) database and information flow. The inadequate working relationship between researchers, investors and policy makers prevents proper formulation of strategies for the development of the construction industry. The interaction between the main actors should be facilitated so that there can be proper promotion and monitoring of the construction industry in a coherent and integrated manner. Effective monitoring and promotion activities eaU again for solid
42
43
26
Annex A, Action Plan§ 6.1.2.
Shemakame, M.M. Production of construction matenals as a policy in Tanzania, Min. of lnd. & Trade, in: NCC, Seminar on capacity building in the production of construction matenals in Tanzania, Dar es Salaam, 1994.

Nationa/ Environment Variables
databases on occurrence and quanturn of available construction materials and technology developments sofar. In most cases research findings on low-cost housing materials are not available to manufacturers. In short, there is a lack of information network.
b) standardisation and design con trol. Quality in construction is closely associated with the level of technological development in a country. As a result of dependency and preferenee for Iabour intensive construction methods in Tanzania, the desired levels of quality are difficult to achieve. This situation is aggravated by the introduetion of foreign designs and foreign contractors who prefer building materials from where they come from. This hinders progress in building materials impravement and production in the country.
With respect to these problems it should be noticed however, that Iabour intensive production has not in itself a negative influence on the desired quality of products. lt is the quality ( determined by skills, attitude, knowledge) of the Iabour that determines the final quality of the products. Hiring unskilled Iabour therefore requires extra efficient quality management. Contractors are forced to meet certain standards and regulations (if not officially required, it is because of security). Therefore they will use high quality materials.
27
Chapter 3
3 Sectoral Environment Variables
3.1 Introduetion
The Tanzanian lime industry can be considered as part of the building materials sector, although it also produces for other industries. Paragraph 3.2 elaborates the building materials sector, which is not officially recorded as such, its relevanee in Tanzania and its position compared to other sectors. Organisations that are involved in R&D and support of the industry are described. Recent developments as well as past experience and experiments are reported in the next paragraph. The application of lime in the construction sector will be reviewed. The paragraph that deals with the demand for lime will focus on the demand in construction, for which a simple model for roughly determining this demand is set up. Other industries that use lime and the imports and exports will be examined in paragraph 3.4.
3.2 Construction materials industry
The main difficulty one encounters when studying the construction materials industry is that it is not captured in one ISIC code and thus can not be found in statistics as one sector.
3.2.1 Relevanee of the industry The contribution of the construction sector (ISIC 5) to GDP (at 1979 constant prices) was 7.5% in 19941
• Kisanga2 states that the construction sector consumes more than 95% of the building materials production. The share of building materials in the construction sector is estimated by the same author to be about 60%, which makes the estimated share of the building materials industry 4.5% of GDP. Treffers3 even mentions an 80% contribution for materials to the total construction costs in the informal sector and roughly 20% for the fundi.
This is an indirect way of determining what the position of the building materials industry in the total of industrial production in Tanzania is. A direct way of calculating is not easily found as was concluded by Van de Ven4
• Still, it would be interesting to know what the relative weight of this industry is.
The following table gives an overview of various sectors that harvest building materials production. This division is based on UNID05
• The volume of production for these sectors is not equivalent for all building materials production. However, a very large part of all
28
Bureau of Statistics, Nationa/Accounts of Tanzania 1976-1994, Dar es Salaam, August 1995. (calculated from p. 11; p.12 is a rounded figure)
Kisanga, A. U. Tlze challenge faced by the building materlafs industry in the developing countries in the 1990s, with special reference to Tanzania, Habitat Int. vol.14, no.4, 1990. pp.119-132
Treffers, M. The infonnal building process for houses in Dar es Sa/aam, Tanzania, M.Sc. thesis, EUT, July 1996. p.100
Ven, H. van de, Assessment of the sustainability of tlze smal/scale brick-buming induslly in Tanzania, with special attention to biomass energy use, M.Sc. thesis, EUT, July 1996. p.53
UNIDO, The building materlafs industry indeveloping countries; an analytica/ appraisal, Sectoral Studies Series, no.16 vol.1, January 1985.
Sectoral Environment Variables
Table 3.1 Sectoral production of building materials. Source: Bureau of Statistics, 1990.
!SIC Gross Output Production Yalue Added Depreciation NYA Casts
3311 247,3155 182,0291 652,864 152,760 500,104 3521 1,010,242 1,010,094 148 43,375 -43,227 3691 1,355,174 1,583,112 -227,938 57,902 -285,840 3692 3,770,026 3,051,048 718,978 2,289,394 -1,570,416 3699 577,233 303,980 273,253 40,010 233,243 3710 n.a. n.a. n.a. n.a. n.a. 3720 11,082,895 10,055,038 1,027,857 166,492 861,365 3813 454,157 306,163 147,994 13,014 134,980
Total 20,722,882 1,8129,726 2,593,156 2,762,947 -169,791
x lUUU Tsh.
construction materials is captured by these groups. The result (table 3.1) is indeed distorted though gives some idea about the size of the Tanzanian building materials industry. It should be noted that all the companies involved in the survey are forma!, where a lot of production takes place in the informal sector. Apart from that, not all entrepreneurs have their business registered at the Bureau of Statistics, because they did not take the time or effort to do so. In Annex J, figures forcement and paint production in Tanzania are given.
3.2.2 R&D, Support and Organisation R&D institutes provide innovations, knowledge and know-how in the building materials sector. Product innovation and exploration of new methods of production and manufacturing contribute to the country's capacity to adapt and adopt technologies. The functioning of institutions that are occupied with research and development is an indication of the state of the sector. Furthermore, new developments require coordination. Collective interests, like Iabour agreements, regulations, subsidies, but also research, require organisation of a sector. In this paragraph the objectives of various institutions are indicated and where possible the actual activities. In practice, it is hard to judge on the merits of each organisation and this has not been the intention. Limitations of the institutes involved were in most cases highlighted by the persons interviewed. Some research and support institutes provide training and education as well. An overview of the addresses of the organisations described in this paragraph is given in annexE.
The Civil Engineering Department at the Faculty of Engineering (UDSM) provides facilities for testing building materials (mechanica} tests). The building materials Iabaratory is one of the few commercial testing laboratories. At least 19 out of 45 class one contractors6 carried out more than one test at this Iabaratory between January 1993 and August 19967 (18 class one contractors out of 34 in Dar es Salaam only). None of these tests concerned lime or lime mortar, which was confirmed by the head of the building materials and structures laboratory8
•
The building materials Iabaratory received the largest sum of money from tests compared to other departments at the university9
• This could be an indication that there is a demand for
Registered by the National Board of Architects, Quantity Surveyars and Building Contractors, as at 31-12-95.
University of Dar es Salaam, Building Matenals Test Reports 1993-1996, unpublished.
Dr. A. Mrema, Senior Lecturer.
See table 2.1
29
Chapter 3
adequately equipped laboratories in Tanzania. The Geology Department, Faculty of Science, is involved in research and survey activities and can perform tests on rock, mineral stones and soil.
Central Matenals Laboratory 10• This is the Iabaratory of the Ministry of Works. It started
eperating in 1958, though it is only recently that they started performing tests and giving consultancy on a commercial basis. In September 1996 new equipment was installed, which makes it a modern laboratory. Mechanica! as well as chemica! tests can be done. A materials database is being set up (October 1996). Most of the tests done so far were related to roads improvement, which was the main activity of the Ministry. Because this Iaberatory is in a transitional phase, not much can be said about its past performance or future expectations.
Santji11/Wazo Hill Laboratory. This Iabaratory is part of the Tanzania Portland Cement Company in Dar es Salaam. In the laboratory, chemica} mineral analyses can be performed and the laboratory has the disposal of an X-ray defractometer ( although only a limited number of minerals can be handled). Testing is done on a commercial basis, though only on a small-scale. The tests are mainly done for internal quality control on raw materials and cement clinker. The cement factories carry out their own minerals exploration. Mineral tests can also be performed at the Tanga and Mbeya cement factories.
In 1986-1989 there has been a trial production at this cement factory of 'masonry cement', which is a cement that contains up to 30% extra lime, 68% (Portland) cement clinker and gypsum additives. This type of masonry mortar is very common in Europe12
• The idea was to decrease demand for low strength cement applications, which ought to relief some pressure on the regular OPC production. About 3,000 tonnes were produced, though the material proved to be not popular. Almost nothing of the trial production was sold, and the material was slowly blended with cement clinker for normal OPC production.
One of the technica! probieros involved in production was the required fineness of the masonry cement, which should be 4000 cm2/gr Blaine13
, where OPC neects only 2800-3000 Blaine. The extra power and thus energy, needed for this fineness increased production costs, which caused the final product to be just as expensive as OPC. Furthermore, no marketing study was done. Interviews with SCANCEM people 14 made clear that the masonry cement was never a success in other parts of Africa, except for Ghana and Nigeria, where some of the cement was sold.
Building Research Unit (BRU) 15•16
• The BRU is a special division of the Ministry of Lands, Housing and Urban Development. lt was established in 1971 by the Government to serve as
lil
11
12
13
14
15
16
30
Interviews with the Chief Engineer and the Senior Engineer.
Tanzania SARUJI Corporation is the government body that used to manage cement production. At the moment TSC still holds 69% of the TPCC shares.
Where 'pure' cement is only used in concrete.
according to BS 5224: Specification for masonry cement (also BS 4887: air-entraining and set retarding ad mixtures)
Mr. F. Svennungsen, Operations Manager TPCC Dar es Salaam. SCANCEM holds 13% of the TPCC shares as well as the management contract.
BRU, Information leaflet, Sept. 1978.
Interview with Mr. L.H. Mosha (architect) at the BRU.
Sectoral Environment Variables
the building research institution of the entire building activity in the country. The terms of reference were to: a) identify the problems of housing and building in the country, b) arrange as far as possible for these problems to be solved in a relevant way, c) coordinate research efforts and enable an appropriate distribution of tasks regarding economie utilization of staff, equipment and other resources of the various research bocties and laboratories concerned, d) see to it that the results of foreign and local research get known within Tanzania, e) collaborate with governmental bodies, parastatals and others in the purpose of getting research results implemented, f) to assist governmental or other bocties who assign the BRU to undertake investigations, surveys etc. and make comments on research matters. lts most important task however is to improve low-cost housing. The BRU has five sections. A technica! section, a building economy section, a human requirement section, an information section and an administrative section. In 1978 it had 56 staff members. According to Mlawa and Sheya17 the BRU had a total of 83 employees in 1989. In August 1996 only 37 persons were employed18
•
Since the change to a more market oriented economy, the BRU now wants to develop into a commercial organisation. This would fit in the government program on Civil Service Reform that is going on. No activities were carried out and no research was done at the moment of taking the interviews. The director expects the BRU to become the authority in the building sector, since such a function is not yet covered. The first task will be to organise the sector. Another point of attention will be the dissemination of Tanzanian Building Standards amongst the building sector. Furthermore, there is a library and bookshop. However, since NORAD (Norwegian Development Organisation) stopped its support in 1986, the number of publications has diminished because of a Jack of funds.
There used to be a collaboration with UCLAS. Where UCLAS has its academie facilities, the BRU provided mostly laboratory facilities. Students from the UCLAS sometimes had their practical training at the BRU. This is also the case for students from the University of Dar es Salaam. At the moment, the laboratory is not functioning as a result of defect equipment.
Tanzania Industrial Research and Development Organisation. TIRDO was established in 1979 to carry out applied research, provide technica! services to the industry and operate a system of documentation to enhance industrial production. lt has no history on building materials research. lts five departments are: Information, Chemistry, Textiles, Engineering and Food technology.
Institute of Production Innovation (IPI). This is one of the Director's Institutes within the University of Dar es Salaam. The institute was established in 1976 and since that time occupied with applied research in machines for village level processing of edible oils, crystalline sugar, milling and mixing animal feed, grain milling and hulling, energy technology, transport equipment and building materials production equipment. The IPI offers consultancy services and participates in teaching activities in all areas of competence. At the workshop, manufacturing of spare parts and manufacturing of proven designs and technologies can be carried out. The institute has designed a stabilised cement/soil block machine; the ones that are widely used in cement-sand block making.
17
IK
Mlawa, H.M., Sheya, M.S. Profiles of R&D institutions in Tanzania, MANSCI, publisher unknown, December 1990.
Interview with Mr. AL. Mtui, director of the BRU.
31
Chapter 3
Eastem and Southem African Mineral Resources Development Centre (ESAMRDC) 19• This
intergovernmental institute used to reside in Dodoma, though can be found nowadays at Kunduchi, Dar es Salaam. The activities of the centre are funded by international agencies and governments. The capacities at the ESAMRDC include: a) Chemica! analytica! services. b) Mineralogical analysis and petrographic ore microscopie studies. Grain analysis on
unconsolidated materials like soils, clays, alluvial, heavy mineral sands. c) Physical properties testing of raw and processed geological and industrial materials, which
include partiele size and thermal properties. d) Heating and firing of materials testscan beundertaken by the centre. e) Mineral processing facilities are equipped to undertake gravity concentration, flotation,
magnetic and electrastatic separations. f ) Pilot scale mineral processing equipment, used to conduct pilot scale processing studies. g) The rock and soil mechanics Iabaratory is equipped to carry out all rock and soil mechanic
tests. h) The centreis equipped to carry out ground geophysical surveys. i ) A geoscience data centre has been established. Also, geoscience data compilation facilities
are being established at 13 member states of SADC and ESAMRDC under the supervision of the latter.
The reason for establishing the centre was to assist its contracting member states in their efforts to exploit their mineral endowments. lts facilities are to be used by every Tanzanian institution, company, individual etc, interested in the exploitation for export and/or local utilisation of mineral raw materials. The major problem is a lack of human resources to operate all laboratories, as a result of that the institute is not yet capable of carrying out mechanica} tests and the database has not yet been set up. The numbers and types of equipment however are impressing. UNIDO is now trying to train people and promate the centre.
Geological Survey Division (Dodoma)20• The technica! functions and general policy of the
division and its sections are as follows: 1. to carry out the basic geological mapping and mineral exploration of the country and to
maintain up to date the assessment of its mineral resources, 2. to provide technica! advice and services to the public, particularly to prospectors, mining
operators, and industries invalving minerals and also to other Government departments, 3. to formulate, support and coordinate mineral technica! aid schemes, provide information
in response to mineral development inquiries both local and foreign and in general to promo te the development of the country's mineral resources,
4. to administer the mining laws, Explosives act, safety regulations and to compile mining operational and mineral production statistics.
The principal divisional activity is the examination and recording of rocks, structures and mineral occurrences over the whole of Tanzania. This is a long term basic geological mapping programme carried out systematically by the Regionat Geology Section. The results are in the standard quarter degree sheet series (full colour), scale 1:125,000. These maps are supplemented by other information on climate, soils, flora, fauna, ethnography etc. and provide an overall survey of the country's natura! resources which is essential for all planning
19
20
32
Information hooklet 1996 and interview with B. Orduz, Chief Technical Adviser UNIDO-ESAMRDC
Ministry of Industries, Mineral Resources and Power, Annual Report of the Mineral Resources Division, 1965, Dar es Salaam, 1967 + interview Mr. Ndonde.
Sectora/ Environment Variables
of land utilisation, agricultural development, communications and other civil engineering projects. In 1965, nearly 40% of the country had been mapped on this scale and over 120 quarter degree sheets have been covered. By July 1996, almest 75% off all maps have been fully surveyed21
• The Laboratories Sectien undertakes chemica! analyses and assays, investigates and suggests mineral and ore dressing methods and perfarms petrological and mineralogical examinations in support of the field sections. The Iaberatory is not equipped to measure physical properties of rocks and minerals and their products.
Recently, the Geological Survey acquired hardware and software based PC-systems, for digitising and processing and production of thematic maps under UNIDO assistance. Among the maps produced are the geological, structural, mineral occurrence maps of Tanzania. Currently, the bibliographical data of both published and unpublished reports are entered into a computer database on all the known mineral occurrences. This means that when the database is completed (almost in Sept 1996), information collected on a particular mineral occurrence over the last seventy years can be traeed at the touch of a button. An extensive list of all publications that mention limestone occurrences in Tanzania could already be provided.
Smal! Industries Development Organisation (SID0)22• The organisation was established in April
1973. lts functions were mainly concerned with the promotion, planning and coordination of smali-scale industries. Therefore it needed to carry out market research and provide services to these industries, in the form of training, technica! assistance, management and consultancy back-up. Apart from this, the organisation should assist any persen in the undertaking of technological research to promote the technological actvancement in Tanzania. Since its establishment, SIDO has promoted, supported and undertaken numerous projects, though since the mid 80s, the number of projects began to decline, probably due to changing government polides and economie reforms. The activities employed by SIDO with respect to lime will be treated in the next paragraph.
National Construction Council (NCC)23• The NCC is a policy implementing and government
informing institution. The council was established in 1979 and became operational in 1981. lt is charged with the responsibility of coordinating the activities in the construction industry. lts primary objective is to promote the development of the construction industry. The council carries out research, advisory and arbitration services, training and formulation of regulatory documents. The status of the council is public. The following departments constitute the NCC: Materials and technology, Building Works, Civil Works, Information and documentation, Finance and administration. Various seminars and training courses have been organised.
Tanzania Industrial Studies and Consulting Organisation (TISC0)24• The organisation was
established in 1976 with a goal of providing a professional background in project formulation, design, implementation and operation. Nowadays, it offers management consultancy and engineering consultancy. The latter ranges from the preparatien of tender documents to project implementation counselling. Management assistance contains among other things market surveying, staff training, technology acquisition and contract formulation. In 1986 TISCO prepared a feasibility study for quicklime and aggregates production in Monduli
21
22
2.1
24
See annex B for a complete list.
Information hooklet 'Ten years of SIDO 1973-1983' and interviews Mr. Kiimu.
NCC, Eleventh Annual Report and Accounts for the Year Ended June 30, 1993, Dar es Salaam, 1994.
Source: Information Leaflet; Business Times, 20t/z anniversary of T/SCO, 8/11/96, p.16
33
Chapter 3
District, Arusha. Even though the project proved feasible, it was not implemented. According to TIB -that financed the study- the loans could after all not be obtained as the initiator, the Monduli District Development Corporation, could not raise the equity required.
National Board of Architects, Quantity Swveyors and Building Contractors25• This association of
construction professionals organises workshops and provides consultancy in case of arguments. All official architects, quantity surveyars and contractors have to register and pay an annual subscription fee that places them on a list that can be consulted by dient. This registration list offers a 'quality guarantee' for the clients. A distinction in seven classes is made according to the maximum contract sum the contractor can handle. Early 1997 a new Act of Parliament is proposed that gives the Board more power. This new Act should enable the Board to visit building sites unannounced whenever a suspicion towards malpractice exists.
Tanzania Bureau of Standards (TBS). The Bureau was established in 1975 and saddled with the following functions. lt should undertake measures for quality control of cammodities of all natures and promate standardisation in industry and commerce. In addition, it should make arrangements and provide facilities for the testing and calibration of precision instruments as well as for examination and testing of cammodities and materials. Besides this, the bureau has to control the use of standard marks and grant or cancel any licence issued for the use of such a mark. Industries can apply for assistance and consultation in setting up quality control procedures or in research, standardisation an related subjects.
National Environmental Management Council (NEMC). In Tanzania various institutions are engaged in environmental issues in the country. In 1986, the NEMC became operational in order to advise the government on all matters related to the environment. lts main functions are to formulate polides on environmental management and recommend implementation as well as to coordinate the activities of all bodies concerned with environmental matters and serve as a channel of communication. Furthermore, it should specify standards, norms and criteria for the proteetion of beneficia! uses and maintenance of the quality of the environment. The council consists of four departments; natura! resources department, pollution prevention and control department, environmental education department, environmental information centre department
3.3 Lime in Tanzania26
3.3.1 A short history In the ancient towns of Kilwa and Bagamoyo, mosques, tombs and other buildings were built as early as in the 121
h and 131h centuries. Those buildings were reported to be made of
masonry from coral limestone and lime mortar27• The first who re-introduced the technology
of limeburning in Tanzania have probably been missionaries in times of the German occupation. During the last decades of the 19111 century until the end of the first world war,
25
27
34
Interview with Mr. M.J.M. Laswai, Senior Evaluation and Registration Officer.
Although the use of time was very common in Zanzibar during the times of the Sultan's occupation, only rnaintand Tanzania is addressed here.
Chittick, H.N. A guide to tlze mins of Kilwa, Antiquities Division Ministry of National Education Dar es Salaam, 1970, and: Mturi, AA A guide to the 11tins of Kaole, Antiquities Division Ministry of National Education Dar es Salaam, 1974, in: Kimambo, R.H. Development of the non-metallic minera/s and the silicate industry in Tanzania, vol. I, Dar es Salaam/Arusha, 1986. p.12.
Sectoral Environment Vmiables
there was an intlux of Christian missionaries from Europe, who -for the construction of their mission stations- performed their own lime burning. In some places, kilns were built and in some places, simple heap-burning was practised. Oates28 states that 'in this country, numerous extensive and conveniently located deposits of good limestone are already known and many of these were actively worked in times of German occupation. During that period local supplies of lime were employed wherever practicabie for building mortar and must have resulted in considerable economy.' Further on, he mentions that in the Dar es Salaam and Tanga regions, lime mortar was soon replaced by Portland cement, which had to be imported by that time. In the more remote regions, lime was used for mortar, plastering and whitewash, because of the high price of imported cements.
In 1974, SIDO has had a programme to develop village industries throughout the country. The organisation established 30 kilns of which 10 were reported operating in 198829
• It is not clear how many of the units are still producing today. Six projects that could be retraced by SIDO, were all not producing. The main reason that was given by the regional offices from SIDO, were problems related to management, which caused them to stop producing.
Oldonyo Sambu Lime Pozzolana Experience30•31
In 1977, SIDO made a feasibility study to start production of lime-pozzolanas. The main reason for this was the scarcity of building materials in the area, which fitted in a campaign to support rural based industrialisation. Samples taken from Mount Meru volcanic ash (pozzolanas) and nearby limestone deposits proved of sufficient quality12
• The project was located in Lemongo Village, which is the largest one of four, making up the Oldonyo Sambu ward, 35 km north of Arusha. The project was developed in cooperation with OXFAM and ITDG. The limekiln was built by local masons after they had been given training during one month and the kiln was delivered early 1978. The design was adopted from the Indian Khadi and Village Industries Commission (KVIC). The same group was trained to continue regular commercial production. The initia! idea was to set up more of these lime pozzolana projects if it would prove technically and economically feasible.
With the Oldonyo Sambu limepozzolana blocks3\ a dispensary was built in 1980 (which is still
existing) and a store.
However, during the years 1978, 1979 and 1980 production declined and in the period January-June 1980 only 3.48 tonnes lime, 2.92 tonnes pozzolime and 3.0 tonnes raw limestone were produced. The project was handed over to the village ward in July 1980. SIDO gave some suggestions for further development of the project. An interesting test was done on the
2K
.lU
31
32
33
Oates, F. Limestone deposits of Tanganyika Tenitmy, with a description of the commercialuses of limestone and time and brief notes upon the occurrences of gypswn and magnesite, Geological Survey Department, Bulletin no.4, Dar es Salaam, 1933. p.81-85
UNCHS (Habitat), Development of the constmction industry for law-ineome shelter and infrastmcture, Nairobi, February 1988. p.21-23
Most of the following information is derived from correspondence of the past 25 years between SIDO Arusha and SIDO HQ DSM. This information was provided by Mr. Kiimu, SIDO HQ DSM.
Schilderman, T. (ed.) Rural Housingin Tanzania, report of a seminar organised at ArllS!za, may I 2-20, 1981, CHS Occasional Paper, Dar es Salaam/Rotterdam, December 1982. p.83-86
Tested by Dr. R.J.S. Spence, Cambridge University, UK
dispensary: 450 x 230 x 150 mm blocks store: 290 x 140 x 110 mm blocks
35
Chapter 3
pozzolime. The low initia! strength of the material proved to be a problem in some applications. Therefore, 5% by weight of gypsum was added to the normal Oldonyo Sambu pozzolime. While 7-day strengthof (standard mortar) cubes was 1.4 to 1.8 N/mm2 with normal material, the added 5% gypsum improved the strength of the cubes to 3.5 N/mm2
• Using Iabaratory gypsum gave even higher strengtbs (3.9 N/mm2
). For this test gypsum from Makanya (Kilimanjaro region) was used, which is also used at TPCC in Dar es Salaam.
On 1/7/1980, phase two in the project started, with the collaboration of the Arusha Planning and Village Development Project (APVDP) and ITDG in London. The basis of phase two should be the construction of a public building out of pozzolime-based materials in Mbeya, using Mount Rungwe and Mount Ngozi ash and Songwe limestone. The building should be used to attract potential entrepreneurs who could then supply capita! for the establishment of an actual pozzolime industry. The project proposal was prepared by SIDO in cooperation with APVDP. No further information on the outcome of the proposal could be obtained.
Problems encountered in the project, which seemed to accompany most of the lime units that have been started up by SIDO, were as fellows. The raw materials were not available in immediate vicinity of the kiln. Limestone was quarried 20 km north of the site, pozzolanas were found 5 km away and firewood had to come from the slopes of Mount Meru. Transportation of these materials was sametimes difficult to organise, because the project did not have its own lorry.
The KVIC kilns that were built, were designed to workon a continuous basis, thus reducing firewood consumption. However, this required a production day of 24 hours, while most people were unwilling to work during night hours. They preferred to work only during daytime and to separate the tasks and work for one week digging limestone, one week cutting firewood and one week firing the kiln. It was even suggested from SIDO Headquarters (HQ) that batch type kilns should be built for future village lime industries. Apart from this, questions were raised on the management skilis available at village level, since local managers were aften not comfortable with a large workforce.
Criticism was expressed at the methad of development of the lime-pozzolana project. One of the reasans why the pozzolime production at Oldonyo Sambu had a slow take-off, was that the lime production was not established first. Pozzolime production was started even befare there was a regular lime production, while pozzolime should be based on an existing lime production. In the original proposal it was stated that the pilot lime kiln should be handed over to an entrepreneur or co-operative and after that, pozzolime production should be established.
Furthermore, an evaluation that was discussed in the correspondence between SIDO Arusha and SIDO Dar es Salaam indicated that the acceptability of the material was limited by two factors: mixing of ash and lime was done by hand, which resulted in a fairly course materiaL Packaging was poor, due to the use of old cement bags, which made it difficult for customers to take the material seriously. Summarised, it was stated that the scale of the industry was too small to embark on a more professional production and produce pozzolime which could seriously compete with Portland cement. By that time, the price of the pozzolime was equal to that of Portland cement.
There have been attempts to produce rice husk ash with lime to produce a cementltious binder. Rice husks from Mbeya and Nzega (Shinyanga Region) were burnt, but resulting cube
36
Sectoral Environment Variables
strengths were disappointing. Problems with the burning of the rice husk would have needed more investigation.
There have been tests on the combination of burnt brick waste (as pozzolana) in combination with lime in Iringa region. However, samples from these bricks gave no good test results and it was decided not to continue with a proposal for this project, until further technica! developments had taken place34
•
3.3.2 The use of lime in construction, results from the questionnaire To obtain information on the present use of lime in construction activities, a questionnaire was developed in which building contractors were asked about the use of lime by their company. The objective of this questionnaire was to find out the quantity of lime used by contractors and the main type of application of the material in construction. Timeseries were asked to see if a trend could be found over the past 6 years. lt should be noted that this is not a market study. The response to the questionnaire remained too low making the sample too small to generalise the outcome to the whole popuiatien of contractors in Tanzania. The results are therefore disputable. However, since the answers give an indication of the present application of lime, the information is still valuable and can serve as a basis for a market study.
Results of the BRU questonnaire from 1983. A similar study was conducted in 1983 by the Building Research Unit. The BRU held an enquiry among 13 contractors and 5 parastatals aimed at determining the application of lime in building and construction in Tanzania35
• The annual consumption of lime given in that report, varied from 1 to 215 tonnes. The average was 41 tonnes/year/contractor. The enquiry showed that the main part of lime consumption went to masoning and plastering.
The same report gives a figure for lime production of 6,000 tonnes. The information was obtained from SIDO. Some of the kilns functioned only occasionally around that time, and installed capacity amounted to 42,300 tonnes per year.
Estimations for the use of lime were made, but included lime used in block production as well. Assuming that out of all new houses, 6.8% ( 43,520 out of 640,000) was built with improved materials (such as concrete blocks, bricks, etc.) the amount of lime used in mortar was calculated at 9,800 tonnes and for plaster at 23,700 tonnes annually (plastered on both sides). After this 'it was concluded' that out of all improved houses, only every eighth house had lime in mortar and plaster ( only one si de), so the annual consumption was calculated at 2,700 t!y.
The main conclusions drawn from the BRU report were that because of the poor availability of lime and its high price compared to that of cement, it seemed very probable that only a fraction of houses utilized lime. The location of lime kilns was most likely to affect regional consumption and finally it was concluded that there were 'big potentials' for the use of lime and also for cement.
34
3S
Most people who used to work for SIDO in this period, have left the organisation, which makes it hard to trace back information.
Talanen, Y. The conswnption of lime in residential buildings, BRU working report 42, Dar es Salaam, 1983.
37
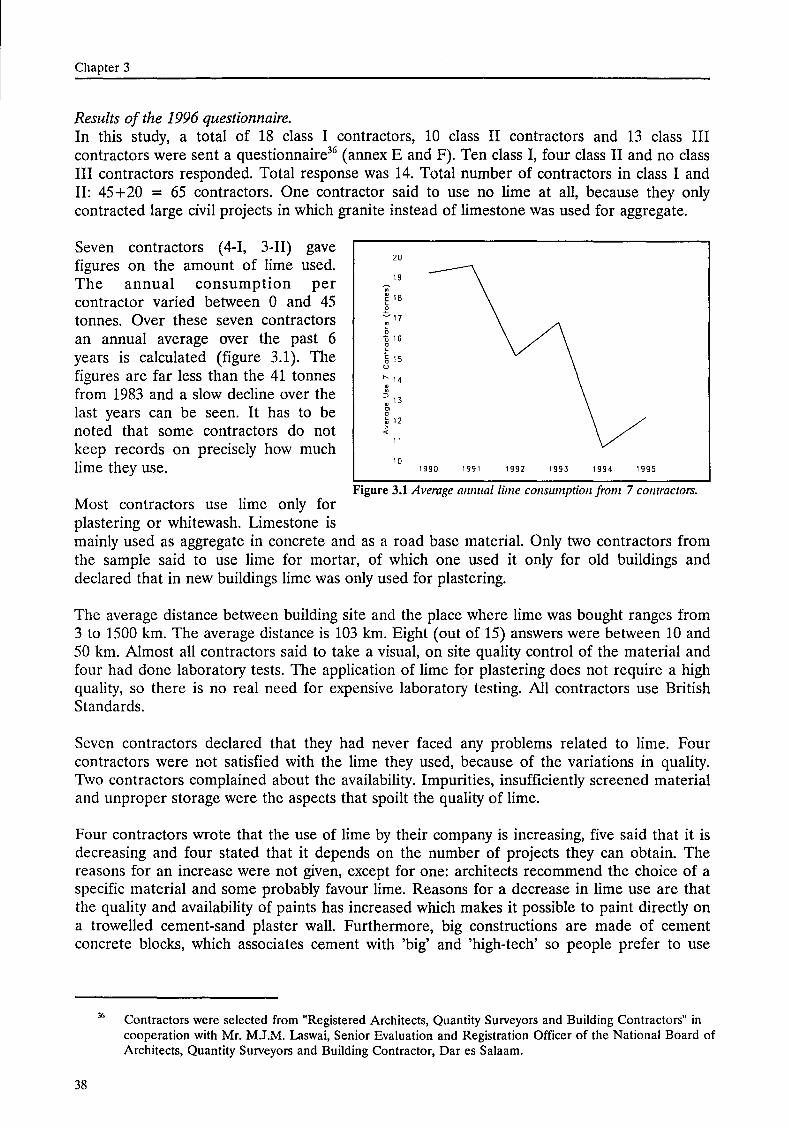
Chapter 3
Results of the 1996 questionnaire. In this study, a total of 18 class I contractors, 10 class II contractors and 13 class III contractors were sent a questionnaire36 (annex E and F). Ten class I, four class II and no class III contractors responded. Total response was 14. Total number of contractors in class I and II: 45+20 = 65 contractors. One contractor said to use no lime at all, because they only contracted large civil projects in which granite instead of limestone was used for aggregate.
Seven contractors ( 4-I, 3-II) gave figures on the amount of lime used. The annual consumption per contractor varied between 0 and 45 tonnes. Over these seven contractors an annual average over the past 6 years is calculated (figure 3.1). The figures are far less than the 41 tonnes from 1983 and a slow decline over the last years can be se en. I t has to be noted that some contractors do not keep records on precisely how much lime they use.
Most contractors use Iime only for plastering or whitewash. Limestone is
20
19 .. ~ 18 c 0
.:::.. 17 ~
0 ü 16 0 c
§ 15 u
" 14 w
~ 13
"' 0
~ 12
"" 11
10 1990 1991 1992 1993 1994 1995
Figure 3.1 Average amwallime consumption from 7 contractors.
mainly used as aggregate in concrete and as a road base materiaL Only two contractors from the sample said to use lime for mortar, of which one used it only for old buildings and declared that in new buildings lime was only used for plastering.
The average distance between building site and the place where lime was bought ranges from 3 to 1500 km. The average distance is 103 km. Eight (out of 15) answers were between 10 and 50 km. Almost all contractors said to take a visual, on site quality control of the material and four had done Iabaratory tests. The application of lime for plastering does nat require a high quality, so there is no real need for expensive laboratory testing. All contractors use British Standards.
Seven contractors declared that they had never faced any problems related to lime. Four contractors were not satisfied with the lime they used, because of the variations in quality. Two contractors complained about the availability. Impurities, insufficiently screened material and unproper starage were the aspects that spoilt the quality of Iime.
Four contractors wrote that the use of lime by their company is increasing, five said that it is decreasing and four stated that it depends on the number of projects they can obtain. The reasans for an increase were not given, except for one: architects recommend the choice of a specific material and some probably favour lime. Reasans for a decrease in lime use are that the quality and availability of paints has increased which makes it possible to paint directly on a trawelled cement-sand plaster wal!. Furthermore, big constructions are made of cement concrete blocks, which associates cement with 'big' and 'high-tech' so people prefer to use
38
Contractors were selected from "Registered Architects, Quantity Surveyars and Building Contractors" in cooperation with Mr. M.J.M. Laswai, Senior Evaluation and Registration Officer of the National Board of Architects, Quantity Surveyars and Building Contractor, Dar es Salaam.
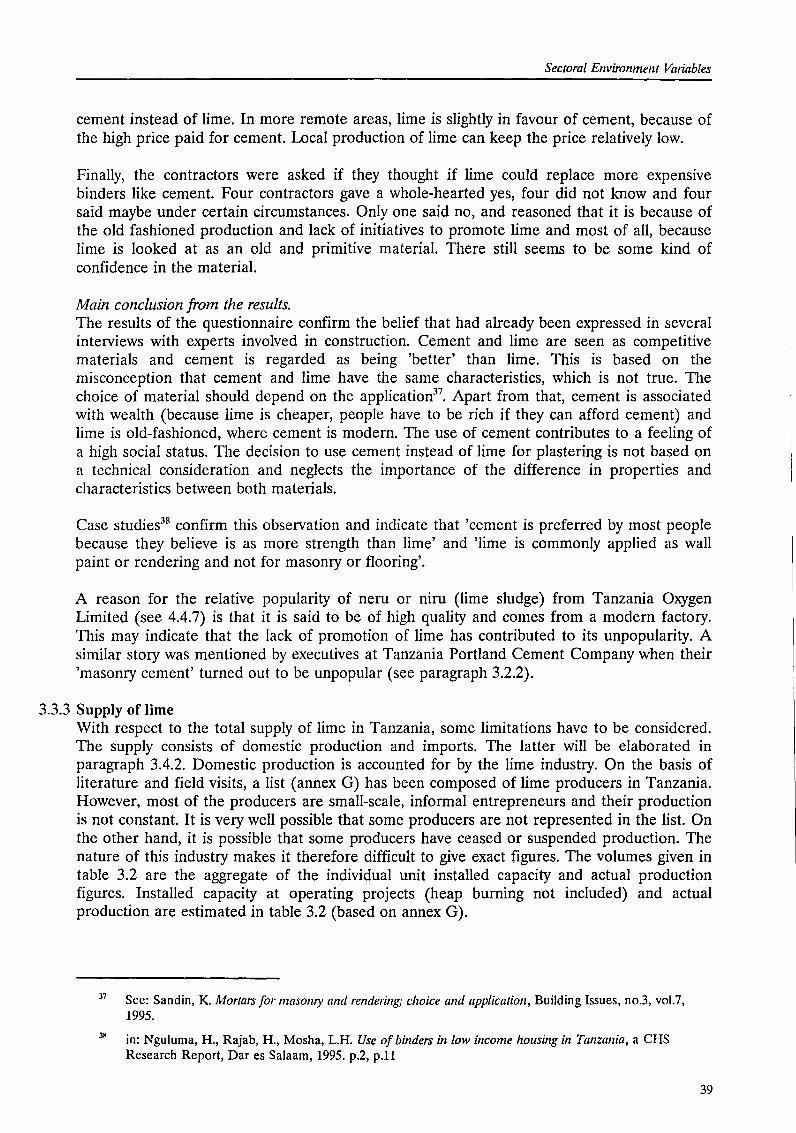
Sectoral Environment Variables
cement instead of lime. In more remote areas, lime is slightly in favour of cement, because of the high price paid for cement. Local production of lime can keep the price relatively low.
Finally, the contractors were asked if they thought if lime could replace more expensive binders like cement. Four contractors gave a whole-hearted yes, four did not know and four said maybe under certain circumstances. Only one said no, and reasoned that it is because of the old fashioned production and lack of initiatives to promote lime and most of all, because lime is looked at as an old and primitive materiaL There still seems to be some kind of confidence in the materiaL
Main condusion from the results. The results of the questionnaire confirm the belief that had already been expressed in several interviews with experts involved in construction. Cement and lime are seen as competitive materials and cement is regarded as being 'better' than lime. This is based on the misconception that cement and lime have the same characteristics, which is not true. The choice of material should depend on the application37
• Apart from that, cement is associated with wealth (because lime is cheaper, people have to be rich if they can afford cement) and lime is old-fashioned, where cement is modern. The use of cement contributes to a feeling of a high social status. The decision to use cement instead of lime for plastering is not based on a technica! consideration and neglects the importance of the difference in properties and characteristics between both materials.
Case studies38 confirm this observation and indicate that 'cement is preferred by most people because they believe is as more strength than lime' and 'lime is commonly applied as wall paint or rendering and not for masonry or flooring'.
A reason for the relative popularity of neru or niru (lime sludge) from Tanzania Oxygen Limited (see 4.4.7) is that it is said to be of high quality and comes from a modern factory. This may indicate that the lack of promotion of lime has contributed to its unpopularity. A similar story was mentioned by executives at Tanzania Portland Cement Company when their 'masonry cement' turned out to be unpopular (see paragraph 3.2.2).
3.3.3 Supply of lime With respect to the total supply of lime in Tanzania, some limitations have to be considered. The supply consists of dornestic production and imports. The latter will be elaborated in paragraph 3.4.2. Dornestic production is accounted for by the lime industry. On the basis of literature and field visits, a list (annex G) has been composed of lime producers in Tanzania. However, most of the producers are small-scale, informal entrepreneurs and their production is not constant. It is very well possible that some producers are not represented in the list. On the other hand, it is possible that some producers have ceased or suspended production. The nature of this industry makes it therefore difficult to give exact figures. The volumes given in table 3.2 are the aggregate of the individual unit installed capacity and actual production figures. Installed capacity at operating projects (heap burning not included) and actual production are estimated in table 3.2 (based on annex G).
37
3H
See: Sandin, K. Mortars for masomy and rendering; choice and application, Building Issues, no.3, vol.7, 1995.
in: Nguluma, H., Rajab, H., Mosha, L.H. Use of binders in low income housing in Tanzania, a CHS Research Report, Dar es Salaam, 1995. p.2, p.l1
39
Chapter 3
Table 3.2 Estimated lime production in Tanzania
Estimates for: Installed capacity Actual production
Lime production in Tanzania 30,000 tonnes I year 12,000 tonnes I year
3.4 Demand for Iime in Tanzania
An overview of earlier estimations for demand and production of lime in Tanzania can be found in 'Lime and alternative binders'39
• It is however difficult to retrace on which assumptions these estimations are based. Holmes and Wingate40 estimate a 27,000 tonnes per year hydrated lime demand for Zanzibar only. Total consumption in construction is estimated at 20,000 tpy for mainland Tanzania by Ikomba41
• Outside the construction industry another 8,000 tpy (sugar refining, paint production, mineral processing, leather tanning). An UNCHS study, cited in the same report estimated total production in 1983 at 18,300 tpy. This figure does not match the 6,000 tpy production mentioned in the BRU report42
• In a CHS paper43
the demand for lime was estimated at 50,400 tonnes per year based on three types of improved houses.
3.4.1 Construction Determination of demand remains a difficult aspect. Moreover, since demand has a strong geographical element. This is reflected in the price per product, which is related to the distance from factory to market Since transport in Tanzania -due to the state of roads- is very expensive, this constitutes a large part of the market price of the final product. This means that the price of cement in remote areas, i.e. large distances from cement factories, is substantially higher than close to the plants. In these places lime may be used relatively more, than in urban areas. Jongsma44 set up a geography-related cement demand projection for Tanzania. In his report he estimates a total cement demand of 825,000 tonnes annually for the mainland only.
From correspondence with producers and contractors in Kigoma and Mtwara region, it turned out that in these regions, lime is used for mortar. As the main reasen for using lime was mentioned the exorbitant high price of cement. It should be noted that income per capita in remote regions is lower than in the regions were cement factories are located.
39
4(1
41
42
43
44
40
Muhegi, B., Schilderman, Th. Production and consumption of binders in Tanzania, in: Agevi, E., Ruskulis, 0., Schilderman, Th. (eds.) Lime and alternative binders in East Africa, IT Publications, London, 1995.
Holmes, S.D., Wingate, M.A. Report and advice given to the STCDA for emergency repairs, traditional lime teclmology and smal! scale lime production, ITDG, Rugby, 1991, in: Production and consumption of binders in Tanzania, workshop papers, 1994.
Ikomba, E.G.S. Feasibility study for lime and precipitated calcium carbonate, Dar es Salaam, 1994, in: Production and consumption of binders in Tanzania, workshop papers, 1994.
Talanen, Y. The conswnption of lime in residential buildings, working report 42, Dar es Salaam, 1983. p. 4
Schilderman, T. (ed.) Rurallzousing in Tanzania, report of a seminar organised at Amsha, May 12-20, 1981, CHS Occasional paper, Dar es Salaam/Rotterdam, December 1982. p.31
Jongsma, I. Smal! scale cement production in Tanzania? M.Sc. thesis, EUT, March 1996. p.16-26

Sectoral Environment Variables
To estimate the present demand, a demand model is developed by the author (Box 3.1). The information available that can serve as input for a model is very limited. Therefore, the outcome of this model is only a rough figure. Two information sourees have been used: the contractors questionnaire and interviews and the second is the consumption of lime by the National Housing Corporation (NHC) and the number of NHC-projects over the last five years. The NHC was chosen, because the author could collect accurate data on material use and projects. The samemodel wastried with the Ministry of Works, though both the amount of lime used as well as the number of projects could not be given. Apart from that the Ministry is mainly occupied with road construction.
The basics of the model are as follows: 1. Assumption: Housing stock growth is proportional to population growth (Iinear), 2. Potential housing stock growth = absolute population growth I average houschold size. 3. Material use per housing unit I houschold size = material consumption per capita. . . 4. Material consumption p.c * absolute population growth = annual demand for materiaL 5. Annual demand for material I total population = average annual per capita demand. 6. This model neglects the matcrials used for maintenance to buildings.
Every building contractor contributes to the growth of the housing stock. Multiplying the number of residential units built with the average houschold size, gives the number of people that are supplied with a new house. Absolute population growth divided by this number gives the contraetar's share to the growth of the housing stock. The share in total material use is equal to the share in housing growth, as long as this contractor builcts a representative part of all houses built. Of course, such a representative contractor does not exist. If the average is calculated from a group of contractors, the annual demand for lime wil! be more reliable.
During the period 1990/91 to 1994/95, the NHC constructed 169 residential units (source: NHC, Dares Salaam). The units average per year is 169 I 5 = 33.8. In the period 1990-1995, 779 tonnes of lime were used. This gives an average annual consumption of 3.84 tonne/unit, equal to 739 kg/capita, forthe average houschold size equals 5.2 persons.
Average population growth over the past five years is 3%. The population of Tanzania in 1995 counted 29 million people, which can be calculated back to 1990 using: P'JIJ = P95 * (1.03)"5 = 25 million people, so absolute growth amounts to: 4 million people over 5 years, equal to 800,000 people per year. The demand for lime is calculated at 0.739 * 800,000 = 591,200 tonnes/year. The average annual demand per capita for the total population = (591,200 I 29*106
) = 20.4 kg.
Population figures, source: World Bank, From plan to market; World Development Report 1996, Oxford UP, New York, June 1996. (p.194) Lime consumption figures, source: NHC, Dodoma. See also paragraph 4.4.1: Mvumi Lime Factory.
Box 3.1 Tlze demand model applied to one contractor; tlze National Housing Corporation.
As stated earlier, the model gives only a very rough figure. The use of lime by the NHC is expected to be much higher than with other contractors, because of their own lime project. The NHC used on average during 1990-1995 some 130 tonnes lime per year, while for 7 large contractors this was only 15.6 tonnes per year. For 12 contractors the average number of residential projects over 5 years amounted 11.5 projects. The NHC had 14 residential projects in the same period, which is not that much different from the other contractors.
Assumed that if all contractors use 8.3 times less lime than the NHC, the total annual demand would be much lower; around 71,000 tonnes/year (or: 2.45 kg per capita). This figure is more realistic compared to the estimates mentioned earlier.
With respect to the demand for lime, some possible future developments should be considered:
41

Chapter 3
1. growth of the number of houses is larger than popuiatien growth, which sounds logically, since average househeld size is decreasing, especially in urban areas, where the main part of construction takes place as well. This could mean more lime consumption in construction.
2. cement production increases and substitutes even more lime than at the moment. This can be established by infrastructural (roads) improvements, cement factory expansion or new factories. This would mean a decrease in lime consumption for construction.
3. the quality and production volume of paints increases and thus substitutes lime used for whitewash45
• (This trend is already mentioned in an interview with a quantity surveyor) 4. industrial growth accounts for an increase in demand for lime, mostly from chemica!
industries. This trend can be seen in developed countries, where the largest consumer of lime in construction is the sand/silicate brick industry. However, quality requirements will be stricter.
Sugar industry At the moment, the largest consumer of hydrated lime in Tanzania is the sugar industry. There are five sugar factories in Tanzania. Hydrated lime is used in the refining process for clarification of the sugar molasses. The production capacity and lime consumption of the factories in Tanzania is given in table 3.3.
Table 3.3 Sugar production and amzuallime-IISe in Tanzania, source: SUDECO HQ, Dar es Sa/aam, 1996.
Installed capacity Lime use in Lime use at (ton sugar prod.) 1995 (tons) max. cap.(tons)
T.P.C. Moshi 64,000 540 672 Kilombero I 36,000 390 612 Kilombero II 40,000 253 572 Mtibwa Sugar Estate 34,000 240 306 Kagera Sugar Ltd. 56,000 60 728
Total 230,000 1483 2890
Leather industry46
Leather tanneries need lime for clearing the hairs of hides. At the moment there are three big leather tanneries in Mwanza, Moshi and Morogoro. The latter is under rehabilitation, and the factory in Moshi is not eperating at the moment. Installed capacity for the three factories is each 2,000 hides per day, but actual production amounts to 800 to 1000 hides per day. The amount of lime necessary is very little, ranging from 0.8 to 1.0% of the weight of a hide. Annual lime consumption under the current capacity utilisation amounts 15 tonnes. The lime eernes from Tanga. Sixty to seventy percent of all hides produced is exported. UNDP is assisting in setting up small tanneries in rural areas in the near future.
45
42
See Annex J for a graph on dornestic paint manufacture.
InteiView with Mr. S. Chandoo, General Manager Tanzania Leather Industry Ltd. (Africa Trade Development Group)
Sectoral Environment Vmiables
Paint manufacture Lime is used as an extender in paints. Paints are used in the construction industry, which makes it a building material as well. One paint manufacturer said to use 25 tonnes of hydrate per 50,000 litres of paint, which was equal to their production per month. The lime used to be imported from Kenya and now comes from India. Another manufacturer declared not to use lime. The use of lime in paint manufacture is dependent on the type of paint made.
Limestone Although limestone 'production' is not the subject of this report, some other uses of the raw material for lime production will be briefly illustrated. The Interchick factory in Dar es Salaam uses 200 tonnes limestone per month for processing chickenfeed. The limestone is quarried at Bunju (north of Dar es Salaam). Steelmills and foundries: 39,000 tonnes steel/year47 installed capacity and 20,000 tpy actual production. At the moment approximately 4,000 tonnes limestone are used annually. Limestone is the major input in cement production. One tonne cement requires 1.2-1.3 tonnes limestone. The actual consumption from the three factories tagether amounts approximately 1,000,000 tonnes limestone, coming from their own quarries. Limestone as aggregate for road stabilisation and concrete is estimated to have an 80% share of all limestone consumption, at least in the Dar es Salaam region48
• Most aggregate in this region comes from the Kunduchi and Mjimwema quarries (respectively north and south of Dar es Salaam).
3.4.2 Imports and Exports Prior to an etaboration of Tanzania's international lime trade, it should be noticed that imports of lime may indicate several situations. These are 1) a general shortage of dornestic supply, 2) shortage of dornestic supply of a certain quality, 3) unreliable dornestic situation with respect to delivery times and availability, 4) contracts between multi-national (daughter-) companies that demand the purebase of certain foreign inputs. This last point is expected to be of minor influence and occurs when companies employ foreign patented industrial processes that involve a certain quality of inputs. This strategy is sametimes used to relocate pro fits.
From information available at the Customs Department of the Ministry of Finance and the Bank of Tanzania, Balance of Payments Department, graphs have been compiled ( see annex C). The figures from before 1979 are from the Bank of Tanzania, given in Kimambo49
• At the Customs Department, the registration system used was altered in June 1992. What was formerly recorded as lime was then divided in the following sub-categories: Quicklime, slaked lime and hydraulic lime. For the sake of simplicity, these figures have been added up. The same applies for the figures of 1993 up to 1996 from the Bank of Tanzania. During the years under survey, the only exportsof lime from Tanzania were in 1992, being 282 tonnes to Zaïre for 158,078 Tsh.
47
4X
Brink, J.van de, Scrap-metal study, M.Sc thesis (draft), Eindhoven, 1997 (yet unpublished)
Interview with Mr. F.G. Kanza, Senior Quantity Surveyor at NS Noremco Construction, Dar es Salaam. However, exact data on this is not available.
Kimambo, R.H. (ed.) Development of the non-metallic minerals and the silicate industry in Tanzania, volume 11, Arusha/Dar es Salaam, 1988. p.213
43
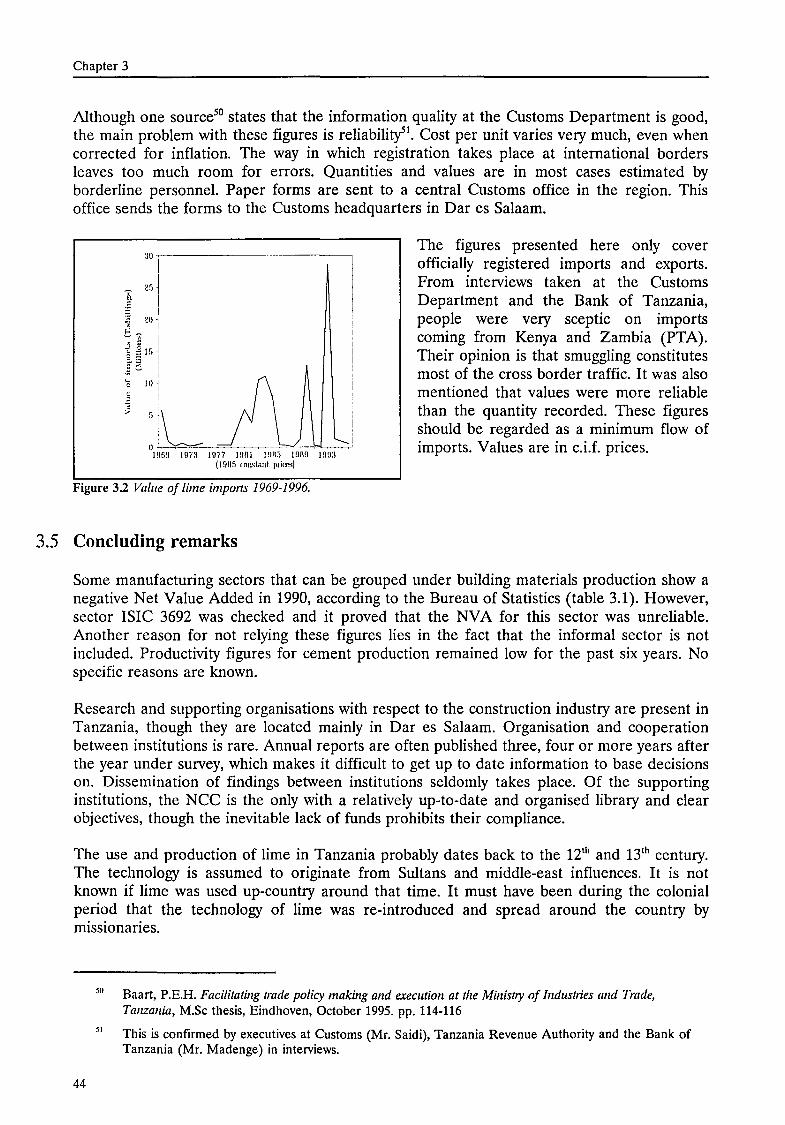
Chapter 3
Although one source50 states that the information quality at the Customs Department is good, the main problem with these figures is reliabilicys1
• Cost per unit varies very much, even when corrected for inflation. The way in which registration takes place at international borders leaves too much room for errors. Quantities and values are in most cases estimated by borderline persenneL Paper farms are sent to a central Customs office in the region. This office sends the farms to the Customs headquarters in Dar es Salaam.
:JO I
2:, I I I "i! 20 I t.'î T,:::::
~ ~ lfl
.a-
clll: !\ ~ I
' :LL Jl ~! I !lfi!l 197:1 1977 19111 !!lil:> 19119 19!1:1
(I flllf> <:nnst.mt priees)
The figures presented here only cover officially registered imparts and experts. From interviews taken at the Customs Department and the Bank of Tanzania, people were very sceptic on imparts coming from Kenya and Zambia (PTA). Their apinion is that smuggling constitutes most of the cross border traffic. lt was also mentioned that values were more reliable than the quantity recorded. These figures should be regarded as a minimum flow of imports. Values are in c.i.f. prices.
Figure 3.2 Value of time imparts 1969-1996.
3.5 Condoding remarks
Some manufacturing sectors that can be grouped under building materials production show a negative Net Value Added in 1990, according to the Bureau of Statistics (table 3.1). However, sector ISIC 3692 was checked and it proved that the NVA for this sector was unreliable. Another reasen for not relying these figures lies in the fact that the informal sector is not included. Productivity figures for cement production remained low for the past six years. No specific reasans are known.
Research and supporting organisations with respect to the construction industry are present in Tanzania, though they are located mainly in Dar es Salaam. Organisation and cooperation between institutions is rare. Annual reports are aften published three, four or more years after the year under survey, which makes it difficult to get up to date information to base decisions on. Dissemination of findings between institutions seldomly takes place. Of the supporting institutions, the NCC is the only with a relatively up-to-date and organised library and clear objectives, though the inevitable lack of funds prohibits their compliance.
The use and production of lime in Tanzania probably dates back to the 121h and 131
h century. The technology is assumed to originate from Sultans and middle-east influences. lt is not known if lime was used up-country around that time. lt must have been during the colonial period that the technology of lime was re-introduced and spread around the country by missionaries.
511
51
44
Baart, P.E.H. Facilitating trade policy making and execution at the Ministry of Industries and Trade, Tanzania, M.Sc thesis, Eindhoven, October 1995. pp. 114-116
This is confirmed by executives at Customs (Mr. Saidi), Tanzania Revenue Authority and the Bank of Tanzania (Mr. Madenge) in interviews.

-------------------------------------------------
Sectoral Environment Variables
There have been development programmes for lime production in the past. The programmes were undertaken and supported by SIDO. However, experiments with the production of lime and lime pozzolanas did not come to much. Various reasons are mentioned in this chapter.
With respect to the present use of lime, it can be stated that plastering and whitewash are the main applications for lime. The use of lime in mortar is very rare. Consictering the developments in the building materials industry, it is likely that the use of lime in construction will decrease.
The demand for lime is estimated at 71,000 tonnes per year. This figure should be treated very carefully, since the demand model is only applied to one contractor. Annual production of lime is estimated at 12,000 tonnes. The great unknown factor is the amount of lime produced in informal heap-burning activities. However, this share should not be exaggerated. The demand-estimate is not consonant with the industry's production figures.
For the development of the lime industry, it seems justified to pay attention to other industries that use lime as input. It should be noted that quality requirements for other industries are stricter than for most applications in construction.
Lime imports could be retraced until 1969. The price per tonne of imported lime shows strange ups and downs, especially in the last 20 years. Some unexplainable outliers have been found. Interviews revealed that reliability of trade statistics can not be guaranteed. The export of lime is negligible. The volume of registered lime imports shows a decrease over the past 10 years. Cement imports show a clear downward trend over the years 1981-1992.
45
Chapter 4
4 The Lime Production Process
4.1 Introduetion
This part farms the care of the study, analysing the use of technology in the 'art' of burning lime. As explained earlier in this report, lime burning is a very old craft. However, research and new technologies have made a contribution to the efficiency, effectiveness, energy requirements and scale of the process. Still, traditional ways of burning lime are practised in many places, indicating a demand for the lime and the possibilities for impravement of the production process. This chapter will explain the various technologies and their most important features. The technology is analysed following its process components (figure 1.2). Attention will be paid to the kilns and machinery, Iabour, information and organisation of the process. Material flows and energy use will be elaborated. The case studies presented in this chapter will indicate the present use of the technology in Tanzania. Seven case studies, of which two elaborate, are personal accounts of the visits made by the author to the lime projects and one is based on correspondence. Two proposed projects will be reviewed (1986 and 1989). A short account of lime production in Malawi is given as well as an indication of a large modern kiln. Annex K contains photographs of the lime projects that were visited.
4.2 Technology
The demand for a higher and more uniform quality lime product is increasing as industrial development increases, because applications in industry demand stricter requirements of the product than in construction. A competitive market economy requires more capital and Iabour efficiency. These have been the most important reasans for developing new technologies and successfully improving older ones.
Heap burning The most traditional methad of producing lime is called heap-burning. The technology has probably been transferred from father to son and the main advantage of this process is the low capital requirement. The process can be described as follows:
Wood logs are collected and piled on to a circular heap. On top of these logs, limestone lumps are placed. The pile is set on fire for approximately two days, until the wood is completely burnt. The stanes are then sprinkled with water. The course material that remains is mostly unburnt stone and useless for further processing. Sametimes the lime is sieved or ground and packed in bags.
This process is characterised by inefficient energy use through heat losses during burning. There is no means of cantrolling the heat and the quality of the final material is consequently not uniform. One batch can produce 1 to 3 tonnes, depending on the size of the heap.
To imprave the energy efficiency a little, pits can be dug in which the material is burnt, though problems can arise as a result of insufficient draft.
Intermiltent kilns So-called intermittent kilns (batch process) are the least efficient among the group of lime kilns. A big variety of different types of interruittent kilns exist. These kilns are characterised
46
The Lime Production Process
by uneven heat distribution in the kiln and energy losses as a result of heating and cooling down of the thick kiln walls. It can be described as follows:
The kiln is constructed of bricks or natural stones and filled with alternating layers of lirnestones and firewood (sornetirnes coal is used). After filling the kiln, the wood is set on fire and left for burning for two or three days, depending on the size of the kiln. Draft is created through holes in the basement of the kiln. The top is left open. When the stones have cooled down they are rernoved and the kiln can be charged for another batch. Hydration of the stones usually takes place outside the kiln.
It is not possible to control the ternperature in the kiln and hence the quality of the burnt stone is not uniform. Irnprovernents can be made by constructing a chirnney to enhance draft and prevent rainwater frorn entering the kiln. Three to ten tonnes per batch can be produced, depending on the size of the kiln.
Vertical Shaft Kilns (VSK) Far more efficient is the continuous vertical shaft kiln. Losses that otherwise occur frorn heating and cooling of the walls can be avoided. The fuel can either be mixed with the stones or feeding is done separately.
The stones are fed frorn the top tagether with the fuel (in case of mixed feed kilns). The burning zone, where the highest ternperature is reached, can be found halfway the kiln. Gases originating frorn burning, pass through the newly fed stones and will preheat these. On the bottorn of the kiln, the burnt stones are discharged. The draft cools down the stones at the bottorn of the kiln. The air is thus pre-heated when it enters the burning zone, so no unnecessary cooling occurs in this zone. Essential to the operation of a VSK is that arnple voids are present in the stone charge for circulation of fuel gases and draught around and through the stones.
The continuous kilns can be fired using oil, coal or gas as well. Ternperature control allows for a more uniform and higher quality product. The productivity of these kilns is higher because of the non-stop character of the process. Ten to fifty tonnes per day can easily be produced, of course depending on the size of the kiln. Modern continuous VSK's have capacities ranging to more than 500 tonnes per day.
Rotary kilns (RK) Large scale production plants for cernent rnanufacture or high-grade chemica} lirnes, ernploy rotary kilns. These kilns can produce a few hundred up to 1500 tonnes per day. Fuel efficiency is in general a little higher than a properly constructed and operated vertical shaft kiln 1•
The actual kiln consists of a slightly inclined tube of 2-4rn diameter and 20-60rn length, that slowly revolves. The interior of the kiln is lined with refractories. Hot gases are blown through the tube. The lirnestone is usually rnuch smaller than in VSK's and is fed on the upper side of the kiln. When the stones are discharged on the lower side of the kiln, they are already calcined.
The restrictions in gradation and the high degree of instrurnentation ensure a high quality and uniforrnity of the product. This relatively expensive technology is not rnuch applied in developing countries.
Fuel The most cornrnonly used fuel in smali-scale lirne production is wood. This is mixed with the lirnestone and set on fire. As scale increases, the process allows for more control and more efficient use of fuel. Coal rnay be used for firing or oil or even gas. The last two can be of
Jongsma, 1., Egmond, E. van, A mini success; is Indian VSK technology about to conquer Africa? in: International Cement Review, November, 1996. p.36-41
47
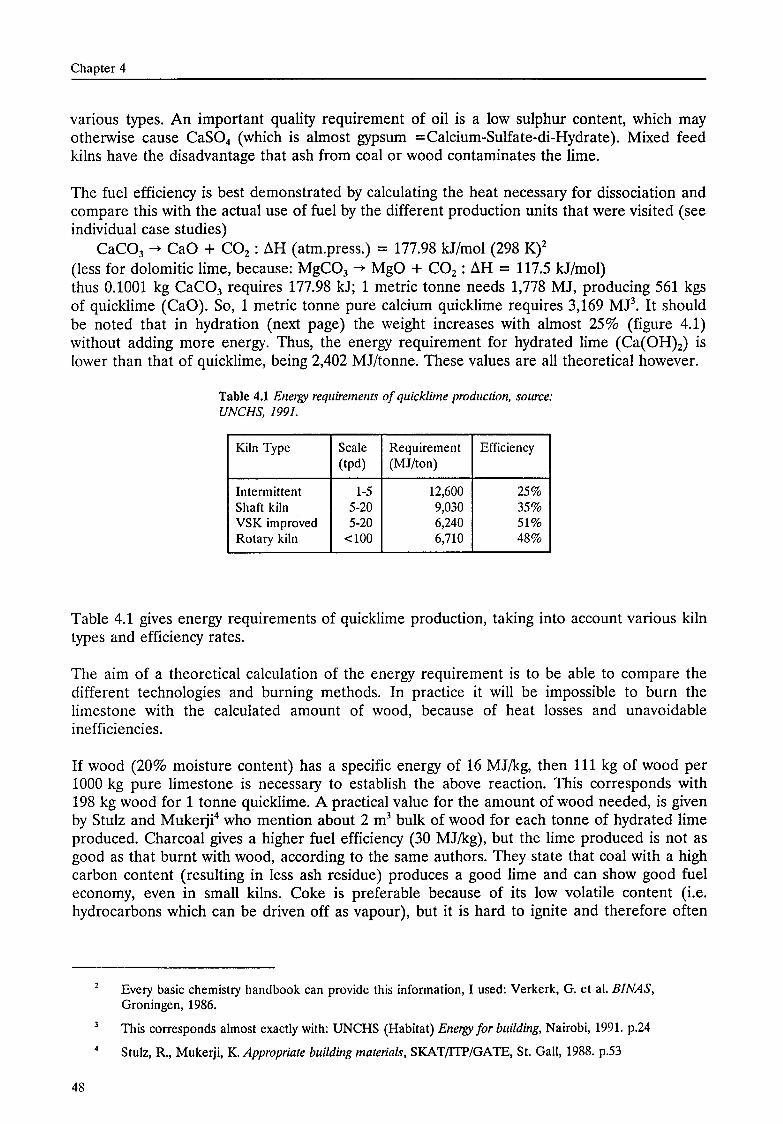
Chapter 4
various types. An important quality requirement of oil is a low sulphur content, which may otherwise cause CaS04 (which is almast gypsum =Calcium-Sulfate-di-Hydrate). Mixed feed kilns have the disadvantage that ash from coal or wood contaminates the lime.
The fuel efficiency is best demonstrated by calculating the heat necessary for dissociation and campare this with the actual use of fuel by the different production units that were visited (see individual case studies)
CaC03 ~CaO+ C02 : ÄH (atm.press.) = 177.98 kJ/mol (298 K)2
(less for dolomitic lime, because: MgC03 ~ MgO + C02 : ÄH = 117.5 kJ/mol) thus 0.1001 kg CaC03 requires 177.98 kJ; 1 metric tonne neects 1,778 MJ, producing 561 kgs of quicklime (CaO). So, 1 metric tonnepure calcium quicklime requires 3,169 MJ3
• lt should be noted that in hydration (next page) the weight increases with almast 25% (figure 4.1) without actding more energy. Thus, the energy requirement for hydrated lime (Ca(OH)2) is lower than that of quicklime, being 2,402 MJ/tonne. These values are all theoretica! however.
Table 4.1 Energy requirements of quicklime production, source: UNCHS, 1991.
Kiln Type Scale Requirement Efficiency (tpd) (MJ/ton)
Intermittent 1-5 12,600 25% Shaft kiln 5-20 9,030 35% VSK imprcived 5-20 6,240 51% Rotary kiln <100 6,710 48%
Table 4.1 gives energy requirements of quicklime production, taking into account various kiln types and efficiency rates.
The aim of a theoretica! calculation of the energy requirement is to be able to campare the different technologies and burning methods. In practice it will be impossible to burn the limestone with the calculated amount of wood, because of heat losses and unavoidable inefficiencies.
If wood (20% moisture content) has a specific energy of 16 MJ/kg, then 111 kg of wood per 1000 kg pure limestone is necessary to establish the above reaction. This corresponds with 198 kg wood for 1 tonne quicklime. A practical value for the amount of wood needed, is given by Stulz and MukerW who mention about 2 m3 bulk of wood for each tonne of hydrated lime produced. Charcoal gives a higher fuel efficiency (30 MJ/kg), but the lime produced is not as good as that burnt with wood, according to the same authors. They state that coal with a high carbon content (resulting in Iess ash residue) produces a good lime and can show good fuel economy, even in small kilns. Coke is preferabie because of its low volatile content (i.e. hydrocarbons which can be driven off as vapour), but it is hard to ignite and therefore often
48
Every basic chemistry handbook can provide this information, I used: Verkerk, G. et al. BINAS, Groningen, 1986.
This corresponds almost exactly with: UNCHS (Habitat) Energy for building, Nairobi, 1991. p.24
Stulz, R., Mukerji, K. Appropriate building matelials, SKAT/ITP/GATE, St. Gall, 1988. p.53

Tlze Lime Production Process
mixed with coal. Liquid fuels (and gaseous) -though more expensive- are easier to handle than solid fuels and burn without producing ash which contaminates the lime.
A calculation of the theoretica! requirement of furnace oil with a specific energy of 40.103
MJ/m3 indicates that at least 44.5 litres per tonne limestone are necessary to establish dissociation; equal to 79.2 litres per tonne quicklime. Assumed that natura! gas5 has a specific energy of 30 MJ/m3 (or 36 MJ/kg), so 60 cubic metres (49 kg) of gas would be needed (at atmospheric pressure) per tonne CaC03 and 106 m3 (88 kg) gas per tonne CaO. Normally, gases are transported and bought under pressure, so less volume is taken than those cubic me tres calculated (of course the mass remains unaltered).
In a comparison of the different fuels, the cambustion products have to be taken into consideration as well. They appear in the form of dust, suspended particulate matter (SPM) and gaseaus pollutants. Impraper cambustion of coal creates carbon monoxide gas, which is toxic. Other gases are C02 (the larger part of this is created by CaC03 dissociation), H2S and S02 (sulphur contained in coal or oil). The unnecessary release of these gases results in a loss of calorific value of the fuel, thus operating on unnecessary high fuel rates.
Complete calcination of 1 tonne of CaC03 releases 440 kg C02• Also, the cambustion productsof the fuel partly consist of C02 (see figure 4.1). This gas is assumed to contribute to global warming. However, there is still no scientific consensus on this subject. Some authors state that 'more C02 leads to a warmer earth6
' while others conclude that 'any effects of the increase in atmospheric carbon dioxide on the earth's average surface temperature can not be distinguished from the background of natura! variability7
'. The same publication concludes that 'we don't know that the world is definitely warming, given recent satellite data. lf the world is warming, we don't know what is causing this change -man or nature. We don't know whether a warmer world is good or bad.'
With respect to health hazards created by working with lime, research8 revealed that pulp-mill workers exposed to lime dust had an impaired nasal clearance function. Kiln workers that were exposed to burnt lime often complained of irritation of their eyes, nose and throat. Mter reducing dust levels, nasal clearance improved. The irritation is probably due to the alkalinity (high pH-value) of the lime. Other publications wam for the aggressive character of quicklime as well9
• During hydration, the temperature of the material may exceed 200° C and there will be a volume expansion of 200-300%.
9
Pure gases: Methane (CH4) = 35.8 MJ/m3 = 49.7 MJ/kg; Propane (C3Hx) = 93.8 MJ/m3 = 46.4 MJ/kg; Butane (C4Hw) = 120.7 MJ/m3 = 45.2 MJ/kg.
S. Arrhenius in: Calmthout, M. van, Het broeikas effect, Vereniging Milieudefensie, Utrecht/Amsterdam, 1990. p.27
Various authors in: Emsley, J. (ed.) The global wanning debate, the report of the European Science and Environment Forum, ESEF London, March 1996. (quote: p.69, 19)
Torén, K., Brisman, J., Hagberg, S.,Karlsson, G. Improved nasal clearance among pulp-mil! workers after the reduction of lime dust, Scandinavian Journat of Work, Environment and Health, (no. 22) 1996. p. 102-109 (All authors work at the Sahlgrenska University Hospital, Göteborg, Sweden)
Houben, H., Guillaud, A. Traité de construction en terre, CRATerre, Marseille, 1989. p.409
49
Chapter 4
Hydration A theoretica! calculation of the amount of water necessary for hydratien ( or slaking) burnt lime gives the following results. The reactions that are taking place during the hydratien process:
CaO + H20 ~ Ca(OH)2 56.1 + 18.0 ~ 74.1 (molecule mass) MgO + H20 ~ Mg(OH)2 40.3 + 18.0 ~ 58.3 ( " " )
For 1 tonne pure CaO, 320.9 litre10 pure water is needed, assuming that no water evaporates. One tonnepure MgO neects 446.7 litre water. Fora pure dolomitic limestone (54/46) at least 173.3 + 205.5 = 378.8 litre water is necessary.
However, part of the water evaporates as it is heated by the energy release of the quicklime (see figure 4.1). A dolomitic lime is sametimes called 'cold-slaking' because less heat is released during hydration. The magnesium-oxide is far less reactive with water than calciumoxide. This demands a different approach in hydration, because the magnesium content has a retarding effect on hydration. The oldest and simplest way of hydratien is the batch method. This method is largely replaced by continuous automated slaking machines in large factories. The Iabour intensive nature of the batch process, the safety problem from lime burns and the unavoidable waste of lime have stimulated the development of these automatic hydrators. Various quicklimes slake differently, so the slaking procedure should be closely monitored. To assure complete hydratien the lime should be slaked at least thirty minutes. Ageing the resulting 'putty' for twelve hours or a few days generally improves the efficiency of the product, provided it is covered to prevent carbonation. This was done traditionally by timeproducers in the Europe, where the lime was immersed under water for several days, to ensure complete hydratien and good workability. 11
Crushing In the production process of lime hydrate, crushers or mills can be exploited in various phases in the process. Several types of mills and crushers are available today. The most common are ball mills, jaw crushers and roll mills. The objective of this equipment is to decrease the size of the materiaL This is necessary in at least two stages of the process. To obtain the right size of kiln feed, the raw limestone neects to be crushed and selected. To improve reactivity of quicklime the surface area neects to be increased, for which the material has to be crushed.
Transport On-site transport can take place using various kinds of machinery or simple equipment like wheelbarrows. More sophisticated means of transport are conveyor beits and hoists. In most cases these are driven by motors that require fuel or electricity.
4.3 Flow Chart
The essence of a technology is that it transfarms inputs into outputs. However, various steps have to be taken in this transformation. Insight in this process is obtained by mapping the
10
11
50
56.1=100%; (18/56.1)*100=320.9
Wetenschappelijk en Technisch Centrum voor het Bouwbedrijf, Beschouwingen over de karbonatie van vette kalk voor binnenpleisterwerk, no.53, Brussel, October 1965. p.4
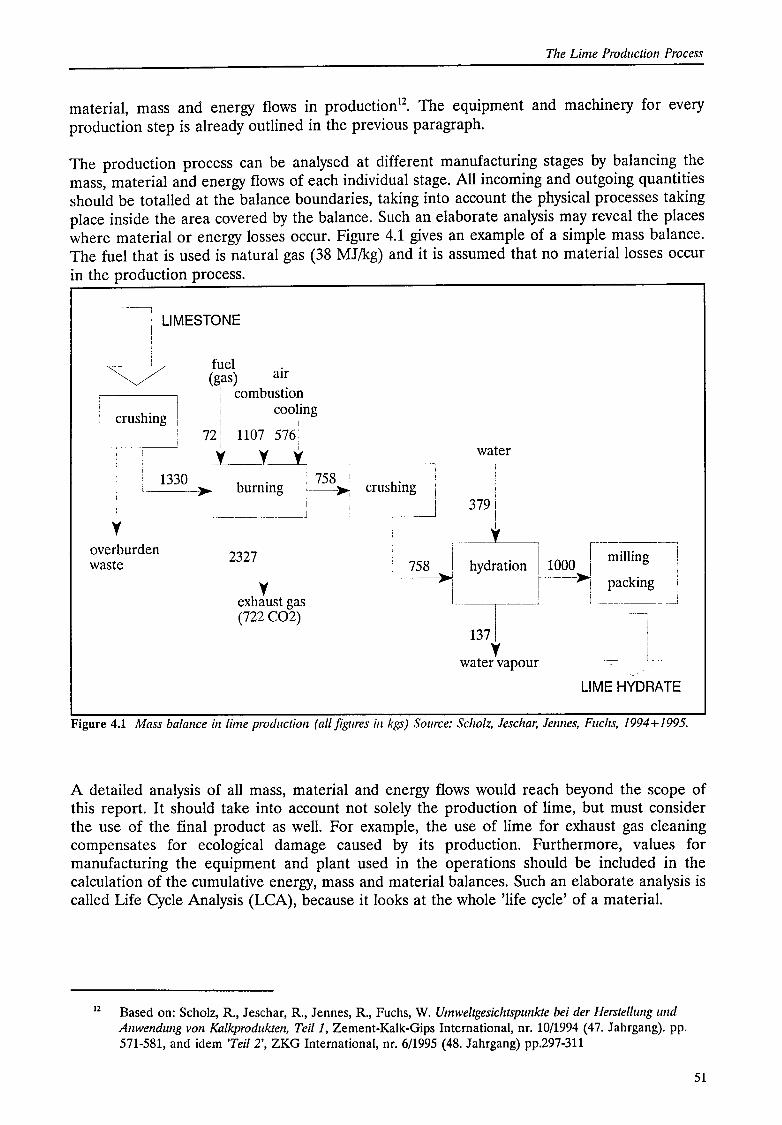
The Lime Production Process
material, mass and energy flows in production12• The equipment and machinery for every
production step is already outlined in the previous paragraph.
The production process can be analysed at different manufacturing stages by balancing the mass, material and energy flows of each individual stage. All incoming and outgoing quantities should be tatalied at the balance boundaries, taking into account the physical processes taking place inside the area covered by the balance. Such an elaborate analysis may reveal the places where materialor energy losses occur. Figure 4.1 gives an example of a simple mass balance. The fuel that is used is natural gas (38 MJ/kg) and it is assumed that no materiallosses occur in the production process.
r-~ LIMESTONE i
crushing
1330
fuel . (gas) atr
· cambustion cooling
I
72 ~ 1107 576: I ;
y__y _______j_ I !
water
i '·---)loo- burning ' 758 h" '-->: crus mg '
379 i I y
overburden waste
i 1 •• ___ ·---_j
2327
y exhaust gas (722 C02)
t r r·---------~
758 I hydration !1000 i milling ! ---~ r··-->-j packing i
1 .. ~ i --------- i
1371 y
water vapour
LIME HYDRA TE
Figure 4.1 Mass balance in lime production (all figures in kgs) Source: Sc/zolz, Jeschar, le!mes, Fuchs, 1994+ 1995.
A detailed analysis of all mass, material and energy flows would reach beyend the scope of this report. It should take into account not solely the production of lime, but must consider the use of the final product as well. For example, the use of lime for exhaust gas cleaning compensates for ecological damage caused by its production. Furthermore, values for manufacturing the equipment and plant used in the operations should be included in the calculation of the cumulative energy, mass and material balances. Such an elaborate analysis is called Life Cycle Analysis (LCA), because it looks at the whole 'life cycle' of a materiaL
12 Based on: Scholz, R., Jeschar, R., Jennes, R., Fuchs, W. Umweltgesichtspunkte bei der Herstellwzg wzd Anwendung von Kalkprodukten, Teil!, Zement-Kalk-Gips International, nr. 10/1994 (47. Jahrgang). pp. 571-581, and idem 'Teil 2', ZKG International, nr. 6/1995 (48. Jahrgang) pp.297-311
51
Chapter 4
4.4 The Case Studies
This paragraph will focus on the process of the lime production in Tanzania. A number of lime projects were visited during September and October 1996. The information was gathered through structured interviews -at least where possible- and observations. It makes a good presentation of the limeburning technology used in Tanzania and indicates most of the problems of these projects.
A list of production units in Tanzania can be found in annex F of this report. These units were sent a letter in which they were asked to inform the author on whether they were producing at the moment or not. lf not, they were asked to give the cause for this. In the same letter the possibility of visiting the projects was suggested. Only three production units responded. All units mentioned problems in production. Eventually, seven projects were visited, which is mentioned in the table. The first and third case study are more elaborate than the ethers, because the management of these units effered their full cooperation to study the projects. In annex G, a questionnaire can be found, which was used as a guideline for the case studies.
4.4.1 Mvumi Lime Factory ·Dodoma Mvumi Lime Factory in Dodoma started eperating in its today form in 1974. It was set up by the National Housing Corporatien (NHC). The purpose of eperating this factory is both economical as well as demonstrational. Economical in the sense that the lime is used in the corporations construction activities and the rest is sold to the general public. Demonstrational for the public to learn on how to produce lime in their localities for their own use and income generating purposes. The factory is located 60 km south of Dodoma. The roads to the project are in a bad condition and no public transport is going to the Ilinga-Mvumi village. The site can only be reached by private vehicle.
The reasen for setting up the project was a shortage of lime that was needed for the construction projects by the NHC in Tanzania. An employee, the present manager, proposed to set up an own NHC lime factory. For the preparations, assistance was found with SIDO. After some time the quality of the product appeared to be very well and soon commercial (non-NHC) orders were set. Today it is still a 100% NHC project, though completely selfsustainable. From all the lime produced, one third is consumed by the NHC and the ether part is sold in retail. Since 1974 there have never been problems to sell the product.
The location where the project can be found today was already in use by someone who produced lime, though no kiln was used for this (heap burning only). Some sheds were already built on the site. With the help of SIDO, technica} actvice on the construction of a kiln was provided.
The limestone that is used for burning is found in the close vicinity of the plant. At the moment, quarrying is done manually. The project owns a caterpillar soil moving machine, which was out of order by the time of the visit, but the manager is waiting for spare parts for this machine. These spare parts have to come from Dar es Salaam. Limestone is found after removing approximately 1 foot of overburden, consisting of red soil and organic materiaL The limestone is not found in beds, but in large bolders13
• The limestone layer is not thick, varying from 1 to 1.5 meter. The bolders are broken manually using club hammers. The broken lumps
13
52
Socalied mbuga Iimestone. A mbuga is a seasonal swamp covered by grass and reeds and practically treeless.
Tlze Lime Production Process
are transported to the kiln with a small front loader. On average 50 tonnes of limestone are used per month.
There is no quality control on the limestone. In 1989 a limestone analysis was made by the farmer Ministry of Industries, Mineral Resources and Power (Dodoma Laboratories). This was done to assess the possibility of delivering hydrated lime to the sugar industry. The results are shown in box 4.1. The outcome however was doubtful for two reasons, both concerning the low Box 4.1 Limestone Analysis (Min. Ind. Min. MgO content. A visual impression of the raw material Res. & Power)
suggests a higher MgO and/or lower CaO content, because of the colour of the stone, which is not very white. A secend reason for suspecting errors is the necessary quality for the refining of sugar. The MgO content must be less than 1% for this application. Apart from this, only one sample was taken, which cannot give a representative outcome since the limestone is not found in beds.
The project uses two types of fuel. Firewood is used for burning the limestone. A diesel engine is used for driving the mill that grinds the hydrated lime and diesel is used for the two trucks, front leader and caterpillar. No electricity is used.
The provision of sufficient and well-sized firewood is the main problem of the project. While the firewood used to come from close surroundings, nowadays distances of sametimes 15 kilometres have to be travelled to find the right size of logs needed for firing. The trucks are used for this, which means extra fuel consumption and Iabour costs. The project manager is planting new trees, but this is only done in the rainy season and it cannot keep pace with the consumption of wood. This is also the restraining factor in expanding the business. Logs of 20 to 30 centimetre in diameter are needed, otherwise they would burn too fast. Sametimes the logs are moistened for the same purpose. The firewood doesn't have to be paid for, this is only done for petrol and Iabour. For one batch (firing) of the large kiln 20 cubic meter of firewood is necessary and for the small kiln 8 m3
•
The engine that is connected to the milling machine with a triple v-belt, uses on average 20 litres of diesel for approximately 8 hours. In this time, 200 bags of lime can be milled (one week production). The diesel eernes from Dodoma and casts approx. 0.50 US$ I litre (280 Tsh). The engine eernes from the U.K. and has notbeen out of order since the last 7 years.
The kilns that are used were built by SIDO. There are two vertical shaft kilns, that are both operated in batch (intermittent). When they are filled on the first day, they can be emptied on the fourth or fifth day.
The designs that were used for the kilns come from KVIC and were used by SIDO around the time of building the kilns. The larger kiln is 4 meter in height and has a 6 meter diameter ( outside-outside ). The smaller kiln is of the same height, but has a diameter ( o-o) of 4 meter. The walls are the same for both kilns and they are made from burnt bricks and built up as fellows (inside lining-cavity-outside wall) 23-15-50 centimetre. This makes a total wall thickness of 87 cm. The kilns are both cylindrical in shape. The tops of both the kilns are open which makes it difficult if not impossible to operate during the rainy season. In Dodoma this is from December to March.
Large kiln: Floor area: 7Tr2 = 3.1415 * (2.13)2 = 14.25 m2
53
Chapter 4
Small kiln:
Height: 4 m * 14.25 m2 = 57.01 m3
Floor area: 7Tr2 = 3.1415 * (1.13)2 = 4.01 m2
Height: 4 m * 4.01 m2 = 16.05 m3
The kilns are not completely filled. Firing is done 4 times per month for the large kiln and 8 times per month for the small kiln. The raw materials mix is fed in the kiln manually, in Iayers. The large kiln can be filled with 25 m3 Iimestone and 20 m3 firewood. The small kiln can use 8 m3 limestone and 8 m3 of firewood. If the density of the limestone is 1400 kg/m3
(which was mentioned by the manager) then 4*25*1400= 140 tonnes limestone per month can be used for the large kiln and 8*8*1400= 89.6 tonnes for the small kiln. Tagether this would mean a consumption of 229.6 tonnes limestone per month (capacity basedon 12 batches).
However this capacity is not utilised. At the moment (September/October 1996), the situation is as follows, according to the manager: limestone use: 50 tonnes per month firing large kiln 4 times per month
small kiln 8 times per month result dry hydrate: 1400 bags/month14 * 25 kg = 35 tonnes.
The 50 tonnes limestone and 35 tonnes dry hydrate do not conform eachother. Expected yield from 50 tonnes limestone = 30 tonnes dry hydrate, based on atomie mass comparison:
CaC03 ~ CaO + C02 & CaO + H20 ~ Ca(OHh 100.1 ~ 56.1 + 44.0 & 56.1 + 18.0 ~ 74.1
Assuming 80% CaC03 (based on limestone sample from Min. lnd. Min.& Pow) this would mean 0.8*74.1 = 60 tonnes out of 100 tonnes limestone = 30 out of 50. Another 20% underburnt material would mean 0.80*30 = 24 tonnes usabie lime. The figure of 50 tonnes/month limestone is probably underestimated.
The size of the kiln feed is not very uniform, though an ideal size of 12 cm is strived after. The stanes are braken manually, which gives a fluctuation in size. Mechanica! crushers are not used in the project.
The discharge of the kiln is done manually as well and hand shovels are used to do this. Wheelbarrows are available on the site. The temperature in the kiln is not recorded, though in most parts of the kiln this must reach above 900° because the larger part of the kilncharge is burnt. Approximately 20% of the quicklime is underburnt. This part is put in the kiln again, during a following batch. There is no problem of overburning. Sametimes there are granite lumps in the feed, which is discovered afterwards when the quicklime is hydrated and sieved.
The refractory lining is subject to deterioration and is renewed every two years. The refractory bricks were coming from Dar es Salaam, though nowadays they are produced in Dodoma.
After leaving the kiln all the quicklime is hydrated on a roofed platform. This is done manually. The water used for hydration (sprinkled on the burnt lime) comes from a pump 15 km away from the project site. The water is kept in a tank which is transported by one of the trucks. There are no casts attached to the water, but diesel is given to operate the mechanica!
14
54
Based on sales of 12,620 bags during jan-sept 96, so 12,620 divided by 9 months = approx. 1400 bags/ month.

The Lime Production Process
pump. The same water is used for the radiator of the diesel engine that is connected to the mill. After the first hydration, the hydrate is sieved using a 2-3mm wire screen. The course particles that remain on the screen are mostly unhydrated quicklime parts. These are hydrated again and sieved again. The powder is already of a fine nature, but it is then milled to get an even finer materiaL
The milling machine causes a lot of dust, which is deleterious for lungs and makes breathing difficult. I t is caused by chinks in the machine. As the machine is ageing, the joints of different parts of the mill have started leaving some play, through which the dust is let out. By sealing the joints, seams and chinks the amount of dust can be reduced, though it is hard to prevent this dust completely. To control the dust from processes like this completely, the process itself will have to be altered as well.
The fine dry hydrated powder is packed in bags, which is also done manually. The thick paper bags are produced by KIBO Paper products in Dar es Salaam. They are filled up to 25 kgs and weighted using a balance. The bags can be sealed manually. One ( empty) bag costs 290 Tsh15
• The campany's logo is printed on it in Kiswahili on one side and on the other side in English. The bags are sold in wholesale for 1500 Tsh and for 1700 in retail, however in some shops in Dodoma the bags were priced at 1800 Tsh.
The project employs 3 people permanently. These are one foremen, one driver and one watchman. Together with the manager, they are all employed by the National Housing Corporation. From July 1996 onwards, the project is eperating (financially) independently. When production level is normal, some 15 people are employed. They all come from the nearby village. The project is only working during daytime.
The employees are provided with mouth masks against the dust, though not everyone wears one. Some employees were coughing heavily. Official regulations demand more measures, but these are not carried out. There have not been any accidents since the project started operating in 1974.
No measures are taken to prevent environmental pollution. There is no direct hinder from the dust, since there are no people living in the close neighbourhood. The useless byproducts (unburnt material) are used for road impravement to the project site. This is done before the raining season starts.
The only means of transport are the two trucks, the small front loader and the caterpillar. There are no conveyor beits or other internal transport systems. The lime is sold in Dodoma and it is brought there by the trucks. One truck can take 200 bags on one trip, which costs 20,000/= Tsh.
The main problem -as mentioned earlier- is the shortage of firewood. There has been a trial run using coal as fuel. This coal came from Mbeya region, but proved to give too much ashes 16
• An extra problem would be the large distance between Mbeya region and IlingaMvumi and the Iringa-Dodoma road is in a very bad state. For this problem is no solution found yet and it is the only limiting factor in increasing production, which would mean a higher capacity utilisation.
15 Rates October 1996= 590 Tsh for 1 US$ 16 The same problem was found at the Mbeya Cement Factory. Coal is now imported from Malawi.
55
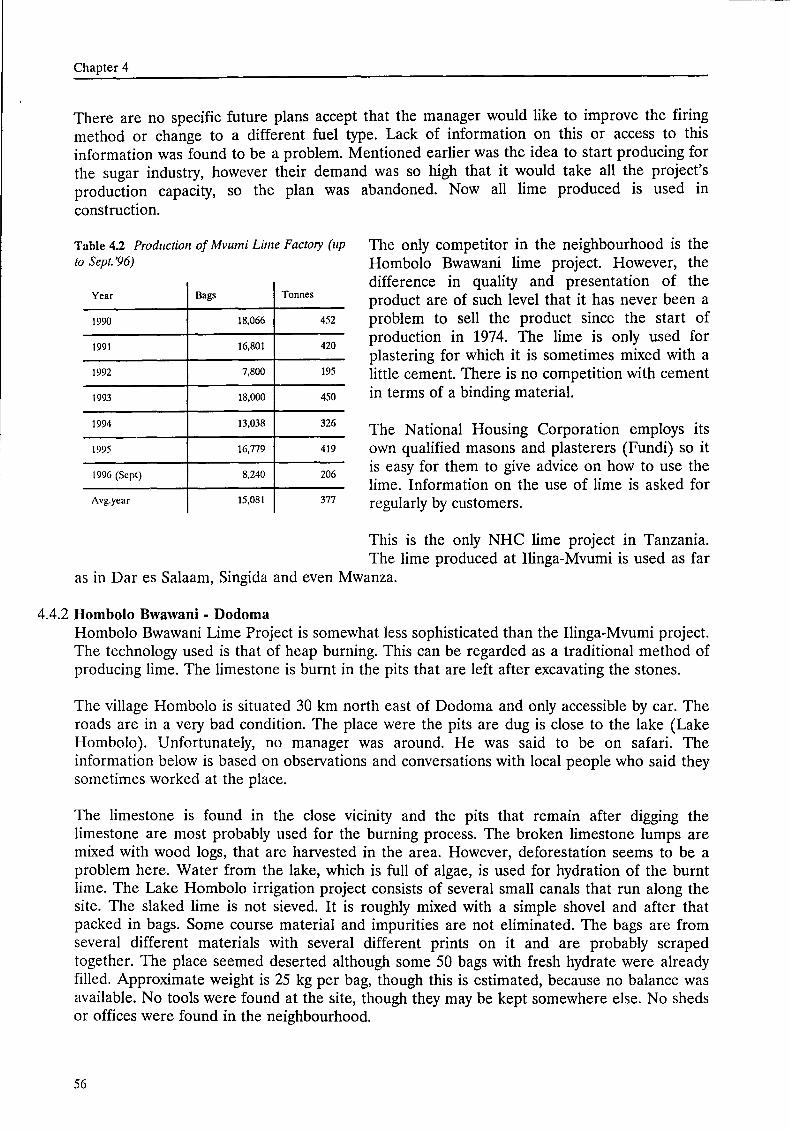
Chapter 4
There are no specific future plans accept that the manager would like to improve the firing metbod or change to a different fuel type. Lack of information on this or access to this information was found to be a problem. Mentioned earlier was the idea to start producing for the sugar industry, however their demand was so high that it would take all the projeet's production capacity, so the plan was abandoned. Now all lime produced is used in construction.
Table 4.2 Production of Mvumi Lime Factory (up to Sept. '96)
Year Bags Tonnes
1990 18,066 452
1991 16,801 420
1992 7,800 195
1993 18,000 450
1994 13,038 326
1995 16,779 419
1996 (Sept) 8,240 206
Avg.year 15,081 377
The only competitor in the neighbourhood is the Hombolo Bwawani lime project. However, the difference in quality and presentation of the product are of such level that it bas never been a problem to sell the product since the start of production in 1974. The lime is only used for plastering for which it is sometimes mixed with a little cement. There is no competition with cement in terms of a binding materiaL
The National Housing Corporation employs its own qualified masons and plasterers (Fundi) so it is easy for them to give actvice on how to use the lime. Information on the use of lime is asked for regularly by customers.
This is the only NHC lime project in Tanzania. The lime produced at Ilinga-Mvumi is used as far
as in Dar es Salaam, Singida and even Mwanza.
4.4.2 Hombolo Bwawani - Dodoma Hombolo Bwawani Lime Project is somewhat less sophisticated than the Ilinga-Mvumi project. The technology used is that of heap burning. This can be regarded as a traditional metbod of producing lime. The limestone is burnt in the pits that are left after excavating the stones.
The village Hombolo is situated 30 km north east of Dodoma and only accessible by car. The roads are in a very bad condition. The place were the pits are dug is close to the lake (Lake Hombolo). Unfortunately, no manager was around. He was said to be on safari. The information below is based on observations and conversations with local people who said they sometimes worked at the place.
The limestone is found in the close vicinity and the pits that remain after digging the limestone are most probably used for the burning process. The broken limestone lumps are mixed with wood logs, that are harvested in the area. However, deforestation seems to be a problem bere. Water from the lake, which is full of algae, is used for hydration of the burnt lime. The Lake Hombolo irrigation project consists of several small canals that run along the site. The slaked lime is not sieved. It is roughly mixed with a simple shovel and after that packed in bags. Some course material and impurities are not eliminated. The bags are from several different materials with several different prints on it and are probably scraped together. The place seemed deserted although some 50 bags with fresh hydrate were already filled. Approximate weight is 25 kg per bag, though this is estimated, because no balance was available. No tools were found at the site, though they may be kept somewhere else. No sheds or offices were found in the neighbourhood.
56
The Lime Production Process
It is not known how many people are involved in this project and how many batches per month are fired. Given the size of the pits, the author estimated a 1-2 ton production of hydrate per batch. It is not known how long the people are already producing lime in this area.
4.4.3 Simba Lime Factory • Tanga Simba Lime Factory, formerly known as Tanga Lime Factory Ltd., can be found 15 kilometre outside Tanga in Pongwe, a few hundred meters from the road Dar es Salaam-Tanga. It is situated behind the Maweni Prison. The factory has changed from ownership in August 1996. The former Tanga Lime Factory had stopped eperating in 1993 because of the death of one of the owners. The factory was built by Greeks in 1965, though without a kiln. The raw limestone was only ground and milled and used as a fertilizer for the sisal plantations in the Tanga region. In 1974 a vertical shaft kiln was built that is still eperating today. Because of the recent take-over, not much is known about the history of the factory, except from some old black and white photographs.
The new owner, who has no experience in lime production, said to have three questions. He wanted to know about the use of lime in different fields, the method to produce the best lime and any new technica! methods or machineries to boost the existing production.
The limestone is quarried close to the actual factory. The company owns 250 acres of land, of which only part is yet in use. By using rented drill compressors, bore holes are drilled in which explosives are put. After this, the stones are broken manually, using hammers, to a size of approximately 12 cm. and loaded to a truck. The latter is also done manually. Every 24 hours, six truck loads of seven tonnes leave the quarry. The explosives used for blasting the rock come from AISCO, Dar es Salaam.
The quality of the Iime has been tested a few times in 1994 at the Simba Cement Factory, by the Tanzania Bureau of Standards and by the Mtibwa Sugar Factory (Morogoro ). However, all these reports give different values for the contents of the lime produced. Nothing is known about the porosity of the stone, though it seems a dense, hard stone. The owner could not teil anything on the mining claim, but he assumed it had been taken over when he bought the factory.
The factory uses electricity and heavy fuel oil. The first is used for the various electrical motors everywhere in the process 17
, the second is used for firing the kiln. The oil is bought from TOT AL in Dar es Salaam and is used at a ra te of 2,250 litres per 24 hours. The current price that is paid for the crude oil is 148.8223 Sh/ltr. 18 The electricity used is standard 220 Volt and according to the manager between 1,3 and 1,4 million shilling per month had to be pa id.
The rectangular cross section kiln that is used is a vertical shaft kiln of 15 meter in height, the outside is 3.60m by 4.90m. The kiln has no chimney. Two exhaust fans on top create draught. Halfway the kiln, a platform is built, where the burning chamber is located. On two sides of the kiln are each 4 burners, through which the oil, mixed with air, is injected. The air comes from an electrical blower. The oil is brought under pressure by two pumps. The oil is stored outside the kiln in a tank. The firebrick lining (refractories) are renewed after 9 months and
17 See annex H.
·~ This is in October 1996. One oil tank truck brings 16,500 litres for 2,455,567.95 Shillings.
57
Chapter 4
replacement takes about one month. Only the first of four layers is replaced. The refractories are bought in Kenya, though they are imported in Kenya from Germany.
The limestone is fed in the kiln using an inclined bucket hoist which is driven by an electrical motor. The bucket can contain 1 tonne of raw materiaL So the filling of the bucket, as well as the filling of the kiln is done automatically. The raw material is stared in a small structure which is filled manually using wheelbarrows. From this structure the bucket goes up to the kiln. The design of the kiln is probably of Greek origin, though no-one could elaborate on that. There are no drawings.
The kiln operates its continuons process during six days per week. Every 24 hours, the kilnis filled and emptied completely 6 times. The stanes are thus heated during 4 hours. There is no temperature control that registers the inside temperature, though according to senior personnel, there used to be a temperature gauge which has been out of order for a long time. Flames from the oil burners were of an orange colour, which indicates that this is not the maximum temperature that can be reached using oil. However, the maximum temperature should in fact not be reached, because it will be too high for efficient burning of the stone. The stokers are unskilled and work on a routine basis, they make use of their past experience, which they refer to as 'fingerspitzengefühl'.
The percentage of unburnt or overhumt material in not registered. However, large heaps of useless material are piled alongside the factory during the past years. The workmen were telling that from every discharge, five wheelbarrows of limestone are put back into the kiln. The remaining useless material is sametimes used to strengthen the roads to the site. The workmen said that the quantity of useless material was related to the pouring in the kiln, which is done in the burning chamber. During this pouring, sametimes hot stanes fall through the ponring holes in the kiln. The discharged stanes have caoled down significantly, indicating a good draught through the kiln.
After the discharge, the stone is brought to the slaking platform by wheelbarrows. The burnt stanes are put in heaps. When sufficient stanes are collected, a water hose is put inside the heaps and according to the site manager per tonne approximately 60 to 70 litres water is added. However, this figure is far too little, as was shown in a previous paragraph. The stanes break during this process, which is an indication for the workers that they are adequately burnt. The slaked material is left 4 to 6 hours for cooling. After cooling, the material is sieved and partly ground on mesh wire tables, using an approximate 1 cm. mesh size. This is done to select the burnt and unburnt material, the latter remains as course particles. Every man in this section has to sieve one tonne slaked lime, which causes one wheelbarrow of useless materiaL The water used for slaking is ordinary Tanga tapwater. Because of unregular supply, there is a self dug pit in which water is kept that can be used during water-breakdowns. An electrical pump is used to pump up this water.
The next step in the process is the final milling of the hydrate after which it is packed. The mill however, requires that the material which has to be milled is very dry. Sometimes, the slaking of the burnt lime results in a too wet materiaL It is then left to dry on a platform.
It should be noted that at this stage the material consists of saturated Ca(OH)2 in water. During drying there is a release of water (H20) that evaporates, however, the Ca(OH)l changes into CaC03 because of a reaction with C02 in the air (carbonation), thus releasing H20 from a chemica! reaction. This is exactly what should not happen, because the reactive Ca(OH)2 is the main constituent that makes a good lime.
58
The Lime Production Process
The milling machine is of unknown origin and already installed from the first moment on in 1965. The engine that is used to drive the mill is a 60 hp electrical motor. There is no final quality control on the lime. Sametimes -on special request- the factory produces very fine milled limestone that can be used as fertilizer.
The packing is done manually. Bags are connected to the milling machine and after they are almast filled, they are weighted using an ordinary balance. The shortage is then filled up or a surplus is removed. The bags are sealed by laying a knot in the polypropylene bags. These bags come from the PeePee Tanzania plastic factory in Tanga.
The bags are of two types, a 25 kgs bag and a 12 kgs bag. The latter is especially made for the construction sector, on special request of the retail shops in Tanga, since they found it difficult to sell the 25 kgs bags. One empty woven polypropylene 25 kgs bag costs 220 Tshs 19 and a 12 kgs bag costs 135 Tshs20
• The bags still have the old campany's logo on it. The owner has not yet made new bags 'because of the reputation of the former Tanga Lime Factory'. Some bags were not air tight and lost some hydrate while loaded on trucks.
The price of a 25 kgs bag is 1300 Tshs in wholesale (or 50,000 per tonne) (Oct.'96). The factory sells 70% of all production to sugar factories in Tanzania. The remaining 30% is bought by shops in Tanga, who sell it for whitewash and some lime is used by the Tanga water supply for purification of water.
At the moment 530 bags per 24 hours are produced (25kgs), amounting to 13.25 tonne. The five sugar factories are supplied by Simba Lime. All of these factories have a low capacity utilisation21 indicating a possible rise in demand for lime when capacity utilisation increases. None of the lime is exported, though if production could be expanded the owner is determined that he could easily sell his lime in Kenya, because of the high quality Pongwe limestone. Unfortunately, nothing is known about past production and no administration of this was supplied to the new owner.
At the moment, 45 people are werking for Simba Lime. Most of the employees used to work at the factory befare the take-over. According to senior labourers, the factory employed some 120 people in its top days. Another souree mentions 90 employees in 199022
• There are three shifts of 8 hours each, except for Sundays when there is no production. Almast all workers come from the nearby village. If people from the village have to go to the hospita! they can sametimes make use of the trucks from the factory.
With respect to safety, the factory disposes over uniforms, mouthmasks, goggles and rubber boots. Only few men are actually using the uniforms, masks and goggles. The workers involved in the hydration of the burnt stone wear their boots because the temperatures can raise substantially and a lot of steam is produced. Apart from this nobody wears boots. They are said to be too hot to wear and your feet start sweating in them. People complained about the mouthmasks that they were made for 'European noses' instead of their 'African type noses'.
I 'I
20
21
22
size 56 x 78 cms.
size 45 x 72 cms.
Sawe, N. Bioenergy based industries in Tanzania, MWEM, feb. 1995. p.27 (see also table 3.3, paragraph 3.4.1)
Austroplan, Development of time production in the SADCC region, United Nations, New York, 1990, in: Production and Consumption of binders in Tanzania, workshop papers, 1994.
59
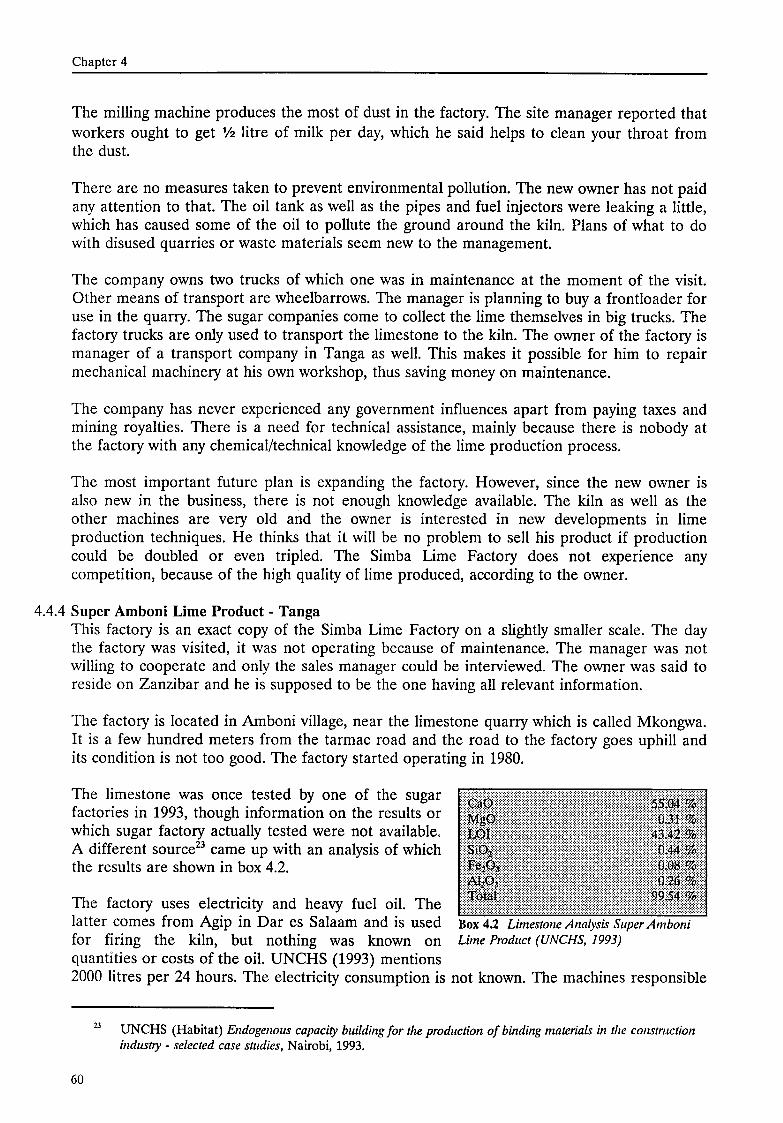
Chapter 4
The milling machine produces the most of dust in the factory. The site manager reported that workers ought to get 1f2 litre of milk per day, which he said helps to clean your throat from the dust.
There are no measures taken to prevent environmental pollution. The new owner has not paid any attention to that. The oil tank as well as the pipes and fuel injectors were leaking a little, which has caused some of the oil to pollute the ground around the kiln. Plans of what to do with disused quarries or waste materials seem new to the management.
The company owns two trucks of which one was in maintenance at the moment of the visit. Other means of transport are wheelbarrows. The manager is planning to buy a frontleader for use in the quarry. The sugar companies come to collect the lime themselves in big trucks. The factory trucks are only used to transport the limestone to the kiln. The owner of the factory is manager of a transport company in Tanga as well. This makes it possible for him to repair mechanical machinery at his own workshop, thus saving money on maintenance.
The company has never experienced any government influences apart from paying taxes and mining royalties. There is a need for teehoical assistance, mainly because there is nobody at the factory with any chemical/technical knowledge of the lime production process.
The most important future plan is expanding the factory. However, since the new owner is also new in the business, there is not enough knowledge available. The kiln as well as the other machines are very old and the owner is interested in new developments in Iime production techniques. He thinks that it will be no problem to sell his product if production could be doubled or even tripled. The Simba Lime Factory does not experience any competition, because of the high quality of lime produced, according to the owner.
4.4.4 Super Amboni Lime Product- Tanga This factory is an exact copy of the Simba Lime Factory on a slightly smaller scale. The day the factory was visited, it was not eperating because of maintenance. The manager was not willing to cooperate and only the sales manager could be interviewed. The owner was said to reside on Zanzibar and he is supposed to be the one having all relevant information.
The factory is located in Amboni village, near the limestone quarry which is called Mkongwa. It is a few hundred meters from the tarmac raad and the raad to the factory goes uphill and its condition is not too good. The factory started eperating in 1980.
The limestone was once tested by one of the sugar factories in 1993, though information on the results or which sugar factory actually tested were not available. A different source23 came up with an analysis of which the results are shown in box 4.2.
The factory uses electricity and heavy fuel oil. The latter comes from Agip in Dar es Salaam and is used Box 4.2 Limestone Analysis Super Amboni
for firing the kiln, but nothing was known on Lime Product (UNCHS, 1993)
quantities or costs of the oil. UNCHS (1993) mentions 2000 litres per 24 hours. The electricity consumption is not known. The machines responsible
23
60
UNCHS (Habitat) Endogenous capacity building for the production of binding matenals in tlze construction industry- selected case studies, Nairobi, 1993.
The Lime Production Process
for electricity consumption are oil pumps, air blower, a milling machine (which turned out be a self rebuilt maizemill), the inclined bucket hoist for loading the kiln and the automatic discharge.
The vertical shaft kiln normally operates on a continuous basis in three shifts. No drawings or dimensions of the kiln were available. UNCHS (1993) gives the following figures: height: 15m, internal dimensions: 5.3m x 4.0m, though this is definitely far too large24
• This kiln is slightly smaller than the Simba Lime kiln. The actual capacity utilisation amounted to 700 bags of 15 kg (the weight not printed on the bags) per 24 hours. This would come down to 10.5 tonnes per 24 hours. The manager said there was a 7 days per week production.
Every 6 months the refractories (fire brick lining) are renewed. It is unknown where refractories come from. The limestone is automatically fed into the kiln by an electrical bucket hoist. The feed is of 'fist size'. There are no means of quality control on the process, though there used to be a thermo-coupler for temperature controL
According to the sales manager, there was absolutely no underburnt or overhumt materiaL However, piles of waste discharge were lying on the site. UNCHS (1993) reported 10 percent underburnt material that was fed back into the kiln.
The manager bas been to Dar es Salaam to promate bis product. He visited some contractors and is aware of the sludge (Kiswahili=neru or niru) produced at T.O.L. He now wants to knowhow this material can be produced. At the moment they are producing dry hydrate. The water used for hydratien is ordinary tapwater.
The woven polypropylene bags that are used for packing carry the cernpany's logo (printed in red capitals) and are made in Tanga.
The factory employs about 20 people, including 2 supervisors. The labourers are supplied with mouthmasks, though not everybody uses them. There used to be goggles, but they are not used anymore. The manager assured that there have never been any accidents at their factory.
The company owns one Landrover and a few wheelbarrows. Some purebasers come to collect the product themselves, though sametimes trucks are rented to send loads to Arusha and Moshi. A bag of 15 kgs. dry hydrate costs 850 Tshs. The lime used to go to the sugar factories, however since Simba Lime is producing again, they have taken over these clients. Most of the lime is now used in construction.
It seems that Super Amboni Lime Product bas benefited from the fact that the farmer Tanga Lime factory stopped producing high quality lime. This way ~bey could sell their product to the sugar factories. Now that Simba Lime Factory bas taken over the farmer Tanga Lime Factory, Super Amboni bas lost their most important customers.
The manager is trying to find new markets to sell bis product and he is also interested in new products that can be made with bis lime. He would very much like to have assistance in this field. Influence from Government plans bas never been noticed.
24 The same souree states that production capacity amounted to 20 tons I four hours = 120 t/day, which is far too optimistic.
61
Chapter 4
During raining season, production continues as normally. In May, July and August there has been no production because of maintenance of machinery. Therefore it seemed a little awkward that at the moment of visiting the factory there was again no production because of maintenance.
4.4.5 Amboni Lime - Tanga25
Traditional heap burning techniques are practised to a large extent in the Amboni village. The place were is mined (same place were Super Amboni Lime Product is quarrying its limestone) is called Mkongwa. It has to be noted that the limestone mined here is from the same quarry as the material analysed in UNCHS (1993), to be found in box 4.2.
Mr. Reuben has his own smalllime production unit in an area where there are approximately 10 to 15 clamps. Every individual producer has its own mining claim. The limestone is obtained from the adjacent open pit quarry. Bareholes are drilled in the stone manually, which are filled with explosives from STAMICO to blast the rocks. The idea was to use pneumatic drills for making boreholes, though this turned out to be too expensive. The stones are crushed manually (hand hammers) to fist size.
Firewood is collected from nearby forests. There is no planting of trees to ensure a sustainable firewood supply. The logs are stacked in a circle, with a diameter of 3 to 4 meters, to a height of 50 to 100 cm. On top of this pile, the limestone is packed in a layer of 50 to 100 cm. The inside is left open, because this is where the firing should start.
After preparing the heap, which takes one day, the clamp is set on fire and left for two days to burn. On the third day, the damp is cooling down. On the fourth day the burnt limestone is completely hydrated, using about 4000 litres of water according to Mr. Reuben. After this the dry hydrate is sieved and packed, which may take another day. During sieving, the underburnt material is separated from the well-burnt materiaL Special constructed tables with mesh wire are used for this purpose. Approximately 25% of the stones is insufficiently burnt and thus useless. These are mostly the stones on the outside of the pile, where the temperature does not reach high enough for dissociation. These stones are crushed and sold as aggregates. Another 15% remains too course and does not pass the sieves. Because all activities are performed outside, the wind sametimes is a problem in this coastal zone when it blows away fine materiaL
The polypropylene bags come from Europe. They used to contain raw material for the nearby Amboni Plastics Ltd. factory and the bags are thus recycled. The price paid for these bags (that do not contain the products name) is 100 Tshs/bag. The bags are filled with 25 kg of hydrate, however, no balance is used to weigh the bags, so variations in weight are very likely to occur. The bags are tight up manually. One bag is sold for 600 Tshs. There is no administration on sales.
Four people are involved in preparing the damp, of whom one artisan (Fundi). Four to six people are involved in fetching water for hydration. One sieve table is used by two persons who can produce 50 to 70 bags per day.
The people are paid on a task basis. There seems to be some organisation among the people occupied with the lïmeproduction. According to Mr. Reuben, it would be possible to organise
25 Interview with Mr. R. Reuben, active in heap burning.
62
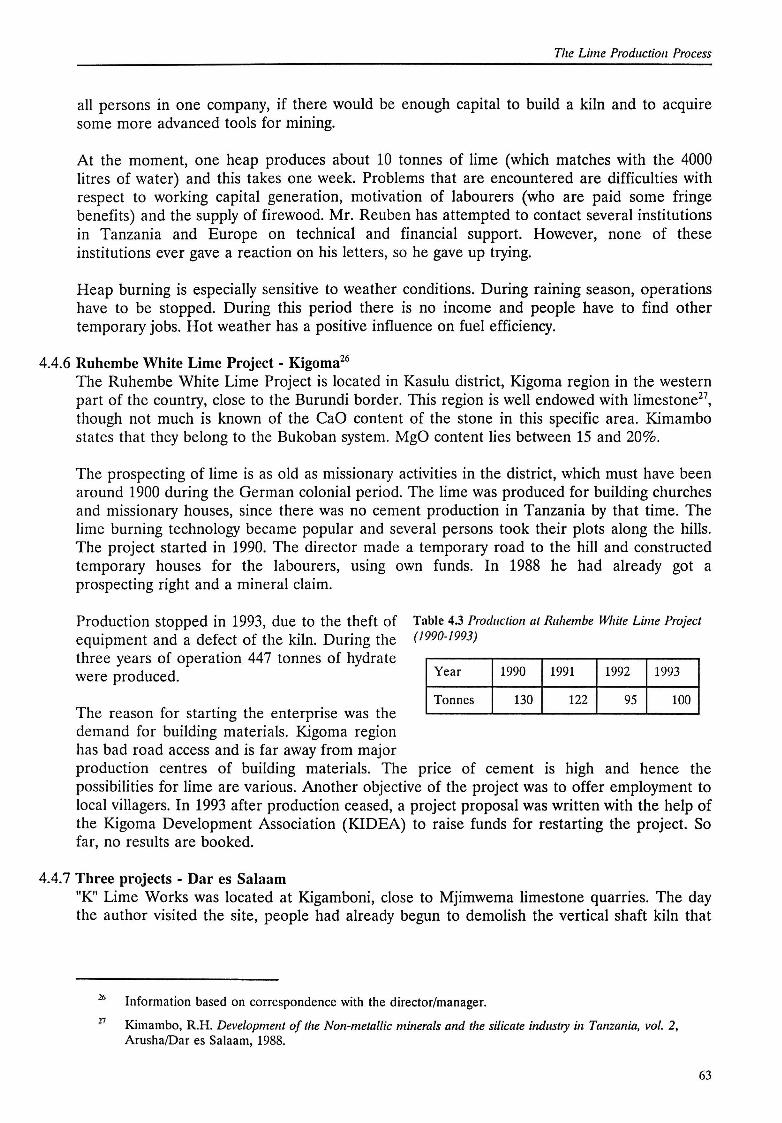
The Lime Production Process
all persons in one company, if there would be enough capita! to build a kiln and to acquire some more advanced tools for mining.
At the moment, one heap produces about 10 tonnes of lime (which matches with the 4000 litres of water) and this takes one week. Problems that are encountered are difficulties with respect to working capita! generation, motivation of labourers (who are paid some fringe benefits) and the supply of firewood. Mr. Reuben bas attempted to contact several institutions in Tanzania and Europe on technica! and financial support. However, none of these institutions ever gave a reaction on bis letters, so he gave up trying.
Heap burning is especially sensitive to weather conditions. During raining season, operations have to be stopped. During this period there is no income and people have to find other temporary jobs. Hot weather bas a positive influence on fuel efficiency.
4.4.6 Ruhembe White Lime Project - Kigoma26
The Ruhembe White Lime Project is Iocated in Kasulu district, Kigoma region in the western part of the country, close to the Burundi border. This region is well endowed with limestone27
,
though not much is known of the CaO content of the stone in this specific area. Kimambo states that they belong to the Bukoban system. MgO content lies between 15 and 20%.
The prospecting of lime is as old as missionary activities in the district, which must have been around 1900 during the Oerman colonial period. The lime was produced for building churches and missionary houses, since there was no cement production in Tanzania by that time. The lime burning technology became popular and several persons took their plots along the hills. The project started in 1990. The director made a temporary road to the hili and constructed temporary houses for the labourers, using own funds. In 1988 he had already got a prospecting right and a mineral claim.
Production stopped in 1993, due to the theft of equipment and a defect of the kiln. During the three years of operation 447 tonnes of hydrate were produced.
Table 4.3 Production at Ruhembe White Lime Project (1990-1993)
The reason for starting the enterprise was the demand for building materials. Kigoma region has bad road access and is far away from major
Year
Tonnes
1990
130
1991 1992 1993
122 95 100
production eentres of building materials. The price of cement is high and hence the possibilities for Iime are various. Another objective of the project was to offer employment to local villagers. In 1993 after production ceased, a project proposal was written with the help of the Kigoma Development Association (KIDEA) to raise funds for restarting the project. So far, no results are hooked.
4.4. 7 Th ree projects - Dar es Salaam "K" Lime Works was located at Kigamboni, close to Mjimwema limestone quarries. The day the author visited the site, people had already begun to demolish the vertical shaft kiln that
27
Information based on correspondence with the director/manager.
Kimambo, R.H. Development of the Non-metallic minerals and the silicate industry in Tanzania, vol. 2, Arusha/Dar es Salaam, 1988.
63
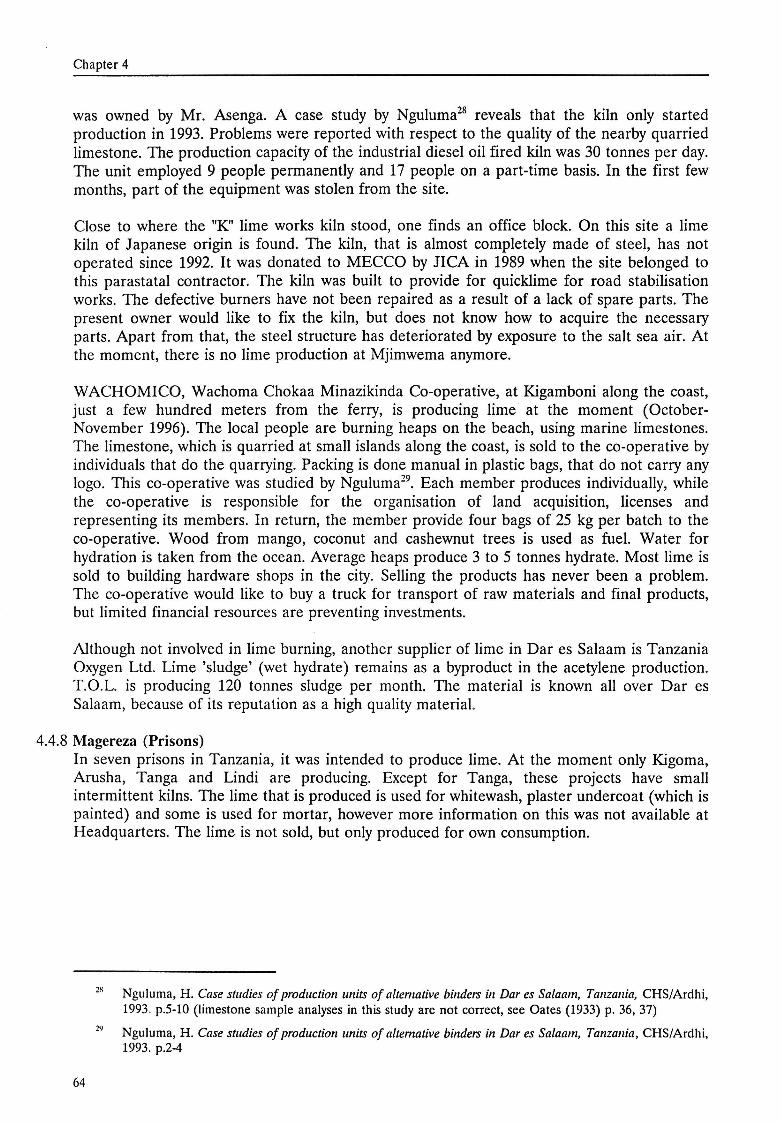
Chapter 4
was owned by Mr. Asenga. A case study by Nguluma28 reveals that the kiln only started production in 1993. Problems were reported with respect to the quality of the nearby quarried limestone. The production capacity of the industrial diesel oil fired kiln was 30 tonnes per day. The unit employed 9 people permanently and 17 people on a part-time basis. In the first few months, part of the equipment was stolen from the site.
Close to where the "K" lime works kiln stood, one finds an office block. On this site a lime kiln of Japanese crigin is found. The kiln, that is almest completely made of steel, has not operated since 1992. It was donated to MECCO by JICA in 1989 when the site belonged to this parastatal contractor. The kiln was built to provide for quicklime for road stabilisation works. The defective burners have not been repaired as a result of a lack of spare parts. The present owner would like to fix the kiln, but does not know how to acquire the necessary parts. Apart from that, the steel structure has deteriorated by exposure to the salt sea air. At the moment, there is no lime production at Mjimwema anymore.
WACHOMICO, Wachoma Chokaa Minazikinda Co-operative, at Kigamboni along the coast, just a few hundred meters from the ferry, is producing lime at the moment (OctoberNovember 1996). The local people are burning heaps on the beach, using marine limestones. The limestone, which is quarried at small islands along the coast, is sold to the co-operative by individuals that do the quarrying. Packing is done manual in plastic bags, that do not carry any logo. This co-operative was stuclied by Nguluma29
• Each memher produces individually, while the co-operative is responsible for the organisation of land acquisition, licenses and representing its members. In return, the member provide four bags of 25 kg per batch to the co-operative. Wood from mango, coconut and cashewnut trees is used as fuel. Water for hydratien is taken from the ocean. Average heaps produce 3 to 5 tonnes hydrate. Most lime is sold to building hardware shops in the city. Selling the products has never been a problem. The co-operative would like to buy a truck for transport of raw materials and final products, but limited financial resources are preventing investments.
Although not involved in lime burning, another supplier of lime in Dar es Salaam is Tanzania Oxygen Ltd. Lime 'sludge' (wet hydra te) remains as a byproduct in the acetylene production. T.O.L. is producing 120 tonnes sludge per month. The material is known all over Dar es Salaam, because of its reputation as a high quality materiaL
4.4.8 Magereza (Prisons) In seven prisons in Tanzania, it was intended to produce lime. At the moment only Kigoma, Arusha, Tanga and Lindi are producing. Except for Tanga, these projects have small intermittent kilns. The lime that is produced is used for whitewash, plaster undercoat (which is painted) and some is used for mortar, however more information on this was not available at Headquarters. The lime is not sold, but only produced for own consumption.
2X
64
Nguluma, H. Case studies of production units of alternative binders in Dar es Sa/aam, Tanzania, CHS/Ardhi, 1993. p.S-10 (limestone sample analyses in this study are not correct, see Oates (1933) p. 36, 37)
Nguluma, H. Case studies of production units of alternative binders in Dar es Sa/aam, Tanzania, CHS/Ardhi, 1993. p.2-4
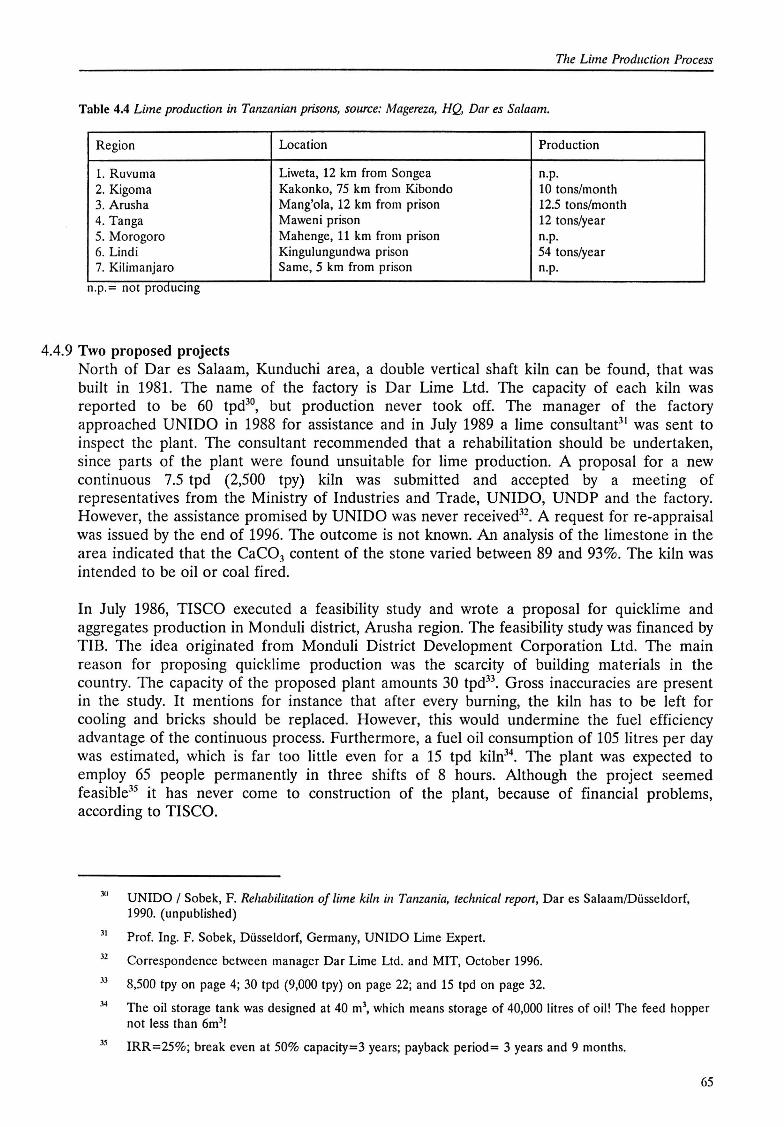
The Lime Production Process
Table 4.4 Lime production in Tanzanian prisons, source: Magereza, HQ, Dar es Salaam.
Region Location Production
1. Ruvuma Liweta, 12 km from Songea n.p. 2. Kigoma Kakonko, 75 km from Kibondo 10 tons/month 3. Arusha Mang'ola, 12 km from prison 12.5 tons/month 4. Tanga Maweni prison 12 tons/year 5. Morogoro Mahenge, 11 km from prison n.p. 6. Lindi Kingulungundwa prison 54 tons/year 7. Kilimanjaro Same, 5 km from prison n.p.
n . . - not p p roducm g
4.4.9 Two proposed projects North of Dar es Salaam, Kunduchi area, a double vertical shaft kiln can be found, that was built in 1981. The name of the factory is Dar Lime Ltd. The capacity of each kiln was reported to be 60 tpd30
, but production never took off. The manager of the factory approached UNIDO in 1988 for assistance and in July 1989 a lime consultane1 was sent to inspeet the plant. The consultant recommended that a rehabilitation should be undertaken, since parts of the plant were found unsuitable for lime production. A proposal for a new continuous 7.5 tpd (2,500 tpy) kiln was submitted and accepted by a meeting of representatives from the Ministry of Industries and Trade, UNIDO, UNDP and the factory. However, the assistance promised by UNIDO was never received32
• A request for re-appraisal was issued by the end of 1996. The outcome is not known. An analysis of the limestone in the area indicated that the CaC03 content of the stone varied between 89 and 93%. The kiln was intended to be oil or coal fired.
In July 1986, TISCO executed a feasibility study and wrote a proposal for quicklime and aggregates production in Monduli district, Arusha region. The feasibility study was financed by TIB. The idea originated from Monduli District Development Corporatien Ltd. The main reason for proposing quicklime production was the scarcity of building materials in the country. The capacity of the proposed plant amounts 30 tpd33
• Gross inaccuracies are present in the study. It mentions for instanee that after every burning, the kiln has to be left for cooling and bricks should be replaced. However, this would undermine the fuel efficiency advantage of the continuous process. Furthermore, a fuel oil consumption of 105 litres per day was estimated, which is far too little even for a 15 tpd kiln34
• The plant was expected to employ 65 people permanently in three shifts of 8 hours. Although the project seemed feasible35 it has never come to construction of the plant, because of financial problems, according to TISCO.
30
31
32
33
34
35
UNIDO I Sobek, F. Relzabilitation of time kiln in Tanzania, technica! report, Dar es Salaam/Düsseldorf, 1990. (unpublished)
Prof. Ing. F. Sobek, Düsseldorf, Germany, UNIDO Lime Expert.
Correspondence between manager Dar Lime Ltd. and MIT, October 1996.
8,500 tpy on page 4; 30 tpd (9,000 tpy) on page 22; and 15 tpd on page 32.
The oil storage tank was designed at 40 m3, which means storage of 40,000 litres of oil! The feed hopper
not less than 6m3!
IRR=25%; break even at 50% capacity=3 years; payback period= 3 years and 9 months.
65
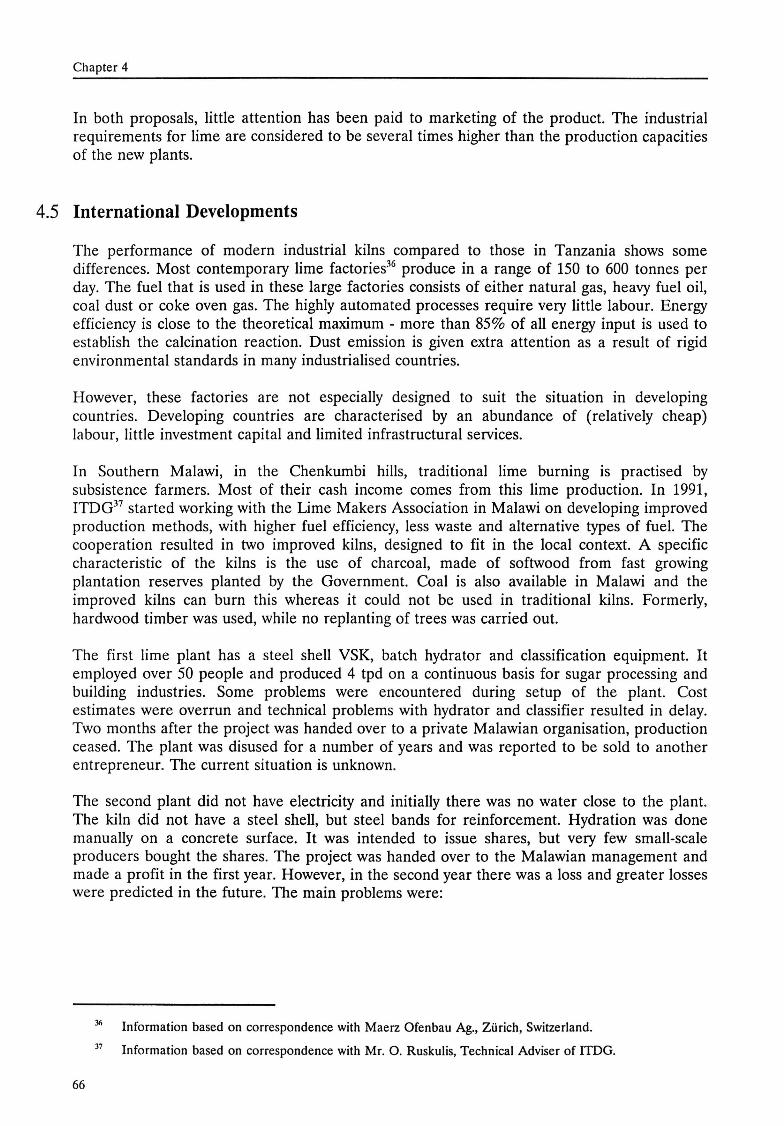
Chapter 4
In both proposals, little attention has been paid to marketing of the product. The industrial requirements for lime are considered to be several times higher than the production capacities of the new plants.
4.5 International Developments
The performance of modern industrial kilns compared to those in Tanzania shows some differences. Most contemporary lime factories36 produce in a range of 150 to 600 tonnes per day. The fuel that is used in these large factories consists of either natura! gas, heavy fuel oil, coal dust or coke oven gas. The highly automated processes require very little Iabour. Energy efficiency is close to the theoretica! maximum - more than 85% of all energy input is used to establish the calcination reaction. Dust emission is given extra attention as a result of rigid environmental standards in many industrialised countries.
However, these factories are not especially designed to suit the situation in developing countries. Developing countries are characterised by an abundance of (relatively cheap) Iabour, little investment capita! and limited infrastructural services.
In Southern Malawi, in the Chenkumbi hills, traditional lime burning is practised by subsistenee farmers. Most of their cash income comes from this lime production. In 1991, ITDG37 started working with the Lime Makers Association in Malawi on developing improved production methods, with higher fuel efficiency, less waste and alternative types of fuel. The cooperation resulted in two improved kilns, designed to fit in the local context. A specific characteristic of the kilns is the use of charcoal, made of softwood from fast growing plantation reserves planted by the Government. Coal is also available in Malawi and the improved kilns can burn this whereas it could not be used in traditional kilns. Formerly, hardwood timber was used, while no replanting of trees was carried out.
The first lime plant has a steel shell VSK, batch hydrator and classification equipment. lt employed over 50 people and produced 4 tpd on a continuous basis for sugar processing and building industries. Some problems were encountered during setup of the plant. Cost estimates were overrun and technica! problems with hydrator and classifier resulted in delay. Two months after the project was handed over to a private Malawian organisation, production ceased. The plant was disused for a number of years and was reported to be sold to another entrepreneur. The current situation is unknown.
The second plant did not have electricity and initially there was no water close to the plant. The kiln did not have a steel shell, but steel bands for reinforcement Hydratien was done manually on a concrete surface. lt was intended to issue shares, but very few smali-scale producers bought the shares. The project was handed over to the Malawian management and made a profit in the first year. However, in the second year there was a loss and greater losses were predicted in the future. The main problems were:
37
66
Information based on correspondence with Maerz Ofenbau Ag., Zürich, Switzerland.
Information based on correspondence with Mr. 0. Ruskulis, Technica! Adviser of ITDG.
The Lime Production Process
despite the demand, lime was being sold too cheaply, so finally creditars could not be paid quality deteriorated resulting in less buyers production records were not properly maintained the hammer mill (reconditioned grain grinding mill) was frequently breaking down there were frequent disagreements between the managers
4.6 Condoding Remarks
In this final chapter of part two, the different ways in which lime can be produced were explained. The type that is most practised in Tanzania is also the most simple way of producing lime, being the socalled heap burning. The extent to which heap burning is practised in Tanzania can only be guessed. However, the smali-scale of production, ranging from 1 to 10 tonnes per heap, will never allow this craft to be of any macro-economie significance. An important factor should not be overlooked though, since simple lime burning provides employment and an iocome to many villagers all over the country.
The efficiency with respect to materials and energy remains low over the whole sector. Fuel efficiency slightly impraves when scale increases (table 4.5). Low efficiency is partly a result of a low capacity utilisation. Most production units use wood as a fuel. Wood scarcity ( deforestation) is already creating difficulties in some places. The two largest factories use heavy fuel oil.
The Iime industry is typically Iabour intensive and decentralised. One of the notabie findings is the low level of knowledge at the production units with respect to theoretica} aspects of the process. It is also difficult to obtain information in Tanzania about the production process. Apart from that, quantities and qualities of inputs and outputs are often not recorded.
There is no organisation of the sector, which further complicates coordinated support. Most of the rnanaging staff at the production units were eager to know more about lime. Some have tried to contact organisations for information, teehoical support or financial support.
It seems that some of the problems encountered in Tanzanian Iime production show similarities to those in Malawi. Table 4.5 gives an overview of the energy consumption and efficiency of production units in Tanzania and some additional figures of other factories.
67
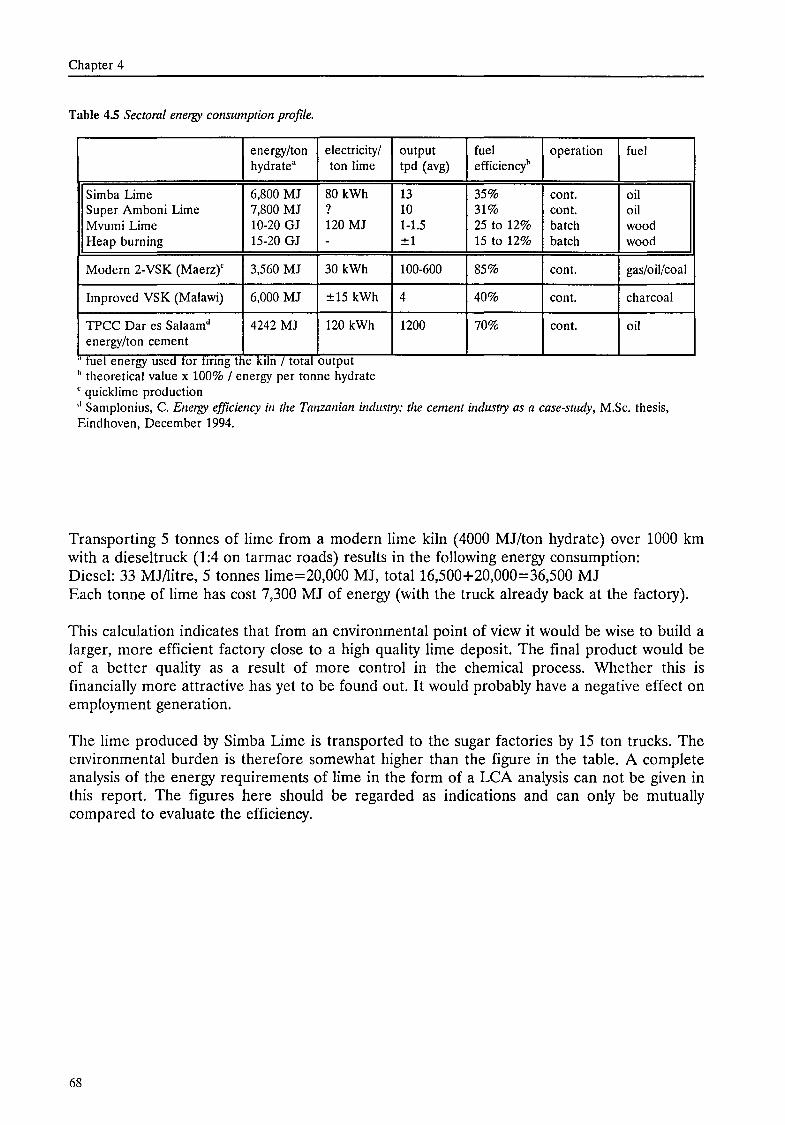
Chapter 4
Table 4.5 Sectoral energy consumption profile.
energy/ton electricity/ hydra te• ton lime
Simba Lime 6,800 MJ 80 kWh Super Amboni Lime 7,800 MJ ? Mvumi Lime 10-20 GJ 120 MJ Heap burning 15-20 GJ -Modern 2-VSK (Maerz)" 3,560 MJ 30 kWh
Improved VSK (Malawi) 6,000 MJ ±15 kWh
TPCC Dar es Salaam11 4242 MJ 120 kWh energy/ton cement
· tuelener gy used tor tmng the k1ln 1 total output h theoretica! value x 100% I energy per tonne hydrate c quicklime production
output fuel operation fuel tpd (avg) efficiencl
13 35% cont. oil 10 31% cont. oil 1-1.5 25 to 12% batch wood ±1 15 to 12% batch wood
100-600 85% cont. gas/oil/coal
4 40% cont. charcoal
1200 70% cont. oil
" Samplonius, C. Energy efficiency in the Tanzanian industry: the cement industry as a case-study, M.Sc. thesis, Eindhoven, December 1994.
Transporting 5 tonnes of lime from a modern Iime kiln ( 4000 MJ/ton hydra te) over 1000 km with a dieseltruck (1:4 on tarmac roads) results in the following energy consumption: Diesel: 33 MJ/litre, 5 tonnes lime=20,000 MJ, total16,500+20,000=36,500 MJ Each tonne of lime bas cost 7,300 MJ of energy (with the truckalready back at the factory).
This calculation indicates that from an environmental point of view it would be wise to build a larger, more efficient factory close to a high quality lime deposit. The final product would be of a better quality as a result of more control in the chemica! process. Whether this is financially more attractive bas yet to be found out. It would probably have a negative effect on employment generation.
The lime produced by Simba Lime is transported to the sugar factories by 15 ton trucks. The environmental burden is therefore somewhat higher than the figure in the table. A complete analysis of the energy requirements of lime in the form of a LCA analysis can not be given in this report. The figures bere should be regarcled as indications and can only be mutually compared to evaluate the efficiency.
68

PARTTHREE
Chapter 5
5 Evaluation
5.1 Introduetion
This final chapter will review the information gathered. The first paragraph will examine the effectiveness characteristics of the Iime industry in Tanzania. As much as possible, the reasans or causes for the characteristics are given. The information is translated to the production capabilities. To refresh the reader's mind: production capabilities enable the effective handling and rnanaging of the technology and the production process in such a way as to achieve the desired output quality and quantity necessary to meet the demands and needs. Is the desired output achieved? How is the technology managed? In what areas is impravement necessary? Finally, this chapter will finish with the overall conclusions with respect to the state-af-the-art of the lime industry.
5.2 Effectiveness Characteristics
The effectiveness characteristics describe the lime industry from different angles, in a way that it can be compared to other industries. The characteristics reviewed in this paragraph are arranged in three levels, from the micro socio-economie point of view to the macro socioeconomie level. Same meso level characteristics are a simple aggregate of the individual micro characteristics. The micro characteristics are arranged according to the components in the transformation process.
5.2.1 Micro-Ievel effectiveness characteristics Inputs: • Capita!: Especially heap burning activities, which is typically Iabour intensive, require only a burning site, spade and screen as 'fixed capita!'. Working capita! to buy woodfuel, bags and sametimes water and explosives and to pay the labourers makes up the larger part of the capita! requirements. The larger factories require more investments and werking capita!. • Raw materials: The production units are all located close to the place where limestone is quarried. However, the provision of fuel is in most places a (sometimes serious) problem. These have to be acquired from far away locations. The kilns that use oil, are located close to a harbour, where the oil is supplied by foreign petroleum companies. Only a few producers know the quality of the limestone that is quarried.
Transformation: • Labour: Most Iabour is unskilled and consists of temporary workers from the local village. The present lime production methods in Tanzania are typically Iabour intensive. Mining, crushing, sieving, hydratien and packing is done manual at most units. Indirect Iabour (forward linkage) is limited to retailers and fundis (craftsmen/artisans). Labour is paid on a daily basis. A quarry aften belengs to the production unit, through a mining claim or prospecting right. • Information: The process is run in accordance with habits, rather than on rational grounds. There is little indigenous knowledge on lime burning and there is no real tradition on the mainland. Even at the larger factories, specific knowledge on the chemica! process is lacking. The administration (if present) consists of sales figures only.
70
Evaluation
• Organisation: With respect to this aspect it has to be noted that production at most units is not very reliable. Production volume is not constant, breakdowns occur as a result of a lack of maintenance. Unforeseen failures could have been foreseen if attention was given to weaknesses in time. No financial reservations are made in these cases. There is no short term, let alone long term planning. Units are operated on a day-to-day basis. In one research report' the following (African?) slogan was mentioned: 'A bad salution for tomorrow is a good one for today'. • Technology: The technology and equipment used in lime production in Tanzania is very basic. There is for example not a single (automatic) hydrator in the country. There are no mechanica! crushers used in lime production, all emshing is done manual. The scale of lime production in Tanzania is small. The largest producer is characterised by a 45 tpd installed capacity, but an actual production of approx. 13 tpd. In the international African context, this is not an exception, though compared to modern kilns the output figure and capacity utilisation remains very low. The technology at the small production units is typically fuel inefficient, compared to large modern kilns. There are no means to control dust emittance. Waste material is left at the site or dumped back in the open pit quarries. It has not come to improvements of the production process, most lime is still burnt in its most elementary way (heap burning). The larger factories are copies of foreign kilns. The SIDO campaign in the 70s took over Indian kiln designs. However, these were only slightly more efficient than the traditional burning methods.
Output: • Final product: The larger part of the final product is sold in the neighbourhood. In first instance, the region is supplied. There are no producers who can teil anything on the quality and composition of the final materiaL No standards are used to classify the product.
5.2.2 Meso-level effectiveness charaderistics • Supply of lime: The market is at the moment dominated by the two larger factories in Tanga, they account for approximately 40% of all lime production in Tanzania. They supply more than just the regional demand. The fact that imperts have been registered during the last decades, indicates a shortage in supply. This could be qualitative as well as quantitative. A number of other reasens can be attached to imports, like delivery times, reliability and price. Breakdowns are not an uncommon phenomenon. A clear decline in the contribution of cement imperts to total imperts can be seen (annex C), where this trend for lime is far less clear. Lime imperts are characterised by ups and downs and look more like a malaria-fever diagram. It is hard to discern a trend, except that the amplitude is increasing. • Geographical distribution: The lime industry is decentralised. Although some projects are located close to urban areas, the lion's share of production takes places in rural areas. Projects are scattered over the country and the choice for a certain location is in all cases based on the availability of limestone in the neighbourhood. • Location of demand: The target group in construction activities consists of low-income households, especially in remote regions. Demand is close to the production unit in most cases. In the larger cities, lime is used by forma! contractors for plastering. A remarkable aspect is the high price for lime in Dar es Salaam, which is almest the same price as cement. In Dar es Salaam, lime can be bought from Tanga, Zanzibar, Kenya and Dar es Salaam.
Nguluma, H., Rajab, H., Mosha, LH. Use of binders in low income housing in Tanzania, a CHS Research Report, Dar es Salaam, 1995. p.8
71

Chapter 5
• Links with other industries: This occurs where lime is an input for other processes. For sugar production, of which the major share is exported to Europe, indigenous lime production indirectly contributes to the acquisition of foreign exchange. At the moment lime plays only a very limited role in other industries. • Links with other organisations: From the case-studies, no links could be mentioned with organisations and institutions in the construction sector, except for two mentions of SIDO. For smali-scale producers, with little cantacts and connections with sector organisations, it is difficult to obtain information on available production technologies and innovations. There is no independent branch organisation or coordinating agency, that can establish relations with technology providers or suppliers of spare-parts and serves but the interest of the lime industry. There is said to be a consultancy service, run by a farmer SIDO employee, but the office should be more supportive to the lime industry. • With respect to foreign dependence, it has to be noted that R&D, support and organising institutions have had more donor support than the lime industry itself. Examples are BRU, SIDO, UDSM, UCLAS, NEMC, ESAMRDC (Experiments in 70s and 80s were financed by ITDG, OXFAM). However, the expected learning effects or knowledge transfer to the industry has been marginal.
5.2.3 Macro-level effectiveness characteristics • Employment generation: From a macro-level perspective, the significanee of employment generation of the lime industry is low, however the decentralised location of the industry has a positive contribution to rural employment, which still lags behind urban employment opportunities. There is no indication of migration as a result of the location of the lime projects. • Income generation: The main advantage of a decentralised industry is that it contributes to a more even distribution of income, especially when the final products are sold in other regions and urban areas. • U se of capital: The smali-scale lime industry, of which a major part belongs to the informal sector, requires little investments which does not put a burden on the countries scarce foreign currency. There have been attempts to find foreign sponsors to supply investment capital, but up till now there has been no financial donor support. • Foreign dependence: The lime industry in Tanzania is to a large extent self-reliant and independent with respect to foreign interterenee or interests. Only with respect to fuel oil, two factodes depend on foreign petroleum companies. Machinery like crushers, engines and air blowers all have a foreign origin, but are relatively scarce. Same projects own trucks, but these can be repaired locally most of the time. It should be noted that from a cultural point of view, especially when it comes to technology or related 'western' products, that the use of foreign ideas and products prevails over common sense or traditions. A good example of this is the situation with respect to cement use and (galvanised) corrugated iron sheets. • Learning effects: There is very little knowledge generation in the industry. This raises question marks with respect to the learning effects, since it is more like copying customs. This is not knowledge transfer. The educational institutions do not provide programs on lime burning. The output of these institutions is very limited compared to the size of the population and country. There has been no transfer worth mentioning from organisations related to the construction sector to production units. Most knowledge -technica} as well as managerial- is concentrated in Dar es Salaam (at the NCC for example) and no or only very little dissemination takes place to the decentralised industry. It is difficult to find up to date information in Tanzania with regard to lime production, the available information is aften out of date.
72

Evaluation
• Pollution: To assess all environmental effects of a product, a socalied Life Cycle Analysis (LCA) should be performed. However, this extensive method has not been applied in this report. In genera!, it can be stated that air pollution through C02 gas evolving from the calcination reaction is substantial, but inherent to lime production. Some sourees state that co2 gas contributes to global warmini, ethers still doubt this3. It should be noted that this gas is also produced in cement manufacture, for which limestone is burnt as well. The C02
emissions from burning the fuel can only be reduced through a more energy efficient process, requiring less fuel. Emissions depend on the type of fuel as well. Other gases that are produced are NOx and SOx. Although awareness exist, no attempts are made to limit or stop deforestation nor decrease detrimental emissions. There are said to be environmental standards, but these are not applied. • Use of resources: As Oates4 already mentioned, 'numerous extensive and conveniently located deposits of good limestone are already known and many of these were actively worked in times of German occupation. During that period local supplies of lime were employed wherever practicabie for building mortar and must have resulted in considerable economy.' Further on, he mentions that in the Dar es Salaam and Tanga regions, lime mortar was soon replaced by Portland cement, which had to be imported by that time.
5.3 Production Capabilities
A first observation is that most lime production units are producing quite satisfactory. The product can be sold, because the demand for lime outstretches supply. Most of the problems that are faced are not directly related to production only, but to difficulties in expanding business or acquiring investment capita!. The simple technique of heap burning, that requires no or only little capital goeds and limited skills, is still practised all over the country. This indicates a basis for further development of the industry, that never took place. Experiments in the past have failed because of a Jack of management skilis and process knowledge. The existing framewerk of institutions that should provide technica! and organisational support, proved to be not capable of this task.
To increase the effectiveness of the industry, which means impravement of most of the characteristics mentioned in the previous paragraph, requires first of all the transfer of knowledge and skills. Although this has been the intention of the authorities, somewhere in the process between macro-level policy formulation and actual micro-level production, links are missing. Consictering the neects expressed in government polides and the actual state of the industry, it has to be concluded that the industry can not achieve these needs. The reasen for that is that either production capabilities are not sufficiently developed or the government neects are too strict and should be focused on developing the country's capabilities first.
The actual neects imposed by the construction industry are less clear. Some producers have a good reputation for the quality of their product and they demand relatively high prices, for
3
4
Calmthout, M. van, Het broeikas effect, Vereniging Milieudefensie, Utrecht/Amsterdam, 1990.
Emsley, J. (ed.) The global wanning debate, the reporl of the European Science and Environment Fomm, ESEF London, March 1996.
Oates, F. Limestone deposits of Tanganyika Ten·itmy, with a description of the commercial uses of limestone and lime and brief notes upon the occurrences of gypsum and magnesite, Geological Survey Department, Bulletin no.4, Dar es Salaam, 1933.
73
Chapter 5
they can easily sell their lime. Some contractors complain about the quality of lime produced locally. Many small contractors do not have much choice given their limited budgets, so the lime produced will be sold anyway as long as fundi's, consultants and architects recommend to use the materiaL The British Standards are still the official valid standards on lime in Tanzania. However, nobody demands for specifications, so these standards are not applied. Used for plastering or whitewash, lime does not require a high quality. The use of lime in other industries is still very marginal, so there is no real need for impravement of the quality of lime by improving the production process. In this light, it can be stated that for the actual applications in construction, the minimum production capabilities are present.
5.4 Conclusions
The research question that was formulated in the first chapter ran as follows: What is the stateaf-the-art of the lime industry in Tanzania and in particu/ar for the construction sector? Because this question can not be answered with a single such-and-such reply, this paragraph presents the conclusions that have been drawn from the information gathered in this report. Together these conclusions indicate the state-of-the-art of the lime industry in Tanzania. Since the research has been carried out with reference to the construction sector, special attention is paid to its use as a building materiaL
1. Lime as a constntction material is nat popu/ar in Tanzania. In all literature that has been studied, the question of demand is dealt with only from a technica! point of view. The case in Tanzania is, that when people would be offered to choose between cement and lime, they would probably choose cement, even if lime is more suited for a certain application. This is partly the result of a Jack of knowledge, partly as a Jack of promotion and partly because of a Jack of standards and regulations. The reason why cement is favoured, is because it is associated with strength and durability. Lime is old-fashioned and not strong. Apart from that, cement is made in large modern factories, while lime is mainly produced in poor rural areas.
2. The lime industry is an energy inefficient industry. The smali-scale production technology in Tanzania does not allow for optima! fuel use. The Jack of control in the production process, as well as the type of kilns (if any) prevent an even distribution of fuel, resulting in partly unburnt materiaL Heat losses occur, especially in heap burning activities. It is calculated5 that from an environmental point of view, a larger, more efficient lime factory close to a high quality limestone deposit, would require less energy (lOOOkm transport included) than scattered smali-scale units close to the market This factory will then supply a larger area. A positive side effect is that the final product will be of a better quality as a result of more control in the chemica! process. Whether this results in cheaper lime is not calculated and it has probably a negative effect on employment generation, compared to smali-scale projects.
3. There is no information on the chemica! composition of the final material (hydrated lime). None of the units have means to check the quality of the end product, nor the raw materiaL Only a few larger producers have retrieved information on the composition of the raw material from literature or laboratories, but this information is not used in the production process. There are various (standard) chemica! tests to check the quality of hydrated lime, of which some are quite simple. Knowledge on where to acquire information on these tests and
5 see chapter 4, paragraph 4.6
74
Evaltwtion
how to execute and interpret the results is lacking. No attempts have been made so far to execute tests. Some contractors6 mentioned that they were not satisfied with the quality of lime, which is said to vary very much. Impurities, insufficiently screened material and unproper storage were the aspects that spoilt the quality of lime.
4. The decentralised lime industry has some notabie advantages. The industry contributes to a more even distribution of income through providing employment in rural areas. Smali-scale limestone mining has a less disturbing impact on the environment than large scale mining. The decentralised industry offers a cheap, locally available building material, even if the lime is only used for plastering and whitewash. Local production has the advantage of little transport to the market This reduces costs. In practice, it means more reliable delivery times as well.
5. The major constraints for setting up a large local lime Jactory are a /ack of finance and a lack of skills. In the past ten years, there have been proposals for the construction of more efficient and large scale lime factories. These were not executed, because no investment capita! could be made available. Furthermore, large scale factories require -among other thingsmanagement skills, technica! knowledge and experience, which are scarce in Tanzania. This can be a reason for an investor to abandon negotiations. Tanzania is rich with respect to limestone resources, which is not a limiting factor to set up a large scale lime factory. A jointventure with a foreign counterpart can be an appropriate strategy for investment. Selling a product of a higher quality is assumed to be not problematical.
6. The efforts made by R&D and supporting organisations in the past have had very Zittie effects on the development of the lime industry. The attempts by SIDO to establish lime kilns in villages throughout the country have had some results, though 20 years later most of the projects have been abandoned or neglected. Various reasans are given by key persons, but the most striking observation is that the producers interviewed in the case studies stated that they did not get any support from organisations. Some are not aware of the possibility to ask for support and the distance (physical as well as figurative) to the institutions remains far.
7. Relevant govemment policies have nat had any effect on the industry. Although it is officially recognised that 'there is no adequate organisation for production of locally available materials such as aggregates and lime to meet demand and quality' and it is explicitly stated in the NCIDS that 'the construction materials production activities at all levels should be encouraged' and 'the optimum utilisation and development of local design, construction and construction materials should be promoted', no such encouragement or promotion is noticed at firm level. As the reason for this is mentioned the shortage of financial resources at government institutions.
Although the final condusion does not tell anything about the present state-of-the-art, it presents an expectation about the future. 8. The use of lime as a constntction material is expected to decrease. Not only because it is less popular than cement, but other materials will be cheaper and more available as well in the future. Paints are a good example of this. Infrastructural improvements will add to the accessibility of other building materials. The lime production process has not been modernised since it was introduced in Tanzania. The experiments with lime and limepozzolana in the 70s and 80s did not have the results or innovative strength that was hoped for. It is an illusion to think that lime will be used for mortar or as a binder in building blocks in the future, when cement will be cheaper and more available throughout the country. The volume of lime
ó see paragraph 3.3.2
75

Chapter 5
imparts over the past 10 years has decreased. However, the development of sand-lime7 blocks production may have a positive effect on the consumption of lime in the future, though only under certain conditions.
5.5 Recommendations
Based on the conclusions in the previous paragraph and the information presented in this report, the following recommendations are given:
1. Matenals research and development should be demand driven. Which means that there's no use in trying to stimulate materials and technologies that will not be applied by low-income householcts and fundis. lf the aim is to imprave housing conditions, this should bear support of the target group. A market study can provide insight in the demand from those target groups.
2. Examine the possibilities for sand-lime brick production. The introduetion of this building material can complement the supply of the popular sand-cement blocks and fill part of the gap between supply and demand for building blocks. Although the technology is not new, it has never been applied in Tanzania. The research should focus on the feasibility from several points of view:
- technical8: quality of lime required, quality of sand necessary, machinery and equipment
maintenance, scale of production, strength of product, size of product, possibilities of a mobile production unit, energy requirements compared to cement-sand blocks, behaviour of sand-lime in hot-humid areas. - commercial: price of bricks compared to sand-cement blocks, transport of bricks, availability for low-income as well as middle-income target group, promotion.
3. Optimize the communication between supporting institutions and producers. Making the dissemination of information more efficient has several effects. The actors in the building materials industry do not know which products are available. Availability of knowledge remains low. Producers do not know what to expect from supporting organisations. There is still a lot of ignorance as well as suspicion towards white-collar jobs.
4. Otlzer types of fuel should be searched for, e.g. charcoal from plantafion forests (fastgrowing softwood). Searching fora sustainable salution for the rapid pace of deforestation. Householcts can benefit from such a development as well, since most of the householcts use wood for cooking. The development of infrastructural facilities for gas transport opens possibilities for industrial use of natura! gas.
5. To obtain insight in the demand and application of lime, a market study should be executed. In this report an attempt is made to estimate the demand and to determine the applications of lime in the construction sector. These estimates are however not complete and serve only as an indication.
76
Both nominations sand-silicate and sand-lime bricks (or blocks) are found in literature.
recent research: - Wu, L., Peng, X., Yang, J., Bai, G. Influence of some technology parameters on the st/Uctures of autoclaved lime-sand concrete, in: Cement and Concrete Research, vol.26, no.7, pp.ll09-1120, 1996. - Wu, L., Peng, X., Yang, J., Bai, G. Strengthand carbonafation of autoclaved lime-sand concrete witlt superfine sand as aggregate, in: Magazine of Concrete Research, 47, no.170, pp.3-10, 1995.
References
List of References
Agevi, E., Ruskulis, 0., Schilderman, Th. (eds.) Lime and alternative binders in East Africa, IT Publications, Londen, 1995.
Ardhi/CHS Proceedings of the urban and housing indicators workshop held at Ardhi Institute, Dar es Salaam, Tanzania, 26-27th September 1995, in preparatien of the HABITAT II Conference City Summit, Istanbul, June 1996.
Austroplan, Development of lime production in the SADCC region, United Nations, New York, 1990, in: Production and Consumption of binders in Tanzania, workshop papers, 1994.
Baart, P.E.H. Facilitating trade policy making and execution at the Ministry of Industries and Trade, Tanzania, M.Sc thesis, Eindhoven, October 1995.
Biggs, T., Shah, M., Srivasta, P. Technological capabilities and leaming in African enterprises, World Bank technica! paper 288, Washington D.C., 1995.
Boynton, R.S. Chemistry and technology of lime and limestone, Wiley & Sans, New York, 1966.
BRE, Building in hot climates, a selection of overseas building notes, Garston, UK, 1980.
BRU, Information leaflet, Sept. 1978.
Bureau of Statistics, Industrial commodities, quarterly report, Dar es Salaam, January 1996a.
Bureau of Statistics, Producer price index, manufacturing sector, quarterly report, Dar es Salaam, January 1996b.
Bureau of Statistics, National Accounts of Tanzania 1976-1994, Dar es Salaam, August 1995.
Calmthout, M. van, Het broeikas effect, Vereniging Milieudefensie, Utrecht/Amsterdam, 1990.
Carr, M. (ed.) The AT Reader; theory and practice in appropriate technology, ITDG, Londen, 1985.
Centre for Human Settiement Studies, Infonnation Booklet, Dar es Salaam, 1995.
Duijsens, R.J.H. Metal industry and technica[ education in Tanzania; model for matching demand and supply of knowledge and skills, M.Sc. thesis, Eindhoven University of Technology, March 1996.
Ekelmans, P.M., Cloo, M.P. The roZe of MIC Tanzania Ltd. in the development of the Tanzanian telecommunication sector, M.Sc. thesis, Eindhoven, March 1997.
Emsley, J. (ed.) The global wanning de bate, the report of the European Science and Environment Fomm, ESEF Londen, March 1996.
Engelen, D.M. van, PubZie policy making and the rise and fall of the Tanzanian Manufacturing Sector, M.Sc thesis, EUT, July 1996.
77

References
Erkelens, P.A. Self-help building productivity, Bouwstenen nr. 20, Eindhoven, 1991.
Fleischeuer, M.J.A. Road contruction in Tanzania M.Sc. thesis, Eindhoven, 1994.
Gaillard, H. The industrialization of developing countries; The micro-level perspective, lecture notes 1666, EUT, 1994.
Griffiths, C.J., Report for National Environmental Management Council by Beach Erosion Monitoring Committee, Dar es Salaam, 1987.
Hili, N., Holmes, S., Mather, D., Lime and other alternative cements, IT Publications, London, 1992.
Horen, D.J.M. van The eutrophication of Lake Victoria, East Africa, MSc. thesis EUT, August 1996.
Houben, H., Guillaud, A. Traité de construction en terre, CRATerre, Marseille, 1989.
International Labour Office, Small scale manufacture of stabilised soil blocks, Technica} Memorandum no.12, Geneva, 1987.
Jacobs, D., Kuijper, J., Roes, B. De economische kracht van de bouw: noodzaak van een culturele trendbreuk, SMO, 's-Gravenhage, 1992.
Jongsma, I. Small scale cement production in Tanzania? MSc.thesis, EUT, March 1996.
Jongsma, 1., Egmond, E. van, A mini success; is lndian VSK technology about to conquer Africa? in: International Cement Review, November, 1996.
Kimambo, R.H. (ed.) Development of the non-metallic minerals and the silicate industry in Tanzania, vol. IJ, Arusha/Dar es Salaam, 1988.
Kimambo, R.H. Development of the non-metallic minerals and the silicate industry in Tanzania, vol. I, Dar es Salaam/Arusha, 1986.
Kimambo, R.H. Mining and mineral prospects in Tanzania, Arusha, 1984.
Kisanga, A. U. The challenge faced by the building matenals industry in the developing countries in the 1990s, with special reference to Tanzania, Habitat Int. vol.14, no.4, 1990.
Koenders, P. Development of a traffic planning system at Tanzania Railways Corporation (TRC), M.Sc. thesis EUT, Eindhoven, August 1994.
Kyessi, A.G. Overview of Human Settlements and Shelter Development and management in Tanzania, in: Seminar on innovative bamboo construction technologies, CHS/Ardhi, Dar es Salaam, April 1996.
Lall, S. Promoting Technology Development: The roZe of technology transfer and indigenous effort, in: Third World Quarterly, vol.14, no. 1, 1993.
78
References
Ministry of Industries, Mineral Resources and Power, Annual Report of the Mineral Resources Division, 1965, Dar es Salaam, 1967.
Ministry of Water, Energy and Minerals, The Energy Policy of Tanzania, Dar es Sa/aam, 1992.
Ministry of Works, Proposed National Constmction Development Strategy, draft, Dar es Salaam, 1995.
Ministry of Works, National Constmction Industry Development Strategy Dar es Salaam, February 1991.
Mlawa, H.M., Sheya, M.S. Profiles of R&D institutions in Tanzania, MANSCI, publisher unknown, December 1990.
National Board of Architects, Quantity Surveyars and Building Contractors (T), Registered Architects, Quantity Surveyars and Building Contractors as at 31-12-1995, Dar es Salaam, 1996.
NCC, Eleventh Annual Report and Accounts for the Year Ended June 30, 1993, Dar es Salaam, 1994.
NCC, Seminar on dornestic capacity building in the production of constntction materialsin Tanzania, Dar es Salaam, 1994.
Nguluma, H., Rajab, H., Mosha, L.H. Use of binders in low income housing in Tanzania, a CHS Research Report, Dar es Salaam, 1995.
Oates, F. Limestone deposits of Tanganyika Territory, with a description of the commercial uses of limestone and lime and brief notes upon the occurrences of gypsum and magnesite, Geological Survey Department, Bulletin no.4, Dar es Salaam, 1933.
Planning Commission, Tanzania, The infonnal sector 1991, Dar es Salaam.
Planning Commission/Ministry of Finance, The Rolling Plan and FolWard Budget for Tanzania for the period 1995/96-1997/98, volume 1, Dar es Salaam, August 1995.
Planning Commission/Ministry of Finance, The Rolling Plan and Fo!Ward Budget for Tanzania for the period 1996/97-1998/99, vo/.1, Dar es Salaam, August 1996. (yet unpublished)
Raaphorst, J. The introduetion of an environmental infonnation system in Tanzania, M.Sc. thesis, EUT, Eindhoven, May 1996.
Samplonius, C. Energy efficiency in the Tanzanian industry: the cement industry as a case-study, M.Sc. thesis, Eindhoven, December 1994.
Sandin, K. Mortars for masonry and rendering; choice and application, Building Issues, no.3, vol.7, 1995.
Sawe, N. Bioenergy based industries in Tanzania, Ministry of Water, Energy and Minerals, Dar es Salaam, 1995.
79

References
Schilderman, T. (ed.) Rural Housingin Tanzania, report of a seminar organised at Arusha, may 12-20, 1981, CHS Occasional Paper, Dar es Salaam/Rotterdam, December 1982.
Scholz, R., Jeschar, R., Jennes, R., Fuchs, W. Umweltgesichtspunkte bei der Herstellung und Anwendung von Kalkprodukten, Teil], Zement-Kalk-Gips International, nr. 10/1994 (47. Jahrgang).
Scholz, R., Jeschar, R., Jennes, R., Fuchs, W. Umweltgesichtspunkte bei der Herstellung und Anwendung von Kalkprodukten, Teil 2, ZKG International, nr. 6/1995 (48. Jahrgang).
Shaghude, Y.W., Mutakyahwa, M.K.D., Shufaa K. Mohamed National report on the status of coastal erosion, sea-level changes and their impacts, Tanzanian case, in: IOC Workshop report no.96, suppl 1, p.85, UNESCO, 1994.
Shemakame, M.M. Production of construction matenals as a policy in Tanzania, Min. of Ind. & Trade, in: NCC, Seminar on capacity building in the production of constntction materials in Tanzania, Dar es Salaam, 1994.
Spence, R.J.S., Cook, D.J. Building matenals indeveloping countnes, Wiley, 1983.
Stulz, R., Mukerji, K. Appropriate building matenals, SKAT!ITP/GATE, St. Gall, 1988.
Tegelaers, M. Pelformanee upgrading of informal building contractors in Dar es Salaam, M.Sc. thesis, EUT, August 1995.
Tilburg, P.T. van, Bertholet, C.J.L. Technology for developing countnes, lecture notes 1597, Eindhoven University of Technology, Sept. 1990.
Tolonen, Y. The consumption of lime in residential buildings, BRU working report 42, Dar es Salaam, 1983.
Torén, K., Brisman, J., Hagberg, S.,Karlsson, G. Improved nasal clearance among pulp-mil! workers after the reduction of lime dust, Scandinavian Joumal of Work, Environment and Health, (no. 22) 1996.
Treffers, M. The informal building process for houses in Dar es Salaam, Tanzania, M.Sc. thesis, EUT, July 1996.
UNCHS (Habitat) Endogenous capacity building for the production of binding materials in the constntction industry- selected case studies, Nairobi, 1993.
UNCHS (Habitat) Energy for building, Nairobi, 1991.
UNCHS (Habitat) Vertical-shaft limekiln technology, Nairobi, 1993.
UNCHS (Habitat), Development of the construction industry for law-ineome shelter and infrastructure, Nairobi, February 1988.
UN-ESCAP, Framework for technology based development planning, Bangalore, 1989.
80
References
UNIDO, The building materials industry indeveloping countries; an analytica! appraisal, Sectoral Studies Series, no.16 vol.l, January 1985.
University of Dar es Salaam, Annual report 1992-93, Dar es Salaam, 1996.
University of Dar es Salaam, Building Matenals Test Reports 1993-1996, unpublished.
Ven, H. van de, Assessment of the sustainability of the smal! scale brick-buming industry in Tanzania, with special attention to biomass energy use, MSc. thesis, EUT, July 1996.
Verkerk, G. et al. BINAS, Groningen, 1986.
Vice President's Office, National Environmental Policy, Dar es Salaam, February 1996. ( draft)
Wetenschappelijk en Technisch Centrum voor het Bouwbedrijf, Beschouwingen over de karbonatie van vette kalk voor binnenpleisterwerk, no.53, Brussel, October 1965.
World Bank, African Development Indicators 1994/95, Washington D.C., 1995.
World Bank, Workers in an inlegrating world; World Development Report 1995, Oxford UP, New York, 1995.
World Bank, From plan to market; World Development Report 1996, Oxford UP, New York, 1996.
81
Epilogue
Epilogue
Befare I went to Tanzania, I could hardly imagine what things and events were to come my way. It was the first time for me to go to the other side of the equator. Of course, I had my expectations about the country. During five years of study, the economy, industry and politica! situation of Tanzania were often used to illustrate the problems of developing countries. Besides that, I had heard the experiences from fellow students who had been to the country and I had seen the usual documentaries on TV. The subject of my particular study however, remained hazy. Nobody could tell me anything on lime indeveloping countries. Thorough reading and talking and even visiting a Dutch sand-lime brick factory gave some general insight in the industry.
The literature I had found in various libraries in the Netherlands could neither give insight in the use nor the production of lime in Tanzania. I had to work out a way to explore the lime industry. Because of the very limited information available, I had to apply a braad framework, that allowed me to adjust the direction of the research any time during my stay.
Rethinking the past year raises a few questions. Did I achieve the objectives of my study? If I had to do it all over again, would I choose the same strategy? What have been the critica! points during the seven months of research?
I believe I have achieved the objective. Given the little knowledge there was and given the Iimited resources I had, I have succeeded in gaining insight in this little part of the Tanzanian industry. I hope that I have also succeeded in writing down my findings in a comprehensible way.
Since more is known about the industry now, it is easier to determine a suitable starting point for research. Sometimes, I feit like a private investigator or detective stroHing around for information in as many places as possible to find leads for my research. Some information I found almast by coincidence. During the final months, people even came to my appartment because the word had spread that a 'mzungu' knew sarnething about 'chokaa'. 1
The contractors' questionnaire did not turn out the way I had expected. Even though the selection of contractors was done in collaboration with an expert, with the idea of improving the response, the results were meagre. I think that the only way to get more results is to make appointments with contractors. Reliability improves, because you get to speak to someone who is acquainted with the issue and you can better judge the accuracy of figures that are presented. However, this raises two new questions. How am I going to contact the contractors and how do I manage to get information of contractors on the other side of the country? I do not know the answers tothese questions, but you get the most out of the situation if you make use of existing local networks.
Now that I have brought under attention the subject of reliability, I must stress that it is no unnecessary waste of time to double-check information. This way I have been able to avoid taking the wrong tracks. Unfortunately, reliability and accuracy remain difficult aspects in Tanzania.
mzungu='white man' or European; chokaa=Iime
82

Epilogt.te
The best times of the research were my visits to the units. People were very eager to show me their business and where possible learn something. I have learnt many things as well, perhaps even more than they learnt from me. Looking back, I wish I could have visited more lime producers. However, the remote locations and limited communication facilities make the producers hard to find in such a vast country as Tanzania.
An important point of interest is the fact that in this small sector, very little people speak English. Kiswahili, the nationallanguage, is for most Tanzanians a second language. People really appreciate even a few words Kiswahili and it can prevent a lot of misunderstanding as well.
83
Annexes
Annexes
A: General information on Tanzania .................................... 2 B: Status of Geological Mapping ....................................... 6 C: Import statistics . . . . . . . . . . . . . . . . . . . . . . . . . . . . . . . . . . . . . . . . . . . . . . . . 17 D: Addresses of R&D and supporting organisations in Tanzania ............... 20 E: Questionnaire for contractors ...................................... 21 F: Results from the contractors' questionnaire . . . . . . . . . . . . . . . . . . . . . . . . . . . . 25 G: Lime Production Units in Tanzania .................................. 29 H: Questionnaire for lime production units ............................... 31 I: Simba Lime Factory Electrical Equipment . . . . . . . . . . . . . . . . . . . . . . . . . . . . . . 38 J: Construction Materials- ISIC Codes ................................. 39 K: Illustrations and photographs . . . . . . . . . . . . . . . . . . . . . . . . . . . . . . . . . . . . . . . 40
1
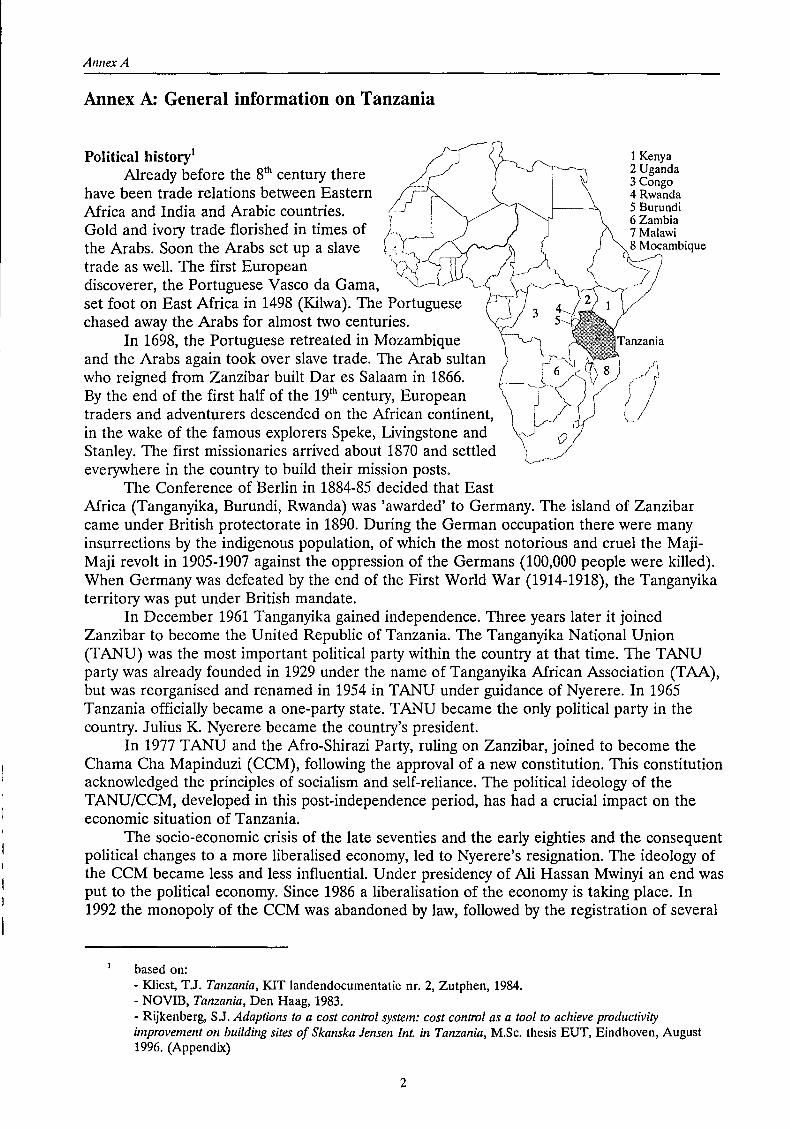
Annex A
Annex A: General information on Tanzania
Political history1
Already before the 81h century there
have been trade relations between Eastern Africa and India and Arabic countries. Gold and ivory trade florisbed in times of the Arabs. Soon the Arabs set up a slave trade as well. The first European discoverer, the Portuguese Vasco da Gama, set foot on East Africa in 1498 (Kilwa). The Portuguese chased away the Arabs for almost two centuries.
In 1698, the Portuguese retreated in Mozambique and the Arabs again took over slave trade. The Arab sultan who reigned from Zanzibar built Dar es Salaam in 1866. By the end of the first half of the 191
h century, European traders and adventurers descended on the African continent, in the wake of the famous explorers Speke, Livingstone and Stanley. The first missionaries arrived about 1870 and settled everywhere in the country to build their mission posts.
The Conference of Berlin in 1884-85 decided that East
1 Kenya 2 Uganda 3 Congo 4 Rwanda 5 Burundi 6 Zambia ?Malawi 8 Moeambigue
Africa (Tanganyika, Burundi, Rwanda) was 'awarded' to Germany. The island of Zanzibar came under British protectorate in 1890. During the German accupation there were many insurrections by the indigenous population, of which the most notorious and cruel the MajiMaji revolt in 1905-1907 against the oppression of the Oermans (100,000 people were killed). When Germany was defeated by the end of the First World War (1914-1918), the Tanganyika territory was put under British mandate.
In December 1961 Tanganyika gained independence. Three years laterit joined Zanzibar to become the United Republic of Tanzania. The Tanganyika National Union (TANU) was the most important politica! party within the country at that time. The TANU party was already founded in 1929 under the name of Tanganyika African Association (TAA), but was reorganised and renamed in 1954 in TANU under guidance of Nyerere. In 1965 Tanzania officially became a one-party state. T ANU became the only politica! party in the country. Julius K. Nyerere became the country's president.
In 1977 TANU and the Afro-Shirazi Party, ruling on Zanzibar, joined to become the Chama Cha Mapinduzi (CCM), following the approval of a new constitution. This constitution acknowledged the principles of socialism and self-reliance. The politica} ideology of the TANU/CCM, developed in this post-independenee period, has had a crudal impact on the economie situation of Tanzania.
The socio-economie crisis of the late seventies and the early eighties and the consequent politica} changes to a more liberalised economy, led to Nyerere's resignation. The ideology of the CCM became less and less influential. Under presidency of Ali Hassan Mwinyi an end was putto the politica! economy. Since 1986 a liberalisation of the economy is taking place. In 1992 the monopoly of the CCM was abandoned by law, foliowed by the registration of several
based on: - Kliest, T.J. Tanzania, KIT landendocumentatie nr. 2, Zutphen, 1984. - NOVIB, Tanzania, Den Haag, 1983. - Rijkenberg, S.J. Adaptions to a cost control system: cost control as a tooi to achieve productivity impravement on building sites of Skanska Jensen Int. in Tanzania, M.Sc. thesis EUT, Eindhoven, August 1996. (Appendix)
2

Annex A
politica! parties a year later. In 1995 the first multi-party elections were held, partly basedon pressure from donor countries. The elections have resulted in a victory of the ruling CCM party; Benjamin W. Mkapa has succeeded Ali Hassan Mwinyi. Despite the CCM victory the 1995 elections should be viewed as the start of a more democratie process and of politica! selfconsciousness among the population of Tanzania.
Demographical Over 120 tribes, from 8 main cultural groups live in Tanzania, but none of them
constitutes more than 10% of the total population. The Kiswahili language has been and still is a binding factor. No major ethnic struggles have taken place in Tanzania sofar, unlike neighbouring countries such as Rwanda, Burundi and Zaïre. This makes the Tanzanian society in this repsect a very stabie and secure society, which especially is a relevant factor in view of foreign companies in the country.
Other population groups include Asians, who are primarily of Indian origin and came to Tanzania as early as around 1900. Whereas the Tanzanian-African population is mainly occupied with agriculture, the Tanzanian-Asian population has a dominant position in the trade sector. Economie reforms and politica! pluralism have slightly sharpened ethnic differences (indigenous African versus Tanzanian-Asian and religious based differences respectively).
Climate Tanzania is situated just South of the equator. lts landscape has considerable altitude
differences, causing a varianee of temperatures in the country. Three elirnatic zones can be distinguished: - moderate temperature zones: Southern (Iringa, Mbeya, Songea) and Northern highlands (Arusha). - warm and humid zones: around the lakes and coastal plateau - hot and dry zones: inland plateaus.
Rainfall varies according to location and time. The largest part of the country has one rainy season, from December till May. In the North, two rainy seasons occur during this period: one in November/December and one from March till May. Twenty-one percent of the country receives more than 750 mm rain per year; only three percent receives more than 1250 mm (both 90% chance). Considerable differences are possible in annual rainfall, especially oin the drier areas of the country.
Especially the rainy periods can have severe influences on the Iime burning process when no measures are taken to prevent rainwater to enter the kilnor clamp. Moreover, one has· to account for the fact that road transport can be severely hindered by heavy rain. The heavy rains plus the large diurnal temperature differences in some areas can influence the condition of building materials stared on site. Equipment stared on site must be protected from rains as well.
Infrastructure The map on the following page gives an overview of the physical infrastructure in
Tanzania. Airport information: Sturkenboom, B.J. Analysis of the aeronautical navigation service organisation in Tanzania, M.Sc. thesis, EUT Eindhoven, June 1997. T ANESCO information: Dijke, P.J.J. van, Future possibilities for mini hydro power in Tanzania, M.Sc. thesis, EUT Eindhoven, August 1996.
3
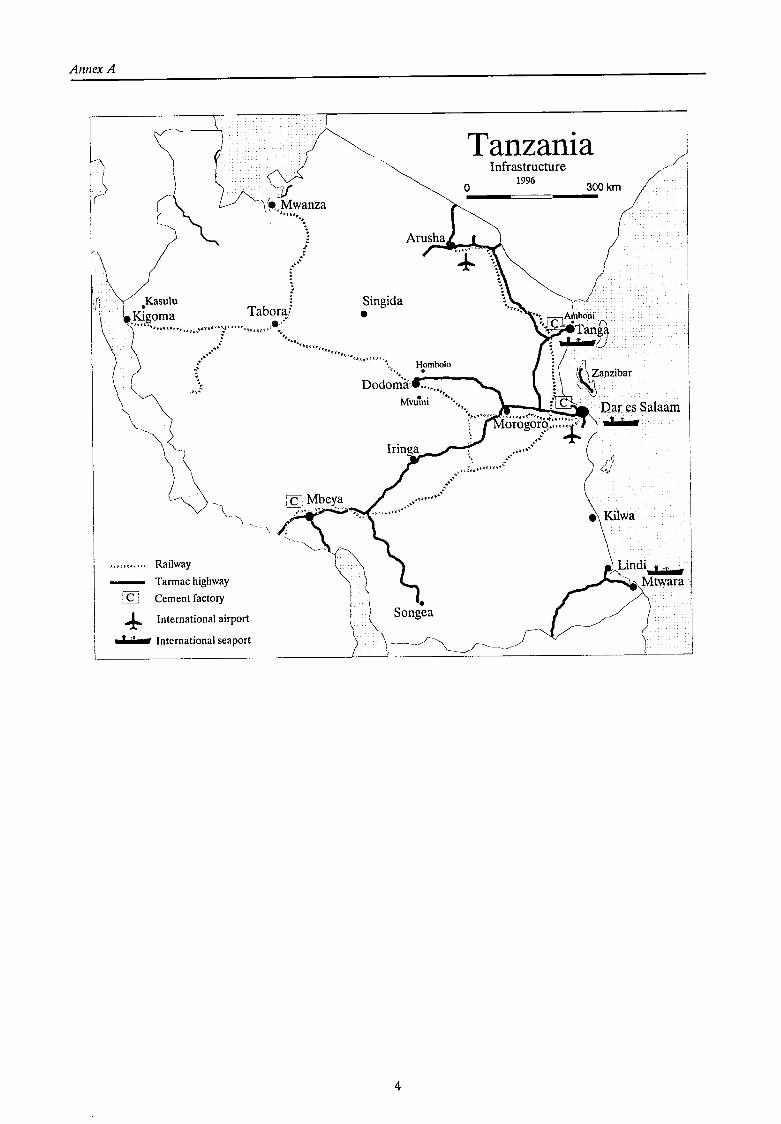
Annex A
Tanzania
Kasulu 0
I I
I
I Railway
Tannac highway
~ÇJ Cement factory I
Singida •
0
Infrastructure 1996
I ~ International airport
I .a..., International seaport \ · \ ____ ,f~ / --.__ __ __J-\ -~--------------_J _ ___,'! ·-------
4
300km
!Î <,.,
/.-1 " I
I
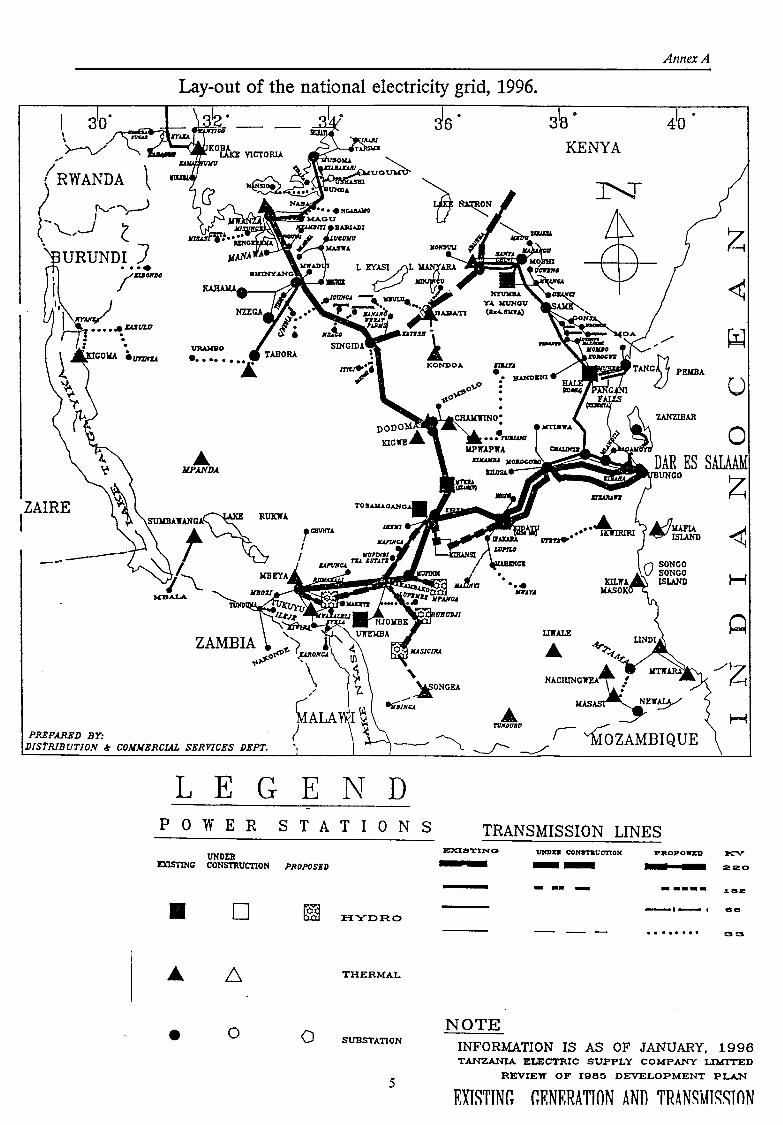
I
Annex A
Lay-out of the national electricity grid, 1996.
I \
•'
?(RWANDA l
"'--~ I
("-- .. -' ( . URUNDI )
ZAIRE
--
PREPAR.ED BY:
•••• /n.oxH
DISTRIBUT/ON .i' COMMERCIAL SERVICES DEPT.
LEGEND POWER STATIONS
UNDER ElClSTING CONSTRUCl10N PROPOSED
• D HYDRO
THERMAL
• 0 0 SUBSTATION
5
0
4
KENYA
z
u
0
z
TRANSMISSION LINES P:ROPOS'ZD »CV' -- 220
- .. - ----- 1::S2
-•-• ee
• • • • • • • • 33
NOTE INFORMATION IS AS OF JANUARY, 1996 TANZANIA ELECTRIC SUPPLY COMPANY UMITED
REVIEW OF 1965 DEVELOPMENT PLAN
F.XTSTJNrr rrF.NF.RATION ANn TRAN~MJ~STON

Annex B
B. Status of Geological Mapping as July 1996
Quarter Degree Sheets {QDS) map on the last page. Geological Survey Department, Dodoma
Sheet no. QDS Title of QDS
1 1 Kyerwa
2 2 Kyaka
3 3 Bukoba
4 4&5 North Mara
5 6 & 14 East Mara
6 7 Nyabiyonza
7 8 Bukene
8 9 Kamachumu
9 10,11,21N & 22N Ukerewe
10 12 Kiabakari
11 13 Buhemba
12 15 Kleins Camp
13 16 & 27 Lolion do
14 17 Rusumo Falls
15 18 Lake Burigi
16 19 Rubondo lsland
17 20 Nyakaliro
18 23 Bunda
19 24 Kirawira
20 25 Soronera
21 26 Soit Ayai
22 28 Kibangiini
23 29 Ngara
24 30 Biharamulo
25 31 Nyamirembe
26 32 Geita
27 33 (Short paper 29)'3
28 34 & 22S Ngudu
29 35 Malya
30 36 Bumera
31 37 Moru
32 38 Oldonyo Ogol
~
6
Year Publ.'1
1967 8
1967 8
1969 8
1964 A
1967 A
1968 8
1967 8
1970 8
1962 A
1966 A
1967 A
1968 A
1966 8
1967 A
1967 8
1970 8
1961 A
1962 A
1967 A
1967 A
1968 A
1969 A
1967 A
1966 A
1966 A
1961 A
1947 c
1962 A
1963 A
1963 A
1960 A
1958 A
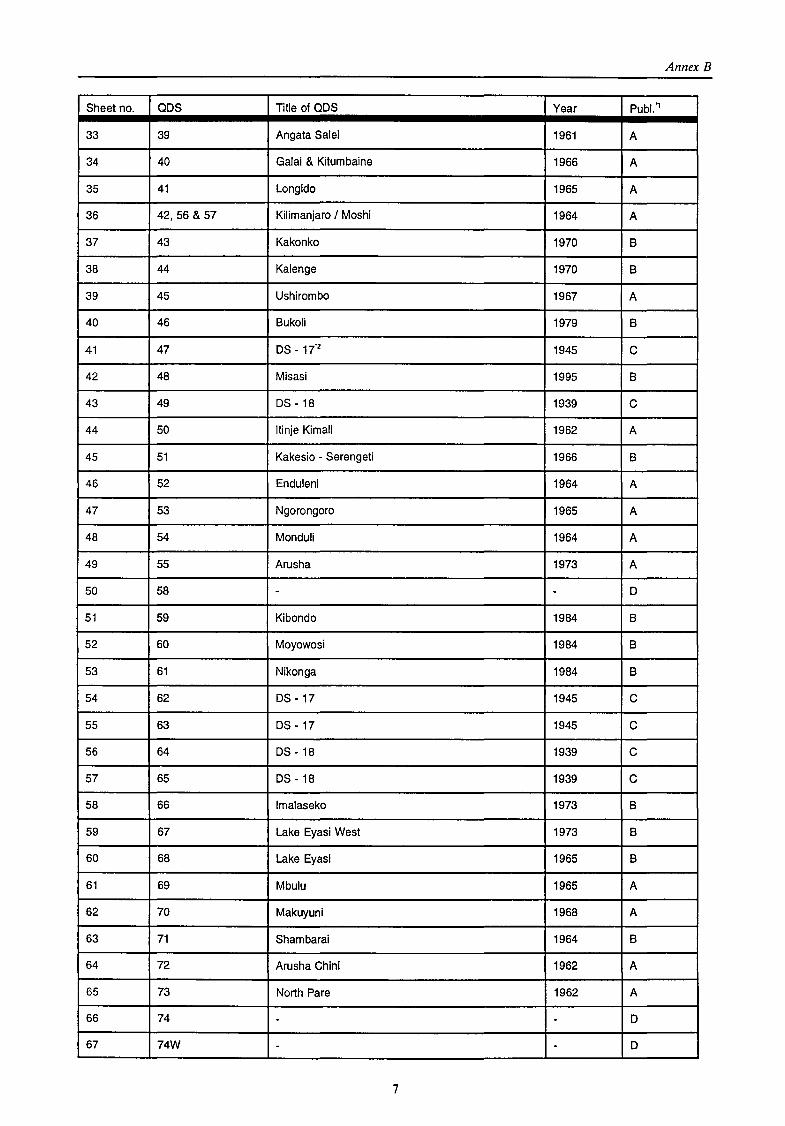
- ---------------------------------------------------------
Annex B
Sheet no. QDS Title of QDS Year Publ.'1
33 39 Angata Salei 1961 A
34 40 Galai & Kitumbaine 1966 A
35 41 Longido 1965 A
36 42, 56 & 57 Kilimanjaro I Moshi 1964 A
37 43 Kakonko 1970 8
38 44 Kalenge 1970 8
39 45 Ushirombo 1967 A
40 46 8ukoli 1979 8
41 47 DS- 17'2 1945 c
42 48 Misasi 1995 8
43 49 DS- 18 1939 c
44 50 ltinje Kimali 1962 A
45 51 Kakesio - Serengeti 1966 8
46 52 Enduleni 1964 A
47 53 Ngorongoro 1965 A
48 54 Monduli 1964 A
49 55 Arusha 1973 A
50 58 - - D
51 59 Kibondo 1984 8
52 60 Moyowosi 1984 8
53 61 Nikonga 1984 8
54 62 DS -17 1945 c
55 63 DS- 17 1945 c
56 64 DS- 18 1939 c
57 65 DS -18 1939 c
58 66 lmalaseko 1973 8
59 67 Lake Eyasi West 1973 8
60 68 Lake Eyasi 1965 8
61 69 Mbulu 1965 A
62 70 Makuyuni 1968 A
63 71 Shambarai 1964 8
64 72 Arusha Chini 1962 A
65 73 North Pare 1962 A
66 74 - - D
67 74W - - D
7
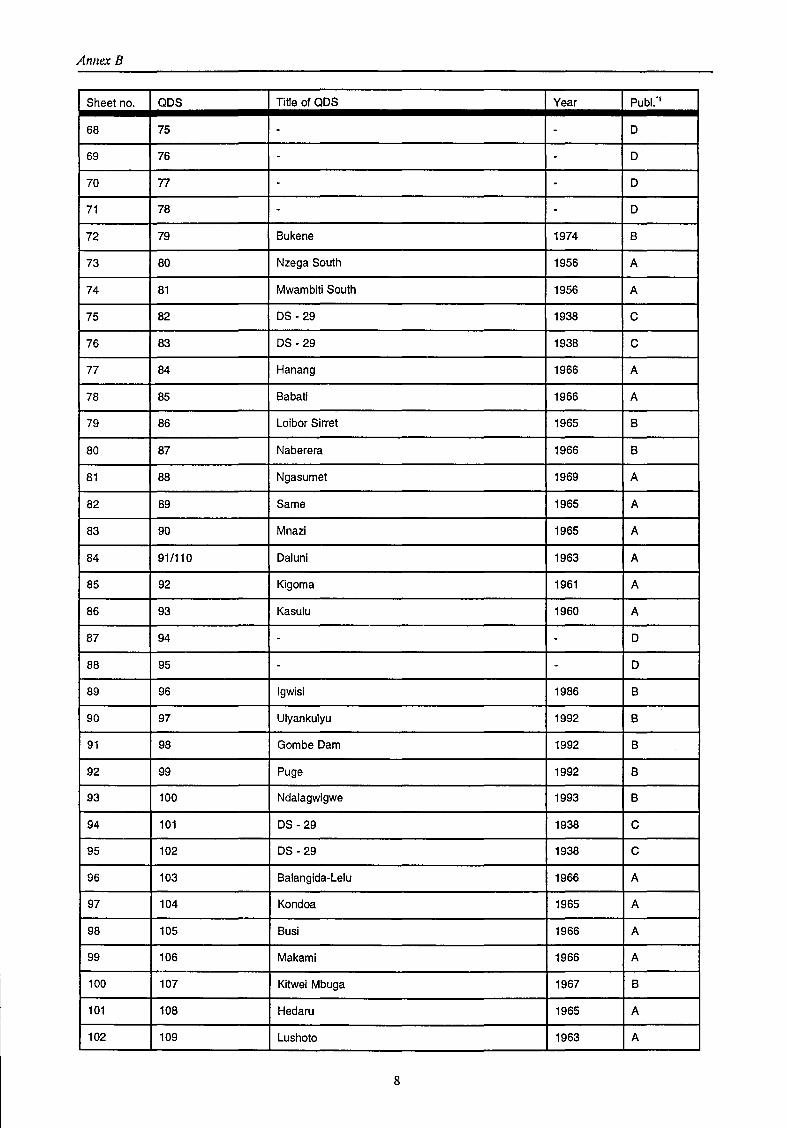
Annex B
Sheet no. QDS Title of QDS Year Publ.'1
68 75 - - D
69 76 - - D
70 n - - D
71 78 - - D
72 79 Bukene 1974 8
73 80 Nzega South 1956 A
74 81 Mwambiti South 1956 A
75 82 os- 29 1938 c
76 83 os- 29 1938 c
77 84 Hanang 1966 A
78 85 Baba ti 1966 A
79 86 Loibor Sirrat 1965 8
80 87 Naberera 1966 8
81 88 Ngasumet 1969 A
82 89 Same 1965 A
83 90 Mnazi 1965 A
84 91/110 Daluni 1963 A
85 92 Kigoma 1961 A
86 93 Kasulu 1960 A
87 94 - - D
88 95 - - D
89 96 lgwisi 1986 8
90 97 Ulyankulyu 1992 8
91 98 GombeDam 1992 8
92 99 Puge 1992 8
93 100 Ndalagwigwe 1993 8
94 101 os- 29 1938 c
95 102 os- 29 1938 c
96 103 Balangida-Lelu 1966 A
97 104 Kondoa 1965 A
98 105 Busi 1966 A
99 106 Makami 1966 A
100 107 Kitwei Mbuga 1967 8
101 108 Hedaru 1965 A
102 109 Lushoto 1963 A
8
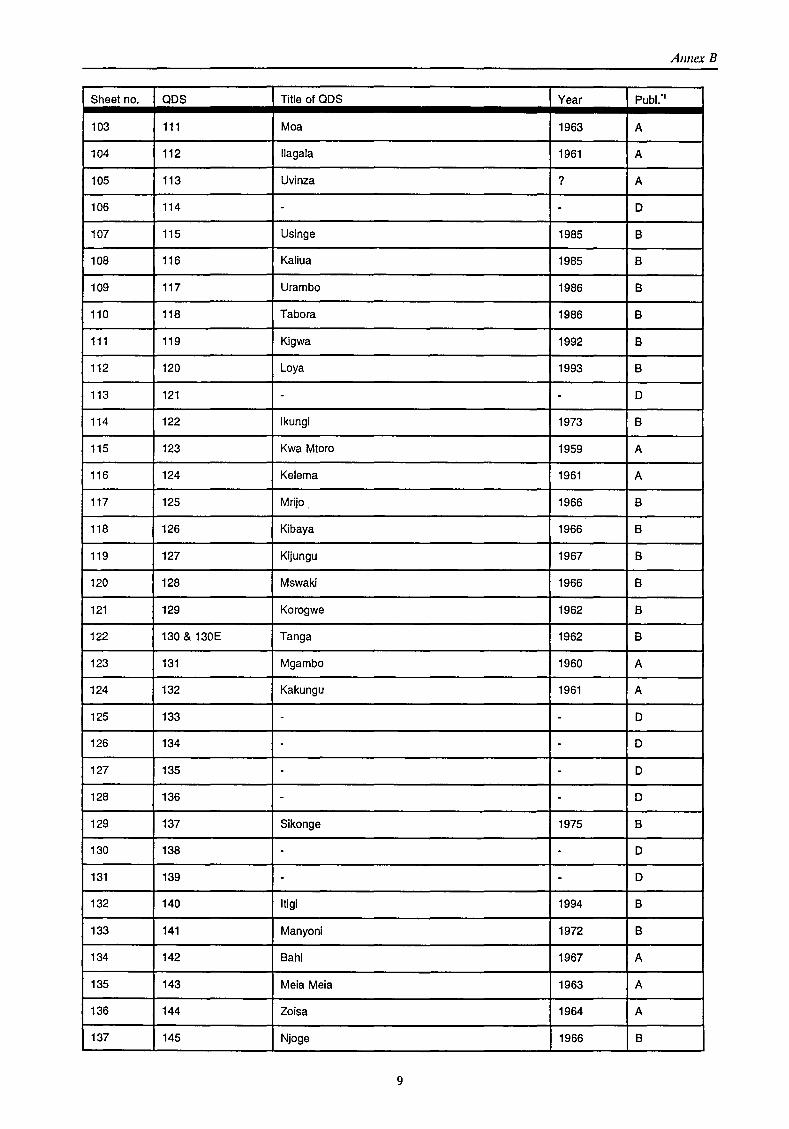
Annex B
Sheet no. QDS Title of QDS Year Publ.'1
103 111 Moa 1963 A
104 112 llagala 1961 A
105 113 Uvinza ? A
106 114 - - D
107 115 Usinge 1985 8
108 116 Kali u a 1985 8
109 117 Urambo 1986 8
110 118 Tabora 1986 8
111 119 Kigwa 1992 8
112 120 Loya 1993 8
113 121 - - D
114 122 lkungi 1973 8
115 123 Kwa Mtoro 1959 A
116 124 Keierna 1961 A
117 125 Mrijo. 1966 8
118 126 Kibaya 1966 8
119 127 Kijungu 1967 8
120 128 Mswaki 1966 8
121 129 Korogwe 1962 8
122 130 & 130E Tanga 1962 8
123 131 Mgambo 1960 A
124 132 Kakungu 1961 A
125 133 - - D
126 134 - - D
127 135 - - D
128 136 - - D
129 137 Sikonge 1975 8
130 138 - - D
131 139 - - D
132 140 ltigi 1994 8
133 141 Manyoni 1972 8
134 142 8ahi 1967 A
135 143 Meia Meia 1963 A
136 144 Zo i sa 1964 A
137 145 Njoge 1966 8
9
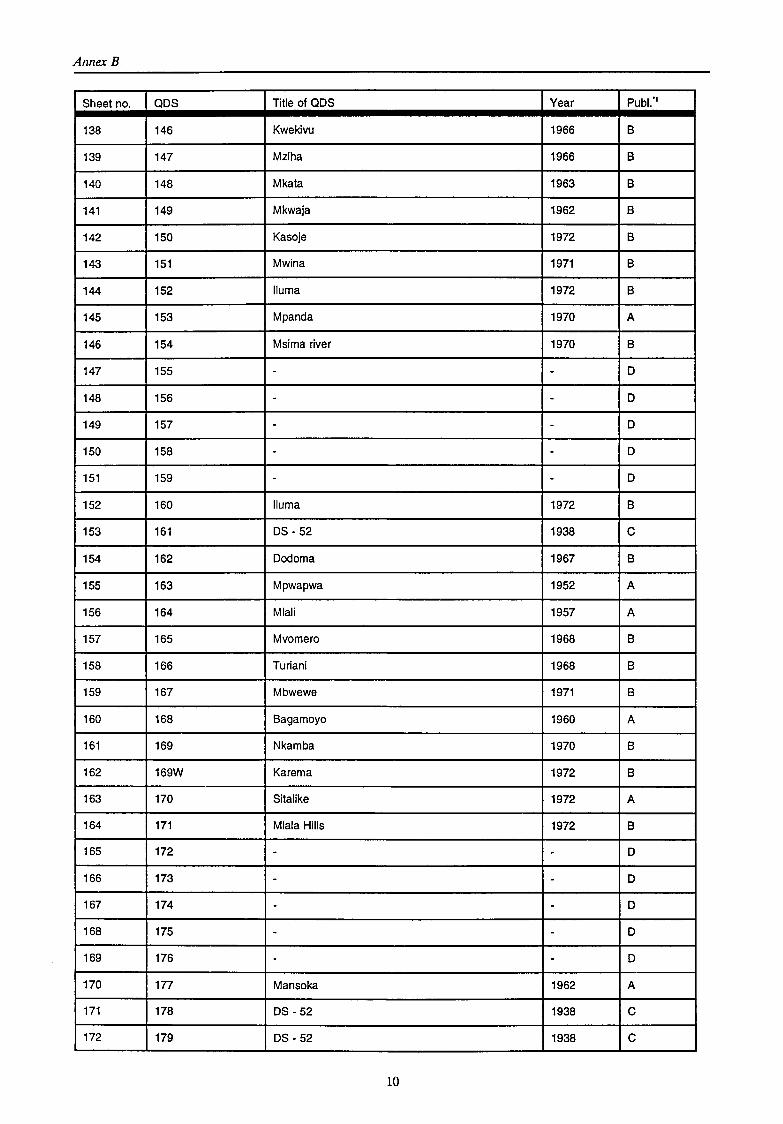
Annex B
Sheet no. QDS Title of QDS Year Publ..1
138 146 Kwekivu 1966 B
139 147 Mziha 1966 B
140 148 Mkata 1963 B
141 149 Mkwaja 1962 B
142 150 Kasoje 1972 B
143 151 Mwina 1971 B
144 152 lluma 1972 B
145 153 Mpanda 1970 A
146 154 Msima river 1970 B
147 155 - - D
148 156 - - D
149 157 - - D
150 158 - - D
151 159 - - D
152 160 lluma 1972 B
153 161 os- 52 1938 c
154 162 Dodoma 1967 B
155 163 Mpwapwa 1952 A
156 164 Mlali 1957 A
157 165 Mvomero 1968 B
158 166 Turiani 1968 B
159 167 Mbwewe 1971 B
160 168 Bagamoyo 1960 A
161 169 Nkamba 1970 B
162 169W Karerna 1972 B
163 170 Sitalike 1972 A
164 171 Mlala Hills 1972 B
165 172 - - D
166 173 - - D
167 174 - - D
168 175 - - D
169 176 - - D
170 177 Mansoka 1962 A
171 178 os- 52 1938 c
172 179 DS- 52 1938 c
10
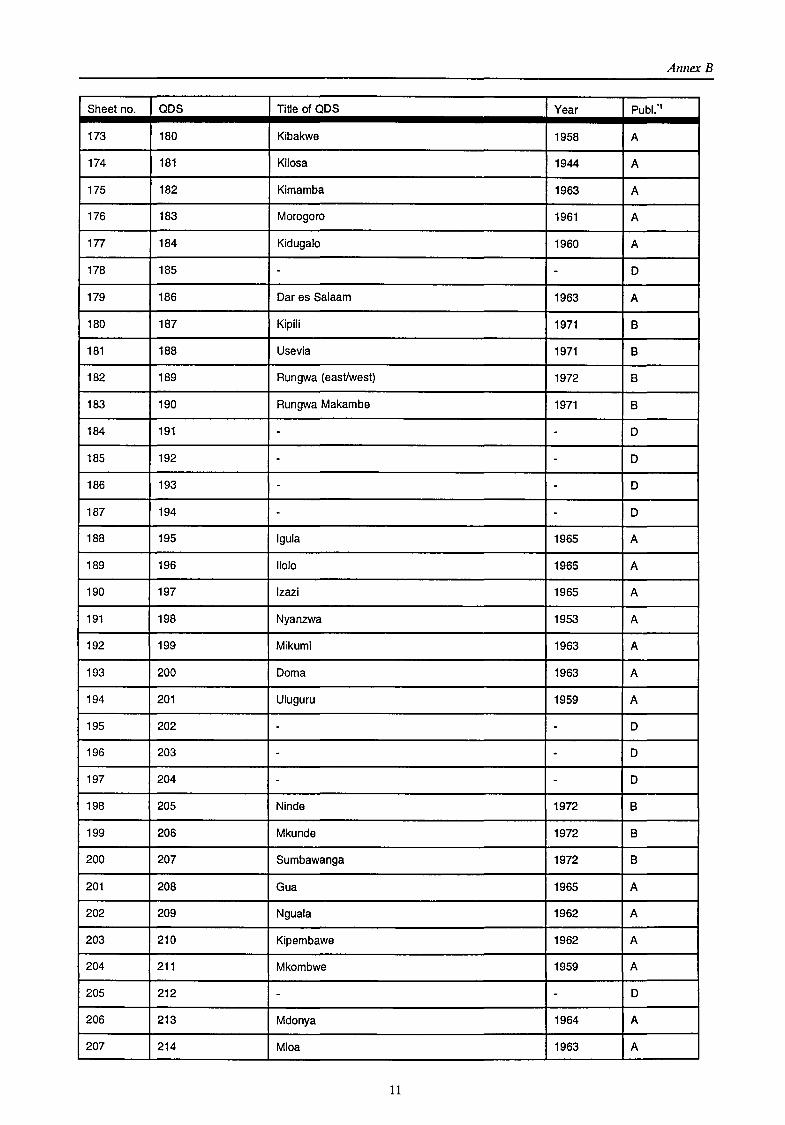
----------------------------------------------------------
Annex B
Sheet no. QDS Title of QDS Year Publ."1
173 180 Kibakwe 1958 A
174 181 Kilosa 1944 A
175 182 Kimamba 1963 A
176 183 Morogoro 1961 A
177 184 Kidugalo 1960 A
178 185 - - D
179 186 Dar es Salaam 1963 A
180 187 Kipili 1971 8
181 188 U se via 1971 8
182 189 Rungwa (eastlwest) 1972 8
183 190 Rungwa Makambe 1971 8
184 191 - - D
185 192 - - D
186 193 - - D
187 194 - - D
188 195 lgula 1965 A
189 196 llolo 1965 A
190 197 lzazi 1965 A
191 198 Nyanzwa 1953 A
192 199 Mikurn i 1963 A
193 200 Dom a 1963 A
194 201 Uluguru 1959 A
195 202 - - D
196 203 - - D
197 204 - - D
198 205 Ninde 1972 8
199 206 Mkunde 1972 8
200 207 Sumbawanga 1972 8
201 208 Gua 1965 A
202 209 Nguala 1962 A
203 210 Kipembawe 1962 A
204 211 Mkombwe 1959 A
205 212 - - D
206 213 Mdonya 1964 A
207 214 Mloa 1963 A
11
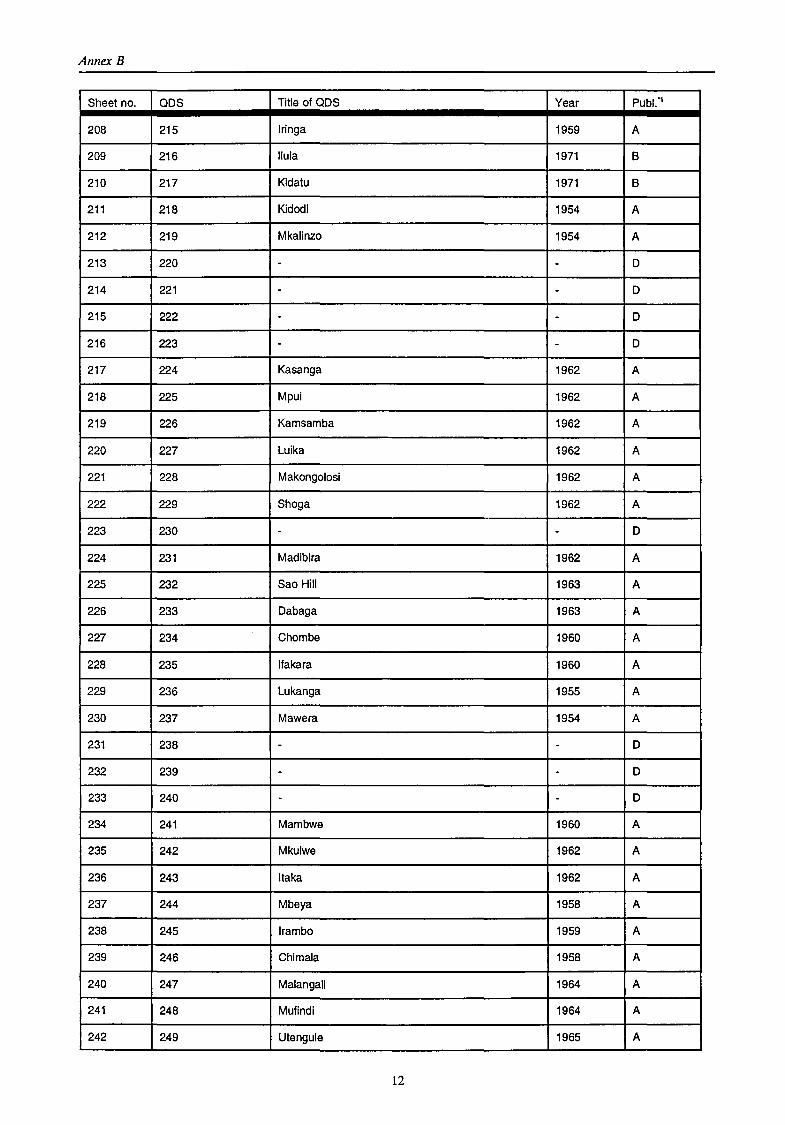
Annex B
Sheet no. QDS Title of ODS Year Publ."1
208 215 lringa 1959 A
209 216 llula 1971 8
210 217 Kidatu 1971 8
211 218 Kidodi 1954 A
212 219 Mkalinzo 1954 A
213 220 - - D
214 221 - - D
215 222 - - D
216 223 - - D
217 224 Kasanga 1962 A
218 225 Mpui 1962 A
219 226 Kamsamba 1962 A
220 227 Lui ka 1962 A
221 228 Makongolosi 1962 A
222 229 Shoga 1962 A
223 230 - - D
224 231 Madibira 1962 A
225 232 Sao Hili 1963 A
226 233 Dabaga 1963 A
227 234 Chombe 1960 A
228 235 lfakara 1960 A
229 236 Lukanga 1955 A
230 237 Mawera 1954 A
231 238 - - D
232 239 - - D
233 240 - - D
234 241 Mambwe 1960 A
235 242 Mkulwe 1962 A
236 243 ltaka 1962 A
237 244 Mbeya 1958 A
238 245 Irambo 1959 A
239 246 Chimala 1958 A
240 247 Malangali 1964 A
241 248 Mufindi 1964 A
242 249 Utengule 1965 A
12
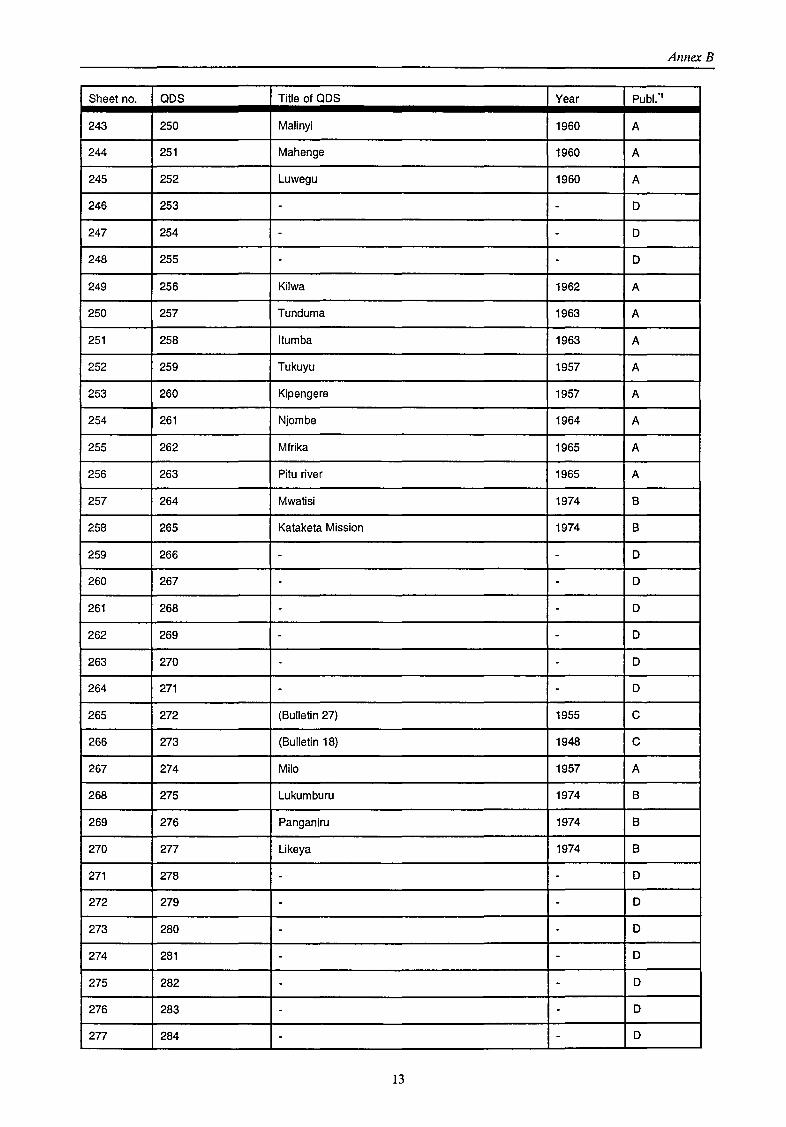
Annex B
Sheet no. QDS Title of QDS Year Publ."1
243 250 Malinyi 1960 A
244 251 Mahenge 1960 A
245 252 Luwegu 1960 A
246 253 - - D
247 254 - - D
248 255 - - D
249 256 Kilwa 1962 A
250 257 Tunduma 1963 A
251 258 !tumba 1963 A
252 259 Tukuyu 1957 A
253 260 Kipengere 1957 A
254 261 Njombe 1964 A
255 262 Mfrika 1965 A
256 263 Pitu river 1965 A
257 264 Mwatisi 1974 B
258 265 Katakela Mission 1974 B
259 266 - - D
260 267 - - D
261 268 - - D
262 269 - - D
263 270 - - D
264 271 - - D
265 272 (Bulletin 27) 1955 c
266 273 (Bulletin 18) 1948 c
267 274 Milo 1957 A
268 275 Lukumburu 1974 B
269 276 Panganiru 1974 B
270 277 Likeya 1974 B
271 278 - - D
272 279 - - D
273 280 - - D
274 281 - - D
275 282 - - D
276 283 - - D
277 284 - - D
13
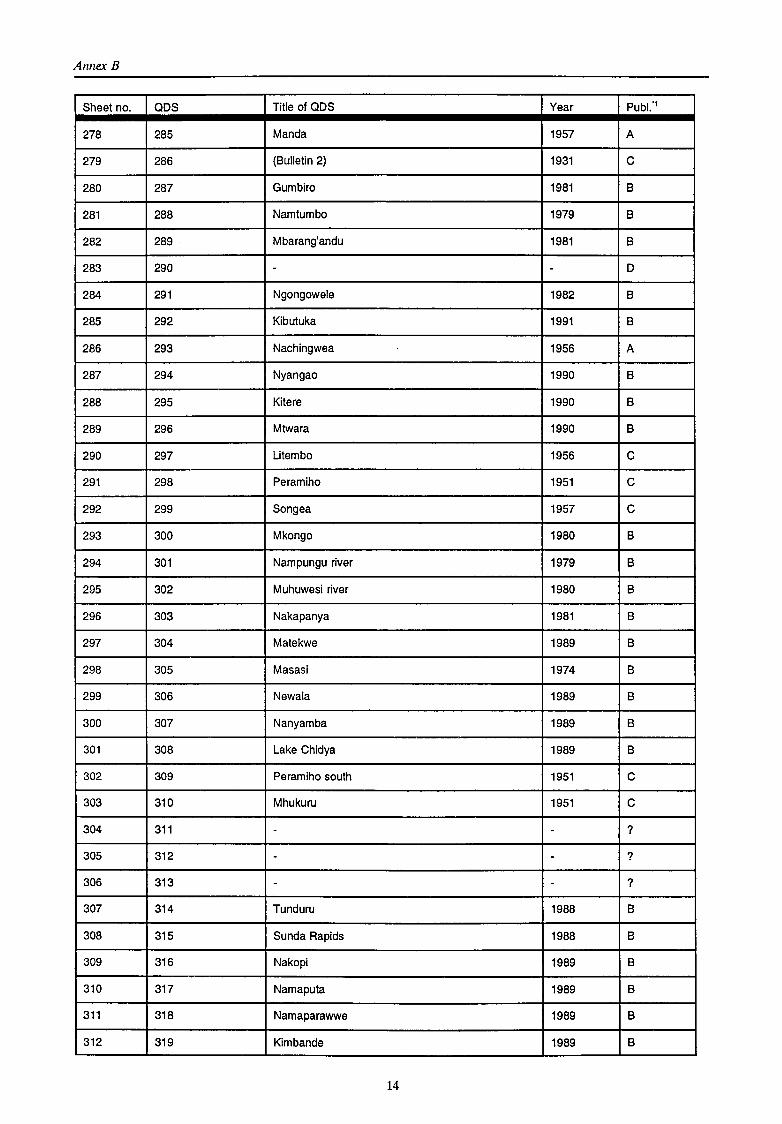
Annex B
Sheet no. QDS Title of QDS Year Publ."1
278 285 Mand a 1957 A
279 286 (Bulletin 2) 1931 c
280 287 Gumbiro 1981 8
281 288 Namtumba 1979 8
282 289 Mbarang'andu 1981 B
283 290 - - D
284 291 Ngongowele 1982 B
285 292 Kibutuka 1991 8
286 293 Nachingwea 1956 A
287 294 Nyangao 1990 B
288 295 Kitere 1990 B
289 296 Mtwara 1990 8
290 297 Litembo 1956 c
291 298 Peramiho 1951 c
292 299 Songea 1957 c
293 300 Mkongo 1980 8
294 301 Nampungu river 1979 8
295 302 Muhuwesi river 1980 B
296 303 Nakapanya 1981 8
297 304 Matekwe 1989 8
298 305 Masasi 1974 8
299 306 Newala 1989 8
300 307 Nanyamba 1989 8
301 308 Lake Chidya 1989 8
302 309 Peramiho south 1951 c
303 310 Mhukuru 1951 c
304 311 - - ?
305 312 - - ?
306 313 - - ?
307 314 Tunduru 1988 8
308 315 Sunda Rapids 1988 8
309 316 Nakopi 1989 8
310 317 Namaputa 1989 B
311 318 Namaparawwe 1989 B
312 319 Kimbande 1989 8
14
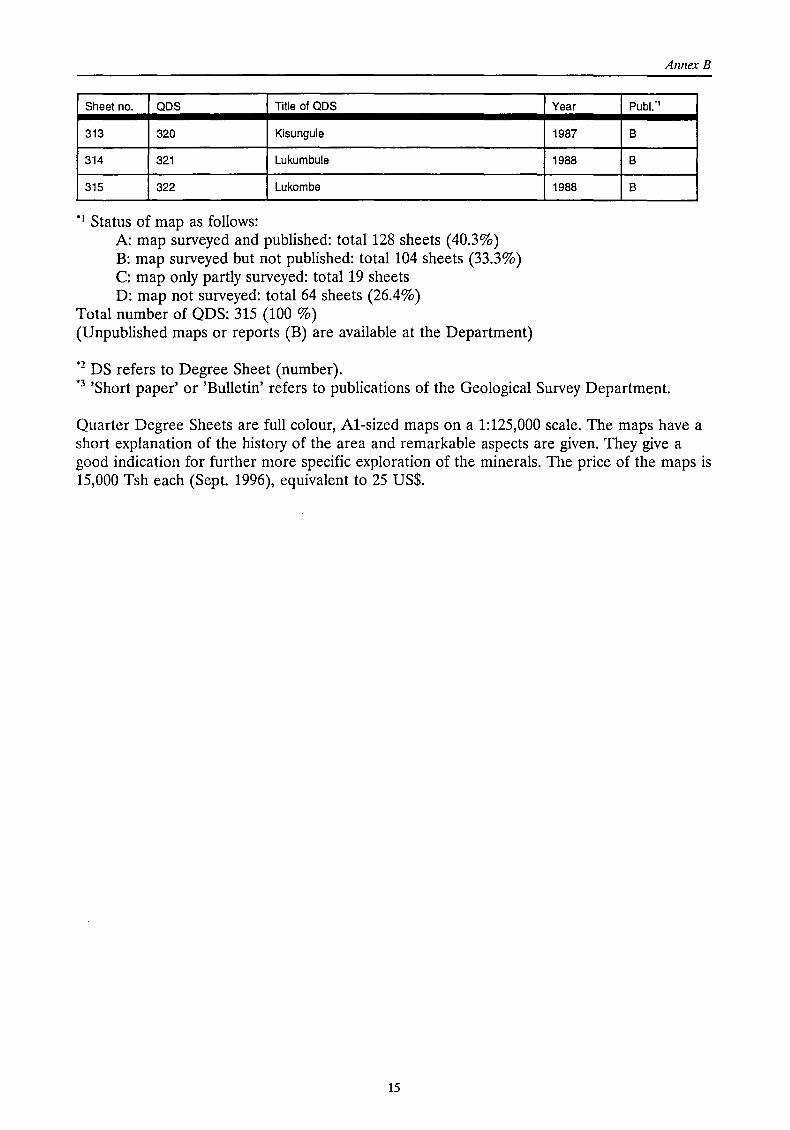
Sheet no. QDS Title of QDS
313 320 Kisungule
314 321 Lukumbule
315 322 Lukombe
*1 Status of map as follows: A: map surveyed and published: total 128 sheets ( 40.3%) B: map surveyed but not published: total 104 sheets (33.3%) C: map only partly surveyed: total 19 sheets D: map not surveyed: total 64 sheets (26.4%)
Total number of QDS: 315 (100 %) (Unpublished maps or reports (B) are available at the Department)
*2 DS refers to Degree Sheet (number).
Annex B
Year Publ."1
1987 8
1988 8
1988 8
•3 'Short paper' or 'Bulletin' refers to publications of the Geological Survey Department
Quarter Degree Sheets are fullcolour, A1-sized maps on a 1:125,000 scale. The maps have a short explanation of the history of the area and remarkable aspects are given. They give a good indication for further more specific exploration of the minerals. The price of the maps is 15,000 Tsh each (Sept. 1996), equivalent to 25 US$.
15
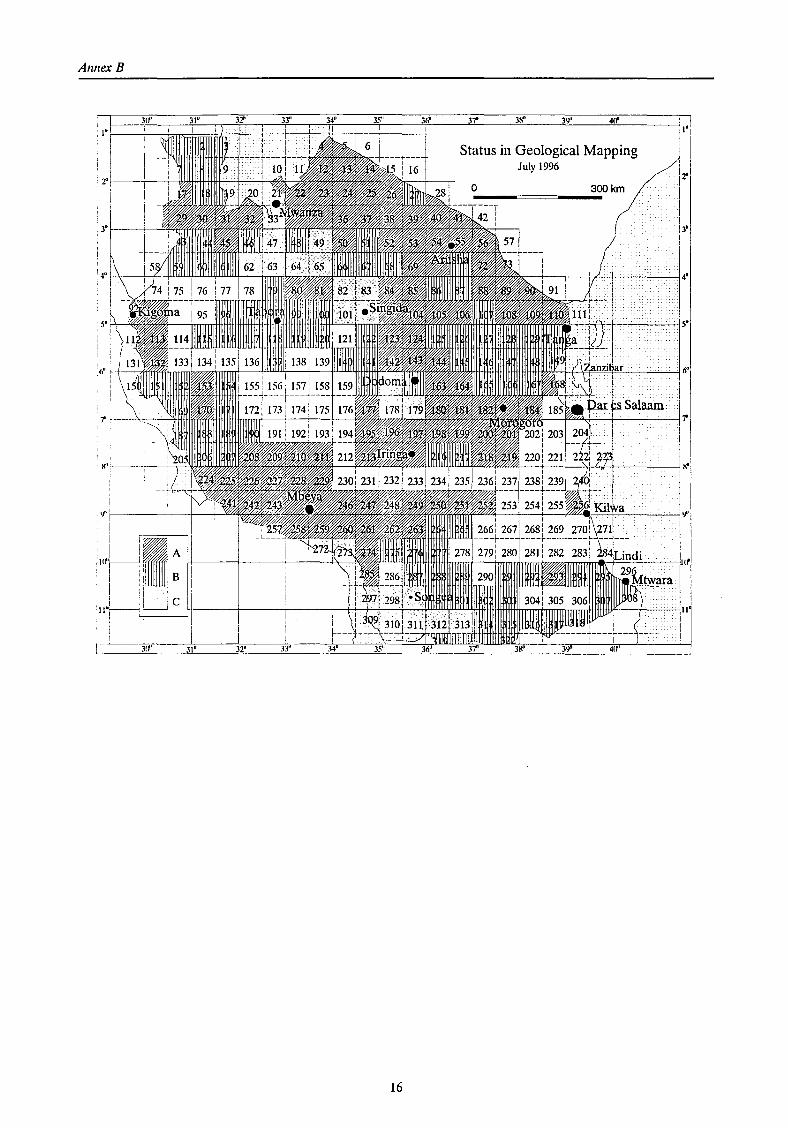
Annex B
16

Annex C
Annex C: Import statistics
(va lues
4
IMPORTS I i me cement
Tsh(current) %of total2 Tsh (curr.) %of total
1981 2,051,968 0.020 39,685,334 0.39 1982 1,738,150 O.ü17 25,417,437 0.24 1983 6,223,433 0.074 39,654,550 0.47 1984 8,498,023 0.088 19,244,211 0.20 1985 . 7,814,214 0.051 27,518,554 0.18 1986 436,820 0.0014 73,880,869 0.24 1987 385,104 0.00065 87,068,344 0.15 1988 13,004 0.000016 91,846,257 0.11 1989 3,333,033 0.0023 55,452,419 0.038 1990 47,345,311 0.018 59,823,819 0.022 1991 969,078 0.00029 165,102,188 0.049 1992 354,776 0.000079 13,117,301 0.0029 1993 223,357,1354 0.036 n.a. n.a. 1994 13,178,370 0.0017 n.a. n.a. 1995 12,161,760 0.0013 n.a. n.a. 19963 6,392,5055 n.a. n.a. n.a.
in c.1.t. pnces)
Bank of Tanzania, Economie Bulletin for the quarler ended 30-6-96, Dar es Salaam, 1996. p.64
Up to 31/08/96
This Customs figure is an outlier.
The TAZARA information section mentioned a 40 tonnes lime sludge transport from Zambia to Dar es Salaam (July 1996), which was not recorded by the Bank of Tanzania and since the value is not known, this is also not included in this table.
17
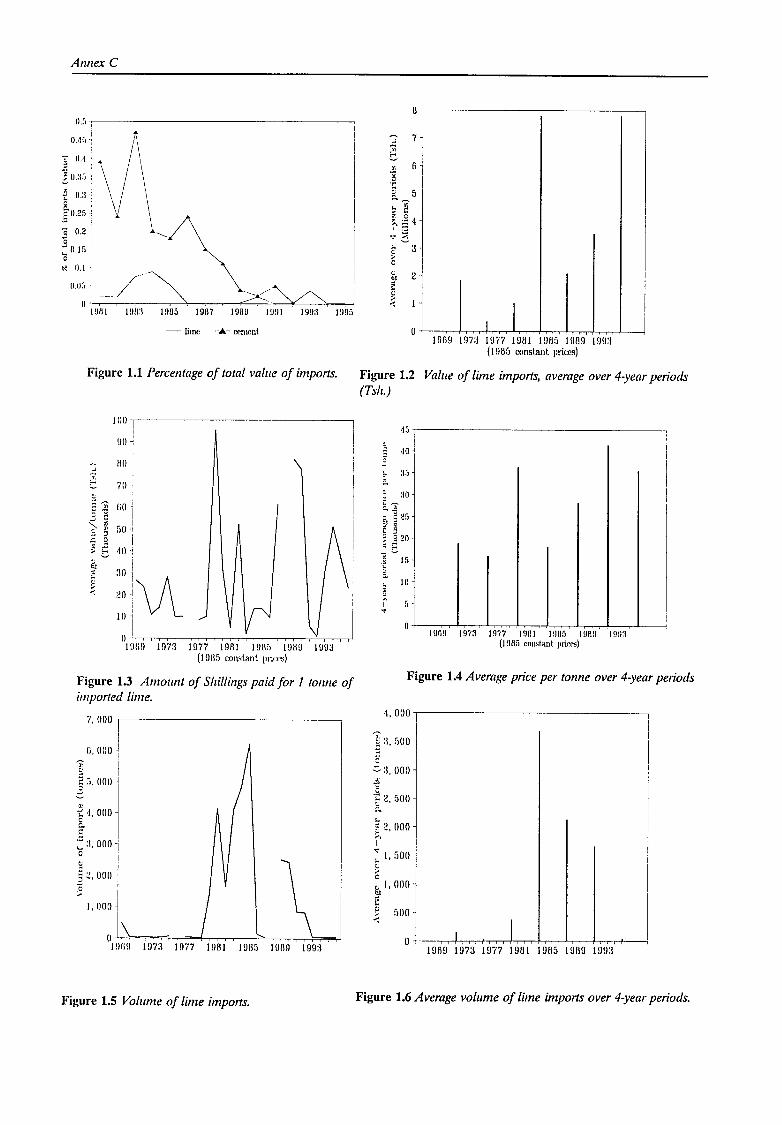
Annex C
n.:, -~--------------------.
:; 0.1 ' ..
Io.:~:,, \ .. f n.:1: c .
"' .§ 0.25
:§ 0.2 c ~ O.lfi c ~ ll.l I
o.o~,, _____ /-·
- Jime -•- cement.
Figure 1.1 Percentage of total value of imports.
liJ()-,--------------------, ' I
!)IJ ~ i
1\ll:
70 i
fiO j
I ;,o _, i
10 -i
I 3o I
~o!\A I U l IJ-- " ' " ' ' '
IUKD 1973 1977 1901 191\5 1989 1993 (1 9115 mnsl.ant. priees)
Figure 1.3 Amount of Shillings paid for 1 tonne of imported time.
7, 000 ,--------------------,
fi,OIJO
"? ~
§ ''· 000 .5
1973 1 !)77 I!JBI 1 nn:, 1 non 1 9!13
Figure 1.5 Volume of time imports.
B
-' 7 )i c ..:!i 6 c .E
5 ""~ .. 00
t: ~ c ~:::: 4 I 3 "' 5 .. 3 ~ ~ c ~ bC 2 f ~ ~ .-.:
0 I I
1969 l!J7:l 1977 1981 1965 1989 19!13 (I !HI5 constant. priccs)
Figure 1.2 Value of time imports, average over 4-year periods (Tslz.)
1''
10 I I
-t :~;,
I I I
:10
lil
l(Jn!J 1973 1977 1 !Hil 1 !1115 1 !JB!l {1 !lll!i c:mL,l:ml prir.es)
Figure 1.4 Average price per tonne over 4-year periods
1, 000 .-~----------------,
T '\ r.(JO J 5 .. ,)
;::.:\, 000
~ t ~. 500
s.. ~ 2, 000 ... I
~ I. 500 ~ c ~c 1, 000
E ~ :iOO ...
I I o+--~~~~~~~~~~~~~~ 1969 1973 1977 1981 19H5 1989 1993
Figure 1.6 Average volume of lime imports over 4-year periods.
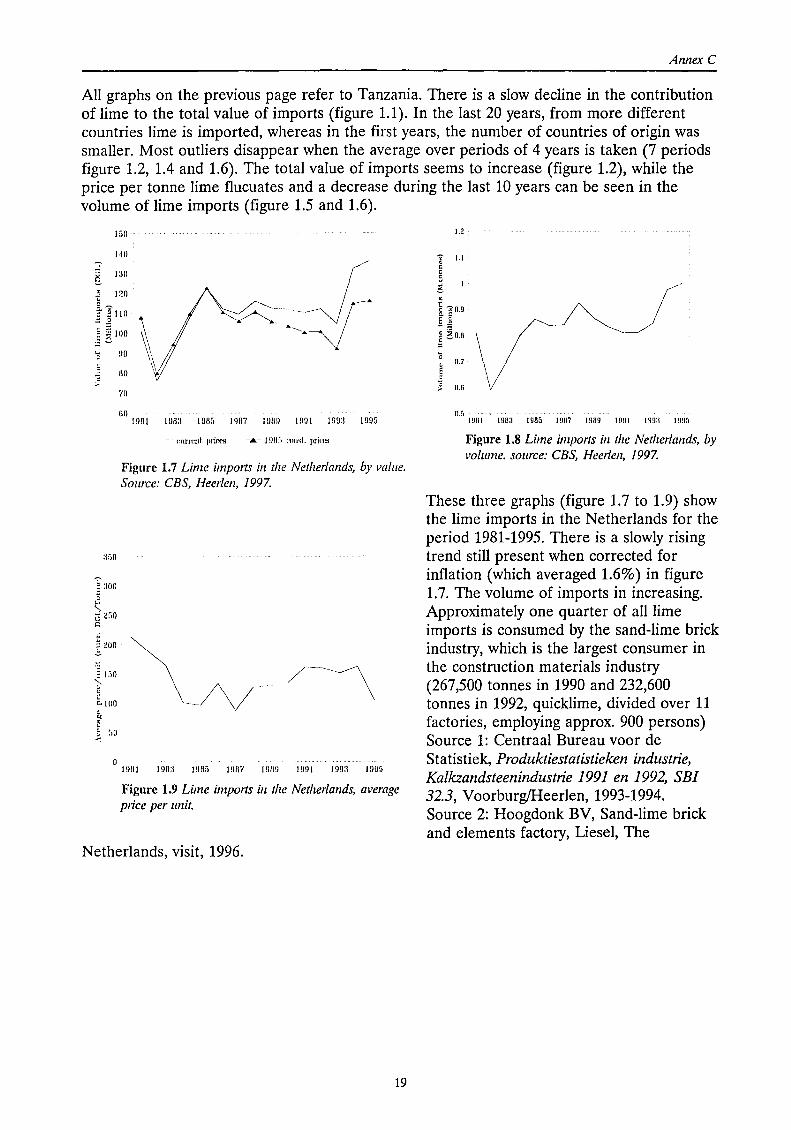
Annex C
All graphs on the previous page refer to Tanzania. There is a slow decline in the contribution of lime to the total value of imparts (figure 1.1). Inthelast 20 years, from more different countries lime is imported, whereas in the first years, the number of countries of crigin was smaller. Most outliers disappear when the average over periods of 4 years is taken (7 periods figure 1.2, 1.4 and 1.6). The total value of imparts seems to increase (figure 1.2), while the price per tonne Iime flucuates and a decrease during the last 10 years can be seen in the volume of lime imparts (figure 1.5 and 1.6).
150
HO
~ 120 . ~ 2' ~ 110
.::: .2
" ê 100 :§6 !JO
110
70
HO 1901 1!lil3 1!1115 1!lfl7 1!lll!l 1!1!11 1!JU:I 19!1:i
--- r:unenl. prir.cs -•- 1 !JB~, I'IIU"'I. prir:t!S
Figure 1.7 Lime imparts in t/ze Netherlands, by value. Sow·ce: CBS, Heerlen, 1997.
:l'iO
\_/\/ ... 1!1111 I!JO:J l!lllf1 1!1117 l!lll!l 1!1!11 19!13 19%
Figure 1.9 Lime imparts in tlze Netlzer/ands, average price per unit.
Netherlands, visit, 1996.
19
1.2
~ 1.1 c c s 1 ' ~ J !J ~ 10.9 E S ... = ~ ;:: ] ~0.8
"5 . 0.7
~ ~ 0.6
o.:, I !1111 19113 I !1115 19117 lflll9 19!11 1!1!1:1 I !l!lf1
Figure 1.8 Lime imparts in the Netherlands, by volume. source: CBS, Heerlen, 1997.
These three graphs (figure 1.7 to 1.9) show the Iime imparts in the Netherlands for the period 1981-1995. There is a slowly rising trend still present when corrected for intlation (which averaged 1.6%) in figure 1.7. The volume of imparts in increasing. Approximately one quarter of all lime imparts is consumed by the sand-lime brick industry, which is the largest consumer in the construction materials industry (267,500 tonnes in 1990 and 232,600 tonnes in 1992, quicklime, divided over 11 factories, employing approx. 900 persons) Souree 1: Centraal Bureau voor de Statistiek, Produktiestatistieken industrie, Kalkzandsteenindustrie 1991 en 1992, SB! 32.3, Voorburg/Heerlen, 1993-1994. Souree 2: Hoogdonk BV, Sand-lime brick and elements factory, Liesel, The
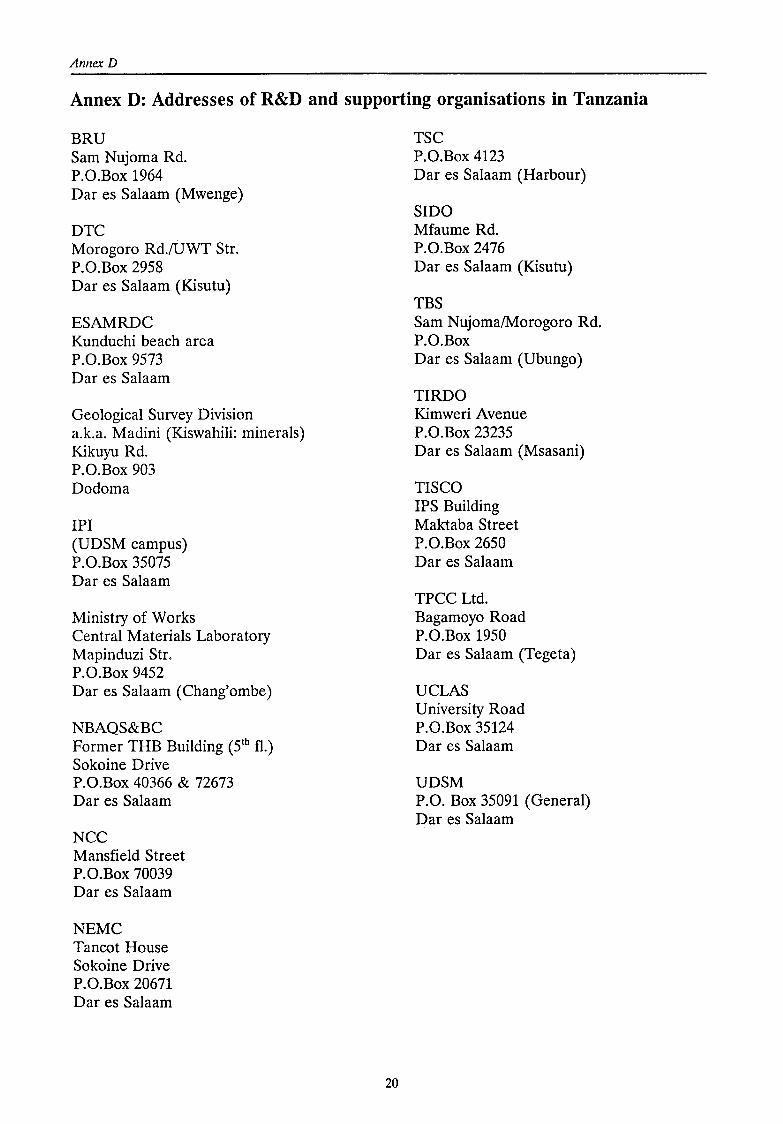
Annex D
Annex D: Addresses of R&D and supporting organisations in Tanzania
BRU Sam Nujoma Rd. P.O.Box 1964 Dar es Salaam (Mwenge)
DTC Morogoro Rd.IUWT Str. P.O.Box 2958 Dar es Salaam (Kisutu)
ESAMRDC Kunduchi beach area P.O.Box 9573 Dar es Salaam
Geological Survey Division a.k.a. Madini (Kiswahili: minerals) Kikuyu Rd. P.O.Box 903 Dodoma
IPI (UDSM campus) P.O.Box 35075 Dar es Salaam
Ministry of Works Central Materials Labaratory Mapinduzi Str. P.O.Box 9452 Dar es Salaam (Chang'ombe)
NBAQS&BC Former THB Building (51
h fl.) Sokoine Drive P.O.Box 40366 & 72673 Dar es Salaam
NCC Mansfield Street P.O.Box 70039 Dar es Salaam
NEMC Tancot House Sokoine Drive P.O.Box 20671 Dar es Salaam
20
TSC P.O.Box 4123 Dar es Salaam (Harbour)
SIDO Mfaume Rd. P.O.Box 2476 Dar es Salaam (Kisutu)
TBS Sam Nujoma/Morogoro Rd. P.O.Box Dar es Salaam (Ubungo)
TIRDO Kimweri Avenue P.O.Box 23235 Dar es Salaam (Msasani)
TISCO IPS Building Maktaba Street P.O.Box 2650 Dar es Salaam
TPCC Ltd. Bagamoyo Road P.O.Box 1950 Dar es Salaam (Tegeta)
UCLAS University Road P.O.Box 35124 Dar es Salaam
UDSM P.O. Box 35091 (Genera!) Dar es Salaam
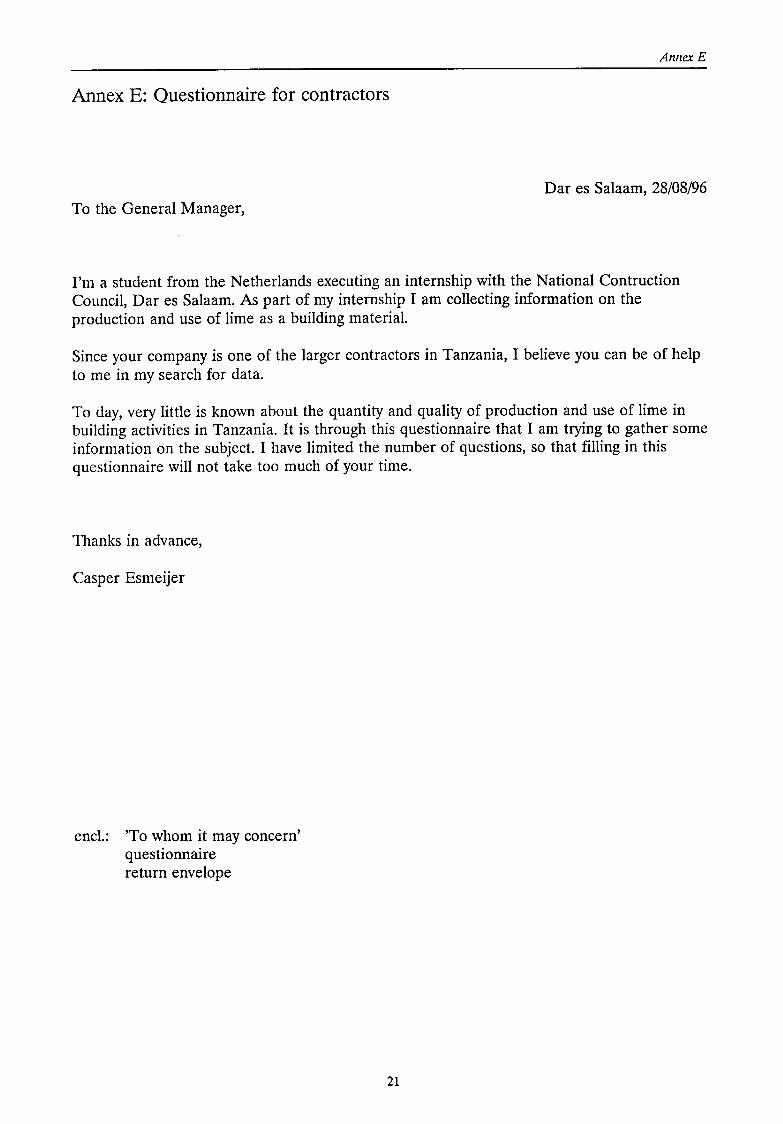
AnnexE
Annex E: Questionnaire for contractors
Dar es Salaam, 28/08/96 Ta the General Manager,
I'm a student from the Netherlands executing an intemship with the National Cantmetion Council, Dar es Salaam. As part of my intemship I am collecting information on the production and use of lime as a building materiaL
Since your company is one of the larger contractors in Tanzania, I believe you can be of help to me in my search for data.
Ta day, very little is known about the quantity and quality of production and use of lime in building activities in Tanzania. lt is through this questionnaire that I am trying to gather some information on the subject. I have limited the number of questions, sa that filling in this questionnaire will nat take toa much of your time.
Thanks in advance,
Casper Esmeijer
end.: 'Ta whom it may concern' questionnaire return envelope
21
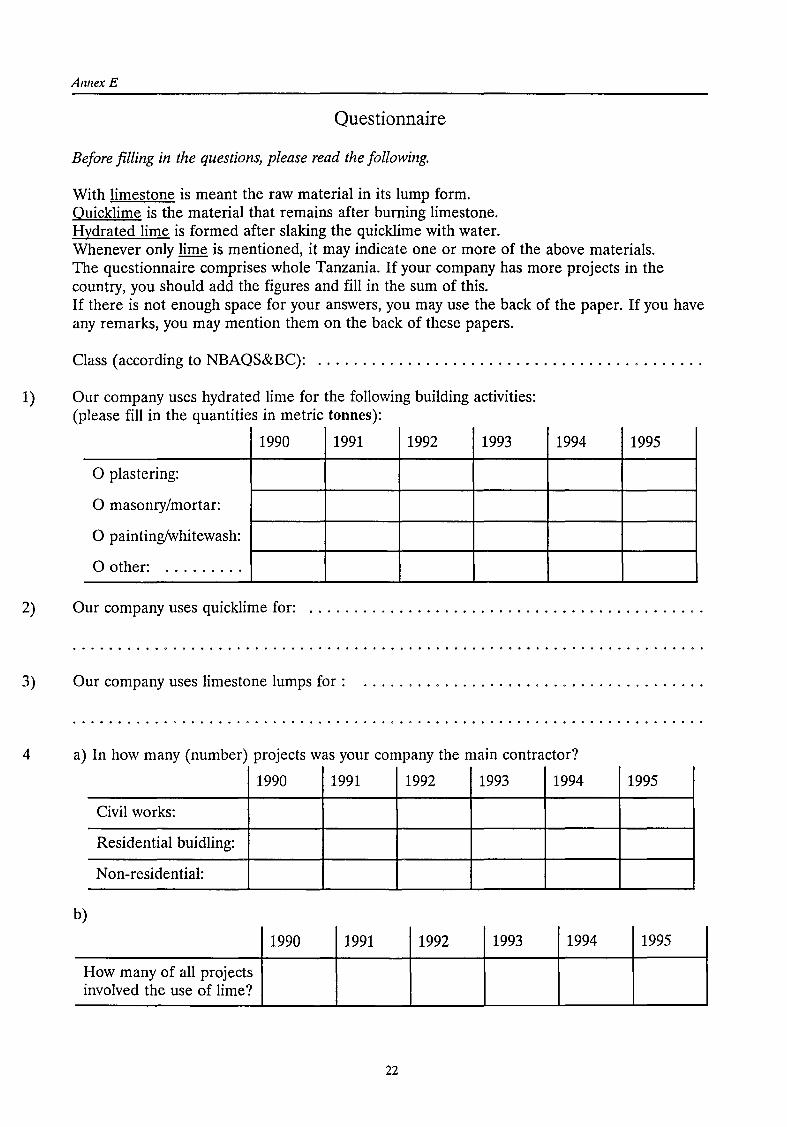
AnnexE
Questionnaire
Befare filling in the questions, please read the following.
With limestone is meant the raw material in its lump form. Quicklime is the material that remains after burning limestone. Hydrated Iime is formed after slaking the quicklime with water. Whenever only lime is mentioned, it may indicate one or more of the above materials. The questionnaire camprises whole Tanzania. If your company has more projects in the country, you should add the figures and fill in the sum of this. If there is not enough space for your answers, you may use the back of the paper. If you have any remarks, you may mention them on the back of these papers.
Class ( according to NBAQS&BC): .......................................... .
1) Our company uses hydrated lime for the following building activities: (please fill in the quantities in metric tonnes):
1990 1991 1992 1993 1994 1995
0 plastering:
0 masonry/mortar:
0 painting/whitewash:
0 other: .........
2) Our company uses quicklime for: ........................................... .
3) Our company uses limestone lumps for :
4 a) In how many (number) projects was your company the main contractor?
1990 1991 1992 1993 1994 1995
Civil works:
Residential buidling:
Non-residential:
b)
1990 1991 1992 1993 1994 1995
How many of all projects involved the use of Iime?
22
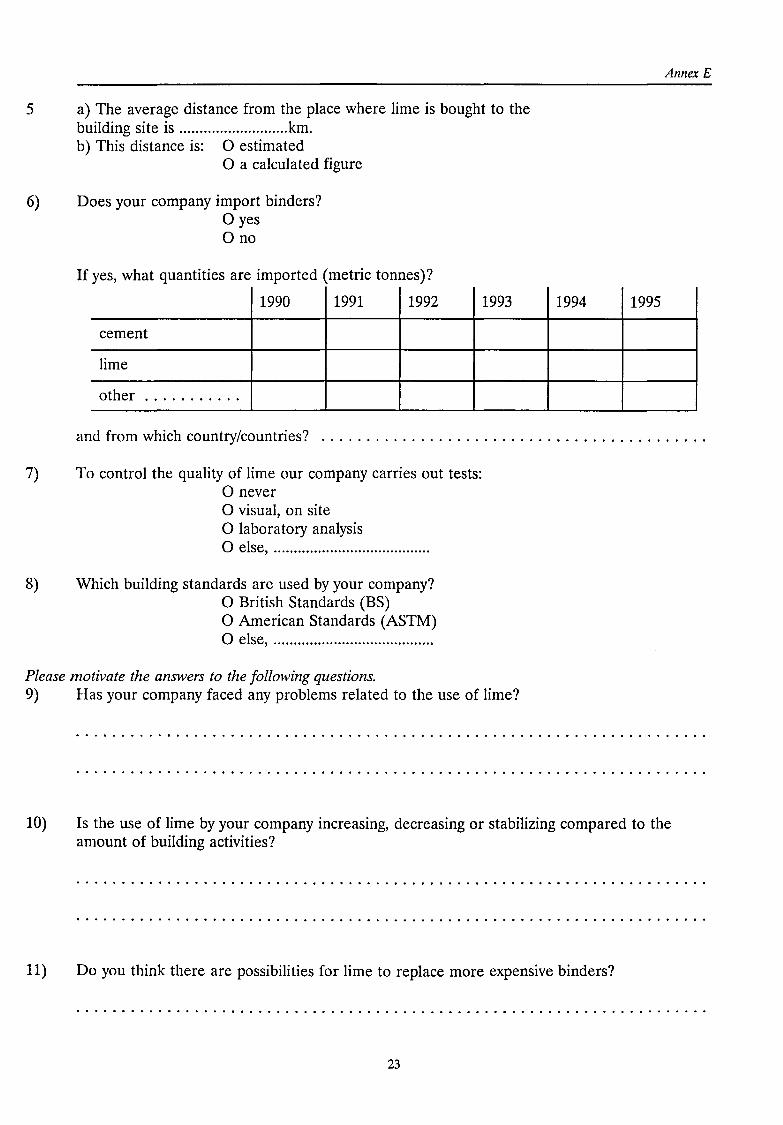
AnnexE
5 a) The average di stance from the place where lime is bought to the building site is ........................... km. b) This distance is: 0 estimated
0 a calculated figure
6) Does your company import binders? 0 yes 0 no
lf yes, what quantities are imported (metric tonnes)?
1990 1991 1992 1993 1994 1995
cement
lime
other ...........
and from which country/countries? .......................................... .
7) To control the quality of lime our company carries out tests: 0 never 0 visual, on site 0 Iabaratory analysis 0 else, ...................................... .
8) Which building standards are used by your company? 0 British Standards (BS) 0 American Standards (ASTM) 0 else, ....................................... .
Please motivate the answers to the following questions. 9) Has your company faced any problems related totheuse of lime?
10) Is the use of lime by your company increasing, decreasing or stahilizing compared to the amount of building activities?
11) Do you think there are possibilities for lime to replace more expensive binders?
......................................................................
23

AnnexE
......................................................................
. . . . . . . . . . . . . . . . . . . . . . . . . . . . . . . . . . . . . . . . . . . . . . . . . . . . . . . . . . . . . . . . . . . . . .
. . . . . . . . . . . . . . . . . . . . . . . . . . . . . . . . . . . . . . . . . . . . . . . . . . . . . . . . . . . . . . . . . . . . . .
. . . . . . . . . . . . . . . . . . . . . . . . . . . . . . . . . . . . . . . . . . . . . . . . . . . . . . . . . . . . . . . . . . . . . .
12) Please mention the narnes and locations of lime suppliers (or producers). name (road) district regton formal/informal?
........... 0 •••••••••••••••••••••••••• 0 ••••••• 0 ••••••••••••••• 0 ••••••••
0 ••••••••• 0 •••• 0 ••••••••••••••••••••••••••• 0 •••••••••••• "." •••••••••••
13) lf you know any narnes and locations of limestonequarries, please mention them here. name district regton remarks
•••••• 0 •••••• 0 0 •• " ................. 0 •••••••••••••••••••••••••••••••••••
• • • • • • 0 ••••• 0 ". 0 ........................................... 0 •••••••••••
14) If you are interested in the outcome of this questionnaire, you can mention this here: 0 Yes, I am interested. Send me a summary of the results to the following
address: ....................................................... .
0 No, I am not interested.
I kindly ask you to fill in and send back this questionnaire as soon as possible, using the return envelope.
24
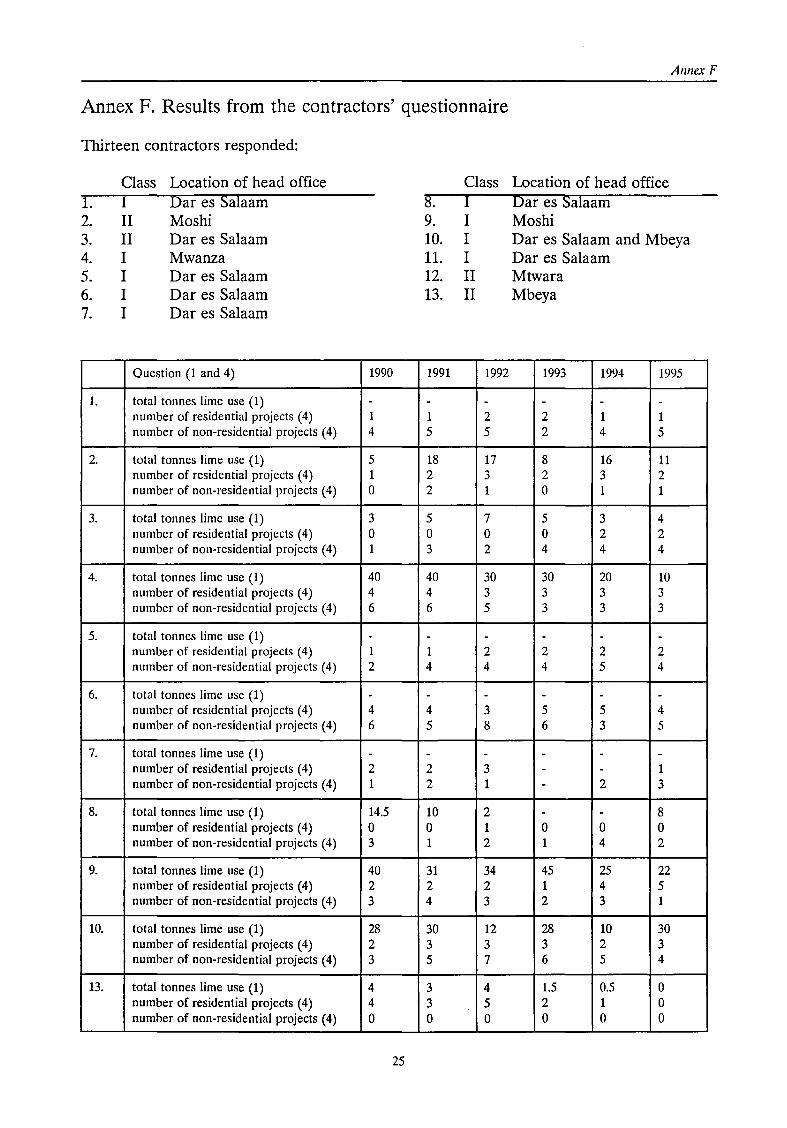
Annex F
Annex F. Results from the contractors' questionnaire
Thirteen contractors responded:
Class Location of head office Class Location of head office 1. I Dar es Salaam 8. I Dar es Salaam 2. II Moshi 9. I Moshi 3. II Dar es Salaam 10. I Dar es Salaam and Mbeya 4. I Mwanza 11. I Dar es Salaam 5. I Dar es Salaam 12. II Mtwara 6. I Dar es Salaam 13. II Mbeya 7. I Dar es Salaam
Question (1 and 4) 1990 1991 1992 1993 1994 1995
1. total tonnes lime use (1) - - - - - -number of residential projects (4) 1 1 2 2 1 1 number of non-residential projects (4) 4 5 5 2 4 5
2. total tonnes lime use (1) 5 18 17 8 16 11 number of residential projects (4) 1 2 3 2 3 2 number of non-residential projects (4) 0 2 1 0 1 1
3. total tonnes lime use (1) 3 5 7 5 3 4 number of residential projects (4) 0 0 0 0 2 2 number of non-residential projects (4) 1 3 2 4 4 4
4. total tonnes lime use (1) 40 40 30 30 20 10 number of residential projects (4) 4 4 3 3 3 3 number of non-residential projects (4) 6 6 5 3 3 3
5. total tonnes lime use (1) - - - - - -number of residential projects (4) 1 1 2 2 2 2 number of non-residential projects (4) 2 4 4 4 5 4
6. total tonnes lime use (1) - - - - - -number of residential projects (4) 4 4 3 5 5 4 number of non-residential projects (4) 6 5 8 6 3 5
7. total tonnes lime use (1) - - - - - -number of residential projects (4) 2 2 3 - - 1 number of non-residential projects (4) 1 2 1 - 2 3
8. total tonnes lime use (1) 14.5 10 2 - - 8 number of residential projects (4) 0 0 1 0 0 0 number of non-residential projects (4) 3 1 2 1 4 2
9. total tonnes lime use (1) 40 31 34 45 25 22 number of residential projects (4) 2 2 2 1 4 5 number of non-residential projects (4) 3 4 3 2 3 1
10. total tonnes lime use (1) 28 30 12 28 10 30 number of residential projects (4) 2 3 3 3 2 3 number of non-residential projects (4) 3 5 7 6 5 4
13. total tonnes lime use (1) 4 3 4 1.5 0.5 0 number of residential projects (4) 4 3 5 2 1 0 number of non-residential projects (4) 0 0 0 0 0 0
25

Annex F
Question 2 and 3: Our company uses lime for: 1. wall finishing (limestone lumps) 2. n/a 3. plastering final coat, whitewash 4. n/a 5. n/a 6. plastering and whitewash 7. for internat plastering walls and ceilings, no use of limestone 8. plastering and painting/whitewash 9. pothole filling and road/field stabilisation 10. plastering, limestone for cladding/facing layer 11. none, corallimestone for aggregates and road base material 12. painting, whitewash, plastering, mortar 13. plastering when mixed with cement gives a good finish for painting
Question 5: Average distance lime-building site ( e=estimated, c=calculated) 1. e 3-500 · 2. e 50 3. e 200 4. e 1500 5. e 4, 15, 45 6. e 6 7. e 10 8. e 10 9. e 500 10. e 40 11. e n/a 12. e 40 13. c 15 Average 102.7 km (excl. 1500 km)
Question 7 and 8: Type of quality control and standards: v=visual, l=laboratory, n=not/never
1. v, I BS, EEC 2. V BS 3. n BS 4. V BS 5. V BS 6. V BS 7. V BS 8. V, I BS 9. v, I BS, ASTM, local 10. V BS 11. I BS 12. V BS 13. V BS
Question 9: Has your company faced any problems related totheuse of lime? 1. availability 2. no
26

Annex F
3. no 4. no 5. no 6. no 7. never 8. different qualities from one souree to another. Once one use from certain souree has to
maintain even if there is a shortage in supply. 9. a) if lime is not well screened you won't get a niceplastering surface
b) if binder in limestone gravel is not above 33% it won't compact well 10. a) to obtain the required quantities at the same time
b) quality problems due to poor methods of production 11. n/a 12. no 13. lot of impurities contaminate the lime as it is manufactured by people locally and on top
of that, storage is not properly done
Question 10: Is the use of lime by your company increasing, decreasing or stabilising? 1. increasing 2. increasing 3. increasing, due to having numbers of projects in hand. The quantity of limestone can be
increasedif we can have some things sticky material available in the market so that when samebody toucht the material it should not rub by hands. In India, normally poor people use limewash to the walls after putting some other materiallike glue. If we can do some advertisement in Tanzania, we can have more shortage of lime in the market
4. stahilizing 5. increasing, depending on recommendation of architects 6. stabilising 7. decreasing as building activities are on decline 8. proportional 9. a country like Tanzania, people do not use much lime as cement, because most of the
big constructions are made out of cement concrete blocks. But I hope by road construction and buildings and burnt bricks lime will now be on the leader of competition
10. decreasing, we use lime for plastering and mortar masonry for only on old buildings. For all new buildings we constructed lime was used for only plastering
11. decreasing, due to the quality of paint available where direct decaration on trawelled cement-sand plaster is possible.
12. for us it depends on the projects, but local people are on increase for use of lime as cement is very costly especially in the southern region they send from mtwara till up to Songea and further.
13. decreasing as there is a shortage of building activities
Question 11: Do you think there are possibilities for lime to replace more expensive binders? 1. yes 2. we don't know 3. yes 4. n/a 5. yes, as it is locally available 6. there might be, but deliberate drive for this is not made 7. no experience on binders
27
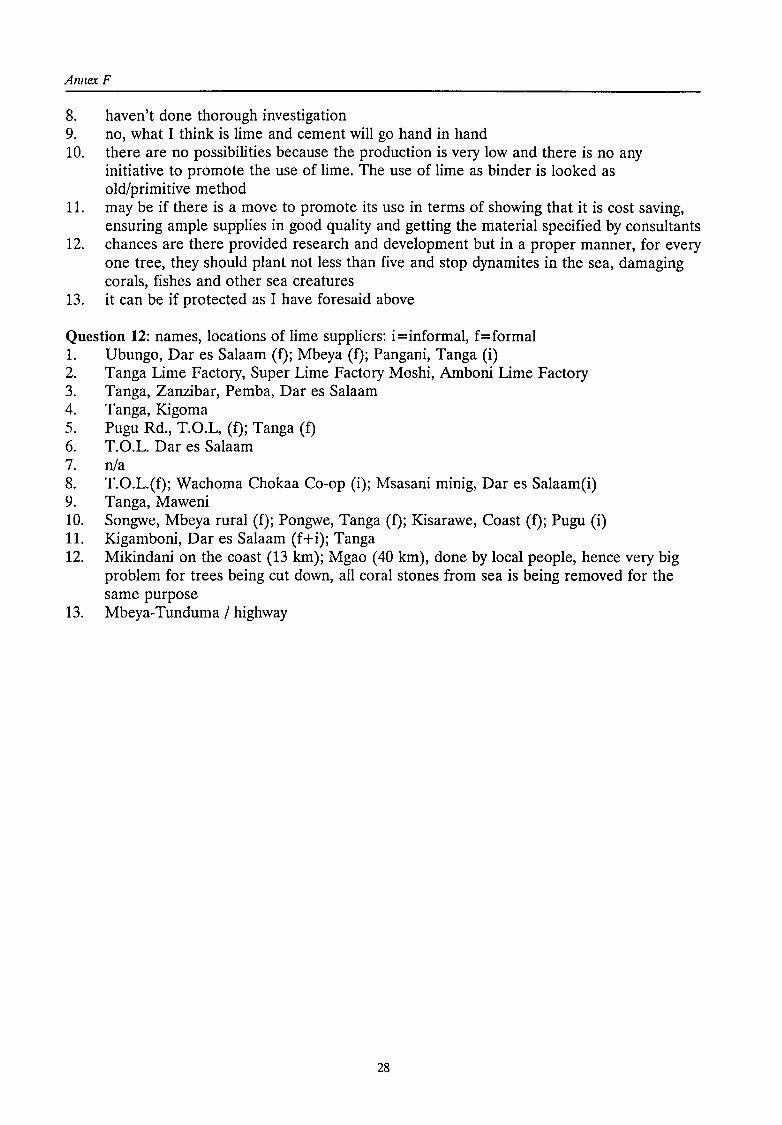
Annex F
8. haven't done thorough investigation 9. no, what I think is lime and cement will go hand in hand 10. there are no possibilities because the production is very low and there is no any
initiative to promate the use of lime. The use of lime as binder is looked as old/primitive methad
11. may be if there is a move to promate its use in terms of showing that it is cast saving, ensuring ample supplies in goed quality and getting the material specified by consultants
12. chances are there provided research and development but in a proper manner, for every one tree, they should plant nat less than five and stop dynamites in the sea, darnaging corals, fishes and ether sea creatures
13. it can be if protected as I have foresaid above
Question 12: names, locations of lime suppliers: i=informal, f=formal 1. Ubungo, Dar es Salaam (f); Mbeya (f); Pangani, Tanga (i) 2. Tanga Lime Factory, Super Lime Factory Moshi, Amboni Lime Factory 3. Tanga, Zanzibar, Pemba, Dar es Salaam 4. Tanga, K.igoma 5. Pugu Rd., T.O.L, (f); Tanga (f) 6. T.O.L. Dar es Salaam 7. n/a 8. T.O.L.(f); Wachoma Chokaa Co-op (i); Msasani minig, Dar es Salaam(i) 9. Tanga, Maweni 10. Songwe, Mbeya rural (f); Pongwe, Tanga (f); K.isarawe, Coast (f); Pugu (i) 11. K.igamboni, Dar es Salaam (f+i); Tanga 12. Mikiudani on the coast (13 km); Mgao ( 40 km), done by local people, hence very big
problem for trees being cut down, all coral stanes from sea is being removed for the same purpose
13. Mbeya-Tunduma I highway
28
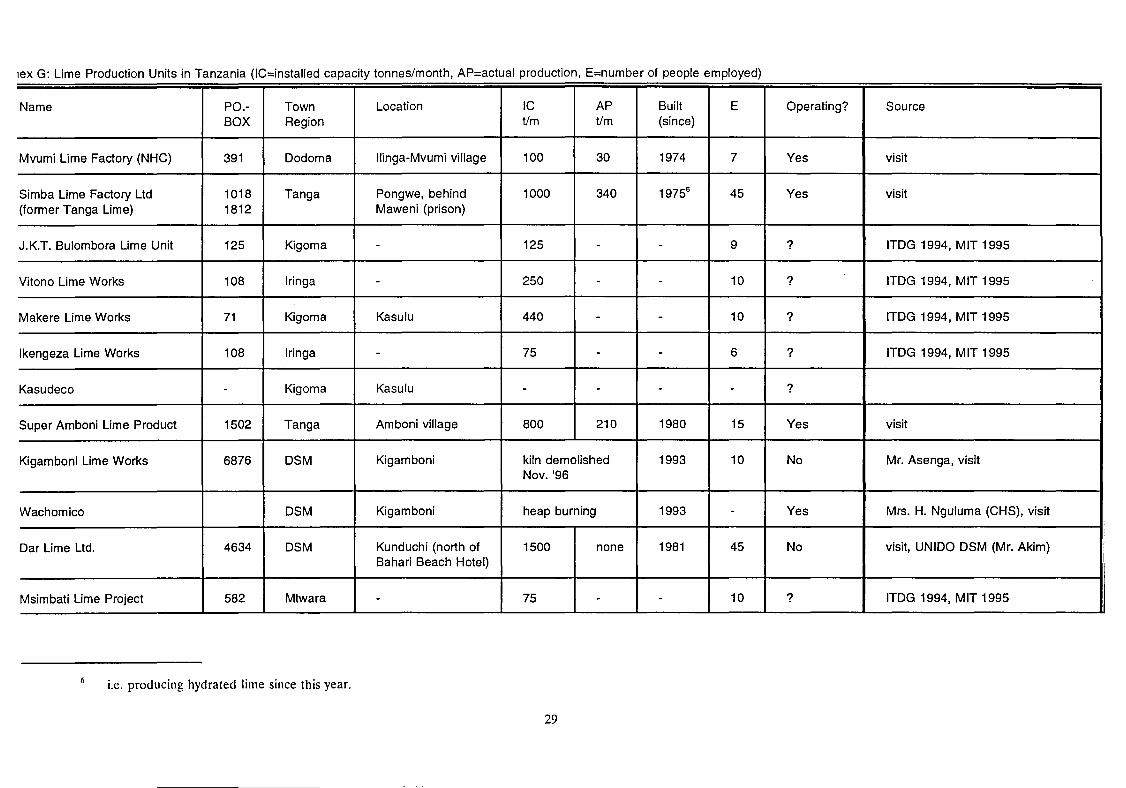
1ex G: Lime Production Units in Tanzania (IC=installed capacity tonnes/month, AP=actual production, E=number of people employed)
Name PO.- Town Location IC AP Built E Operating? Souree BOX Region Vm Vm (si nee)
Mvumi Lime Factory (NHC) 391 Dodoma llinga-Mvumi village 100 30 1974 7 Yes visit
Simba Lime Factory Ltd 1018 Tanga Pongwe, behind 1000 340 19756 45 Yes visit (fermer Tanga Lime) 1812 Maweni (prison)
J.K.T. Bulombora Lime Unit 125 Kigoma - 125 - - 9 ? ITDG 1994, MIT 1995
Vitono Lime Works 108 lringa - 250 - - 10 ? ITDG 1994, MIT 1995
Makere Lime Works 71 Kigoma Kasulu 440 - - 10 ? ITDG 1994, MIT 1995
lkengeza Lime Works 108 lringa - 75 - - 6 ? ITDG 1994, MIT 1995
Kasudeco - Kigoma Kasulu - - - - ?
Super Amboni Lime Product 1502 Tanga Amboni village 800 210 1980 15 Yes visit
Kigamboni Lime Works 6876 DSM Kigamboni kiln demolishad 1993 10 No Mr. Asenga, visit Nov. '96
Wachomico DSM Kigamboni heap burning 1993 - Yes Mrs. H. Nguluma (CHS), visit
Dar Lime Ltd. 4634 DSM Kunduchi (north of 1500 none 1981 45 No visit, UNIDO DSM (Mr. Akim) Bahari Beach Hotel)
Msimbati Lime Project 582 Mtwara - 75 - - 10 ? ITDG 1994, MIT 1995
i.e. producing hydrated lime since this year.
29
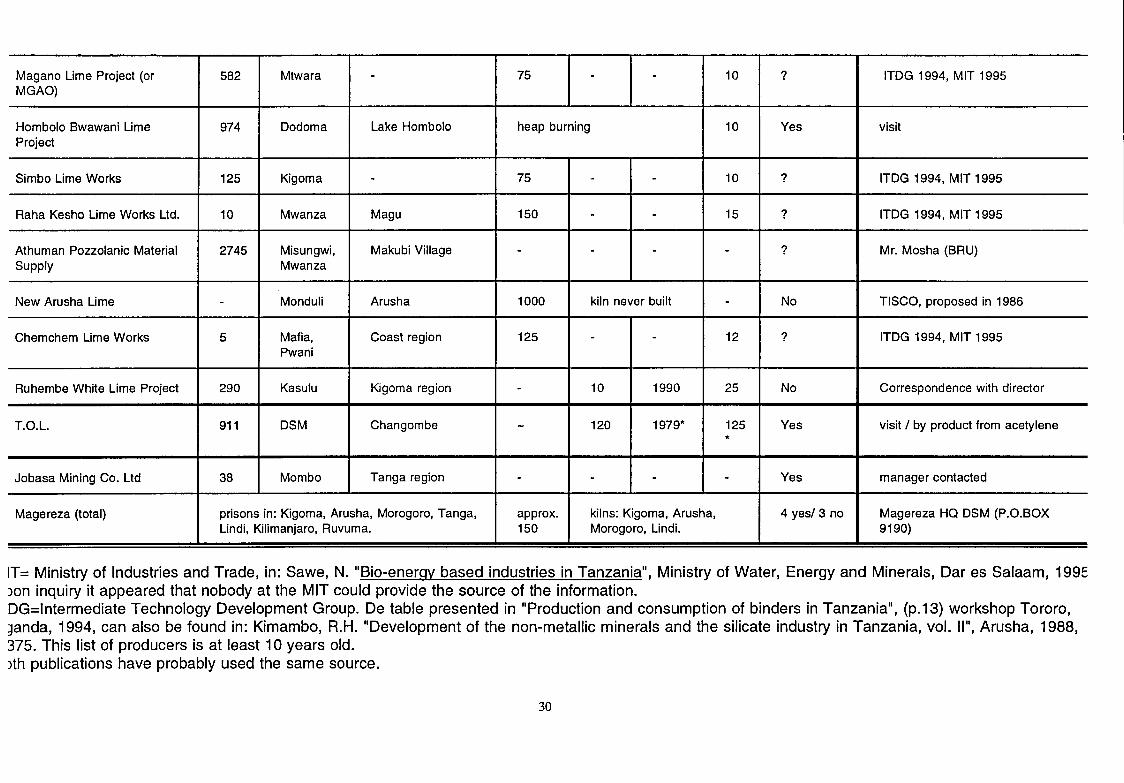
Magano Lime Project (or 582 Mtwara - 75 - - 10 ? ITDG 1994, MIT 1995 MGAO)
Hombola Bwawani Lime 974 Dodoma Lake Hombola heap burning 10 Yes visit Project
Simbo Lime Works 125 Kigoma - 75 - - 10 ? ITDG 1994, MIT 1995
Raha Kesho Lime Works Ltd. 10 Mwanza Mag u 150 - - 15 ? ITDG 1994, MIT 1995
Athuman Pozzolanic Material 2745 Misungwi, Makubi Village - - - - ? Mr. Mosha (BRU) Supply Mwanza
New Arusha Lime - Monduli Arusha 1000 kiln never built - No TISCO, proposed in 1986
Chemchem Lime Works 5 Mafia, Coast region 125 - - 12 ? ITDG 1994, MIT 1995 Pwani
Ruhembe White Lime Project 290 Kasulu Kigoma region - 10 1990 25 No Correspondence with directer
T.O.L. 911 DSM Changombe - 120 1979* 125 Yes visit I by product from acetylene *
Jobasa Mining Co. Ltd 38 Mombo Tanga region - - - - Yes manager contacted
Magereza (total) prisons in: Kigoma, Arusha, Morogoro, Tanga, approx. kilns: Kigoma, Arusha, 4 yes/3 no Magereza HQ DSM (P.O.BOX Lindi, Kilimanjaro, Ruvuma. 150 Morogoro, Lindi. 9190)
IT = Mi nistry of Industries and Tra de, in: Sa we, N. "Bio-energy based industries in Tanzania", Mi nistry of Water, Energy and Minerals, Dar es Salaam, 1995 Jon inquiry it appeared that nobody at the MIT could provide the souree of the information. DG=Intermediate Technology Development Group. De table presented in "Production and consumption of binders in Tanzania", (p.13) workshop Tororo, Janda, 1994, can also be found in: Kimambo, R.H. "Development of the non-metallic minerals and the silicate industry in Tanzania, vol. 11", Arusha, 1988, 375. This list of producers is at least 1 0 years old. )th publications have probably used the same source.
30
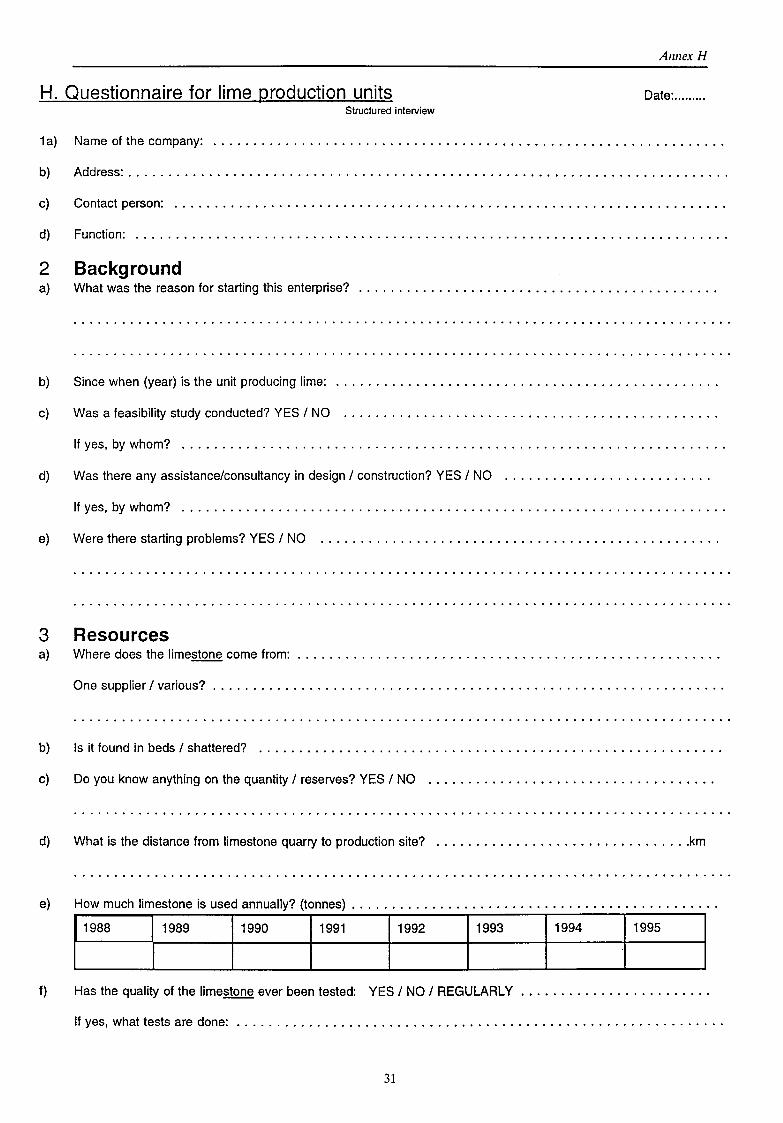
Annex H
H. Questionnaire for lime production units Date: ....... .. Structured interview
1 a) Name of the company:
b) Address: .......................................................................... .
c) Contact person: .................................................................... .
d) Function: ......................................................................... .
2 a)
Background What was the reason tor starting this enterprise?
b) Since when (year) is the unit producing lime: ............................................... .
c) Was a feasibility study conducted? YES I NO .............................................. .
lf yes, by whom? ................................................................... .
d) Was there any assistancelconsultancy in design I construction? YES I NO ......................... .
lf yes, by whom? ................................................................... .
e) Were there starting problems? YES I NO ................................................. .
3 Resources a) Where does the limestone come trom:
One supplier I various? ............................................................... .
b) Is it found in beds I shattered? ......................................................... .
c) Do you know anything on the quantity I reserves? YES I NO ................................... .
d) What is the distance trom limestone quarry to production site? ................................ km
e) How much limestone is used annually? (tonnes) ..............................................
11988 11989
I 11990 11991 11992 11993 11994 11995
f) Has the quality of the limestone ever been tested: YES I NO I REGULARL Y ........................
lf yes, what tests are done: ............................................................ .
31
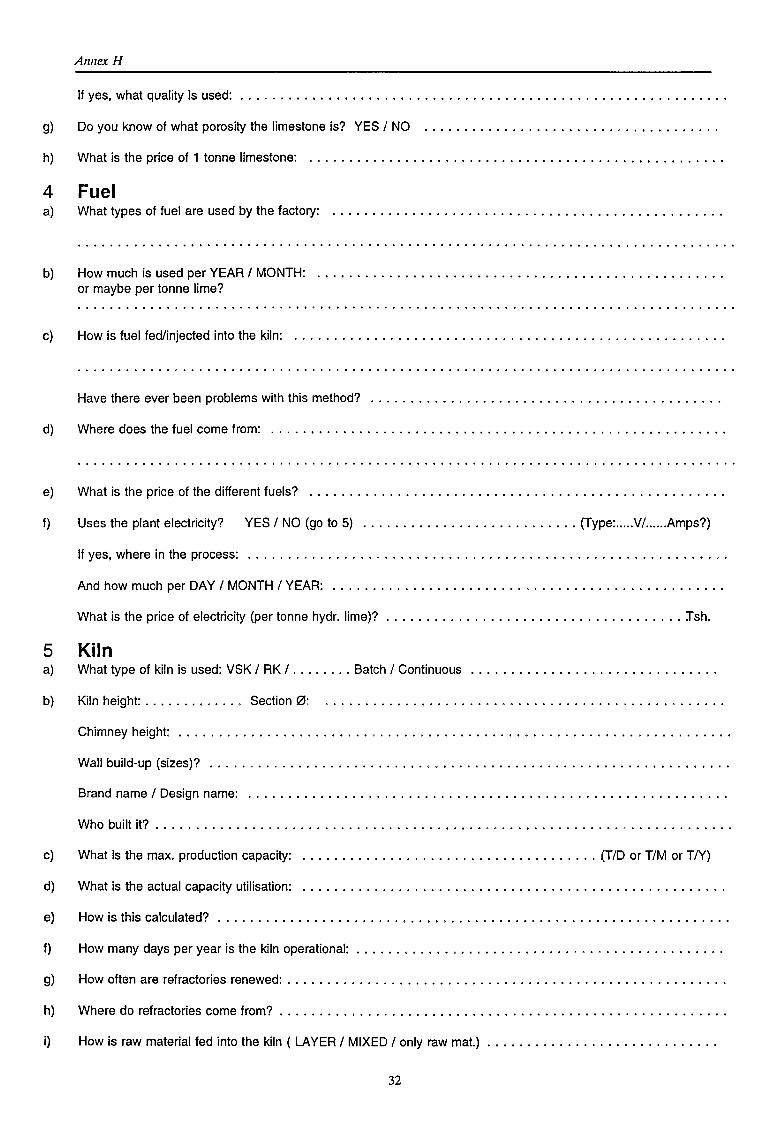
Annex H
lf yes, what quality is used:
g) Do you know of what porosity the limestone is? YES I NO .................................... .
h) What is the price of 1 tonne limestone:
4 Fuel a) What types of fuel are used by the factory:
b) How much is used per YEAR I MONTH: .................................................. . or maybe per tonne lime?
c) How is fuel fed/injected into the kiln: ..................................................... .
Have there ever been problems with this method? ........................................... .
d) Where does the fuel come trom: ........................................................ .
e) What is the price of the different fuels? ................................................... .
f) Uses the plant electricity? YES I NO (go to 5) ........................... (Type: ..... VI ...... Amps?)
lf yes, where in the process: ........................................................... .
And how much per DAY I MONTH I YEAR: ................................................ .
What is the price of electricity (per tonne hydr. lime)? ..................................... :rsh.
5 Kiln a) What type of kiln is used: VSK I RK I ........ Batch I Continuous
b) Kiln height: . . . . . . . . . . . . . Sectien 0:
Chimney height: .................................................................... .
Wall build-up (sizes)? ................................................................ .
Brand name I Design name: ........................................................... .
Who built it? ....................................................................... .
c) What is the max. production capacity: ..................................... (TID or TIM or T/Y)
d) What is the actual capacity utilisation:
e) How is this calculated? ............................................................... .
f) How many days per year is the kiln operational: ............................................. .
g) How aften are refractories renewed: ...................................................... .
h) Where do refractories come trom? ....................................................... .
i) How is raw material fed into the kiln ( LAYER I MIXED I only raw mat.)
32
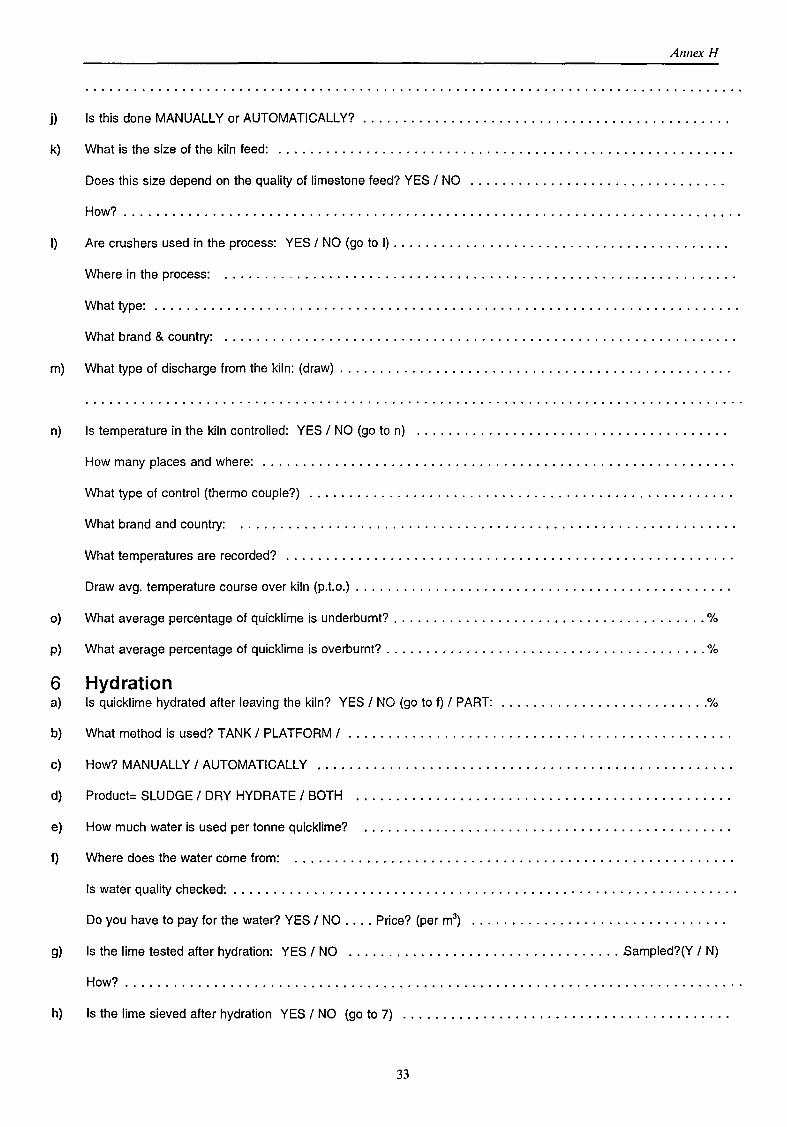
Annex H
j) Is this done MANUALL Y or AUTOMATICALLY? ............................................. .
k) What is the size of the kiln feed: ........................................................ .
Does this size depend on the quality of limestone feed? YES I NO ............................... .
How? ............................................................................ .
I) Are crushers used in the process: YES I NO (go to I) ......................................... .
Where in the process: ............................................................... .
What type: ............................................................. · ......... · ·
What brand & country: ............................................................... .
m) What type of discharge trom the kiln: (draw) ................................................ .
n) Is temperature in the kiln controlled: YES I NO (go to n) ...................................... .
How many places and where: .......................................................... .
What type of control (thermo couple?) .................................................... .
What brand and country: ............................................................. .
What temperatures are recorded? ....................................................... .
Draw avg. temperature course over kiln (p.t.o.) .............................................. .
o) What average percentage of quicklime is underburnt? ....................................... %
p) What average percentage of quicklime is overburnt? ........................................ %
6 Hydratien a) Is quicklime hydrated after leaving the kiln? YES I NO (go tof) I PART: .......................... %
b) What method is used? TANK I PLATFORM I ............................................... .
c) How? MANUALLY I AUTOMATICALLY ................................................... .
d) Product= SLUDGE I DRY HYDRA TE I BOTH
e) How much water is used per tonne quicklime?
f) Where does the water come trom: ...................................................... .
Is water quality checked: .............................................................. .
Do you have to pay tor the water? YES I NO .... Price? (per m3) ••••••••••••••••••••••••••••••••
g) Is the lime tested after hydration: YES I NO .................................. Sampled?(Y I N)
How? ............................................................................ .
h) Is the lime sieved after hydratien YES I NO (go to 7) ........................................ .
33
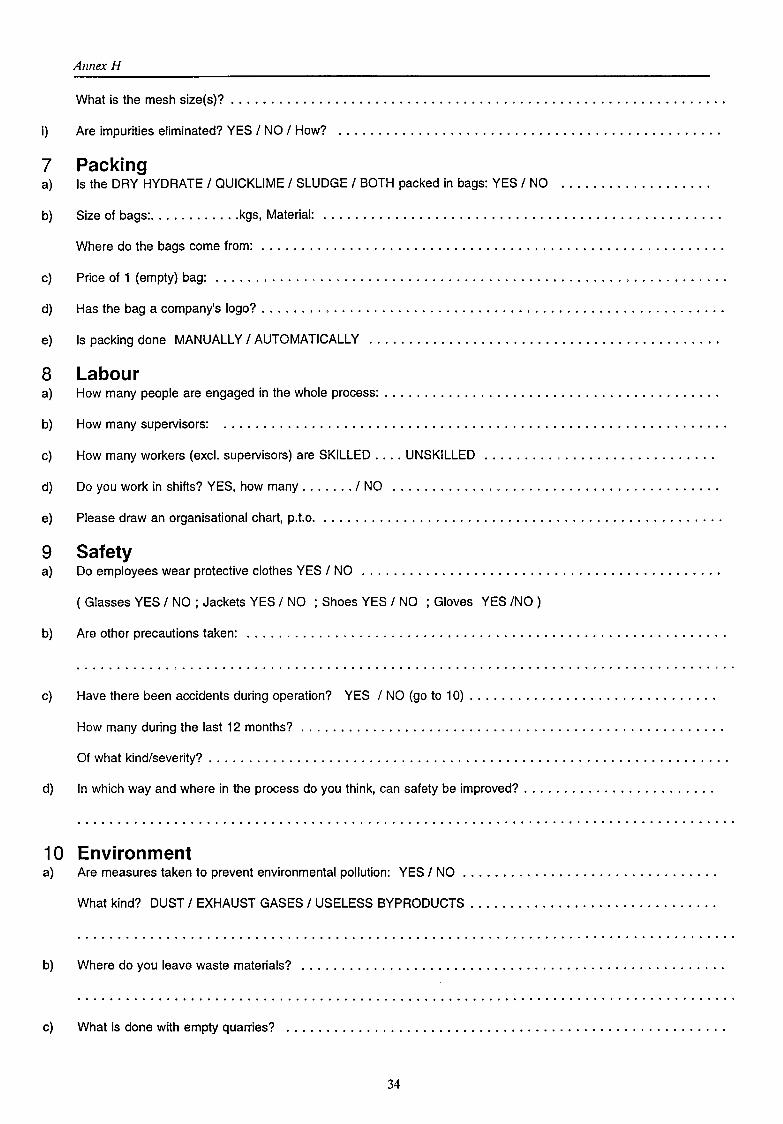
i)
7 a)
Annex H
What is the mesh size(s)? ............................................................. .
Are impurities eliminated? YES I NO I How?
Packing Is the DRY HYDRATE I QUICKLIME I SLUDGE I BOTH packed in bags: YES I NO
b) Size of bags: ............ kgs, Material: ................................................. .
Where do the bags come from: ......................................................... .
c) Price of 1 (empty) bag: ............................................................... .
d) Has the bag a company's logo? ......................................................... .
e) Is packing done MANUALLY I AUTOMATICALL Y ........................................... .
8 Labour a) How many people are engaged in the whole process: ......................................... .
b) How many supervisors: .............................................................. .
c) How many workers (excl. supervisors) are SKILLED .... UNSKILLED ............................ .
d) Do you work in shifts? YES, how many ....... I NO ........................................ .
e)
9 a)
Please drawan organisational chart, p.t.o.
Safety Do employees wear protective clothes YES I NO
( Glasses YES I NO ; Jackets YES I NO ; Shoes YES I NO ; Gloves YES /NO )
b) Are other precautions taken: ........................................................... .
c) Have there been accidents during operation? YES I NO (go to 1 0) .............................. .
How many during the last 12 months? .................................................... .
Of what kind/severity? ................................................................ .
d) In which way and where in the process do you think, can safety be improved? ....................... .
1 0 Environment a) Are measures taken to prevent environmental pollution: YES I NO ............................... .
What kind? DUST I EXHAUST GASES I USELESS BYPRODUCTS .............................. .
b) Where do you leave waste materials? .................................................... .
c) What is done with empty quarries? ...................................................... .
34
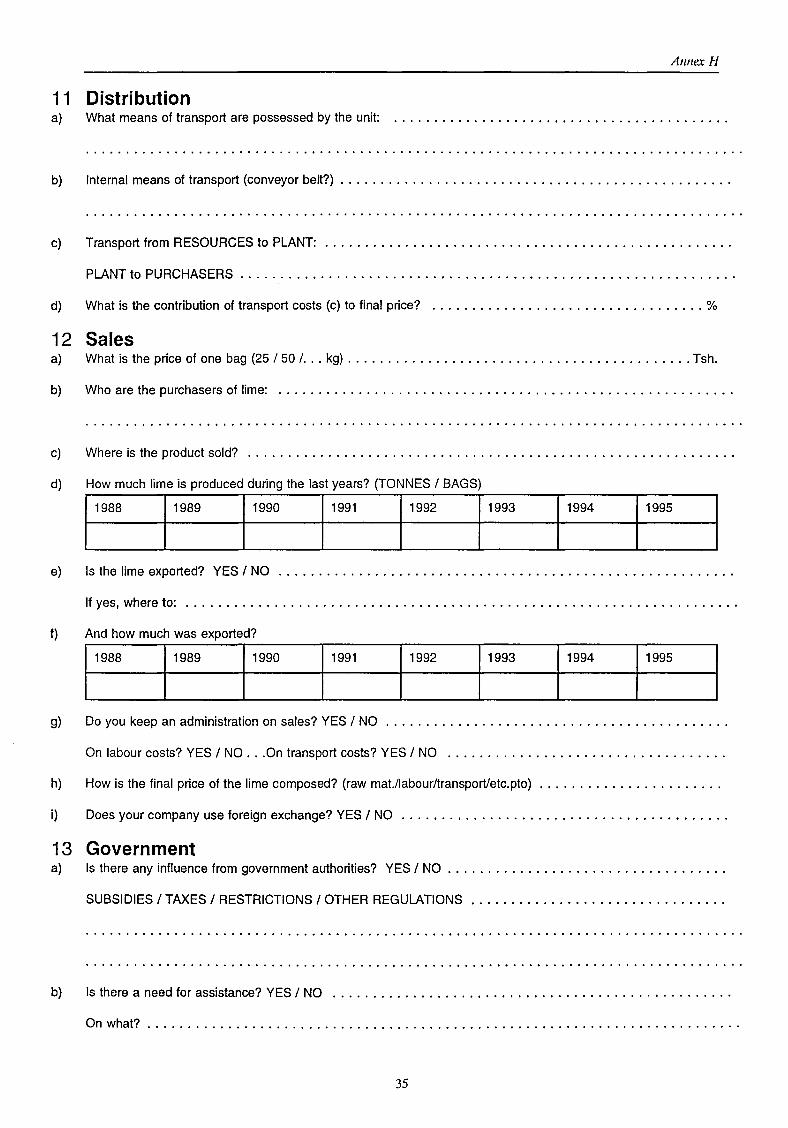
Annex H
11 Distribution a) What means of transport are possessed by the unit:
b) lnternal means of transport (conveyor belt?) ................................................ .
c) Transport trom RESOURCES to PLANT: .................................................. .
PLANT to PURCHASERS ............................................................. .
d) What is the contribution of transport costs (c) to final price? .................................. %
12 Sales a) What is the price of one bag (25 I 50 I . .. kg) ........................................... Tsh.
b) Who are the purchasers of lime: ........................................................ .
c) Where is the product sold? ............................................................ .
d) How much lime is produced during the last years? (TONNES I BAGS)
11988 11989 11990 11991 11992 11993 11994 11995
e) Is the lime exported? YES I NO ........................................................ .
lf yes, where to: .................................................................... .
f) And how much was exported?
11988 11989 11990 11992 11993 11994
g) Do you keep an administration on sales? YES I NO
On Iabour costs? YES I NO ... On transport costs? YES I NO .................................. .
h) How is the final price of the lime composed? (raw mat./labourltransport/etc.pto) ...................... .
i) Does your company use foreign exchange? YES I NO
13 Government a) Is there any influence trom government authorities? YES I NO .................................. .
SUBSIDIES I TAXES I RESTRICTIONS I OTHER REGULATIONS ............................... .
b) Is there a need for assistance? YES I NO ................................................. .
On what? ......................................................................... .
35
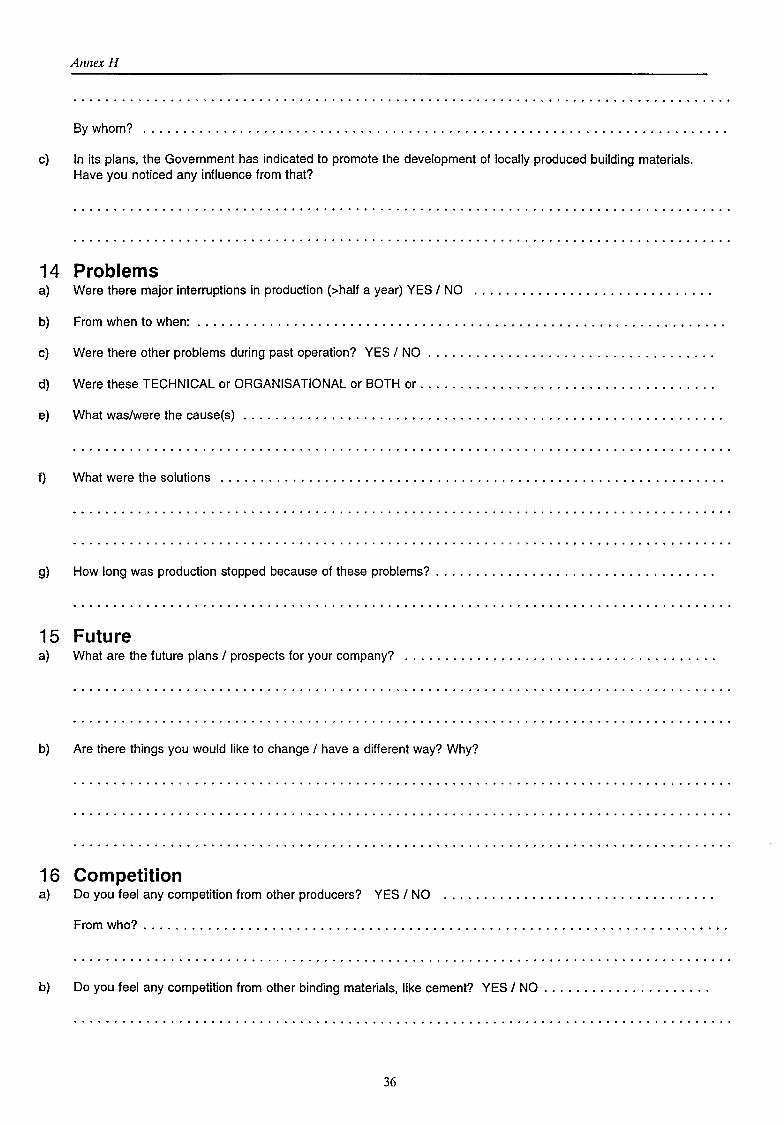
Annex H
By whom? ........................................................................ .
c) In its plans, the Government has indicated to promote the development of Jocally produced building materials. Have you noticed any influence trom that?
14 Problems a) Were there major interruptions in production (>half a year) YES I NO
b) From when to when: ................................................................. .
c) Were there other problems during past operation? YES I NO ................................... .
d) Were these TECHNJCAL or ORGANISATIONAL or BOTHor .................................... .
e) What was/were the cause(s) ........................................................... .
f) What were the solutions .............................................................. .
g) How Jong was production stopped because of these problems? .................................. .
15 Future a) What are the future plans I prospects tor your company?
b) Are there things you would like to change I have a different way? Why?
16 Competition a) Do you teel any competition trom other producers? YES I NO ................................. .
From who? ........................................................................ .
b) Do you teel any competition trom other binding materials, Jike cement? YES I NO .................... .
36

Annex H
17 Miscellaneous a) Do you give advice on how to apply lime? YES I NO ........................................ .
b) Have there ever been experiments to produce new materials: YES I NO .......................... .
What kind of new material: ............................................................ .
Have there been attempts to improve the product: YES I NO .................................. .
Successful: YES I NO ...... What improvements? ......................................... .
c) What do you think is the reasen tor the success of this company? ................................ .
37
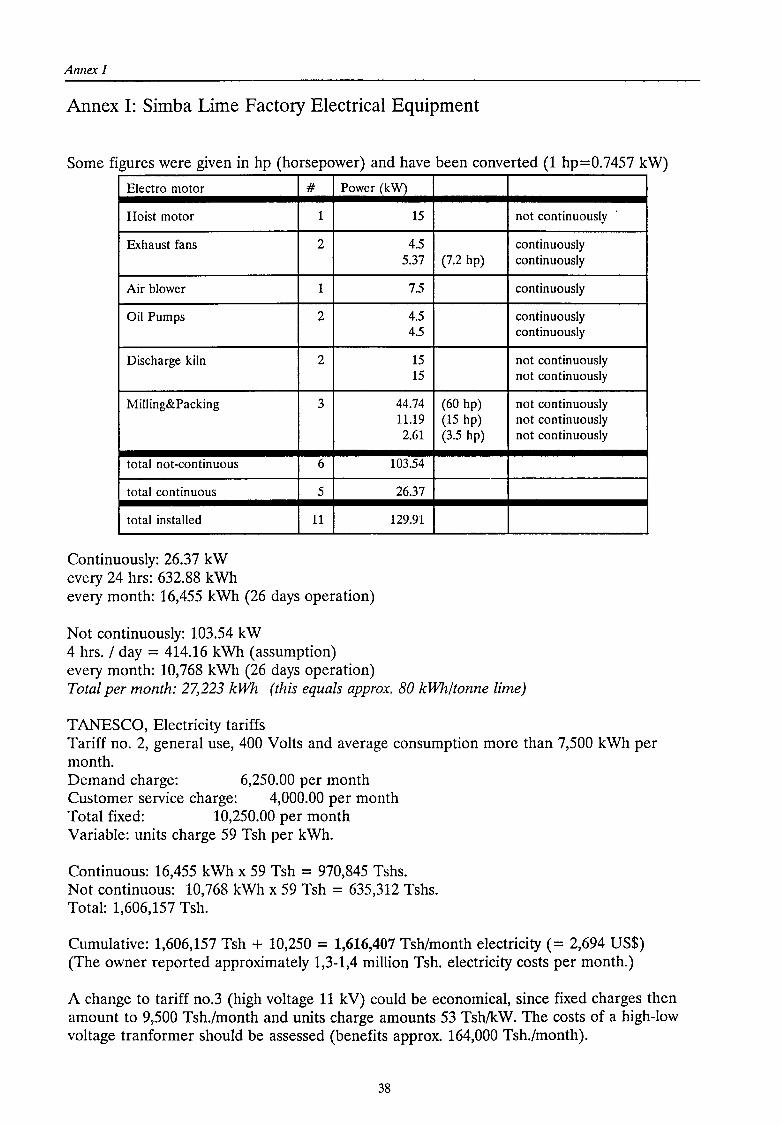
Annex I
Annex 1: Simba Lime Factory Electrical Equipment
Some figures were given in hp (horsepower) and have been converted (1 hp=0.7457 kW)
Electro motor # Power (kW)
Hoist motor
Exhaust fans
Air blower
Oil Pumps
Discharge kiln
Milling&Packing
total not-continuous
total continuous
total installed
Continuously: 26.37 kW every 24 hrs: 632.88 kWh
1
2
1
2
2
3
6
5
11
every month: 16,455 kWh (26 days operation)
Not continuously: 103.54 kW 4 hrs. I day = 414.16 kWh (assumption) every month: 10,768 kWh (26 days operation)
15
4.5 5.37
7.5
4.5 4.5
15 15
44.74 11.19 2.61
103.54
26.37
129.91
not continuously
continuously (7.2 hp) continuously
continuously
continuously continuously
not continuously not continuously
(60 hp) not continuously (15 hp) not continuously (3.5 hp) not continuously
Total per month: 27,223 kWh (this equals approx. 80 kWh/tonne lime)
T ANESCO, Electricity tariffs Tariff no. 2, general use, 400 Volts and average consumption more than 7,500 kWh per month. Demand charge: 6,250.00 per month Customer service charge: 4,000.00 per month Total fixed: 10,250.00 per month Variable: units charge 59 Tsh per kWh.
Continuous: 16,455 kWh x 59 Tsh = 970,845 Tshs. Not continuous: 10,768 kWh x 59 Tsh = 635,312 Tshs. Total: 1,606,157 Tsh.
Cumulative: 1,606,157 Tsh + 10,250 = 1,616,407 Tsh/month electricity ( = 2,694 US$) (The owner reported approximately 1,3-1,4 million Tsh. electricity costs per month.)
A change to tariff no.3 (high voltage 11 kV) could be economical, since fixed charges then amount to 9,500 Tsh./month and units charge amounts 53 Tsh/kW. The costs of a high-low voltage tranformer should be assessed (benefits approx. 164,000 Tsh./month).
38
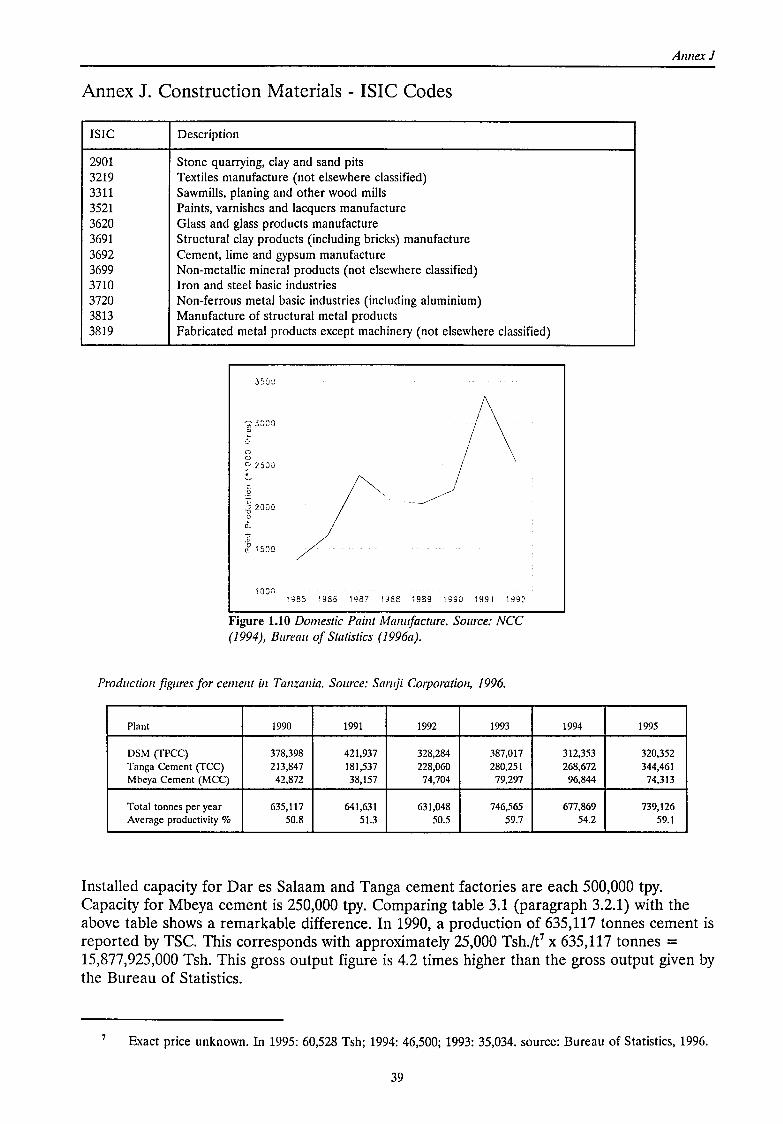
Annex J. Construction Materials- ISIC Codes
rsrc
2901 3219 3311 3521 3620 3691 3692 3699 3710 3720 3813 3819
Description
Stone quarrying, clay and sand pits Textiles manufacture (not elsewhere classified) Sawmills, planing and other wood mills Paints, varnishes and lacquers manufacture Glass and glass products manufacture Structural clay products (including bricks) manufacture Cement, time and gypsum manufacture Non-metallic mineral products (not elsewhere classified) Iron and steel basic industries Non-ferrous metal basic industries (including aluminium) Manufacture of structural metal products Fabricated metal products except machinery (not elsewhere classified)
3SOJ
'? 3:JQJ
" 0 0
::' 2)JD
.2
~ 2000 0
r.t c
;.P 15oo
I OOC• 1985 1986 1987 1988 1989 1990 1991 1992
Figure 1.10 Damestic Paint Manufacture. Source: NCC (1994), Bureau of Stalistics (1996a).
Production figures forcement in Tanzania. Source: Samji Corporation, 1996.
Plant 1990 1991 1992 1993
DSM (fPCC) 378,398 421,937 328,284 387,017 Tanga Cement (fCC) 213,847 181,537 228,060 280,251 Mbeya Cement (MCC) 42,872 38,157 74,704 79,297
Total tonnes per year 635,117 641,631 631,048 746,565 Average productivity % 50.8 51.3 50.5 59.7
Annex J
1994 1995
312,353 320,352 268,672 344,461
96,844 74,313
677,869 739,126 54.2 59.1
Installed capacity for Dar es Salaam and Tanga cement factories are each 500,000 tpy. Capacity for Mbeya cement is 250,000 tpy. Camparing table 3.1 (paragraph 3.2.1) with the above table shows a remarkable difference. In 1990, a production of 635,117 tonnes cement is reported by TSC. This corresponds with approximately 25,000 Tsh./e x 635,117 tonnes = 15,877,925,000 Tsh. This gross output figure is 4.2 times higher than the gross output given by the Bureau of Statistics.
Exact price unknown. In 1995: 60,528 Tsh; 1994: 46,500; 1993: 35,034. source: Bureau of Statistics, 1996.
39

Annex K
Annex K. Illustrations and photographs of lime projects
40

Larger kiln and smaller kiln (Mvumi-llinga, Dodoma) Caterpillar on the background.
Frontleader (Mvumi) Larger kiln (Mwumi)
Kiln wall (Mvumi) The brick lining has deteriorated seriously. Bumt quicklime lumps at the bottorn of the kiln.
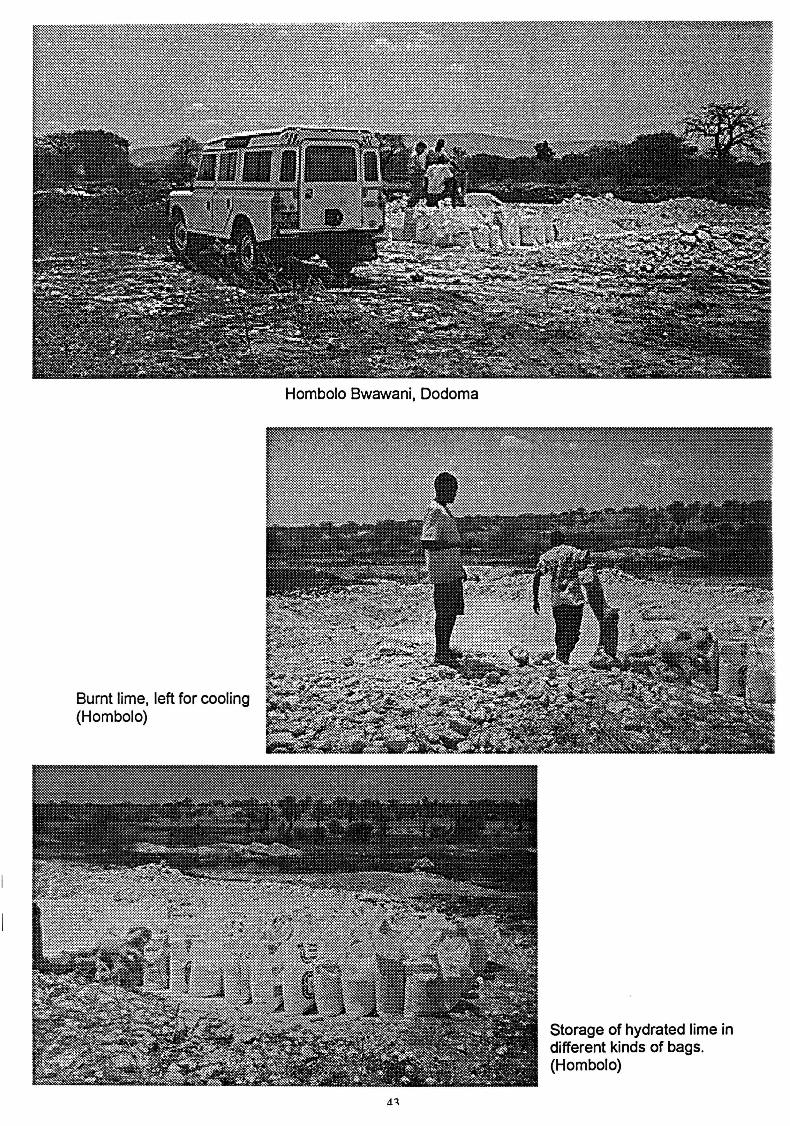
Bumt lime, left for cooling (Hombolo)
Hombola Bwawani, Dodoma
Starage of hydrated lime in different kinds of bags. (Hombolo)
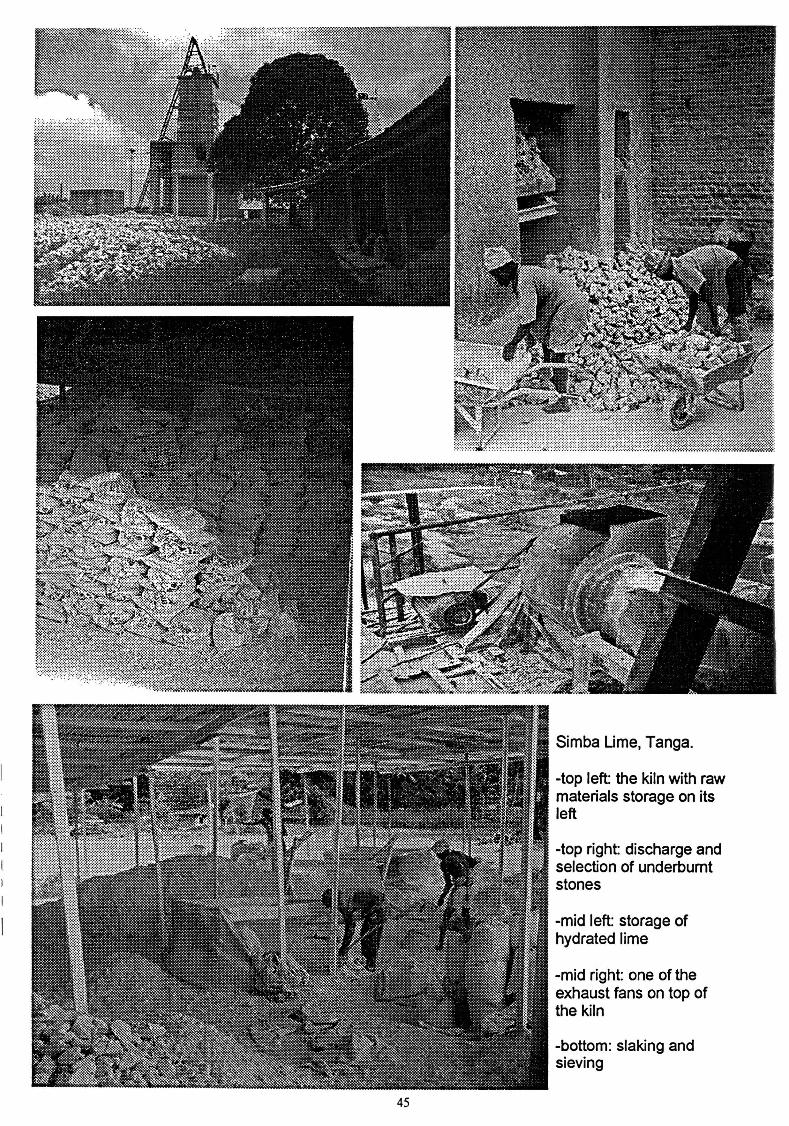
45
Simba Lime, Tanga.
-top left: the kiln with raw matenals starage on its Ie ft
-top right discharge and selection of underbumt stanes
-mid left: starage of hydrated lime
-mid right: one of the exhaust fans on top of the kiln
-bottom: slaking and sieving
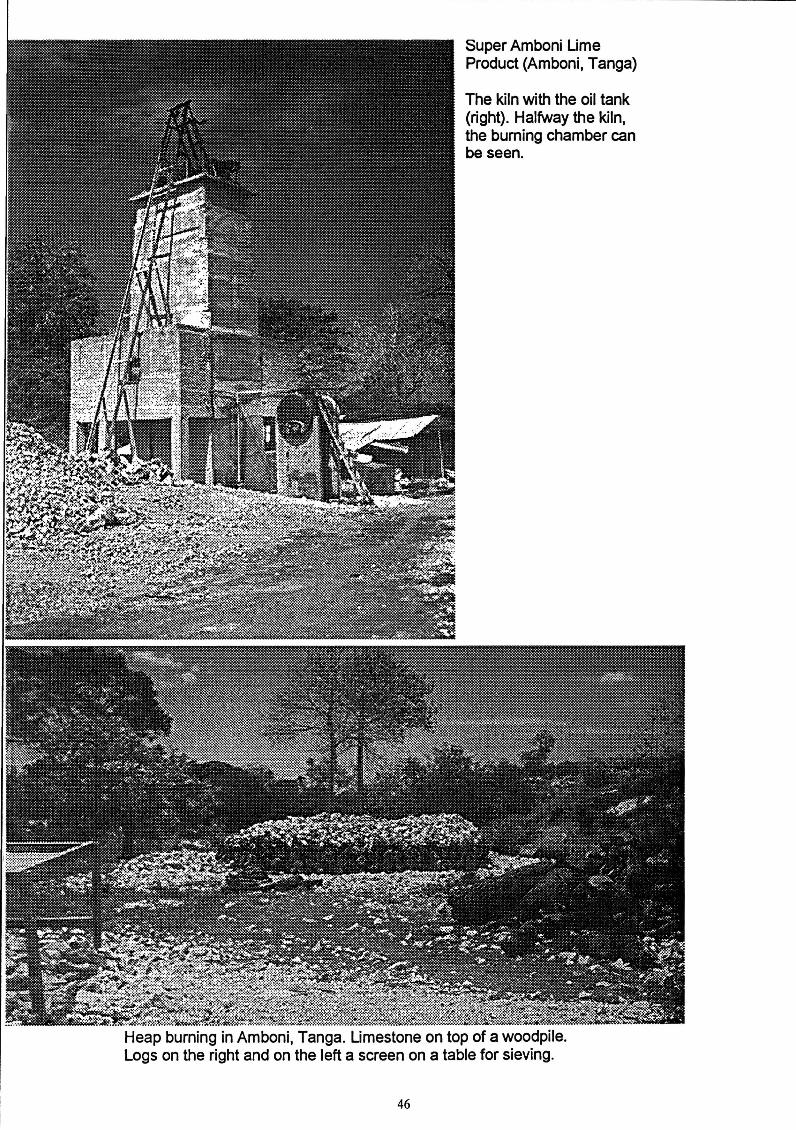
Super Arnboni Urne Product (Arnboni, Tanga)
The kiln with the oil tank (right). Halfway the kiln, the buming charnber can be seen.
Heap buming in Arnboni, Tanga. Urnestene on top of a woodpile. Logs on the right and on the left a screen on a table for sieving.
46
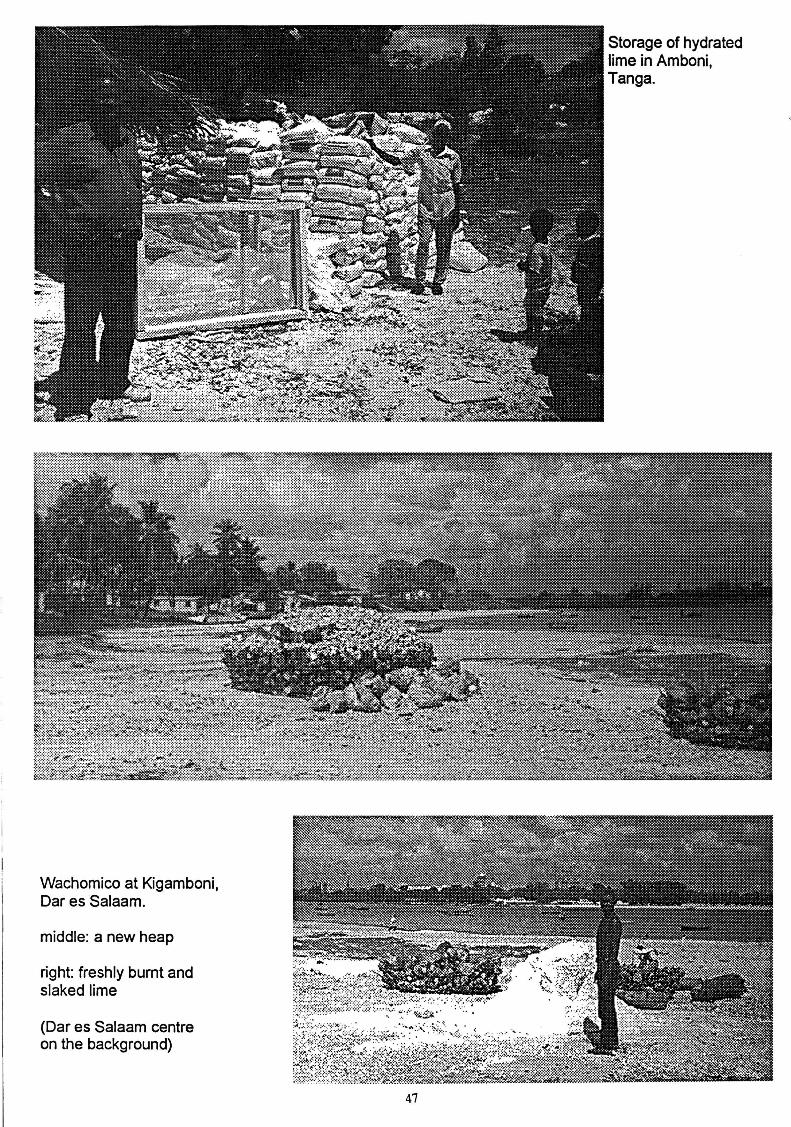
Wachomico at Kigamboni, Dar es Salaam.
middle: a new heap
right: freshly burnt and slaked lime
(Dar es Salaam centre on the background)
47
Starage of hydrated lime in Amboni, Tanga.

Lime kiln, donated by JICA, at the fermer MECCO site, Mjimwema, Dar es Salaam. Bottom left: Control panel of the quicklime kiln. Bottom right: Automatic discharge (vibrating table) and bucket hoist for raw material feeding.
48
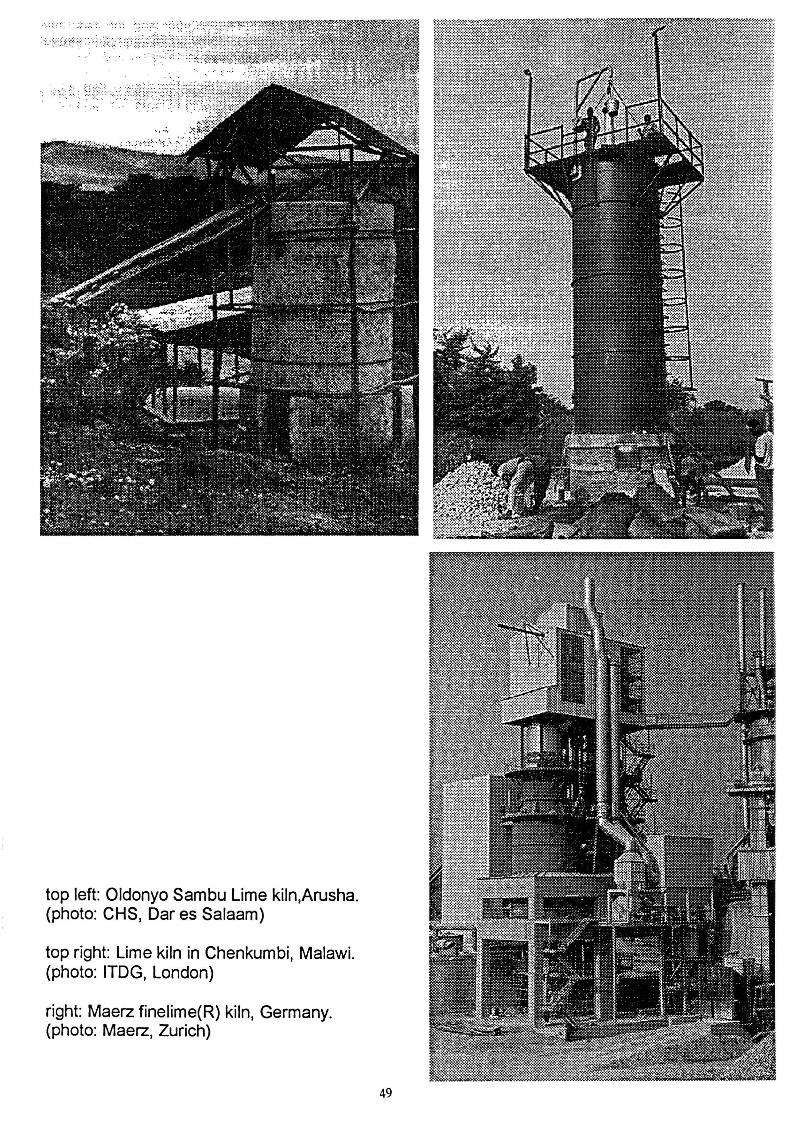
top left: Oldonyo Sambu Lime kiln,Arusha. (photo: CHS, Dar es Salaam)
top right: Lime kiln in Chenkumbi, Malawi. (photo: ITDG, London)
right: Maerz finelime(R) kiln, Germany. (photo: Maerz, Zurich)
49
M.Sc. Theses in Technology and Development Studies since 1997
97.1 Joho van Rijn; The implementation of building Techniques in Gedaref. The search for appropriate designs and building techniques for primary schools and health eentres and their implementation in Gedaref (Sudan)
97.2 Marie Odile Zanders; An assessment of Dornestic Waste Water Pollution for the Lake Victoria Region
97.3 Marcel Cloo and Pjotr Ekelmans; The role of MIC Tanzania Ltd in the development of the Tanzanian telecommunication sector. Tanzania in search of an appropriate tclecommunication technology
97.4 Geert Bergman; Measuring lorlustrial Efficiency in Developing Countries. Thcory and a case study: bottling of Coca-Cola in Dar es Salaam, Tanzania
97.5 Francine Jansen; Analysis of the housing situation in Minsk (Belarus)
97.6 Bartelt Bongenaar; Part 1) Evaluation of the role of the Tanzania Ioclustrial Research and Development Organisation; Part 2) The satellitc receiver design
97.7 Mark Pantus; Implementation of a total quality assurance system in electronics. A study of total quality in a Philippine electronics company
97.8 Jan Buis; Productivity measurement in the Costa Rican low-income housing projects. The search for an adequate methodology
If you would like to rcceive a copy of one of the above indicated M.Sc. theses, please contact:
Department of Technology and Devclopment Studies Eindhoven Univcrsity of Technology MS.c. research co-ordinator L. Robben DG 1.02 PO Box 513 5600 MB Eindhoven Tbc Netherlands