Wireless Sensing Networks for Environmental Monitoring: Two case studies from tropical forests
7
Wireless Sensing Networks for Environmental Monitoring:Two case studies from tropical forests Arturo Sanchez-Azofeifa 1 , Cassidy Rankine 1 , Mario Marcos do Espirito Santo 2 , Rob Fatland 3 , Milton Garcia 4 1 Earth and Atmospheric Science Department University of Alberta Edmonton, Alberta, Canada Email: [email protected] 2 Departamento de Biologia Geral/CCBS Universidade Estadual de Montes Claros Montes Claros, Minas Gerais, Brazil 3 Microsoft Research One Microsoft Way Redmond, WA, 98052 4 Smithsonian Tropical Research Institute (STRI) Panama, Republic of Panama Abstract— The emergence of new environmental monitoring tools utilizing Wireless Sensor Networks (WSNs) represent new opportunities to understand locally driven ecological processes in tropical environments at larger spatial and temporal scales, while at the same time opens new opportunities for eScience research. In this paper we present results from the outcome of two WSNs deployments aimed to evaluate this new technology in tropical environments. Leaf temperature and Photosynthetically Active Radiation (PAR) were measured at high temporal resolution in Panama and Brazil, respectively. Our results indicate that WSN technologies can be used effectively enough to measure important micro-meteorological variables that are sensitive to climate change and land use/cover change. Some of the temperatures recorded during our experiments in Panama were significantly high above those suggested as critical environmental thresholds for tropical environments. Our PAR results from Brazil showcase the value of this technology to evaluate the role of light patterns on ecosystem succession as a result of regional land use/cover change process. Our experiments indicate the WSN can serve as a key element in future understandings of ecosystem process driven by eScience in the years to come. Keywords; tropical dry forests, wireless sensor networks, leaf/canopy temperature, ecosystem succession. I. INTRODUCTION Tropical ecosystems have been, for good reasons, the increasing focus of the implementation of emerging environmental monitoring platforms in recent years. Due to their importance as biodiversity hotspots and their strong influence on land-atmospheric interactions, understanding emerging ecosystems changes in these ecosystems is imperative to define comprehensive conservation and management policies. Advanced computational techniques that link those changes to the quantification of the provision of ecosystem services are fundamentally important to the decision-making domain. Moreover, environmental monitoring systems driven by new multi- and hyperspectral remote sensing platforms [1], which in turn are complemented with ground based monitoring instrumentation and techniques; represent a significant challenge to eScience applications. Long-term environmental monitoring platforms are increasingly necessary to characterize changes in ecosystem functioning and services. The common denominator for these platforms is their production of immense amounts of data. The management of hyper-temporal location based information is logistically demanding and requires a high degree of coordination in order to ensure a successful monitoring program. Tools for working with stored data, such as timeframe or value parameter filtering, are necessary for rapid trend visualization and proper data analysis. The inability to efficiently analyze large, complex databases created by existing and developing long-term monitoring platforms severely limits the utility and application of these relevant earth observation datasets. Wireless sensor networks (WSNs) have the ability to provide unprecedented spatial resolution of natural phenomena in highly dynamic environments at fine temporal scales. Recent advances in electrical component miniaturization, data storage, and low power consumption of wireless communication devices has rendered these technologies ideal for use in environmental monitoring applications [2]. Traditional wired monitoring systems are known to impose several restrictions on sensor deployments. For example, monitoring deployments with over 100m of sensor cable length will demonstrate data logger battery failures and
-
Upload
independent -
Category
Documents
-
view
2 -
download
0
Transcript of Wireless Sensing Networks for Environmental Monitoring: Two case studies from tropical forests

Wireless Sensing Networks for Environmental Monitoring:Two case studies from tropical forestsArturo Sanchez-Azofeifa1, Cassidy Rankine1, Mario Marcos do Espirito Santo2, Rob Fatland3, Milton Garcia4
1Earth and Atmospheric Science Department
University of Alberta Edmonton, Alberta, Canada
Email: [email protected]
2Departamento de Biologia Geral/CCBS Universidade Estadual de Montes Claros
Montes Claros, Minas Gerais, Brazil
3Microsoft Research One Microsoft Way
Redmond, WA, 98052
4Smithsonian Tropical Research Institute (STRI) Panama, Republic of Panama
Abstract— The emergence of new environmental monitoring tools utilizing Wireless Sensor Networks (WSNs) represent new opportunities to understand locally driven ecological processes in tropical environments at larger spatial and temporal scales, while at the same time opens new opportunities for eScience research. In this paper we present results from the outcome of two WSNs deployments aimed to evaluate this new technology in tropical environments. Leaf temperature and Photosynthetically Active Radiation (PAR) were measured at high temporal resolution in Panama and Brazil, respectively. Our results indicate that WSN technologies can be used effectively enough to measure important micro-meteorological variables that are sensitive to climate change and land use/cover change. Some of the temperatures recorded during our experiments in Panama were significantly high above those suggested as critical environmental thresholds for tropical environments. Our PAR results from Brazil showcase the value of this technology to evaluate the role of light patterns on ecosystem succession as a result of regional land use/cover change process. Our experiments indicate the WSN can serve as a key element in future understandings of ecosystem process driven by eScience in the years to come.
Keywords; tropical dry forests, wireless sensor networks, leaf/canopy temperature, ecosystem succession.
I. INTRODUCTION Tropical ecosystems have been, for good reasons, the increasing focus of the implementation of emerging environmental monitoring platforms in recent years. Due to their importance as biodiversity hotspots and their strong influence on land-atmospheric interactions, understanding emerging ecosystems changes in these ecosystems is imperative to define comprehensive conservation and management policies. Advanced computational techniques that link those changes to the quantification of the provision of
ecosystem services are fundamentally important to the decision-making domain. Moreover, environmental monitoring systems driven by new multi- and hyperspectral remote sensing platforms [1], which in turn are complemented with ground based monitoring instrumentation and techniques; represent a significant challenge to eScience applications.
Long-term environmental monitoring platforms are increasingly necessary to characterize changes in ecosystem functioning and services. The common denominator for these platforms is their production of immense amounts of data. The management of hyper-temporal location based information is logistically demanding and requires a high degree of coordination in order to ensure a successful monitoring program. Tools for working with stored data, such as timeframe or value parameter filtering, are necessary for rapid trend visualization and proper data analysis. The inability to efficiently analyze large, complex databases created by existing and developing long-term monitoring platforms severely limits the utility and application of these relevant earth observation datasets.
Wireless sensor networks (WSNs) have the ability to
provide unprecedented spatial resolution of natural phenomena in highly dynamic environments at fine temporal scales. Recent advances in electrical component miniaturization, data storage, and low power consumption of wireless communication devices has rendered these technologies ideal for use in environmental monitoring applications [2]. Traditional wired monitoring systems are known to impose several restrictions on sensor deployments. For example, monitoring deployments with over 100m of sensor cable length will demonstrate data logger battery failures and
unreliable sensor values as a result of high voltage resistance within the electrical system. This can significantly limit monitoring platforms that require numerous sensors over long distances from the data storage location such as tower deployments or ground networks.
Wireless sensors have the advantage to be free from
restrictions imposed by cables; furthermore, sensors may be placed in desirable locations that might otherwise be inaccessible to wired sensors. Wireless sensors networks can also be rapidly deployed due to the independent nature of the components and greater sensor mobility enables simplified network repositioning or relocation for optimizing deployments. Yet by far the greatest advantage conveyed by WSN technology is the increased spatial realm that can be monitored at ground level; limitations on the spatial extent of ground monitoring data is a prevailing issue in relating point based measurements to landscape scale geo-informatics’ data sets [3].
Despite the advantages this emerging technique exerts
over traditional wired sensory systems, environmental WSNs also have several mentionable disadvantages. As this technology has not been adapted for outdoor applications until recently the hardware often cannot withstand harsh environmental conditions such as those in the arctic or tropic regions. High humidity and temperatures have shown to introduce high failure rates with instruments designed for temperate regions where most of the product developers are concentrated. Problems may also arise when using new operating software since the systems have not been hardened with extensive field-testing; additionally, few personnel may be knowledgeable in solving equipment malfunctions for new electronic platforms. When deploying WSNs, depending on the signal frequency and amplification used, sensor location may be limited in regions of low signal transmission, like mountainous terrain or monitoring plots with dense vegetation. Most notably discouraging is the immense amounts of data produced by hyper-temporal multi-sensor networks. Despite such impositions, the potential advantages of wireless sensor networking in environmental monitoring are worthwhile. Developing more durable hardware, robust user-friendly software, and advanced data processing tools are instrumental in overcoming the current barriers to widespread use of environmental WSNs.
Quantifying the fraction of Photosynthetic Active
Radiation absorbed by a plant canopy (fPAR) provides vital information about ecosystem energy and mass exchanges and is important for evaluating changes in carbon pool balances. Long term monitoring of fPAR dynamics is needed to assess changes in vegetative phenology and associated ecosystem productivity levels, and therefore carbon production under climate change scenarios. Unfortunately, accurately measuring fPAR tends to be difficult in large complex vegetative stands such as tropical forests due to the spatial heterogeneity of these environments.
Monitoring leaft/canopy temperature and photosynthetic
radiation fluxes in tropical environments requires sensors in often inaccessible reaches within and above the forests canopy; indeed, deployments of multi-sensor monitoring networks are needed in order to better capture the variable light environment of tropical forests for adequate fPAR assessments or to evaluate if tropical canopies are in fact reaching critical environmental thresholds associated to climate change scenarios [3]. We propose this task can be greatly aided and facilitated by the use of WSNs combined with advanced cyber-infrastructure platforms that allow for easy and fast access to the massive environmental datasets produced by WSN deployments [4].
In the context of the role that this emerging technology
can play in eScience initiatives, the specific goal of this paper is to present the outcome of two WSNs deployments in two different tropical dry forests environments. The first WSN deployment deals with a WSN of leaf temperature sensors in the top of a dry forest canopy in Panama. This deployment aims to evaluate how this technology can be used to assess in-situ leaf temperature. The second WSN deployment deals with a series of experiments aimed to measure Photosynthetically Active Radiation in a tropical dry forest under different levels of succession in Brazil.
II. MATERIALS & METHODS
A. Study Areas We deployed two WSN at two different tropical dry forests
sites in Panama and Brazil. Tropical Dry forests are defined as those forests having mean annual temperature of 25oC and a mean annual precipitation of ranging from 700-2000 mm. This ecosystem presents two well-defined seasons, one of which is deciduous [5].
The temperature WSN was deployed at the Parque Natural
Metropolitano (PNM), Panama City, Panama. The PNM is a tropical dry forest with a mean annual precipitation of 1500 mm. At the PNM a 47m-construction crane is deployed to support basic tropical canopy research. This crane facility is administered by the Smithsonian Tropical Research Institute (STRI) [6]. The PNM site is highly affected by liana infestation [7]. At this site three tree and three liana species of lianas were equipped with thermocouples systems. The fundamental goal of this experiment was to see if (i) average tree/liana temperature were below common environmental thresholds discussed by [3] and (ii) document if differences exist between tree and liana leaf temperature.
The PAR WSN was deployed at the Mata Seca State Park
in Minas Gerais, southeastern Brazil. The Mata Seca State Park was created in 2000 from the areas of four farms (total area of 15,000 ha) and is a combination of primary and secondary tropical dry forest under different ages of regeneration. Mean annual precipitation is 900 mm with a
mean annual temperature of 24.5oC [8]. The WSNs were assembled in forest patches at three different successional stages: early (10 years recovering after pasture abandonment; 4 m in average canopy height), intermediate (30 years of recovery; 8 m in height) and late (no records of clear-cutting for 50 years; 12 m in height).
B. Instrumentation Two types of Wireless Sensor Networks were deployed
during our experiments. The Panama WSN consisted of 24 thermocouples connected to three species of tropical trees (Anacardium excelsum (Anacardiaceae), Ficus insipida (Moraceae), and Chrysophyllum argenteum (Sapotaceae)) and two species of tropical lianas (Stigmaphyllon hypargyreum (Malpighiaceae), Bonamia trichantha (Convolvulaceae)) living on the host trees mentioned previously.
In the leaf temperature experiment, the tip of the
thermocouple system was attached to the lower epidermis of the leaves using surgical tape. The thermocouple cables were then connected to WSN nodes produced by Microstrain Corp. (TC-Link, Vermont, USA). Data was collected at every 5 min interval for sun-exposed leaves. Data was downloaded using a base station. Leaves were monitored weekly to check for potential discoloration of leaves due to the surgical tape, as well as potential disconnection of the thermocouples from the leaf.
Thermocouples were deployed from February 26 to May
25, 2011, and all data with exception of the first week of measurements is considered in this paper.
The wireless equipment used to monitor fPAR conditions in Brazil was developed using Olsonet Communications Corporation nodes (Olsonet Corporation, Ottawa, Canada). These nodes were adapted for use with Apogee PAR (SQ-110) and solar radiation sensors (SP-110). Both upward and downward facing PAR and pyrometers sensors were mounted on towers and positioned 5m above the forest canopy providing a 100m-diameter sensor field of view [9, 10] sensor values are relayed through a Wireless Optical Phenology System (WOPS®) to the data aggregator at ground level.
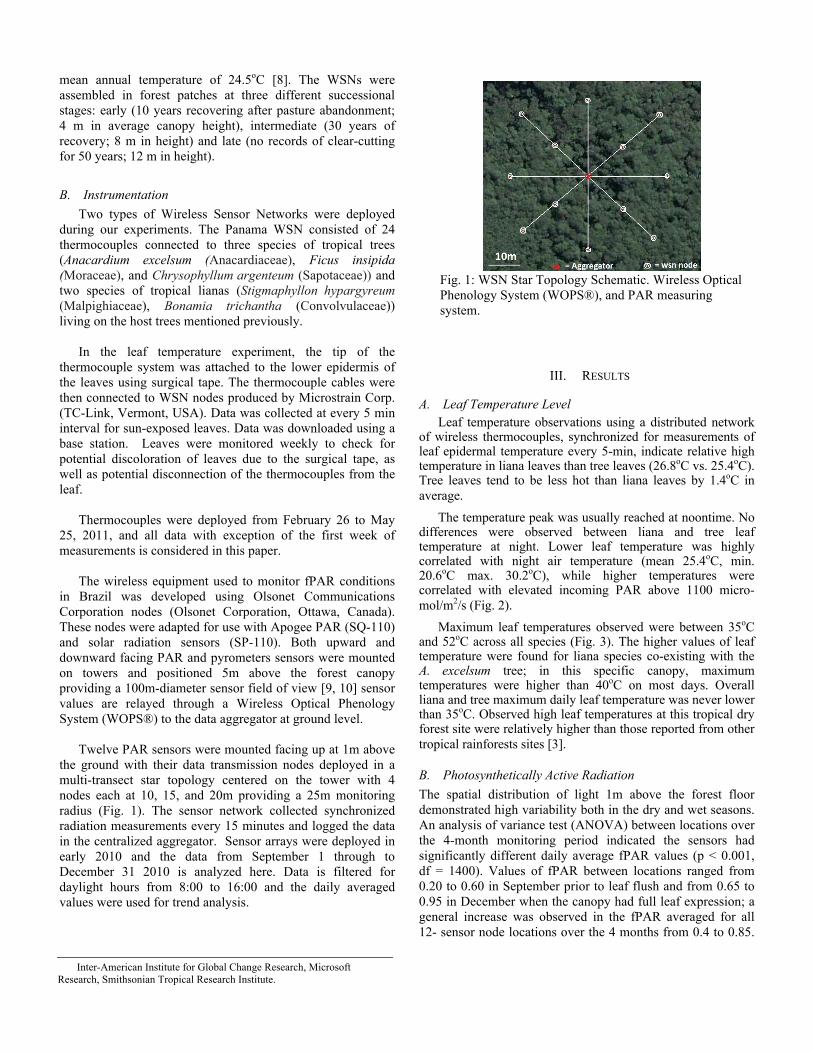
Twelve PAR sensors were mounted facing up at 1m above
the ground with their data transmission nodes deployed in a multi-transect star topology centered on the tower with 4 nodes each at 10, 15, and 20m providing a 25m monitoring radius (Fig. 1). The sensor network collected synchronized radiation measurements every 15 minutes and logged the data in the centralized aggregator. Sensor arrays were deployed in early 2010 and the data from September 1 through to December 31 2010 is analyzed here. Data is filtered for daylight hours from 8:00 to 16:00 and the daily averaged values were used for trend analysis.
III. RESULTS
A. Leaf Temperature Level Leaf temperature observations using a distributed network
of wireless thermocouples, synchronized for measurements of leaf epidermal temperature every 5-min, indicate relative high temperature in liana leaves than tree leaves (26.8oC vs. 25.4oC). Tree leaves tend to be less hot than liana leaves by 1.4oC in average.
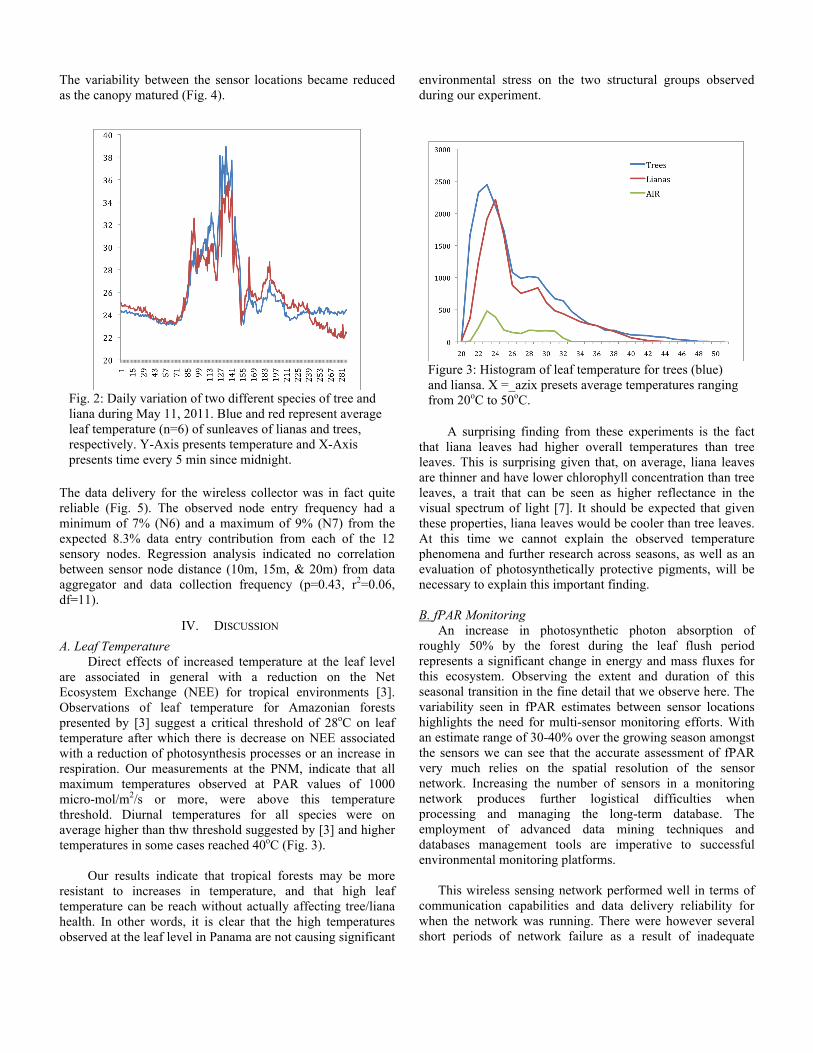
The temperature peak was usually reached at noontime. No differences were observed between liana and tree leaf temperature at night. Lower leaf temperature was highly correlated with night air temperature (mean 25.4oC, min. 20.6oC max. 30.2oC), while higher temperatures were correlated with elevated incoming PAR above 1100 micro-mol/m2/s (Fig. 2).
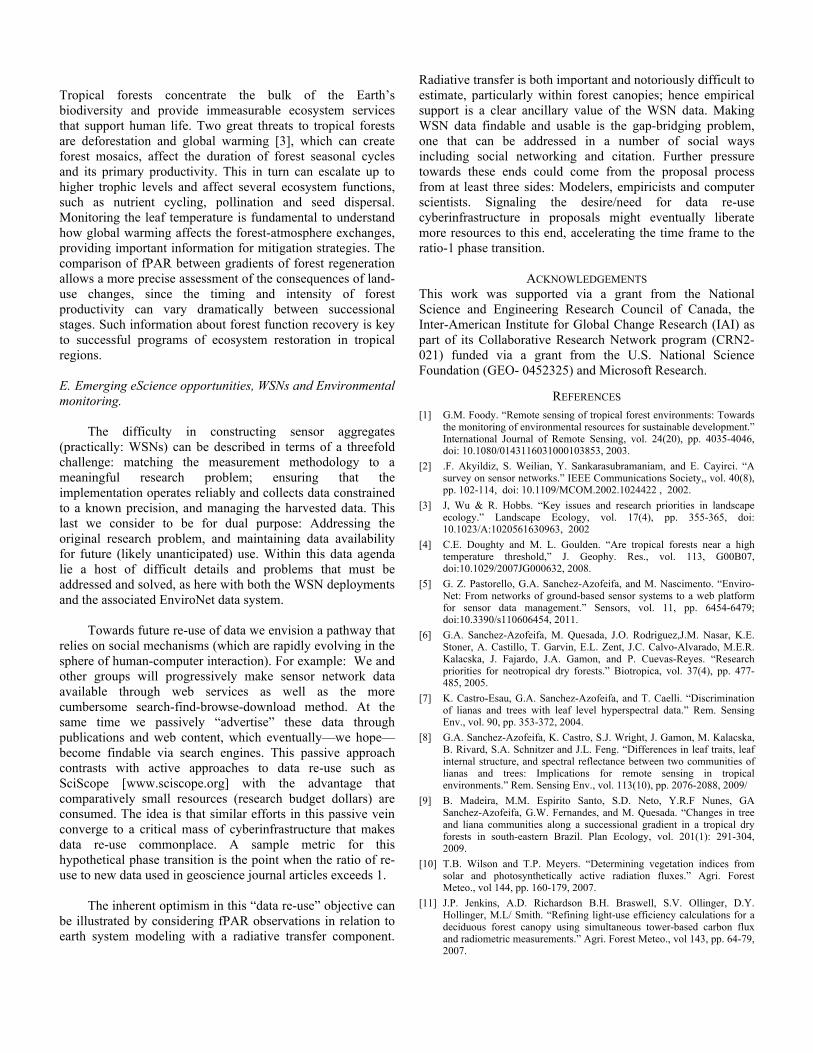
Maximum leaf temperatures observed were between 35oC and 52oC across all species (Fig. 3). The higher values of leaf temperature were found for liana species co-existing with the A. excelsum tree; in this specific canopy, maximum temperatures were higher than 40oC on most days. Overall liana and tree maximum daily leaf temperature was never lower than 35oC. Observed high leaf temperatures at this tropical dry forest site were relatively higher than those reported from other tropical rainforests sites [3].
B. Photosynthetically Active Radiation The spatial distribution of light 1m above the forest floor demonstrated high variability both in the dry and wet seasons. An analysis of variance test (ANOVA) between locations over the 4-month monitoring period indicated the sensors had significantly different daily average fPAR values (p < 0.001, df = 1400). Values of fPAR between locations ranged from 0.20 to 0.60 in September prior to leaf flush and from 0.65 to 0.95 in December when the canopy had full leaf expression; a general increase was observed in the fPAR averaged for all 12- sensor node locations over the 4 months from 0.4 to 0.85.
Inter-American Institute for Global Change Research, Microsoft Research, Smithsonian Tropical Research Institute.
Fig. 1: WSN Star Topology Schematic. Wireless Optical Phenology System (WOPS®), and PAR measuring system.
The variability between the sensor locations became reduced as the canopy matured (Fig. 4).
The data delivery for the wireless collector was in fact quite reliable (Fig. 5). The observed node entry frequency had a minimum of 7% (N6) and a maximum of 9% (N7) from the expected 8.3% data entry contribution from each of the 12 sensory nodes. Regression analysis indicated no correlation between sensor node distance (10m, 15m, & 20m) from data aggregator and data collection frequency (p=0.43, r2=0.06, df=11).
IV. DISCUSSION A. Leaf Temperature
Direct effects of increased temperature at the leaf level are associated in general with a reduction on the Net Ecosystem Exchange (NEE) for tropical environments [3]. Observations of leaf temperature for Amazonian forests presented by [3] suggest a critical threshold of 28oC on leaf temperature after which there is decrease on NEE associated with a reduction of photosynthesis processes or an increase in respiration. Our measurements at the PNM, indicate that all maximum temperatures observed at PAR values of 1000 micro-mol/m2/s or more, were above this temperature threshold. Diurnal temperatures for all species were on average higher than thw threshold suggested by [3] and higher temperatures in some cases reached 40oC (Fig. 3).
Our results indicate that tropical forests may be more resistant to increases in temperature, and that high leaf temperature can be reach without actually affecting tree/liana health. In other words, it is clear that the high temperatures observed at the leaf level in Panama are not causing significant
environmental stress on the two structural groups observed during our experiment.
A surprising finding from these experiments is the fact that liana leaves had higher overall temperatures than tree leaves. This is surprising given that, on average, liana leaves are thinner and have lower chlorophyll concentration than tree leaves, a trait that can be seen as higher reflectance in the visual spectrum of light [7]. It should be expected that given these properties, liana leaves would be cooler than tree leaves. At this time we cannot explain the observed temperature phenomena and further research across seasons, as well as an evaluation of photosynthetically protective pigments, will be necessary to explain this important finding. B. fPAR Monitoring
An increase in photosynthetic photon absorption of roughly 50% by the forest during the leaf flush period represents a significant change in energy and mass fluxes for this ecosystem. Observing the extent and duration of this seasonal transition in the fine detail that we observe here. The variability seen in fPAR estimates between sensor locations highlights the need for multi-sensor monitoring efforts. With an estimate range of 30-40% over the growing season amongst the sensors we can see that the accurate assessment of fPAR very much relies on the spatial resolution of the sensor network. Increasing the number of sensors in a monitoring network produces further logistical difficulties when processing and managing the long-term database. The employment of advanced data mining techniques and databases management tools are imperative to successful environmental monitoring platforms.
This wireless sensing network performed well in terms of
communication capabilities and data delivery reliability for when the network was running. There were however several short periods of network failure as a result of inadequate
Fig. 2: Daily variation of two different species of tree and liana during May 11, 2011. Blue and red represent average leaf temperature (n=6) of sunleaves of lianas and trees, respectively. Y-Axis presents temperature and X-Axis presents time every 5 min since midnight.
Figure 3: Histogram of leaf temperature for trees (blue) and liansa. X =_azix presets average temperatures ranging from 20oC to 50oC.

power supply to the central data logger, along with some hardware complications, but the monitoring gaps were minimal for this network. Other networks operating in nearby forest plots experienced much longer data gaps mostly due to human error and limitations on maintenance resources.
C. Lessons Learned and its Significance to Emerging eScience Environmental Monitoring Approaches.
Environmental monitoring can be difficult in complex ecosystems due to spatial and temporal heterogeneity of prevailing conditions. Wireless sensor networks can be extremely useful tool in environmental monitoring due to the many advantages these new instrument platforms have over spatially confined wired sensor stations. The logistical disadvantages of operating new technology in remote regions do exist, but the benefits of enhanced monitoring capabilities are promising. The PAR and phenology nodes were deployed in this study were in a relatively small plot area (2000m2) in order to remain within the tower sensors viewing footprint, but emerging wireless sensing technology lends itself to larger monitoring networks. New hardware developments can deliver the sensory communication from more remote ground based locations for distances approaching 1km which would enable remotely linked sensory networking and greatly improve our ground based monitoring capacity.
Fig. 5: Data delivery frequency per node for 400,000 wireless data entries over 15 months for a 3-channel, 12-nodeWSN sampling, transmitting, and logging sensory data every 15 minutes.
This new sensing technology coincides with the emergence
of cyber-infratsructures for enhanced database operations. New data management tools offer online storage with facilitated data organization for improved database access and streamlined result analysis. The University of Alberta`s Enviro-Net project [4] is one those emerging cyber-infrastructure portals that is central to the operations of our tropical forest eScience monitoring program. The custom data processing tools designed for Enviro-Net users has proven instrumental to the success of data utilization and information mobilization with regards to these valuable fPAR data sets and other joint environmental monitoring networks in place.
D. Relevance for Tropical Forest Conservation
Fig. 4: Spatial and Temporal Distribution of fPAR in a Brazilian Tropical Dry Forest. A) Time series of daily averaged fraction of absorbed fPAR for 12 wirelessly monitored locations in the 2000 m2 canopy viewing footprint of an optical phenology tower during the leaf flushing period. B) Monthly average daytime downwelling PAR (W/m2) measured at 1m above the ground.
Tropical forests concentrate the bulk of the Earth’s biodiversity and provide immeasurable ecosystem services that support human life. Two great threats to tropical forests are deforestation and global warming [3], which can create forest mosaics, affect the duration of forest seasonal cycles and its primary productivity. This in turn can escalate up to higher trophic levels and affect several ecosystem functions, such as nutrient cycling, pollination and seed dispersal. Monitoring the leaf temperature is fundamental to understand how global warming affects the forest-atmosphere exchanges, providing important information for mitigation strategies. The comparison of fPAR between gradients of forest regeneration allows a more precise assessment of the consequences of land-use changes, since the timing and intensity of forest productivity can vary dramatically between successional stages. Such information about forest function recovery is key to successful programs of ecosystem restoration in tropical regions. E. Emerging eScience opportunities, WSNs and Environmental monitoring.
The difficulty in constructing sensor aggregates (practically: WSNs) can be described in terms of a threefold challenge: matching the measurement methodology to a meaningful research problem; ensuring that the implementation operates reliably and collects data constrained to a known precision, and managing the harvested data. This last we consider to be for dual purpose: Addressing the original research problem, and maintaining data availability for future (likely unanticipated) use. Within this data agenda lie a host of difficult details and problems that must be addressed and solved, as here with both the WSN deployments and the associated EnviroNet data system.
Towards future re-use of data we envision a pathway that
relies on social mechanisms (which are rapidly evolving in the sphere of human-computer interaction). For example: We and other groups will progressively make sensor network data available through web services as well as the more cumbersome search-find-browse-download method. At the same time we passively “advertise” these data through publications and web content, which eventually—we hope—become findable via search engines. This passive approach contrasts with active approaches to data re-use such as SciScope [www.sciscope.org] with the advantage that comparatively small resources (research budget dollars) are consumed. The idea is that similar efforts in this passive vein converge to a critical mass of cyberinfrastructure that makes data re-use commonplace. A sample metric for this hypothetical phase transition is the point when the ratio of re-use to new data used in geoscience journal articles exceeds 1.
The inherent optimism in this “data re-use” objective can
be illustrated by considering fPAR observations in relation to earth system modeling with a radiative transfer component.
Radiative transfer is both important and notoriously difficult to estimate, particularly within forest canopies; hence empirical support is a clear ancillary value of the WSN data. Making WSN data findable and usable is the gap-bridging problem, one that can be addressed in a number of social ways including social networking and citation. Further pressure towards these ends could come from the proposal process from at least three sides: Modelers, empiricists and computer scientists. Signaling the desire/need for data re-use cyberinfrastructure in proposals might eventually liberate more resources to this end, accelerating the time frame to the ratio-1 phase transition.
ACKNOWLEDGEMENTS
This work was supported via a grant from the National Science and Engineering Research Council of Canada, the Inter-American Institute for Global Change Research (IAI) as part of its Collaborative Research Network program (CRN2-021) funded via a grant from the U.S. National Science Foundation (GEO- 0452325) and Microsoft Research.
REFERENCES [1] G.M. Foody. “Remote sensing of tropical forest environments: Towards
the monitoring of environmental resources for sustainable development.” International Journal of Remote Sensing, vol. 24(20), pp. 4035-4046, doi: 10.1080/0143116031000103853, 2003.
[2] .F. Akyildiz, S. Weilian, Y. Sankarasubramaniam, and E. Cayirci. “A survey on sensor networks.” IEEE Communications Society,, vol. 40(8), pp. 102-114, doi: 10.1109/MCOM.2002.1024422 , 2002.
[3] J, Wu & R. Hobbs. “Key issues and research priorities in landscape ecology.” Landscape Ecology, vol. 17(4), pp. 355-365, doi: 10.1023/A:1020561630963, 2002
[4] C.E. Doughty and M. L. Goulden. “Are tropical forests near a high temperature threshold,” J. Geophy. Res., vol. 113, G00B07, doi:10.1029/2007JG000632, 2008.
[5] G. Z. Pastorello, G.A. Sanchez-Azofeifa, and M. Nascimento. “Enviro-Net: From networks of ground-based sensor systems to a web platform for sensor data management.” Sensors, vol. 11, pp. 6454-6479; doi:10.3390/s110606454, 2011.
[6] G.A. Sanchez-Azofeifa, M. Quesada, J.O. Rodriguez,J.M. Nasar, K.E. Stoner, A. Castillo, T. Garvin, E.L. Zent, J.C. Calvo-Alvarado, M.E.R. Kalacska, J. Fajardo, J.A. Gamon, and P. Cuevas-Reyes. “Research priorities for neotropical dry forests.” Biotropica, vol. 37(4), pp. 477-485, 2005.
[7] K. Castro-Esau, G.A. Sanchez-Azofeifa, and T. Caelli. “Discrimination of lianas and trees with leaf level hyperspectral data.” Rem. Sensing Env., vol. 90, pp. 353-372, 2004.
[8] G.A. Sanchez-Azofeifa, K. Castro, S.J. Wright, J. Gamon, M. Kalacska, B. Rivard, S.A. Schnitzer and J.L. Feng. “Differences in leaf traits, leaf internal structure, and spectral reflectance between two communities of lianas and trees: Implications for remote sensing in tropical environments.” Rem. Sensing Env., vol. 113(10), pp. 2076-2088, 2009/
[9] B. Madeira, M.M. Espirito Santo, S.D. Neto, Y.R.F Nunes, GA Sanchez-Azofeifa, G.W. Fernandes, and M. Quesada. “Changes in tree and liana communities along a successional gradient in a tropical dry forests in south-eastern Brazil. Plan Ecology, vol. 201(1): 291-304, 2009.
[10] T.B. Wilson and T.P. Meyers. “Determining vegetation indices from solar and photosynthetically active radiation fluxes.” Agri. Forest Meteo., vol 144, pp. 160-179, 2007.
[11] J.P. Jenkins, A.D. Richardson B.H. Braswell, S.V. Ollinger, D.Y. Hollinger, M.L/ Smith. “Refining light-use efficiency calculations for a deciduous forest canopy using simultaneous tower-based carbon flux and radiometric measurements.” Agri. Forest Meteo., vol 143, pp. 64-79, 2007.