Species Composition, Diversity and Local uses of Tropical Dry Deciduous and Gallery Forests in...
19
-1 Species Composition, diversity and local uses of tropical dry deciduous and gallery forests in Nicaragua BENIGNO GONZA ´ LEZ-RIVAS 1 , MULUALEM TIGABU 2, *, KARIN GERHARDT 3 , GUILLERMO CASTRO-MARI ´ N 1 and PER CHRISTER ODE ´ N 2 1 Facultad de Recursos Naturales y del Ambiente, Universidad Nacional Agraria Apartado Postal 453, Managua, Nicaragua; 2 Department of Forest Genetics and Plant Physiology, Tropical Silviculture and Seed Laboratory, Faculty of Forest Sciences, Swedish University of Agricultural Sciences, SE-901 83 Umea ˚, Sweden; 3 Department of Plant Ecology and Evolutionary Biology Centre, Uppsala University, Villava ¨gen 14, SE-752 36 Uppsala, Sweden; *Author for correspondence (e-mail: [email protected], [email protected]; phone: +46-90-786-83-19; fax: +46-90- 786-58-96) Received 6 December 2004; accepted in revised form 15 August 2005 Key words: Biodiversity, Central America, Endangered species, Floristic composition Abstract. The floristic composition and diversity of tropical dry deciduous and gallery forests were studied in Chacocente Wildlife Refuge, located on the Pacific coast in Nicaragua during 1994 and 2000. Density, dominance and frequency as well as species and family important values were computed to characterize the floristic composition. A variety of diversity measures were also calculated to examine heterogeneity in each forest community. A total of 29 families, 49 genera and 59 species were represented in 2 ha dry deciduous forest. In the gallery forest, the number of families, genera and species recorded in 2000 inventory was 33, 48 and 58, respectively and slightly higher than the 1994 inventory. The number of stems ‡10 cm dbh varied from 451 to 489 per hectare in the deciduous forest, and from 283 to 298 per hectare in the gallery forest. The basal area was much larger for species in the gallery than dry deciduous forest. Fabaceae, sub family Papilionoideae, was the most specious family in the deciduous forest while Meliaceae was the dominant family in the gallery forest. Similarity in species composition and abundance between deciduous and gallery forests was low. In terms of species diversity, the gallery forest was found more diverse than the deciduous forest using Fisher’s diversity index. Both forest communities were characterized by a typical inverse J shape. Therefore, emphasis should be given to the protection of rare species, i.e. as the forests are still under continued human pressure, an immediate action should be taken to conserve the remaining flora. Introduction Dry forests once covered more than 40% of the total area of tropical forests (Murphy and Lugo 1986). They are considered to be one of the most threa- tened of all the major tropical forest habitats and are argued to deserve a high priority for conservation (Janzen 1988; Gillespie et al. 2000). According to the Holdridge system of life zone classification, dry tropical and subtropical forests and woodlands occur in frost-free areas with a mean annual temperature Biodiversity and Conservation (2006) 15:1509–1527 ȑ Springer 2006 DOI 10.1007/s10531-005-2632-0
Transcript of Species Composition, Diversity and Local uses of Tropical Dry Deciduous and Gallery Forests in...

-1
Species Composition, diversity and local uses
of tropical dry deciduous and gallery forests
in Nicaragua
BENIGNO GONZALEZ-RIVAS1, MULUALEM TIGABU2,*,KARIN GERHARDT3, GUILLERMO CASTRO-MARIN1 andPER CHRISTER ODEN2
1Facultad de Recursos Naturales y del Ambiente, Universidad Nacional Agraria Apartado Postal 453,
Managua, Nicaragua; 2Department of Forest Genetics and Plant Physiology, Tropical Silviculture
and Seed Laboratory, Faculty of Forest Sciences, Swedish University of Agricultural Sciences,
SE-901 83 Umea, Sweden; 3Department of Plant Ecology and Evolutionary Biology Centre, Uppsala
University, Villavagen 14, SE-752 36 Uppsala, Sweden; *Author for correspondence (e-mail:
[email protected], [email protected]; phone: +46-90-786-83-19; fax: +46-90-
786-58-96)
Received 6 December 2004; accepted in revised form 15 August 2005
Key words: Biodiversity, Central America, Endangered species, Floristic composition
Abstract. The floristic composition and diversity of tropical dry deciduous and gallery forests were
studied in Chacocente Wildlife Refuge, located on the Pacific coast in Nicaragua during 1994 and
2000. Density, dominance and frequency as well as species and family important values were
computed to characterize the floristic composition. A variety of diversity measures were also
calculated to examine heterogeneity in each forest community. A total of 29 families, 49 genera and
59 species were represented in 2 ha dry deciduous forest. In the gallery forest, the number of
families, genera and species recorded in 2000 inventory was 33, 48 and 58, respectively and slightly
higher than the 1994 inventory. The number of stems ‡10 cm dbh varied from 451 to 489 per
hectare in the deciduous forest, and from 283 to 298 per hectare in the gallery forest. The basal area
was much larger for species in the gallery than dry deciduous forest. Fabaceae, sub family
Papilionoideae, was the most specious family in the deciduous forest while Meliaceae was the
dominant family in the gallery forest. Similarity in species composition and abundance between
deciduous and gallery forests was low. In terms of species diversity, the gallery forest was found
more diverse than the deciduous forest using Fisher’s diversity index. Both forest communities were
characterized by a typical inverse J shape. Therefore, emphasis should be given to the protection of
rare species, i.e. as the forests are still under continued human pressure, an immediate action should
be taken to conserve the remaining flora.
Introduction
Dry forests once covered more than 40% of the total area of tropical forests(Murphy and Lugo 1986). They are considered to be one of the most threa-tened of all the major tropical forest habitats and are argued to deserve a highpriority for conservation (Janzen 1988; Gillespie et al. 2000). According to theHoldridge system of life zone classification, dry tropical and subtropical forestsand woodlands occur in frost-free areas with a mean annual temperature
Biodiversity and Conservation (2006) 15:1509–1527 � Springer 2006
DOI 10.1007/s10531-005-2632-0

higher than 17 �C, a mean annual rainfall between 250 and 2000 mm, and anannual ratio of potential evapotranspiration to precipitation exceeding unity(Murphy and Lugo 1995).
The area of natural forests in Central America is estimated to be 190,000 km2,representing ca. 15% of the total land cover. In addition, some 130,000 km2
deforested land is considered suitable only for forestry, adding to 24%of the totalarea (Segura et al. 1997). The deforestation rate in Central America is estimatedas 0.5 km2 per year (Roldan 2001). The tendency of human populations toconcentrate in drier climates is hastening the rate of dry forest degradation(Murphy and Lugo 1995) and deforestation has increased dramatically withpopulation growth during the last century. Large areas are cleared for grazingand agriculture and only fragments of dry forests remain (Gerhardt 1994).
Nicaragua has 2500 km2 of tropical dry forests, representing ca. 2% of thetotal forest cover (Harcourt and Sayer 1996). The dry forests are found mainlyon the Pacific coast where ca. 50% of the population also lives. Nicaraguan dryforests have been intensively exploited for commercial timber production. Themajor commercial timber species are Swietenia humilis, Cedrela odorata, Bom-bacopsis quinata, Dalbergia retusa and Guaiacum sanctum (Sabogal 1992). Theextraction of valuable commercial trees for export started in early 1900 (Terceroand Urrutia 1994), and continued for decades, resulting in considerablereduction of commercially important species. The Nicaraguan Pacific railwaywas constructed in the 1950s and most of the railway sleepers used was extractedfrom the dry forest in Chacocente (Tercero and Urrutia 1994). The dry forestsare still major sources of wood for fire, poles and timber, and provide oppor-tunities for hunting and collection of other important non-timber forestsproducts (NTFP). In addition to cutting of trees for wood and related products,the major causes of deforestation have been conversion of dry forests into coffeeplantations, crop fields and ranches (Roldan 2001).
Chacocente National Wildlife Refuge was established in 1983 to protect thenesting beach of marine turtles and the last area of the tropical dry forest due tothe social, economic, ecological and scientific relevance of this type of ecosys-tem. During the Sandinista Revolution big ranches were expropriated and be-came property of the state. In 1990 this land was given to peasant cooperatives.By 1998, the land tenure changed very rapidly since land was being sold andcooperative land was converted into private land (Anonymous 2002). Today,the Chacocente National Wildlife Refuge consists mainly of private farms (84owners), although some are quite small. The only state land in the refuge is asmall property donated to Ministry of Natural Resources and Environment(MARENA) by the International Fauna and Flora Organization. The refuge isnot fully protected against human impact and is utilized both legally and ille-gally by the local people living inside as well as outside the refuge. Anthropo-genic disturbances such as burning, grazing, wood collection and illegal cuttingare factors affecting plant population density (Gillespie et al. 2000).
The effect of this land use dynamics and forest fragmentation on biologicaldiversity in Chacocente is not well documented (Sabogal and Valerio 1998). An
1510

assessment of species composition and diversity provide information fordeveloping guidelines for conservation priorities in the region since few com-parative or quantitative studies in remaining forest fragments in CentralAmerica have been made (Gillespie et al. 2000). In this study, we described thefloristic composition and species diversity of two tropical dry forest types, drydeciduous and gallery forests, at two different times. The vegetation descriptionpresented will hopefully contribute to a better understanding of the floristiccomposition and diversity of the tropical dry forests. Given the threatenedstatus of dry forests throughout the tropics, particularly in Nicaragua, and thefact that dry forests are less studied than moister tropical forest types, thisstudy will provide important baseline data for the region.
Materials and methods
Study area
This study was carried out in Chacocente Wildlife Reserve (11�36¢–11�30¢ Nand 86�08¢–86�15¢ W) located on the Pacific coast in the department of Carazo,Nicaragua (Figure 1). The refuge consists of closed deciduous forest (1099 ha),gallery forest (471 ha), open low forest (1842 ha), fallows area (554 ha), annualcrops (311 ha), grassland (294 ha), and beach area (71 ha) (Anonymous, 2002).Chacocente has a dry period of 7 months with less than 50 mm precipitationper months, and during the rainy season (June–October) rainfall is irregularwith many days without rainfall (Anonymous 2002). The mean annual pre-cipitation during the last 13 years has been 1422 mm, with a maximum in 1995
Figure 1. Distribution of tropical dry forests in Nicaragua and location of the study site,
Chacocente.
1511

(1962 mm) and the minimum in 1991 (991 mm). During October 1998,hurricane Mitch passed over the area and the precipitation that month was ashigh as 775 mm. The average annual temperature is 26 �C (Anonymous 2002).
The gallery forest, defined as narrow patches along the fringes of semi-permanent watercourses (Lamprecht 1989), occurs along the main watercourse, the Rıo Escalante. It has a different species composition, structure andstand density than the more common deciduous forest. The vegetation ismostly evergreen, the trees are tall and the majority of the trees have a diameterexceeding 35 cm at breast height. The deciduous forest trees totally or partiallyshed their leaves during the dry season.
Sampling and data analyses
Two permanent plots in each forest type were established by UniversidadNacional Agraria, Managua, Nicaragua in 1989. The area of each permanentplot was 1.0 ha and subdivided into 25 subplots of 20 · 20 m. Each plot wassystematically surveyed by identifying, measuring, and tagging all trees withdiameter at breast height (dbh) ‡10 cm. The inventories were made in 1994 and2000. In addition, local names were recorded and information about uses of thetree species was gathered by consulting a Nicaraguan forest use specialist(Claudio Calero, personal communication) and relevant literature (Salas 1993;Stevens et al. 2001). All scientific names were thoroughly cross-checked in theTROPICOS nomenclatural database (http://mobot.mobot.org/W3T/search/Vast.html) of the Missouri Botanical Garden.
The importance value index (IVI) and family importance value (FIV) wereused to describe the species composition of the plots. IVI of a species is definedas the sum of its relative dominance, its relative density and its relativefrequency, which in turn are calculated as follows:
Relative dominance¼ total basal area for a species/total basal area for all
species
Relative density¼ number of individuals of a species/total number of
individuals
Relative frequency¼ frequency of a species/sum frequencies of all species
The frequency of species is defined as the number of subplots (20 · 20 m) inwhich the species is present. The theoretical range for relative dominance,relative density and relative frequency is 0–100%, thus IVI of species may varybetween 0 and 300%. The FIV was computed in the same way as IVI exceptthat relative frequency was replaced by the relative diversity, computed as thenumber of species in a family/total number of species. All species encounteredduring both inventories were clustered into three groups based on the meannumber of individuals of a species per hectare as rare (�4 individuals per
1512

hectare), intermediate (4–24 individuals per hectare) and abundant(>24 individuals per hectare). According to Duque and Cavelier (2003), aspecies with two or fewer individuals in 2.16 ha is considered as locally rare.
A variety of commonly used diversity indices were computed in order topermit a more precise comparison of the alpha diversity between the two forestcommunities. These indices were Margalef’s species richness index, Shannon’smeasure of evenness, Shannon–Wiener’s diversity index, Simpson’s diversityindex and Fisher’s diversity index. These indices are widely employed tomeasure biological diversity (Magurran 2004). In addition, the species-abun-dance patterns in each forest community were plotted. Floristic similaritybetween forest communities was assessed using Jaccard’s coefficient of simi-larity, based on the presence/absence of the species, and Morisita’s index ofsimilarity, based on number of individuals per species. Jaccard’s coefficient ofsimilarity and Morisita’s index vary between 0 and 1 and a value close to 1indicates greater similarity between forest communities (Krebs 1999). Theconservation status of species encountered in our plots was assessed based onthe 2004 IUCN Red List of Threatened Species directory (IUCN 2004).In addition, candidate species for future IUCN listing were identified based ontheir rarity and regional distribution based on Flora of Nicaragua (Stevenset al. 2001) and the Missouri Botanical Garden’s TROPICOS database.
Results
Floristic composition
A total of 29 families, 49 genera and 59 species were found in the dry deciduousforest during both inventories (Table 1). While the stem density slightly in-creased in 2000 inventory, the basal area was relatively less compared to theinventory made in 1994. Fabaceae, sub-family Papilionoideae was the mostspecious family with higher FIV (Table 2). Other families (sub-families) with‡4 species were Caesalpinioideae and Boraginaceae. Hernandiaceae, thoughrepresented by one species (Gyrocarpus americanus), had the second and thirdhigher FIV in 1994 and 2000 inventories, respectively owing to the large stemdensity per hectare (62 individuals/ha in 1994 and 37 individuals/ha in 2000).Gyrocarpus americanus stood out as the most abundant species during bothinventories in terms of basal area, relative dominance, relative frequency andIVI (Table 3). While Tabebuia ochracea was the second most abundant speciesduring both inventories, Lonchocarpus minimiflorus and Myrospermumfrutescens were more abundant in 1994 and 2000 inventories, respectively. Therarest species during both inventories were Celtis caudata and Zanthoxylumcaribaeum (Table 4). Four species, Acacia costaricensis, Ficus obtusifolia,Pithecellobium saman and Trichilia hirta, recorded in 1994 inventory were notencountered in 2000, but four other species, Adelia barbinervis, Casearia
1513

corymbosa, Cordia dentata and Trema micrantha, were found in 2000 inventory(Appendix).
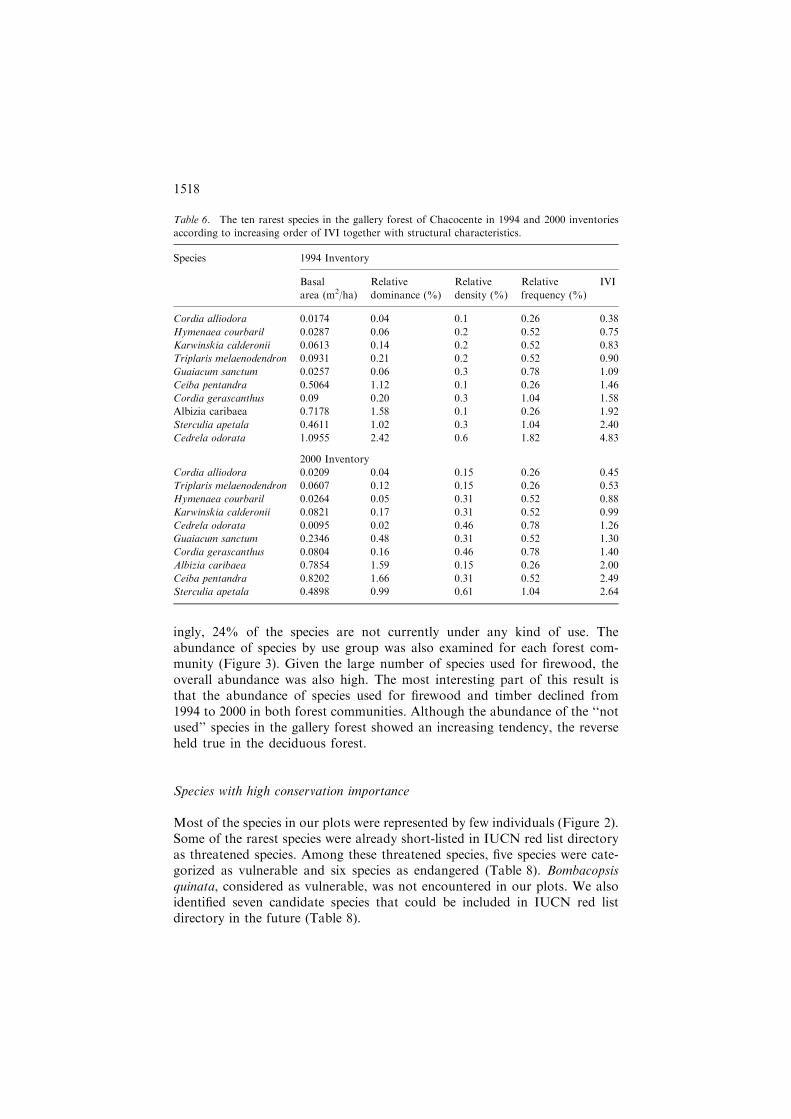
In the gallery forest, the number of families, genera and species encounteredin 1994 inventory were 33, 47 and 55, respectively while 48 genera and 58 specieswere recorded in 2000 inventory (Table 1). The total stem density (298 indi-viduals/ha) was comparatively higher in 1994 inventory than in 2000 inventorywhile the basal area was relatively larger in 2000 than in 1994 inventory. In bothinventories, Meliaceae was the most specious family with higher IFV (Table 2).Most of the important families were represented by 1 or 2 species. The mostabundant species, in terms of basal area, relative dominance, and IVI wasPithecellobium saman, followed by Trichilia hirta (Table 5). In both inventories,Cordia alliodora was the rarest species, followed by Hymenaea courbaril in the
Table 1. Summary of floristic composition and structure of trees ‡10 cm dbh in dry deciduous and
gallery forests inventoried in 1994 and 2000.
Forest types-Inventory time Families Genera Species Stem densitya Basal areab
Deciduous-94 29 49 59 451 31.5
Deciduous-00 29 49 59 489 29.0
Gallery-94 33 47 55 298 45.3
Gallery-00 33 48 58 283 49.3
astem density = Number of individuals ha�1.bbasal area (m2 ha�1).
Table 2. The ten most important families (sub-families) in the dry deciduous and gallery forests of
Chacocente in 2000 inventory according to decreasing order of family importance value (FIV).
Forest type Family Genus Species N/ha IFV
Deciduous Papilionoideae 8 10 82 58.3
Caesalpinioideae 3 5 45 29.3
Hernandiaceae 1 1 37 23.3
Mimosoideae 2 3 19 20.7
Bignoniaceae 1 1 40 19.2
Achatocarpaceae 1 1 23 14.8
Boraginaceae 1 4 13 14.0
Apocynaceae 1 1 30 12.7
Spindaceae 2 2 17 10.4
Tiliaceae 1 1 12 7.2
Gallery Miliaceae 3 4 39 40.0
Capparidaceae 1 1 14 17.6
Sapindaceae 1 1 13 17.3
Hernandaceae 1 1 7 15.5
Sterculiaceae 2 2 8 11.6
Annonaceae 2 2 15 11.4
Boraginaceae 1 4 13 14.0
Simaroubaceae 1 1 16 10.7
Apocynaceae 1 1 8 10.0
Rhamnaceae 2 2 8 8.5
1514
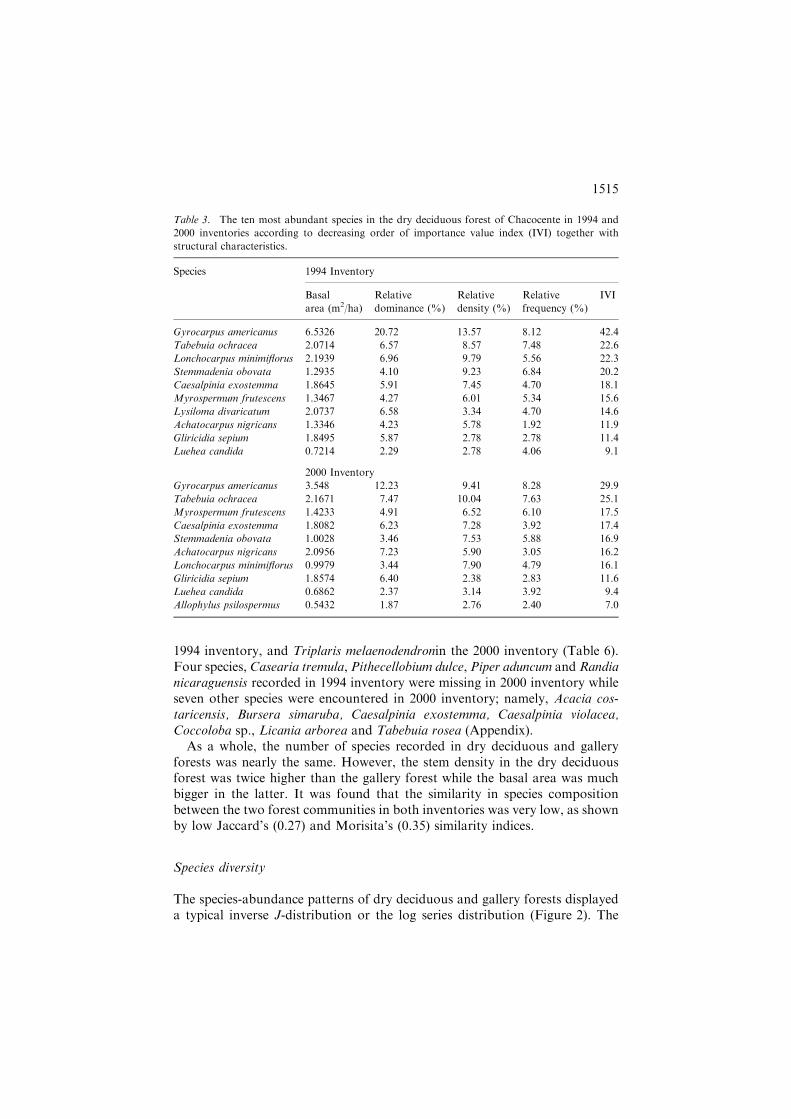
1994 inventory, and Triplaris melaenodendronin the 2000 inventory (Table 6).Four species, Casearia tremula, Pithecellobium dulce, Piper aduncum andRandianicaraguensis recorded in 1994 inventory were missing in 2000 inventory whileseven other species were encountered in 2000 inventory; namely, Acacia cos-taricensis, Bursera simaruba, Caesalpinia exostemma, Caesalpinia violacea,Coccoloba sp., Licania arborea and Tabebuia rosea (Appendix).
As a whole, the number of species recorded in dry deciduous and galleryforests was nearly the same. However, the stem density in the dry deciduousforest was twice higher than the gallery forest while the basal area was muchbigger in the latter. It was found that the similarity in species compositionbetween the two forest communities in both inventories was very low, as shownby low Jaccard’s (0.27) and Morisita’s (0.35) similarity indices.
Species diversity
The species-abundance patterns of dry deciduous and gallery forests displayeda typical inverse J-distribution or the log series distribution (Figure 2). The
Table 3. The ten most abundant species in the dry deciduous forest of Chacocente in 1994 and
2000 inventories according to decreasing order of importance value index (IVI) together with
structural characteristics.
Species 1994 Inventory
Basal
area (m2/ha)
Relative
dominance (%)
Relative
density (%)
Relative
frequency (%)
IVI
Gyrocarpus americanus 6.5326 20.72 13.57 8.12 42.4
Tabebuia ochracea 2.0714 6.57 8.57 7.48 22.6
Lonchocarpus minimiflorus 2.1939 6.96 9.79 5.56 22.3
Stemmadenia obovata 1.2935 4.10 9.23 6.84 20.2
Caesalpinia exostemma 1.8645 5.91 7.45 4.70 18.1
Myrospermum frutescens 1.3467 4.27 6.01 5.34 15.6
Lysiloma divaricatum 2.0737 6.58 3.34 4.70 14.6
Achatocarpus nigricans 1.3346 4.23 5.78 1.92 11.9
Gliricidia sepium 1.8495 5.87 2.78 2.78 11.4
Luehea candida 0.7214 2.29 2.78 4.06 9.1
2000 Inventory
Gyrocarpus americanus 3.548 12.23 9.41 8.28 29.9
Tabebuia ochracea 2.1671 7.47 10.04 7.63 25.1
Myrospermum frutescens 1.4233 4.91 6.52 6.10 17.5
Caesalpinia exostemma 1.8082 6.23 7.28 3.92 17.4
Stemmadenia obovata 1.0028 3.46 7.53 5.88 16.9
Achatocarpus nigricans 2.0956 7.23 5.90 3.05 16.2
Lonchocarpus minimiflorus 0.9979 3.44 7.90 4.79 16.1
Gliricidia sepium 1.8574 6.40 2.38 2.83 11.6
Luehea candida 0.6862 2.37 3.14 3.92 9.4
Allophylus psilospermus 0.5432 1.87 2.76 2.40 7.0
1515

majority of the species in both forest communities were represented by fewindividuals while few species in both forests were represented by many indi-viduals. In the dry deciduous forest, out of the 59 species recorded during bothinventories, 37 species were considered as rare (<4 individuals/ha), 15 speciesas intermediate (4–24 individuals/ha) and 7 species as abundant (>24 indi-viduals/ha). Of all the species recorded in the gallery forest during bothinventories, 43 species was considered as rare (<4 individuals/ha), 8 species asintermediate (4–24 individuals/ha) and 4 species as abundant (>24 individuals/ha). The various diversity measures for each forest community are presented inTable 7. Although the total number of species recorded in both forest com-munities was very close, the number of individuals in 2 ha plot was muchhigher in the dry deciduous than gallery forests. In terms of numerical speciesrichness (S/N), the two forest communities differed slightly (cf. 0.1 for galleryand 0.06 for deciduous forest). According to Margalef’s index of speciesrichness (DMg), which combines mathematically number of species (S) andnumerical species richness (S/N), the gallery forest (in 2000 inventory) wasfound to be more diverse than the dry deciduous forest. Shannon’s measure ofevenness did not differ much between and within forest communities. TheShannon–Wiener diversity index, which combines species richness and
Table 4. The ten rarest species in the dry deciduous forest of Chacocente in 1994 and 2000
inventories according to increasing order of IVI together with structural characteristics.
Species 1994 Inventory
Basal
area (m2/ha)
Relative
dominance (%)
Relative
density (%)
Relative
frequency (%)
IVI
Zanthoxylum caribaeum 0.0154 0.05 0.11 0.21 0.37
Celtis caudata 0.0305 0.10 0.11 0.21 0.42
Ficus obtusifolia 0.0366 0.12 0.11 0.21 0.44
Coursetia elliptica 0.0266 0.08 0.22 0.43 0.73
Diospyros nicaraguensis 0.0566 0.18 0.22 0.43 0.83
Dalbergia retusa 0.0137 0.04 0.44 0.64 1.12
Calycophyllum candidissimum 0.0113 0.04 0.56 1.07 1.67
Swietenia humilis 0.278 0.88 0.33 0.64 1.85
Chomelia spinosa 0.0715 0.23 0.67 1.07 1.97
Haematoxylon brasiletto 0.6026 1.91 0.56 1.07 3.54
2000 Inventory
Celtis caudata 0.0167 0.06 0.13 0.22 0.40
Zanthoxylum caribaeum 0.0191 0.07 0.13 0.22 0.41
Malpighia stevensii 0.0216 0.07 0.13 0.22 0.42
Coursetia elliptica 0.0281 0.10 0.25 0.44 0.78
Dalbergia retusa 0.0097 0.03 0.50 0.65 1.19
Chomelia spinosa 0.0216 0.07 0.63 0.87 1.57
Diospyros nicaraguensis 0.0923 0.32 0.75 0.65 1.72
Calycophyllum candidissimum 0.0113 0.04 0.63 1.09 1.76
Haematoxylon brasiletto 0.1863 0.64 0.50 0.87 2.02
Swietenia humilis 0.3244 1.12 0.50 0.87 2.49
1516

evenness into a single value, declined over time within each forest community,and identified the dry deciduous forest as more diverse than the gallery forest.The complement of Simpson’s index, which attaches more weight to theabundance of the most common species, also identified the dry deciduousforest as more diverse than the gallery forest. Fisher’s diversity index, the mostwidely recommended measure of diversity, revealed that the galley forest ismore diverse than the dry deciduous forest.
Local uses
Although we did not make a systematic ethno-botanical study, the local usesof the tree species in both forest communities were identified based oninformation gathered from the local people, expert consultation and existingliterature. Accordingly, ten major use categories were identified (Figure 3). Itwas found that the largest number of species in both forest communities (53%of the total species) was used for firewood, followed by timber extraction(35%), rural construction (27%) and charcoal production (23%). Interest-
Table 5. The ten most abundant species in the gallery forest of Chacocente in 1994 and 2000
inventories according to decreasing order of importance value index together with structural
characteristics.
Species 1994 Inventory
Basal
area (m2/ha)
Relative
dominance (%)
Relative
density (%)
Relative
frequency (%)
IVI
Pithecellobium saman 12.462 27.49 0.76 2.34 30.6
Trichilia hirta 4.2525 9.38 7.89 8.31 25.6
Thouinidium decandrum 2.9502 6.51 5.43 6.23 18.2
Simarouba glauca 1.5827 3.49 2.97 9.09 15.6
Capparis pachaca 0.8255 1.82 4.75 6.49 13.1
Gyrocarpus americanus 2.4077 5.31 2.21 4.16 11.7
Astronium graveolens 1.6976 3.74 1.87 5.97 11.6
Stemmadenia obovata 0.7411 1.63 3.99 4.16 9.8
Guarea glabra 0.9649 2.13 2.97 4.16 9.3
Trichilia moschata 0.8863 1.96 2.04 4.68 8.7
2000 Inventory
Pithecellobium saman 12.7787 25.89 1.22 2.07 29.2
Trichilia hirta 2.4232 4.91 15.29 8.55 28.8
Capparis pachaca 1.3614 2.76 13.15 7.51 23.4
Thouinidium decandrum 2.9474 5.97 9.63 6.74 22.3
Gyrocarpus americanus 4.6233 9.37 4.43 3.63 17.4
Simarouba glauca 2.01 4.08 4.89 8.29 17.3
Annona reticulata 1.3844 2.80 4.13 6.74 13.7
Astronium graveolens 2.0686 4.19 3.21 5.44 12.8
Stemmadenia obovata 0.8589 1.74 6.57 4.15 12.5
Guarea glabra 1.2341 2.50 5.35 4.40 12.3
1517
ingly, 24% of the species are not currently under any kind of use. Theabundance of species by use group was also examined for each forest com-munity (Figure 3). Given the large number of species used for firewood, theoverall abundance was also high. The most interesting part of this result isthat the abundance of species used for firewood and timber declined from1994 to 2000 in both forest communities. Although the abundance of the ‘‘notused’’ species in the gallery forest showed an increasing tendency, the reverseheld true in the deciduous forest.
Species with high conservation importance
Most of the species in our plots were represented by few individuals (Figure 2).Some of the rarest species were already short-listed in IUCN red list directoryas threatened species. Among these threatened species, five species were cate-gorized as vulnerable and six species as endangered (Table 8). Bombacopsisquinata, considered as vulnerable, was not encountered in our plots. We alsoidentified seven candidate species that could be included in IUCN red listdirectory in the future (Table 8).
Table 6. The ten rarest species in the gallery forest of Chacocente in 1994 and 2000 inventories
according to increasing order of IVI together with structural characteristics.
Species 1994 Inventory
Basal
area (m2/ha)
Relative
dominance (%)
Relative
density (%)
Relative
frequency (%)
IVI
Cordia alliodora 0.0174 0.04 0.1 0.26 0.38
Hymenaea courbaril 0.0287 0.06 0.2 0.52 0.75
Karwinskia calderonii 0.0613 0.14 0.2 0.52 0.83
Triplaris melaenodendron 0.0931 0.21 0.2 0.52 0.90
Guaiacum sanctum 0.0257 0.06 0.3 0.78 1.09
Ceiba pentandra 0.5064 1.12 0.1 0.26 1.46
Cordia gerascanthus 0.09 0.20 0.3 1.04 1.58
Albizia caribaea 0.7178 1.58 0.1 0.26 1.92
Sterculia apetala 0.4611 1.02 0.3 1.04 2.40
Cedrela odorata 1.0955 2.42 0.6 1.82 4.83
2000 Inventory
Cordia alliodora 0.0209 0.04 0.15 0.26 0.45
Triplaris melaenodendron 0.0607 0.12 0.15 0.26 0.53
Hymenaea courbaril 0.0264 0.05 0.31 0.52 0.88
Karwinskia calderonii 0.0821 0.17 0.31 0.52 0.99
Cedrela odorata 0.0095 0.02 0.46 0.78 1.26
Guaiacum sanctum 0.2346 0.48 0.31 0.52 1.30
Cordia gerascanthus 0.0804 0.16 0.46 0.78 1.40
Albizia caribaea 0.7854 1.59 0.15 0.26 2.00
Ceiba pentandra 0.8202 1.66 0.31 0.52 2.49
Sterculia apetala 0.4898 0.99 0.61 1.04 2.64
1518

Discussion
The number of families, genera and species reported in the present study lieswithin the range reported earlier in most Neotropical dry forests. For example,Gentry (1988) reported 35 families and 55 species per hectare in a gallery forestin Guanacaste, Costa Rica and Sabogal and Valerio (1998) reported onaverage 44 species per hectare in Chacocente dry deciduous forest in Nicara-gua. The most common family in the deciduous forest was Fabaceae/Papilio-noideae with 10 species, a pattern common in most Neotropical dry forests(Gentry 1988). This result also coincides with a study carried out in CentralAmerica where Fabaceae was found to be the dominant tree and shrub familyin six of seven sites studied (Gillespie et al. 2000). Gillespie et al. (2000) madean inventory in Chacocente and found the same common species as in thepresent study. However, the present study found L. minimiflorus and C. exo-stemma as common species. In tropical dry forest across the north centralYucatan, the following important natural forest species were reported: Burserasimaruba, Caesalpinia gaumeri, Gymnopodium floribundum and Piscidia piscip-ula (White and Hood 2004), which are also encountered in our study. It wasobserved that some species recorded in the first inventory (1994) were missingin the subsequent inventory (2000) while new species were encountered in thesecond inventory. Given the large number of species with 1 or 2 individuals,
Species rank
0 10 20 30 40 50
Abu
ndan
ce
0
25
50
75
100
125Deciduous-94
Species rank0 10 20 30 40 50
Abu
ndan
ce
0
25
50
75
100
125
Deciduous-00
Species rank
0 10 20 30 40
Abu
ndan
ce
0
25
50
75
100
Gallery-94
Species rank
0 10 20 30 40
Abu
ndan
ce
0
25
50
75
100Gallery-00
Figure 2. Species abundance plots for dry deciduous and gallery forests inventoried in 1994 and
2000.
1519

No. species0 10 20 30 40 50
Charcoallive fencefirewoodfodderconstructionfruitstimberornamentalcarvingsunknown
Abundance (individuals/2ha)0 50 100 150 200 250 300
Charcoallive fencefirewoodfodderconstructionfruitstimberornamentalcarvingsunknown1994
2000
Deciduous
Abundance (individuals/2ha)0 20 40 60 80 100 120 140 160
Charcoallive fencefirewoodfodderconstructionfruitstimberornamentalcarvingsunknown1994
2000
Gallery
Figure 3. Local uses of tree species and their abundance in dry deciduous and gallery forests
in Chacocente, Nicaragua.
1520

illegal cutting might have caused the disappearance of this species. However,the plausible explanation for the appearance of species in the second inventorycould be ascribed to the transition from seedling class in the 1994 inventory tohigher class (trees ‡ 10 cm dbh) in the subsequent inventory.
Tree species richness is difficult to compare for different sample sizes andgeographical variation (Murphy and Lugo 1995). Dry forest at Palo Verde onthe Pacific side of Costa Rica had approximately 52 tree species per hectare(Murphy and Lugo 1995). Lower values have been found in the drier areas andparticularly in insular forests, such as in Southwestern Puerto Rico nearGuanica where 30–50 tree species per hectare were found. Gentry (1995) re-ported an average of 65 tree species per ha in 23 Neotropical dry forests, which
Table 8. List of threatened species and suggested candidate species for future IUCN listing.
Species Status
Bombacopsis quinata Vulnerable
Cedrela odorata Vulnerable
Dalbergia retusa Vulnerable
Maclura tinctoria Vulnerable
Swietenia humilis Vulnerable
Esenbeckia litoralis Endangered
Guaiacum sanctum Endangered
Lonchocarpus minimiflorus Endangered
Lonchocarpus phlebophyllus Endangered
Platymiscium pleiostachyum Endangered
Zanthoxylum belizense Endangered
Albizia caribaea Candidate
Celtis caudate Candidate
Diospyros nicaraguensis Candidate
Hymenaea courbaril Candidate
Jacquinia aurantiaca Candidate
Manilkara achras Candidate
Phyllostylon brasiliense Candidate
Table 7. Diversity measures for trees ‡10 cm dbh in the dry deciduous and gallery forests
inventoried in 1994 and 2000 on 2 ha plots.
Diversity Measures Deciduous Gallery
1994 2000 1994 2000
No. of individuals recorded in 2 ha plots 902 979 597 566
Total number of species recorded 59 59 55 58
Rate of species increase per individual enumerated (S/N) 0.065 0.060 0.092 0.102
Margalef ’s index of species richness (DMg = (S� 1)/ln N) 8.52 8.42 8.45 8.99
Shannon’s measure of evenness (J¢ = H¢/ln S) 1.16 1.15 1.17 1.10
Shannon–Wiener’s diversity index (H¢ =�P
pi log2pi) 4.71 4.69 4.69 4.48
The reciprocal of Simpson’s index (1/D) 17.1 16.9 14.6 14.5
Fisher’s index of diversity (a = N(1� x)/x) 14.1 13.8 14.8 16.2
1521
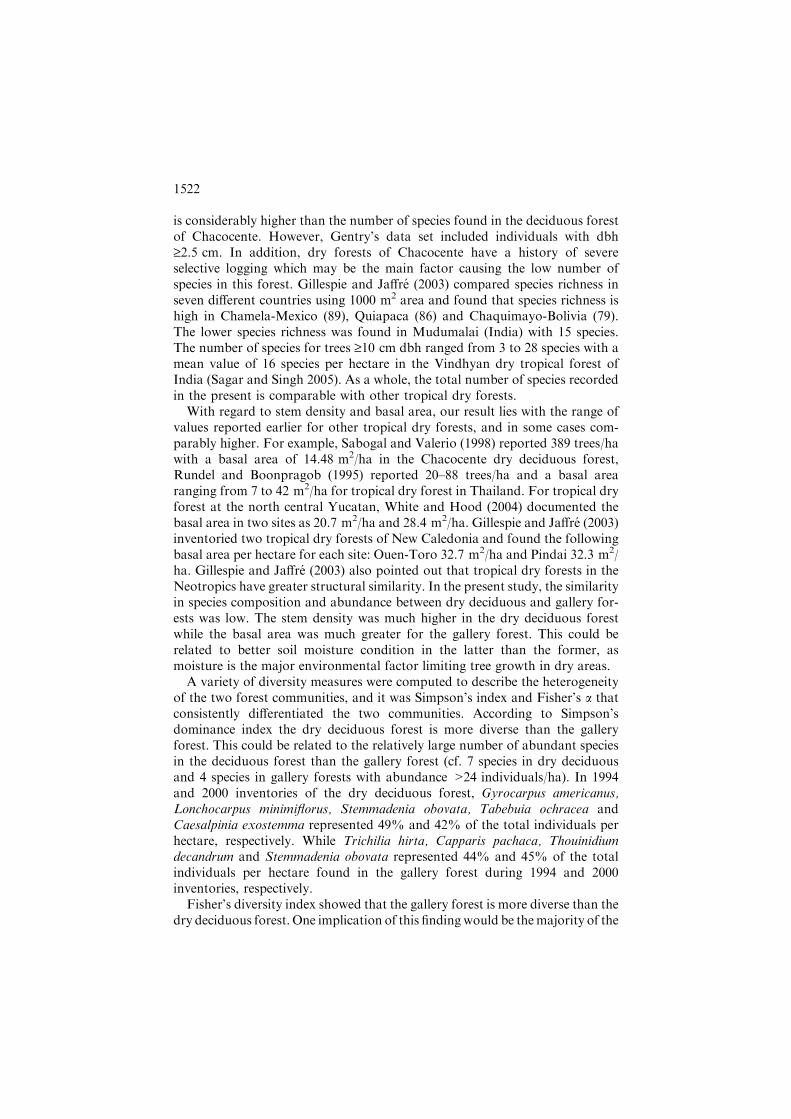
is considerably higher than the number of species found in the deciduous forestof Chacocente. However, Gentry’s data set included individuals with dbh‡2.5 cm. In addition, dry forests of Chacocente have a history of severeselective logging which may be the main factor causing the low number ofspecies in this forest. Gillespie and Jaffre (2003) compared species richness inseven different countries using 1000 m2 area and found that species richness ishigh in Chamela-Mexico (89), Quiapaca (86) and Chaquimayo-Bolivia (79).The lower species richness was found in Mudumalai (India) with 15 species.The number of species for trees ‡10 cm dbh ranged from 3 to 28 species with amean value of 16 species per hectare in the Vindhyan dry tropical forest ofIndia (Sagar and Singh 2005). As a whole, the total number of species recordedin the present is comparable with other tropical dry forests.
With regard to stem density and basal area, our result lies with the range ofvalues reported earlier for other tropical dry forests, and in some cases com-parably higher. For example, Sabogal and Valerio (1998) reported 389 trees/hawith a basal area of 14.48 m2/ha in the Chacocente dry deciduous forest,Rundel and Boonpragob (1995) reported 20–88 trees/ha and a basal arearanging from 7 to 42 m2/ha for tropical dry forest in Thailand. For tropical dryforest at the north central Yucatan, White and Hood (2004) documented thebasal area in two sites as 20.7 m2/ha and 28.4 m2/ha. Gillespie and Jaffre (2003)inventoried two tropical dry forests of New Caledonia and found the followingbasal area per hectare for each site: Ouen-Toro 32.7 m2/ha and Pindai 32.3 m2/ha. Gillespie and Jaffre (2003) also pointed out that tropical dry forests in theNeotropics have greater structural similarity. In the present study, the similarityin species composition and abundance between dry deciduous and gallery for-ests was low. The stem density was much higher in the dry deciduous forestwhile the basal area was much greater for the gallery forest. This could berelated to better soil moisture condition in the latter than the former, asmoisture is the major environmental factor limiting tree growth in dry areas.
A variety of diversity measures were computed to describe the heterogeneityof the two forest communities, and it was Simpson’s index and Fisher’s a thatconsistently differentiated the two communities. According to Simpson’sdominance index the dry deciduous forest is more diverse than the galleryforest. This could be related to the relatively large number of abundant speciesin the deciduous forest than the gallery forest (cf. 7 species in dry deciduousand 4 species in gallery forests with abundance >24 individuals/ha). In 1994and 2000 inventories of the dry deciduous forest, Gyrocarpus americanus,Lonchocarpus minimiflorus, Stemmadenia obovata, Tabebuia ochracea andCaesalpinia exostemma represented 49% and 42% of the total individuals perhectare, respectively. While Trichilia hirta, Capparis pachaca, Thouinidiumdecandrum and Stemmadenia obovata represented 44% and 45% of the totalindividuals per hectare found in the gallery forest during 1994 and 2000inventories, respectively.
Fisher’s diversity index showed that the gallery forest is more diverse than thedry deciduous forest. One implication of this findingwould be themajority of the
1522

species inventoried have irregular and clumped spatial distribution in thedeciduous forests, and therefore the gallery forest is characterized by high alphadiversity. The Shannon–Wiener diversity index is usually found to fall between1.5 and 3.5 and only rarely surpasses 5.0 (Magurran 2004). The values ofShannon–Wiener index for the deciduous and gallery forests falls within theexpected range. Gentry (1988) reported values of Shannon–Wiener diversityindex for two sites of 0.1 ha in Nicaragua; Cerro Olumo with 5.80 and Cerro ElPicacho with 5.22 (Clould forests). These values are higher than the presentstudy; however, the precipitation and altitude of these sites are higher thanChacocente. Hence, the larger diversity of these sites may be due to higherprecipitation and low temperature favoring growth and survival of more species.
Almost 50% of Nicaragua’s population lives around tropical dry forest andin spite of the partial protection of Chacocente, human pressure on theremaining forests are obvious. The result from the present study providesevidence that the abundance of species used for firewood and timber declinedfrom 1994 to 2000 in both forest communities. For example Cordia alliodora,though very common elsewhere in Nicaragua; was one of the rarest species inChacocente. Even the abundance of the ‘‘not used’’ species in the deciduousforest showed a decreasing tendency, indicating an on-going disturbance(anthropogenic and natural) in the forest reserve and loose protection of theforest reserve. It is also important to note that species with high commercialvalues, such as Swietenia humilis, Cedrela odorata, Dalbergia retusa andGuaiacum sanctum were among the rarest species in our study. Illegal loggingof commercially valuable species is still a common problem in the wholecountry. Apparently, the continuing loss of biodiversity is attributed to mainlydeforestation, as in the case of many tropical dry forests (Thiollay 2002). If thisanthropogenic disturbance is not curved as early as possible, the tree species,particularly commercial species that appear almost absent in the forest, willbecome locally extinct (e.g., Bombacopsis quinata). As both forest communitiesare characterized by many species with few individuals, active management,such as reintroduction of threatened species (Table 8) on private and com-munity lands is highly desirable to maintain viable populations. Simulta-neously, an immediate action should be taken to assist the natural regenerationprocess to restore species diversity of the remaining relics of tropical dry forestin the country. We further recommend a detailed assessment of the suggestedcandidate species for IUCN listing to determine their conservation status.
Acknowledgements
We thank Claudio Calero for his support during the fieldwork. Also he made agreat contribution with his knowledge about species uses. Thanks also to AliWater and Alvaro Noguera for their help during the fieldwork. The Ministry ofNatural Resources and Environment kindly allowed us to carry out thisresearch at Chacocente National Wildlife Refuge. The study was financed by
1523

the Swedish International Development Cooperation Agency (UNA-SLU PhDProgram). Finally, the anonymous reviewer is highly appreciated for thevaluable and constructive comments.
Appendix
Appendix. List of tree species ‡10 cm dbh recorded in 1994 and 2000 inventories in dry deciduous
and gallery forests in Chacocente Wildlife Refuge, Nicaragua together with their uses (CH –
charcoal; LF – live fence; FW – fire wood; FOD – fodder; RC – rural construction; FRU – fruit; W
– timber; P – pole; O – ornamental; HC – handicrafts and carvings).
Species Family Deciduous Gallery Uses
1994 2000 1994 2000
Acacia costaricensis Mimosoideae * * FW, CH
Achatocarpus nigricans Achatocarpaceae * * FW, RC
Adelia barbinervis Euphorbiaceae * NO
Albizia caribaea Mimosoideae * * FW, P, CH
Allophylus psilospermus Sapindaceae * * FW, CH, RC
Annona reticulata Annonaceae * * FRU
Ardisia revolute Myrsinaceae * * NO
Astronium graveolens Anacardiaceae * * * * P, W
Bixa orellana Bixaceae * * NO
Brosimum alicastrum Moraceae * * W, FW, CH, HC
Bunchosia cornifolia Malpighiaceae * * FW, RC, CH
Bursera simaruba Burseraceae * * * LF, P
Caesalpinia coriaria Caesalpinoideae * * FW
Caesalpinia exostemma Caesalpinoideae * * * NO
Caesalpinia violacea Caesalpinoideae * * * FW, LF, CH
Calycophyllum candidissimum Rubiaceae * * * * FW, CH, O
Capparis odoratissima Capparidaceae * * FW
Capparis pachaca Capparidaceae * * * * NO
Casearia corymbosa Flacourtaceae * FW
Casearia tremula Flacourtaceae * * * FW
Cecropia peltata Cecropiaceae * * NO
Cedrela odorata Meliaceae * * W, FW, HC
Ceiba pentandra Bombacaceae * * W
Celtis caudata Ulmaceae * * * * NO
Chomelia spinosa Rubiaceae * * NO
Coccoloba caracasana Polygonaceae * * NO
Coccoloba floribunda Polygonaceae * * NO
Coccoloba sp. Polygonaceae * FW
Cordia alliodora Boraginaceae * * * * P, HC, W
Cordia collococca Boraginaceae * * * * CH, HC, W
Cordia dentata Boraginaceae * * * P, LF
Cordia gerascanthus Boraginaceae * * * * CH, HC, W
Coursetia elliptica Papilionoideae * * NO
Croton niveus Euphorbiaceae * * FW
Dalbergia retusa Papilionoideae * * FW, W, FOD
1524

Appendix. Continued
Species Family Deciduous Gallery Uses
1994 2000 1994 2000
Diospyros nicaraguensis Ebenaceae * * FW, RC
Erythroxylum havanense Erythroxylaceae * * FW
Esenbeckia litoralis Rutaceae * * * * FW
Ficus obtusifolia Moraceae * O
Gliricidia sepium Papilionoideae * * FW, FOD, W
Guaiacum sanctum Zigophyllaceae * * P, HC, W
Guarea glabra Meliaceae * * CH, P, HC, W
Guazuma ulmifolia Sterculiaceae * * * * FW, CH, FOD
Gyrocarpus americanus Hernandiaceae * * * * NO
Haematoxylon brasiletto Caesalpinoideae * * FW
Hippocratea rovirosae Hippocrataceae * * W, RC
Hymenaea courbaril Caesalpinoideae * * HC, W
Inga sp. Mimosoideae * *
Jacquinia aurantiaca Theophrastaceae * * FW
Karwinskia calderonii Rhamnaceae * * * * W, RC
Licania arborea Chrysobalanaceae * W, HC
Lonchocarpus minimiflorus Papilionoideae * * FW, FOD, W
Lonchocarpus phlebophyllus Papilionoideae * * FW, CH, W
Lonchocarpus sp Papilionoideae * * NO
Luehea candida Tiliaceae * * RC, W
Luehea seemannii Tiliaceae * * FW, CH, P, W
Lysiloma divaricatum Mimosoideae * * FW, CH, RC
Lysiloma sp Mimosoideae * * FW, CH, RC
Machaerium biovulatum Papilionoideae * * FW
Maclura tinctoria Moraceae * * FW, CH, P, W
Manilkara achras Sapotaceae * * FW, P, W
Malpighia stevensii Malpighiaceae * * FW, LF
Myrospermum frutescens Papilionoideae * * * * W, RC
Pithecellobium dulce Mimosoideae * * * FW, CH
Pithecellobium saman Mimosoideae * * * FW, FOD, HC, W
Phyllostylon brasiliense Ulmaceae * * FW, CH
Piper aduncum Piperaceae * NO
Pisonia macranthocarpa Nyctaginaceae * * NO
Platymiscium pleiostachyum Papilionoideae * * FW
Pterocarpus rohrii Papilionoideae * * FW, LF, W
Randia armata Rubiaceae * * FW
Randia cookii Rubiaceae * * FW
Randia nicaraguensis Rubiaceae * FW
Sapranthus nicaraguensis Annonaceae * * * * NO
Senna atomaria Caesalpinoideae * * * * FW, CH
Simarouba glauca Simaroubaceae * * W, CH
Spondias purpurea Anacardiaceae * * * * NO
Spondias sp. Anacardiaceae * * NO
Stemmadenia obovata Apocynaceae * * * * FW
Sterculia apetala Sterculiaceae * * FW
Swietenia humilis Meliaceae * * W, CH, HC
1525

References
Anonymous 2002. Plan de manejo del refugio de vida silvestre Rıo Escalante- Chacocente. Min-
isterio de Recursos Naturales y del Ambiente. Ramboll/Posaf. Managua, Nicaragua.
Duque A. and Cavelier J. 2003. Strategies of tree occupation at a local scale in terra firme forests in
the Colombian Amazon. Biotropica 35: 20–27.
Gentry A.H. 1988. Changes in plant community diversity and floristic composition on environ-
mental and geographical gradients. Ann. Missouri Bot. Garden 75: 1–34.
Gentry A.H. 1995. Diversity and floristic composition of Neotropical dry forest. In: Bullock S.H.,
Mooney H.A. and Medina E (eds), Seasonally Dry Tropical Forests. Cambridge University
Press, Cambridge, UK, pp. 9–34.
Gerhardt K. 1994. Seedling Development of Four Tree Species in Secondary Tropical Dry Forest
in Guanacaste, Costa Rica. PhD thesis, Uppsala, Sweden.
Gillespie T.W., Grijalva A. and Farris C.N. 2000. Diversity, composition, and structure of tropical
dry forests in Central America. Plant Ecol. 147: 37–47.
Gillespie T.W. and Jaffre T. 2003. Tropical dry forests in New Caledonia. Biodiv. Conserv. 12:
1687–1697.
Harcourt C.S. and Sayer J.A. 1996. The Conservation Atlas of Tropical Forest. The Americas,
Simon & Schuster.
IUCN. 2004. 2004 IUCN Red List of Threatened Species. www.iucnredlist.org. Downloaded on 14
December 2004. International Union for Conservation of Nature and Natural Resources,
Cambridge, UK.
Janzen D. 1988. Management of habitat fragments in a tropical dry forest: growth. Ann. Missouri
Bot. Garden 75: 105–116.
Krebs C.J. 1999. Ecology Methodology. 2nd ed. Addison-Wesley Educational Publishers. Inc.
Lamprecht H. 1989. Silviculture in the Tropics: Tropical Forest Ecosystems and their Tree Species.
GTZ, Eschborn.
Magurran A.E. 2004. Measuring Biological Diversity. Blackwell Publishing, Malden, Oxford and
Victoria.
Murphy P.G. and Lugo A.E. 1986. Ecology of tropical dry forest. Ann. Rev. Ecol. Syst. 17: 67–88.
Appendix. Continued
Species Family Deciduous Gallery Uses
1994 2000 1994 2000
Tabebuia ochracea Bignonaceae * * * * FW, LF, W
Tabebuia rosea Bignonaceae * FW, LF, W
Terminalia oblonga Combretaceae * * FW, HC, W
Tetrorchidium rotundatum Euphorbiaceae * * NO
Thouinidium decandrum Sapindaceae * * * * FW, CH, HC
Trema micrantha Ulmaceae * FW, CH, P
Trichilia hirta Meliaceae * * * W, FW
Trichilia moschata Meliaceae * * * * P, W
Triplaris melaenodendron Polygonaceae * * P, LF
Ximenia americana Olacaceae * * * * NO
Zanthoxylum belizense Rutaceae * * W, RC
Zanthoxylum caribaeum Rutaceae * * * * NO
Ziziphus guatemalensis Rhamnaceae * * W, FW, P
Zuelania guidonia Flacourtiaceae * * NO
1526

Murphy P.G and Lugo A.E. 1995. Dry forest of Central America and the Caribbean. In: Bullock
S.H., Mooney H.A and Medina E (eds), Seasonally Dry Tropical Forests. Cambridge University
Press, Cambridge, England, pp. 9–34.
Roldan H. 2001. Recursos forestales y cambio en el uso de la tierra, Republica de Nicaragua.
Santiago, Chile.
Rundel P.W. and Boonpragob K. 1995. Dry forest of Central America and the Caribbean. In:
Bullock S.H., Mooney H.A. and Medina E (eds), Seasonally Dry Tropical Forests. Cambridge
University Press, Cambridge, England, pp. 93–119.
Sabogal C. 1992. Regeneracion de bosques secos naturales en Centro America, con ejemplos de
Nicaragua. J. Veget. Sci. 3: 407–416.
Sabogal C. and Valerio L. 1998. Forest Composition, Structure and Regeneration in a dry forest of
the Nicaraguan Pacific Coast. In: Dallmeier F and Comiskey J.A. (eds), Forest Biodiversity in
North Central and South America, and the Caribbean: Research and Monitoring. Man and The
Biosphere Series, Vol. 21. UNESCO, New York pp.187–212.
Sagar R. and Singh J.S. 2005. Structure, diversity, and regeneration of tropical dry deciduous forest
of northern India. Biodiv. Conserv. 14: 935–959.
Salas J.B. 1993. Arboles de Nicaragua. Instituto Nicaraguense de Recursos Naturales y del Am-
biente. Servicio Forestal Nacional., Managua, Nicaragua.
Segura O., Kaimowitz D. and Rodrıguez J. 1997. Polıticas forestales en Centro America: Analisis
de las restricciones para el desarrollo del sector forestal. IICA-Holanda/LADERAS.
Stevens W.D., Ulloa C.U., Pool A. and Montiel O.M. 2001. Flora de Nicaragua. Missouri
Botanical Garden Press.
Tercero M.G. and Urrutia G.S. 1994. Caracterizacion florıstica y estructural del bosque de galerıa
en Chacocente, Carazo, Nicaragua. Trabajo de diploma. Universidad Nacional Agraria,
Managua, Nicaragua.
Thiollay J.M. 2002. Forest ecosystems: threats, sustainable use and biodiversity conservation.
Biodiv. Conserv. 11: 943–946.
White D.A. and Hood C.S. 2004. Vegetation patterns and environmental gradients in tropical dry
forests of the northern Yucatan Peninsula. J. Veget. Sci. 15: 151–160.
1527