
Verification of Anchoring in Foundations of Wind Turbine Towers

Wind Turbine MeasurementTechnique—an Open Laboratory forEducational PurposesKnud Ole Helgesen Pedersen*, Ørsted, Technical University of Denmark (DTU), 2800 Lyngby,DenmarkKurt S. Hansen, Department of Mechanical Engineering, MEK, DTU, DK-2800 Lyngby, DenmarkUwe Schmidt Paulsen and Poul Sørensen, Wind Energy Department, Risø, DTU, DK-4000 Roskilde,Denmark
As part of the International Master of Science Programme in Wind Energy at the TechnicalUniversity of Denmark (DTU), a complete interactive wind turbine measurement laboratory(WTMLAB) was developed. A 500 kW stall regulated wind turbine was instrumented withsensors for recording (i) turbine operational parameters, (ii) meteorological conditions, (iii)electrical quantities and (iv) mechanical loads. The data acquisition system was PC based,and it was combined with a MySQL® database for data management. The system enabledonline access for real-time recordings, which were used both for demonstration purposes,for individual student exercises and for scientific investigations. The automatic data acqui-sition system furthermore enabled recording of extreme and fatigue loads together with along-term event registration. Long-term registration of wind turbine loads resulted in aunique database of non-commercial time series, which would be available for practicingfatigue calculations and extreme load estimation in basic wind turbine courses. Powerquality analysis was carried out based on high-speed-sampled, three-phase voltage andcurrent signals. The wide spectrum of sensors enabled a detailed study of the correlationbetween meteorological, mechanical and electrical quantities. Measurements wererecorded with a PC placed at the wind turbine site at Risø. The PC could be remotely con-trolled from DTU, which gave the students the opportunity to work on an operating windturbine. The WTMLAB was included in a new course entitled Wind Turbine MeasurementTechniques. Copyright © 2007 John Wiley & Sons, Ltd.
Received 21 July 2006; Revised 8 August 2007; Accepted 8 August 2007
WIND ENERGYWind Energ. 2008; 11:281–295Published online 26 September 2007 in Wiley Interscience (www.interscience.wiley.com) DOI: 10.1002/we.248
Copyright © 2007 John Wiley & Sons, Ltd.
BroaderPerspectives
* Correspondence to: K. Ole Helgesen Pedersen, Ørsted, Technical University of Denmark (DTU), 2800 Lyngby, Denmark.E-mail: [email protected]
IntroductionTo maintain the growth in the wind turbine industry, which has taken place during the last 15–20 years, the industry and research institutions require an increasing number of engineers. Since Denmark has been aleader in education, research, design, construction and manufacturing of wind turbines, the Technical Univer-sity of Denmark (DTU) has implemented a wind energy teaching programme to educate highly qualified students.
Key words:wind turbine;education;instrumentation; data acquisition; data management;load analysis; power quality

The wind energy teaching programme focuses on skills, which qualifies for employment in the internationalwind energy sector, e.g. developers, wind turbine manufacturers, utilities and research institutions. The mainpart of courses offered in this programme is standard courses, and as part of the programme, a dedicated windturbine measurement technique course has been formulated, which enables the students to design, implementand operate a complete measurement system on a wind turbine. Furthermore, the aim is to present and quan-tify the different standards used for documenting the behaviour of a wind turbine, e.g. power curve determi-nation, reporting of structural loads and electrical quantities. The students will be practising the acquiredknowledge both during exercises in the laboratory and on our online wind turbine measurement laboratory(WTMLAB), which is implemented on a commercial, operating 500kW wind turbine.
The wind turbine is equipped with a data acquisition system for recording meteorological properties (wind,wind direction, temperature, atmospheric pressure and rain), wind turbine operational properties (electricpower, nacelle position, rotor speed, rotor position, status signals) and structural loads in terms of strain gaugemeasurements from the blade root, the main shaft, tower top and tower bottom. The data are stored in a data-base, where the selected data are accessible through WindData.com, which is hosted at DTU.
WTMLAB is used for the development of new data acquisition hardware, software, hands-on wind turbineoperation, development of new test procedures and algorithms in collaboration with other universities.
Course ContentThe objective is to enable the students to measure and report on power curve, electrical properties and struc-tural loads for a grid connected wind turbine according to the current standards. The obtained knowledge ispractised on an instrumented 500kW grid connected wind turbine.
The lectures focus on the theory and methods for experimental determination of wind characteristics, powerperformance and mechanical loads together with assessment of electric power quality and noise emission. Thefollowing topics are considered:
• presentation of International Electrotechnical Commission (IEC) standards for wind turbine testing;• presentation of the wind turbine components and their mechanical and electrical properties;• description of instrumentation involved in the testing—ranging from sensors, measurements chain, data
acquisition, database management and data analysis;• discussion of sensor technology, accuracy and calibration with special attention given to the anemometer,
the strain gauge and voltage/current transducers;• design and implementation of a complete data acquisition system.
The lectures are combined with dedicated exercises founded in the calibration of sensors, sensor installationand analysis of real-time wind turbine measurements.
Wind Turbine DescriptionThe test wind turbine, which is located at Risø Campus, Roskilde, is a traditional Danish three-bladed stallregulated Nordtank, NTK 500/41 wind turbine—see specifications in Table I. The turbine is primarily used forenergy production and it is serviced on commercial conditions. The wind turbine is located on the formerDanish test site for wind turbines, which has a free undisturbed inflow from the dominant western wind sector.
The turbine was installed in 1992 and has since then been subject to many tests and investigations accord-ing to references.1–6
Furthermore, a frequency converter system has been designed and implemented, which enables an opera-tion with variable grid frequency, but this feature has not yet been utilized in the course.
The wind turbine is connected to a local 0.4kV grid, designed for test of smaller wind turbines. The 0.4kVis supplied from the public 10kV grid through a 1000kVA, 10.0/0.4kV transformer that is presently sharedbetween the 500kW Nordtank wind turbine and other smaller wind turbines.
282 K. Ole Helgesen Pedersen et al.
Copyright © 2007 John Wiley & Sons, Ltd. Wind Energ 2008; 11:281–295DOI: 10.1002/we

The Nordtank wind turbine is rated to 0.69kV, and therefore an additional 800kVA, 0.4/0.69kV transformeris installed to increase the voltage. The principal electric connection diagram is shown in Figure 1.
InstrumentationThe idea of establishing WTMLAB is to enable the students to explore experimentally the mechanical con-version of wind power to electric power on an operating wind turbine, with focus on four main areas:
Wind Turbine Measurement Technique 283
Copyright © 2007 John Wiley & Sons, Ltd. Wind Energ 2008; 11:281–295DOI: 10.1002/we
Gearbox
500 kWinductiongenerator
Maincircuitbreaker
Capacitor bank
0.69/0.4transfo
Softstarter
Bypasscontactor
0.4/10.4transfo
10 kV
100 kWTellus
wind turbine
Measurementpoint
Grid
400 V
690 V
Figure 1. Connection diagram of 500kW Nordtank in Risø
Table I. Nordtank NTK 500/41 specifications—in October 2005
Identification no. 92–500Rotor diameter 41·1mSwept area 1320m2
Rotational speed 27·1 rpmMeasured tip angle −0·2 ± 0·2°Blade type LM 19·1Blade profile(s) NACA 63-4xx and NACA FF-W3, equipped with vortex generatorsBlade length 19·04mBlade chord 0·265–1·630mBlade twist 0·02–20·00°Air brakes Pivotable blade tips, operated in FS* modeMechanical brake High speed shaft, operated in FS* modePower regulation Passive aerodynamic stallGearbox Flender, ratio 1·0:55·35Generator 500kW, four poles, 690VTower Conical steel tube, h = 33·8mHub height 36·0mTilt 2°Coning 0°Masses
Blade weight 1960kgRotor including hub 9030kgTower head mass 24,430kgTower mass 22,500kg
* Fixed speed mode (FS)

• meteorological measurements to describe the inflow;• structural measurements to analyse the dynamic response;• control and power measurements to study the long-term operational behaviour;• electrical measurements to examine the interaction between wind turbine and the electrical grid.
A meteorological mast is placed 2.5 rotor diameters in westerly direction from the wind turbine. The mastis equipped for measurement of wind speed at hub height, wind direction, air temperature, air barometric pres-sure and air humidity. The installation is made in accordance with the recent IEC recommendations for bothpower performance and structural load measurements.7
The structural loads are monitored by strain gauges mounted at the blade root, on the main shaft, at thetower top and at the tower bottom. The instrumented locations are detailed below.
BladeThe load signals from the reference blade include bending moments at the blade root, measured by straingauges mounted on the blade root steel extenders, as shown in Figure 2. Installation of gauges enables mea-surements of both flapwise and edgewise bending moments in a rotating reference system. During autumn2005, the installation of strain gauges has been improved furthermore with strain gauges on all three blades,both for measuring flapwise and edgewise bending moments in the blade root.
RotorThe load measurement on the main shaft includes torque and two bending moments at a position behind thehub/main shaft flange—in a rotating reference system, as shown in Figure 3. The gauge location enables mea-surements of bending moments in two directions, perpendicular to each other in a rotating reference system.The two bending moments combined with the rotor position are used to determine the rotor bending momentsin yaw and tilt direction—in a nacelle reference system.
TowerThe tower loads include torque at the tower top and bending moments in two directions at the tower bottom,as shown in Figure 4 in a (fixed) tower reference system.
Various sensors are installed to monitor the operational conditions of the wind turbine. The position of thenacelle, the wind direction and the wind speed on top of the nacelle are measured. Pulses from sensors placedon the fast rotating generator shaft and on the slow rotating main shaft are used to determine the rotationalspeeds and the position of the rotor. Electric power production is derived by a dedicated instrument. Finally,status information on tip brake, shaft brake and grid connection are registered.
284 K. Ole Helgesen Pedersen et al.
Copyright © 2007 John Wiley & Sons, Ltd. Wind Energ 2008; 11:281–295DOI: 10.1002/we
Strain gauges locationon blade root (extender section)
hub
(blade Centre of Gravity (CG))
6.28 m1.24 m
Figure 2. Structural load measurements in the blade root at radius 1.24m

Most of the sensors and transmitters have been used for many years at Risø National Laboratory in fieldexperiments, and they have a documented high precision and a good reliability; especially the Risø cupanemometer has demonstrated noteworthy performance.*
The three-phase voltages and the three phase-to-ground currents at the 690V level at the generator termi-nals are measured by conventional measurement transformers.
Wind Turbine Measurement Technique 285
Copyright © 2007 John Wiley & Sons, Ltd. Wind Energ 2008; 11:281–295DOI: 10.1002/we
*See specific details on http://www.cupanemometer.com/.
Strain gauges locationon main shaft (torque & 2 x bending
moments)
0.16 m
HUB CG
bearings
rotor speed, low speed shaft& rotor position
gearbox
0.75 m
generator
rotor speed, high speed shaft
Figure 3. Structural load measurements on the main shaft
Online View
Strain gauges location2 x bending moments
3.5 m
Strain gauges location (torsion)
Figure 4. Structural load measurements on the welded tubular steel tower

Sensor Principles and Calibration of SignalsBasic Installation of Strain GaugesLoad measurements on the blade, the rotor and the tower are obtained by active strain gauges arranged in aWheatstone Bridge (WSB). The WSB signal is magnified by means of an integrated completions circuit, withapplicable gains within 50–10,000.
Installation in the field requires trained and skilled personnel. This task was carried out by experienced Risøstrain gauge technicians.
Calibration of Bending Moments of Blades and Main ShaftCalibration of the strain gauge instrumentations is performed on site. The gravity load due to the rotor can beused to calibrate the bending moments of the rotor and main shaft. Turning the rotor slowly during low windresults in a cyclic bending moment, and since the loads are well determined, a sensitivity of kNm per unit ofvolts (gain) can be established. Examples of such calibration measurements are shown below in Figure 5 forthe edgewise bending moment at the blade and in Figure 6 for the bending moments at the main shaft in twodirections perpendicular to each other.
Although the strain gauges on the main shaft are mounted perpendicular to each other, the mounting alwaysresults in small imperfections, which directs the students’ attention to the importance of a perfect installation.
In each case, the strain gauge instrumentation offset is taken as the geometric mean of the moment duringone revolution.
Calibration of Main Shaft TorqueThe main shaft torque measurement is carried out with 2 × 2 perpendicular mounted (V form) strain gauges8,9
on the surface in the main shaft direction. The geometry of the main shaft section with the strain gauge is quitecomplex for a direct calculation of the output. Thus, the sensitivity has to be established either by correlatingthe sensor signals with the mechanical shaft torque produced by the wind turbine itself (derived from rotorspeed and electrical power and compensated for transmission losses) or by alternatively correlating with anexternal applied torque parallel with the shaft orientation.
Figure 7 shows the main shaft torque during one revolution of idling. The torque varies ±1kNm, which isdue to a small misalignment of the strain gauges on the main shaft.
Calibration of Tower LoadsThe instrumentation for tower bending and tower torsion is identical to the instrumentation for blade bendingand main shaft torque, respectively. The calibration of the tower loads is carried out by calculation of the
286 K. Ole Helgesen Pedersen et al.
Copyright © 2007 John Wiley & Sons, Ltd. Wind Energ 2008; 11:281–295DOI: 10.1002/we
0 30 60 90 120 150 180 210 240 270 300 330 360
-100
-50
0
50
100
Rotor position - degEd
gew
ise
ben
din
g m
om
ent;
Mx1
2 -
kNm Nordtank - 10/2-2006 kl. 9:10
Figure 5. Edgewise bending moment during idling at low winds—bin averaged

bending and torsion sensitivity of the slight conical, circular tower tube annulus. This technique is applicablebecause the geometry of the tower is well defined, simple and suitable for engineering calculus of strain andload. The zero points of the tower bending and torsion were found by yawing the turbine at 360° during lowwinds.
Calibration of Cup AnemometerThe wind speed-sensing device (the cup anemometer) has been calibrated in a wind tunnel facility, in order tostate the sensitivity of the device in metre per second per unit change of frequency (gain), and to provide the
Wind Turbine Measurement Technique 287
Copyright © 2007 John Wiley & Sons, Ltd. Wind Energ 2008; 11:281–295DOI: 10.1002/we
0 30 60 90 120 150 180 210 240 270 300 330 360-80
-60
-40
-20
0
20
40
60
80S
haf
t b
end
ing
; M
yNR
- k
Nm
Nordtank - 10/2-2006 kl. 9:10
MyNR
0 30 60 90 120 150 180 210 240 270 300 330 360-80
-60
-40
-20
0
20
40
60
80
Rotor position - deg
Sh
aft
ben
din
g;
MzN
R -
kN
m
MzNR
Figure 6. Shaft bending moments during idling at low winds—bin averaged
0 30 60 90 120 150 180 210 240 270 300 330 360-2
-1.5
-1
-0.5
0
0.5
1Nordtank - 10/2-2006 kl. 9:10
Sh
aft
torq
ue;
MxN
R -
kN
m
Rotor position - deg
Figure 7. Bin-averaged main shaft torque during idling at low winds

threshold speed in metre per second, where the rotor starts to rotate (offset). The cup anemometer calibrationresult is obtainable from the wind tunnel calibrating facility in accordance with the laboratory’s accreditationpolicy and capability.
Calibration of Measurement ChainSignal lines from the sensors/transducers to the central measurement computer are calibrated separately. In-house reference calibration standard signals (cycles, voltage or current) have been used. These calibrators areon a regular basis calibrated at national accredited laboratories conforming with regulations according to theInternational Standard ISO 17025:2005.10
To determine the sensitivity of the WSB, the gauges in the circuit are one by one substituted with a shuntresistance and a resistive distortion in steps is carried out.
Data AcquisitionA PC-based data acquisition system has been designed to monitor and collect data from the wind turbinesensors—see Figure 8.
The output signals from all sensors are conditioned to the +/−5V range. The signals are either continuouslyvarying (strain gauges, temperature . . .), of digital types such as train of pulses (rotational speed, anemome-ter . . .) or on/off levels (status signals for brake, blade tips and generator modes). All signals—except outputsfrom voltage and current transformers—are connected to one of three RISØ P2558A data acquisition units(DAU), each of which provides 16 analogue input channels and six general-purpose digital input channels.11
The analogue inputs are converted into 16-bit quantities and assembled in a binary telegram, which is trans-mitted to the PC over a RS232 serial channel. The sampling rate at the DAUs is set to 35Hz so new telegramsare created and sent 35 times per second per channel.
One DAU is installed in the bottom of the wind turbine tower, another in the nacelle, and the last one ismounted on the hub—it is rotating and transmitting data over a Radio Frequency (RF) link.
The 35Hz scan rate is high when considering meteorological conditions, appropriate for mechanical phe-nomena, but it is far too slow when studying the impact of the wind turbine on the power grid. Thus, anotherpart of the acquisition system works at a much higher sampling rate (12.8kHz) on transducer signals from thethree-phase voltages and currents at the 0.69kV generator terminals—see Figure 1. The signals are fed to a
288 K. Ole Helgesen Pedersen et al.
Copyright © 2007 John Wiley & Sons, Ltd. Wind Energ 2008; 11:281–295DOI: 10.1002/we
Sensors
DAU1
DAU2
DAU3
COMPorts
ADC NETOPHost
PC
LabVIEW
Data Acquisition:
LabVIEWServer
DISK
10 min Records10 min Statistics
+/-5VSignals
Sample&HoldIsolation
Serial RS232Channels
AnalogueChannels
Internet DTU
Figure 8. Structure of data acquisition system
signal-conditioning interface that performs sample and hold operation, scales down the signals to the ±5Vlevel and delivers the conditioned signals to a 12-bit multi-channel Analog-to-Digital Conversion (ADC) plug-in board in the PC.
The data acquisition system is built up around a standard desktop PC. The PC is connected to the Internetand thereby to DTU from where it can be operated remotely. Unfortunately, due to firewalls and of securityreasons, access is restricted to a limited number of IP addresses.
An important aspect of WTMLAB is that the students obtain access to a real wind turbine, which is welldocumented in all possible operational situations. The students have visited the wind turbine; they even haveclimbed the nacelle so they have a feeling of the wind turbine, the location and size of components and thesurrounding terrain. Besides being a test facility, the wind turbine works as production unit creating revenuefor Risø, so most of the time, it is running on normal, commercial basis.
To build up complete documentation of the wind turbine behaviour, data acquisition is carried out constantly.Dedicated measurement software has been developed under LabVIEW®. The data streams received on theserial channels from the DAUs are read, error checked, and the measured values are derived from the datatelegrams. Data are assembled in 10min time series, and statistics such as mean, standard deviation, maximumand minimum values are calculated. The whole time series and the statistics—with a time stamp added—arestored on disc in ASCII format.
The electric power signals are treated differently due to the fast sampling rate. The idea is to aggregate powerquality parameters over 10min intervals—synchronous with the DAU intervals—so atmospheric, mechanicaland electrical behaviour directly can be correlated.
Another benefit of WTMLAB is that the students are able to develop data acquisition programmes of theirown, upload the programmes to the PC at Risø and perform test directly on an operating wind turbine. In addi-tion, due to the built-in server in LabVIEW, the measurement application can be monitored and controlledacross the Web.
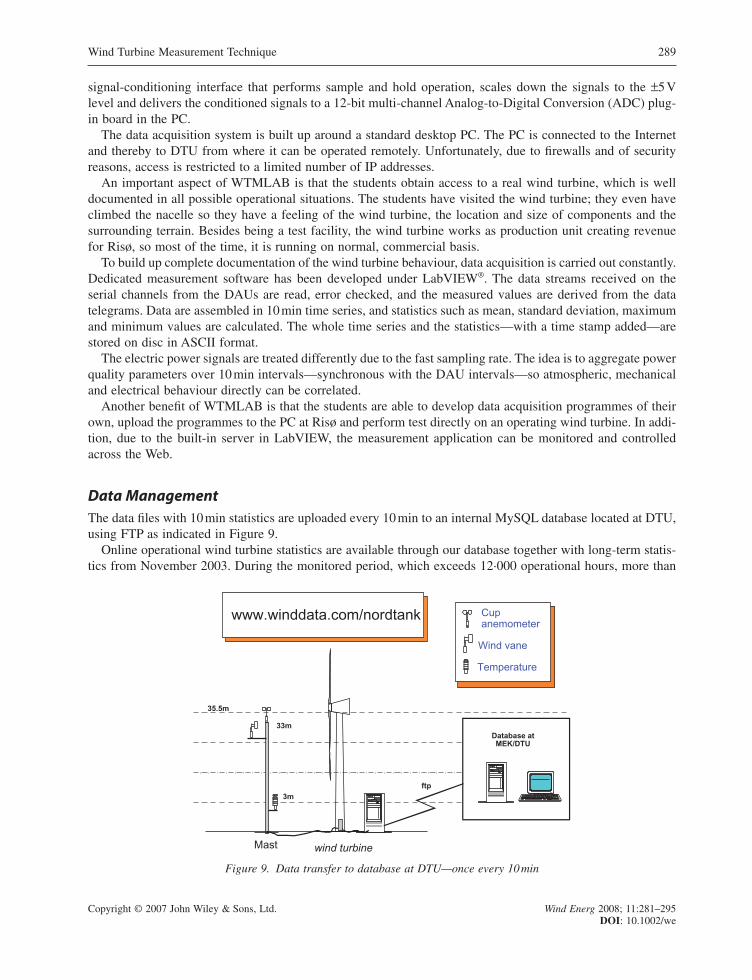
Data ManagementThe data files with 10min statistics are uploaded every 10min to an internal MySQL database located at DTU,using FTP as indicated in Figure 9.
Online operational wind turbine statistics are available through our database together with long-term statis-tics from November 2003. During the monitored period, which exceeds 12·000 operational hours, more than
Wind Turbine Measurement Technique 289
Copyright © 2007 John Wiley & Sons, Ltd. Wind Energ 2008; 11:281–295DOI: 10.1002/we
35.5m
www.winddata.com/nordtank
Temperature
ftp3m
Cup anemometer
Wind vane
wind turbineMast
Database atMEK/DTU
33m
Figure 9. Data transfer to database at DTU—once every 10min

1.1GWh of energy has been produced and more than 8·000 start/stop sequences has taken place together withdifferent types of events, e.g. emergency stops.
The structure of the Nordtank database, which is outlined in Figure 10, enables an easy data access fromstandard software packages like MATLAB® through SQL. Different measurement types are separated in different tables, but with a unique reference. The students can directly access the database and in that way,realistic exercises can be shaped.
A quality parameter is associated with each channel according to the definitions given in Table II.For example, determination of power curve requires that all signals (wind speed, wind direction, tempera-
ture, pressure and electric power) are of high quality (=1), and it is important to validate the quality with regularintervals for all channels.
As seen in Figure 10, an operational mode has been determined for each 10min period. The possible windturbine operational modes are defined in Table III.
The different wind turbine mode enables an easy selection of applicable time series for specific investiga-tions.
In Figure 10, ‘1S’ is a new addition and it is an exception to the other tables since it contains 1 s mean valuesof selected channels such as wind speed, power and rotor revolutions. Such data are well suited for studies ofthe grid impact.
Besides the 10min statistics, also entire time series (35Hz) with wind and structural load measurements areuploaded to DTU every night—totally 150MB day−1. Selected series are inserted in the database Wind-Data.com, where they have been indexed and made searchable for the student exercises. Software tools havebeen developed to organize the time series (temporary) in the databases, which enables online plots and analy-sis with MATLAB.
290 K. Ole Helgesen Pedersen et al.
Copyright © 2007 John Wiley & Sons, Ltd. Wind Energ 2008; 11:281–295DOI: 10.1002/we
LOADSWind turbine structural loads
(mean, stdv, min, max &quality)
DIRSWind direction measurements
(mean, stdv, min, max &quality)
RUNSLogging info, time stamps
CHANNELSDefinitions
ADDSAtm. pressure and rain
measurements (mean, stdv,min, max & quality)
1S1 Hz mean values of power
and wind speed
TEMPSTemperature measurement
(mean, stdv, min, max &quality)
SPEEDSWind speed measurements(mean, stdv, min, max, ti &
quality)OPERATION
Wind turbine operationalparameters eq. rotor speed
(mean, stdv, min, max &quality)
POWERElectrical power (mean, stdv,
min, max & quality)
STATUSWind turbine status
parameters (mean, stdv, min,max & quality)
MODEWind turbine operational
mode (mean)
Figure 10. Structure of the Nordtank database

Wind Turbine EventsA number of illustrative wind turbine events have been logged and identified during the recent 1.5 years. Asan example, one major event was caused by a failure of the generator during operation at rated power (∼500kW)—see Figure 11. The accident required a repair of the generator before restart of the wind turbine. Theevent demonstrates how an emergency stop sequence activates both tip brakes and the mechanical brake andhow the wind turbine handles a rotor over-speed situation. Furthermore, the gearbox is heavily loaded due tothe reversing torque in the main shaft during the stop sequence.
Course ExercisesParallel to the lectures, a number of exercises are carried out to give the students hands-on experiences in mea-surement techniques and data analysis. The following topics are considered:
• Visit to wind turbine in order to document location of major components, nacelle arrangement, sensor instal-lations and the surrounding obstacles and terrain.
• Calculate power curve and annual energy production (AEP). The power curve is based on wind power mea-surements from a free, undisturbed wind sector taking into account the air density correction—according tothe guideline given in the International Standard IEC 61400-12-1.12 The AEP is estimated with respect to theactual wind turbine location.
• Develop a real-time data acquisition programme in LabVIEW. First, 35Hz data from one of the DAU unitsare measured, and the relations between wind speed, power production and structural loads are considered.Secondly, the three-phase voltages and currents are measured at 12.8kHz, and electrical quantities such asactive and reactive power, harmonic content, etc. are derived. The programme is uploaded to the wind turbinesite and tested in real life.
• Introduction to cup anemometer dynamics and calibration of a cup anemometer in a wind tunnel.
Wind Turbine Measurement Technique 291
Copyright © 2007 John Wiley & Sons, Ltd. Wind Energ 2008; 11:281–295DOI: 10.1002/we
Table II. Definition of signal quality parameter
qa = 0 Measurement is not validatedqa = 1 Measurement is validated and okqa = 2 Measurement is validated and ok, but with spikesqa = 3 Measurement is validated and ok, but with dropouts or constant
periodsqa = 9 Measurement is faulty
Table III. Wind turbine operational modes
Mode Description0 Not validated1 Parking (at low wind, no brakes applied)2 Idling 100% (V < cut_in)3 Power production, grid connected 100%4 Stop sequence (prod >> idling)5 Start seq. normal (idling >> prod)6 Turbine stopped, brakes applied7 Emergency stop sequence (V > cut_in wind speed)8 Stop at high winds, V > cut_out speed9 Start sequence (V > cut_in wind speed)10 Combined start/prod/stop sequence at cut_out speed

292 K. Ole Helgesen Pedersen et al.
Copyright © 2007 John Wiley & Sons, Ltd. Wind Energ 2008; 11:281–295DOI: 10.1002/we
570 575 580 585 590 59510
15
20Nordtank - 13/2-2005 23:0
WS
36 -
m/s
570 575 580 585 590 595-1000
-500
0
500
1000
Pow
er -
kW
570 575 580 585 590 595-200
0
200
400
600
Tor
que
- kN
m
570 575 580 585 590 5950
500
1000
1500
2000
Gen
erat
or s
peed
- r
pm
570 575 580 585 590 5950
100
200
300
400
roto
r po
sitio
n -
deg
Seconds
Figure 11. Example of emergency stop after generator failure

• Introduction to strain gauge technique combined with exercise on strain gauge installations at a test benchin the laboratory to- determine the amplification of strain gauge signals;- validate force measurements;- calculate wind turbine structural loads transferred to a fixed reference system, e.g. tilt and yaw moments.
• Perform various analyses of the wind turbine structural loads such as evaluation of- structural frequencies for blade, transmission and tower;- mean structural loads as function of wind speed;- 1 s equivalent fatigue loads for structural blade loads, main shaft loads and tower loads for three represen-
tative Wöhler curve exponents.
Student’s ProjectsAfter the basic course, some of the students continue with specialized tasks related to measurement techniqueand data analysis. A few examples on such student work are given below.
Integrating Wind Turbine Measurements and Analyses with DatabaseAn automatic system to assess the 10min data files containing DAU measurements was built. A flexibleMySQL database structure was designed and implemented. Criteria were developed to detect special condi-tions, for which the whole 10min time series were saved. Such criteria can be ‘start/stop of wind turbine’,‘yaw misalignment’ and the like.
Data Analysis of Wind Turbine MeasurementsThe behaviour of the Nordtank wind turbine in its different operational modes (duty cycles) with reference tothe International Standard IEC 61400-137 was documented. The project was divided into four parts: (i) estab-lish the wind turbine duty cycles, (ii) validate load data from 10min raw data series, (iii) determine structuralloads and (iv) determine equivalent loads. It is important to know how a turbine will behave in a certain terrainso as to ensure that it can run for its stated lifetime. One such way of evaluating the lifetime is to determinethe duty cycles and the equivalent loads of the turbine.
Calibration of Strain Gauge Signals in the Nordtank Wind TurbineInstallation of new strain gauges for measuring flapwise and edgewise bending blade root moments in all threeblades required a calibration of the new signals. This project describes the calibration procedure where exter-nal forces have been applied to each blade in different directions, which resulted in a complete set of scaling(slope and offset) values for the new stain gauges.
Power QualityAll power quality parameters listed in the current standards13,14 were evaluated in real time. The derivation hadto be synchronized with the 10min intervals used for the DAU measurements. In that way, mechanical andelectrical phenomena influencing the wind turbine can be correlated.
SimulationsThe data in the wind turbine database have a broad scope of applications. For example, wind and power datacovering all possible production situations have been utilized as input to a model simulating an energy systemincluding a wind turbine and a combined heat and power plant—CHP. In this manner, a realistic insight intothe behaviour of such a combined energy system could be gained.
Wind Turbine Measurement Technique 293
Copyright © 2007 John Wiley & Sons, Ltd. Wind Energ 2008; 11:281–295DOI: 10.1002/we

Future ActivitiesSince the measurements are stored continuously, the data are available for future analysis of long-term windturbine behaviour (e.g. aerodynamic, gear, generator) and determination of extreme events. Furthermore, themeasurements can be used for validating new aeroelastic codes and long-term energy production estimates.
The instrumented wind turbine is ideal as a platform for test of new measurement, monitoring methods andcalibration of structural signals. Implementation of the upcoming IEC 61400-25 standard for wind turbinescould be an example on such an activity. In fact, such projects are planned.
The Internet access to the Nordtank database enables for international cooperation with other institutionsinside the wind turbine field, and external enquiries for such cooperation are most welcome. Upcoming pro-jects have been formulated within the following areas:
• calibration of rotor thrust coefficient;• impact of electrical events on mechanical loads;• long-term event analysis;• long-term power curve sensitivity analysis to rain, turbulence . . . ;• study of wind turbine ability to support grid stability—based on time series with 1Hz data of wind and power
fluctuations.
Finally, an extension of the measurement system to handle very fast and synchronized mechanical and electrical measurements is underway.
ConclusionsA course in wind turbine measurement techniques has been established to give students insight into measure-ment methods, standards and analysis tools focusing on wind turbines. The course has been held three times—each time successful and well attended. An online wind turbine laboratory has been established in a joint projectbetween DTU and Risø National Laboratory. The measurement laboratory is installed on a 500kW Nordtankwind turbine that runs in daily operation. The wind turbine has been fully equipped with sensors and an Inter-net accessible data acquisition system has been set-up. The online laboratory has been functioning for morethan 2 years.
One main idea of the laboratory is to give the students hands-on experiences in measuring on a practicalwind turbine and for assessing the properties of such a wind turbine. Experiences up to now have proven thatit is a pedagogical and motivating way of teaching students wind turbine techniques.
As the data acquisition system constantly is collecting and storing data systematically in a database, theknowledge of the wind turbine behaviour becomes more and more detailed, which opens new prospects forfuture activities—both in education and in research.
While the database is open and published on the Internet, cooperation with other institutions and universi-ties is possible—and welcome.
References1. Petersen SM. Wind turbine test, Nordtank NTK 500/37. Risø-R-714, 1994.2. Petersen SM. Vindmølleafprøvning Nordtank NTK 500/37, Måling af Effektkurve. Risø-I-731, 1993.3. Paulsen US. Vindmølleafprøvning Nordtank NTK 500/41, Måling af Effektkurve. Risø-I-889, 1995.4. Paulsen US. Power curve measurements, measurement summary, no. 12.2. NTK 500/41, 1995.5. Voelund P et al. Validation of aero-elastic model of Nordtank 500/37. Risø-R-1006, 1997.6. Kristensen OJD et al. Accelerated fatigue testing of LM 19.1 blades. Risø-R-1358, 2003.7. International Standard IEC 61400-13. Wind Turbine Generator Systems – Part 13: Measurement of Mechanical Loads.
International Electrotechnical Commission, 2001 IEC, Geneva, Switzerland.8. Hoffmann K. An Introduction to Measurements Using Strain Gauges. HBM, Hottinger Baldwin Messtechnik,
Darmstadt, 1996.
294 K. Ole Helgesen Pedersen et al.
Copyright © 2007 John Wiley & Sons, Ltd. Wind Energ 2008; 11:281–295DOI: 10.1002/we

9. Interactive Guide to Strain Measurement Technology. Vishay Measurement Group, 1997–2001. Available online:www.vishay.com/Brands/measurements_group/guide/guide.html.
10. International Standard ISO 17025:2005. General Requirements for the Competence of Testing and Calibration Labo-ratories. 2005.
11. DAU P2858. Data acquisition unit description. User manual. Risø 17-12-2001.12. International Standard IEC 61400-12-1. Wind Turbine Generator Systems—Part 12: Wind Turbine Power Performance
Testing.13. International Standard IEC 61400-21. Wind Turbine Generator Systems—Part 21: Measurement and Assessment of
Power Quality Characteristics of Grid Connected Wind Turbines.14. International Standard IEC 61000-4-30. Electromagnetic Compatibility—Part 4-30: Testing and Measuring
Techniques—Power Quality Measurements Methods.
Wind Turbine Measurement Technique 295
Copyright © 2007 John Wiley & Sons, Ltd. Wind Energ 2008; 11:281–295DOI: 10.1002/we
Copyright © 2022 FDOKUMEN