WIND BELTS AND SEASONAL VARIA
23
1 Component-I(A) - Personal Details Component-I (B) - Description of Module Items Description of Module Subject Name Geography Paper Name Climatology Module Name/Title PLANETARY WIND PATTERNS: WIND BELTS AND SEASONAL VARIATIONS Module Id CL-10 Pre-requisites Objectives Keywords Role Name Affiliation Principal Investigator Prof. Masood Ahsan Siddiqui Department of Geography, Jamia Millia Islamia, New Delhi Paper Coordinator, if any Dr. Ramashray Prasad Associate Professor Dr B.R. Ambedkar College (University of Delhi Content Writer/Author (CW) Dr. Ramashray Prasad Associate Professor Dr B.R. Ambedkar College (University of Delhi Content Reviewer (CR) Dr. (Mrs.) Satya Raj Assistant Professor in Geography, School of Sciences,IGNOU, MaidanGarhi,New Delhi- Language Editor (LE)
-
Upload
khangminh22 -
Category
Documents
-
view
6 -
download
0
Transcript of WIND BELTS AND SEASONAL VARIA

1
Component-I(A) - Personal Details
Component-I (B) - Description of Module
Items Description of Module
Subject Name Geography
Paper Name Climatology
Module Name/Title PLANETARY WIND PATTERNS: WIND BELTS
AND SEASONAL VARIATIONS
Module Id CL-10
Pre-requisites
Objectives
Keywords
Role Name Affiliation
Principal Investigator Prof. Masood Ahsan Siddiqui Department of Geography,
Jamia Millia Islamia,
New Delhi
Paper Coordinator, if any Dr. Ramashray Prasad
Associate Professor Dr B.R.
Ambedkar College
(University of Delhi
Content Writer/Author (CW) Dr. Ramashray Prasad Associate Professor Dr B.R.
Ambedkar College
(University of Delhi
Content Reviewer (CR) Dr. (Mrs.) Satya Raj Assistant Professor in
Geography, School of
Sciences,IGNOU,
MaidanGarhi,New Delhi-
Language Editor (LE)

2
Module 10
PLANETARY WIND PATTERNS: WIND BELTS AND
SEASONAL VARIATIONS
Dr. Ramashray Prasad Associate Professor in Geography
DrBhim Rao Ambedkar College
(University of Delhi)
Yamuna Vihar, Delhi 110094.
Contents
Introduction
Learning Objectives
Air Pressure and Gravitational Pull
Factors Affecting Atmospheric Pressure
Temperature
Altitude
Water Vapour
Gravitational Pull
Earth’s Rotation
Relationship between Atmospheric Pressure and Wind
Development of Atmospheric Motion: Winds
Temperature and Air Molecules
Temperature, Air Pressure and Winds
Uniform Temperature in Two Air Columns:
Differential Heating and Change in Pressure:
Changing Pressure and Start of Wind:
Vertical Air Mixing with Latitudes
Horizontal Atmospheric Motion: Winds
Atmospheric Pressure Gradient:
Coriolis Effect
Frictional Force
Distribution of Idealized Pressure Belts
Inter Tropical Convergence Zone:
Subtropical High:
Subpolar Low:
Polar High:
Seasonal Variations in Pressure Belts
Seasonal Variations during July
Seasonal Variations during January
Summary and Conclusions
References
Web Links
Multiple Choice Questions
Answers to MCQs

3
Introduction
The atmosphere is made up of several gases comprising several layers. The surface of the earth is
not alike everywhere. The effectiveness of the solar energy distributed over the surface of the
earth is different in different areas. They are caused by several factors. Depending on them, the
atmospheric pressure develops in a definite pattern over the globe. The different pressure belts
created is the root cause for the development of winds. Planetary pressure belts generate
horizontal movement of air known as winds. Winds develop a certain pattern which itself is
affected by several factors. Apart from all these, there is wide variations in the seasons all over
the globe. Somewhere, it is very distinct while at some places, there is no change in season
particularly in the equatorial regions. Therefore, an attempt has been made in this module to
study wind belts and their controlling factors. The changes in pressure belts and winds with
seasons are also concern of study here.
Learning Objectives
After studying this lesson, you will be able to:
definethe air pressure and pressure gradient;
enumerate the factors affecting atmospheric pressure;
establish the relationship between air pressure and winds;
explain the horizontal atmospheric motions;
discuss the development of different pressure belts;
describe the development of different atmospheric cells; and
explain the seasonal variations in pressure belts and winds.
Air Pressure and Gravitational Pull
As air has weight, hence atmosphere exerts pressure on Earth. Atmospheric Pressure is the force
per unit area exerted by a weight of air above it. The change in pressure measured across a given
distance at certain level/ surface is called a "pressure gradient". Atmospheric pressure gradient is
marked both horizontally as well as vertically. A very steep vertical pressure gradient is in the
troposphere. As we go above, the change in air pressure is very drastic. It is caused by reducing
air mass as long as we keep on going up and up (Figure 1). The force of pressure gradient pushes
upward while the gravitational pull of the earth brings it down. Both of them are balanced and

4
the atmosphere is retained with the earth. Both of these forces are greater at or near the surface or
sea level but at higher altitude, both are very weak.
Figure 1: Vertical Air Pressure Gradient
Source: http://highered.mheducation.com/sites/dl/free/0078095166/1030553/Chapter3.pdf
Factors Affecting Atmospheric Pressure
Atmospheric pressure of any region is affected by following factors:
Temperature: There is a very close relation between temperature of the air and existing
pressure. Higher temperature expands the air and hence low pressure is created whereas the
lowertemperature contracts the air which occupies less volume and therefore becomes denser and
heavier. Due to this high pressure results. So there is an inverse relationship between temperature
of the air and its pressure.
Altitude: The lower level of the atmospheric gases are more compressed in comparison to the
upper level. Upper layers are resting on the lower and hence exerting more pressure but at the
upper level, the air mass laying above them is very less and hence less compressed. Therefore,
maximum air pressure is at the lowest level whichgenerally sea level. But with increasing height,
it keeps on declining. Figure 2shows the relationship between altitude and air pressure.
Figure 2: Declining Pressure with Increasing Altitude

5
Source: http://2.bp.blogspot.com/-cbLIXyVluyk/VlNilmpTiCI/AAAAAAAABcQ/hJUT5jqVDHA/s1600/altitude-vs-mbar.gif
Water Vapour:The water vapour is lighter than the air. Therefore, addition of water vapour in
the air causes the air pressure to decline. The dry air is heavier than the moist air (air with
moisture). Increase in vapourleads to decline in the air pressure whereas its lowering lead to
increase in pressure.
Gravitational Pull: Due to gravitational pull of the earth, the atmosphere of the earth is intact
with it otherwise it would have escaped. Earth’s gravity at any particular place is inversely
proportional to the square of its distance from its centre. The air near the earth’s surface or sea
level exerts more pressure than the upper air. Equatorial radius is more than the polar radius,
therefore, the atmospheric pressure is more at the pole than at equator at sea level.
Earth’s Rotation: Due to the earth’s rotation Coriolis Effect is produced which tends to deflect
the winds from their original direction. Due to this, the air also develops a tendency of being
thrown outwards and spreading outwards.
Relationship between Atmospheric Pressure and Wind
There is a direct and positive correlation between air pressure and winds. Difference in air
pressure creates pressure gradient. The intensity of the pressure gradient is dependent upon the
intensity of the pressure difference. If the difference between two places is the same but the
distance is different, then the smaller horizontal distance will show a steeper pressure gradient
whereas the distant one will be gentler. Hence, it is the pressure difference per unit of distance
travelled in a straight direction across isobars. The wind blowing and its velocity is dependent
upon the pressure gradient. It is very clearly shown in Figure 3. It is apparent that the
atmospheric pressure is represented by isobars on the map. In Figure 3, the isobars are much

6
closer in the north-west direction whereas in south-east direction, they are widely spaced. The
boldness of the presented arrows shows the intensity of wind speed. Therefore, the wind blows
very fast in the north-west direction from the high pressure but the wind is very gentle in south-
east direction.
Figure 3: Pressure Gradient and Wind Speed
Source: http://www.physicalgeography.net/fundamentals/images/relativewindspeed.GIF
Development of Atmospheric Motion: Winds
Atmospheric motion is movement of the air. This movement may be horizontal or vertical or
both. Generally, the horizontal movement of air is termed as wind. As mentioned above, wind is
blowing due to difference in the atmospheric pressure. The atmospheric pressure is also affected
primarily by temperature. The temperature of the air is an outcome of the distribution of
insolation over the earth’s surface. Some of the portions have already been discussed in a
preceding module. Let us however discuss a few of them in brief.
Temperature and Air Molecules
Increasing temperature makes the substance more flexible even if it is firm and very hard. You
must have seen the blacksmith heating the iron items and changing the shape or altering the same
by giving ordinary force. It happens because the atoms of iron get mobility and thus gets
softened. In the same way, warm air also expands and different molecules of the air are on
change and thus they move wide apart (Figure 4). It is due to this reason, the volume of the air is
more when it is heated. Increase in volume with same mass lead to decrease in the density.

7
Decreased density causes the pressure to decrease. Compacted air (high pressure) moves towards
the less compacted air (low pressure). Thus, wind starts blowing which is dependent upon the
intensity of pressure gradient.
Figure 4: Difference in Air Pressure due to Change in Temperature
Temperature, Air Pressure and Winds
Thus, the change in temperature in the air column is reflected by change in air pressure as well as
air movement.
Uniform Temperature in Two Air Columns: Similar temperature of two air columns with
similar physical surface are generally comparable in terms of air pressure. In these two air
columns, the similarity is not only seen horizontally, but also has vertical uniformity (Figure
5A). With increasing or decreasing altitude, the air pressure is alike in both the columns.
Differential Heating and Change in Pressure: Differential heating of the atmosphere is
reflected by changing air pressure. For example, when one column is warmed up due to some
reasons (insolation or change in physical characteristics of the surface or some other local
reasons), the air in the warmed column will expand. Expansion causes the density to decrease. In
the same way, when the other column is cooled, its column is reduced due to compacting effect
(Figure 5B). It is causing the density of air to rise. Hence, the vertical distribution of air pressure
is altered between these columns.
Figure 5: Pressure Change and Wind Blowing (I)
8
Changing Pressure and Start of Wind: Refer to the Figure 5B. In compressed column, the
pressure level (say 500millibar) is lowered (in height) and in expanded column, the same air
pressure level (say 500 millibar) is shifted up (Figure 5B and C) in terms of altitude. So in the
upper part, pressure gradient develops between these two columns. From expanded column the
air moves towards compressed column. Therefore, the pressure in the expanded column is
reduced at the lower/ ground level because of shift of the air mass on the top. The shifting of the
air over the compressed/ subsided column, the total mass on the cooled column becomes still
greater in comparison to the initial one. Therefore, the high pressure develops there and at lower
level air blows from the compressed column to expanded column (Figure 5B and 5C).
Figure 5: Pressure Change and Wind Blowing (II)
Vertical Air Mixing with Latitudes

9
Vertical mixing/ motion of air is the maximum at the equator and the lowest at the poles. It is
again due to maximum vertical air rise caused by ITCZ. The troposphere is at the maximum
height at equator and lowest at poles (Figure 6). In the tropical region, the tropopause is at a
height of about 15 km and it come down to about 5 km near poles. It is all very clear as per the
description already made through the illustrations in Figure 6.
Figure 6: Vertical Air Circulation Cells and Troposphere
Source: http://weatherworkedout.weebly.com/uploads/2/2/3/5/22359606/622339660.gif?1376037245
Horizontal Atmospheric Motion: Winds
As mentioned before as well, the horizontal air movement is affected by several factors and the
important among them are:
Atmospheric Pressure Gradient
Coriolis Effect
Frictional Force
Atmospheric Pressure Gradient: Atmospheric pressure is the determining factor for the wind
direction and velocity. Direction is determined by the pressure difference (high/ low) and the
velocity is guided by the pressure gradient. Basically pressure gradient is the change in the
isobaric value per unit of distance travelled in a certain direction (already mentioned before and
shown in Figure 3). The force applied by pressure gradient to drive winds is called pressure
gradient force. The wind speed is dependent on the pressure gradient.
Coriolis Effect: The earth is spinning on its axis and the atmosphere is existing with the earth.
Coriolis force is an invisible force due to which the wind is deflected. The deflection of the wind
is perpendicular to the rotation of the earth. Since the earth is rotating on its axis from west to
east, the Coriolis force is applicable in east-west direction. This force is zero at equator and

10
keeps on increasing towards poles. The diagrammatic presentation given in Figures 7 and 8 is
very clear.
Figure 7: Coriolis Effect on Wind Direction
Source: http://faculty.ung.edu/jjones/astr1010home/coriolisfig.JPG
Suppose that two children are standing/sitting on a rotating disk. When the disk is still, the ball
thrown by one is reaching exactly to the other. Once the disk is in rotation, one child (Melvin 1)
throws ball to the other child (Melvin 2) to catch (Figure 7). The other child is not able catch the
same. The ball takes some time to reach to the other child. By the time ball reaches, the disk has
already moved further and the ball is left behind.
When the disk is rotating in anticlockwise (like northern hemisphere) direction, the ball is moved
to the right with the respect to the designated direction. This case is already shown in the Figure
7. When the disk is moving in clockwise (like southern hemisphere) direction, the ball is moved
to the left with respect to the designated direction. The same thing is happening throughoutthe
earth. Therefore, the winds tend to turn right in the northern hemisphere and to left in the
southern hemisphere. It is also known asferrel’s law.

11
When the rotating wheel is in standing position, the ball will definitely will reach to the other
child and there is no change in the direction of the ball. For example, any moving body or the
wind coming from the north pole will reach to the equator along a meridian when the earth is
static (Figure 8Aa). But the same is not the case when the earth is rotating. It is turned to right
because the moving object or the wind will take some to reach equator from the pole. By the
time it reaches to equator, the position of that longitude will move eastward and the object/ wind
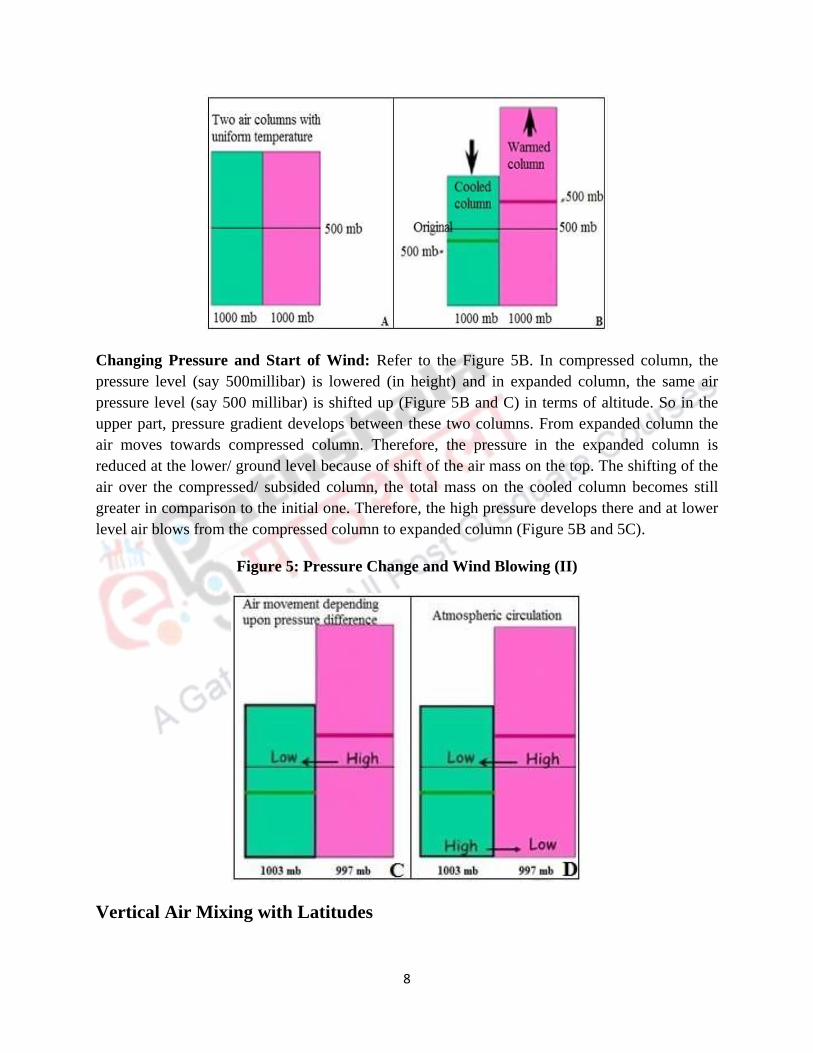
will be left behind to the right side to the designated direction (Figure 8Ab). The earth is rotating
on its axis and it causes the wind to divert the path to the right in the northern hemisphere
(Figure 8BA) and to the left in the southern hemisphere (Figure 8BA)
Figure 8A: Coriolis Effect on Wind Direction
Source: http://www.richhoffmanclass.com/images/chapter6/coriolisforce.jpg
Figure 8B: Coriolis Effect on Wind Direction
12
Source: https://ibseedintorni.files.wordpress.com/2016/03/coriolis.jpg?w=676
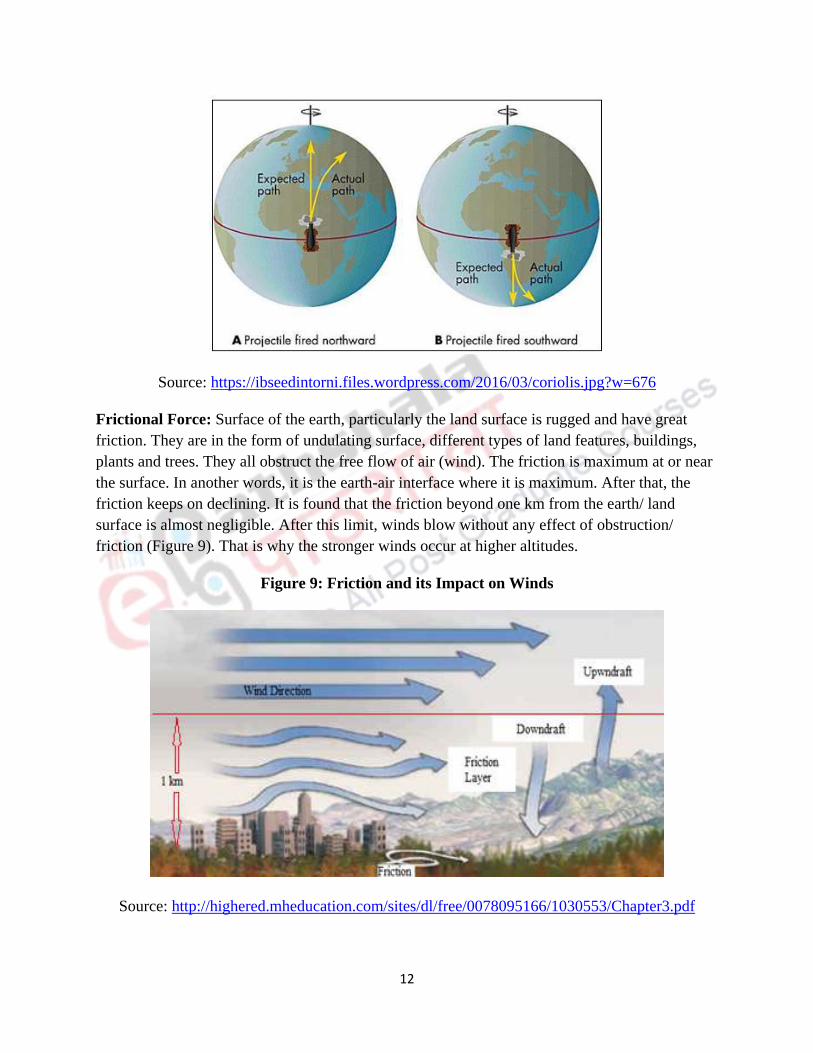
Frictional Force: Surface of the earth, particularly the land surface is rugged and have great
friction. They are in the form of undulating surface, different types of land features, buildings,
plants and trees. They all obstruct the free flow of air (wind). The friction is maximum at or near
the surface. In another words, it is the earth-air interface where it is maximum. After that, the
friction keeps on declining. It is found that the friction beyond one km from the earth/ land
surface is almost negligible. After this limit, winds blow without any effect of obstruction/
friction (Figure 9). That is why the stronger winds occur at higher altitudes.
Figure 9: Friction and its Impact on Winds
Source: http://highered.mheducation.com/sites/dl/free/0078095166/1030553/Chapter3.pdf

13
Friction near the earth surface is the cause for complicated wind patterns. Obstructions like
undulated land, valleys, peaks, ridges, buildings, plants and trees etc. in the path of the winds
results in curved or complex paths and creates turbulence near the earth.
Distribution of Idealized Pressure Belts
You must have read about the development of pressure belts and their distribution over the globe
in the previous module. But let us discuss about them in very brief.
It is well known fact that the sun’s rays are vertical in equatorial region throughout the year.
Hence, higher temperature is observed in this region. The effect of high temperature is very
clearly seen on the circulation of air. The incoming short wave solar radiation is primarily not
trapped by atmosphere. Those rays reach to the earth surface almost directly. First of all, the
surface is heated by the solar energy. The air in contact with the surface is warmed up when the
earth radiates back through longwave radiations. The long wave earth’s radiation is being
absorbed by the air. Thus, the air gets the heat in this method. This process is applicable to entire
earth including land and water surface but the effectiveness is different in different cases.
Inter Tropical Convergence Zone: Inter tropical convergence zone (ITCZ) is a low pressure
belt found generally along the equator. It is a zone where the winds coming from sub-tropical
high pressure belts of both the hemispheres converge near the equator. Since this zone
experiences high temperature throughout the year, the air in this zone is heated up and get sparse
in terms of density. Warm air is lighter and it moves upward. In this way, a temporary void space
is created. Therefore, this area is termed as low pressure zone. This is also known as a zone of
tropical low pressure or generally ITCZ (Figure 10). This low pressure is thermally induced
because it happens due to high temperature in this zone. The air laying in the surrounding areas
starts rushing to fill this temporary void. Refer to Figure 11 to get a clear picture of it.
Figure 10: Pressure Belts Distribution

14
Source: http://uhfall2014dominicanrepublic.blogspot.in/
Figure 11: Low Pressure Creation over Equator
Source: http://media.diercke.net/omeda/800/13561E_3_Passat_ITC.jpg

15
Subtropical High: The converged air at ITCZ rises up. We know that temperature decreases
with increasing altitude. The rising air is diverged and displaced towards poles but it does not
reach to that great distances. From the upper troposphere, it reaches to around 300 north and
south latitudes and descends or sinks there. The descending or sinking air presses the underlying
air. This increases the air pressure at the lower level. From this area of increased air pressure,
winds start blowing towards the equator, where the low pressure zone is already generated
(Figure 11). The completion of the air circulation from ITCZ/ equator to upper troposphere
north/south divergence, sinking at subtropical high and again blowing towards equator is like a
cell. This cell is popularly called Hadley Cell (Figure 6 and 12) as it was first explained by him.
Figure 12: Vertical Air Circulation and Cells
Source: http://www.bbc.co.uk/education/guides/zym77ty/revision/2
Subpolar Low: The sinking air at subtropical high also blows towards the pole. The polar low
pressure zone is created by dynamic behavior of the air movement. Poles are excessively very
cold and due to this, poles have high pressure. It is also thermally induced high pressure because
the poles are excessively cold. Between two high pressures, that is, the sub-tropical high pressure
and polar high pressure, there is bound to be a low pressure. This low is developed around 600
north and south latitudes. The convergence of air at the polar low is causing to rise of the air

16
(Figure 12). The rising air from this zone is again diverted towards poles as well as towards
subtropical high pressure where they descend. The rising from subpolar low, diverging towards
subtropical, sinking there and blowing from subtropical high to subpolar low is a circular motion
known as Ferrel’s Cell (Figure 6 and 12).
Polar High:As mentioned before, the poles have excessively low temperatures. Excess cold
causes the air to be very heavy and due to this the high pressure has developed over poles. Apart
from this, the risen air at subpolar low, reaches to the polar region and sinks there. Due to both
the reasons, polar areas are zones of high pressure. Hence, the winds are blowing towards
subpolar low pressure area. The uplifted air at subpolar low, moving towards poles and
descending there and finally reaching to the subpolar low is termed as Polar Cell (Figure 6 and
12).
Though the direction of air on Figure 10 is shown by straight lines from high pressure zone to
low. This figure is placed only to show the air pressure belts. In reality, winds are not blowing on
a straight path but are on a curvilinear path (Figure 13). The curvature of the path is due to
rotation of the earth as well as Coriolis force about which you have already learnt in the previous
section of this module.
Figure 13: Curvilinear Path of Winds
Source: https://classconnection.s3.amazonaws.com/487/flashcards/1587487/png/three_cell_model1351023546708.png

17
Seasonal Variations in Pressure Belts
As discussed before, the earth’s axis is inclined about 660 30’ from horizontal or 230 30’ from the
vertical. It is also mentioned, the orbit of the earth is elliptical in shape on which it is revolving
around the sun. Due to this, after third week of March to third week of September, for a period of
six months, northern hemisphere gets more insolation. In the same way from third week of
September to third week of March, for a period of six months, southern hemisphere receives
more solar energy (Figure 14). As mentioned above that energy received from the sun is a
determining factor for all sorts of weather and climatic phenomena.
Figure 14: Seasonal Changes of Sun’s Rays Incidence on Curved Surface of the Earth
Source: http://physics.weber.edu/schroeder/ua/EarthCirclesAndSunRays.png
In general, the global atmospheric pressure belts depart northwards as along as the sun shines
vertically in northern hemisphere after third week of March. The departure of atmospheric
pressure belts keeps on continuing till third week of June, when the sun is vertical over tropics of
Cancer. Sun is vertical over tropic of cancer on 21st June while on 22nd December it is vertical
over tropic of Capricorn (Figure 15).

18
Figure 15: Sun Shining on Tropics of Capricorn and Cancer
Source: https://dept.astro.lsa.umich.edu/resources/ugactivities/Labs/seasons/SeasonsIntrotroppics.html
Seasonal Variations during July
By the end of third week of June, the sun shines directly over the tropic of Cancer. After that
sun’s rays starts turning towards south. July is the hottest month recorded in the northern
hemisphere. Northward departures of the inclination of sun’s rays from last week of March
increases the temperature in northern hemisphere. Along with this, the ITCZ keeps on moving
northwards (Figure 16 and 17). Its maximum departure is seen upto 250 north latitude in the large
chunk of land of Asia. Though the ITCZ shifting is northwards, itsshift is minimum on the large
water bodies of Pacific and Atlantic (Figure 17).
Figure 16: Changed ITCZ during Jun/July
Source: http://www.weatherwise.org/sebin/s/i/Convergence-Photo-4.gif

19
Figure 17: Changed ITCZ during June and July
Source: https://image.slidesharecdn.com/winds-111208234718-phpapp02/95/winds-16-728.jpg?cb=1323392487
The effectiveness of the sun’s departure is observed till July as it is the hottest month for
northern hemisphere, while the southern hemisphere witness the coldest conditions in July. In
this process, inter tropical convergence zone (ITCZ) is shifted according to shift in sun’s rays
(Figure 16). Shift in the ITCZ is associated with the shift in all the atmospheric pressure belts in
the direction of the ITCZ shifting. Therefore shift in the all vertically developed cells like,
Hadley, Ferrel’s and Polar are also shifted simultaneously. The shift in the all the belts are
evident from Figure 18.

20
Figure 18: Migration in all Atmospheric Pressure Belts during Certain Months
Slightly modified from: https://www.slideshare.net/iqbalmuhammed4/geo02-wind
The northward departure of ITCZ is further northward over the continental landmass (Figure 17).
It happens so because the land is getting heated up very quickly and intensely. The low pressure
is developed over such regions. The ocean surface is relatively cool because specific heat of
water is high compared to land. So, it does not get heated or cooled so quickly like land. Though
the temperature of the ocean water also rises, but due to differential low temperature, oceans
possess high pressure.
Over Pacific and Atlantic, the average sea-level atmospheric pressure is more than 1024 mb
whereas the low pressure over widespread continental area of Africa and Asia records less than
1000 mb (Figure 19). In the same month (July), a very widespread and extensive area of high
pressure is developed almost encircling the entire southern hemisphere between 50 to 400 south
latitudes. It encompasses both land and water bodies. The subpolar low pressure belt has also
shifted northward and occupies its position between 450 to 600 south latitudes.

21
Figure 19: Average Atmospheric Pressure in July
Source: https://media1.britannica.com/eb-media/42/104242-004-338AFD20.jpg
Seasonal Variations during January
By the end of third week of September the sun’s rays become vertical towards southern
hemisphere. The effectiveness of solar radiation increases in southern hemisphere with the
passage of time, but simultaneously it keeps on decreasing in the northern hemisphere. It all
happens due to inclined rays of the sun in the northern hemisphere. With more and more vertical
rays in the southern hemisphere, the increase in temperature is very significant and prominent in
southern hemisphere. Increasing temperature causes the high atmospheric pressure region turns
into a low air pressure zone. The continuous widespread high pressure belt is confined only to
the southern parts of Pacific, Atlantic and Indian oceans. The subpolar low pressure belt is also
reduces to a narrower belt in comparison to July. The same is the case with polar high confining
to a contracted region(Figure 20).
So the case of northern hemisphere is reversed in January in comparison to July. Everything is
due to seasonal changes due to earth’s revolution round the sun. A huge area is under the
influence of high atmospheric pressure. Itextendsover enormous landmass of Europe, Africa,
Asia and North America. This belt is relatively narrower over the water bodies of Pacific and
Atlantic. These are having the reason of the nature of the surface and their differential response
to the heat received.

22
Figure 20: Average Atmospheric Pressure in January
Source: https://media1.britannica.com/eb-media/41/104241-004-1DC78D2A.jpg
Summary and Conclusions
The planetary wind pattern is affected by the sequential development of high and low
atmospheric pressure. The intensity and velocity of wind is affected by the pressure gradient
which is the function of the inter spacing of the isobars and the distance. In other words, the
atmospheric pressure is controlled primarily by important factors like temperature, altitude,
water vapour, gravitational pull and earth’s rotation.
Lowering the temperature of the air of an area causes the pressure to rise whereas the increase of
the same lead to decrease in pressure. With increase in altitude, the pressure is decreased and
vice-versa. Increase in water vapour in the air causes the air pressure to decrease as it makes the
air lighter. So decreasing vapour increases the air pressure. Gravitational pull is greater near the
surface but with increase in height, it is reduced. Earth’s rotation causes the air to throw away
due to centrifugal force of earth’s spinning.
The heating of air creates convectional currents particularly in inter tropical convergence zone.
The risen air from ITCZ is diverted towards poles but it descends near subtropical high. It creates
Hadley cell. Another Ferrel cell is created between subtropical high to subpolar low. The third
cell, that is, Polar cell gets developed between subpolar low to polar high. As demarcated by
these cells, sequential development of the pressure belts are created. The horizontal movement of
wind is primarily affected by the pressure gradient, corioliseffect and frictional force.
With change in season, complete reversal in weather and climatic elements are seen over the
globe. In a cycle of one year, sun is bright for six months in northern hemisphere from last week
of March to the third week of September. Thus, in this period, all pressure belts and ITCZ shifts
northwards. The reverse is the case fromthird week of September to the third week of March

23
when sun is bright in the southern hemisphere. During those days, all air pressure belts as well as
ITCZ are shifted southwards. The effect of the land water distribution in the two hemispheres
also play a very crucial role in determining the atmospheric pressure belts and the wind pattern
over the globe.
=================