The anatomy of exhumed river‐channel belts
68
This article has been accepted for publication and undergone full peer review but has not been through the copyediting, typesetting, pagination and proofreading process, which may lead to differences between this version and the Version of Record. Please cite this article as doi: 10.1111/SED.12765 This article is protected by copyright. All rights reserved DR. BENJAMIN THOMAS CARDENAS (Orcid ID : 0000-0001-7246-219X) DR. JASMINE MASON (Orcid ID : 0000-0003-4107-5749) Article type : Original Manuscript The anatomy of exhumed river-channel belts: Bedform to belt-scale river kinematics of the Ruby Ranch Member, Cretaceous Cedar Mountain Formation, Utah, USA Benjamin T. Cardenas 1,2 *, David Mohrig 1 , Timothy A. Goudge 1 , Cory M. Hughes 3 , Joseph S. Levy 4 , Travis Swanson 5 , Jasmine Mason 1 , and Feifei Zhao 1 1 Jackson School of Geosciences, University of Texas at Austin, Austin, TX, USA 2 now at the Division for Geological and Planetary Sciences, California Institute of Technology, Pasadena, CA, USA 3 Department of Geology, Western Washington University, Bellingham, WA, USA 4 Department of Geology, Colgate University, Hamilton, NY, USA 5 Department of Geology and Geography, Georgia Southern University, Statesboro, GA, USA *Corresponding Author Contact Information Telephone: (210) 240-0382 Email: [email protected] Re-submitted to Sedimentology after copy editing Manuscript #: SED-2019-OM-199.R2 Accepted Article
-
Upload
khangminh22 -
Category
Documents
-
view
4 -
download
0
Transcript of The anatomy of exhumed river‐channel belts

This article has been accepted for publication and undergone full peer review but has not been through the copyediting, typesetting, pagination and proofreading process, which may lead to differences between this version and the Version of Record. Please cite this article as doi: 10.1111/SED.12765 This article is protected by copyright. All rights reserved
DR. BENJAMIN THOMAS CARDENAS (Orcid ID : 0000-0001-7246-219X)
DR. JASMINE MASON (Orcid ID : 0000-0003-4107-5749)
Article type : Original Manuscript
The anatomy of exhumed river-channel belts: Bedform to belt-scale river kinematics of the Ruby
Ranch Member, Cretaceous Cedar Mountain Formation, Utah, USA
Benjamin T. Cardenas1,2*, David Mohrig1, Timothy A. Goudge1, Cory M. Hughes3, Joseph S. Levy4,
Travis Swanson5, Jasmine Mason1, and Feifei Zhao1
1Jackson School of Geosciences, University of Texas at Austin, Austin, TX, USA2now at the Division for Geological and Planetary Sciences, California Institute of Technology,
Pasadena, CA, USA3Department of Geology, Western Washington University, Bellingham, WA, USA
4Department of Geology, Colgate University, Hamilton, NY, USA5Department of Geology and Geography, Georgia Southern University, Statesboro, GA, USA
*Corresponding Author Contact Information
Telephone: (210) 240-0382
Email: [email protected]
Re-submitted to Sedimentology after copy editing
Manuscript #: SED-2019-OM-199.R2Acc
epte
d A
rtic
le

This article is protected by copyright. All rights reserved
Word Count: 7,677 (8,000 limit)
Abstract: 242 (300 word limit)
Figures: 20
References: 112
Associate Editor – Christopher Fielding
Short Title – The anatomy of exhumed river-channel belts
ABSTRACT
Many published interpretations of ancient fluvial systems have relied on observations of
extensive outcrops of thick successions. This paper, in contrast, demonstrates that a regional
understanding of palaeoriver kinematics, depositional setting and sedimentation rates can be
interpreted from local sedimentological measurements of bedform and barform strata. Dune and
bar strata, channel planform geometry and bed topography are measured within exhumed fluvial
strata exposed as ridges in the Ruby Ranch Member of the Cretaceous Cedar Mountain Formation,
Utah, USA. The ridges are composed of lithified stacked channel belts, representing at least five or
six reoccupations of a single-strand channel. Lateral sections reveal well-preserved barforms
constructed of subaqueous dune cross-sets. The topography of palaeobarforms is preserved along
the top surface of the outcrops. Comparisons of the channel-belt centreline to local palaeotransport
directions indicate that channel planform geometry was preserved through the re-occupations,
rather than being obscured by lateral migration. Rapid avulsions preserved the state of the active
channel bed and its individual bars at the time of abandonment. Inferred minimum sedimentation
durations for the preserved elements, inferred from cross-set thickness distributions and assumed
bedform migration rates, vary within a belt from one to ten days. Using only these local
sedimentological measurements, the depositional setting is interpreted as a fluvial megafan, given
the similarity in river kinematics. This paper provides a systematic methodology for the future
synthesis of vertical and planview data, including the drone-equipped 2020 Mars Rover mission to
exhumed fluvial and deltaic strata.Acc
epte
d A
rtic
le

This article is protected by copyright. All rights reserved
Keywords: bar, channel belt, fluvial sedimentology, preservation, sinuous ridge
INTRODUCTION
Fluvial channel belts are the record of bedform and barform migration and accumulation.
Lateral migration, aggradation and degradation of an ancient river is recorded by the accumulations
and bounding surfaces associated with these bedforms and bars, which in turn make up the channel
belts (Van De Lagewag et al., 2013). Therefore, in order to determine the kinematics of ancient
rivers, that is, how they migrated, aggraded and avulsed, it is necessary to understand the
accumulation and preservation of the bedform and barform strata within the associated channel
belts (e.g. Reesink et al., 2015; Durkin et al., 2018; Paola et al., 2018; Chamberlin & Hajek, 2019).
Furthermore, variables such as water and sediment discharge of an ancient fluvial system can only
be determined if hydraulic geometries can be accurately estimated from channel belts (Wright &
Parker, 2003; Parker et al., 2007; Hayden et al., 2019).
This paper examines an exhumed complex of fluvial deposits in the Ruby Ranch Member of
the Cretaceous Cedar Mountain Formation, Utah, USA (Fig. 1). The goal is to use local
sedimentological measurements of dune and bar strata to infer the regional kinematics and
depositional settings of the formative rivers. Here, new methodologies are developed for extracting
river-channel kinematics from channel-belt deposits. The measurements presented here cover the
channel belts across a range of scales, from local stacks of cross-sets to entire outcrops, in order to
interpret the ancient river systems of the Ruby Ranch Member. The datasets analyzed in this paper
include aerial images collected from a drone, field maps, vertical and lateral sections, and modern
river analogues. The spread of palaeotransport directions along ridgetops is compared to modern
rivers to understand the degree of lateral migration recorded by the belts. Timescales related to the
vertical aggradation of channel belts are constrained using climb angles inferred from cross-set
thickness distributions. Preserved bar topography is identified by cross-set bounding surfaces that
Acc
epte
d A
rtic
le

This article is protected by copyright. All rights reserved
conform to the modern topography, and is relevant for understanding avulsions and channel
abandonment.
Background
Ruby Ranch Member, Cedar Mountain Formation
The rivers that deposited the Ruby Ranch Member of the Lower Cretaceous Cedar Mountain
Formation drained the uplifted Sevier thrust belt, in what is now modern-day western Utah, north-
eastward towards the Mowry Sea and its successor, the Western Interior Seaway (Currie, 1998,
2002). Ultimately, foreland-basin subsidence led to the burial of the Cedar Mountain Formation by
late Cretaceous coastal and marine deposits of the Naturita Formation (formerly the Dakota
Sandstone; Young, 1960; Carpenter, 2014) and the Mancos Shale (Currie, 1998, 2002). A regional
unconformity separates the base of the Cedar Mountain Formation from the top of the upper
Jurassic Morrison Formation (Peterson & Ryder, 1975; Kowallis et al., 1986). The Ruby Ranch
Member has been interpreted as consisting of channel sandstones and conglomerates, and
overbank mudstones and palaeosols (Stokes, 1961; Currie, 1998; Garrison et al., 2007; Ludvigson et
al., 2015; Nuse, 2015; Hayden et al., 2019).
The Cedar Mountain Formation is an important source of palaeontological, climatic and
tectonic information (Heller & Paola, 1989; Currie, 1998, 2002; Kirkland et al., 1999; Ludvigson et al.,
2010, 2015; Joeckel et al., 2017, 2019). Recent work regarding the Ruby Ranch Member of the Cedar
Mountain Formation has focused on the geomorphology of exhumed channel deposits, which are
more resistant than the surrounding floodplain material, resulting in the preferential erosion of
floodplain strata and preservation of the channel deposits that form ridges (Williams et al., 2007;
2009; Hayden et al., 2019). These ridges are as tall as 35 m and 60 to 90 m wide on average, and
expose channel belts in three dimensions (Fig. 1). Recent interest in these landforms and other
exhumed channel belts (e.g. Hayden et al., 2019; in Oman, Maizels 1987, 1990; Maizels & McBean, Acc
epte
d A
rtic
le
This article is protected by copyright. All rights reserved
1990; in Egypt, Zaki et al., 2018) has partially been driven by high-resolution images of
morphologically similar ‘fluvial sinuous ridges’ on Mars (e.g. Burr et al., 2009; Davis et al., 2016;
Cardenas et al., 2018; Hughes et al., 2019). Hayden et al. (2019) have provided an important
comparison between field-based and remote-sensing-based palaeohydraulic reconstructions for the
exhumed channel belts of the Ruby Ranch Member, but the sedimentological analysis herein
provides additional information for palaeoenvironmental analysis.
Dune, bar and channel belt strata
The dip direction of a dune cross-stratum records the orientation of the formative dune lee
face, and reflects the local direction of dune migration (Allen, 1970; Rubin & Hunter, 1982). This
relationship, however, is complicated in trough cross-strata created by dunes with sinuous crestlines
(McKee & Weir, 1953; DeCelles et al., 1983; Rubin, 1987; Slingerland & Williams, 1979). The local dip
direction of a set of trough cross-stratification may represent the mean migration direction of the
associated dune plus or minus as much as 90° (Dott Jr., 1973; Almeida et al., 2016). In plan-view
exposures, the net migration direction can be determined reliably, as well as the orientation of the
bar surface the dune migrated on (Dott Jr., 1973; Almeida et al., 2016). In channel deposits, larger
dipping strata composed of smaller dune cross-sets, called compound strata, represent the accretion
surfaces of barforms built by superimposed dunes (Allen, 1983; Haszeldine, 1983; Edwards et al.,
1983; Miall, 1985, 1988; Almeida et al., 2016; Reesink, 2019).
Barforms are either fixed in position by channel shape or are free to migrate downstream,
although these represent end members of a continuum (Miall, 1977; Seminara & Tubino, 1989;
Ikeda, 1989; Hooke & Yorke, 2011). Point bars fixed to the inner bank of a channel bend grow into
the channel (Ikeda et al., 1981) and record lateral river migration. Point bars have been identified in
the rock record based on lateral accretion surfaces dipping towards a range of orientations relative
to the local dip directions of dune cross-strata (e.g. Edwards et al., 1983; Wu et al., 2015; Almeida et
al., 2016). Free bars are able to migrate downstream, although they may be attached to banks, and Acc
epte
d A
rtic
le

This article is protected by copyright. All rights reserved
preserve a wider array of relationships between local dune migration direction and the bar surface
dip direction (e.g. Allen, 1983; Almeida et al., 2016). Free bars and point bars commonly coexist in
channels and in mixed-case forms (Fig. 2) (Kinoshita & Miwa, 1974; Whiting & Dietrich, 1993; Hooke
& Yorke, 2011). Strata representing both point bars and free bars may therefore be observed in the
Ruby Ranch Member.
In net-depositional settings, aggradation of the riverbed is coupled with aggradation of the
channel levées and proximal floodplain, and occurs more rapidly than in the distal floodplain
(Pizzuto, 1987). Over time, the channel becomes elevated relative to the floodplain, and the
difference between the two elevations defines the channel’s superelevation. Past studies have
shown that a superelevation of 60% of the flow depth is linked to a threshold for river avulsion
(Mohrig et al., 2000), the process by which flow abandons a channel in favour of a lower topographic
pathway (Heller & Paola, 1996; Mohrig et al., 2000; Hajek & Edmonds, 2014; Chadwick, 2020).
Studies of both modern and ancient avulsive rivers suggest that rivers tend to return to previously
abandoned channels that became attractors to flow following the aggradation of the adjacent
floodplain (Heller & Paola, 1996; Reitz et al., 2010; Edmonds et al., 2016). Such systems leave behind
channel-belt complexes, that is, stacked channel-belts (Friend, 1979; Mohrig et al., 2000; Jones &
Hajek, 2007; Cuevas Martínez et al., 2010; Chamberlin & Hajek, 2015; Hayden et al., 2019).
Modern-analogue rivers
Two modern rivers representing end-member braided and meandering planforms, the North
Loup River (Nebraska, USA) and Trinity River (Texas, USA), are used for comparisons in this study.
The North Loup River is a sand-bed braided river that has been used before as a modern analogue to
ancient fluvial strata (Mohrig et al., 2000; Mahon & McElroy, 2018). The North Loup River represents
a reasonable analogue to understand bar and bedform processes occurring in the formative
channels of the Ruby Ranch Member, because widths and depths are similar. The eastern and
western ridges are 63 m and 90 m wide on average. The North Loup River is 111 m wide in the Acc
epte
d A
rtic
le

This article is protected by copyright. All rights reserved
studied reach, and ca 1.0 to 1.5 m deep (Mohrig & Smith, 1996; Hayden et al., 2019). This study also
uses analyzed bedforms and bars in the meandering Trinity River (Mason & Mohrig, 2018; 2019a,b;
Mason, 2018). The Trinity River has a similar width to the ancient rivers described here (122 m on
average), but is deeper. The similar widths are significant for the aspects of this study focusing on
the steering of dunes by bars.
METHODS
Field measurements
Several datasets were acquired at two adjacent ridges in the Ruby Ranch Member that
appear to have once been continuous (Fig. 1A and B). The ridges have good and accessible sidewall
and planview exposures. None of the normal faults mapped in the area appear to intersect these
ridges (Sable, 1956; Hayden et al., 2019). Aerial photosurveys, collected with a DJI Phantom 2 Vision
Plus drone (DJI, Shenzhen, China), imaged the top and side surfaces of both ridges with >75% along-
path and side overlap in photographs (Fig. 1C to D). Flights were conducted at 15 to 20 m above
ground level. Ground control point locations were determined using an Archer Field PC (Juniper
Systems, Logan, UT, USA) with an external GPS antenna, producing horizontal position data with
<0.3 m RMS accuracy. Orthomosaics were generated with 5 cm spatial resolution using Agisoft
Photoscan Pro (www.agisoft.com), and cover an area of 213 000 m2 over the eastern and western
ridges (Fig. 1C and D). These datasets were used to map the locations of bounding surfaces of cross-
sets and major erosional surfaces. Dip directions of cross-strata identified on the photomosaics were
measured in the field using compasses. Each set was classified as either being composed of
sandstone or conglomerate.
Around the perimeters of each ridge, 59 vertical sections were measured covering the
entirety of the available vertical exposure of the ridge-top fluvial strata, resulting in 276 total metres
of section. An additional 31 two-dimensional lateral sections ranging from 1 to 10 m wide were Acc
epte
d A
rtic
le

This article is protected by copyright. All rights reserved
collected around the perimeters of both ridges in order to characterize the smaller, cross-set scale
architectural elements of the channel belts. Architectural variability in the transport direction at the
scale of a few metres was recorded, including changes in set thickness and the dips of bounding
surfaces. Across all of these surveys, the thickness of 362 sets of cross-strata were measured, and
grain size was measured for 75 of those sets in the field using a SciOptic translucent grain-size chart.
Using a geographic information system (GIS), field mapping results were merged with the remote
sensing measurements. Ridge-scale bounding surfaces were digitized as lines, and 1071 sets of
planform-exposed trough cross-strata and 107 exposures of large-scale dipping strata were digitized
as polygons.
Transport anomaly
To test how well the ridge outcrop centrelines represent original channel centrelines, a new
metric is developed and named here as the transport anomaly, ѲTA. It is defined for both modern
rivers and the exhumed channel belts.
ѲTA-CHANNEL = ѲCL-CHANNEL – ѲD-CHANNEL (1a)
ѲTA-RIDGE = ѲCL-RIDGE – ѲD-RIDGE (1b)
where ѲD is the 0 to 359° orientation of a transport or palaeotransport measurement from an active
dune (ѲD-CHANNEL; Eq. 1a) or cross-set (ѲD-RIDGE; Eq. 1b), and ѲCL is the orientation of the centreline
nearest to the location where ѲD was measured (Fig. 3). Values of ѲTA may be positive or negative,
and are calculated using the Circular Statistics Toolbox available for MATLAB
(www.mathworks.com), which measures the shortest angular distance, positive or negative,
between the two directions such that no measurement exceeds 180° or is less than
-180° (Berens, 2009).
By measuring ѲD-CHANNEL from dunes in modern rivers and ѲTA-RIDGE from planform-exposed
cross-sets in the Ruby Ranch Member, hundreds of measurements of ѲTA (Eq. 1a to b) between the Acc
epte
d A
rtic
le

This article is protected by copyright. All rights reserved
ancient and modern systems were compared to test whether the transport anomalies for the
outcrop are distinct from transport anomalies observed in a modern river system. To perform this
comparison, Ruby Ranch Member ridge centreline trends and palaeotransports are required, as well
as modern river centrelines and instantaneous transport directions collected from dune crest
orientations. The braided North Loup River and the meandering Trinity River are used as the modern
analogues.
This test assesses how well the centrelines of the ancient rivers are preserved in the
exhumed channel belts and represent ridge geometry (Fig. 4A and B). For example, if the mean and
standard deviation (σ) of ѲTA-RIDGE (Eq. 1b) approximately equal those of ѲTA-CHANNEL (Eq. 1a), then the
transport anomaly of the ancient deposit is no greater than the variability in a modern river, and is
consistent with channel-belt planform preserving the formative channel planform (Fig. 4A). If lateral
migration and reworking has greatly widened the channel belt and reduced its overall sinuosity from
that of the formative channels, σ should be greater in the ancient deposit, as well as a more random
distribution of ѲTA-RIDGE (Fig. 4B). An example of the latter case comes from point bar strata of the
Cretaceous Ferron Sandstone, Utah, USA, in Wu et al., (2015, fig. 13; 2016, fig. 8), which present a
general north-west-curving palaeotransport trend along a north-east trending exposure, making that
study location a high palaeotransport anomaly zone. Furthermore, the deviation angle in Wu et al.
(2016) is calculated relative to an interpreted channel-form, not the exhumed channel-belt shape.
Wang & Bhattacharya (2017, fig. 10A) show an even clearer example linked to point bar growth.
Examples of this kind of lateral amalgamation have been documented in both the ancient
(Cretaceous McMurray Formation, Alberta, Canada) and the modern (Mississippi River, Missouri and
Arkansas, USA) by Durkin et al. (2018). In a third scenario where erosion patterns have not exhumed
the belt evenly from all directions, the characteristics of both of the two aforementioned scenarios
would not be observed.
Points defining the centrelines of rivers were calculated using the series of points used to
define enclosing channel banks. For each point on one bank or ridge edge, the distance to the
nearest point on the opposite bank or ridge edge is calculated and taken as a local width Acc
epte
d A
rtic
le
This article is protected by copyright. All rights reserved
measurement, and a centreline point is placed at the location exactly between the two points. The
sequence of points spanning the length of the ridges or a river reach was smoothed using a spline
method in the MATLAB curve fitting toolbox. Centrelines are ultimately defined as points spaced ca
1 m apart along the smoothed line.
To measure local transport directions in the analogue rivers, the brink lines of modern dunes
on the North Loup River bed were mapped using the orthorectified drone photomosaic that shows
subaqueous bars and dunes, collected by Swanson et al. (2018). The orientation of each dune was
estimated by a best-fit line to a series of mapped brink points. The normal to each brink line, in turn,
was taken as the local transport direction for that dune, ѲD-CHANNEL: ѲD-CHANNEL was then tied to a
point located at the average X–Y coordinate of all X–Y coordinates defining that particular dune
brink line. The same process was applied to bedforms over the 32 km reach of the Trinity River
imaged using sonar profiles of dunes on the channel bed (dataset from Mason, 2018), as well as
dunes frozen on subaerially exposed point bar surfaces formed during the previous bankfull flood
imaged in a 2015 lidar (light detection and ranging) survey (Mason & Mohrig, 2018; 2019b). The
widths of these channels are comparable to the widths of the ridges, and the braided and
meandering end-members are useful in interpreting the Ruby Ranch Member, because the
dominance of free bars in the former versus point bars in the latter route flow in different ways
(Dietrich & Smith, 1984; Ashworth, 1996). In the Ruby Ranch Member, values for ѲD-RIDGE are taken
from field measurements of planform trough cross-strata across the top surfaces of the two ridges
and assigned associated X–Y coordinates at the centre of the corresponding mapped set.
RESULTS
Vertical sections
The vertical sections measured along the perimeters of each ridge were composed of over
99% cross-stratified sandstones and conglomerates. The top surfaces of mudstones in the vertical Acc
epte
d A
rtic
le

This article is protected by copyright. All rights reserved
sections are scoured into by erosional surfaces that extend across ridges. Mudstone units vary in
thickness over short distances because they were eroded by overlying channel elements, attaining a
maximum thickness of 0.6 m. These persistent erosional surfaces commonly define and separate
individual channel-belts (Figs 5A, 5B, 6A and 6B; Friend et al., 1979). Any given vertical section
exposes one to four stacked stories which locally vary in thickness from 0.10 m to 8.60 m, with a
mean of 3.10 m ± 0.22 m (the calculated standard error of the mean), median of 2.80 m ± 0.27 m
(the calculated standard error of the median) and σ of 2.03 m ± 0.15 m (the calculated standard
error of the standard deviation; n = 89; Fig. 6C). These storey-bounding surfaces are also exposed
along the top surfaces of the ridges. Five of these surfaces have been mapped across the western
ridge, and four have been mapped across the eastern ridge (Fig. 5C).
Sedimentary structures and architecture
The most common sedimentary structures preserved in planview and vertical exposures of
the Ruby Ranch Member ridges are trough cross-sets (Fig. 7) with median grain sizes ranging from
upper-fine sand to medium pebbles (Fig. 8A to C). The mean thickness of these sets is 0.12 m ± 0.005
m, with a standard deviation of 0.09 m ± 0.003 m, and a coefficient of variation of 0.79 ± 0.04 (cv =
σ/mean, with propagated errors; n = 350). Along the top ridge surfaces where these structures are
exposed and mapped in planview (Fig. 9), the dominant dip direction of these sets was identified as
representative of the associated bedform’s migration direction. The polygons outlining these
planform exposed sets (n = 1071) sum to a total area of 5019 m2. Of the 1071 sets mapped in
planform, 269 were identified as conglomerate, representing 25.1% of sets and 26.5% (1330 m2) of
total set area. The remaining 802 sets were identified as sandstone, representing 74.9% of sets and
73.5% (3689 m2) of total set area. Larger scale thicker compound cross-sets (n = 12), with a mean of
1.28 m ± 0.05 m and a σ of 0.19 m ± 0.04 m measured at preserved rollovers (topsets), are also
exposed in planview (Fig. 10A to D). There was no overlap in thickness between the two structures.
The locations of planview measurements of both types of sedimentary structures are shown in Fig. Acc
epte
d A
rtic
le

This article is protected by copyright. All rights reserved
11. The summed planform exposure area of these sets (n = 103) is 520 m2, or covering 10.3% of the
planform area of trough cross-sets. Within individual channel belt stories, shingled trough cross-sets
record transport up and down larger-scale topography (Fig. 12A to D).
Four arrangements of cross-beds, types A, B, C and D, were observed (Figs 13 and 14). Types
A, B and C appear in sandstones, and Type D appears only in pebble conglomerates. Type A feature a
thick basal set of compound strata scoured along its top by an upstream-dipping surface, and
overlain by a thinner coset composed of smaller cross-beds with a mean thickness and standard
deviation of 0.12 m ± 0.01 m and 0.07 m ± 0.01 m (Figs 13, 14A and 14B). The upstream dips of the
scour surface range from 5° to 13° (mean = 7°, n = 6). In this case, the orientation of small cross-beds
is roughly parallel to the dip direction of the larger cross-beds.
Type B feature a thick basal set of compound cross-sets that change both dip and thickness in
the downstream direction (Figs 13, 14C and 14D). Individual cross-beds thicken by as much as 300%
over the course of 1.5 m in the downstream direction (0.08 m to 0.23 m, 0.07 m to 0.23 m and 0.06
m to 0.19 m). Correspondingly, the bounding surfaces separating these cross-beds shallow
downstream from as steep as 26° to as shallow as 5°, and the upper bounding surface transitions
from being markedly erosional to conformable. Similar to type A, the smaller cross-beds roughly
parallel the dip direction of the larger cross-beds. The mean thickness and standard deviation of
these sets at shallowly dipping sections was 0.13 m ± 0.01 m and 0.08 m ± 0.01 m.
Type C is also composed of compound strata, but in these cases the dip directions of the
smaller foresets were roughly transverse to the dip direction of the larger cross-beds (Figs 13 and
10D). Type C sets were mostly identified in plan-view exposures, so set thickness measurements
were not made.
Type D feature no compound cross-stratification, and bounding surfaces were sub-horizontal
or showed local variable curvature associated with trough geometry (Figs 13, 14E and 14F). Type D
strata have a ca 90° scatter of transport directions, apparent by the juxtaposition of trough and dip-
Acc
epte
d A
rtic
le

This article is protected by copyright. All rights reserved
normal exposures (Slingerland & Williams, 1979). The mean thickness and σ of type D sets was 0.19
m ± 0.02 m and 14.7 m ± 0.02 m, and sections contain up to ten stacked sets.
Transport anomalies
Maps of transport anomalies (ѲTA) for the Ruby Ranch Member channel belts and North Loup
River are presented in Fig. 15A to C. The associated ѲTA histograms and statistical moments for these
systems and the Trinity River are presented in Fig. 16A to D. All datasets have mean values ranging
between -12˚ and +6˚, and standard deviations ranging from 25° to 35°. In the North Loup River,
anomalies were driven by flow routing around bars (Fig. 17B). Measurements approach the reach
mean when assembled over a downstream distance of about three bar lengths, or half the reach
length, indicating adequate sampling (Figs 15C and 17A to C). In the Trinity River, as expected for
meandering rivers, both the magnitude of the mean and standard deviation of the transport
anomalies are the smallest (Fig. 16D). Transport anomalies that are observed are located along point
bar surfaces (Dietrich & Smith, 1984). In the Ruby Ranch Member, areas with concentrated high
anomalies were found to be located at ridge bends with concentrations of transport-normal-dipping
accretion surfaces (Fig. 15A to B).
DISCUSSION
This discussion begins with interpretations of sedimentary structures deposited by the
ancient Ruby Ranch Member rivers. The avulsions, lateral migration and aggradation of these rivers
(their kinematics) are then inferred through analysis of these sedimentary structures. A regional
depositional setting is then interpreted based on the kinematics of the rivers.
Dune, bar, belt and overbank strata
Acc
epte
d A
rtic
le

This article is protected by copyright. All rights reserved
A distinction is drawn between cross-sets on either side of the break in scale shown in Fig.
8A. The thinner-bedded trough cross-strata (Fig. 7) are interpreted as forming via the migration of
three-dimensional dunes with variably deep troughs (Rubin, 1987). In planform and vertical sections,
these are clearly distinct from larger-scale dipping strata (Fig. 10A to D), which do not show the
same bounding-surface curvature and, significantly, feature cross-strata defined by compound cross-
sets (Figs 10D and 14C to D). These larger-scale strata are interpreted as river-bar sets (Edwards et
al., 1983; Haszeldine, 1983; Almeida et al., 2016). The population of dip direction versus centreline
trend anomalies for the bar strata feature a larger spread of values and modes situated far from zero
(compare Fig. 16A to D against Fig. 16E to F). The range of values, particularly the prevalence of
palaeoflow-normal values, suggests that the formative bar types included point bars with primarily
cross-stream accreting surfaces (Fig. 10D), and free bars which can feature cross-stream-dipping,
downstream-dipping and upstream-dipping accretion surfaces (Smith, 1972; Skelly et al., 2003;
Almeida et al., 2016). Point bar structures are also interpreted from ridge-scale observations, where
clusters of bar surfaces dip towards the convex sides of ridge bends (Fig. 11A and B; note that the
western-most point bar strata define a convex-north bend, Fig. 1C). Free bars, discussed below, can
be observed on a much smaller scale, and are represented by bar accretion surfaces not associated
with a point bar (Fig. 11A and B).
Together, these dune-scale and bar-scale cross-strata are interpreted as channel belts
formed during episodes of active sediment transport in channels ca 1.28 m deep, based on bar
thickness (Mohrig et al., 2000). The mudstones associated with ridge-scale erosional surfaces are
interpreted to represent sedimentation during periods of channel abandonment, which indicates a
system that experienced multiple avulsions and channel reoccupations (Mohrig et al., 2000; Jones &
Hajek, 2007; Cuevas Martínez et al., 2010). The observed mudstone layers are laterally
discontinuous, which the authors interpret as due to local scour associated with re-occupation that
created the erosional surface. Thus, the ridges represent channel-belt complexes composed of
stacked, individual channel belts and the stratigraphic continuity between the two ridges suggests
that they once formed a continuous deposit.Acc
epte
d A
rtic
le

This article is protected by copyright. All rights reserved
The four cross-stratal types A through to D observed in the Ruby Ranch Member ridges
document the interaction of the ancient dunes and bars in the formative river channels (Figs 13 and
14). Type A architectures are characteristic of free bars, and possess a bar-scale bounding surface
separating bar lee strata below from deposits of the bar-stoss surface above (Fig. 14A and B). As
such, this bounding surface preserves the characteristic dip of the stoss side of the bar form. The
bar-lee strata may be compound in that they are composed of dune cross-sets, or bar slip faces,
which may nonetheless be influenced by superimposed dunes and ripples (Reesink & Bridge, 2011;
Reesink, 2018). Theory (Paola & Borgman, 1991) and a recent morphodynamic bedform model
(Swanson et al., 2019) show that set stacking can occur even under conditions of net bypass or
erosion because of variability in dune scour depths.
Type B architectures highlight change in compound dune strata due to migration of free bars
(Figs 13, 14C and 14D). The steepest 26° cross-strata represent bar-lee construction most
perpendicular to the average transport direction observed. The observed shallowing of bounding-
surface dips and thickening of sets in the downstream direction records the planform deformation of
the bar crest over time, where steep downstream-accreting surfaces gradually become more
laterally accreting. As is evident from the compound nature of these sets, this bar growth is driven
by dune accretion in front of the bar. At the two locations where A and B type architectures are
adjacent (Fig. 14A to D), the transition of the stoss scour surface to the conformable bounding
surface of a bar cross-stratum represents the delivery of sediment mined from the bar stoss up and
over the crest of the bar, and onto the bar lee. Taken together, these two architectures preserve the
processes associated with bar migration via the mining and delivery of sediment by a surface veneer
of smaller dunes compound to a larger free bar. One lateral section shows the stacking of stoss
strata on lee strata, recording the aggradation and migration of a bar (Fig. 14G and H).
The type C compound strata define bar growth at an oblique angle to the net transport
direction, and define the lateral migration of a bank-attached bar form (Fig. 10D). The coarser, non-
compound type D architectures are interpreted as thalweg deposits (Fig. 14E and F). Together, these
four architectural types describe the construction of channel-bottom topography within individual Acc
epte
d A
rtic
le

This article is protected by copyright. All rights reserved
channel belts via the migration and growth of dunes (both on bars and in the thalweg), free bars and
point bars.
Channel-bed topography
Preserved bar form topography is interpreted to record the moment of channel
abandonment (Fig. 12A to D). Two lines of evidence support this. First, in both cross-section and
map view, the compound relationship between dune and bar strata informs us that entire bar forms
are preserved, complete with bar rollovers that represent the tops of bars (topset, Figs 12, 13, 14
and 19). Second, the stoss-positioned dune sets are restricted to a surface veneer composing less
than the upper 25% of the bar, with the remainder composed of steeply dipping bar-scale strata. If
erosion of ridge surfaces commonly broke through the surface veneer of stoss dune sets, then large
bar scale strata would constitute a greater percentage of sedimentary structures exposed on ridge
surfaces. Given that sandstone trough cross-sets, which are interpreted as superimposed on bars,
constitute nearly 75% of all mapped sets, the authors would interpret a less well-preserved channel
bed to expose up to 75% bar strata. Instead, dunes occupy an order of magnitude more surface area
of the outcrop. The preservation of the river-bottom topography at the time of avulsion is
interpreted to be the consequence of a relatively rapid channel abandonment coupled with minimal
erosion of the channel belt by the subsequent channel reoccupation.
Channel-planform geometry
The near zero means and the high kurtosis of the Ruby Ranch Member Formation
palaeotransport anomaly measurements, coupled with the similarity of the standard deviations
measured in the ancient and the modern, are interpreted to indicate that the channel-belt-complex
geometry preserves the formative river centreline in a reliable way (Fig. 16A to D). Regions of the
channel belts showing concentrations of high transport anomaly measurements are associated with Acc
epte
d A
rtic
le

This article is protected by copyright. All rights reserved
point bar lateral accretion surfaces (Figs 1C, 11A, 11B, 16A and 16B), supporting the hypothesis that
lateral point bar migration is a cause of high anomaly measurements (Fig. 4B). However, these
regions do not represent a majority of the ridge area.
The studied ridges are composed of several vertically stacked channel belts. The preservation
of the formative river channel centrelines through multiple re-occupations of the channel is
expected in fluvial settings with high rates of vertical aggradation within the channel relative to
lateral migration rates (Gibling, 2006; Jerolmack & Mohrig, 2007). As a result, there is a general lack
of centreline distortion, even though the ridge represents a complex of stacked channel belts.
Channel-belt thickness
Because avulsions are likely to occur when a channel bed has aggraded to a sufficient level of
superelevation, the thickness of a preserved channel belt, on average, is posited to equal
palaeochannel depth plus an aggradational component. The thickness of a free bar set from topset
to bottomset is assumed to be a measure of local channel depth (Mohrig et al., 2000). Bar
measurements reported in Fig. 8A suggest an overall, mean channel depth of 1.28 ± 0.05 m. The
mean belt thickness of 3.10 m ± 0.22 m (Fig. 6C) is then composed of an aggradational component
consisting of 1.82 m ± 0.20 m. This indicates that, on average, a channel belt accumulated a
thickness of 1.53 ± 0.22 times its original depth before avulsing, creating a channel belt with a total
thickness of 2.42 ± 0.19 times its flow depth.
River-bed kinematics
Dune accumulation on bars and in the thalweg
Analysis of Paola & Borgman (1991) shows that bedforms with gamma-distributed heights
create a predictable exponential distribution of set thicknesses in cases of no net aggradation. Acc
epte
d A
rtic
le

This article is protected by copyright. All rights reserved
Bridge & Best (1997) and Jerolmack & Mohrig (2005) emphasize the importance of bed aggradation
as a control on the distribution of set thickness, showing that increased aggradation rates decrease
the relative control of variable scour depth on set thickness. Jerolmack & Mohrig (2005) showed that
the coefficient of variation (cv) of set thicknesses decreases from a value of 0.88 in the case of no
aggradation, to values approaching the cv of the formative bedform heights with significant bed
aggradation. Coupled with this change in cv is a gradual shift from the predicted exponential
distribution of set thicknesses, to a gamma distribution mirroring the distribution of the formative
bedforms. Significantly, this analysis has been shown to be general enough to apply to ancient fluvial
(Jerolmack & Mohrig, 2005) and aeolian strata (Swanson et al., 2019; Cardenas et al., 2019).
Therefore, the reporting and analysis of set thickness distributions should be considered a significant
part of any quantitative reconstruction of clastic sedimentary systems where there is an interest in
understanding the kinematics and transport within the ancient system.
When taken together, all measured dune set thicknesses (n = 350) have a cv of 0.79 ± 0.04
(Fig. 8A). This value implies set production by variable scour under conditions of minimal bed
aggradation (cv = 0.88 ± 0.03 for bypass case in Bridge, 1997). The scour-dominated case also creates
laterally discontinuous sets (Jerolmack & Mohrig, 2005; Cardenas et al., 2019). This scour dominance
appears to be at odds with the well-preserved bars described above (Fig. 14C and D). To understand
the construction of the channel belt, measurements must be locally standardized to account for
variability in bedform height at the reach scale, which is not necessarily representative of local
variability (Reesink et al., 2015). Assembling all measurements into a single calculation without
considering local architecture can result in inaccurate interpretations.
Set-thickness analysis performed separately for bar-lee sets, bar-stoss sets and thalweg sets
yields a different result than the bulk description. The first step in analyzing data from each sub-
environment was to divide each set thickness by the mean set thickness for its local coset. These
dimensionless values of set thickness were then collected for every bar-lee, bar-stoss and thalweg
deposit. Standardized cumulative distribution functions (CDFs) are shown in Fig. 18. Coefficients of
variation for the standardized distributions are 0.29 ± 0.04 for lee sets, 0.47 ± 0.07 for stoss sets and Acc
epte
d A
rtic
le

This article is protected by copyright. All rights reserved
0.67 ± 0.10 for thalweg sets. Although cv values as low as 0.29 were not examined by Jerolmack &
Mohrig (2005), interpolation of fig. 4B from that study leads to a ratio of aggradation rate (r) to
migration rate (c) for lee sets of ca 10-1 (climb angle from 5 to 6°). Stoss sets have r / c of ca 10-1.5
(climb angle from 1 to 2°) and thalweg sets have r / c of ca 10-2.5 (climb angle from 0.1 to 0.2°). The
lee sides of downstream-migrating barforms, where the most sediment accumulation is expected
(Reesink et al., 2015), have the highest ratio of aggradation rate to migration rate. This significant
aggradation is supported by a Kolmogorov–Smirnov statistical test comparing the measurements to
fitted exponential and gamma curves (Fig. 18A to C). For lee sets, the exponential curve is rejected at
a significance level of 0.05 (p < 0.001) and the gamma curve is not (p = 0.46). This is consistent with
the observed stacking and downstream thickening of sets in lee-type architectures (Fig. 14C and D).
Even though thalweg sets are rejected as being exponentially distributed (p = 0.02) and not rejected
as gamma distributed (p = 0.17), the two fitted curves are more similar than in the lee and stoss
cases.
A non-trivial amount of climb is recorded by stoss sets, given the cv of 0.47 ± 0.07, rejection
of an exponential fit (p = 0.01) and non-rejection of a gamma fit (p = 0.90). This indicates some
degree of upstream accumulation driven by the stoss-side aggradation of dune sets, likely during the
final flood (Lunt & Bridge, 2004). Using ground-penetrating radar cross-sections, Skelly et al. (2003)
also interpreted upstream accretion in modern bars of the Niobrara River, Nebraska, USA, which
represent the growth and deformation of bars as they migrate.
Constraints on the time recorded by individual channel belts
How is time distributed through Ruby Ranch Member channel belts? Backing out
sedimentation rates from these strata would provide information on the kinematics of the formative
rivers, as well as how local controls might dictate the construction of the rock record (Sadler, 1981;
Jerolmack & Sadler, 2015; Paola et al., 2018). The distribution of cross-set thicknesses, in
conjunction with assumed bedform migration rates, can provide some sense of the minimum Acc
epte
d A
rtic
le

This article is protected by copyright. All rights reserved
amount of time associated with aggradation of each channel belt. This analysis is performed for the
two major channel belt components observed here, bar and thalweg accumulations.
Given that the accumulation of dune sets at the bar lee is the process through which these
bars migrated (Fig. 14C and D), it follows that:
rlee / clee = sbar / mbar (2)
where rlee is the aggradation rate of the bed, clee is the migration rate of dunes, rlee /clee of bar lee
sets is calculated in the prior section as 10-1, and sbar / mbar is the bar thickness over the equivalent
migration distance (Fig. 19). Solving for mbar, the only unknown, yields 12.8 ± 0.5 m of bar migration,
with uncertainty based on the number of measurements. Downstream-migrating bars migrate ca 10
m per day in the North Loup and other rivers (Meade, 1985; Mohrig & Smith, 1996). Assuming that
10 m per day is a comparable rate to the ancient Ruby Ranch Member fluvial system, which is a
reasonable, order of magnitude assumption given the similar flow depths, channel widths and the
distribution of dune heights in the North Loup relative to the measured cross-set thicknesses herein
(Mohrig & Smith, 1996), the observed lee architectures are a record of only ca 1.28 ± 0.05 days of
sedimentation. This suggests that the bar strata and associated compound dune strata do not record
the gradual aggradation of the channel bed leading up to avulsion, but rather record the higher
frequency modification of the channel bed via bar migration. Instead, it is hypothesized that the
aggradation of the channel bed is recorded in thalweg strata. To test this hypothesis, Eq. 2 is
redefined in terms of the thalweg sets and the average thickness of the aggradational component of
the channel belts, with a slower aggradation rate predicted. Assuming steady construction at North
Loup dune migration rates (ca 60 m per day, Mohrig & Smith, 1996), only 9.7 days ± 1.1 days are
required to accumulate the thalweg strata reported here. While indeed longer-term accumulations
than the bar strata, these sets do not record slow channel aggradation over avulsion timescales.
For most rivers, occupation may last anywhere from years to thousands of years (Stouthamer
& Berendsen, 2001; Slingerland & Smith, 2004). It is unlikely that these channels were only occupied
for 9.7 days. Instead, these strata may only represent the aggradation and scour filling that occurred Acc
epte
d A
rtic
le

This article is protected by copyright. All rights reserved
during the final episode of sedimentation that preceded avulsion and channel abandonment. This
episode is likely to coincide with the final flood prior to avulsion. This result suggests that the
channel was in a state of net bypass for most of its occupation, or close enough to it that subsequent
scouring during floods removed any slowly accumulated strata. Had channel abandonment not
prevented it, the flood-associated aggradation recorded by each channel belt would likely have been
reworked to a lower, possibly pre-flood elevation (Fig. 20). The complete reworking of the channel
bed during flood stage has been observed in modern net-depositional rivers (Nittrouer et al., 2011a)
and in experiments (Leary & Ganti, 2020). This also suggests that floodplain deposits might more
completely record successive episodes of flood-stage deposition than channel belts, as presumably
an episode of floodplain deposition is not immediately followed by reworking.
Channel versus floodplain accumulation
On average, a formative river of the Ruby Ranch Member constructed a channel belt that
was 2.42 ± 0.19 times thicker than its characteristic flow depth before avulsing. This thickness to
depth ratio is somewhat larger than the value of 1.84 measured for the ancient Guadalope–
Matarranya fluvial system in Spain (Mohrig et al., 2000, table 2). Without preserved levée deposits,
it is unclear whether the increased relative belt thickness recorded by the Ruby Ranch Member is
connected to an increase in incision depth or channel superelevation. However, the preservation of
mudstones between vertically stacked channel belts, as well as preserved bar rollovers suggest that
the standardized incision depths for the Ruby Ranch Member were comparable to the Guadalope–
Matarranya system (Mohrig et al., 2000). Assuming that the threshold superelevation trigger for
avulsion proposed by Mohrig et al. (2000) is suitably general, the increased bed aggradation for
Ruby Ranch channel belts is hypothesized to have required increased Ruby Ridge floodplain
aggradation compared to the Guadalope–Matarranya system. That is, in order for the channel bed
to reach the threshold superelevation to avulse, more channel bed aggradation was required during
the final depositional episode to catch up with levées and floodplain that steadily aggraded during Acc
epte
d A
rtic
le

This article is protected by copyright. All rights reserved
each bankfull event (Fig. 20). This scenario is consistent with the interpreted reworking of the
channel bed between bankfull events, where any associated accumulation and scouring are
reworked or filled such that there is not enough net channel bed change to avoid scouring by the
following flood. This is contrasted by steady, gradual levée and floodplain aggradation, assuming
that these overbank environments are less likely to be reworked between floods.
Large-scale depositional setting
The interpreted kinematics of the Ruby Ranch Member rivers are consistent with the
kinematics reported for megafan channels. Channels in Andean megafans are highly unstable and
mobile, and avulse on the scale of years, limiting any significant lateral migration (e.g. Horton &
DeCelles, 2001; Chakraborty et al., 2010). Broader channel belts can develop on megafans, but these
are generally limited to meandering rivers confined within lobe-cutting incised valleys that prevent
avulsions (Assine et al., 2014). The authors therefore interpret the Ruby Ranch Member of the Cedar
Mountain Formation to represent the accumulations of an early Cretaceous megafan or megafans
draining the Sevier orogenic belt. Given the importance of floodplain aggradation in stacking these
channel belts, the Ruby Ranch Member likely represents a medial fan setting (Owen et al., 2015).
This contribution is useful in that a regional interpretation of depositional setting can be made using
only local sedimentology, possibly even in cores, without the dependence on observing fan-scale
changes in facies which may not be exposed well enough in all formations (e.g. Owen et al., 2015).
CONCLUSIONS
Remnant, erosion-resistant ridges of the Ruby Ranch Member of the Cretaceous Cedar
Mountain Formation are channel-belt complexes, composed of five or six stacked channel belts.
Each channel belt is composed of bar and dune strata that exhibit a variety of compound
relationships indicating the role of the latter in the accumulation of the former. In simple terms, bars Acc
epte
d A
rtic
le

This article is protected by copyright. All rights reserved
created topography, which forced dune sedimentation in the space in front of or next to a bar,
which then drove further bar migration.
Free-bar migration rates are estimated from thickness distributions of compound dune cross-
strata. Free bars represent only about one day of accumulation, yet they comprise on average 41%
of a channel belt’s total thickness. Accumulations of dunes in the thalweg represent the rest of the
belt and the aggradation of the channel bed, and are distinct from bar strata. Thalweg cross-set-
thickness distributions are used to estimate the duration of bed aggradation at only about ten days.
These ten days are interpreted to represent the final bankfull episode preceding avulsion, rather
than the duration of the entire occupation of the channel. Prior bankfull accumulations that did not
lead to avulsion were reworked to lower elevations by subsequent non-flood flows. Therefore, these
channels primarily functioned as conduits for bypassing sediment, and most of the total time
recorded by these channel belts is represented by their basal erosional surfaces.
Two aspects of the formative river systems are preserved particularly well, and record
frequent and rapid avulsions, and a minor amount of total lateral migration. First, free bars are
preserved completely, from stoss to lee, and are observed in both vertical sections and as
topography on ridge tops. This observation is significant on its own; if this palaeobar topography can
be detected by using remote sensing, future analysis could use it to better constrain flow depths of
ancient rivers from fluvial channel belts exposed at the surface of Mars. Second, the planform
geometry of the ridge and channel-belt complex represents the planform geometry of the formative
rivers well, despite multiple reoccupations. Frequent, rapid avulsions and limited lateral migration
are consistent with megafan channels, thus a megafan is interpreted herein as the depositional
setting of these channel-belt complexes. This provides a way to interpret regional depositional
setting by using the local sedimentology, rather than requiring regional exposure showing predicted
facies changes.
Significantly, this synthesis of vertical and planform channel belts measurements provides a
baseline for future studies facilitated by high resolution, drone-derived planform datasets. The Acc
epte
d A
rtic
le

This article is protected by copyright. All rights reserved
workflow presented here may be particularly useful for the upcoming 2020 Mars Rover mission to
Jezero crater, Perseverance, which will examine exhumed fluvial and deltaic strata using rover-
mounted cameras and the first helicopter drone on Mars, Ingenuity.
ACKNOWLEDGEMENTS
We thank Chief Editor Ian Kane, Associate Editor Christopher Fielding, Arjan Reesink, Matt
Joeckel and two anonymous reviewers for constructive feedback that helped to improve this
manuscript. Hima Hassenruck-Gudipati, Woong Mo Koo and David Brown are thanked for their field
assistance. The staff of Green River State Park, Utah, were accommodating to our large group. This
paper has improved following discussions with members of the David Mohrig Research Group and
the Quantitative Clastics Laboratory, as well as Wonsuck Kim, Joel Johnson, Zoltan Sylvester, Cole
Speed, Paola Passalacqua, Alistair Hayden, Mike Lamb, Becky Williams, Jenn Pickering and Tim
Demko. Funding was provided by the University of Texas Jackson School of Geosciences, the
University of Texas Graduate School and the RioMAR Industry Consortium.
DATA AVAILABILITY STATEMENT
The data that support the findings of this study are available from the corresponding author
upon reasonable request.
Acc
epte
d A
rtic
le

This article is protected by copyright. All rights reserved
REFERENCES
Allen, J.R.L. (1970) A Quantitative Model of Climbing Ripples and Their Cross-Laminated Deposits.
Sedimentology, 14, 5–26.
Allen, J.R.L. (1983) Studies in fluviatile sedimentation: bars, bar-complexes and sandstone sheets
(low-sinuosity braided streams) in the Brownstones (L. Devonian), Welsh Borders.
Sedimentary Geology, 33, 237–293.
Almeida, R.P., Freitas, B.T., Turra, B.B., Figueiredo, F.T., Marconato, A., and Janikian, L. (2016)
Reconstructing fluvial bar surfaces from compound cross-strata and the interpretation of bar
accretion direction in large river deposits. Sedimentology, 63, 609–628.
Ashworth, P.J. (1996) Mid-channel bar growth and its relationship to local flow strength and
direction. Earth Surface Processes and Landforms, 21, 103-123.
Assine, M.L., Corradini, F.B., Pupim, F. do N., and McGlue, M.M. (2014) Channel arrangements and
depositional styles in the São Lourenço fluvial megafan, Brazilian Pantanal wetland.
Sedimentary Geology, 301, 172-184.
Berens, P. (2009) CircStat: A MATLAB Toolbox for Circular Statistics. Journal of Statistical Software,
31, 1-21.
Bridge, J.S. (1997) Thickness of sets of cross strata and planar strata as a function of formative bed-
wave geometry and migration, and aggradation rate. Geology, 25, 971-974.
Bridge, J.S., and Best, J. (1997) Preservation of planar laminae due to migration of low-relief bed
waves over aggrading upper-stage plane beds: comparison of experimental data with theory.
Sedimentology, 44, 253-262.
Acc
epte
d A
rtic
le

This article is protected by copyright. All rights reserved
Burr, D.M., Enga, M.-T., Williams, R.M., Zimbelman, J.R., Howard, A.D., and Brennand, T.A. (2009)
Pervasive aqueous paleoflow features in the Aeolis/Zephyria Plana region, Mars. Icarus, 200,
52-76.
Cardenas, B.T., Mohrig, D., and Goudge, T.A. (2018) Fluvial stratigraphy of valley fills at Aeolis
Dorsa, Mars: Evidence for base-level fluctuations controlled by a downstream water body.
Geological Society of America Bulletin, 130, 484-498.
Cardenas, B.T., Kocurek, G., Mohrig, D., Swanson, T., Hughes, C.M., and Brothers, S.C. (2019)
Preservation of autogenic processes and allogenic forcings within set-scale aeolian
architecture II: the scour-and-fill dominated Jurassic Page Sandstone, Arizona, USA. Journal of
Sedimentary Research, 89, 741-760.
Cardenas, B.T., Swartz, J.M., Mohrig, D., Prokocki, E.W. Setting up the preservation of fluvial
channel belts. Preprint available at EarthArxiv. DOI: 10.31223/osf.io/y7m4w
Carling, P.A., and Leclair, S.F. (2019) Alluvial stratification styles in a large, flash-flood influenced
dryland river: The Luni River, Thar Desert, north-west India. Sedimentology, 66, 102-128.
Carpenter, K. (2014) Where the sea meets the land: the unresolved Dakota problem in Utah. Utah
Geological Association Publication, 43, 357-372.
Chadwick, A.J. (2020) Mechanics of river avulsions on lowland river deltas. PhD Dissertation,
California Institute of Technology, https://doi.org/10.1029/2019GL082491.
Chakraborty, T., Kar, R., Ghosh, P., and Basu, S. (2010) Kosi megafan: Historical records,
geomorphology and the recent avulsion of the Kosi River. Quaternary International, 227, 143-
160.
Chamberlin, E.P., and Hajek, E.A. (2015) Interpreting paleo-avulsion dynamics from multistory sand
bodies. Journal of Sedimentary Research, 85, 82–94.Acc
epte
d A
rtic
le

This article is protected by copyright. All rights reserved
Chamberlin, E.P., and Hajek, E.A. (2019) Using bar preservation to constrain reworking in channel-
dominated fluvial stratigraphy. Geology, 47, 531-534.
Cuevas Martínez, J.L., Cabrera Pérez, L., Marcuello, A., Arbués Cazo, P., Marzo Carpio, M., and
Bellmunt, F. (2010) Exhumed channel sandstone networks within fluvial fan deposits from
the Oligo-Miocene Caspe Formation, South-east Ebro Basin (North-east Spain).
Sedimentology, 57, 162–189.
Currie, B.S. (1998) Upper Jurassic-Lower Cretaceous Morrison and Cedar Mountain Formations, Ne
Utah-NW Colorado: Relationships between Nonmarine Deposition and Early Cordilleran
Foreland-Basin Development. Journal of Sedimentary Research, 68, 632-652.
Currie, B.S. (2002) Structural configuration of the Early Cretaceous cordilleran foreland-basin system
and the Sevier thrust belt, Utah and Colorado. The Journal of Geology, 110, 697-718.
Davis, J.M., Balme, M., Grindrod, P.M., Williams, R.M.E., and Gupta, S. (2016) Extensive Noachian
fluvial systems in Arabia Terra: implications for early Martian climate. Geology, 44, 847-850.
DeCelles, P.G., Langford, R.P., and Schwartz, R.K. (1983) Two New Methods of Paleocurrent
Determination from Trough Cross-Stratification. Journal of Sedimentary Research, 53, 629-
642.
Dietrich, W.E., and Smith, J.D. (1984) Bed load transport in a river meander. Water Resources
Research, 20, 1355-1380.
Dott, R.H., Jr. (1973) Paleocurrent Analysis of Trough Cross Stratification. Journal of Sedimentary
Research, 43, 779-783.
Durkin, P.R., Hubbard, S.M., Holbrook, J., and Boyd, R. (2018) Evolution of fluvial meander-belt
deposits and implications for the completeness of the stratigraphic record. Geological Society
of America Bulletin, 130, 721-739.Acc
epte
d A
rtic
le

This article is protected by copyright. All rights reserved
Edmonds, D.A., Hajek, E.A., Downton, N., and Bryk, A.B. (2016) Avulsion flow-path selection on
rivers in foreland basins. Geology, 44, 695–698.
Edwards, M.B., Eriksson, K.A., and Kier, R.S. (1983) Paleochannel geometry and flow patterns
determined from exhumed Permian point bars in north-central Texas. Journal of Sedimentary
Research, 53, 1261-1270.
Friend, P.F., Slater, M.J., and Williams, R.C. (1979) Vertical and lateral building of river sandstone
bodies, Ebro Basin, Spain. Journal of the Geological Society, 136, 39–46.
Ganti, V., Paola, C., and Foufoula-Georgiou, E. (2013) Kinematic controls on the geometry of the
preserved cross sets. Journal of Geophysical Research: Earth Surface, 118, 1296-1307.
Garrison, J.R., Brinkman, D., Nichols, D.J., Layer, P., Burge, D., and Thayn, D. (2007) A
multidisciplinary study of the Lower Cretaceous Cedar Mountain Formation, Mussentuchit
Wash, Utah: a determination of the paleoenvironment and paleoecology of the Eolambia
caroljonesa dinosaur quarry. Cretaceous Research, 28, 461–494.
Gibling, M.R. (2006) Width and thickness of fluvial channel bodies and valley fills in the geological
record: a literature compilation and classification. Journal of Sedimentary Research, 76, 731–
770.
Goudge, T.A., Mohrig, D., Cardenas, B.T., Hughes, C.M., and Fassett, C.I. (2018) Stratigraphy and
paleohydrology of delta channel deposits, Jezero crater, Mars. Icarus, 301, 58–75.
Hajek, E.A., and Edmonds, D.A. (2014) Is river avulsion style controlled by floodplain
morphodynamics? Geology, 42, 199-202.
Hartley, A.J., Owen, A., Swan, A., Weissmann, G.S., Holzweber, B.I., Howell, J., Nichols, G., and
Scuderi, L. (2015) Recognition and importance of amalgamated sandy meander belts in the
continental record. Geology, 43, 679-682.Acc
epte
d A
rtic
le

This article is protected by copyright. All rights reserved
Haszeldine, R.S. (1983) Fluvial bars reconstructed from a deep, straight channel, Upper
Carboniferous coalfield of Northeast England. Journal of Sedimentary Research, 53, 1233-
1247.
Hayden, A.T., Lamb, M.P., Fischer, W.W., Ewing, R.C., McElroy, B.J., and Williams, R.M.E. (2019)
Formation of sinuous ridges by inversion of river-channel belts in Utah, USA, with
implications for Mars. Icarus, 332, 91-110.
Heller, P.L., and Paola, C. (1989) The paradox of Lower Cretaceous gravels and the initiation of
thrusting in the Sevier orogenic belt, United States Western Interior. Geological Society of
America Bulletin, 101, 864-875.
Heller, P.L., and Paola, C. (1996) Downstream changes in alluvial architecture: an exploration of
controls on channel-stacking patterns. Journal of Sedimentary Research, 66, 297-306.
Hooke, J.M., and Yorke, L. (2011) Channel bar dynamics on multi-decadal timescales in an active
meandering bar. Earth Surface Processes and Landforms, 36, 1910-1928.
Hughes, C.M., Cardenas, B.T., Goudge, T.A., and Mohrig, D. (2019) Deltaic deposits indicative of a
paleo-coastline at Aeolis Dorsa, Mars. Icarus, 317, 442-453.
Ikeda, H. (1989) Sedimentary controls on channel migration and origin of point bars in sand-bedded
meandering rivers. In S. Ikeda and G. Parker (Eds.), River Meandering: Water Resources
Monograph, 12, 51-68. American Geophysical Union: Washington, D.C.
Ikeda, S., Parker, G., and Sawai, K. (1981) Bend theory of river meanders. Part 1. Linear
development. Journal of Fluid Mechanics, 112, 363-377.
Jerolmack, D.J., and Mohrig, D. (2005) Frozen dynamics of migrating bedforms. Geology, 33, 57-60.
Jerolmack, D.J., and Mohrig, D. (2007) Conditions for branching in depositional rivers. Geology, 35,
463–466.Acc
epte
d A
rtic
le

This article is protected by copyright. All rights reserved
Joeckel, R.M., Ludvigson, G.A., and Kirkland, J.I. (2017) Lower Cretaceous paleo-Vertisols and
sedimentary interrelationships in stacked alluvial sequences, Utah, USA. Sedimentary
Geology, 361, 1-24.
Joeckel, R.M., Ludvigson, G.A., Möller, A., Hotton, C.L., Suarez, M.B., Suarez, C.A., Sames, B.,
Kirkland, J.I., and Hendrix, B. (2019) Chronostratigraphy and terrestrial palaeoclimatology of
Berriasian-Hauterivian strata of the Cedar Mountain Formation, Utah, USA. Geological
Society, London, Special Publications, 498,
Jones, H.L., and Hajek, E.A. (2007) Characterizing avulsion stratigraphy in ancient alluvial deposits.
Sedimentary Geology, 202, 124-137.
Kirkland, J.I., Cifelli, R.L., Britt, B.R., Burge, D.L., DeCourten , F.L., Eaton, J.G., and Parrish, J.M.,
(1999) Distribution of vertebrate faunas in the Cedar Mountain Formation, east central Utah,
in Gillette, D.D., ed., Vertebrate Paleontology in Utah: Utah Geological Survey Miscellaneous
Publication, 1999–1, 201–217.
Kowallis, B.J., Heaton, J.S., and Bringhurst, K. (1986) Fission-track dating of volcanically derived
sedimentary rocks. Geology, 14, 19-22.
Lazarus, E.D., and Constantine, J.A. (2013) Generic theory for channel sinuosity. Proceedings of the
National Academy of Sciences, 110, 8447-8452.
Leary, K.C.P., and Ganti, V. (2020) Preserved fluvial cross strata record bedform disequilibrium
dynamics. Geophysical Research Letters, 47, https://doi.org/10.1029/2019GL085910.
Ludvigson, G.A., Joeckel, R.M., González, L.A., Gulbranson, E.L., Rasbury, E.T., Hunt, G.J., Kirkland,
J.I., and Madsen, S. (2015) Correlation of Aptian-Albian carbon isotope excursions in
continental strata of the Cretaceous foreland basin, Eastern Utah, U.S.A. Journal of
Sedimentary Research, 80, p. 955-974.
Acc
epte
d A
rtic
le

This article is protected by copyright. All rights reserved
Ludvigson, G.A., Joeckel, R.M., Murphy, L.R., Stockli, D.F., González, L.A., Suarez, C.A., Kirkland, J.I.,
and Al-Suwaidi, A. (2015) The emerging terrestrial record of Aptian-Albian global change.
Cretaceous Research, 56, 1-24.
Lunt, I.A., and Bridge, J.S. (2004) Evolution and deposits of a gravelly braid bar, Sagavanirktok River,
Alaska. Sedimentology, 51, 415-432.
Mahon, R.C., and McElroy, B. (2018) Indirect estimation of bedload flux from modern sand-bed
rivers and ancient fluvial strata. Geology, 46, 579-582.
Maizels, J.K. (1987) Plio-Pleistocene raised channel systems of the western Sharqiya (Wahiba),
Oman. Geological Society of London, Special Publications, 35, 31–50.
Maizels, J. (1990) Raised channel systems as indicators of palaeohydrologic change: a case study
from Oman. Palaeogeography, Palaeoclimatology, Palaeoecology, 76, 241–277.
Maizels, J., and McBean, C. (1990) Cenozoic alluvial fan systems of interior Oman:
palaeoenvironmental reconstruction based on discrimination of palaeochannels using
remotely sensed data. Geological Society of London, Special Publications, 49, 565–582.
Mason, J., and Mohrig, D. (2018) Using time-lapse lidar to quantify river bend evolution on the
meandering coastal Trinity River, Texas, USA. Journal of Geophysical Research: Earth Surface,
123, 1133-1144.
Mason, J., and Mohrig, D. (2019a) Scroll bars are inner bank levees along meandering river bends.
Earth Surface Processes and Landforms, 44, 2649-2659.
Mason, J., and Mohrig, D. (2019b) Differential bank migration and the maintenance of channel
width in meandering river bends. Geology, 47, 1136-1140.
Mason, J. (2018) Sediment transport and the geomorphic evolution of the coastal Trinity River, TX.
PhD Dissertation, University of Texas at Austin, 167 p.Acc
epte
d A
rtic
le

This article is protected by copyright. All rights reserved
McKee, E.D., and Weir, G.W. (1953) Terminology for stratification and cross-stratification in
sedimentary rocks. Geological Society of America Bulletin, 64, 381–390.
Meade, R.H. (1985) Wavelike movement of bedload sediment, East Fork River, Wyoming.
Environmental Geology and Water Sciences, 7, 215-225.
Miall, A.D. (1977) A review of the braided-river depositional environment. Earth-Science Reviews,
13, 1-62.
Miall, A.D. (1985) Architectural-element analysis: a new method of facies analysis applied to fluvial
deposits. SEPM Special Publication-Recognition of Fluvial Depositional Systems and Their
Resource Potential, 19, 33-81.
Miall, A.D. (1988) Architectural elements and bounding surfaces in fluvial deposits: anatomy of the
Kayenta formation (lower Jurassic), Southwest Colorado. Sedimentary Geology, 55, 233–262.
Miall, A.D. (2015) Updating uniformitarianism: stratigraphy as just a set of ‘frozen accidents’.
Geological Society of London, Special Publications, 404, 11-36.
Mohrig, D., Heller, P.L., Paola, C., and Lyons, W.J. (2000) Interpreting avulsion process from ancient
alluvial sequences: Guadalope-Matarranya system (northern Spain) and Wasatch Formation
(western Colorado). Geological Society of America Bulletin, 112, 1787–1803.
Mohrig, D., and Smith, J.D. (1996) Predicting the migration rates of subaqueous dunes. Water
Resources Research, 32, 3207-3217.
Nittrouer, J.A., Mohrig, D., Allison, M.A., and Peyret, A.-P. B. (2011a) The lowermost Mississippi
River: a mixed bedrock-alluvial channel. Sedimentology, 58, 1914-1934.
Nittrouer, J.A., Mohrig, D., and Allison, M. (2011b) Punctuated sand transport in the lowermost
Mississippi River. Journal of Geophysical Research: Earth Surface, 116, F04025.
Acc
epte
d A
rtic
le

This article is protected by copyright. All rights reserved
Nuse, B. (2015) Flow processes and sedimentation in a low-sinuosity high net-sand content fluvial
channel belt: 3D outcrop study of the Cedar Mountain Formation, Utah. Unpublished MS
Thesis, Colorado School of Mines.
Owen, A., Nichols, G.J., Hartley, A.J., Weissmann, G.S., and Scuderi, L.A. (2015) Quantification of a
distributive fluvial system: The Salt Wash DFS of the Morrison Formation, SW U.S.A. Journal
of Sedimentary Research, 85, 544-561.
Paola, C., and Borgman, L. (1991) Reconstructing random topography from preserved stratification.
Sedimentology, 38, 553-565.
Paola, C., Ganti, V., Mohrig, D., Runkel, A.C., and Straub, K.M. (2018) Time not our Time: Physical
controls on the preservation and measurement of geologic time. Annual Review of Earth and
Planetary Sciences, 46, 409-438.
Parker, G., Paola, C., Whipple, K.X., and Mohrig, D. (1998) Alluvial fans formed by channelized
fluvial and sheet flow. I: Theory: Journal of Hydraulic Engineering, 124, 985-995.
Parker, G., Wilcock, P.R., Paola, C., Dietrich, W.E., and Pitlick, J. (2007) Physical basis for quasi-
universal relations describing bankfull hydraulic geometry of single-thread gravel bed rivers.
Journal of Geophysical Research – Earth Surface, 112, F04005.
Peterson, F., and Ryder, R.T. (1975) Cretaceous rocks in the Henry Mountains region, Utah and their
relation to neighboring regions. in Four Corners Geological Society Guidebook, 8, p. 166-189.
Pizzuto, J.E. (1987) Sediment diffusion during overbank flows. Sedimentology, 34, 301–317.
Reesink, A.J.H., and Bridge, J.S. (2011) Evidence of bedform superimposition and flow unsteadiness
in unit-bar deposits, South Saskatchewan River, Canada. Journal of Sedimentary Research, 81,
814-840.
Acc
epte
d A
rtic
le

This article is protected by copyright. All rights reserved
Reesink, A.J.H., Van den Berg, J.H., Parsons, D.R., Amsler, M.L., Best, J.L., Hardy, R.J., Orfeo, O.,
and Szupiany, R.N. (2015) Extremes in dune preservation: Controls on the completeness of
fluvial deposits. Earth-Science Reviews, 150, 652-665.
Reesink, A.J.H. (2018) Interpretation of cross strata formed by unit bars. In eds. M.Ghinassi, L.
Colombera, N.P. Mountney, and A.J.H. Reesink, Fluvial Meanders and Their Sedimentary
Products in the Rock Record, International Association of Sedimentary Petrologists Special
Publication, 48, 173-200.
Reitz, M.D., Jerolmack, D.J., and Swenson, J.B. (2010) Flooding and flow path selection on alluvial
fans and deltas. Geophysical Research Letters, 37, L06401.
Rubin, D.M. (1987) Cross-bedding, Bedforms, and Paleocurrents. SEPM Concepts in Sedimentology
and Paleontology, 1.
Rubin, D.M., and Hunter, R.E. (1982) Bedform climbing in theory and nature. Sedimentology, 29,
121–138.
Rubin, D.M., and Hunter, R.E. (1987) Bedform alignment in directionally varying flows. Science, 237,
276-278.
Sable, V.H. (1956) Photogeologic map of the Tidwell-2 quadrangle, Emery and Grand counties, Utah.
Miscellaneous Geologic Investigation, Map I-162.
Sadler, P.M. (1981) Sediment accumulation rates and the completeness of stratigraphic sections.
The Journal of Geology, v. 89, 569-584.
Sadler, P.M., and Jerolmack, D.J. (2015) Scaling laws for aggradation, denudation and progradation
rates: the case for time-scale invariance at sediment sources and sinks. Geological Society of
London, Special Publications, 404, 69-88.
Acc
epte
d A
rtic
le
This article is protected by copyright. All rights reserved
Seminara, G., and Tubino, M. (1989) Alternate bars and meandering: Free, forced and mixed
interactions. In S. Ikeda and G. Parker (Eds.), River Meandering: Water Resources
Monograph, 12, 267-320. American Geophysical Union: Washington, D.C.
Shaw, J.B., and Mohrig, D. (2014) The importance of erosion in distributary channel network
growth, Wax Lake Delta, Louisiana, USA: Geology, 42, 31-34.
Skelly, R.L., Bristow, C.S., and Ethridge, F.G. (2003) Architecture of channel-belt deposits in an
aggrading shallow sandbed braided river: the lower Niobrara River, northeast Nebraska.
Sedimentary Geology, 158, 249-270.
Slingerland, R., and Smith, N.D. (2004) River avulsions and their deposits. Annual Review of Earth
and Planetary Sciences, 32, 257-285.
Slingerland, R., and Williams, E.G. (1979) Paleocurrent analysis in light of trough cross-stratification
geometry. The Journal of Geology, 87, 724-732.
Smith, N.D. (1982) Some sedimentological aspects of planar cross-stratification in a sandy braided
river. Journal of Sedimentary Petrology, 42, 624-634.
Stokes, W.L. (1961) Fluvial and Eolian Sandstone Bodies in Colorado Plateau. AAPG SP-Geometry of
Sandstone Bodies, 22, 151–178.
Stouthamer, E., and Berendsen, H.J.A. (2001) Avulsion frequency, avulsion duration, and
interavulsion period of Holocene channel belts in the Rhine-Meuse Delta, the Netherlands.
Journal of Sedimentary Research, 71, 589-598.
Swanson, T., Mohrig, D., Kocurek, G., Perillo, M., and Venditti, J. (2018) Bedform spurs: a result of a
trailing helical vortex wake. Sedimentology, 65, 191-208.
Acc
epte
d A
rtic
le

This article is protected by copyright. All rights reserved
Swanson, T., Mohrig, D., Kocurek, G., Cardenas, B.T., and Wolinsky, M.A. (2019) Preservation of
autogenic processes and allogenic forcings within set-scale aeolian architecture I: numerical
experiments. Journal of Sedimentary Research, 89, 728-740.
Swartz, J.M., Mohrig, D., Passalacqua, P., Goff, J., and Gulick, S.P.S. (2018) From distributary to
tributary: coastal drainage network position and morphometry are set by depositional
processes. Presented at the American Geophysical Union 2018 Fall Meeting, EP21B-2230.
Van De Lagewag, W.Y., Van Dijk, W.M., and Kleinhans, M.G. (2013) Channel belt architecture
formed by a meandering river. Sedimentology, 60, 840-859.
Wang, J., and Bhattacharya, J.P. (2017) Plan-view paleochannel reconstruction of amalgamated
meander belts, Cretaceous Ferron Sandstone, Notom Delta, south-central Utah, U.S.A.
Journal of Sedimentary Research, 88, 58–74.
Whiting, P.J., and Dietrich, W.E. (1993) Experimental constraints on bar migration through bends:
Implications for meander wavelength selection. Water Resources Research, 29, 1091-1102.
Williams, R.M.E., Irwin, R.P., and Zimbelman, J.R. (2009) Evaluation of paleohydrologic models for
terrestrial inverted channels: Implications for application to Martian sinuous ridges.
Geomorphology, 107, 300–315.
Williams, R.M.E., Chidsey Jr., T.C., and Eby, D.E. (2007) Exhumed Paleochannels in Central Utah—
Analogs for Raised Curvilinear Features on Mars. Central Utah-Diverse Geology of a Dynamic
Landscape, 221–235.
Wright, S., and Parker, G. (2003) Grain-size specific suspended sediment transport and flow
resistance in large sand-bed rivers. In A. Gyr and W. Kinzelbach (Eds.), Sedimentation and
Sediment transport, 221-227. Netherlands: Springer.
Acc
epte
d A
rtic
le

This article is protected by copyright. All rights reserved
Wu, C., Bhattacharya, J.P., and Ullah, M.S., (2015) Paleohydrology and 3D facies architecture of
ancient point bars, Ferron Sandstone, Notom Delta, South-central Utah, USA. Journal of
Sedimentary Research, 85, 399–418.
Wu, C., Ullah, M.S., Lu, J., and Bhattacharya, J.P. (2016) Formation of point bars through rising and
falling flood stages: Evidence from bar morphology, sediment transport and bed shear stress.
Sedimentology, 63, 1458–1473.
Young, R.G. (1960) Dakota Group of Colorado Plateau. American Association of Petroleum Geologists
Bulletin, 44, 158-194.
Zaki, A.S., Pain, C.F., Edgett, K.S., and Giegengack, R. (2018) Inverted stream channels in the
Western Desert of Egypt. Synergistic remote, field observations and laboratory analysis on
Earth with applications to Mars. Icarus, 309, 105-124.
Acc
epte
d A
rtic
le

This article is protected by copyright. All rights reserved
FIGURE CAPTIONS
Figure 1 – (A) Index map of Utah. (B) Enlargement near Green River, showing the location of the
town as well as the studied ridges of the Ruby Ranch Member of the Cedar Mountain Formation. (C)
View showing the ridges beyond the study area. Black line maps out a ridge centreline for several
kilometres, with interpreted dashed segments bridging erosional discontinuities. Blue arrows show
the general direction of palaeoflow. Red arrows mark the two major bends bounding the studied
part of the ridge. The arrows point away from the centre of curvature, and match with the general
dip directions of local dipping bar strata. (D) Drone ortho-images of the studied eastern and western
ridges of the Ruby Ranch Member ridges. The photomosaics are rotated slightly to fit the panel, but
are correctly co-located.
Figure 2 – Free bars (red arrows) and point bars (yellow arrows) commonly coexist in rivers, both in
straight reaches and bends. (A) Trinity River, Texas, USA. Image centred at 30.134° N,
-94.815° E. (B) North Loup River, Nebraska, USA. Image centred at 42.019° N, -100.098° E. (C)
Calamuth River, Nebraska, USA. Image centred at 42.083° N, -99.649° E. (D) River Dane, Cheshire,
England. Image centred at 53.183° N, -2.259° E.
Figure 3 – (A) Diagram defining the components of the transport anomaly, ѲTA, for a modern river
channel. A measurement of transport direction, ѲD, is made from the orientation of a dune crest
(short black arrow; 091°). The centreline point closest to the measurement of ѲD is starred. The
orientation of the starred centreline point, ѲCL, is defined as the azimuth direction of the ray
originating at the adjacent upstream point and passing through the adjacent downstream point
(grey arrow; 124°). (B) The transport anomaly, ѲTA, is defined as ѲCL – ѲD. It may be positive or
negative, and is bound between -180° and +180°. In this scenario, ѲTA = 124° – 091° = 33°.
Acc
epte
d A
rtic
le

This article is protected by copyright. All rights reserved
Figure 4 – Hypothesized scenarios guiding interpretations of palaeotransport anomaly results.
Schematic diagrams are on the left, the distribution of palaeotransport anomaly measurements are
in the middle, and relevant statistical moments are on the right. Standard deviation is shown by σ.
Legend is at the bottom. (A) The ridge centreline represents well the formative channel centreline.
With increasing lateral amalgamation, results will instead approach the scenario in panel (B). (B)
Lateral amalgamation of the channel-belt separates any formative channel centreline from the ridge
centreline. Laterally accreting bar strata are preserved. A random exhumation pattern not following
the edges of the channel belt is unlikely to show any of these patterns.
Figure 5 – (A) and (B) Yellow arrows pointing to erosional surfaces above friable, recessed
mudstones separating coarse-grained, cross-bedded packages. These erosional surfaces are
interpreted to represent the contacts between stacked channel belts. (C) Geological maps showing
the stacking patterns of channel-belts exposed at the surface of both ridges. There is no attempt to
correlate individual channel belts between ridges.
Figure 6 – (A) Vertical section showing storey-bounding surfaces and associated mudstones. Stories
in this section are of average to below-average thickness. (B) Two stories bounded by an erosional
surface with no associated mudstone. The bottom storey is above average thickness. (C) Histogram
of local channel-belt (storey) thicknesses measured from vertical sections, and the mean thickness of
a bar set at the rollover (red line), which is used as a proxy for channel depth. The difference
between channel depth and channel-belt thickness is due to aggradation of the channel bed.
Figure 7 - Photograph of dune cross-strata exposed in planview along upper ridge surfaces. Blue
arrow shows the mean dip directions of cross-strata. This 3D outcrop shows the relationship
between planform-exposed cross-strata and vertically exposed cross-strata. Boots are 30 cm long.Acc
epte
d A
rtic
le

This article is protected by copyright. All rights reserved
Figure 8 – (A) Histograms showing the distribution of dune and bar cross-set thicknesses, with
statistical moments and the coefficient of variation (cv). Arrows highlight a break between the two
distributions when measuring bar sets at a rollover. (B) Distribution of grain-size classes in dune
cross-sets. Classes labelled fU, mL, mU, cL, cU, vcL and vcU represent sand sizes of fine upper,
medium lower, medium upper, coarse lower, coarse upper, very coarse lower and very coarse
upper, respectively.
Figure 9 – (A) Example of drone photomosaics used as field base maps. (B) Digitized field map
showing planform-exposed sets of cross-strata outlined and filled in with green (sandstone) or blue
(pebble conglomerate).
Figure 10 - Examples of larger-scale accretion strata. Red arrows show the dip direction of the strata
in each panel. Boots in each panel are 30 cm long. (A) A lack of exposed bounding surfaces on this
topographic surface suggests that the topography itself represents a bounding surface. (B) Beneath
the arrow, erosion exposes internal stratification parallel to the surface. (C) A 3D outcrop of larger-
scale dipping strata composed of smaller-scale stratification exposed by erosion. (D) Compound
cross-strata with a larger-scale accretion surface (red arrow) dipping obliquely to a smaller-scale
dune set (blue arrow). A few dune cross-strata are mapped in black lines.
Figure 11 – Planform maps outlining the top surfaces of the western (A) and eastern (B) ridges. Two
locations with clusters of similarly dipping bar accretion surfaces following ridge curvature are
interpreted to represent point bars. The north-east-accreting point bar structure of the western
ridge corresponds with a larger-scale ridge curvature beyond the extent of the study area (Fig. 1C). Acc
epte
d A
rtic
le

This article is protected by copyright. All rights reserved
Bar accretion surfaces not clearly associated with a point bar are interpreted as free-bar accretion
surfaces.
Figure 12 – The preservation of bar topography on upper-ridge surfaces. (A) Fisheye view of a
sandstone mound rising towards the downstream direction (left to right), with a surface defined by
shingled cross-sets climbing with topography. This is interpreted as the stoss surface of a
downstream-migrating barform. Tape measure for scale in foreground, arrow pointing to person (ca
1.8 m tall) in background. (B) Interpretation of panel (A). (C) Downstream end of a sandstone mound
featuring cross-sets and topography falling in the downstream direction. Interpreted as the lee slope
of a downstream-migrating barform. Person for scale (1.65 m tall). (D) Interpretation of panel (C).
Figure 13 – The four arrangements of compound dune and bar strata. (A) Type A strata have a bar
set beneath dune cross-sets, separated by an upstream-dipping surface. Bar strata are not
necessarily at angle of repose in this figure. (B) Type B strata have bar sets shallowing and thickening
downstream, where they conformably become dune cross-sets. (C) Type C strata show compound
dune and bar strata dipping at high angles to one another. (D) Type D strata are dune sets with no
clear compound structure.
Figure 14 – Cross-sectional view of Type A to D strata (Fig. 13), with superimposed interpretations.
Sets of dune and bar strata are marked by thick black lines and dune cross-strata by thinner black
lines. Surfaces separating dune and bar strata are marked by red lines. (A) and (B) Type A strata from
the stoss side of a bar, with an interpreted transition to the lee side. Flow was from left to right. (C)
and (D) Cross-sectional view of preserved strata from the lee (Type B) and stoss (Type A) sides of a
bar form. Flow was from right to left. (E) and (F) Cross-sectional view of Type D strata featuring a
±90° spread in transport direction, conglomerates and a lack of bar architecture. This type of Acc
epte
d A
rtic
le

This article is protected by copyright. All rights reserved
architecture is interpreted as a thalweg environment due to the coarser grains driven by higher
velocity flow, and a larger spread in transport driven by changes in steering due to bar growth. (G)
and (H) Cross-sectional view showing the internal structure of a barform with Type A strata overlying
Type B strata. Flow was from left to right. From bottom to top, the transition from stoss to lee
architecture to lee architecture, all within the same barform, records the forward migration and
aggradation of the barform.
Figure 15 – Transport anomaly maps of the western ridge of the Ruby Ranch Member (A), the
eastern ridge (B) and the North Loup River (C). X and Y coordinates are relative to a different local
datum in each map, shown in the bottom left corner of each panel. Circles show the location of
palaeotransport or modern transport direction measurements. The colour at each point represents
the palaeotransport or transport anomaly (Fig. 3A and B). Colours are stretched to each individual
panel. Grey lines represent ridge outlines and the banks of the North Loup River. Black arrows in
panels (A) and (B) point to regions recording point bar accretion, and are associated with relatively
high anomaly values, particularly in the western ridge (Figs 1C and 11).
Figure 16 – Histograms showing the distribution of palaeotransport/transport anomalies of the
western (A) and eastern (B) ridges of the Ruby Ranch Member, and the modern North Loup River (C)
and Trinity River (D). The number of measurements, mean and standard deviation are reported in
each panel. Note the similarity in mean and standard deviation between the ancient and modern
datasets. Histograms (E) and (F) show the difference between dip directions of bar accretion strata
exposed along the upper surfaces of ridges and the centreline. Both histograms show a wide
distribution of values with peaks approaching perpendicular to the centreline trend.
Acc
epte
d A
rtic
le

This article is protected by copyright. All rights reserved
Figure 17 – (A) Drone photomosaic of the North Loup River near Taylor, Nebraska, USA (Swanson et
al., 2018). Brighter tan colours within the channel are subaqueous and represent higher portions of
downstream-migrating bars beneath shallow water. Darker reaches of the channel represent deeper
water. Mixed white and black areas with no crestlines mapped are subaerially exposed bar tops that
are not currently undergoing fluvial transport. The location of panel (B) is shown in the black box. (B)
Enlargement showing dune crestlines (short red lines) interpreted as perpendicular to dune
transport direction. Black dashed arrows show general trends in local transport directions due to the
steering of flow around bars. (C) Window length versus the mean transport anomaly within the
window. As the window length approaches that of the approximately three barforms or about half
the reach, the sampled mean approaches the mean of the entire reach, indicating that the total
variability has been adequately sampled. Changes in curvature of this line are observed near
multiples of mean bar length, supporting topographic steering as the source of the transport
anomaly.
Figure 18 – (A) Cumulative distribution function (CDF) showing the mean – standardized distribution
of set thickness located within bar lee environments (Fig. 14). (B) CDF of set thickness within bar
stoss environments (Fig. 13). (C) CDF of thalweg set thickness (Fig. 15). The best-fit gamma and
exponential curves are shown for each distribution. In all cases, the exponential fits are rejected
using a Kalmogorov–Smirnov test at a significance level of .05, and the gamma fits are not. This
suggests that all architectures required a significant rate of bed aggradation relative to the rate of
dune migration, although the similarity of the two curves for thalweg sets indicates that the ratio of
bed aggradation to dune migration was the lowest of the three environments (Paola & Borgman,
1991; Jerolmack & Mohrig, 2005).
Acc
epte
d A
rtic
le
This article is protected by copyright. All rights reserved
Figure 19 – A diagram explaining the calculation of accumulation time (Eq. 2). The relative rates of
aggradation to migration are compared to deposit thickness, s, and and an assumed dune migration
rate divided by the equivalent distance, m.
Figure 20 – A diagram merging the observations of the usually bypass-state channel bed and the
relatively high amount of channel-bed aggradation preceding avulsion, when compared to other
fluvial strata (e.g. Mohrig et al., 2000). (A) At t = 1, the distance between the lowest part of the
floodplain and the channel bed (red line) during low flow is defined. (B) At t = 2, the channel is in
flood stage. The floodplain has aggraded less than the channel bed. Avulsion does not occur. Original
channel bed shown by a red dashed line. (C) At t = 3, post-flood channel-bed reworking fills scours
and removes accumulations such that there is zero net change in bed elevation.
Acc
epte
d A
rtic
le


θCL - θD = θTA = +33°
θD
θCL
net �owN
θCL at starred point = 124°
θD = 091°
A
B
centreline dune crest andnet migrationdirection
river bank
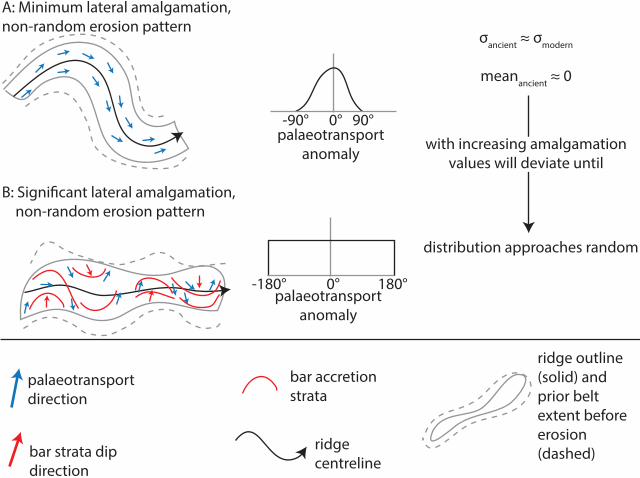
0°palaeotransport
anomaly
σancient ≈ σmodern
meanancient ≈ 0
0°palaeotransport
anomaly
A: Minimum lateral amalgamation,non-random erosion pattern
B: Signi�cant lateral amalgamation, non-random erosion pattern
palaeotransportdirection
bar strata dipdirection
bar accretionstrata
ridgecentreline
ridge outline(solid) and prior belt extent before erosion (dashed)
distribution approaches random
-90° 90°
-180° 180°
with increasing amalgamationvalues will deviate until


35
30
25
20
15
10
5
0
freq
uenc
y
fU mL mU cL cU vcL vcU
gran
ule
pebb
le
n = 75
set thickness (m)
freq
uenc
ydune setsn = 350mean = 0.14 mσ = 0.11 mcv = 0.79
dune-set grain size
A
B
0 0.2 0.4 0.6 0.8 1.0 1.2 1.4 1.6 1.8
1020
30
40
5060
70
8090
100
0
bar sets at rollovern = 12mean = 1.28 mσ = 0.19 m


A type A B type B
C type C D type D
bar stoss
bar cross-strata
dune cross-sets


A Ced r Mountain Formation, western ridge, n = 566
300 C
·;:: 2500
ro
� 200'+--0
£ 150lo..
0C
� 100QJ
+-'
QJ
E 50
0
0
origin:
UTM 12N
569,463 mE
4,303,971 mN
100
point-bar strata
400 200 300 metres east of local origin
B Cedar Mountain Formation, eastern ridge, n = 505 350
300 C
.Ol 250 lo..
0
ro 200 u
0 '+- 150 0
..c +-' 100 lo..
0 C
V') 50 lo..
QJ +-'
QJ 0 E
-50
-1000
point-bar strata
origin:
UTM 12N
571,042 mE
4,303,646 mN
100 500 200 300 400 metres east of local origin
150
100
50
0
-50
-100
-150
100
50
0
-
0 ..._.
�
ro
E 0 C
ro +-'�
0 c.. V1
C ro � +-'
-
0 ..._.
ro
E 0 C
ro +-'�
0 -50 C..
V1
C ro
-100 �
-150
me
tre
sm
etr
es

C
450
.c 400 O')·-
o 350
� 300
I ' \
O 200 C
(lJ 150 I '
E 100
50
• •
or1g1n:
UTM 14N
467,572 mE
4,625,284 mN
North Loup River, n = 2,871
0 .___.___ __ ____,___ __ _____._ __ ______. ___ ....____ __ ___,______;;._� -
0 100 200 300 400 metres east of local ori in
500 600
100
80
60
40
20
0
-20
-40
-60
-80
-100
ro
E 0 C ro I , \
0 a. Vl
C ro \
I , me
tre
s

Cedar MountainFormationwestern ridgen = 566mean = 6°σ = 35°kurtosis = 6.5
North Loup Rivern = 2,871mean = -12°σ = 33°kurtosis = 3.5
transport direction anomaly (°)(centreline azimuth - local transport direction)
0-50-100-150 50 100 150
freq
uenc
y
0
50
100
150
200
2500-50-100-150 50 100 1500
10
20
30
40
50
60
70
80
90fr
eque
ncy
freq
uenc
yA B
C
Cedar MountainFormation eastern ridgen = 505mean = -8°σ = 29°kurtosis = 6.0
0-50-100-150 50 100 1500
10
20
30
40
50
60
Cedar Mountain Formationwestern ridgebar accretion stratan = 40mode = 75°σ = 59°
centreline azimuth - dip direction (°)-150 -100 -50 0 50 100 1500
1
2
3
4
5
6E
D
0
1
2
3
4
5
6
7
8Cedar Mountain Formationeastern ridgebar accretion stratan = 59mode = -76°σ = 70°
-150 -100 -50 0 50 100 150
-150 -100 -50 0 50 100 150
200
160
120
80
40
0
transport direction anomaly (°)(centreline azimuth - local transport direction)
F
centreline azimuth - dip direction (°)
Trinity Rivern = 2,190mean = 3°σ = 25°kurtosis = 2.7
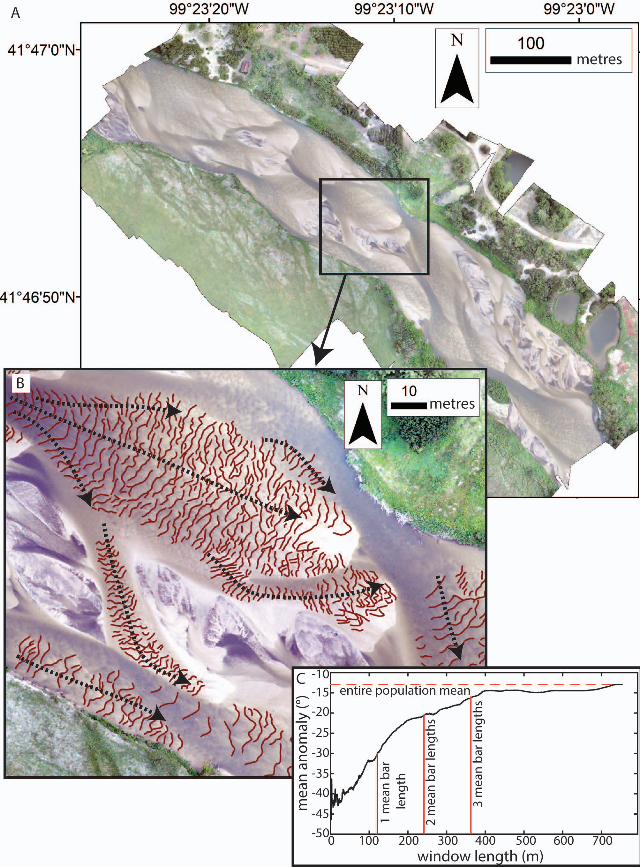

A
B
locally standardized set thickness
cum
ulat
ive
prob
abili
tycu
mul
ativ
e pr
obab
ility
cum
ulat
ive
prob
abili
ty
C
0 0.5 1 1.5 2 2.5 3 3.5 40
0.5
1
thalweg sets (n = 40)cv = 0.67
gamma
exponential
0 0.5 1 1.5 2 2.5 3 3.5 40
0.5
1
lee sets (n = 32)cv = 0.29
gamma
exponential
0 0.5 1 1.5 2 2.5 3 3.5 40
0.5
1
stoss sets (n = 33)cv = 0.47
gamma
exponential

m
s

aggraded �oodplain
aggraded channel bed
original �oodplain elevation - channel bed elevation
zero net change in channel bed elevation
aggraded �oodplain not reworked added �oodplain
elevation
original �oodplain elevation
original �oodplain elevation - channel bed elevation
A
B
C
t = 1: pre �ood
t = 2: �ood
t = 3: post �ood
thalwegscour depth