Wind and turbulence in the urban boundary layer - analysis from acoustic remote sensing data and fit...
14
Meteorologische Zeitschrift, Vol. 16, No. 4, 393-406 (August 2007) (published online 2007) c by Gebrüder Borntraeger 2007 Article Wind and turbulence in the urban boundary layer – analysis from acoustic remote sensing data and fit to analytical relations S TEFAN EMEIS ∗1 ,KATHRIN BAUMANN-S TANZER 2 ,MARTIN P IRINGER 2 , MARGARITA KALLISTRATOVA 3 ,ROSTISLAV KOUZNETSOV 3 and VLADISLAV YUSHKOV 3 1 Institut für Meteorologie und Klimaforschung – Atmosphärische Umweltforschung (IMK-IFU) Forschungszentrum Karlsruhe GmbH, Garmisch-Partenkirchen, Germany 2 Zentralanstalt für Meteorologie und Geodynamik, Vienna, Austria 3 Obukhov Institute for Atmospheric Physics, Russian Academy of Sciences, Moscow, Russia (Manuscript received November 30, 2006; in revised form May 7, 2007; accepted May 14, 2007) Abstract Mean seasonal profiles of wind speed, standard deviation of the vertical velocity and turbulence intensity from SODAR measurements in three cities of different size, Moscow, Hanover and Linz, are compared to an- alytical approximations for the Prandtl and Ekman layer. Typical urban features in the profiles and differences to measurements at rural sites are discussed. Typical urban features are a greater slope in the wind profiles, enhanced turbulence intensities, and a vertical increase in magnitude of the turbulence. The analytical ap- proach proposed by ETLING (2002) for the description of the vertical wind profile in the whole boundary layer is amended in the Prandtl-layer part by a correction function for atmospheric stability. The amended profile description turns out to render the best results for the approximation of urban wind profiles within the lowest 500 m above ground. Zusammenfassung Mittlere saisonale Profile der Windgeschwindigkeit, Standardabweichung der Vertikalgeschwindigkeit und der Turbulenzintensität aus SODAR-Messungen in drei unterschiedlich großen Städten, Moskau, Hannover und Linz, werden mit analytischen Annäherungen für die Prandtl- und die Ekman Schicht verglichen. Typ- ische Eigenschaften für diese Profile in Städten sind eine stärkere Zunahme des Windgeschwindigkeitsprofils mit der Höhe, höhere Turbulenzintensitäten und die Zunahme der Turbulenz mit der Höhe. Der analytische Ansatz, welcher von ETLING (2002) für die Beschreibung des Windprofils in der gesamten Grenzschicht vorgeschlagen wird, wird in der Prandtl Schicht durch eine Korrekturfunktion zur Berücksichtigung der at- mosphärischen Stabilität erweitert. Die erweiterte Profilbeschreibung ermöglicht die beste Annäherung an städtische Windprofile in den untersten 500 m über Grund. 1 Introduction Wind and turbulence within the urban boundary layer (UBL) determine the horizontal and vertical disper- sion and transport of air pollutants in towns and is thus important for the health of the citizens. Numer- ous field experiments (for an overview see e.g. GRIM- MOND, 2006), numerical studies (see e.g. BATCH- VAROVA and GRYNING (2006)) and several wind tun- nel studies (COUNIHAN, 1973; FARELL and I VENGAR, 1999; SCHATZMANN and LEITL, 2002) therefore have been conducted to investigate the structure of the UBL. Besides of a better understanding of mixing and trans- port processes within the UBL, a realistic representa- tion of the flow field within street canyons and above ∗ Corresponding author: Stefan Emeis, Institut für Meteorolo- gie und Klimaforschung, Atmosphärische Umweltforschung (IMK-IFU) Forschungszentrum Karlsruhe GmbH, Kreuzeck- bahnstr. 19, 82467 Garmisch-Partenkirchen, Germany, e-mail: [email protected] the buildings is essential for the application of disper- sion models to urban areas (e.g. model simulations for London with ADMS Urban (CERC, 2001)). Detailed urban surface exchange parameterisation schemes have been developed e.g. by MASSON (2000), MARTILLI et al. (2002) and DUPONT and MESTAYER (2006). As con- tinuous wind profile measurements within the urban area are not available in most cases, analytical wind profiles are used in state of the art air pollution modelling to extend the observed wind from e.g. 10 m above roof top to the entire UBL. Recommendations concerning wind measurements in cities are given by FISHER et al. (2005). Recent special campaigns like BUBBLE (ROTACH et al., 2005) and DAPPLE (DOBRE et al., 2005) per- formed in European cities as well as other measure- ments (e.g. CASADIO et al., 1996; DUPONT et al., 1999; HILDEBRAND and ACKERMANN, 1984; MELLING and LIST, 1980; UNO et al., 1988, 1992; VENKATRAM et DOI: 10.1127/0941-2948/2007/0217 0941-2948/2007/0217 $ 6.30 c Gebrüder Borntraeger, Berlin, Stuttgart 2007
-
Upload
independent -
Category
Documents
-
view
3 -
download
0
Transcript of Wind and turbulence in the urban boundary layer - analysis from acoustic remote sensing data and fit...
Meteorologische Zeitschrift Vol16 No 4 393-406 (August 2007) (published online 2007)ccopy by Gebruumlder Borntraeger 2007 Article
Wind and turbulence in the urban boundary layer ndashanalysis from acoustic remote sensing data and fit toanalytical relations
STEFAN EMEISlowast1 KATHRIN BAUMANN -STANZER2 MARTIN PIRINGER2MARGARITA KALLISTRATOVA 3 ROSTISLAV KOUZNETSOV3 and VLADISLAV YUSHKOV3
1Institut fuumlr Meteorologie und Klimaforschung ndash Atmosphaumlrische Umweltforschung (IMK-IFU)Forschungszentrum Karlsruhe GmbH Garmisch-Partenkirchen Germany2Zentralanstalt fuumlr Meteorologie und Geodynamik Vienna Austria3Obukhov Institute for Atmospheric Physics Russian Academy of Sciences Moscow Russia
(Manuscript received November 30 2006 in revised form May 7 2007 accepted May 14 2007)
AbstractMean seasonal profiles of wind speed standard deviation of the vertical velocity and turbulence intensityfrom SODAR measurements in three cities of different size Moscow Hanover and Linz are compared to an-alytical approximations for the Prandtl and Ekman layer Typical urban features in the profiles and differencesto measurements at rural sites are discussed Typical urbanfeatures are a greater slope in the wind profilesenhanced turbulence intensities and a vertical increase in magnitude of the turbulence The analytical ap-proach proposed by ETLING (2002) for the description of the vertical wind profile in thewhole boundarylayer is amended in the Prandtl-layer part by a correction function for atmospheric stability The amendedprofile description turns out to render the best results for the approximation of urban wind profiles within thelowest 500 m above ground
ZusammenfassungMittlere saisonale Profile der Windgeschwindigkeit Standardabweichung der Vertikalgeschwindigkeit undder Turbulenzintensitaumlt aus SODAR-Messungen in drei unterschiedlich groszligen Staumldten Moskau Hannoverund Linz werden mit analytischen Annaumlherungen fuumlr die Prandtl- und die Ekman Schicht verglichen Typ-ische Eigenschaften fuumlr diese Profile in Staumldten sind eine staumlrkere Zunahme des Windgeschwindigkeitsprofilsmit der Houmlhe houmlhere Turbulenzintensitaumlten und die Zunahmeder Turbulenz mit der Houmlhe Der analytischeAnsatz welcher von ETLING (2002) fuumlr die Beschreibung des Windprofils in der gesamten Grenzschichtvorgeschlagen wird wird in der Prandtl Schicht durch eine Korrekturfunktion zur Beruumlcksichtigung der at-mosphaumlrischen Stabilitaumlt erweitert Die erweiterte Profilbeschreibung ermoumlglicht die beste Annaumlherung anstaumldtische Windprofile in den untersten 500 m uumlber Grund
1 Introduction
Wind and turbulence within the urban boundary layer(UBL) determine the horizontal and vertical disper-sion and transport of air pollutants in towns and isthus important for the health of the citizens Numer-ous field experiments (for an overview see eg GRIM-MOND 2006) numerical studies (see eg BATCH-VAROVA and GRYNING (2006)) and several wind tun-nel studies (COUNIHAN 1973 FARELL and IVENGAR1999 SCHATZMANN and LEITL 2002) therefore havebeen conducted to investigate the structure of the UBLBesides of a better understanding of mixing and trans-port processes within the UBL a realistic representa-tion of the flow field within street canyons and above
lowastCorresponding author Stefan Emeis Institut fuumlr Meteorolo-gie und Klimaforschung Atmosphaumlrische Umweltforschung(IMK-IFU) Forschungszentrum Karlsruhe GmbH Kreuzeck-bahnstr 19 82467 Garmisch-Partenkirchen Germany e-mailstefanemeisimkfzkde
the buildings is essential for the application of disper-sion models to urban areas (eg model simulations forLondon with ADMS Urban (CERC 2001)) Detailedurban surface exchange parameterisation schemes havebeen developed eg by MASSON (2000) MARTILLI etal (2002) and DUPONTand MESTAYER(2006) As con-tinuous wind profile measurements within the urban areaare not available in most cases analytical wind profilesare used in state of the art air pollution modelling toextend the observed wind from eg 10 m above rooftop to the entire UBL Recommendations concerningwind measurements in cities are given by FISHER et al(2005)
Recent special campaigns like BUBBLE (ROTACH
et al 2005) and DAPPLE (DOBRE et al 2005) per-formed in European cities as well as other measure-ments (eg CASADIO et al 1996 DUPONTet al 1999HILDEBRAND and ACKERMANN 1984 MELLING andL IST 1980 UNO et al 1988 1992 VENKATRAM et
DOI 1011270941-294820070217
0941-294820070217 $ 630
ccopy Gebruumlder Borntraeger Berlin Stuttgart 2007
394 S Emeis et al Wind and turbulence in the urban boundary layer Meteorol Z 16 2007
al 2004 FISHER et al 2005 PIRINGER and JOFFRE2005 PIRINGER et al 2007) show that the verticalstructure of the atmospheric boundary layer over townsoften deviates from the usual layering over flat homo-geneous terrain This is to be attributed to three typicalfeatures of town surfaces (1) town surfaces have a largeroughness with a wide spectrum of different roughnesselements (2) urban areas tend to be warmer than theirsurroundings due to the increased heat storage at andthe reduced evaporation from artificial surfaces and (3)towns often are isolated islands featuring these specialsurface properties surrounded by rural terrain so that theflow above them is not in equilibrium with the urbansurface
Following PLATE (1995) ROTH (2000) andPIRINGER and JOFFRE (2005) the urban boundary-layer (UBL) is usually divided into four layers Thelowest one is the urban canopy layer (UCL) whichreaches up to the mean top height of the buildings Thenext layer is the wake layer in which the influence ofsingle buildings on the flow is still notable This wakelayer usually extends to about two to five times the av-erage building height Above these two layers which areoften jointly addressed as the urban roughness sub-layer(URL ROTACH 1999) is the constant flux layer (CFL)or inertial sublayer (IS) over homogeneous terrainusually addressed as surface layer or Prandtl-layer Inthe uppermost part of the boundary layer above theCFL the wind direction turns into the direction of thegeostrophic wind (often called Ekman layer)
If a convectively driven boundary layer (CBL)is present no distinction is made between the CFLor Prandtl-layer and the Ekman layer but they arejointly addressed as mixing layer The thickness ofthese layers has so far been investigated over ur-ban surfaces for longer time periods only in Moscow(PEKOUR and KALLISTRATOVA 1993 PEKOUR et al1993 LOKOSHCHENKO 2002) in Hanover (EMEIS andTUumlRK 2004) and Toronto for the CBL (MELLING andL IST 1980)
EMEIS (2004) presents a first evaluation of monthlymean vertical wind profiles and diurnal courses ofmonthly mean wind speed of the standard deviation ofthe vertical velocity w and turbulence intensity in theURL and CFL derived from SODAR measurements inHanover for heights up to 225 m from an extended ob-servation period of 17 months The main results are thatno diurnal variation of the mean wind speed is found inthe URL (about 60 m above ground about 30 to 40 mabove mean roof level) that the amplitude of the diur-nal course ofσw and turbulence intensity is large in bothlayers due to the heating of the urban surface (in springand summer daytime values are sometimes even morethan twice as large than night-time values) and thatσw
increases with height in the surface layer up to about 300
to 400 m above ground especially in summer indicatingan unstable stratification (PANOFSKY et al 1977) Theincrease ofσw with height is not visible in wind tunnelstudies using a realistic model of the surroundings of theGoumlttinger Straszlige but confined to neutral thermal stratifi-cation of the air (pers comm Schatzmann)
PLATE (1995) assumes that the same wind profilelaws are valid for the CFL and the Ekman layer overtowns as applied for flat homogeneous terrain This as-sumption has to be scrutinised because the limited spa-tial extent of a town does not permit an equilibriumflow above the urban area especially not in higher lay-ers WIERINGA (1993) postulates an equilibrium flowat height z above ground if the fetch is homogeneousover about 100 times z The fetch depends on the tur-bulence intensity because intense mixing accelerates theadaptation to changed surface characteristics Thereforethe fetch should be shorter with very rough surfaces andwith unstable thermal stratification ROTH (2000) limitshis assessment of the layers above the URL to the CBLand thus deals only with thermally unstable flows Theintense vertical mixing in the CBL reduces the necessaryfetch for an equilibrium flow ROTH and OKE (1995)therefore postulate fetches more than one order of mag-nitude less than WIERINGA (1993)
Ground-based remote sensing of wind and turbu-lence profiles over urban areas from longer measure-ment campaigns offer the opportunity to learn moreabout the UBL and to reconsider the wind profile lawsused to describe the UBL In this paper the wind andturbulence structure in the URL and the CFL (if exis-tent) are investigated in further detail and for heightsup to about 500 m above ground based on field mea-surements from Hanover (Germany) Moscow (Russia)and Linz (Austria) The mean wind profiles in the CFLare furthermore approximated with two approaches (1)a logarithmic wind profile using the Businger-Dyer sta-bility corrections (BUSINGERet al 1971 DYER 1974)(2) the wind profile formula for the CFL and Ekmanlayer suggested by ETLING (2002) which has been mod-ified here to consider also the thermal stratification in theCFL
2 Instrumentation and measurementsites
The presented study is based on SODAR (SOundDetection And Ranging) measurements from thecities Hanover (Germany about 500000 inhabitants)Moscow (Russia about 10 Mio inhabitants) and Linz(Austria about 200000 inhabitants) A description ofthe measurement principle of SODARs is given egby TATARSKII (1961) MAUGHAN et al (1982) andBEYRICH (1997)
The METEK DSD3x7 mono-static Doppler SODAR(REITEBUCH and EMEIS 1998) operated in Hanover
Meteorol Z 16 2007 S Emeis et al Wind and turbulence in the urban boundary layer 395
has three antennas with seven sound transducers eachworking at about 1500 Hz The instrument is optimisedfor long-range detection up to 1300 m above groundin ideal conditions without external noise sources Themeasurements analysed here have been made from 2001to 2003 The SODAR site in Hanover was situated ina near-central industrial area close to a railway prop-erty away from residential areas At this site the usualmaximum range for wind and turbulence profiles wasbetween 500 and 800 m depending on the atmosphericconditions as well as on the day of the week The rangewas highest on Sundays and public holidays when noshunting of good waggons was made on the nearby rail-way area The data are averaged over 30 min in timeand 125 m in the vertical The measurements wereperformed in the national research project VALIUM(SCHATZMANN et al 2006) within the framework pro-gramme AFO2000 of the German Ministry of Eduactionand Research BMBF
Two monostatic LATAN sodars developed at theObukhov Institute of Atmospheric Physics (IAPh)Russian Academy of Sciences are continuously oper-ated since April 2005 at two sites (1) at the IAPh build-ing in downtown Moscow and (2) at the Physical Facultyof Moscow State University (MSU) in the south-westdistrict of Moscow Additionally two monthly cam-paigns with continuous simultaneous wind measure-ment downtown of Moscow and at a rural site 45 kmwest of Moscow were carried out in October 1993 andin July 2005
The REMTECH phased array SODAR PA2 operatedat Linz is also a mono-static Doppler Sodar with an ar-ray of 14 x 14 sound transducers operating at about1600 Hz The height range of this instrument dependsstrongly on ambient noise and on weather conditionsAt Linz data availability was above 90 up to about300 m and then decreased steadily Data up to 500 mare evaluated in this study The data are averaged over30 min in time and 20 m in the vertical the first layeris in 40 m above ground Continuous SODAR data areavailable from 20 November 2004 to 7 April 2005 mea-sured at a site close to the confluence of the rivers Traunand Danube about 5 km east of the Austrian city of LinzWhenever the most frequent westerly to north-westerlywinds are prevailing this site is expected to be withinthe urban plume the part of the boundary layer down-wind of a city carrying with it the properties of the urbanatmosphere (PIRINGER and JOFFRE 2005) The mea-surements conducted during these wind directions aretherefore interpreted as ldquourbanrdquo wind data the rest ofthe data-set as ldquoruralrdquo
3 Analytical descriptions of wind andturbulence profiles
In the CFL a logarithmic wind profile is expected abovehorizontally homogeneous terrain For the vertical pro-file of the mean wind speed with the inverse of the vanKaacutermaacuten constant 1κ = 25 and the stability-dependentcorrection functionΨm(zLlowast) (BUSINGER et al 1971DYER 1974) holds
u(z) = 25 ulowast(ln(zz0)minusΨm(zLlowast)) (31)
with
Ψm(zLlowast) =
ln
(
(1+x2)2
(
(1+x)2
)2)
minus2arctg(x)+ π2
f or zLlowast lt 0
minusazLlowast f or 0 lt zLlowast le 05
AzLlowast +B(zLlowastminusCD)middotexp(minusDzLlowast)+BCD
f or 05le zLlowast le 7
(32)
and x = (1 minus bzLlowast)14 Llowast is the Monin-Obukhovlength Following HOumlGSTROumlM(1988)a is set to 5 andbis set to 16 In the third equation for stronger stable con-ditions (LANGE and FOCKEN 2006) isA = 1 B = 23C = 5 andD = 035 For the varianceσw of the verticalwind component in neutral and slightly stable conditionsthe following relation should hold (STULL 1988)
σw(z) = 13 ulowast (33)
and thus for the turbulence intensity by dividing (33) by(31)
σw(z)u(z)
=052
ln(zz0)minusΨm(zLlowast)(34)
which is similar to the relation found by WIERINGA
(1973) for the longitudinal variance under neutral strat-ification For the variance of the vertical velocity com-ponentσw under unstable conditions PANOFSKY et al(1977) propose
σw = 13 ulowast(1minus3zLlowast)13 (35)
and thus for the turbulence intensity by dividing (35) by(31)
σw(z)u(z)
=052(1minus3zLlowast)13
ln(zz0)minusΨm(zLlowast) (36)
This implies an increase ofσw with height in thePrandtl layer under unstable thermal conditions
396 S Emeis et al Wind and turbulence in the urban boundary layer Meteorol Z 16 2007
For the Ekman layer the vertical wind speed profiledepends on the geostrophic wind speedug and the (ver-tically constant) turbulent exchange coefficient for mo-mentum KM as formulated in the equations for the Ek-man spiral
u(z) = ug(1minus2exp(minusγz)cos(γz)+ exp(minus2γz))12
(37)
with γ2 = f (2KM) and the Coriolis parameter f For ther-mally unstable situations when KM becomes large (37)can be simplified following EMEIS (2001) because thecosine function approaches unity
u(z) = ug(1minus exp(minusγz)) (38)
The main difference between (37) and (38) is thatin (37) u(z) oscillates aroundug when approachingug
whereas u(z) approachesug monotonically in (38) TheEkman layer laws (37) and (38) suffer from the as-sumption of a vertically constant exchange coefficientand cannot be extended towards the ground There-fore ETLING (2002) proposes a two-layer model In hismodel the exchange coefficient is assumed to increaselinearly with height (=κ ulowast z) below the height ofthe Prandtl layer (CFL) zp and to be constant (=κ ulowastzp) above Etlingrsquos approach is followed here with theapplication of one amendment the correction functionΨm(zLlowast) for the thermal stratification of the Prandtllayer is applied below the height zp This leads to thefollowing vertical profile of the mean wind speed
u(z) =
ulowastκ (ln(zz0)minusΨm(zLlowast)) f or z lt zp
ug(minussinα0 +cosα0) f or z = zp
ug[1minus2radic
2exp(minusγ(zminus z0))middotsinα0cos
(
γ(zminus z0)+ π4 minusα0
)
+2exp(minus2γ(zminus z0))sin2α0]12
f or z gt zp
(39)
(39) depends on the following six parameters the sur-face roughnessz0 the geostrophic wind speedug theheight of the Prandtl layerzp the friction velocityulowast theMonin-Obukhov lengthLlowast and the angle between thesurface wind and the geostrophic windα0 The two vari-ablesz0 andug are external parameters the other four ofthem are internal parameters and vary according to thethermal stratification of the layer If fixed values forzp
ndash as done by ETLING (2002) ndash and forLlowast are chosentwo further equations in addition to (39) are needed todetermineulowast and α0 accordingly These equations aregenerated here from the physical requirement that both
the wind speed as well as the wind shear are continuousin the heightz = zp Equating the first two equations ofthe wind profile equation (39) forz = zp gives
ulowast =κug(minussinα0 +cosα0)
ln(zpz0)minusΨm(zpLlowast)(310)
and from equating the respective shear equations in thesame heightz = zp we get
ulowast =2|ug|γκzp sinα0
ϕ(zpLlowast)(311)
with the correction function for thermal stratification(using HOumlGSTROumlMrsquos (1988) values for the constants)ϕ(zLlowast)
ϕ(zLlowast)=
(1+16zLlowast)minus14 f or zLlowast lt 01 f or 0 lt zLlowast le 05
1+5zLlowast f or zLlowast gt 05(312)
Equating now the right hand sides of (310) and (311)yields the desired relation forα0
α0 = arctg1
1+2γzp
ϕ(zpLlowast)(ln(zpz0)minusΨm(zpLlowast))
(313)(313) still depends onulowast via γ
γ =
radic
f2κulowastzp
(314)
thusulowast has to be determined iteratively starting with afirst guess forulowast in (314) subsequently computingα0from (313) and then re-computingulowast from (310) or(311) The equation (2150) in ETLING (2002) is notappropriate to determineulowast and fromzp z0 andug
A shortcoming of equations (39) to (314) is thatthermal layering in the Ekman layer is still not consid-ered Therefore the yielded values for the height of thePrandtl layer and the friction velocity are not fully satis-fying but they are better than in the original formulationof ETLING (2002) without considering the thermal lay-ering in the Prandtl layer Even more complex expres-sions for the vertical profile of the exchange coefficientKM lead to systems of equations which no longer can besolved analytically
We will analyse the results from the sodar measure-ments given in the following chapter whether the rightchoice ofzp ulowast Llowast and α0 will lead to a meaningfulapplication of the wind profile laws (31) and (39)
4 Results
41 Mean urban wind profiles
Mean monthly wind profiles observed in Hanover inAugust and November 2002 and in February and April
Meteorol Z 16 2007 S Emeis et al Wind and turbulence in the urban boundary layer 397
Figure 1 Mean monthly wind profiles for day-time and night-time in Hanover and approximations of these profiles by stability-dependent
logarithmic wind profiles from eq (31)
Figure 2 Mean monthly wind profiles for day-time and night-time in January 2006 April 2005 July 2005 and October 2005 in Moscow
The height range is limited to 300 m
398 S Emeis et al Wind and turbulence in the urban boundary layer Meteorol Z 16 2007
Figure 3 Mean winter wind speed profiles for day and night-time
in Linz and approximations of these profiles by stability-dependent
logarithmic wind profiles from eq (31)
2003 together with stability-dependent logarithmic windprofiles (Eq (31)) are shown in Fig 1 These monthshave been chosen as representative for the four seasonsNocturnal wind speeds are on average higher than day-time wind speeds in all cases except in April 2003 wherethe mean wind speeds during day-time below 125 mabove ground occurred to be higher than the night-timeaverages The monthly means are computed from 30min-mean profiles which are complete up to at least 210m Above this height the data availability decreases andis about 20 at 500 m height The standard deviationof the wind speed values used for the calculation of themeans depends on the season and slightly on the heightabove ground It is lowest in November with about 30 in all heights and largest in August with nearly 50 inlower heights and roughly 60 in upper heights
In autumn and winter the differences between thedaytime and the night-time wind profiles are rathersmall ie the mean stratification of the air is alwaysquite stable (Llowast = 450 m and 1000 m at daytime and320 m and 450 m at night respectively have been usedin the fit with eq (31) here) In spring and summer thedaytime profiles are distinctively coined by the unsta-ble thermal stratification of the airLlowast in the fit with thestability-dependent logarithmic wind profile (31) there-fore is ndash4000 m and ndash800 m at daytime and 250 m and120 m at night respectively The night-time profiles inthese two seasons show that low-level-jets with a windmaximum at 300 to 350 m above ground are frequentlyobserved in the urban area of Hanover In all fits theroughness length was set toz0 = 1 mulowast is varying bet-ween 0201 ms for the night-time profile in August and0538 ms for the daytime profile in April In autumnand winter the observed average wind profiles withinthe lowest 500 m above ground are relatively well rep-resented by the logarithmic wind profile In spring theanalytic and the mean observed wind profiles agree upto 350 m above ground in summer up to 250 m above
Figure 4 Mean winter wind speed profiles for selected wind direc-
tions (urban and non-urban fetch) in Linz
ground while the observed wind speeds are on average1 to 2 ms lower than expected according to the logarith-mic wind profiles at higher levels
Mean monthly wind profiles for day-time and night-time observed in Moscow in January April July and Oc-tober are depicted in Fig 2 The seasonal results can becompared to those from the measurements in Hanover(Fig 1) Please note that the height scales differ be-tween Fig 1 and Fig 2 The seasonal differences of thewind profiles observed in Moscow are very similar tothose found in Hanover Day and night-time wind pro-files within the lowest 100 m are similar in autumn andwinter In spring and summer up to about 150 m day-time wind speeds are on average 1 to 2 ms higher thanat night Above 150 m the mean nocturnal wind speedsare always higher than those at day-time The strong in-crease of wind speed within the lowest 100 m shown inFigs 1 and 2 is typical for urban areas
Seasonal mean wind speed profiles for wintertimeobserved in Linz at day- and night-time are shownin Fig 3 As observed in wintertime in Hanover andMoscow the average day and night-time wind speedsat Linz are similar below 100 m above ground and day-time wind speeds are lower than those at night aboveThe fit with the logarithmic wind profile (31) is bestwith Llowast = 1000 m during daytime and 600 m in the nightAs for Hanover a roughness length ofz0 = 1 m has beenchosen The friction velocityulowast for this winter seasonin Linz is 032 ms at nighttime and 036 ms at day-time which is very close to the February 2003 value forHanover (ulowast = 036 at day and night)
42 Comparison of mean urban windprofiles to non-urban wind profiles
Urban and hilly areas in general have a larger surfaceroughness than flat rural terrain Wind speeds are there-fore increasing considerably with height for several hun-
Meteorol Z 16 2007 S Emeis et al Wind and turbulence in the urban boundary layer 399
Figure 5 Mean monthly profiles of the variance of the vertical velocity component (σw) in dependence of the main wind direction and for
day-time and night-time in Hanover
dreds of meters at these sites Over the smooth rural ar-eas this increase is confined to a shallower layer
Seasonal mean wind speed profiles for wintertimeobserved in Linz in dependence of the wind direction areshown in Fig 4 The separation according to wind direc-tions was chosen in order to investigate whether the cityof Linz exerts an urban influence on the wind profilesat the SODAR site downwind of the city This is anti-cipated for westerly to north-westerly winds Northerlywinds at the SODAR site are probably influenced bydrainage flows from the hills north and north-east of thesite there is also the village of Steyregg situated 15 kmnorth of the site Another built-up but flat area is foundabout 15 km south of the site With easterly winds thefetch is predominantly rural along the river Danube upto a distance of more than 3 km
The mean wind speed profiles in Fig 4 show largedifferences between wind profiles observed with strongwesterlies (between 6 and 11 ms with increasing height)and those observed with weak northerly and southerlyflow The latter show no strong variation in wind speedup to heights of about 300 m for northerly winds this isdue to the shadowing effects of the aforementioned hillsat the northern edge of the Linz basin The terrain is alsosteepening towards south but to a much lesser extent
The average wind profiles for westerly to north-westerly winds having crossed the urban area show the
strongest increase in wind speed between 40 and 100m above ground this is in line with the assumption atthe beginning of this section that due to the increasedsurface roughness wind speeds increase stronger withheight than over rural terrain A wind speed maxi-mum is found on average at 100 m height when west-north-westerly or north-westerly winds are prevailingThis maximum is also observed in other urban areasby PIRINGER and BAUMANN (1999) DRAXLER (1986)and BALLING and CERVENY (1987) due to the in-creased vertical mixing above the urban area the low-level air flow is destabilized and accelerated while cross-ing the warmer city centre
43 Mean urban turbulence profiles
Mean monthly profiles of variances of the vertical ve-locity component (σw) in Hanover separated for day andnight and for four wind direction sectors are depicted inFig 5 for the same months as in Figure 1
Fig 5 shows increasing values ofσw within the lowerfew hundred meters of the urban boundary layer inspring and most pronounced in summer reaching up toabout 350 m above ground The daytime increase can beexplained by unstable stratification (see eq (35) Theconsiderable increase of the night-timeσw with heightis in the lower 100 m also due to unstable stratificationbut above this height probably related to the formation
400 S Emeis et al Wind and turbulence in the urban boundary layer Meteorol Z 16 2007
Figure 6 Shows monthly mean profiles of the vertical component of the turbulenceintensity observed in Hanover ieσw divided by the
average horizontal wind speed This quantity therefore inversely depends on the mean wind speed
Figure 7 Diurnal variations of the variance of the vertical velocity component (σw) in summer in Moscow (left) and in Hannover (right)
of nocturnal low-level jets (see the upper right and espe-cially the lower left frame in Figure 1) The maximumof σw is in the same height as the core of the low-leveljet Theσw values near the ground are a little bit higherthan expected from (33) and (35) According to theserelations and using theulowast values used for fitting in Fig1 theσw values should range between about 03 ms forthe night-time variance in August and about 07 ms forthe daytime variance in April
The differences between daytime and night-timeσw
profiles are small in winter and autumn although thewinter profiles show a large dependence of the synoptic
wind direction In wintertime the largest values ofσw
occur with usually stronger westerly winds Night-timeand daytime profiles differ most in spring and summer-time In these seasons the differences between the meanday-time and night-time profiles are much larger thanthe differences between the mean profiles for differentwind directions
Fig 6 shows monthly mean profiles of the verti-cal component of the turbulence intensity observed inHanover ieσw divided by the average horizontal windspeed This quantity therefore inversely depends on themean wind speed
Meteorol Z 16 2007 S Emeis et al Wind and turbulence in the urban boundary layer 401
Figure 8 Mean winter profiles of the variance of the vertical veloc-
ity component (σw) for day-time and night-time in Linz
Figure 9 Mean winter profiles of the vertical component of the tur-
bulence intensity for day-time and night-time in Linz
Turbulence intensity is highest in summer and springIn these two seasons the daytime values are twice ashigh as the night-time values At daytime turbulence in-tensity profiles in spring and summer are more or lessconstant with height up to 300 to 400 m above groundIn autumn winter and generally at night-time the pro-files show a strong decrease of the turbulence intensitywith height within the lower 150 to 200 m in accordancewith eqs (34) and (36)
The diurnal course of the variance of the vertical ve-locity component in summertime is found to be quitesimilar in Hanover and Moscow Nevertheless Fig 7 in-dicates that the overall level ofσw is somewhat larger inthe much larger city of Moscow than in the smaller cityof Hanover although the mean wind speeds in Moscowin July 2005 have been even lower than in Hanover inAugust 2002 Both plots show thatσw increases withheight at daytime and nighttime in summer in accor-dance with the profiles shown in the lower left frameof Figure 5
Seasonal meanσw profiles for wintertime observedin Linz at day- and nighttime and in dependence of thewind direction are shown in Fig 8 and the mean turbu-lence intensity profiles in Fig 9 As mentioned in sec-
Figure 10 Same as Fig 8 but different wind direction
Figure 11 Same as Fig 9 but different wind direction
tion 2 the measurement period in Linz covers mainlythe winter months The averageσw profiles (Fig 8) gen-erally show an increase with height The range is be-tween 03 and 05 ms near ground and about 05 to 09ms at 500 m The near-ground values ofσw in Linz fitquite well to the relations (33) and (35) from whichσw
= 044 could be expected usingulowast = 034 from Fig 3As expected and also found in the other cities nocturnalσw values are on average lower than daytime values
The turbulence intensity values in Linz range frombelow 01 to near 016 (Fig 9) and are thus smaller thanthose observed in Hanover The average daytime tur-bulence intensity is about 15 times larger than that atnight-time
44 Comparison of monthly mean urbanturbulence to non-urban turbulence
Diurnal variations of the variance of the vertical ve-locity component (σw) in Hanover have already beencompared in EMEIS (2004) with those from the non-urban site in Fuumlrstenfeldbruck west of Munich (Ger-many) Due to the higher surface roughness the frictionvelocity is higher over urban areas Therefore accordingto (33) and (35) higher variances of the vertical veloc-ity component have been found at urban areas both atnight-time and at daytime Also the diurnal variations of
402 S Emeis et al Wind and turbulence in the urban boundary layer Meteorol Z 16 2007
Figure 12 Comparison of analytical wind profiles to the observed mean day and night-time wind profiles in Hannover in August 2002
Bold line observations thin line profile from (31) dotted line profile from (36)
Figure 13 Comparison of analytical wind profiles to the observed mean day and night-time wind profiles in Linz in winter (November
2004 to April 2005) Bold line observations dashed line profile from (31) dotted line profile from (39)
σw have been found to be more pronounced at the urbanarea (at least in spring and summer) This is due to thelarger heating from surfaces in urban areas during dayand night
For Linz a possible urban influence on the turbu-lence quantities can be obtained by comparing ldquourbanrdquoand ldquonon-urbanrdquo wind directions The lowestσw valuesare measured with the rural easterly winds and the raresoutherly winds (Fig 10) The highestσw values are ob-served for the ldquourbanrdquo directions west to north-west Thevery highσw values with westerly winds are caused bya combination of high wind speeds and the urban effectThe σw values with northerly winds are close to the alldata average Theσw values under urban influence areat least twice as large as those for easterly and southerlywinds with rural fetch
Most of the mean turbulence intensity profiles fordifferent wind directions in Linz (Fig 11) show a de-crease of turbulence with height With northerly andsoutherly winds high turbulence intensities are on aver-age caused by the generally low wind speeds and com-parably large variances Above-average turbulence in-tensities are also found in Linz with the ldquourbanrdquo wind
directions west-north-west and north-west The lowestturbulence values are observed on average when easterlyand southerly winds are prevailing The rather small tur-bulence values with westerly winds are caused by thevery high average wind speeds observed with this direc-tion thus apparently masking the influence of the urbanarea The urban effect on the turbulence intensity pro-files observed at Linz is over-ridden by the large differ-ences in wind speeds associated with the different winddirections
As expected turbulence intensity is found to be muchlarger in urban areas and for profile measurements influ-enced by urban fetch due to larger surface roughness andlarger thermal heating than at flat rural sites or under theinfluence of a mainly rural fetch
45 Application of analytical wind profilelaws
In Figures 1 and 3 the urban mean wind profiles inHanover and Linz have been approximated with thePrandtl-layer wind profile from equation (31) But itis not meaningful to extend a Prandtl-layer profile toheights of 500 m and more Even above cities this height
Meteorol Z 16 2007 S Emeis et al Wind and turbulence in the urban boundary layer 403
is already within the Ekman layer Thus a profile de-scription is needed which fulfills the requirements ofboth layers the Prandtl layer and the Ekman layer inorder to adequately describe vertical wind profiles inthe urban boundary layer up to several hundred metresabove ground Therefore we will examine here the two-layer model given in eq (39) for Hanover and Linz inorder to assess the applicability of this approach
In Fig 12 and 13 analytical daytime and night-timewind profiles are compared to mean wind profiles ob-served in Hanover in August 2002 and in Linz in win-ter 20042005 The three additional free parameters inequation (39) (in comparison to eq (31)) are tuned inorder to improve the agreement to the measured windprofiles The first three parameters have been chosen asclose as possible to the ones found in Figs 1 and 3
For the approximations shown in Fig 12 the Prandtl-layer heightzp is set to 30 m at night and to 150 m atdaytime Below the heightzp both profile laws ((31) and(39)) give identical values The roughness lengthz0 isset to 1 m the Monin-Obukhov lengthLlowast is chosen inorder to represent the profile belowzp properly and thegeostrophic wind speed is set equal to the wind speedat 500 m The friction velocityulowast is then iterated fromthe eq (311) to (314) as described in Chapter 3 Fromthis iteration the friction velocity at daytime (ulowast = 037ms) turns out to be about twice as high as at night-time(ulowast = 018 ms) The turning angle of the wind directionchanges between 32 at night and 127 at day Both val-ues seem reasonable
For Linz (Fig 13) the Prandtl-layer heightzp is set to30 m at night and to 60 m at daytime With these valuesthe profiles from (39) show the best fit to the wind datain upper levels The daytime value forzp is much lowerthan that used for Hanover which can be explained bythe predominantly wintertime data set at Linz comparedto the August data from Hanover The roughness lengthat Linz is 02 m the Monin-Obukhov lengthLlowast is de-rived from ultrasonic anemometer measurements to bendash100 m on average during daytime and 200 m duringnight As in Hanover the geostrophic wind speed is setequal to the wind speed at 500 m and the friction veloc-ity again determined iteratively is also about twice aslarge during daytime (044 ms) than during night (0225ms) The turning angle of the wind direction changesbetween 28 at night and 17 during daytime
5 Discussion
The average wind speed the standard deviation of thevertical velocity and turbulence intensity profiles ob-served in three cities of different size Moscow Hanoverand Linz show similarities as well as differences day-time wind speeds are on average higher than night-time wind speeds at higher levels in spring (Hanover
Moscow) and summer (Moscow) and lower than thenocturnal wind speeds throughout the lowest few hun-dred meters in autumn and winter in all three cities Asexpected daytime wind speed profiles tend to be lessstable than night-time profiles This is most pronouncedin spring and summer The wind speed profiles of thelargest city Moscow show the weakest increase of windspeed with height and thus the strongest urban impacton stability In winter differences between day and nightare small in all three cities as the stratification of the airis always quite stable
In Linz westerly to north-westerly winds cross thecity before reaching the SODAR site while the windprofiles observed by the SODAR with other wind direc-tions are affected by hilly or rural terrain Wind speedsare increasing with height up to 500 m above ground inall mean wind profiles this increase of wind speed is inmost cases less pronounced above 400 m Urban effectson the wind speed profiles at Linz are seen in an above-average increase in wind speed with height at low levelsas well as in a wind speed maximum at 100 m when theflow crosses the urban area before reaching the SODARsite The latter is interpreted as an urban effect in thiscase because the increased vertical mixing over the cityincreases instability and thus accelerates the flow
The following main part of this discussion will befocused on two issues the increase ofσw with heightand the description of the whole vertical wind profile bythe two-layer model (39)
Theσw profiles observed in Hanover and Linz are ofthe same magnitude and in general increase with heightespecially in spring and summer The reasons for thisincrease are probably twofold The first reason is thatin the lower one hundred metres above the town thenocturnal thermal stratification remains slightly unsta-ble in spring and summer This can eg be inferred forHanover from some days for which additionally tem-perature profiles from a RASS (Radio acoustic sound-ing system) measurement had been available (EMEIS etal 2004) In Figs 5 to 7 in EMEIS et al (2004) it isshown for three days in spring 2002 that the tempera-ture at roof-top level (43 m above ground) is more than1C larger than at about 100 m above ground at nightAbove this unstable layer the RASS data show that theatmosphere is stably stratified up to about 400 m as hasalready been inferred from the wind profiles shown inFigs 1 and 3 The second reason for the increase ofσw
with height is the frequent formation of low-level jetsat the top of the nocturnal stable layer at about 400 mabove ground in spring and summer as is also to be seenfrom the upper right and lower left frames in Figure 1These low-level jets lead to a mechanical production ofturbulence at night in heights between 100 m and 400 mabove ground a fact which had already been proven inREITEBUCH et al (2000)
404 S Emeis et al Wind and turbulence in the urban boundary layer Meteorol Z 16 2007
Additionally theσw profiles observed on average inFebruary in Hanover as well as those measured duringwintertime in Linz are highly dependent on the wind di-rection the largest values ofσw occur with strong west-erly winds Day-night differences are large in both citiesup to a factor of two in Linz Theσw values measuredin Linz when the ldquourbanrdquo wind directions west to north-west are prevailing are considerably larger than for themore rural easterly and southerly winds The nocturnalσw values over Hanover Moscow and Linz are con-siderably larger than over rural areas (see also EMEIS
(2004)) This is in agreement with the findings presentedby UNO et al (1988 1992) and DUPONT et al (1999)who also showed that the large roughness of the townsurface and the urban heat island prevents the formationof a cool stably stratified nocturnal surface layer as it istypical for rural areas for nights with clear skies Fur-ther the near-surface values of the variancesσw over thelarger cities Hanover and Moscow are larger than couldbe expected from the friction velocity using (33) and(35) This hints to the fact that turbulence productionover rough surfaces with bluff bodies is larger than overflat surfaces with the same roughness length and frictionvelocity Similar enhancements of turbulence have beenfound over forests (HOumlGSTROumlMet al 1989)
Fewer similarities are found between the average tur-bulence intensity profiles in Hanover and Linz The Feb-ruary profiles in Hanover show a sharp decrease withheight in the lowest 150 to 200 m The Linz profilesreveal a much weaker decrease and a stronger depen-dence on the wind direction Conceptually turbulenceintensity in urban areas or in hilly terrain is expectedto be higher than in rural areas In Linz the results onturbulence intensity are influenced by the large direc-tional differences in wind speed although west-north-westerly north-westerly winds and in general daytimeprofiles show higher turbulence intensities the largestvalues occur with southerly and northerly winds whichhave by far the lowest average wind speeds So the pos-sible urban effect on the turbulence intensity in Linz ismasked by the significant differences in wind speed ofdifferent regional flow directions and by orographic ef-fects
Because the division between the Prandtl layer andthe Ekman layer is not very clear over urban areas dueto the larger turbulence also several hundreds of metresabove ground a unified description of the vertical windprofile for the whole boundary layer over these areas isdesirable From the results presented in this paper theamended Etling approach (39) for the combined ana-lytical description of wind profiles in the Prandtl andEkman layer seems to be a reasonable tool to approx-imate the measured urban wind profiles Figs 12 and13 show that in the cases analysed here the modifiedEtling approach (39) leads to smaller wind speed values
at greater heights at night-time but to higher wind speedsat these heights during day-time compared to the purelogarithmic profiles from equ (31) Both times equa-tion (39) fits the observational data better than equa-tion (31) Especially at night time we see that the pro-files are reproduced rather well with the sole exceptionof the low-level jet in Hanover As the equations (39)and (31) are derived for stationary conditions an un-stationary feature like a low-level jet can not be repro-duced by these analytical profiles The approximation ofthe wind profile using the Etling approach works well inboth cities with their different environments and havingused data from different seasons
This success of the two-layer model (39) is not toomuch surprising because this approach depends on sixvariables which need to be chosen and which can betuned according to the measurements in the presentedcases In doing this tuning it turns out that the rightchoice of the Prandtl-layer heightzp in the two-layermodel (39) is the most important task Ifzp is not chosenappropriately then no combination of the other five pa-rameters will lead to a satisfying fit of the wind profileThe extension of the original version of this approach(ETLING 2002) by adding the correction terms for non-neutral stratification for heights below the Prandtl layerheight as described in Section 3 enhanced the applica-bility of this approach and led to much more meaningfulvalues ofzp
6 Conclusions
In this paper mean SODAR measurements of urbanwind and turbulence profiles in three differently sizedcities are presented Although they show common andconsistent features they allow only a qualitative estima-tion of the urban influence Having used data from threecities with roughly 200000 500000 and 10000000 in-habitants it is not justified to derive quantitative depen-dencies on features like size and population characteris-ing a city Typical urban features are a higher wind shearin heights of several hundreds of meters above grounda larger increase ofσw with height especially at nightand a doubling of the turbulence intensity The noctur-nal increase ofσw with height in spring and summer isnot just an urban feature but a feature which comes fromthe interaction between rural and urban air flows Low-level jets form over rural areas and the additional surfacefriction due to cities is not sufficient to destroy themThus the higher mechanically-produced turbulence be-low low-level jets in heights between 100 and 400 mabove ground continues the higher thermally-producedturbulence in the urban boundary layer below 100 mThe results of this study have shown that urban areasand forests have mechanically some features in common
Meteorol Z 16 2007 S Emeis et al Wind and turbulence in the urban boundary layer 405
(enhanced turbulence intensity) Looking at thermal fea-tures they are very different as forests exhibit no featuresthat are comparable to the urban heat island
The knowledge of these urban features and the im-proved analytical description of the urban wind profileup to 500 m which is proposed in this paper help withthe assessment of the conditions for pollutant transportover heavily populated areas Urban areas are known fortheir strong emissions of pollutants and reliable disper-sion calculations are a mandatory prerequisite for airpollution mitigation strategies Likewise the informa-tion on urban wind and turbulence profiles is valuableto test and validate meso-scale and micro-scale numeri-cal flow simulation models As the population living incities is still growing these models are indispensable forair quality forecasts as well as for studies concerningthe impact of climate change on the health prospects forlarge parts of the Earthrsquos population
References
ARYA SP 1995 Atmospheric boundary layer and its para-meterization ndash In CERMAK JE et al (Hrsg) Wind Cli-mate in Cities Kluwer Dordrecht 41ndash66
BALLING R C JR RS CERVENY 1987 Long-term as-sociation between wind speeds and the urban heat island ofPhoenix Arizona ndash J Climate Appl Meteor26 712ndash716
BATCHVAROVA E S-E GRYNING 2006 Progress in ur-ban dispersion studies ndash Theor Appl Climatol84 57ndash67
BEYRICH F 1997 Mixing height estimation from sodardata ndash a critical discussion ndash Atmos Environ31 3941ndash3953
BUSINGER JA JC WYNGAARD Y IZUMI EFBRADLEY 1971 Flux profile relationships in the at-mospheric surface layer ndash J Atmos28 181ndash189
CASADIO S A DI SARRA G FIOCCO D FUA F LENAMP RAO 1996 Convective characteristics of the noctur-nal urban boundary layer as observed with Doppler sodarand Raman lidar ndash Bound-Layer Meteor79 375ndash391
CERC 2001 Cambridge Environmental Research Consul-tants ADMS dispersion model ndash httpwwwcerccouk
COUNIHAN J 1973 Simulation of an adiabatic urbanboundary layer in a wind tunnel ndash Atmos Environ7 673ndash689
DOBRE A SJ ARNOLD RJ SMALLEY JWD BODDYJF BARLOW AS TOMLIN SE BELCHER 2005 Flowfield measurements in the proximity of an urban intersec-tion in London UK ndash Atmos Environ39 4647ndash4657
DRAXLER R R 1986 Simulated and observed influence ofthe nocturnal urban heat island on the local wind field ndash JClimat Appl Meteor25 1125ndash1133
DUPONT E L MENUT B CARISSIMO J PELON PFLAMANT 1999 Comparison between the atmosphericboundary layer in Paris and its rural suburbs during theECLAP experiment ndash Atmos Environ33 979ndash994
DUPONT S P G MESTAYER 2006 Parameterisation ofthe urban energy budget with the submesoscale soil modelSM2-U ndash J Appl Meteor Climatol45 1744ndash1765
DYER AJ 1974 A review of flux-profile relations ndashBound-Layer Meteor1 363ndash372
EMEIS S 2001 Vertical variation of frequency distributionsof wind speed in and above the surface layer observed bysodar ndash Meteorol Z10 141ndash149
mdash 2004 Vertical wind profiles over an urban area ndash Meteo-rol Z 13 353ndash359
EMEIS S M TUumlRK 2004 Frequency distributions of themixing height over an urban area from SODAR data ndash Me-teorol Z13 361ndash367
EMEIS S C MUumlNKEL S VOGT WJ MUumlLLER KSCHAumlFER 2004 Atmospheric boundary-layer structurefrom simultaneous SODAR RASS and ceilometer mea-surements ndash Atmos Environ38 273ndash286
ETLING D 2002 Theoretische Meteorologie Eine Ein-fuumlhrung 2 Auflage ndash Springer-Verlag Berlin HeidelbergNew York 354 pp
FARELL C AKS IYENGAR 1999 Experiments on thewind tunnel simulation of atmospheric boundary layers ndashJ Wind Eng Indust Aerodyn79 11ndash35
FISHER B S JOFFRE J KUKKONEN M PIRINGER MROTACH M SCHATZMANN (Eds) 2005 Meteorologyapplied to urban air pollution problems ndash Final Reportof COST Action 715 ISBN 954-9526-30-5 Demetra LtdPublishers Printed in Bulgaria 276 pp
GRIMMOND CSB 2006 Progress in measuring and ob-serving the urban atmosphere ndash Theor Appl Climatol843ndash22
HILDEBRAND PH B ACKERMANN 1984 Urban Effectson the Convective Boundary Layer ndash J Atmos Sci41 76ndash91
HOumlGSTROumlM U 1988 Non-dimensional wind and tem-perature profiles in the atmospheric surface layer a re-evaluation ndash Bound-Layer Meteor42 55ndash78
HOumlGSTROumlM U H BERGSTROumlM A-S SMEDMAN SHALLDIN A L INDROTH 1989 Turbulent exchangeabove a pine forest I Fluxes and gradients ndash Bound-LayerMeteor49 197ndash217
LANGE M U FOCKEN 2006 Physical Approach to Short-Term Wind Power Prediction ndash Springer Berlin Heidel-berg 208 pp
LOKOSHCHENKO MA 2002 Long-Term Sodar Observa-tions in Moscow and a New Approach to Potential MixingDetermination by Radiosonde Data ndash J Atmos OceanicTechnol19 1151ndash1162
MARTILLI A A CLAPPIER M W ROTACH 2002 An ur-ban surface exchange parameterisation for mesoscale mod-els ndash Bound-Layer Meteor104 261ndash304
MASSON V 2000 A physically-based scheme for the ur-ban energy budget in atmospheric models ndash Bound-LayerMeteor94 357ndash397
MAUGHAN RA AM SPANTOND ML W ILLIAMS 1982 An analysis of the frequency distribution of SODARderived mixing heights classified by atmospheric stabilityndash Atmos Environ16 1209ndash1218
MELLING H R LIST 1980 Characteristics of Vertical Ve-locity Fluctuations in a Convective Urban Boundary Layerndash J Appl Meteor19 1184ndash1195
PANOFSKY HA H TENNEKES DH LENSCHOW JCWYNGAARD 1977 The characteristics of turbulent veloc-ity components in the surface layer under convective condi-tions ndash Bound-Layer Meteor11 355ndash361
406 S Emeis et al Wind and turbulence in the urban boundary layer Meteorol Z 16 2007
PEKOUR MS MA KALLISTRATOVA 1993 Sodar studyof the boundary layer over Moscow for air pollution appli-cation ndash Appl Phys B57 49ndash55
PEKOUR MS MA KALLISTRATOVA MALOKOSHCHENKO IV PETENKO 1993 Acousticsounding study of the mixing layer over a city ndash In Opticalmonitoring of the environment Proceedings of SPIE Vol2107 SPIE Bellingham WA 1993 169ndash193
PIRINGER M K BAUMANN 1999 Modifications of a val-ley wind system by an urban area ndash experimental results ndashMeteor Atmos Phys71 117ndash125
PIRINGER M S JOFFRE (Eds) 2005 The urban surfaceenergy budget and mixing height in European cities datamodels and challenges for urban meteorology and air qual-ity ndash Final report of Working Group 2 of COST Action 715ISBN 954-9526-29-1 Demetra Ltd Publishers Printed inBulgaria 239 pp
PIRINGER M S JOFFRE A BAKLANOV A CHRIS-TEN M DESERTI K DE RIDDER S EMEIS P MES-TAYER M TOMBROU D MIDDLETON K BAUMANN -STANZER A DANDOU A KARPPINEN J BURZYNSKI2007 The surface energy balance and the mixing heightin urban areas ndash activities and recommendations of COST-Action 715 Published online April 5 2007 in Bound-Layer Meteor DOI 101007s10546-007-9170-0
PLATE EJ 1995 Urban Climates and Urban Climate Mod-elling An Introduction ndash In CERMAK JE et al (Eds)Wind Climate in Cities NATA ASI Series E277 KluwerAcad Publ Dordrecht 23ndash39
REITEBUCH O S EMEIS 1998 SODAR-measurementsfor atmospheric research and environmental monitoring ndashMeteorol Z N F7 11ndash14
REITEBUCH O A STRASSBURGER S EMEIS W KUT-TLER 2000 Nocturnal secondary ozone concentrationmaxima analysed by sodar observations and surface mea-surements ndash Atmos Environ34 4315ndash4329
ROTACH MW 1999 On the influence of the urban rough-ness sublayer on Turbulence and dispersion ndash Atmos Env-iron 33 4001ndash4008
ROTACH MW R VOGT C BERNHOFER E BATCH-VAROVA A CHRISTEN A CLAPPIER B FEDDERSEN
S-E GRYNING G MARTUCCI H MAYER V M ITEVT R OKE E PARLOW H RICHNER M ROTH Y-AROULET D RUFFIEUX J A SALMOND M SCHATZ-MANN J A VOOGT 2005 BUBBLE ndash an Urban Bound-ary Layer Meteorology Project ndash Theor Appl Climatol81 231ndash261
ROTH M 2000 Review of atmospheric turbulence overcities ndash Quart J Roy Meteor Soc126 941ndash990
ROTH M TR OKE 1995 Relative efficiencies of turbulenttransfer of heat mass and momentum over a patchy urbansurface ndash J Atmos Sci52 1863ndash1874
SCHATZMANN M B LEITL 2002 Validation and appli-cation of obstacle-resolving urban dispersion models ndash At-mos Environ36 4811ndash4821
SCHATZMANN M W BAumlCHLIN S EMEIS JKUumlHLWEIN B LEITL WJ MUumlLLER K SCHAumlFER HSCHLUumlNZEN 2006 Development and Validation of Toolsfor the Implementation of European Air Quality Policy inGermany (Project VALIUM) ndash Atmos Chem Phys63077ndash3083
STULL RB 1988 An Introduction to Boundary Layer Me-teorology ndash Kluwer Acad Publ 666 pp
TATARSKII VI 1961 Wave Propagation in a TurbulentMedium Translated from Russian by R A Silverman ndashMcGraw-Hill New York 285 pp
UNO I S WAKAMATSU H UEDA A NAKAMURA 1988 An observational study of the structure of the noc-turnal urban boundary layer ndash Bound-Layer Meteor4559ndash82
mdash mdash mdash mdash 1992 Observed structure of the nocturnalurban boundary layer and its evolution into a convectivemixed layer ndash Atmos Environ26B 45ndash57
VENKATRAMM A V ISAKOV D PANKRATZ JHEUMANN J YUAN 2004 The analysis of data from anurban dispersion experiment ndash Atmos Environ38 3647ndash3659
WIERINGA J 1973 Gust factors over open water and built-up country ndash Bound-Layer Meteor3 424ndash441
mdash 1993 Representative roughness parameters for homoge-neous terrain ndash Bound-Layer Meteor63 323ndash363
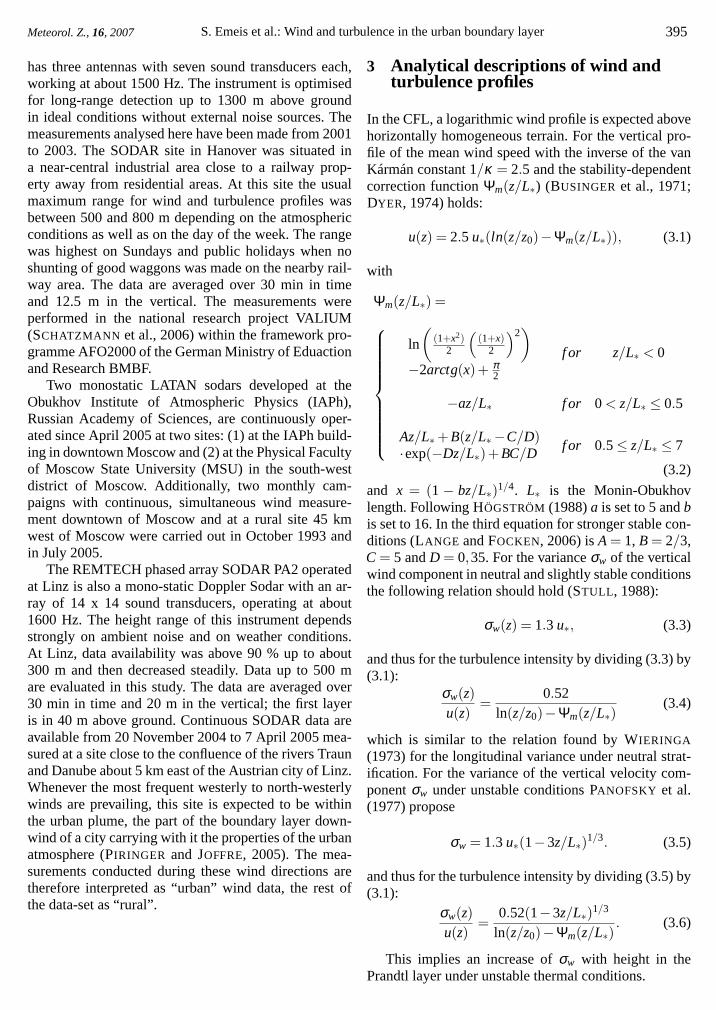
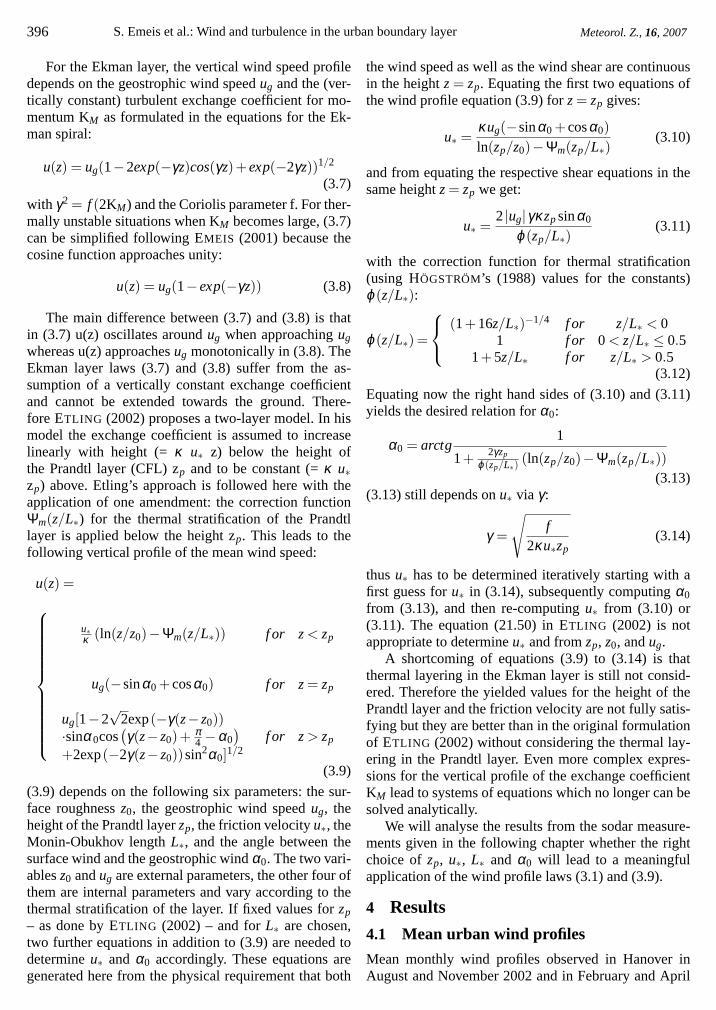
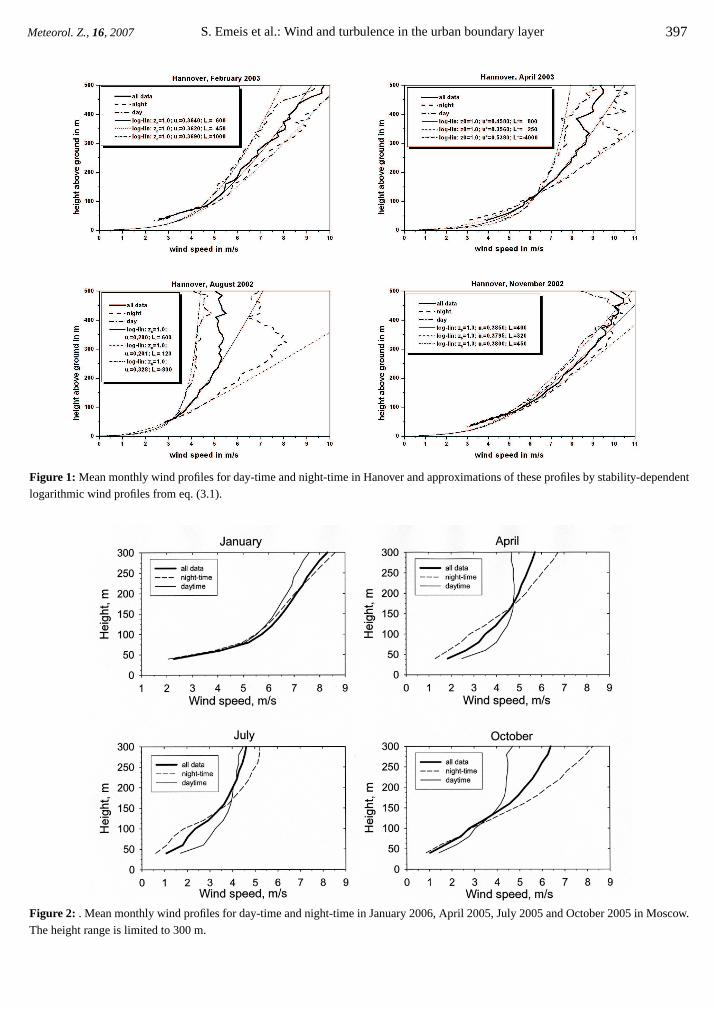
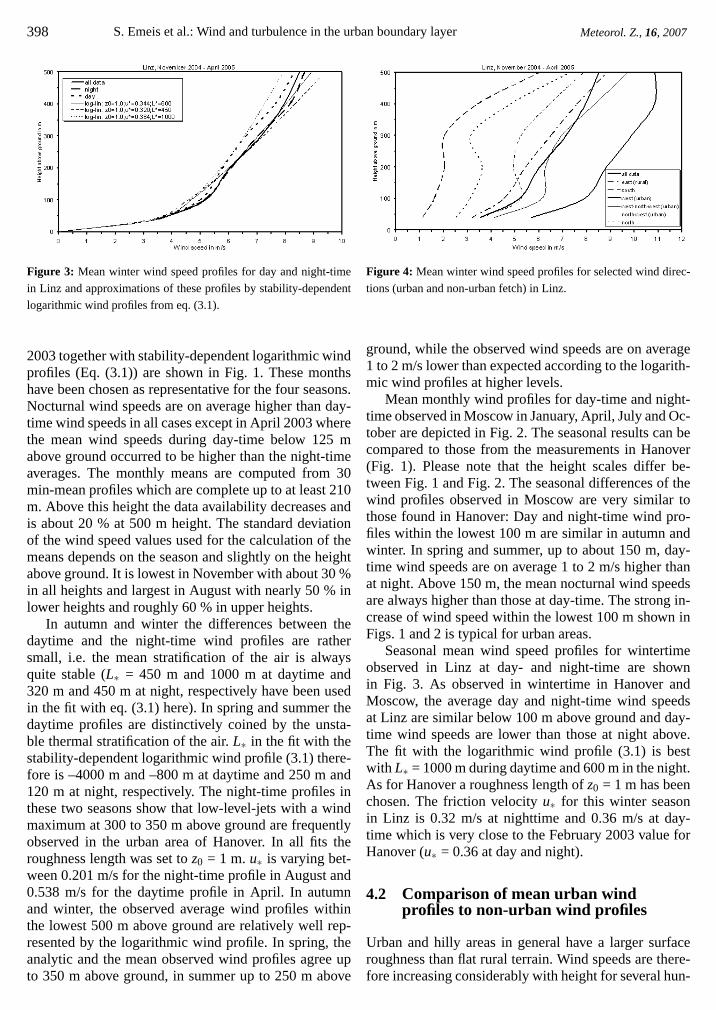
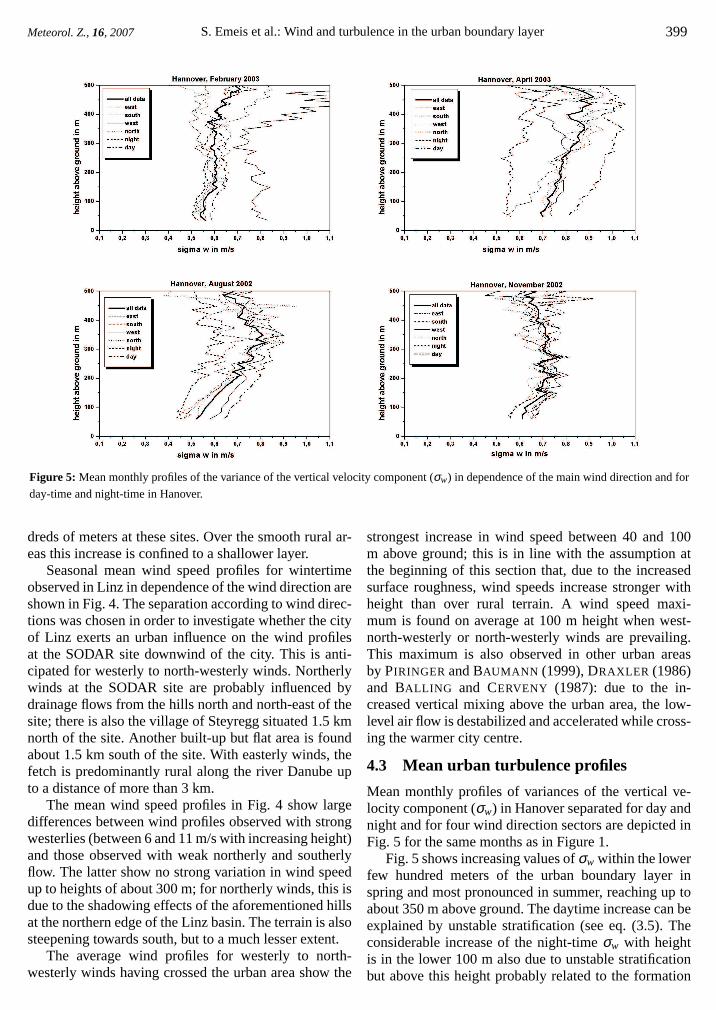
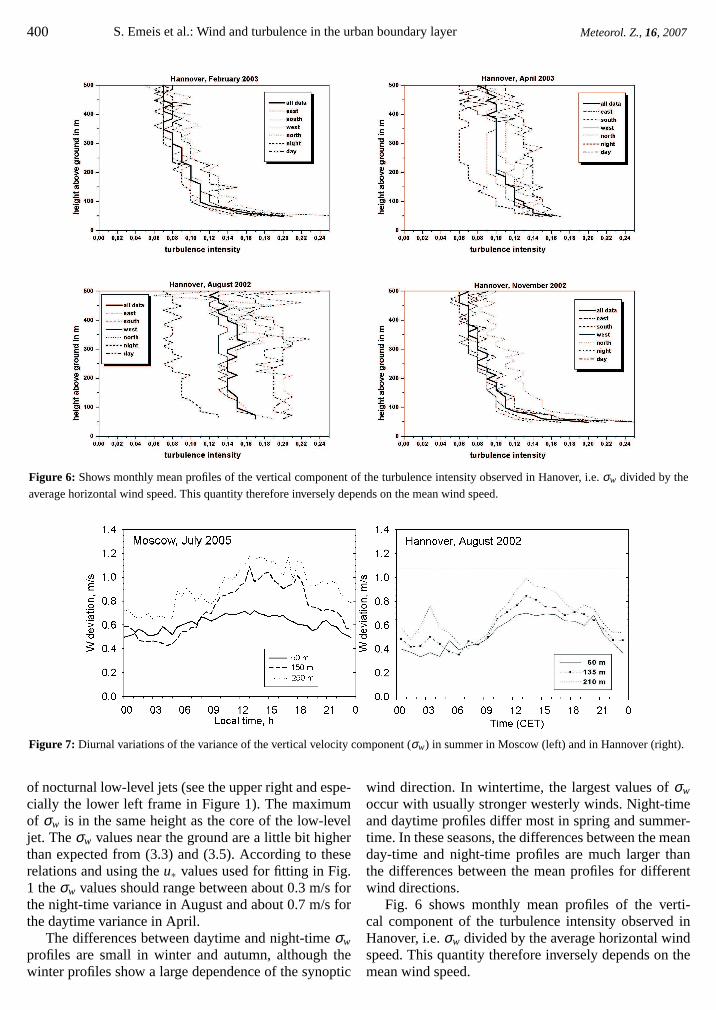
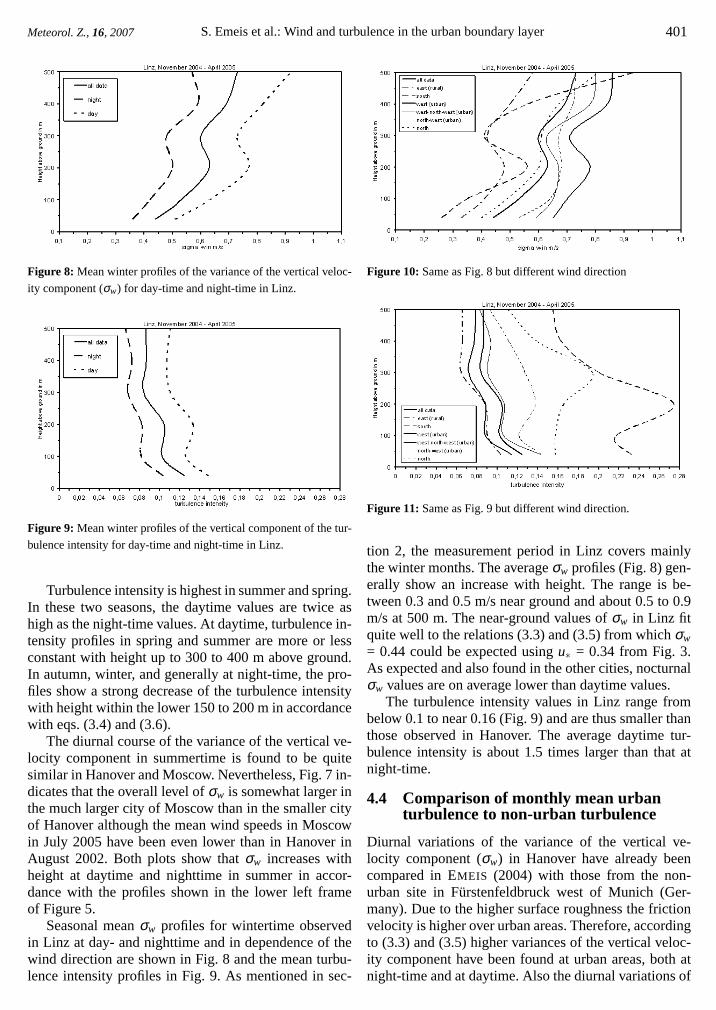
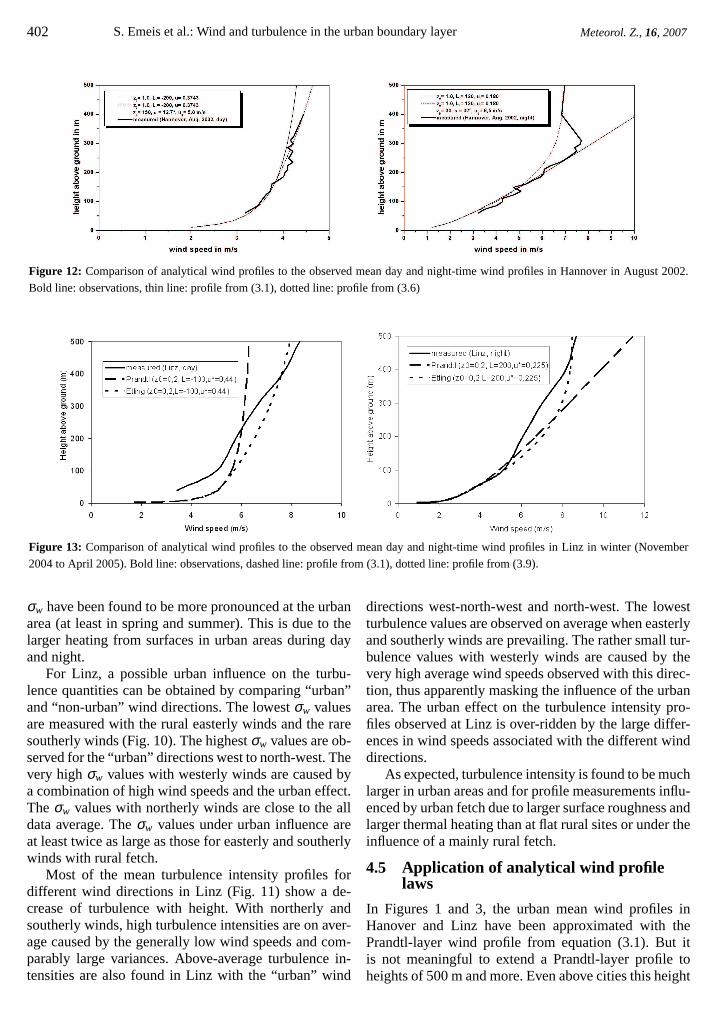
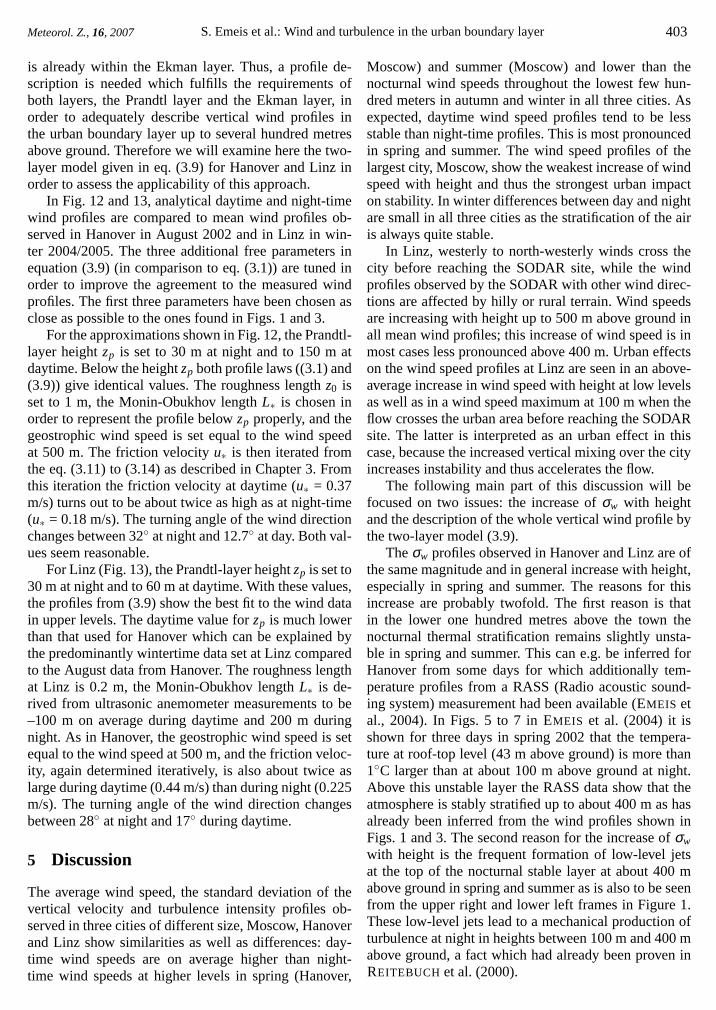
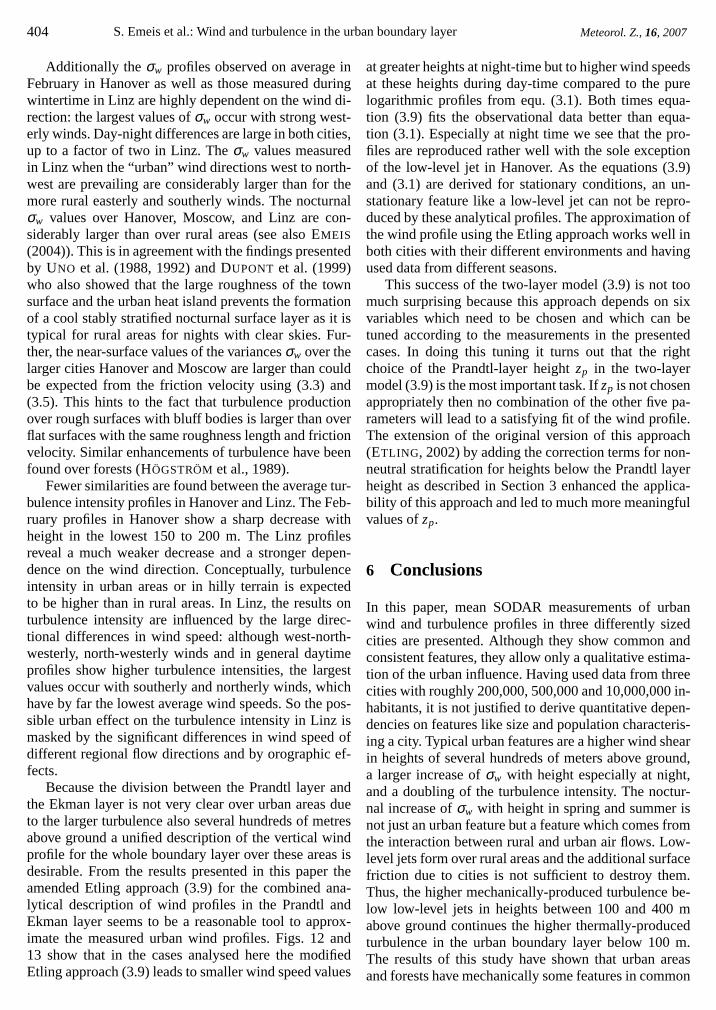