William M. Hartmann - Principles of Musical Acoustics
352
Undergraduate Lecture Notes in Physics William M. Hartmann Principles of Musical Acoustics
-
Upload
khangminh22 -
Category
Documents
-
view
0 -
download
0
Transcript of William M. Hartmann - Principles of Musical Acoustics

Undergraduate Lecture Notes in Physics
William M. Hartmann
Principles of Musical Acoustics

Undergraduate Lecture Notes in Physics
For further volumes:http://www.springer.com/series/8917

Undergraduate Lecture Notes in Physics (ULNP) publishes authoritative texts covering topicsthroughout pure and applied physics. Each title in the series is suitable as a basis forundergraduate instruction, typically containing practice problems, worked examples, chaptersummaries, and suggestions for further reading.
ULNP titles must provide at least one of the following:
• An exceptionally clear and concise treatment of a standard undergraduate subject.• A solid undergraduate-level introduction to a graduate, advanced, or non-standard subject.• A novel perspective or an unusual approach to teaching a subject.
ULNP especially encourages new, original, and idiosyncratic approaches to physics teachingat the undergraduate level.
The purpose of ULNP is to provide intriguing, absorbing books that will continue to be thereader’s preferred reference throughout their academic career.
Series Editors
Neil AshbyProfessor, Professor Emeritus, University of Colorado Boulder, CO, USA
Professor, William BrantleyFurman University, Greenville, SC, USA
Michael FowlerProfessor, University of Virginia, Charlottesville, VA, USA
Michael InglisProfessor, SUNY Suffolk County Community College, Selden, NY, USA
Elena SassiProfessor, University of Naples Federico II, Naples, Italy
Helmy SherifProfessor, University of Alberta, Edmonton, AB, Canada

William M. Hartmann
Principles of MusicalAcoustics
123

William M. HartmannMichigan State UniversityEast Lansing, MI, USA
ISSN 2192-4791 ISSN 2192-4805 (electronic)ISBN 978-1-4614-6785-4 ISBN 978-1-4614-6786-1 (eBook)DOI 10.1007/978-1-4614-6786-1Springer New York Heidelberg Dordrecht London
Library of Congress Control Number: 2013938260
© Springer Science+Business Media New York 2013This work is subject to copyright. All rights are reserved by the Publisher, whether the whole or part ofthe material is concerned, specifically the rights of translation, reprinting, reuse of illustrations, recitation,broadcasting, reproduction on microfilms or in any other physical way, and transmission or informationstorage and retrieval, electronic adaptation, computer software, or by similar or dissimilar methodologynow known or hereafter developed. Exempted from this legal reservation are brief excerpts in connectionwith reviews or scholarly analysis or material supplied specifically for the purpose of being enteredand executed on a computer system, for exclusive use by the purchaser of the work. Duplication ofthis publication or parts thereof is permitted only under the provisions of the Copyright Law of thePublisher’s location, in its current version, and permission for use must always be obtained from Springer.Permissions for use may be obtained through RightsLink at the Copyright Clearance Center. Violationsare liable to prosecution under the respective Copyright Law.The use of general descriptive names, registered names, trademarks, service marks, etc. in this publicationdoes not imply, even in the absence of a specific statement, that such names are exempt from the relevantprotective laws and regulations and therefore free for general use.While the advice and information in this book are believed to be true and accurate at the date ofpublication, neither the authors nor the editors nor the publisher can accept any legal responsibility forany errors or omissions that may be made. The publisher makes no warranty, express or implied, withrespect to the material contained herein.
Printed on acid-free paper
Springer is part of Springer Science+Business Media (www.springer.com)

To Mitra and Daniel


Preface
Musical acoustics is a scientific discipline that attempts to put the entire range ofhuman musical activity under the microscope of science. Because science seeksunderstanding, the goal of musical acoustics is nothing less than to understandhow music “works,” physically and psychologically. Accordingly, musical acousticsis multidisciplinary. At a minimum it requires input from physics, physiology,psychology, and several engineering technologies involved in the creation andreproduction of musical sound.
As a scientific discipline, musical acoustics poses several questions. The firstquestion has to be, “Why would anyone want to study it?” Unlike some otherscientific pursuits, it is unlikely to improve the health of the population, nor is itlikely to be the engine that drives the economy to new heights. The answer to thequestion lies within the appeal of music itself. Music is fundamentally important tohuman beings—it has been a part of every culture throughout history. Nothing hasgreater capability to inspire human emotions. Thus musical acoustics is an attemptto take a rational approach to a human activity that is essentially emotional. In theend, music is compelling. It compels us to listen to it, to create it, and ultimately totry to understand it.
Musical acoustics is an ancient science—the rational approach to music was partof the ancient Greek quadrivium. Musical acoustics also claims an ancient technol-ogy. For instance, the greatest violins in history were made in the eighteenth century.Is there any other scientific discipline where the peak of a relevant technologyoccurred more than 200 years ago? At the same time, musical acoustics is modern.New electronic methods of producing, processing, and recording music appear withevery new year. The discipline forms an important part of our rapidly developingworldwide communications technology, and the study of music processing by thehuman brain is an important aspect of contemporary neuroscience.
The teaching and learning of musical acoustics likewise presents some chal-lenges. As an ancient science, with millions of participants as performers andinstrument makers, and a technology that is as much art as it is science, thesubject abounds in details. Every musical idea and every musical instrument haveseen dozens of variations—some enduring, others fleeting curiosities. These details
vii

viii Preface
are often fascinating, and they are part of the charm of the subject. Musiciansare justifiably proud of their rich musical culture. On the other hand, studentsapproaching the subject for the first time can easily be overwhelmed by all thedetails. As its name implies, this little book, Principles of Musical Acoustics, focuseson the basic principles in the science and technology of music. Musical examplesand specific musical instruments demonstrate the principles.
This book begins with a study of vibrations and waves—in that order. Thesetopics constitute the basic physical properties of sound, one of two pillars supportingthe science of musical acoustics. The second pillar is the human element, thephysiological and psychological aspects of acoustical science. The perceptual topicsinclude loudness, pitch, tone color, and localization of sound.
With these two pillars in place, it is possible to go in a variety of directions andin no particular order. The book treats in turn the topics of room acoustics, audio—both analog and digital—broadcasting, and speech. It ends with chapters on thetraditional musical instruments, organized by family.
The mathematical level of this book assumes that the reader is familiar withelementary algebra. Trigonometric functions, logarithms, and powers also appearin the book, but computational techniques are included as these concepts areintroduced, and there is further technical help in appendices.
There are exercises at the end of each chapter. Most of the exercises follow in astraightforward way from material presented in the chapter. Other exercises are a bitof a stretch. Both kinds are useful. Rather complete answers to most of the exercisesappear in the back of the book, but anyone who wants to use this book for seriousstudy ought to try to do the exercises before looking up the answers in the back.The goal, of course, is active involvement with the material in the text. Working anexercise, even if unsuccessfully, is of more value than reading a text passively.
The elements in this book have been developed over the course of several decadesin teaching musical acoustics in the Department of Physics and Astronomy atMichigan State University. I am grateful to the thousands of students who haveexperienced the course and given me inspiration, advice, data, cheers, complaints,and other forms of feedback. Especially, I am particularly grateful to ProfessorJon Pumplin, Dr. Diana Ma, and Mr. John McIntyre for helpful suggestions. TimMcCaskey, Nick Nuar, Ben Frey, Louis McLane, and Yun Jin Cho helped meassemble notes into this volume. I could not have written this book without theirhelp. Finally, I am grateful to my wife, Christine Hartmann, for her support over theyears.
East Lansing, MI, USA William M. Hartmann
�

Contents
1 Sound, Music, and Science . . . . . . . . . . . . . . . . . . . . . . . . . . . . . . . . . . . . . . . . . . . . . . . . 11.1 The Source . . . . . . . . . . . . . . . . . . . . . . . . . . . . . . . . . . . . . . . . . . . . . . . . . . . . . . . . . . 21.2 Transmission . . . . . . . . . . . . . . . . . . . . . . . . . . . . . . . . . . . . . . . . . . . . . . . . . . . . . . . . 31.3 Receiver . . . . . . . . . . . . . . . . . . . . . . . . . . . . . . . . . . . . . . . . . . . . . . . . . . . . . . . . . . . . . 3
2 Vibrations 1 . . . . . . . . . . . . . . . . . . . . . . . . . . . . . . . . . . . . . . . . . . . . . . . . . . . . . . . . . . . . . . . . . 92.1 Mass and Spring . . . . . . . . . . . . . . . . . . . . . . . . . . . . . . . . . . . . . . . . . . . . . . . . . . . . 9
2.1.1 Definitions . . . . . . . . . . . . . . . . . . . . . . . . . . . . . . . . . . . . . . . . . . . . . . . . . 92.1.2 How It Works . . . . . . . . . . . . . . . . . . . . . . . . . . . . . . . . . . . . . . . . . . . . . . 10
2.2 Mathematical Representation . . . . . . . . . . . . . . . . . . . . . . . . . . . . . . . . . . . . . . 112.3 Audible Frequencies . . . . . . . . . . . . . . . . . . . . . . . . . . . . . . . . . . . . . . . . . . . . . . . . 14
3 Vibrations 2 . . . . . . . . . . . . . . . . . . . . . . . . . . . . . . . . . . . . . . . . . . . . . . . . . . . . . . . . . . . . . . . . . 173.1 Damping .. . . . . . . . . . . . . . . . . . . . . . . . . . . . . . . . . . . . . . . . . . . . . . . . . . . . . . . . . . . . 173.2 Natural Modes of Vibration . . . . . . . . . . . . . . . . . . . . . . . . . . . . . . . . . . . . . . . . 183.3 Multimode Systems . . . . . . . . . . . . . . . . . . . . . . . . . . . . . . . . . . . . . . . . . . . . . . . . . 193.4 The Tuning Fork . . . . . . . . . . . . . . . . . . . . . . . . . . . . . . . . . . . . . . . . . . . . . . . . . . . . 193.5 The Spectrum . . . . . . . . . . . . . . . . . . . . . . . . . . . . . . . . . . . . . . . . . . . . . . . . . . . . . . . 223.6 Resonance . . . . . . . . . . . . . . . . . . . . . . . . . . . . . . . . . . . . . . . . . . . . . . . . . . . . . . . . . . . 23
3.6.1 A Wet Example . . . . . . . . . . . . . . . . . . . . . . . . . . . . . . . . . . . . . . . . . . . . 233.6.2 Breaking Glassware . . . . . . . . . . . . . . . . . . . . . . . . . . . . . . . . . . . . . . . 233.6.3 Sympathetic Strings . . . . . . . . . . . . . . . . . . . . . . . . . . . . . . . . . . . . . . . 24
4 Instrumentation . . . . . . . . . . . . . . . . . . . . . . . . . . . . . . . . . . . . . . . . . . . . . . . . . . . . . . . . . . . . . 294.1 Transducers.. . . . . . . . . . . . . . . . . . . . . . . . . . . . . . . . . . . . . . . . . . . . . . . . . . . . . . . . . 294.2 The Oscilloscope .. . . . . . . . . . . . . . . . . . . . . . . . . . . . . . . . . . . . . . . . . . . . . . . . . . . 31
4.2.1 Analog ’Scope and CRT Display . . . . . . . . . . . . . . . . . . . . . . . . . 314.2.2 Digital ’Scopes and Liquid Crystal Displays . . . . . . . . . . . . 324.2.3 Beyond the Basic Oscilloscope . . . . . . . . . . . . . . . . . . . . . . . . . . . 33
4.3 The Spectrum Analyzer. . . . . . . . . . . . . . . . . . . . . . . . . . . . . . . . . . . . . . . . . . . . . 334.4 The Frequency Counter . . . . . . . . . . . . . . . . . . . . . . . . . . . . . . . . . . . . . . . . . . . . . 344.5 The Function Generator . . . . . . . . . . . . . . . . . . . . . . . . . . . . . . . . . . . . . . . . . . . . 354.6 Virtual Instrumentation . . . . . . . . . . . . . . . . . . . . . . . . . . . . . . . . . . . . . . . . . . . . . 36
ix

x Contents
5 Sound Waves . . . . . . . . . . . . . . . . . . . . . . . . . . . . . . . . . . . . . . . . . . . . . . . . . . . . . . . . . . . . . . . . 395.1 Polarization.. . . . . . . . . . . . . . . . . . . . . . . . . . . . . . . . . . . . . . . . . . . . . . . . . . . . . . . . . 415.2 The Speed of Sound . . . . . . . . . . . . . . . . . . . . . . . . . . . . . . . . . . . . . . . . . . . . . . . . 42
5.2.1 Supersonic Things. . . . . . . . . . . . . . . . . . . . . . . . . . . . . . . . . . . . . . . . . 435.2.2 Sound vs Light . . . . . . . . . . . . . . . . . . . . . . . . . . . . . . . . . . . . . . . . . . . . 44
5.3 Sound Waves in Space and Time . . . . . . . . . . . . . . . . . . . . . . . . . . . . . . . . . . . 455.4 Sound Waves in More Than One Dimension of Space. . . . . . . . . . . . 47
6 Wave Properties. . . . . . . . . . . . . . . . . . . . . . . . . . . . . . . . . . . . . . . . . . . . . . . . . . . . . . . . . . . . . 536.1 Wave Addition . . . . . . . . . . . . . . . . . . . . . . . . . . . . . . . . . . . . . . . . . . . . . . . . . . . . . . 536.2 Interference.. . . . . . . . . . . . . . . . . . . . . . . . . . . . . . . . . . . . . . . . . . . . . . . . . . . . . . . . . 546.3 Beats . . . . . . . . . . . . . . . . . . . . . . . . . . . . . . . . . . . . . . . . . . . . . . . . . . . . . . . . . . . . . . . . . 566.4 Audio Analogies . . . . . . . . . . . . . . . . . . . . . . . . . . . . . . . . . . . . . . . . . . . . . . . . . . . . 586.5 Generalization .. . . . . . . . . . . . . . . . . . . . . . . . . . . . . . . . . . . . . . . . . . . . . . . . . . . . . . 596.6 Reflection. . . . . . . . . . . . . . . . . . . . . . . . . . . . . . . . . . . . . . . . . . . . . . . . . . . . . . . . . . . . 616.7 Refraction . . . . . . . . . . . . . . . . . . . . . . . . . . . . . . . . . . . . . . . . . . . . . . . . . . . . . . . . . . . 626.8 Diffraction .. . . . . . . . . . . . . . . . . . . . . . . . . . . . . . . . . . . . . . . . . . . . . . . . . . . . . . . . . . 626.9 Segregation .. . . . . . . . . . . . . . . . . . . . . . . . . . . . . . . . . . . . . . . . . . . . . . . . . . . . . . . . . 63
7 Standing Waves . . . . . . . . . . . . . . . . . . . . . . . . . . . . . . . . . . . . . . . . . . . . . . . . . . . . . . . . . . . . . 677.1 Standing Waves in General . . . . . . . . . . . . . . . . . . . . . . . . . . . . . . . . . . . . . . . . . 677.2 Standing Waves on a String . . . . . . . . . . . . . . . . . . . . . . . . . . . . . . . . . . . . . . . . 697.3 The Guitar Player’s Equation.. . . . . . . . . . . . . . . . . . . . . . . . . . . . . . . . . . . . . . 717.4 The Stretched String: Some Observations . . . . . . . . . . . . . . . . . . . . . . . . . 72
8 Standing Waves in Pipes . . . . . . . . . . . . . . . . . . . . . . . . . . . . . . . . . . . . . . . . . . . . . . . . . . . 778.1 Pipe with Both Ends Open . . . . . . . . . . . . . . . . . . . . . . . . . . . . . . . . . . . . . . . . . 778.2 Pipe with One End Open and One End Closed . . . . . . . . . . . . . . . . . . . . 788.3 Playing a Pipe . . . . . . . . . . . . . . . . . . . . . . . . . . . . . . . . . . . . . . . . . . . . . . . . . . . . . . . 798.4 Thinking Critically . . . . . . . . . . . . . . . . . . . . . . . . . . . . . . . . . . . . . . . . . . . . . . . . . . 808.5 Open-End Corrections . . . . . . . . . . . . . . . . . . . . . . . . . . . . . . . . . . . . . . . . . . . . . . 80
9 Fourier Analysis and Synthesis . . . . . . . . . . . . . . . . . . . . . . . . . . . . . . . . . . . . . . . . . . . 859.1 The Sine Wave . . . . . . . . . . . . . . . . . . . . . . . . . . . . . . . . . . . . . . . . . . . . . . . . . . . . . . 869.2 Complex Waves . . . . . . . . . . . . . . . . . . . . . . . . . . . . . . . . . . . . . . . . . . . . . . . . . . . . . 879.3 Periodicity . . . . . . . . . . . . . . . . . . . . . . . . . . . . . . . . . . . . . . . . . . . . . . . . . . . . . . . . . . . 879.4 The Sawtooth.. . . . . . . . . . . . . . . . . . . . . . . . . . . . . . . . . . . . . . . . . . . . . . . . . . . . . . . 899.5 The Sounds .. . . . . . . . . . . . . . . . . . . . . . . . . . . . . . . . . . . . . . . . . . . . . . . . . . . . . . . . . 909.6 Harmonic and Inharmonic Spectra, Periodic
and Aperiodic Tones . . . . . . . . . . . . . . . . . . . . . . . . . . . . . . . . . . . . . . . . . . . . . . . . 929.8 Continuous Spectra . . . . . . . . . . . . . . . . . . . . . . . . . . . . . . . . . . . . . . . . . . . . . . . . . 95
10 Sound Intensity . . . . . . . . . . . . . . . . . . . . . . . . . . . . . . . . . . . . . . . . . . . . . . . . . . . . . . . . . . . . . 9910.1 Pressure, Power, and Intensity. . . . . . . . . . . . . . . . . . . . . . . . . . . . . . . . . . . . . . 9910.2 The Inverse Square Law . . . . . . . . . . . . . . . . . . . . . . . . . . . . . . . . . . . . . . . . . . . . 10010.3 Decibels . . . . . . . . . . . . . . . . . . . . . . . . . . . . . . . . . . . . . . . . . . . . . . . . . . . . . . . . . . . . . 10210.4 Absolute vs Relative dB . . . . . . . . . . . . . . . . . . . . . . . . . . . . . . . . . . . . . . . . . . . . 104

Contents xi
11 The Auditory System . . . . . . . . . . . . . . . . . . . . . . . . . . . . . . . . . . . . . . . . . . . . . . . . . . . . . . . 10911.1 Auditory Anatomy . . . . . . . . . . . . . . . . . . . . . . . . . . . . . . . . . . . . . . . . . . . . . . . . . . 109
11.1.1 The Outer Ear . . . . . . . . . . . . . . . . . . . . . . . . . . . . . . . . . . . . . . . . . . . . . 10911.1.2 The Middle Ear . . . . . . . . . . . . . . . . . . . . . . . . . . . . . . . . . . . . . . . . . . . . 11011.1.3 The Inner Ear . . . . . . . . . . . . . . . . . . . . . . . . . . . . . . . . . . . . . . . . . . . . . . 11111.1.4 The Semicircular Canals . . . . . . . . . . . . . . . . . . . . . . . . . . . . . . . . . . 113
11.2 Auditory Function . . . . . . . . . . . . . . . . . . . . . . . . . . . . . . . . . . . . . . . . . . . . . . . . . . 11411.2.1 Outer Ear Function .. . . . . . . . . . . . . . . . . . . . . . . . . . . . . . . . . . . . . . . 11411.2.2 Middle Ear Function . . . . . . . . . . . . . . . . . . . . . . . . . . . . . . . . . . . . . . 11411.2.3 Inner Ear Function . . . . . . . . . . . . . . . . . . . . . . . . . . . . . . . . . . . . . . . . 11511.2.4 Beyond the Cochlea . . . . . . . . . . . . . . . . . . . . . . . . . . . . . . . . . . . . . . . 11811.2.5 Hearing Impairments . . . . . . . . . . . . . . . . . . . . . . . . . . . . . . . . . . . . . . 118
12 Loudness Perception . . . . . . . . . . . . . . . . . . . . . . . . . . . . . . . . . . . . . . . . . . . . . . . . . . . . . . . 12512.1 Loudness Level . . . . . . . . . . . . . . . . . . . . . . . . . . . . . . . . . . . . . . . . . . . . . . . . . . . . . 12512.2 Loudness . . . . . . . . . . . . . . . . . . . . . . . . . . . . . . . . . . . . . . . . . . . . . . . . . . . . . . . . . . . . 12712.3 Psychophysics .. . . . . . . . . . . . . . . . . . . . . . . . . . . . . . . . . . . . . . . . . . . . . . . . . . . . . . 12912.4 Neural Firing Rate . . . . . . . . . . . . . . . . . . . . . . . . . . . . . . . . . . . . . . . . . . . . . . . . . . 13112.5 Excitation Patterns . . . . . . . . . . . . . . . . . . . . . . . . . . . . . . . . . . . . . . . . . . . . . . . . . . 13112.6 Complex Sounds . . . . . . . . . . . . . . . . . . . . . . . . . . . . . . . . . . . . . . . . . . . . . . . . . . . . 13212.7 Critical Band . . . . . . . . . . . . . . . . . . . . . . . . . . . . . . . . . . . . . . . . . . . . . . . . . . . . . . . . 134
13 Pitch . . . . . . . . . . . . . . . . . . . . . . . . . . . . . . . . . . . . . . . . . . . . . . . . . . . . . . . . . . . . . . . . . . . . . . . . . . 13713.1 Pitch of Sine Tones: Place Theory . . . . . . . . . . . . . . . . . . . . . . . . . . . . . . . . . 13713.2 Pitch: Timing Theory . . . . . . . . . . . . . . . . . . . . . . . . . . . . . . . . . . . . . . . . . . . . . . . 13813.3 Pitch of a Complex Tone . . . . . . . . . . . . . . . . . . . . . . . . . . . . . . . . . . . . . . . . . . . 13813.4 The Template Theory . . . . . . . . . . . . . . . . . . . . . . . . . . . . . . . . . . . . . . . . . . . . . . . 14013.5 Pitch as an Interpretative Percept . . . . . . . . . . . . . . . . . . . . . . . . . . . . . . . . . . 14213.6 Absolute Pitch. . . . . . . . . . . . . . . . . . . . . . . . . . . . . . . . . . . . . . . . . . . . . . . . . . . . . . . 143
14 Localization of Sound . . . . . . . . . . . . . . . . . . . . . . . . . . . . . . . . . . . . . . . . . . . . . . . . . . . . . . 14514.1 Horizontal Plane . . . . . . . . . . . . . . . . . . . . . . . . . . . . . . . . . . . . . . . . . . . . . . . . . . . . 145
14.1.1 Interaural Level Differences . . . . . . . . . . . . . . . . . . . . . . . . . . . . . . 14614.1.2 Interaural Time Differences.. . . . . . . . . . . . . . . . . . . . . . . . . . . . . . 147
14.2 Localization in the Vertical Median Plane . . . . . . . . . . . . . . . . . . . . . . . . . 15014.3 The Precedence Effect . . . . . . . . . . . . . . . . . . . . . . . . . . . . . . . . . . . . . . . . . . . . . . 15114.4 Perceived Auditory Space . . . . . . . . . . . . . . . . . . . . . . . . . . . . . . . . . . . . . . . . . . 152
15 Sound Environments . . . . . . . . . . . . . . . . . . . . . . . . . . . . . . . . . . . . . . . . . . . . . . . . . . . . . . . 15715.1 Reflections from a Surface . . . . . . . . . . . . . . . . . . . . . . . . . . . . . . . . . . . . . . . . . 15715.2 Transmission Loss . . . . . . . . . . . . . . . . . . . . . . . . . . . . . . . . . . . . . . . . . . . . . . . . . . 15815.3 Room Acoustics. . . . . . . . . . . . . . . . . . . . . . . . . . . . . . . . . . . . . . . . . . . . . . . . . . . . . 159
15.3.1 Early Reflections in a Room .. . . . . . . . . . . . . . . . . . . . . . . . . . . . . 16015.3.2 Focused Sound . . . . . . . . . . . . . . . . . . . . . . . . . . . . . . . . . . . . . . . . . . . . 16115.3.3 Reverberation .. . . . . . . . . . . . . . . . . . . . . . . . . . . . . . . . . . . . . . . . . . . . . 161
15.4 Gaining Control of Acoustical Spaces . . . . . . . . . . . . . . . . . . . . . . . . . . . . . 164

xii Contents
16 Audio Transducers . . . . . . . . . . . . . . . . . . . . . . . . . . . . . . . . . . . . . . . . . . . . . . . . . . . . . . . . . 16916.1 Basic Definitions . . . . . . . . . . . . . . . . . . . . . . . . . . . . . . . . . . . . . . . . . . . . . . . . . . . . 16916.2 The Current and Magnetism Principle . . . . . . . . . . . . . . . . . . . . . . . . . . . . . 171
16.2.1 Application of the Current–Magnetism Principle . . . . . . . 17216.3 The Analog Concept . . . . . . . . . . . . . . . . . . . . . . . . . . . . . . . . . . . . . . . . . . . . . . . . 17316.4 The Generator Principle . . . . . . . . . . . . . . . . . . . . . . . . . . . . . . . . . . . . . . . . . . . . 17316.5 The Motor Principle . . . . . . . . . . . . . . . . . . . . . . . . . . . . . . . . . . . . . . . . . . . . . . . . 17416.6 Electrostatic Devices. . . . . . . . . . . . . . . . . . . . . . . . . . . . . . . . . . . . . . . . . . . . . . . . 17516.7 Electro-Optical Transducers . . . . . . . . . . . . . . . . . . . . . . . . . . . . . . . . . . . . . . . . 176
17 Distortion and Noise . . . . . . . . . . . . . . . . . . . . . . . . . . . . . . . . . . . . . . . . . . . . . . . . . . . . . . . . 17917.1 Noise. . . . . . . . . . . . . . . . . . . . . . . . . . . . . . . . . . . . . . . . . . . . . . . . . . . . . . . . . . . . . . . . . 17917.2 Distortion .. . . . . . . . . . . . . . . . . . . . . . . . . . . . . . . . . . . . . . . . . . . . . . . . . . . . . . . . . . . 180
17.2.1 Distortion Not . . . . . . . . . . . . . . . . . . . . . . . . . . . . . . . . . . . . . . . . . . . . . 18017.2.2 Linear Distortion . . . . . . . . . . . . . . . . . . . . . . . . . . . . . . . . . . . . . . . . . . 18017.2.3 Nonlinear Distortion . . . . . . . . . . . . . . . . . . . . . . . . . . . . . . . . . . . . . . 182
17.3 Dynamic Range . . . . . . . . . . . . . . . . . . . . . . . . . . . . . . . . . . . . . . . . . . . . . . . . . . . . . 185
18 Audio Systems . . . . . . . . . . . . . . . . . . . . . . . . . . . . . . . . . . . . . . . . . . . . . . . . . . . . . . . . . . . . . . . 18918.1 Sound Recording .. . . . . . . . . . . . . . . . . . . . . . . . . . . . . . . . . . . . . . . . . . . . . . . . . . . 18918.2 Public Address System . . . . . . . . . . . . . . . . . . . . . . . . . . . . . . . . . . . . . . . . . . . . . 19018.3 Preamplifier . . . . . . . . . . . . . . . . . . . . . . . . . . . . . . . . . . . . . . . . . . . . . . . . . . . . . . . . . 19018.4 Power Amplifier . . . . . . . . . . . . . . . . . . . . . . . . . . . . . . . . . . . . . . . . . . . . . . . . . . . . 19318.5 Mixer . . . . . . . . . . . . . . . . . . . . . . . . . . . . . . . . . . . . . . . . . . . . . . . . . . . . . . . . . . . . . . . . 19318.6 Tone Controls and Equalizers . . . . . . . . . . . . . . . . . . . . . . . . . . . . . . . . . . . . . . 19418.7 Dynamic Range Compressor . . . . . . . . . . . . . . . . . . . . . . . . . . . . . . . . . . . . . . . 19518.8 Integrated Amplifiers . . . . . . . . . . . . . . . . . . . . . . . . . . . . . . . . . . . . . . . . . . . . . . . 19618.9 Receiver . . . . . . . . . . . . . . . . . . . . . . . . . . . . . . . . . . . . . . . . . . . . . . . . . . . . . . . . . . . . . 19618.10 More Integration . . . . . . . . . . . . . . . . . . . . . . . . . . . . . . . . . . . . . . . . . . . . . . . . . . . . 19718.11 Multichannel Audio. . . . . . . . . . . . . . . . . . . . . . . . . . . . . . . . . . . . . . . . . . . . . . . . . 198
19 Loudspeakers . . . . . . . . . . . . . . . . . . . . . . . . . . . . . . . . . . . . . . . . . . . . . . . . . . . . . . . . . . . . . . . 20119.1 Loudspeakers: What We Want . . . . . . . . . . . . . . . . . . . . . . . . . . . . . . . . . . . . . 20119.2 The Two-Way Speaker . . . . . . . . . . . . . . . . . . . . . . . . . . . . . . . . . . . . . . . . . . . . . . 20319.3 Enclosures . . . . . . . . . . . . . . . . . . . . . . . . . . . . . . . . . . . . . . . . . . . . . . . . . . . . . . . . . . . 20419.4 More About Loudspeaker Diffusion . . . . . . . . . . . . . . . . . . . . . . . . . . . . . . . 20519.5 Powered Speakers . . . . . . . . . . . . . . . . . . . . . . . . . . . . . . . . . . . . . . . . . . . . . . . . . . . 20719.6 Subwoofers .. . . . . . . . . . . . . . . . . . . . . . . . . . . . . . . . . . . . . . . . . . . . . . . . . . . . . . . . . 207
20 Digital Audio . . . . . . . . . . . . . . . . . . . . . . . . . . . . . . . . . . . . . . . . . . . . . . . . . . . . . . . . . . . . . . . . 21120.1 Digital vs Analog . . . . . . . . . . . . . . . . . . . . . . . . . . . . . . . . . . . . . . . . . . . . . . . . . . . 21120.2 Digital Noise . . . . . . . . . . . . . . . . . . . . . . . . . . . . . . . . . . . . . . . . . . . . . . . . . . . . . . . . 21320.3 Sampling . . . . . . . . . . . . . . . . . . . . . . . . . . . . . . . . . . . . . . . . . . . . . . . . . . . . . . . . . . . . 21520.4 Contemporary Digital Audio . . . . . . . . . . . . . . . . . . . . . . . . . . . . . . . . . . . . . . . 215
21 Broadcasting . . . . . . . . . . . . . . . . . . . . . . . . . . . . . . . . . . . . . . . . . . . . . . . . . . . . . . . . . . . . . . . . 21921.1 Continuous Wave . . . . . . . . . . . . . . . . . . . . . . . . . . . . . . . . . . . . . . . . . . . . . . . . . . . 22021.2 Amplitude Modulation . . . . . . . . . . . . . . . . . . . . . . . . . . . . . . . . . . . . . . . . . . . . . 221

Contents xiii
21.3 Frequency Modulation .. . . . . . . . . . . . . . . . . . . . . . . . . . . . . . . . . . . . . . . . . . . . . 22221.4 Bandwidth .. . . . . . . . . . . . . . . . . . . . . . . . . . . . . . . . . . . . . . . . . . . . . . . . . . . . . . . . . . 22221.5 Carrier Frequencies . . . . . . . . . . . . . . . . . . . . . . . . . . . . . . . . . . . . . . . . . . . . . . . . . 224
22 Speech . . . . . . . . . . . . . . . . . . . . . . . . . . . . . . . . . . . . . . . . . . . . . . . . . . . . . . . . . . . . . . . . . . . . . . . . 22722.1 Vocal Anatomy .. . . . . . . . . . . . . . . . . . . . . . . . . . . . . . . . . . . . . . . . . . . . . . . . . . . . . 22722.2 Voiced Sounds . . . . . . . . . . . . . . . . . . . . . . . . . . . . . . . . . . . . . . . . . . . . . . . . . . . . . . 22922.3 Speech Sounds . . . . . . . . . . . . . . . . . . . . . . . . . . . . . . . . . . . . . . . . . . . . . . . . . . . . . . 23122.4 Spectrograms .. . . . . . . . . . . . . . . . . . . . . . . . . . . . . . . . . . . . . . . . . . . . . . . . . . . . . . . 234
23 Brass Musical Instruments . . . . . . . . . . . . . . . . . . . . . . . . . . . . . . . . . . . . . . . . . . . . . . . . 23723.1 Sustained-Tone Instruments . . . . . . . . . . . . . . . . . . . . . . . . . . . . . . . . . . . . . . . . 23723.2 Evolution of the Resonances of a Trumpet . . . . . . . . . . . . . . . . . . . . . . . . 23823.3 Tone Production: Feedback and Nonlinearities . . . . . . . . . . . . . . . . . . . 240
24 Woodwind Instruments . . . . . . . . . . . . . . . . . . . . . . . . . . . . . . . . . . . . . . . . . . . . . . . . . . . . 24724.1 Single-Reed Instruments. . . . . . . . . . . . . . . . . . . . . . . . . . . . . . . . . . . . . . . . . . . . 24724.2 Double Reeds . . . . . . . . . . . . . . . . . . . . . . . . . . . . . . . . . . . . . . . . . . . . . . . . . . . . . . . 25024.3 Reeds in General . . . . . . . . . . . . . . . . . . . . . . . . . . . . . . . . . . . . . . . . . . . . . . . . . . . . 25024.4 Edge Tone Instruments . . . . . . . . . . . . . . . . . . . . . . . . . . . . . . . . . . . . . . . . . . . . . 25124.5 Boatswain’s Pipe . . . . . . . . . . . . . . . . . . . . . . . . . . . . . . . . . . . . . . . . . . . . . . . . . . . . 25324.6 The Flute . . . . . . . . . . . . . . . . . . . . . . . . . . . . . . . . . . . . . . . . . . . . . . . . . . . . . . . . . . . . 253
25 String Instruments . . . . . . . . . . . . . . . . . . . . . . . . . . . . . . . . . . . . . . . . . . . . . . . . . . . . . . . . . 25725.1 Percussive Strings . . . . . . . . . . . . . . . . . . . . . . . . . . . . . . . . . . . . . . . . . . . . . . . . . . . 257
25.1.1 The Guitar . . . . . . . . . . . . . . . . . . . . . . . . . . . . . . . . . . . . . . . . . . . . . . . . . 25925.1.2 The Electric Guitar . . . . . . . . . . . . . . . . . . . . . . . . . . . . . . . . . . . . . . . . 26025.1.3 The Piano . . . . . . . . . . . . . . . . . . . . . . . . . . . . . . . . . . . . . . . . . . . . . . . . . . 261
25.2 Bowed Strings . . . . . . . . . . . . . . . . . . . . . . . . . . . . . . . . . . . . . . . . . . . . . . . . . . . . . . . 26225.2.1 Tone Generation in the Bowed Strings . . . . . . . . . . . . . . . . . . . 26325.2.2 The Violin Body . . . . . . . . . . . . . . . . . . . . . . . . . . . . . . . . . . . . . . . . . . . 265
26 Percussion Instruments . . . . . . . . . . . . . . . . . . . . . . . . . . . . . . . . . . . . . . . . . . . . . . . . . . . . 26926.1 Bars, Rods, and Tubes . . . . . . . . . . . . . . . . . . . . . . . . . . . . . . . . . . . . . . . . . . . . . . 270
26.1.1 Useful Bars . . . . . . . . . . . . . . . . . . . . . . . . . . . . . . . . . . . . . . . . . . . . . . . . 27126.1.2 Useful Tubes. . . . . . . . . . . . . . . . . . . . . . . . . . . . . . . . . . . . . . . . . . . . . . . 271
26.2 Membranes .. . . . . . . . . . . . . . . . . . . . . . . . . . . . . . . . . . . . . . . . . . . . . . . . . . . . . . . . . 27226.2.1 Chladni Patterns . . . . . . . . . . . . . . . . . . . . . . . . . . . . . . . . . . . . . . . . . . . 27326.2.2 Timpani . . . . . . . . . . . . . . . . . . . . . . . . . . . . . . . . . . . . . . . . . . . . . . . . . . . . 274
26.3 Plates: Cymbals, Gongs, and Bells . . . . . . . . . . . . . . . . . . . . . . . . . . . . . . . . . 27526.3.1 Nonlinear Mode Coupling . . . . . . . . . . . . . . . . . . . . . . . . . . . . . . . . 27526.3.2 Bells. . . . . . . . . . . . . . . . . . . . . . . . . . . . . . . . . . . . . . . . . . . . . . . . . . . . . . . . 276
27 Electronic Music . . . . . . . . . . . . . . . . . . . . . . . . . . . . . . . . . . . . . . . . . . . . . . . . . . . . . . . . . . . . 27927.1 Analog Synthesizers . . . . . . . . . . . . . . . . . . . . . . . . . . . . . . . . . . . . . . . . . . . . . . . . 27927.2 Digital Synthesizers. . . . . . . . . . . . . . . . . . . . . . . . . . . . . . . . . . . . . . . . . . . . . . . . . 28327.3 Musical Instrument Device Interface . . . . . . . . . . . . . . . . . . . . . . . . . . . . . . 284

xiv Contents
Appendix A: Composers . . . . . . . . . . . . . . . . . . . . . . . . . . . . . . . . . . . . . . . . . . . . . . . . . . . . . . . . 287
Appendix B: Trigonometric Functions . . . . . . . . . . . . . . . . . . . . . . . . . . . . . . . . . . . . . . . . 289
Appendix C: Traditional Musical Instruments . . . . . . . . . . . . . . . . . . . . . . . . . . . . . . . 291
Appendix D: Keyboard Tuning . . . . . . . . . . . . . . . . . . . . . . . . . . . . . . . . . . . . . . . . . . . . . . . . . 293
Appendix E: Standard Musical Frequencies . . . . . . . . . . . . . . . . . . . . . . . . . . . . . . . . . . 297
Appendix F: Power Law Dependences . . . . . . . . . . . . . . . . . . . . . . . . . . . . . . . . . . . . . . . . . 299
Appendix G: Telephone Tones . . . . . . . . . . . . . . . . . . . . . . . . . . . . . . . . . . . . . . . . . . . . . . . . . . 303
Appendix H: Greek Alphabet . . . . . . . . . . . . . . . . . . . . . . . . . . . . . . . . . . . . . . . . . . . . . . . . . . . 305
Answers to Exercises . . . . . . . . . . . . . . . . . . . . . . . . . . . . . . . . . . . . . . . . . . . . . . . . . . . . . . . . . . . . . 307
Index . . . . . . . . . . . . . . . . . . . . . . . . . . . . . . . . . . . . . . . . . . . . . . . . . . . . . . . . . . . . . . . . . . . . . . . . . . . . . . . 345
�

Chapter 1Sound, Music, and Science
Sound is all around us. It warns us of danger, enables us to communicate with others,annoys us with its noise, entertains us by radio and iPods, and captivates us in music.It is an important part of the daily lives of hearing people.
We are concerned here with a science of sound, especially musical sound. Thereis something of a paradox in this concept. Sound itself tends to be personal andit often brings up an emotional response. On the other hand there is science,supposedly rational and objective. Merging these two aspects of human experienceis the science and art of acoustics.
Acoustics is foremost a science. As such it is quantitative, attempting to accountfor the physical world and our perception of it in ways that can be measured withexperiments and described with mathematical models. A quantitative science likeacoustics operates with a number of ground rules:
• Definitions: We need precise definitions for ideas and for quantities. We oftentake common words and give them meanings that are more tightly constrainedthan in everyday speech. For instance, in the next chapter the word “period” willbe given a precise mathematical meaning.
• Simplification: The real world is complicated. Science gains its power by simpli-fication. For instance, everyday materials are complex compounds and mixturesof dozens of chemical elements, but the chemist uses pure chemicals to gaincontrol of his experiment. In the same way, speech and music are complicatedsignals, but the acoustician uses signals that are no more complicated thannecessary for the intended purpose.
• Idealization: The technique of idealization is like simplification in that it isa scientific response to a messy world. Idealization applies to the conceptualmodels that we use to explain some aspect of the world. An idealized modelattempts to capture the essence of something, even though the model may notexplain every detail. For instance, there is the concept that planets, like the Earthand Mars, orbit the Sun because of the Sun’s strong gravitational attraction. Thatis a powerful model of our solar system. But, it is not a perfect model because the
W.M. Hartmann, Principles of Musical Acoustics, Undergraduate Lecture Notesin Physics, DOI 10.1007/978-1-4614-6786-1 1,© Springer Science+Business Media New York 2013
1

2 1 Sound, Music, and Science
planets attract one another too, and this is not included in the basic heliocentricmodel of orbital motion. Nevertheless, the model successfully abstracts the mostimportant character of planetary motion from a complicated real-world situation.This model is a useful idealization.
And so we begin with the science of acoustics . . .An acoustical event consists of three stages as shown in Fig. 1.1: First, the sound
is generated by a source. Second, the sound is transmitted through a medium. Third,the sound is intercepted and processed by a receiver. These three stages form thebasis of acoustical science. We consider them in turn and highlight items that weexpect to study in detail.
1.1 The Source
The source of a sound is always a vibration of some kind. For example, it might bethe vibration of a drumhead. A drum is a traditional musical instrument, and ourapproach makes a study of traditional musical instruments by their families: brassinstruments, woodwind instruments, string instruments, and percussion instruments.
The human voice is another source of sound, arguably the most important ofall. The basic science of the human voice is enormous fun because a few simpleprinciples serve to take us a long way toward understanding what is going onacoustically.
A more modern source of sound is the loudspeaker. It too is a vibratingsystem, but unlike the other vibrating systems, it is not caused to vibrate directlyby human action. The loudspeaker is a transducer that converts electronic signalsinto acoustical signals. This marriage of electronics and acoustics is called audio;its technological and cultural significance is so important that it is impossibleto imagine modern life without it. It is closely allied with broadcasting byradio and TV. Audio technology has made possible two other kinds of musicalinstrument. One is the electrified instrument, where the vibrations of a physicalobject are converted into electronic form. For instance, the vibrations of a guitarstring can be converted by a pickup into an electrical signal. The other is anelectronic instrument, analog or digital, where the original vibrations are generatedelectronically.
Vibrations are so basic in the study of acoustics that the first chapters arededicated to developing the terminology and basic mathematical relations for thestudy of vibration. These chapters also introduce electronic instrumentation usedto study vibrations.

1.3 Receiver 3
Fig. 1.1 A sound from a source is transmitted to two receivers, a human listener and a microphone
1.2 Transmission
The vibration of the drumhead causes the air around it to vibrate. This vibrationpropagates as a wave through the air. Accordingly, the study of waves occupies animportant place in musical acoustics. The physics of waves is actually a long anddeep subject because there is a rich variety of wave phenomena. We shall deal withsome of the most fundamental properties. Wave motion is not only a characteristicof sound waves (acoustics), but also characterizes the transmission of light and radiowaves. The wave principles that one learns in studying acoustics apply directly tooptics (light) and electromagnetic radiation in the form of radio waves. Therefore,by learning about the weird things that can happen to an acoustical wave youimmediately understand something about optical mirages and problems with yourcell phone.
The transmission of sound from a source to a receiver does not take place entirelyby a straight line path. The sound waves are reflected from the walls of a room andby other surfaces in the room. The character of the room puts its indelible stampon the sound wave as it is finally received. This is the subject of room acoustics. Itcovers a lot of ground, from the problem of noise in your residence to the design ofmulti-million-dollar concert halls.
1.3 Receiver
The most important receiver of sound is the human ear and brain—the humanauditory system. Sound waves, of the kind that we study in the musical acoustics, aremeant to be heard, understood, and appreciated. In the final analysis, the strengthsand limitations of the human auditory system determine everything else we do inacoustics. There are two basic divisions of subject matter in the study of humanhearing; the first is the anatomy and physiology of the auditory system, the secondis the psychoacoustics. The anatomy and physiology describe the tools we have towork with as listeners; the psychoacoustics describes the function of these tools,

4 1 Sound, Music, and Science
converting sound waves into perceptions. Important perceptual properties of soundinclude the loudness of tones, pitch, tone color, and location.
These three stages: source, transmission, and reception, appear in any acousticalexperiment or experience, and they can be separately identified. The chapters thatfollow try to deal with the details of each stage in turn. It all starts with a source,specifically with vibration, which we begin in earnest in Chap. 2.
Comparisons
We make comparisons everyday. It is part of living. Some things are better—otherthings are worse. In a science like acoustics comparisons are usually quantitative.This section describes the most important quantitative comparisons.
Differences:Quantitatively, difference means subtraction. We obtain a difference by subtract-
ing two values. Thus if A has a length of 2 m and B has a length of 2.1 m, then thedifference between B and A is a length of 2:1 � 2 D 0:1m.
You will notice that a difference has units—such as meters. It has the units of thequantities that are subtracted. It follows that we can only take differences betweenquantities that have the same kind of units. For instance, it is not possible to find thedifference between 2 m and 3 kg.
It is possible, however, to find the difference between 2 m and 210 cm. Althoughmeters and centimeters are different units, they are the same kind of units. They areboth lengths. Still, one cannot take the difference directly. The difference calculation210�2would give a nonsensical answer. To take differences of quantities expressedin different units of the same kind requires a conversion of units so that the quantitiesbeing subtracted have identical units. In this instance we might chose to convert210 cm to 2.1 m and take the difference 2:1�2:0�0:1m, as before. Alternatively, wemight choose to convert 2 m to 200 cm and take the difference 210� 200 D 10 cm.Either way is correct.
RatiosQuantitatively, ratio means division. Two quantities are compared by dividing
one by the other. Thus if A has a length of 2 m and B has a length of 2.1 m, then theratio of B to A is 2:1=2:0 D 1:05. Another word that is often used in connectionwith the ratio concept is the word “factor.” We say that B is greater than A by afactor of 1.05. The implication of this statement is that we can find out how big B isby starting with A and multiplying by a factor of 1.05. If “ratio” means divide, then“factor” means multiply.
You will notice that a ratio does not have any units. That makes it very differentfrom a difference. So whereas 2:1�2:0 D 0:1 and 210�200 D 10, the ratio 2.1/2.0equals 1.05 and the ratio 210/200 also equals 1.05. We can go further: A length of2.1 m is 82.677 in. and a length of 2.0 m is 78.74 in. The ratio 82.677/78.74 is alsoequal to 1.05. Coming out in a unitless way like this gives the ratio comparison

1.3 Receiver 5
a certain conceptual advantage over the difference comparison. But in order forthe ratio comparison truly to have no units, the quantity in the numerator and thequantity in the denominator must have the same units. Thus it would be wrong tofind the ratio of (210 cm)/(2 m) D 105. The number 105 is not a correct ratio.
Of course, there are division operations that are not ratio comparisons. Forexample 100 km driven in 2 h corresponds to an average speed of 50 km/h. Dividing100 km by 2 h leads to a speed which has physical units and therefore is not a ratiocomparison.
PercentagesPercentages are just like ratios. If A is 2.0 and B is 2.1, then the ratio of A to B is
2.0/2.1, which is about 0.952. We say that A is 95.2 % of B. Alternatively we couldcalculate the ratio 2:1=2:0 D 1:05 and say that B is 105 % of A. Either way, we geta percentage comparison by multiplying a ratio by 100.
Percentage ChangeThe percentage change is a more common comparison than the percentage
comparison. The percentage change combines the concepts of difference and ratio.It is the difference between two quantities divided by one of those two originalquantities. In terms of a fraction, the difference is in the numerator and one of thetwo quantities is in the denominator. The quantity in the denominator is the referencequantity. The concept of change is that we start with something and end up withsomething else. The reference quantity is what we start with.
In terms of quantities A and B , the percentage change from A to B has A in thedenominator.
Percent change D .B �A/=A (1.1)
We can apply this equation to a change in height.
Example 1: At age 16 Shaquille O’Neal was A = 201 cm tall. By age 21 hehad grown to be B = 216 cm tall. The percentage change is a growth of .216 �201/=201 D 0:075 or 7.5 %. The reference quantity is the height in the startingyear, namely 201 cm.
Example 2: Alternatively we might start with a sandwich that is A = 2.1 m long andnibble on it until it is B = 2.0 m long. The percentage is a decrease, namely a negativechange, .2:0 � 2:1/=2:1 D �0:0476, a decrease of 4.76 %. The reference quantityis the starting sandwich length of 2.1 m.
There is a simple relationship between the ratio and the percentage changeindicated by the end of Eq. (1.2)
Percent change D .B � A/=A D B=A� 1: (1.2)
Equation (1.2) shows that the percentage change is always the difference betweena ratio (like B=A) and the number 1. That little bit of algebra will prove helpful in

6 1 Sound, Music, and Science
some of the exercises later in this book. Like a ratio, the percentage change has nounits.
Example 3: At the start of the year 2009, the Dow Jones Industrial Average of stockprices was 8776. At the end of the year, it was 10428. The change for 2009 was
10428:=8776:� 1: D 0:188 (1.3)
or 18.8 %.
Powers of ten
Powers of ten are illustrated with their prefixes by introducing the fictitious unitof the Snurk.
One gigaSnurk D 109 Snurks D 1,000,000,000 Snurks (one billion)�One megaSnurkD 106 Snurks D 1,000,000 Snurks (one million)One kiloSnurk D 103 Snurks D 1,000 Snurks (one thousand)One milliSnurk D 10�3 Snurks D 1/1000 Snurks (one thousandth)One microSnurk D 10�6 Snurks D 1/1,000,000 Snurks (one millionth)One nanoSnurk D 10�9 Snurks D 1/1,000,000,000 Snurks (one billionth)
Scientific notation
21,000 Snurks D 2:1 � 104 Snurks0.00345 Snurks D 3:45 � 10�3 Snurks
*As of 1975, 1,000,000,000 is both the American and the British billion.
Exercises
Exercise 1, ClassificationIn the categories of Source, Transmission, and Receiver, how would you classify
a reflecting wall? A musical instrument? A microphone?
Exercise 2, Sound goes everywhereSound not only propagates in air, but also propagates in water and even in solids.
What good is that?
Exercise 3, Bad conditionsUnder what conditions have you had difficulty hearing something that you
wanted to hear?

Exercises 7
Exercise 4, Idealized modelsSam says, “Models of the world are essential for human thought. Without models
every experience would be a brand new event. Models provide a context in whichexperiences fit, or don’t fit.”
Pam says, “Models of the world can be dangerous. They lead to assumptionsabout events and people that may not be true. Models can prevent you from seeingthings as they truly are.”
Defend Sam or Pam, or both.
Exercise 5, More wavesThe text mentions sound waves, light waves, and radio waves. What other kinds
of waves do you know?
Exercise 6, More ShaqAt age 16 Shaquille O’Neal weighed 120 kg. At age 21 his weight was 137 kg.
Calculate the difference, the ratio, and the percentage of change over those 5 years.
Exercise 7, Investment experienceOn Monday your investment loses 10 % of its value. However, on Tuesday your
investment gains 10 %. Do those two changes perfectly cancel each other? (a) Showthat these two changes actually cause you to lose 1 %. (b) Would the net result bedifferent if you gained 10 % on Monday and lost 10 % on Tuesday?
Exercise 8, Powers of tenRecall that 103 � 105 D 108. Now evaluate the following:(a) 103 � 102 D? (b) 103=102 D? (c) 103 � 10�2 D? (d) 103=10�2 D? (e)
103 C 102 D?
Exercise 9, Scientific notationExpress the following in scientific notation: (a) $20 billion. (b) Ten cents. (c)
231,000. (d) 0.00034.
Exercise 10, micro, milli, kilo, mega(a) How many seconds in a megasecond? (b) How many microseconds in a
second? (c) How many milliseconds in a kilosecond?
�

Chapter 2Vibrations 1
Sound begins with vibrations. For example, the sound of a guitar begins with thevibration of the strings, and the sound of a trumpet begins with the vibrations ofthe player’s lips. Perhaps less obvious, the sound of the human voice begins with thevibration of vocal folds (vocal cords), and sounds that are reproduced electronicallyare ultimately converted into acoustical waves by the vibration of a loudspeakercone. Because sound starts with vibrations, it’s natural that the study of acousticsbegins with the study of vibrations.
Fundamentally, a vibration is a motion that is back and forth. Vibrations can besimple, like the swinging of a pendulum, or they can be complicated, like the rattleof your car’s glove box when you drive on a bumpy road. Here we follow a paththat is traditional in science; we consider first the simplest possible system and tryto describe it as completely as possible. This vibration is called simple harmonicmotion.
2.1 Mass and Spring
2.1.1 Definitions
The most fundamental mechanical vibrator is a single mass hanging from a spring.If there is no motion (no vibration) the force of gravity pulling the mass downis just balanced by the force of the spring pulling up. The mass is at rest. It issaid to be at equilibrium. If the mass moves away from its equilibrium positionit has a displacement. If the mass moves up above the equilibrium position, thedisplacement is positive, if it moves down, the displacement is negative. When themass is at equilibrium the displacement is zero (Fig. 2.1).
If the spring and mass system is allowed to vibrate freely, the mass will undergosimple harmonic motion. As the mass vibrates up and down, its displacement is
W.M. Hartmann, Principles of Musical Acoustics, Undergraduate Lecture Notesin Physics, DOI 10.1007/978-1-4614-6786-1 2,© Springer Science+Business Media New York 2013
9

10 2 Vibrations 1
Fig. 2.1 The spring andmass system. In equilibriumthe displacement is zero.When the mass moves abovethe equilibrium point thedisplacement is positive.When the mass moves belowthe equilibrium point thedisplacement is negative
Fig. 2.2 The sine wave has extreme values ˙A, called the amplitude. It has a characteristicwaveform shape as shown here. The sine wave is periodic, so that any two equivalent points on thewaveform are separated in time by the time interval T known as the “period.” Theoretically, thesine wave extends indefinitely to infinite positive and infinite negative time, having no beginningor end
alternately positive and negative. The displacement (x) can be plotted as a functionof time (t) on a graph like Fig. 2.2.
The maximum displacement is called the amplitude. The most negative dis-placement is the same number with a minus sign in front of it. Simple harmonicmotion is an example of periodic motion. That means that the motion is repeatedindefinitely. There is a basic pattern, called a cycle, that recurs. The duration of thecycle is called the period. It is a time and it is measured in seconds, or milliseconds(1 one-thousandth of a second).
2.1.2 How It Works
To start the vibrations of a mass and spring system, you displace the mass fromits equilibrium position and let it go. Let us suppose that you gave the mass a
2.2 Mathematical Representation 11
negative (downwards) displacement, stretching the spring. Because the spring isstretched, there is a force on the mass trying to bring the mass back to its equilibriumposition. Therefore, the mass moves toward equilibrium. Soon the mass arrives atthe equilibrium position, and at that point there is no more force. You might thinkthat the mass would just stop at equilibrium, but this is not what happens. The massdoesn’t stop because in the process of coming back to equilibrium, the mass hasacquired some speed and, precisely because it is massive, it has acquired somemomentum. Because of the momentum, the mass overshoots the equilibrium point,and now it has a positive displacement. The positive displacement causes the springto be compressed, which ultimately forces the mass to move back down again towardequilibrium. As the mass passes the equilibrium point for a second time, it now hasmomentum in the opposite direction. That momentum keeps the mass going downuntil it has reached the negative amplitude that it had at the very start of this story.The mass and spring system has now executed one complete cycle. The amount oftime needed to complete the cycle is one period.
The workings of a simple harmonic vibrating system like the mass and springillustrate some very general principles. First, it seems clear that if we have a verystiff spring, then any displacement from equilibrium will lead to a large force andthat will accelerate the mass back toward equilibrium faster than a weak spring.Therefore, we expect that making the spring stiffer ought to make the motion fasterand decrease the period. Second, it also seems clear that if the mass is very massive,then it will respond only sluggishly to the force from the spring. (Did you knowthat the English-system unit for mass is the slug? How appropriate!) Therefore, weexpect that making the mass heavier ought to make the motion slower and increasethe period. As we will see in Chap. 3, that is exactly what happens.
2.2 Mathematical Representation
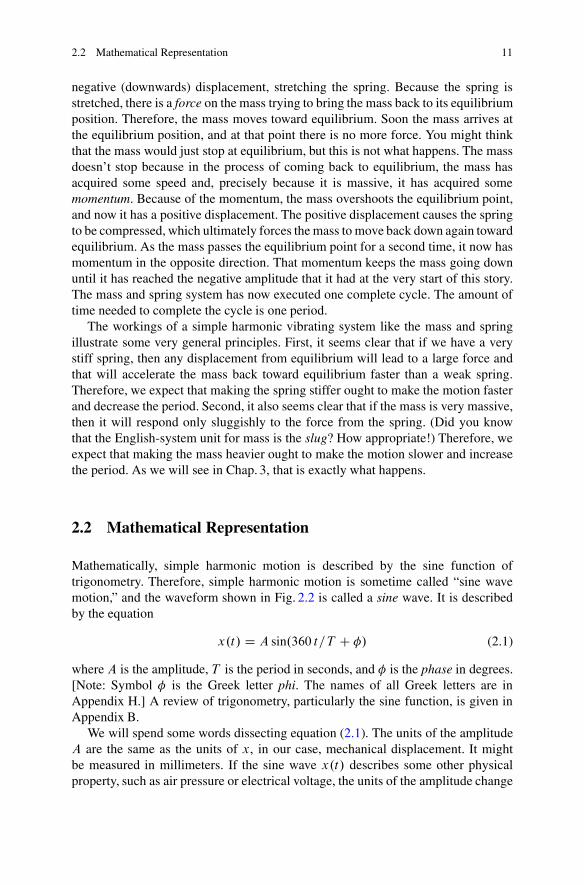
Mathematically, simple harmonic motion is described by the sine function oftrigonometry. Therefore, simple harmonic motion is sometime called “sine wavemotion,” and the waveform shown in Fig. 2.2 is called a sine wave. It is describedby the equation
x.t/ D A sin.360 t=T C �/ (2.1)
where A is the amplitude, T is the period in seconds, and � is the phase in degrees.[Note: Symbol � is the Greek letter phi. The names of all Greek letters are inAppendix H.] A review of trigonometry, particularly the sine function, is given inAppendix B.
We will spend some words dissecting equation (2.1). The units of the amplitudeA are the same as the units of x, in our case, mechanical displacement. It mightbe measured in millimeters. If the sine wave x.t/ describes some other physicalproperty, such as air pressure or electrical voltage, the units of the amplitude change

12 2 Vibrations 1
accordingly. By convention,A is always a positive real number. AmplitudeA can bezero, but in that case there is no wave at all, and there is nothing more to talk about.The amplitude multiplies the sine function—sin—which has a maximum value of1 and a minimum value of �1. It follows that the sine wave x.t/ has a maximumvalue of A and a minimum value of �A.
The sine function is a function of an angle, i.e., whenever you see an expressionlike sin.: : :/, the quantity: : :, which is the argument of the sine function, has to bean angle. Therefore, “360t=T C�” is an angle. The special phase � in the equationis the value of the angle when t D 0. In some cases we are interested in the functiononly for positive values of time t , it being presumed that the wave starts at timet D 0. Then phase � is called the “starting phase.”
The sine function is periodic; it repeats itself when the angle (or argument)changes by 360ı. Equation (2.1) shows that if the running time variable t starts atsome value and then increases by T seconds, the function comes back to its startingpoint. That is why we call T the period.
The reciprocal of the period leads us to the definition of the frequency (f ) of thesine wave,
f D 1=T; (2.2)
and its units are cycles per second, or Hertz, (abbreviated Hz). Therefore, one canwrite the sine wave in another form,
x.t/ D A sin.360 f t C �/: (2.3)
Example: As an example, we consider the sine-wave vibration of an object whoseposition in millimeters is given by
x.t/ D 4 sin.360 � 60 t C 90/: (2.4)
From Eq. (2.1), the amplitude of the vibration is 4 mm, which means that themaximum positive and negative excursions are ˙4mm. The frequency is 60 Hz,and the starting phase is 90ı. See Fig. 2.3.
The argument of the sine function, here given by 360f t C �, is an angle calledthe instantaneous phase. We will give it the symbol‚. It is assumed that angle‚ isalways expressed in units of degrees. In a complete circle there are 360ı.
The role of the sine function as a periodic function of a time-dependentinstantaneous phase is emphasized by separating the aspects of periodicity and timedependence. One simply writes the sine wave in the form
x.t/ D A sin.‚/ (2.5)

2.2 Mathematical Representation 13
b
a
Fig. 2.3 Panel (a) shows the instantaneous phase angle‚, increasing from an initial value � D 90
as time goes on. Over the duration shown, this angle advances through three multiples of 360ı.Panel (b) shows what happens when one takes the sine of angle ‚ and multiplies by the amplitudeA. Here the amplitude A was chosen to be 4 mm
Fig. 2.4 The wave shown by the solid line is said to lead the wave shown by the dashed linebecause every waveform feature—peak, positive-going zero crossing, etc.—occurs at an earliertime for the solid line. Alternatively the dashed line wave can be said to lag the solid line wave.Both waves have the same frequency and amplitude, but their starting phases are different
where ‚ is the instantaneous phase angle, measured in degrees, as shown inAppendix B. Here, angle‚ is a function of time
‚ D ‚.t/ D 360f t C � (2.6)
As t increases, the angle‚ increases linearly, and the sine function goes throughits periodic oscillations, as shown in Fig. 2.3. Figure 2.3 shows the special casewhere the phase is � D 90ı.
Phase Lead–Phase Lag When two sine waves have the same frequency butdifferent starting phases, one of them is said to lead or to lag the other. Figure 2.4is an example. The lagging wave is given by x.t/ D A sin.360f t/ and the leadingwave is given by x.t/ D A sin.360f t C 90/. According to Eqs. (2.5) and (2.6) thestarting phase angle for the leading wave is � D 90ı. This angle is positive and less

14 2 Vibrations 1
than 180ı, which corresponds to a condition for leading. It should be evident that if� had been equal to 180ı, then neither wave would lead or lag the other.
2.3 Audible Frequencies
The spring and mass system that we used to introduce simple harmonic motion letsyou see the vibration but the frequency is too low to hear. Such vibration is said tobe “infrasonic.” Vibrations of a few Hertz can sometimes be felt, and they can dodamage too (an earthquake would be an example), but they cannot be heard. Theaudible range of frequencies is normally said to be from 20 to 20,000 Hz, or 20 Hzto 20 kHz. That statement of the range is easy to remember, but the practical rangetends to be smaller. Without a special acoustical system it is not possible to hear20 Hz. A frequency of 30 Hz is a more practical lower limit. Many college studentscannot hear 20,000 Hz either. A more realistic upper limit of hearing is 17,000 Hz.We are quite accustomed to doing without the lowest and highest frequencies.Many loudspeakers that claim to be high quality cannot reproduce sounds below100 Hz. FM radio stations are not even allowed to transmit frequencies higher than15,000 Hz, and telephone communication in the USA is normally limited to the bandbetween 300 and 3,300 Hz.
Octave Measure
To change a frequency by an octave means to multiply it or divide it by thenumber 2. Starting with a frequency of 440 Hz, going up one octave gets you to880 Hz and going up another octave gets you to 1,760 Hz. The sequence is continuedin Fig. 2.5. Again starting at 440 Hz, going down an octave leads to 220 Hz andgoing down another octave leads to 110 Hz. The measure of an octave is a basicelement in the music of all cultures.
Fig. 2.5 The horizontal axis is a linear frequency scale. The circles show 440 Hz and octavesabove 440, namely 880, 1,760, 3,520, and 7,040 Hz. With increasing octave number the frequenciesbecome more widely spaced on the linear scale

Exercises 15
Exercises
Exercise 1, Human limitsNominally, the limits of human hearing are 20 and 20,000 Hz. Find the periods
of those two waves.
Exercise 2, A low frequencyThe second hand of a clock takes 60 s for one cycle. What is the frequency in
Hertz?
Exercise 3, Time conversionsA millisecond is 1 one-thousandth of a second, and a microsecond is 1 one-
millionth of a second. (a) How many milliseconds is 2 s? (b) How many millisecondsis 30�s?
Exercise 4, Frequency conversionsA kilohertz (kHz) is 1,000 Hz. (a) How many kilohertz is 16,384 Hz? (b) How
many hertz is 10 kHz?
Exercise 5, Period and frequency(a) If the period is 1 ms, what is the frequency in kHz? (b and c) If the frequency
is 10,000 Hz, what is the period in milliseconds and in microseconds?
Exercise 6, Conditions for phase lagThe mathematical conditions for phase leading are described in the text. From
this, can you infer the conditions for lagging?
Exercise 7, Optical analogyIf an “infrasonic” sound has a frequency that is too low to hear, what is “infrared”
light?
Exercise 8, Telephone bandwidthThe telephone bandwidth is from 300 to 3,300 Hz. How many octaves is that
bandwidth?
Exercise 9, Sine wavesThe sine wave in Fig. 2.2 has a starting phase of zero. It is reproduced in Fig. 2.6.
(a) On the same set of axes, draw a sine wave with the same frequency and sameamplitude but with a starting phase of 180ı. (b) Draw a sine wave with the sameamplitude but twice the frequency. (c) Draw a sine wave with the same frequencybut half the amplitude. (d) The sine wave is said to be a “single valued function,”meaning that for every point in time there is one and only one value of the wave.Sketch a function that is not single valued for comparison.

16 2 Vibrations 1
a
b
c
Fig. 2.6 Three practice waves for Exercise 9
�

Chapter 3Vibrations 2
Chapter 2 introduced the concept of simple harmonic motion. This concept allowedus to define the terms used to discuss vibrating systems—terms like amplitudeand frequency. Chapter 3 extends this discussion to additional properties of realvibrating systems. It ends with the topics of spectrum and resonance, essentialconcepts in any form of physics, especially acoustics.
3.1 Damping
Ideal simple harmonic motion goes on forever. It is a kind of perpetual motionmachine with an amplitude that never changes. It just keeps on going and goingand going. Real, passive mechanical systems, like a mass suspended from a spring,are not like this. The vibrations (or oscillations) of a real, free mechanical systemare damped by frictional forces, including air resistance. The amplitude of suchsystems is not constant but decreases gradually with time. Figure 3.1 shows motionthat would be simple harmonic (sine wave) motion except that it is damped.
Because of damping in real systems, our theoretical picture of simple harmonicmotion is an idealization. Idealizations are common in science. They help us dealwith certain truths about the world without the encumbrances of a lot of messy real-world details. The ideal simple harmonic motion is a useful idealization becausemany systems vibrate for many cycles before decaying appreciably. Also, it is oftenpossible to compensate for the damping (or decay) of vibrations by adding energy tothe system from outside. Then the system is active, not passive or freely vibrating.
W.M. Hartmann, Principles of Musical Acoustics, Undergraduate Lecture Notesin Physics, DOI 10.1007/978-1-4614-6786-1 3,© Springer Science+Business Media New York 2013
17

18 3 Vibrations 2
Fig. 3.1 Rapidly damped simple harmonic motion—like clinking glasses
3.2 Natural Modes of Vibration
The concept of “modes of vibration” is important in mechanics and acoustics. Youalready know something about it. The spring and mass system, with the massconfined to move in one dimension, is a system that has one mode of vibration.A mode is described by its properties:
1. Frequency: Most important, a mode has a specific frequency. The spring andmass system has a frequency given by the following formula:
f D 1
2�
rs
m(3.1)
Here s is the stiffness of the spring, measured in units of Newtons per meter. ANewton is the unit of force in the metric system of units. It is equivalent to about 1/4pound in the English system of units. Quantitym is the mass measured in kilograms.The prefactor 1
2�can be calculated from the fact that � is approximately equal to
3.14159. Thus, the prefactor is the number 0.159. Insight into Eq. (3.1) appears inAppendix F.
2. Shape: A mode of vibration has a shape. In the case of a mass hanging from aspring, the mode shape is simply the up and down motion of the spring. Thatis pretty obvious. In the future we will encounter musical systems with modalshapes that are not so obvious.
3. Amplitude: If we put a lot of energy into a mode of vibration, its amplitude willbe large. But the amplitude is not a “property” of a mode. It only says how muchaction there is in the mode.
A mode is rather like your bank account. You have an account, and it exists. Ithas your name on it, and it has a number, just like the frequency of a mode. You canput a lot of money into your bank account or you can take money out of it. Whetherthe “amplitude” of money in your account is large or small, it is still your account.That is its property.

3.4 The Tuning Fork 19
Fig. 3.2 A spring and masssystem with two modes ofvibration. Motion of themasses in (1) low- and (2)high-frequency modes areshown by arrows
3.3 Multimode Systems
The one-dimensional spring and mass system has one mode of vibration. Mostphysical systems, including musical systems, have more than one mode. Usingsprings and masses we can construct a one-dimensional system with two modesof vibration. Figure 3.2 shows such a system. By saying that the system is one-dimensional, we mean that the masses are required to move along a straightline path.
A system of two masses and two springs has two modes of vibration, whichmeans that there are two separate and distinct natural frequencies for this system,one for each mode. The shapes of the two modes are quite different. In the modewith the lower frequency (1), the mode shape has the two masses moving together inlock step. That means that the spring in the middle is not stretched or compressed.In the mode with the higher frequency (2), the two masses move contrary to oneanother. When the first mass moves to the left, the second mass moves to the rightand vice versa. Those mode shapes are shown by the arrows in Fig. 3.2.
Possibly you are now doing a bit of inductive reasoning and thinking that if aspring and mass system with one mass has one mode, and a system with two masseshas two modes, then a system with three masses would have three modes. If thisis what you are thinking, you would be right. And so on it goes with four and fivemasses, etc.
Systems of springs and masses are discrete systems. Most familiar vibratingobjects, like drumheads, guitar strings, and window panes, are continuous systems.Such systems have many modes of vibration but sometimes only a few of themare important. It is often possible to identify the effective springs and the effectivemasses of such continuous system. The tuning fork provides an example.
3.4 The Tuning Fork
The tuning fork is a vibrating system with several modes of vibration, but one ismuch more important than the others.
1. Main mode: The main mode of a tuning fork has a frequency that is stampedon the fork so that the fork becomes a reference for that frequency. It makes

20 3 Vibrations 2
a bFig. 3.3 (a) The main modeof a tuning fork. (b) The firstclang mode
a good reference because it is extremely stable. We actually know how Mozarthad his piano tuned because we have his tuning fork. We are rather sure that thefrequency of the main mode of this tuning fork has not changed since Mozart’stime (1756–1791). A few hundred years should not make any difference to atuning fork.
2. Other modes: There are other modes of the tuning fork. Their frequencies arehigher than the main mode. When a tuning fork is struck, these frequencies canalso be heard. One of them, the “first clang mode,” is particularly evident.
3. Mode addition: When a physical system vibrates in several modes at once, theresulting vibration is just the sum of the individual modes. Physicists sometimescall this addition property “superposition.” The result of the adding is that themain mode and the clang modes of the tuning fork coexist, and a listener hearsall the modes.
Example:Suppose we have a tuning fork with a main mode having a frequency of
256 Hz and with a first clang mode having a frequency of 1,997 Hz. Supposefurther that we observe the fork when the amplitude of the main mode is 1 mmand the amplitude of the first clang mode is one-third of that or 0.33 mm.Algebraically, the vibration is given by the sum of two sine waves with thecorrect frequencies and amplitudes. It is
x.t/ D 1:0 sin.360 � 256 t/C 0:33 sin.360 � 1997 t/ .3:2/
Figure 3.4 shows how this addition works. Part (a) shows vibration in themain mode with a frequency of 256 Hz and an amplitude of 1 mm. Part (b)shows vibration in the first clang mode with a frequency of 1,997 Hz and an

3.4 The Tuning Fork 21
amplitude of 0.33 mm. The sum of Parts (a) and (b) is given in Part (c). Ifwe put a microphone a few centimeters away from the tuning fork we couldcapture that sum.
a
b
c
Fig. 3.4 Waveforms (a) and (b) are added together to make (c). The waveforms arefunctions of time, t
4. Damping: The clang modes do not interfere much with the use of the tuningfork because these modes are rapidly damped. Their amplitudes become smallsoon after the fork is struck. By contrast, the main mode lasts a long time—many minutes! One minute after the fork is struck, only the main mode canbe heard. The fork effectively becomes a single mode system, just like a singlespring and mass.
5. Mode shapes: The shapes of the main mode and the first clang mode appear inFig. 3.3. They are drawn the way we always draw modes of vibration, with asolid line indicating the maximum displacement in one direction and a dashedline indicating the displacement half a period later in time, when the vibrationhas a maximum in the opposite direction.
3.4.1 Wave Addition Example
Adding two waves, as in Fig. 3.4, means that at every point in time the valuesof the two waves along the vertical axes are added together to get the sum. Anexample is given in Fig. 3.5.Helpful rules for this kind of point-by-point addition are:
1. When one of the two waves is zero, the sum must be equal to the value ofthe other wave. This rule is illustrated by filled circles in the figure.
2. When both waves are positive the sum is even more positive, and whenboth waves are negative the sum is even more negative. These rules areillustrated by the square and triangle symbols.

22 3 Vibrations 2
a
b
c
Fig. 3.5 Waves (a) and (b) are added together to get (c). Most of (c) is missing—a creativeopportunity for the reader
3. When the waves are of opposite sign, the sum tends to be small. This ruleis illustrated by the star symbols.
4. To eyeball an accurate plot one can draw a series of vertical lines (fixedpoints in time) and plot a series of dots that show the sum of the waves.Then by connecting the dots one gets the summed wave, as shown by thedashed line in part (c) of the figure.
3.5 The Spectrum
The waveform representation of a vibration (shown in Fig. 3.4c) is a function oftime. An alternative representation is the spectral representation. It describes thevibration as a function of frequency. The amplitude spectrum shows the amplitudeof each mode plotted against the frequency of the mode.
Remember that the vibration shown in Fig. 3.4c was the sum of a 256 Hz sinevibration with an amplitude of 1 mm and a 1,997 Hz sine vibration with an amplitudeof 0.33 mm. The amplitude spectrum then looks like Fig. 3.6.
Notice how the heights of the waveforms in parts (a) and (b) of Fig. 3.4 directlytranslate into the representations of amplitudes in Fig. 3.6.
Fig. 3.6 The spectrum of the tuning fork has two lines, one for each mode

3.6 Resonance 23
3.6 Resonance
The word “resonance” is often used (and misused!) in popular acoustical discus-sions. It is a word that has a technical meaning, and we shall deal with that technicaldefinition right now.
The concept of resonance requires that there be two physical systems, a drivensystem and a driving system. As you can imagine, the driving system feeds energyinto the driven system. For example, for the acoustic guitar, the driving system isa vibrating string, and the driven system is the guitar body. The body, with its topplate and sound hole, is responsible for radiating the sound. The guitar body vibratesbecause energy is fed into it from the string.
The concept of resonance requires that the driven system have some modesof vibration. Therefore, there are special frequencies where this driven systemnaturally vibrates if once started and left alone. Resonance occurs when the drivingsystem attempts to drive the driven system at one of these special frequencies. Whenthe driven system is driven at a frequency that it likes, the driven system respondsenthusiastically and the amplitude of the resulting vibration can become huge.
3.6.1 A Wet Example
Imagine a bathtub that is half full of water. You are kneeling next to the tub and yourgoal is to slop a lot of water out of the tub and onto the bathroom floor. (The rules ofthis game are that you can only put one hand into the tub.) You could splash aroundrandomly in the tub and get some water out, but if you really want to slop a lot ofwater you would use the concept of resonance.
A little experimenting would quickly show you that there is a mode of vibrationof water in the tub, sloshing from one end to the other. This mode has a particularnatural frequency. Your best slopping strategy is to use the palm of your hand todrive this mode of vibration—moving your hand back and forth (sine-wave motion)in the tub at this frequency. It would not take you long to learn what the naturalfrequency is and to move your hand at the correct frequency to match the naturalfrequency. You would see a resonant behavior develop as the amplitude of the watermotion became larger and larger. Moving your hand at any other frequency wouldbe less effective. Very soon you and the floor would be all wet.
3.6.2 Breaking Glassware
A popular motif in comedy films has a soprano singer, or other source of intensesound, breaking all the glassware in the room. Even bottles of gin miraculously

24 3 Vibrations 2
a b c
Fig. 3.7 (a) A quiet goblet, top view, has no vibration. (b) The main mode of vibration has fournodes. (c) The second mode has six nodes. The amplitudes are greatly exaggerated in the figure
burst when exposed to this intense sound. The fact is, it isn’t that easy to breakthings with sound. However, it can be done. We can break a crystal goblet.
A crystal goblet is a continuous system with many modes of vibration, but it has amain mode of vibration that is particularly important. This is the mode that is excitedif you ding the goblet with your fingernail. It is the mode that is continuously excitedif you run a wet finger around the rim. The shape of the mode looks like Fig. 3.7b.
As you can tell from dinging the goblet, this mode of vibration takes a long timeto decay away. A long decay time indicates that the resonance is “sharp,” meaningthat this mode of vibration can be excited by a sine-wave driver only if the frequencyof the driver is very close to the natural frequency of the mode. In order to breakthe goblet, we cause it to have a very large amplitude in this mode of vibration bydriving it with a loudspeaker at precisely the natural frequency of this mode. In otherwords, we use the phenomenon of resonance. We say that we are driving the gobletat its resonance frequency. The goblet is so happy to vibrate at this frequency that itresponds with a large amplitude and finally vibrates itself to death.
3.6.3 Sympathetic Strings
Several Asian musical instruments employ the principle of resonance by addingsympathetic strings to the instrument, in addition to the main strings that are actuallyplayed. The sympathetic strings are tuned to frequencies that will occur in the pieceof music to be played. The term “sympathetic” is apt because these strings might besaid to vibrate “in sympathy” with the tones played on the main strings. The bestknown of these instruments is the Indian sitar (Fig. 3.8) a fretted, plucked stringinstrument which has about 20 strings, only six or seven of which are played. Thesarod is another Indian instrument without frets, and having four or five melodystrings, two drone strings, and about ten sympathetic, resonating strings. The rubabis a similar instrument from Afghanistan with three melody strings, three drones,and about ten sympathetic strings.

Exercises 25
Fig. 3.8 The sitar. This instrument appears to have 18 strings
An alternative description of sympathetic strings would be to call them“resonators.” A resonator is always a driven system, specifically designed toenhance the vibration or sound of the driving system.
Exercises
Exercise 1, Natural vibesFind the natural frequency of a spring and mass system where the spring has a
stiffness of 100 N/m and the mass is 250 g (0.25 kg).
Exercise 2, Filing the forkThink about the main mode of the tuning fork. What part of the tuning fork acts
as the mass? What part acts as the spring? What happens to the frequency of thetuning fork if you file away metal from the ends of the tines? What happens to thefrequency if you file away metal near the junction of the two tines?
The fact that we can think about a continuous system like a tuning fork in termsof a single mass and spring shows the conceptual power of modal analysis. Butwhich part of the system plays the role of the mass and which part plays the role ofthe spring depend on the shape of the mode we are considering.

26 3 Vibrations 2
Exercise 3, LifetimeLook at the damped vibrations in Fig. 3.1. If the frequency of vibration is 200 Hz,
how long does it take for the wave to die away? This exercise requires you to findyour own definition for “die away.” How much decrease is needed in order to saythat the vibration has disappeared?
Exercise 4, A simple spectrumDraw the spectrum for a 1,000-Hz sine tone.
Exercise 5, More complex spectraDraw the spectra for the following waves:
(a) x.t/ D 1:3 sin.360 � 575 t/C 0:8 sin.360 � 1200 t/(b) x.t/ D 0:5 sin.360 � 100 t/C 2:2 sin.360 � 780 t/C 0:8 sin.360 � 1650 t/Exercise 6, Resonance—an anthropomorphism
If your friend makes a statement and you agree with the statement, it might besaid that the two of you are in resonance. Explain how this metaphor is an extensionof the concept of resonance for physical systems as explained in this chapter.
Exercise 7, Playground Resonance
(a) Explain how the idea of resonance is used to great effect when pushing a childin a swing.
(b) Is the swing example an exact example of resonance?
Exercise 8, Square root dependenceAccording to Eq. (3.1), the frequency of a spring and mass system depends on
the ratio of spring stiffness to mass. However, it does not depend on this ratio in alinear way. It is a square-root dependence.
(a) What happens to the frequency if you change the system by doubling thestiffness and doubling the mass, both at once?
(b) What happens to the frequency if you double the mass?
Exercise 9, Adding waveformsFigure 3.9 shows two waveforms, (a) and (b). They show displacement as
a function of time for two simultaneous modes of vibration. (A) Add thesewaveforms—point by point—to find the resulting vibration pattern. (B) If thefrequency of the wave in part (a) is 100 Hz, what is the frequency of the wave inpart (b)?
Exercise 10, Resonance?Which of the following are examples of resonance?
(a) You strike a Tibetan singing bowl and it vibrates in several of its modes.(b) You run a wet finger around the rim of a crystal goblet and it vibrates in its main
mode.(c) You strike a tuning fork and it ultimately vibrates only in its main mode.(d) You bow a violin string and it vibrates at its natural frequency.

Exercises 27
a
b
c
Fig. 3.9 Waveforms to be added for Exercise 9
Fig. 3.10 Modes of akalimba tine for Exercise 11.The tine is fixed in the bridgeat the left side
Exercise 11, Kalimba tineThe kalimba is a westernized version of the African mbira or “thumb piano.” It
consists of metal tines mounted on a wooden box. The performer uses his thumbsto pluck the tines and the box acts as a resonator. Figure 3.10 shows the first threemodes of vibration of a kalimba tine, as calculated by David Chapman and publishedin 2012 in the Journal of the Acoustical Society of America. Which mode do youthink has the highest frequency? Which has the lowest?
Exercise 12, Kalimba boxBy itself, the kalimba tine does not radiate sound effectively. The kalimba box
solves that problem. The box is hollow and has a sound hole like a guitar. Thekalimba box vibrates, as forced by the tines, and its large surface area and soundhole become effective radiators of the sound. The box also has resonances becauseof the modes of vibration of air inside the box. Based on your experience withhollow objects, do you think that the resonance frequencies become higher or lowerif the box is made bigger and its volume increases?
�

Chapter 4Instrumentation
Acoustics is an ancient science. In the fifth century BC, Pythagoras made thescience of musical tones into an entire philosophy. In renaissance times Galileoand Descartes developed the mathematics of musical tones, and Isaac Newton tried(but failed) to calculate the speed of sound in air. The nineteenth century saw thebeginning of truly serious study of human hearing—the anatomy, the physiology,and the psychology. Herman von Helmholtz led the way.
In the twentieth century the study of acoustics got two tremendous boosts. Thefirst boost arrived in the first half of the century with the introduction of electronicsand the invention of acoustical instrumentation. For the first time, scientists had atool for studying sound that was fast enough to keep up with the full frequency rangeof sound itself. The second boost arrived in the second half of the century with thewidespread availability of computers and digital signal processing. After these tworevolutions, nothing in the ancient science of acoustics will ever be the same again.
This chapter is about electronic instrumentation. It deals with the subject oftransducers and with four instruments: the oscilloscope, the spectrum analyzer, thefrequency counter, and the function generator.
4.1 Transducers
A transducer is a device that converts a signal from one form to another. If you wantto make an audio recording, you use a microphone. A microphone is a transducer.As indicated by Fig. 4.1, it converts a signal from the acoustical domain, where it isa pressure waveform transmitted through the air, to the electrical domain, where isit a voltage waveform transmitted through wires.
To do the reverse process, converting an electrical signal into an acousticalpressure waveform in the air, you use another transducer—a loudspeaker or a setof headphones.
W.M. Hartmann, Principles of Musical Acoustics, Undergraduate Lecture Notesin Physics, DOI 10.1007/978-1-4614-6786-1 4,© Springer Science+Business Media New York 2013
29

30 4 Instrumentation
Fig. 4.1 A microphoneconverts a signal from anacoustical pressure wave (p)to an electrical voltage (v). Aloudspeaker does the reverse
The microphone and loudspeaker are known as analog devices. They are calledso because the output of the device is analogous to the input. For instance, if amicrophone receives a sound pressure waveform of a particular shape, then theoutput from the microphone ought to be a voltage waveform that preserves thedetails of that shape at every instant in time. If the output does not exactly representthose details, then the microphone has distorted the signal.
A well-behaved transducer that does not distort the signal is linear. In a lineartransducer, a change in the input to the devices causes a proportional change in theoutput. If from one instant of time to the next the input changes by a factor of 1.27(becomes 1.27 times larger), then the output must change by a factor of 1.27. If itchanges by a factor of 1.26 instead of 1.27 there is distortion.
Linearity can be shown on a graph that describes the relationship betweenthe input and the output. The graph must be a straight line as in Fig. 4.2a. Thatis the meaning of the word “linear.” The idea of linearity also normally assumes thatthe straight line goes through the origin so that the output is zero when the input iszero. The operation of microphones, loudspeakers, and other transducers is furtherdiscussed in Chap. 16.
a b
Fig. 4.2 (a) The input/output relationship of a linear transducer is a straight line. For a micro-phone, the output in volts (v) is linearly related to the input in pressure units (p). Positive andnegative axes are shown. (b) The input pressure waveform is transduced by the microphone into ananalogous voltage waveform. Because the slope of the line in (a) is shallow, the voltage (v) in part(b) is shown smaller than the pressure (p), but the shape of the pressure waveform is preserved inthe voltage waveform

4.2 The Oscilloscope 31
4.2 The Oscilloscope
The oscilloscope (or “’scope”) is an instrument that displays waveforms as functionsof time. The horizontal axis of the display represents time and the vertical axisrepresents a voltage. The voltage may come from a microphone, so that in the endthe oscilloscope can show a sound wave and its dependence on time.
There are two types of ’scopes available, analog and digital. The analog ’scopemay use a cathode ray tube (CRT) for the display, as shown in Fig. 4.3. CRT displayswere formerly the standard displays in television sets and computer monitors. Thedigital ’scope uses either a CRT display or a liquid crystal display (LCD). LCDscreens are also found in laptop computers, ipads, graphing calculators, and cellphones.
4.2.1 Analog ’Scope and CRT Display
A “cathode ray” is actually a beam of electrons shot out from an electron gun towardthe screen in the front of the tube. The screen is coated with a fluorescent materialthat glows briefly when it is hit with a high-speed electron. The electron beam fromthe gun speeds down the neck of the tube and hits the screen directly in the center.Then if you look at the screen you will see a single small dot, right in the middle.
To make a useful picture we need to move the dot from left to right and up anddown on the screen. We need to move it so rapidly that we don’t see a movingdot—we see a picture instead. The dot is moved electronically by horizontal andvertical deflection mechanisms that deflect the electron beam from its straight-linepath. This is done using the charged properties of the electron. Deflection platesare placed in pairs—top and bottom, and left and right—within the CRT. Thesedeflection plates are given either a positive or negative charge to deflect the electronin the desired direction. The oscilloscope gives the user great control over the waythe dot is moved.
Fig. 4.3 A cathode-ray tube is the display for ’scopes without digital memory
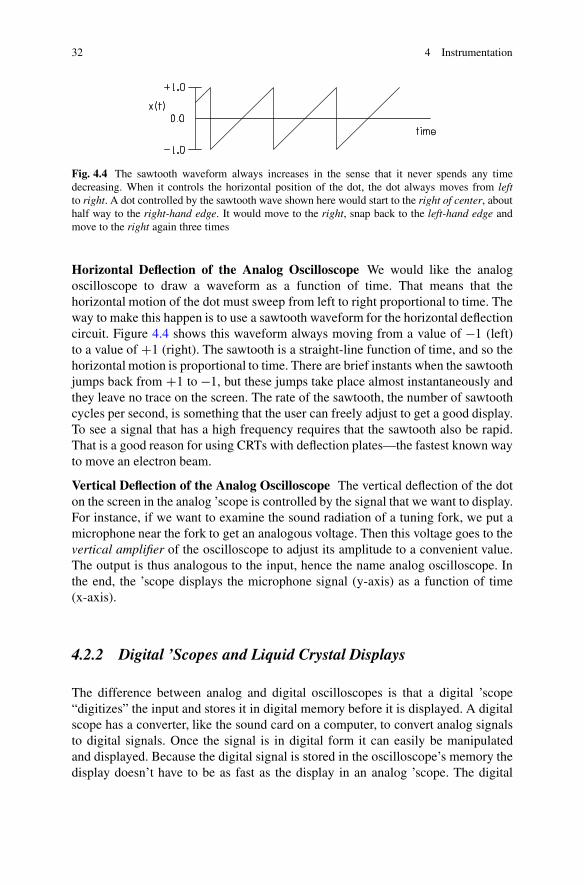
32 4 Instrumentation
Fig. 4.4 The sawtooth waveform always increases in the sense that it never spends any timedecreasing. When it controls the horizontal position of the dot, the dot always moves from leftto right. A dot controlled by the sawtooth wave shown here would start to the right of center, abouthalf way to the right-hand edge. It would move to the right, snap back to the left-hand edge andmove to the right again three times
Horizontal Deflection of the Analog Oscilloscope We would like the analogoscilloscope to draw a waveform as a function of time. That means that thehorizontal motion of the dot must sweep from left to right proportional to time. Theway to make this happen is to use a sawtooth waveform for the horizontal deflectioncircuit. Figure 4.4 shows this waveform always moving from a value of �1 (left)to a value of C1 (right). The sawtooth is a straight-line function of time, and so thehorizontal motion is proportional to time. There are brief instants when the sawtoothjumps back from C1 to �1, but these jumps take place almost instantaneously andthey leave no trace on the screen. The rate of the sawtooth, the number of sawtoothcycles per second, is something that the user can freely adjust to get a good display.To see a signal that has a high frequency requires that the sawtooth also be rapid.That is a good reason for using CRTs with deflection plates—the fastest known wayto move an electron beam.
Vertical Deflection of the Analog Oscilloscope The vertical deflection of the doton the screen in the analog ’scope is controlled by the signal that we want to display.For instance, if we want to examine the sound radiation of a tuning fork, we put amicrophone near the fork to get an analogous voltage. Then this voltage goes to thevertical amplifier of the oscilloscope to adjust its amplitude to a convenient value.The output is thus analogous to the input, hence the name analog oscilloscope. Inthe end, the ’scope displays the microphone signal (y-axis) as a function of time(x-axis).
4.2.2 Digital ’Scopes and Liquid Crystal Displays
The difference between analog and digital oscilloscopes is that a digital ’scope“digitizes” the input and stores it in digital memory before it is displayed. A digitalscope has a converter, like the sound card on a computer, to convert analog signalsto digital signals. Once the signal is in digital form it can easily be manipulatedand displayed. Because the digital signal is stored in the oscilloscope’s memory thedisplay doesn’t have to be as fast as the display in an analog ’scope. The digital

4.3 The Spectrum Analyzer 33
display doesn’t have to keep up with the signal in real time. This gives the digital‘scope display options such as liquid crystal displays.
Just as cathode-ray tubes are being replaced by liquid crystal and plasma displaysin televisions, so too CRTs are being replaced by LCDs in oscilloscopes. In contrastto the analog CRT, which draws continuous line, the LCD uses a series of discretepixels. Each pixel is created from a liquid crystal. A liquid crystal is made frommolecules that are twisted unless an electric signal is applied to them. Applying anelectric signal untwists the molecules. The LCD screen is made with polarizing glasssuch that when the crystals are twisted they let the light through, and when they areuntwisted they block the illuminating light. In this way the LCD screen creates animage by using the electric signal from the input source to determine which pixelsto transmit light and which pixels to block out light.
4.2.3 Beyond the Basic Oscilloscope
Important refinements to the basic oscilloscope include the following:
(a) Triggered sweep: A circuit that synchronizes the start of the horizontal sweepwith the waveform being displayed. With triggered sweep, subsequent traces ofa periodic waveform are identical on the screen. That’s important because, atany one time, there are many traces visible on the screen. If the traces are notsynchronized, the image is a jumble.
(b) Dual trace: The ability to display two different waveforms on the same screen atthe same time. The two waveforms are drawn simultaneously, causing them tobe perfectly aligned in time. The dual-trace feature allows the user to comparewaveforms. For instance, one can compare the input and the output of a deviceto determine the effect of the device.
(c) Digital memory: The ability to store a waveform. In a conventional analog’scope, when the signal dies away the amplitude on the display dies away aswell. How could it do anything else? But suppose that we were able to capturea waveform in memory and keep on playing it back to the vertical deflectioncircuit. Then we could capture a transient event, like a drum beat, and watch itfor as long as we want. That’s a big advantage of the digital ’scope.
4.3 The Spectrum Analyzer
The spectrum analyzer is like the oscilloscope in that it displays a picture on ascreen, but that is the end of the resemblance. The spectrum analyzer displaysamplitudes as a function of frequency. What a difference! In the oscilloscope thehorizontal axis is time; in the spectrum analyzer it is frequency. In the oscilloscope

34 4 Instrumentation
Fig. 4.5 If a tuning fork has a main mode at 256 Hz and a clang mode at 1,997 Hz, then thespectrum analyzer will display two peaks. The heights of the peaks indicate the relative amplitudesin those two modes
the vertical axis is the signal itself; in the spectrum analyzer it is the amplitude ofthe component whose frequency corresponds to the value on the horizontal axis.
Obviously the spectrum analyzer is just what we need if we want to analyze asignal into its sine wave components. For instance, if we put in a signal from a tuningfork shortly after it is struck, then the spectrum analyzer will indicate the presenceof amplitude at the main frequency and at the frequency of the clang mode. Ideallythe display would be two vertical lines like Fig. 3.6. Instead, these lines always havea certain width causing the vertical spikes to become peaks, as shown in Fig. 4.5.
The analysis performed by the spectrum analyzer is far more complicated thansimply displaying the signal on an oscilloscope. It takes a certain amount of time todo the analysis. In a swept-frequency analyzer, a trace goes from left to right on thescreen as the instrument makes its analysis, frequency by frequency. The analysisis not complete until the trace reaches the right-hand edge. The signal has to lastfor the entire duration of the analysis. If the signal changes during the course ofanalysis, the analysis will be inaccurate. Therefore, the swept-frequency analyzerwould not really be appropriate to study a decaying signal like the tone of a tuningfork. Once again, digital electronics can help. A digital spectrum analyzer can storea brief signal in memory and perform the frequency analysis later. Alternatively, thedigital spectrum analyzer can make successive analyses of a long signal, refining itsmeasurement on each pass.
The amplitude displayed on the vertical axis of the CRT display or LCD isnot exactly like the display shown in Fig. 4.5. Instead, it is normally displayed indecibels. The decibel transformation of amplitude allows the analyzer to displaycomponents of greatly different amplitude all on the same graph on the screen. Wewill study this decibel transformation in Chap. 10.
4.4 The Frequency Counter
The frequency counter does not have a screen like an oscilloscope. It just has anumerical readout with half a dozen digits. The readout indicates the frequency (inHz) of the signal that is put into the counter. An obvious problem is that a signalmay have many different frequencies—more about that later (Fig. 4.6).

4.5 The Function Generator 35
Fig. 4.6 The frequency counter counts positive-going zero crossings in a signal that comesthrough the gate
Fig. 4.7 Block diagram showing the functional components of a frequency counter
The frequency counter works by mindlessly counting the occurrence of aparticular feature in the signal voltage. It is common to count positive-going zerocrossings. You know that a sine signal has one positive-going zero crossing percycle. So does a sawtooth signal (Fig. 4.4). Therefore, by counting positive-goingzero crossings, the counter is counting the number of cycles. The number of cyclesis displayed on the numerical readout. It counts 001, 002, 003, 004, : : : As shown inFig. 4.7, the next ingredient in the counter is an electronic gate that tells the counterwhen to count. The gate is precisely 1 s long. Therefore, the counter reads out thenumber of cycles that occur in 1 s. Wow! That is exactly what we mean by frequency.Now we have a frequency counter.
When we use the frequency counter, we are making several assumptions. Weassume that the signal does not change during the 1-s gate interval required to countcycles. We also assume that there is only one positive-going zero crossing per cycle.If the signal is a sine wave then that assumption is true, but if the signal has manyfrequencies the assumption may or may not be true.
4.5 The Function Generator
The oscilloscope, spectrum analyzer, and frequency counter are all instruments ofanalysis. We put a signal into them and we get out a measurement or display thatgives us information about the signal. The function generator is the reverse. Thefunction generator creates a signal; it creates the signal in electronic form. The usermust specify the frequency and the amplitude by some means, perhaps by knobson the front panel of the instrument, perhaps by computer control. The user canalso specify the waveform, e.g., sine wave, sawtooth wave, square wave, or trianglewave. Such simple waveforms can be used to test audio and acoustical systems.They also are at the basis of electronically synthesized music, where they are called“oscillators.”

36 4 Instrumentation
Digital function generators are sometimes called “waveform synthesizers.” Awaveform synthesizer allows the user to generate complicated waveforms of anydesired shape, even transient waveforms. Engineers at Ford in Dearborn, Michigan,use huge transducers under the wheels of test vehicles to subject these vehiclesto realistic (and unrealistic) vibrations. The transducers are driven by waveformsynthesizers that simulate bumpy roads, dips, potholes, etc.—anything that willtorture a car and reveal weaknesses.
4.6 Virtual Instrumentation
Can a special-purpose instrument, such as an oscilloscope or a spectrum analyzer,be replaced by a general purpose computer? What features of the instrument wouldthe computer need to accomplish this? It would need a way to acquire a signal (aninput). It would need a way to process and represent the signal as selected by theuser. It would need a way to display the result. The computer has these features. Ithas a sound card that can input signals. It has a memory and arithmetic capabilitythat can follow a program. It has a monitor screen for display. Computer programsthat emulate the functions of special-purpose instruments are generically knownas virtual instruments. It is usual for the display to simulate the screen of the realspecial-purpose instrument. The display also depicts the knobs, pushbuttons, dials,and indicators that are typical of the real instrumentation. The user manipulatesthese controls with a mouse. Good virtual instrumentation can rival the quality andease of use found in real instrumentation. An advantage of the real instrumentationis that real instrumentation is often used to measure signals that have been generatedby a computer. The real instruments offer an independent confirmation.
Exercises
Exercise 1, The telephoneHow many acoustical transducers are in a telephone handset? What are they?
Exercise 2, Fooling the frequency counterOn the graph in Fig. 4.8 draw a periodic signal that has two positive-going zero
crossings per cycle. Explain why a frequency counter would display a frequencythat is two times larger than the fundamental frequency of the signal. (A factor oftwo in frequency is called an “octave.”)
Exercise 3, All things come to him who waits.A frequency counter displays a frequency as an integer number of cycles per
second because it counts discrete events. For instance, it might display 262 Hz.Suppose you wanted better accuracy. Suppose you wanted to know that thefrequency was really 262.3 Hz. What could you do?

Exercises 37
Fig. 4.8 Your signal to fool the counter with two positive-going zero crossings per cycle
Exercise 4, Make a listMicrophones and loudspeakers are transducers. Name some other transducers.
Exercise 5, Setting the sweep rateSuppose you want to display two cycles of a 500-Hz sine tone on an oscilloscope.
What should you chose for the period of the sawtooth sweep on the horizontal axis?
Exercise 6, The dual-trace oscilloscopeWhat is so important about a dual-trace oscilloscope? In what way does it have
more than twice the capability of a single-trace ’scope?
Exercise 7, Oscilloscope deflectionRecall that like charges repel and opposite charges attract. The analog oscillo-
scope deflects the electron beam horizontally using charged plates on the right andleft side of the CRT. If you want to deflect an electron (negative charge) to the leftside of the oscilloscope screen, which plate would be positively charged, and whichplate would be negatively charged?
Exercise 8, Reading the frequency from the oscilloscopeThe oscilloscope has ten divisions in the horizontal direction. You observe that
the sweep rate control is set to “0.5 ms/div.” (Translation: 0.5 ms per horizontaldivision on the screen.) You see exactly four cycles of a sine tone on the screen.What is the frequency of the tone?
Exercise 9, Estimating the frequencyThe oscilloscope is set up as in Exercise 8. You observe that a single cycle of the
tone covers slightly more than 2 divisions. Estimate the frequency of the tone.
Exercise 10, Spectrum analyzer and oscilloscopeA signal is sent to both the spectrum analyzer and the oscilloscope. The spectrum
analyzer display looks like Fig. 4.9. Explain why the oscilloscope tracing looks likeFig. 4.10.

38 4 Instrumentation
Fig. 4.9 Signal for Exercise 10 on the spectrum analyzer
Fig. 4.10 Signal for Exercise 10 on the oscilloscope
Exercise 11, Oscilloscope gridThe oscilloscope grid in Fig. 4.10 has divisions spaced by 1 cm. How many
volts per centimeter on the vertical scale? How many seconds per centimeter on thehorizontal scale?
�

Chapter 5Sound Waves
Recall that the first step in an acoustical event is a vibration of some kind andthe second step is the propagation of that vibration. The opening chapters of thisbook introduced vibrations. Now it is time to look at that second step. Vibrationsare propagated by means of sound waves. Therefore, this propagation raises thetopic of waves themselves. As you know, there are many different kinds of waves—radio waves, light waves, X-rays, and waves on the surface of a lake. Sound wavesare another important example. The different waves have some common features.They all have some frequency (or frequencies). They all can be characterized by adirection of propagation and a speed of propagation, though the speeds are differentfor different kinds of waves.
In general terms, a wave can be thought of as a physical means of propagatingenergy, momentum, and information without transporting mass. If a friend throws aball to you, energy and momentum are propagated, and so is the mass of the ball. Bycontrast, if a friend subjects you to a booming bass sound, energy and momentumare again propagated (your chest walls may be temporarily deformed) but no massis propagated. The sound comes to you as a wave. If a friend sends you a letter, youget the information and the mass of the letter. By contrast, if a friend contacts youby cell phone, you get information but no mass. The information is propagated by aradio wave.
We are particularly interested in sound waves. Sound waves can travel throughsolids, liquids, and gasses. What is normally most important for us as listeners is thepropagation of sound waves in air (Fig. 5.1).
To begin the study of sound waves in air, we start with a brief detour into thewater. When you dive down into the water you feel a pressure on your eardrums.That is because of the weight of the water on top of you. The weight of the water isdue to the earth’s gravity, and this weight leads to pressure.
When you are on the surface of the earth, you are under a sea of air. Because ofgravity, the air has weight and leads to pressure. It is known as standard atmosphericpressure. A pressure has units of a force per unit area. In the metric system of units,force is measured in Newtons and area is measured in square meters, and so pressure
W.M. Hartmann, Principles of Musical Acoustics, Undergraduate Lecture Notesin Physics, DOI 10.1007/978-1-4614-6786-1 5,© Springer Science+Business Media New York 2013
39
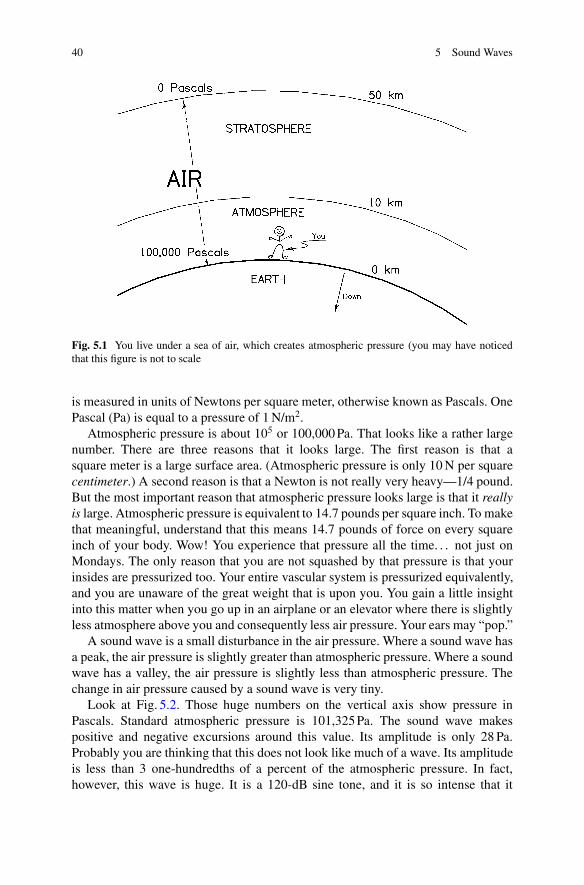
40 5 Sound Waves
Fig. 5.1 You live under a sea of air, which creates atmospheric pressure (you may have noticedthat this figure is not to scale
is measured in units of Newtons per square meter, otherwise known as Pascals. OnePascal (Pa) is equal to a pressure of 1 N/m2.
Atmospheric pressure is about 105 or 100,000 Pa. That looks like a rather largenumber. There are three reasons that it looks large. The first reason is that asquare meter is a large surface area. (Atmospheric pressure is only 10 N per squarecentimeter.) A second reason is that a Newton is not really very heavy—1/4 pound.But the most important reason that atmospheric pressure looks large is that it reallyis large. Atmospheric pressure is equivalent to 14.7 pounds per square inch. To makethat meaningful, understand that this means 14.7 pounds of force on every squareinch of your body. Wow! You experience that pressure all the time. . . not just onMondays. The only reason that you are not squashed by that pressure is that yourinsides are pressurized too. Your entire vascular system is pressurized equivalently,and you are unaware of the great weight that is upon you. You gain a little insightinto this matter when you go up in an airplane or an elevator where there is slightlyless atmosphere above you and consequently less air pressure. Your ears may “pop.”
A sound wave is a small disturbance in the air pressure. Where a sound wave hasa peak, the air pressure is slightly greater than atmospheric pressure. Where a soundwave has a valley, the air pressure is slightly less than atmospheric pressure. Thechange in air pressure caused by a sound wave is very tiny.
Look at Fig. 5.2. Those huge numbers on the vertical axis show pressure inPascals. Standard atmospheric pressure is 101,325 Pa. The sound wave makespositive and negative excursions around this value. Its amplitude is only 28 Pa.Probably you are thinking that this does not look like much of a wave. Its amplitudeis less than 3 one-hundredths of a percent of the atmospheric pressure. In fact,however, this wave is huge. It is a 120-dB sine tone, and it is so intense that it
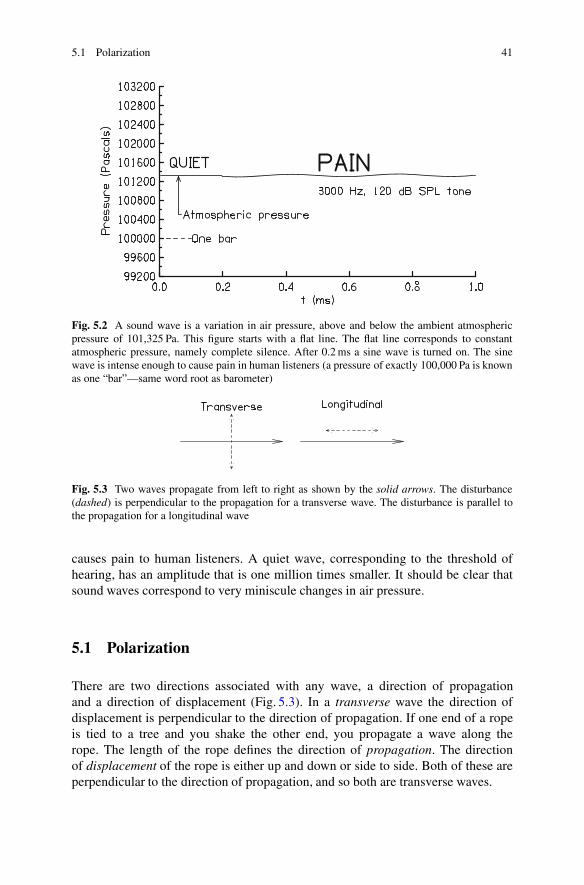
5.1 Polarization 41
Fig. 5.2 A sound wave is a variation in air pressure, above and below the ambient atmosphericpressure of 101,325 Pa. This figure starts with a flat line. The flat line corresponds to constantatmospheric pressure, namely complete silence. After 0.2 ms a sine wave is turned on. The sinewave is intense enough to cause pain in human listeners (a pressure of exactly 100,000 Pa is knownas one “bar”—same word root as barometer)
Fig. 5.3 Two waves propagate from left to right as shown by the solid arrows. The disturbance(dashed) is perpendicular to the propagation for a transverse wave. The disturbance is parallel tothe propagation for a longitudinal wave
causes pain to human listeners. A quiet wave, corresponding to the threshold ofhearing, has an amplitude that is one million times smaller. It should be clear thatsound waves correspond to very miniscule changes in air pressure.
5.1 Polarization
There are two directions associated with any wave, a direction of propagationand a direction of displacement (Fig. 5.3). In a transverse wave the direction ofdisplacement is perpendicular to the direction of propagation. If one end of a ropeis tied to a tree and you shake the other end, you propagate a wave along therope. The length of the rope defines the direction of propagation. The directionof displacement of the rope is either up and down or side to side. Both of these areperpendicular to the direction of propagation, and so both are transverse waves.

42 5 Sound Waves
Fig. 5.4 A longitudinal wave propagates from left to right in a hollow tube filled with air. Asnapshot of the wave shows that the molecules of air are close together at a pressure maximum andthey are more widely spaced at a pressure valley. About three cycles are shown because the lengthof the entire figure is about three wavelengths long
A transverse wave can exist in a medium if the medium has some resistance tobeing bent. For instance, a tightly stretched rope and a steel bar both have resistanceto bending and both can support a transverse wave.
In a longitudinal wave the direction of displacement is parallel to the directionof propagation. A visible example of a longitudinal wave is the vibration of a slinkyalong its length. As a wave propagates along a stretched slinky, the displacementsof the coils are parallel to the extension of the slinky. Therefore, the displacementsare in the same direction as the wave propagation.
A longitudinal wave can exist in a medium if the medium has some resistanceto being compressed. For instance, air or water both have resistance to compressionand both can support a longitudinal wave.
The reason for bringing up this matter of polarization is that sound waves can beeither transverse or longitudinal, but when sound propagates in a gas—like ordinaryair—the sound wave is longitudinal, as shown in Fig. 5.4. For instance, if a wavepropagates in a north direction, then the molecules of air move along a north-southline. A transverse wave cannot exist in air because air has no resistance to beingbent. In terms of the spring and mass analogy, there is no transverse spring.
5.2 The Speed of Sound
The speed of sound in room temperature air is 343.7 m/s. That corresponds to1,128 ft/s or 769 miles/h.
In fact, the speed of sound depends on air temperature. The higher the tempera-ture, the faster the sound. The dependence is not a very strong dependence. A simpleformula that can be used over the range of temperatures that we normally encountergives the speed of sound as
v D 331:7C 0:6 TC ; (5.1)

5.2 The Speed of Sound 43
where v is the speed of sound in meters per second and TC is the temperature inCelsius degrees. On the Celsius scale, room temperature is 20ı, and that is how weget the speed of sound to be 343.7 m/s at room temperature.
Interestingly, the speed of sound does not depend on the air pressure. On a clearday, when the barometer reads high or on a stormy day when the barometer readslow, the speed of sound is the same. The reason is that the effect of changingair pressure leads to mutually compensating changes in the air. Increasing the airpressure increases the elasticity of air, and this tends to increase the speed of sound.But increasing the air pressure also increases the density of the air, and this tends todecrease the speed of sound. In the end, these two changes in the properties of aircancel one another.
5.2.1 Supersonic Things
Something that is supersonic goes faster than the speed of sound. Some airplanesare supersonic, and their speed is measured in Mach number, which is just a way ofsaying how many times faster than the speed of sound. For instance, the F16 fighterplane flies at Mach 2, which means twice the speed of sound (this was also thecruising speed of the Concorde passenger plane). Because the speed of sound is 769miles per hour, you might conclude that the F16 flies at 1,538 miles per hour. Thatwould be close but not quite right. The trick here is that the F16 flies at 50,000 ft.At this high altitude the air is cold, and the speed of sound is only 670 miles perhour. Mach numbers are measured with respect to the ambient air. Therefore, forthis plane, Mach 2 is only 1,340 mph.
A supersonic thing makes a shock wave that trails behind it so long as it continuesto travel at supersonic speeds. For an aircraft traveling faster than Mach 1 this shockwave is called a sonic boom. It can break windows all along the path below the planefor as long as the plane flies supersonically.
Linearizing a Function
Equation (5.1) for the speed of sound is good and it is bad. It is goodbecause it provides a simple way to calculate the speed of sound for anynormal air temperature. It is simple because it is linear in the air temperature,TC . However, the equation is bad because it misrepresents the true waythat the speed of sound actually depends on temperature. In reality, thespeed of sound depends on the square root of the absolute temperature,referenced to absolute zero (�273 ıC). That dependence is shown in Fig. 5.5for temperatures ranging from �194 to C300 ıC. It is not linear, it is curved.
The shaded region in Fig. 5.5 extends from �18 to 40ıC, correspondingto Fahrenheit temperatures from 0 to 104ı. That is the temperature rangewhere we normally live. Over that small temperature range a straight line(linear) is a good approximation to the curve. Equation (5.1) represents that

44 5 Sound Waves
straight line approximation to the curve. It is an example of a mathematicaltechnique commonly used in engineering and economics, linearizing a morecomplicated function to represent behavior over a limited range.
Fig. 5.5 The speed of sound depends on the square root of the absolute temperature, asshown by the heavy line, but over a restricted temperature range it is well represented by astraight line. (The asterisk at �194 ı shows where air becomes a liquid.) The shaded regionindicates the normal range of outdoor air temperatures
5.2.2 Sound vs Light
Sound and light are both wave phenomena. However, there are enormous differencesbetween sound waves and light waves. Most important, sound waves require amedium, such as air or water, to propagate. Light waves do not require a medium.Light waves can travel through a vacuum. That is why we can see the sun (visiblelight) and feel its warmth (infrared light) but we cannot hear the sun.
Sound waves consist of pressure changes in the medium; light waves, includingradio waves, consist of changes in an electromagnetic field. Light waves travel at thespeed of light (How about that!). The speed of light is 3 � 108 m/s. To compare thatwith the speed of sound in air, consider that 344 m/s is about 3� 102 m/s. Evidentlylight is faster by a factor of 106, i.e., it is a million times faster. In the time that ittakes a sound wave to go 40 m (130 ft) a light wave can go completely around theearth at the equator (25,000 miles). In the time that it takes sound to go 1 km, a lightwave can travel to the Moon and back.

5.3 Sound Waves in Space and Time 45
A light wave has a frequency just like a sound wave does. While the frequenciesof audible sound are 20–20,000 Hz, the frequencies of visible light range from4 � 1014 Hz (red) to 7 � 1014 Hz (violet). Also, where sound waves in air arelongitudinal, light waves are transverse. The electromagnetic field is perpendicularto the direction of propagation.
5.3 Sound Waves in Space and Time
In previous chapters we have drawn waves as functions of time. Such a wave mightrepresent the vibration of a guitar string at the position of the bridge of the guitar, orit might represent a voltage coming from a microphone. Such waves are functionsof one dimension, the dimension of time. When we talk about propagating wavesin space, we need to add spatial dimensions to the description of wave motion.Because there are three dimensions of space, we might add as many as three moredimensions.
Often it is possible to consider sound propagation in a single spatial dimension.Then there are two dimensions, one dimension of space and one dimension of time.We can imagine plotting sound pressure as a function of time and a single spatialdimension. To do so requires a three-dimensional graph, as shown in Fig. 5.6.
It is difficult to work with a three-dimensional graph, and most of the time wedon’t. What we do instead is to decide in advance whether we want to describe thewave in time or in space. If we choose to plot the wave in time, we pick a point inspace and draw a graph of the sound pressure as the wave comes by that point. Ifwe chose to plot the wave in space, we pick a point in time and draw a graph ofthe spatial dependence of the sound pressure. Making a graph at a particular pointin time is called a “snapshot.” This is a familiar concept. A snapshot photographshows spatial relationships—e.g., you are in the middle, your friends are to the rightand the left—but time is frozen.
Fig. 5.6 A three-dimensional coordinate system for plotting sound wave as a function of time andone dimension of space. If you have trouble visualizing three mutually perpendicular axes like this,think about the corner of a room, where two walls meet a floor

46 5 Sound Waves
Fig. 5.7 Two views of a 800-Hz sine tone. For the graph on the left, we choose a point in space (the0.69 m mark at point A) and we plot pressure as time goes by. We observe that the period is 1.0/800= 1.25 ms. For the graph on the right, we take a snapshot at time t D 0:81ms and we plot thepressure at all points in space at this time. We see that the wavelength is � D 344=800 D 0:43m
The two kinds of plot are shown in Fig. 5.7. The graph on the left shows thepressure as a function of time. The graph on the right shows the pressure as afunction of space. The function is a sine wave, which is periodic in time. Its periodis T , measured in seconds. Because the time graph is periodic, the space graph isalso periodic. Its period has a spatial character. It is called wavelength—lambda(�)—and it is measured in meters.
There is a simple and important relationship between the frequency of a wave,the wavelength of the wave, and the speed of the wave. The relationship is
v D f � (5.2)
This equation can be manipulated in different ways with different interpretations.The interpretations are analogies for waves that are intended to make the conceptsof frequency and wavelength easier to understand.Frequency: First, Eq. (5.2) can be used to find the frequency,
f D v=� (5.3)
Interpretation: There is a rigid structure with a regular spacing like the teeth of asaw or the threads of a screw. The spacing is called �. When this structure movespast point A, the rate at which the teeth or threads come by is equal to the speedof the structure divided by the spacing. That rate is frequency f , as determined byEq. (5.3).
Period: Of course, Eq. (5.3) can be used to find the period, because the period is thereciprocal of the frequency—just Eq. (5.3) upside down:
T D �=v (5.4)
Interpretation: The cars on the freight train all have the same length, and that lengthis �. The length of time between the passage of freight cars is equal to the lengthof the cars divided by the speed of the train. That is the period T as determined byEq. (5.4).
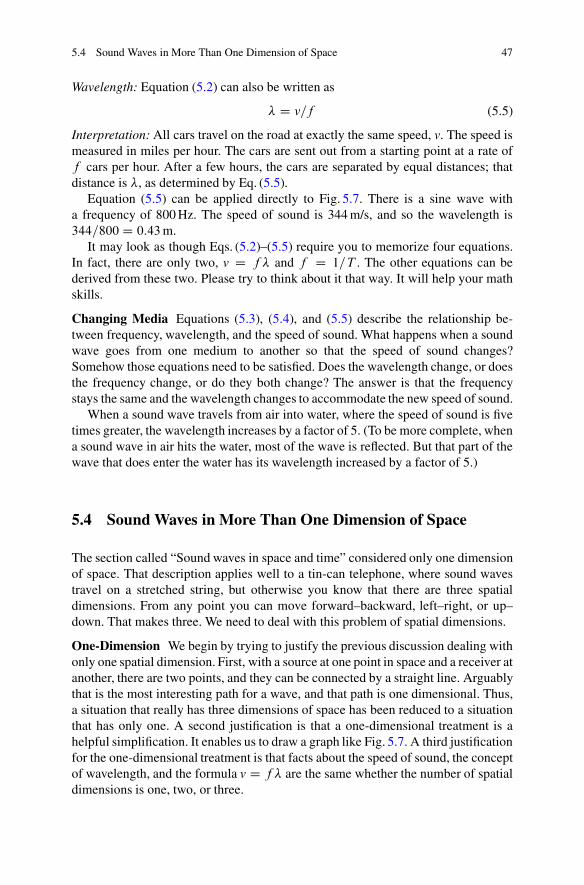
5.4 Sound Waves in More Than One Dimension of Space 47
Wavelength: Equation (5.2) can also be written as
� D v=f (5.5)
Interpretation: All cars travel on the road at exactly the same speed, v. The speed ismeasured in miles per hour. The cars are sent out from a starting point at a rate off cars per hour. After a few hours, the cars are separated by equal distances; thatdistance is �, as determined by Eq. (5.5).
Equation (5.5) can be applied directly to Fig. 5.7. There is a sine wave witha frequency of 800 Hz. The speed of sound is 344 m/s, and so the wavelength is344=800 D 0:43m.
It may look as though Eqs. (5.2)–(5.5) require you to memorize four equations.In fact, there are only two, v D f � and f D 1=T . The other equations can bederived from these two. Please try to think about it that way. It will help your mathskills.
Changing Media Equations (5.3), (5.4), and (5.5) describe the relationship be-tween frequency, wavelength, and the speed of sound. What happens when a soundwave goes from one medium to another so that the speed of sound changes?Somehow those equations need to be satisfied. Does the wavelength change, or doesthe frequency change, or do they both change? The answer is that the frequencystays the same and the wavelength changes to accommodate the new speed of sound.
When a sound wave travels from air into water, where the speed of sound is fivetimes greater, the wavelength increases by a factor of 5. (To be more complete, whena sound wave in air hits the water, most of the wave is reflected. But that part of thewave that does enter the water has its wavelength increased by a factor of 5.)
5.4 Sound Waves in More Than One Dimension of Space
The section called “Sound waves in space and time” considered only one dimensionof space. That description applies well to a tin-can telephone, where sound wavestravel on a stretched string, but otherwise you know that there are three spatialdimensions. From any point you can move forward–backward, left–right, or up–down. That makes three. We need to deal with this problem of spatial dimensions.
One-Dimension We begin by trying to justify the previous discussion dealing withonly one spatial dimension. First, with a source at one point in space and a receiver atanother, there are two points, and they can be connected by a straight line. Arguablythat is the most interesting path for a wave, and that path is one dimensional. Thus,a situation that really has three dimensions of space has been reduced to a situationthat has only one. A second justification is that a one-dimensional treatment is ahelpful simplification. It enables us to draw a graph like Fig. 5.7. A third justificationfor the one-dimensional treatment is that facts about the speed of sound, the conceptof wavelength, and the formula v D f � are the same whether the number of spatialdimensions is one, two, or three.
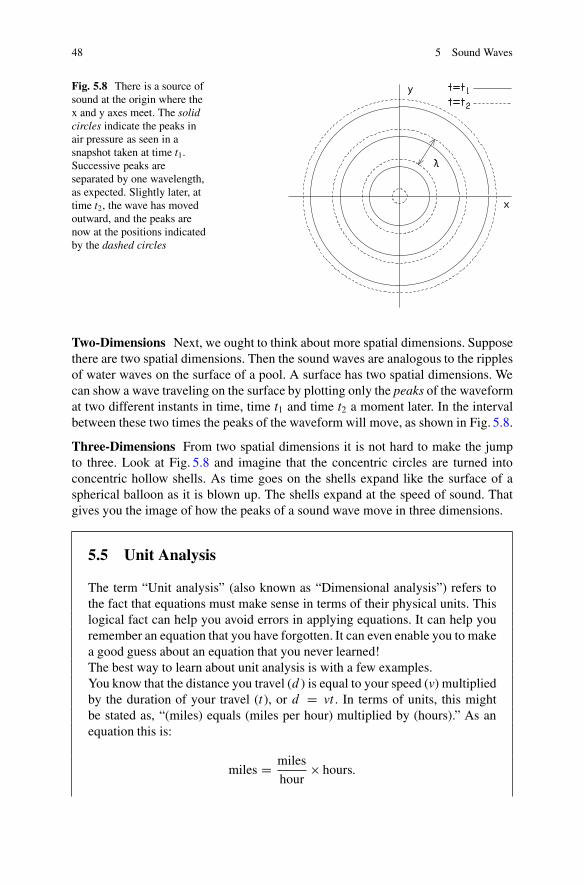
48 5 Sound Waves
Fig. 5.8 There is a source ofsound at the origin where thex and y axes meet. The solidcircles indicate the peaks inair pressure as seen in asnapshot taken at time t1.Successive peaks areseparated by one wavelength,as expected. Slightly later, attime t2, the wave has movedoutward, and the peaks arenow at the positions indicatedby the dashed circles
Two-Dimensions Next, we ought to think about more spatial dimensions. Supposethere are two spatial dimensions. Then the sound waves are analogous to the ripplesof water waves on the surface of a pool. A surface has two spatial dimensions. Wecan show a wave traveling on the surface by plotting only the peaks of the waveformat two different instants in time, time t1 and time t2 a moment later. In the intervalbetween these two times the peaks of the waveform will move, as shown in Fig. 5.8.
Three-Dimensions From two spatial dimensions it is not hard to make the jumpto three. Look at Fig. 5.8 and imagine that the concentric circles are turned intoconcentric hollow shells. As time goes on the shells expand like the surface of aspherical balloon as it is blown up. The shells expand at the speed of sound. Thatgives you the image of how the peaks of a sound wave move in three dimensions.
5.5 Unit Analysis
The term “Unit analysis” (also known as “Dimensional analysis”) refers tothe fact that equations must make sense in terms of their physical units. Thislogical fact can help you avoid errors in applying equations. It can help youremember an equation that you have forgotten. It can even enable you to makea good guess about an equation that you never learned!The best way to learn about unit analysis is with a few examples.You know that the distance you travel (d ) is equal to your speed (v) multipliedby the duration of your travel (t), or d D vt . In terms of units, this mightbe stated as, “(miles) equals (miles per hour) multiplied by (hours).” As anequation this is:
miles D miles
hour� hours:

Exercises 49
We have used the fact that the word “per” means “divided by.” The key pointis that the units of hours cancel in the numerator and denominator, leading tothe logical conclusion that miles equal miles. Unit analysis enforces that kindof logic.Notice that unit analysis can prevent you from making an error such asmultiplying a speed in miles per hour by the number of minutes you travel.Unit analysis applies to every equation we study. For instance, Eq. (5.2) saysv D f �. In terms of units
meters per second D cycles
second� meters
cycle:
The units of cycles cancel, and this equation reduces to a logical result:
meters per second D meters
second:
Notice that unit analysis helps you avoid an error in writing the equation. Forinstance, v D �=f is a nonsense formula. It says that a speed (v) is equal to alength (�) multiplied by a time (1=f ), but you know that a speed is equal to alength divided by a time.As another example, Chap. 2 says that frequency, f , has units of inverse time.Therefore, 1=f has units of seconds. Formally we say that period, T , is givenby T D 1=f , or,
seconds per cycle D 1
cycles=second:
You can improve your life by applying unit analysis to every practicalcalculation you do.
Exercises
Exercise 1, Constant pressureThe pressure of the sound shown in Fig. 5.2 is more than 101,000 Pa. Bozo says
that such a big pressure is bound to be painful. Set Bozo straight on the role of thisconstant part of the pressure.
Exercise 2, Check those powers of tenThe first page of this chapter says that 100,000 N/m2 is equivalent to 10 N/cm2.
Is that really right? Consider that 1 m is 100 cm. Why isn’t 100,000 N/m2 equivalentto 1,000 N/cm2?

50 5 Sound Waves
Exercise 3, Pressure conversionYour goal is to show that 14.7 pounds per square inch is equivalent to about
101,000 N/m2. You begin by realizing that pressure is force per unit area. Therefore,you need English-metric conversions for force and for area. For force: 4.45 N/pound.For distance: 0.0254 m/in., therefore, 0.000645 m2/in.2. Can you work it from here?
Exercise 4, Extreme weatherOn a really cold day the temperature is �18 ıC (0 ıF). On a really hot day it is
C40 (104 ıF). What is the speed of sound at �18? At C40?
Exercise 5, Americanize the equationOur formula Eq. (5.1) for the speed of sound as a function of temperature assumes
that temperature is given on the Celsius (also known as Centigrade) scale. On thisscale water freezes at zero and water boils at 100ı. Most Americans are morefamiliar with the Fahrenheit scale where water freezes at 32ı and boils at 212ı.A temperature on the Fahrenheit scale TF can be converted to a temperature on theCelsius scale TC with the formula
TC D 5
9.TF � 32/: (5.6)
(a) Show that the speed of sound, in meters per second, is given by
v D 321C 1
3TF : (5.7)
(b) Room temperature on the Fahrenheit scale is about 69ı. Show that formula (5.7)leads to a speed of sound of 344 m/s at this temperature as you would expect.
(c) To further Americanize the equation, show that the speed of sound in feet persecond is given by
v D 1053C 1:1 TF : (5.8)
Use the fact that 1 ft is exactly 0.3048 m.
Exercise 6, A fair start(a) How long does it take for sound to travel 10 m? (b) The runner in the far
lane is 10 m farther away from the starter than the runner in the near lane. Whenthe starter fires the starting pistol, the near runner hears it first. Could this make asignificant difference?
Exercise 7, Stormy weatherThunder and lightning are produced simultaneously. If you see the lighting 2 s
before you hear the thunder, how far away did lightning strike?
Exercise 8, Mach 1The text says that the speed of sound at room temperature is 1,128 feet per second
or 769 miles per hour. Use the fact that there are 5,280 ft in a mile to show that thisequivalence is correct.

Exercises 51
Exercise 9, Sound vs lightThe section called “Sound vs light” gives the range of audible sound frequencies
and the range of visible light frequencies. Which range is broader?
Exercise 10, Longest and shortestNominally, the limits of human hearing are 20 and 20,000 Hz. Find the wave-
lengths of those two waves in air. Here, and in exercises below, assume that the airis at room temperature.
Exercise 11, Medium longWhat is the frequency of a tone with a wavelength of 1 m?
Exercise 12, Frequency and wavelengthEquations (5.2), (5.3), and (5.5) are all variations on the same equation. Is one
more fundamental than the others? Knowing what you do about waves that travelfrom one medium into another, can you make the case that Eq. (5.5) [� D v=f ] isthe most fundamental?
Exercise 13, Making wavesClap your hands four times with a perfectly regular rhythm so that there is 1/2 s
between each clap. Think about the hand claps as a periodic signal. It is not a sinewave signal, but it is periodic—at least for a few seconds. Now look at Fig. 5.8.Could this apply to the hand clapping exercise? What is the period, the frequency,the wavelength?
Exercise 14, Unit analysisBy law, the maximum water usage of a new American toilet is 1.6 gpf. What do
you think is meant by “gpf.” Write the equation that describes how many gallons ofwater the toilet uses in a day. Your equation should include all the units, which isthe main point of this exercise.
Exercise 15, DispersionThe speed of a sound wave in open air does not depend on the frequency of
the wave. We say that the propagation in air is non-dispersive. Some physicalsystems do have dispersion. For instance, when a light wave travels through aglass prism, the speed of light in the glass depends on the color (frequency) of thelight. The dispersion of the prism separates the different colors that compose whitelight. Suppose that sound propagation were dispersive so that low-frequency soundstravel 10 % faster than high-frequency sounds. What would be the consequences forcommunication?
Exercise 16, Bending water?Can transverse waves propagate in a fluid like water?
Exercise 17, Breaking wavesBreaking waves that you see coming up the beach are complicated. They
are more complicated than the sound waves that we describe as longitudinal ortransverse. (a) Make the case that the polarization of breaking waves is longitudinal.(b) Make the case that the polarization of breaking waves is transverse.
52 5 Sound Waves
Exercise 18, Helium gasHelium gas is much lighter than ordinary air, i.e. it is less dense. That is why it
is used as a lifting gas for blimps. Because helium is so light, the speed of sound inhelium is high, about 1000 m/s.
(a) Show that the speed of sound in helium is about three times faster than thespeed of sound in air.
(b) Show that the wavelength of a 1000-Hz tone in helium gas is about 1 meter.(c) Explain why the frequency of a 1000-Hz tone in helium gas is still 1000 Hz.
�

Chapter 6Wave Properties
This chapter describes some properties of waves—properties like interference,beats, reflection, and refraction. Naturally, the focus will be on sound waves, but theprinciples apply equally to light waves. Because of the unifying principles of wavephysics, you get two for one—once you’ve learned the acoustics, you automaticallyknow the optics.
6.1 Wave Addition
Your date is talking to you across the table, and the band is playing in thebackground. You hear them both. You may imagine that there are two sound waves,one from your date and the other from the band and that both sound waves arepropagated to your ears. That description is not entirely wrong, but a much betterdescription is that the waves from the two sources are added in the air, and yourear is exposed to only a single wave. The single wave is the sum of the waves fromthe two sources. The addition of waves is the addition of pressure waves. Becausepressure waves can be positive or negative there are possibilities for reinforcementand cancellation. Reinforcement occurs when two waves are added and they havethe same sign—both are positive or both are negative. Then the summed wave ismore positive or more negative than either of its constituents. Cancellation occurswhen the constituent waves have different signs. If one wave leads to a positivepressure at a particular place and time and the other wave leads to a negative pressureat that place and time, then the two waves tend to cancel each other when they bothoccur at the same time.
W.M. Hartmann, Principles of Musical Acoustics, Undergraduate Lecture Notesin Physics, DOI 10.1007/978-1-4614-6786-1 6,© Springer Science+Business Media New York 2013
53

54 6 Wave Properties
6.2 Interference
In the most general terms, interference is the same thing as the addition ofseveral waves as described in the section above. Specifically though, when we talkabout interference, we usually are thinking about a situation where the addition isparticularly simple because the two sources are similar. Both sources emit the samewaveform and have the same frequency. This simple situation is important becausedramatic events can occur. As usual in science, simplicity leads to power.
If the waves from the two sources add up to reinforce one another we haveconstructive interference. If the waves from the two sources add up to cancel oneanother we have destructive interference. Constructive interference occurs at a pointin space where the two waves have the same phase. When one is positive the otheris positive. When the first one is negative the second one is also negative.
Destructive interference occurs when the two waves have opposite signs. Whenone is positive the other is negative. Two sine waves can be caused to have oppositesigns by delaying one of them by half a period. Then the two sine waves become180ı out of phase. You will recall that what you get on the second half cycle of asine wave is just the negative of what you got on the first half cycle. Therefore, thekey to completely destructive interference is a delay of half a period.
Figure 6.1 shows two loudspeakers and a microphone. Speaker 1 is 1.06 m awayfrom the microphone; speaker 2 is 1.4 m away from the microphone. Both speakersemit a sine tone with a frequency of 500 Hz so that the period is 2 ms.
This example happens to be a case of interference that is almost completelydestructive. The reason is that the two waves arrive at the microphone almost 180ıout of phase. That is because the extra time for the sound from speaker 2, comparedto speaker 1, is half a period of the tone. Let’s see why that is so. The time requiredfor any waveform feature to get from speaker 1 to the microphone is t1, t1 D D1=v,where v is the speed of sound, v D 344m/s, as shown in the time-line of Fig. 6.2.The time for the feature to arrive from speaker 2 is t2, t2 D D2=v. The extra time ist2 � t1, and it is easily calculated.
t2 � t1 D D2=v �D1=v D 1:4=344� 1:06=344 � 0:001 seconds; (6.1)
or 1 ms. Because the period of the tone is 2 ms, the extra time is half a period, justwhat is needed for cancellation.
Fig. 6.1 Two loudspeakersand a microphone. The samesine signal is sent to bothspeakers

6.2 Interference 55
Fig. 6.2 Delay t1 D 1:06=344. Delay t2 D 1:4=344. The two waves cancel each other at themicrophone position
Note that if the extra travel time were a full period, then the waves fromthe two speakers would be in phase, and there would be completely constructiveinterference.
Note that if the extra travel time were one-and-a-half periods, then the wavesfrom the two speakers would be 180ı out of phase again and the interference wouldbe destructive.
It should be clear that the condition for destructive interference is that the extratravel time should be an odd number of half periods, i.e., T=2, 3T=2, 5T=2, 7T=2,etc. The formula for destructive interference is then
t2 � t1 D .2nC 1/T=2; (6.2)
where n is an integer. [Note that .2nC 1/ is just a way to describe any odd integer.Try it.]
We can express that result in terms of the extra distance that the wave fromspeaker 2 must go. Call that extra distance D2 �D1. Then destructive interferenceoccurs when the extra distance is an odd number of half wavelengths, i.e.
D2 �D1 D .2nC 1/�=2: (6.3)
To prove that Eq. (6.3) is correct, we can start with Eq. (6.2) for cancellationdescribed in terms of delay, then multiply both sides of the equation by the speed ofsound to get distances:
D2 �D1 D v.t2 � t1/ D .2nC 1/vT=2 D .2nC 1/�=2: (6.4)
The proof has used the fact that vT D �.
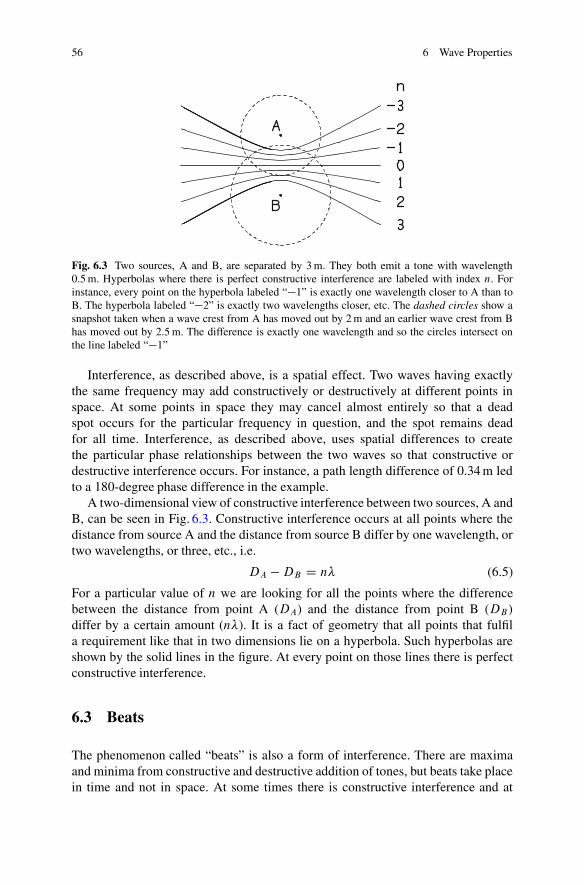
56 6 Wave Properties
Fig. 6.3 Two sources, A and B, are separated by 3 m. They both emit a tone with wavelength0.5 m. Hyperbolas where there is perfect constructive interference are labeled with index n. Forinstance, every point on the hyperbola labeled “�1” is exactly one wavelength closer to A than toB. The hyperbola labeled “�2” is exactly two wavelengths closer, etc. The dashed circles show asnapshot taken when a wave crest from A has moved out by 2 m and an earlier wave crest from Bhas moved out by 2.5 m. The difference is exactly one wavelength and so the circles intersect onthe line labeled “�1”
Interference, as described above, is a spatial effect. Two waves having exactlythe same frequency may add constructively or destructively at different points inspace. At some points in space they may cancel almost entirely so that a deadspot occurs for the particular frequency in question, and the spot remains deadfor all time. Interference, as described above, uses spatial differences to createthe particular phase relationships between the two waves so that constructive ordestructive interference occurs. For instance, a path length difference of 0.34 m ledto a 180-degree phase difference in the example.
A two-dimensional view of constructive interference between two sources, A andB, can be seen in Fig. 6.3. Constructive interference occurs at all points where thedistance from source A and the distance from source B differ by one wavelength, ortwo wavelengths, or three, etc., i.e.
DA �DB D n� (6.5)
For a particular value of n we are looking for all the points where the differencebetween the distance from point A (DA) and the distance from point B (DB )differ by a certain amount (n�). It is a fact of geometry that all points that fulfila requirement like that in two dimensions lie on a hyperbola. Such hyperbolas areshown by the solid lines in the figure. At every point on those lines there is perfectconstructive interference.
6.3 Beats
The phenomenon called “beats” is also a form of interference. There are maximaand minima from constructive and destructive addition of tones, but beats take placein time and not in space. At some times there is constructive interference and at

6.3 Beats 57
Fig. 6.4 Two waves, 500 and 510 Hz. The time axis begins at the upper left and continues on thesecond graph below. Beats occur when the solid wave and the dashed wave are added together. Thepattern shown here repeats for as long as the two tones persist
other times there is destructive interference. When the interference is constructive itis constructive at all points in space, and when it is destructive it is destructive at allpoints in space.
Beats occur between two sine tones that have almost the same frequency but notexactly the same frequency. The beat rate (the number of beats per second) is equalto the difference between the two frequencies. If the two frequencies are f1 and f2,then the beat rate is
fbeat D f2 � f1 (6.6)
For instance, suppose you strike two tuning forks, and one has a frequency of 500 Hzwhile the other has a frequency of 501 Hz. The difference is 501� 500 D 1, or onebeat per second. That means that there will be one maximum, when the sum is loud,and one minimum, when the sum is quiet, every second. It is not hard to see whythis is so.
Suppose that we measure the two waves from the two tuning forks when eachis at a positive maximum. They are “in phase.” Then the sum will be as loud as itcan be. As time progresses the two waves will become out of phase because theforks have different frequencies. After half a second the 500-Hz wave will haveexecuted 250 complete cycles and it will be at a positive maximum again. However,the 251-Hz wave will have executed 250.5 cycles, and the extra half a cycle willmean that this wave is at a negative maximum. The positive maximum and negativemaximum will cancel and the sum will be quiet. After a full second, the 500-Hzwave will have gone through 500 cycles and be at a positive peak; the 501-Hz wave

58 6 Wave Properties
Fig. 6.5 A two-input mixer. As usual, signals go from left to right. Two signals come into themixer and one signal comes out on the right. The signal that comes out is the sum of the two inputsignals. The sigma symbol indicates summation. To create a musical recording or the sound trackof a film, audio engineers use mixers that add dozens of signals together. A 48-input mixer is notuncommon. The principles of interference among audio signals still apply
will have gone through 501 complete cycles and also be at a positive peak. As aresult, the waves will once again be perfectly in phase and there will be a maximumagain. This example shows that there is one maximum and one minimum per secondwhen the frequency difference is 1 Hz.
Figure 6.4 shows what happens when the frequencies are 500 and 510 Hz. Nowthere are ten beats per second. Ten beats per second is rather fast but one canstill hear them as a rapidly varying loudness. Again, we choose to start the clockwhen both waves are together. After 50 ms (0.05 s) the 500-Hz wave will have gonethrough 25 cycles but the 510-Hz wave will have gone through 25.5 cycles. Thewaves will be out of phase and will cancel. After 100 ms the two waves will havegone through 50 and 51 complete cycles and will be in phase again.
6.4 Audio Analogies
The previous sections have described interference and beats in acoustical terms.The outputs of two loudspeakers were added in the air to make a single wave thatappeared at the microphone. The outputs of two tuning forks were added in the airto create a single beating wave at a listener’s ear.
Because we often deal with signals in electronic (audio) form, it is importantto note that interference and beats also occur between audio signals that are addedtogether. The electronic device that adds audio signals together is called a “mixer.”Figure 6.5 shows a mixer with two inputs. If these two inputs contain sine tonesthat happen to have the same frequency and the same amplitude but are 180ı outof phase, then the sine tone in the output will cancel just as surely as it did in thetwo-loudspeaker experiment. Alternatively if the two inputs contain sine tones withfrequencies of 500 and 510 Hz, then the output will contain a sine tone that beatsten times per second. One could see that beating tone by connecting the output toan oscilloscope.

6.5 Generalization 59
6.5 Generalization
The concepts of interference and beats have been presented above using sine tonesas examples. It was natural to use sine tones because the interference and beatingeffects are determined by frequency and a sine tone has only a single frequency.That makes it simple. It is important to realize that these effects also take place forthe more complicated signals of speech and music because sine tones are present ascomponents in complicated signals. An interference effect or a beating effect thatoccurs for a sine tone in isolation also occurs in the same way when that sine toneis a component of a complex tone.
Telephone Dial Tone To illustrate the generalization above about complex signals,consider the dial tone in an American telephone. The dial tone is a sum of two sinewaves, 350 and 440 Hz. This sum makes a complex wave that sounds like a musicalchord. Suppose you did not know what the frequencies were and you wanted to findout. An oscilloscope tracing would be a mess because the signal is not particularlyperiodic. For the same reason, a frequency counter would do you no good either.
What you could do is to add another sine tone with adjustable frequency andlisten for the beats. You can choose to get beats from either the 350-Hz component orthe 440-Hz component. When you adjust the frequency to 345 Hz you hear 5 beatsper second because of the 350-Hz component. When you adjust the frequency to443 Hz you hear 3 beats per second because of the 440-Hz component. By countingthe beats for different frequencies of the adjustable tone near 350 and 440 Hz youcould learn the exact frequencies of the two components in the dial tone.
Electronic Inversion The present chapter opened with a discussion of waveaddition and interference. It showed that a 500-Hz tone can be cancelled by addinganother 500-Hz tone if one of these tones is delayed by 1 ms compared to the other.That is because 1 ms is one-half of the period—just what is needed to make thetwo tones 180ı out of phase. Similarly, a 400-Hz tone can be cancelled by addinganother 400-Hz tone that has been delayed by 1.25 ms. This kind of cancellationworks perfectly for sine tones.
But what happens for a complex tone? Suppose you want to place a singlespeaker so as to cancel a complex tone that is the sum of a 400-Hz tone and a500-Hz tone, using a set up like Fig. 6.1. You could use a delay of 1.25 ms to cancelthe 400-Hz part of the tone, or you could use a delay of 1 ms to cancel the 500-Hzpart of the tone, but there is no delay that would cancel both components of the tone.
Within the domain of acoustics there is no solution to this complex cancellationproblem. But electronically there is a solution because electronics allows forwaveform inversion by a device called (appropriately) an “inverter.” An inverter hasan input and an output. Whenever the input voltage is positive, the output voltage isnegative—and with the same magnitude. Thus, at an instant of time when the inputis 3.45 V, the output is �3:45V. Similarly, when the input is negative, the output ispositive, again with the same magnitude. Therefore, the inverter happens to delay

60 6 Wave Properties
a
b
Fig. 6.6 (a) Waveform x.t/ is the sum of a 400-Hz sine and a 500-Hz sine. (b) Waveform y.t/ isthe result of passing waveform x through an inverter. At any instant of time y is the negative of x.If x and y are added together in a mixer the output of the mixer is zero because x and y cancelcompletely
each frequency component by exactly the right amount to turn the waveform upsidedown. The inverted waveform y.t/ could be used to cancel the input waveform x.t/,as described in Fig. 6.6.
Noise-Cancelling Headphones
Our high-speed industrialized world is a noisy place. The sounds of machin-ery and transportation can mask other sounds that we need to hear or wantto hear. Noise can be more than just annoying. It can be a hazard to healthand safety. Wouldn’t it be great if we could use electronics and the concept ofinterference to cancel the noise around us? The idea is simple in principle. Allwe need to do is to pick up the annoying sound with a microphone to convertit into an audio (electronic) signal, then invert the signal, and finally playit back through a loudspeaker. The signal from the loudspeaker should thencancel the annoying sound. This is the concept of active noise cancellation.In fact, it is almost impossible with current technology to achieve activenoise cancellation over a three-dimensional region of space, except for thevery longest wavelengths (lowest frequencies). However, there are severalacoustical circumstances where active noise cancellation can be successful.One application is in ducts where the sound is confined, and there is only oneimportant direction of propagation, namely along the length of the duct.The most common application of active noise cancellation is in headphones.Headphones are another confined environment, and they all contain littledrivers with diaphragms that reproduce speech and music. In noise-cancellingheadphones, the phone for each ear contains a tiny microphone to pick upthe outside noise. The signal from the microphone is inverted and sent back,to be mixed with the desired speech or music. The combined signal is thensent to the headphone diaphragm driver. The result is that the inverted noisecancels the noise from outside and the user can hear the speech and musicbetter. Alternatively, the user can disconnect the source of speech or musicand simply listen to quiet.

6.6 Reflection 61
Noise-cancelling headphones work well for low-frequency sounds wherethe wavelengths are long compared to the size of the headphone ear cup.Commercially available units are effective below 500 Hz but not at higherfrequencies. Because much of the noise in aircraft and other vehicles isactually below 500 Hz, noise-cancelling headphones are useful. However,the sounds of intelligible human speech extend well above 500 Hz. Thus,noise-cancelling headphones can eliminate the low rumble inside an airplane,leaving a high-frequency rushing sound, but they do not prevent you frombeing disturbed by people using their cell phones while you are waiting in theairport.
6.6 Reflection
Waves can be reflected. A wave is reflected when it abruptly changes its direction ofpropagation. Suppose that you are in a room at night with a single lamp burning. Ifyou look directly at the lamp you see a source of direct light. If you look at anythingelse in the room you are seeing reflected light. Similarly, sound waves are reflectedfrom surfaces in a room. A wave is reflected when it encounters a change in mediumfor propagation. Both light and sound are reflected from a wall because the materialof the wall is different from ordinary air.
There are two kinds of reflection depending on the regularity of the reflectedwave. A mirror leads to specular reflection. You can see your face in a mirror. Atypical wall leads to diffuse reflection. You cannot normally see your face in a wall.The difference can be seen in Fig. 6.7.
The specular reflection preserves the order of the rays and therefore preserves theimage on reflection like a mirror. The diffuse reflection scrambles the order.
Whether a reflection is specular or diffuse depends on the size of the bumpson the surface compared to the wavelength. If the bumps are small compared to
a b
Fig. 6.7 (a) A wave comes in from the upper left. Four long, parallel lines show the directionof propagation of the rays, and the spaces between the wavefronts (shown dashed) indicate thewavelength. The wave is specularly reflected because the reflecting surface has irregularities thatare much smaller than the wavelength. (b) The same wave comes in from the upper left, but it isdiffusely reflected because the bumps on the surface are comparable to the wavelength or largerthan the wavelength

62 6 Wave Properties
Fig. 6.8 The figure shows six lines indicating the pressure peaks in a traveling sound wave. Thelines are separated by a wavelength. The wavelength is longer in warm air where the speed ofsound is greater. The direction of propagation is perpendicular to the lines that show the peaks.Therefore, the direction of propagation is bent downwards toward the cool region
the wavelength the reflection is specular. If the bumps are large compared to thewavelength the reflection is diffuse. A specular reflection of sound waves in a roomcan lead to focusing of sound—often leading to an uneven sound distribution in theroom.
6.7 Refraction
Refraction of a wave is different from reflection because the change of directionis gradual and not abrupt. A lens refracts a light wave. For instance, eyeglassesconsist of lenses that make slight changes in the direction of the rays of light inorder to correct for defects in the optics of the user’s eyes. Lenses work because theconditions for propagation of light in glass are slightly different from the conditionsin air or vacuum.
Sound waves can also be refracted when the conditions for propagation change.For instance, when sound travels from a region of cool air to a region of warm air,the wavefront moves faster in the warm air and bends toward the direction of thecool air. This effect occurs on a sunny winter day when the air immediately abovethe ground is cooled by snow but the air well above the ground is warm (Fig. 6.8).
6.8 Diffraction
You can’t see around a corner, but you can hear around a corner. That essentialdifference between vision and hearing is the result of the very different wavelengthsof light and sound. While visible light has a wavelength of about 500 nm (500 �10�9 m, or 5 � 10�7 m), audible sound has a wavelength as long as 7 m, about tenmillion times longer than light. Sound waves bend around corners. Light waves bendaround corners too—just ten million times less.
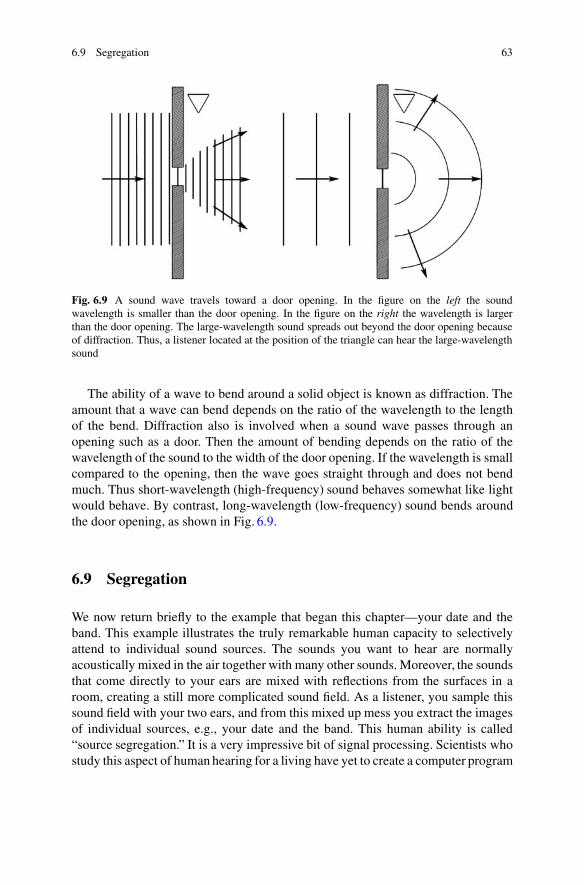
6.9 Segregation 63
Fig. 6.9 A sound wave travels toward a door opening. In the figure on the left the soundwavelength is smaller than the door opening. In the figure on the right the wavelength is largerthan the door opening. The large-wavelength sound spreads out beyond the door opening becauseof diffraction. Thus, a listener located at the position of the triangle can hear the large-wavelengthsound
The ability of a wave to bend around a solid object is known as diffraction. Theamount that a wave can bend depends on the ratio of the wavelength to the lengthof the bend. Diffraction also is involved when a sound wave passes through anopening such as a door. Then the amount of bending depends on the ratio of thewavelength of the sound to the width of the door opening. If the wavelength is smallcompared to the opening, then the wave goes straight through and does not bendmuch. Thus short-wavelength (high-frequency) sound behaves somewhat like lightwould behave. By contrast, long-wavelength (low-frequency) sound bends aroundthe door opening, as shown in Fig. 6.9.
6.9 Segregation
We now return briefly to the example that began this chapter—your date and theband. This example illustrates the truly remarkable human capacity to selectivelyattend to individual sound sources. The sounds you want to hear are normallyacoustically mixed in the air together with many other sounds. Moreover, the soundsthat come directly to your ears are mixed with reflections from the surfaces in aroom, creating a still more complicated sound field. As a listener, you sample thissound field with your two ears, and from this mixed up mess you extract the imagesof individual sources, e.g., your date and the band. This human ability is called“source segregation.” It is a very impressive bit of signal processing. Scientists whostudy this aspect of human hearing for a living have yet to create a computer program

64 6 Wave Properties
that can segregate sound sources as well as the human brain. The source segregationproblem is one of the greatest challenges in the field of artificial intelligence, butyou routinely solve the problem without even thinking.
Exercises
Exercise 1, Magic wavelengths, magic frequenciesTwo loudspeakers are connected so that they radiate the same sine tone. You are
3 m away from one loudspeaker and 3.4 m away from the other. (a) Find two valuesof the wavelength for which cancellation occurs. (b) What are the two frequenciesfor which cancellation occurs? (c) Are there more than two different wavelengthsfor which cancellation occurs?
Exercise 2, Total destructionYou are 1 m away from a source of a 1,000-Hz sine tone. (a) Where would you put
a second source, driven by the same 1,000-Hz sine signal, in order to get completecancellation? (b) Does it matter what the amplitudes of the two tones are?
Exercise 3, StereoIn a standard stereo audio system, there are two loudspeakers. The loudspeakers
can be connected wrongly so that they are out of phase. Why is this error moreimportant for low frequencies than for high?
Exercise 4, BeatsYou hear two tones with a beat rate of 5 Hz. One tone has a frequency of 440 Hz.
What are possible frequencies for the other tone?
Exercise 5, The dial tone experimentFig. 6.10 depicts the dial tone experiment. The added tone at 345 Hz has an
amplitude that is somewhat smaller than the amplitude of the dial-tone componentat 350 Hz. Explain why the beats would be stronger if the added tone had the sameamplitude as the component at 350 Hz.
Fig. 6.10 The solid linesshow the amplitude spectrumof the telephone dial tonewith components at 350 and440 Hz. The dashed lineshows a sine tone that can beadded at 345 Hz to causebeats, five per second, toexpose the 350 Hz tone

Exercises 65
a b
Fig. 6.11 Figure for Exercise 10. The input/output relationship of a linear transducer is a straightline. How would you describe this line?
Exercise 6, How smooth is smooth?How smooth does a mirror need to be? Answer this question by working out the
wavelength of light. Remember that the speed of light is 3 � 108 m/s. Recall thatfrequency of visible light is about 6 � 1014 Hz.
Exercise 7, How rough is rough?Imagine a rough stone wall where some stones randomly protrude a few inches.
How does a 100-Hz sound wave reflect from this wall? How about a 10,000-Hzwave? The answers to this exercise illustrate the general principle that a surfaceappears to be rough or smooth depending on the wavelength of the radiation that isused to examine the surface.
Exercise 8, Sound channels by refractionWith a complicated temperature profile, refraction can lead to narrow channels
that trap sound waves. Which profile leads to a channel: (1) a layer of warm airtrapped between layers of cool air, or (2) a layer of cool air trapped between layersof warm air?
Exercise 9, Elective deafnessAlthough it seems like blocking out the loud sounds of our busy and noisy world
would be a good idea, having perfect noise-cancelling headphones would have itsdisadvantages. Explain why you would not want to completely knock out the noiseof everyday life.
Exercise 10, Another linear transducerFigure 4.2 shows the input/output relationship for a linear transducer that
converts pressure waves into electrical waves. Figure 6.11 is similar but different.Explain how the difference in parts (a) of the figures leads to the difference in thevoltage v in parts (b).
�

Chapter 7Standing Waves
The two previous chapters have described wave motion with particular reference totraveling waves. Traveling waves carry energy and information from one point inspace to another. This chapter begins a study of standing waves. Standing wavesturn out to be the modes of vibration of important classes of musical instruments.Accordingly, the chapter quickly moves on to the vibration of guitar strings.
7.1 Standing Waves in General
A traveling wave moves; a standing wave does not. But that does not mean that astanding wave does not change with time. It just changes differently from a travelingwave. The difference between a traveling wave and a standing wave can be seen ina series of snapshots.
Figure 7.1 is a snapshot of a 500-Hz wave. The period of the wave is 2 ms(1,000/500). The wavelength is 344=500 D 0:69m, and you can see that wavelengthin Fig. 7.1 because the horizontal axis is a spatial axis, x.
If this wave is a traveling wave, then it moves rigidly in time. If the wave istraveling from left to right, and we look at it 0.25 ms later (one-eighth of a period),then we find that the wave has moved to the position shown by the dashed line inFig. 7.2.
If this wave is a standing wave and we look at it 0.25 ms later (one-eighth of aperiod), the wave looks like the dashed curve in Fig. 7.3. It has not moved. It hasjust changed its size.
We continue to track the standing wave. If we look at the standing wave afteranother 0.25 ms (total time of t3 D 0:5ms, or one quarter of a period), we find thatthe standing wave is momentarily totally flat, as shown in Fig. 7.4.
After another 0.25 ms (total time of t4 D 0:75ms or three-eighths of a period)we find that the 500-Hz standing wave has come out the other side. It has changedfrom the original solid curve to the dashed curve in Fig. 7.5.
W.M. Hartmann, Principles of Musical Acoustics, Undergraduate Lecture Notesin Physics, DOI 10.1007/978-1-4614-6786-1 7,© Springer Science+Business Media New York 2013
67

68 7 Standing Waves
Fig. 7.1 A snapshot of a wave, taken at time t1. This snapshot serves as the reference for snapshotsto follow
Fig. 7.2 As time goes on, the 500-Hz traveling wave moves from left to right as time increasesfrom t1 to t2
Fig. 7.3 In contrast to the traveling wave, the standing wave does not move
Fig. 7.4 The snapshot of the standing wave taken at time t3 is shown by a dashed line, but thatline is hidden by the x axis
Fig. 7.5 The snapshot of the standing wave taken at time t4 is shown by a dashed line
If we look at the 500-Hz standing wave after another 0.25 ms (total time of t5 D1ms, or one-half of a period), we find that it has changed from the original solidcurve to the dashed curve in Fig. 7.6.
Figure 7.6 shows how standing waves are normally represented, by two snap-shots, one showing a maximum amplitude and the other, taken half a period later,showing a maximum in the other direction.

7.2 Standing Waves on a String 69
Fig. 7.6 The snapshot of the standing wave taken at time t5 is shown by a dashed line. Thedifference in times, t5 � t1 equals half a period, T=2
As time goes on, the standing wave continues to evolve. The graphs of thecontinued motion look just like the graphs 7.2 through 7.6 played in reverse. Forinstance, after 1.25 ms the 500-Hz wave looks like it did at time t4, and at 1.5 ms thewave looks like it did at time t3. After a full period, the wave looks like it did at thebeginning at time t1.
A clear difference between a traveling wave and a standing wave is that witha standing wave there are places in space (values of location x) where there isnever any displacement. No matter how long we wait at one of these places, thereis never any action. Such places are called “nodes.” By contrast, a traveling waveultimately causes every point in space to experience some displacement. If there isno action now at your spot, be patient—the crest of a traveling wave will come byin a millisecond or so.
7.2 Standing Waves on a String
Standing waves don’t just happen for no good reason. If there is a disturbance ina medium, such as a disturbance in the air or on a string, then the disturbance willtravel as a traveling wave. A standing wave is caused by reflections in the system.For instance, if the string is stretched between two boundaries, then there will bereflections of the displacement wave at the boundaries. The key to understandingthe standing wave are the conditions at the boundaries. Mathematicians call these“boundary conditions.”
A guitar string is stretched between the bridge and the nut. A wave on the stringis reflected from both these ends. The boundaries at the bridge and nut are placeswhere the string is not allowed to vibrate. That is the key to the standing waves onthe guitar string (or any other stretched string). The boundary conditions insist thatthere are no displacements at the ends of the string. The standing waves that areallowed to exist must be waves that satisfy those boundary conditions. That meansthat the wavelengths of the allowed vibrations must somehow “fit” onto the string.
The wave below has a wavelength that works. The wavelength is twice the lengthof the string so that half a wave fits perfectly onto the string. If the string is L D65 cm long, then the wavelength is � D 130 cm or � D 1:3m. This is the longestwavelength that will fit on the string. This pattern of vibration of the string is thefirst mode. Because this is the mode with the longest wavelength, this mode has

70 7 Standing Waves
the lowest frequency. The frequency depends on the speed of sound on the string(Fig. 7.7).
Suppose that the speed of sound on the string is vs D 107m/s. Then the frequencyof this mode of vibration is given by
f D vs=� D 107=1:3 D 82:3 Hz: (7.1)
This is the fundamental frequency of the lowest string on a guitar. The note iscalled “E.”
Because the wavelength is twice the length of the string, we can write theformula as
f D f1 D vs=.2L/ (7.2)
The second mode of vibration of the string has a complete wavelength fitting intothe length of the string. A better way to say it is that two half-wavelengths will fit(Fig. 7.8).
The frequency of the second mode of vibration of the string is then
f2 D vs=.L/ D vs=.2L/ � 2 D 107=1:3� 2 D 165Hz: (7.3)
The third mode of vibration has three half-wavelengths fitting into the length ofthe string (Fig. 7.9).
The frequency of the third mode is
f3 D vs=
�2
3L
�D vs=.2L/ � 3 D 107=.1:3/� 3 D 247Hz: (7.4)
Mode 1 has no nodes. Mode 2 has one node. Mode 3 has two nodes. If we wereto continue, mode 4 would have three nodes, etc. (This counting of nodes does not
Fig. 7.7 The first mode of a stretched string gets half a wavelength into the length of the string
Fig. 7.8 The second mode of a stretched string gets a full wavelength into the length of the string

7.3 The Guitar Player’s Equation 71
Fig. 7.9 The third mode of a stretched string gets one and a half wavelengths (three halves) intothe length of the string
count the two fixed ends of the string where there can never be any displacement.)It should be clear that there is no limit to the number of possible modes of vibration.
The different modes of vibration of the guitar string radiate by means of theguitar body. These different modes create the different harmonics of the guitar tone.The first mode creates the fundamental tone or first harmonic. The second mode ofvibration creates the second harmonic, and so on. Each of the harmonic frequenciesis an integer multiple of the fundamental frequency.
Harmonics The paragraph above used the word “harmonic.” The word has beenused before in this book, as in “simple harmonic motion.” However, the paragraphabove gives a second meaning to the word. Two or more components of a tone aresaid to be harmonics if their frequencies are small integer multiples of some basefrequency. For instance, 150, 300, and 450 Hz are all integer multiples of 150 Hz.The integers are 1, 2, and 3, and the frequencies correspond to the first, second, andthird harmonics.
For the stretched string, one can express the frequency of the nth mode(equivalently the nth harmonic) as
fn D vs=.2L/ � n (7.5)
This is a very simple relationship. As we study different musical instrumentsin the chapters that follow, the instruments will have physical modes of vibrationthat correspond to harmonics in the tone of the instrument, but the correspondencebetween modes and harmonics will not always be so simple.
7.3 The Guitar Player’s Equation
To play melody and harmony, the guitar player must play notes with correct fun-damental frequencies. The fundamental frequency of a note, or tone, is determinedby the speed of sound and the length of the string. The speed of sound, in turn,depends on the tension in the string (F ) and the linear mass density (�) of the stringaccording to the equation
vs DsF
�: (7.6)

72 7 Standing Waves
Here, F is the tension measured in Newtons. Recall that Newtons is a metric unitof force, equivalent to about 1/4 pound in the English system of units. Linear massdensity � is the mass per unit length of the string. It is measured in kilograms permeter (kg/m).
Putting the information from Eqs. (7.2) and (7.6) together gives the guitarplayer’s equation for the fundamental frequency of a tone,
f1 D 1
2L
sF
�: (7.7)
Thus, three different string properties go into making the pitch of the guitar tone:length (L), tension (F ), and linear density (�).
7.4 The Stretched String: Some Observations
Modes: Really? The discussion of standing waves on a string made frequent use ofthe word “mode.” This is not the first time you have seen this word. This word wasintroduced in Chap. 3 to describe a natural pattern of vibration of a physical system.Is it correct to use this word again to describe the standing wave? Absolutely—it iscorrect. The modes of vibration of a stretched string are standing waves. Recall thatthe requirements for a mode are that there be (1) a specific frequency, (2) a specificshape, and (3) an amplitude that can be determined by the user. You should be ableto see how our definition of standing waves on the stretched string fulfills all thoserequirements.
The Musical Significance of the Stretched String: Harmonics Think about allthe things there are in the world that you could bang on or blow on or otherwisecause to vibrate. Now think about the physical systems that are actually used inmaking music. Only small fraction of the possible things in the world make usefulmusical instruments, and the stretched string is one of them. The stretched stringdominates our orchestras because of the violin family (includes violin, viola, cello,and bass viol) and it dominates our rock groups because of guitars. It is also theacoustical basis of the piano. This is really rather strange. The stretched stringseems like an unlikely candidate for a musical instrument. It makes a very poorradiator. It has so little vibrating surface area that one always needs a sound boardor amplification of some kind to make it at all useful musically.
There must be a reason why this one physical system, out of all the possibilities,is so dominant. The reason is that the modes of vibration have frequencies that areall integer multiples of a fundamental frequency. The second mode has a frequencythat is twice the frequency of the first mode. The third mode has a frequency that isthree times the frequency of the first mode, and so on. Because of this useful factabout the frequencies of the modes, the stretched string can create tones consistingof vibrating components that are harmonic. These components of a tone are sinewaves and they are called “partials” because the entire tone is made up of many sine

Exercises 73
waves. Each sine component is only “part” of the entire wave. The partials of a tonemade by a stretched string are harmonic because of the integer relationship betweenthe frequencies of the partials. We can rewrite Eq. (7.5) to emphasize that fact,
fn D nf1: (7.8)
This is an equation that is just about the frequencies of the modes, and ultimatelyabout the frequencies of the partials. Most other physical systems have modes withfrequencies that do not obey this special harmonic law.
Idealization and Reality When you pluck a guitar string your thumb pulls thestring to the side and releases it. There is a restoring force that then causes the stringto move toward equilibrium. The restoring force is responsible for the vibration ofthe string. Most of the restoring force is caused by the tension in the string. However,some of the restoring force comes from the stiffness of the string. To understandstiffness, imagine that the guitar string is not on the guitar but is lying loose on thetable. There is no tension and yet if you try to kink the string tightly you encountersome resistance. The resistance is stiffness. This stiffness also contributes to theresistance to displacement when the string is stretched on the guitar in the usual way.
Our treatment of the stretched string, and the harmonic law concerning the modefrequencies, is based on the assumption that all of the force on the string comes fromtension and none of it comes from stiffness. In other words, it is an idealization ofthe real string. Look at Eq. (7.7). There you see the importance of tension (F ) butthere is nothing about stiffness. When we discuss about string instruments later inthis book, we will deal with real strings. As we will see at the time, what looks likea potential problem turns into a benefit.
Exercises
Exercise 1, High mode numberDraw the standing wave corresponding to the sixth mode of string vibration. How
many nodes are there? (Don’t count the two fixed ends of the string.)
Exercise 2, The A stringIf the speed of sound on a string is 154 m/s, and the string length is 70 cm, what is
the frequency of the first (or fundamental) mode of vibration? What is the frequencyof the third harmonic?
Exercise 3, The guitar player’s equationExplain how the three parameters, �, F , and L, are used in building, tuning, and
playing a guitar.
Exercise 4, Standing and travelingExplain how standing waves and traveling waves change with time. How are they
different?

74 7 Standing Waves
Exercise 5, How to play the guitarTo play different notes, a guitar player presses fingers down on the string to
make it shorter. What is called an “open string” occurs when the player does notpress down with a finger but uses the full string length (as the instrument wasmanufactured). The open E string has fundamental frequency of 82 Hz. Supposeit is 70 cm long. How short must the string be to play the note called “A” with afrequency of 110 Hz?
Exercise 6, A tale of two stringsThe lowest fundamental frequency on a guitar is 82 Hz—the open E string. The
top string on a guitar is also an E string. The open top string sounds the E twooctaves higher. How much faster is the speed of sound on the top E string comparedto the lowest string? Recall that going up by one octave corresponds to a doublingof the frequency.
Exercise 7, Bending notesBending an note means to change its frequency slightly in a slow and continuous
way for musical effect. To play the blues you have to bend notes. How does a rockguitar player bend notes? What is the physical principle involved?
Exercise 8, The effect of tensionA guitar string has a fundamental frequency of 100 Hz. What does the frequency
become if the tension in the string is doubled?
Exercise 9, More unit analysisChapter 5 introduced unit analysis with some simple examples. You might like
to try unit analysis on a not-simple example such as Eq. (7.6) for the speed of soundon a string, vs , given in meters per second.
vs DsF
�:
The denominator is the linear mass density, and its units are kilograms per meteror (kg/m). The numerator is a force with units of Newtons, but that is not veryhelpful. The key to the units of force is Newton’s second law, which says that forceis equal to mass multiplied by an acceleration. Mass has units of kg, and accelerationhas units of m/[(s)(s)]. Therefore, a Newton of force corresponds to kg m/[(s)(s)].Show that the units on the right-hand side of this equation are m/s as expected. Don’tforget to take the square root of the units. Note that a unit such as m=Œ.s/.s/� wouldnormally be written as m=s2.
Exercise 10, Role of the guitar bodyFrom the guitar player’s equation, Eq. (7.7), it looks as though the frequency of
a guitar note, and hence its pitch is entirely determined by the vibrating string andis not related in any way to the body of the guitar. Can that possibly be right?
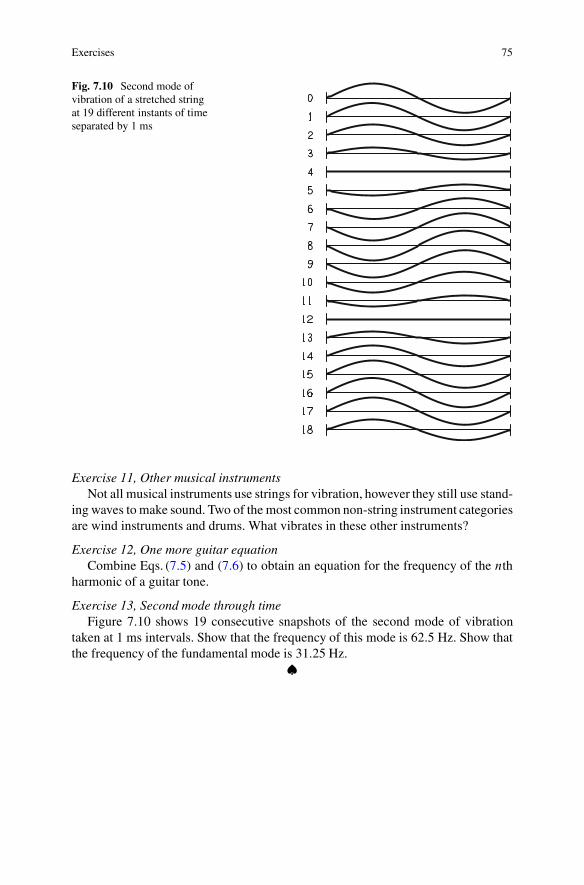
Exercises 75
Fig. 7.10 Second mode ofvibration of a stretched stringat 19 different instants of timeseparated by 1 ms
Exercise 11, Other musical instrumentsNot all musical instruments use strings for vibration, however they still use stand-
ing waves to make sound. Two of the most common non-string instrument categoriesare wind instruments and drums. What vibrates in these other instruments?
Exercise 12, One more guitar equationCombine Eqs. (7.5) and (7.6) to obtain an equation for the frequency of the nth
harmonic of a guitar tone.
Exercise 13, Second mode through timeFigure 7.10 shows 19 consecutive snapshots of the second mode of vibration
taken at 1 ms intervals. Show that the frequency of this mode is 62.5 Hz. Show thatthe frequency of the fundamental mode is 31.25 Hz.
�

Chapter 8Standing Waves in Pipes
8.1 Pipe with Both Ends Open
A cylindrical pipe (a flute, a marimba resonator, an automobile exhaust pipe) filledwith ordinary air is a system that shows standing waves. If both ends of the pipe areopen, the boundary conditions insist that the pressure at the open end is zero. Zeromeans that it is not overpressure (positive); it is not underpressure (negative); it isordinary atmospheric pressure (zero).
A snapshot of the first mode of vibration looks like Fig. 8.1.Here the solid curve is a snapshot taken at a time when air has rushed in from the
two ends and piled up in the middle of the pipe creating a pressure maximum there.The dashed curve is a snapshot taken half a cycle later when the air has rushed outof the open ends and created a partial vacuum in the middle of the pipe.
A snapshot of the second mode of vibration looks like Fig. 8.2.It should be clear that in this mode, the air is sloshing from one side of the pipe
to the other, like the water in a bathtub. The solid line shows the pressure sloshed tothe left side with a pressure valley on the right. Half a cycle later (dashed line) thepressure has sloshed to the right side.
The graphs of the modes of air in a cylindrical pipe are just the same as thegraphs of the modes of a vibrating string. The physical systems are different, butthe mathematical analysis is the same. If you know about the string there is almostnothing more to learn.
Just as in the case of the stretched string, the modes have wavelengths givenby the equation �n D 2L=n where n is an integer indicating the mode number.Therefore the frequencies are given by the formula
fn D Œv=.2L/�n (8.1)
The only new thing to learn is that when dealing with the vibrations of air in apipe, you must use the speed of sound in air for v. For the vibrations of a string youmust use the speed of a transverse vibration wave on the string.
W.M. Hartmann, Principles of Musical Acoustics, Undergraduate Lecture Notesin Physics, DOI 10.1007/978-1-4614-6786-1 8,© Springer Science+Business Media New York 2013
77

78 8 Standing Waves in Pipes
Fig. 8.1 Open–open pipe. The first mode has no nodes as we count them
Fig. 8.2 Open–open pipe. The second mode has one node
Example:If a cylindrical pipe is 90 cm long and open at both ends, then what is the frequencyof the third mode of vibration?
Answer:
f3 D v=.2L/ � 3 D 344=.2� 0:9/ � 3 D 573 Hz: (8.2)
8.2 Pipe with One End Open and One End Closed
Closing off one end of a pipe changes the physical system dramatically. The firstmode in an open–closed pipe looks like Fig. 8.3. There is a pressure maximum atthe closed end of a pipe as the air rushes in and jams against this closed end. Halfa cycle later there is a pressure minimum at the closed end. Hence, the boundarycondition for a standing wave at the closed end is an antinode. At the open end theboundary condition is zero pressure as usual.
The second mode looks like Fig. 8.4.The third mode of vibration looks like Fig. 8.5.There is an evident pattern. In the first mode one-quarter wavelength fits into the
length of the pipe. In the second mode three-quarters of a wavelength fit. In the thirdmode five-quarters fit, and so on.
In connection with the frequencies f1, f2, and f3; . . . , of modes 1, 2 and 3,. . . , symbol v again represents the speed of sound in air. The frequency f1 for theopen–closed pipe is v=.4L/ and this can be compared with the frequency for theopen–open pipe, namely, f1 D v=.2L/.

8.3 Playing a Pipe 79
Fig. 8.3 Open–closed pipe. The first mode has only 1/4 wavelength in the pipe
Fig. 8.4 Open–closed pipe. The second mode has a single node, 3/4 wavelength
Fig. 8.5 Open–closed pipe. The third mode has 5/4 wavelengths in the pipe
Harmonics Again The modes of vibration of air in pipes have frequencies thatare in a harmonic relationship. Therefore, used as musical instruments, pipes createtones with harmonic components. The pipe that is open at one end and closed at theother illustrates the warning given in Chap. 7 about more complicated relationshipsbetween modes and harmonics. Here, the first mode creates the first harmonic, thesecond mode creates the third harmonic, the third mode creates the fifth harmonic,and so on, all-odd numbered harmonics.
8.3 Playing a Pipe
If you blow across the open end of a pipe you can produce a tone. (Players of panpipes are expert at this.) The tone occurs because blowing across the pipe excites themodes of vibration of the air in the pipe. More or less, all of the modes are excitedat once, though it is usually the mode with the lowest frequency that is excited themost. Therefore, more or less all the modal frequencies are present in the tone at thesame time. The pitch of the tone (what musicians call the “note”) is normally givenby the frequency of the lowest mode. This rule about pitch holds good both for pipesthat are open at both ends and for pipes that are open at one end and closed at theother.

80 8 Standing Waves in Pipes
Shock exciting the modes of a pipe, by banging the open end of a pipe intoyour palm, also excites all the modes. Again, all the different mode frequencies arepresent simultaneously, though the lowest frequency modes dominate.
8.4 Thinking Critically
There is something rather strange about what this chapter has said about standingwaves in pipes. It is actually worse than strange, and you ought to be questioning it.
This chapter related the frequencies of standing waves to the length of pipes, butnothing was ever said about the diameter of the pipes. Imagine a pipe that is 90 cmlong and 1 km in diameter. How would this pipe be any different from open air in thegreat outdoors? One can’t imagine that such a system would have standing waveslike those shown in the figures above. And why doesn’t the diameter appear in theequations for the frequencies of the standing waves? How does this make any sense?
These are good questions. In fact, the treatment of the modes in a pipe makes theassumption that the pipe diameter is small compared to the length. Such a pipe iscalled “thin.” The fact that the diameter is small means that the pipe appears to bea one-dimensional system and the only dimension of interest is the length. That iswhy the length is the only dimension that appears in the equations.
If the diameter of the pipe is not much smaller than the length, then the picturedescribed in this chapter does not apply. If the diameter is much smaller than thelength, but not very much smaller, then the picture described in this chapter isa decent approximation to reality, and it can be improved by including open-endcorrections, as described below.
8.5 Open-End Corrections
Our treatment of an open end of a pipe has not been exactly correct. We haveassumed that the pressure goes to zero (equivalent to the outside atmosphericpressure) right at the open end of the pipe. In fact, the pressure wave extends alittle bit beyond the end of the pipe. The point of zero pressure actually occursslightly outside the pipe. The amount by which the pressure wave extends beyondthe open end of the pipe depends on the pipe diameter. Therefore, for the purposeof calculating the resonant frequencies of a pipe with one or two open ends, theeffective pipe length is longer than the measured pipe length. The measured pipelength should be increased by the end correction to find the effective pipe length. Inequation form, ifL is the measured length of the pipe andLend is the end correction,then the effective length of the pipe is given by
Leffect ive D LC Lend (8.3)

8.5 Open-End Corrections 81
Fig. 8.6 Because the standing wave in a pipe extends beyond the ends of the pipe, the effectivepipe length Leffective is longer than the measured length L. The difference is the end correction.For a pipe like this one with two open ends, the end correction must be added twice to obtain theeffective length
The end correction is equal to 0.61 times the radius of the pipe (0.305 times thediameter) for one open end. If both ends are open the end correction is twice as large(Fig. 8.6).
Example:A pipe is 1 m long and open at both ends. Its diameter is 5 cm (0.05 m).
What is the lowest resonant frequency of the pipe?
Answer:The lowest resonant frequency is given by v=.2Leffective/.The effective length of the pipe is Leffective D 1 C 0:05 � 0:305 � 2 or
1.0305 m. Therefore, the lowest resonant frequency is
f D v=.2Leffective/ D 344=.2 � 1:0305/ D 167 Hz: (8.4)
Note that without the end correction we would have calculated a frequencyof 172 Hz. [v=.2L/ D 344=2 D 172]. The difference is significant.
Making a pan fluteThe goal of this example is to construct a pan flute that plays the tones of
a major scale starting on middle C and ending an octave higher. Such a scalehas eight notes, called C, D, E, F, G, A, B and C, and so the pan flute will bemade from eight tubes. They will be closed at one end.
From Appendix E we learn that middle C (called C4) has a fundamentalfrequency of 261.6 Hz. To make the other notes, we choose an equal-temperedscale. Therefore, all the fundamental frequencies are given by the equation
fm D 261:6 � 2m=12

82 8 Standing Waves in Pipes
Fig. 8.7 A pan flute (pan pipe) that plays an equal-tempered major scale using pipes thatare closed at one end. Except for the small end correction, the tube lengths decrease expo-nentially for tones of increasing frequency
where m is the number of semitones, m D 0; 2; 4; 5; 7; 9; 11; 12. Notice thatm D 0 produces middle C andm D 12 produces a C that is an octave higher.This equation, together with the values of m leads to the eight fundamentalfrequencies of the scale. Each of the notes of the scale will have a set of oddharmonics that will occur naturally without any effort on our part.
To make the flute, we will use lengths of tube with an inside diameter of1 cm (10 mm). The diameter determines the end correction. To find out thelengths of the tubes, we use the formula for a pipe open at only one end,including the end correction,
fm D v=Œ4.Lm CLend /�;
where Lm is the length of the tube that we have to cut.To find that length, we can combine the two equations and solve for Lm,
Lm D v=.4 � 261:6 � 2m=12/�Lendor
Lm D 344000=.1046� 2m=12/ � 3;
where Lm is the tube length in mm, 344000 is the speed of sound in mm/s,and 3 mm is the end correction for a tube with an inside diameter of 10 mm.
The last equation leads to tube lengths of 326, 290, 258, 243, 216, 192,171, and 161 mm, as shown in Figure 8.7.

Exercises 83
Exercises
Exercise 1, 1-ft pipe
(a) You have a pipe, 1 ft long and open at both ends. What frequency do you hearif you blow across this pipe? (Note: Use the fact that the speed of sound isv D 1130 ft/s. You may ignore the end correction for this part and the otherparts of this exercise.)
(b) You close off one end of the pipe and blow across the open end again. Showthat the fundamental frequency is an octave lower than in part (a) where bothends were open. (Recall the definition of an “octave:” Frequency fa is an octavehigher than frequency fb if fa is twice fb , i.e., fa D 2fb. Then fb is an octavelower than fa.
(c) Explain why the open–closed pipe makes a tone with only odd harmonics (1, 3,5, . . . ) whereas an open–open pipe makes a tone with all the harmonics (1, 2,3, . . . )
Exercise 2, Nodes and modesFind the mathematical relationship between the number of nodes for the standing
waves in an open–closed pipe and the mode number. Compare with the relationshipfor an open–open pipe. (Don’t count the points of zero pressure that occur at openends.)
Exercise 3, Open–closed pipeDraw the standing wave for the fourth mode of an open–closed pipe. How many
nodes does it have? (Don’t count the point of zero pressure at the open end.) Whatis a mathematical expression for the frequency?
Exercise 4, Open–open pipeDraw the standing wave for the fourth mode of an open–open pipe. How many
nodes does it have? What is a mathematical expression for the frequency?
Exercise 5, The end correctionIn what way does the end correction depend on the ratio of the pipe diameter to
the pipe length? Does the end correction tend to zero if the pipe diameter becomessmaller and smaller? Does the end correction tend to zero if the pipe length becomeslonger and longer?
Exercise 6, Pipes of PanPan pipes are cylindrical tubes in an array. Blowing across a tube produces a
tone with frequencies corresponding to the expected modes. The tubes are stackedin pairs, with one tube open–open and the other open–closed. Blowing across thepair of tubes creates two tones, with fundamental frequencies that are an octaveapart. The two tubes of a pair are almost the same length, but not quite. Whichof the two should be slightly longer? [Hint: Remember that the end correction isapplied to open ends only.]
Exercise 7, The organ pipe is too long!

84 8 Standing Waves in Pipes
According to Appendix C, a massive pipe organ has a pipe that sounds afrequency of 16 Hz. That is the fundamental frequency of the lowest note. (a) Showthat the formula f1 D v=.2L/ implies that this pipe needs to be 10.75 m long. (b)Show that this length is more than 35 ft. (c) Unfortunately, you are confronted withan installation where the vertical space available for the pipe organ is only 30 ft.What can you do to solve this problem? (d) What do you sacrifice with this solution?
Exercise 8, Boston Symphony HallThe front of the famous Boston Symphony Hall features 48 exposed organ pipes,
and 33 of them appear to have the same length! How can the designer make organpipes that look that way and still have the pipes play different notes?
Exercise 9, How to make the pipe more complicatedThe mode frequencies for a stretched string depend on the string length, the mass
density, and the tension. By contrast, the mode frequencies for air in a pipe dependonly on the pipe length—much less complicated. What could be done to make theacoustics of a pipe seem more analogous to the acoustics of a string?
Exercise 10, Popping a pipeImagine that you have a piece of thin plumbing pipe, about 25 cm (10 in.) long
and open at both ends. You can make a tonal sound by striking an open end on yourpalm (first remove burrs from the end of the pipe). Alternatively you could put afinger into the pipe and pop it out like a cork. Both methods shock excite the modesof the pipe. Do you expect that both methods lead to the same pitch?
Exercise 11, The clarinetThe clarinet is a woodwind instrument with a cylindrical bore about 60 cm long.
When all the tone holes are closed, it resembles an open–closed pipe. Calculatethe lowest frequency for the clarinet. Compare with the lowest frequency given inAppendix C.
Exercise 12, Percussive bassYou want to make a bass musical instrument from PVC pipe. The pipe should
produce the musical note C2 with a frequency of 65.4 Hz when you slap an endwith a wet sponge. You have PVC pipe with an inside diameter of 1.5 in. How longshould you cut the pipe? Remember the end correction for the (only one) open end.
Exercise 13, Slide whistleThe slide whistle is made from a cylindrical tube that is closed at one end by a
stopper. The stopper can be retracted to make the tube longer. When the stopper isfully retracted, the inside length is 287 mm. The rod that retracts the stopper has atotal travel distance of 232 mm. (a) Show that the lower and upper frequencies areabout 300 and 1,560 Hz. (b) The manufacturer claims that the range of the whistleis more than two octaves. Do you agree?
�

Chapter 9Fourier Analysis and Synthesis
The concepts of Fourier analysis and synthesis come from an amazingly powerfultheorem by mathematician J.B.J. Fourier (1768–1830). Fourier’s theorem states thatany waveform is just a sum of sine waves. This statement has two implications,Fourier synthesis and Fourier analysis.
Fourier synthesis is something that you already know about from your study ofvibrations and waves. You already know that a complicated vibration can be createdby adding up simple harmonic motions of various frequencies. You already knowthat a complex wave can be synthesized by adding up sine waves. Fourier’s theoremsays that by adding up sine waves you can create any waveform your heart desires,any waveform at all.
The opposite of synthesis is analysis. In Fourier analysis one begins with acomplex wave and discovers what the sine waves are that make it. Just as achemist analyzes a material to discover how much of what elements are present, theacoustician analyzes a complex tone to discover how much of what sine frequenciesare present. Fourier’s theorem also says that any complex wave can be analyzed inonly one way. There is only one set of sine wave frequencies, amplitudes, and phasesthat can come out of the analysis. For that reason, we can make a better statementof the theorem, “Any waveform is a unique sum of sine waves.”
To summarize: In Fourier synthesis one begins with an amplitude spectrum andphase spectrum and uses those two spectra to generate a complex wave. The spectraare functions of frequency. The complex wave is a function of time.
In Fourier analysis one begins with a complex wave that is a function of time.The results of the analysis are amplitude and phase spectra, and these spectra arefunctions of frequency.
The following examples give (1) an equation for a wave (or signal), (2) a graphof the wave as a function of time, and (3) graphs showing the amplitude and phasespectra.
W.M. Hartmann, Principles of Musical Acoustics, Undergraduate Lecture Notesin Physics, DOI 10.1007/978-1-4614-6786-1 9,© Springer Science+Business Media New York 2013
85

86 9 Fourier Analysis and Synthesis
Fig. 9.1 A sine wave has the simplest possible spectrum
Fig. 9.2 Another sine wave. This one starts at a peak because of the 90-degree phase
9.1 The Sine Wave
The simplest wave has a single component. That makes it a pure sine wave. A sinesignal with an amplitude of 60 units, a frequency of 1,000 Hz, and and a phase ofzero shown in Fig. 9.1 and is given by the equation
Signal D 60 sin.360 � 1000 t C 0/: (9.1)

9.3 Periodicity 87
A variation on the 1,000-Hz signal is a sine signal with an amplitude of 40 units,and a phase of 90ı, as shown in Fig. 9.2. It is given by
Signal D 40 sin.360 � 1000 t C 90/: (9.2)
9.2 Complex Waves
We next consider a complex wave with two components. There is a fundamentalcomponent with a frequency of 200 Hz and an amplitude of 45 units. There is athird harmonic with a frequency of 600 Hz and an amplitude of 15 units. (You maywish to revisit the definition of harmonics in Chap. 7.) Both components have zerophase. Please notice the positions of all those numbers, 200, 600, 45, 15, 0, and0, in Eq. (9.3) below. You can consider this equation to be a model mathematicaldescription for all complex waves.
Signal D 45 sin.360 � 200 t C 0/C 15 sin.360 � 600 t C 0/: (9.3)
Phase plays a role in shaping the final waveform. Consider what happens if thephase of the third harmonic is changed to 90ı as in Fig. 9.4:
Signal D 45 sin.360 � 200 t C 0/C 15 sin.360 � 600 t C 90/: (9.4)
Comparing the two final waveforms in Figs. 9.3 and 9.4 makes it clear that bychanging the relative phase of the first and third harmonics we have changed theshape of the waveform. Curiously, this phase change does not change the soundof this wave. A law called “Ohm’s law of phases” says that human listeners areinsensitive to phase changes. For a signal with two low-numbered harmonics, likethe first and third harmonics of 200 Hz, the law holds good. More about Ohm’s lawappears below in a discussion of the sound of periodic waves.
9.3 Periodicity
The periodicity of the complex wave with components at 200 and 600 Hz is1/200 s. That’s because after 1/200 s (5 ms) the 200-Hz component has gone throughexactly one cycle, and the 600-Hz component has gone through exactly three. Bothcomponents are then ready to start over again. That’s the basis of periodicity. Thecomponent at 200 Hz is the lowest frequency component. It also happens to be thefundamental. The component at 600 Hz is the third harmonic.
But sometimes the assignment of periodicity, fundamental, and harmonic num-bers is not so simple. Think about a complex wave that has components at 400,600, and 800 Hz, as shown in Fig. 9.5. After 1/400 s (2.5 ms) the 400-Hz component

88 9 Fourier Analysis and Synthesis
Fig. 9.3 A complex wave with two components. The two components can be seen in the amplitudeand phase plots on the right. The figure on the left shows the first harmonic or fundamental(200 Hz), the third harmonic (600 Hz), and the final signal waveform. The final signal is madeby summing the fundamental component and the third-harmonic component
Fig. 9.4 A complex wave that is the same as in Fig. 9.3, except for the phase of the third harmonic.This phase change causes a change in the waveform but causes no change in the sound of the wave

9.4 The Sawtooth 89
a
b
Fig. 9.5 Part (a) shows a complex tone with three sine components, 400, 600, and 800 Hz. Thecomponent amplitudes decrease with increasing frequency, as shown in the spectrum on the right,and all components have zero phase. There is a missing fundamental, with frequency of 200 Hz.The period is 1/(200 Hz) or 5 ms. Part (b) shows an inharmonic tone with three sine componentshaving frequencies of 400, 620, and 800 Hz. The amplitudes and phases are the same as in part(a), but the frequency of the third harmonic is increased from 600 to 620 Hz, as shown by thelittle circles and dashed lines in the spectra. Although part (b) starts out looking like part (a), noperiodicity can be seen in part (b)
has gone through one cycle and the 800-Hz component has gone through two butthe 600-Hz component has gone through 1.5 cycles. This is not an integer numberof cycles and this component is not ready to start over again. The period of thiscomplex wave is, in fact, 1/200 s, as can be seen in Fig. 9.5a. The fundamentalfrequency is 200 Hz. It just happens that there is no power at 200 Hz. Thefundamental is missing. What is present are harmonics 2, 3, and 4.
To find the fundamental frequency f0 (and the period T D 1=f0) when you aregiven a set of components like 400, 600, and 800 Hz, you find the largest commondivisor. The largest number that divides into these three frequencies an integernumber of times is 200. That makes 200 Hz the fundamental. Of course, the number100 will divide into those three frequencies too, but 100 is not the largest number.
9.4 The Sawtooth
You will remember the sawtooth wave from the discussion of the oscilloscope. It is afunction of time, and on the basis of Fourier’s theorem we expect that we can createit by adding up sine wave components. Furthermore, the sawtooth is a periodic

90 9 Fourier Analysis and Synthesis
waveform, and so we expect that the sine wave components will be harmonics.If the period is 0.0025 s (2.5 ms) we expect the components to be harmonics of a400-Hz fundamental. Figure 9.6 shows an approximation to a sawtooth. It is anapproximation because only the first 12 harmonics are included, 400, 800, 1,200,. . . , 4,800 Hz. All the other harmonics have been omitted. It is simple to describethe amplitude spectrum of the sawtooth. The fundamental has an amplitude of 1,the second harmonic has amplitude 1/2, the third harmonic has amplitude of 1/3,and so on. The phase spectrum is even easier. All harmonics have a phase of 180ı.Therefore, the waveform is described by an equation that begins,
Signal D 1: sin.360�400 tC180/C1
2sin.360�800 tC180/C1
3sin.360�1200 tC180/C: : :
(9.5)
An exercise at the end of the chapter asks you to extend this equation.
9.5 The Sounds
This chapter has described three kinds of periodic signals. How do they sound?
The 1,000-Hz sine: Figures 9.1 and 9.2 showed 1,000-Hz sine tones with differentstarting phases. The starting phase affects the sound for only an instant and cannotpossibly matter in the long run. A frequency of 1,000 Hz is somewhat piercing and
Fig. 9.6 A sawtooth with a 2.5-ms period can be approximated by adding up the first 12 harmonicsof a 400-Hz fundamental

9.5 The Sounds 91
unpleasant (3,000 Hz would be worse). A 100-Hz sine tone has a “dull” tone color.The fact that this simple sine waveshape, with only a single component, can have atone color that spans the range from dull to piercing tells you that the color of a tonedepends more on the frequencies that are present in that tone than on the shape ofthe waveform.
The two-component complex, 200 plus 600 Hz: Figures 9.3 and 9.4 showedcomplex tones consisting of a fundamental component (harmonic number 1) anda third harmonic having one-third the amplitude. If you listen carefully, you canhear both harmonics separately. That is not the usual situation. Usually one doesnot hear the individual harmonics of a complex periodic tone, but then a typicalcomplex tone has many harmonics, not just two. If one starts with the complex tonehaving harmonics 1 and 3 and then adds harmonics 2 and 4, it is no longer possibleto hear the first and third harmonics separately. Instead one hears a single tone witha complex tone color.
If one starts with harmonics 1 and 3, as before, and adds harmonics 5, 7, 9, 11,etc., then once again the third harmonic tends to disappear in the crowd. A listenernormally hears only a single tone. Odd harmonics like this are the basis of the squarewave and triangle wave, waveforms that come out of typical function generators(recall from the end of Chap. 4).
For a typical complex tone, the fundamental frequency (reciprocal of the period)determines the pitch, and the amplitudes of the components determine the tone coloror steady-state timbre of the tone. High-frequency harmonics with large amplitudeslead to a bright tone color.
Ohm’s Law For periodic tones having fundamental frequencies of 100 Hz orgreater and having only a dozen low-numbered harmonics, Ohm’s law of phaseinsensitivity holds well. Ohm’s law fails when there are systematic changes amonghigh harmonics that are close together. For instance, the tone color of a waveformmade from harmonics 20, 21, 22, 23 (and no others) can depend on whether theharmonics all have the same phase or whether they have random phases. Thesekinds of signals do not occur in nature. They can be constructed electronically forexperiments in psychoacoustics. Despite failures with such specially constructedsignals, Ohm’s “law” holds rather well for naturally occurring signals such as thetones of musical instruments. The human ear is insensitive to the relative phasesamong the harmonics. By contrast, changes in the amplitude spectrum make a bigdifference in the sound of a tone. As a result, the phase spectrum of complex tonesis not treated with the same respect as the amplitude spectrum. Most of the time weignore the phase spectrum.
Phase-scrambled sawtooth The 400-Hz sawtooth waveform in Fig. 9.6 has a pitchof 400 Hz and a bright tone color. It could serve as the starting point for thesynthesis of a trumpet tone or violin tone. We can use the sawtooth waveformto illustrate Ohm’s law. Figure 9.7 shows a waveform having the same amplitudespectrum as the sawtooth in Fig. 9.6. However, the phases of the harmonics havebeen chosen randomly from the full range, 0–360ı. Obviously the waveform looks

92 9 Fourier Analysis and Synthesis
Fig. 9.7 A 400-Hz signal with 12 harmonics having the same amplitudes as the sawtooth inFig. 9.6. However, the phases are all different from sawtooth phases
entirely different, though the period is still the same. All that is no surprise. What issurprising is that this waveform sounds just like the sawtooth waveform. Ohm’s lawholds well in this case.
9.6 Harmonic and Inharmonic Spectra, Periodicand Aperiodic Tones
Harmonic: Periodic A tone made out of sine waves having frequencies of 200,400, 600, and 800 Hz has harmonic components. These sine components (also calledpartials) are all harmonics of 200 Hz. Because the partials are harmonic, the tone isperiodic. Its period is 1/200 s and the pitch is 200 Hz, or very nearly 200 Hz.
A tone made out of sine waves having frequencies of 400, 600, and 800 Hz (seeFig. 9.5a) also has harmonic components. These components are all harmonics of200 Hz, but the fundamental (200 Hz) is not present in the spectrum. The tone has aperiod of 1/200 s and the pitch is very close to 200 Hz.
Inharmonic: Aperiodic If the partials of a tone are not simple integer multiplesof a fundamental, then the partials are inharmonic and the tone is aperiodic.For instance, the tone with components 400, 620, and 800 Hz has inharmoniccomponents and the tone is not periodic. Figure 9.5b shows the waveform evolvingin a complicated way. No two “cycles” are the same. The waveform does not seemto repeat itself.

9.6 Harmonic and Inharmonic Spectra, Periodic and Aperiodic Tones 93
But hang on a minute! Maybe this tone is periodic after all. We could say thatthere is a fundamental frequency of 20 Hz and the components are the 20th, 31st,and 40th harmonics of 20 Hz. [400/20 = 20; 630/20 = 31; 800/20 = 40.] The periodis 1/20 s, and we might expect a pitch of 20 Hz.
In strict mathematical terms there is nothing wrong with the argument in theparagraph above, and yet the prediction about the pitch is quite wrong. That problempoints up the fact that what we choose to call harmonic and periodic is determinedby our auditory perceptions. Harmonic numbers 2, 3, and 4 are numbers that aresmall enough and close enough together that the tone with components at 400, 600,and 800 can be considered periodic. Harmonics 20, 31, and 40 are so large and sofar apart that we do not perceive the complex consisting of 400, 620, and 800 asa single tone, and we do not treat it as a single periodic entity. More about thisimportant feature of the human auditory system will appear in Chap. 13 on pitchperception.
The Tuning Fork Again Recall the discussion of the tuning fork in Chap. 3. Therewe added up two sine components with frequencies of 256 and 1,997 Hz. Theprocess was just the same as adding up the components of 200 Hz and 600 Hz inFigs. 9.3 and 9.4. But there is one big difference. The mode frequencies of thetuning fork were not harmonics. Therefore, the final wave for the tuning fork inFig. 3.4c was not periodic. Because these components were not harmonics, therewas no reason to be concerned about the phases of the harmonics, and the spectrumin Fig. 3.6 showed only the amplitudes. When two components are not harmonics,their relative phase varies continuously. By contrast, the harmonics of a periodictone are locked together. Their relative phases determine the shape of the waveform,and there may be some reason to be interested in the phase spectrum.
9.7 Filters
Possibly you have been asking yourself, “What’s the point of this Fourieranalysis?” “What does it matter if a waveform like a sawtooth or whatevercan be analyzed into components of different frequencies, or synthesized byadding up sine tones with those frequencies?” Ultimately, the answer to thesequestions is filtering. A filter passes some things and rejects other things. Forinstance, a filter in a coffee maker passes coffee and rejects coffee grounds.A filter in acoustics or electronics passes certain frequencies and tends toreject other frequencies. Filtering of some sort can be found everywhere inacoustics, including the human auditory system. Because filtering is selectiveof frequency, the frequency representation made possible by Fourier analysisis crucial. The fact that filters operate in the domain of frequency is the reasonthat the concepts of Fourier analysis and synthesis are so important.
From your study of vibrations you have learned about resonance. Systemswith natural frequencies of vibration serve as filters in that they respondstrongly to only certain frequencies. If a complicated waveform is impressedupon such a system, the system will select out mainly those frequencies

94 9 Fourier Analysis and Synthesis
that are its natural frequencies. Filters are particularly evident in audio orelectronics. There are lowpass filters that pass only low frequencies and high-pass filters that pass only high frequencies. There are bandpass filters thatact like resonant devices (resonators) because they pass only frequencies in aband near the resonant frequency.
All the World’s a Lowpass Filter The consequences of Fourier’s theoremare not limited to acoustics. The relationship between waveforms and fre-quency has enormous commercial and political consequences. The fact is,everything in the world is a lowpass filter in the sense that there is some upperlimit to the frequency to which it will respond. In communication systems,the lowpass character limits the bandwidth, and this places a limitation on therate at which information can be transmitted.
Figure 9.8a shows a data stream consisting of seven bits—ones or zeros.This data stream actually represents the capital letter “Y.” It is shown here,transmitted at a rate of 10,000,000 bits per second, so that each bit lasts for0.1�s, which is 100 ns.
a
b
c
Fig. 9.8 (a) A computer code (ASCII) for the letter “Y.” (b) The computer signal from (a)after it is passed through a channel with a bandwidth of only 0.8 MHz. (c) The computersignal from (a) after it is passed through a channel with a bandwidth of 4.0 MHz
Suppose we try to transmit this signal through a communications channelwith a bandwidth of only 800 KHz (0.8 MHz). This channel will not pass thehigh frequencies needed to make a clean signal, and the received signal willlook like Fig. 9.8b. It is very likely to be unreadable at the receiving end,and data are lost. In order to transmit information reliably in such a channelwe need to slow down the transmission rate so that the frequencies in thespectrum are not so high. Alternatively, if we can afford it, we can buy orrent a channel with a wider bandwidth. For instance if the bandwidth of thechannel is 4 MHz, the received signal looks like Fig. 9.8c. That is very likelyto be a useable signal. The receiving system can recover the data without error.

Exercises 95
Thus, by using a wider bandwidth we have been able to transmit informationat the high rate.
Every communication system in the world has some bandwidth limitation.The search for wider bandwidth has led telecommunications companiesto new technologies, such as optical data transmission. The scarcity ofbandwidth in broadcasting has led to governmental regulation worldwide.Essentially, everywhere you look—Fourier rules!
9.8 Continuous Spectra
The spectra that appear in this chapter have all been line spectra in that they consistof discrete frequencies, like 200, 400, 600 Hz. This section introduces continuousspectra where there are no gaps between frequencies. The concept is somewhatabstract, but it can be approached from what you already know.
(1) From Fig. 9.5 you know that a wave with components at 400, 600, and 800 Hzhas a short period, only 1/200 s. Its harmonics are far apart—they are separatedby 200 Hz.
(2) From Fig. 9.5 you also know that a wave with components at 400, 620, and800 Hz is less periodic. It has a longer period, 1/20 s. Its harmonics are muchcloser together; they are separated by 20 Hz.
(3) The tuning fork with frequencies of 256 and 1,997 Hz is even less periodic. Itsperiod is a full second, and that caused us to say that it was not really periodic.Its harmonics (to stretch the definition of the term) would be separated by only1 Hz—in fact, they would be the 256th and the 1,997th harmonics of 1 Hz—kind of a silly idea, but it is mathematically correct.
(4) Finally, there is a signal like the letter “Y” in Fig. 9.8. That signal is not atall periodic. It never repeats itself. It’s a one-shot event. Therefore, we haveto say that the period is infinite, and, to follow the mathematical logic, theseparation between the spectral components becomes zero. That’s the conceptof the spectral continuum. Just for illustration, the amplitude spectrum is shownin Fig. 9.9. It looks continuous, not like individual discrete lines. The phasespectrum is not shown.
Exercises
Exercise 1, A complex waveWrite the equation for a wave having the first four harmonics of 250 Hz, all with
90ı of phase and with amplitudes given by 1=n where n is the harmonic number.[Hint: Follow the form in Eqs. (9.3) and (9.4).]

96 9 Fourier Analysis and Synthesis
Fig. 9.9 The amplitude spectrum of the signal for the letter “Y” from Fig. 9.8. The spectrumbecomes zero at 10 MHz because each pulse has a duration that is a multiple of 0.1�s. Dashedvertical lines appear at 0.8 and 4.0 MHz. You can see how much spectral strength is lost if thesignal is filtered to reduce the amplitude of components above 0.8 MHz. That is why Fig. 9.8b issuch a poor representation of Fig. 9.8a
Exercise 2, Morphing a signalFigure 9.3 shows the signal described by the equation
Signal D 45 sin.360 � 200 t C 0/C 15 sin.360 � 600 t C 0/: (9.6)
Use that plot to imagine the signal described by
Signal D 45 sin.360 � 200 t C 0/C 45 sin.360 � 600 t C 0/; (9.7)
where the third harmonic is just as tall as the fundamental. Sketch that signal.
Exercise 3, What’s the period?
(a) Use figures to show why a wave with components at 200 and 600 Hz has theperiod of 1=200 s. Do the phases of the components change the periodicity?
(b) What is the period of a wave with components at 200 and 500 Hz?
(c) What is the period of a wave with components at 200 and 601 Hz?
(d) What is the period of a wave with components of 150, 450, and 750 Hz?
(e) What is the period of a wave with components of 220, 330, 550, and 660 Hz?
Exercise 4, Physical vs psychologicalThe discussion of the phase-scrambled sawtooth in the text says that the sawtooth
waveform has a pitch of 400 Hz. Frequency is a physical quantity and it canproperly be measured in Hz. Pitch, however, is a perceptual quantity, and it canonly be measured by a human listener. So how can one measure a pitch in physicalunits of Hz?
Exercise 5, Bozo and the waveformBozo explains that according to Ohm’s law the amplitude spectrum determines
the shape of the waveform. Therefore, the picture on an oscilloscope screen doesnot depend much on the phases of the components. Set Bozo straight on this matter.
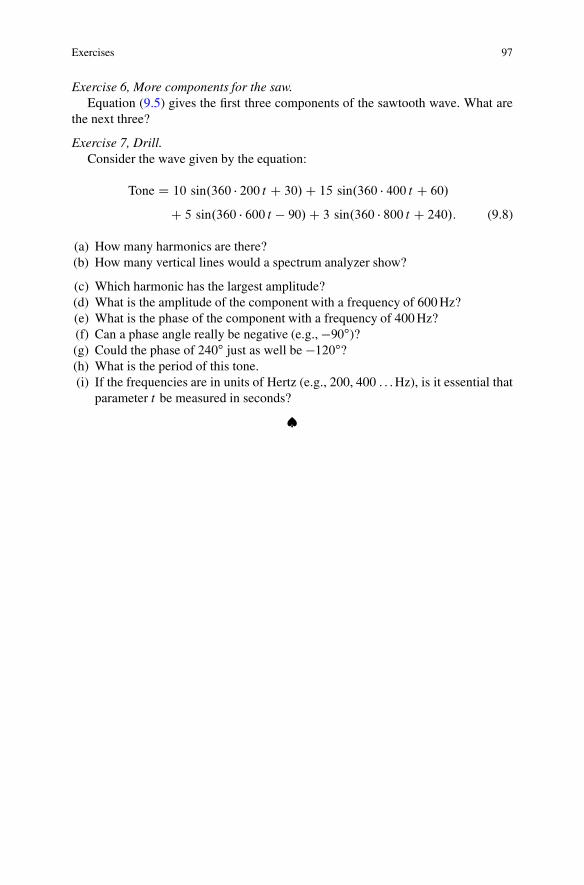
Exercises 97
Exercise 6, More components for the saw.Equation (9.5) gives the first three components of the sawtooth wave. What are
the next three?
Exercise 7, Drill.Consider the wave given by the equation:
Tone D 10 sin.360 � 200 t C 30/C 15 sin.360 � 400 t C 60/
C 5 sin.360 � 600 t � 90/C 3 sin.360 � 800 t C 240/: (9.8)
(a) How many harmonics are there?(b) How many vertical lines would a spectrum analyzer show?
(c) Which harmonic has the largest amplitude?(d) What is the amplitude of the component with a frequency of 600 Hz?(e) What is the phase of the component with a frequency of 400 Hz?(f) Can a phase angle really be negative (e.g., �90ı)?(g) Could the phase of 240ı just as well be �120ı?(h) What is the period of this tone.(i) If the frequencies are in units of Hertz (e.g., 200, 400 . . . Hz), is it essential that
parameter t be measured in seconds?
�

Chapter 10Sound Intensity
10.1 Pressure, Power, and Intensity
Sound waves have pressure, power, intensity, and energy. These facts becameevident at the walls of Jericho some years ago. If you weren’t there at the time toexperience the event, then you may anyhow have experienced chest wall vibrationsat rock concerts—or when listening to music in a booming car. Like light wavesfrom a laser, sound waves have pressure, power, intensity, and energy.
At this point we mainly know about the pressure in sound waves. But pressurelooks like a strange way to describe the flow of sound power because a pressure waveis both positive and negative. Normally it is negative just as much as it is positive,and its average value is zero. That seems quite different from the concepts of power,intensity, and energy. In contrast to pressure, sound power is strictly positive. It isclosely related to the amplitude of the pressure (a positive number). We will refer tothe pressure amplitude by the symbol A.
Focus on Intensity: I A sound wave travels outward from the source of sound,and the power in the wave gets spread out over space. If a certain amount of poweris spread out over a large area, then that is a weak sound. If the same amount ofpower is concentrated in a small area, then the sound is strong. This concept of weakand strong is embodied in the measure called “intensity.” The physical dimensionsof intensity are power per unit area. Because power is expressed in metric unitsof watts, and area is in square meters, intensity is expressed in “watts per squaremeter.” We refer to power and intensity by the symbols P and I respectively.
There is an important relationship between pressure amplitude and intensity: Theintensity is proportional to the square of the pressure amplitude. We write
I / A2: (10.1)
W.M. Hartmann, Principles of Musical Acoustics, Undergraduate Lecture Notesin Physics, DOI 10.1007/978-1-4614-6786-1 10,© Springer Science+Business Media New York 2013
99

100 10 Sound Intensity
Note that this means that if the pressure is doubled, then the intensity is increasedfour times. If the pressure becomes ten times larger, then the intensity becomes 100times larger, i.e., it is increased by a factor of 100.
ProportionalityThe concept of proportionality, indicated by the symbol /, is not difficult tounderstand. A statement of proportionality, such as Eq. (10.1) simply meansthat there is some constant number k that would allow us to write a trueequation,
I D kA2 (10.2)
where k does not depend on either A or I . The concept of proportionalityis used in mathematics to emphasize a particular functional dependence andto disregard others. Here, proportionality statement Eq. (10.1) emphasizesthat intensity depends on the square of the pressure amplitude. What isdisregarded in the proportionality statement is all the complexity that mightbe hidden in Eq. (10.2) because of constant k. For instance, k might dependon the temperature or the density of the gas where the wave is moving. Theproportionality statement makes the assumption that all those quantities areunchanging (that’s why k is called a “constant”) as one changes the pressureamplitude and watches the change in intensity.
10.2 The Inverse Square Law
When you are farther away from a sound source, the sound tends to be less loud.That is such a familiar experience that you would imagine that there ought to be agood physical explanation for it. The most basic attempt to find such an explanationis the inverse square law.
The inverse square law refers to the intensity of the sound wave. It says thatthe intensity at a receiver depends inversely on the square of the distance from thesource. If I is the intensity and d is the distance between the source and the receiver,then
I / 1=d2: (10.3)
The statement of proportionality in Eq. (10.3) is an abstract rule about intensityand distance. We apply this rule by making comparisons between several particularsituations. For instance, let’s think about a trumpet playing 1.5 m (1.5 m) away fromyour ear, and a trumpet playing 15 m away from your ear. If we say that I1 is theintensity when the source is at d1 D 1:5m and I2 is the intensity when the source is

10.2 The Inverse Square Law 101
Fig. 10.1 The sound source at the left radiates power in a conical pattern. At distance d1, thepower is spread over area S1. At distance d2 the power is spread over area S2. Because d2 is twiceas large as d1, S2 is four times larger than S1. The sound intensity depends on how the power isspread over the area and so the intensity at distance d2 is one-quarter of the intensity at distance d1
at d2 D 15m, then the square of the distance ratio is
.d2=d1/2 D .15=1:5/2 D 102 D 100: (10.4)
The inverse square law says
I2=I1 D .d2=d1/�2 D .15=1:5/�2 D 10�2 D 1=100: (10.5)
That means that the intensity is 100 times less when you are 15 m away from thetrumpet compared to when you were 1.5 m away.
It’s not hard to see why the inverse square law is true. Sound intensity is like apower density in that it is the number of watts per square meter. A wavefront fromthe trumpet spreads out in a beam as it leaves the horn. When the ear is only 1.5 maway from the horn, the ear intercepts the wavefront at a distance where it is spreadover a small area. When the ear is 15 m from the horn, it intercepts the wavefrontwhere it is spread over an area that is 100 times larger. That is because the surfacearea of the end of a beam is proportional to the square of the length of the beam.
Figure 10.1 gives another example of the operation of the inverse square law.There, the far distance is only twice as far as the near distance. Therefore, I2=I1 D.1=2/2 D 1=4.
Spherical Source The inverse square law does not depend on having a conicalradiation pattern like Fig. 10.1. The law works for any pattern. As another example,think about a pulsating sphere that radiates a sound wave equally in all directions.Such a radiator is called isotropic. It radiates a spherical wave. You might think ofa wavefront of this wave, e.g., a pressure maximum, as the surface of a sphericalballoon. The expansion of the wavefront as it moves out from the source is like theexpansion of the balloon as it fills with air. As the wave expands, the power is spreadout over an ever larger surface area. Similarly, as the balloon expands, the rubber isstretched over a larger area. The surface area of a sphere, S , is proportional to thesquare of the radius, d . The formula is S D 4�d2. Therefore, the intensity of thesound wave measured a distance d away from the source is I D P=.4�d2/, where

102 10 Sound Intensity
P represents the power of the source. If the power is in watts and the distance is inmeters, then the intensity is in units of watts per square meter, as expected.
Application of the Inverse Square Law The inverse square law comes from amodel in which there is a source, a receiver, and nothing else but air. There isnothing in this environment that would lead to reflected sound waves. Obviously,this model is an idealization because whenever a sound occurs in a room there aremany reflections from the walls of the room, contrary to the model.
In fact, in many room environments the model is a very bad approximation toreality. For instance, in a classroom with a talker near the chalk board and a listeneranywhere else in the room the model fails badly, and the inverse square law does notapply. It fails to describe the dependence of intensity on distance from the source.
There are some other contexts in which the inverse square law does apply.First, if one could imagine a special room where all the walls and other surfacesabsorb sound completely and do not reflect any of it, then the model would apply,and the inverse square law would be valid. Such a room is called “anechoic.” Allsurfaces in this room are covered with foam wedges about a meter long. Second,the inverse square law might apply approximately, even in a normal room if thedistance between the source and receiver is small compared to the distance to anywalls. Then the reflections from the walls, violating the assumptions of the model,might be small compared to the sound that travels directly from source to receiver.Third, if the source and receiver are out of doors, away from all walls, then theinverse square law applies. It applies especially well if the ground is covered withfresh snow, a good sound absorber.
Finally, the inverse square law applies in theoretical calculations in a room wherethe goal is to follow each sound reflection from one surface to another. This contextis different from the others because it deals with sound on a microscopic time scale.Instead of thinking about the propagation of sound from a source to a receiver, thiscontext considers the propagation from the source to the first reflection, and secondreflection, and third, and so on, and finally to the receiver. The inverse square lawapplies to the propagation as it occurs on each step of this complicated path.
RecapitulationPressure: Positive and negative, measured in pascals (or micropascals).
Power: Positive only, measured in watts.
Intensity: Positive only, Power/Area, measured in watts/(meter2).
10.3 Decibels
It’s a strange fact that the pressure, power, intensity, and energy in a sound wave arenot normally specified in physical units such as watts per square meter. What we doinstead is to have standard reference values for all of those physical quantities and

10.3 Decibels 103
to measure a real sound wave in terms of those reference values. That’s the basis ofthe decibel scale.
To explain how the decibel scale works, this chapter tells a long story about youand your neighbor’s music. The story gives a specific example, but you should beable to generalize the concepts to other circumstances.
The story begins with a definition of a reference intensity. The standard referencefor intensity is 10�12 W/m2. This intensity is called the “threshold of hearing”because it is the weakest sound that humans can hear. Making measurements atyour place of the music coming from your neighbor, we might find that the intensityis one million times greater than the reference intensity. That is how we refer theintensity of a sound, like music coming from your neighbor, to the threshold ofhearing.
To put this in the form of an equation, if the threshold of hearing is an intensitycalled Io and the music measured at your place has an intensity called I , then
I=Io D 1; 000; 000 or 106: (10.6)
Because the power of ten that is needed to make one million is 6, we could alsosay that the music is six orders of magnitude more intense than the threshold ofhearing. The number 6 is an exponent here. It is a power of 10. It is the power of10 that is needed to make a million. Therefore, the number 6 is the logarithm of onemillion. In equation form we say,
6 D log.1; 000; 000/: (10.7)
There is only one step remaining to describe the music in terms of decibels. Wemultiply by 10. In the end we say that the music has a level of 60 decibels or 60 dB.
This statement, that the sound has a level of 60 dB, is a little curious. It looks asthough we are describing the level in absolute terms. We know, however, that thislevel has really been referred to the threshold of hearing. So we might have saidinstead, “The sound has a level of 60 dB with respect to the threshold of hearing.”The point is that the threshold of hearing has been agreed upon as an internationalstandard. Therefore, it is OK to say simply that the level is 60 dB. We must bear inmind though that levels measured in dB always are relative measures, even thoughlevels with respect to the threshold of hearing are expressed as though they wereabsolute. That distinction becomes clarified in the next section.
To summarize what has gone above, we can calculate the level, L, of a soundthat has intensity I by the equation
L D 10 log.I=Io/; (10.8)
where Io D 10�12 W/m2.

104 10 Sound Intensity
10.4 Absolute vs Relative dB
You go to your neighbor’s place and walk in. There, the music is 100 times moreintense than it was when you heard it back in your own place. Therefore, its intensityis 108 times the threshold of hearing. The intensity is actually 10�4 W/m2. Tocalculate the level in dB, we use the formula above,
L D 10 log.10�4=10�12/ D 10 log.108/ (10.9)
L D 10 � 8 D 80 dB: (10.10)
At your neighbor’s place the level is 80 dB. That is 20 dB more than back at yourplace. We arrive at this difference of 20 dB by remembering that at your place thelevel was 60 dB, and 80� 60 D 20. We calculated two values on the “absolute” dBscale and subtracted one from the other.
Another Way There is another way to do this calculation that emphasizes the dBmeasure as a relative measure. We return to the fact that the sound intensity was 100times greater at your neighbor’s place.
We define the level at your own place asL1 and the level at your neighbor’s placeas L2. The difference is
L2 � L1 D 10 log.I2=I1/: (10.11)
Because I2=I1 D 100, we have
L2 �L1 D 10 log.100/ D 10 � 2 D 20 dB (10.12)
So we get the same answer, 20 dB, whichever way we do it. We say, “Relative tothe sound at your place, the level at your neighbor’s place is up by 20 dB.”
Another way to say it is, “Relative to the sound at your neighbor’s place, the levelat your place is down by 20 dB.” Still another way to say it is, “The barriers betweenyou and your neighbor attenuate the sound by 20 dB.” To attenuate means to reducethe level.
It is instructive to think about the attenuation picture algebraically. The referencesound is the sound at the source (your neighbor). Its level isL2. The sound of interestis the sound at your place, and its level is L1. Therefore,
L1 �L2 D 10 log.I1=I2/ (10.13)
We know that the ratio I1=I2 is 1/100 or 10�2. We calculate
L1 � L2 D 10 log.10�2/ D 10 � .�2/ D �20 dB (10.14)
We say that relative to the source, the level at your place is �20 dB.

Examples 105
Examples
By studying the following examples, you ought to be able to figure out how to dodecibel problems. The first example uses powers of ten that are integers and don’trequire a calculator to calculate logs. Examples 2–5 use powers of ten that are notintegers. You should use the log button on your calculator to check the numbers.
Example 1(a), An easy dB problemIf sound A is 1,000 times more intense than sound B, then IA D IB � 103. The
exponent is 3 and the level of A is said to be 30 dB greater than the level of B(3 � 10 D 30). viz
LA � LB D 10 log.IA=IB/ D 10 log.103/ D 30 dB:
Example 1(b), A negative dB problemIf sound C has one tenth the intensity of sound D, then IC D ID � .1=10/ or
IC =ID D 10�1. The exponent is �1 and the level of C is said to be 10 dB less thanthe level of D.
viz
LC �LD D 10 log.IC =ID/ D 10 log.1
10/ D 10 log.10�1/ D �10 dB:
Example 2(a), A dB problemNoise Y is five times more intense than noise X. What is the level difference?
SolutionWith the levels of X and Y defined as LY and LX , the level difference is
given by
LY � LX D 10 log.IY =IX/
LY � LX D 10 log.5/ D 10 � 0:7 D 7 dB:
We conclude that the level of Y is 7 dB greater than the level of X.
Example 2(b), The same dB problemAnother way to compare noises X and Y is to say that noise X is one fifth as
intense as noise Y. What is the level difference?
SolutionThe level difference is given by
LX �LY D 10 log.IX=IY /
LX � LY D 10 log.1=5/ D 10 � .�0:7/ D �7 dB:
We again conclude that the level of Y is 7 dB greater than the level of X.

106 10 Sound Intensity
Example 3, A reverse dB problemThe level of the Chevrolet horn (C) is 5 dB greater than the level of the Ford horn
(F). Compare the intensities.
Solution
LC � LF D 5 D 10 log.IC =IF /
0:5 D log.IC =IF /
IC =IF D 100:5 D 3:16:
We conclude that the Chevrolet horn is about three times more intense than theFord horn.
Example 4, Absolute dBThe intensity of the trombone at your ear is 4 � 10�3 W/m2. What is the level?
Solution
L D 10 log.4 � 10�3=10�12/
L D 10 log.4 � 109/
L D 10 log.4/C 10 log.109/
L D 10 � 0:6C 10 � 9 D 96 dB:
That’s loud!Example 5, Reverse absolute dB problem
A sound level meter at the back of the hall measures 103 dB during a rockconcert. What is the intensity of sound there?
SolutionLet I be the intensity of interest. Then
103 D 10 log.I=10�12/
I=.10�12/ D 1010:3
I D 1010:3�12 D 10�1:7 D 0:02
i.e., 0.02 W/m2. That’s dangerously loud!!

Exercises 107
Falling off a log
1. Prove that the log of 10 is 1, in other words, log(10) = 1.2. Prove that the log of 1/10 is �1, in other words, log(1/10)= �1.
3. A logarithm is an exponent. It is a power of 10. For instance, the log of 17[log(17)] is the power of 10 needed to make the number 17.
3a. Use a calculator to show that log(17) is approximately 1.233b. Use a calculator to show that 101:23 � 17:
4. Show that because exponents add, the log of a product is the sum of the logs. Tobe more precise, if A and B are any two numbers, then the log of the product ofA times B is the log of A plus the log of B. In other words,
log.AB/ D log.A/C log.B/:
5. The number 170 is 10�17. If the log of 17 is 1.23, then prove that the log of 170is 2.23.
6. The reciprocal of 17 (1/17) is about 0.0588. If the log of 17 is 1.23, how do youknow that log.0:0588/ D �1:23?
Exercises
Exercise 1, OutdoorsThe inverse square law for sound intensity applies pretty well outdoors where the
only reflection is from the ground. (a) Show that if you go three times farther awayfrom a source of sound, the intensity goes down by a factor of 9. (b) Show that thisdecrease corresponds to a level decrease of 9.5 dB.
Exercise 2, The inverse first-power law
(a) Use the inverse square law and the relationship between intensity and amplitudeto show that the amplitude A of a sound wave depends inversely on the firstpower of the distance d to the source, i.e.,
A / 1=d:
(b) To solve part (a) you need to take the square root of both sides of a proportional-ity. Show that this is a legitimate step writing the proportionality as an equationand then taking the square root of both sides of the equation (a legitimate stepin this context).

108 10 Sound Intensity
Exercise 3, A spherical radiatorA spherical source radiates 10 W of acoustical power uniformly in all directions.
(a) What is the sound intensity at a distance of 1 km, assuming no obstructions.(b) What is the absolute level in dB? (c) Where would one find such conditions?
Exercise 4, Life in different dimensionsYou know that the inverse square law for intensity arises because an expanding
wave spreads over the surface of a sphere, and the surface area is proportional to thesquare of the distance from the source. The spherical surface itself is appropriate inthis case because the world is three dimensional.
In a two-dimensional world, the wave is confined to two dimensions. Anexpanding wave spreads over a circle, and the circumference of the circle isproportional to the first power of the distance from the source. In a two-dimensionalworld the inverse square law for sound intensity is replaced by an inverse first-power law.
How about a one-dimensional world? A tin-can telephone or the speaking tubeon a ship are examples of sound waves confined to one dimension. What then is theappropriate law for sound intensity?
Exercise 5, Orchestra vs soloThirty violins lead to an intensity that is 30 times greater than one violin. Show
that the difference is 14.8 dB.
Exercise 6, A factor of twoShow that doubling the intensity of sound leads to a level increase of 3 dB.
Exercise 7, Unequal duetThe trombone is playing at a level that is 20 dB higher than the flute. (a) Compare
the intensities of trombone and flute. (b) Compare the sound pressure amplitudes oftrombone and flute.
Exercise 8, Converting the equation to amplitudeShow that
L2 � L1 D 20 log.A2=A1/; (10.15)
where A refers to the pressure amplitude.
Exercise 9, Loud!Not far from the space shuttle main engines the sound level is measured to be
130 dB. Show that the intensity is 10 W/m2.
�

Chapter 11The Auditory System
This chapter begins a new aspect of the science of acoustics, the study of the humanlistener. We continue to proceed in an analytical way by studying the physiologyof hearing. The physiology begins with anatomy—the science of where things arein the body, what they look like, how they are connected, and how these facts giveclues about physiological function.
Overall, the auditory system consists of peripheral elements and central elements.The peripheral elements are near the skull and comprise what is commonly called“the ear.” The central elements are located in the brain—the brainstem, midbrain,and cortex. The peripheral part of the auditory system is shown in Fig.11.1—acomplicated figure.
11.1 Auditory Anatomy
The anatomy of the peripheral auditory system has three main divisions: (1) outerear, (2) middle ear, and (3) inner ear, as shown in Fig. 11.2. Figure 11.2 is asimplified version of Fig. 11.1. Please try to identify the parts of Fig. 11.1 that belongto the divisions shown in Fig. 11.2.
11.1.1 The Outer Ear
The outer ear is the part that you can see. It consists of the pinna and the ear canal.The pinna is the fleshy, horn-like protuberance from the side of the head—often usedfor hanging decorations. The ear canal (external auditory meatus) is a duct, about2.5 cm long, running from the pinna to the eardrum. It sometimes accumulates earwax. The eardrum, or tympanic membrane, is the end of the outer ear; it is thebeginning of the middle ear.
W.M. Hartmann, Principles of Musical Acoustics, Undergraduate Lecture Notesin Physics, DOI 10.1007/978-1-4614-6786-1 11,© Springer Science+Business Media New York 2013
109

110 11 The Auditory System
Fig. 11.1 The entire peripheral auditory system, plus the semicircular canals
Fig. 11.2 A simpler figure ofthe outer, middle, and innerear
11.1.2 The Middle Ear
The middle ear consists of three bones and several muscles in a small cavityin the temporal bone. The bones act as a lever that conducts sound vibrations fromthe eardrum to the oval window. The oval window is the point of contact withthe inner ear. The three bones are called ossicles, meaning “little bones.” They areappropriately named because they are the smallest bones in the body. From theeardrum to the oval window, the bones are, in order, the malleus, the incus, andthe stapes—translated: the hammer, the anvil, and the stirrup.

11.1 Auditory Anatomy 111
Fig. 11.3 The middle ear hasthree bones, hammer, anvil,stirrup, connecting theeardrum (tympanicmembrane) to the ovalwindow. The stirrup (stapes)pushes on the oval window
The middle ear cavity is normally filled with air, but it is sealed off at one endby the eardrum and at the other by the oval window and round window. When theoutside pressure changes (perhaps because you are going up in an airplane), therewould be painful pressure on the eardrum if it were not for the eustachian tubethat connects the middle ear cavity to the nasal cavities, which, in turn, are opento the outside air. The eustachian tube allows the pressure in the middle cavity tobecome equal to the atmospheric pressure outside. This is a good thing. However,infections, such as a common cold, that affect the nasal cavities can make their wayup to the middle ear cavity. This is a bad thing. Infants are particularly susceptibleto middle ear infections. When an infection does reach the middle ear, it causes theeardrum to be inflamed. Because the eardrum is translucent, it is possible to seethis inflammation by looking down the ear canal with an otoscope. That is what thephysician is looking for when he or she inspects your ear canals.
The last bone in the chain, the stapes, presses on the oval window and transmitsvibrations to the inner ear (Fig. 11.3).
11.1.3 The Inner Ear
The inner ear is where the real action takes place. It is possible to hear without anouter ear. It is possible to hear without a middle ear. But it is not possible to hearwithout an inner ear. The inner ear is responsible for converting acoustical signalsinto signals that the brain can understand.
The inner ear is a cavity in the skull’s temporal bone called the “cochlea.” It iscurled up into a snail shape and divided into three canals by two membranes asshown by the cross section in Fig. 11.4. The canals are filled with fluid, not unlikesea water. The main membrane is the basilar membrane. The other membrane isReissner’s membrane, and it is so light as to be unimportant mechanically. It does

112 11 The Auditory System
Fig. 11.4 A cross section of the cochlea showing the three canals
not affect the way the fluids move in the cochlea. But Reissner’s membrane isimportant electrically. It separates the ions in the canal called “scala media” fromthe ions in the scala vestibuli. The differences in ionic concentration provide theenergy source for the action of the hair cells. The ionic differences serve as the ear’sbattery—a source of electrical energy.
A pressure pulse from the oval window travels down the duct made from scalavestibuli and scala media to the end of the snail shell cavity where there is a smallopening called the “helicotrema.” There the pulse can turn around and come backon the other side of the basilar membrane through the scala tympani. At the end ofthe scala tympani is the round window, another membrane that acts as a pressurerelief mechanism. The response to a pressure pulse at the oval window is shown inFig. 11.5 by dashed lines.
Motion of the fluids in the canals causes the basilar membrane to move. On thebasilar membrane is the Organ of Corti (Fig. 11.6), which is filled with hair cellsthat play a most vital role in hearing. The hair cells are transducers that convertmechanical motion into neural impulses. The neural impulses are electrical spikesthat are essentially the language of the brain.
Communication within the nervous system is by means of such electrical spikes.Impulses from the hair cells travel along the auditory nerve to higher centers. Theauditory nerve is sometimes called the “eighth (VIII-th) cranial nerve,” or “cochlearnerve.”

11.1 Auditory Anatomy 113
Fig. 11.5 A lengthwise X-ray cartoon of the inside of the cochlea as though it were uncoiled.What you see here is actually coiled up two and a half turns in the human head. The dashed linesshow the response to a positive pressure pulse
Fig. 11.6 The organ of Corti, sitting on the basilar membrane
11.1.4 The Semicircular Canals
The semicircular canals are contiguous with the cochlea and share the same fluids.However, they have nothing to do with hearing. They are the origin of our senseof balance (vestibular system). In fact, the semicircular canals work rather likethe cochlea in that motion of fluids result in neural spikes that are sent to highercenters of the nervous system. However, the mechanism of the semicircular canalsis sensitive only to the low frequencies of whole head motion, mostly below 10 Hz.The cochlea is sensitive to the high frequencies of the auditory world, 20–20,000 Hz.
The neural messages from the semicircular canals also travel on the VIII-th nerve.Diseases, such as Meniere’s disease, that affect the vestibular system also affect theauditory system. Sometimes the cochlea and semicircular canals are jointly referredto as the “inner ear,” but only the cochlea merits further study as part of the hearingsystem.

114 11 The Auditory System
11.2 Auditory Function
Knowing the auditory anatomy gives you strong clues about the functions of thedivisions of the auditory periphery.
11.2.1 Outer Ear Function
The pinna gathers sound and directs it into the ear canal. Its peculiar shape gives it anuneven frequency response. It captures some frequencies better than others, thoughthis unevenness only has a big effect on high frequencies above 5 kHz. Furthermore,the frequency response depends on the direction that the sound is coming from. Thatis not the sort of behavior one would expect from a high-fidelity sound transmittingsystem. That would seem to be a bad thing. However, we humans have learned to usethe asymmetry of this frequency response to help us localize the sources of sound,and so it turns out to be a good thing in the end.
The ear canal is about 2.5 cm long and it looks like a tube that is open at oneend and closed at the other. It is closed by the ear drum. An exercise at the endof the chapter will ask you to show that such a tube has a resonance at about3,400 Hz. Because of this resonance one might expect that the auditory system ismost sensitive to frequencies between 3,000 and 4,000 Hz. This is actually true, aswill be seen in Chap. 12 on loudness.
11.2.2 Middle Ear Function
Sound waves in the ear canal are pressure waves in the air inside that canal. Soundwaves in the inner ear are pressure waves in the fluids of the cochlea—similar toseawater. The function of the middle ear is to form an efficient coupling of the wavesin the air to the fluids. If it were not for the bones of the middle ear, most of the wavesin the air of the ear canal would be reflected from the denser fluids of the cochlea,and little of the sound energy would be coupled into the motion of the fluids. In fact,the mismatch between the air and fluids is so bad that only 1 % of the sound energywould be transmitted from the outer ear into the inner ear. The middle ear solvesthat problem.
At the same time, the middle ear can reduce the efficiency of the couplingbetween outer and middle ear by using two muscles, the stapedius muscle andthe tensor tympani. These muscles contract to make the coupling less efficient inthe presence of loud sounds. This serves as a form of automatic volume controlto protect the delicate inner ear. Unfortunately this is a system that is incompletelyevolved and is rather slow in its action. It is too slow to react to impulsive sounds like
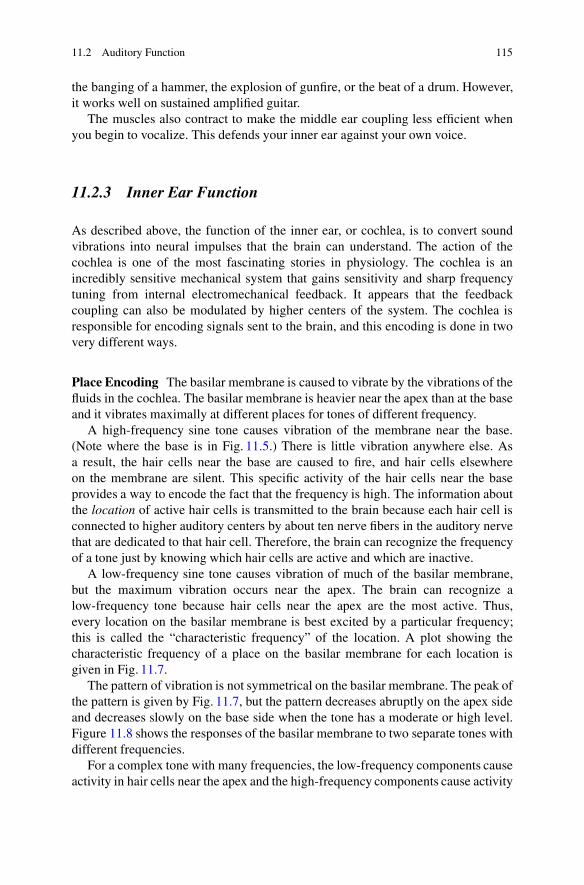
11.2 Auditory Function 115
the banging of a hammer, the explosion of gunfire, or the beat of a drum. However,it works well on sustained amplified guitar.
The muscles also contract to make the middle ear coupling less efficient whenyou begin to vocalize. This defends your inner ear against your own voice.
11.2.3 Inner Ear Function
As described above, the function of the inner ear, or cochlea, is to convert soundvibrations into neural impulses that the brain can understand. The action of thecochlea is one of the most fascinating stories in physiology. The cochlea is anincredibly sensitive mechanical system that gains sensitivity and sharp frequencytuning from internal electromechanical feedback. It appears that the feedbackcoupling can also be modulated by higher centers of the system. The cochlea isresponsible for encoding signals sent to the brain, and this encoding is done in twovery different ways.
Place Encoding The basilar membrane is caused to vibrate by the vibrations of thefluids in the cochlea. The basilar membrane is heavier near the apex than at the baseand it vibrates maximally at different places for tones of different frequency.
A high-frequency sine tone causes vibration of the membrane near the base.(Note where the base is in Fig. 11.5.) There is little vibration anywhere else. Asa result, the hair cells near the base are caused to fire, and hair cells elsewhereon the membrane are silent. This specific activity of the hair cells near the baseprovides a way to encode the fact that the frequency is high. The information aboutthe location of active hair cells is transmitted to the brain because each hair cell isconnected to higher auditory centers by about ten nerve fibers in the auditory nervethat are dedicated to that hair cell. Therefore, the brain can recognize the frequencyof a tone just by knowing which hair cells are active and which are inactive.
A low-frequency sine tone causes vibration of much of the basilar membrane,but the maximum vibration occurs near the apex. The brain can recognize alow-frequency tone because hair cells near the apex are the most active. Thus,every location on the basilar membrane is best excited by a particular frequency;this is called the “characteristic frequency” of the location. A plot showing thecharacteristic frequency of a place on the basilar membrane for each location isgiven in Fig. 11.7.
The pattern of vibration is not symmetrical on the basilar membrane. The peak ofthe pattern is given by Fig. 11.7, but the pattern decreases abruptly on the apex sideand decreases slowly on the base side when the tone has a moderate or high level.Figure 11.8 shows the responses of the basilar membrane to two separate tones withdifferent frequencies.
For a complex tone with many frequencies, the low-frequency components causeactivity in hair cells near the apex and the high-frequency components cause activity

116 11 The Auditory System
Fig. 11.7 Frequency map ofthe basilar membraneaccording to the Greenwoodequation (see Exercise 8).The horizontal axis shows thelocation of the peak of thevibration pattern for a sinetone whose frequency isgiven on the vertical axis
Fig. 11.8 A cartoon showingthe vibration amplitude of thebasilar membrane for twoseparate tones. A 1,000-Hztone leads to a vibrationalpeak at 14.1 mm, and a1,300-Hz tone leads to a peakat 15.8 mm. The patternsextend more toward the base(high-frequency side) than tothe apex
in hair cells near the base. Thus, the basilar membrane performs a spectral analysis(Fourier analysis) of the incoming wave. Different neurons transmit the signals fromthe various sine components. The analysis by frequency that begins in the cochleais maintained at higher levels of the auditory system.
Timing Encoding A hair cell encodes information about the frequency of a tone inyet another way, by synchronizing the pulses it generates with the tone itself. When ahair cell is excited by a tone it fires more frequently, but the spikes are not generatedat random times. Instead, the hair cell tends to produce a spike at a particular phaseof the sine waveform as shown in Fig. 11.9. As a result, the firing tends to preservethe period of the waveform. The time between successive spikes might be equal toa period, or two periods, or three, or four, . . . . Therefore, frequency informationis passed to the brain by means of the regular firing of the neurons. In order totransmit information in this way the neurons must be able to synchronize to thesignal. The nervous system cannot keep up with a signal having a frequency greaterthan 5,000 Hz, but it can faithfully follow a signal with a frequency of 2,000 Hzand below. More about time encoding and neural synchrony appears in Chap. 13 onpitch perception.
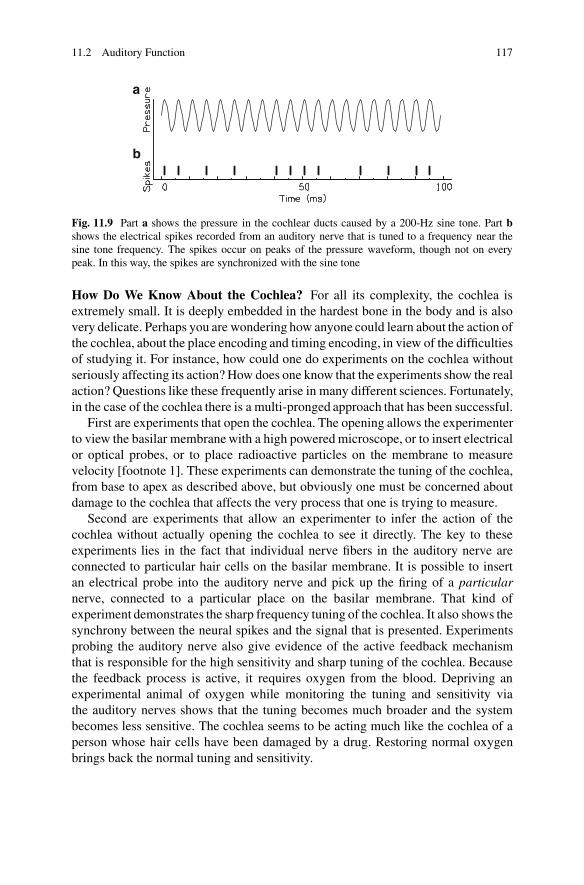
11.2 Auditory Function 117
a
b
Fig. 11.9 Part a shows the pressure in the cochlear ducts caused by a 200-Hz sine tone. Part bshows the electrical spikes recorded from an auditory nerve that is tuned to a frequency near thesine tone frequency. The spikes occur on peaks of the pressure waveform, though not on everypeak. In this way, the spikes are synchronized with the sine tone
How Do We Know About the Cochlea? For all its complexity, the cochlea isextremely small. It is deeply embedded in the hardest bone in the body and is alsovery delicate. Perhaps you are wondering how anyone could learn about the action ofthe cochlea, about the place encoding and timing encoding, in view of the difficultiesof studying it. For instance, how could one do experiments on the cochlea withoutseriously affecting its action? How does one know that the experiments show the realaction? Questions like these frequently arise in many different sciences. Fortunately,in the case of the cochlea there is a multi-pronged approach that has been successful.
First are experiments that open the cochlea. The opening allows the experimenterto view the basilar membrane with a high powered microscope, or to insert electricalor optical probes, or to place radioactive particles on the membrane to measurevelocity [footnote 1]. These experiments can demonstrate the tuning of the cochlea,from base to apex as described above, but obviously one must be concerned aboutdamage to the cochlea that affects the very process that one is trying to measure.
Second are experiments that allow an experimenter to infer the action of thecochlea without actually opening the cochlea to see it directly. The key to theseexperiments lies in the fact that individual nerve fibers in the auditory nerve areconnected to particular hair cells on the basilar membrane. It is possible to insertan electrical probe into the auditory nerve and pick up the firing of a particularnerve, connected to a particular place on the basilar membrane. That kind ofexperiment demonstrates the sharp frequency tuning of the cochlea. It also shows thesynchrony between the neural spikes and the signal that is presented. Experimentsprobing the auditory nerve also give evidence of the active feedback mechanismthat is responsible for the high sensitivity and sharp tuning of the cochlea. Becausethe feedback process is active, it requires oxygen from the blood. Depriving anexperimental animal of oxygen while monitoring the tuning and sensitivity viathe auditory nerves shows that the tuning becomes much broader and the systembecomes less sensitive. The cochlea seems to be acting much like the cochlea of aperson whose hair cells have been damaged by a drug. Restoring normal oxygenbrings back the normal tuning and sensitivity.
118 11 The Auditory System
Third are experiments that measure cochlear emissions. Because the cochlea iselectromechanically active it actually generates acoustical signals of its own. Thesesignals propagate back along the basilar membrane, back through the middle ear,and back into the ear canal where they can be measured by microphones placedin the canal. The signals that return from the cochlea in this way are delayedcompared to sounds that excite the cochlea into action. The delay makes it possibleto recognize the emissions and to study them. While the open-cochlea and auditory-nerve experiments can only be done on animals, the experiments that measureotoacoustic emissions can be done on human beings. They are even part of infantscreening tests.
11.2.4 Beyond the Cochlea
The hair cells on the basilar membrane in the cochlea convert sound waves intoneural impulses, or electrical spikes. Higher stages of the auditory system processthese impulses. The auditory nerve transmits impulses from the hair cells to acollection of neural cells called the cochlear nucleus. The cochlear nucleus is inthe brainstem, part of the brain just above your neck. After the cochlear nucleuscomes half a dozen stages of neural processing which include millions of neuronsand an elaborate cross-linking between left- and right-hand sides. The processingproceeds by excitation, where a spike in one neuron causes a spike in another, andby inhibition where a spike on one neuron inhibits spike generation by another.The auditory pathway ascends through the processing stages to the auditory cortex,located near your left and right temples. In addition to the ascending pathway aredescending pathways by which the higher auditory centers send neural messagesto lower stages, even into the cochlea! The descending pathways are a form offeedback by which the processing of lower centers is controlled by the higher.The complexity of the auditory nervous system has kept psychoacousticians andauditory physiologists busy for years. They are still hard at work. One aspect of thesystem that seems clear is that frequency tuning, originally established by the basilarmembrane is retained throughout the higher stages. At every stage, it is possible tolocate a 1,000-Hz place, differently located from, say, a 200-Hz place.
11.2.5 Hearing Impairments
Ringing in the Ears Ringing in the ears is an everyday name for subjective tinnitus,a sound that you hear that does not have an external physical origin. Many peoplehave the experience that while doing nothing in particular, they suddenly hear ahigh-pitched ping. Often it is lateralized to one side of the other. This sound lasts a

11.2 Auditory Function 119
few seconds and then goes away. Such experiences are minor curiosities and so faras one knows they have no particular implications for the health of the ear or brain.Unfortunately, there are many people for whom the sound does not go away. It isa persistent tone, or buzzing, or hissing sound—usually tonal, meaning that it hasa pitch. For such people, and they are perhaps as much as 20 % of the population,tinnitus can become a serious disturbance, significantly reducing the quality of life.
Tinnitus is so common that you might expect it to have a simple explanation.Surprisingly, there is no simple single explanation. Tinnitus can originate in theexternal ear, with an accumulation of ear wax, or in the middle ear with infection orotosclerosis, wherein a bony mass grows within the middle ear cavity and impedesthe motion of the stapes. It can originate in the inner ear, especially in connectionwith hair cell loss caused by an acoustical trauma such as a nearby explosion. Itcan apparently originate in the auditory nerve, especially in the case of an acousticneuroma, a slow-growing tumor that presses on the nerve. It may originate in thebrain.
Tinnitus can be caused by common drugs, aspirin or non-steroidal anti-inflammatory drugs such as ibuprofen, or by aminoglycocides, potentially highlyototoxic antibiotics used to treat systemic bacteriological infections. Drug-inducedtinnitus often ceases when the drug regimen is changed.
In some cases, tinnitus can be a warning of other disorders such as anemia, ananeurysm, or a tumor, but most of the time it seems that tinnitus has no other healthimplication beyond the annoyance of the tinnitus itself. There is no recognizedcure for the problem. People who suffer from tinnitus are encouraged to avoid loudnoises, which may aggravate the problem. Paradoxically many sufferers gain relieffrom masking noise, either from a loudspeaker or from a hearing aid. For mosttinnitus patients, masking noise that is 14 dB above threshold is adequate to obscurethe tinnitus. In some cases, masking noise may even provide relief for minutes,hours, or days after it is turned off. Programs that use biofeedback or relaxationtechniques have proved helpful to some. For some individuals nothing helps, andthey are required to learn to live with the problem. In summary, although tinnituswould seem to be a simple and common phenomenon, it turns out to be surprisinglycomplicated.
Hearing Loss and Hearing Aids Hearing loss can be classified as one of twotypes: conductive loss or sensorineural loss. Conductive loss occurs when thenormal acoustical path to the inner ear is blocked in some way. An accumulationof ear wax can block the ear canal. Otosclerosis can prevent normal conductionof sound by the ossicles. Conductive loss can often be cured surgically. If not,conductive loss responds well to hearing aids because hearing aids essentially solvethe problem of conductive loss, namely insufficient acoustical intensity arriving atthe inner ear. A hearing aid consists of a microphone to pick up the sounds, anamplifier which requires battery power, and a tiny loudspeaker that fits in the earcanal. The amplifier may include filtering and other signal processing to try to tailorthe hearing aid to the individual patient.

120 11 The Auditory System
Sensorineural loss is usually a deficit in the inner ear. Normal hair cells areessential for normal hearing. Unfortunately, hair cells are vulnerable to ageing, tointense noises, to ototoxic drugs, and to congenital abnormalities. The classic caseof impaired hearing results from poorly functioning hair cells. Because the hair cellsare responsible for sensitivity, tuning, and timing, people who are hearing impairedmay have deficits in some or all of these functions.
There is a tendency to think about hearing aids as analogous to eyeglasses, andfor people with conductive hearing loss the analogy is not bad. But for the largenumber of people with sensorineural loss the analogy is not accurate. For the greatmajority of visually impaired individuals, eyeglasses (or contact lenses) solve theproblem. The optical defects of an eyeball that does not have exactly the correctshape are readily compensated by passing the light through corrective lenses—endof story. Hearing impaired individuals do not normally gain the same kind of benefitfrom hearing aids. Hearing impairments, resulting from poor hair cell function, areas complicated as the hair cells themselves. A better analogy with the visual systemwould compare abnormal hair cells in the cochlea with an abnormal retina in theeyeball.
Cochlear Implants In order to benefit from hearing aids, an impaired person needsto have some residual hair cell activity. Some people however are totally deaf withno hair cell function at all. But such people often still have functioning auditorynerves. The nerve endings come to the cochlea in the normal way, but they don’tfind normal hair cells there to excite them.
Thousands of people who are totally deaf because of hair cell loss have regainedsome auditory function by the use of cochlear implants. The implant consists of amicrophone that picks up sounds like a hearing aid, but the resemblance to hearingaids stops there. Instead, an electrode is inserted in the cochlea via surgery throughthe middle ear’s round window. The electrode excites the auditory nerve directly byan electrical representation of the wave from the microphone.
Early cochlear implants were not a great success. Although they restored somesense of hearing, they did not make it possible to understand speech. These implantshad only one electrode. From the place-encoding principle, however, it is known thatnerve endings near the base of the cochlea normally receive high-frequency signalsand nerve endings near the apex receive low-frequency signals. A modern cochlearimplant has many electrodes, as many as 24, all along its length, encoding differentfrequency regions. Sounds with different frequencies can be sent to the correct fibersof the auditory nerve. Thus, the implant itself performs the Fourier analysis thatis normally performed by the basilar membrane. Implants like this, retaining thenormal frequency analysis of the cochlea, have enabled deaf persons to understandspeech, even over the telephone where they cannot gain anything from lip reading.
Cochlear implants and the encoding of information sent to the electrodes havebeen optimized for speech. The sounds perceived by implanted patients are verydifferent from normal speech—they have been compared to the quacking of ducks.Nevertheless, people who learned to speak and to understand speech prior to

Exercises 121
deafness have been able to make the transition and decipher the quacking. Initially,implants were restricted to people who were post-lingually deaf because it wasreasoned that there was no point in providing degraded speech information to apatient who had never heard any normal speech in the first place.
Eventually, implants were tried on deaf children, and the results were surprisinglygood. Further, it was found that the younger the child, the better the results! Now,infants are implanted, often so successfully that the child learns to speak andunderstand essentially like a normal hearing child. An important philosophical take-home message from that experience is that those of us who have normal hearing andperceive speech in the usual way, do so because our brains have learned to interpretthe signals sent by the periphery. Marvelous though the peripheral auditory systemmay be, there is no need for it to encode signals in one specific way or another; theyoung brain can learn to cope with a wide variety of inputs from the periphery.
There are some drawbacks to cochlear implants. The present encoding strategythat has proved to be so successful in encoding speech removes timing informationfrom the input signal and the patient receives no normal timing encoding. This hasthe effect of eliminating most musical pitch information. Implantees, even youngones, don’t perceive music normally at all. Also, the surgery that implants electrodeswrecks whatever normal features there may be in the cochlea. If someday a drugis found that causes normal hair cells to grow and restore hearing to deaf people,implantees are unlikely to benefit. For the present, cochlear implants have givennormal speech perception to individuals who would otherwise be as deaf as bricks.Implants represent a strikingly successful collaboration between medical practiceand fundamental research in human hearing.
Cochlear Nucleus Implants A cochlear implant can restore hearing to individualswho have a functioning auditory nerve, but what if there is no functioning auditorynerve? The obvious answer is to put an implant into the next stage of auditoryprocessing, the cochlear nucleus. A procedure that has recently been developedplaces electrodes in the cochlear nucleus. Although the concept of electrodesimplanted in the brain stem may seem spooky, it’s not the only bionic braintechnology. Electrodes can be implanted in the thalamus to control the tremors ofParkinson’s disease.
Exercises
Exercise 1, The ear canal as a pipe
(a) Given the description of the ear canal in the section on the outer ear, show thatthe resonant frequency of the ear canal (first mode) is about 3,400 Hz.
(b) What is the frequency of the second mode for air in the ear canal?

122 11 The Auditory System
Exercise 2, Inside the canalsThe speed of sound in cochlear fluid is about five times the speed of sound in air.
If the cochlear duct is 35 mm long show that it takes a sound pulse about 40�s togo from the oval window, down the duct, and back to the round window opening tothe middle ear. However, the mechanical traveling wave on the basilar membrane ismuch slower. That wave takes about 10 ms to go from the base to the apex.
Exercise 3, Acoustic reflexThe action of middle ear muscles in response to a loud sound is called the
“acoustic reflex.” Describe loud sounds that you expect to trigger the action of theacoustic reflex.
Exercise 4, The “place” model of hearing.
(a) Use Fig. 11.7 to find where the basilar membrane most excited for a frequencyof 440 Hz.
(b) Where are the hair cells that are most activated by the second harmonic of440 Hz?
Exercise 5, In syncIf you were able to probe the firing of a neuron in the VIII-th nerve, what time
intervals between spikes would you expect to see if the ear receives a 440-Hz tone?
Exercise 6, Place encodingAs human beings age, we lose the ability to hear high frequencies. This effect
is attributed to the loss of hair cells. Where on the basilar membrane are thesehair cells?
Exercise 7, Tone-on-tone maskingIntense tones of one frequency interfere with the perception of weaker tones
of other frequencies. Given what you know about the mechanics of the basilarmembrane, which to you expect to reveal more interference?
(a) An intense 1,000-Hz tone and a weak 1,300-Hz tone.(b) An intense 1,300-Hz tone and a weak 1,000-Hz tone.
See Fig. 11.8 for a cartoon showing basilar membrane displacement for these twofrequencies in the case of equal levels.
Exercise 8, The Greenwood equation.The mapping of characteristic frequency (fC ) vs distance (z) along the basilar
membrane was plotted using an equation published in 1961 by Donald Greenwood.This equation says,
fC D 165 .10az � 1/; (11.1)
where distance z is measured from the apex, and constant a is 0.06 inversemillimeters. Use this equation to show that the frequencies corresponding to 5, 10,15, 20, 25, and 30 mm places are, respectively, 164, 492, 1,146, 2,450, 5,053, and10,246 Hz.

Exercises 123
Exercise 9, Inverse Greenwood
(a) Invert the Greenwood equation to show that the distance along the basilarmembrane as a function of characteristic frequency is given by
z D 1
alog10.1C fC=165/: (11.2)
(b) Use Eq. (11.2) to work Exercise 4(a) more precisely.
Exercise 10, The cochlear nucleus implantCochlear implants have multiple electrodes dedicated to different frequency
bands. In this way they simulate the action of the basilar membrane—analyzingsound by frequency and sending different bands along different neural channels.Would you expect that the cochlear nucleus implant would also have multipleelectrodes so that multiple frequency bands can be transmitted?
Exercise 11, The cochlear implantThe insertion of a cochlear implant is shown in the figure below. (a) Where is the
conversion from acoustical to electrical? (b) What parts can be seen by an outsideobserver? (c) How many turns of the cochlea have been implanted?

124 11 The Auditory System
Footnote 1, Mossbauer effect: Radioactive nuclei like iron with an atomicmass of 57 units decay by emitting gamma radiation. The frequency of thisradiation is amazingly precise, one part in ten billion. Because the frequencyis determined so precisely, it is possible to measure small velocities of theradioactive particles by measuring the Doppler shift in the frequency of theradiation. The effect that makes this possible is known as the Mossbauereffect.
�

Chapter 12Loudness Perception
Loudness is a familiar property of sound. If you are listening to the radio and youwant to increase the loudness you turn up the volume control, i.e., you increase theintensity. Clearly loudness is closely related to sound intensity. But loudness is notthe same as intensity. Sound intensity is a physical quantity—it can be measuredwith a sound level meter. Loudness, by contrast, is a psychological quantity—it canonly be measured by a human listener. The purpose of this chapter is to introducethe important elements of sound that contribute to the perception of loudness.
12.1 Loudness Level
On physical grounds alone you can expect that loudness should be different fromintensity because the ear does not transmit all frequencies equally, i.e., it does nothave a flat frequency response. The outer ear, with its complicated geometry, hasseveral overlapping resonances including the important ear canal resonance near3 or 4 kHz. Therefore, the magnitude of the input to the nervous system does notdepend on intensity alone, the frequency also matters.
The first step on the road to a scale for loudness is a measure of intensity thatcompensates for the effect of frequency on the loudness of sine tones. Such ameasure is the loudness level, and it is expressed in units of phons (rhymes with“Johns”). By definition, any two sine tones that have equal phons are equally loud.The curves of equal phons are called equal-loudness contours. A set of equal-loudness contours is shown in Fig. 12.1.
The contour concept is not unusual. You are probably familiar with contour mapsin geography where the vertical and horizontal axes represent north–south and east–west in the usual way, and lines on the map represent equal-elevation contours. Thusone line might be the 100-m elevation line while the next line might be the 110-mline. Equal-loudness contours are like that, except that instead of equal elevation,the lines are equal loudness.
W.M. Hartmann, Principles of Musical Acoustics, Undergraduate Lecture Notesin Physics, DOI 10.1007/978-1-4614-6786-1 12,© Springer Science+Business Media New York 2013
125

126 12 Loudness Perception
Fig. 12.1 Equal loudness contours come from loudness comparisons made by average humanlisteners with normal hearing for sine tones of different frequency and sound level. The horizontaland vertical axes are both physical properties of the tone. The human part appears in the curvesthemselves. Every point on a single curve describes a sine tone with the same loudness. The dashedline corresponds to absolute threshold, the weakest sound the average human can hear
To construct an equal-loudness contour requires an experimenter and a listener.The experiment begins when the experimenter presents a sine tone having afrequency of 1,000 Hz and some chosen level, say 20 dB. The listener listens tothat tone. Then the experimenter changes the frequency, for instance to 125 Hz, andasks the listener to adjust the level of that 125-Hz tone so that it is just as loud asloud as the 1,000-Hz tone.
In this example, where the sound level of the 1,000-Hz sine is 20 dB, it is foundthat the sound level of the 125-Hz sine must be adjusted to 33 dB for equal loudness.These two points (1,000 Hz, 20 dB) and (125 Hz, 33 dB) are on the same equal-loudness contour, and, by definition, this contour is called the 20-phon loudnesslevel. The frequency of 1,000 Hz is always the reference frequency for the phon scale.In what follows we will refer to a loudness level in phons by the Greek symbol ˆ(Phi, for physical). The level called 0-dB in Fig. 12.1 corresponds to the nominalthreshold, 10�12 W/m2.

12.2 Loudness 127
12.2 Loudness
The loudness level, expressed in phons, ˆ, is a frequency-compensated decibelscale, but it is not yet a measure of loudness. A true measure of loudness would scalewith the personal sensation of magnitude, but there is no reason to suppose that thenumbers 10 phons, 20 phons, etc. will do that. After all, the scale of phons is tiedto the decibel scale at 1,000 Hz, and the decibel scale was invented without muchconsideration of human perception of loudness. A logarithmic scale, like the decibelscale, is convenient mathematically, but careful experiments on human listenershave concluded that loudness is not a logarithmic function of intensity. Loudnessdoes not follow the decibel scale well. Instead, many experiments done over thepast 75 years have shown that the rule for loudness is a different kind of function. Itis a exponential law, as follows:
‰ / 100:03ˆ; (12.1)
where the symbol Greek ‰ (Psi for psychological) stands for loudness. Analternative way to write Eq. (12.1) is as
‰ / 1:0715193ˆ: (12.2)
These proportionalities don’t enable you to calculate any absolute numbers, butthey do enable you to calculate ratios. Suppose there are two tones, numbered “1”and “2”, that have loudness levels of ˆ1 phons and ˆ2 phons. Then the ratio of theloudnesses is given by
‰2=‰1 D 100:03.ˆ2�ˆ1/ (12.3)
The formula in Eq. (12.3) follows immediately from the proportionality in Eq. (12.1).Ratios can be useful concepts, as shown in the following example.
Example:
Question: There are two sine tones, “1” and “2.” These tones have differentfrequencies and tone 2 is 10 phons greater than tone 1. How much louder istone 2, compared with tone 1?
Answer: Although the frequencies are different, the fact that loudnesslevels are given in phons makes it possible to use Eq. (12.3). Plugging intoEq. (12.3) we find:
‰2=‰1 D 100:03�.10/ (12.4)
or
‰2=‰1 D 100:3 (12.5)
From the inverse log function on a calculator we find that ‰2=‰1 D 1:995.That’s close to 2. Tone 2 is about two times louder than tone 1.
The example above has illustrated the convenient rule:
Rule 1: For every increase of 10 phons, the psychological sensation of loudnessdoubles.

128 12 Loudness Perception
Loudness vs Sound Level Because we regularly make physical measurementsof the sound intensity in terms of the sound level in decibels, it would be reallyconvenient to be able to relate loudness to the sound level, L. There are tworequirements that need to be fulfilled in order for us to be able to do that. First, weneed to consider a single frequency at a time. Thus we can compare the loudnessesof two tones that have different levels but the same frequency. In other words, wecan ask about the effect of turning up the volume control. The second requirementis that the tones involved need to have particular levels and frequencies such thatthe equal-loudness contours are approximately parallel. A glance at the contoursof Fig. 12.1 shows that this second requirement is met by many everyday sounds,having frequencies between 250 and 8,000 Hz and levels greater than 40 dB.
As a practical matter, therefore, we can rewrite Eq. (12.1) as
‰ / 100:03L (12.6)
We expect that this relationship will fail at frequencies below 125 Hz, where theequal loudness contours are not parallel but are squished together. We expect thatthis relationship will hold good in many practical circumstances. Exercises at theend of the chapter will assume that it holds good.
Given the relationship in Eq. (12.6) it follows that if there are two tones of thesame frequency with levels L1 and L2, then the loudnesses are related by the ratio
‰2=‰1 D 100:03.L2�L1/ (12.7)
A special case of Eq. (12.7) leads to the convenient rule:
Rule 2: For every increase of 10 dB, the psychological sensation of the loudness ofa tone doubles.
Rule 2 is more convenient than Rule 1 because it uses decibels instead of phons.But Rule 2 is not as general as Rule 1 because it requires that special conditionshold—constant frequency and parallel equal-loudness contours.
Loudness vs Intensity From Chap. 10, we know that the sound level (L) indecibels can be related to the sound intensity (I ) expressed in watts per square meter.The relationship is that I / 10L=10. For tones in the practical region of frequencyand level, it follows from Eq. (12.6) that
‰ / I 0:3: (12.8)
This relationship is a power law. It says that loudness grows as the 0.3 power ofthe intensity. This statement is close to saying that the loudness grows as the cuberoot of the intensity. The cube root would be the 1/3 (or 0.333. . . ) power, and that isclose to 0.3.

12.3 Psychophysics 129
Fig. 12.2 The 0.3 power lawis a compressive function. Asthe input goes from 1 to 10,the output goes from 1 to 2
This is quite an amazing rule. Suppose you have a tone with a sound level of50 dB. Therefore, the intensity is 10�7 W/m2. If you increase the level to 60 dBthe intensity becomes 10�6 W/m2, and the loudness becomes twice as great. If youincrease the level by another 10 dB the intensity becomes 10�5 W/m2, and again theloudness doubles. This behavior indicates a highly compressive function. Overall,starting from 50 dB, the intensity has increased 100 times but the end result is onlyfour times louder according to human ears. This behavior is called, “compressive”because the output grows slowly as the input increases. Here, one imagines the inputto be the physical intensity, put into the human auditory system, and the output isthe listener’s sensation of loudness. A graph of a compressive function has a shapelike Fig. 12.2.
Example:
Question: There are two sine tones, “1” and “2.” These tones have the samefrequency, but tone 2 is 300 times more intense than tone 1. How muchlouder is tone 2, compared with tone 1?
Answer: From the proportionality in Eq. (12.8), you know that
‰2=‰1 D .I2=I1/0:3 (12.9)
We are told that I2=I1 D 300, and so ‰2=‰1 D .300/0:3 D 5:5. Thus tone 2is about five times louder than tone 1.
12.3 Psychophysics
The delicate matter of scaling a psychological magnitude such as loudness is thesubject of the science of psychophysics. The psychophysicist tries to determinethe relationship between physical magnitudes, measured with ordinary electronicinstrumentation, and psychological magnitudes as reported by human (or animal)observers.

130 12 Loudness Perception
There are several different techniques used to determine psychological mag-nitudes. In a direct technique, the experimenter just asks subjects to rate theirsensations of magnitude. For instance, a listener might be presented with 1,000-Hz sine tones having a dozen different intensities. The listener is asked to rate theloudness of the tones. This is an example of a magnitude estimation task.
It is not clear that this kind of experiment should work. As you can imagine, ifyou ask ten listeners to estimate the magnitude of a tone, you are likely to get tendifferent answers. However, if the magnitude estimation experiment is continuedfor many hours over the course of a week or two, certain clear patterns begin toemerge from the data. Although different listeners may use different scales, thereare common features (ratios mostly) in their responses.
After the experimenter has found stable numerical responses to tones of differentintensities in the estimation task, the experiment is reversed to form a magnitudeproduction task. This time, the experimenter gives the listener the numbers, andthe listener adjusts a volume control to vary the intensity of the sound. If thelistener previously gave numbers on a scale of 1–100 in the estimation task, thenthe experimenter will give the listener the same range of numbers for the productiontask. After another week of experimenting, the data from the two tasks are averaged,and the result is a function showing the relationship between physical magnitude andpsychological magnitude. For the loudness experiment, the relationship is that givenin Eq. (12.1).
The Sone Scale The exponent of 0.3, as in Eq. (12.8), is the basis for thecurrent national and international loudness scale known as the sone scale.The reference for this absolute scale is that a 1,000-Hz sine tone with a levelof 40 dB SPL shall have a loudness of one sone. Therefore,
‰.sones/ D 1
15:849.I
I0/0:3; (12.10)
or
log‰.sones/ D � log.15:849/C 0:03 � 10 logI
I0: (12.11)
It follows by definition that any tone with a loudness level of 40 phons has aloudness of one sone, and sones can be calculated from phons by the equation
log‰.sones/ D �1:2C 0:03L'; (12.12)
where L' is the loudness level in phons.

12.5 Excitation Patterns 131
Fig. 12.3 Neural firing ratevs sound level in dB. Thethreshold is defined as thelevel where the firing ratebecomes 10% greater than thespontaneous rate
12.4 Neural Firing Rate
A scientist finds it natural to try to understand the perception of loudness fromwhat is known about the auditory system and the properties of neurons that processsounds in our brains. It is very compelling to imagine that the loudness sensation isrelated in some way to the total number of neural spikes transmitted to the centralauditory system by the auditory nerve.
As the intensity of a sound increases, the firing rate of neurons in the auditorynerve also increases, but the whole story is not as simple as that. First, even whenthere is no sound at all, the neurons fire occasionally. This spontaneous firing ratemay be about 50 spikes per second. Now suppose that a very weak tone is turnedon. For very low intensity levels a neuron’s firing rate remains at the spontaneousrate, as shown in Fig. 12.3. As the intensity increases it eventually passes a thresholdwhere the neural firing rate starts to become greater than the spontaneous rate. Asthe intensity continues to increase, through a range of 30 or 40 dB above threshold,the neuron fires more and more often. But eventually, as the intensity increasesstill further, the neuron starts to saturate. Its firing rate no longer goes up rapidlywith increasing intensity. In other words, neural firing rate looks like a compressivefunction of intensity. It is a good bet that the loudness of a sound is closely related tothe number of neural spikes received by the central auditory system in a 1-s interval,i.e. to the neural firing rate. Therefore, it seems likely that the compressive behaviorof loudness observed in the psychology of human hearing is closely related to thecompressive behavior of neural firing rate observed physiologically.
12.5 Excitation Patterns
We must remember that the neurons described above in the discussion of neuralfiring rate are originally excited by a vibration pattern (excitation pattern) on thebasilar membrane. The neurons that are active are those at places on the basilarmembrane that are excited by frequencies in the tone. If the tone is a sine tone, there

132 12 Loudness Perception
Fig. 12.4 Cartoon showing basilar membrane motion for a sine tone (solid) and a more intensesine tone (dashed). Three representative hair cells are given labels A, B, and C
is only one frequency and the excitation pattern has a single peak, as shown by thesolid line in Fig. 12.4. Therefore, only a few neurons are excited. As the intensitygrows, the excitation pattern becomes somewhat wider, as shown by the dashed line,and additional neurons are excited. This is a second mechanism for transmitting thesensation of loudness to the brain. Not only do active neurons become more active(e.g., the neuron at location B) but additional neurons (e.g., the neuron at locationA) start to fire beyond their spontaneous rate. The additional spikes contributedby the neuron at A will help somewhat to generate the loudness sensation whenthe neurons near location B saturate. However, because of neural compression, alaw of diminishing returns applies when the only neurons that contribute are thosethat respond to a single frequency. To increase the total firing rate a lot, to get areally loud sound, you need more than one frequency. You need a complex tone. Forinstance, adding a low-frequency component should excite the neuron at locationC. A broadband tone with components at frequencies that span the audible rangeexcites all places on the basilar membrane and should be particularly loud. Thecompressive character of neural firing means that the best way to generate loudnessis to spread the available power over a broad frequency band rather than over anarrow band where it excites only a few neurons. An example of this effect appearsin the next section.
12.6 Complex Sounds
To review where we have been in this chapter, recall that the chapter began with sinetones with particular levels (L in dB) and frequencies (f ) and put these tones onequal-loudness contours denoted by loudness level (ˆ in phons). Next, we relatedthe loudness level (ˆ) to the sensation of loudness (‰) through an exponential law.Finally we identified a practical region of levels and frequencies where the equal-loudness contours were approximately parallel, and we related loudness (‰) to level(L) and then to intensity (I ). We found that loudness was proportional to the 0.3power of the intensity. We related this power law to facts about the auditory nervoussystem.

12.6 Complex Sounds 133
a d
b e
c
Fig. 12.5 Spectra for loudness calculations: (a) sine, (b) whistle, (c) two closely-spaced sines,(d) two separated sines, and (e) complex periodic tone. The horizontal axis is a logarithmicfrequency scale, an approximation to the scale of the real basilar membrane
After all this work, it is a little disappointing to realize that the only soundsthat we have considered so far are sine tones (Fig. 12.5a). The real world consistsof complex sounds, made up of many sine tone components. Fortunately, it is nottoo hard to use what we already know to make good guesses about the loudnessof complex sounds. The key to our approach is to assume that the sensation ofloudness ought to depend on the total number of neural spikes received by the brain.We consider three kinds of sounds in turn.
1. Narrow-band sounds: If you whistle, you create a tone that is almost a sine tone,but it fluctuates in time. This fluctuation appears spectrally as a narrow band ofnoise, centered on a frequency that corresponds to the pitch of the whistled tone(Fig. 12.5b). The neurons that respond to the narrow band of noise are essentiallythe same neurons that would respond to a sine tone and we feel confident aboutusing the entire sine-tone model to calculate the loudness of a narrow-band noise.All the components that make the tone noisy are compressed in the same way.
A second example of narrow-band sounds is a few (for instance two) sinetones with frequencies that are close together, e.g., 1,000 and 1,100 Hz (Fig. 12.5c).These tones excite mostly the same neurons and the excitations from both tonesare compressed together. Thus if one tone has an intensity of 2 units and the othertone has an intensity of 3 units, the loudness will be proportional to .2C3/0:3 D 50:3
or 1.62.

134 12 Loudness Perception
2. Separated sine tones: If there are two sine tones with quite different frequenciesthen two quite different regions of the basilar membrane will be active and quitedifferent sets of neurons will be excited. For instance, the frequencies might be 500and 2,000 Hz (Fig. 12.5d). Excitations from these two sets of neurons will becompressed separately. Thus if one tone has an intensity of 2 units and the othertone has an intensity of 3 units, the loudness will be proportional to .2/0:3C.3/0:3 D1:23 C 1:39 D 2:62: You will notice that the loudness of the separated tones isconsiderably greater than the loudness of tones that are close together in a narrowband, i.e., 2.62 is greater than 1.62.
3. Harmonic tones: Let’s consider a periodic complex tone with a fundamentalfrequency of 500 Hz and 16 harmonics (Fig. 12.5e). This tone has components at500, 1,000, 1,500, . . . , 8,000 Hz. To find the loudness of this tone we need toadd up the contributions from all 16 components. What is interesting about thistone is that the low-frequency components 500 and 1,000 Hz are separated by afactor of 2 and excite different neurons in the auditory system. But the highest-frequency components, 7,500 and 8,000 Hz, are separated by only a factor of 1.07,and they excite mostly the same neurons. Thus, both kinds of addition—separatedcomponents and narrow band—must be done for such a sound.
12.7 Critical Band
The loudness calculations above point up the need for a way to decide whetherthe spectral components of a sound will excite the same neurons in the auditorysystem or different neurons. Strong compression occurs when only the same neuronsare involved. Thoughts like these led to the concept of the critical band. If twospectral components are separated in frequency by more than a critical band, theyexcite different neurons. Two components that are separated by less than a criticalband excite the same neurons. It should be evident that the all-or-nothing characterof this definition of the critical band is only an approximation to what is really acontinuum of interaction along the basilar membrane and in higher auditory centers.Nevertheless, psychoacoustical experiments have found reasonable reproducibilityin measurements of the critical band width.
One way to measure the width of a critical band is by loudness, as suggestedabove. As the frequency separation of two tones increases, the loudness starts toincrease when the separation exceeds a critical band width. Another way to measureis by masking. A weak tone is masked by an intense band of noise if the frequencyof the tone and the frequencies of the noise fall within the same critical band.Masking means that the weak tone cannot be heard because of the intense noise.It is an amazing fact that if the weak tone and the intense noise band are separatedin frequency by more than a critical band then there is almost no masking at all!

Exercises 135
Fig. 12.6 Critical bandwidths are shown by the solidline. They were measuredusing bands of masking noisehaving a notch with variablewidth. One-third octavewidths are shown by thedashed line. Because the plotis a log–log plot, theone-third octave reference is astraight line
Critical band widths determined from masking experiments are given in Fig. 12.6.The dashed line is a reference showing bandwidths that are one-third of an octavewide. Evidently the critical band is wider than 1/3 octave at low frequencies andnarrower than 1/3 octave at high frequencies.
Exercises
Exercise 1, Equal loudness contoursWhat are the axes of the equal loudness contours?
Exercise 2, PhonsWhat is the loudness level in phons of a 300-Hz tone having a sound level of
40 dB?
Exercise 3, Sub-threshold or supra-thresholdIs it possible to hear a 200-Hz tone with a sound level of 10 dB?
Exercise 4, ThresholdIn terms of the equal loudness contours, why is the threshold of hearing said to
be 0 dB?
Exercise 5, Following the curvesWhat is the level of a 4,000-Hz tone that is as loud as a 125-Hz tone having a
sound level of 50 dB?
Exercise 6, How to make loudnessHere is a loudness competition. You start with a 1,000-Hz sine tone having an
intensity of 10�6 W/m2. To increase the loudness, you are allowed to add anothersine tone, also with an intensity of 10�6 W/m2. Your goal is to choose the frequencyof that added tone in order to lead to the greatest possible loudness. Which frequencydo you choose? (a) 100 Hz, (b) 1,000 Hz, (c) 1,100 Hz, (d) 6,000 Hz.
136 12 Loudness Perception
Exercise 7, The compressive law of loudness(a) Show that Eq. (12.8) agrees with the idea that increasing the intensity by a
factor of 10 doubles the loudness. (b) If the intensity of tone 2 is 50 times greaterthan the intensity of tone 1, how much louder is tone 2 compared to tone 1?
Exercise 8, The compressive law used in reverseHow much must the intensity of a tone be increased in order to create (a) four
times the loudness; (b) 16 times the loudness?
Exercise 9, Why is there a valley?Why are equal loudness contours lowest in the frequency range from 3 to 4 kHz?
Exercise 10, Loudness and dBThe band conductor asks the trombone player to play louder. The trombone
player increases the level by 7 dB. How much louder is the sound?
Exercise 11, Listening to your car radioYou are driving at high-speed on a highway listening to your car radio. There is
a lot of road noise, and you need to turn up the level of your radio to hear the music.When you exit the highway and come to a stop at the traffic signal, your radio soundsmuch too loud. How does this relate to neural firing? It should be evident that thetotal neural firing rate in your auditory system is less when you are stopped thanwhen you are driving at high speed. How can you explain the fact that the radio islouder when you are stopped?
Exercise 12, TerminologyBozo objects to the last sentence of the exercise immediately above. He says that
the radio isn’t really louder when you are stopped—it just sounds louder. Set Bozostraight on the scientific definition of loudness.
Exercise 13, Bathroom fansConsumers Reports (January 2004) rates the noise of bathroom fans in units of
sones. Quiet fans are rated from 0.5 to 1.2 sones, and the loudest are rated at 4 sones.How much louder is a 4-sone fan compared to a 0.5-sone fan?
Exercise 14, Contour mapsAs you look at a contour map, you see that at some places on the map the contours
are far apart and at other places the contours are close together. From the spacingof the contours, you learn whether the terrain is rather flat or whether it is steeplyrising. What can you infer from the equal loudness contours in Fig. 12.1. Comparelow-level signals at 62 Hz with low-level signals at 1,000 Hz.
�

Chapter 13Pitch
Pitch is the psychological sensation of the highness or the lowness of a tone.Pitch is the basis of melody in music and of emotion in speech. Without pitch,music would consist only of rhythm and loudness. Without pitch, speech would bemonotonic—robotic. As human beings, we have astonishingly keen perception ofpitch. The principal physical correlate of the psychological sensation of pitch is thephysical property of frequency, and our keen perception of pitch allows us to makefine discriminations along a frequency scale. Between 100 and 10,000 Hz we candiscriminate more than 2,000 different frequencies!
13.1 Pitch of Sine Tones: Place Theory
Because frequency is so important to pitch, we begin the study of pitch with a sinetone, which has only a single frequency. From Chap. 11 you know that the basilarmembrane is selective for frequency. Different frequencies cause the membrane tovibrate maximally at different locations. This, in turn, causes particular hair cellsto be maximally excited by particular frequencies. Each hair cell is connected toparticular neurons in the auditory nerve, and this establishes a neural selectivity forfrequency that is maintained throughout the entire auditory system. The frequencyselectivity of neurons is called “tonotopic analysis,” tono- for tone frequency,and topic for location, meaning that different frequencies excite slightly differentlocations in the brain.
Nothing could be more natural than to assume that the sensation of pitch isthe result of tonotopic analysis. This idea is called the “place theory” of pitchperception. According to this theory, you hear different pitches because differentneurons (different places in your brain) are excited. From years of research,including recent studies of persons with cochlear implants, we know that this placetheory is capable of accounting for many aspects of pitch perception. However, thereis more. . .
W.M. Hartmann, Principles of Musical Acoustics, Undergraduate Lecture Notesin Physics, DOI 10.1007/978-1-4614-6786-1 13,© Springer Science+Business Media New York 2013
137

138 13 Pitch
a
b
Fig. 13.1 The intense tone in (a) produces more neural spikes than the weak tone in (b), but bothtones produce synchronized spikes
13.2 Pitch: Timing Theory
You know about neural firing rate. You know that a greater firing rate correspondsto greater loudness. You know that a high firing rate in certain neurons encodespitch—the place theory mechanism. Now you need to recall a third property of theneural code, introduced in Chap. 11, namely neural synchrony. The firing of a haircell and the spikes in the neurons connected to it synchronize to the input tone. Thishappens because a hair cell tends to fire on a particular phase of the pressure wave inthe cochlea. Figure 13.1 shows the firing of a hair cell that fires on waveform peaks.Part a shows 1/10 s of a 200-Hz sine tone of moderate intensity. This tone causes 12neural spikes, so the firing rate is about 120 spikes per second, but the spikes don’tcome at random times. The time intervals between spikes are integer multiples of aperiod, specifically: 5, 10, 10, 15, 5, 5, 5, 15, 10, 10, 5 ms. This sequence is only anexample. In the next 1/10 s, the sequence of intervals will no doubt be different, butall the intervals will be multiples of 5 ms.
In this way, the timing of the neural spikes encodes the period of the tone, andthis provides another cue to the brain for the pitch of the tone. The idea that thesynchrony of neural spikes leads to the sensation of pitch is called the “timingtheory” of pitch perception. Part b of Fig. 13.1 shows another 200-Hz tone, but lessintense. There are only seven spikes in 1/10 s, but they too are synchronized withthe signal.
So far as the timing theory is concerned, the intervals are still multiples of 5 msand the timing information about pitch is not different for this weaker tone.
13.3 Pitch of a Complex Tone
Most sounds that we encounter are complex. They have multiple frequency compo-nents. If the tone is periodic then the components are harmonic—their frequenciesare integer multiples of a fundamental frequency. Figure 13.2 shows a very typicaltone. It could be a musical instrument tone or a sustained spoken vowel. Ten

13.3 Pitch of a Complex Tone 139
Fig. 13.2 A complex tone with ten harmonics of 200 Hz
harmonics are shown. There are more, but they are normally weaker than thefirst half dozen. The fundamental is the strongest harmonic, which is typical, butfor many other complex tones the fundamental is not the strongest. In fact, thefundamental might not even exist. Nothing that we say about pitch requires thatthe fundamental be strong or even that it be present.
The tone in Fig. 13.2 has a pitch of 200 Hz. That means that if you listen to thattone for about a second or less, and try to sing what you heard, you will sing atone with a fundamental frequency of 200 Hz. Or, to be more precise, you mighthave a sine-tone generator with a knob that controls the frequency. When you adjustthe sine frequency to match the pitch of the complex tone it turns out that you set thegenerator to 200 Hz.
This experimental result makes the timing theory look very good. Because thecomponents are all harmonics of 200 Hz, the period of the waveform is 1/200 s.The prediction of the timing theory and the experimental results agree that (1) thepitch depends on the period and does not depend much on the relative strengthsof the harmonics. (2) The pitch does not depend on the fundamental or other lowharmonics being present in the spectrum. For instance, a tone with the spectrum ofFig. 13.3 also has a period of 1/200 s and it also leads to a pitch of 200 Hz. (3) Thepitch is insensitive to the overall intensity of the tone. By contrast, it’s not clear whatthe place theory has to say about a complex tone. The place theory might predictthat a tone with ten harmonics, like Fig. 13.2, should lead to ten different pitches.After all, the ten different frequencies in the tone excite the basilar membrane at tendifferent places.
Before giving up on the place theory though, we need to do some more exper-imenting. Suppose we have a spectrum like Fig. 13.4 with a 200-Hz fundamentalcomponent and a 10th harmonic component at 2,000 Hz and no other components.Once again, the period is 1/200 s, but this time one clearly hears two distinct pitches,one at 200 Hz and the other at 2,000. This observation agrees with place theory andnot with timing theory. The obvious conclusion is that neither the place theory ofpitch perception nor the timing theory of pitch perception is good enough to accountfor the sensations produced by all possible tones. We shall continue to try to find abetter theory.

140 13 Pitch
Fig. 13.3 The spectrum has components at 800, 1,000, and 1,200 Hz, corresponding to the 4th,5th, and 6th harmonics of 200 Hz. According to most listeners, the pitch is 200 Hz
Fig. 13.4 The spectrum has components at 200 and 2,000 Hz, corresponding to the first and 10thharmonics of 200 Hz. The two components are heard separately—analytic listening
13.4 The Template Theory
The template theory (or template model) of pitch perception deals with some of theproblems of the place theory. The template theory says that from early experience(maybe even prenatal!) you have learned to associate a tone having a harmonicspectrum with a pitch corresponding to the fundamental frequency (or period) ofthe tone. When you hear a tone, you subconsciously match its spectrum with atemplate (a spectral pattern) stored in your memory. The pattern that best matchesthe harmonics in the tone is the pattern that gives the sense of pitch.
An advantage of the template theory is its flexibility. For instance, it can dealsuccessfully with slightly inharmonic tones. Suppose one starts with the 200-Hzcomplex tone of Fig. 13.3 and shifts each component frequency by 30 Hz. Thecomponents then have frequencies 830, 1,030, and 1,230 Hz. This tone does nothave harmonic components, and it is not strictly periodic (Fig. 13.5).
Experiments with this tone show that its pitch is not as well defined as the pitchof a periodic tone, but that listeners rather consistently find the pitch to be about206 Hz. This result provides support for the template theory. According to the

13.4 The Template Theory 141
a
b
Fig. 13.5 (a) The spectrum from Fig. 13.3 is replotted here on a different scale. The fundamentalfrequency and pitch are 200 Hz. (b) The spectrum, shown by lines, has components at 830, 1,030,and 1,230 Hz, and these are not harmonics. However, the spectrum fits reasonably well with aharmonic template having a fundamental frequency of 206 Hz and harmonic numbers 4, 5, and 6,shown by circles
template model, the listener chooses a pitch for which the harmonics of a harmonictemplate would best agree with the components that are actually present. In thiscase, a 206-Hz template would have a fourth harmonic at 4 � 206 D 824Hz, a fifthharmonic at 5 � 206 D 1; 030Hz, and a sixth harmonic at 6 � 206 D 1; 236Hz.Compared to the actual components, the template fourth harmonic would be too low(824 < 830), the template sixth harmonic would be too high (1; 236 > 1; 230), andthe template fifth harmonic would be exactly right. One can make the case that ifone insists on a harmonic template then 206 Hz leads to the best match to the threecomponents actually present. According to the template theory, that is why the brainperceives a pitch of 206 Hz.
Template Model Calculations
To calculate a pitch from a set of spectral frequencies using the templatemodel, you imagine that each frequency in the spectrum suggests a funda-mental. You then average all those suggestions. To begin this process, youfirst need to decide what harmonics shall correspond to the frequencies thatyou are given.For instance, given spectral components at 830, 1,030, and 1,230 Hz youmight decide that these look like harmonics 4, 5, and 6. Therefore, thesuggested fundamentals are 830/4, 1030/5, and 1230/6. The average of theseis
1
3.830=4C 1030=5C 1230=6/D 206 Hz;
in agreement with the more intuitive calculation above. The choice ofharmonics 4, 5, and 6 was consistent with the general observation thatlisteners prefer templates with consecutive harmonics.
142 13 Pitch
13.5 Pitch as an Interpretative Percept
Attempts to build a purely mechanistic theory for pitch perception, like the placetheory or the timing theory, frequently encounter problems that point up theadvantages of less mechanistic theories, like the template theory. Often, pitchseems to depend on the listener’s interpretation. Although the auditory systemsegregates many of the harmonics of a complex tone like Fig. 13.2 into separateneural channels, the brain finds little benefit in hearing out the different harmonicsand tends to hear the tone as a single entity with a single pitch. However, if thespectrum has an unusually large gap, like the gap between harmonics 1 and 10 inFig. 13.4, the brain decides that there are two entities and assigns two pitches. Inthis case the place model works.
But the place model does not explain why it is so important for our perceptionthat the partials of a tone should be harmonic. A harmonic tone holds together and isperceived as a single entity with a single pitch. Inharmonic tones, by contrast, oftenseparate into several entities each with a different pitch.
For an inharmonic tone, the brain might hear the complex as a single tone witha pitch for which the harmonic template would best fit the inharmonic components,or it might hear out the individual components themselves. Hearing a single toneis known as synthetic listening because the listener synthesizes a single pitch fromthe components. Hearing the individual components is known as analytic listeningbecause the listener perceives the spectral analysis originally performed in thecochlea. Listening to a tone for a long time may cause a listener to hear outindividual harmonics—analytic listening. That is why the discussion of the tone inFig. 13.2 suggested listening for a second or less in order to hear a synthetic pitch.Experiments with ambiguous tones (e.g., Exercise 5 below) show that some listenerstend to be synthetic and others tend to be analytic. The variety of experience in pitchperception seems to preclude any really simple mechanistic model. However, thatdoes not prevent us from continued efforts to find one.
Visual TemplatesThe interpretative nature of pitch perception has visual analogues, for
example Fig. 13.6. You can probably recognize a word in the symbols of thatfigure, and yet you have never seen the word written like that before at anytime in your life. How did you do it? The answer is that the symbols are fairlyclose to letters for which you have templates stored in your brain, and thetemplate enables you to make the association between the image on the paperand the letter. Also, the word itself is familiar. As you learned to read, youacquired the habit of linking symbols to form a word as a single entity. On theother hand, the last symbol may remind you of an umbrella. Unusual letterscan separate like that into several entities, each with its own identity. It’s amatter of interpretation, and your brain is engaged in that activity full time,both in the visual world and in the auditory world.
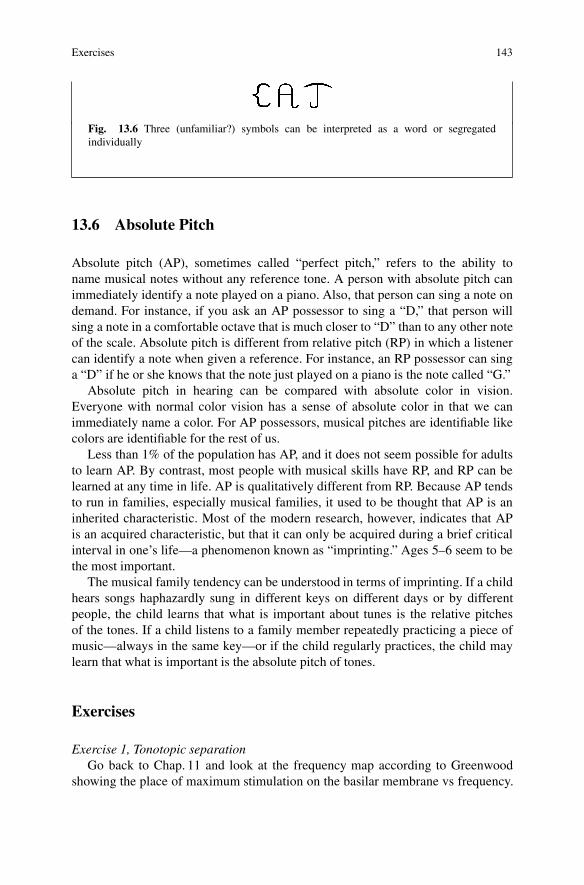
Exercises 143
Fig. 13.6 Three (unfamiliar?) symbols can be interpreted as a word or segregatedindividually
13.6 Absolute Pitch
Absolute pitch (AP), sometimes called “perfect pitch,” refers to the ability toname musical notes without any reference tone. A person with absolute pitch canimmediately identify a note played on a piano. Also, that person can sing a note ondemand. For instance, if you ask an AP possessor to sing a “D,” that person willsing a note in a comfortable octave that is much closer to “D” than to any other noteof the scale. Absolute pitch is different from relative pitch (RP) in which a listenercan identify a note when given a reference. For instance, an RP possessor can singa “D” if he or she knows that the note just played on a piano is the note called “G.”
Absolute pitch in hearing can be compared with absolute color in vision.Everyone with normal color vision has a sense of absolute color in that we canimmediately name a color. For AP possessors, musical pitches are identifiable likecolors are identifiable for the rest of us.
Less than 1% of the population has AP, and it does not seem possible for adultsto learn AP. By contrast, most people with musical skills have RP, and RP can belearned at any time in life. AP is qualitatively different from RP. Because AP tendsto run in families, especially musical families, it used to be thought that AP is aninherited characteristic. Most of the modern research, however, indicates that APis an acquired characteristic, but that it can only be acquired during a brief criticalinterval in one’s life—a phenomenon known as “imprinting.” Ages 5–6 seem to bethe most important.
The musical family tendency can be understood in terms of imprinting. If a childhears songs haphazardly sung in different keys on different days or by differentpeople, the child learns that what is important about tunes is the relative pitchesof the tones. If a child listens to a family member repeatedly practicing a piece ofmusic—always in the same key—or if the child regularly practices, the child maylearn that what is important is the absolute pitch of tones.
Exercises
Exercise 1, Tonotopic separationGo back to Chap. 11 and look at the frequency map according to Greenwood
showing the place of maximum stimulation on the basilar membrane vs frequency.

144 13 Pitch
a bFig. 13.7 Spectrogramsshowing the tone pairs inExperiments a and b called“Analytic or synthetic pitch”
How far apart are places 200 and 2,000 Hz? This large distance is probably thereason that a tone with only these components is not perceptually fused into a single200-Hz tone. Instead the individual components stand out.
Exercise 2, Neural synchrony: interspike interval histogramFigure 13.1 Part a shows neural spikes in response to an intense 200-Hz sine tone.
What time intervals occur between neural spikes? Make a histogram plot that showsthe number of spikes separated by one cycle, by two cycles, and by three cycles.When you are done, you will have made an interspike interval histogram—a veryuseful representation used everyday by neuroscientists. The only difference is thatthey have thousands of intervals in their data, and you have only 11. Make anotherhistogram for the weak tone in Part b of Fig. 13.1.
Exercise 3, A case of the missing fundamentalA complex tone has three components with equal amplitudes and frequencies:
750, 900, and 1,050 Hz. From the template model, what pitch do you expect?
Exercise 4, The template model(a) Complex tone A has three components with equal amplitudes and frequen-
cies: 420, 620, and 820 Hz. (b) Complex tone B has five components with equalamplitudes and frequencies: 420, 620, 820, 1,020, and 1,220 Hz. From the templatemodel, what pitches do you expect?
Exercise 5, Analytic or synthetic pitchThere is a sequence of two tones, first 1 then 2 as shown in Fig. 13.7.
Tone 1 has two equal-amplitude components at 800 and 1,000 Hz.Tone 2 has two equal-amplitude components at 750 and 1,000 Hz.
Do you predict that the pitch goes up or down in Experiment a? How aboutExperiment b?
�

Chapter 14Localization of Sound
The ability to localize the source of a sound is important to the survival of humanbeings and other animals. Although we regard sound localization as a common,natural ability, it is actually rather complicated. It involves a number of differentphysical, psychological, and physiological, processes. The processes are differentdepending on where the sound happens to be with respect to the your head. Webegin with sound localization in the horizontal plane.
14.1 Horizontal Plane
The horizontal plane is the plane parallel to the ground that includes your two earsand your nose. (It is a fact of geometry that it takes three points to define a plane.)We regard your head as a center point and think about sound sources located atother points in this plane. Those other points can differ in distance and azimuth withrespect to your head. We begin with azimuth. The azimuth is an angle typicallymeasured in degrees from the forward direction. Therefore, a point directly in frontof your nose is at 0ı azimuth. Points in space that are directly to your right and lefthave azimuths that are C90ı and �90ı, respectively, as shown in Fig. 14.1.
Modern approaches to sound localization in the horizontal plane are restrictedto sources that lie in a within the 180ı range from your extreme left (�90ı) toyour extreme right (C90ı). The rest of the horizontal plane is behind you, and thatbecomes a matter to be discussed in connection with vertical plane localization.What is significant about this restricted range of locations in the horizontal planeis that different angles lead to signals that are uniquely different in your left andright ears (unless the source is directly in front). Differences between your ears(interaural differences) are processed by part of your nervous system called the“binaural system.” The binaural system consists of several processing centers inthe brain stem and midbrain that receive neural spikes from a processing chain thatstarts with the hair cells in the cochlea. These specialized binaural centers (olivary
W.M. Hartmann, Principles of Musical Acoustics, Undergraduate Lecture Notesin Physics, DOI 10.1007/978-1-4614-6786-1 14,© Springer Science+Business Media New York 2013
145

146 14 Localization of Sound
Fig. 14.1 A head and soundsource (symbol S) in thehorizontal plane. The sourcehas azimuth � with respect tothe forward direction. Awavefront from the sourcearrives at the right ear beforearriving at the left. Also, thehead partially blocks thesound wave coming to the leftear causing it to be lessintense at the left ear
complex, trapezoidal body, and part of the inferior colliculus) are particularly speedyand efficient. The upper levels of this binaural system are combined with visualcenters that also encode location information. This combination allows the auditoryand visual systems to learn from each other.
There are two main kinds of interaural differences, interaural level differences(ILDs) and interaural time differences (ITDs). We will deal with these in turn.
14.1.1 Interaural Level Differences
If a sound source is located off to your right, then it is closer to your right ear thanto your left. Furthermore, a sound wave from the right has to go around your headsomehow in order to arrive at your left ear. Thus, there are two effects causing thesound level to be higher in your right ear than in your left. The first is a distanceeffect and the second is a “head-shadow” effect. Both lead to an ILD.
It is not hard to show that unless a sound source is very close to your head thedistance effect is not important. In Exercise 14.1 you will show that for a sourcethat is 1 m away, the distance effect leads to an ILD no more than 1.4 dB. The effectis even smaller if the source is further away. But the distance effect is of obviousimportance when the source is very close to your head, for instance when there is amosquito in one of your ears.
To deal with the head-shadow effect without the distance effect we assume thatthe source is a few meters away. The head-shadow effect leads to ILDs that canbe quite large, but the ILDs depend on frequency. Figure 14.2 shows the ILD fora source that is off to your right at an azimuth of 10ı, 45ı, or 90ı. The verticalaxis shows how much greater the level is in your right ear compared to your left.The figure shows that at low frequency there is hardly any effect at all. The ILDis essentially zero. That is because the low-frequency sound has a wavelengththat is much larger than your head diameter, and the sound diffracts around yourhead, almost as though it were not there at all. By contrast, at high frequencies thewavelength is small, and your head represents a significant obstacle. At 4 kHz and90ı the ILD caused by head-shadow reaches 10 dB.

14.1 Horizontal Plane 147
Fig. 14.2 The ILD for a sine tone is shown as a function of the frequency of the tone for threevalues of the azimuth, 10ı , 45ı, and 90ı. The values were calculated from a equation for sounddiffraction around a sphere having the diameter of the average human head. The oscillations inthe plots reveal the complexity of the diffraction process. They can lead to some unexpected andconfusing effects in controlled experiments
14.1.2 Interaural Time Differences
If a source of sound is located to your right, then every feature of the waveformarrives at your right ear before it arrives at your left ear. The difference in arrivaltime is known as the ITD. When you first think about it, it is difficult to believe thatthe ITD could have much effect. On the human scale, sound travels very fast, and theears are quite close together. It is hard to imagine that the delay of a sound wavefrontas it passes first one ear and then the other could be a large enough delay to beperceived. In fact, even for a sound at 90ı azimuth (directly to your right) the delayin your left ear is less than 800�s, equivalent to 0.8 ms. Strange as it may seem, thehuman binaural system is capable of dealing with interaural differences that small,and much smaller. It uses the differences to provide important information about thelocation of sounds. To understand how ITD localization works there are two thingsthat we have to know. First, we need to know the relationship between the azimuthof the source and the ITD. Second, we need to know about the ability of the binauralsystem to perceive the ITD.
Source Azimuth and ITDThere is a formula, coming from a simplified theory of sound diffraction, that
can be used to calculate the ITD for a source at azimuth � :
ITD D 3 r
vsin.�/; (14.1)

148 14 Localization of Sound
Fig. 14.3 The interaural time difference (ITD) as a function of azimuth from Eq. (14.1). The ITDis zero in the forward direction (azimuth 0ı) because a source directly in front is equally distantfrom the two ears. For a negative value of the azimuth, the ITD is the negative of what it is for thecorresponding positive azimuth value
where r is the head radius and v is the speed of sound. A typical human head radiusis 8.75 cm, and the factor 3r=v is 763�s. Because the sine function is never greaterthan 1.0, the ITD can never be greater than 763�s. The ITD vs azimuth, accordingto Eq. (14.1), is shown in Fig. 14.3.
The Binaural System and the Usefulness of ITDs The ability of the human brainto make use of the ITD caused by the head is different for different azimuths. Thesystem works best near an azimuth of zero (directly in front), where it is sensitive toan ITD as small as 20�s, corresponding to a change of 1.5ı. At 75ı off to the side,the system is less successful. It is only sensitive to an angular difference of about8ı, but that is more precise than visual localization at that large azimuth.
There are important limitations in the ability of the binaural system to make useof ITD. If the frequency of a tone or noise is higher than 1,400 Hz, the waveformfine structure is too fast for the system to follow. Then the binaural system canonly register time differences in the envelope (i.e., the amplitude), including theonset. Evidently, the use of ITD depends on the frequency range. To illustrate thedifferent ways that ITD can be used, Fig. 14.4 shows a tone with an abrupt onset anda frequency glide or sweep—musically known as a “glissando.”

14.1 Horizontal Plane 149
Fig. 14.4 The figure shows a high-frequency tone (1,800 Hz) that quickly sweeps to a lowfrequency (800 Hz). The high-frequency tone is modulated so its amplitude varies slowly. Thesource of the tone is 33ı to the right. Therefore, from Eq. (14.1), the signal in the right ear leadsthe signal in the left by 417�s. The binaural system can respond to this ITD in three ways, shownby numbers between the plots. (1) The onset occurs first in the right ear. (2) The structure in themodulation of the high-frequency waveform occurs first in the right ear. The 1,800-Hz waveform istoo fast to observe the ordered structure in the waveform, but the ordered structure in the envelope(amplitude) can be seen. (3) The fine structure in the 800-Hz waveform occurs first in the right ear.Unlike the waveform fine structure at 1,800 Hz, the fine structure at 800 Hz is slow enough for thebinaural system to measure
Binaural beats
Binaural beats occur when sine tones of slightly different frequency areseparately sent to the left and right ears using headphones. Because the twofrequencies are not physically combined there are no real beats, but there canbe beats in the brain leading to a spatial effect. For instance, given a 500-Hztone in the left ear and a 501-Hz tone in the right, most listeners hear a tone,with a pitch near 500 Hz, moving back and forth within the head once persecond. If the frequencies are increased to 1,000 and 1,001 Hz, the frequenciesare high enough that binaural effects are weak and the binaural beats are hardto hear.To get a visual impression of the binaural effect, return to Fig. 6.4, which wasdrawn to explain real beats. Imagine that the solid curve represents the signalin your left ear and that the dashed curve represents the signal in your right.Notice that along the time line between 10 and 20 ms, the dashed curve seemsto lead the solid curve. Now notice that between 80 and 90 ms the solid curveseems to lead the dashed. Your brain interprets this situation as a source firston the right and then on the left. (Recall that for visual purposes Fig. 6.4 hasfrequencies of 500 and 510 Hz leading to ten beats per second instead of onebeat per second.)

150 14 Localization of Sound
Summary
The sections above have described horizontal (azimuthal) plane localization forsteady-state sounds—the continuous parts of sine tones or complex tones with asimple spectral structure and no abrupt onset. Abrupt onsets lead to additionallocalization information that will be discussed in the section on the precedenceeffect. The interaural differences, ITD and ILD, in the waveform of a steady sound,or a sound with a slow onset, normally work together to localize the sound. The ITDseems to have the stronger influence, but the ITD has the limitation that it is onlyuseful for frequencies below about 1,400 Hz. For tones above the not-particularly-high frequency of 1,400 Hz, the ILD is the main influence on localization, thoughsome additional information is available from the ITD in the modulation of a time-varying signal, as shown in segment (2) of Fig. 14.4.
Sine tones without abrupt onsets have no modulation, as shown by segment (3)in Fig. 14.4. The usefulness of the ITD and the ILD in sine tones has a curiousfrequency dependence. At very low frequencies (below 200 Hz) the wavelength isso large compared to the size of the head that diffraction causes the levels in thetwo ears to be almost the same, and the ILD is too small to be useful. The ITDis usable at very low frequencies, though it is not particularly accurate because theperiod (greater than 5,000�s) is so long that timing it is difficult. At low frequencies(400–900 Hz) the ITD process becomes highly effective and accurate. At quitehigh frequencies, above 2,000 Hz, the head provides a reliable shadow on the earfarther from the source, and the ILD is a useful cue. For intermediate frequencies(1,000–2,000Hz) ITD information is weak or nonexistent. Also, head diffractionbecomes a complicated function of both frequency and source azimuth causing theILD information to be confusing. As a result, sine tone localization is worst in thisintermediate frequency region.
14.2 Localization in the Vertical Median Plane
The vertical median plane is the plane that includes the points directly in frontof you, directly in back of you, and directly overhead. Points in this plane aresymmetrical with respect to your two ears. Therefore, sources in this plane leadto no important interaural differences. Nevertheless, you are able to localize sourcesin this plane. For instance, you can tell the difference between front and back. Onereason that you can do this is that you can turn your head so that the source issomewhat off to the left or right. Then your ability to make left–right localizationjudgments coupled with your sense of motion enables you to distinguish front fromback. However, if the sound is too brief for you to turn your head, or if you areunable to move your head, you can still tell front from back. That’s because soundsfrom the front and back are differently filtered by the anatomy of your head. Yourhead does not have front–back symmetry (no nose on the back of your head), and

14.3 The Precedence Effect 151
this is especially true of your outer ears. The diffraction of short-wavelength soundsfrom these anatomical features leads to filtering of high-frequency sounds that isdifferent for sounds coming from different directions in the median plane. The mostimportant frequencies are above 6,000 Hz. Your brain has learned to recognize thespectral shapes that these anatomical filters impose on sound waves, and that is whatenables you to localize sources in the vertical median plane.
The same kinds of spectral discriminations, in combination with the azimuthal,interaural localization processes, mediate the ability to distinguish between frontand back and to perceive the elevation of sources off to the left or right. Experimentson front–back localization show large individual difference. Some people candistinguish directly in front from directly in back with noise bands near 6,000 Hzthat are only a few kilohertz wide. Other people require very wide bands extendingwell above 10 kHz.
14.3 The Precedence Effect
The interaural differences and the spectral cues that are so important to soundlocalization are determined by the location of the sound source with respect to yourhead. Perhaps a coin is dropped on the table to your right or there is a talker to yourleft. The waves that come to your head directly from the source of the sound containthe useful localization cues.
A potential problem occurs when sounds are heard in a room, where the wallsand other surfaces in the room lead to reflections. Because each reflection from asurface acts like a new source of sound, the problem of locating a sound in a roomhas been compared to finding a candle in a dark room where all the walls are entirelycovered with mirrors. Sounds come in from all directions and it’s not immediatelyevident which direction is the direction of the original source.
The way that the human brain copes with the problem of reflections is to performa localization calculation that gives different weight to localization cues that arriveat different times. Great weight is placed on the information in the onset of thesound. This information arrives directly from the source before the reflections have achance to get to the listener. The direct sound leads to localization cues such as ILD,ITD, and spectral cues that accurately indicate the source position. The brain givesmuch less weight to the localization cues that arrive later. It has learned that theygive unreliable information about the source location. This weighting of localizationcues, in favor of the earliest cues, is called the precedence effect.
There are a number of rather amazing audio illusions that demonstratethe precedence effect using electronic reverberation simulators. For instance, if oneplays a recorded voice from the right loudspeaker of a left–right stereo pair andplays the reverberation of that sound from the left loudspeaker, a listener will hearthe sound coming from the right, even if the sound from the left speaker is 8 dBmore intense. The precedence effect operates here because the reverberant soundresembles the direct sound but arrives later.

152 14 Localization of Sound
Fig. 14.5 A click pair to study the precedence effect: there are four pressure pulses, two at theright ear and two at the left. Pulses 1 and 2 form a leading click. Pulses 3 and 4 form a laggingclick. However, the pulses come so close together in time that they sound like a single click image.(The time axis shows microseconds.) The leading click represents a direct sound arriving from thelistener’s right. The lagging click represents a reflected sound from the listener’s left. Even thoughthe reflected sound has an ITD (�500�s) that is larger in magnitude than the direct sound (300�s),the direct sound wins the competition. The listener hears the sound coming from the right becauseof the precedence effect. The direct sound arrives first
The precedence effect is particularly easy to study with a click pair, as shownin Fig. 14.5. A click has all frequencies, high, medium, and low, and all of theanatomical localization processes are available. Experiments with click pairs haveemphasized that the precedence effect relies importantly on high levels of the centralnervous system. Infants do not have it—it is developed in childhood. Also, theprecedence effect can be affected by context. A long series of click pairs withthe leading click on the right, i.e., repeatedly presenting the click pair shown inFig. 14.5, will bias the system. If that series is followed by a click pair with theleading click on the left, that last click will split into two images—one to the leftand one to the right.
14.4 Perceived Auditory Space
Sound localization, as described earlier in this chapter, is an important perceivedspatial effect, but it is not the only perceived spatial aspect of our auditory expe-riences. Other aspects include auditory image externalization, distance perception,and compactness.
Externalization: The burst of noise when you open a soda bottle is not onlylocalized, it appears to be “out there” somewhere in the space where you live. It is“externalized.” Similarly, an electronic burst of noise reproduced by a loudspeakerin a room leads to an externalized auditory image. If you take that same electronicburst of noise and send it to a listener wearing headphones (same noise signal into
14.4 Perceived Auditory Space 153
both left and right headphones), the listener will not perceive an externalized image.Instead, the listener tends to hear the noise within the head.
The distinction between externalized sounds and internalized sounds is importantenough that auditory scientists use the term “lateralization,” instead of the word“localization,” to describe the perceived location of headphone-presented soundsheard within the head. Fortunately for the science of binaural hearing, it happens thatthere is a rather good correlation between localization and lateralization. Imaginea real sound source—somewhere out there—that produces interaural differencesthat cause the image to be localized half way between the front and the side. Ifthe same interaural differences are produced using headphones, the image will belateralized about half way between the center of the head and the extreme right.Therefore, much of what we know about sound localization was actually discoveredin headphone experiments studying lateralization. Nevertheless, externalization is aseparate perceptual phenomena, and for many years it was something of a mystery.The mystery was solved when auditory scientists began to study the detaileddiffraction of sound waves by the human head, upper torso, and, especially, theexternal ears (pinna). These anatomical features put their own distinctive stamp onthe frequency content of broadband sounds like noise bursts as a function of therelative location of the source. The different diffraction of different frequencies isa directionally dependent filter, and we listeners have got used to the features ofthat filtering by our own anatomy. When a sound does not exhibit the filtering of ourown anatomy, our brains reject the concept that this sound is created by a real sourcesomewhere out there. The appearance of the sound inside the head is apparently adefault condition.
Perceived distance: Externalized sounds may be heard as close to us or far away.Understanding how we as listeners perceive the distance of a source is not easy. Ofcourse, when there is a mosquito in your ear, there is a big ILD, but wheneverthe source is more than a few meters away from the head there are no useableinteraural differences between distant sources and nearby sources. A first step inunderstanding distance perception is to realize that controlled experiments showthat we are actually not very good at it. Sound intensity, perceived as loudness, isa cue because of the inverse square law, but when the intensity is randomized, wecan’t distinguish 2 m from 10 m or more. When sounds are heard in a room, theratio of direct sound to reverberated sound is a useable distance cue. The ratio issmaller for distant sources, and this is particularly useful in comparing the distanceof two different sources in the same room. In addition, very distant sounds aredistinctive because the air itself particularly absorbs high frequencies. This filteringeffect becomes noticeable when the path length is long.
Compactness: A compact image is perceived to be localized (or lateralized) ata point. The opposite of a compact image is a diffuse image. A diffuse imageseems to be spread out in space; it may even surround us. The compact-diffusedistinction is particularly easy to study using headphones. In the early days ofsound localization research, experimenters produced tones with ILDs that favoredthe right ear and ITDs that favored the left ear or vice versa. They wanted to see

154 14 Localization of Sound
which interaural difference would win—lateralization to the right or the left? Theyfound that conflicting interaural differences led to an image that was not compact.Sometimes it split in two, other times it became a fuzzy ball inside the head.
Compact images tend to occur when the signals in the two ears resemble oneanother. There may be an ILD or there may be an ITD, but if the signals arerecognizably the same sort of thing on oscilloscope tracings, then a listener willtend to hear a compact image. Monophonic sound reproduction from a singleloudspeaker leads to a compact image. Even in a room, a listener can accuratelylocalize the loudspeaker because of the precedence effect. That is not a welcome factwhen listening to recorded music. Stereophonic reproduction (two slightly differentsignals from two loudspeakers) leads to a more diffuse—more surrounding—experience because it helps to make the waves in the two ears to be more different.Similarly, it has been discovered that successful concert halls emphasize reflectionsfrom the sides which lead to significant differences in the signals received by thetwo ears, promoting the surround effect.
Exercises
Exercise 1, The distance effect on ILDThe distance between your ears is about 18 cm. Therefore, if a sound is 1 m away
from your right ear, it can be no more than 1.18 m away from your left. (a) Use theinverse square law for sound intensities to show that the level in your right ear canbe no more than 1.4 dB greater than the level in your left ear due to the distanceeffect alone. This calculation ignores the head-shadow effect. (b) Suppose that thesource is 0.5 m away from your head. Show that the level difference is larger, namely2.7 dB. This result generalizes. The closer the source, the greater the ILD caused bythe distance effect.
Exercise 2, How big is your head?(a) Why is it not possible to use the interaural level difference (ILD) to localize
sounds with frequencies below 100 Hz? (b) If you wanted to make use of ILD at lowfrequency would you like your head to be larger or smaller than it is? Why?
Exercise 3, ILDs at 2,000 HzUse Fig. 14.2 to estimate the smallest detectable angular change for a 2,000-Hz
source. Assume that the source azimuth is between 10ı and 45ı, and assume that alistener can detect an ILD change as small as 0.5 dB.
Exercise 4, Interaural time difference(a) Show that Eq. (14.1) is dimensionally correct. (b) Calculate the ITD for
azimuths of 30ı, 45ı, and 60ı. Compare your answers with Fig. 14.3.

Exercises 155
Exercise 5, Which plane?Is localization better in the horizontal plane or the vertical plane? What would
one mean by “better?”
Exercise 6, The front/back problemHow is it possible to tell whether a sound comes from in front of you or behind
you? Such locations would seem to be symmetrical with respect to your ears andhead.
Exercise 7, Older listenersOlder listeners have much more difficulty making front–back distinctions com-
pared to left–right distinctions. Can you explain why?
Exercise 8, Precedence effectWhat is the precedence effect? Why is it important for localizing sound in rooms?
Exercise 9, Personal experiencesRecall experiences you have had when you were confused about the true location
of a source of sound. Sound localization is such a tricky business that everyone hashad such experiences.
�

Chapter 15Sound Environments
The study of sound in the environment begins by thinking about the different waysthat sound can travel from a source to a receiver. There are five important processesas shown in Fig. 15.1:
� Direct sound travels in a straight line path through the air from source to receiver.This is always the path of shortest length.
� Reflected sound hits a wall or other surface and bounces off. Reflected soundstays in the room with the source. Some of the reflected sound arrives at thereceiver in the same room.
� Transmitted sound goes directly through a wall to a receiver in another room.Possibly that occurs because there are holes in the wall. Possibly it occursbecause the wave from the source vibrates the wall and the wall reradiates thesound on the other side.
� Propagated and transmitted sound is like transmitted sound, but it may followa long path. It may be propagated through air ducts or as vibrations along thesurfaces of pipes or partitions. A concrete floor can propagate the noise of amachine long distances within a building.
� Absorbed sound is wasted sound. Absorption is different from the other processesbecause after absorption there is no more sound. Absorbed sound does not get toa receiver, instead it is turned into heat by friction. Actually, the ultimate fate ofall sound is to be absorbed somehow, somewhere. That fact is part of a generaltruth: all energy that is used in our world (mechanical, electrical, chemical, oracoustical) ultimately ends up as heat.
15.1 Reflections from a Surface
The reflection of sound plays an important role in almost all environments. As notedin Chap. 6, reflection from a surface can be specular or diffuse:
W.M. Hartmann, Principles of Musical Acoustics, Undergraduate Lecture Notesin Physics, DOI 10.1007/978-1-4614-6786-1 15,© Springer Science+Business Media New York 2013
157

158 15 Sound Environments
Fig. 15.1 In this cartoon, asource of sound (S) radiatessound that propagates directlyto a receiver (or listener, L) bya direct path (D), is reflectedfrom a wall (R), is transmittedthrough the wall (T), ispropagated along the thinpanel and transmitted fromthe end of that panel (PT), oris absorbed on the wall (A)
(a) Specular reflection is like a billiard ball bouncing off a cushion on a billiardtable. The angle of incidence is the same as the angle of reflection.
(b) Diffuse reflection is like a high-speed tomato hitting a wall. The sound wavebounces off at many different random angles. Specular reflection occurs ifthe surface is smooth, with bumps that are small compared to the wavelengthof the sound. Diffuse reflection occurs if the bumps on the surface arecomparable to the wavelength or larger.
PerspectiveIf you are used to thinking about the way that sound propagates as a wave,complete with diffraction and interference effects, you may be surprisedto find sound waves treated as though they were bouncing balls as theyreflect from a surface. Does this mean that the nature of sound has changedsomehow? No, sound waves are still waves, and there are precise (butcomplicated) experimental and theoretical ways to deal with the interactionof these waves with surfaces. But for many practical purposes it is anadequate approximation to imagine a wave as following the path of aprojectile like a ball as it reflects (bounces) off a surface. The most importantassumption in the approximation is that the surface itself (whether it besmooth or bumpy) is large compared to the wavelength of sound. Becausesound wavelengths are often large (4 m for bass notes) it is clear thatthis assumption requires large surfaces. That is why the bouncing ball (orsplattering tomato) approach is used in describing rooms. Rooms are large.
15.2 Transmission Loss
We often have the goal of minimizing sound transmission, for example minimizingthe transmission of a conversation from one office to another, or the sound of atelevision from one apartment to another. Unfortunately, the superb dynamic rangeof the human hearing process works against efforts to reduce the annoyance of

15.3 Room Acoustics 159
transmitted sound. Consider that if you succeed in eliminating 99 % of the soundintensity, you have only reduced the level by 20 dB (see Exercise 4). A reductionof only 20 dB may not be enough to eliminate the disturbance caused by unwantedsound, especially if the sound includes information such as speech.
Sound transmission can be reduced by barriers, such as walls. The reductionof transmitted sound intensity by a wall is the attenuation of the wall. A wall canattenuate sound in two ways. It can absorb sound and it can reflect sound. Sound isabsorbed by a wall when wall surfaces vibrate and convert the energy into heatthrough friction. Sound is reflected when it comes to an interface between twodifferent media. A double wall works well because there are multiple changes ofmedium: air, to wall, to air, to second wall, to air again. Upon each reflection there issome absorption, and that eliminates sound. Walls also transmit sound, and thereforefail to some degree, because of holes in the wall (like a gap under a door) andbecause the walls are caused to vibrate as a whole by the incident sound. To avoidvibration of an entire wall the wall material should be heavy. Lots of mass is the bestway to avoid transmission by vibration. Unfortunately it is a costly way to build.
As a general rule, high-frequency sounds are effectively reflected or absorbedby walls, but low-frequency sounds tend to get transmitted. Plotting the attenuationof a wall (in dB) as a function of frequency always leads to a rising curve—moreattenuation for higher frequency. Walls can be characterized by sound transmissionclass (STC) which refers to the attenuation at 500 Hz, an arbitrarily chosenfrequency. If a wall has a STC rating of 40 dB, you can expect that it will attenuatea 500-Hz sound by 40 dB. It will likely attenuate a 200-Hz sound by less than 40 dBand will attenuate a 2,000-Hz sound by more than 40 dB.
15.3 Room Acoustics
The subject known as “room acoustics” is concerned with what happens insidethe room containing the source and not about what happens outside. Therefore,it involves direct sound and reflected sound. Sound that is not reflected back intothe room is of no interest. Whether this sound is absorbed on the walls of theroom and turned into heat or is transmitted out of the room through the walls, theroom acoustician says that it is “absorbed.” (Ultimately, of course, the lost sound isabsorbed, even if it happens to be transmitted elsewhere first.) For instance, an openwindow is said to be a perfect absorber because all the sound that hits the windowgoes out and never returns. Thus, from the point of view of the room acoustician,sound that hits a wall is either reflected or absorbed. If 30 % of the sound power isreflected, then 70 % is said to be absorbed.

160 15 Sound Environments
Fig. 15.2 Impulses measured at the position of a listener in a room with a single wall
15.3.1 Early Reflections in a Room
Suppose there is a source, a listener, and a single wall that creates a strong reflection.If the source makes an impulsive sound, like a hand clap at time zero, then there isa brief delay for the direct sound to get to the listener and a longer delay for thereflection (Fig. 15.2).
In a real room with real walls there are multiple early reflections because of singleand double reflections from all the walls and other surfaces. Most important for goodacoustics is the time gap between the arrival of the direct sound and the arrivalof the early reflections. A good listening environment has numerous reflectionsthat arrive with a gap much shorter than 50 ms. Reflections that arrive within thefirst 20 ms give a sense of intimacy to the acoustical environment. Reflections thatcome from the side walls give a sense of “surround” or “spaciousness,” a desiredeffect in listening to music. Side wall reflections lead to an incoherence between thesound waves at a listener’s left and right ears. The incoherence is responsible forthe sense of envelopment—the impression of being “in the sound.” Stereophonicsound reproduction has a similar effect in the audio domain. Reflections from theceiling contribute favorably to the loudness, but they do not lead to the same senseof spaciousness.
Echoes If a strong single reflection arrives more than 50 ms after the direct soundthe listener perceives an echo, which is defined as a distinctly heard repetition of thedirect sound. Echoes are acoustically bad—really bad. Echoes cause speech to behard to understand and they cause music to sound “muddy.” Even in an environmentwith lots of other reflections, a particularly intense reflection that is delayed as longas 50 ms can create an echo. Rooms that suffer from an echo must be treated inorder to be satisfactory spaces for listening. The location that leads to the offendingreflection (usually a back wall) can be covered with absorber. Alternatively, thelocation can be reshaped to reflect sound over a wide range of angles.

15.3 Room Acoustics 161
ba
Fig. 15.3 In parts (a) and (b), sound waves come in from the left and are reflected by a curvedsurface. In part (a) the rays are focused at a point causing the intensity to be large there. In part(b) the rays are widely dispersed, helping to create an even distribution of sound intensity
15.3.2 Focused Sound
You know that if sound is reflected from a large, smooth, flat surface, then the soundray, defining the direction of travel of the wave, bounces off the surface like a ball.Suppose the surface is curved. What then? A concave surface tends to focus soundsas shown in Fig. 15.3a. Concave surfaces are found in cylindrical auditoriums or inrooms with a prominently curved back wall. They occur with domed ceilings asare found in many ceremonial spaces. In extreme cases concave surfaces createwhispering galleries, where two people can communicate over amazingly longdistances because the vocal waves that are emitted in all directions end up beingfocused at the location of the listener.
Apart from the fun of whispering galleries, focused sound is normally a badthing. Focusing of sound can make a delayed reflection strong enough to be heardas an echo. Even if the focused sound is not delayed long enough to create anecho, the focusing concentrates sound power at particular location(s) in the room,while inevitably depriving other locations of power. For good room acoustics, onewould prefer that sound power be evenly distributed throughout the room. Evendistribution is actually promoted by convex surfaces, which scatter sound waves asshown in Fig. 15.3b. Along with bumpy surfaces, convex surfaces are normally ahelpful addition to good sound distribution in a room.
15.3.3 Reverberation
In an ordinary room, sound is reflected from all the surfaces. It is reflected andre-reflected and re-reflected again. After awhile there are so many reflections that itbecomes pointless to keep track of individual reflections and where they come from.These reflections come in a dense mass that is called “reverberation.” Reverberationis the primary consideration for rooms that are especially designed for listening,and the most important acoustical specification for a room is the reverberation time.The reverberation time is the length of time that a tone persists in room after thesource has been turned off.

162 15 Sound Environments
a b
Fig. 15.4 (a) To measure the reverberation time we turn off a tone and measure the time that ittakes for the sound to fade away by 60 dB as shown by the idealization in (a). That time is T60. In theless-than-ideal conditions shown in (b) there are two problems. First, the decay is not uniform;second, we can only measure about 40-dB until we reach the noise background. To find T60 we usethe data we have and estimate the best straight line (shown dashed) down 60 dB
The reverberation time is determined by a simple experiment. A tone, withfrequency f , is turned on and allowed to fill the room. Then the tone is abruptlyturned off. The tone will then decay away and the experimenter measures the timethat it takes for the tone to decay by 60 dB. That time is the reverberation time,called T60, at frequency f . The choice of 60 dB is a somewhat arbitrary standard,but it corresponds rather well with our subjective impression of the duration of thedecay (Fig. 15.4).
The Sabine Equation It is possible to estimate the reverberation time based on afew simple physical properties of the room. (1) The reverberation time is shorter ifthere is a lot of absorption in the room, especially on the walls and other surfaces.The greater the absorption, the faster the room loses sound intensity. (2) Thereverberation time is longer if the room is larger because sound has to travel furtherbefore it can be absorbed on the room surfaces. These two ideas about reverberationtime form the basis of the Sabine equation,
T60 D 0:16 V=.AT /: (15.1)
Here, T60 is the reverberation time in seconds, V is the volume of the room in cubicmeters, and AT is the total absorbing area in square meters. The number 0.16 hasunits of seconds per meter. It has to account for the fact that the quantity V=.AT /on the right-hand side of the equation has dimensions of length (meters) and theleft-hand side has dimensions of time (seconds). This numerical value (0.16) wouldbe different for a calculation done in English units of volume and absorbing area orfor a different reverberation time such as T30.
The volume of the room (V ) is a simple concept. If the room is rectangular thevolume is just the length times the width times the height. The total absorbing area(AT ) needs some discussion. The AT is the sum of all the absorbing surface areasin the room. To find an absorbing surface area, you start with the area itself (A),measured in square meters, and multiply by the absorption coefficient (˛) for thesurface material. Absorption coefficients depend on the material and they dependon frequency too. That is why the reverberation time depends on frequency.

15.3 Room Acoustics 163
Your intuition already tells you something about absorption coefficients. Supposea high-frequency tone (e.g. 2,000 Hz) encounters heavy draperies. You expect thata lot of that sound will be absorbed. Therefore it does not surprise you to learn thatthe absorption coefficient at 2,000 Hz for heavy drapes is 0.70, meaning that 70 %of the sound power will be absorbed. At the other end of the scale, you expect thatglazed tile reflects most of the incident sound and you are not surprised to learn thatthe absorption coefficient is about 0.01, meaning that only 1 % of the incident soundintensity is absorbed. Absorption coefficients can be found in the table at the end ofthe chapter.
Calculating Reverberation Time The difficult part of Eq. (15.1) is the totalabsorbing area, AT . Mathematically, we say that the total absorbing area is a sumof surface areas times their absorption coefficients plus the sum of the effectiveabsorbing areas (EA) attributed to individual objects like chairs or persons.
AT DX
surfaces
Asurface˛surface CXobjects
EAobjects (15.2)
For example, if a room has four walls, each with an area of 100 m2 and anabsorption coefficient of 0.3, and a floor and ceiling, each with an area of 400 m2
and an absorption coefficient of 0.1, then the sum over surfaces is 4 � 100 � 0:3C2� 400� 0:1. That sum is 200 m2. If this room is occupied by 40 adult persons thenthe absorbing area is increased by 40 times the effective area of a person. From thelast entry in the Table of Absorption Coefficients we see that the effective absorbingarea of a person (at 500 Hz) is 0.45 m2. Thus, the sum of objects is 40 � 0:45 or 18,and in the end AT D 218m2.
Reverberation and Intensity in a Large Room There is a useful analogy to soundand its reverberation in rooms, namely a stream of water from a hose trying to filla leaky bucket. The stream of water represents the source of sound. The bucketrepresents the room, and the leak is the absorption. If the stream of water flowinginto the bucket suddenly stops, it takes a while for all the water to leak out of thebucket. The time to drain the bucket is analogous to the reverberation time.
This analogy can go further. Suppose that all the holes in the bucket aresomehow plugged up. Then, a continuing steady stream of water into the bucketwill cause the level to rise indefinitely. Similarly, if it were somehow possible toeliminate all the absorption in a room, the sound intensity would grow without limit.Eventually the sound would be intense enough to destroy the walls.
In a physically reasonable case, it is not possible to eliminate all the absorption.The correct analogy to realistic absorption is to imagine that the leaky bucket hasholes punched up the sides. The higher the water level the greater the flow of waterleaking out. What happens then is that the level of water in the bucket will rise untilit reaches a steady state where the rate of water flow from the hose is equal to therate of water flow out all the leaks. Similarly, the level of sound in a room will growuntil the rate of sound absorption is equal to the power of the source. As a result,

164 15 Sound Environments
rooms with little absorption are “loud” rooms. The intensity of a steady-state soundin a room from a source with power P is given by
I D 4P=AT : (15.3)
You will notice that this formula for intensity does not include any informationabout the distance to the source. The formula calculates the intensity in thereverberant field, measured at places that are far enough away from the source thatthe intensity is dominated by reverberated sound and not by direct sound.
Because excessive reverberation makes speech hard to understand, you mightimagine that the ideal classroom or auditorium intended only for speech would haveno reverberation at all, i.e., the reverberation time would be zero. By aggressiveuse of absorbers (carpet on the floor, acoustical tile on the ceiling, and sound-absorbing panels on the walls) it is possible to reduce the reverberant sound to avery small level. However, too much absorption leads to the problem of inadequateintensity. For a room seating more than 100 persons, a talker needs reflections fromthe surfaces of the room to be heard clearly. In the end, when designing a room forspeech comprehension a designer cannot simply apply absorption mindlessly. Thereis no substitute for good judgement.
Recommended Reverberation Times
� For classrooms and other environments where it is important to hear speechclearly, T60 should be about 0.5 s.
� For baroque concertos or small jazz ensembles where it is important to hear innervoices, T60 should be about 1.5 s.
� For romantic music where the goal is emotional drama, T60 should be between1.9 and 2.2 s.
� To produce the big sound of an organ in a church T60 should be 2.5 or greater.A vast cathedral may have a reverberation time as long as 9 s.
15.4 Gaining Control of Acoustical Spaces
When a new concert hall or major theater opens in a community, it is a time of greatlocal interest and pride. It is also a time of anxiety. How will the new hall sound?Will speech be comprehensible? Will music be rich and exciting? The developersor the community have raised millions of dollars to build the hall. Will it work asintended?
You might think that the acoustical design of a hall ought to be a sure thing.After all, the Sabine equation has been known for many years and the absorbingcharacteristics of materials are well known. There should be no problem withgetting the reverberation times right at low, mid, and high frequencies. However,there are other details, especially in the early reflections, that are critical to the
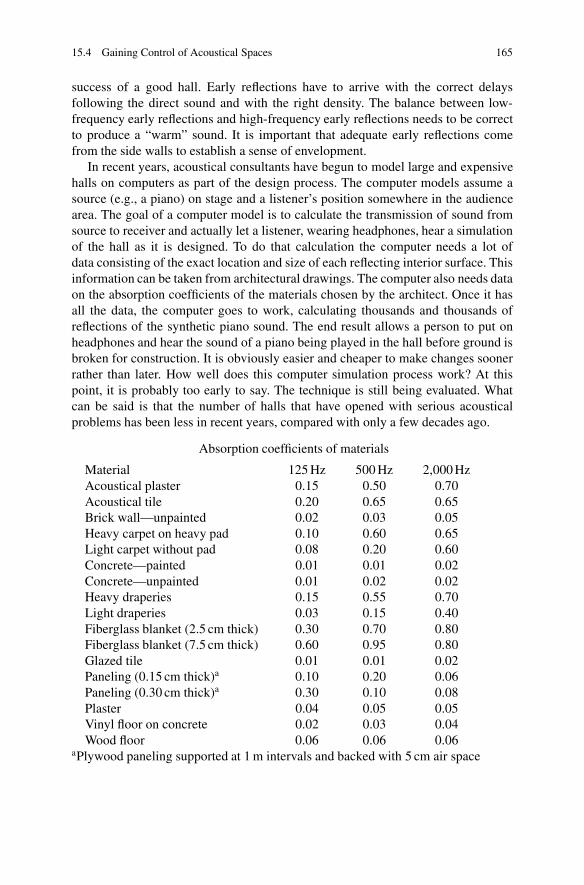
15.4 Gaining Control of Acoustical Spaces 165
success of a good hall. Early reflections have to arrive with the correct delaysfollowing the direct sound and with the right density. The balance between low-frequency early reflections and high-frequency early reflections needs to be correctto produce a “warm” sound. It is important that adequate early reflections comefrom the side walls to establish a sense of envelopment.
In recent years, acoustical consultants have begun to model large and expensivehalls on computers as part of the design process. The computer models assume asource (e.g., a piano) on stage and a listener’s position somewhere in the audiencearea. The goal of a computer model is to calculate the transmission of sound fromsource to receiver and actually let a listener, wearing headphones, hear a simulationof the hall as it is designed. To do that calculation the computer needs a lot ofdata consisting of the exact location and size of each reflecting interior surface. Thisinformation can be taken from architectural drawings. The computer also needs dataon the absorption coefficients of the materials chosen by the architect. Once it hasall the data, the computer goes to work, calculating thousands and thousands ofreflections of the synthetic piano sound. The end result allows a person to put onheadphones and hear the sound of a piano being played in the hall before ground isbroken for construction. It is obviously easier and cheaper to make changes soonerrather than later. How well does this computer simulation process work? At thispoint, it is probably too early to say. The technique is still being evaluated. Whatcan be said is that the number of halls that have opened with serious acousticalproblems has been less in recent years, compared with only a few decades ago.
Absorption coefficients of materials
Material 125 Hz 500 Hz 2,000 HzAcoustical plaster 0.15 0.50 0.70Acoustical tile 0.20 0.65 0.65Brick wall—unpainted 0.02 0.03 0.05Heavy carpet on heavy pad 0.10 0.60 0.65Light carpet without pad 0.08 0.20 0.60Concrete—painted 0.01 0.01 0.02Concrete—unpainted 0.01 0.02 0.02Heavy draperies 0.15 0.55 0.70Light draperies 0.03 0.15 0.40Fiberglass blanket (2.5 cm thick) 0.30 0.70 0.80Fiberglass blanket (7.5 cm thick) 0.60 0.95 0.80Glazed tile 0.01 0.01 0.02Paneling (0.15 cm thick)a 0.10 0.20 0.06Paneling (0.30 cm thick)a 0.30 0.10 0.08Plaster 0.04 0.05 0.05Vinyl floor on concrete 0.02 0.03 0.04Wood floor 0.06 0.06 0.06
aPlywood paneling supported at 1 m intervals and backed with 5 cm air space

166 15 Sound Environments
Absorbing areas (m2)
Object 125 Hz 500 Hz 2,000 HzAdult person 0.30 0.45 0.55Heavily upholstered theater seat 0.33 0.33 0.33
Exercises
Exercise 1, Something there is that doesn’t like a wallStandard home wall construction consists of dry-wall panels mounted on two-
by-four studs. Explain the mechanisms of sound transmission through such a wall.How can sound transmission be reduced? Does it help to fill the wall with fiberglassinsulation?
Exercise 2, Bad roomsThink about bad acoustical environments you have experienced. What do you
think made them bad?
Exercise 3, Confronting brick wallsYou are on a committee to design a new auditorium. Your colleague argues that
using a brick interior wall would be preferable to using a plaster wall because thebrick wall is rough and will lead to diffuse reflection. Diffuse reflection is desirablein an auditorium. What is your opinion of this argument?
Exercise 4, Decibels once againThe text says that by reducing the sound intensity by 99 % you reduce the sound
level by 20 dB. Prove that this statement is true.
Exercise 5, All energy ultimately turns into heatThe text says that the ultimate fate of all energy is to be turned into heat. Is that
really true. How about nuclear energy? Would that be an exception?
Exercise 6, Practice with the Sabine equationIn the text, Eq. (15.2) was illustrated with a room having a total absorbing area of
218 m2. Suppose that the volume of the room is 2,000 m3. Continue the calculationto show that the reverberation time is RT60 D 1:5 s.
Exercise 7, More practice with the Sabine equationFind the reverberation time at 500 Hz of a rectangular room with dimensions
6.3 m by 7.7 m by 3.6 m high, where the walls and ceiling are plaster and the floor isvinyl on concrete. Use the Table of Absorption Coefficients at the end of the chapter.
Exercise 8, Everyone’s alternative to Carnegie HallEstimate the reverberation time of a shower stall. [Hint Estimate the dimensions
of a shower stall and assume that all the surfaces have absorption coefficients similarto glazed tile.]
Exercises 167
Exercise 9, Sabine fails for dead roomsProve that the Sabine equation fails when absorption coefficients are very high.
Hint: Consider the reverberation time when absorption coefficients are 1. Then100 % of the sound ought to be absorbed.
Exercise 10, Unit analysisThe text says that the quantity V=.AT / has dimensions of meters. Explain why
this is so.
Exercise 11, Expanding the roomConsider two rooms, A and B. The surfaces of room B are made of the same
materials as the corresponding surfaces of room A. Thus, the rooms are identicalexcept that every dimension (length, width, height) of room B is twice as long asthe corresponding dimension in room A. Compare the reverberation times of roomsB and A.
�

Chapter 16Audio Transducers
Audio is the marriage of acoustics and electronics. Audio is used in three majorways: as sound recording and reproduction, as sound reinforcement in rooms orpublic address, and in broadcasting. In each case, a sound wave is turned into anelectrical equivalent (i.e., an electrical analog) and processed in some way as anelectrical signal. Then it is turned back into a sound wave. The devices that make thetransformation, from acoustical to electrical and back to acoustical, are transducers.
To understand transducers you need to know a little about electricity, and thatis where this chapter begins. It introduces the topics of electrical charge, voltage,current, and magnetism.
16.1 Basic Definitions
� Charge: Everything in the world is made up of atoms. In the center of an atomis a nucleus that contains protons (positively charged). All round the nucleusare clouds of electrons (negatively charged). In a neutral atom the number ofelectrons is just equal to the number of protons, and the positive and negativecharges cancel. The net charge is zero (neutral). For instance, an atom of copperhas 29 protons—that is why it is copper. A neutral copper atom then has 29electrons too. A neutral atom of aluminum has 13 protons and 13 electrons.Figure 16.1 shows an aluminum atom.
Because of the positive and negative charges, atoms are chock full of forces.(A force is a push or a pull.) These forces are ultimately what gives electricityits prodigious powers. The electrons are attracted to the protons because oppositecharges experience a force of attraction. That is why most of the electrons do notwander off into space but stay in the vicinity of the positive nucleus. However,in a material like copper or aluminum, it is possible to separate some electronsfrom their atoms. Some electrons are free to move around throughout the material.
W.M. Hartmann, Principles of Musical Acoustics, Undergraduate Lecture Notesin Physics, DOI 10.1007/978-1-4614-6786-1 16,© Springer Science+Business Media New York 2013
169

170 16 Audio Transducers
Fig. 16.1 The nucleus of an aluminum atom contains 13 protons, which gives the nucleus a strongpositive charge. Around the nucleus are several clouds of electrons. One cloud (the core) is stronglybound to the nucleus. The other cloud (valence electrons) is more spread out. In the aluminum atomthere are three valence electrons in this cloud. When atoms of aluminum are put together to makea metallic solid these three electrons are free to move around and to conduct electrical currentthrough the metal
Such materials are called “metals” and they can conduct electrical currents. Electroncurrents move audio information through wires.
� Voltage: Because charges of opposite sign attract one another, a force field isset up when positive and negative charges are caused to be separated. This fieldof force has an effect on still other charges in the vicinity, and it is known asa voltage. A voltage is measured in volts. For instance, the chemical reactionthat separates electrical charges in a flashlight battery leads to a voltage of 1.5 V.These electrical forces, or voltages, can be added together. The basic flashlightcontains a stack of two batteries, one on top of the other, leading to a voltage of3.0 V. The standard 9-V battery is made from six such cells, stacked together ina little rectangular package with snaps on top. You can measure the voltage ofa battery by using a voltmeter. It gives a steady reading. Electrical signals, likespeech or music in electronic form, consist of voltages that change rapidly withtime. You can measure a voltage that changes with time by using an oscilloscope.
� Current: Fundamentally, current is the motion of electrical charge. Electronsin a metal are always in motion. All things being equal, they move in randomdirections—any one direction as much as any other. An electrical current occurswhen electrons are caused to move preferentially in one direction, for instancefrom one end of a copper wire toward the other end. They are caused to move bythe force of a voltage. If there is no voltage no current will flow. With a voltagepresent, either steady from a battery or alternating from an electrical signal, acurrent flows. For instance, Fig. 16.2 shows voltage from a battery driving acurrent through a light bulb.

16.2 The Current and Magnetism Principle 171
Fig. 16.2 The simple circuitthat is used in a flashlight.The two batteries are addedtogether to create a voltage of3 V. This voltage motivates acurrent that flows through thelight bulb creating light
Electrical current in a wire is analogous to the flow of water in a pipe. You canmeasure the flow of water in a pipe in units of gallons per minute. You can measurethe flow of electrons in a wire in units of electrons per second. A more common unitfor current is amperes (abbreviation: amps). If you go to the basement of your houseand look at the circuit breaker box you will find breakers rated at 15 A. That meansthat the circuit can safely carry electrical current at a rate of 15 A.
� Magnetism: Magnetism is intimately connected with electricity. In fact, everytime there is an electrical current there is also a magnetic field. It’s a lawof nature; it’s unavoidable. The reverse is true as well. Every magnetic fieldowes its existence to some form of electrical current somewhere. (By the way,magnetism is completely unrelated to gravity. People are often confused on thispoint because our Earth has both a magnetic field and a gravitational field, butthese two forces, magnetic and gravitational, have nothing to do with one another,as far as we know.) The relationship between magnetism and electricity leads tothe first of three principles of electromagnetism.
16.2 The Current and Magnetism Principle
The current–magnetism principle is:
1. An electrical current in a wire creates a magnetic field around the wire. If thecurrent changes, the magnetic field changes in the same way.
There are two kinds of magnets, temporary and permanent. An electrical currentfrom a battery creates a temporary magnetic field. When the circuit is switched off,the current stops and the field disappears.
Permanent magnets exist because there are certain materials, especially materialsthat contain iron, that can be made to have a magnetic field because of electrical cur-rents within the atoms themselves. These atomic currents are in a state of perpetual
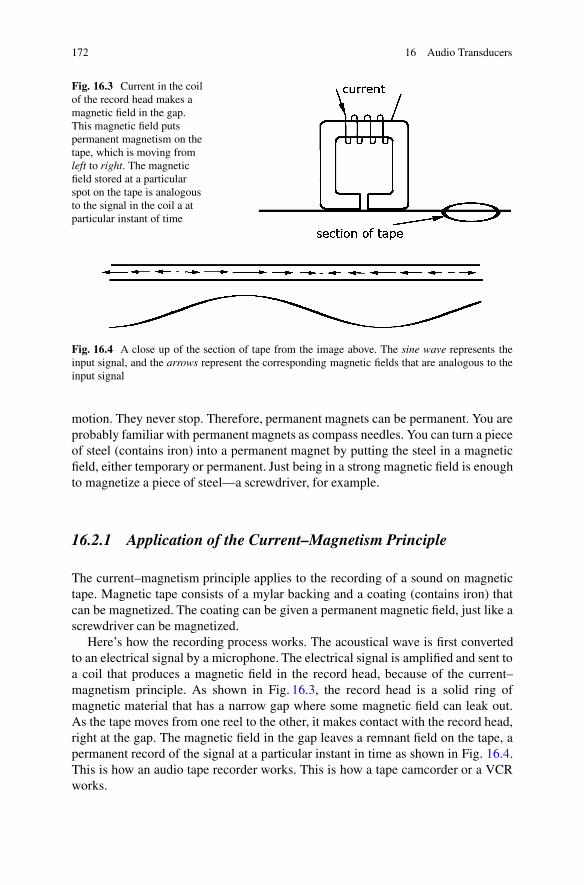
172 16 Audio Transducers
Fig. 16.3 Current in the coilof the record head makes amagnetic field in the gap.This magnetic field putspermanent magnetism on thetape, which is moving fromleft to right. The magneticfield stored at a particularspot on the tape is analogousto the signal in the coil a atparticular instant of time
Fig. 16.4 A close up of the section of tape from the image above. The sine wave represents theinput signal, and the arrows represent the corresponding magnetic fields that are analogous to theinput signal
motion. They never stop. Therefore, permanent magnets can be permanent. You areprobably familiar with permanent magnets as compass needles. You can turn a pieceof steel (contains iron) into a permanent magnet by putting the steel in a magneticfield, either temporary or permanent. Just being in a strong magnetic field is enoughto magnetize a piece of steel—a screwdriver, for example.
16.2.1 Application of the Current–Magnetism Principle
The current–magnetism principle applies to the recording of a sound on magnetictape. Magnetic tape consists of a mylar backing and a coating (contains iron) thatcan be magnetized. The coating can be given a permanent magnetic field, just like ascrewdriver can be magnetized.
Here’s how the recording process works. The acoustical wave is first convertedto an electrical signal by a microphone. The electrical signal is amplified and sent toa coil that produces a magnetic field in the record head, because of the current–magnetism principle. As shown in Fig. 16.3, the record head is a solid ring ofmagnetic material that has a narrow gap where some magnetic field can leak out.As the tape moves from one reel to the other, it makes contact with the record head,right at the gap. The magnetic field in the gap leaves a remnant field on the tape, apermanent record of the signal at a particular instant in time as shown in Fig. 16.4.This is how an audio tape recorder works. This is how a tape camcorder or a VCRworks.

16.4 The Generator Principle 173
16.3 The Analog Concept
The process of recording on magnetic tape, as described above, is an analog process.The signal starts out as a pressure wave in air, and in the recording process itundergoes a number of transformations. It is first converted to a voltage by themicrophone, which leads to a current through the wires in the coil of the recordhead. Then the signal is transformed into a magnetic field in the gap of the recordhead, and finally it ends up as a remnant magnetism on the tape. The analog conceptsays that if the process is working correctly then information about the shape ofthe waveform is preserved in every transformation. If the original pressure wavehas a positive bump at some time, then the electrical voltage has an analogousfeature at that time, and the magnetism on the tape has an analogous feature atthe place on the tape corresponding to the time of the original pressure bump. If theequipment is not working perfectly so that the shape information of the pressurewave is not preserved during the recording transformations then the signal is said tobe “distorted.” You can hear the difference.
16.4 The Generator Principle
You know what an electrical generator does. It starts with mechanical energy(gasoline engine, steam turbine, waterfall, wind power, etc.) and transforms it intoelectrical energy. At the basis of that transformation is the generator principle:
2. If there is relative motion between a wire and a magnetic field, a voltage isinduced in the wire.
Note that the key point is relative motion. It doesn’t matter whether the wiremoves or the magnetic field moves, just so long as one moves with respect to theother. If there is no relative motion there is no voltage.
The generator principle describes the process of playing back a magnetic tape.There is a playback head, very similar in construction to the record head. As themagnetized tape moves past the gap in the playback head, it creates a changingmagnetic field in the head. The changing magnetic field passes through a coilwrapped on the head and a voltage is induced in the wire of the coil. This voltage isanalogous to the magnetic field on the tape.
The generator principle also describes the operation of microphones of the kindcalled “dynamic.” As shown in Fig. 16.5, the microphone has a diaphragm that iscaused to move by the air pressure variations in a sound. A coil of wire is attachedto the diaphragm, and so the coil moves with the acoustical wave. The coil issurrounded by a permanent magnet. When the coil moves in the magnetic field,a voltage is created in the coil, and it is this voltage that is the output of themicrophone. Positive air pressure causes the diaphragm to move inward, and thiscreates a positive voltage. Negative air pressure (the small partial vacuum in sound

174 16 Audio Transducers
Fig. 16.5 A dynamicmicrophone works accordingto the generator principle.Motion of the diaphragm,caused by the pressure in anacoustical wave, causes a coilto move in a magnetic field.This relative motion causes avoltage to be induced inthe coil
waves) causes the diaphragm to move outward, and this change makes a negativevoltage. The voltage can be amplified and used for recording or public address orbroadcasting.
The generator principle also is responsible for the operation of a phonographcartridge, used to play vinyl records. The grooves in the record cause a needle in thecartridge to vibrate. The motion of the needle causes relative motion of a coil anda magnetic field. In this way the cartridge acts as a generator, producing an outputvoltage.
16.5 The Motor Principle
An electric motor has electrical energy as an input and mechanical energy as anoutput. It operates according to the motor principle:
3. If a wire carries a current through an external magnetic field, there is a force onthe wire.
Loudspeakers and headphones operate according to the motor principle. Thisis true of almost 100% of the loudspeakers of the world, and the great majorityof the headphones. We begin with the loudspeaker. A loudspeaker consists of anenclosure—perhaps a rectangular wood box, perhaps the plastic case of a boombox—and sound producing elements called “drivers.” We are interested in thedrivers.
As shown in Fig. 16.6, a loudspeaker driver has a cone that is attached to a coilof wire. The coil of wire is suspended inside a steel permanent magnet (That is whyloudspeakers are heavy.) A power amplifier drives electrical current through the coiland, because of the motor principle, this generates a force on the cone. The forcecauses the cone to move, and the cone motion moves the air, causing a sound

16.6 Electrostatic Devices 175
Fig. 16.6 A loudspeakerdriver works according to themotor principle. Theinteraction of a current (in thecoil) with a magnetic field(from the permanent magnet)leads to a force on the coil.This causes the coil to moveforward or backward. Thecoil is connected to the conewhich then compresses orexpands the air in front of thespeaker. You may notice thatthis figure rather resemblesFig. 16.5 for the microphone.That is not an accident. SeeExercise 8 below
wave. When the current moves in a positive direction, the cone moves outwards,compressing the air in front. When the current is negative, the cone moves inward—into the loudspeaker cabinet—and this creates a partial vacuum. In this way, analternating electrical signal can create an alternating pressure wave that we hear assound.
16.6 Electrostatic Devices
Although most audio transducers operate according to the three electromagneticprinciples above, some operate according to electrostatic principles. These princi-ples were introduced in the sections above called Charge and Voltage. There are twoprinciples.
The fundamental electrostatic principle:
1. Like charges repel each other, unlike charges attract.
The fundamental electrostatic principle says that two objects with electricalcharge will exert a force on one another. Two positive charges repel one another.Two negative charges repel one another. A positive and negative charge attractone another. The electrostatic force has a convenient duality. It can be attractive orrepulsive. Therefore, this force can create positive or negative motion (compressionor expansion) to make a sound wave in the air.
Electrostatic headphones work according to this principle. Electrostaticheadphones are known for their very good high-frequency response because they

176 16 Audio Transducers
do not need the heavy magnet and coil that are needed in the usual electromag-netic headphones. However, electrostatic headphones do require a high polarizingvoltage—about 100 V. Therefore, these headphones are not so portable. The userhas to be close to the supply for polarizing voltage.
The second electrostatic principle is the capacitor principle:
2. Separating electrical charges leads to a voltage. The bigger the separation, thebigger the voltage.
The capacitor principle obviously creates an opportunity to build a microphone.A moveable diaphragm carries one charge and a fixed frame in the microphonecarries the opposite charge. As sound waves cause the diaphragm to move, thecharges are separated by more or less and this makes more or less voltage.The world’s best microphones as well as the world’s cheapest microphones operateaccording to this capacitor (sometimes called “condenser”) principle. The bestmicrophones are used in recording studios; the cheapest microphones are used intelephones and cell phones and for speech input to computer sound cards. The bestmicrophones require a polarizing voltage, normally supplied in recording studiosby the preamplifier that amplifies the microphone output voltage. The cheapestmicrophones are electret microphones where the polarizing voltage comes fromspecial materials that have a fixed charge, which creates a fixed electrostatic fieldmuch as a permanent magnet creates a fixed magnetic field. (The word “electret”resembles the word “magnet.”) Both produce permanent fields, but electrostaticfields and electromagnetic fields are very different. Electromagnetic fields requirecharges in motion. Electrostatic fields come from charges that are . . . well . . . static.
16.7 Electro-Optical Transducers
Electro-optical transducers convert electrical current into light or convert light intoan electrical voltage. Electro-optical audio techniques were the first used in puttingsound tracks on movie film. The alternative was to separate the sound track from thefilm images, but the problem of synchronizing sound and pictures in the early daysof movie sound made it evident that putting the sound track on the same film withthe pictures was the way to go. The sound track was played back by shining a lightthrough the track. The light was then captured by a photosensitive element whichcreated, or modulated, a voltage when struck by the light. The voltage became theaudio signal to be played to the audience. The sound track itself was made to passmore or less light by varying its optical density on the film or by varying the width ofthe track. Analog sound tracks made in this way never worked very well. They werenoisy, generated tons of distortion, and had limited dynamic range. The technologyof film sound was considerably improved by digitizing the sound tracks.
Electro-optical transducers made from semiconducting materials are now usedto play back compact discs and DVDs. They are also used to transmit information

Exercises 177
along optical fibers. For example, in a compact disc (CD) player, a semiconductinglaser (similar to a light-emitting diode) shines a highly focused light beam on therotating CD. Music is encoded on the surface of the CD in the form of small pits inthe surface. When the light beam hits a pit, interference causes the reflected light tobe very dim. When the light beam hits a “land” (flat area between the pits) the beamis reflected brightly. The beam, dim or bright, is reflected to a photodiode, whichis a semiconducting device that passes current when stimulated by light. Thus, themusic, encoded by pits and lands on the CD, causes electrical current to be off andon respectively. The information from the CD is now in electronic form, and that isthe most flexible and useful form of all.
These modern optical transducers are different from the other transducersdescribed in this chapter because they do not work on analog principles. Althoughinformation is retrieved from a compact disc by modulating a beam of light, thereis nothing in the beam of light or the current in the photodiode that is analogous tothe music being retrieved. Instead, the compact disc and the modulated light beamconvey digital information, a series of ones and zeros. With this technology thereis little concern about distortion. Imagine, for instance that a reflected light beam istransmitting a signal that is supposed to be a “one.” Suppose there is distortion andthe beam transmits the analog equivalent of 0.8. That discrepancy corresponds to adistortion of 20%—intolerably huge for an analog system. Nevertheless, that signalis much closer to 1 than it is to 0, and therefore, the signal will be correctly readas “one.” Thus no information is lost by the distortion. More on digital recordingappears in Chap. 20.
Exercises
Exercise 1, Basic definitionsDefine electrical charge, voltage, and current.
Exercise 2, It’s not the size, it’s the principleHow is a dynamic microphone like an electrical power generator?
Exercise 3, The origin of magnetismIs it possible to have magnetism without electrical current in some form?
Exercise 4, Loudspeaker driversThe motor principle involves a current and a magnetic field. The combination
is said to produce a force. This principle applies to loudspeakers. Where does thecurrent come from? Where does the magnetic field come from? What experiencesthe force?
Exercise 5, Warped imagesPutting loudspeakers next to a TV can distortion the TV picture! Why should this
happen? [Hint: This is an unintended consequence of the motor principle. Thinkabout the CRT described in the chapter on Instrumentation. Do you see a current

178 16 Audio Transducers
Fig. 16.7 This electric guitar has three pickups—three buttons—for each string
there? Think about loudspeaker drivers. Do you see a magnetic field there? Thenthere is the force. What experiences the force?
Exercise 6, Where’s the motion?If you look closely at a rock guitar, you will see one or more sets of buttons below
each string as shown in Fig 16.7. The buttons are “pickups” that create an electricalcurrent analogous to the motion of the strings. A pickup uses the generator principleto do this. The guitar pickup consists of a coil of wire wrapped around a magnet.How is there relative motion between a this coil of wire and a magnetic field? [Hint:Strings used on an electric guitar are steel, and steel is magnetic.]
Exercise 7, Design a microphoneIn a dynamic microphone, the motion of a diaphragm causes relative motion
between a coil and a magnetic field. If you had to design a microphone, whichwould you attach to the diaphragm—the coil or the permanent magnet?
Exercise 8, Motors and generatorsIt is sometimes said that a generator is simply a motor operated in reverse. (a)
Explain how this is true in terms of fundamental ideas of mechanical motion andforce and electrical current and voltage. (b) Do you suppose that you could use aloudspeaker driver as a microphone?
Exercise 9, Burned out driversThe electrical current in the voice coil of a loudspeaker driver, which is necessary
to make the cone move, has an unintended consequence. It creates heat. If there istoo much current the wire in the voice coil will become so hot that the wire melts.What effect do you expect this to have on the operation of the driver?
�

Chapter 17Distortion and Noise
Audio has made it possible to record sounds and reproduce them with reasonablefidelity, to amplify and modify sounds beyond our unassisted human powers, and tobroadcast sounds using electromagnetic radiation. Audio has greatly magnified ourabilities to control and use sound. It has also led to the twin evils of noise anddistortion.
17.1 Noise
When a sound is recorded and reproduced, or when it is otherwise processed ortransmitted electronically, it can be contaminated by noise. Noise is something thatis added to the signal. You will recognize noise as the “hiss” that you hear on thetelephone or radio. You know that the original speech did not contain that hissingsound. The hiss was added because of imperfection in the recording or transmissionpath of the speech signal. This kind of noise is broadband; it has components atall frequencies. It is caused by randomness in the electronic components becausecomponents do not behave in a completely deterministic way. It is a generalrule that when signals are processed in their analog form (not digital) then themore complicated the signal path, the more noise one is likely to add. Sometimesthe definition of noise is divided into “broadband noise”—meaning the hiss due torandomness, and “hum”—meaning a low-frequency tonal component.
Hum comes from electrical power. Electricity is distributed around the USA asa 60-Hz (60-cycle per second) sine wave, normally with a voltage between 110and 120 V. It is said to be alternating current (AC) because it alternates from positiveto negative. Audio electronic devices are powered by this AC electricity and some ofit may leak into the signal path, either due to inadequate design of the equipment orto deterioration of the electronic components. Furthermore, the power lines radiate
W.M. Hartmann, Principles of Musical Acoustics, Undergraduate Lecture Notesin Physics, DOI 10.1007/978-1-4614-6786-1 17,© Springer Science+Business Media New York 2013
179

180 17 Distortion and Noise
a 60-Hz electromagnetic field, and this can be picked up by cables or by transducerssuch as dynamic microphones or tape playback heads. Harmonics of 60 Hz, thesecond at 120 and the third at 180 Hz, also appear in hum.
17.2 Distortion
A signal processing system generates distortion if the waveform coming out of thesystem does not have exactly the same shape as the waveform going into the system.Imagine a simple acoustical tone that is transformed into an electrical signal by amicrophone. We could display that signal on an oscilloscope to determine its exactshape. Now suppose that the signal is recorded onto tape, transmitted through thetelephone wires and finally broadcast across the country. We could examine the finalsignal with an oscilloscope and determine the final waveform shape. If the electronicprocessing is accurate, the shape should be the same as the original. If it is not, thenthe signal has been distorted in some way.
17.2.1 Distortion Not
There are several kinds of signal changes that occur in electronic processing thatshould not be classified as distortion. A simple change in gain, where the signal ismultiplied by a constant, is not distortion. This change does not change the shape ofthe waveform. The effect of the gain change can be compensated by amplificationor attenuation.
Inversion, whereby positive is turned into negative and negative is turned intopositive, is equivalent to multiplying the signal by �1 and it is not distortion either.The frequency content of an inverted signal is identical to original. Amplificationand inversion appear in parts (b) and (c) of Fig. 17.1.
Other kinds of waveform changes are properly called distortion. Distortion maybe linear or nonlinear. We deal with these in turn.
17.2.2 Linear Distortion
Linear distortion can be separated into two categories, amplitude distortion andphase distortion.
Amplitude distortion: Ideally, a signal transmission system should have a flatfrequency response. That means that it boosts or attenuates all frequencies equally.Linear distortion occurs when the frequency response of the processing system is not

17.2 Distortion 181
a
b c
d e
f g
Fig. 17.1 One input and half a dozen outputs from different processing systems: (a) The inputis a sawtooth wave as a function of time. (b) The output of a system with gain—no distortion.(c) The output of an inverting system—no distortion. (d) The output of a lowpass filter, whichreduces the amplitudes of high-frequency components compared to low-frequency components.Consequently the output waveform is smoother than the input—linear distortion. (e) The outputof a filter that introduces phase distortion. The high-frequency harmonics are just as strong asin the input sawtooth, but their phases are changed, changing the shape of the waveform—lineardistortion. (f) The output of a time-delay device—no distortion. (g) The output of a saturatingdevice that resists extremes, especially negative extreme values tending to cut off the bottom of thewaveform—nonlinear distortion
flat—when the system operates like a filter of some sort, giving special emphasis tosome frequencies. This effect is known as “amplitude distortion.”
Phase distortion: Ideally, a signal transmission system should have no dispersion.That means that if the system delays a signal at all, then it delays all frequenciesequally. Such a delay does not distort the shape of a signal. However, if thereis dispersion then some frequencies are delayed more than others, then the shapeis changed. The change is known as “phase distortion.”
Linear distortion is not necessarily a serious matter. Every time you adjustthe tone controls on a radio you are distorting (or un-distorting) the signal in alinear way. Linear distortion is part of the normal operation of transducers suchas microphones. Theoretically, linear distortion can always be made to go awayby filtering the signal. For instance, if the nature of the distortion is to reduce the

182 17 Distortion and Noise
high frequency content then one can overcome that distortion with a high-boostfilter. It may not always be easy to compensate for linear distortion if the processingsystem is very complicated, but in principle one can always do it. All it takes is asufficiently specialized filter at the receiving end.
17.2.3 Nonlinear Distortion
Although linear distortion may be rather benign, nonlinear distortion is not. It is themost serious kind of distortion because it can be highly unpleasant and there is nosimple way to get rid of it. In general, nonlinear distortion cannot be removed byfiltering.
Nonlinear distortion by a device or process results in the addition of extrafrequencies to the output of the device or process. That is the most significantdifference between nonlinear distortion and linear distortion. For instance, if theinput to a device has spectral power at frequencies of 100, 223 and 736 Hz thenthe output of a linear device will have power at only those three frequencies. Theamplitudes may be boosted or attenuated differently, the phases may be scrambled,but there won’t be any new frequencies. With nonlinear distortion there will be atleast a few new frequencies added, and normally a lot of new frequencies will beadded.
The Origins of Distortion Imagine a clock pendulum that is slowly oscillating backand forth,smoothly and unobstructed. Clearly the motion is periodic. It is nearlysinusoidal, but not exactly sinusoidal, and a complete description of the motionwould include a few harmonics. Now imagine that someone puts up a barrier so thatjust before the pendulum reaches its maximum displacement to the right it runs intothe barrier—bonk! The pendulum motion continues, it even continues to be periodic,but the pattern of motion is obviously changed by the obstruction—the pattern hasbeen distorted. One might say that the pattern has been “clipped” in the sense thatthe barrier prevents the pendulum from reaching the full extent of vibration.
Distortion occurs in a loudspeaker driver if you use a finger to prevent theloudspeaker cone from reaching the maximum displacement that the audio signalwants the cone to make. This kind of distortion occurs in a driver, even withoutinterference from the outside, because physical limits in the cone mounting preventthe cone from making very large displacements. If the audio signal sent to aloudspeaker is very large, the signal will try to cause the cone to make extremedisplacements and gross nonlinear distortion will occur.
Distortion occurs in audio devices that are purely electronic when the limits of theelectronic circuitry are exceeded by a signal that is amplified too much. The usualway to study nonlinear distortion by a process or device is to use one or two sinewaves as inputs—thus only one or two frequencies. If there are more, the situationbecomes very complicated.

17.2 Distortion 183
Fig. 17.2 A sine tonesuffering symmetricalclipping. Only odd-numberedharmonics (3, 5, 7, : : :) areproduced by this distortion
Harmonic Distortion If a sine tone is put into a system that clips off the top thereis a change in the waveshape. The tone remains periodic because every cycle ofthe sine tone has its top clipped off in the same way. Therefore the period is notchanged by this clipping, but the signal is no longer a sine tone; it is now a complextone. The complex tone has a fundamental frequency equal to the frequency of theoriginal sine tone, and now it has harmonics. This is called harmonic distortion. Thiskind of clipping can be expected to generate harmonics of all orders, both even andodd. The second harmonic or the third will normally be the strongest.
If the nonlinear system clips off the top and the bottom of the sine tone symmet-rically, as in Fig. 17.2, then the output includes only odd-numbered harmonics asdistortion products.
Intermodulation Distortion If you put two sine tones (frequencies f1 and f2)into a nonlinear system, you expect there to be harmonic distortion products, withfrequencies 2f1 and 2f2, also 3f1 and 3f2, and so on. However, there is more.There are also summation tones and difference tones generated by the nonlinearity.Summation tones occur at frequencies generically given by the formulamf2 C nf1,wherem and n are integers. Frequencies f2 C f1 and 2f2 C 3f1 are examples.
Difference tones occur at frequencies generically given by the formulamf2�nf1,where m and n are integers. The most important difference tones are usually thefollowing three: f2 � f1, 2f1 � f2, and 3f1 � 2f2. In using these formulas, weconsider f2 to be the larger frequency and f1 to be the smaller. Normally, then,the formulas will lead to positive frequencies for the distortion tones. However, ifone of the numbers you calculate turns out to be negative, you can find a legitimatedistortion frequency simply by reversing the sign and making it positive.
Of all these distortion products, the difference tones are the worst. They are easyto hear and are the among the most objectionable features of poor audio. As anexample, if two sine tones, with frequencies of 2,000 and 2,300 Hz are put into anonlinear device, the difference tones f2 � f1, 2f1 � f2, and 3f1 � 2f2 become,300 Hz, 1,700 Hz, and 1,400 Hz, as shown in Fig. 17.3.
Distortion in the Cochlea The neural transduction that takes place in the cochleais a highly nonlinear operation. Therefore you expect that the cochlea generatesdistortion products. For instance, it should generate harmonic distortion. However,the curious nature of wave propagation in the cochlea saves us listeners fromthat distortion. You will recall that in the cochlea, sounds travel from the high-frequency end (base) toward the low-frequency end (apex). Suppose that there isa 200 Hz tone that is being transduced by the cochlea. Because 200 Hz is a rather

184 17 Distortion and Noise
Fig. 17.3 The amplitude spectrum of the output of a nonlinear device when the input to thedevice is a two-tone signal with components f1 D 2; 000Hz and f2 D 2; 300Hz. The outputincludes the original frequencies, f1 D 2; 000Hz and f2 D 2; 300Hz, as shown by open symbols.The output also includes distortion products: (1) Harmonics of 2,000 Hz, shown by filled circles.(2) Harmonics of 2,300 Hz, shown by filled squares. (3) Difference tones, shown by downwardpointing triangles, f2 � f1 D 300Hz, 2f1 � f2 D 1; 700Hz, and 3f1 � 2f2 D 1; 400Hz.(4) Summation tones, shown by upward pointing triangles, f1 C f2 at 4,300 Hz, and 2f1 C f2at 6,300 Hz. There are other distortion components above 8,000 Hz, out of the range of the figure.They include higher harmonics of 2,000 and 2,300 Hz and more summation tones, such as 3f1C2f2
low frequency, this transduction takes place near the apex. That’s where harmonicdistortion products, 400, 600, 800 Hz, : : : are created. But in order to be heardthese products need to travel to places tuned to these frequencies, and those placesare further toward the base where the 200-Hz component is already present andgrowing. Those places are busy passing the 200-Hz component and respond mostlyto it. Therefore, we are not troubled by harmonic distortion.
On the other hand, difference tones have lower frequencies than the inputfrequencies and they successfully travel to places further along the basilar mem-brane where the original tones do not create much excitation. Difference tones canbe heard. Clear examples of audible distortion products are described in Exercises6 and 7.
If you want to investigate difference tones created by the ear’s own nonlineardistortion, you should start with two sine tones that have completely independentaudio paths, from the generators through the loudspeakers. Otherwise, you can’t besure that the distortion you hear is coming from the ear. It might just be coming fromthe audio equipment. (You can be pretty sure that the air between two loudspeakersand your ears mixes tones from the loudspeakers in a linear way.) An alternative totwo independent loudspeakers is a flute duet, where the conditions of Exercises6 and 7 can easily occur. Audible distortion is actually one of the very seriousproblems of flute duets.
Distortion in Rock Guitar Distortion is an essential element of the classic rockand roll sound,especially guitar sound. The earliest form of distortion is known

17.3 Dynamic Range 185
as “overdrive,” which just means that somewhere along the electronic processingpath the signal has been clipped, as in Fig. 17.2. The clipping does not need tobe symmetrical, though it often is because early guitar amplifiers clipped in thatway and people liked the sound. The clipping can be gentle in which the peaksand valleys are slightly rounded or it can be harsh where peaks and valleys areseriously cut off. Harsh clipping is characteristic of fuzz boxes. Guitar distortion ismost effective on a strum of all the strings because playing many notes at once, eachnote with its harmonics, leads to an uncountably large number of intermodulationdistortion products and a thick sound. In modern rock guitar sound, distortion in theform of clipping is combined with filtering (often filtering that changes in time) andother time dependent effects such as phasing or flanging. Fuzz boxes have evolvedinto “effects” boxes.
17.3 Dynamic Range
The typical electronic signal processor and the typical audio transducer are verylinear if the signal is weak. Therefore, it should be easy to avoid the bad effectsof nonlinear distortion simply by keeping the signal small. The problem with thisapproach is that such a small signal may not be large enough compared withthe noise added in audio processing. Thus, the signal-to-noise ratio may suffer.The obvious answer to the noise problem is to make the signal larger, but then thesystem may distort.
A practical example of this dilemma has a singer on stage with a microphone,50 m away from the microphone amplifier at the back of the hall. If the singer isfar from the microphone or sings quietly, the output of the microphone is less thana few millivolts (a few one-thousandths of a volt). The amplifier at the back of thehall needs to multiply that signal by more than 1,000 to get a useful signal of a fewvolts. In doing so, the amplifier also amplifies the hum and noise picked up by 50 mof microphone cable. That creates a noise problem, characterized by a poor signal tonoise ratio. A solution to the noise problem is for the singer to put the microphoneclose to his mouth and yell. Now the amplifier only needs to amplify by a factor of100 and the signal to noise ratio improves by 20 dB. Unfortunately, the diaphragmof the microphone cannot readily move to the extreme excursions required by thisintense signal source and the microphone causes distortion.
That then, is the nature of the problem. Audio processing must sail the straitsbetween noise on one side and distortion on the other. The width of the straits (tomaintain the nautical analogy) is the dynamic range of the system. The dynamicrange is the difference, expressed in dB, between the level of an intense signalthat causes distortion (say 0.1% distortion) and the level of the noise background.Fortunately, advances in digital electronics have dramatically expanded the dynamicrange of audio systems.

186 17 Distortion and Noise
Exercises
Exercise 1, Less hum across the pondEuropean countries use electrical power with a frequency of 50 Hz. Do you
expect that “hum” is less audible in European audio gear?
Exercise 2, Too much of a good thingWhy does nonlinear distortion occur if an amplifier is “overdriven.”
Exercise 3, Rock ‘n’ roll(a) How does nonlinear distortion in the amplifier make chords played on an
electric guitar sound “thicker?” (b) If nonlinear distortion makes music sound badwhy would the rockers deliberately choose distortion?
Exercise 4, Choose a test signalYou will use your ears to evaluate an audio system for nonlinear distortion. You
have a choice of signal sources to put into the system. What do you choose? (a)broadband noise? (b) a complex periodic tone with many harmonics? (c) a sine tonewith frequency of 5,000 Hz? (d) a sine tone with frequency of 500 Hz?
Exercise 5, Harmonic distortionA 1,000-Hz sine tone is put into a nonlinear device causing harmonic distortion.
What is the fundamental frequency of those harmonics?
Exercise 6, All the distortion componentsYou put the sum of two sine tones into a nonlinear device. The sine tone
frequencies are 1,000 and 1,200 Hz. What are the frequencies of harmonic distortionproducts that emerge? What are the frequencies of difference tones that emerge?What are the frequencies of summation tones that emerge? What frequencies arelikely to be most audible?
Exercise 7, Worse and worse with up and downThe sine tone frequencies from Exercise 6, 1,000 and 1,200 Hz form the musical
interval known as a minor third (See Appendix D if you want to know more aboutmusical intervals.) Suppose the upper frequency is changed from 1,200 to 1,250 Hz.The frequencies of 1,000 and 1,250 Hz make the interval of a Major third. Whathappens to the difference tone given by 2f1 � f2 when this change occurs?
Exercise 8, Dynamic rangeAn audio system produces 0.1% harmonic distortion (mostly second and third
harmonics) when the level is 90 dB. The noise background is 10 dB. What is thedynamic range of this system?
Exercise 9, Audio amplifier makes toastThis chapter says that electrical power from the outlet in the wall is a 60-Hz
sine wave. How is that different from a 60-Hz signal created by a computer soundcard and then passed through a power amplifier? If it’s not different, why can’tyou connect a toaster to the power amplifier of your stereo system? (You’d makethe connection to the power amplifier just where you would normally connect theloudspeakers.)

Exercises 187
0200
400
600
800
1K1.2K
1.4K
1.6K
1.8K
2K2.2K
2.4K
2.8K
2.6K
Fig
.17.
4T
hesp
ectr
umof
are
cord
edca
rho
rn.(
Itw
asa
Bui
ck.)
The
mea
sure
dso
und
leve
lwas
98dB
,as
mea
sure
dw
ith
anA
-wei
ghte
dso
und
leve
lmet
er

188 17 Distortion and Noise
Exercise 10, Thinking like an acoustician—The car hornAcousticians try to find physical explanations for human perceptions of sound
qualities. The sound of a car horn is an example. The acoustician thinks that theperception can characterized by a loudness and a tone color.
1. Assuming that the spectrum is broadband, having both low and high frequencies,an intuitive approximate sense of the loudness will be gained from a decibelreading on a sound level meter. That is a single, easy measurement to make: Puta sound level meter 3 m in front of a car, blow the horn, and read the meter.
2. The tone color will be quantified by recording the sound electronically andstudying its spectrum, as shown in Fig. 17.4. The horizontal axis shows frequencyin Hertz. The vertical axis shows the levels of the spectral components indecibels, but the scale is arbitrary. No problem. You don’t really need the absolutevalues of dB on the spectral plot because you already have a sense of scale fromthe reading you made with the sound level meter. Instead, you are concerned withthe relative levels of the different components. It is typical to take the tallest peakas a reference level. Then all the other peaks have levels that are negative. In thecase of the car horn, however, it makes sense to take the component at 350 Hz asa standard for the level because it is both a tall peak and a low-frequency peak.
(a) First, consider the frequencies of tall peaks in the spectrum from 0 to 2,800 Hz.Do you see some mathematical relationships in the list of frequencies? Do yousee harmonics? What does this tell you about the car horn sound?
(b) If you find more than one fundamental frequency, what does this suggest abouthow car horns are made or installed?
(c) If you find that there are two fundamental frequencies, determine the ratios ofthose frequencies. Compare with the ratios in Appendix D to determine themusical interval in the car horn sound.
(d) Can you account for all the peaks in the spectrum by assuming that they areharmonics?
(e) Can you see some distortion components? What are their frequencies and howcan you account for them?
�

Chapter 18Audio Systems
The purpose of this chapter is to identify some concepts and terms describing audiosystems. There is a wide variety of audio systems, ranging from gigantic soundreinforcement systems for stadiums to smart phones and iPods for personal use.Mostly, this chapter will deal with the ideas that are central to practical audioprocesses. The chapter begins by being amazed about the concept of soundrecording.
18.1 Sound Recording
It is quite remarkable to realize that until the middle of the nineteenth century therewas no way to preserve sounds. Sounds were produced, had their effect on listeners,and then were lost forever. Any performance of a piece of music had to be a liveperformance because there was no alternative. The words of orators disappearedas soon as they were spoken, and there was no way to be entirely sure of whatwas really said because there was no possibility to review. The concept of soundas fleeting—here and then gone—was firmly established, and it must have beena mind-bending experience for people to hear a sound repeated, however badlydistorted.
The earliest recorded sounds were a single talker or a single singer. That madesense. Remarkable though the concept of preserving sound might seem, one wouldcertainly expect that a single recording system could preserve and reproduce onlya single voice. To produce the sound of a string quartet would logically requirefour recording systems operating in parallel, and the sound of a symphony wouldobviously require so many recording systems that they would never fit into anaverage home. That “logical” idea was rather quickly shot down when recordingswere made of singers with piano accompaniment. Preserving the sound of anensemble in a single waveform stored on some medium dramatically illustrated thefact that the only information that we listeners ever get is a single waveform, a
W.M. Hartmann, Principles of Musical Acoustics, Undergraduate Lecture Notesin Physics, DOI 10.1007/978-1-4614-6786-1 18,© Springer Science+Business Media New York 2013
189
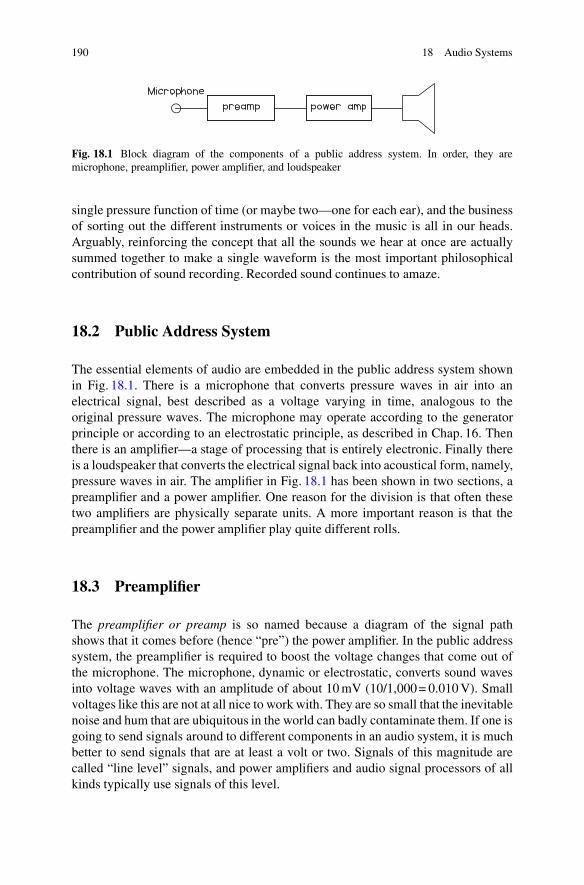
190 18 Audio Systems
Fig. 18.1 Block diagram of the components of a public address system. In order, they aremicrophone, preamplifier, power amplifier, and loudspeaker
single pressure function of time (or maybe two—one for each ear), and the businessof sorting out the different instruments or voices in the music is all in our heads.Arguably, reinforcing the concept that all the sounds we hear at once are actuallysummed together to make a single waveform is the most important philosophicalcontribution of sound recording. Recorded sound continues to amaze.
18.2 Public Address System
The essential elements of audio are embedded in the public address system shownin Fig. 18.1. There is a microphone that converts pressure waves in air into anelectrical signal, best described as a voltage varying in time, analogous to theoriginal pressure waves. The microphone may operate according to the generatorprinciple or according to an electrostatic principle, as described in Chap. 16. Thenthere is an amplifier—a stage of processing that is entirely electronic. Finally thereis a loudspeaker that converts the electrical signal back into acoustical form, namely,pressure waves in air. The amplifier in Fig. 18.1 has been shown in two sections, apreamplifier and a power amplifier. One reason for the division is that often thesetwo amplifiers are physically separate units. A more important reason is that thepreamplifier and the power amplifier play quite different rolls.
18.3 Preamplifier
The preamplifier or preamp is so named because a diagram of the signal pathshows that it comes before (hence “pre”) the power amplifier. In the public addresssystem, the preamplifier is required to boost the voltage changes that come out ofthe microphone. The microphone, dynamic or electrostatic, converts sound wavesinto voltage waves with an amplitude of about 10 mV (10/1,000 = 0.010 V). Smallvoltages like this are not at all nice to work with. They are so small that the inevitablenoise and hum that are ubiquitous in the world can badly contaminate them. If one isgoing to send signals around to different components in an audio system, it is muchbetter to send signals that are at least a volt or two. Signals of this magnitude arecalled “line level” signals, and power amplifiers and audio signal processors of allkinds typically use signals of this level.

18.3 Preamplifier 191
The function of the preamplifier is to provide voltage gain, multiplying a weakvoltage from a transducer by a factor of 100—maybe even a factor of 1,000—to reach line level. Obviously, there is an advantage to placing the preamplifierphysically close to the transducer. A short signal path picks up less hum and noise.
What is true about the small output of microphones is also true about othertransducers. Examples are the signals from a phonograph cartridge or a magnetictape playback head or instrument pickups like the transducers on an electricguitar. In the case of the signal from the phonograph cartridge, the preamp has toapply a filter to the signal, boosting the low frequencies and attenuating the highfrequencies, to undo the effects of filtering that are standardly incorporated into theproduction of vinyl records.
Preamplifiers: Expanded Many years ago, the preamplifiers that amplified theoutput of phonograph cartridges acquired a second role to play. They were used alsofor switching among inputs (PHONO, TUNER, AUX, MIC, TAPE-HEAD, etc.)and for tone control (bass, treble, midrange). As audio became more complicated,the multiple channel processing, and functions of surround sound decoding andambiance synthesis, were also incorporated into the preamplifier.
The back of a modern home entertainment preamplifier bristles with input jacksthat accept the outputs from many different sources (PHONO, TUNER, AUX, CD,DVD, VCR, etc.). There may be optical inputs for digital audio. On the front of thepreamplifier is a switch that enables the user to select one of the sources. If the usercan select more than one source at the same time the preamplifier becomes a mixer,which adds several signals.
Of the inputs listed above for the modern preamp, only PHONO is a low-voltageinput that requires much voltage gain. The other input circuits are designed forvoltage levels of several volts (line level) acquired from other units like a compactdisc player (CD), a DVD player, or a tuner. A tuner makes it possible to listen toradio stations. It receives AM or FM radio signals, as selected by a tuning device,and puts out the audio signal from the selected radio station.

192 18 Audio Systems
The Amplification Concept
The ability to amplify, to take a small signal, varying between C0:01and �0:01V, and multiply its amplitude so that it varies between C1 and�1V (gain of 100), is what makes electronics so useful. Possibly you arewondering how such a device can work. How can a small signal be magnifiedinto a large signal? It seems like getting something for nothing. Fortunately,the processes is less mysterious than it appears.The essential elements in an amplifier are transistors, which operate likecontrol devices. A transistor is a semiconducting device in a metal or plasticpackage with three little wires coming out. Two of these wires are connectedto a power supply circuit that can easily swing a large voltage, like ˙25V.The third wire is for a control signal. The essential character of the transistoris that the large voltage swing can be controlled by a small input controlsignal of ˙0:01V. Changes in the small input voltage control analogouschanges in the large output voltage.The operation of an amplifier is rather like an automobile. You know thatpressing down on the accelerator pedal with your foot causes the car tomove forward. The more you push on the accelerator the faster the car goes.But the power to move the car does not come from your foot. It comes fromthe engine, and the pressure of your foot only operates as a control signal.Similarly the output of an amplifier comes from its internal power supply,and the input signal operates as a control.A transistor amplifier usually includes several successive stages ofamplification, each employing several transistors. Alternatively the multiple-transistor circuit may be combined into a single package—an integratedcircuit amplifier. Before there were transistors for amplification there werevacuum tubes. Tubes operated in the same way in that a large-voltage circuit(output) was controlled by a smaller voltage (input). Vacuum tubes for smallsignal amplification are now totally obsolete, except for one small niche area;that niche is audio. Some people think that tube amplifiers have a specialsound, and they like it.Modern digital audio techniques set a high standard for signal quality. Thisstandard places great demands on contemporary preamplifiers, which are thefirst link in the chain after the microphone or other audio transducer. It is acontinuing struggle for this part of the technology (an analog part) to keepup, or catch up.

18.5 Mixer 193
18.4 Power Amplifier
As you learned in Chap. 16, a loudspeaker works according to the motor principle,where the force to move the cone in the driver comes from a current in a magneticfield. It is the role of the power amplifier to provide the current. Preamplifiers can’tdo that. Preamps can produce high enough voltages, but they cannot provide theelectrical current or the power needed to drive a loudspeaker.
Power amplifiers for theaters and major home installations are large and heavybecause they must supply a great deal of power. Power amplifiers for a stadiumoccupy an entire room. Inevitably power amplifiers waste some power by convertingit into heat which must be eliminated. Therefore, power amplifiers have heat sinks,metal fins that cool the output transistors. Big power amplifiers may require fansfor cooling. By contrast the power amplifier that drives headphones or earbuds onyour iPod are small and may not be an important source of heat compared to the restof the electronics. Big or small, a power amplifier is needed any time one wants toconvert an electrical signal back into acoustical form.
Normally a power amplifier has a volume control that the user can adjust tomake the output electrical signal large or small. It may include a loudspeaker switchby which the user can select which loudspeakers to drive. The same output mayalso be used to drive headphones through a headphone jack. The headphone jackis connected to the same output as the speakers, through a resistor that limits theamount of current that can be supplied.
The power amplifier used in a two-channel (stereo) system is essentially twoidentical and independent power amplifiers, one for each channel. Normally, thereis a single power supply for these two amplifiers. The stereo power amplifier unitthen needs a stereo balance control, which operates like a volume control in that itcontrols the level of the power sent to the speakers. While the volume control raisesor lowers the power for both channels, a stereo balance control allows the user todecrease the power sent to the left or right channel in order to achieve a better spatialbalance, for instance, getting a vocalist to appear in the center of the sound stage.A multichannel amplifier used in home theater has multiple independent amplifiers,and the correct balance among them depends on the particular loudspeakers in useand the geometry of the environment.
18.5 Mixer
Other analog audio signal devices beyond the basic preamp and power amp can beillustrated by giving our basic public address system a little more capability. Forinstance, we might like to have live speech from the microphone heard togetherwith music from a source like an iPod. To add two signals together like that, weuse a mixer. In its basic form, the mixer simply adds two or more signals. Each ofthe signals comes in through a channel which has its own gain, g, (volume control)

194 18 Audio Systems
Fig. 18.2 The expanded public address system mixes speech from the microphone and music fromthe iPod. The microphone signal is compressed and the music is equalized before mixing
so that the user can adjust the mix. You have seen this kind of addition before inChap. 3. At every point in time the output from the mixer is the algebraic sum of thespeech waveform and the music waveform at that particular point in time. That iswhat the basic mixer does, and that is why the mixer is indicated with a Greek lettersigma (˙)—the mathematical symbol for addition. It is a linear operation, and itturns out to be very easy to accomplish electronically.
xout .t/ D g1xspeech.t/C g2xmusic.t/ (18.1)
Large studio mixers are called desks, because they look like huge desks. They areable to add 40 or more channels of sound and to do a lot of processing, equalizationfor example, on each individual channel. Studio mixers have different outputs,representing slightly different mixes. There will be independent outputs for left andright stereo channels (more for surround sound), submixes to be sent to performerswho are playing along with previously recorded sound, and submixes for artificialreverberation devices.
18.6 Tone Controls and Equalizers
Tone controls are filters. Like all filters, they operate selectively on differentfrequency ranges. A bass control boosts or attenuates low frequencies. A treblecontrol boosts or attenuates high frequencies. To some degree, these controls cancompensate for inadequacies in loudspeakers, or the room, or the original soundsource, or the personal auditory system of the listener.
In designing our expanded public address system of Fig. 18.2, we have chosento go beyond the usual bass and treble controls and have selected an equalizer.An equalizer can control the level of the sound in individual frequency bands. Thevariety of possible equalizers is endless. There are five-band equalizers often used incar sound. Ten-band equalizers that boost or attenuate sound in ten different octavebands are standard for home entertainment systems. Professional installations mayhave 30-band equalizers shown in Fig. 18.3 that boost or attenuate sound ineach one-third octave band. Sound reinforcement applications may use parametricequalizers, which are individual tunable filters with characteristic frequencies,

18.7 Dynamic Range Compressor 195
Fig. 18.3 The controls of a graphic equalizer give a visual impression of the filter settings. Theyare here set in a typical “smiley face” pattern intended to compensate for loudspeaker deficienciesby boosting bands with low and high frequencies
gains, and bandwidths that can be adjusted (tediously) by the audio technician.Individual preferences often play a large role in the way that equalizers are set.
18.7 Dynamic Range Compressor
Dynamic range—the range of levels between noise and distortion—was introducedat the end of the previous chapter. The concept of dynamic range compressionbegins with the idea that there is some maximum value of the signal that the audioelectronics can handle. In radio and TV broadcasting, there is a limit set by law.In analog audio, a high signal value will lead to distortion. In digital audio systems,exceeding the limit creates even worse distortion. This limit has to be avoided.
The negative peaks in the speech signal shown in Fig. 18.4a are right up to thedistortion limit shown by the dashed lines, and yet most of the speech is well belowthat limit. We would like to turn up the gain on the weaker parts of the speech togain better comprehension, but if we did that, the peaks would become too big.If we could somehow turn up the volume on the entire speech, but limit the heightsof the peaks to a safe value we would get speech that is easier to understand. That isthe idea of the kind of dynamic range compression known as “peak limiting.”
An alternative to peak limiting is compression that boosts the level of weaksounds. Figure 18.4a shows the results of compressing the speech. See howmuch more intense the weaker parts have become. Dynamic range compression isregularly used in broadcasting. It makes speech sound louder and gives it greaterpunch. Compression is especially used in commercials. That is why the audio incommercials sounds louder than the audio in the regular program material.

196 18 Audio Systems
a
b
Fig. 18.4 Speech waveform: (a) The talker is saying, “Dynamic range compression.” (b) Thesame speech is compressed. Dashed lines show the distortion limit
18.8 Integrated Amplifiers
As its name implies, an integrated amplifier combines a preamplifier and a poweramplifier in the same box. The output of the preamplifier becomes the input tothe power amplifier. Sometimes the connection between preamplifier and poweramplifier is actually made externally with a short jumper. On the back of the chassisis a preamp-out and a power-amp-in. This allows the user to put an external device,a recorder or signal processor, in between the preamp and the power amp if desired.
In an integrated amplifier, the volume controls, stereo balance controls, and tonecontrols are all part of the power amplifier section. The input switching is part ofthe preamplifier section. Some tone controls may be put back in the preamp.
18.9 Receiver
The electronic packages that you see most often in the audio stores are receivers.A receiver is an integrated amplifier with a built-in tuner. The internal tuner is oneof the inputs that can be selected in the preamplifier stage.
A receiver (or an integrated amplifier) can be used with a recording system, likean iPod or computer sound card by using the output of the preamp and input ofthe power amp connections on the rear. Such a connection is shown as an “externaldevice” in Fig. 18.5. The output of the preamp goes to the input of the recorder.

18.10 More Integration 197
Fig. 18.5 The modules shown within the dashed box are the elements of a receiver
Therefore, one records the program that is selected at the preamp. The output of therecorder goes to the input to the power amp. Therefore, one hears the signal thatcomes off the recorder as processed by the power amp with its volume, balance, andtone controls.
18.10 More Integration
Powered loudspeakers: Increasingly, power amplifiers are being integrated intoloudspeakers to create what is known as a powered loudspeaker or active loud-speaker. Powered speakers, including subwoofers, are discussed in Chap. 19 onloudspeakers. Digital loudspeakers are the same as powered loudspeakers exceptthat they also have a built-in digital to analog converter. Therefore, one can senda digital signal to the loudspeaker directly from a computer or other digital deviceusing a USB connection.
Bullhorns: It is possible to integrate the microphone with the power amplifier andloudspeaker, together with a battery for power, to create a portable public addresssystem, commonly called a bullhorn or electronic megaphone. A bullhorn is used toincite, or control, or otherwise influence crowds of people.
Digital microphones: The digital microphone is the converse of the digital loud-speaker. The digital microphone includes its own preamplifier to boost the signalvoltage, and it also includes an analog to digital converter to produce a digitizedsignal right at the output of the microphone. Typically, the digitized signal issent for further digital processing by means of a USB connection. The mainadvantage of a digital microphone is that it eliminates the audio cable that runsfrom the microphone to the preamplifier, replacing it with a digital cable. Becausethe preamplifier has a lot of gain, noise picked up by the microphone cable can bea problem. In addition, the electronic processing within the microphone itself caneliminate the problem of overdriving the system into distortion with loud sounds.

198 18 Audio Systems
Wireless microphones: A wireless microphone includes a radio transmitter (often anFM transmitter) to send the signal to a radio receiver that is not very far away.The receiver then sends the microphone signals on for further stages of audioamplification or processing. The transmitter may be a small box that a performercan wear or put in a pocket. Alternatively, the transmitter may be built in to thehandle of the microphone. The only advantage of the wireless microphone (but it’sa big one) is that the performer is free to take the microphone anywhere on stage ordown into the audience without dragging a cable. Because the wireless microphonehas potential problems with reliability, radio interference, and audio quality, no onewould ever use one except for live performance.
18.11 Multichannel Audio
Stereophonic sound has been around a long time. It was introduced in 1939 in theDisney movie Fantasia. Stereo sound became commercially viable in the 1960s withthe long-playing vinyl record, and later with stereo FM broadcasting. Stereo is anidea that works in that most listeners find that stereo reproduction greatly enhancesthe enjoyment of recorded music in comparison with monophonic reproduction.The signals in the two channels of a stereo recording are nearly the same, butthey have slight amplitude and timing differences that lead to important directionalinformation. Sometimes, (depending on the room and the listener’s position inthe room) the directional information reliably localizes different musical sourcesin the sound field. More important, however, the stereo reproduction leads toan incoherence in the signals received by the two ears which leads to increasedtransparency in the music (can hear inner voices better) and to an increased sense ofenvelopment—the impression that the music is all around you.
Multiple channel reproduction (such as a four-, five-, and seven-channel hometheater system) attempts to simulate the environment more accurately and providea more dramatic envelopment by supplementing the usual two front stereo loud-speakers with a center speaker in between them plus at least two speakers in backor on the sides. Again, all the signals in the multiple channels are mostly the same.Larger delays for the signals that go to the speakers in back simulate reflectionsfrom a back wall. Changing the delay between front and back speakers can createthe illusion that a sound is moving right by you.
Exercises
Exercise 1, Voltage amplificationDescribe briefly how a preamplifier magnifies voltage.

Exercises 199
Exercise 2, Preamplifier gainThe chapter says that a preamplifier boosts the voltage amplitude by a factor of
100. (a) Show that this boost corresponds to a level change of 40 dB. (b) What is thelevel change for a factor of 1,000?
Exercise 3, Designing an equalizerGraphic octave-band equalizers generally have ten bands. Figure 18.3 is an
example. You decide to capture a big share of the equalizer market by producinga graphic equalizer with 11 bands. If the lowest band is centered on 20 Hz, what arethe center frequencies of the other ten bands?
Exercise 4, Valves?About vacuum tubes—the British call them “valves.” Why would anyone call
them valves?
Exercise 5, What’s in it?Consider the following list of audio elements: CD drive, tuner, microphone,
preamplifier, tone controls or equalizer, power amplifier, loudspeakers. Which ofthese elements do you find in (a) the car sound module that goes in the dash of yourautomobile? (b) A boom box? (c) A desktop computer? (d) A laptop computer? (e)A camcorder or digital camera?
Exercise 6, Big mixerThe section on mixers suggests a mixer with 40 inputs. Would anyone really ever
want to add 40 signals together?
�

Chapter 19Loudspeakers
The advances in digital electronics of the last two decades have resulted in enormousimprovement in the recording, reproduction, and distribution of sound. The compactdisc and DVD have greatly reduced the noise and distortion that were alwayspresent when vinyl records and analog magnetic tape were the main distributionmedia. However, audio is not yet perfect—far from it. The weak links in the audiochain now are the transducers that convert sound from pressure waves in the air toelectrical signals or vice versa. Among the transducers, the most problematical arethe loudspeakers.
19.1 Loudspeakers: What We Want
Important characteristics that we would like to have in a loudspeaker are these:1. A linear response
The acoustical pressure wave generated by the speaker should be proportional tothe electrical current that drives the speaker. A graph showing pressure vs currentshould be a straight line. That is the meaning of the word “linear.” If the graph is notlinear then the speaker leads to distortion.
Distortion causes difference tones to appear due to intermodulation distortionbetween any two frequency components in the sound reproduced by the speaker.It makes music sound muddy. Loudspeaker distortion tends to be symmetrical, asshown in the Fig. 19.1b. Therefore, distortion products tend to be odd-order.2. A flat frequency response
The word “flat” means that the graph showing the acoustical output power as afunction of the frequency of a tone ought to be a horizontal (flat) straight line. Herewe imagine an experiment where we drive the speaker with different frequenciesbut always the same amplitude. We expect the output power to be constant (flat).In contrast to this ideal, the response for a typical small speaker is shown inFig. 19.2. It is by no means a straight horizontal line. It has peaks and valleys thatcause the speaker to be louder or softer at these frequencies.
W.M. Hartmann, Principles of Musical Acoustics, Undergraduate Lecture Notesin Physics, DOI 10.1007/978-1-4614-6786-1 19,© Springer Science+Business Media New York 2013
201

202 19 Loudspeakers
a b
Fig. 19.1 (a) A linear response loudspeaker. (b) A response that is nonlinear in a way that istypical of loudspeakers. It is a straight line when the signal is small (close to zero where the axesintersect), but it becomes a curved line when the signal is more intense
Fig. 19.2 Frequency response of a modern small speaker measured in the forward direction(on-axis) and at 45ı. Each vertical division is 5 dB
The frequency response depends on the position of the listener, described byan angle with respect to the loudspeaker’s straightforward direction. The reasonthat the frequency response depends on direction can be found in the ideas ofwave diffraction and beaming that were a part of our study of physical acoustics.To review: the diffusion of a sound depends on the wavelength of the sound (�)compared to the diameter of the speaker (d ). The critical comparison is the ratio,�=d . If �=d is large (long wavelength–low frequency) then a sound wave spreadsout evenly everywhere in front of the speaker. If �=d is small (short wavelength–high frequency) the wave is beamed in the forward direction and does not adequatelycover the space to the right or left. Therefore, the problem with direction-dependentfrequency response is mainly a high-frequency problem.

19.2 The Two-Way Speaker 203
Fig. 19.3 In this two-way loudspeaker, the output from the audio power amplifier comes in fromthe left and is divided by the low-pass and high-pass filters in the crossover network. The low-passed part goes to the woofer. The high-passed part goes to the tweeter
There is an obvious solution to this problem of beaming of high frequencies, andthat is to make the diameter of the speaker very small. Then �=d is always largeand there is an even distribution of sound to all angles. If a speaker were the size ofa fingernail there would be no diffusion problem. However, such a tiny loudspeakerwould suffer from another problem—it would be very inefficient.3. Efficiency
Ultimately, the purpose of a loudspeaker is to move air. That is how a loudspeakertransforms power into acoustical form. Efficiency is defined as a ratio of output toinput. The efficiency of a loudspeaker is equal to the amount of acoustical powercoming out divided by the amount of electrical power going in. If the input poweris 2 W and the output power is 0.2 W then the speaker efficiency is 10 %.
Moving a lot of air is especially important at low frequencies where theconversion to acoustical power tends to be inefficient. To move a lot of air requiresa large moving surface; it requires a large speaker cone. Then the problem is that alarge cone beams high-frequency sound in a forward direction.
19.2 The Two-Way Speaker
Clearly there is a problem. A loudspeaker cone should be small (like a fingernail) tohave good diffusion, but it should be large to have acceptable efficiency. A way tosolve this problem is to use a large cone for low frequencies—where the wavelengthis large, but to use a small cone for high frequencies. Such a system is called atwo-way loudspeaker as shown in Fig. 19.3. A two-way speaker receives the entirespectrum of frequencies from the power amplifier, and the division into the low-frequency channel and high-frequency channel is made within the speaker cabinetitself. The low frequencies are sent to a driver called the “woofer.” The highfrequencies are sent to a driver called the “tweeter.” The separation into high- andlow-frequency signals is made by a filter called a “crossover.” A typical two-wayspeaker might have a crossover frequency of 1,000 Hz.
A three-way loudspeaker has three drivers, a woofer, a tweeter, and a midrange.The crossover then has three outputs and two crossover frequencies. For instance,

204 19 Loudspeakers
Fig. 19.4 Cross sections of four enclosure types. From left to right: Sealed box with an acousticsuspension driver. Ported box or bass reflex. Sealed box with added passive radiator or drone cone.Acoustical labyrinth or transmission line
the crossover frequencies might be 500 and 2,000 Hz. Then frequencies below500 Hz are sent to the woofer. Frequencies above 2,000 Hz are sent to the tweeter,and frequencies between 500 and 2,000 Hz are sent to the midrange driver.
19.3 Enclosures
Imagine a loudspeaker cone coming forward. It is compressing the air in front of itand this makes a pressure pulse. When this pulse arrives at a listener, the listenerwill hear a drum beat. However, as the front of the cone compresses air, the back ofthe cone is moving so as to create a rarefaction—a partial vacuum. If air is allowedto move from in front of the cone to the back, some of the pressure pulse generatedin front will not reach the listener but will be sucked into the partial vacuum createdin back. One might say that the sound has been “short circuited.” A way to avoidthis problem is to mount the driver in a wall. Then the pressure wave from the frontcannot reach the back. The wall is said to serve as a “baffle.” If one wants to preventcommunication between the front and back of the speaker cone using a portableinstallation one needs a loudspeaker enclosure to serve as a baffle (Fig. 19.4).
Sealed Box Simple enclosures are sealed boxes. An air-tight box prevents interfer-ence between the radiation from the front and back of the driver cone. It is importantthat the box be rigid, so that vibrations of the box itself do not radiate and interferewith the waves propagated by the drivers. A sealed, rigid box acts like a perfect wallbetween the front and back of the driver.
Sealed-box enclosures, however, lead to an unintended consequence. They aresealed so tightly that the compression and expansion of air inside the box actuallymakes a significant contribution to the stiffness of the suspension of woofer cones.To solve this problem, the woofers designed for such enclosures are made withunusually flexible suspensions of their own. It is assumed that the air inside the boxwill provide additional stiffness. Therefore, loudspeakers made with sealed boxesare often called “acoustic suspension” or “air suspension” speakers.

19.4 More About Loudspeaker Diffusion 205
Bass Reflex (Ported) Enclosure and Alternatives An important design goal forany speaker is to obtain the best low-frequency response (bass response) withoutusing a physically huge loudspeaker. Therefore, an alternative to the sealed boxenclosure is the bass reflex or ported enclosure. A port is just a hollow tubethat connects the inside of the enclosure to the outside. Therefore, the enclosureis not sealed. The enclosure becomes a resonator intended to reinforce the bass.The length and diameter of the port together with the volume of the enclosure allgo to determine the resonant frequency. This frequency is chosen to be just belowthe lowest frequency that the woofer can easily reproduce by itself. Such a designextends the bass range to lower frequencies.
An alternative to the ported box, also intended to boost the bass response, is thedrone cone. The drone cone looks deceptively like a driver, but actually it consistsonly of the cone with no magnet and no voice coil. Its action is completely passive.The diameter and mass of the drone cone are chosen depending on the volume ofthe enclosure.
Still another alternative is the acoustical labyrinth, which includes a long path forthe radiation from the back of the driver before it meets up with the radiation fromthe front. The idea of the long path is to delay the back radiation by half a period(path length of half a wavelength) so that it reinforces radiation from the front.Because the goal is particularly to reinforce low frequencies (long wavelengths)such enclosures tend to be large.
19.4 More About Loudspeaker Diffusion
Intuition For a given wavelength, a small-diameter loudspeaker driver tends todiffuse sound over a wide angle, but a large-diameter driver tends to beam soundin the forward direction. Does that seem backwards? Wouldn’t your intuition tellyou that a small driver ought to beam the sound in a tight angle? This failure ofnormal intuition on this point is a reminder that the behavior of waves sometimesseems mysterious. The key ingredient that is missing from normal intuition is thatthe diameter needs to be compared with the wavelength of the sound that is radiated.When the diameter is NOT SMALL compared to the wavelength, the sound isbeamed in the forward direction.
Good Frequency Response The fact that loudspeakers don’t radiate the same inall directions (they beam the high frequencies) leads to a problem in measuringa frequency response curve like Fig. 19.2. You now realize that if you make themeasurement with a microphone directly in front of the loudspeaker (forwarddirection) you will emphasize the high-frequency response. If you measure withthe microphone off to the side you will reduce the high-frequency response. Whereshould you put the microphone?
The best answer to this question depends on how the loudspeaker will be used.If the loudspeaker will be used in an ordinary living room, you can expect thatsound radiated from all angles will be reflected by the walls and ultimately reach

206 19 Loudspeakers
Fig. 19.5 This columnloudspeaker is long verticallyand narrow horizontally todisperse sound preferentiallyin the horizontal direction. Itis made by stacking fiveordinary drivers. Such a stackends up working just like along and narrow driver would
the listener. Sound radiated directly at the listener will be most important, but itwill not be all important. To estimate the frequency response of the speaker in anenvironment like this you can put the microphone at an angle of about 45ı to theforward direction. This measurement takes some account of the importance of theforward direction but also includes the radiation to the sides that ultimately counts.By contrast, if you are setting up loudspeakers for a concert in the park you can’texpect major reflections from walls because there are no walls. Then the forwarddirection becomes relatively more important.
Intentional Beaming The next time you are in a large church, look at theloudspeakers on the side walls or side columns. You will see that they are long andnarrow and oriented with their long dimension in the vertical direction as shown inFig. 19.5. What’s the point of that? Review your new-and-improved intuition aboutradiation and realize that this loudspeaker will tend to beam the sound (narrowbeam) in the vertical direction but to diffuse the sound well in the horizontaldirection.
These loudspeakers on the side walls are intended to reproduce speech to make itmore intense for the audience and therefore more understandable. By diffusing thesound well to the sides the loudspeakers can cover a wide range of the audience.That’s good. But churches, especially large ones, have a problem in that they tendto have high ceilings and vast volumes. The danger in amplifying speech is thatsound from the loudspeakers will go up to the large volumes near the ceiling andbe reflected back down to the audience. This reflected sound will arrive at thelisteners with a considerable delay. That’s bad. The original speech plus delayedspeech is hard to understand, as described in Chap. 15. The idea behind makingthe loudspeaker long in the vertical direction is that the speaker will tend to beamthe sound sideways toward the audience and not diffuse the sound upward towardthe ceiling.

19.6 Subwoofers 207
19.5 Powered Speakers
The loudspeakers that have been described so far in this chapter have been passive.They don’t need to be plugged into a wall socket. The only source of powerthey need is the audio power that comes from a power amplifier. There are someadvantages to using a powered loudspeaker instead. In a powered loudspeaker(active loudspeaker) a power amplifier is included in the loudspeaker enclosureitself. To do this integration, the loudspeaker needs to have its own power supply.One advantage is that the power amplifier can be matched to the loudspeakerdrivers. For instance, the amplifier can limit the current to safe levels—protectingthe woofer. There can be separate amplifiers for the woofer and tweeter, and thecrossover can be improved compared to the passive crossovers used in passiveloudspeakers. Even better, special dedicated electronics within the loudspeaker canmeasure the displacement of the woofer cone and send feedback to the poweramplifier to reduce distortion. Powered loudspeakers are commonly used in soundreinforcement applications and as monitors in recording studios.
19.6 Subwoofers
A subwoofer is a loudspeaker specifically intended to reproduce very low-frequencysounds. Therefore, subwoofers are normally physically large. One tends to think ofa subwoofer as an “add on.” There are several kinds of applications.
Audio System Suppose you have a two-channel (stereo) audio system for listeningto music and you want to extend the bass response of the system to lowerfrequencies. Maybe you want to really experience the 16-Hz organ note that beginsAlso Sprach Zarathustra. Then you can add a subwoofer. But how much you needto reinforce the bass depends on how much bass you already have with your mainspeakers. Therefore, the subwoofer has a tone control that allows you to adjust itslowpass filter. As you set this filter to higher frequencies you allow the subwooferto reproduce more of the entire audio range. You are then relying less on your mainspeakers.
Normally, you would buy only a single subwoofer, intended to reproduce basssounds from both left and right stereo channels. The advertisements say that it doesnot matter where you locate the subwoofer because low-frequency sounds are “notdirectional.” That may be true if the subwoofer is set to reproduce only the verylowest frequencies. But many installations require boost at frequencies as high as100 Hz. If the subwoofer reproduces sounds with frequencies of 100 Hz or above,the directional characteristics do matter, and using a single subwoofer would be acompromise.
For your audio installation you can buy a passive subwoofer or a poweredsubwoofer. The driver in a passive subwoofer has two independent voice coils,one for the left channel and the other for the right. The two voice coils are wound

208 19 Loudspeakers
together within the same magnet, and so the subwoofer cone is moved by the sumof the left and right signals. In operation, you send both the left and right channeloutputs from your power amplifier or receiver to the subwoofer, which combinesthem electromagnetically as described above and then sends separate highpass-filtered versions of the left and right signals to the main speakers.
Because a powered subwoofer includes its own power amplifier, you are notrelying on your power amplifier or receiver to provide the power to drive thesubwoofer. An additional advantage of the powered subwoofer is that electronicswithin the subwoofer itself give you more precision and flexibility in the lowpassfiltering that selects the frequencies to be reproduced by the subwoofer.
Sound for Television Home entertainment centers combine commercial televisionreception with video tape, DVD recordings, and digital recorders. Control centers, orvideo receivers, include enough separate power amplifiers to drive arrays of passiveloudspeakers like a 5.1 array. Here, the number 5 refers to the number of full-rangeloudspeakers: left and right speakers in front, left and right speakers in back, and acenter speaker in front. That makes five. The 0.1 refers to a subwoofer channel whichreproduces only low frequencies. A 7.1 system is like a 5.1 system but adds twospeakers on the sides. To set up such a system you need to set the band of frequenciesthat will be sent to the subwoofer. As for the musical application, the setting dependson the capabilities of your main left and right front speakers. The receiver setupprocedure asks you whether the main speakers are large or small to make thatdecision. In installations with high-quality main speakers the subwoofers mainlyreproduce only “low-frequency effects (LFE)” such as explosions or the rumble ofengines.
Sound for Computers Loudspeakers attached to computers are poweredloudspeakers to reduce the power load on the computer and its sound card. Typicallycomputer loudspeakers are small. Perhaps they are small because computers areused on office desks and there is never enough room on a desk. Perhaps it isbecause of price pressure in computer sales. Perhaps it seems wrong for a computerloudspeaker to be larger than the computer itself. For whatever reason, computerspeakers are normally small, and the sonic quality is a compromise. To try toimprove the sound, one may add a subwoofer, normally placed somewhere out ofthe way. The subwoofer cabinet may also contain the power amplifiers for the mainleft and right speakers, or for a complete set of both main and rear speakers. In acommercially available computer sound system with a subwoofer, the subwoofertypically handles a great deal of the bass.
Exercises
Exercise 1, Engineering = compromiseDescribe how different goals of loudspeaker design lead to compromises. One
goal is high efficiency. Another goal is a frequency response that does not dependon direction.

Exercises 209
Exercise 2, Building an enclosureSuppose you are building a bass reflex speaker using a woofer that rolls off (limit
of low-frequency reproduction) at 60 Hz. What would you choose for a resonancefrequency for the cabinet and port?
Exercise 3, A three-way loudspeakerDraw a diagram of a three-way loudspeaker showing the three drivers and the
crossover—with low-pass, band-pass, and high-pass filters.
Exercise 4, Efficiency comparisonWhich is more efficient? Speaker A has an output power of 1.5 W given an input
of 20 W. Speaker B has an output power of 1 W given an input of 14 W.
Exercise 5, Understanding the spec sheetsLoudspeaker efficiencies are normally quoted by giving the output sound level
in dB SPL (sound pressure level above threshold) measured at a distance of 1 m,for an electrical input power of 1 W. Using this measure find the efficiency (in dB)of speaker B from Exercise 4? (Use the inverse square law.) Remember that thethreshold of hearing is 10�12 W/m2.
Exercise 6, Linear for small amplitudesThe caption to Fig. 19.1 says that the nonlinear response in part (b) is actually
linear when the signal is small. Compare the slope of that linear part with the slopein part (a). What do you conclude in comparing parts (a) and (b)?
Exercise 7, Frequency responseFor the loudspeaker in Fig. 19.2, the frequency response for the forward direction
(0ı) is about the same as for 45ı up to about 500 Hz, but the responses for those twoangles become quite different above 500 Hz. Is that expected behavior? Can youimagine an opposite situation where the responses are similar at high frequency butnot at low frequency?
Exercise 8, Low-frequency responseFor the loudspeaker in Fig. 19.2, compare the response at 50 Hz to the response
at 500 Hz. By how many decibels has the response “rolled off” at 50 Hz?
Exercise 9, Multi-channel loudspeaker arrangementsFigure 19.6 shows loudspeaker arrangements of increasing complexity. Count the
number of loudspeakers required for each arrangement. Estimate the costs in moneyand floor space. Where do you draw the line between costs and sound surround?

210 19 Loudspeakers
a b
c
d e
Fig. 19.6 Loudspeakerarrangements for homeentertainment systems.Squares indicate speakers.The circle indicates a listener.(a) Stereophonic. (b)Stereophonic with mixed leftand right channels sent to aspeaker in the middle.(c) Quadraphonic. (d) 5.1system. [The code 0.1indicates thelow-frequency-effect (lfe)subwoofer.] (e) 7.1 system
�

Chapter 20Digital Audio
In the past several decades, digital electronics, as represented by computers, havemade great changes in the way we do things. Audio is no exception. The purpose ofthis chapter is to describe important principles involved in digital electronics and itsapplication to audio. It especially contrasts digital audio with analog audio.
20.1 Digital vs Analog
Even in a digital world, audio begins and ends with an analog signal. The output ofa microphone or other acoustical transducer is an electrical signal that is analogousto the acoustical waveform that produced it. The signal remains in analog formuntil converted to digital form by an analog to digital converter (ADC). Once inthe digital domain the sound can be transmitted, processed, or stored as digitaldata, i.e., as a series of “ones” and “zeros.” To hear the sound again requires thatit first be transformed back to analog form by a digital to analog converter (DAC).The analog signal can then be amplified to produce an analogous current that willdrive loudspeakers to make an analogous acoustical signal. What is different aboutdigital audio is the digital means of transmission, processing, and storage.
Transmission: The sound that comes over the Internet, or in digital broadcasting, orDMX digital cable is digital transmission. It is transmitted as a series of high andlow voltages, representing ones and zeros. In this way it is different from analogtransmission, as in AM or FM radio, where voltages follow the original acousticalmaterial.
Processing: Digital processing exploits two splendid advantages of the digitaldomain, the availability of delay and noise immunity.
Digital methods can delay a signal by any desired amount of time because thesignal is readily available in digital memory. There it can be processed in detail,like any other digital file, by a computer or a computer-like device. An obvious
W.M. Hartmann, Principles of Musical Acoustics, Undergraduate Lecture Notesin Physics, DOI 10.1007/978-1-4614-6786-1 20,© Springer Science+Business Media New York 2013
211

212 20 Digital Audio
application is an ambiance synthesizer, where a signal (music or speech) is delayedand added back many times to the original to simulate the reflections in a room.The delayed signal can be delayed by a small amount to simulate early reflectionsand it can be given many different long delays and added back to simulatereverberation. The delayed signals can be attenuated and can be filtered to representthe absorption of high frequencies on reflecting surfaces. Less obvious, a delayoperation is at the heart of digital filtering, which can change the spectral profile ofa signal, just like an analog filter, but with more precision and with more flexibility.
An analog signal processor—an analog filter for example—is a causal device.Its output at any given time depends on the input signal at that time, or at timesin the past. Such a processor cannot make any use of the signal as it will be in thefuture because it has no knowledge of the future. This seems to us to be a reasonablelimitation. We ourselves live with this limitation every day. It is a constraint called“causality.” Digital processing devices do not have to live with this constraint.An input signal can be stored in memory, processed using all the information inthe memory, and then reproduced—with a time lag that depends on the memorylength, of course, but normally only a few milliseconds. Thus, digital devices can beacausal, meaning that what happens now can be affected by what will happen in thefuture. Freedom from causality opens up an entire new world of signal processingopportunities.
Noise immunity is an important advantage of processing in the digital domain,because the analog domain is not immune to noise. As analog processing increases,noise and distortion are added—combining signals in a mixer, filtering them toimprove frequency response, filtering again to eliminate some problem, runningthe signals across the room in cables, etc. Each added stage or process degradesthe signal somewhat. This limits the number of operations that can be chained.It particularly limits the number of stages (hence the precision) of filtering thatcan be done in the analog domain. By contrast, digital processing is immune tonoise. Adding another digital process to a signal path, or adding ten more digitalprocesses, does not increase the amount of noise or distortion. That is because digitaloperations are numerical. Exercise 1 illustrates this point.
Among the most important processing operations is the simple operation ofcopying. With analog recordings there is some signal degradation with eachsuccessive recording. With digital recording and storage there is no degradationfrom one generation to the next. (See Exercise 13.)
Storage: Compact discs, DVDs, digital audio tape (DAT), diskette, and hard drivesare examples of digital storage media. So are computer RAM and flash drives.In their physical principles, some of these storage devices are not very differentfrom the devices that have traditionally stored sound in analog form. The compactdisc, or DVD, uses optical storage, resembling the optical storage of sound tracks onfilm. The DAT, the hard drive, and the diskette are magnetic media, storing digitaldata as small regions of magnetism on the medium, just like a tape recorder storesanalog data. What is different about the digital storage is not the physical principleof storage; it is the matter of what is stored.

20.2 Digital Noise 213
Digital data are stored as numbers. The numbers are represented in binary form.Each binary digit (bit) is either a “1” or a “0.” The compact disc is a format that usesa 16-bit word. Therefore, an example of a meaningful sample of a waveform storedon a compact disc might be
0110 0111 1101 1001:
If this number is recorded on a magnetic disk, then successive places on the diskare magnetized so:
#""# #""" ""#" "##" ;
where the arrow points in from the north pole to the south pole of the magnet.This number can be interpreted from right to left: There is 1 in the “1”s column,
zero in the “2”s column, zero in the “4”s column, 1 in the “8”s column, and so on.The four bits on the right add up to 1 � 1 C 0 � 2 C 0 � 4 C 1 � 8 D 9. With16 bits it is possible to encode 216 D 65536 different numbers. (See Exercise 2.)A problem immediately arises because all the numbers are positive and we wish tostore waveforms that are both positive and negative. This problem is solved by arule, applied in audio, that says that if the first bit on the left is a 1 then the numbershall be interpreted as negative. Hence the number above is positive because the firstbit is “0”. (Digital storage conventions are full of arbitrary rules like that. Digitalmethods work only because everybody agrees on the rules.)
It now becomes possible to see why digital storage is immune to noise. When abit is stored on a hard drive the magnetism will point up or down. Of course, therewill be random variations in magnetism on the disk. At some places the magnetismwill be slightly larger than other places because of inevitable noise on the magneticmedium. So long as this variation in magnetism is small compared to the differencebetween upward and downward magnetism, the noise will not cause the direction ofthe magnetism to be misinterpreted. A “1” will remain a “1,” and a “0” will remaina “0.” The digital information is not corrupted at all by this noise. The informationis preserved perfectly as shown by Fig. 20.1. This immunity can be contrasted withanalog storage where any added noise is reproduced along with the signal.
20.2 Digital Noise
There is, however, a form of noise that occurs particularly in digital storage, namelyquantization noise. A 16-bit word allows only 65536 different possible values ofthe waveform at an instant. It cannot store values of the waveform that happen tolie between allowed values and therefore it makes an error. Since allowed valuesare 1 unit apart, the largest possible error is 1 unit. This idea leads to a calculation ofsignal to noise ratio (SNR). The calculation goes as follows: First, the quantization

214 20 Digital Audio
a
b
c
d
Fig. 20.1 (a) A 20-bit digital word, [0101 0010 0011 0010 0100], is put out to a storage device.(b) The storage device records the word as a signal, adding hum and noise. (c) The recordedsignal is interpreted with a threshold set at the dashed line. Whenever the signal is greater than thethreshold, the signal is interpreted as a 1; else it’s a zero. (d) The interpreted signal is recoveredfrom the storage device. It represents the word perfectly
noise is 1 unit. Second, the largest possible signal is 65536 units. Therefore, theSNR is 65536/1, and in decibels this becomes 20 log.65536/ D 96 dB. This is anexcellent ratio of signal to noise. The best vinyl records achieve a ratio of only 60or 70 dB. In general the SNR in dB can be written as
SNR D 20 log.2N / D 20N log.2/ D 20 � 0:301N � 6N: (20.1)
This formula, as developed from left to right, says that for every extra bit in thedigital word one gains 6 dB of SNR. To understand the factor of 20 that multipliesthe logarithm, please refer to Exercise 8 in Chap. 10 that shows how to deal withamplitudes on the decibel scale.
As usual, it is hard to illustrate realistic noise with a drawing. The ear is somuch more sensitive than the eye in this matter. To illustrate quantization noise onecan imagine what would happen if the word length were 3 bits instead of 16 bits.Figure 20.2 shows a sine signal and the sampled sine signal using a 3-bit roundingDAC. The rounding DAC replaces a number by the nearest integer value. Thequantization noise would be even worse with a truncating DAC. A truncating DACreplaces each number by the integer part of that number. For instance, at the timeof the second sample in Fig. 20.2 the signal has a value of 2.7. The rounding DACreplaces this value by 3. The truncating DAC replaces it by 2.

20.4 Contemporary Digital Audio 215
Fig. 20.2 A signal with amplitude of 3 units is shown by a continuous line. It is sampled regularlyat times shown by tic marks on the horizontal axis. The sampled version of the signal is shown bycircles. The analog-to-digital conversion is only 3 bits and so there are only 8 possible differentvalues �4, �3, �2, �1, 0, C1, C2, C3. The resulting quantization error is evident in the figure.The circles do not agree perfectly with the solid line
20.3 Sampling
When sound is recorded on analog magnetic tape or vinyl records it is recordedcontinuously. A digital recording cannot be continuous. Instead, a digital recordingconsists of a series of samples of the sound. These samples are taken by the ADC ata precisely regular rate. Figure 20.3 shows such sampling.
Obviously, if the samples are taken too infrequently important details of thewaveform will be missed. In order to create a faithful sampled image of thewaveform, the samples must be taken frequently. But how frequently do the sampleshave to be? If the waveform has only low frequencies so that it changes only slowly,the sample rate does not need to be high. But high frequencies will cause thewaveform to change rapidly and a high sample rate will be needed to capture thoserapid changes. In the end, the correct sample rate to use depends on how highthe highest frequencies are. The rule is called the Nyquist rule.
The Nyquist Rule:The sample rate must be at least twice as high as the highest frequencyin the signal to be sampled.
The sample rate for compact disc is 44,100 samples per second (sps). Therefore,the sound to be recorded digitally cannot have a frequency greater than 44; 100=2 D22; 050Hz. That’s OK. The audible range extends only to 20,000 Hz. The samplerate for DAT is slightly higher than for CDs. It is 48,000 sps.
20.4 Contemporary Digital Audio
Digital techniques are so flexible technically that they lead in many differentdirections. We note some of them here:

216 20 Digital Audio
Fig. 20.3 The signal from Fig. 20.2 is sampled regularly at times shown by tic marks on thehorizontal axis. The analog-to-digital conversion is 16 bits and this sampling is so accurate thatit is not possible to see the difference between the true signal, shown by the solid line, and thesamples, shown by the circles. Some people think that they can hear the difference though
Improved quality: The compact disc standard—16 bits and 44.1 ksps—leads to highquality sound, but there are many who think that it is not good enough. Already 24-bit recording is standard practice in digital studios. The DVD medium supports bothlonger word lengths—such as 24 bits—and higher sample rate. The most importantreason for the flexibility of the DVD is that its storage capacity is nearly seven timesgreater than the CD.
Data compression: The compact disc standard requires a great deal of data (seeExercise 3). If there are 700 MB on a compact disc, then a 32-GB computer flashdrive can comprehend the contents of only 45 compact discs. The problems ofgreat amounts of digital data become really serious when transferring audio overthe Internet. The slow speed of many links lead to long download times.
Reducing the amount of data that is required to transmit and store audio, whileminimizing the degradation in audio quality is the object of data compressiontechniques. These techniques work by taking time slices of the original material,making a spectral analysis of each slice, and processing slices with a data reductionalgorithm based on what listeners are likely to hear. Then the slices are joinedback together to make a digital audio stream with fewer bits per second. Datareductions of one bit out for every ten bits in are possible with techniques such asMP3 encoding. The operation of compressive encoding schemes demands that theplayback process be compatible with the encoding process. Tight standards must bein force.
Convergence: In the days of vinyl microgroove records there were just a fewformats. Long-playing records were made at 33 RPM (revolutions per minute) andthe disks were 10 in. or 12 in. in diameter. Singles were recorded at 45 RPM, andthe disks were 7 in. in diameter. There was a clear reason to restrict the number offormats because introducing a new format required new hardware on the part of theuser. Users resisted frequent changes of hardware.
The matter of formats is entirely different with digital media. A new format mayrequire only a new program for interpretation, and new programs are easily andcheaply distributed—for instance by the Internet. There is no compelling reason tolimit audio to two channels (stereophonic), or four, or six. Audio can be combinedwith video and other data. Programs in different formats can be accommodated on

Exercises 217
the same distribution medium so long as the instructions for decoding are included.The combination of all forms of communication in a comprehensive and flexibledata space has been called “convergence.” Convergence requires that competingmanufacturers, and competing distributors of program material, and governmentsagree on standards to be followed by the industry as a whole. With all interestedparties jockeying for position, it is sometimes a slow-moving process.
Exercises
Exercise 1, The joy of integer numbersYou know that 1C1 D 2: That is an accurate statement. How much less accurate
is the statement: 1C1C1�1C1�0�1 D 2? The answer to this question explainswhy digital signal processing can be chained indefinitely with no degradation insignal quality.
Exercise 2, Test the formula yourself.A formula in the text says that with an N -bit word, it is possible to encode 2N
different numbers. This statement clearly works for N D 2. The formula gives 22
and this is equal to 4. It is easy to write down all possible combinations of two bits:
00 01 10 11;
and we discover that there are four possibilities as predicted by the formula. Showthat the formula works forN D 3 andN D 4. This exercise is intended to persuadeyou that the formula is correct for any value of N . It is an example of inductivelogic.
Exercise 3, Compact discsThe sample rate for compact discs is 44,100 samples per second per channel.
Each sample is stored as a 16-bit word. Show that it requires at least 1.4 million bitsto store a single second of stereophonic sound. There are 8 bits in a byte. How manybytes does it take to store a single second of sound?
Exercise 4, Nyquist theoremExplain why the Nyquist theorem says that there must be at least two samples
per cycle of a waveform.
Exercise 5, Digital telephonesSignals transmitted over the telephone are normally restricted to a maximum
frequency of 5,000 Hz. What is the smallest sample rate that can be used to digitizea telephone conversation?
Exercise 6, No apparent audio sourceThe first section of this chapter explained that digital audio required an ADC to
convert analog signals into digital form before the signals could be processed andstored using digital methods. Can you think of an exception to this statement?
218 20 Digital Audio
Exercise 7, Communicating with extraterrestrialsWe are going to send a capsule into deep space with artifacts from our civilization
with the expectation that someone out there will find it and learn about our humanculture. It is the space-age equivalent of the message in a bottle tossed into the sea.We want to include an audio recording of some human speech and music. Whatrecording format do you recommend, a digital compact disc or an analog vinylrecord?
Exercise 8, Digital ready?In the early days of digital audio, some loudspeakers and headphones were
marketed as “digital ready.” What might that mean?
Exercise 9, Quantization noise?Why is it called “quantization noise?” Why isn’t it called “quantization distor-
tion” instead?
Exercise 10, An 8-bit systemEarly digital audio systems used 8-bits. Quantization by 8 bits is still used in
some digital applications such as digital oscilloscopes, but 8-bits is not good enoughfor audio. There is too much quantization noise.
(a) How many different possible values can be represented by an 8-bit system?(b) Calculate the SNR of an 8-bit system. Do you agree that this is not good enoughfor audio?
Exercise 11, An 8-bit wordA byte is an eight-bit word. Show that the byte below represents the number 109.
0 1 1 0 1 1 0 1Exercise 12, Have another byte
Write the 1s and 0s in a byte to represent the number 85.
Exercise 13, Sharing commercial musicMusic in digital form can be copied, recopied, and copied again many times
with no loss in quality. What are the implications for the industry that produces anddistributes music?
Exercise 14, CausalityMaking a decision now that is influenced by events that will happen in the future
violates the principle of causality. (a) Recall an instance in which you wished thatyou could violate causality in this way.
Violating causality risks a time paradox where making a decision based on thefuture changes the future in such a way that the decision is no longer based on thefuture. (b) Does your recalled instance create a time paradox?
(c) The first section of this chapter says that digital signal processing can violatecausality. Really? Explain why it does not involve a time paradox.
�

Chapter 21Broadcasting
The soprano sings at the Metropolitan Opera at Lincoln Center in New York, andthe performance is broadcast by National Public Radio. Back at home you take offyour Gucci slippers, relax in your hot tub and listen to the performance. How doesit work? One thing you know for sure—the sound is not transmitted from the Met toyou as an acoustical wave. Instead, the sound is transmitted as a radio wave, a formof electromagnetic radiation.
It is sometimes said that a radio station is “on the air,” or that radio broadcastinguses the “air waves.” This is a figure of speech; technically it is nonsense. The airhas nothing to do with it. Like all forms of electromagnetic radiation, radio wavestravel perfectly well through an absolute vacuum. It’s a good thing too. All of theenergy that we get from the sun arrives here as electromagnetic radiation comingthrough the vacuum of space. Electromagnetic radiation travels at the speed of light,and therefore the performance from the Met comes to you at the speed of light.The speed of light is
c D 3 � 108 meters per second; (21.1)
which you will recognize as about one million times faster than the speed of sound.Practical radio waves have frequencies from about 3,000 Hz to 100 GHz. That is,
from 3� 103 to 1011 Hz. You will note that the lowest frequencies are in the audiblerange. Do not be fooled. These low-frequency radio waves are electromagnetic; theyare not acoustical—they cannot be heard. Still, radio waves are indeed waves, andthey obey many of the same laws as acoustical waves. For instance, the famousrelationship between wavelength and frequency still holds,
� D c=f; (21.2)
where in this case, c is the speed of light.
W.M. Hartmann, Principles of Musical Acoustics, Undergraduate Lecture Notesin Physics, DOI 10.1007/978-1-4614-6786-1 21,© Springer Science+Business Media New York 2013
219

220 21 Broadcasting
Another important feature of radio waves that we might anticipate from the studyof acoustics is the phenomenon of difference tones, generated in a nonlinear system.We will see that presently.
21.1 Continuous Wave
A radio transmitting system consists of a source of electromagnetic power in theform of a sine wave with a precise frequency in the radio range. The source of poweris called a transmitter, and it is attached to an antenna that radiates the sine wave.For instance, the radio wave from Station X might have a frequency of 1.000 MHz.We would say that Station X is broadcasting at a frequency of 1.000 MHz.
A radio receiver has an antenna that intercepts the radiation from the transmitter,as well as the radiation from hundreds of other transmitters sending out signalsat other frequencies. At the outset all the transmissions are received together, andit appears to be a hopeless jumble. To solve this problem, the first stage of radioreception is a tuned circuit that precisely selects a desired station. If the tuned circuitis tuned to frequency f1 D 1:000MHz, then the receiver will pick up Station X.Up to this point, however, no information is being communicated.
To communicate, one needs to make the radio signal audible. To do this, thereceiver has a radio-frequency generator of its own (but much less power than thetransmitter). Suppose that it generates a signal with a frequency of f2 D 1:001MHz,and suppose that this is added to the signal from the tuned circuit in a nonlineardevice. The nonlinear distortion will create an electrical difference signal having afrequency f2 � f1, namely 1,000 Hz. This signal is in the audible range and can beconverted to a audible signal with a loudspeaker. Out of the speaker comes a 1,000-Hz tone. Wow! Now it is possible to hear radio station X. However, there is still noinformation being communicated.
Suppose now that the person who is operating the transmitter turns his signalon and off. He might use a telegraph key to do this switching. He can turn it onfor a long interval (a “dash”) or for a short interval (a “dot”). With a series ofdashes and dots the operator can send the letters of the alphabet using Morse code.
Fig. 21.1 A transmitted 1-MHz radio signal of the type called “continuous wave (CW)” can sendMorse code. Shown here is a dash, a dot, and another dash. That makes the letter “K.” As shownhere, the transmission of dots and dashes is extremely rapid so that you can see the individualcycles of the carrier

21.2 Amplitude Modulation 221
a
b
c
Fig. 21.2 The evolution of an AM broadcast. All the signals shown in the figure are voltages,and the vertical axes represent volts. Part (a) shows a 1-MHz sine wave carrier. In 100�s thereare 100 cycles. When this wave is radiated it will become the electromagnetic radiation of StationX, broadcasting at a frequency of 1 MHz. Part (b) shows another electrical wave; it contains theaudio information that we desire to transmit using the radio wave. This signal is an audio signal,with a frequency of 15,000 Hz, and it was originally generated from an audible source by the useof a microphone. Part (c) shows how the audio signal is transmitted. It is used to modulate theamplitude of the 1-MHz signal. In this way the audible information is incorporated. The process isknown as amplitude modulation
At the receiver, the 1,000-Hz tone comes on only when the transmitter is on. If theperson at the receiver knows the code, he can decipher what is sent. Now, finally,information can be communicated. This form of broadcasting, called “continuouswave,” is the most primitive form. It is illustrated in Fig. 21.1.
21.2 Amplitude Modulation
Modulation makes it possible to transmit more detailed information than sim-ple on/off information. With modulation one can transmit speech or music asaudio. The concept of modulation begins with the old continuous-wave signal.Quite simply, some aspect of that continuous wave is varied, i.e. modulated,according to the waveform of the speech or music. In amplitude modulation (AM),it is the amplitude of the radio sine wave that is modulated. For instance, Fig. 21.2modulates a carrier with a 15,000-Hz sine tone as the audio signal.
At the receiving end, the modulation impressed on the signal by the transmittercan be extracted by the AM radio receiver, and the modulation is, of course, theoriginal 15,000-Hz tone that was broadcast. It should now be evident why the1-MHz radiation is called the “carrier.” It acts as a vehicle that carries the audio.The frequency of a radio or TV station is the frequency of its carrier. At the receivingend, this carrier is filtered out and only the audio signal is left.

222 21 Broadcasting
a
b
c
Fig. 21.3 Frequency modulation of a 1-MHz carrier by a 15,000 Hz audio signal. Parts (a) and (b)are the same as for AM in Fig. 21.2, but the form of the modulation is different
21.3 Frequency Modulation
Figure 21.3 shows a frequency modulated (FM) signal. The FM technique is anothermeans of transmitting an audio signal using radio waves. Now the amplitude isconstant. What is modulated is the carrier frequency itself. The carrier frequency iscentered on 1 MHz, but the modulation gives this carrier small excursions above andbelow 1 MHz. The FM receiver has to be different from an AM receiver. Whereasthe AM receiver takes variations in the carrier amplitude and converts them to anaudible signal, the FM receiver converts carrier frequency variations into an audiblesignal. Receiving information encoded by FM turns out to be less sensitive to static(interference caused by electrical storms); FM provides a better communicationschannel.
21.4 Bandwidth
The figures above have shown AM and FM signals as functions of time. Thistime representation is the easiest way to visualize how the modulation affects thecarrier. Additional important insight comes from looking at AM and FM from aspectral point of view. At first glance, it would seem that the spectral point ofview is very simple. There is a sine wave carrier at 1-MHz. The sine wave has asingle spectral component, and so it seems as though the spectrum of the signalwould be a single line at a frequency of 1,000,000 Hz. That is actually correctfor the continuous-wave signal. However, when a signal is modulated, additionalfrequencies are added. The additional frequencies are called “sidebands” because

21.4 Bandwidth 223
a
b
c
Fig. 21.4 (a) An audio signal with components at 5, 6, 7, 10, and 15 kHz. (b) A radio frequencycarrier with a frequency of 1 MHz (1,000 kHz). (c) An AM signal—the 1-MHz carrier is amplitudemodulated by the audio signal. Because the audio signal has a frequency as high as 15 kHz, themodulated signal in part (c) extends from 985 to 1,015 kHz. Therefore, the bandwidth of the signalis 30 kHz
they appear to the left- and right-hand sides of the carrier frequency. Specifically,when a 1-MHz carrier is modulated by a 15,000-Hz signal there is a componentat 1 MHz + 15,000 Hz (the upper sideband) and a component at 1 MHz – 15,000 Hz(the lower sideband).
Of course, the 15,000-Hz tone is a very simple modulation. In practice we wouldlike to broadcast audio with all frequencies from 0 to 15,000 Hz. Therefore, insteadof having single discrete sideband components, we get a smeared out spectralregion, extending plus and minus 15,000 Hz, either side of the carrier frequency.The total bandwidth is, therefore, 30,000 Hz as shown in Fig. 21.4.
If we wanted to transmit a television signal the bandwidth would have to bemuch greater. That is because the TV signal includes both the audio and thevideo information. More information requires greater bandwidth. A conventionalanalog TV signal has a bandwidth of 6 MHz. Obviously it would not be possibleto transmit a TV signal using a carrier of 1 MHz. The sidebands would extendto negative frequencies, and this would greatly distort the signal. Therefore, TVstations broadcast with carrier frequencies that are high, about 100 MHz for VHF,and 500–800 MHz for UHF. The broad bandwidth required for analog TV is thereason that governments worldwide are encouraging digital TV. In fact, they areinsisting on it because the information in TV signals can be compressed in the digitaldomain by eliminating redundancy. Less redundant information means that signalscan have a narrower bandwidth. Narrower bandwidth, in turn, means that more TVsignals can be squeezed into any given range of frequencies.

224 21 Broadcasting
21.5 Carrier Frequencies
Worldwide, the transmission of radio signals is regulated. There are specific rulesabout which radio frequencies may be used, and where, and when. It has to be thatway. Otherwise, signals from competing stations would pile on top of one anotherand communication would be chaotic. It is rather like cars on the street. Only one caris allowed to occupy a given patch of street at any given time. Particular frequencybands have been assigned to particular kinds of broadcasting. In the USA, AMbroadcasting is done with carriers in the range from 550 to 1,600 kHz (or 1.6 MHz).FM broadcasting is done with carriers in the range from 98 to 106 MHz. Becausethe AM range is so narrow (only about 1 MHz) AM radio stations are limited inbandwidth. In fact, it would be illegal for an AM station to broadcast a signal witha bandwidth of 30 kHz as in the example above. However, an FM station is allowedto broadcast a signal that wide.
Analog TV broadcasting takes place in several frequency ranges. Channels 2–6are found between 54 and 88 MHz. Channels 7–13 are found between 174 and216 MHz, and channels 14–69 are found between 470 and 806 MHz.
Exercises
Exercise 1, Frequency and wavelength revisited(a) AM radio broadcasts at frequencies of about 1 MHz, i.e. 106 Hz. Show that
the wavelength is about 300 m. (b) Microwaves have frequencies as high as 1011 Hz.Show that the wavelength is 3 mm.
Exercise 2, AM radioDraw the spectrum of a 1-MHz carrier amplitude modulated by a 15,000-Hz
audio signal.
Exercise 3, The bandwidth cost of videoHow many times greater is the bandwidth of an analog TV signal compared to
the 30,000-Hz bandwidth of an FM signal?
Exercise 4, FM vs AMWhy do you suppose that FM transmission is less susceptible to static than AM
transmission? Consider static to be a noise that is added to the electromagneticradiation on its way to the receiver.
Exercise 5, Who hears it first?The back row of the opera house is 150 ft away from a singer on stage. The
broadcast microphone may only be 2 ft away. Who hears the singer first? Is it theperson in the audience sitting in the back row at the opera, or is it you, sittingin the hot tub perhaps several thousand miles away? [Hint: Remember that thebroadcast comes to you at the speed of a radio wave, namely the speed of light.]

Exercises 225
Exercise 6, Bandwidth, information and economicsWhat is the connection between bandwidth and the amount of information that
is transmitted? Is bandwidth scarce? Must it be regulated?
Exercise 7, StaticThe antenna of a radio receiver not only picks up all the radio transmitters
within range, but it also picks up noise (called “static” in radio communicationsterminology) from electrical storms all around the world. The input tuning of thereceiver helps reduce this noise. How do you think that this works?
Exercise 8, TV broadcastingThe text says that TV signals have a bandwidth of 6 MHz. (These were the USA
standard—NTSC—signals prior to digital TV.) Is this bandwidth consistent with theassignment of frequency ranges for TV channels given in the section called “Carrierfrequencies?”
�

Chapter 22Speech
Speech is our most basic and most important means of human communication.Speech conveys more than mere words. It conveys shades of meaning, emotion,attitudes, and opinions, sometimes even more completely than we as talkers wouldlike. As a topic for study, human speech has endless fascination for acousticians,phoneticians, linguists, and philosophers. This chapter can only scratch the surfaceof this vast topic. It is mainly devoted to the production of speech by human talkers.It introduces the anatomy of the vocal tract and then describes how the componentsof the vocal tract function to create speech sounds, particularly vowels—the basisof singing.
To an unusual extent, the goal of this chapter is merely to cause the reader tobecome aware of things that he or she already knows from years of experience intalking. Properly read, this chapter requires some vocal involvement from the reader,if only to check that certain sounds are really made the way that the text says thatthey are made. If it’s done right, it should be a noisy experience.
22.1 Vocal Anatomy
Speech sounds are made by using air from the lungs. The lungs provide all of theenergy that ultimately ends up in a speech waveform. The air from the lungs passesthrough the trachea, to the larynx—including the vocal folds, and then to a part of thevocal tract that serves as a resonator. We consider those processes in turn (Fig. 22.1).
Diaphragm and lungs: The diaphragm is an arched sheet of muscle separating thelung cavity from the abdominal cavity. To understand what happens as you inhale,take a few deep breaths and use your hands to feel how your upper body moves.
W.M. Hartmann, Principles of Musical Acoustics, Undergraduate Lecture Notesin Physics, DOI 10.1007/978-1-4614-6786-1 22,© Springer Science+Business Media New York 2013
227

228 22 Speech
Fig. 22.1 Vocal anatomy,cross section afterFarnsworth, 1940
Notice that when you inhale, your belly seems to protrude as the diaphragm islowered to expand the lungs, and in the process moves other organs around lowerdown. Notice too that your upper chest walls rise. Both actions expand the chestcavity, allowing air to rush in because of normal atmospheric pressure. This processof inhalation, or inspiration, can expand the volume of air in the lungs from 2 to 7 Lfor the average adult human. However, in normal quiet breathing, the change in lungvolume is only 10% of that.
Expiration (or exhalation) occurs when the normal elasticity of the lungs andchest walls forces air out of the lungs. Also, the lungs have a reserve capacity thatcan be made to expel additional air using expiratory muscles. When we stress certainsyllables while speaking, the momentary added air volume is expelled by chest-wallmuscles called “intercostal muscles.”
A literThe liter is a metric unit of volume. It is equivalent to 0.001 cubic metersor 1,000 cubic centimeters (cc). English equivalents to a liter are 61 in.3 orslightly more than a USA quart.
Trachea: The trachea, commonly known as the “windpipe,” allows air to flow inand out of the lungs. As the trachea descends toward the lungs, it divides into twobronchi (bronchial tubes), one for each lung. The trachea has a mucous lining thathelps to catch dust particles, preventing them from entering the lungs. In that sense,its function is the same as the air intake and air filter on your car’s engine.

22.2 Voiced Sounds 229
Larynx: At the top of the trachea, and contiguous with it, is the larynx or voice box.The larynx serves many functions, not the least of which is to channel air to thetrachea and food to the esophagus. Within the larynx is the glottis, consisting of thevocal folds (vocal cords)—two mucous membranes with a separation that is underexquisite, active, conscious control by the brain.
As you exhale normally through the trachea, the vocal folds are apart and airpasses by them. If you hold your breath, the vocal folds are tight shut. When youmake a voiced sound, the vocal folds are loosely together. The vocal folds vibrateagainst one another to make a buzz driven by a steady stream of air from the trachea.For unvoiced sounds the vocal folds are apart, as in normal breathing. Because thereis no vocalization, unvoiced sounds have to be made by creating constrictions usingpharynx, soft palate (vellum), tongue, teeth, and lips and then blowing air past theseconstrictions. The constrictions may be fixed in time, as for the sound “ssss,” or theconstrictions may suddenly open as for the sound of “p.” In whispering, the vocalfolds are somewhat apart, but they vibrate in a noisy way to create a sound that canbe filtered later, just as for voiced sounds.
Resonators: The pharynx (pharyngeal cavity), mouth, and nasal cavities haveresonances that act as filters, reinforcing particular frequency regions of the voicedor whispered sounds from the larynx. The frequencies of the resonances can beprecisely controlled because of all the flexibility that you have with the shape of yourmouth cavity and your tongue and lips. The different resonances are responsible forcreating the different vowel sounds.
22.2 Voiced Sounds
The buzzing sound made by vibrating vocal folds is normally a periodic wave,and it has a complex spectrum with many harmonics. The vocal buzz, waveformand spectrum, is shown in Fig. 22.2. To some degree, the vocal buzz resembles thesounds of wind musical instruments—the brass instruments and woodwinds. Boththe vocalized sounds and the wind instrument sounds begin with air from the lungs.Both sounds are generated by some physical element that vibrates with periodicmotion in the air stream, as controlled by the intelligence of the person producingthe sound. The analogy is particularly valid in the case of singing where sustainedsounds have stable frequencies or frequencies that move only slowly or regularly.Physically, however, there is an important difference between the production ofvoiced sounds and the production of wind instrument sounds.

230 22 Speech
a b
Fig. 22.2 (a) The waveform of a vocal sound measured in the throat shows peaks of air pressurewhen the vocal folds are open and intervals of zero pressure when the vocal folds are closed. Thewaveform is periodic with a period of about 8 ms, typical of an adult male voice. (b) The spectrumshows a fundamental frequency of 125 Hz (=1,000/8) and strong harmonics. Different shapes oforal cavities further upstream will lead to different vowel sounds. Note that in this figure, both axesare logarithmic. The harmonics are really equally spaced by 125 Hz, as expected for a periodictone, but the logarithmic horizontal axis (a scale of octaves) does not give that impression
The vibrating element in the wind instrument, for example a trumpet player’slips or a clarinet player’s reed, requires feedback from the rest of the instrumentin order to produce the tone with the intended pitch. It is not so with voicedsounds. Although the parts of the vocal tract that follow the larynx (pharynx, mouthcavity, and nasal cavity) act as resonators or filters, they do not provide importantfeedback to the larynx. The larynx is capable of generating the voiced tone, withthe correct frequency, all by itself without help from the rest of the vocal tract.Consequently, the human voice is easier to understand physically than are windmusical instruments. That is why the chapter on the human voice comes first in thisbook, before the chapters on musical instruments.
The most prominent voiced sounds are the vowels. Vowel sounds carry mostof the energy in speech, though not necessarily most of the information. Becauseof their power, vowels are the main element in singing. It is easy to sing withoutconsonant sounds. It is impossible to sing without vowels.
To make vowel sounds, one shapes the vocal tract—mouth and nasal cavities—to give these cavities particular acoustical resonances as shown in Fig. 22.3. Theseresonances cause particular harmonics of the vocal fold buzz to be emphasized.Thus, the vocal folds create a complex spectrum and the vocal tract filters it. Thefrequency regions containing strong harmonics due to vocal tract resonances arecalled “formants.” It is usual to characterize vowel sounds by three formants, thoughit is possible to find as many as five.

22.3 Speech Sounds 231
The formant conceptThe idea of a formant is nothing new. A formant is a band of frequencies thatis prominent in the output of an acoustical source. This band of frequencies isprominent because the source includes a filter, or resonator, that emphasizesthose frequencies.
The concept of a formant can be illustrated in a speech or music contextin which the band of strong frequencies remains constant while the fun-damental frequency of the sound changes. For instance, if a singer singsthree different notes all with the vowel “AH” there are three differentfundamentals, but the range of emphasized frequencies stays the same. Aformant near 1,000 Hz strongly emphasizes the eighth harmonic of a 125-Hz tone, or the fifth harmonic of a 200-Hz tone, or the third harmonic of a333-Hz tone.
A mute inserted into the bell of a brass instruments (e.g., trumpet ortrombone) introduces a formant into the sounds of the instrument. Thischanges the tone color of every note played. For instance, a trumpet mutecalled a “cup mute” introduces a resonance peak extending from 800 to1,200 Hz. Although the trumpet may play dozens of different notes, eachwith its own fundamental frequency and harmonic series, the formant,800–1,200Hz, applies equally to every note and leads to an unmistakablecoloration of the sound.
Formant frequencies for different American vowel sounds are given inTable 22.1. The table shows the average formant frequencies for 76 talkers—33men, 28 women, and 15 children. Average formants for adult women are higherthan those for adult men because, on the average, vocal tracts are shorter forwomen. If you think of a vocal tract as a cylindrical pipe open at one end andclosed at the other (Chap. 8), you are not surprised to learn that a shorter pipehas higher resonance frequencies. Children have much shorter vocal tracts andcorrespondingly much higher formant frequencies. As listeners, we associate highformant frequencies with small creatures. We also associate high fundamentalfrequencies with small creatures. The high fundamental frequencies of childrenoccur because their vocal folds are lighter than for adults. Thus, high formantfrequencies and high fundamental frequencies occur for very different reasons.
22.3 Speech Sounds
Years ago, you learned that speech is composed of vowels and consonants. Thisdistinction is not necessarily wrong, but it greatly oversimplifies the phonologicaland linguistic nature of speech and language. Although it is not hard to define a

232 22 Speech
Table 22.1 Average formant frequencies and levels for vowels spoken by mainly Americantalkers
Vowel EE I E A AH AW U OO UH(as in) heed hid head had hod hawed hood who’d hud
Frequencies (Hz)F1Men 270 390 530 660 730 570 440 300 640Women 310 430 610 860 850 590 470 370 760Children 370 530 690 1,010 1,030 680 560 430 850
F2Men 2,290 1,990 1,840 1,720 1,090 840 1,020 870 1,190Women 2,790 2,480 2,330 2,050 1,220 920 1,160 950 1,400Children 3,200 2,730 2,610 2,320 1,370 1,060 1,410 1,170 1,590
F3Men 3,010 2,550 2,480 2,410 2,440 2,410 2,240 2,240 2,390Women 3,310 3,070 2,990 2,850 2,810 2,710 2,680 2,670 2,780Children 3,730 3,600 3,570 3,320 3,170 3,180 3,310 3,260 3,360
Relative levels (dB)L1 �4 �3 �2 �1 �1 0 �1 �3 �1L2 �24 �23 �17 �12 �5 �7 �12 �19 �10L3 �28 �27 �24 �22 �28 �34 �34 �43 �27
steady vowel, as we have done with the formant concept, the variety of humanspeech behavior makes even the study of vowel sounds a complicated one.A thorough approach to a more advanced treatment is beyond the scope of this book.This section on speech sounds will deal with the some classes of speech sounds withemphasis on the means of production.
diphthongs: Within the vowel context there are diphthongs, combinations of twovowels that are interpreted as a single speech sound. The word “toil” is an example.As for the word “out” from the speech spectrogram, it is impossible to pronouncethe vowel sound in “toil” without changing the shape of the vocal tract. Even thepronunciation of the first letter of our English alphabet seems to end in an EEEsound if you listen to it closely.
glides: A glide is a vowel-like sound that requires the vocal tract to move. The WHsound in “when” is an example.

22.3 Speech Sounds 233
a
b
c
Fig. 22.3 Creating a voicedvowel. (a) The spectrum of avocal sound measured in thethroat from Fig. 22.2. (b) Thegain of the vocal tract filtermaking the vowel E as in“head.” (c) The spectrum ofthe vowel finally produced bythe talker. The peak near500 Hz is the first formant. Itappears to be broader than theother peaks, but that is adistortion of the logarithmicplot. In units of linearfrequency, the first formantpeak is actually the narrowest
fricatives: Fricatives are consonant sounds that are essentially noise. They are madeby creating a constriction somewhere in the vocal tract and blowing air past theconstriction to make a turbulent flow with a noisy character. The FF sound is madewith a constriction between the upper teeth and lower lip. To make the TH soundyou make a constriction with your tongue in back of your teeth. The HH, as in “hah”comes from a constriction in the glottis itself. The sounds known as sibilants are thehissy fricatives like SS and SH. Spectrally, fricative sounds are broadband with noharmonic structure. However, different fricatives have different frequency regionsof spectral strength. For instance, the SS sound has much greater high-frequencypower than the SH sound.
plosives: As the name implies, a plosive is a little explosion. Plosives (sometimescalled “stops”) are made by building up air pressure behind a closed constrictionand then releasing it. The plosives P,T, and K are not voiced. The plosives B,D, andG are normally accompanied by voicing. Plosives, as well as fricatives, are said tobe manners of articulating consonant sounds.

234 22 Speech
22.4 Spectrograms
A spectrogram, for example Fig. 22.4, is a plot of power in a vocalization as afunction of frequency and time. The frequency is plotted on the vertical axis andruns from 0 to 4,000 or 5,000 Hz because this is the vital frequency range for speech.The time is along the horizontal axis, as for an oscilloscope, but the time scale ismuch longer than the time for a trace on the oscilloscope. From left to right the timeis several seconds—enough time to speak an entire sentence. The power that occursat a particular frequency (vertical axis) and at a particular time (horizontal axis) isshown by darkness.
Figure 22.4 shows a spectrogram for the utterance, “Joe took father’s shoe benchout.” The first sound that occurs is the “J” sound in “Joe.” Notice that it is a noisewith most of its power between 2 and 4 kHz. Next comes the “OH” sound in “Joe,”and it shows motion in time. The formants are moving. There is some weak noiseenergy for the “t” sound in “took,” and then comes the short “oo” vowel sound in“took.” The short “oo” vowel is too short for much motion. It appears to show darkregions near 400, 1,300, 2,200, and 3,200 Hz. We can compare that with the “U”sound in Table 22.1, as in “hood.” If this is a male talker (we don’t really know fromthis spectrogram), then formants are expected at 440, 1,020, and 2,240 Hz. Thesefirst three formants agree pretty well with the dark regions, though 1,020 Hz seemslow compared to 1,300 Hz. This discrepancy indicates that individual talkers aren’tnecessarily the same as the average talker.
Figure 22.4 shows that the “s” sound that ends the word “father’s” and the “sh”sound that begins the word “shoe” are totally merged in time. The breaks thatexperienced listeners perceive between different words may have no real acoustical
3
J OE T K F A TH ERS SH OE B E N CH OU TOO
2
TIME
FR
EQ
UE
NC
Y (
kHz)
1
0
Fig. 22.4 Speech spectrogram. Power is indicated by dark regions. From W.J. Strong, J. Acoust.Soc. Am. 41, 1434 (1967)
Exercises 235
existence in the speech waveform. The segmentation of different words from thecontinuum can be a problem for listeners who are less familiar with the language.
Something is moving a lot in the “oe” sound that ends the word “shoe.” Perhapsit is a second formant that is moving. In any case, there is no necessary motionin pronouncing the word “shoe.” You will find it possible, though perhaps a littleunnatural, to say the word “shoe” with all your articulators in a fixed position.Individual modes of speaking show greater or lesser motion. By contrast, it isimpossible to pronounce the word “out” without a lot of motion of the mouth. Thatcan be seen in the huge time variation in the first and second formants at the end ofthe sentence in Fig. 22.4. It looks as though the second formant drops from about1,500 to 1,000 Hz.
The speech spectrogram is a very useful method of studying speech. It is detailed,but not too detailed. Spectrograms of different individuals saying the same sentencecan show what parts of speech are essential to convey the intended words and whatparts are individual differences. The spectrogram gives clues as to the articulatorygestures used in speech, but they are only cues because there is more than one wayto make any given speech sound.
Exercises
Exercise 1, Breathing-in speech.Prove that it is not necessary to breathe out when you speak. It is possible to
speak while breathing in. Can you learn to control this kind of speech?
Exercise 2, We are all windbags!The text says that the lung capacity of the average human is about 5 L. A table
of weights and measures says that 1 L is 0.2642 gallons (that’s 0.22 British imperialgallons). (a) Calculate the average lung capacity in gallons; (b) in quarts.
Exercise 3, Feeling the buzz(a) Feel the buzz of your vocal folds when you make a voiced sound. (b) Which
of the following sounds are voiced: FF, SS, B, V, P, T?
Exercise 4, The nose knows.(a) Which speech sounds can you make with your mouth closed? (b) Practice
making the transition between “M” and “N” with your mouth closed and in oneposition. Can you get a friend to distinguish between these two sounds?
Exercise 5, Diphthongs or not?Say the vowels as you learned them in school: A, E, I, O, and U. Which vowels
would you expect to sound most nearly the same if played backwards?
Exercise 6, Plosive soundsWhere are the “explosions” taking place in your mouth in the sequence, “Pah,
Tah, Kah, Gah?” Does this sequence go from front to back or from back to front?

236 22 Speech
Exercise 7, Fricative soundsFricative sounds are made by blowing air past a constriction. Where are the
constrictions in the sequence, “Sah, Fah, Thah, Hah?”
Exercise 8, Whispered vowelsSay a vowel out loud. Now whisper the same vowel. Did you have to change the
shape of your vocal tract when you started to whisper? Why?
Exercise 9, ChimerasThe discussion of Table 22.1 noted that children have high fundamental
frequencies because their vocal folds are light, and they have high formantfrequencies because their vocal tracts, from the pharynx on up, are small. Can youimagine a creature with low fundamental frequencies and high formants or viceversa?
Exercise 10, Read a spectrogramIn the spectrogram, identify the spectral character of vowel formants, formant
transitions, fricatives (like sibilants), and plosives.
Exercise 11, The remarkable “AH”Refer to Table 22.1 and notice the separation in frequency between the first and
second formants of the AH and AW vowel sounds as in “hod” and “hawed.” Noticethat the separation is the smallest separation for any of the formants of any of thevowels in the table. Figure 22.4 has an AH sound in “father.” Can you now accountfor the big blob of power below 1,500 Hz in the spectrogram of that word?
Exercise 12, Benched!Look at the blobs of power in the “E” sound in the word “bench” in Fig. 22.4.
What are the frequencies for these regions? Do they agree with the formantfrequencies in Table 22.1 for the “E” sound as in “head?”
�

Chapter 23Brass Musical Instruments
The family of musical instruments known as brass instruments includes the trumpet,trombone, French horn, and tuba, among others. The ranges of these well-knownorchestral instruments are given in Appendix C. If you guessed that brass instru-ments are made out of brass you would be right, but they are sometimes made outof other materials as well. For instance, the vuvuzela is made out of vinyl. Whatreally characterizes the brass family, as we define it, is that the sound originateswith the vibration of the player’s lips in a mouthpiece. Some authors refer to brassinstruments as “lip-reed” instruments. Another characteristic of the brasses is thatthey all have a bell, a flaring end of the horn that radiates all the sound.
23.1 Sustained-Tone Instruments
Brass instruments are sustained-tone instruments, like the bowed strings, thewoodwinds, and the human singing voice. All these instruments make tones thatcarry melodies and can be used in close harmony. These tones are approximatelyperiodic, though they do not have the perfect cycle-to-cycle redundancy of the peri-odic complex tones from an electronic function generator. They include intentionalexpressive variations such as glides and vibrato (frequency modulation) and tremolo(amplitude modulation), as well as unintended noise and glitches. These tonesmight be called “adequately periodic,” in the sense that the perceived attributes ofharmonic fusion and unambiguous pitch that apply to the ideal tones from precisionelectronic function generators also apply to them.
Sustained tones, like those from brass instruments, are close enough to periodicthat the standard physical description of them begins with a perfectly periodic proto-type and then deals with variations as deviations from that prototype. The prototypeis not just an abstract idealization. With special care it is possible to produce asustained tone with a brass instrument that is stable on an oscilloscope screen formany seconds. That means that the relative phases among the harmonics do not
W.M. Hartmann, Principles of Musical Acoustics, Undergraduate Lecture Notesin Physics, DOI 10.1007/978-1-4614-6786-1 23,© Springer Science+Business Media New York 2013
237

238 23 Brass Musical Instruments
change over the course of many seconds. That, in turn, means that the harmonicfrequencies deviate from integer multiples of a fundamental frequency by muchless than 1 Hz. Thus, if brass-instrument tones differ at all from perfect periodicity,it is because the performer makes it so. The basic mechanism of sound productionis capable of making ideally periodic tones.
Harmonic Partials from Inharmonic Resonances The harmonics of a brassinstrument tone (essentially perfect)should not be confused with the resonances ofthe instrument itself. Brass instruments are hollow tubes that have been fashioned tomake air columns with modes of vibration with frequencies (resonance frequencies)that are approximately in a harmonic relationship. These modes, or resonances, areresponsible for generating the harmonics of tones, but they may easily deviate fromperfect harmonicity by 5 or 10 %. How a musical instrument generates a tone withpartials that are in a perfect harmonic relationship from resonances that are onlyapproximately harmonic is an essential part of the nonlinear tone generation processin wind instruments.
Thus, there are two essential problems in the understanding of brass instruments.The first is to understand the resonances of the instrument. The second is tounderstand how these resonances can be made to produce tones with clear pitchesand stable harmonic spectra. We deal with the resonance problem first.
23.2 Evolution of the Resonances of a Trumpet
Any brass-instrument player can pick up a piece of copper pipe and play a few notesby buzzing his lips in one end of the pipe. If the pipe is 1 m long, the notes will havefundamental frequencies of about 260, 430, and 600 Hz. These frequencies fit apattern; they are approximately 3 � 86, 5 � 86, and 7 � 86. Returning to the studyof cylindrical pipes in Chap. 8, you discover that this pattern looks like a pipe thatis open at one end and closed at the other. The closed end is closed by the player’slips. You can calculate the base frequency to be v=4L or 344=4 �1 D 86Hz, and thatagrees with the observed result. You also expect there to be only odd resonances. Itall works out, except that apparently the brass instrument player is unable to makea tone from the lowest resonance at 86 Hz. However, if a clarinet player comesalong and puts her reed mouthpiece on the end of the pipe, she can play a tonecorresponding to that low-frequency resonance.
The Bugle The first step in developing a useful instrument is to add a mouthpieceand bell to the cylindrical tube as shown in Fig. 23.1. The function of the mouthpieceis mainly to provide a comfortable and convenient place to vibrate lips. The bell hastwo functions. First, it helps to radiate the tone, especially the high harmonics of thetone so that the brass instrument sounds bright. Second, the bell greatly modifies theresonance frequencies of the instrument. They are no longer odd integer multiplesof a base.
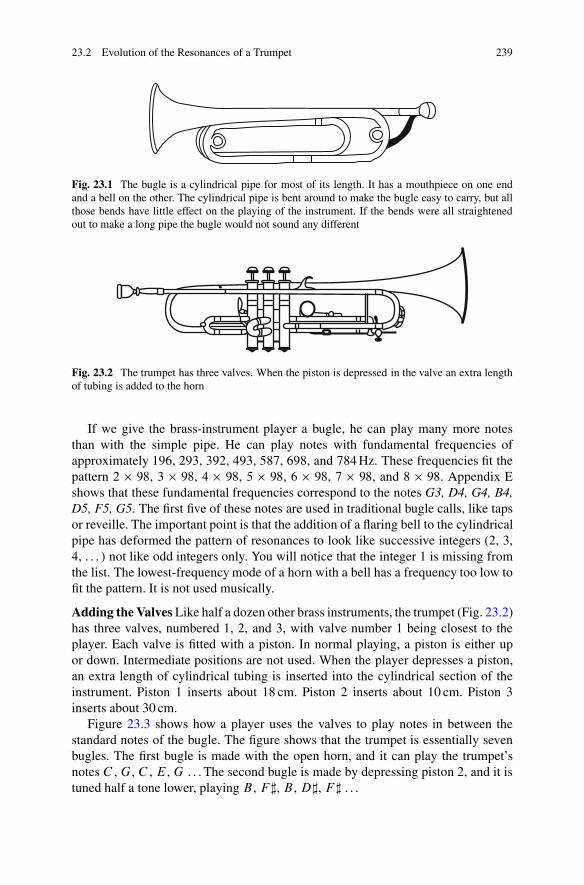
23.2 Evolution of the Resonances of a Trumpet 239
Fig. 23.1 The bugle is a cylindrical pipe for most of its length. It has a mouthpiece on one endand a bell on the other. The cylindrical pipe is bent around to make the bugle easy to carry, but allthose bends have little effect on the playing of the instrument. If the bends were all straightenedout to make a long pipe the bugle would not sound any different
Fig. 23.2 The trumpet has three valves. When the piston is depressed in the valve an extra lengthof tubing is added to the horn
If we give the brass-instrument player a bugle, he can play many more notesthan with the simple pipe. He can play notes with fundamental frequencies ofapproximately 196, 293, 392, 493, 587, 698, and 784 Hz. These frequencies fit thepattern 2 � 98, 3 � 98, 4 � 98, 5 � 98, 6 � 98, 7 � 98, and 8 � 98. Appendix Eshows that these fundamental frequencies correspond to the notes G3, D4, G4, B4,D5, F5, G5. The first five of these notes are used in traditional bugle calls, like tapsor reveille. The important point is that the addition of a flaring bell to the cylindricalpipe has deformed the pattern of resonances to look like successive integers (2, 3,4, . . . ) not like odd integers only. You will notice that the integer 1 is missing fromthe list. The lowest-frequency mode of a horn with a bell has a frequency too low tofit the pattern. It is not used musically.
Adding the Valves Like half a dozen other brass instruments, the trumpet (Fig. 23.2)has three valves, numbered 1, 2, and 3, with valve number 1 being closest to theplayer. Each valve is fitted with a piston. In normal playing, a piston is either upor down. Intermediate positions are not used. When the player depresses a piston,an extra length of cylindrical tubing is inserted into the cylindrical section of theinstrument. Piston 1 inserts about 18 cm. Piston 2 inserts about 10 cm. Piston 3inserts about 30 cm.
Figure 23.3 shows how a player uses the valves to play notes in between thestandard notes of the bugle. The figure shows that the trumpet is essentially sevenbugles. The first bugle is made with the open horn, and it can play the trumpet’snotes C , G, C , E , G . . . The second bugle is made by depressing piston 2, and it istuned half a tone lower, playing B , F ], B , D], F ] . . .
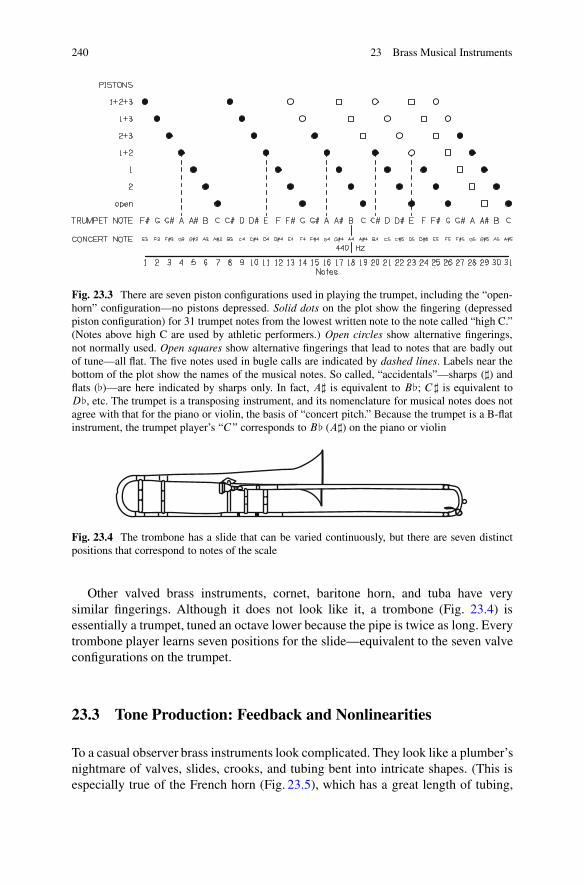
240 23 Brass Musical Instruments
Fig. 23.3 There are seven piston configurations used in playing the trumpet, including the “open-horn” configuration—no pistons depressed. Solid dots on the plot show the fingering (depressedpiston configuration) for 31 trumpet notes from the lowest written note to the note called “high C.”(Notes above high C are used by athletic performers.) Open circles show alternative fingerings,not normally used. Open squares show alternative fingerings that lead to notes that are badly outof tune—all flat. The five notes used in bugle calls are indicated by dashed lines. Labels near thebottom of the plot show the names of the musical notes. So called, “accidentals”—sharps (]) andflats ([)—are here indicated by sharps only. In fact, A] is equivalent to B[; C] is equivalent toD[, etc. The trumpet is a transposing instrument, and its nomenclature for musical notes does notagree with that for the piano or violin, the basis of “concert pitch.” Because the trumpet is a B-flatinstrument, the trumpet player’s “C ” corresponds to B[ (A]) on the piano or violin
Fig. 23.4 The trombone has a slide that can be varied continuously, but there are seven distinctpositions that correspond to notes of the scale
Other valved brass instruments, cornet, baritone horn, and tuba have verysimilar fingerings. Although it does not look like it, a trombone (Fig. 23.4) isessentially a trumpet, tuned an octave lower because the pipe is twice as long. Everytrombone player learns seven positions for the slide—equivalent to the seven valveconfigurations on the trumpet.
23.3 Tone Production: Feedback and Nonlinearities
To a casual observer brass instruments look complicated. They look like a plumber’snightmare of valves, slides, crooks, and tubing bent into intricate shapes. (This isespecially true of the French horn (Fig. 23.5), which has a great length of tubing,

23.3 Tone Production: Feedback and Nonlinearities 241
a
b
Fig. 23.5 (a) The French horn and (b) the baritone horn
all curled up into a convenient package.) But from a physical point of view, what istruly complicated about a brass instrument is the interaction of the player’s lips—buzzing in the mouthpiece—and the resonances of the plumbing. This section triesto deal with that interaction.
The mouthpiece of a brass instrument can be disconnected from the rest of theinstrument. If you give a bugle player the mouthpiece alone, the player can vibratehis lips without difficulty in the mouthpiece to produce a buzzy sound, rather likean obnoxious duck. While this buzzy sound continues, the rest of the instrumentcan be slid onto the mouthpiece to produce a normal bugle tone. What is interestingabout this little experiment is the sensation experienced by the player. With themouthpiece alone, the lip vibration feels chaotic. As the rest of the instrument isadded, the lips are forced into a more orderly pattern of vibration and the player canfeel this happening.
The cause of this change can be described as feedback from the horn to themouthpiece, or as reflections of puffs of air from the horn back to the mouthpiece,or as the result of standing waves in the horn. The standing waves can be called“resonances” of the horn. These descriptions are essentially equivalent. Becauseof its strong resonances, the horn reinforces lip vibrations near its resonancefrequencies. If the horn resonance frequencies are nearly in a harmonic relationship,they cause the lips to vibrate periodically and the puffs of air admitted into thehorn by the lips through the mouthpiece are caused to have a well-defined shapein space and time. Well-defined pulses lead to a brassy tone with strong highharmonics. If the resonance frequencies of the horn are not well aligned in aharmonic relationship, the puffs of air are less compact in shape and the tone qualitybecomes duller.

242 23 Brass Musical Instruments
The bugle player can get at least six different musical notes from the instrument.A trumpet player can get at least six for every configuration of the pistons. Of course,for each configuration the horn has only one set of resonances. Thus, it is evidentthat the player must be using the resonances in different ways to get all the differentnotes.
Figure 23.6 shows the resonances of a trumpet with no pistons depressed. Youcan see 14 resonant peaks there. Their frequencies are 92, 233, 364, 464, 587, 710,819, 937, 1,065, 1,183, 1,320, 1,451, 1,579, and 1,706 Hz. These are the peaksthat can be used to create tones. For example, the lowest tone of the open horn(no pistons down) has a fundamental frequency of 233 Hz. Figure 23.6 includescircles indicating the harmonics of the 233-Hz tone. Their frequencies are 233, 466,699, 932, 1,165, 1,398, and 1,631 Hz. The first five harmonics are supported by thenearby resonances, with peaks at 233, 464, 710, 937, and 1,183.
If the musician wants to play a different note, still with no pistons depressed,the musician will tighten the lips, and perhaps blow a little harder. The result willbe that the resonances are used in a different way to create a tone with a differentfundamental frequency. Learning how to control the lips in such a way as to makeflexible use of the resonances of the horn is the essence of learning how to play abrass instrument. The resonances that contribute to the different notes will becomeclear on the completion of Fig. 23.6 in Exercise 23.2.
The collaboration between vibrating lips and the resonances of the horn increating a tone has several consequences. These are described below in terms ofresonances numbered 1–14 starting from the left.
Consequence 1: Harmonic Amplitude vs Resonance Peak Height and TuningIf a resonance of the horn is close in frequency to a harmonic of the tone and theresonance peak is tall, the corresponding harmonic will normally be strong in thetone. For example, in the 233-Hz trumpet tone you can expect the second and thirdharmonics to be strong because the 4th and 6th resonance peaks in Fig. 23.6 are tall.For the note an octave higher, with fundamental frequency 466 Hz, the fundamentalshould dominate because the resonance at 464 is stronger than the other contributingresonances as you will see when you do Exercise 23.2. Because these resonances arefixed in frequency, as the playing (fundamental) frequency changes, tall resonanceslead to formants, characteristic of the instrument.
Consequence 2: Harmonic Amplitude vs Intensity If the player blows withgreater force, the amplitudes of all the harmonics increase. However, the amplitudesof the higher-frequency harmonics increase more than the amplitudes of the lower-frequency harmonics. Therefore, in relative terms, the high harmonics becomeincreasingly important, and the tone color becomes brighter.
Consequence 3: Playing Frequency vs Intensity Each resonance that helps tocreate a tone plays a role in determining the playing frequency. For example,consider the five resonances that help create the 233-Hz tone. Resonance number2, with a peak frequency at 233 Hz, wants the playing frequency to be 233 Hz.Resonance 4, with a frequency of 464 Hz, would like to create a second harmonic ofa 232-Hz tone, and therefore this resonance would like the playing frequency to be

23.3 Tone Production: Feedback and Nonlinearities 243
Fig. 23.6 The response curve for a trumpet indicates the amplitude of pressure variations at themouthpiece caused by feedback from the rest of the horn. This feedback will help the player’slips vibrate with frequencies of peaks of the response curve. Peaks are called resonances, the firstthree are numbered. A few of their frequencies are given too. Circles indicate the frequencies ofharmonics of low C, with a playing frequency of 233 Hz
232 Hz. That is because 464=2 D 232. Resonance 6, at 710 Hz wants to create thethird harmonic of 237 Hz because 710=3 D 237. Similarly resonance 8, at 937 Hzwants to create the fourth harmonic of 234 Hz, and resonance 10 at 1,183 Hz wantsto create the fifth harmonic of 237 Hz.
Evidently the different resonances are voting for different playing frequencies.But the voting is not equal. The votes are weighted by the contribution to thetone. This weighting leads to small changes in frequency with increased intensity.As described in Consequence 2, the higher harmonics become relatively moreimportant with increasing intensity. Harmonics 3, 4, and 5 would all vote for aplaying frequency that is higher than 233 Hz. As they become more important withincreased blowing pressure, the playing frequency of this note on this instrumentwill tend to rise slightly.
Consequence 4: Bending Notes Establishing the playing frequency of a brassinstrument can be imagined in three steps. (1) First the musician tightens his lipsand sets the blowing pressure to establish the general frequency range of the note tobe played. (2) Then the resonances of the horn determine more precisely what theplaying frequency shall be, within the range established in step (1). The resonancesdetermine the reflections of puffs of air backwards toward the mouthpiece that

244 23 Brass Musical Instruments
cause the musician’s lips to open at the right time to admit a new puff of air. Ifa trumpet player is playing “high C,” with a fundamental frequency of 932 Hz, thenthe player’s lips open and close 932 times per second, admitting 932 puffs of airevery second. (3) Finally, the musician can establish some micro control of theplaying frequency. He can “lip” the frequency up or down. Because the playingfrequency is always a compromise among the different resonances, and becausethe resonance peaks themselves are not infinitely sharp, a musician can tighten orrelax his lips ever so slightly to cause the instrument to run a little bit sharp or flatcompared to the best combination of resonances. In this way, a musician can bendnotes. Bending notes can be used to play better in tune with another instrument orfor expressive effect, as in jazz performance. If a trumpet player wants to bend a noteby a large frequency difference, he can deliberately wreck the pattern of resonancesof his instrument by closing a valve (usually the second valve) half way. When thevalve is caused to be neither fully open nor fully closed, the resonances become paleshadows of what they were normally. Because the resonances are then not so strong,the musician’s lips have more micro control of the playing frequency, but the tonequality becomes stuffy and not at all brassy.
Exercises
Exercise 1: Trumpet tonesWith an open horn, a trumpet can play notes that the trumpet player calls C4, G4,
C5,E5,G5,C6. The trumpet is a “transposing” instrument, which means that the realnotes (concert notes) are B[3, F4, B[4, D5, F5, B[5. These notes have fundamentalfrequencies: 233, 349, 466, 587, 698, 932 Hz, respectively.
(a) From the frequencies, show that all the notes calledC are in octave relationships.
(b) Show that the notes calledG are a musical fifth above the notes calledC becausethe frequency ratios are about 3/2.
Exercise 2: Trumpet resonances and trumpet tonesRefer to Fig. 23.6, the large resonance curve for the open trumpet. Do the
following steps on that plot. (a) Complete the numbering of resonances, 1–14. (b)Complete the list of peak frequencies on the plot. They are: 92, 233, 364, 464,587, 710, 819, 937, 1,065, 1,183, 1,320, 1,451, 1,579, and 1,706 Hz. (c) Use circlesto indicate which resonances are used to make the six tones with the fundamentalfrequencies given in Exercise 1 (notes are C, G, C, E, G, C in trumpet notation). Thefirst tone, C 233-Hz, has been done for illustration.
Exercise 3: Open or closed or neither?A bugle resembles a pipe that is open at one end (the bell) and closed at the other
(the mouthpiece). However, in an important sense it better resembles a pipe thatis open at both ends. In what sense is that? How do you account for this apparentparadox?
Exercises 245
Exercise 4: Trumpet valves and trumpet tonesA trumpet has three valves (so do many other brass instruments). In normal
playing, a valve is either open or closed. Show that the valve combinations canbe represented as a 3-bit word. Therefore, show that there are eight possiblecombinations. Which combination is missing from Fig. 23.3?
Exercise 5: Trombone and trumpetThe trombone tubing is about twice as long as the trumpet. Show why you expect
it to sound an octave lower.
Exercise 6: French horn and trumpetThe French horn tubing is about twice as long as the trumpet, but the playing
frequencies are about the same as the trumpet. How can this be? [Hint: The notesthat can be played in a single valve position on a French horn are much closertogether than the notes that can be played on a trumpet.]
Exercise 7: The abused bugleThe author owns a bugle that was thoroughly dented during several years of
camp. The bugle still plays the right notes (correct fundamental frequencies) butthe tone color is bad. Can you explain?
Exercise 8: Speedy!The text says that when a trumpet player plays “high C,” his lips open and close
932 times per second. Bozo disagrees. He says that nobody can move his muscles,even lip muscles, at such a rapid rate. Set Bozo straight on this matter.
Exercise 9: Resonances againThe chapter makes frequency use of the concept called “resonances.” What’s the
relationship between that concept and resonance as described back in Chap. 3?
�

Chapter 24Woodwind Instruments
The family of musical instruments known as the woodwinds includes reedinstruments like the clarinet and oboe. It also includes edge-tone instruments likethe recorder and flute. Unlike the brass instruments, which are sealed systems ofplumbing terminated by a bell where all the sound comes out, the woodwinds havetone holes, and much of the sound is radiated by these tone holes.
24.1 Single-Reed Instruments
A single-reed instrument has a cane reed attached to a mouthpiece. The reed vibratesagainst the mouthpiece, allowing a puff of air into the rest of the instrument eachtime the reed opens. If the instrument plays a tone with a fundamental frequency of440 Hz, the reed opens 440 times per second. Among the well-known single-reedinstruments are the clarinets and saxophones.
The Clarinet The clarinet (Fig. 24.1) has a cylindrical bore. Although there is asmall bell at the end, the bell is acoustically unimportant except in playing thelowest notes, when most of the tone holes are closed. The clarinet, of all musicalinstruments, most resembles the cylindrical pipe open at one end and closed atthe other. You will recall from Chap. 8 that such a system has only odd-numberedresonances. The low notes of a clarinet reflect that fact. The second and fourthharmonics of tones with low-frequency fundamentals are very weak compared to thethird and fifth harmonics. Wow—the physics is working! Contrary to expectation,however, the sixth harmonic can be relatively strong. The wavelength of the sixthharmonic is short enough that small deviations from the cylindrical bore becomeimportant—the mouthpiece is tapered, and the bore of the entire instrument isdimpled with closed tone holes.
The low-frequency tones constitute the low “register” of the clarinet. There are19 notes in this register, and they have the distinctive hollow sound of a complexperiodic tone with missing second and fourth harmonics. These notes correspond
W.M. Hartmann, Principles of Musical Acoustics, Undergraduate Lecture Notesin Physics, DOI 10.1007/978-1-4614-6786-1 24,© Springer Science+Business Media New York 2013
247

248 24 Woodwind Instruments
Fig. 24.1 The clarinet resembles a cylindrical pipe, open at one end and closed at the other
a
b
Fig. 24.2 (a) Schematic clarinet with the first mode of vibration. (b) Schematic clarinet withregister hole open supporting the second mode of vibration with a frequency that is three timeshigher than the first
to the first mode of vibration of air in an open–closed pipe, where the open end isapproximately at the position of the first open tone hole.
Higher-frequency tones on the clarinet are in the second register, where thestanding waves correspond to the second mode of vibration of air in an open–closedpipe. The second mode has one node, and the clarinet is fitted with a register key,which opens a hole to help force a node in the air column at the right place to activatethe second mode of vibration. Because the frequency of the second mode is threetimes the frequency of the first, the clarinet “overblows the twelfth.” The musicalinterval called the “twelfth” is an “octave” and a “fifth,” or a factor of three. (SeeAppendix D.) Still higher notes on the clarinet use the third mode of vibration ofair, a mode with two nodes (Fig. 24.2).
The Saxophone Unlike the clarinet, the saxophone (Fig. 24.3) has a conical bore,i.e., the bore is like a truncated (cut-off) cone. While a cylinder open at one endand closed at the other has only odd-numbered resonances, a cone has both odd-and even-numbered resonances. The resonant frequencies of a cone are given by theformula f D Œv=.2L0/�n, where v is the speed of sound in air, and n is an integer,1, 2, 3, . . . Length L0 is somewhat strange. It is not the length of the truncated cone.Instead, it is the length that the cone would have if it were not truncated (Fig. 24.4).
Free Reeds Instruments like the harmonica and accordion also generate musicalnotes using a single reed. Musical toys played at parties on New Years Eve operateon a similar principle. These instruments might be called woodwinds, but they arenot in the same family with the clarinet and saxophone. The clarinet and saxophonehave a beating reed—the reed opens once per cycle of the tone as it beats againstthe mouthpiece. The free reed is in a window that allows it to open both in and outof the window. Therefore, the free reed opens twice per cycle of the tone, and the

24.1 Single-Reed Instruments 249
Fig. 24.3 Saxophones from left to right: soprano, tenor, baritone
Fig. 24.4 A saxophone is like a truncated cone, shown by the solid line. Its effective length is L0
including the dashed conical extension
spectrum has a strong second harmonic. Another important difference is that theplaying frequency of a free-reed instrument is mainly determined by the reed itself.This frequency is established by a combination of stiffness (numerator) and mass(denominator) that you would expect for a free vibrator. By contrast, the playingfrequency of a clarinet or saxophone is determined by the air column. The naturalfrequency of the reed in these instruments does have an effect, but it does not affectthe playing frequency, instead it leads to a formant. Harmonics in the tone that arenear the reed resonance tend to be strong.

250 24 Woodwind Instruments
Fig. 24.5 The oboe (top) and the bassoon (bottom) are the two most important double-reedinstruments
24.2 Double Reeds
The best-known double reed instruments are the oboe and the bassoon (Fig. 24.5).In contrast to a single reed instrument, where the reed vibrates against a mouthpiece,the two reeds of a double reed vibrate against one another. At instants in time whenthere is a gap between the two reeds a puff of air enters the rest of the instrument.
The oboe and bassoon both have conical bores, like the saxophone, but the coneangle is less than in the saxophone and this difference makes the high harmonicsof the double reed instruments relatively stronger. Appendix C shows that thefrequency range of the oboe is similar to that of the clarinet, though narrower, andthe range of the bassoon is similar to the cello. Many of the tones played on theseinstruments have unusual spectra, with harmonics 3, 4, and 5 as strong or strongerthan 1 and 2. Both instruments exhibit formants, near 1,000 and 3,000 Hz for theoboe and near 460 Hz for the bassoon. These formants are probably attributable toreed resonances. As a result, the oboe and bassoon have a very distinctive tone color.Traditionally, the oboe is used to tune the orchestra, possibly because the upperharmonics are strong enough to stand out over the cacophony as other instrumentstune up.
24.3 Reeds in General
Although there is a lot of variety among the single and double reed instruments,it’s important to recognize that the basic mechanism of tone production for all ofthese instruments is similar to the process described for a bugle in the chapter onbrass instruments. Just as feedback from the horn entrains the vibration of the brassplayer’s lips, so the feedback from the main body of a reed-woodwind instrumententrains the vibrations of the reed. Both lips and reeds operate as pressure-controlledflow valves. The large pressure variations at the mouthpiece (closed end) caused bythe standing waves in the body of the instrument control the entry of puffs of air intothe instrument. The importance of the body of the instrument becomes evident if theinstrument is disassembled, and the reed and mouthpiece are blown in the usual way.The sound of the mouthpiece and reed alone is a high-frequency squeal. The main

24.4 Edge Tone Instruments 251
body of the instrument is needed to support a useful playing frequency. Just as in thebrass instruments, the resonances of the plumbing determine the harmonics of thetones, but the player’s embouchure (position, orientation, and stiffness of the lips)determines whether the playing frequency will be high, low, or in the middle, andthus determines which resonance will be assigned to each harmonic.
24.4 Edge Tone Instruments
When a stream of air impinges on a sharp edge, the pattern of air flow is unstable.If you blow across the width of a pencil, for example, you will hear a rushing noisecoming from the air stream chaotically vibrating from one side of the pencil toanother. In musical instruments employing a vibrating air stream as the originalsource of sound, the vibrations can be entrained by attaching a resonator, such asan open pipe. This is the basis of instruments like the recorder or the flute. Theedge, where the tone is generated, is in a hole in the wall of the cylindrical tube. Asa result, the instrument resembles a pipe with two open ends. Therefore, an edge-tone instrument is different from a reed instrument, where the tone is generated at aclosed end.
Edges with a Fipple A whistle, like a referee’s whistle, is an edge-tone instrumentthat anybody can play—even without practicing. That’s because it has a fipple, anentry duct that guides the stream of air against the edge. With enough blowingpressure, good tone generation is automatic. Recorders (Fig. 24.6) are instrumentswith fipples, conical bores, and tone holes. They were popular in baroque timesand are still used in baroque music ensembles. Recorders are often used for musiceducation in schools because they can be made inexpensively out of plastic and areeasy to play because of the fipple.
The Ocarina The ocarina is another fippled-instrument that is easy to play. Theocarina is rather unique among musical instruments in that its shape can be justabout anything that the maker wants. Typical shapes resemble blobs, and the ocarinais sometimes called the “sweet potato.”
Unlike the other instruments of this chapter, which use the modes of aircolumns, the ocarina uses a mode similar to the mode of a soda bottle. It is calledthe “Helmholtz mode” or the “Helmholtz resonance.” In this mode of vibration,the mass of air in the neck of the bottle serves as the vibrating mass, and the
Fig. 24.6 An alto recorder is an ancient instrument

252 24 Woodwind Instruments
Fig. 24.7 This Helmholtzresonator has a clearlydefined neck
compressibility of air in the rest of the bottle serves as the spring. Of course, formost bottles the division into mass and spring parts is not clear cut. The bottle tendsto be a continuous system. But just as one could identify mass in the tines of tuningfork and spring in the shoulders of a tuning fork, one can say that parts of the air inthe bottle play the role of a mass and parts play the role of a spring (Fig. 24.7).
The frequency of the Helmholtz resonance is given by
fH D v
2�
rA
V l(24.1)
where v is the speed of sound in air, V is the volume of the bottle, A is the cross-sectional area of the neck, and l is the length of the neck. The dependence on thevolume of the bottle indicates that the details of the shape are unimportant.
By blowing very hard, a player can excite a second mode of vibration of air in anocarina—more easily in some instruments than in others. Modes of vibration higherthan the Helmholtz resonance are called “cavity modes.” In general their frequenciesare much higher than fH and not at all harmonically related to fH . The shape of acavity mode, its frequency, and the ease with which it can be excited depend on theshape of the instrument.
A case can be made that the ocarina is a more successful instrument than therecorder. The problem with the recorder is that it is difficult to play low-frequencynotes loudly. When the player increases the blowing pressure, there is a great riskthat the oscillation of air will jump from the low-frequency mode to a second mode,with a frequency that is an octave higher. The ocarina suffers less from this problembecause the second mode of vibration is so far removed in frequency and so differentin mode shape. For the same reason the ocarina does not have a rich spectrum. It’swaveform is mostly a sine tone.

24.6 The Flute 253
24.5 Boatswain’s Pipe
From old movies of ancient naval warfare, you will recall the high-pitched sound ofthe boatswain’s pipe. The pipe, or whistle, of the boatswain (pronounced “bosun”)had to be audible in a gale everywhere on the ship. It is tuned to about 3,000 Hz,right where the auditory system is most sensitive and well above the spectral rangeof most wind and waves. The boatswain’s pipe uses the resonance of a small, hollowmetal sphere with a hole. Because it is metal, the wall of this spherical cavity is thinand one can hardly imagine a neck length. Thoughts like this raise the concept ofthe Helmholtz resonator without a neck.
The theory of the neckless Helmholtz resonator supposes that the mass of theoscillator corresponds to the air just outside the tone hole. It is essentially the sameconcept as led to the end correction for the open ends of pipes. The resonancefrequency of such a cavity is given by
fH D v
2�
r1:85a
V; (24.2)
where a is the radius of the tone hole.
24.6 The Flute
The flute (Fig. 24.8) is an edge-tone instrument resembling a pipe open at both endslike the recorder. However, the flute does not have a fipple. Instead, the player isresponsible for directing the stream of air optimally against the edge to make a tone.Therefore, the flute is more difficult to play than the recorder. Nevertheless, the flutehas now replaced the recorder as an important instrument in orchestras and bands.The reason is that the flute player can redirect the air stream so as to avoid the octavejump at high stream velocities. Therefore, the flute player can play low-frequencytones at higher levels of intensity. Actually, loud, low-register tones on the flute tendto have a very strong second harmonic. But even though the second harmonic isstrong, the flute player is able to keep the oscillations going in the first mode ofvibration so that the fundamental of the tone is still in the spectrum, and the pitchstays in the lower octave.
Because it has a cylindrical bore for most of its length, the flute overblows the oc-tave. “Overblowing the octave” means that if a player is playing a
Fig. 24.8 The flute looks complicated, but it is basically a cylindrical pipe with holes in the wall

254 24 Woodwind Instruments
low-frequency tone, and blows harder without making a compensating correctionin the embouchure, then the frequency will jump up by an octave. Tones in thissecond register (one node) and tones in the third register (two nodes) are rather likesine tones if played softly. No other instrument in the orchestra makes a tone that ismore sinusoidal.
The flute is about 60 cm long. That is such a long piece of pipe that if tone holesare placed optimally, the tone holes are too far apart for a player’s fingers to reach.As for the reed woodwinds, an elaborate system of keys, rings, and pads has beenworked out so that the instrument can be played with ordinary human hands. Thepresent design was invented by Theobald Boehm in 1871. The world still awaits thegenius who will invent such a system for the ocarina. When this happens, the sweetpotato will be boss.
The piccolo operates according to the same principles as the flute. It is about halfas long, and, as expected, plays about an octave higher.
Exercises
Exercise 1, Clarinet resonances and clarinet tonesThe clarinet is approximately a cylindrical tube, open at one end and closed at
the other. (a) Show why you expect the clarinet tone to have only odd-numberedharmonics. (b) Appendix C says that the lowest note on a clarinet has a frequencyof 147 Hz. Given a first mode frequency of 147 Hz, calculate the expected length ofa clarinet.
Exercise 2, Clarinet register keyThe clarinet has a register key to aid in playing the second mode of vibration of
air in the column. Why would you expect the register key to be at a position that is1/3 of the way from the mouthpiece to the end of the horn?
Exercise 3, Clarinet and fluteA flute is a pipe open at both ends. It is about as long as a clarinet, but it sounds
an octave higher. Why?
Exercise 4, Clarinet and oboeThe oboe has a conical bore. It is not cylindrical like the clarinet but flares on the
inside. The oboe also has a double reed and not a single reed. The double reed of theoboe snaps shut for an appreciable fraction of a normal playing cycle. The singlereed of the clarinet does not normally close so much except at very high playinglevels. Explain why you expect the oboe to have a brighter tone color.
Exercise 5, Reeds and singing(a) In what way are the behaviors of vocal folds and vocal tracts in singing similar
to a free-reed instrument . . . and not similar to a saxophone? (b) In what way are thevocal folds more like an oboe than like a clarinet.
Exercises 255
Exercise 6, The fluteFrom the embouchure hole to the open end, the flute is about 60 cm long. What
do you expect the frequency to be for the lowest possible note on the flute?
Exercise 7, Platinum flutes and metal clarinetsThe sound of a woodwind instrument comes from the vibrations of a column
of air inside the instrument. The walls of the instrument only serve to confinethe air column. The walls do not vibrate much, they do not radiate appreciably.Therefore, the scientific evidence supports the notion that the wall material is. . . well . . . immaterial to the playing of the instrument or the quality of the tone.Musicians on the other hand often disagree. What do you think?
Exercise 8, The bosun’s pipeOn a boatswain’s pipe, the radius of the tone hole is about half the radius of the
spherical cavity. Show that the frequency of the pipe is given by
fH D 5146=D (24.3)
where D is the diameter of the sphere in cm. Therefore, to make the pipe have afrequency of 3,000 Hz requires a sphere with a diameter of about 1.7 cm.
Exercise 9, Tuning up to the oboeThe text says that the oboe may be used to tune the orchestra because its upper
harmonics are strong enough to be heard against the rest of the orchestra. What goodwould that be? What good would it be to hear only the upper harmonics?
Exercise 10, Harmonica spectrumFigure 24.9 shows the power spectrum of the lowest note on a Hohner Blues
Harp. (a) What is the fundamental frequency, and what musical note would thatbe? (See Appendix E.) (b) How many harmonics can you find over the range of thespectrum? (c) Do you expect the harmonica tone to be periodic in time? (d) Comparethe levels of the fundamental and the second harmonic. (e) Compare the levels ofthe fundamental and the 12th harmonic.
�

256 24 Woodwind Instruments
−20
−30
−40
−50
−60
−70
−80
−90
−100
dB0
200400600800
1K1.2K
1.4K
1.6K
1.8K
2K2.2K
2.4K
2.6K
2.8K
3.2K
3.4K
3.6K
3.8K
4K4.2K
4.4K
4.6K
4.8K
5K3K
Fig
.24.
9Sp
ectr
umof
the
low
estn
ote
ona
smal
lhar
mon
ica
for
Exe
rcis
e10
Chapter 25String Instruments
It is hard to overestimate the importance of the stretched string in music—so manyinstruments, ancient and modern, use the stretched string as the initial source ofsound. The string is used in two different ways, as a percussive string and as abowed string. A percussive string may be plucked, as in a guitar or harpsichord, orit may be struck, as in a piano. A bowed string is continuously excited by the actionof the bow and it produces a sustained sound. This chapter treats the percussive andbowed strings in turn.
25.1 Percussive Strings
A percussive string is a free vibrator. After it is once struck or plucked, it vibrates inits natural modes like the vibrators of other percussion instruments such as bellsor drums. Chapter 7 described the modes of a freely vibrating string and notedthat ideally their frequencies are in a harmonic relationship. Chapter 7 concludedby noting that real strings are not completely ideal and that deviations from idealbehavior would be presented at a later time. That time has now arrived.
Like every oscillator, a stretched string must experience a restoring force thattends to move it back in the direction of equilibrium when it has been displaced.The restoring force comes about in two ways. First, there is the tension in thestring, second there is the stiffness of the string. To the extent that the restoringforce comes from tension alone, the string is ideal and its modal frequencies areperfect harmonics. To the extent that the restoring force comes from stiffness thestring resembles a solid rod. As will be seen in Chap. 26 on percussion instruments,the solid rod is a very inharmonic system. Every real musical string is partly ideal,but partly it is a rod.
The stiffness of a string is not normally important for low-numbered modesof vibration that don’t bend the string sharply. However, high-numbered modesof vibration, with many bends, are affected by the stiffness, and their frequencies
W.M. Hartmann, Principles of Musical Acoustics, Undergraduate Lecture Notesin Physics, DOI 10.1007/978-1-4614-6786-1 25,© Springer Science+Business Media New York 2013
257

258 25 String Instruments
are progressively increased. For the highest modes, the deviation from perfectharmonicity is proportional to the cube of the mode number, i.e., proportional to n3.A formula that describes this behavior gives the frequency of mode number n as
fn D nf1Œ1C ˛.n2 � 1/�: (25.1)
The ideal behavior, where fn is just n times the frequency of the fundamental(f1), is outside the square brackets. The deviation is within the square brackets.
The size of the deviation from ideal behavior is determined by ˛, which dependson the properties of the string,
˛ D �3r4E
8FL2: (25.2)
Here r is the radius of the string, and E is a property of the string material. It isa measure of the resistance to being stretched known as Young’s modulus. In thedenominator, F is the tension in the string, and L is the length of the string. Theinterpretation of Eq. (25.2), with quantities r , E , L, and F , is that if you want to getideal behavior then you need a thin (r) and flexible (E) string. It should be long (L)and should be stretched to a high tension (F ). The opposite conditions tend to leadto a large value of ˛ and more inharmonic behavior.
At this point it is good to reconsider the guitar player’s equation, number (7.7),which says that the playing frequency, or fundamental frequency, of a string is
f1 D 1
2L
sF
�; (25.3)
where � is the linear mass density of the string. This equation suggests that if youwant to see ideal behavior then it is the low-frequency tones that are going to giveyou trouble. The reasoning is this: first, there is a practical limit on how long thestring can be. (However much you might enjoy a 20-ft piano, you couldn’t get itinto the house.) Therefore, to get low frequencies you need to reduce the tension(F ) and increase the mass per unit length (�). But reducing the tension and makingthe string thicker (r) to increase the mass both tend to increase parameter ˛ and leadto inharmonic components in the tone.
One way to help solve the low-frequency problem is to use a wound string.A wound string consists of a thin nylon or steel string core, with windings of brasswire. The windings add mass to the string to help increase � but they are not nearlyas stiff as a solid wire with comparable mass because the windings are in flexiblecoils. Guitars, pianos, and violins all use wound strings for the low-frequencystrings.
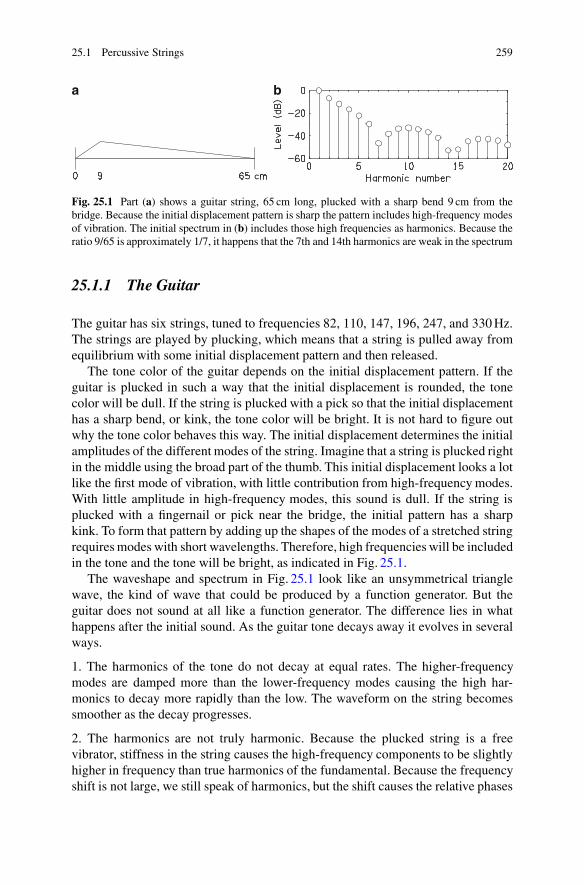
25.1 Percussive Strings 259
a b
Fig. 25.1 Part (a) shows a guitar string, 65 cm long, plucked with a sharp bend 9 cm from thebridge. Because the initial displacement pattern is sharp the pattern includes high-frequency modesof vibration. The initial spectrum in (b) includes those high frequencies as harmonics. Because theratio 9/65 is approximately 1/7, it happens that the 7th and 14th harmonics are weak in the spectrum
25.1.1 The Guitar
The guitar has six strings, tuned to frequencies 82, 110, 147, 196, 247, and 330 Hz.The strings are played by plucking, which means that a string is pulled away fromequilibrium with some initial displacement pattern and then released.
The tone color of the guitar depends on the initial displacement pattern. If theguitar is plucked in such a way that the initial displacement is rounded, the tonecolor will be dull. If the string is plucked with a pick so that the initial displacementhas a sharp bend, or kink, the tone color will be bright. It is not hard to figure outwhy the tone color behaves this way. The initial displacement determines the initialamplitudes of the different modes of the string. Imagine that a string is plucked rightin the middle using the broad part of the thumb. This initial displacement looks a lotlike the first mode of vibration, with little contribution from high-frequency modes.With little amplitude in high-frequency modes, this sound is dull. If the string isplucked with a fingernail or pick near the bridge, the initial pattern has a sharpkink. To form that pattern by adding up the shapes of the modes of a stretched stringrequires modes with short wavelengths. Therefore, high frequencies will be includedin the tone and the tone will be bright, as indicated in Fig. 25.1.
The waveshape and spectrum in Fig. 25.1 look like an unsymmetrical trianglewave, the kind of wave that could be produced by a function generator. But theguitar does not sound at all like a function generator. The difference lies in whathappens after the initial sound. As the guitar tone decays away it evolves in severalways.
1. The harmonics of the tone do not decay at equal rates. The higher-frequencymodes are damped more than the lower-frequency modes causing the high har-monics to decay more rapidly than the low. The waveform on the string becomessmoother as the decay progresses.
2. The harmonics are not truly harmonic. Because the plucked string is a freevibrator, stiffness in the string causes the high-frequency components to be slightlyhigher in frequency than true harmonics of the fundamental. Because the frequencyshift is not large, we still speak of harmonics, but the shift causes the relative phases

260 25 String Instruments
among the harmonics to change with time, and this change is another reason thatthe shape of the wave evolves as the tone sounds.
3. There may be audible effects because the vertical and horizontal polarizationsof the string vibration do not have identical frequencies. Recall that the stringdisplacements are transverse to the string length, but these may be either vertical(perpendicular to the guitar top) or horizontal (parallel to the guitar top). Becauseof the connection of the string at the bridge, the string appears to have slightlydifferent lengths for these two polarizations and the difference may produce slowbeats, a further kind of evolution.
4. Most important, the string vibration is not heard directly. The string itself movesvery little air. Instead, in an acoustic guitar, the string is coupled to the top platethrough the bridge, and the top plate is coupled to the air cavity within the guitar.The top plate radiates because it has a large surface, and the cavity radiates throughthe sound hole. The top plate and cavity together have resonances that filter thesound of the string as they radiate it, in much the same was as the vocal tract filtersthe glottal pulse from the vocal folds.
25.1.2 The Electric Guitar
The electric guitar is different from the acoustic guitar in that the sound is notradiated by the top plate and sound hole. In fact, a top plate and sound hole don’tnormally exist, and if they do they do not matter acoustically. Instead, the stringvibrations are picked up by electromagnetic transducers to create an electrical signalwhich can then be amplified (often a lot) and reproduced by loudspeakers (often verylarge loudspeakers).
A transducer is made by wrapping coils of wire onto a permanent magnet beneatha string. The string is steel, which is a magnetic material. Thus when the stringvibrates it alters the field from the permanent magnet and creates a voltage in thecoil by means of the generator principle described in Chap. 16. The effect generatesan appreciable voltage only if the coil is close to the vibrating string, and there isnormally a separate transducer for each string.
The signal that comes out of the electric guitar represents the string motion at theposition of the transducer. If the transducer is placed near the bridge, it efficientlypicks up high-frequency modes and the tone is bright. If the transducer is fartherfrom the bridge it picks up the large vibrations of low-frequency modes and the toneis mellow. Electric guitars often have two or three sets of transducers at differentdistances from the bridge to provide options.
Except for this very different sound radiation process, the electric guitar is likean acoustic guitar. Similar processes cause the string vibration to evolve in similarways as the tone decays, although the decay is of longer duration in the electricguitar (see Exercise 5).
25.1 Percussive Strings 261
25.1.3 The Piano
The piano is like the guitar in that the strings of a piano are free vibrators. However,while the guitar strings are plucked, the piano strings are struck. A modern pianohas 88 keys. When a key is depressed, a hammer with a felt surface is thrown againstthe strings tuned to a single note. The striking of the strings leads to a brief noise atthe very start of the piano attack. As in the guitar, the strings themselves radiate verylittle sound. The strings of the piano pass over a bridge connected to a soundboard,and the soundboard is responsible for the radiation.
As for the guitar, the frequencies of the modes of vibration of the string are“stretched” compared to harmonic frequencies. There are similar questions ofscaling. The string length, string tension, and string mass must be chosen to playthe right frequency, to obtain good coupling to the radiator, and to satisfy practicalconsiderations such as the size of the instrument and the physical limits on themaximum tension. The piano maker has some advantages. The musician does nothold the piano in his lap, and the piano can be large. The frame can be made ofheavy steel to support the tension in the strings—a total of 20 tons of tension ina concert grant piano! Of course, there are correspondingly great demands on thepiano maker. The piano needs to cover a wide frequency range—notes tuned from28 to 4,196 Hz, and the piano is required to produce a big sound.
The three effects of a non-ideal string that lead to an evolving vibration pattern,and an interesting tone, for the guitar also apply to the piano. In addition, the pianotone has another avenue of evolution. Piano tones are played on multiple strings.Corresponding to the 88 different notes on the piano are more than 225 strings. Mostof the notes of the piano have three strings. The mid-bass region has two strings, andonly the low bass notes have a single string.
The three strings assigned to a single piano tone are not all tuned to identicalfrequencies. First, it would be physically impossible to make them absolutelyidentical. Second, there is evidence that piano tuners adjust the mistuning amongthe three strings to produce the best sound. Mistuning leads to beats, of course, butthe different harmonics of the tone beat at different rates and the perceived effect ofthe beats is subtle. The mistuning among the multiple strings leads to an importantcharacteristic of piano tone, a double decay pattern.
When the hammer strikes the three strings, it first causes them all to move up anddown together. All the strings force the bridge in the same way. The bridge movesa lot and extracts energy from the vibrating strings with great efficiency. This leadsto an intense attack sound. It is a sound that decays rapidly because the strings arelosing energy at such a high rate. But, because the strings have slightly differentfrequencies, it takes only a few seconds before the vibrations of the individualstrings are no longer in phase. Then the strings force the bridge independently. Thiscauses the coupling to the bridge to be less efficient, and the rate of decay becomesslower. The slowly decaying part of the tone is called the “aftersound.” It can easilycontinue for a minute (Fig. 25.2).

262 25 String Instruments
Fig. 25.2 The piano tone has a two-part decay pattern. At first, the strings vibrate in phase,creating an intense rapidly-decaying tone. After the string vibrations become out of phase, theaftersound decays more slowly. The tone shown here stops abruptly after 15 s because the playerreleased the key. When the key is released a damper makes contact with the string and stops thetone
Fig. 25.3 Bowed string instruments, from left to right: the violin, the viola, the cello, thedoublebass or bass viol
25.2 Bowed Strings
The class of orchestra instruments known as the strings includes the violin, viola,cello, and double bass (Fig. 25.3). These instruments are sometimes called the violinfamily. The ranges of these important instruments are given in Appendix C. Thebasic sound producing element is the vibrating string. Sometimes the string isplucked, a style of playing known as “pizzicato.” When plucked, a violin stringis a free vibrator, just like a guitar string. Normally, however, the string is bowed.

25.2 Bowed Strings 263
Fig. 25.4 Two cycles of the stick–slip process. The y axis shows the displacement of the stringat the location of the bow as time progresses. The slipping takes place between times t2 and t3.Because it takes 4.545 ms for two cycles, you know that the playing frequency is 440 Hz. Time t1is a marker for Fig. 25.5
Bowed strings are not free vibrators. They are driven vibrating systems likethe brasses and woodwinds. Like the brasses and woodwinds, the bowed stringsare sustained-tone instruments. Their tones have exact harmonics and are stablewhen viewed on an oscilloscope. As in all the other sustained-tone instruments,feedback and a nonlinear tone generation process are responsible for creating a tonewith harmonic partials from resonances that are only approximately in a harmonicrelationship.
25.2.1 Tone Generation in the Bowed Strings
The tone generation process is similar in all the bowed string instruments. Fordefiniteness, the following discussion will refer to the violin, but it might as wellbe directed toward any of the others.
The bow of a violin is made of many strands of horse hair, stretched into a thinribbon. When the bow is drawn across a string, the string is set into vibration. Theprocess by which the bow excites the string can be described as a “stick–slip”process. As the bow moves across a string, it pulls the string with it. This is the“sticking” phase of the stick–slip process. Violin players put rosin on the bow tocontrol the amount of sticking. As the string is pulled aside by the bow it is stretched,and tension builds up. Eventually the tension is so great that the string slips andmoves in a direction that is opposite to the bow motion. This is the “slipping” phaseof the stick–slip process. Once the string has slipped back, it is ready to be pickedup by the bow again and another cycle begins. During the sticking part of the cycle,the speed of the string is the speed of the bow. But when the string slips, it snapsback suddenly, as shown in Fig. 25.4.
This stick–slip description of the bowing process is easy to understand. What ismore, it correctly describes the motion of a bowed string as seen at the bowing point.However, there is something dreadfully incomplete about it. It takes no account ofthe length of the string. But you know that the length of the string is crucial in

264 25 String Instruments
Fig. 25.5 When a string is correctly bowed, the string displacement has a sharp kink which travelsaround the path shown by dashed lines, once per cycle. A snapshot of the string is here taken attime t1 (see Fig. 25.4), just before the kink hits the bowing point. When the kink hits the bowingpoint the slipping phase will start
determining the playing frequency. A violin player shortens the string by pressing itdown on the fingerboard to make tones with higher frequency. So there is a puzzlehere to solve.
Perhaps you are now thinking about how it was with woodwind instruments—how resonant feedback from the body of a woodwind instrument entrained theopening and closing of the reed, which then fed energy into the oscillating system.That feedback was critical in determining the playing frequency of the instrument.Perhaps you are now thinking by analogy and imagining that feedback from thewell-known resonances of a stretched string, might entrain the stick–slip process. Ifthat is what you are thinking, you would be right. It is absolutely uncanny how thisgeneral physical principle keeps on appearing, in different guises, in the differentsustained-tone instruments.
If you look down on a string while it is being bowed, you will see a fuzzy patternlooking like the dashed outline in Fig. 25.5. This outline is actually the path of asharp bend, or kink, in the string, as shown by the solid line. This kink travels aroundthe path once per cycle. If the playing frequency is 440 Hz, the kink makes 440round trips per second. Figure 25.5, is a snapshot of the string taken at time t1, justbefore the kink arrives at the bowing point. An instant later, at time t2, the kink hitsthe bowing point and knocks the string free from the bow. That initiates the slippingphase, as shown in Fig. 25.4. While the string is slipping, the kink will travel to thebridge, where it will be reflected onto the bottom dashed path in Fig. 25.5. Whenthe kink hits the bowing point again, the bow will pick up the string and the stickingprocess will begin again. In that way, the modes of the string make their impact onthe stick–slip mechanism.
The stick–slip process is periodic, and the period is equal to the time it takesfor the kink to make a round trip. In one cycle the kink travels a total distance oftwice the string length (2L), and it travels with the speed of sound on the string(v). Consequently, the period is 2L=v, and the fundamental frequency is v=.2L/. Itshould not surprise you that this frequency is exactly what we found in Chap. 7 forthe fundamental frequency of a stretched string.

25.2 Bowed Strings 265
Fig. 25.6 A violin bridgewith the pitch-names of thestrings indicated
This account of the vibrations of a bowed string describes what happens whenthe string is correctly bowed and a good tone is produced. It is worth noting thatthere is no guarantee that just any application of a bow to a string will be correct orthat a good tone will be produced automatically. Getting a string to vibrate so thatthere is useful cooperation between the energy fed in from the bow and the feedbackfrom the string itself is the art of bowing a string, and every violin player learns todo that. In fact, if a string is bowed with too much bow force, the feedback processfails. Then the stick–slip process is uncontrolled, and the string produces a noisysquawk with no clear frequency.
25.2.2 The Violin Body
In a wind instrument, the air column plays a double role. It provides a resonantfeedback mechanism responsible for playing a periodic tone with a stable frequency,and it is responsible for radiating the tone, either through a bell or through toneholes. The violin is not like that. As described above, the resonant feedbackmechanism is the stretched string and does not involve the body, but a string makesa very inefficient radiator. It is so thin that it cannot move much air. What happensinstead is that the violin string causes the bridge to vibrate, and the bridge causesthe top plate of the body to vibrate in turn. The coupling of the vibration throughthe bridge is a very delicate operation. The bridge is carved in a special shape thatallows it to provide a good match between the string and the top plate. The muteon a violin, for especially soft playing, adds a little mass to the bridge and greatlyreduces the coupling efficiency for high-frequency vibrations. The fact that a smallchange in mass in the bridge dramatically reduces the transfer of high-frequencypower indicates that the function of the bridge is highly sensitive to its physicaldetails (Fig. 25.6).
The radiation from the violin comes mainly from the top plate and from thevibration of air inside the body. Holes, called “f-holes,” are cut into the top plate andallow sound waves inside the body to radiate to the outside. The resonances of theviolin body and air volume are independent of the modes of the strings, and they areof the utmost importance for the sound quality of a violin. They mark the differencebetween a poor sounding student instrument and a great sounding masterpiece.

266 25 String Instruments
It is thought that the art of violin making reached its peak, in Italy, at thetime of Niccolo Amati (1596–1684) and Antonio Stadivari (1644–1737). In thecenturies since then countless violin makers (and scientists too) have tried tomake instruments of comparable quality. It has been supposed that these Italiancraftsmen held a secret—perhaps it was a special varnish—and that one only had todiscover the secret to achieve the playing characteristics and sound of these splendidinstruments. Possibly all this is true, and yet there is more than just a little mystiqueabout these instruments. Most of the fine old Italian violins that are so prized havebeen rather thoroughly worked over in more recent times to keep them in playingcondition. One wonders how much of the original is left.
Whether or not contemporary violin makers can make violins that compare withthe old masters can be debated. What can be said for sure is that contemporarymakers know enough about the art and science of violin making to make fine playinginstruments and can do so reliably.
Vibrato A violinist does not press the string down on the fingerboard and hold itthere motionless. Instead, the violin player oscillates the hand (it’s always the lefthand) so as to make the string slightly shorter and longer with time. This leads to aplaying frequency that rises and falls periodically. The effect is well characterizedas frequency modulation (FM) of the violin tone. The parameters of this FM aredifferent for different playing styles and are subject to fashions of the times. Inrenaissance music there was no vibrato at all. Over the course of the twentiethcentury preferred vibrato rates decreased from a range of 6–8 cycles per second to arange of 5–7 cycles per second. For a contemporary violinist typical parameters are:a rate of 5.5 cycles per second, a sinusoidal modulation waveform, and an overallfrequency excursion of 1 semitone (equivalent to C3 % and �3 % of the playingfrequency).
Vibrato is said to be an “ornament” in performance. That statement is not false,but it may not do justice to the importance of vibrato in the sound of the violin. Ithas become an essential element of playing, so much so that when a violinist hasthe possibility of playing a sustained note on an open string (no finger down on thefingerboard) the violinist will choose to play the note on a different string wherevibrato can be used.
A violin tone with vibrato is lively. Its character is more interesting than aviolin tone played without vibrato. The difference may well be that vibrato leadsto an effect known as “FM-induced AM.” In this effect, the harmonics of theviolin tone rise and fall with the frequency excursions in the vibrato. For example,imagine a violin body with a strong resonance at 800 Hz. Imagine now a violin tonewith a nominal frequency of 392 Hz, but excursions that make the instantaneousfundamental frequency vary from 380 to 404 Hz. The second harmonic will varyin step with the fundamental from 760 to 808 Hz because the waveform remainsperiodic throughout the vibrato cycle. When the second harmonic is near 800 Hz itsamplitude will be boosted by the resonance, but when the second harmonic is near760 Hz its amplitude will be weaker. While this second harmonic has increased inamplitude with increasing playing frequency, there will no doubt be other harmonics

Exercises 267
Fig. 25.7 The note being played is a G with a central frequency of 392.0 Hz. One second of thesound is shown here. The vertical axis is intended to show the instantaneous frequency to be drawnin Exercise 4
of the tone that line up with different resonances of the body in such a way that theiramplitudes decrease with increasing playing frequency. Because the violin bodyhas many resonances, there are many opportunities for this effect. The dynamiccharacter of FM induced AM leads to a shimmering quality to the violin tone.
Exercises
Exercise 1, Speed of sound on a violin stringA violin string is 346 mm long, from bridge to nut. If the string is tuned to 440 Hz,
what is the speed of sound on the string?
Exercise 2, How to play the violinAn open violin string is 346 mm long and plays 440 Hz. To play higher notes the
violinist shortens the string. Each semitone step of the ascending scale correspondsto an increase of about 6 % in frequency. Thus, successive notes of the chromaticscale have frequencies of about 440, 466.2, 493.9, 523.3, 554.4, 587.3, 622.3, and659.3 Hz, as given in Appendix E. Calculate the string lengths for all of those tones.How close are these string lengths to being equally spaced on the fingerboard?
Exercise 3, The violin and the voiceThe violin sound begins with a string and is radiated by the body. The human
voice begins with vocal folds and is radiated by the vocal tract. Find the parallelsbetween the violin and the voice.
Exercise 4, VibratoOn Fig. 25.7 sketch the instantaneous frequency of a violin tone played with
vibrato that is acceptable by contemporary standards.
Exercise 5, GuitarsThe section on electric guitars says that the string vibration decays more slowly
in an electric guitar than in an acoustic guitar. Why is this so?

268 25 String Instruments
Exercise 6, Bozo’s string theoryBozo says that the stick–slip process for bowing a string predicts an effect of
adding rosin to the bow. He says that adding rosin makes the bow stickier so that thestring continues to be dragged by the bow for a longer time. That makes the periodlonger. The result is that adding rosin to the bow decreases the playing frequency.
Use what you know about the reflected kink on the string and its feedback to thebowing process to explain to Bozo why adding rosin to the string does not affect theplaying frequency.
�

Chapter 26Percussion Instruments
This chapter is about percussion instruments. The percussion family includeswell-known instruments like drums, cymbals, and bells—and also hollow logs, tincans, and truck springs. Anything that can be beaten or rattled to make a noise ispotentially a percussion instrument. Therefore, this could be a very long chapter. Tobring a little order to the zoo, this chapter starts with a definition.
Percussion Instruments Defined Percussion instruments are free vibrators. Un-like sustained tone instruments, where power is continually fed into the instrumentto keep the tone sounding, a percussion instrument gets all its energy with an initialstrike. After the initial impulse the percussion instrument vibrates in its naturalmodes of vibration. Eventually friction and loss of energy to radiation damp thesevibrations so that they can no longer be heard.
It is a fact of mechanics that no real physical system has modes of vibrationwith frequencies in a precise harmonic relationship. Therefore, a corollary of thisdefinition is that all percussive sounds are more or less inharmonic, or aperiodic.That is an absolutely firm conclusion. On the other hand, the phrase “more or less”gives a lot of latitude. Some percussive systems, such as the percussive strings ofguitars and pianos, have modes of vibration that are nearly harmonic. Such systemscan play melodies and close harmony just like sustained-tone instruments. Otherpercussion instruments make sounds that are grossly inharmonic.
Some percussion instruments, such as marimba bars and chime tubes, start witha very inharmonic system but incorporate refinements intended to emphasize theirtonal character and enable them to play melodies and even close harmony. Otherpercussion instruments, like snare drums, go the other way and incorporate featuresdesigned to make them less tonal.
To bring further order to the zoo, this chapter continues by organizing percussiveinstruments according to type of vibrator. It deals with bars, membranes and plates.
W.M. Hartmann, Principles of Musical Acoustics, Undergraduate Lecture Notesin Physics, DOI 10.1007/978-1-4614-6786-1 26,© Springer Science+Business Media New York 2013
269

270 26 Percussion Instruments
26.1 Bars, Rods, and Tubes
A bar is a length of solid metal or wood with a rectangular cross section. Rods(solid) and tubes (hollow) have circular cross sections. Musically useful vibrationsof bars, rods, and tubes have vibrations that are transverse to the length. The endsmay be free or clamped. For instance, a marimba bar has both ends free, but a clockchime rod has one end clamped.
The modes of vibration of a free bar, rod, or tube can be described by the numberof nodes. The first mode has two nodes, the second mode has three, and so on, asshown for a bar in Fig. 26.1.
The frequencies of these modes of vibration are given by the formula
f D 0:113vL t
L2.2nC 1/2; (26.1)
where vL is the speed of sound in the bar material, t is the thickness of the bar,and L is its length. The quantity n numbers the modes, and .2n C 1/ takes on thevalues 3.011, 5, 7, 9, . . . . for mode numbers 1, 2, 3, 4, . . . Thus, it is the sequenceof odd integers starting with 3, except that the first value is a little more than 3.It should be evident that the frequencies are not at all in a harmonic relationship.Exercise 1 shows that the second mode of vibration has a frequency that is 2.76times the first, i.e., f2=f1 D 2:76. The third mode has a frequency that is 5.40
Fig. 26.1 The first three modes of vibration of a uniform rectangular bar with free ends. Trianglesshow mounting points that encourage the first mode and discourage all the others by damping theirvibrations
Fig. 26.2 How a bar can be undercut to lower the frequency of the first mode
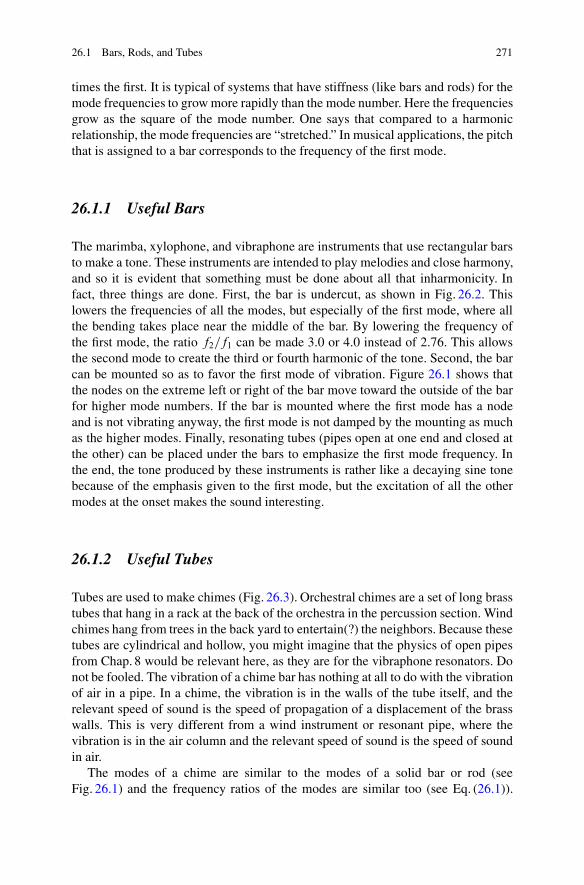
26.1 Bars, Rods, and Tubes 271
times the first. It is typical of systems that have stiffness (like bars and rods) for themode frequencies to grow more rapidly than the mode number. Here the frequenciesgrow as the square of the mode number. One says that compared to a harmonicrelationship, the mode frequencies are “stretched.” In musical applications, the pitchthat is assigned to a bar corresponds to the frequency of the first mode.
26.1.1 Useful Bars
The marimba, xylophone, and vibraphone are instruments that use rectangular barsto make a tone. These instruments are intended to play melodies and close harmony,and so it is evident that something must be done about all that inharmonicity. Infact, three things are done. First, the bar is undercut, as shown in Fig. 26.2. Thislowers the frequencies of all the modes, but especially of the first mode, where allthe bending takes place near the middle of the bar. By lowering the frequency ofthe first mode, the ratio f2=f1 can be made 3.0 or 4.0 instead of 2.76. This allowsthe second mode to create the third or fourth harmonic of the tone. Second, the barcan be mounted so as to favor the first mode of vibration. Figure 26.1 shows thatthe nodes on the extreme left or right of the bar move toward the outside of the barfor higher mode numbers. If the bar is mounted where the first mode has a nodeand is not vibrating anyway, the first mode is not damped by the mounting as muchas the higher modes. Finally, resonating tubes (pipes open at one end and closed atthe other) can be placed under the bars to emphasize the first mode frequency. Inthe end, the tone produced by these instruments is rather like a decaying sine tonebecause of the emphasis given to the first mode, but the excitation of all the othermodes at the onset makes the sound interesting.
26.1.2 Useful Tubes
Tubes are used to make chimes (Fig. 26.3). Orchestral chimes are a set of long brasstubes that hang in a rack at the back of the orchestra in the percussion section. Windchimes hang from trees in the back yard to entertain(?) the neighbors. Because thesetubes are cylindrical and hollow, you might imagine that the physics of open pipesfrom Chap. 8 would be relevant here, as they are for the vibraphone resonators. Donot be fooled. The vibration of a chime bar has nothing at all to do with the vibrationof air in a pipe. In a chime, the vibration is in the walls of the tube itself, and therelevant speed of sound is the speed of propagation of a displacement of the brasswalls. This is very different from a wind instrument or resonant pipe, where thevibration is in the air column and the relevant speed of sound is the speed of soundin air.
The modes of a chime are similar to the modes of a solid bar or rod (seeFig. 26.1) and the frequency ratios of the modes are similar too (see Eq. (26.1)).

272 26 Percussion Instruments
Fig. 26.3 (Left) A vibraphone has undercut bars and resonating tubes under the bars. Disks withinthe tubes are rotated by a motor to tune and detune the resonators. This imparts a tremolo to thesound, favored in jazz applications. Chimes, on the right, also have metal tubes but they are usedin an entirely different way
The suspension of the chime tube, and the reduced internal friction, allows higherfrequency modes to be sustained longer in the chime compared to the solid bar.
What is interesting about the chime is that its nominal frequency is not evenclose to any of the mode frequencies. Instead, the pitch of the chime comes frommodes 4, 5, and 6. According to Eq. (26.1) the frequencies are proportional to 92,112 and 132, or 81, 121, and 169. These numbers are in the ratios 2, 2.99, and 4.17.These are close enough to the ratio 2, 3, 4 that the chime creates a tone with amissing fundamental, as described in Chap. 13 on pitch perception. The frequenciesof modes 4, 5, and 6 can be brought into an even better 2, 3, 4 ratio by loading anend of the chime tube with a solid plug, and manufacturers regularly do this.
26.2 Membranes
Drum heads are membranes stretched over a hollow frame. A few examples appearin Fig. 26.4. They are always circular, or nearly. The modes of vibration of a drumhead are displacements perpendicular to the membrane surface, as a function ofposition on that surface. Therefore, the modes are two dimensional. That makesthem different from the modes that have been considered for a stretched string, orfor air in a pipe, or for a solid bar, all of which are one dimensional. For a one-dimensional systems there is a mode number, always giving some indication of thenumber of nodes in the standing wave pattern. For instance, index n describes thenumber of nodes in Fig. 26.1. To describe a mode in two dimensions requires twomode numbers.
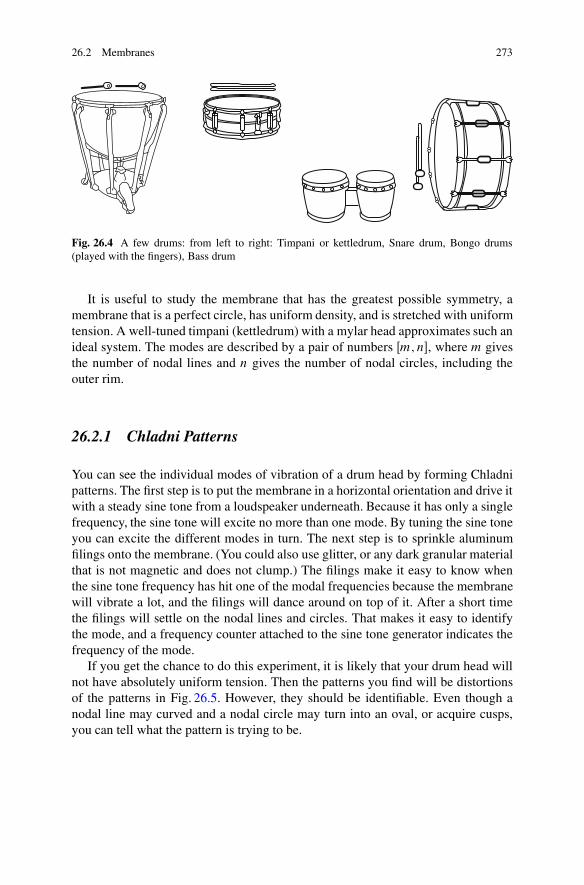
26.2 Membranes 273
Fig. 26.4 A few drums: from left to right: Timpani or kettledrum, Snare drum, Bongo drums(played with the fingers), Bass drum
It is useful to study the membrane that has the greatest possible symmetry, amembrane that is a perfect circle, has uniform density, and is stretched with uniformtension. A well-tuned timpani (kettledrum) with a mylar head approximates such anideal system. The modes are described by a pair of numbers Œm; n�, where m givesthe number of nodal lines and n gives the number of nodal circles, including theouter rim.
26.2.1 Chladni Patterns
You can see the individual modes of vibration of a drum head by forming Chladnipatterns. The first step is to put the membrane in a horizontal orientation and drive itwith a steady sine tone from a loudspeaker underneath. Because it has only a singlefrequency, the sine tone will excite no more than one mode. By tuning the sine toneyou can excite the different modes in turn. The next step is to sprinkle aluminumfilings onto the membrane. (You could also use glitter, or any dark granular materialthat is not magnetic and does not clump.) The filings make it easy to know whenthe sine tone frequency has hit one of the modal frequencies because the membranewill vibrate a lot, and the filings will dance around on top of it. After a short timethe filings will settle on the nodal lines and circles. That makes it easy to identifythe mode, and a frequency counter attached to the sine tone generator indicates thefrequency of the mode.
If you get the chance to do this experiment, it is likely that your drum head willnot have absolutely uniform tension. Then the patterns you find will be distortionsof the patterns in Fig. 26.5. However, they should be identifiable. Even though anodal line may curved and a nodal circle may turn into an oval, or acquire cusps,you can tell what the pattern is trying to be.

274 26 Percussion Instruments
Fig. 26.5 The modes of a uniformly stretched circular membrane are given by two numbersindicating the number of nodal lines and the number of nodal circles. Numbers below the modedrawings show mode frequencies relative to the frequency of the lowest mode, called “[0,1].” Othermodes shown are, in order, [1,1], [2,1], [0,2], [1,2], [0,3]
26.2.2 Timpani
Timpani are the most important drums in the orchestra. They are tuned. Althoughthey do not normally play melodies, they are used to reinforce selected notes playedby the rest of the orchestra, and it is important that the tuning be right. Here we haveanother case where a tuned percussive sound is needed and yet the basic vibrator, inthis case the stretched membrane, has modal frequencies (as given by the ratios inFig. 26.5) that do not look promising. The solution to this problem for the timpani isto add the kettle below the membrane. The kettle is filled with ordinary air, and thisvolume of air loads the membrane and reduces all the modal frequencies. However,some modes have their frequencies more reduced than others and that’s the key.
The air loading changes the frequency of the [2,1] mode so that the ratio f21=f11changes from 1.34 to 1.51, and it changes the frequency of the [3,1] mode so thatthe ratio f31=f11 changes from 1.67 to 1.99. The ratios 1.51 and 1.99 are close to 1.5and 2.0, which are related to the fundamental pitch f11 by the interval of a musicalfifth and an octave. In this way the kettle of air makes the timpani sound more tonal.

26.3 Plates: Cymbals, Gongs, and Bells 275
a bFig. 26.6 Cymbals (a) andgongs (b) begin with a freecircular plate, but are formedwith a dome in the center
26.3 Plates: Cymbals, Gongs, and Bells
The vibrational modes of a flat, uniform, circular plate are like the modes of acircular membrane in that they can be defined by nodal lines and nodal circles.The same notation, [m,n], can be used. There is a useful analogy that can be drawnbetween these two-dimensional systems and one-dimensional systems, namely thata plate is to a stretched membrane as a bar is to a stretched string. While themembrane and string have fixed boundaries, the plate and bar (as in cymbal andxylophone) have free boundaries. While the membrane and string get most of theirrestoring force from the applied tension, the plate and the bar get their restoringforce from stiffness. Stiff vibrators have modes with frequencies that are widelyseparated. This is true of both bars and plates. For comparison, note that the lowestsix modal frequencies for a membrane, given in Fig. 26.5, have ratios 1, 1.59, 2.14,2.30, 2.65, and 2.92. The lowest six modal frequencies for a circular plate with afree boundary have ratios 1, 1.73, 2.33, 3.91, 4.11, and 6.30 (Fig. 26.6).
The circular plate with a free boundary is a reasonable starting model for acymbal or gong, but both instruments differ in important ways from this prototype.Both cymbal and gong have a raised dome in the center which means that themodes of vibration higher than [0,6] or [2,1] are not like those of a plate but arelike combinations of different plate modes. The gong has a curved rim that canbe expected to change the free boundary condition. The instrument known as a“tamtam” is a large gong without the dome.
26.3.1 Nonlinear Mode Coupling
The description of the vibration of cymbals, gongs, and tamtams in terms of theirnatural modes of vibration is a linear analysis and does not really do justiceto the complicated character of either the vibration or the sound made by theseinstruments. The modes are coupled in ways that depend on how hard the plate isstruck. For a large gong or tamtam, the vibration pattern develops slowly with time

276 26 Percussion Instruments
Fig. 26.7 The modes of vibration of a bell have been given names. Their nodal meridians andnodal circles are shown by dashed lines. Their frequencies are given relative to the prime frequencywhich corresponds to the nominal pitch of the bell. This figure was borrowed from The Science ofSound by Thomas D. Rossing, Addison Wesley, 1990
as the plate is repeatedly struck. Beating softly on a tamtam with a soft beater leadsto a low-frequency rumble. Continued and more intense beating appears to cause atransfer of energy from low-frequency modes into high-frequency modes producinga loud shimmering sound. Psychologically, the effect is dramatic. Intellectually, thescientist also finds this unexpected mode coupling to be dramatic because it is notreadily understandable. Whoever figures out how this effect works is going to makescientific history—big time.
26.3.2 Bells
Many civilizations, in the east and in the west, have used bells throughout history.The church bell, or carillon bell, that we know in the west was developed in the lowcountries of Europe in the seventeenth century.

Exercises 277
Figure 26.7 shows that the modes of vibration have nodal meridians and nodalcircles that recall the nodal lines and nodal circles of a circular plate. From left toright, the top line of the figure shows modes [2,0], [2,1], [3,1], and [3,1a]. What isdifferent about the bell is that the thickness of the walls is not uniform. Instead, thethickness is caused to vary so that the modes are tuned, with relative frequenciescorresponding to notes of the scale, such as the minor third and fifth. Of course,when the bell is struck, all the modes are excited at once and a listener does not hearthe individual notes of the scale. The pitch of the bell, or fundamental, is establishedby the modes with frequencies 2.0, 3.0, and 4.0 times the fundamental. The primetone acts to reinforce this pitch, and the “hum tone” is consonant, an octave lower.But the modes of the bell decay at different rates, and eventually a listener can hearseveral different notes of the scale. That ambiguity is part of the charm of the bellsound.
Exercises
Exercise 1, Modes of a uniform barUse Eq. (26.1) to find the frequencies of the first four modes of vibration of a
uniform bar. Express these frequencies as multiples of the frequency of the firstmode. In other words, find f2=f1, f3=f1, and f4=f1.
Exercise 2, The chime toneIt is said that the modes of a chime tube are proportional to 92, 112 and 132,
which are in the ratio of 2, 2.99, and 4.17. Show that this is true.
Exercise 3, Drums with two headsBass drums and snare drums often have two heads. One is beaten and the other
is forced to vibrate by the compression of air inside the drum. The two heads arenormally stretched to different tensions. Do you think that the addition of the secondhead makes the drum more tonal or less tonal?
Exercise 4, Plates you have knownSome dinner plates are made of china, others are made of paper. They sound very
different when struck. What is responsible for the difference?
Exercise 5, Bell mode notationWhat are the values of Œm; n� for the bottom row of Fig. 26.7?
Exercise 6, Bell modesOn opposite sides of a nodal line the vibration is in opposite directions. For
instance the nodal meridians in Fig. 26.7 divide the bell into segments. When onesegment moves outward, the adjacent segment moves inward. Show how this appliesto the circles in Fig. 26.7 that indicate the nodes on the rim of the bell. Use solid anddashed lines—as usual for standing waves—to indicate vibrations as separated intime by half a period.
�
Chapter 27Electronic Music
In the broadest terms, the title “Electronic Music” could mean many different things.It could refer to electronic recording of music or to electrified musical instrumentslike the electric guitar. It could include computer-aided music composition orelectronic production of a hard copy of a score. As commonly understood, however,electronic music refers to the electronic synthesis of performed music.
The idea of electronic music stems naturally from the idea of recorded music,either analog or digital. Imagine that you have in your hands a tape recording of amusical performance. You know that the music is entirely captured in the sequenceof magnetization stretched out along the tape. It might then occur to you that if therewere some way to duplicate that sequence of magnetization, starting from scratch,the original musical performance would not be necessary. Alternatively, imaginethat you are holding a compact disc. You know that the music is entirely representedby a long string of ones and zeros on the disc. If you had a computer program thatcould create the same sequence of ones and zeros, you would have the music, eventhough it might never have previously existed in any acoustical form. These are theideas of electronic music—analog and digital.
27.1 Analog Synthesizers
As you know, the first step in recording music is to use a microphone to convertan acoustical signal into an electrical signal. The electrical signal can be perfectlyrepresented by a graph showing the electrical voltage as a function of time. Thevariations of voltage with time are analogous to the original variations of pressurewith time. Because of this analogous relationship, the electrical signal has evidentmusical value. The goal of the analog synthesizer is to create an electrical signalwith musical value without having to record it. Instead, the musician creates theelectrical signal from a collection of electronic signal generating and processingcircuits.
W.M. Hartmann, Principles of Musical Acoustics, Undergraduate Lecture Notesin Physics, DOI 10.1007/978-1-4614-6786-1 27,© Springer Science+Business Media New York 2013
279

280 27 Electronic Music
Fig. 27.1 An attempt to synthesize a violin tone using an analog patch of a function generatormaking a sawtooth wave and a filter with resonances
Fig. 27.2 Two tones can be added in a mixer (indicated by † to simulate a duet of instruments.The mixer adds the two voltages—more or less depending on the settings of the volume controls,shown by circular knobs
Chapter 4 on instrumentation introduced the function generator. The functiongenerator creates a periodic electrical signal with a frequency that can be controlledby a knob on the front panel. For instance, the function generator can create asawtooth wave. In fact, the sawtooth wave would not seem to be so very differentfrom the wave of a violin sound. (See Fig. 25.4.) Both waves are periodic and bothhave a complete set of strong harmonics. If you put the fundamental frequency inthe right range, perhaps you could use the sawtooth waveform to simulate a violin.However, you will recall that the body of the violin has resonances that emphasizeharmonics having particular frequencies. This effect contributes in an importantway to the violin sound. Unfortunately for our electronic musical experiment, thesawtooth wave does not have such emphasized harmonics. But there is no needto be discouraged, because it is possible to filter the sawtooth waveform with anelectronic filter having resonances. Then the electronic filter changes the spectrumof the sawtooth to simulate the way that the violin body filters the spectrum ofvibrations from the bridge. Thus, a first attempt at synthesizing a violin looks likethe patch in Fig. 27.1. A patch is just a pattern of connections among modules.
The flexibility of analog electronics becomes evident if you want to generatethe sound of two violins playing together. You only need to get another functiongenerator and another filter and add the signals in a mixer. The mixer will add thetwo tones in a linear way, just like the air adds the tones from two violins. To controlthe levels of the two synthesized tones, there are volume (gain) controls on the inputsto the mixer.
Figure 27.2 shows two signals being added, but there is no real limit to thenumber of signals that could be added together. The mixer might have a dozeninputs, allowing you to simulate a violin chorus if you had enough functiongenerators and filters.
At this point, however, your violin synthesis patch is not yet a satisfactory instru-ment. A real violin has a precise and flexible way of controlling the fundamental

27.1 Analog Synthesizers 281
Fig. 27.3 The frequency of a voltage-controlled function generator (VCFG) depends on thecontrol voltage inserted into the control port
Keyboard
LF FG
VC FG
∑
Fig. 27.4 The frequency ofthe function generator(VCFG) is controlled both bythe keyboard and by thelow-frequency functiongenerator (LFFG)
frequency of the tone. Precise control of the frequency is needed for melody, andthe flexibility of the pitch is an essential part of artistic expression in violin playing.Your patch has none of that. It only has the knob on the front of the functiongenerator to control the frequency. When you think about frequency control, youdiscover that you have real problems.
Because you are making a synthesizer, you would like to control the frequencywith a keyboard. But you recall from Chap. 25 that the violin is played with vibrato,and therefore, the frequency control will need to incorporate the slow frequencymodulation (FM). Evidently you need both kinds of control at once. To solve thisproblem you need to completely redesign the function generator. You need to makeit voltage controlled. A voltage-controlled function generator (musicians often callit a voltage-controlled oscillator, or VCO) has a fundamental frequency that dependson a voltage that is put into a control port. If the voltage into the control port is low,the frequency is low. If the control voltage is high, the frequency is high (Fig. 27.3).
The voltage-controlled function generator allows a great deal of flexibility inpitch control because control voltages can be summed in a mixer, just as signalvoltages were summed. Figure 27.4 shows how the frequency of the VCFG can becontrolled in parallel by a keyboard (to play different notes) and by a low-frequencysine wave from another function generator (for vibrato). Voltages from the keyboardand from the low-frequency sine-wave function generator (LFFG) are summed tomake a control voltage.
So far, so good. We can synthesize the tone of a violin (or two violins). Wecan control the frequency of the tone with a keyboard and give that tone realisticvibrato. There is a problem though—we cannot turn the tone on and off! As our

282 27 Electronic Music
Fig. 27.5 The voltage-controlled amplifier (VCA) multiplies the input voltage by the controlvoltage (Vc) to produce an output voltage. Here, an input signal that is indefinitely long is turnedon and off, and its amplitude is given a realistic shape by the envelope voltage (Vc) that is insertedinto the control port for the VCA
patch of modules stands now, the tone is always on. We cannot just turn the tone onand off with a switch because such an abrupt onset and decay would not resemblethe attack and decay of a violin tone. At this point we need a voltage-controlledamplifier (VCA) and a device called an envelope generator, as shown in Fig. 27.5.
The VCA has a signal input voltage, a signal output voltage, and a control inputvoltage. The signal output is the product of the signal input and the control input.Therefore, if the control input is 0 V, the output is zero. Now we can turn the toneoff. If the control input rises in a gradual way and then dies away slowly, the outputsignal has a gradual attack and then fades out slowly. It is the role of the envelopegenerator to produce a slowly moving voltage that leads to a realistic attack anddecay. The envelope begins its attack when the musician presses one of the keys ofthe keyboard.
Voltage control was a powerful idea in the early days of electronic musicsynthesizers because voltages can be easily and cheaply manipulated. They canbe switched on and off, amplified, attenuated, inverted, summed, or distorted.A series of control voltages can be automated to produce a sequence of musicalcontrol gestures. Therefore, many different signal processing parameters were givenvoltage control. Most important were the voltage-controlled function generator(oscillator), the VCA, and voltage-controlled filter (where the cutoff frequency orpassband frequency was determined by a control voltage). The voltage-controlledmodules could be chained indefinitely. The vibrato example shown above was ashort illustration of that.
The voltage-controlled analog synthesizer is no longer a mainstream instrument.It is awkward to use and expensive because it has a lot of front-panel hardware.Nevertheless, it is an important instrument because the functions of its voltage-controlled modules provided a common language and a useful framework forthinking about musical signal synthesis. These ideas are now implemented in digitalsynthesizers.

27.2 Digital Synthesizers 283
27.2 Digital Synthesizers
In a modern instrument, the modular functions are accomplished digitally. Signals,as such, do not exist in the digital synthesizer. Instead, signals are computed, andthey remain in the form of digital numbers until finally converted to a voltage by adigital to analog converter. For example, while an analog synthesizer would add twovoltages in a summer (perhaps two violin tones), the digital synthesizer adds twolong sequences of numbers. Each sequence represents an instrument; each numberrepresents an instantaneous value of the waveform produced by the instrument.
From the outset, digital methods are clearly promising. First, digital methods arefast. If there is a computational engine capable of millions of operations per second,then many operations can be done to generate each successive data point in theoutput. Second, digital methods can make use of computer memory. Memory canstore both musical waveforms and control data, such as the times for turning noteson and off and the dynamics of a performance.
Speed and memory make a big difference. While an analog synthesizer is limitedto one or two simultaneous voices, the speed of a digital synthesizer allows it to betruly polyphonic. The instrument can produce as many simultaneous notes as themusician can play on the keyboard. While an analog function generator is limitedto a few simple waveforms, a digital memory can store waveforms digitally—perhaps recorded from real musical instruments. Pre-recorded real instrumentsounds become useful when other synthesis techniques fail. For example, it isdifficult to synthesize a convincing piano sound by any other means.
Because the digital synthesizer keeps all the music in memory before convertingit to an analog voltage, it is automatically capable of performing signal processingtechniques that add together multiple versions of the same signal with variousdelays. An application that immediately comes to mind is artificial reverberation.Without reverberation, synthesized music is weak. Artificial reverberation of somekind is always needed, and digital methods are ideal for this task. There are otherapplications of delay-and-add processing that came out of rock and roll studios. Oneis the technique called “chorusing” that thickens a musical voice by adding clones.Another is a technique called “flanging” that varies the amount of delay to producea sonic effect described as “spacy.”
The digital synthesizers that appear on stage at concerts are real-time perfor-mance instruments with a keyboard that can be played like a piano. The user canselect from a few hundred different waveforms representing musical instrumentsor sound effects. Such sound “samples” are stored in waveform memory. Somesynthesizers permit the user to record sounds into sample memory, to be played backlater with different pitches. But the digital synthesizer is more than just a reproducerof sampled sounds. The recorded waveform samples can be processed as they areplayed back. Vibrato, filtering, spatial effects, and diverse forms of modulation canbe added.
A digital synthesizer also includes a sequencer, which is a memory for musicalgesture data. Such data can tell the signal generators to play the right notes at the

284 27 Electronic Music
right times with appropriate expression—level, level variation, vibrato, and pitchbend. The sequencer can store away enough gestural and performance data thatit can play all the different parts of an entire piece of music by itself, once itis programmed to do so. Including the human musician in a live performance isstill regarded as a nice touch, however. What is often done as a compromise isto preprogram rapid sequences of notes—arpeggios or riffs—so that pressing aparticular key on the keyboard unleashes the entire sequence.
27.3 Musical Instrument Device Interface
The musical instrument device interface, or MIDI, is a data protocol that allowsdifferent electronic music instruments to communicate with one another. At aconcert you will see a musician playing a keyboard instrument. It does not follow,however, that the instrument that he is playing is the instrument that is making thesounds! Quite possibly, the keyboard synthesizer is just being used as a controldevice to send gestural data to another synthesizer to make the sounds. The othersynthesizer might be a box of electronics in a rack somewhere, or it might be avirtual synthesizer, which is a computer program running on a general purposepersonal computer with a sound card.
The ability to send musical performance data around a stage or around a studio ismade possible by the MIDI. Each musical device in the loop has a channel address,and data intended for that instrument are preceded with that channel number.Therefore, the MIDI connection requires only a single wire, running daisy-chainfashion among all the synthesizers or control devices. The intention of the MIDIprotocol is to transfer all musically relevant information. There are set-up commandsthat tell a synthesizer to play a particular voice, such as a tom-tom or clarinet. Thereare performance data that turn notes on and off, and there are expressive data fromkeyboard pressure or pitch-bend wheels or foot pedals.
Because MIDI data are only control data, and not actual waveforms, MIDI datado not require a tremendous amount of memory and can be transmitted rapidly.MIDI data can be displayed on a computer monitor screen and can be edited toimprove the performance. If you play a great riff except for one mistake, it is easyto correct the mistake with a computer editor and keep everything else.
The MIDI standard is an open standard, which means that any engineer canproduce a musical instrument that reads and writes MIDI code. An importantconsequence is that different controllers can be created—replacing or augmentingthe keyboard. Control technologies that resemble traditional musical instrumentsmake it possible for many musicians to synthesize music digitally. It is evenpossible to synthesize sound based on a performer’s brain waves, as measured byan electroencephalographic monitor, though the degree of control may not appeal tothe performer or any other listener.
Exercises 285
Science, Technology, Music, and Musicians
Electronic music is, in a sense, an ultimate in the application of technologyto music. In one way or another it makes use of all the science to be foundin this book. Making music electronically, either analog or digital, leads to anunprecedented opportunity for analysis and control of musical parameters.
In the early days of electronic music, people were impressed by the noveltyof the sounds, and there was great interest in “what the electronic musicsynthesizer could do.”
A perspective on this matter was given by Dr. Robert A. Moog (1934-2005), one of the pioneers of analog music synthesis. Bob Moog emphasizedthat at every period in history making music has involved the technology ofthe time. Ultimately, music was not made by the technology, it was made bymusicians.
In October of 1974, Moog gave a talk at a meeting of the AmericanPhysical Society in Buffalo, New York. As he always did in his talks, heillustrated his points by playing compositions made on one of the synthesizersmanufactured by his company. As I recall, he played a portion of Snowflakesare Dancing by Isao Tomita. At the conclusion, an enthusiastic member ofthe audience yelled out, “Oscillator, Oscillator!”
Without hesitation, Moog replied, “The next time I hear a violin concertoI am going to yell out, ‘Cat, Cat!’” His point was that the electroniccomposition was no more played by the electronics than the violin concertowas played by catgut.
In the end, whatever the science or the technology, music is made bymusicians. Musicians can take a couple of sticks and a rusty bucket, and usethis “technology” to make music. The rational approach to musical soundadopted in Principles of Musical Acoustics is valuable intellectually. It mayeven help a musician better understand the principles of the craft. However,music surpasses the intellectual; it speaks to us on a deep and personal level.That is its real value.
Exercises
Exercise 1, Design this patchThe output of a voltage-controlled amplifier module (VCA) is given in terms of
the input to the module by the following formula,
vout D vin � .vc=5/ .vc � 0/ (1)

286 27 Electronic Music
vout D 0 .vc < 0/ (2)
where vc is the control voltage in volts. Thus when the control voltage is zero, thereis no output. When the control voltage is 5 V, the output is equal to the input.
Draw a patch including two function generators and a VCA to generate anamplitude-modulated signal, as described in Chap. 21.
Exercise 2, Digital speedImagine a digital synthesizer that performs 100,000,000 operations per second.
It generates a signal at a sample rate of 44,100 samples per second, the samplerate of the compact disc. Show that this synthesizer can perform more than 2,200operations for every output sample.
Exercise 3, EmulationAs a relatively new art form, electronic music is still trying to decide what
it wants to be. Recently designers have worked hard to synthesize the sounds oftraditional acoustical instruments. Others say that this is a mistake. They think thatthe role of electronic music should be to create new sounds. What do you think?
Exercise 4, WheelsMany synthesizers have two controllers shaped like wheels to be controlled with
the musician’s left hand. (a) One of them controls the depth of the vibrato. (b)The other is able to bend the pitch of a note. Why would one go to the troubleof providing such elaborate frequency control?
Exercise 5, Computer applicationIs a general purpose computer, like a PC, more naturally a sequencer or a
synthesizer?
�

Appendix A: Composers
Renaissance
Giovanni da Palestrina 1525(?)–1594Josquin des Pres c 1450–1521Thomas Tallis 1505–1585Michael Praetorius 1571–1621Claudio Monteverdi 1567–1643
Baroque
Dietrich Buxtehude 1637–1707Johann Pachelbel 1653–1706Arcangelo Corelli 1653–1713Henry Purcell 1659–1695Antonio Vivaldi 1678–1741Georg Philipp Telemann 1681–1767Jean-Philipe Rameau 1683–1764Johann Sebastian Bach 1685–1750Georg Frederick Handel 1685–1759Giovani Pergolesi 1710–1736Christoph W. Gluck 1714–1787
Rococo
Francois Couperin 1668–1733Domenico Scarlatti 1685–1757
Wilhelm Friedman Bach 1710–1784Carl Phillip Emanuel Bach 1714–1788PDQ Bach 1807–1742 (?)
Classic
Josef Haydn 1732–1809Johann Christian Bach 1735–1782Luigim Boccherini 1743–1805Muzio Clementi 1752–1832Wolfgang Amadeus Mozart 1756–1791Antonio Salieri 1750–1825
Romantic
Ludwig van Beethoven 1770–1827Gioacchino Rossini 1792–1868Franz Schubert 1797–1828Hector Berlioz 1803–1869Felix Mendelssohn 1809–1847Robert Schumann 1810–1856Richard Wagner 1813–1883Johannes Brahms 1833–1897Cesar Franck 1822–1890Anton Bruckner 1824–1896Camille Saint-Saens 1835–1921Pablo de Sarasate 1884–1908
W.M. Hartmann, Principles of Musical Acoustics, Undergraduate Lecture Notesin Physics, DOI 10.1007/978-1-4614-6786-1,© Springer Science+Business Media New York 2013
287

288 Appendix A: Composers
Virtuoso
Niccolo Paganini 1782–1840Frederic Chopin 1810–1849Franz Liszt 1811–1886
Russian Movement
Alexander Borodin 1834–1887Modest Musorgsky 1839–1881Petr I. Tchaikovsky 1840–1893Nicholai Rimsky-Korsakov 1844–1908Alexander Scriabin 1872–1915Serge Prokofiev 1891–1952
Nationalist
Bedrich Smetana 1824–1884Antonin Dvorak 1841–1904Edvard Grieg 1843–1907Carl Nielsen 1865–1931Jean Sibelius 1865–1957
Impressionists
Claude Debussy 1862–1918Fredrick Delius 1862–1934Eric Satie 1866–1925Maurice Ravel 1875–1937Ottorino Respighi 1879–1936Charles T. Griffes 1845–1920
Post Romantics
Edward Elgar 1857–1934Gustav Mahler 1860–1911Richard Strauss 1864–1949
Ralph Vaughn Williams 1872–1958Sergei V. Rachmaninoff 1873–1943Gustav Holst 1874–1934
Expressionists–Serialists
Arnold Schoenberg 1874–1951Anton von Webern 1883–1945Alban Berg 1885–1935
Neo Classic
Charles Ives 1874–1954Manuel de Falla 1876–1946Darius Milhaud 1892–1974Walter Piston 1894–1976Carl Orff 1895–1982Howard Hansen 1896Roger Sessions 1896–1985Francis Poulenc 1899–1963Joaquin Rodrigo 1902–1999Aaron Copland 1906–1990Dmitri Shostakovich 1906–1975Samuel Barber 1910–1981William Schuman 1910–1992Benjamin Britten 1913–1976
Modern
Bela Bartok 1881–1945Igor Stravinsky 1882–1971Edgar Varese 1885–1965Paul Hindemith 1895–1963Harry Partch 1901–1974Olivier Messiaen 1908–1992John Cage 1912–1992Pierre Boulez 1925–Luciano Berio 1925–2003Karlheinz Stockhausen 1928–2007
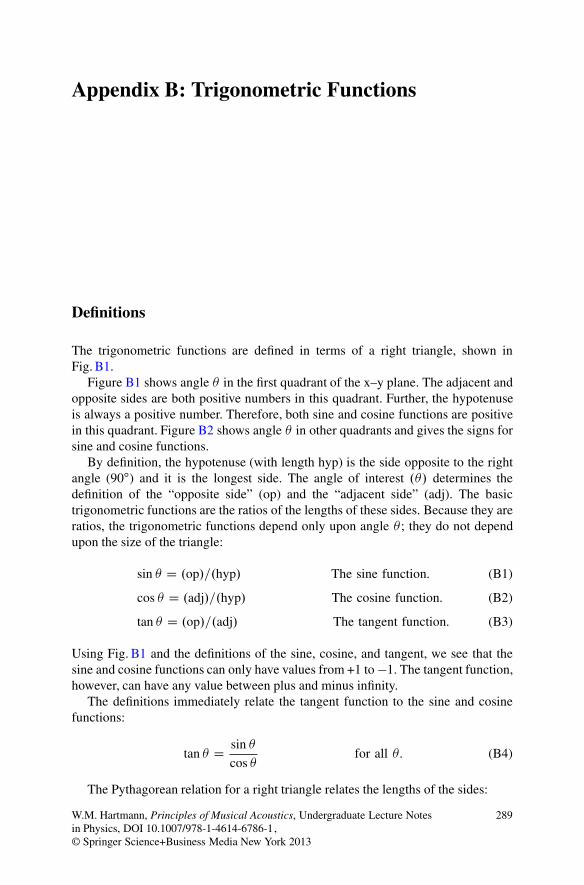
Appendix B: Trigonometric Functions
Definitions
The trigonometric functions are defined in terms of a right triangle, shown inFig. B1.
Figure B1 shows angle � in the first quadrant of the x–y plane. The adjacent andopposite sides are both positive numbers in this quadrant. Further, the hypotenuseis always a positive number. Therefore, both sine and cosine functions are positivein this quadrant. Figure B2 shows angle � in other quadrants and gives the signs forsine and cosine functions.
By definition, the hypotenuse (with length hyp) is the side opposite to the rightangle (90ı) and it is the longest side. The angle of interest .�/ determines thedefinition of the “opposite side” (op) and the “adjacent side” (adj). The basictrigonometric functions are the ratios of the lengths of these sides. Because they areratios, the trigonometric functions depend only upon angle � ; they do not dependupon the size of the triangle:
sin � D .op/=.hyp/ The sine function: (B1)
cos � D .adj/=.hyp/ The cosine function: (B2)
tan � D .op/=.adj/ The tangent function: (B3)
Using Fig. B1 and the definitions of the sine, cosine, and tangent, we see that thesine and cosine functions can only have values from +1 to �1. The tangent function,however, can have any value between plus and minus infinity.
The definitions immediately relate the tangent function to the sine and cosinefunctions:
tan � D sin �
cos �for all �: (B4)
The Pythagorean relation for a right triangle relates the lengths of the sides:
W.M. Hartmann, Principles of Musical Acoustics, Undergraduate Lecture Notesin Physics, DOI 10.1007/978-1-4614-6786-1,© Springer Science+Business Media New York 2013
289

290 Appendix B: Trigonometric Functions
Fig. B1 An angle in the firstquadrant. The opposite sideand the adjacent side are bothpositive
Fig. B2 Angles in the otherthree quadrants
adj2 C op2 D hyp2
or
cos2 � C sin2 � D 1: (B5a)
�

Appendix C: Traditional Musical Instruments
This appendix indicates the fundamental frequencies in units of Hertz (Hz) ofsignificant notes on some important instruments of the orchestra.
For most instruments the bottom note (lowest frequency) is rather firmly fixed bythe construction of the instrument, though non-traditional playing techniques mayproduce lower frequencies. The top notes are much less well defined. For instance,the top note on the trumpet is given as 1,244 Hz, but some jazz players can hit the“double high C” at B[6 D 1; 863Hz. Normally the top notes given below are thosethat a musician may expect to see written in musical scores.
It is important to remember that the entries below only correspond to thefundamental frequencies of instruments. Each of the tones has harmonics that leadto energy at much higher frequencies. For instance, the bottom note of the trumpetis listed as 165 Hz, but there is lots of energy in the 10th harmonic of this note, andthat frequency is 1,650 Hz (higher than the fundamental frequency of the top note).
All frequencies have been rounded off to the nearest Hz. Careful tuning tries tobe more precise than this.
Strings
There are four or six strings. Their note names are given first in order of ascendingfrequency. Then the corresponding fundamental frequencies are given.
Violin: G3, D4, A4, E5, 196, 294, 440, 659, top at E7 = 2637Viola: C3, G3, D4, A4, 131, 196, 294, 440, top at A6 = 1760Cello: C2, G2, D3, A3, 65, 98, 147, 220, top at E5 = 659Bass: E1, A1, D2, G2, 41, 55, 73, 98, top at D4 = 587Guitar: E2, A2, D3, G3, B3, E4, 82, 110, 147, 196, 247, 330,top at B5 = 938
W.M. Hartmann, Principles of Musical Acoustics, Undergraduate Lecture Notesin Physics, DOI 10.1007/978-1-4614-6786-1,© Springer Science+Business Media New York 2013
291

292 Appendix C: Traditional Musical Instruments
Woodwinds
Flute: bottom at C4 = 262, top at D7 = 2349Piccolo: bottom at C5 = 523, top at C8 = 4186Clarinet�: bottom at D3 = 147, top at B[6 = 1865Alto Saxophone�: bottom at D[3 = 139, top at A[5 = 831Tenor Saxophone�: bottom at A[2 = 104, top at E[5 = 622Oboe: bottom at B[3 = 233, top at G6 = 1568Bassoon: bottom at B[1 = 58, top at E[5 = 622
Brass
Trumpet�: bottom at E3 = 165, top at E[6 = 1244Trombone�: bottom at E2 = 82, top at D5 = 587Tuba�: bottom at E[1 = 39, top at B[3 = 233French horn�: bottom at B1 = 62, top at F5 = 698
Other
Tenor voice: top (not falsetto) at approximately C5 = 523Harp: bottom at B0 = 31, top at A7 = 3520Piano: bottom at A0 = 28, top at C8 = 4186Organ: bottom at C0 = 16, top at C9 = 8372
�This table gives frequencies and note names that are, so-called, “concert” notes,established by the notes on the piano or the notes recognized by a violin player.An instrument marked with an asterisk is a “transposing” instrument, meaning thatthe note name recognized by the player is different from the “concert” note name.For instance, the trumpet is a B[ instrument. Therefore, when the trumpet playerplays what he reads on the score as “middle C,” and what he calls “middle C,” thefundamental frequency of the note that sounds is not C -262 Hz. Instead it is B[-233 Hz. The note B[ is a whole step lower than C . The transposition is consistentin that the notes written for a trumpet always sound a whole step lower than concertpitch.
�

Appendix D: Keyboard Tuning
Keyboard instruments like pianos, organs, and synthesizers give a musician theopportunity to play many notes at once. In exchange for this benefit, the keyboardplayer sacrifices control of intonation—fine control of the frequency during playing.The piano player cannot bend notes up or down like the player of wind instrumentsor string instruments. The individual notes of a keyboard instrument must be tunedbefore the instrument is played.
Figure D1 shows a standard keyboard with notes named C , C], D, etc. It alsoshows musical intervals, unison, minor second, Major second, etc., using C as areference. The figure shows a little more than an octave. You will note that thepattern of the keys is the same for each octave. An octave corresponds to a factor oftwo—always, whatever the tuning. For instance, if the note called C on the far lefthas a frequency of 261.6 Hz then the note called C to the right (the “Octave”) has afrequency of 261:2 � 2 D 522:4Hz.
Table D1 shows frequency ratios corresponding to those intervals for threedifferent tunings. The table gives the frequency ratios for musical intervals withinthe octave in three tunings, Just, Pythagorean, and Equal Tempered, per ANSIstandard S1.1-1994. There are 12 intervals besides the unison.
Just Tuning The tuning called “Just” chooses the frequency ratios to be the ratiosof small integers like 5/4 for the interval called the “Major third.” For instance, ifwe tune a keyboard in the key of C and make the frequency of middle C equal to261.6 Hz, then the frequency of the note calledE (Major third) will be 261:6�5=4 D327:0Hz. The Just tuning leads to very smooth sounding chords.
Pythagorean Tuning The tuning called “Pythagorean” is obtained by using theratios 3/2 and 4/3 systematically. For example the weird ratio 1024/729 is equal to4/3 raised to the sixth power .4=3/6 D 4096=729, which is then brought into thefirst octave by twice dividing by 2 (i.e., by 4). For instance, if we tune a keyboardin the key of C and make the frequency of middle C equal to 261.6 Hz, then thefrequency of the note called E (Major third) will be 261:6 � 81=64 D 331:1Hz.
W.M. Hartmann, Principles of Musical Acoustics, Undergraduate Lecture Notesin Physics, DOI 10.1007/978-1-4614-6786-1,© Springer Science+Business Media New York 2013
293

294 Appendix D: Keyboard Tuning
Fig. D1 A section of the piano keyboard with note names and interval names. The assignment ofinterval names assumes that the low C is the reference
The Pythagorean tuning was the starting point for many different tunings of thebaroque era known as meantone tunings.
Equal Temperament The tuning called “Equal temperament” chooses the fre-quency ratios to be powers of 21=12, the ratio of the semitone. Therefore, any twoadjacent notes on the keyboard have a frequency ratio of 21=12, regardless of the key.For instance, whatever key the music may be, if we make the frequency of middleC equal to 261.6 Hz, then the frequency of the note called E (Major third) will be261:6�24=12 D 329:6Hz. Equal temperament is used almost universally in our ownday. It has all but replaced the other tunings.

Appendix D: Keyboard Tuning 295
Table D1 Notes of the scale in three temperaments
Interval Just tuning Pythagorean tuning Equal temperament
Unison 1. 1. 20 D 1:
minor Second 16/15 = 1.067 256/243 = 1.053 21=12 = 1.059Major Second 10/9 = 1.111 9/8 = 1.125 22=12 = 1.122
or 9/8 = 1.125minor Third 6/5 = 1.200 32/27 = 1.185 23=12 = 1.189Major Third 5/4 = 1.250 81/64 = 1.266 24=12 = 1.260Fourth 4/3 = 1.333 4/3 = 1.333 25=12 = 1.335Tritone 45/32 = 1.406 1024/729 = 1.405 26=12 = 1.414
or 64/45 = 1.422 or 729/512 = 1.424Fifth 3/2 = 1.500 3/2 = 1.500 27=12 = 1.498minor Sixth 8/5 = 1.600 128/81 = 1.580 28=12 = 1.587Major Sixth 5/3 = 1.667 27/16 = 1.688 29=12 = 1.682minor Seventh 7/4 = 1.750 16/9 = 1.778 210=12 = 1.782
or 16/9 = 1.778or 9/5 = 1.800
Major Seventh 15/8 = 1.875 243/128 = 1.898 211=12 = 1.888Octave 2/1 = 2.000 2/1 = 2.000 212=12 = 2.000
�


Appendix E: Standard Musical Frequencies
This appendix gives the frequencies (in Hertz) of the notes of the equal-temperedmusical scale assuming that concert A is tuned to 440 Hz, per the internationalstandard.
C0 16.35C]0 or D[0 17.32
D0 18.35D]0 or E[0 19.45
E0 20.60F0 21.83
F ]0 or G[0 23.13G0 24.50
G]0 or A[0 25.96A0 27.50
A]0 or B[0 29.14B0 30.87
C1 32.70C]1 or D[1 34.65
D1 36.71D]1 or E[1 38.89
E1 41.20F1 43.65
F ]1 or G[1 46.25G1 49.00
G]1 or A[1 51.91A1 55.00
A]1 or B[1 58.27B1 61.74
C2 65.41C]2 or D[2 69.30
D2 73.42D]2 or E[2 77.78
E2 82.41F2 87.31
F ]2 or G[2 92.50G2 98.00
G]2 or A[2 103.83A2 110.00
A]2 or B[2 116.54B2 123.47
C3 130.8C]3 or D[3 138.6
D3 146.8D]3 or E[3 155.6
E3 164.8F3 174.6
F ]3 or G[3 185.0G3 196.0
G]3 or A[3 207.7A3 220.0
A]3 or B[3 233.1B3 246.9
C4 261.6C]4 or D[4 277.2
D4 293.7D]4 or E[4 311.1
E4 329.6F4 349.2
F ]4 or G[4 370.0G4 392.0
G]4 or A[4 415.3A4 440.0
A]4 or B[4 466.2B4 493.9
C5 523.3C]5 or D[5 554.4
D5 587.3D]5 or E[5 622.3
E5 659.3F5 698.5
F ]5 or G[5 740.0G5 784.0
G]5 or A[5 830.6A5 880.0
A]5 or B[5 932.3B5 937.8
W.M. Hartmann, Principles of Musical Acoustics, Undergraduate Lecture Notesin Physics, DOI 10.1007/978-1-4614-6786-1,© Springer Science+Business Media New York 2013
297

298 Appendix E: Standard Musical Frequencies
C6 1046.5C]6 or D[6 1108.7
D6 1174.7D]6 or E[6 1244.5
E6 1318.5F6 1396.9
F ]6 or G[6 1480.0G6 1568.0
G]6 or A[6 1661.2A6 1760.0
A]6 or B[6 1864.6B6 1975.5
C7 2093.C]7 or D[7 2218.
D7 2349.D]7 or E[7 2489.
E7 2637.F7 2794.
F ]7 or G[7 2960.G7 3136.
G]7 or A[7 3322.A7 3520.
A]7 or B[7 3729.B7 3951.
C8 4186.C]8 or D[8 4435.
D8 4699.D]8 or E[8 4978.
E8 5274.F8 5588.
F ]8 or G[8 5920.G8 6272.
G]8 or A[8 6645.A8 7040.
A]8 or B[8 7459.B8 7902.

Appendix F: Power Law Dependences
Linear (First Power) Dependence If one pencil costs 10 cents, then two pencilscosts 20 cents, and three pencils costs 30 cents, etc. The total cost of pencils dependslinearly on the number of pencils purchased. We say that the cost varies as the firstpower of the number of pencils. Double the number of pencils and you double thecost.
Square Law (Second Power) Dependence If the side of a square has a length of5 in., then the square has an area of 25 in.2. If the side of a square has a length of10 in., then the square has an area of 100 in.2. The area depends on the square ofthe length of a side. We say that the area varies as the second power of the length.Double the length of a side and you multiply the area by four.
The linear law and the square law are examples of power laws. When there is apower law, it is possible to make statements about how many times larger or smallera dependent quantity becomes when another quantity is varied.
Here is another power law, based on Eq. (3.1). That equation says that thefrequency of a simple harmonic vibration varies as the square root of the stiffness,quantity s. To gain insight into how the equation works, we ask what happens if thestiffness is doubled. We will answer this question in two ways, one quick, the otherslow and systematic. We reproduce Eq. (3.1) for convenient reference
f D 1
2�
rs
m(3.1)
Quick Thinking: Square-Root Law (One-Half Power) Dependence Because thefrequency varies as the square root of the stiffness, if we double the stiffness wemultiply the frequency by the square root of 2. For instance, if the frequency isinitially 100 Hz then after the stiffness is doubled, the frequency becomes 100�p
2,or 141 Hz. That is the quick way.
W.M. Hartmann, Principles of Musical Acoustics, Undergraduate Lecture Notesin Physics, DOI 10.1007/978-1-4614-6786-1,© Springer Science+Business Media New York 2013
299

300 Appendix F: Power Law Dependences
Slow and Systematic We identify two conditions:
OLD CONDITION: Stiffness s gives frequency of 100 Hz.
NEW CONDITION: Stiffness 2s gives a new, unknown frequency.
Our task is to find the new frequency.We write Eq. (3.1) for both conditions
fOLD D 1
2�
psOLD=mOLD
fNEW D 1
2�
psNEW =mNEW
We can divide the new equation by the old equation:
fNEW
fOLDD
12�
psNEW =mNEW
12�
psOLD=mOLD
:
The factors of 2� appear in both the numerator and the denominator, and theycancel. Likewise, the old mass and the new mass are the same and they too cancel.Therefore,
fNEW
fOLDD
psNEWpsOLD
:
Because the ratio of square roots is equivalent to the square root of the ratios,
fNEW
fOLDD
rsNEW
sOLD:
We have succeeded in reducing this equation down to something we know,because we know that the new stiffness is twice the old stiffness. Therefore,
fNEW
fOLDD p
2
or
fNEW D fOLDp2:
Now if fOLD is 100 Hz then fNEW is 100p2 D 141Hz.
That is the end of the slow and systematic way, and it gives the same answer asthe quick way. In the quick way we just look at the dependence and apply it directly.For instance, if the stiffness is increased by a factor of three (becomes three times

Appendix F: Power Law Dependences 301
larger), then the frequency is increased by the square root of 3. If it was originally100 Hz, then after increase the frequency fNEW is 100
p3 D 173Hz.
Inverse Square-Root Law (Minus One-Half Power) Dependence Equation (3.1)shows that the frequency depends inversely on the square root of the mass. “Inverse”means reciprocal. For instance, if the mass is doubled then the frequency becomessmaller. It becomes smaller by a factor of the reciprocal of the square root of two.That means that fNEW D fOLD=
p2. If the frequency was originally 100 Hz, then
after the increase in mass the frequency fNEW is 100=p2 D 71Hz.
�


Appendix G: Telephone Tones
The telephone uses pairs of sine tones to encode the numbers in touch-tone dialing.The sine tones are added together with approximately equal amplitudes. The sinetone frequencies (in Hz) are given in the table below
Frequencies (Hz) 1209 1336 1477 1633697 1 2 3 (not770 4 5 6 yet852 7 8 9 used)941 * 0 #
For example pressing the button called “4” sends a signal with components at770 and 1,209 Hz.
The dial tone of a telephone is also a sum of sine tones, with frequencies 350 and440 Hz.
The dial tone is different from the tones from the numeric keypad because it isconsonant. The ratio 440=350 equals 1.257, which is an interval of a Major third. Forcomparison note that Appendix D gives the Major third as 1.25 in Just tuning, 1.266in Pythagorean, and 1.260 in Equal temperament. Historically, there have been somany different meantone tunings with different ratios for the Major third, that theratio 1.257 must have appeared in somebody’s favorite tuning.
The telephone bandwidth for speech is 300 Hz to 3.3 kHz. The dynamic range isabout 40 dB.
�
W.M. Hartmann, Principles of Musical Acoustics, Undergraduate Lecture Notesin Physics, DOI 10.1007/978-1-4614-6786-1,© Springer Science+Business Media New York 2013
303


Appendix H: Greek Alphabet
Some of the equations in this book use letters of the Greek alphabet. Here are all 24of them, upper case, lower case, and their names.
A ˛ AlphaB ˇ Beta Gamma� ı DeltaE � EpsilonZ ZetaH � Eta‚ � ThetaI � IotaK � Kappaƒ � LambdaM � MuN � Nu„ � XiO o Omicron… � PiP � Rho† � SigmaT � Tau‡ � Upsilonˆ � PhiX � Chi‰ Psi� ! Omega
�
W.M. Hartmann, Principles of Musical Acoustics, Undergraduate Lecture Notesin Physics, DOI 10.1007/978-1-4614-6786-1,© Springer Science+Business Media New York 2013
305


Answers to Exercises
Chapter 1
1.1: A reflecting wall is part of the transmission path. A musical instrumentis a source. A microphone is a receiver of acoustical waves, but in turn, ittransmits electrical waves. So it could be considered either a receiver or part ofthe transmission path.
1.2: Fish perceive sound vibrations in the water, whales communicate, and dolphinsand submarines echolocate, all with sound waves. Sounds travel very well in solids.It is believed that elephants hear waves that are transmitted through the ground.Putting your ear on a railroad track can give the first evidence that a train is coming.Mostly, however, the sounds that are transmitted through solids, such as a solid wall,are an annoyance.
1.3: If a sound source is far away it may be too weak to hear. Intense sounds canmask quieter sounds, such as the sounds of a conversation that you want to hear.Excess reverberation in a room can cause speech to be garbled. Listening to a singletalker in a context with many other talkers is often possible, but stressful.
1.5: Ocean waves and X-rays would be examples.
1.6: The difference is 137� 120 D 17 kg. The ratio is 137/120 = 1.14. The ratio hasno units. It would be wrong to say that the ratio is 1.14 kg. The percentage changeis 100 � .137=120� 1/ D 14%.
1.7: The simple way to do this problem is to use the idea of Eq. (1.2) to realize thatdecreasing a number by 10 % is equivalent multiplying it by 0.9, and that increasinga number by 10 % is equivalent to multiplying it by 1.1. Thus decreasing and thenincreasing by 10 % multiplies the original number by 0:9 � 1:1 D 0:99 or 99 %.Hence the change is a 1 % loss. The order of decreasing and increasing events doesnot matter because the order of multiplying two numbers together does not matter.
W.M. Hartmann, Principles of Musical Acoustics, Undergraduate Lecture Notesin Physics, DOI 10.1007/978-1-4614-6786-1,© Springer Science+Business Media New York 2013
307
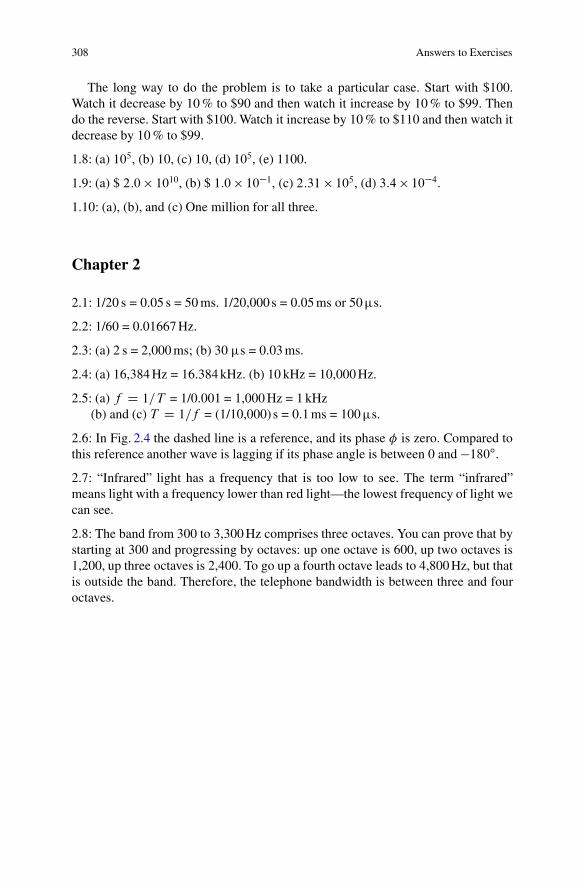
308 Answers to Exercises
The long way to do the problem is to take a particular case. Start with $100.Watch it decrease by 10 % to $90 and then watch it increase by 10 % to $99. Thendo the reverse. Start with $100. Watch it increase by 10 % to $110 and then watch itdecrease by 10 % to $99.
1.8: (a) 105, (b) 10, (c) 10, (d) 105, (e) 1100.
1.9: (a) $ 2:0 � 1010, (b) $ 1:0 � 10�1, (c) 2:31 � 105, (d) 3:4 � 10�4.
1.10: (a), (b), and (c) One million for all three.
Chapter 2
2.1: 1/20 s = 0.05 s = 50 ms. 1/20,000 s = 0.05 ms or 50�s.
2.2: 1/60 = 0.01667 Hz.
2.3: (a) 2 s = 2,000 ms; (b) 30 �s = 0.03 ms.
2.4: (a) 16,384 Hz = 16.384 kHz. (b) 10 kHz = 10,000 Hz.
2.5: (a) f D 1=T = 1/0.001 = 1,000 Hz = 1 kHz(b) and (c) T D 1=f = (1/10,000) s = 0.1 ms = 100�s.
2.6: In Fig. 2.4 the dashed line is a reference, and its phase � is zero. Compared tothis reference another wave is lagging if its phase angle is between 0 and �180ı.
2.7: “Infrared” light has a frequency that is too low to see. The term “infrared”means light with a frequency lower than red light—the lowest frequency of light wecan see.
2.8: The band from 300 to 3,300 Hz comprises three octaves. You can prove that bystarting at 300 and progressing by octaves: up one octave is 600, up two octaves is1,200, up three octaves is 2,400. To go up a fourth octave leads to 4,800 Hz, but thatis outside the band. Therefore, the telephone bandwidth is between three and fouroctaves.

Answers to Exercises 309
2.9:
a
b
c
For Exercise 2.9 (a–c). The dashed line is the reference sine
2.9 (d): There are many possible answers to this question. Almost any scribble thata child would do is likely to be a function that is not single-valued. Figure belowshows two simple functions. You can see that in each case knowing the value of xcould leave you uncertain about the value of y.
For Exercise 2.9 (d). Two functions that are not single-valued
Chapter 3
3.1: The square root of (100/0.25) is 20. Divide by 2� to get 3.18 Hz.
3.2: The mass is near the ends of the tines, and the stiffness comes from theshoulders. File the tines and the frequency increases because the mass gets smaller.File the shoulders and the frequency decreases because with less material there isless stiffness.

310 Answers to Exercises
3.3: In engineering, one measures the lifetime as the time it takes for the amplitudeto fall below its initial value by a factor of 1=e, where e is the natural logarithm base,e � 2:72. That corresponds to 37 % of the initial value. In Fig. 3.1, the amplitudehas dropped to 37 % after about four cycles. Each cycle has a period of 1/200 s.Therefore, the lifetime is 4 times (1/200) or 1/50, which is 0.02 s.
In acoustics, one measures the lifetime as the time it takes for the amplitude tofall below one one-thousandth of the initial value (0.001). By the that standard, thelifetime in Fig. 3.1 is at least as long as the entire time axis with about 18 cycles.Therefore, we’ll say the waveform has disappeared after 18 times (1/200) or 18/200,which is 0.09 s.
3.4: The recipe for salt is as follows: “Add salt.” That is the end of the recipe. Thespectrum of a 1,000-Hz sine tone consists of a 1,000-Hz sine component. That isthe end of the spectrum. The problem does not state an amplitude so we are free topick any amplitude we like.
For Exercise 3.4. Spectrum of a 1,000-Hz sine tone
3.6: There are two people (systems) and a suggestion made by one of them is gladlyfollowed by the other because the two people (systems) are in agreement on thematter in question.
3.7: (a) A child on a swing is like a swinging pendulum. The pendulum has onemode of vibration and if you drive the pendulum system at its natural frequencythe amplitude of the oscillation becomes huge. Thus pushing a child in a swing isjust like adding energy to a pendulum to increase the amplitude and make the childswing higher.(b) The playground swing is not an exact example of resonance. The driving forceis not a sine wave force. Instead, it is impulsive. If you push the child on every othercycle of motion, or every third, the amplitude increases, even though the drivingfrequency is one-half or one-third of the natural frequency of vibration. Strictlyspeaking, resonance is not like that. The driving frequency and the mode frequencyhave to be exactly the same for resonance.
3.8: (a) The frequency stays the same. (b) The frequency gets smaller by a factor ofthe square root of two. That means that if the frequency is originally f1 then afterdoubling the mass the frequency becomes f1=
p2 or f1=1:414.

Answers to Exercises 311
a
b
c
For Exercise 3.9. Adding (a) and (b) point-by-point gives you (c)
3.9: (a)(b) For every cycle of a there are 1.5 cycles of b. Therefore, the frequency of b is1.5 times the frequency of a. If the frequency of a is 100 Hz the frequency of b is150 Hz.
3.10: None of these is an example of resonance because the driving force is not asine function and so the driving system does not have any particular frequency. Theessential condition for resonance is that the frequency of the driving must equal anatural frequency of the driven system.
3.11: The top pattern shows the mode with the highest frequency and the bottompattern shows the lowest. Complicated vibration patterns generally have highfrequencies.
3.12: A larger volume leads to lower frequencies for the modes of vibration of air inthe box. Lower frequency modes will resonate with tines of lower pitch.
Chapter 4
4.1: There are two transducers, a microphone and a miniature loudspeaker.
4.2: Many of different periodic waveforms might have two positive-going zerocrossings per cycle. Here is one of them
For Exercise 4.2. A waveform to fool the frequency counter
The frequency counter adds a count to the total whenever the signal input circuitdetects a positive-going zero crossing. With two of these per cycle, the total count,
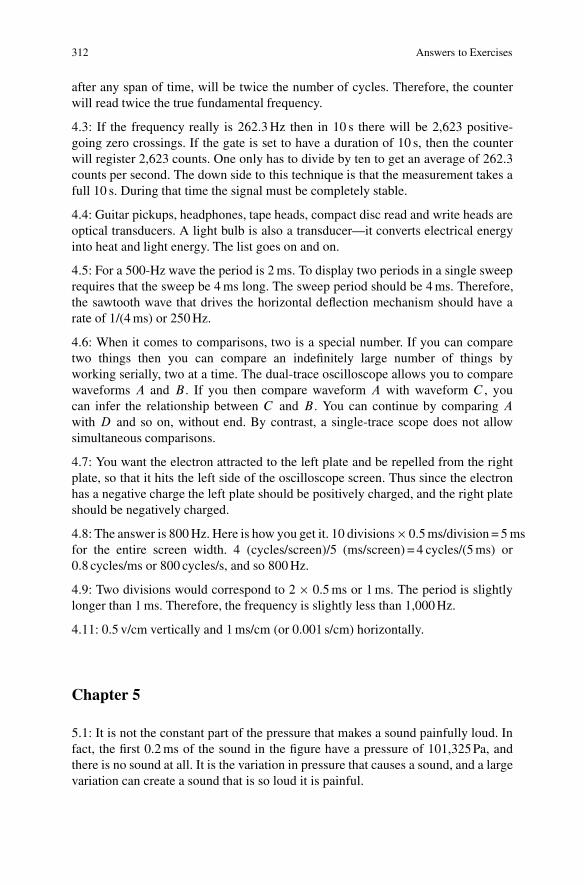
312 Answers to Exercises
after any span of time, will be twice the number of cycles. Therefore, the counterwill read twice the true fundamental frequency.
4.3: If the frequency really is 262.3 Hz then in 10 s there will be 2,623 positive-going zero crossings. If the gate is set to have a duration of 10 s, then the counterwill register 2,623 counts. One only has to divide by ten to get an average of 262.3counts per second. The down side to this technique is that the measurement takes afull 10 s. During that time the signal must be completely stable.
4.4: Guitar pickups, headphones, tape heads, compact disc read and write heads areoptical transducers. A light bulb is also a transducer—it converts electrical energyinto heat and light energy. The list goes on and on.
4.5: For a 500-Hz wave the period is 2 ms. To display two periods in a single sweeprequires that the sweep be 4 ms long. The sweep period should be 4 ms. Therefore,the sawtooth wave that drives the horizontal deflection mechanism should have arate of 1/(4 ms) or 250 Hz.
4.6: When it comes to comparisons, two is a special number. If you can comparetwo things then you can compare an indefinitely large number of things byworking serially, two at a time. The dual-trace oscilloscope allows you to comparewaveforms A and B . If you then compare waveform A with waveform C , youcan infer the relationship between C and B . You can continue by comparing Awith D and so on, without end. By contrast, a single-trace scope does not allowsimultaneous comparisons.
4.7: You want the electron attracted to the left plate and be repelled from the rightplate, so that it hits the left side of the oscilloscope screen. Thus since the electronhas a negative charge the left plate should be positively charged, and the right plateshould be negatively charged.
4.8: The answer is 800 Hz. Here is how you get it. 10 divisions � 0.5 ms/division = 5 msfor the entire screen width. 4 (cycles/screen)/5 (ms/screen) = 4 cycles/(5 ms) or0.8 cycles/ms or 800 cycles/s, and so 800 Hz.
4.9: Two divisions would correspond to 2 � 0.5 ms or 1 ms. The period is slightlylonger than 1 ms. Therefore, the frequency is slightly less than 1,000 Hz.
4.11: 0.5 v/cm vertically and 1 ms/cm (or 0.001 s/cm) horizontally.
Chapter 5
5.1: It is not the constant part of the pressure that makes a sound painfully loud. Infact, the first 0.2 ms of the sound in the figure have a pressure of 101,325 Pa, andthere is no sound at all. It is the variation in pressure that causes a sound, and a largevariation can create a sound that is so loud it is painful.

Answers to Exercises 313
5.2: Remember that 1 m2 is 10,000 cm2. Therefore, to find the pressure in Newtonsper square centimeter you divide by 10,000.
It is useful to apply the concepts of unit analysis to this exercise. The exerciserequires that we convert from units of Newtons per square meter to units of Newtonsper square centimeter. To do this operation we need to multiply by something thatis equivalent to 1.0 that gets rid of the square meters and replaces it with squarecentimeters. The kind of thing that is likely to work is a fraction with square metersin the numerator and square centimeters in the denominator.
Algebraically it looks like this:
100;000Newtons
meter2�
�1
100
meter
cm
�2D 10
Newtons
cm2
The factor equivalent to 1.0 is 1=100m/cm. This factor needs to be squared (it’sstill 1.0) to get the units right and the number 1=100 gets squared right along withthe units. Therefore, the number 100,000 gets divided by 10,000, not by 100.
5.3: 14:7 pounds=in:2 � 4:45N=pound � Œ1:=0:000645� in:2=m2 D 101; 419N=m2
5.4: According to Eq. (5.1) the speed of sound at �18 ıC becomes
v D 331:7C 0:6.�18/ D 331:7� 10:8 D 320:9m=s;
and at 40 ıC
v D 331:7C 0:6.40/ D 331:7C 24 D 355:7m=s:
5.5 (a): Start with Eq. (5.1) and substitute Eq. (5.6) for TC , the centigrade tempera-ture.
v D 331:7C 0:6Œ5
9.TF � 32/� D 331:7C 1
3TF � 0:6 � 5
9� .32/ D 312C 1
3TF
and this is Eq. (5.7).
5.5 (b): Equation (5.7) has two terms. To convert to feet per second, they both needto be multiplied by the number of feet per meter. That number is
39:37 in:=m � ft=12 in D 3:28ft=m:
i.e. multiply by 3.28 to get Eq. (5.8).
5.6: (a) time = distance/speed = 10 m/ (344 m/s)time = 0.029 s or 29 ms.
(b) With races decided by hundredths of a second (tens of milliseconds) a delay of29 ms is significant. That is why a starter pistol is no longer used to start sprints.Instead there is a signaling device in each lane behind the runner.

314 Answers to Exercises
5.7: The light can be considered to travel instantaneously. The delay of 2 s isall due to the relatively slow speed of sound. Therefore, distance D speed �time = 344m=s � 2 s, or distance = 688 m away. That’s 0.688 km, i.e., about 0.7 kmwhich is about 0.4 miles.
5.8: 1128 ft/s � (1/5280) miles/ft � (3600) s/h = 769 miles/h. Notice how the unitscancel numerator and denominator.
5.9: The difference in audible frequencies is 20,000 – 20, which is about 20,000 Hz.The difference in visible frequencies is 7�1014�4�1014 which is about 3�1014 Hz.Obviously the range of visible light is enormously wider in terms of differences. Butwhen it comes to the behaviors of physical and biological systems, ratios are moreimportant than differences. In terms of ratios, the range of audible sound frequenciesis far greater than the range of visible light frequencies. The human ear needs tobe able to deal with a low frequency like 20 Hz and with a high frequency like20,000 Hz, i.e. 1,000 times greater. The human eye needs to be able to deal withred light, 4 � 1014 Hz, and with violet light, 7 � 1014 Hz, less than a factor of twogreater. In other words, the range of visible light is less than an octave, but the rangeof audible sound is ten octaves, i.e. 210 D 1024 � 1000.
5.10: At room temperature for 20 Hz, wavelength = 344/20 = 17 m. That is more than55 ft.
At room temperature for 20,000 Hz, wavelength = 344/20,000 = 17 mm. That isless than 3/4 in.
5.11: At room temperature, frequency = 344 (m/s)/1 (m) = 344 Hz.
5.12: The formula � D v=f conforms to the convention that independent variablesare on the right side of the equals sign and the dependent variable is on the left. Thespeed of sound is determined by the environment, and the frequency is independentof the environment. The wavelength is what one gets depending on the other twovariables.
5.13: The period is half a second; the fundamental frequency is 2 Hz. Successivesolid circles may be the pressure peaks of each successive clap. The distancebetween the circles is the wavelength, � D vT , or 344� 1=2 D 172m.
5.14: The unit “gpf” stands for “gallons per flush.” To determine the water usage ina day you need to know the numberN of “flushes per day.” You do the calculation:
1.6 gallons/flush � N flushes/day = 1:6N gallons/day.
Notice that the units of “flushes” cancels between numerator and denominator,giving you a final answer in units of “gallons per day.”
5.15: The low-frequency parts of a complex sound would arrive at you sooner thanthe high-frequency parts. If the sound source is close to you it might not mattermuch, but the relative delay would be longer for a distant source. A distant explosionwould sound to you like a whooosh with a pitch that rises. A voice in the distancewould become unintelligible because the high and low frequencies would not besynchronized.

Answers to Exercises 315
5.16: Transverse waves cannot propagate in water. To carry a transverse wave, amedium must have some resistance to being bent. Water has a lot of resistance tobeing compressed (longitudinal waves) but no resistance to being bent.
Chapter 6
6.1: According to Eq. (6.3) the requirement for cancellation is that the difference indistance be an odd number of half wavelengths. For this exercise, the difference indistance is 0.4 m. Therefore, for parts (a) and (b):
A distance of 0.4 m is one half of a wave length if the wavelength is 0.8 m. Thenthe frequency is 344/0.8 or 430 Hz.
A distance of 0.4 m is three halves of a wave length if the wavelength is 0.2667 m.Then the frequency is 344/0.2667 or 1290. Hz. This frequency is just 3 times430. Hz.(c) In theory, there is no limit to the number of magic wavelengths and frequencies.Any odd number of half wavelengths will work: 5/2, 7/2, 9/2, etc.
6.2: (a) There are two ways to do this exercise. Both give the same answer.
First way—use the period. The period is 1 ms and half a period is 0.5 ms. Forcancellation the delay ought to be half a period. One gets a delay of 0.5 ms with adistance difference of 0:5�344 or 172 mm which is 0.172 m. Therefore, cancellationoccurs if you put the second source 1:000 C 0:172 D 1:172m away from you, orelse 1:000� 0:172 D 0:828m away from you.
Second way—use the distance. The difference in distance ought to be half awavelength. For a 1,000 Hz tone the wavelength is 344/1000 = 344 mm. Half awavelength is 172 mm which is 0.172 m. Therefore, cancellation occurs if you putthe second source 1:000 C 0:172 D 1:172m away from you or 1:000 � 0:172 D0:828m away from you.
(b) In order to get complete cancellation the amplitudes of the two tones, asmeasured independently at the position of the receiver (namely at your position),need to be the same.
6.3: At low frequencies the wavelengths are larger than the dimensions of yourroom. If they are cancelled by a phasing error they are cancelled everywhere in yourroom. Getting a good bass response is a challenge for most audio systems. Recordedmusic is mixed with the left and right channels in phase for low frequencies to helpwith this situation. One thing that you really don’t want to do is to cancel the bass.
When the wavelength is longer than the dimensions of the room, you can thinkof the loudspeakers as a pump, alternately compressing and expanding the entirevolume of air in the room. For effective compression and expansion, the twospeakers need to work together and not against one another.

316 Answers to Exercises
By contrast, high frequencies have wavelengths that are much shorter than thedimensions of your room. High frequency sounds may cancel in one spot, but theyreappear at another spot. This is a normal effect for any sound in any room; it is notspecial to stereophonic reproduction.
6.4: We know that the difference of the two frequencies is 5 Hz. If one of thefrequencies is 440 then the other frequency must either be 445 or 435 Hz.
6.5: The beats between two sine waves are strongest if the amplitudes are equalbecause only then can complete cancellation occur. If the amplitudes are slightlydifferent, there will always be a little bit of the larger wave left over when the phaserelationship between the two waves leads to the greatest cancellation.
6.6: � D c=f or 3 � 108=.6 � 1014/ D 0:5 � 10�6 = half a micrometer. A mirrorneeds to be polished so that bumps on its surface are smaller than that.
6.7: The wavelength of a 100-Hz wave is much longer than a few inches, but thewavelength of a 10,000-Hz wave is smaller than a few inches. The stone wallappears to be smooth to the 100-Hz wave, but it appears to be rough to the 10,000 Hzwave. The 10,000-Hz wave is diffusely reflected.
6.8: According to Fig. 6.8, sound waves bend toward the direction of cool air.Therefore, a channel is made by a layer of cool air between layers of warm air.
6.9: We use our ears to warn us of danger to ourselves or others. Apart from that,norml social interaction depends on verbal communication.
6.10: According to Fig. 6.11a, the slope of the input/output line is negative. Themore the input pressure is positive, the more the output voltage is negative—andvice versa. The transducers described by Figs. 4.2 and 6.11 are actually the sameexcept that Fig. 6.11 is inverted. It could be that the two transducers are identicalexcept that the positive and negative wires coming from the transducer are reversedin Fig. 6.11.
Chapter 7
7.1: For the sixth mode there are six half wavelengths along the string, and fivenodes.
For Exercise 7.1. The sixth mode of vibration of a stretched string

Answers to Exercises 317
7.2: f D vs=.2L/ or 154 (m/s)/(1.4 m) = 110 Hz. The third harmonic has afrequency three times larger, 330 Hz.
7.3: The linear density (�) is determined by the choice of guitar string. The tension(F ) is determined by stretching the string on tuning the instrument. The length (L)is determined by the player who presses the string down on the frets.
7.5: The frequency is inversely proportional to the string length. We set up aproportion for the unknown length L.
82=110 D L=70:
The solution is L D 52:2 cm.
7.6: The top E frequency is four times greater or about 328 Hz. To get this highfrequency the speed of sound needs to be four times faster.
7.7: Bend notes by stretching strings, increasing the tension. Some rock guitars havehinged bars (whammy bars) that stretch all the strings at once.
7.8: Double the tension and the speed of sound increases by a factor of the squareroot of 2. Therefore, the frequency increases by the same factor and becomes141 Hz.
7.9: Start with F=�. It is kg�m=Œ.s/.s/�kg=m . The units of kg divide out and the denominator
just becomes 1=m. Thus F=� has units of m2=s2, and the square root of this is m/sas advertised.
7.10: The role of the guitar body is to radiate the sound. The frequencies of the soundare almost entirely determined by the string only. However, because the bridge andnut of the guitar body vibrate a little, the boundary conditions change slightly, andthere is a tiny effect of the body on the playing frequencies. In this book, we alwaysneglect that tiny effect.
7.11: In a wind instrument, the air pressure within the body of the instrumentvibrates. In a drum, the drumhead (a membrane) vibrates. Both have modes ofvibration. These modes are equivalent to standing waves. For instance, these modeshave nodes at certain places.
7.12:
fn D n
2L
sF
�
7.13: The easiest solution is to recognize that the flat lines at 4 and 12 ms areseparated in time by half a period. Therefore, half a period is 12 � 4 D 8ms and afull period is 16 ms. Therefore, the frequency is 1000=6 D 62:5Hz.

318 Answers to Exercises
Chapter 8
8.1: (a) For open-open pipe f D v=.2L/ D 1130=.2/D 565Hz.
(b) For open-closed pipe f D v=.4L/ D 1130=.4/D 282Hz.
(c) The open-closed pipe has natural mode frequencies that are odd-integer multiplesof the lowest mode frequency. Only modes with these frequencies are allowed toexist in this pipe. All the even numbered harmonics are missed.
8.2: (a) For open-closed pipe number of nodes = mode number �1(b) For open-open pipe number of nodes = mode number �1,
i.e., the relationships are the same.
8.3 Mode number four for a open-closed pipe has three nodes as shown f Dv=.4L/� 7:
For Exercise 8.3. The fourth mode of air vibration in an open-closed pipe
8.4: The drawing should look like Fig. 8.2 except that there will be three nodesinstead of one.
8.5: To put this matter in a clear light, we write an equation for the lowest frequencyof a pipe that is open at both ends. Putting in the end correction explicitly, we findf D v=Œ2.L C 0:61d/�, where L is the measured length of the pipe and d is thediameter. The neat way to write this is to rearrange the denominator slightly to get.
f D v=Œ2L.1C 0:61d=L/�:
Now the formula looks just like our old friend, f D v=2L, with a denominator thatis multiplied by something that is pretty close to 1.0 if d=L is small. This makes itclear that it is the diameter compared to the measured length, d=L, that causes theend-correction deviations.
8.6: The open-closed pipes need to be slightly longer because only one endcorrection is applied to them and in order to get a precise octave, the effective lengthsof the two pipes need to be the same.
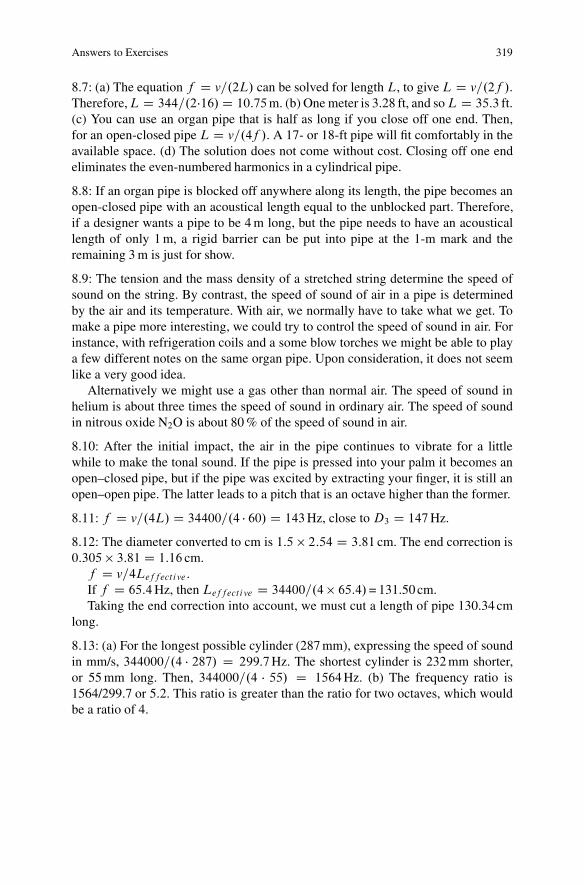
Answers to Exercises 319
8.7: (a) The equation f D v=.2L/ can be solved for length L, to give L D v=.2f /.Therefore,L D 344=.2�16/D 10:75m. (b) One meter is 3.28 ft, and soL D 35:3 ft.(c) You can use an organ pipe that is half as long if you close off one end. Then,for an open-closed pipe L D v=.4f /. A 17- or 18-ft pipe will fit comfortably in theavailable space. (d) The solution does not come without cost. Closing off one endeliminates the even-numbered harmonics in a cylindrical pipe.
8.8: If an organ pipe is blocked off anywhere along its length, the pipe becomes anopen-closed pipe with an acoustical length equal to the unblocked part. Therefore,if a designer wants a pipe to be 4 m long, but the pipe needs to have an acousticallength of only 1 m, a rigid barrier can be put into pipe at the 1-m mark and theremaining 3 m is just for show.
8.9: The tension and the mass density of a stretched string determine the speed ofsound on the string. By contrast, the speed of sound of air in a pipe is determinedby the air and its temperature. With air, we normally have to take what we get. Tomake a pipe more interesting, we could try to control the speed of sound in air. Forinstance, with refrigeration coils and a some blow torches we might be able to playa few different notes on the same organ pipe. Upon consideration, it does not seemlike a very good idea.
Alternatively we might use a gas other than normal air. The speed of sound inhelium is about three times the speed of sound in ordinary air. The speed of soundin nitrous oxide N2O is about 80 % of the speed of sound in air.
8.10: After the initial impact, the air in the pipe continues to vibrate for a littlewhile to make the tonal sound. If the pipe is pressed into your palm it becomes anopen–closed pipe, but if the pipe was excited by extracting your finger, it is still anopen–open pipe. The latter leads to a pitch that is an octave higher than the former.
8.11: f D v=.4L/ D 34400=.4 � 60/ D 143Hz, close to D3 D 147Hz.
8.12: The diameter converted to cm is 1:5 � 2:54 D 3:81 cm. The end correction is0:305 � 3:81 D 1:16 cm.f D v=4Leffect ive .If f D 65:4Hz, then Leffect ive D 34400=.4� 65:4/= 131.50 cm.Taking the end correction into account, we must cut a length of pipe 130.34 cm
long.
8.13: (a) For the longest possible cylinder (287 mm), expressing the speed of soundin mm/s, 344000=.4 � 287/ D 299:7Hz. The shortest cylinder is 232 mm shorter,or 55 mm long. Then, 344000=.4 � 55/ D 1564Hz. (b) The frequency ratio is1564/299.7 or 5.2. This ratio is greater than the ratio for two octaves, which wouldbe a ratio of 4.
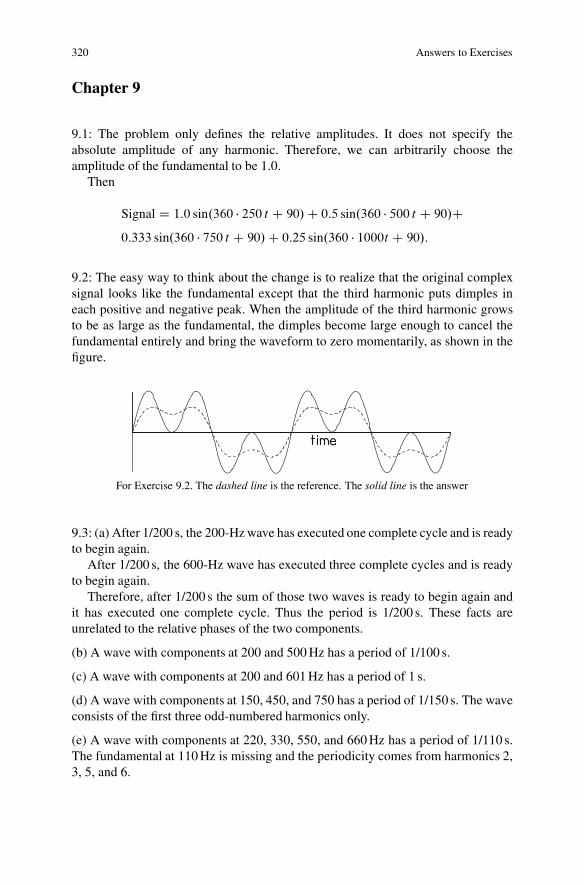
320 Answers to Exercises
Chapter 9
9.1: The problem only defines the relative amplitudes. It does not specify theabsolute amplitude of any harmonic. Therefore, we can arbitrarily choose theamplitude of the fundamental to be 1.0.
Then
Signal D 1:0 sin.360 � 250 t C 90/C 0:5 sin.360 � 500 t C 90/C0:333 sin.360 � 750 t C 90/C 0:25 sin.360 � 1000t C 90/:
9.2: The easy way to think about the change is to realize that the original complexsignal looks like the fundamental except that the third harmonic puts dimples ineach positive and negative peak. When the amplitude of the third harmonic growsto be as large as the fundamental, the dimples become large enough to cancel thefundamental entirely and bring the waveform to zero momentarily, as shown in thefigure.
For Exercise 9.2. The dashed line is the reference. The solid line is the answer
9.3: (a) After 1/200 s, the 200-Hz wave has executed one complete cycle and is readyto begin again.
After 1/200 s, the 600-Hz wave has executed three complete cycles and is readyto begin again.
Therefore, after 1/200 s the sum of those two waves is ready to begin again andit has executed one complete cycle. Thus the period is 1/200 s. These facts areunrelated to the relative phases of the two components.
(b) A wave with components at 200 and 500 Hz has a period of 1/100 s.
(c) A wave with components at 200 and 601 Hz has a period of 1 s.
(d) A wave with components at 150, 450, and 750 has a period of 1/150 s. The waveconsists of the first three odd-numbered harmonics only.
(e) A wave with components at 220, 330, 550, and 660 Hz has a period of 1/110 s.The fundamental at 110 Hz is missing and the periodicity comes from harmonics 2,3, 5, and 6.
Answers to Exercises 321
9.4: There is no perfect way to identify a psychological sensation like pitch with aphysical measurement like frequency such that pitch can be expressed in Hz. Whatis done in practice is to define pitch in Hz as the frequency of a sine tone that leadsto the same sense of pitch, i.e., the same height on a musical scale. For instance,we might play a 400-Hz sawtooth to a listener and ask the listener to adjust thefrequency of a sine tone so as to match the pitch of the sawtooth. Suppose that thelistener adjusts the sine frequency to be 401 Hz. Then we say that for this listener,on this experimental trial, the pitch of the 400-Hz sawtooth is 401 Hz.
9.5: Both the amplitude spectrum and the phase spectrum contribute to the shapeof the waveform. Ohm’s law of phase insensitivity applies to the sound of thewaveform, not to its shape on an oscilloscope.
9.6: The next three terms are:
1
4sin.360 � 1600 tC 180/C 1
5sin.360 � 2000 tC 180/C 1
6sin.360 � 2400 tC 180/:
9.7 Drill answers:
(a) Four harmonics; (b) four lines on a spectrum analyzer; (c) second harmonichas the highest amplitude; (d) 5 units; (e) 60ı; (f) Yes, a phase can be negative; (g)Yes, 240ı is equivalent to �120ı because those two angles differ by 360ı; (h) Theperiod is 1/200 s; (i) the quantity f t must have physical units of cycles. Therefore,if f is in Hertz, then t must be in seconds.
Chapter 10
10.1: (a) The square of (1/3) is 1/9.
(b) 10 log.1=9/ D �10 log.9/ D �10 � .0:954/ D �9:54 dB
10.2(a): From Eqs. (10.1) and (10.2) we know that I / A2 and that I / 1=d2.Substituting the first proportionality into the second, it follows that A2 / 1=d2, andthe square root leads to A / 1=d , as advertised.
10.3(a): I D P=.4�d2/ D 10=.4�106/ D 8 � 10�7 W/m2
(b): 10 log.8 � 10�7=10�12/ D 59 dB.(c): An airplane in flight is perhaps the only condition where one finds 1 km ofempty air in all directions, and an airplane can make 10 W of acoustical power.Alternatively—maybe a skydiving brass band?
10.4: Intensity dependence on distance (d ) from the source for worlds with differentdimensionality (D). As dimensionality goes from 3-D to 2-D to 1-D, the wavefrontspreading law goes from (inverse second power, 1=d2) to (inverse first power,1=d ) to (inverse zeroth power, 1). Zeroth power means no dependence on distance

322 Answers to Exercises
at all. Therefore, in a one-dimensional world there is no intensity loss due towavefront spreading. The only losses are due to friction (absorption) in the mediumof transmission.
10.5: 10 log.30=1/ D 10 � .1:477/ D 14:8 dB.
10.6: L2 � L1 D 10 log.I2=I1/ D 10 log.2/ D 10 � 0:301 D 3 dB.
10.7: (a) The statement of the situation in the exercise is that 20 D 10 log.Itmb=Iflute/
Therefore, Itmb=Iflute D 102 D 100
(b) Itmb=Iflute D ŒAtmb=Aflute�2, and so ŒAtmb=Aflute� D 10:
10.8: We begin with the statement that
L2 �L1 D 10 log.I2=I1/
Now .I2=I1/ D .A2=A1/2, so L2 �L1 D 10 logŒ.A2=A1/2�.
But the log of a square is twice the log, and so L2 � L1 D 20 log.A2=A1/
10.9:
130 D 10 log.I=10�12/
13 D log.I=10�12/
I D 1013 � 10�12 D 10W=m2:
Chapter 11
11.1: (a) The ear canal is said to be about 2.5 cm long. It resembles an open-closedpipe. Therefore, the resonant frequency is
f D v=.4L/ D 34400=.4� 2:5/ D 34400=10D 3440Hz:
(b) The second mode of such a pipe has the frequency
f D 3v=.4L/ D 3 � 34400=.4� 2:5/ D 10; 320Hz:
11.2: The speed of sound in air is 344,000 mm/s. Five times that speed is1,720,000 mm/s. Therefore, the time to go twice the distance of 35 or 70 mm inthe fluid is
time D 70=1; 720; 000D 0:000; 041 s D 41�s
11.3: The acoustic reflex is triggered by a whistle blowing next to your ear and othercontinuous sounds containing frequencies in the range from 1,000 to 4,000 Hz.

Answers to Exercises 323
11.4: (a) For 440 Hz, about 9 mm from the apex. (b) For 880 Hz, about 13 mm fromthe apex.
11.5: Expect intervals of 1/440 s, 2/440 s, 3/440 s, and so on.
11.6: The lost hair cells must be those near the oval window.
11.7: There will be more interference when an intense 1,000-Hz tone masks aweaker 1,300-Hz tone because excitation patterns on the basilar membrane areunsymmetrical with greater excitation extending toward the base, i.e., toward thedirection of higher frequency places.
11.8: For 5 mm,
fc D 165.10.0:06/�.5/ � 1/ D 165.1:995� 1/ D 164Hz:
For 10 mm,
fc D 165.10.0:06/�.10/ � 1/ D 165.3:981� 1/ D 492Hz:
etc.
11.9 (a): We start with the Greenwood equation,
fC D 165.10az � 1/
Our goal is to get z by itself on one side of the equation. We proceed systematically,doing what we can to move in the right direction at each step.
fC=165 D 10az � 1
1C fC =165 D 10az
log10.1C fC =165/D az
1a
log10.1C fC =165/ D z
Done!
(b): If fC D 440 then, with a D 0:06,
1
0:06log10.1C 440=165/D z D 9:4mm:
11.10: In the normal human auditory system there are half a dozen stages of neuralprocessing between the cochlea and the final destination in the auditory cortex.Every one of these stages is tuned in frequency, with slightly different spatial regionsfor tones of different frequency. To best simulate a normal system, a cochlearnucleus implant ought to have multiple electrodes that the surgeon can place in

324 Answers to Exercises
appropriate regions of the midbrain. Cochlear nucleus implants are, in fact, made inthis way.
11.11: (a) Microphone. (b) Microphone, Speech processor, Transmitter. (c) Aboutone turn.
Chapter 12
12.1: Horizontal axis is frequency in Hz; vertical axis is level in dB.
12.2: About 41 phons.
12.3: The tone is inaudible. The point at 200 Hz and 10 dB is below the threshold ofhearing curve.
12.4: The threshold of hearing is 0 phons whatever the frequency. That is thedefinition of zero phons. A sound level of 0 dB is also related to the threshold ofhearing by definition, but the dashed line in Fig. 12.1 makes it clear that the actualdecibel level for threshold depends on frequency. So long as the frequency is nottoo low or high, the threshold (dashed line) is rather close to 0 dB, i.e. close to10�12 W=m2.
12.5: From the equal-loudness contours, about 32 dB.
12.6: Choose 6,000 Hz. The equal-loudness contours dip down near 6,000 Hz,suggesting that this is a loud tone by itself. That is not true for 100 Hz. Also, thistone will excite different neurons from the 1,000-Hz tone. That cannot be said forthe 1,100-Hz tone. Because neurons are compressive, you would prefer to spendyour energy on different neurons.
12.7: (a) The equation says:
/ I 0:3 (12.1)
Therefore,
2= 1 D .I2=I1/0:3
We are told that the ratio of the intensities is 10 to 1. Therefore,
2= 1 D 100:3 D 1:995 � 2:
(b)
2= 1 D .I2=I1/0:3 D 500:3 D 3:2
Therefore, 3.2 times louder.

Answers to Exercises 325
12.8: (a) We know that the intensity ratio raised to the 0.3 power is 4. Therefore,the intensity ratio is 4 raised to the power 1/0.3, which is 102. Therefore, about100 times. (Because 4 is the square of 2, we might have expected to find that twodoublings would require multiplying the intensity by 10 twice.)
(b) 10 � 10 � 10 � 10 D 10; 000. Therefore, 10,000 times.
12.9: The dip in equal loudness contours is caused by the resonance of the ear canalnear 3,500 Hz.
12.10: From Eq. (12.7) we calculate that a level difference of 7 dB corresponds to aloudness ratio of 1.6. Thus, the trombone sound is 1.6 times louder.
12.11: In order to understand the effect of road noise on the loudness of a car radio,we need to assume that the auditory system can somehow separate the sound of theradio from the background noise and evaluate the loudness of the radio independentthe noise. Just considering the total neural firing rate can never explain the effect. Itis very likely that separating the sound of the car radio depends on the synchrony ofneurons as they respond to the radio. The road noise suppresses the neural responsethat is synchronized with tones from the radio. When the road noise is gone theneural response is not suppressed.
12.12: Loudness is defined as a psychological quantity, in contrast to intensity,which is a physical quantity. Therefore, if it sounds louder, it really is louder,regardless of how the intensity might or might not change.
12.13: The noisy fan is 8 times louder than the quiet fan. 4 sones/ 0.5 sones = 8. Thepurpose of the sone scale is to make comparisons like this really easy.
12:14: In comparison with 1,000 Hz, the contours at 62 Hz are very close together.Therefore, the loudness increases rapidly as the sound level increases. At 62 Hz, asthe sound level increases from 50 to 60 dB, the loudness level increases from 20phons to 40 phons—twice as large an increase.
Chapter 13
13.1: 200 Hz appears at 5 mm from the apex and 2,000 Hz at 17 mm from the apex.The maxima for these two tones are 12 mm apart. That is a huge distance.
13.2: For Part a the histogram shows the following numbers of interspike intervals:For 1 cycle (1/200 s) 5 intervalsFor 2 cycles (2/200 s) 4 intervalsFor 3 cycles (3/200 s) 2 intervalsFor Part b, the histogram isFor 1 cycle (1/200 s) 2 intervalsFor 2 cycles (2/200 s) 1 intervalFor 3 cycles (3/200 s) 1 interval

326 Answers to Exercises
For 4 cycles (2/200 s) 1 intervalFor 5 cycles (3/200 s) 1 interval
13.3: These components look like harmonics 5, 6, and 7 of 150 Hz. The integers 5,6, and 7 are consecutive and not very large. The pitch is very likely to be 150 Hz.
13.4: (a) This tone looks rather like harmonics 2, 3, and 4 of 200 Hz, but theharmonics are mistuned. We get a decent fitting template if we say that the templatehas a fundamental frequency of 620/3 or 206.7 Hz. The template expects a secondharmonic at 2 � 206:7 or 413 Hz, and this is flat compared to the real component at420 Hz. The template expects a fourth harmonic at 4 � 206:7 or 826.6 Hz, and thisis sharp with respect to the real component at 820. In the end, the template is toolow for the second harmonic, too high for the fourth harmonic, and just right for thethird. The brain regards this template as a reasonable compromise and perceives thistone to have a pitch of 206.7 Hz.
(b) This problem is an extension of Exercise 13.4 (a). More mistuned harmonics(five and six) are added to the top end. If we think about a template with afundamental frequency of 206.7 Hz, the sixth harmonic has a frequency of 1,240 Hz,and this is too far above the real component at 1,220 Hz. We are going to have todecrease the fundamental frequency of the template to get a better fit. We fit thecenter component (looking like the fourth harmonic) by choosing a fundamentalfrequency of 820=4 D 205Hz.
13.5: An analytic listener recognizes that the only difference between tones “1” and“2” is that 800 Hz component goes down to 750 Hz. This listener says that in thesequence “1” followed by “2” the pitch goes down. Most listeners hear Experimentsa and b in this way.
A synthetic listener interprets tone “1” as the 4th and 5th harmonics of 200 Hz.This listener interprets tone “2” as the 3rd and 4th harmonics of 250 Hz. This listenersays that in the sequence “1” followed by “2” the pitch goes up. The continuity inExperiment b should cause the synthetic listener hear the sequence differently. Itshould help him hear analytically if he wants to hear like most people.
The ambiguous sequence in Experiment a appears as demonstration number25 on a compact disc entitled “Auditory Demonstrations,” by A.J.M. Houtsma,T.D. Rossing, and W.W. Wagenaars, and is available from the Acoustical Societyof America. It was reviewed by W.M. Hartmann, “Auditory demonstrations oncompact disk for large N,” J. Acoust. Soc. Am. Review and Tutorial 93, 1–16 (1993).
Chapter 14
14.1: (a) 20 log10.1:18=1/ D 1:44. Thus, about 1.4 dB.
(b) 20 log10.0:68=0:5/ D 2:67. Thus, about 2.7 dB.
14.2: (a) The wavelength of a 100-Hz sound is about 3.4 m. This is about 20 timesthe diameter of the head. The wavelength is so much larger than the head diameter

Answers to Exercises 327
that the sound diffracts around the head and is just as large in the far ear as it is inthe near ear. (b) To use the interaural level difference at a low frequency like 100 Hz,it would be necessary to have a head about five times larger than normal.
14.3: From Fig. 14.2 it looks as though there is about 1.8 dB separating the 10ı curvefrom the 45ı curve at 2,000 Hz. If the smallest detectable difference is 0.5 dB, thenthe range from 10ı to 45ı is divided into about 1.8/0.5 or 3.6 intervals. On averagethese intervals correspond to .45� 10/=3:6 or 10ı. Thus, the ILD is seen to provideonly a crude estimation of azimuthal location.
14.4: (a) The left-hand side is time. The right-hand side is a distance divided bya speed, i.e., (meters) divided by (meters/second). The units of meters cancels innumerator and denominator leaving us with 1/(1/s), which is simply seconds.
(b) For 30ı, 45ı, and 60ı, the ITD values from Eq. (14.1) are 382, 540, and 661�s,respectively.
14.5: Localization is better in the horizontal plane in that it is possible to discrimi-nate between two locations that are closer together in the horizontal plane. A listenercan judge differences of about 1.5ı in the forward direction in the horizontal plane,but can only judge differences of about 4ı in the vertical plane.
14.6: The outer ear acts as a direction-dependent filter. As a result, a sound thatcomes from the back has a different spectrum, as it reaches the eardrum, comparedto a sound that comes from the front.
14.7: The most important frequencies in front–back localization are above 6,000 Hz.Older people tend to lose high-frequency hearing, and many of them do not hearfrequencies higher than 6,000 Hz. Because important speech frequencies are lowerthan 6,000 Hz, you would expect older listeners to lose front–back discriminationwhile maintaining good understanding of speech. Left–right (azimuthal) localiza-tion does not depend on such high frequencies. Low frequencies near 500 Hz tendto dominate.
14.8: According to the precedence effect, the first arriving sound determines theperceived location of the sound, even if later arriving sounds—early reflections andreverberation from a room—seem to point to different locations.
Chapter 15
15.1: Sound is transmitted through the wall by means of the studs. The drywallon the noisy side shakes the studs, and the studs shake the drywall on the otherside. Putting fiberglass insulation in the gaps between the studs does not change thissound transmission process at all and is not an effective noise reduction method.What is effective is to use a staggered-stud wall where no stud is in physical contactwith both sides of the wall. Once there is no contact between the wall surfaces itmakes sense to add the fiberglass absorber.
328 Answers to Exercises
15.2: Many rooms are acoustically bad because the heating, ventilating, air condi-tioning (HVAC) systems are poorly installed and make a lot of background noise.Other rooms may suffer from too much reverberation. Many environments havepublic address systems that are incorrectly adjusted or incorrectly used.
15.3: Compared to a plaster wall, a brick wall is not rough on an acoustical scale.The small bumps and valleys of a brick wall are not comparable to the wavelengthof audible sound, and they do not produce diffuse reflections.
15.4: Decibels again—just when you thought it was safe to forget about them. If99 % of the intensity is absorbed then 1 % of the intensity remains. The attenuationis found from the ratio of what remains to the initial amount. That ratio is 1 % or0.01.
Lremains �Linit ial D 10 log.0:01/ D �20:
15.5: Nuclear reactions boil water to make steam to turn a turbine to run a generatorto make electricity. Nothing about the final fate of all this energy is fundamentallychanged by this generating process.
15.6: T60 D 0:16 VAT
D 0:16 2000218
D 1:5 s.
15.7: To calculate the reverberation time using the Sabine equation we need thevolume and total absorbing area. The volume is easy: 6.3 by 7.7 by 3.6 or 174.6 m3.
The total absorbing area requires more work. There are two kinds of surfaces,plaster and vinyl on concrete. According to the table, the absorption coefficients at500 Hz are 0.05 and 0.03, respectively.
There are two walls 6.3 by 3.6 m, each with an area of 22.7 m2.There are two walls 7.7 by 3.6 m, each with an area of 27.7 m2.There is a ceiling and a floor, 6.3 by 7.7 m, each with an area of 48.5 m2.Therefore,
AT D 2 � 22:7 � 0:05C 2 � 27:7 � 0:05C 48:5 � 0:05C 48:5 � 0:03 D 8:92m2:
Then from the Sabine equation,
T60 D 0:16.174:6/=.8:92/D 3:1 s:
That is a long reverberation time. In fact, the description of the room corresponds toa reverberation room used in acoustical testing.
15.8: The purpose of a shower is to provide an environment for singing, and mostof the energy in the singing voice is below 500 Hz. We will assume that all surfacesare glazed tile and use an absorption coefficient of 0.01.
(a) Assume that the dimensions are 3 ft by 3 ft by 7 ft high. Assume that the showerhas a glass door that also has an absorption coefficient of 0.01. Then the volume is

Answers to Exercises 329
63 ft3, and the total absorbing area (AT ) is 4� 3� 7� 0:01C 2� 9� 0:01: The ATis thus 1.02 ft2.
Sabine’s formula involves V=.AT /, which is 63/1.02 or 61.8 ft. To use theformula we need to convert that dimension to meters, and we find 18.8 m. Thus,T60 D 0:16 � 18:8 D 3 s, and that makes a wonderfully long reverb time.Unfortunately, the human singer inside the shower adds absorption and reduces thereverberation time.
(b) Assume that everything is the same as in (a) except that there is no door. Theshower is open on one side and that leads to an additional absorbing area of 3� 7�1 D 21 ft2! Thus, T60 D 0:16 � 0:87 D 0:13 s, and that is no fun at all.
15.9: If all the absorption coefficients are 1.0, then 100 % of the sound is absorbed onthe walls. Such a room is an idealization and would be called “perfectly anechoic.”Alternatively, such a room is really no room at all because it behaves just like emptyspace. With 100 % of the sound absorbed there is no sound reflected back into theroom and the reverberation time is zero. But the Sabine formula says that T60 D0:16 V=.AT /, where AT would be the total surface area in the room (multiplied by1.0). All of the quantities are finite numbers, and the formula predicts a finite reverbtime, contrary to the truth about this unusual, ideal room.
15.10: First, it is assumed that volume and total absorbing area are computed inthe metric system. Then, the numerator (volume) has dimensions of cubic metersand the denominator (area) has dimensions of square meters, so the fraction hasdimensions of meters. In terms of a dimensional equation:
meters3=meters2 D meters:
15.11: The volume of B is 8 times the volume of A. The total absorbing area of B is4 times that of A. Consequently, the reverberation time of B is twice that of A.
Chapter 16
16.1: Charge is the basic quantity of electricity. Voltage is a force on a charge. Theforce of voltage causes charge to flow. Current is the rate of charge flow.
16.2: Both the dynamic microphone and the generator use the electromagneticgenerator principle to convert motion into an electrical voltage.
16.3: No, not possible. Although a permanent magnet, like the magnet in aloudspeaker driver or a steel compass needle, has no apparent electrical current thereactually is a microscopic current. On an atomic level the magnetism of a permanentmagnet is caused by tiny electron currents and spins in the magnetic material.
16.4: For the loudspeaker to operate, the electrical current comes from the poweramplifier and flows through the voice coil. The magnetic field comes from perma-
330 Answers to Exercises
nent magnets that surround the voice coil. The force is transmitted to the cone ordome of the speaker, having large surface areas, in order to move air creating anacoustical pressure wave.
16.5: The electron beam in the CRT is a flow of electrons, and that is a current.The loudspeaker has to have permanent magnets in order to work at all, and someof the magnetic field can leak out and cause a force on the beam in a nearby CRT.This is the motor principle, even though the current is not actually carried by a wire.The force bends the electron beam, which causes objects to appear in slightly wrongplaces on the screen, thus distorting the picture. Because of this effect, loudspeakersintended to go next to computer monitors are shielded to reduce the leakage ofmagnetic field.
16.6: The coil is wrapped around the magnet and there would seem to be no relativemotion between the wire of the coil and the magnet. Therefore, it would seem thatthe generator principle would not apply. However, we know that these pickups dowork, and so we have to look further. We begin by noting that the generator principleonly requires motion between the coil of wire and the magnetic field. That’s the key.What actually happens is that the motion of the steel guitar string close to the magnetof the pickup causes a small change in the amount of magnetic field that threads itsway through that magnet. Thus the magnetic field is changing, and the coil of wireis right there in the presence of this changing field. Thus a voltage is induced in thecoil of wire.
16.7: The coil is lighter than the magnet. Attaching the coil to the diaphragm, insteadof the magnet, would lead to less inertia and more relative motion between coil andmagnetic field.
16.8: (a) Physically, both the motor and the generator consist of a coil of wire in amagnetic field. The coil of wire is attached to a shaft which transmits mechanicalrotation. The wire has two ends, and an electrical current can flow in and out. Ifa current passes through the coil of wire, there is a force on the wire because ofthe motor principle. That force can turn the shaft. That makes a motor. It can doyour laundry or start your car engine. In the reverse operation, an external source ofmechanical energy turns the shaft, and a voltage is induced between the two endsof the wire because of the generator principle. (b) Yes, a loudspeaker can be used inreverse to serve as microphone. It’s easy to show if you connect the two terminalsof a loudspeaker driver (a woofer works very well) to the input to a sensitiveoscilloscope. If you then talk into the loudspeaker you will see the generated voltageon the ’scope.
16.9: When the wire of the voice coil melts it no longer carries any current. With nocurrent, the speaker cone feels no force and the loudspeaker driver makes no soundat all. The only practical remedy is to replace the driver, which could be expensive.

Answers to Exercises 331
Chapter 17
17.1: Both 60 and 50 Hz are low frequencies where the equal loudness contours arerising steeply. For such low frequencies, the lower the frequency the harder it is tohear. Therefore, the answer to this exercise is, Yes, all other things being equal itis harder to hear hum at 50 Hz than 60 Hz. There is more. Hum normally includessecond and third harmonics—possibly even stronger than the fundamental. Then,the fact that 100 Hz is harder to hear than 120 Hz, and 150 Hz is harder to hear than180 Hz also would make the European hum less objectionable.
17.2: In order to avoid distortion, the output of a power amplifier must have thesame shape as the input. When an amplifier is overdriven, the amplifier has reachedthe limit of its output voltage. It cannot produce a voltage that is high enough (ornegative enough) to capture the peak (or valley) required by the shape of the input.The resulting change in waveform shape is nonlinear distortion.
17.3: (a) Chords consist of many frequencies—the fundamentals and harmonics ofall the notes in the chord. Nonlinear distortion causes difference tones among allthese components in the chord. That leads to a mass of spectral components that arethe characteristic sound of the distorted rock guitar. (b) What sounds bad dependson the context. In heavy metal music distortion is used as an artistic device.
17.4: You should choose the 500-Hz tone (d). With the four sources available to you,you can only test for harmonic distortion. You will listen for spectral components inthe output that do not occur in the input. With the 500-Hz tone you will easily hearthe second and third harmonics at 1,000 and 1,500 Hz. The harmonics of the 5,000-Hz tone (c) are too high to hear easily. The complex tone (b) already has harmonicsin the input. Therefore, if harmonics are heard in the output you learn nothing. Thebroadband noise (a) has components at all frequencies and so distorted noise soundsjust like undistorted noise.
17.5: The fundamental frequency is 1,000 Hz.
17.6: Harmonic distortion products occur at 2,000, 3,000, 4,000, . . . Hz and 2,400,3,600, 4,800, . . . Hz. Important difference tones are f2 � f1 D 1200 � 1000 D200Hz, 2f1�f2 D 2000�1200D 800Hz, and 3f1�2f2 D 3000�2400D 600Hz.Important summation tones can be found by replacing the minus signs abovewith plus signs. Therefore, they include 2,200, 3,200, and 5,400 Hz. Physically,the summation tones have the same amplitudes as the corresponding differencetones, but the difference tones are much more audible. One reason for the greaterprominence of the difference tones is that the difference tones have frequencies thatare lower than the input sine tones and so they are not as efficiently masked by theinput sine tones.
17.7: When frequencyf2 increases from 1,200 to 1,250 Hz, the difference tone 2f1�f2 decreases from 800 to 750 Hz. If this difference tone is prominent, it may evenchange a listener’s perception from an upward pitch change to a downward change.

332 Answers to Exercises
17.8: Assuming that the tolerable distortion is 0.1%, the dynamic range is 90�10 D80 dB.
17.9: Fundamentally, there is no difference between the 60-Hz electrical powerfrom the outlet in the wall and a 60-Hz audio signal from a power amplifier. Bothare called “alternating current,” both have the same waveform (sine wave) andfrequency. The 120-V power from the wall has an amplitude of 120
p2 D 177V.
That is much higher the voltage used to drive loudspeakers in a home audio system,normally only a few volts. Therefore, a home audio system does not have enoughpower to run a toaster (about 1,000 W). On the other side, if you were to plug astandard loudspeaker into a wall outlet, you would be driving the loudspeaker at arate of .120/2=8 D 1800W . . . briefly . . . because the loudspeaker coil would burnout very quickly.
17.10: (a) The tall peaks in the spectrum have frequencies that are integer multiplesof 350 or 450 Hz. They occur at 700, 1,050 Hz, . . . and 900, 1,350 Hz . . . These areharmonics which tells you that there are two periodic waveforms here.(b) It’s a good bet that there are two physical horns, each one making a periodicwave.(c) The frequency ratio is 450/350 or 1.286. Table D1 indicates that the closestmusical interval is an equal-tempered major third with a ratio of 1.26.(d) If we define tall peaks as peaks that are no smaller than 20 dB less than the�60 dB peak (i.e. 20 dB down) at 350 Hz (i.e. 20 dB down), then all the peaks areaccounted for by assuming that they are harmonics.(e) If we decide to include all the peaks higher than the 30-dB down point, then wesee distortion components at frequencies (Hz) given by 2f1 � f2 D 250, f1 C f2 D800, 41 � f2 D 950, 3f1 C 2f2 D 1950, 4f1 C 2f2 D 2300, 3f1 C 3f2 D 2400,6f1Cf2 D 2550. There are probably more difference tones too, but they are maskedby low frequency noise—likely wind noise. Interestingly, all the smaller peaks canalso be accounted for with combination tone formulas like those above but differentintegers, sometimes large integers.
Chapter 18
18.1: The amplifier consists of a source of voltage that may be positive or negative.This voltage initially comes from positive and negative power supplies, which arethe most massive part of the amplifier. The positive and negative voltages from thesupplies represent the largest magnitudes of voltage that the amplifier will ever beable to produce. What the output voltage actually is at any given time is determinedby the input signal, which can have a voltage that is much smaller than the outputvoltage. The process of controlling a large output voltage with a small control signalis called amplification, and it is normally accomplished with transistor amplifiers orintegrated circuits that contain transistors.
18.2: (a) 20 log.100/ D 40 dB. (b) 20 log.1000/ D 60 dB.

Answers to Exercises 333
18.3: For an 11-band, octave-band equalizer, the center frequencies of the bands,starting at 20 Hz, would be 20, 40, 80, 160, 320, 640, 1,280, 2,560, 5,120, 10,240,20,480 Hz.
18.4: A valve is a device that controls a flow. A water valve turns the water on andoff and regulates its flow. It’s natural to refer to a vacuum tube as a valve becauseit can control the flow of electrical current in the output circuit by means of a smallinput voltage.
18.5: (a) The car radio has a tuner, preamplifier, tone controls, and power amplifier.It may have a CD drive. (b) The boom box is the same as the car radio but includesloudspeakers too. (c) A desk top computer has a CD drive and a sound card thatincludes a preamplifier for microphone input. A desk top computer normally isconnected to speakers that include their own power amplifier. (d) A lap top computerhas everything on the list except for a tuner and tone controls. (e) A camcorder has amicrophone, preamplifier, a tiny power amplifier, and a tiny speaker. Digital cameraswith audio are the same.
18.6: There is a school of audio recording that advocates tight mikeing whereby alarge number of microphones are placed all around the orchestra to make close-uprecordings of individual instruments or groups of instruments. Dozens of individualrecordings feed separate channels of a mixer where they can be adjusted to taste andmixed with the signals from other microphones that have been placed to capture theambiance of the environment. One can easily use 40 microphones and 40 channels.
Chapter 19
19.2: Choose a resonance frequency for the enclosure that is somewhat less than60 Hz. By boosting frequencies where the driver is weak, you can extend the bassresponse of the system to lower frequencies.
19.3:
For Exercise 19.3. Three-way loudspeaker. The crossover has one input and three outputs From
top to bottom, the drivers are tweeter, midrange, and woofer
19.4: Efficiency is output power divided by input power. For A: 1:5=20 D 7:5%. ForB: 1=14 D 7:1%. Thus A is slightly more efficient, but for all practical purposes the

334 Answers to Exercises
two speakers have equivalent efficiency. [10 log.7:5=7:1/ D 0:2 dB—an inaudibledifference.]
19.5: To calculate the output of the speaker in dB SPL we imagine that we put1 W into the speaker. Then, from the description in Exercise 4, we expect to get1/14 acoustical watt out of the speaker. To calculate the level of sound produced weimagine that this power, 1/14 W, is distributed over the surface of a sphere that is 1 min radius. We further assume homogeneous distribution. The area of a sphere withradius R is given by 4�R2. For a 1-m sphere that is 12.6 m2. A power of 1/14 Wspread over a surface of 12.6 m2 is an intensity of 5.68 mW/m2. The threshold ofhearing is 10�12 W=m2 or 10�9 mW=m2. Therefore, the level is
10 log.I=I0/ D 10 log.5:68=10�9/ D 97:5 dB SPL
From a physical point of view this seems like a strange way to quote an efficiency,but it has obvious practical value to the speaker designer who wants to know howloud the speaker is going to sound.
19.6: Near the origin, where signal levels are low, the slope of part (b) appears to beabout the same as the slope of part (a). Maybe (a) and (b) are really supposed to bethe same device, but (b) is defective in some way.
19.7: At low frequencies the wavelength is long and the ratio of wavelength to drivercone diameter is large. That is the condition for good diffusion, and so you expectthe frequency response for 45ı to be similar to the response for 0ı. Similar responseat high frequencies would violate the rule for wave diffraction.
19.8: The plot shows that compared to the response at a mid frequency like 0.5 kHz,the response at the low frequency of 0.05 kHz has rolled off by about 6 dB.
Chapter 20
20.1: Obviously the two statements are equally accurate.
20.2: For a three-bit word, N D 3. From the formula we expect there to be eightpossible values of the signal. These are:
000 001 010 011 100 101 110 111:
In a system with positive numbers only, these represent the numbers 0, 1, 2, 3, 4, 5,6, and 7 respectively.
In the audio standard that uses negative numbers, these represent the numbers 0,1, 2, 3, �4, �3, �2, and �1 respectively.
20.3: If there are 44,100 samples per second per channel and there are two channelsin a stereo recording, then stereo requires 88,200 samples per second. If there are 16
Answers to Exercises 335
bits in a sample, then a stereo recording requires 1,411,200 bits per second. If thereare 8 bits in a byte, then you can find the number of bytes by dividing the numberof bits by 8 or 176,400 bytes per second.
These values of the data rate apply to the compact disc format, which uses nodata compression. Data compression techniques can greatly reduce the data rateand storage requirements, but information is lost in that process. In actuality, thecompact disc format requires a higher data rate than we have calculated because thisformat includes redundant information that enables the playback system to recoverfrom errors in reading the data. The error correction codes need to be added to theminimum set of data represented by 88,2000 samples per second.
20.4: If the sample rate is at least twice the highest frequency, then there must be atleast two samples for every cycle.
20.5: The telephone uses only a single channel (no stereo telephone) and the samplerate needs to be twice the maximum frequency or 10,000 samples per second.
20.6: Digital electronic music synthesizers compute the musical waveform from aformula, as controlled by the musician. This music has no existence as an analogwaveform until it is converted to an audio signal by a DAC.
20.7: Reasonable people can differ on this question, but an important argument forthe analog vinyl recording is that the ET s will quickly recognize what it is andfigure out how to play it back. By contrast, information in the compact disc formatis highly encoded and is further complicated by error correction codes, redundancychecks, and added data outside the audio domain. Getting the information off acompact disc requires that the reader have knowledge of these arbitrary encodingconventions or somehow figure out what they are. If we want the ET s to be able toread the compact disc we had better hope that they are very clever.
20.8: Because loudspeakers and headphones receive an analog signal from a poweramplifier, it is hard to see how the format of the original program material—digitalor analog—could matter at all. “Digital ready” would seem inappropriate.
20.9: Unless the sampling of the signal is somehow synchronized with periodicityin the signal itself (an unlikely event) the errors made by quantization are randomlyvarying like noise. We normally reserve the term “distortion” to describe asystematic, time-independent deformation of a waveform which would be the sameon each cycle of a periodic signal.
20.10: (a) 28 D 256. Thus, 256 different values. (b) 20 log.256/ D 48. Thus thesignal to noise ratio is 48 dB. That is not nearly good enough for audio. Oldertechnologies, such as vinyl disks and magnetic tape, have better signal to noiseratios than that 20:11 W 1C 4C 8C 32C 64 D 109:
20.12: A byte for the number 85 is 0101 0101. It is 1C 4C 16C 64.
20.13: Commercial analog recordings of music were frequently copied, but eachgeneration had more noise than the previous generation. This loss of quality inreproductions caused consumers to buy original recordings. Digital recordings

336 Answers to Exercises
do not suffer this sequential degradation, and that makes frequent copying moreattractive. Nevertheless, sharing files among friends had little effect on the musicindustry. What really changed the game was the Internet which made it possible formillions of people to share the same digital music file. The battle between consumersand the industry raged throughout the first decade of the twenty-first century.
20.14(c): Digital technology cannot be acausal in the truest sense. However, if wemake a continuous recording of a sound and are willing to delay the output of theprocessing by 10 ms, we can look ahead 10 ms in doing the processing.
Chapter 21
21.1: The wavelength is given by � D c=f , where c is the speed of light. Therefore,for 1 MHz, (a) � D 3 � 108=106 D 3 � 102 D 300m. For a frequency of 1011 Hz,
the wavelength is (b) � D 3 � 108=1011 D 3 � 10�3 D 0:003m.
21.2:
For Exercise 21.2
21.3: 6;000;000=30;000 D 200 times wider.
21.4(c): An AM receiver is sensitive to the amplitude of the signal and when noiseis added to the signal the amplitude includes that noise. A FM receiver is sensitiveto the phase of the signal, particularly the rate of change of that phase. It is notsensitive to changes in the amplitude of the signal. When noise is added to the signalit apparently has less effect on the phase than it does on the amplitude.
21.5: Back row of the opera: The time required for a sound wave to go 150 ft can befound from the speed of sound, 1.130 ft/ms. The delay to the back row is therefore150=1:130D 133ms.Broadcast: Because the circumference of the earth is about 36,000 km, any twopoints on the surface of the earth are separated by no more than 18,000 km. A radiowave goes that far in 18; 000=.3 � 105/ D 60ms. Adding at most 20 ms for the

Answers to Exercises 337
acoustical paths from singer to microphone and radio to you leads to no more than80 ms. Therefore, you hear the singer before the audience in the back row.
21.6: To transmit audio or video information via a radio-frequency carrier, thecarrier must be modulated. When the carrier is modulated it acquires sidebands.Although a carrier by itself is only a single frequency, transmitting the sidebandsrequires a frequency region or band. No other transmission can use that frequencyregion without causing interference. To avoid chaos, the use of frequency bandsmust be regulated. In the USA, for example, radio bands are assigned by the FederalCommunications Commission, part of the Department of Commerce. The greaterthe rate of transmitting information, the faster the modulation needs to be. Highmodulation frequencies lead to large bandwidth. Because bandwidth is a scarcecommodity, information transmission itself becomes scarce, and economic factorsapply. This rule is completely general. It does not matter if one is transmitting audioby AM radio or if one is transmitting digital data by modulating an optical carrier(light beam). The rule is the same: Information transfer requires bandwidth.
21.7: A lightning bolt produces a brief intense burst of electromagnetic radiation.This leads to static in radio reception. Because it is a pulse, static has a broadspectrum. Thus, the power is spread over a wide frequency range. The tuned circuitat the front end of a radio receiver eliminates all of that broad spectrum exceptfor the narrow band that happens to coincide with the desired signal. But since thesignal is deliberately put in that band, whereas the static is only accidently in thatband, the signal normally dominates the static. But not always—AM broadcasts arefrequently interrupted by static.
21.8: Yes, there is agreement. For example, channels 7–13 must fit into a band witha width of 216 � 174 D 42MHz. Because there are seven channels, 7, 8, 9, 10, 11,12, and 13, they will fit if each of them is 42/7 or 6 MHz in width.
Chapter 22
22.2: Lung capacity is 1.32 gallons or 5.28 quarts.
22.3b: B and V are voiced plosives.
22.4: The nasals can be made with the lips tight shut, but a listener may not knowwhich nasal is being pronounced. There is also a nasal aspiration, not on the listof phonemes, as in “hmmmm.” Although these closed-lips phonemes would seemto have minimal content, a lot of information can be transmitted by pitch changesduring phonation.
22.5: In theory, all vowels might sound the same if played backward, but speakersof English tend to make diphthongs out of all vowels, more or less dependingon regional accents. By their nature, these diphthongs sound different if playedbackward. For standard American speech (e.g. network TV announcers) the EE andthe OO tend to be the same backward and forward.

338 Answers to Exercises
22.6: The great thing about answering questions like this one is that you don’t haveto know anything new. Just make the sounds and report what you do. The sequencegoes from front to back.
22.8: There is no reason to change. The spoken vowel and whispered vowel bothhave the same formants as determined by the articulatory structures—mouth, lips,tongue. The difference between speaking aloud and whispering is only in thedifferent excitation source from the lower parts of the vocal tract.
22.9: Low fundamental frequencies and high formants occur for cartoon charactersin films and TV ads. For instance, there’s the baby who smokes cigars.
22.10: The vowels have the most energy and appear darkest on the spectrogram.They have formants—alternating dark and light bands as a function of frequency.Formant transitions appear as dark bands that slide from a higher frequency range toa lower frequency range or vice versa. Fricatives appear as noise, broadband, or highfrequency. They do not show formant structure—there is only one main frequencyband. Plosives are like fricatives but they are brief and don’t occupy much time onthe horizontal axis.
Chapter 23
23.1: The trumpet player calls the notes “C,G,C,E,G,C”—the notes of a bugle call.Their frequencies are: 233, 349, 466, 587, 698, and 932 Hz.
(a) The notes called C correspond to frequencies: 233, 466, and 932. Each one istwice as high (factor of 2) as the previous one. A factor of two in frequency is anoctave.
(b) FromC4 toG4 is a ratio 349/233 = 1.498. FromC5 toG5 is a ratio 698/466 = 1.498.These intervals are close enough to 3/2 = 1.500 to be good intervals of the fifth.
23.2 (c): For G4: Resonances 3 and 6. (Resonance 9 is on the high side.) For C5:Resonances 4 and 8. For E5: Resonances 5 and 10. For G5: Resonance 6. (Thesecond harmonic falls between resonances 11 and 12.) For C6: Resonance 8.
23.3: The resonances of a bugle are at successive integer multiples (2, 3, 4, . . . )of a (nonexistent) base frequency. A cylindrical pipe that is open at both ends alsohas resonance frequencies that are successive integer multiples of a base frequency(Chap. 8). In that sense, the two systems are similar. However, the bugle is not acylindrical pipe. It gets its harmonically related resonances from its bell.
23.4: If we represent a closed valve by the symbol 1 and an open valve by a symbol0 then the possible positions can be represented by the answer to the first part ofExercise 20.2, namely:
000 001 010 011 100 101 110 111:
The missing configuration is 001, where only the third piston is depressed.

Answers to Exercises 339
23.5: A tube with a flaring bell and mouthpiece is really quite different from acylindrical pipe open at one end and closed at the other. The frequencies of thebasic cylindrical pipe are substantially altered when the bell is added. Therefore, wecannot answer this question by appealing to the formula .v=4L/ � .2n C 1/ for theresonances of a cylindrical pipe.
A better answer appeals to the idea of scaling. Suppose that a trombone wereabsolutely identical to a trumpet except that every dimension of the trumpet ismultiplied by 2 to make a trombone. Then every resonance of the trombone would bethe same as the resonance of the trumpet except that the trombone resonance wouldoccur for a wavelength that is twice as long. Doubling the wavelength reduces thefrequency by an octave, and that would cause the trombone to sound an octave lower.In fact, the trombone is close enough to a scaled trumpet that this scaling argumentis valid. It may strike you as surprising that the trombone is a scaled trumpet. Thetwo instruments don’t look the same. The trombone has a slide and the trumpet hasvalves. Acoustically, however, both are cylindrical tubes with flaring bells on theend. Whether extra cylindrical tube is added by extending a slide or by operating avalve is acoustically less important.
23.6: First, refer back to Exercise 23.2. The trumpet player and trombone player usethe same resonances of the instrument. The instruments sound different because theresonances of the trombone are an octave lower than the trumpet. By contrast theFrench horn player uses higher-numbered resonances. Even though the instrumentmay be as long as a trombone, the playing frequencies are not low like a trombone.Using the higher-numbered resonances leads to notes of higher frequency.
23.7: Dents in a beat up bugle are small and don’t change the basic shape of theinstrument. They do change the details. The low frequency modes, which are mostimportant in determining the playing frequency, have long wavelengths and they arenot much affected by the dents. Dents can mistune the high-frequency modes andcause them not to line up well with harmonics of the tones. When high-frequencymodes do not support the upper harmonics of the tone, a brass instrument soundsdull or stuffy.
23.8: Bozo is wrong as usual. The player does not voluntarily move his lips at arapid rate. He uses his lip muscles to set a favorable lip configuration inside themouthpiece. After that, his lips vibrate rapidly under the influence of a more orless steady stream of air. Vibration caused by a steady stream is fairly common.Venetian blinds will rattle in a steady breeze. The nozzle of a balloon may vibrateas air comes out of the balloon. You can blow a steady stream of air through yourmouth and trill your tongue. The brass instrument player’s lips do the same kind ofthing, except their motions are organized by the influence of the horn. Of course,setting a configuration that favors lip vibration is not trivial. When a beginner firsttries a brass instrument, he is likely to get no sound out of it at all—no lip vibration.
23.9: The resonance curves, such as those in Fig. 23.6, come from the linearresponse of the instrument itself . . . no musician involved. To measure this responseyou arrange to have a sinusoidal oscillating flow of air into the instrument so that

340 Answers to Exercises
the amplitude of the flow (measured in cubic centimeters per second) is constant asthe frequency of the oscillations changes. Then you measure the response, whichis the amplitude of the pressure oscillations in the mouthpiece. That response lookslike Fig. 23.6, which can fairly be called a resonance curve because it shows a ratioof output to input as a function of input (driving) frequency. To use a more technicalterm, you can say that you have measured the magnitude of the “input impedance”of the horn as a function of frequency. Having found this linear response, we cannow add the musician. We imagine a musician with lips of steel who can maintaina steady flow of air into the instrument through a fixed opening between his lips.Then the pressure in the mouthpiece would be proportional to the flow. But the realmusician does not have lips of steel. Instead, the opening depends on the pressure inthe mouthpiece. In the end, the resulting pressure in the mouthpiece depends on theresulting pressure in the mouthpiece, and that is a nonlinear process. The nonlinearprocess causes the lips to buzz at a frequency and with a waveform determined bythe feedback from the horn with its tuned resonances.
Chapter 24
24.1: (a) For a tube like this, the resonances are given by the formula .v=4L/ �.2n C 1/. (Recall Chap. 8.) The odd-numbered resonances create odd-numberedharmonics in the tone. The clarinet actually differs from a cylinder because it hasa bell, and because it has holes bored into its wall. Even if the holes are closed,they represent irregularities in the wall surface. Also the mouthpiece is tapered,and that is another irregularity. These irregularities are responsible for the even-numbered harmonics in the higher register of the clarinet. For the low register thewavelengths of low-numbered harmonics are long enough that the irregularities arehardly noticed. Then the ideal cylindrical pipe, with odd-numbered resonances only,is a better approximation to the real clarinet.
(b) If v=.4L/ D 147, where v D 344m/s, thenL D 344=.4�147/, andL D 0:585m.
24.2: Consider the pressure waves for the first and second modes of a cylindricalpipe, open at one end and closed at the other, as shown in Chap. 8. One third of theway from the closed end the second mode has a node. If a hole is opened at thispoint in the pipe, nothing is changed so far as the second mode is concerned. Thestanding wave pattern for this mode has ordinary atmospheric pressure at that pointwhether the hole is there or not. Now consider the first mode. The first mode requiresconsiderable pressure variation at the point that is one-third of the distance from theclosed end. The first mode cannot survive with a hole at that point. Therefore, theregister hole kills off the first mode while not affecting the second mode (frequencyof three times the first).
24.3: For an open–open pipe the frequency of the fundamental is v=2L. For anopen–closed pipe the frequency of the fundamental is v=4L. There’s the octave.

Answers to Exercises 341
24.4: From the study of Fourier analysis we know that waveforms that changeabruptly in time have high-frequency components. Just imagine all the highfrequencies it takes to synthesize a waveform that has a sharp corner. The abruptclosing of a double reed leads to a waveform with sharp corners. The relativelyintense harmonics with high-harmonic number lead to a bright sound. Renaissancedouble reed instruments like the krumhorn make such an impulsive waveform thatthe high harmonics are very numerous and very intense. As a result such instrumentsare more than bright—they are buzzy.
24.5: (a) The free reeds and the vocal folds both vibrate at frequencies determinedonly by themselves, without any feedback from a resonator. The saxophone reedvibrates at a frequency that is largely determined by feedback from the horn. (b) Ina double-reed instrument like the oboe, the two reeds vibrate against one another—like the two halves of the vocal folds.
24.6: For a pipe open at both ends the playing frequency should be f D v=.2L/. Forthe flute, f D 344=1:2 D 287Hz. From Appendix E, you find that this frequencyis between C]4 and D4. In fact, the head joint—a tapered extension of the flute—adds some effective length, and the lowest note on the flute is actually C4 with afrequency of 262 Hz.
24.8: Hints: Use v D 34; 400 cm/s, and V D .4=3/�r3, where r is the radius of thesphere. Use the approximation for the tone hole radius a D r=2, and remember thatdiameter Dis twice r . Then turn the algebraic crank on Eq. (24.2) for the necklessHelmholtz resonator.
24.9: Remember what you learned in Chap. 13 about the pitch of a periodic tonewith a missing fundamental.
24.10: (a) The fundamental appears to be about 262 Hz. (You can get good accuracyby finding the 10th harmonic and dividing its frequency by 10.) Appendix Eshows that the closest note is C4 (261.6 Hz), called “middle C.” (b) One can see19 harmonics out to 5,000 Hz. (c) The spectral components seem to be regularlyspaced as expected for a harmonic spectrum, and so one expects the tone tobe periodic (period = 1/262 s). (d) The second harmonic seems to be about 6 dBhigher than the fundamental. For harmonica tones, the second harmonic is alwaysstrong, as expected for a free-reed instrument, but it is not always stronger thanthe fundamental. (e) The 12th harmonics seems to be 3 or 4 dB higher than thefundamental. That makes the harmonica a highly unusual instrument. For mostinstruments in their melody-range, harmonics as high as the 12th are much weakerthan the fundamental. The strong high harmonics for the harmonica lead to thecharacteristic reedy sound.

342 Answers to Exercises
Chapter 25
25.1: From the formula f D v=.2L/ we find that the speed of sound is v D 2Lf D2 � 346 � 440= 304,480 mm/s or about 304 m/s.
25.2: The lengths are 346, 326.6, 308.2, 290.9, 274.6, 259.2, 244.6, and 230.9 mm.The successive differences are 19.4, 18.4, 17.3, 16.3, 15.4, 14.6, and 13.7 mm. Thesedifferences are similar but not the same.
Note: The frequencies of the scale do not grow linearly—they grow geometri-cally with a common ratio. The frequencies of the string do not vary linearly withstring length—they vary in a reciprocal way. Both these nonlinear functions producegreater frequency differences for greater frequencies.
25.3: For both the violin and the voice, there is a source and a resonator. Thesource vibration pattern and frequency are very little affected by the resonator.Source and resonator are largely independent in their operations. The role of theresonator is to filter and radiate the sound. The resonator has many peaks andvalleys in its response function, which is responsible for the tone color. When atone is played or sung with vibrato (periodic frequency modulation), the resonanceslead to a frequency-modulation-induced amplitude modulation of the harmonics.This relationship between source and resonator is very different from a windinstrument, either brass or woodwind, where the resonator provides feedback thathelps determine the vibrating frequency of the source.
25.4: Your graph should show about five or six cycles of a sine wave with anamplitude of about 12 Hz, hence extending from 380 to 404 Hz.
25.5: The acoustic guitar needs to radiate energy so that it can be heard. Thebridge and top plate are designed to radiate efficiently. As the energy is radiatedthe string vibration is damped. The electric guitar does not need to radiate energy.The transducer that produces the electrical signal draws almost no energy from thestring. The body of an electric guitar is solid and not designed to vibrate or radiate.Therefore, the string on an electric guitar is not damped by radiation.
25.6: It is true that the playing frequency depends on the timing of the stick–slipprocess, but the timing of the stick and slip depends on the motion of the kink alongthe string. The timing of the kink motion depends on the length of the string and thespeed of sound on the string, not on the stickiness of the bow.
Chapter 26
26.1: fn=f1 D Œ.2n C 1/=3:011�2. Therefore, f2=f1 D 2:76, f3=f1 D 5:40, andf4=f1 D 8:93.
26.2: Doing the squares leads to 81, 121, and 169. Forming the ratios leads to81=81 D 1, 121=81 D 1:494, and 169=81 D 2:086. The relative ratios are not

Answers to Exercises 343
changed by multiplying by 2 to get 2, 2.988, and 4.172. The listener interprets thesespectral components as 2, 3, and 4 times a (nonexistent) fundamental frequency.
26.3: Adding a second drum head leads to a greater number of different frequenciesin the radiation, essentially twice as many. The denser spectrum of unrelatedcomponents leads to a sound that is less tonal.
26.4: As your mother often told you, dinner plates of all kinds make bad musicalinstruments. Paper plates are particularly unsuccessful because of internal dampingof vibrational waves in the plate material. A paper plate is soft, and vibrations insoft material are quickly converted into heat.
26.5: The modes are: [4,1], [4,1], [5,1], and [6,1].
26.6: The figure shows the standing waves on the rim of the bell for a mode withfour meridian lines, like the “octave.”
For Exercise 26.6
Chapter 27
27.1: A patch to create an amplitude-modulated signal is made from two sinefunction generators and a voltage controlled amplifier:
For Exercise 27.1
The control voltage to the voltage-controlled amplifier must be positive. Therefore,the output of function generator “2” must be offset so that it does not go negative.
344 Answers to Exercises
27.2: 100; 000; 000=44; 100 D 2267:6. Hence, 2,267 operations, even without anyparallel processing.
27.4: Pitch and pitch variation are essential elements in music expression. Guitaristsbend notes and violinists play with vibrato. It’s not surprising that synthesistechniques pay a lot of attention to pitch. (a) The depth of vibrato often increases asa tone is sustained. The modulation controller gives a performer the control to dothat. (b) Without bending the pitch of notes, you cannot sing the blues . . . or anythingelse.
27.5: A computer naturally handles data. A computer makes a great sequencerbecause programs can be written to display control data as musical notes and to editthe data. With a special interface, the computer can put out data at precise times.Computers do not excel in making waveforms. The sound cards inside personalcomputers are always a compromise.
�

Index
Aabsolute pitch, 143absorption, 157,165aftersound-piano, 262air pressure, 40alphabet-Greek, 305amplification, 192amplitude, 10amplitude modulation, 221analog concept, 173analytic listening, 144answers-exercises, 307 ffaperiodic, 92argument-function, 12ASCII, 94atmospheric pressure, 40audible frequencies, 14audio, 169ffauditory nerve, 117
Bbaffle, 204bandwidth, 95, 222baritone horn, 240baroque, 287bars, 270, 277basilar membrane, 113, 132bass reflex, 205bass viol, 262bassoon, 250, 292beats, 56bells, 276, 277binaural beats, 149bits, 213boatswain pipe, 253, 255Boston Symphony Hall, 84
bowed strings, 262, 291brass instruments, 237ffbridge - violin, 265bugle, 238,byte, 218
Ccar horn, 106, 187carrier wave, 221cathode ray tube, 31causality, 212, 218cello, 262, 291charge-electrical, 169chimera, 236chimes, 271, 277Chladni patterns, 273clarinet, 84, 247, 254, 292cochlea, 112cochlear implants, 120cochlear nucleus, 118comparisons - quantitative, 4complex waves, 87, 138composers, 287compression - data, 216compression, 131,136, 195concert pitch, 297Corti, 113critical band, 134current-electrical, 170,cymbals, 275
Ddamping, 17decibels, 102destructive interference, 54
W.M. Hartmann, Principles of Musical Acoustics, Undergraduate Lecture Notesin Physics, DOI 10.1007/978-1-4614-6786-1,© Springer Science+Business Media New York 2013
345

346 Index
dial tone, 59, 303difference tones, 184, 186differences-quantitative, 4diffraction, 62, 202diffuse reflection, 61digital audio, 211ffdigital media, 212displacement, 9distance perception, 153distortion, 180ffdrums, 273, 277dynamic range, 185
Eedge-tone instruments, 251ffelectricity, 169ffelectro-optical, 176electrostatic, 175emissions-cochlear, 118end correction, 80equal loudness contours, 126,135equal temperament, 294equalizer, 194equilibrium, 9excitation pattern, 131expressionists, 288extraterrestrials, 218
Ffan-bathroom, 136filters, 93, 280fipple, 251flanging, 283flute, 253, 255, 292focused sound, 161formant, 231, 234Fourier, 85free reed, 248French horn, 241, 292frequency, 12frequency counter, 34frequency modulation, 222, 266frequency response, 201, 209fricatives, 233, 236function generator, 35
Ggamma rays, 124generators, 173glass-wine, 23
gongs, 275Greek alphabet, 305Greenwood, 116guitar, 71, 178, 184, 259ff, 291guitar-electric, 330
Hharmonica, 255harmonics, 72, 230harp, 292headphones, 60, 174hearing aids, 119helium, 52, 319Helmholtz, 29Helmholtz resonator, 252horn-car, 187hum, 186
Iimpressionists, 288inharmonic, 92inner ear, 111,115integrated amplifier, 196intensity, 99interaural differences, 146ffinterference, 54intermodulation, 184intervals - musical, 295inverse square law, 100
JJust tuning, 293
Kkalimba, 27kettledrum, 274keyboard, 294
Llarynx, 229linear response, 201, 299linearity, 30litre, 228localization of sound, 145fflogarithm, 103longitudinal, 41loudness, 125ffloudspeakers, 174, 179, 201fflungs, 227, 235

Index 347
MMach number, 42, 50magnetic tape, 172magnetism, 171magnitude estimation, 130marimba, 271membranes, 272Metropolitan Opera, 219, 224microphone, 174middle ear, 110,114MIDI, 284mixer, 58, 193modes of string, 70modes, 18Moog, R.A. , 285Morse code, 220Mossbauer, 124motors, 174mouth, 228MP3, 216mute-brass, 231mute-strings, 265
Nnasal cavity, 228, 235neural firing, 131Newton, 29nodes, 70, 78noise cancellation, 60noise immunity, 212noise, 179nonlinear distortion, 182Nyquist rule, 215
Ooboe, 250, 255, 292ocarina, 251octaves, 14Ohm’s Law, 91organ pipe, 84oscilloscope, 31outer ear, 109,114
Ppainful sound, 41pan flute, 81Pascal, 40percentages, 5percussion, 257, 269ffperfect pitch, 143period, 10
pharynx, 228phase - instantaneous, 13phase lead/lag, 13phase, 12phons, 126, 135piano, 261, 292piccolo, 254, 292pipe organ, 292pipes, 77ffpitch perception, 137ffplace theory, 137polarization, 41power amplifier, 190, 193power laws, 299power, 99powers of ten, 6preamplifier, 190, 194precedence effect, 151prefixes, 6pressure, 40psychophysics, 129public address system, 190Pythagoras, 29, 289Pythagorean tuning, 293
Qquadrant - trigonometry, 290quadraphonic, 210quantization noise, 214, 218
Rradio, 219ffratios, 4receiver, 196reflections, 61, 157ffrefraction, 62resonance, 23resonances - trumpet, 243reverberation, 161romantic, 287rooms, 157ff
SSabine, 162sampling, 215sawtooth, 32, 89saxophone, 248, 292semicircular canals, 113Shaq, 5simple harmonic motion, 11sine function, 289

348 Index
sine wave, 10sitar, 25slide whistle, 84sones, 130spectrogram, 234spectrum analyzer, 33spectrum, 22, 86, 133specular reflection, 61speech, 227ffspeed of light, 44, 219speed of sound, 42spring-mass, 10square law, 299standing waves, 67stiffness, 257 ffStradivarius, 266string - wound, 258string instruments, 257ffsubwoofer, 207summation tones, 184supersonic, 42swing, 310sympathetic strings, 23synthesis, 85synthesizer, 279ffsynthetic listening, 144
Ttamtam, 275tape recording, 172telephone, 59, 217, 303temperature scales, 50template theory, 140three-way loudspeaker, 333threshold of hearing, 126, 135time paradox, 218timing encoding, 116, 138timpani, 274tinnitus, 118tone control, 194tonotopic, 116, 143
trachea, 228transducer, 29transposing instrument, 244, 292, 338transverse, 41trigonometry, 289trombone, 240, 292trumpet, 238, 292tuba, 240, 292tuning, 293tuning fork, 20, 93
Uunit analysis, 48
Vvertical plane, 150vibraphone, 272vibrato, 266viola, 262, 291violin, 263, 291voice, 292voltage control, 281voltage, 170
Wwalls, 327wave addition, 21wavelength, 46wheels-modulation, 286woodwind instruments, 247ff
Xxylophone, 271
YYoung’s modulus, 258