ACOUSTICS AND NOISE CONTROL IN SPACE CREW ...
572
NASA/SP—2015–624 ACOUSTICS AND NOISE CONTROL IN SPACE CREW COMPARTMENTS Edited by: Jerry R. Goodman Former Chairman Space Shuttle and ISS Acoustics Working Group, and ISS Acoustics Lead Johnson Space Center, National Aeronautics and Space Administration Houston, Texas Ferdinand W. Grosveld, D.E. Acoustics Consultant Hampton, Virginia October 2015
-
Upload
khangminh22 -
Category
Documents
-
view
5 -
download
0
Transcript of ACOUSTICS AND NOISE CONTROL IN SPACE CREW ...

NASA/SP—2015–624
ACOUSTICS AND NOISE CONTROL IN SPACE CREW COMPARTMENTS
Edited by:
Jerry R. Goodman
Former Chairman Space Shuttle and ISS Acoustics Working Group, and ISS Acoustics Lead Johnson Space Center, National Aeronautics and Space Administration Houston, Texas
Ferdinand W. Grosveld, D.E.
Acoustics Consultant Hampton, Virginia
October 2015

NASA STI Program ... in Profile
Since its founding, NASA has been dedicated
to the advancement of aeronautics and space
science. The NASA scientific and technical
information (STI) program plays a key part in
helping NASA maintain this important role.
The NASA STI program operates under the
auspices of the Agency Chief Information Officer.
It collects, organizes, provides for archiving, and
disseminates NASA’s STI. The NASA STI
program provides access to the NTRS Registered
and its public interface, the NASA Technical
Reports Server, thus providing one of the largest
collections of aeronautical and space science STI
in the world. Results are published in both non-
NASA channels and by NASA in the NASA STI
Report Series, which includes the following report
types:
TECHNICAL PUBLICATION. Reports of
completed research or a major significant
phase of research that present the results of
NASA Programs and include extensive data
or theoretical analysis. Includes compila-
tions of significant scientific and technical
data and information deemed to be of
continuing reference value. NASA counter-
part of peer-reviewed formal professional
papers but has less stringent limitations on
manuscript length and extent of graphic
presentations.
TECHNICAL MEMORANDUM.
Scientific and technical findings that are
preliminary or of specialized interest,
e.g., quick release reports, working
papers, and bibliographies that contain
minimal annotation. Does not contain
extensive analysis.
CONTRACTOR REPORT. Scientific and
technical findings by NASA-sponsored
contractors and grantees.
CONFERENCE PUBLICATION.
Collected papers from scientific and
technical conferences, symposia, seminars,
or other meetings sponsored or
co-sponsored by NASA.
SPECIAL PUBLICATION. Scientific,
technical, or historical information from
NASA programs, projects, and missions,
often concerned with subjects having
substantial public interest.
TECHNICAL TRANSLATION.
English-language translations of foreign
scientific and technical material pertinent to
NASA’s mission.
Specialized services also include organizing
and publishing research results, distributing
specialized research announcements and
feeds, providing information desk and personal
search support, and enabling data exchange
services.
For more information about the NASA STI
program, see the following:
Access the NASA STI program home page
at http://www.sti.nasa.gov
E-mail your question to [email protected]
Phone the NASA STI Information Desk at
757-864-9658
Write to:
NASA STI Information Desk
Mail Stop 148
NASA Langley Research Center
Hampton, VA 23681-2199
This page is required and contains approved text that cannot be changed.

NASA/SP—2015–624
ACOUSTICS AND NOISE CONTROL IN SPACE CREW COMPARTMENTS
Edited by:
Jerry R. Goodman
Former Chairman Space Shuttle and ISS Acoustics Working Group, and ISS Acoustics Lead Johnson Space Center, National Aeronautics and Space Administration Houston, Texas
Ferdinand W. Grosveld, D.E.
Acoustics Consultant Hampton, Virginia
National Aeronautics and
Space Administration
Johnson Space Center Houston, TX 77058
October 2015
This page is required and contains approved text that cannot be changed.

Enter acknowledgments here, if applicable.
Click here: Press F1 key (Windows) or Help key (Mac) for help NASA Center for AeroSpace Information 7115 Standard Drive Hanover, MD 21076-1320 443-757-5802
National Technical Information Service 5301 Shawnee Road
Alexandria, VA 22312 703-605-6000
This report is available in electronic form at http://www.sti.nasa.gov

This page intentionally left blank

i
CONTENTS
CHAPTER I ACOUSTICS
Jerry R. Goodman and Ferdinand W. Grosveld
CHAPTER II NOISE CONTROL
Jerry R. Goodman and Ferdinand W. Grosveld
CHAPTER III ACOUSTICS AND NOISE CONTROL IN APOLLO
Jerry R. Goodman
CHAPTER IV ACOUSTICS AND NOISE CONTROL IN THE SPACE SHUTTLE ORBITER
Jerry R. Goodman
CHAPTER V ACOUSTICS AND NOISE CONTROL IN INTERNATIONAL SPACE STATION
Jerry R. Goodman and Ferdinand W. Grosveld
CHAPTER VI EUROPEAN NOISE CONTROL IN INTERNATIONAL SPACE STATION
Pietro C. Marucchi-Chierro and Ferdinand W. Grosveld
CHAPTER VII ACOUSTIC SPACEFLIGHT MATERIALS
Jerry R. Goodman and Charles Hill
CHAPTER VIII COMPENDIUM OF ACOUSTICS AND VIBRATION IN ENCLOSED VOLUMES
Ferdinand W. Grosveld

CONTENTS
ii
PREFACE AND INTRODUCTION .................................................................................................................... xi
BOOK DEDICATION ......................................................................................................................................xiii
ACKNOWLEDGEMENTS ............................................................................................................................... xv
BOOK OUTLINE ............................................................................................................................................ xxi
CHAPTER I ACOUSTICS
1. INTRODUCTION ...................................................................................................................................... 3
2. ACOUSTICS REQUIREMENTS .................................................................................................................. 4
2.1 Continuous Noise Limits ............................................................................................................... 5
2.1.1 Background ....................................................................................................................... 5
2.1.2 Discussion ......................................................................................................................... 6
2.1.3 Continuous Noise Limits ................................................................................................. 11
2.1.4 Sub-Allocations of Key Noise Contributors .................................................................... 14
2.1.5 Crew Quarters/Sleep Operations ................................................................................... 15
2.2 Intermittent Noise ...................................................................................................................... 16
2.3 Daily Exposure Limits ................................................................................................................. 18
2.4 Narrowband Component Limits ................................................................................................. 18
2.5 Ultrasound and Infrasound Limits .............................................................................................. 18
2.6 Hazardous Overall Noise Limits .................................................................................................. 19
2.7 Reverberation Time .................................................................................................................... 20
2.8 Alarms ........................................................................................................................................ 20
3. COMPLIANCE AND VERIFICATION ........................................................................................................ 20
4. CONCLUSIONS ...................................................................................................................................... 21
5. REFERENCES ......................................................................................................................................... 22
6. ACRONYMS .......................................................................................................................................... 25
CHAPTER II NOISE CONTROL
1. INTRODUCTION ...................................................................................................................................... 5
2. NOISE CONTROL PLAN ........................................................................................................................... 5
2.1 Noise Control Strategy ................................................................................................................. 6
2.1.1 Noise Sources ................................................................................................................... 7

NASA/SP-2015-624 – ACOUSTICS AND NOISE CONTROL IN SPACE CREW COMPARTMENTS – Goodman & Grosveld
iii
2.1.2 Noise Paths ....................................................................................................................... 8
2.1.3 Noise at the Receiver Location ......................................................................................... 9
2.2 Acoustic Analysis ........................................................................................................................ 10
2.3 Testing and Verification ............................................................................................................. 11
3. NOISE CONTROL DESIGN APPLICATIONS ............................................................................................. 11
3.1 Noise Control at the Source ....................................................................................................... 13
3.2 Path Noise Control ..................................................................................................................... 15
3.2.1 Mufflers, Resonators, and Other Absorbers .................................................................. 15
3.2.2 Combining Mufflers, Isolators, and Added Features in Fans and Other Noise Sources . 26
3.2.3 Airflow Concerns and Attenuation ................................................................................. 28
3.2.4 Isolators/Anti-Vibration Mounts and Treatments with Viscoelastic Materials.............. 29
3.2.5 Absorbing Material within Enclosures and Wraps, Covers, and Barriers ....................... 38
3.2.6 Other Material Options .................................................................................................. 43
3.2.7 Sealing of Pathways ........................................................................................................ 46
3.3 Noise Control in the Receiving Space ......................................................................................... 49
3.4 Post-Design Noise Mitigation ..................................................................................................... 54
4. CONCLUSIONS AND RECOMMENDATIONS .......................................................................................... 55
5. REFERENCES ......................................................................................................................................... 56
6. ACRONYMS .......................................................................................................................................... 58
CHAPTER III ACOUSTICS AND NOISE CONTROL IN APOLLO
1. INTRODUCTION ...................................................................................................................................... 6
2. COMMAND MODULE ............................................................................................................................. 6
2.1 Acoustic Requirements ................................................................................................................ 6
2.2 Command Module Crew Compartment Configuration ................................................................ 9
2.3 Preflight Acoustic Tests and Noise Control Efforts .................................................................... 13
2.4 Acoustics and Noise Control During Operational Flights ........................................................... 19
2.4.1 Apollo 7 ......................................................................................................................... 20
2.4.2 Apollo 8 ......................................................................................................................... 20
2.4.3 Apollo 9 ......................................................................................................................... 20
2.4.4 Apollo Missions 10-17 ................................................................................................... 20
2.5 Command Module Summary Discussion and Comments .......................................................... 21
3. LUNAR MODULE................................................................................................................................... 23

CONTENTS
iv
3.1 Acoustic Requirements .............................................................................................................. 23
3.2 Lunar Module Crew Compartment and System Configuration.................................................. 26
3.3 Preflight Acoustic Tests .............................................................................................................. 32
3.4 Lunar Module Acoustics and Noise Control During Operational Flights and During This Time Period ......................................................................................................................................... 32
3.4.1 Apollo 9, LM-3 (Launched March 1969)........................................................................ 32
3.4.2 Apollo 10, LM-4 (Launched May 1969) ......................................................................... 36
3.4.3 Apollo 11, LM-5 (Launched July 1969) .......................................................................... 36
3.4.4 LM-7 Acoustic Testing During Altitude Tests at Kennedy Space Center, 7 November 1969 .......................................................................................................... 37
3.4.5 Late 1969 Meetings and Efforts on Remedial Actions for the Lunar Module Cabin Noise ............................................................................................................................. 41
3.4.6 Lunar Module Test Article 8 Testing (November-December 1969) .............................. 46
3.4.7 Other Efforts on Lunar Module Noise Analysis, Testing, and Control .......................... 49
3.4.8 Apollo 12, LM-6 (Launched November 1969) ............................................................... 50
3.4.9 Apollo 13, LM-7 (Launched April 1970) ........................................................................ 50
3.4.10 Apollo 14, LM-8 (Launched January 1971) .................................................................... 50
3.4.11 Apollo 15, LM-10 ........................................................................................................... 51
3.4.12 Apollo 16, LM-11 ........................................................................................................... 51
3.4.13 Apollo 17, LM-12 ........................................................................................................... 51
3.5 Summary Comments Lunar Module Acoustics and Noise Control ............................................ 51
4. DISCUSSION, CONCLUSIONS, AND RECOMMENDATIONS ................................................................... 53
5. REFERENCES ......................................................................................................................................... 55
6. ACRONYMS .......................................................................................................................................... 59
APPENDIX A: LUNAR MODULE-7 ACOUSTIC ALTITUDE TESTS AT KENNEDY SPACE CENTER, 7 NOVEMBER 1969 .............................................................................................................................. 60
CHAPTER IV ACOUSTICS AND NOISE CONTROL IN THE SPACE SHUTTLE ORBITER
1. INTRODUCTION ...................................................................................................................................... 5
2. INITIAL ORBITER ACOUSTIC REQUIREMENTS ........................................................................................ 5
2.1 Continuous Noise ......................................................................................................................... 6
2.2 Intermittent and Short Duration Noise ........................................................................................ 7
3. SPACE SHUTTLE ORBITER CONFIGURATION .......................................................................................... 8
4. NOISE CONTROL DESIGN APPLICATIONS DURING INITIAL ORBITER DEVELOPMENT .......................... 12

NASA/SP-2015-624 – ACOUSTICS AND NOISE CONTROL IN SPACE CREW COMPARTMENTS – Goodman & Grosveld
v
4.1 Source Control ............................................................................................................................ 14
4.2 Path Control ............................................................................................................................... 16
4.3 Noise Control at the Receiver Locations .................................................................................... 26
5. UPDATED OFT AND OPERATIONAL ORBITER ACOUSTIC REQUIREMENTS ........................................... 30
6. NOISE CONTROL DURING OPERATIONAL FLIGHTS .............................................................................. 34
7. FINAL ORBITER ACOUSTIC REQUIREMENTS ......................................................................................... 51
8. NOISE CONTROL DESIGN APPLICATIONS FOR EXTENDED DURATION ORBITER (EDO) MISSIONS ...... 52
9. DISCUSSION OF THE NOISE CONTROL EFFORTS .................................................................................. 57
10. CONCLUSIONS ...................................................................................................................................... 60
11. REFERENCES ......................................................................................................................................... 61
12. ACRONYMS .......................................................................................................................................... 65
CHAPTER V ACOUSTICS AND NOISE CONTROL IN INTERNATIONAL SPACE STATION
1. INTRODUCTION .................................................................................................................................... 12
2. MANAGEMENT, OVERSIGHT, AND SCOPE OF ACOUSTICS OFFICE EFFORTS ....................................... 14
3. ACOUSTIC REQUIREMENTS .................................................................................................................. 16
3.1 Resolution of Basic Sub-Allocations ........................................................................................... 19
3.2 Segments and Modules Requirements ...................................................................................... 20
3.3 Module Verification.................................................................................................................... 25
3.4 Payloads ..................................................................................................................................... 26
3.5 Government Furnished Equipment ............................................................................................ 27
4. CERTIFICATION OF FLIGHT READINESS PROCESS ................................................................................. 28
5. MISSION SUPPORT: HARDWARE, MONITORING, MEASUREMENTS, TRAINING AND HEARING PROTECTION ........................................................................................................................................ 29
6. RUSSIAN SEGMENT .............................................................................................................................. 33
6.1 Functional Cargo Block ............................................................................................................... 36
6.2 Service Module ........................................................................................................................... 48
6.2.1 Service Module Configuration ........................................................................................ 49
6.2.2 Service Module Efforts before Its First Flight ................................................................. 55
6.2.3 Service Module Noise Control Efforts Just Preceding and After the First Flight ............ 71
6.2.4 Renewed Service Module Noise Control Efforts ............................................................ 87
6.2.5 Summary of Service Module Efforts ............................................................................. 101
7. U.S. MODULES IN U.S. SEGMENT ....................................................................................................... 104

CONTENTS
vi
7.1 U.S. Laboratory ......................................................................................................................... 104
7.1.1 U.S. Laboratory Noise Control Measures ..................................................................... 109
7.1.2 U.S. Laboratory Vacuum Exhaust System Noise Control .............................................. 114
7.2 U.S. Airlock ............................................................................................................................... 117
7.2.1 Airlock Depressurization Problem ................................................................................ 118
7.2.2 NASA Noise Control Measures ..................................................................................... 120
7.2.2.1 Russian Depressurization Pump ....................................................................... 120
7.2.2.2 Added Inlet muffler .......................................................................................... 123
7.2.2.3 Benefits of Noise Control Measures ................................................................ 124
7.2.2.4 Airlock Noise Associated with Equalization Valves .......................................... 127
7.2.3 Airlock Operations Not Associated with Depressurization .......................................... 128
7.3 Node 1 ...................................................................................................................................... 128
8. JAPANESE MODULES .......................................................................................................................... 133
8.1 Japanese Experiment Module/Kibo Facility and its Modules .................................................. 133
8.2 H-II Transfer Vehicle Configuration and Hardware Contents .................................................. 135
8.3 Centrifuge Accommodation Module, Centrifuge Rotor, and Life Sciences Glovebox ............. 137
8.3.1 Original Acoustic Allocations for the Centrifuge Accommodation Module, Centrifuge Rotor, and Life Sciences Glovebox Payloads ................................................................ 140
8.3.2 Centrifuge Rotor Design, Acoustic Limits, and Centrifuge Rotor-in-the-Centrifuge Accommodation Module .............................................................................................. 141
8.3.3 Life Sciences Glovebox ................................................................................................. 144
8.3.4 Centrifuge Accommodation Module, Centrifuge Rotor, and Life Sciences Glovebox Overview ....................................................................................................................... 152
9. EUROPEAN MODULES ........................................................................................................................ 153
10. PAYLOADS .......................................................................................................................................... 155
10.1 Minus Eighty-Degree Laboratory Freezer for International Space Station .............................. 156
10.2 EXpedite the PRocessing of Experiments for Space Station Racks .......................................... 165
11. GOVERNMENT FURNISHED EQUIPMENT ........................................................................................... 168
11.1 Temporary Early Sleep Station ................................................................................................. 169
11.2 Portable Electrical Equipment Kit ............................................................................................ 175
12. DISCUSSION OF THE NOISE CONTROL EFFORTS ................................................................................ 176
13. CONCLUSIONS .................................................................................................................................... 179
14. REFERENCES ....................................................................................................................................... 181
15. ACRONYMS ........................................................................................................................................ 189

NASA/SP-2015-624 – ACOUSTICS AND NOISE CONTROL IN SPACE CREW COMPARTMENTS – Goodman & Grosveld
vii
CHAPTER VI EUROPEAN NOISE CONTROL IN INTERNATIONAL SPACE STATION
1. INTRODUCTION ...................................................................................................................................... 4
2. AUDIBLE NOISE SYSTEM LIMITS ............................................................................................................. 4
2.1 Hearing Conservation ................................................................................................................... 5
2.2 Voice Communication and Crew Annoyance ............................................................................... 5
3. NOISE MANAGEMENT APPROACH......................................................................................................... 5
4. AUDIBLE NOISE CONTROL ...................................................................................................................... 8
4.1 Source Sound Power Allocation Approach................................................................................... 8
4.2 Sound Power Budgeting ............................................................................................................. 12
4.3 Audible Noise Transfer Functions .............................................................................................. 13
5. DESIGN GROUND RULES, STANDARDS AND COMPUTATIONAL MODELS ........................................... 15
5.1 Design Ground Rules .................................................................................................................. 15
5.1.1 Control at the Source ..................................................................................................... 16
5.1.2 Interruption, Damping or Absorption along the Transmission Path .............................. 16
5.1.3 Protection at the Receiver Location (not desirable for the crewmembers) .................. 18
5.2 Audible Noise Standards ............................................................................................................ 18
5.2.1 Standards Requirements and Definitions ....................................................................... 18
5.2.2 Measurement and Test Standards ................................................................................. 18
5.3 Computational Models ............................................................................................................... 19
6. DESIGN AND DEVELOPMENT TASKS .................................................................................................... 20
6.1 System Level Audible Noise Control Activities ........................................................................... 20
6.1.1 System Architecture Integrity ......................................................................................... 20
6.1.2 Audible Noise Requirements at the System Level .......................................................... 21
6.1.3 System Design and Development Activities ................................................................... 21
6.1.4 Analysis and Budget Report............................................................................................ 24
6.1.5 Function and Other Government Furnished Equipment/Contractor Furnished Equipment Budget Requirements .................................................................................. 25
6.1.6 External Interface Control .............................................................................................. 25
6.1.7 Internal Interface Control ............................................................................................... 25
6.2 System Function Level ................................................................................................................ 25
6.2.1 Audible Noise Design and Development Activities ........................................................ 25
6.2.2 Government Furnished Equipment/Contractor Furnished Equipment Sub-Budget Requirements ................................................................................................................. 29
6.3 Government Furnished Equipment/Contractor Furnished Equipment Level ............................ 29

CONTENTS
viii
6.3.1 Audible Noise Design and Development Activities ........................................................ 29
6.3.2 Government Furnished Equipment/Contractor Furnished Equipment Analysis and Budget Report ................................................................................................................ 30
7. ASSEMBLY, INTEGRATION AND VERIFICATION .................................................................................... 30
7.1 System Audible Noise Verification ............................................................................................. 30
7.2 Function Audible Noise Verification ........................................................................................... 30
7.3 Government Furnished Equipment/Contractor Furnished Equipment Audible Noise Tests .... 31
8. CRITICAL TECHNOLOGIES ..................................................................................................................... 32
9. CONCLUSIONS ...................................................................................................................................... 32
10. REFERENCES ......................................................................................................................................... 33
11. ACRONYMS .......................................................................................................................................... 34
CHAPTER VII ACOUSTIC SPACEFLIGHT MATERIALS
1. INTRODUCTION ...................................................................................................................................... 5
2. SOUND ABSORBERS ............................................................................................................................... 7
2.1 Absorbent Cushions ..................................................................................................................... 7
2.2 Primary Absorbent Materials ....................................................................................................... 8
2.2.1 Foams ........................................................................................................................... 9
2.2.1.1 Melamine foam ................................................................................................ 10
2.2.1.2 SOLIMIDE® foam .............................................................................................. 10
2.2.1.3 Soundfoam® HT ............................................................................................... 12
2.2.1.4 Pyrell® foam ..................................................................................................... 12
2.2.1.5 SCOTTFELT® foam ............................................................................................ 12
2.2.1.6 Other foams ..................................................................................................... 12
2.2.2 Fibrous Material and Felts .............................................................................................. 12
2.2.2.1 Kevlar® felt ....................................................................................................... 12
2.2.2.2 Thinsulate™ ...................................................................................................... 13
2.2.2.3 Durette® felt .................................................................................................... 14
2.2.2.6 Foam Absorption ............................................................................................. 14
2.3 Feltmetal™ Materials ................................................................................................................. 15
2.3.1 Feltmetal™ with Absorbent Materials ............................................................................ 15
3. BARRIERS .............................................................................................................................................. 16
3.1 BISCO® HT-200 ............................................................................................................................ 16

NASA/SP-2015-624 – ACOUSTICS AND NOISE CONTROL IN SPACE CREW COMPARTMENTS – Goodman & Grosveld
ix
3.2 Non-Reinforced Barrier .............................................................................................................. 18
3.3 Multi-layer Barriers .................................................................................................................... 18
4. VIBRATION ISOLATION AND DAMPING ............................................................................................... 21
4.1 Strip-N-Stick® .............................................................................................................................. 21
4.2 Damping Foil ............................................................................................................................... 21
4.3 ISODAMP® ................................................................................................................................... 22
4.4 COHRlastic® ................................................................................................................................. 22
4.5 BISCO® HT-800® ........................................................................................................................... 22
4.6 Armaflex ..................................................................................................................................... 22
5. ACOUSTIC FABRICS............................................................................................................................... 23
5.1 HT90-40 Nomex® ........................................................................................................................ 26
5.2 60650 ROY Nomex® .................................................................................................................... 26
5.3 FDI 307 Dark Blue Nomex® ......................................................................................................... 26
5.4 GORE-TEX® .................................................................................................................................. 27
5.5 Beta Cloth ................................................................................................................................... 27
6. ACOUSTIC MATERIAL SUPPORT ........................................................................................................... 27
6.1 Coroplast® ................................................................................................................................... 27
6.2 Nomex® Pressboard .................................................................................................................... 28
6.3 Armalon ...................................................................................................................................... 28
6.4 Foam Core .................................................................................................................................. 29
6.5 Kapton® Tape .............................................................................................................................. 29
6.6 Aluminum Tape .......................................................................................................................... 30
7. MATERIALS CONTROL .......................................................................................................................... 30
7.1 Requirements Overview ............................................................................................................. 30
7.1.1 Flammability ................................................................................................................... 30
7.1.2 Flammability Configuration Analysis .............................................................................. 33
7.1.3 Offgassing Toxicity .......................................................................................................... 34
7.1.4 Outgassing/Thermal Vacuum Stability ........................................................................... 34
7.2 Requirements Documents .......................................................................................................... 35
7.3 Materials and Processes Technical Information System Database ............................................ 35
8. CONCLUSIONS ...................................................................................................................................... 38
9. REFERENCES ......................................................................................................................................... 38
10. ACRONYMS .......................................................................................................................................... 39
APPENDIX A: SELECTED MATERIALS SOURCES AND MAPTIS NUMBERS ............................................. 40
APPENDIX B: MATERIALS DOCUMENTATION ...................................................................................... 42

CONTENTS
x
CHAPTER VIII COMPENDIUM OF ACOUSTICS AND VIBRATION IN ENCLOSED VOLUMES
1. INTRODUCTION ...................................................................................................................................... 3
2. BASIC TERMINOLOGY AND METRICS ..................................................................................................... 4
3. TYPES OF SOUND ................................................................................................................................... 8
4. MATHEMATICAL OPERATIONS ............................................................................................................... 9
5. SOUND SOURCES ................................................................................................................................. 11
6. SOUND RADIATION .............................................................................................................................. 15
7. SOUND PROPAGATION ........................................................................................................................ 15
8. SOUND IN ENCLOSED SPACES .............................................................................................................. 17
9. SOUND ABSORPTION ........................................................................................................................... 21
10. PANEL VIBRATION ................................................................................................................................ 23
11. ACOUSTIC TRANSMISSION ................................................................................................................... 26
12. ACOUSTIC RESONATORS ...................................................................................................................... 32
13. ACOUSTICS AND VIBRATION INSTRUMENTATION............................................................................... 33
14. FAST FOURIER TRANSFORM ANALYSIS ................................................................................................ 34
15. NOISE EXPOSURE METRICS .................................................................................................................. 36
16. SPEECH INTELLIGIBILITY TERMS ........................................................................................................... 38
17. STATISTICAL ENERGY ANALYSIS ........................................................................................................... 41
18. OTHER VIBRO-ACOUSTIC SIMULATION AND ANALYSIS SOFTWARE SOLUTIONS ................................ 45
19. REFERENCES ......................................................................................................................................... 46
20. ACRONYMS .......................................................................................................................................... 51
21. SYMBOLS (in order of appearance)...................................................................................................... 52

NASA/SP-2015-0624 – ACOUSTICS AND NOISE CONTROL IN SPACE CREW COMPARTMENTS – Goodman & Grosveld
xi
PREFACE AND INTRODUCTION
The term ‘crew compartment’ is applied in this book to the habitable volume in a crewed spacecraft, module, habitat, or other types of crewed enclosures used in a space environment. The habitable volume is where the crew normally works, rests, or sleeps. It is important to note that predominant noise sources affecting the crew compartment, like fans, pumps and other noise producing hardware in spacecraft like those in Apollo, Space Shuttle Orbiter, and International Space Station (ISS) modules are for the most part located behind closeout panels, in bays or ducting, or otherwise located in what is not considered the crew compartment.
Very little in-depth documentation is available on acoustics and noise control efforts in manned space-related crew compartments. What is available is primarily in technical papers, which are very brief, focus on generalized efforts on a spacecraft or module, and present very little evolutionary or summary history and lessons learned on acoustic requirements and effective noise control efforts. Acoustics and noise control in crew compartments presents unique challenges given: the confined compartment; the unusual demands and work schedules of the flight crews; the numerous hardware required to maintain and operate the vehicle or module, sustain and monitor the crew, and to allow the crew to exercise or perform experiments; and the resultant additional acoustic impacts of this hardware on the environment, crew health, comfort/habitability, and efficiency.
The lead editor was an observer in what happened in acoustics in the Apollo Program – in the Command Module (CM) and Lunar Module (LM). During that time the lead editor was Crew Compartment Project engineer for the CM and later the LM, working in the Apollo Program Office at NASA Manned Spacecraft Center (MSC), which later became Johnson Space Center (JSC). Noise control was generally performed by the NASA contractors for the vehicle hardware. Oversight was provided by the Vehicle Project Engineers assigned to each vehicle and the NASA subsystems managers who were responsible for the noise producers. Support came from a NASA MSC’s Crew Systems Division materials expert, and unique muffler design support for the LM was provided by the NASA Structures and Mechanics Division. There were consistent generic flight acoustic anomalies and concerns in both of these vehicles. NASA’s noise control focus at the time was to ensure adequate crew sleep to support the lunar mission activities, and there was no impediment to successfully completing these missions. In response to overall vehicle design problems, NASA investigated these problems and developed a set of related Manned Spacecraft Standards for each of them applicable to all future crewed spacecraft programs. Included in these standards was the Manned Spacecraft (MSC) Design and Procedural Standard, Design Standard (DS) 145, Acoustical Noise Criteria, released in October 1972. Chapter III covers the Apollo Program acoustics and associated noise control efforts.
At the beginning of the Space Shuttle Orbiter (herein referred to as Orbiter) Program, the lead editor submitted a recommendation that acoustics requirements documented in DS 145 be implemented in the Orbiter, before, in effect, becoming the NASA lead on Orbiter acoustics for the Orbiter Project and setting up an Acoustics Working Group (AWG) at JSC to obtain NASA center-wide support. Attempts to implement Noise Criterion NC-50 required in DS 145 met

PREFACE AND INTRODUCTION
xii
considerable resistance and skepticism that these levels were necessary to be met and could be implemented without significant impacts. Space Shuttle progress in noise control was limited and constrained due to the lack of support by NASA and Contractor management. This changed later, when the first Orbiter vehicle was being checked out and acoustic levels were determined to be unacceptably loud in testing by Astronauts. Government Furnished Equipment (GFE) mufflers were implemented to lower the acoustics levels to a degree, but not to the specified limits. Specified limits were then revised to reflect the acoustic levels obtained with these mufflers. Later missions produced crew concerns with the Orbiters acoustic levels, which helped provide emphasis and support to improve noise control measures for extended duration Orbiter vehicles. Payloads at times were flown with acoustic waivers – acoustic signatures that caused Orbiter levels to exceed its acoustic limits. This situation caused serious acoustic problems on mission STS-40, due to high noise levels in the Spacelab and Orbiter. A NASA Headquarters AWG was set up as a result and acoustics got increased Shuttle Program management and payloads attention. Orbiter acoustics was difficult, and a challenge to work on.
The lead editor got involved in International Space Station (ISS) acoustics when leaving the Orbiter Project Office, eventually working acoustic aspects of NASA’s involvement in the Mir, then becoming Acoustics Lead for ISS acoustics and setting up an Acoustics Office at NASA JSC to support ISS. Using tough lessons learned from the Orbiter Program, an AWG was established, and a contractor support staff was obtained to help manage establish requirements, support all of the ISS hardware development, and provide oversight and technical support. ISS acoustic requirements established were lower than Orbiter and Apollo – closer to what was required in DS 145. Implementation was difficult because limits were tighter, and overall experience with noise control was limited, and there were a large number of hardware suppliers and different cultures involved. There were problems with compliance. However, in ISS there was much more acceptance with the need to comply with established acoustic limits, and to monitor and perform noise control efforts. In general NASA was successful in meeting established limits, and with modules that did not comply the noise levels were lowered to an acceptable level over time. Noise control technology and materials applications developed were shared with IPs and all hardware providers, and significantly improved over time.
Jerry R. Goodman
Ferdinand W. Grosveld

NASA/SP-2015-624 – ACOUSTICS AND NOISE CONTROL IN SPACE CREW COMPARTMENTS – Goodman & Grosveld
xiii
BOOK DEDICATION
The editors would like to dedicate this book to four extraordinary individuals, whose exceptional knowledge and practice of noise control engineering have made a tremendous impact on creating a safe and functional acoustic environment in space crew compartments. These pioneers have been involved in assessing and resolving acoustic issues since the early days of the crewed spacecraft programs. The editors are indebted to Pietro, Rimma, Robert and Jim for their commitment and their enthusiasm to advance and implement new noise control technologies that may serve as a sound foundation for future endeavors into space.
This book’s dedication includes and takes special notice of Pietro
Marruchi in memory of his life and efforts on the European approach to acoustics and noise control on the International Space Station (ISS). He and his Alenia staff provided significant contributions, and their approach led to the successful acoustic environment and unique materials applications in the European modules making up the ISS. These modules were among the quietest modules in the ISS. Pietro supported the initiative of writing this book from its inception, provided valuable information and delivered several drafts of Chapter VI, European Noise Control in International Space Station. Several photographs and figures used in this book originated from Mr. Marruchi’s and Alenia’s work.
The late Rimma Ivanova Bogatova with the Russian Institute of Biomedical Problems (IBMP) also merits special notice in memory of her very significant contributions to Space Station Mir and ISS acoustics and noise control. Since 1995 or 1996 this lead author has worked with Ms. Bogotova on ensuring that Russian modules were habitable and acceptable from an acoustics standpoint. She was very instrumental in procuring acoustic measurement equipment for training on-board the Russian Mir and later ISS flight modules, obtaining Russian sanctions and priority for taking in-flight measurements and follow-up activities, and was a stalwart supporter of efforts to remedy high acoustic levels that persisted in Russian modules. Ms. Bogotova performed many other valuable functions on
crew health, sanitation and hygiene requirements, and studies on the effects of long-term confinement.
Pietro Marruchi
Rimma Bogotova

BOOK DEDICATION
xiv
Robert Hill worked at North American Aviation which later became Rockwell Space Division, then Boeing Company, and as a consultant to NASA, Johnson Space Center (JSC) on ISS. Mr. Hill was the technical lead for Space Shuttle Orbiter Acoustics, overseeing the implementation of all Orbiter contractor noise control designs at Rockwell. A large number of figures used in this book came from Mr. Hill’s presentations on the Space Shuttle and show results of his wide-ranging and extensive noise control work at Rockwell. He was contracted by the NASA Acoustics Office as a key acoustics consultant, where he participated in Acoustic Technical Interchange Meetings (TIMs) with ISS International Partners (IPs) in reviewing module designs, and presented overviews of Orbiter acoustics and noise control efforts. He initiated and developed the design of an Airlock inlet muffler described in the ISS Chapter. He also
participated in ISS acoustic TIMs for Boeing. Jim Warnix, Lockheed Martin, originally managed the acoustics test
facility for NASA’s Structures and Mechanics Division where he tested numerous Space Shuttle payloads and Government Furnished Equipment (GFE), and numerous ISS hardware. Mr. Warnix also helped hardware comply with their limits. He played a very significant role in the following efforts: establishing Space Shuttle and ISS definitions of continuous and intermittent noise and new acoustic requirements established late in the Space Shuttle program; providing numerous Space Shuttle and ISS acoustic demonstrations to NASA management; performing acoustic testing of all of the Space Shuttle Orbiters; performing acoustic testing and exceptional resolution of Spacehab acoustics; developing acoustic requirements for ISS modules, payloads and GFE; and providing other significant support of acoustics efforts on the Space Shuttle Orbiter and early ISS, and NASA Acoustics Working Group (AWG) efforts. Mr. Warnix was hired as a key ISS acoustics consultant, where he participated in Acoustic TIMs with IPs, provided briefings on lessons learned on the Space Shuttle, and reviewed module designs. He played a primary role in quieting and testing a pump used in the U.S. Airlock, and testing NASA’s first ISS sleeping quarters. A large number of figures presented in this book came from Mr. Warnix’s testing efforts.
Jerry R. Goodman
Ferdinand W. Grosveld
Robert Hill
James Warnix

NASA/SP-2015-624 – ACOUSTICS AND NOISE CONTROL IN SPACE CREW COMPARTMENTS – Goodman & Grosveld
xv
ACKNOWLEDGEMENTS
The Editors wish to express appreciation to those individuals and organizations who have contributed to acoustics and noise control in crew compartments, and made the efforts described in this book possible. There are many individuals who deserve credit for their efforts, but unfortunately it is not possible to list the names of all contributors.
Dr. Jerry Homick and Burrell French who worked Apollo acoustics and helped this lead editor with his beginning efforts on acoustics. Dr. Homick was very instrumental in Apollo and Space Shuttle acoustics, and helped develop and interpret acoustic limits for the Orbiter. He developed 24-hour time-weighted limits used in the Orbiter and participated as the Space and Life Sciences representative in the Acoustics Working Group (AWG) throughout the Space Shuttle Program. He wrote important reports and documentation on Apollo and Orbiter acoustics.
Charles Willis, was a manager with Rockwell Space Division, was this lead editor’s counterpart on the Orbiter crew compartment, Extravehicular Activity provisions, and acoustics, who provided oversight over Rockwell’s acoustics efforts on the Orbiter, was instrumental in communicating and resolving issues, and helped keep acoustic efforts on-track.
Christopher Allen was deputy of the NASA Acoustics Office during most of the ISS period covered by this book. He came from NASA Ames with significant background and experience in acoustics. He oversaw a large number of key areas of ISS acoustics, made very significant contributions in ISS acoustics – and is now manager in charge of acoustics at NASA JSC. He took the lead in renewed Russian remedial design efforts which resulted in successfully lowering Service Module (SM) acoustic levels, and development of promising quiet fans for use in the SM and other Russian modules. He became the head of the Acoustics Office at JSC in 2006. He was the principal and valuable reviewer of all the Chapters in this publication.
Sam Denham, the Boeing Company, was a key player in the ISS U.S. Laboratory, Airlock and Node 1 acoustics efforts, and made many, significant contributions to ISS acoustics and noise control. He performed acoustic testing and managed noise control efforts implemented on the U.S. Laboratory. He provided numerous reports, including support of ISS Increment reports, and was an invaluable source of information and a very key supporter of the Acoustics Office and NASA’s AWG. He became an important reviewer of IP acoustics, and was later a valuable co-chair of the NASA’s AWG.
Dr. Punan Tang was a very experienced NASA support contractor of ISS. He later became a key acoustics consultant who participated in TIMs with IPs. He performed numerous significant acoustic testing and noise control efforts on a number of NASA and IP payloads; on the Russian Service Module; the United States Laboratory (USL) vacuum ventilation system, and developed proposed redesigns of vacuum lines for improved acoustics; NASA treadmill development and testing; and other support areas. He also performed numerous tests on acoustic materials. A number of the ISS figures presented in this book came from his efforts.

ACKNOWLEDGEMENTS
xvi
Dr. Ferdinand Grosveld was a very experienced independent consultant enlisted to support NASA’s TIMs with IPs and performed numerous other support. He developed a unique muffler design to help quiet Russian Functional Cargo Block (FGB) set of fans, and was instrumental in supporting remedial actions on German and Japanese payloads. He played a very key, major role in oversight of a number of Japanese ISS modules and payloads, and supported Russian, German, Dutch, and Italian IP efforts. He is co-editor of this book, author of Chapter VIII, produced the European Chapter using Pietro Marruchi’s inputs, and is co-author of several other chapters. Dr. Grosveld has played a very significant role in this book – in its generation, organization, editing, and review of its contents.
Butch Hosler was the original ISS Project lead working acoustics. Mike Engle was later assigned as the ISS Project Office acoustics integration manager who helped coordinate, integrate, and resolve acoustic issues across the ISS program. He participated in a number of Russian TIMs and provided significant support of establishing renewed remedial action efforts on the Service Module. He was a key participant in the AWG and management reviews.
Doug Counter of NASA Marshall Space Flight Center (MSFC) originally worked acoustics and noise control efforts with European modules, collaborating with the NASA Acoustics Office and reporting periodically to the AWG. He was very instrumental in reviewing and supporting European acoustics efforts and helping Boeing with U.S. Laboratory acoustics. Shirley Chandler (McDonnell-Douglas at MSFC), was very cooperative on Spacelab acoustics. Bob McAnnally, and Greg McDaniels at MSFC led Spacelab quieting efforts after the STS-40 mission.
Dr. Richard Danielson, with USRA/Baylor College of Medicine, led JSC’s Audiology and Hearing Conservation efforts, development and operation of an on-orbit hearing test hardware for ISS Astronaut crews, and management of later hearing protection devices used by the crews. He was a key member of the AWG and stalwart supporter of remedial noise control efforts.
Gregory Pilkinton was originally a NASA Contractor who was responsible for ISS mission support, including developing mission procedures for acoustic measurements and mission interim and final reports, flight crew training of acoustic equipment, and working with IPs on measurement locations and acquired flight data. He was very instrumental and a key player in a wide number of support contractor efforts, was the provider of acoustic design of an early NASA sleep station kit and other areas. He later became Boeing’s Technical Lead on ISS acoustics where he participated in acoustic TIMs with IPs, and became co-chair of the AWG. He provided very significant and key support of overall ISS acoustics.
James Stramler represented the Astronaut Office in management reviews, acoustic TIMs and AWG meetings. He made very significant and consistent contributions to ISS acoustics and noise control over the ISS period of time covered in this book, and was another stalwart supporter of remedial noise control efforts on ISS
NASA/SP-2015-624 – ACOUSTICS AND NOISE CONTROL IN SPACE CREW COMPARTMENTS – Goodman & Grosveld
xvii
Eric Phillips was a Johnson Engineering Contractor who was responsible for oversight and monitoring of ISS payloads, and was an important member of the AWG.. He helped quiet several payloads and initiated and developed a quiet fan database for payload support. He later became a Boeing employee responsible for payload acoustics, supported various Acoustic TIMs and performed other significant efforts on payloads, and in that role, again was a key AWG supporter and member.
Tatiana Christian was originally a Johnson Engineering Contractor, who later became employed by the National Space Biomedical Research Institute (NSBRI), working on ISS acoustics. She provided very significant support of Russian ISS acoustic efforts, participating in numerous TIMs and helping establish better communications and relationships with Russian counterparts. She also played a significant role establishing Government Furnished Equipment (GFE) acoustic requirements, supporting other IP efforts, and a wide variety of other ISS efforts.
Reed Murry was an experienced support contractor who took over oversight of GFE, in addition to providing significant support of testing on GFE, payloads, Boeing hardware, and IPs. He procured acoustic equipment and materials and maintained them. He setup records on suppliers of acoustic materials, and information on outgassing and toxicity. Mr. Murry provided equipment and materials assistance for all TIMs requiring support. He was a key asset, and a member of the ISS AWG.
Jim Rauch was a senior engineer with NASA’s support contractor who had significant experience in Space Shuttle flight crew equipment and crew station design. He provided invaluable support of Mir and early ISS efforts, took over original oversight of ISS GFE equipment and hardware, served as secretary of the original AWG, and expedited and provided oversight over various other support efforts.
Shoa Sheng R. Chu was an acoustics expert with NASA’s support contractor. He performed acoustic testing on GFE and payload hardware, and tested an extensive number of acoustic materials and layups.
Denise Baisden who was the Space Shuttle and ISS Lead Flight Surgeon, and was a very key supporter of Space Shuttle and ISS acoustics and AWGs. Drs. Steven Hart and Jon Clark, NASA Flight Surgeons performed significant efforts to establish crew acoustic dose limits for ISS Flight Rules, and were key supporters of ISS AWG efforts.
Authur Scheuermann was Boeing Houston’s original ISS project lead responsible for acoustics. James Lambert later became Boeing’s Acoustics Lead and counterpart to NASA’s Acoustics Lead. He oversaw and coordinated Boeings support of acoustics and integration on all Boeing provided modules and other ISS noise prediction efforts. Sam Denham, mentioned previously, reported to Mr. Lambert initially. Sam Woodward was a key player with Boeing Huntsville during initial meetings on the USL. Kurt Lohman worked overall technical aspects of acoustics. Kurt was one of Boeing’s representatives on the AWG. Mark Wang, with McDonnell Douglas was responsible for Node 1 acoustics.

ACKNOWLEDGEMENTS
xviii
Randy Dickson worked for NASA MSC on Apollo LM noise control, designing and testing muffler designs used to quiet LM glycol pumps. He provided a wealth of information on LM acoustics and quieting efforts, including test reports, various meeting minutes, schematics, test data, photographs, and physical prototype mufflers used in the 1960’s. He also reviewed and provided comments on the Apollo Chapter. Wade Dorland was prominent in LM noise reduction efforts for NASA MSC.
Steve Schenfield, Gil Bonse, Katie Allen, Amy Hoang also supported acoustics efforts and the ISS AWG, representing safety organizations.
George Sandars, Jamie Erickson and Joseph Eggert worked on Payload acoustics for the ISS Payloads Office. Mr. Erickson was the Payloads Office representative at initial AWG meetings.
Ernest Becker was the lead of NASA’s original support contractor’s acoustics group. He managed the NASA’s support contractor’s efforts, and helped hire personnel, equipment, facilities, and materials to support NASA’s efforts. His involvement was important to establish proper NASA support of ISS acoustics. Other NASA support contractor personnel who supported the Acoustics Office were: Darren Riggle, Michele Segal, Tracy Bush, Nick Combs, Noel Lamar, James Whitely, Irene Schemp, and Dandy Russell. Jurine Adolf coordinated and oversaw Lockheed Martin’s acoustics support when her company took over as NASA’s support contractor.
Significant support from the Astronaut Office for the Space Shuttle is recognized: Joe Kerwin, John Young, Bill Thornton, and Story Musgrave. For ISS, the late Laurel Clark was a very significant and valuable supporter of acoustics, who helped generate flight rules and played a valuable role in overall AWG efforts. Other significant Astronaut Office support was provided by: Jeff Wisoff, Rick Husband, Anna Fisher, Linda Godwin, Michael Barratt, Catherine Coleman, Sandra Magnus, William Shepard, Julie Payette, Piers Sellers, Edward Finke, James Voss, Thomas Jones, Jeffrey Williams, Peggy Whitson, Dan Burbank, and Sunita Williams.
Mark Bowman performed significant efforts on the U.S. treadmill, supported Russian ISS TIMs with the Moscow Liaison office, and later on payload acoustics, including Japanese payloads. Javier Lucero performed significant noise control efforts on the U.S. treadmill with Mr. Bowman. Gayle Greenthaner supported Russian ISS TIMs with the NASA Moscow Liaison Office. Sue Adam, Laura Louivere, Charles Wheelwright, and Anton Koros, performed significant efforts at NASA JSC including the assessment of acoustics during various Space Shuttle Orbiter missions and supporting the AWG. Mr. Wheelwright provided other important documentation on prior programs, and supported reviews of Orbiter acoustics. Carlos Aguilar and Lindy Kimmel, with Lockheed-Martin performed significant noise control efforts on the Human Research Facility (HRF).
Jason Beierle and Paul Campbell performed excellent efforts on Mir acoustics. Ed Stanton was very supportive and conducted several astronaut surveys on Space Shuttle.

NASA/SP-2015-624 – ACOUSTICS AND NOISE CONTROL IN SPACE CREW COMPARTMENTS – Goodman & Grosveld
xix
Beth Cooper, who was Manager of NASA, Glenn Research Centers Acoustics Testing Laboratory helped with oversight and NASA acoustic reviews of payloads provided by that NASA Center, general training in acoustics, and coordinated several meetings with our Acoustics Office to review and consult with a number of emerging payloads. Ms. Cooper also enlisted technical papers on ISS acoustics for NOISE-CON 2003 (Institute of Noise Control Engineering) and setup our participation in sessions on this subject, when she was a sponsor of this conference held in Cleveland.
Jason Otoshi, Thomas Wynn, Robert Barber, Harold Clay, Nathan Burnside, Chris Barreras, Carol Elland and Jeff Laberge, at NASA Ames provided significant efforts on the Centrifuge Accommodations Module, the Centrifuge Rotor, the Life Sciences Glove Box, and the habitats and science payloads.
An important area of acoustics and noise control support has been materials control. The efforts of the following personnel are acknowledged and appreciated: Fred Dawn, Paul Ledeaux, Michael Pedley, Charles Hill (co-author of Chapter VII Acoustic Spaceflight Materials), Lubert Leger, Jack Huckstein, Jan Martinez, Chia Chang, Daniel Supkis, Rajib Dasgupta, Rudy Gabiola, Jerry Kuminecz, Evelyn Orndoff, Tony Brown, Dale Sauers, and Greg Day.
To Russia counterparts with love, for their collaboration and their efforts in resolving acoustic issues with Russian modules: from Rocket Space Corporation-Energia (RSC-E): the late Evgeni Zaitzev, Vladimir Dementiev, Anatoli Elchin, Vladimir Shabelnikov, Alexi Uspenky, Uri Fedorov, Sergey Ryback, Alexander Ermark, and Oleg Smirnov. From Institute of Biomedical Problems (IBMP): the late Rimma Bogotova (see previous recognition of her), Irina V. Kutina, Alexandre Agureev; and from the Functional Cargo Block (FGB): Stanislav Zaitsev, Sergey Shaevich, S. Paskhin, Vladimir Polyakov, and A. Kuksa. Also, with MTI Technology: Boris Brinin, Mikhail Moronov, and Andrei Llin, acoustic consultants.
To Thales Alenia Aerospace: the late Pietro Marruchi who led the acoustics group efforts (see previous recognition of him), Stefano Destefanis, and Roberto Ullio for their significant efforts, and review of the European Chapter generated on behalf of Pietro Marruchi. Also to Massimo Martini, Nicola Riva, and Valentina Tumminelli, who were part of the Thales Alenia team.
To the European Space Agency (ESA) for their support: Peter Buchwald with ESA/European Space Research and Technology Centre (ESTEC), Frank Bouckaert with ESA, and Dave Wyn-Roberts with ESA/Spacelab project, and Dirk Eilers, who worked with Daimler-Benz Aerospace in Germany and Chrysler Aerospace Aktiengesellschaft (DASA). These gentlemen collaborated with Pietro Marruchi and Alenia on their noise control efforts. Christine Taddei, Jean Chegancas, Jean-Michel Merle, and Alain Brunschvig, with Astrium-Space in France, and Martin Zell, Andreas Schutte, and Roland Muller, Astrium-Space in Germany. Astronaut Steven L. Smith who was NASA’s ISS liaison with ESA on the Automated Transfer Vehicle (ATV) provided significant support of acoustics on that vehicle.

ACKNOWLEDGEMENTS
xx
To the following Japanese personnel who worked on either the Japanese Experiment Module (JEM), JEM payloads, Centrifuge Rotor (CR), Centrifuge Accommodations Module (CAM), Life Sciences Glovebox (LSG), or H-II Transfer Vehicle (HTV) or multiple areas: Toru Yoshihara, Satoru Tachihara, Shinya Watanabe, Tsutomu Fukatsu, Hirohiko Uematsu, Tetsuya Sakashita, Yasuhiro Nakamura, Yasuhio Uchibori, Yui Takeshi, Hidetaka Tanaka, Mitsuyuki Kohzuma, Hisato Ishii, Terumasa Kohama, Keisuke Suzuki, Takeshi Kamiya, Takao Yamaguchi, Hideyuki Yamaguchi, Hiroyuki Sasayama, Ichirou Aoki, Koichi Ootomi, Akira Okumura, Hiroshi Miyaba, Shinya Watanabe, Hideyuki Watanabe, Satoru Suzuki, Hiroshi Yamamoto, Sadamu Ito, Kazuhiro Ubukata, Atsushi Namiki, Shigeru Imai, Norihito Tsuji, Kaiichi Asami, Yoshioka Takeyasu, Kanzawa Takuya, Higo Naoyuki, Kenichi Kawazoe, Mitsuyuki Kohzuma, Masayuki Harada, Kensuke Teranishi, Yoshio Ono, Keniichi Wada, Yasushi Hisadone, O. Kawamoto, Osamu Satoh, Osamu Kawamoto, Kazuhiro Nakamura, Junichi, Yoshikawa, Naoki Satoh, Michiaki Mizuochi, and Nasahiko Shimizu. Also thanks to Emiko Lee with the NASA Space Station Liaison Office in Japan.
The many other contractors and IP personnel not mentioned above who performed successful efforts on Government Furnished Equipment (GFE), payloads, and modules.
Janine Bolton, Kim So, and the NASA JSC Human Health and Performance Libraryfor their significant help with references.
Lenora Guin, Joanne Ramey, Reberta Gutkowski, and Dane Russo, for their support in generating this book.
Susan Breeden with DB Consulting Group, Inc. for her significant contributions in reviewing and editing of this book, and Marshall Mellard, also with the same company, for his helpful efforts in support of the book, both representing the Information Resources Directorate at NASA JSC. Kathy Padgett with GeoControl Systems, Inc., for her support in setting up printing of this book.
Finally, Bill Seitz, my Division Chief, who allowed me to spend the time I did on this book, encouraged me to cover ISS acoustics, and was very supportive of this effort for a long time.
Jerry R. Goodman

NASA/SP-2015-624 – ACOUSTICS AND NOISE CONTROL IN SPACE CREW COMPARTMENTS – Goodman & Grosveld
xxi
BOOK OUTLINE
This book discusses the acoustics and noise control in spacecraft crew compartments, using experience and lessons learned from the Apollo, Orbiter, and ISS Programs. Chapters in this book are outlined as follows:
Chapter I, Acoustics, provides recommended acoustic requirements for crew compartments, based upon experiences obtained from the Apollo, Space Shuttle Orbiter (Orbiter), and ISS Programs.
Chapter II, Noise Control, discusses the principles of noise control and provides examples of a variety of design techniques and approaches, and material applications that were used in space programs, and proven to be effective. This Chapter is written so it could be used as a stand-alone document for reference or use in noise control. Where possible the technical benefits of these approaches or materials applications are included.
Chapters III, IV, and V are on Acoustics and Noise Control in Apollo, Orbiter, and ISS, respectively. These Chapters describe/document what acoustic requirements and noise control approaches were used in these programs and provide lessons learned from these efforts. Chapter IV of this book covers Orbiter acoustics and noise control from the beginning of Orbiter development until 1995. Chapter V covers ISS acoustics and noise control from 1995 until 2006, during which time the lead editor was Acoustics Lead for ISS, and Manager of the Acoustics Office at JSC.
Chapter VI provides the European approach to noise control on ISS. It reflects the work of Alenia Aerospace, representing the Italian Space Agency. The European approach on noise control of their modules was proficient and successful. The information for this Chapter was provided by Pietro Marucchi, with Alenia Aerospace, who led this Italian team’s approach to noise control on European ISS modules.
Chapter VII, Acoustics Spaceflight Materials, describes flight-approved acoustic materials used by NASA in Orbiter/Spacelab and ISS noise control and applications. Also provided is information on commercial sources for these materials, materials certification, and the materials processes relative to noise control. Charles Hill, an experienced materials engineer provided the information on the materials selection process, as well as listings of materials requirements, and other materials documents.
Chapter VIII, Acoustics and Vibration Compendium, presents basic equations for vibro-acoustic phenomena and pertinent information for acoustics and noise control applications in crew compartments. It is intended to be a useful reference for those working in this area.

CHAPTER I
ACOUSTICS
Jerry R. Goodman
Ferdinand W. Grosveld
CONTENTS
1. INTRODUCTION ........................................................................................................................ 3
2. ACOUSTICS REQUIREMENTS .................................................................................................... 4
2.1 Continuous Noise Limits .................................................................................................. 5
2.1.1 Background ........................................................................................................... 5
2.1.2 Discussion ............................................................................................................. 6
2.1.3 Continuous Noise Limits ..................................................................................... 11
2.1.4 Sub-Allocations of Key Noise Contributors ......................................................... 14
2.1.5 Crew Quarters/Sleep Operations ....................................................................... 15
2.2 Intermittent Noise ......................................................................................................... 16
2.3 Daily Exposure Limits ..................................................................................................... 18
2.4 Narrowband Component Limits .................................................................................... 18
2.5 Ultrasound and Infrasound Limits ................................................................................. 18
2.6 Hazardous Overall Noise Limits ..................................................................................... 19
2.7 Reverberation Time ....................................................................................................... 20
2.8 Alarms ............................................................................................................................ 20
3. COMPLIANCE AND VERIFICATION .......................................................................................... 20
4. CONCLUSIONS ........................................................................................................................ 21
5. REFERENCES ........................................................................................................................... 22
6. ACRONYMS ............................................................................................................................. 25

NASA/SP-2015-624 – ACOUSTICS AND NOISE CONTROL IN SPACE CREW COMPARTMENTS – Goodman & Grosveld
Chapter I - 2
TABLES
Table 1. Speech interference levels that barely permit communications. ..................................... 7
Table 2. Octave band sound pressure level limits for continuous noise [dB]. ............................. 12
Table 3. Intermittent A-weighted Overall Sound Pressure Level (OASPL) and corresponding operational limits for supplementary hardware; e.g., rack-mounted payload hardware and non-integrated GFE. ................................................................................................. 17
Table 4. Threshold Limit Values for ultrasonic sound in air [37][44]. .......................................... 19
FIGURES
Figure 1. Noise Criteria curves and specifications. ......................................................................... 6
Figure 2. Talker-to-listener distances for just reliable face-to-face communication, based on SIL (0.5, 1, 2, 4). ..................................................................................................................... 8
Figure 3. Percent intelligibility level versus the NC criterion for male crew-to-crew communication at distances from 1.52 m to 2.44 m (5 ft to 8 ft). .................................. 9
Figure 4. Approximate thresholds of human response to ambient noise. ................................... 10
Figure 5. Extended continuous NC limits. ..................................................................................... 12

ACOUSTICS - Goodman & Grosveld
Chapter I - 3
CHAPTER I
ACOUSTICS
Jerry R. Goodman
Ferdinand W. Grosveld
1. INTRODUCTION
Crew compartments in space hardware are confined volumes with closed-loop environmental systems that usually involve significant hardware systems and equipment for life support, thermal control, crew sustenance, mission and vehicle operations, experiments or payloads, and survivability. Crew confinement is a 24-hours-per-day affair – unlike our normal workdays on Earth, where one escapes the work environment. The resultant environment is challenging from an acoustics standpoint because of the multitude of noise sources and their occurrences, the relatively restricted volume for crew operations and rest/sleep, and the design and operational repercussions of controlling the acoustics environment.
The acoustics environment in space operations is important to maintain at manageable levels so that the crew can remain safe, functional, effective, and reasonably comfortable in a habitable environment, thereby contributing to the success of each mission. A safe acoustics environment is one where the crew can communicate effectively and efficiently and can hear warning alarms; where the crew can live without being agitated by noise and can rest without being awakened; and, of course, where the crew’s auditory organs will not sustain injury.
High acoustic levels can produce temporary or permanent hearing loss. High acoustic levels can also cause physiological symptoms such as auditory pain, headaches, ringing in the ear, discomfort, strain in the vocal cords, or fatigue. Noise is defined as unwanted sound. Excessive noise can result in psychological effects such as irritability, inability to concentrate or relax, decrease in productivity, annoyance, errors in judgment, and distraction. A noisy environment also can result in the inability to rest, sleep, or sleep well. Elevated noise levels can affect the ability to concentrate, communicate, understand what is being said, and/or hear what is going on in the environment, thereby degrading crew performance and operations and creating habitability concerns. Superfluous noise levels can mask the hearing of alarms or other important auditory cues, such as the sound of an equipment malfunction.
Recent spaceflight experience, evaluation of the requirements in crew habitable areas, and lessons learned show the importance of maintaining an acceptable acoustics environment [1][2][3][4][5][6][7][8][9]. This is best accomplished by establishing a high-quality set of limits and requirements early in the program, and by implementing effective noise control measures [3][4][8][9].

NASA/SP-2015-624 – ACOUSTICS AND NOISE CONTROL IN SPACE CREW COMPARTMENTS – Goodman & Grosveld
Chapter I - 4
2. ACOUSTICS REQUIREMENTS
Prior spaceflight experience demonstrated the necessity for programs to adopt a well-founded set of acoustics requirements [10] to ensure a safe and adequate acoustics environment, and to ensure implementation of the requirements throughout the program through noise control plans and applied noise control.
Acoustics requirements are a key pillar of successful design. Such requirements need to be implemented at the beginning of a program, and be as well defined and clear as possible. The area of acoustics should be treated as a technical specialization on par with other design disciplines, with experienced and knowledgeable personnel assigned to implement the defined requirements. The following factors should be considered when tailoring acoustics requirements to meet a specific application:
Type of mission. Mission duration. Number and characteristics of crew occupants. Size, function, number, type, and sound power of hardware systems that make up
the crewed vehicle, module, or enclosure, and the supplementary hardware such as payloads and supplementary Government Furnished Equipment (GFE) and their significance relative to the total system noise contributions.
Whether single or dual shift operations will be used. Quality of communications, including the degree of speech intelligibility needed, the
distance between crewmembers required for good communications, the relative orientation between communicating crewmembers, and the background noise at each crewmember’s location. Also, the need to accommodate males and females in the exchanges.
Whether ‘shirt-sleeves’ is considered the nominal operational condition, with suited operations as required for contingencies or extravehicular activity (EVA).
Crewmembers’ ability to communicate with the ground at all times. Crewmembers’ ability to have direct voice communications during continuous noise
operations for reasonable distances between the crewmembers. Compatibility of communication headsets or speakers with background noise levels
and reliability regarding critical mission tasks or communications. The size and the shape of the interior surface and equipment areas, the surface
absorption properties, and the reverberation characteristics in the crew compartment.
The operating pressure(s) of the crew compartment and the gaseous composition. The external environment, gravity, and the type of external physical support of the
vehicle or enclosure, if planetary.
The term ‘crew compartment’ is applied in this document to the habitable volume in a crewed spacecraft, module, habitat, or other types of crewed enclosures used in a space environment. This volume is the one in which the crew normally works, rests, or sleeps. All the requirements recommended in this Chapter apply throughout the crew compartment and are underlined. Separate acoustic restrictions need to be applied to areas that are outside the

ACOUSTICS - Goodman & Grosveld
Chapter I - 5
habitable volume, but which have the capability to be accessed for short-term use, such as during equipment change-out or maintenance, or for contingencies. Special consideration should be given to the acoustic levels allowed in the habitable volume should such access require leaving doors open, removing panels, or through other means for sound to enter the habitable volume. Use of design goals in lieu of firm requirements is not recommended unless the goals are clearly required. The use of goals rather than firm requirements sets the stage for efforts that are essentially “do what you can do,” and implies that efforts should be limited to those objectives that can be met with minimum effort or impact, or that can be interpreted as such by those who implement the requirements. This publication presents some important acoustics requirements currently employed by the National Aeronautics and Space Administration (NASA) and its International Partners [IP] in crewed spacecraft applications. Recommended changes discussed in References [3] and [8] will be further addressed. Special emphasis is placed on the background and discussion of the acoustics requirements for continuous noise, since this has been the most significant area of issue in prior space programs.
2.1 Continuous Noise Limits
2.1.1 Background
Spaceflight missions typically range in duration from several days to many months. To assure crew safety, special requirements are needed to administer the 24-hours-per-day, 7-days-per-week exposure to noise in enclosed space vehicle environments. The sum of all systems and hardware continuous noise is a key consideration, since crews are exposed to this noise most of the mission time. Per International Space Station (ISS) definition, noise sources operating for more than 8 hours in any 24-hour period are classified as those producing continuous noise. In 1972, NASA adopted Manned Spacecraft (MSC) Design Standard 145 with Noise Criterion (NC) curves as the acoustic noise criteria standard to manage continuous noise in manned spacecraft [11]. This standard resulted from concerns with adequate acoustic standards that came from the Apollo Program. In an Apollo experience report, recurrent noise problems were noted and it was recommended that special attention in future crew station development efforts be made in acoustics, and that this standard be utilized [12]. The NC curves specify the octave band limits of the acceptable noise levels in habitable environments (Figure 1). This NASA standard sets the maximum allowable continuous sound pressure levels produced by all normal simultaneously operating equipment or systems within work areas at the NC-50 curve.
The NC-50 requirement was proposed for the Space Shuttle Orbiter (herein referred to as Orbiter) and its operating systems, but was considered by many as too difficult to meet and unnecessary [10]. Initially, NC-55 (Figure 1) was adopted as a goal, and later deemed to be a requirement. Noise control efforts were lacking and reactive only in response to unacceptable high levels, such as those found during the pre-delivery tests of the first Orbiter. Mufflers were added to the Orbiter as GFE to reach more acceptable levels. Acoustic levels measured with these mufflers were adopted for the Orbiter mid-deck and flight deck requirements. The Figure 1 curve labeled ‘Shuttle Specifications’ was the current specification limit for the Orbiter

NASA/SP-2015-624 – ACOUSTICS AND NOISE CONTROL IN SPACE CREW COMPARTMENTS – Goodman & Grosveld
Chapter I - 6
mid-deck, flight deck, and attached modules such as Spacelab. This curve, which is equivalent to 68 dBA, was used as the total limit for all Orbiter operations, including payloads. Payloads were allocated a limit of 10 dB lower in all octave bands to ensure that this requirement would be met.
Figure 1. Noise Criteria curves and specifications.
For the United States (U.S.) segments of the ISS, the NC-50 curve was adopted as the limit
for the modules, including their operating systems required for the basic functioning of the module. This limit did not include the acoustics control of payloads because payloads were not provided or controlled by the module supplier. NC-48 was determined to be the limit for the payload complement within a module, as shown in Figure 1 [13]. Each individual rack equivalent item was required not to exceed the NC-40 limit in Figure 1 [14]. Appropriate sub-allocations were given to components that made up the payload rack hardware to ensure that the rack limit was controlled, especially since hardware within racks were added or changed out during ISS missions. The continuous acoustic levels for the integrated systems affecting the ISS crew compartment, including the noise from modules and supplementary hardware – e.g., payloads, non-integrated GFE, or other classifications – is then limited to NC-50 + NC-48, or the approximate NC-52 level shown in Figure 1. The modules in the Russian segment of the ISS use a limit higher than the NC-50 and NC-52 curves, as also shown in Figure 1.
2.1.2 Discussion
The continuous noise limit for crew compartments needs to be set at a level that provides the following:
Adequate communications and word intelligibility.
Octave Band Center Frequency, Hz
So
un
d P
res
su
re L
ev
el,
dB
35
40
45
50
55
60
65
70
75
80
63 125 250 500 1000 2000 4000 8000
NC-52
NC-50
NC-48
NC-40
NC-55
NC-60
NC-65
NC-45
NC-52 Total SpecificationsNC-50 Module SpecificationsNC-48 Payload ComplementShuttle SpecificationsRussion Specifications
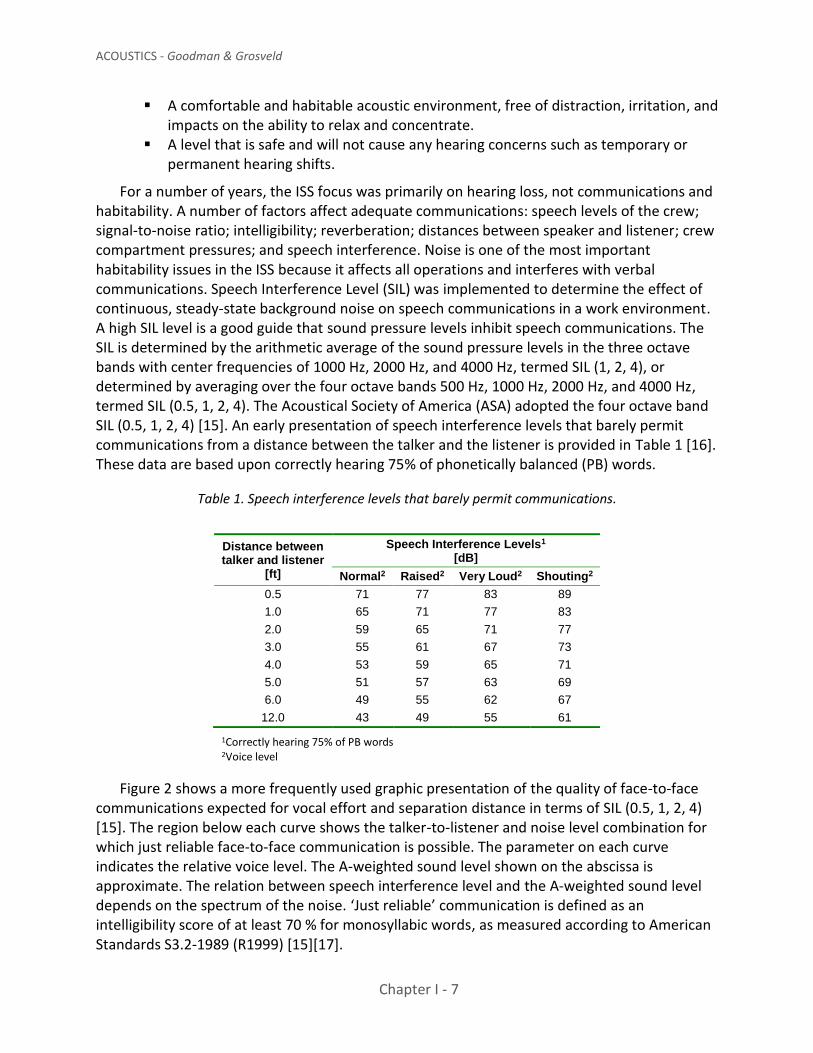
ACOUSTICS - Goodman & Grosveld
Chapter I - 7
A comfortable and habitable acoustic environment, free of distraction, irritation, and impacts on the ability to relax and concentrate.
A level that is safe and will not cause any hearing concerns such as temporary or permanent hearing shifts.
For a number of years, the ISS focus was primarily on hearing loss, not communications and habitability. A number of factors affect adequate communications: speech levels of the crew; signal-to-noise ratio; intelligibility; reverberation; distances between speaker and listener; crew compartment pressures; and speech interference. Noise is one of the most important habitability issues in the ISS because it affects all operations and interferes with verbal communications. Speech Interference Level (SIL) was implemented to determine the effect of continuous, steady-state background noise on speech communications in a work environment. A high SIL level is a good guide that sound pressure levels inhibit speech communications. The SIL is determined by the arithmetic average of the sound pressure levels in the three octave bands with center frequencies of 1000 Hz, 2000 Hz, and 4000 Hz, termed SIL (1, 2, 4), or determined by averaging over the four octave bands 500 Hz, 1000 Hz, 2000 Hz, and 4000 Hz, termed SIL (0.5, 1, 2, 4). The Acoustical Society of America (ASA) adopted the four octave band SIL (0.5, 1, 2, 4) [15]. An early presentation of speech interference levels that barely permit communications from a distance between the talker and the listener is provided in Table 1 [16]. These data are based upon correctly hearing 75% of phonetically balanced (PB) words.
Table 1. Speech interference levels that barely permit communications.
Distance between talker and listener
[ft]
Speech Interference Levels1 [dB]
Normal2 Raised2 Very Loud2 Shouting2
0.5 71 77 83 89
1.0 65 71 77 83
2.0 59 65 71 77
3.0 55 61 67 73
4.0 53 59 65 71
5.0 51 57 63 69
6.0 49 55 62 67
12.0 43 49 55 61
1Correctly hearing 75% of PB words 2Voice level
Figure 2 shows a more frequently used graphic presentation of the quality of face-to-face communications expected for vocal effort and separation distance in terms of SIL (0.5, 1, 2, 4) [15]. The region below each curve shows the talker-to-listener and noise level combination for which just reliable face-to-face communication is possible. The parameter on each curve indicates the relative voice level. The A-weighted sound level shown on the abscissa is approximate. The relation between speech interference level and the A-weighted sound level depends on the spectrum of the noise. ‘Just reliable’ communication is defined as an intelligibility score of at least 70 % for monosyllabic words, as measured according to American Standards S3.2-1989 (R1999) [15][17].

NASA/SP-2015-624 – ACOUSTICS AND NOISE CONTROL IN SPACE CREW COMPARTMENTS – Goodman & Grosveld
Chapter I - 8
Figure 2. Talker-to-listener distances for just reliable face-to-face communication, based on SIL (0.5, 1, 2, 4).
Figure 2 also shows the same evaluation against an A-weighted background noise level (dBA), which uses one-third octave band dependent A-weighting to better evaluate, subjectively, the response of the human ear. Military Standards MIL-STD-1474 [16] and MIL-STD-1472 [18] note that A-weighted sound level, rather than SIL, is the desired requirement. Other tables or presentation forms address the SIL, dBA, and NC levels acceptable for communications. Figure 3 shows the percent intelligibility levels of key words plotted versus the NC curves (or dBA levels) for crew-to-crew communication distances from 1.52 m to 2.44 m (5 ft to 8 ft) [19].
The minimum percentage of intelligibility recommended by NASA is 75% of key words for the satisfactory communication of most messages [20]. This 75% of key words provides 98% sentence intelligibility and single digits understood. An intelligibility of 95% is recommended for sentences spoken under normal vocal effort with the talker and listener being visible to each other [21]. In other recommendations to NASA, a 90% intelligibility of words was recommended as a minimum goal for the Space Shuttle, constituting at least a minimally adequate communication environment [20]. The 90% intelligibility of words would provide exceptionally high intelligibility, with separate syllables understood.
NASA space programs since Gemini have had a communications systems requirement for speech intelligibility in spacecraft-to-ground communications equivalent to a 90% word identification rate. It is questionable why intelligibility requirements for direct crew-to-crew communications should be less than electronic communications for reasonable communication distances. During the Space Shuttle Program, astronauts indicated that the ability to communicate with the ground at all times should be a requirement. Higher intelligibility would seem appropriate, especially when crews are far from Earth and more crew-to-ground autonomy is needed or desired. It should be important to understand single words or numbers
Speech Interference Level, dB
A-Weighted Level, dB(A)
Dis
tan
ce
fro
m T
alk
er
to L
iste
ne
r, m
Dis
tan
ce
fro
m T
alk
er
to L
iste
ne
r, f
t
40 50 60 70 80 90 100
30 40 50 60 70 80 900.25
0.5
1
2
4
8
16
1
2
4
8
16
32

ACOUSTICS - Goodman & Grosveld
Chapter I - 9
spoken, not just sentences. Figure 3 shows that the 75% word intelligibility requirement does not allow sound pressure levels to exceed approximately NC-50.5. For the 90% requirement, levels are not to exceed about NC-48. The 95% requirement does not permit levels greater than NC-46. Figure 3 shows that the NC-50 + NC-48 (approximately NC-52) – the operating systems limit of the ISS plus the payload complement – provides about 58% intelligibility at the stated distances, which is obviously insufficient for clear communications. NC-50 provides 78% intelligibility, which appears to satisfy the referenced NASA STD-3000 standard [19]. NC-55, originally used as a goal and a requirement for the Orbiter and thought to be used for the Apollo Command Module, provides only approximately 31% intelligibility. Human factors assessment of Space Transportation System (STS)-40, STS-50, and STS-57 Space Shuttle flights emphasized concerns with speech communications and other concerns with noise levels in Orbiters [22][23][24]. In a 1969 report [25], Sutherland and Cuadra show that NC-50 is in the region where annoyance occurs close to the edge of a voice impaired zone and above the curve showing the lowest limit of annoyance (Figure 4). NC-55 is in the voice communications impaired zone. The same information was later used in References [22] and [23]. Note that the discussion that follows appears to substantiate that NC-50 can be in the voice impaired zone shown in Figure 4. This seems to be a reason why MIL-STD-1472A called for offices, shops, etc., where frequent communications were required, to have a level of NC-45 maximum. Also, the noise level in general offices, command and control centers, drafting rooms, and similar areas was not to exceed NC-40 [17]. Numerous other engineering, military, and architectural publications or standards – including NASA-STD 3000 [19], Beranek [26], and Bies and Hansen [27] – where NC levels or dBA levels are recommended also suggest that NC-50 would be too high where good communication is required.
Figure 3. Percent intelligibility level versus the NC criterion for male crew-to-crew communication at distances from 1.52 m to 2.44 m (5 ft to 8 ft).
Noise Criterion (NC), dB
Pe
rce
nt
of
Ke
y W
ord
s i
n S
en
ten
ce
s C
orr
ec
tly
Un
de
rsto
od
, %
40 45 50 55 600
10
20
30
40
50
60
70
80
90
100
NC-50
75% IntelligibilityRequirement(NASA-STD-3000)
NC-52 (NC-50 + NC-48)
58.1dBA
60.3dBA

NASA/SP-2015-624 – ACOUSTICS AND NOISE CONTROL IN SPACE CREW COMPARTMENTS – Goodman & Grosveld
Chapter I - 10
Figure 4. Approximate thresholds of human response to ambient noise.
A number of considerations and concerns will affect the issue of what is an acceptable level to ensure good communications. The following reflect on NC-50 as a limit, and suggest some conservatism be applied in using data and establishing limits, as follows:
The data used for this curve in Figure 3 are based on communications between males conversing in the English language in positions face-to-face, and do not take into account female voices or foreign dialects. Females speak softer than males; therefore, SIL (0.5, 1, 2, 4) should be decreased 5 dB, or the X-axis should be moved to the right by 5 dB in curves such as in Figure 3 [28].
It is doubtful that the face-to-face position provides a realistic enough orientation for crews communicating in operational compartments. For example, a listener in a crew compartment may be working close to a loud payload or console during communications or facing a different direction, making voice inputs more difficult to hear.
In zero-gravity, crewmembers may communicate in non-face-to-face orientations, or in face-to-face orientations but with faces skewed, upside down from each other, or possessing facial distortions, thereby affecting normal facial cueing made possible by viewing or reading lips [29].
Other noise sources (tones, intermittent noises, or changes in steady-state levels), room shapes or obstacles, noise source directivity, and reverberation in crew compartments can make the operational ’room‘ much different than the ground test situations that are used to establish limits for speech communications.
Octave Band Center Frequency, Hz
So
un
d P
res
su
re L
ev
el,
dB
20
40
60
80
100
120
140
160
16 31.5 63 125 250 500 1000 2000 4000 8000
Pain
Impairment of Motor or Mental Activity
Hearing Damage Pure Tones(Continuous Exposure)
VoiceCommunication
ImpairedAnnoyance
Hearing Damage(Continuous Exposure) Random Noise
NC-50

ACOUSTICS - Goodman & Grosveld
Chapter I - 11
Published speech intelligibility evaluation techniques apply to low stress in personnel, and steady-state ambient background noise levels – conditions that are quite different from those found in most operational crew compartments.
Tolerance to noise can also be affected by other factors such as confinement, fatigue, monotony, and the inability to change the environment.
NASA has a policy to accommodate a wide range in crew sizes and anthropometric dimensions for designing space vehicles and hardware; similarly, NASA recommends worst-case human strength limits to ensure all eligible crewmembers can perform all critical mission tasks. However, little consideration is given to accommodating a range of factors such as sensitivities and the level of noise tolerance of individual crew personnel. A main conclusion from myriad laboratory and field studies over the past 40 years is that people differ drastically in sensitivity and the resultant degree of annoyance [30]. Another consideration about this variability is brought out in a Russian report indicated “hearing disorders following prolonged exposure to defective noise [i.e., high noise levels] develops first in subjects with decreased resistance to noise, since there are wide fluctuations in individual sensitivity” [31].
Another significant subject affecting intelligible communications is the signal-to-noise (S/N) ratio. This involves the sound pressure levels needed for hearing at the receiving ear to overcome the background sound pressure levels at that ear. While it is generally accepted that a minimum of 10 dB S/N is required for ample communication, other sources recommend 12 dB [32], 15 dB for complicated messages, including listening to foreign languages [33], and 15-18 dBA for complete sentence intelligibility in listeners with normal hearing [34]. The S/N level needed depends upon the quality of communications required, rated from insufficient to excellent. Good refers to an S/N of 6-12 dB, for department stores or training workshops [35]. The S/N required depends upon the communication situation.
Speech intelligibility and communicating distances between speaker and listener are affected by the atmospheric pressure. The atmospheric pressure was expected to be lower than 101.4 kPa (14.7 psia) in Constellation vehicles and some future habitats. Chapter III on Apollo Acoustics and Noise Control shows examples of acoustic level differences between an atmosphere at 14.7 psia and 5 psia (34.5 kPa) used in Apollo. In the Space Shuttle Program, the crew communications distances in the Spacelab module were 4 m (13 ft) across the width and 7 m (23 ft) across its length, which was much larger than the approximate 1.83 m (6 ft) to 3.05 m (10 ft) distances in the Orbiter mid-deck and flight deck. Skylab astronauts gave up trying to communicate when separated more than several meters, when the absolute cabin pressure was 5 psia [36].
2.1.3 Continuous Noise Limits
It is recommended that the total continuous noise throughout crew compartments be limited to NC-50. NC curves covering requirements are to be extrapolated to include the 16 kHz octave band (Figure 5). This is to better cover the audible range at the higher frequencies. Limits for each octave band are provided in Table 2. Use of hearing protection or headsets should not be used to satisfy the NC-50 requirement except in special, short-term cases.

NASA/SP-2015-624 – ACOUSTICS AND NOISE CONTROL IN SPACE CREW COMPARTMENTS – Goodman & Grosveld
Chapter I - 12
Figure 5. Extended continuous NC limits.
Table 2. Octave band sound pressure level limits for continuous noise [dB].
Octave-Band (Hz) 63 125 250 500 1k 2k 4k 8k 16k NC
Work Areas 71 64 58 54 51 49 48 47 46 50
Sleep Areas Maximum 64 56 50 45 41 39 38 37 36 40
Sleep Areas Minimum 54 44 37 31 27 24 22 21 20 25
Note that the NC-50 requirement is applicable throughout the crew compartment. In the
Space Shuttle, the locations where limits were measured for compliance were much lower in sound pressure level than other locations where the crews spent time; the mid-deck center was the quietest location. The NC-50 specification should be used because it provides a nominally acceptable quality of communications and word intelligibility, including accommodation of related concerns noted above, and a limit that is less irritating and more habitable. NC-50 has been the recommended requirement for crewed spacecraft since 1972 and is still NASA’s standard. This criterion has been recommended over the years past for the Orbiter and the ISS [3][8][10][11][19][20][21][37]. Over time, a large number of other reviews, independent and other assessments, crew and management acoustic demonstrations, and crew surveys have recommended or concluded that NC-50 should be the limit. The NC-50 requirement was revisited for commercial spacecraft, and reaffirmed as the requirement for their vehicles. However, since the new vehicles have active payloads, in general, as well as some GFE, NASA is allowing NC-52. This makes the requirement equivalent to some ISS modules with this added equipment [38]. NC-50 limits can be met if the appropriate resources and efforts, experience, and expertise are applied, especially if addressed early in the program. Also, since the Apollo
Octave Band Center Frequency, Hz
So
un
d P
res
su
re L
ev
el,
dB
35
40
45
50
55
60
65
70
75
63 125 250 500 1000 2000 4000 8000 16000
NC-50 Maximum Habitable Space All SystemsNC-48 Maximum Total Supplementary PayloadNC-40 Sleep and Maximum Individual Payload

ACOUSTICS - Goodman & Grosveld
Chapter I - 13
era, considerable efforts have been expended in noise control, analysis, and acoustic materials and their applications. These efforts demonstrated that meeting NC-50 is achievable and that proactive implementation of noise control by experienced personnel is the way to achieve compliance [8][9].
Some ISS modules have met NC-50 or have achieved lower levels [39]. Space Shuttle payloads frequently exceeded their limits until STS-40, when the acoustics situation was very bad and the crewmembers had difficulty communicating and were distressed by the overall levels. The high acoustic levels were caused by payloads in the Spacelab and the Orbiter mid-deck that exceeded their specification limits and these exceedances were waived. Payload acoustics then received appropriate attention and payload manufacturers were pressured to comply with acoustics requirements. As a result, payload acoustics improved and waivers diminished. Hardware suppliers providing hardware within the crews living environment should accept their share of the responsibility to control the vehicle noise. High noise levels can be readily achieved without much effort, especially when acoustics requirements, noise control applications, experienced personnel, and/or commitment are lacking.
In 1997, NASA established a dedicated office of technical responsibility for the overall acoustics requirements, implementation and verification for the ISS, which proved to be of significant value. The Acoustics Office performed acoustic testing of the modules, payloads, and GFE, and also worked remedial activities to help achieve acoustic compliance [1][10], as will be further elaborated on in Chapter V, Acoustics and Noise Control in International Space Station. This alleviated the problem with a number of hardware suppliers not having ready access to this type of testing capability, experience in remedial activities, and/or the availability of acoustic materials and applications. Through such activities, acoustics and noise control finally achieved recognition as an accepted, important technical discipline. Team reviews of spacecraft included an acoustics team. Limits of NC-50 or lower have been proposed for full-up operation. It is interesting to note that U.S. and Russian crews have repeatedly stated that they did not want the vehicle acoustic levels to be too low. The crews consciously or unconsciously want to hear the hardware running so they can sense changes and ensure systems are functional.
Duration of space flight has long been considered a significant factor in establishing acoustic limits. For example, the NASA Johnson Space Center Space and Life Systems Directorate recommended lower limits for Orbiter operational flights than the test flights, due to mission duration [40]. The Russians use a 30-day time period as the discriminator between higher and lower allowable limits. The recommendation made earlier on using NC-50 as the continuous noise limit applies regardless of duration. The acoustics problems experienced in the Apollo Lunar Module were significant – even for their relatively short duration of several days. The glycol pump noise was very loud, precluding crew sleep/rest on the lunar surface. Therefore, changes had to be made to quiet the pump. Fans had to be turned off to allow communications in both the Lunar Module (LM) and the Command Module (CM) (Chapter III, Acoustics and Noise Control in Apollo). The STS-40 mission, which was only 9 days long, offers an extreme example of a relatively short-duration mission that showed quite unacceptable acoustics problems with significant adverse effects to the mission [41]. Also, experience has shown that operations originally conceived as those which can be constrained can be impractical to implement (including sometimes when crewmembers may choose to do things that are not

NASA/SP-2015-624 – ACOUSTICS AND NOISE CONTROL IN SPACE CREW COMPARTMENTS – Goodman & Grosveld
Chapter I - 14
anticipated). In ISS, the Russian segment includes intermittent noise limit requirements relative to full-up operation. These Russian requirements deal with the permissible increase in the overall system levels and set time limits on crew exposures to those levels. In reality, for years these limits were exceeded in some Russian modules, when, if taken literally, the module should have been vacated [1][7]. Another example of exceeding limits in ISS operations was the crew sleeping in the Russian docking module, when the acceptance of the specification exceedance was based upon only a short-duration crew exposure. Also, it seems impractical from an operational standpoint to expect the crew to keep track of, or constrain their time in, modules. There is no doubt, however, that mission duration (or crew exposure) is a very important factor in communications, habitability, and the adverse effects on hearing. Longer-duration exposure clearly exacerbates a bad condition or an undesirable condition, especially if hearing loss or long-term use of hearing protection is at stake.
2.1.4 Sub-Allocations of Key Noise Contributors
An appropriate limit or sub-allocation should be applied to the basic space vehicle, module, or habitat system for other noteworthy hardware located within the crew compartment – hardware that is not required for the basic functioning of the spacecraft, module, or enclosure systems. The ISS, as discussed, uses NC-50 (equivalent to 58 dBA) for the U.S. segment modules, whereas the Russian Specifications curve shown in Figure 1 (equivalent to 60 dBA) was used for modules of the Russian segment. In the past, the other noteworthy noise source categories including such items as payloads, non-integrated GFE, experiments, cargo, or other classifications of hardware became program priorities that dictated significant acoustic apportionment. The NC-48 complement payload limit used in ISS was sized or based upon the original projection that the U.S. Laboratory would have up to 10 payloads manifested within the module. This NC-48 complement is a considerable, generous acoustics allocation for payloads that, combined with the NC-50 limit, produces an effective limit slightly higher than NC-52 and equivalent to 60.3 dBA. As noted previously, the NC-48 + NC-50, which is the effective systems limit of the ISS, provides approximately 58% word intelligibility (Figure 3). This is clearly insufficient. NC-50 provides 78% intelligibility. In retrospect, the ISS NC-48 complement allocation for payloads was too generous, considering its acoustic impacts on the total noise limits. If NC-50 is used for the module crew compartment systems limit, and not for all systems operating, then the payload and other equipment need to be kept at NC-40 or lower. The maximum number of individual payloads could be limited to minimize the complement limit. Another approach to limit payload noise would be to provide additional dedicated acoustic isolation in the vehicle or module design for payload provisions, thereby adding a defined attenuation to the payload emission limit. For example, Space Shuttle payloads were added to the Orbiter at the same interface as stowage lockers, without affording any additional vehicle blockage of payload emissions. Another option would be to lower the module crew compartment limit and balance it with the payload and other limits, especially if the module has limited major noise sources. This lowering of the module limit was recommended on one ISS module under development. Another concern that developed in the Space Shuttle was the late submittal of acoustic waivers on payloads, which were verified late and close to flight date, and after crews trained for their mission with these payloads. The mission and political impacts were such that payload waivers were very hard to reject. STS-40 is a good example of a mission

ACOUSTICS - Goodman & Grosveld
Chapter I - 15
where this occurred and where payload exceedances were waived. Payload noise created significant crew and mission impacts [42].
Individual hardware items making up any complement, such as a payload, need to have a “design to limit” for both continuous and intermittent noise. In the Space Shuttle Program, and in the ISS when limits were set, the acoustics requirements were limits for the total spacecraft system (NC-55 or NC-50 for work; NC-40 for sleep). No limit was specified for individual payload or GFE hardware manifested within the spacecraft or module that did not contribute to the spacecraft or module function. As a contributor to the acoustic levels of an operating vehicle or module, emissions of this type of hardware must be controlled at an appropriate level. As such, these limits could not be directly applied to a separate payload complement or subsystem because of the accumulative and interacting effects when sound sources representing these payload complements were integrated in the complete spacecraft system. A number of hardware developers used the NC-50 spacecraft system limits for their payload complement or GFE, which was not discovered until later in the program when hardware was manifested. Acoustic assessments made after the addition of this hardware brought out concerns with design requirements and resultant mission impacts. Some limited repeat of this problem was experienced with ISS GFE.
2.1.5 Crew Quarters/Sleep Operations
Crewmembers need a reasonable limit for the acoustic levels being present during their sleep periods so that they can obtain necessary rest and recover from any high noise exposure during their activity periods. The importance of adequate sleep and repercussions of loss of sleep are significant [5][19]. The NASA space programs have encountered sleep interference since the Apollo Program. For example, in a survey of 33 Orbiter astronauts, approximately 60% reported that noise disturbed their sleep [43]. Originally, the Orbiter used bags in the mid-deck for sleeping. Bunks were added to provide improved quiet and isolation. During dual shift operations, the sleeping bunks were located in the work area of the Orbiter mid-deck and sleeping crews were frequently awoken by other on-duty crew activities. Orbiter crews were also awakened by the hitting of rings or buckles on the interior of the bunk, or by the crew hitting the outside of the bunks with a locker door or drawer when accessed during dual shift operations. Further improvements were made in the bunks by adding acoustic liners to lower acoustic levels, along with other provisions to dampen noise from hits on the bunk [42]. Both the Orbiter sleep station with liners and the ISS Temporary Early Sleep Station met the NC-40 limit.
Where the crew compartment design permits, the crew quarters or other sleeping provisions should be an accommodation that is isolated or separated from areas of work activity, higher noise level sources, and intermittent noise sources. The crew sleeping area should not exceed NC-40, which is shown in Figure 5 and listed in Table 2 [3][8][20][37]. A minimum noise limit of NC-25 is recommended (Table 1). The sleep station design should minimize effects of such internal or external bumps or dings to the structure and avoid having a structural-borne noise source transmitting to it. To preclude any awakening of sleeping crewmembers, impulse or transient noises in the sleeping area should be limited to less than 10 dB above the background noise [11][20].

NASA/SP-2015-624 – ACOUSTICS AND NOISE CONTROL IN SPACE CREW COMPARTMENTS – Goodman & Grosveld
Chapter I - 16
2.2 Intermittent Noise
Intermittent noise sources, by ISS definition, are those lasting 8 hours or less in any 24-hour period. Operations of such hardware can be very disturbing, wake the crew, and interfere with sleep or nominal activities. Over time, intermittent noise sources usually add to the overall systems noise level.
The 1972, the NASA acoustic standard [11] included maximum allowable sound pressure levels to be used during launch and short-duration mission phases. One of the figures in this standard provided damage risk criteria per exposure per day in octave bands or one-third octave bands. Another figure showed damage risk for one exposure per day for pure tones. Also, a table was included for the minimum time between successive noise exposures. The allowed octave band levels were very high and were listed for as few as 1.5 minutes in duration up to 480 minutes. The limits did not specify the distance away from the source to which the criteria applied. These criteria were also very complex to use and apply to habitable spacecraft. It was later concluded that continuous and intermittent limits needed to be applied to hardware that is manifested within the vehicles, such that each hardware item can be designed and tested independently to meet the appropriate standards. These limits need to be set individually, taking into consideration the quantity of hardware items and their compatibility, and in consonance with the vehicle and the overall total systems limits.
It was decided that habitable spacecraft should not allow levels as high as those in the original NASA acoustic standard [11], which were based upon the Committee on Hearing, Bio-acoustics and Biomechanics (CHABA), National Academy of Sciences, Occupational Safety and Health Administration (OSHA), or other data on what the human ear could tolerate or incur without damage. In addition, the OSHA data applied to work exposure during an 8-hour workday, with 16 hours away from the workplace. In spacecraft applications the intermittent exposure covers exposure during a 24-hour period. Furthermore, the noise associated with trains, jack hammers, and high-level commercial or other noise sources should be precluded in spacecraft hardware. This emphasis on the acceptability of acoustic levels based upon loss of hearing alone came up early in ISS when some modules had very high levels. In spacecraft design, a lot of hardware and systems designs need to be tailored to meet operational and safety requirements of the vehicle, and there is no reason why the hardware should not be tailored to satisfy acoustics needs. Maximum acoustic levels should be consistent with the levels allowed for communications and habitability; hardware that contributes to these levels needs to be designed and verified to be compatible with such requirements. The increase in payloads to the Orbiter created both continuous and intermittent noise concerns, which became very much a concern during STS-40. Because of the severity of STS-40 acoustic problems, NASA formed a Headquarters Acoustic Working Group to focus on remedial actions, including intermittent noise effects and specification changes.
In 1991, intermittent limits were applied to Orbiter payloads. These limits were a good start at restricting payload intermittent noise, but were not graduated into finer divisions of allowed duration, and later were determined to be too high for ISS applications.
Supplementary hardware in the ISS, such as payloads or GFE, is limited in intermittent A-weighted acoustic emissions to the levels and the durations defined in Table 3, with

ACOUSTICS - Goodman & Grosveld
Chapter I - 17
measurements taken 0.61 m (2 ft) from the loudest point on the hardware [14]. Use of this table is recommended. Hearing protection or headsets should not be used to satisfy these limits, except in special, short-term cases.
Table 3. Intermittent A-weighted Overall Sound Pressure Level (OASPL) and corresponding operational
limits for supplementary hardware; e.g., rack-mounted payload hardware and non-integrated GFE.
Maximum Noise Duration (per 24-hours)
A-weighted Overall Sound Pressure Level [dBA]
8 Hours 7 Hours 6 Hours
49 50 51
5 Hours 4.5 Hours 4 Hours
52 53 54
3.5 Hours 3 Hours
2.5 Hours
55 57 58
2 Hours 1.5 Hours 1 Hours
60 62 65
30 Minutes 15 Minutes 5 Minutes
69 72 76
2 Minutes 1 Minute
Not Allowed
78 79 80
Most exercise equipment – e.g., treadmills and ergometers – can be difficult to control to these limits. Depending upon crew size, et cetera, such equipment can produce loud acoustic levels over time and add a lot to the operating crew noise dosage, as well as the crew compartment where other crewmembers may be located. The original U.S. treadmill was especially loud. Both the treadmill and the bicycle ergometer were located in the Service Module (SM), which was the loudest ISS module, and in prime crew use space. The Orbiter treadmill, which emitted a level of 99 dBA, was located and used in the center of the mid-deck – also in prime crew use space. Such use of hardware and other loose equipment raises several concerns: the higher levels produced during their operations, and the raising of the overall acoustic background levels to higher levels over the approximate 16 hours of crew wake time. In ISS, audio dosimeters continually registered high intermittent noise levels during wake or sleep periods inside sleeping quarters. It is believed the effects of such intermittent noises have been underestimated and need further investigation and perhaps remedial action. It is suggested that, if possible, the exercise area be allotted separate quarters or otherwise isolated from prime work areas in the crew compartment. In the ISS, when the initial GFE power strips for electrical power were added, each strip had a high noise level. Approval of these strips was contingent upon limits on the quantity of the strips because of the acoustic impacts. These strips were subsequently quieted. It is recommended that all intermittent noises in the crew compartment be identified and controlled, if possible, to ensure the resultant overall levels are

NASA/SP-2015-624 – ACOUSTICS AND NOISE CONTROL IN SPACE CREW COMPARTMENTS – Goodman & Grosveld
Chapter I - 18
not excessive and are compatible with communications and habitability needs. In the ISS, there is oversight of payload operations from an acoustics standpoint. The limits in Table 3 may need to be lowered if the quantity and acoustic levels of supplemental hardware cannot be controlled adequately (the ISS limits in Table 3 were based upon a module with 10 operating payloads).
2.3 Daily Exposure Limits
Continuous noise levels in spacecraft vary during the day because of the changing levels in the numerous systems that operate, or because of systems that are temporarily switched on or off (the continuous adjustments in environmental and thermal control systems are good examples). As noted previously, intermittent noises can also add to the overall daily acoustic exposure of the crew. Accordingly, in the early part of the Space Shuttle Program, the Space and Life Sciences Directorate at NASA recommended that daily exposure limits should be used to ensure that the crew exposure was limited to safe values. Flight rules were established in the Space Shuttle and ISS to provide operational redlines and rules for crew exposure. In general, the habitable spacecraft environment should not dictate the use of hearing protection.
2.4 Narrowband Component Limits
The glycol pump within the Apollo Lunar Module produced significant narrowband noise levels that required fixing and resulted in emphasis to add new requirements to control the noise levels. The Space Shuttle Program and ISS Program both experienced a number of problems with narrowband elements. A narrowband component is a simple or complex tone, or a line spectrum having intense and steady-state frequency components in a very narrowband – i.e., 1% of an octave band or 5 Hz, whichever is less – and is heard as a musical sound, either harmonic or discordant. The maximum sound pressure level of any narrowband component should be at least 10 dB less than the sound pressure level of the octave band that contains the component [11][20][37].
2.5 Ultrasound and Infrasound Limits
Ultrasound is high frequency sound – i.e., above 15 kHz to 20 kHz – that is inaudible to the human ear. Ultrasonic sound can have physiological effects on humans, and it should be addressed as part of the acoustics environment. It is thought, however, that pertinent concerns regarding ultrasound should be focused on direct body contact and any audible noise associated with the sub-harmonics of the hardware that produces it. Ultrasonic noise can be generated by electrical converters, battery chargers, and other types of equipment. There are two concerns of importance when dealing with this type of noise: it is difficult and costly to predict whether the hardware produces ultrasonic levels in the crew compartment or habitat that are sufficient to be of concern or that exceed defined limits; and the hardware required to measure ultrasonic emissions is costly and not commonly available or used.

ACOUSTICS - Goodman & Grosveld
Chapter I - 19
Use of the extended NC curves to 16 kHz (Figure 5) helps to understand most sub-harmonic effects in the audible range, but it is recommended that some screening be used to determine whether the resultant ultrasonic levels in the crew compartment are of concern or exceed any of the recommended Threshold Limit Values (TLVs) as shown in Table 4 [37][44].
Table 4. Threshold Limit Values for ultrasonic sound in air [37][44].
One-third Octave Band
Center Frequency [kHz]
Ceiling Values
[dB]
Eight Hour Time-weighted Average
[dB]
10 105 89
12.5 105 89
16 105 92
20 105 94
25 110 -
31.5 115 -
40 115 -
50 115 -
63 115 -
80 115 -
100 115 -
Infrasound constitutes acoustic emission below the audible range of human hearing. Limits
are required to prevent nausea, lightheadedness, excitation of body structures, and other effects.
Infrasound in the crew compartment or habitat should be limited to less than 150 dB within the frequency range of 1 Hz to 20 Hz [37].
2.6 Hazardous Overall Noise Limits
Excessively loud overall noise levels can harm the hearing abilities of crewmembers, and should be limited. The sound level during the mission in the crew compartment is limited to a maximum A-weighted Overall Sound Pressure Level (OASPL) of 85 dBA at the crewmember’s ear, except for launch, entry, or mission abort phases [20][37]. This limit includes all acoustic inputs to the ear. Noise associated with launch, entry, cabin depressurization, re-pressurization, or similar activities should be limited to 105 dBA at the crewmembers ear during these types of operations [45][37]. Related 24-hour limits on the noise dose should be implemented [37]. An exception to the 85 dBA limit is only for alarms situations, as noted in Section 2.8. Appropriate limits should be established for launch aborts.
Impulse noise is a burst of noise that is at least 10 dB above the background noise and exists for 1 second or less. Impulse noise, measured at the crewmember’s ear, should be less than the 140 dB peak SPL to prevent trauma to the hearing organs [37].

NASA/SP-2015-624 – ACOUSTICS AND NOISE CONTROL IN SPACE CREW COMPARTMENTS – Goodman & Grosveld
Chapter I - 20
2.7 Reverberation Time
Reverberation time is the time required for the energy density in an acoustic field to reduce to a level 60 dB below its steady-state value. Reverberation time has a pronounced effect on speech intelligibility. Because it is an important criterion for conversational speech, the reverberation time should be adjusted to the volume of the crew compartment for conversational speech [20]. A reverberation time of less than 0.5 or 0.6 seconds is recommended for quiet environments. One report to NASA [21] warned that when the reverberation times exceed 0.5 seconds, a temporal ‘blurring’ of direct versus indirect reverberant sounds into one another occurs, imposing limits on speech intelligibility. Military Standard MIL-STD-1472A [18] indicates the average room sound absorption coefficient shall be at least 0.20, but should not exceed 0.50, and the related range of acceptable reverberation times should not be greater than 0.5, except when the room volume exceeds approximately 4200 cubic feet (119 m3) [17]. NASA changed requirements for reverberation times from a time of approximately 0.5 seconds to: the system shall provide a reverberation time in the crew habitable volume of less than 0.6 seconds in the 500 Hz, 1 kHz, and 2 kHz octave bands [37]. It is recommended that the time of 0.5 seconds (+0.1, -0.3 seconds) for 500 Hz, 1 kHz, and 2 kHz be adopted as the limit, and this same time value attempted to be met for other frequencies within the defined octave band range. The reverberation time should be adjusted to the volume of the crew compartment, as per MIl-STD-1472A [17] or NASA STD-3000 [20].
2.8 Alarms
Alarm signals used within the crew compartment should be loud enough to be heard readily, and be easily discernible by crewmembers when working or sleeping. Signals from local loudspeakers or emanated from other locations within a spacecraft – e.g., adjacent crew compartments or modules – should possess sufficient signal-to-noise ratio to be heard over the local background noise. Using measurements of A-weighted sound levels acquired in accordance with ISO 7731:2003E, method a in Section 5.22.1 [46], the difference between the A-weighted SPL of the signal and the ambient noise shall be greater than 15 dBA [47][48]. If the alarm is intended to arouse sleeping occupants, this 15 dBA requirement should be satisfied. Also, the maximum alarm signal shall not exceed 95 dBA at the operating position of the intended receiver. This allows alarm levels to exceed the 85 dBA hazard limit because of the need to hear the alarm and since alarms can be silenced at the discretion of the crew. Other options covered by this ISO (methods b and c), using effective masked threshold methods, can be used to satisfy the alarm requirements.
3. COMPLIANCE AND VERIFICATION
It is intended that acoustics requirements and limits be met without the attenuation afforded by hearing protection, communication headsets, or other coverings, except during launch, entry, burn, or other short-term limited phases of a mission. An example of a limited phase would be one that occurs during cabin depressurization or other times that can be

ACOUSTICS - Goodman & Grosveld
Chapter I - 21
controlled or are of relatively short duration. The long-term use of hearing protection for nominal operations brings significant problems and operational burdens with it. Meeting the acoustics limit ensures a safe and habitable environment, and precludes the use of the hearing protection and other means noted from being imposed upon the crewmembers and their subsequent reliance on it.
Frequently, acoustics requirements are challenged at the beginning of a program and sometimes later, when difficulties or impacts start to emerge. Requirements such as those recommended here are typically regarded as too strict, and are considered to lead to unacceptable impacts. This Chapter and others – Chapter II, Noise Control, and Chapter V on Acoustics and Noise Control in International Space Station – show otherwise. Verification, another key pillar to a good design, is a process that defines what needs to be completed and how this is to be done to prove that requirements have been met. It is usual practice to have companion verification procedures written by the originator of the requirements. These procedures ensure that every verification includes how to test, demonstrate, inspect, or analyze the system to show that the requirements have been satisfied. To be effective, the verification procedures need to be stated as precisely as possible, and the system test success criteria and the use of necessary equipment need to be defined.
The application of noise control is essential to ensure that the acoustics requirements are implemented [8]. When requirements are not met, resultant waiver or deviation assessment needs to address whether early and reasonable noise control efforts have been applied. If proper monitoring of the design and development process is performed, then reasonable efforts are addressed and attended to as early as possible in the program. Requirements might be perfectly written, but if they are not implemented and verified correctly, and with the right equipment, methods, and experience, then the intent of the requirements may not be achieved.
4. CONCLUSIONS
Stringent acoustics requirements for habitable crew compartments are considered necessary for current and future spaceflights for the protection of the safety and well-being of individual crewmembers, and to aid in ensuring successful completion of their intended missions. The acoustic requirements applicable to all sources in the crew compartment (the habitat or spacecraft systems and integrated hardware, the supplementary GFE, and other payloads) need to be defined early in the program cycle, implemented correctly, and verified. The requirements are uniquely dependent upon the character, duration, frequency content, and level of the noise source emission. A strong effort on noise control is required and an effective noise control plan is necessary to ensure successful implementation. It is vital that program management understands the acoustics requirements, makes a case for having them, and supports their implementation.

NASA/SP-2015-624 – ACOUSTICS AND NOISE CONTROL IN SPACE CREW COMPARTMENTS – Goodman & Grosveld
Chapter I - 22
5. REFERENCES
1. Goodman, Jerry R., International Space Station Acoustics. Proceedings of NOISE-CON 2003. Washington, DC: US Institute of Noise Control Engineering, 2003.
2. Allen, C.S. and Goodman, J.R., Preparing for Flight - The Process of Assessing the ISS Acoustic Environment. Proceedings of NOISE-CON 2003. Washington, DC: US Institute of Noise Control Engineering, 2003.
3. Goodman, J.R. and Grosveld, F.W., Part I - Space Environment (Natural and Induced) – Acoustics. Safety Design for Space Systems. Ed. Gary Musgrave, Axel Larsen and Tommaso Sgobba, Elsevier Publishing Company, 2008.
4. Goodman, J.R. and Grosveld, F.W., Part III – Noise Abatement Design. Safety Design for Space Systems. Ed. Gary Musgrave, Axel Larsen and Tommaso Sgobba, Elsevier Publishing Company, 2008.
5. Smith, Suzanne D., Goodman, Jerry R. and Grosveld, Ferdinand W., Vibration and Acoustics. Fundamentals of Aerospace Medicine. 4th edition. Jennifer A. Fogarty, Jan Stepanek, Robert Johnson, Jeffrey R. Davis, eds., Lippincott Williams and Wilkins, USA, 2008.
6. Clark, J. and Allen, C., Principles of Clinical Medicine for Space Flight. Barratt, M. and Pool, S. Editors, Chapter 24, Springer, May 2008.
7. Bogatova, R.I., Allen, C.S., Kutina, I.V. and Goodman, J.R., U.S.-Russian Cooperation in Space Biology and Medicine. Fifth volume of the Space Biology and Medicine series – Chapter 5. The Habitable Environment of the ISS, Section 1, Microclimate, Acoustic Environment, and Lighting Conditions, 2008.
8. Goodman, Jerry R., Acoustics in habitable space vehicles and enclosures. Proceedings of the Third IAASS Conference, Rome, Italy, 21-23 October 2008.
9. Grosveld, Ferdinand W. and Goodman, Jerry R., Noise control in habitable space vehicles and enclosures. Proceedings of the Third IAASS Conference, Rome, Italy, 21-23 October 2008.
10. Goodman, J.R., Acoustics inside the Space Shuttle Orbiter and the International Space Station. SAE Paper Number 09NVC-340. Proceedings of the SAE Noise and Vibration Conference, St. Charles Illinois, 2009.
11. MSC Design and Procedural Standard, Design Standard 145, Acoustical Noise Criteria, NASA Manned Spacecraft (MSC), NASA Johnson Space Center, 16 October 1972.
12. Allen, Louis D. and Nussman, Dale A., Apollo Experience Report - Crew Station Integration, Volume 1 - Crew Station Design and Development, NASA TN D-8178, March 1976.
13. Payload Verification Program. International Space Station Program Document SSP 57011-B. NASA Johnson Space Center, 2003.
14. Pressurized Payload Interface Control Document. International Space Station Program Document SSP 57000, Rev E. NASA Johnson Space Center, 2000.

ACOUSTICS - Goodman & Grosveld
Chapter I - 23
15. American National Standards Institute (ANSI). American National Standard for Rating Noise with Respect to Speech Interference. ANSI S12.65-2006 (R2011). New York: American National Standards Institute, Inc., 2011.
16. Noise limits. Department of Defense Design Criteria Standard, MIL-STD-1474D, 12 February 1997.
17. American National Standards Institute (ANSI). Method for measuring the intelligibility of speech over communication systems, ANSI S3.2-1989 (R1999). New York: American National Standards Institute, Inc., 2009.
18. Human Engineering Design Criteria. MIL-STD 1472A, May 1970.
19. Man-System Integration Standard. NASA STD-3000, Volume I, Part A. NASA Johnson Space Center, 1995.
20. Pearsons, Karl S., Recommendations for Noise Levels in the Space Shuttle. Bolt, Beranek and Newman Job No. 157160, 1975.
21. CHABA: Guidelines for Noise and Vibration levels for the Space Station. NASA CR 178310. Committee on Hearing, Bioacoustics, and Biomechanics, Commission on Behavioral and Social Sciences and Education, National Research Center, Washington, D.C., 1987.
22. Human Factors Assessment of STS-40/SLS-1. JSC-28514 NASA-JSC Flight Crew Support Division, National Aeronautics and Space administration, 1998.
23. Koros, Anton S., Wheelwright, Charles D. and Adam, Susan C., An evaluation of noise and its effect on Shuttle crewmembers during STS-50/USML-1. NASA Technical Memorandum 104775, Houston Texas, National Aeronautics and Space Administration, September, 1993.
24. Mount, Francis E. and Adams, Susan, Human Factors Assessments of the STS-57 Spacehab-1 Mission. NASA Technical Memorandum 104802, 1994.
25. Sutherland, L.C. and Cuadra, E., Preliminary criteria for internal acoustic environments of orbiting space stations. NASA TM 69-2, 1969.
26. Beranek, L.L, Noise and Vibration Control, Chapter 18 - Criteria for noise and vibration in communities, buildings, and vehicles. 1971.
27. Bies, D.A. and Hansen, C.H., Engineering Noise Control - Theory and Practice. 2nd edition, 1998
28. Crocker, Malcolm J., Editor in Chief, Handbook of Acoustics. Wiley-Interscience Publication, 1998.
29. Cohen, M., Perception of Facial features and Face-to- Face Communications in Space. Aviation, Space and Environmental Medicine, 2000.
30. Berger, E., Royster, L., Royster, J. Driscoll, D. and Layne, M., The Noise Manual. Revised Fifth Edition, Chapter 5: Dixon, W., Royster, J. and Royster, L., Auditory and non-auditory effects of Noise, 2003.

NASA/SP-2015-624 – ACOUSTICS AND NOISE CONTROL IN SPACE CREW COMPARTMENTS – Goodman & Grosveld
Chapter I - 24
31. Matsnev, E.I. and Yakovleva, I.Ya., Peculiarities of the Reaction of the Auditory Analyzer in Man in Prolonged Action of Noise. Aspect of Space Medicine. US Joint Publications Research Service, 10 October 1975.
32. Sanders, M. and McCormick, E., Human Factors and Design. McGraw-Hill Science, 1993
33. Berglund, B., Lindvall, T. and Schwela, D.H., eds., Guidelines for Community Noise. [E-book]. World Health Organization, 1999.
34. Lazarus, H., New methods for describing and assessing direct speech communication disturbing conditions. Environmental International, 16:373-392, 1990.
35. Johnson, D.L., Papadopoulos P., Watfa, N. and Takala, J., Exposure criteria, occupational exposure levels. In: Goelzer, B., Hansen, C.H. and Sehrndt, G.A., Occupational exposure to noise: evaluation, prevention and control. Dortmund/Berlin: World Health Organization; 2001. pp. 79-102.
36. Johnson, C., Skylab Experiment M487, Habitability/Crew Quarters. NASA Technical Memorandum TM X-58163, NASA Johnson Space Center, June 1975.
37. NASA Spaceflight Human Standard. NASA-STD-3001, Volume 2, Human Factors, Habitability, and Environmental Health, 2011.
38. Allen, Christopher S., E-mail to Jerry Goodman on Commercial Spacecraft acoustic limits, 19 July 2013.
39. Allen, Christopher S. and Denham, Samuel A., International Space Station Acoustics - A Status Report. AIAA 2011-5128, 41st International Conference on Environmental Systems, Portland, Oregon, 17 - 21 July 2011.
40. Piland, R., Evaluation of OV-102 Acoustical Noise Test at KSC. Director of Space and Life Systems, Robert Piland to Manager, Space Shuttle Orbiter Project Office, 1980.
41. Goodman, J., STS-40 Acoustical Noise Results and Summary. Memorandum from Daniel Germany, Manager, Orbiter and GFE Projects to distribution, 1991.
42. Goodman, Jerry R., Noise Control in Space Shuttle Orbiter. Proceedings of NOISE-CON 2010, Baltimore Maryland: US Institute of Noise Control Engineering, 2010.
43. Wilshire, Kelli F. and Leatherwood, Jack D., Shuttle Astronaut Survey. National Aeronautics and Space Administration, Langley Research Center, Hampton, VA, 1985.
44. Threshold Limit Values & Biological Exposure Indices (BIE’s). American Conference of Government Industrial Hygienists (ACGIH), 2004.
45. Orion Multi-Purpose Crew Vehicle (MPCV) Program Human-Systems Integration Requirements. MPCV 70024, Revision A, Released 22 January 2014.
46. ISO 7731, Ergonomics - Danger Signals for Public and Work areas - Auditory Danger Signals. Geneva, Switzerland: International Standards Organization, 2003.
47. Allen, Christopher and Hess, Linda, SSP 50005 Alarm Audibility Requirement Changes, 11 January 2012.

ACOUSTICS - Goodman & Grosveld
Chapter I - 25
48. NASA-JSC Acoustics Office submitted Revision to SSP 50005, International Space Station (ISS) Flight Crew Integration Standard, to incorporate Audio Alarm Characteristics Changes. Change directive SSN: 012447, Approved October 2012.
6. ACRONYMS
ASA Acoustical Society of America CHABA Committee on Hearing, Bio-acoustics and Biomechanics CM Command Module dB decibel dBA A-weighted decibel EVA extravehicular activity
GFE Government Furnished Equipment ISS International Space Station LM Lunar Module MSC Manned Spacecraft NASA National Aeronautics and Space Administration NC Noise Criterion OASPL Overall Sound Pressure Level OSHA Occupational Safety and Health Administration PB phonetically balanced S/N signal-to-noise ratio SIL Speech Interference Level
SM Service Module STS Space Transportation System TLV Threshold Limit Values U.S. United States

NASA/SP-2015-624 – ACOUSTICS AND NOISE CONTROL IN SPACE CREW COMPARTMENTS – Goodman & Grosveld
Chapter I - 26
This page intentionally left blank

CHAPTER II
NOISE CONTROL
Jerry R. Goodman
Ferdinand W. Grosveld
CONTENTS
1. INTRODUCTION ........................................................................................................................ 5
2. NOISE CONTROL PLAN .............................................................................................................. 5
2.1 Noise Control Strategy ..................................................................................................... 6
2.1.1 Noise Sources ........................................................................................................ 7
2.1.2 Noise Paths ........................................................................................................... 8
2.1.3 Noise at the Receiver Location ............................................................................. 9
2.2 Acoustic Analysis ........................................................................................................... 10
2.3 Testing and Verification ................................................................................................. 11
3. NOISE CONTROL DESIGN APPLICATIONS................................................................................ 11
3.1 Noise Control at the Source .......................................................................................... 13
3.2 Path Noise Control ......................................................................................................... 15
3.2.1 Mufflers, Resonators, and Other Absorbers....................................................... 15
3.2.2 Combining Mufflers, Isolators, and Added Features in Fans and Other Noise Sources ................................................................................................................ 26
3.2.3 Airflow Concerns and Attenuation ..................................................................... 28
3.2.4 Isolators/Anti-Vibration Mounts and Treatments with Viscoelastic Materials . 29
3.2.5 Absorbing Material within Enclosures and Wraps, Covers, and Barriers ........... 38
3.2.6 Other Material Options ...................................................................................... 43
3.2.7 Sealing of Pathways ............................................................................................ 46
3.3 Noise Control in the Receiving Space ............................................................................ 49
3.4 Post-Design Noise Mitigation ........................................................................................ 54
4. CONCLUSIONS AND RECOMMENDATIONS ............................................................................ 55
5. REFERENCES ........................................................................................................................... 56
6. ACRONYMS ............................................................................................................................. 58

NASA/SP-2015-624 – ACOUSTICS AND NOISE CONTROL IN SPACE CREW COMPARTMENTS – Goodman & Grosveld
Chapter II - 2
TABLE
Table 1. Space Shuttle noise control............................................................................................. 12
FIGURES
Figure 1. Space Shuttle GFE IMU fan mufflers. ............................................................................. 16
Figure 2. Space Shuttle muffler used in the EDO. ......................................................................... 16
Figure 3. Typical lined air duct section for the reduction of inlet and outlet noise. .................... 16
Figure 4. Absorption coefficients of different duct linings with Feltmetal™. ............................... 17
Figure 5. Absorption coefficients of different duct linings with Feltmetal™. ............................... 17
Figure 6. Noise reduction of a standpipe muffler. ........................................................................ 18
Figure 7. U.S. Laboratory IMV fan muffler and cross-section (upper right hand illustration and lower photograph are courtesy, S.A. Denham - Boeing)............................................... 18
Figure 8. Node 3 acoustic insertion loss of IMV muffler averaged over 20 different serial numbers (Courtesy, S.A. Denham - Boeing). ................................................................. 19
Figure 9. Typical muffler design (left) and Node 2 inlet and outlet mufflers. .............................. 19
Figure 10. Columbus muffler (right-hand view showing inside during maintenance). ................ 20
Figure 11. U.S. Airlock pump inlet muffler. .................................................................................. 20
Figure 12. LSG WVA prototype mufflers (colored yellow) and cover (right photograph). ........... 21
Figure 13. Add-on mufflers on the exterior of the EXPRESS Rack payloads. ................................ 21
Figure 14. Commercial Generic Bioprocessing Apparatus muffler view showing hook-and-loop fastener interface with EXPRESS Rack and muffler interiors (outlet muffler on left, inlet on right). .............................................................................................................. 22
Figure 15. Integrated rack noise levels with and without mufflers (EXPRESS Rack 4, Flight 8A). 22
Figure 16. NASA muffler for the FGB. ........................................................................................... 23
Figure 17. Russian-provided FGB muffler. .................................................................................... 23
Figure 18. Two mufflers installed in FGB (left); inboard face of muffler (right). .......................... 24
Figure 19. Outboard face of the muffler showing holes for the Helmholtz muffler approach (left); a close-up of outboard/fan-facing side of muffler on the right. ....................... 24
Figure 20. FGB acoustic standoff (left); an acoustic louver (right). .............................................. 24
Figure 21. Installed standoffs (left) and louvers (right) in FGB. .................................................... 25
Figure 22. Supply duct including a series of rectangular acoustic panels (warts) applied externally to the duct. ................................................................................................. 25
Figure 23. ISS AAA fan and packaging. .......................................................................................... 26
Figure 24. AAA fan inlet slanted muffler holes, with inlet hose removed (left and center views) and outlet muffler showing outlets (right view). ........................................................ 27

NOISE CONTROL - Goodman & Grosveld
Chapter II - 3
Figure 25. ISS IMV fan. .................................................................................................................. 27
Figure 26. ISS IMV fan. .................................................................................................................. 28
Figure 27. Old upstream (left) and new Node 2 (Temperature and Humidity Control System back pressure plates) cabin air diffuser plate doubling the open area. .............................. 28
Figure 28. Old downstream (left) and new Node 2 cabin air diffuser plate with 80% more open area. ............................................................................................................................. 29
Figure 29. Orbiter Avionics Bay fan with rubber-type bellows isolators. ..................................... 29
Figure 30. Baseline Space Shuttle fan and pump isolator assembly. ........................................... 30
Figure 31. Baseline Space Shuttle isolator used in various hardware mountings. ....................... 30
Figure 32. Isolator designs used in IMV fan mounting. ................................................................ 31
Figure 33. AVM in a European ISS module. .................................................................................. 31
Figure 34. ISS Rack with PPA. ........................................................................................................ 32
Figure 35. Locations of the four commercially available isolators used to quiet the U.S. Airlock depressurization pump. ............................................................................................... 33
Figure 36. Barry Controls 505 series vibration isolators. .............................................................. 33
Figure 37. Shuttle dreamtime television avionics cooling. ........................................................... 34
Figure 38. Rubber pad used as a hardware isolator in the ISS Service Module. .......................... 34
Figure 39. Spacelab special AVMs for cabin fan and water separator. ........................................ 35
Figure 40. Summary chart showing Columbus modules benefits of unlocked on-orbit AVMs on cabin fan and CWSAs (Courtesy Marucchi-Cierro, Pietro). ......................................... 36
Figure 41. ATV AVM launch (left) and on-orbit configurations. ................................................... 36
Figure 42. Proposed Spacelab viscoelastic modifications. ........................................................... 37
Figure 43. JEM Kobairo outer rack face isolation approach. ........................................................ 37
Figure 44. Melamine foam liners (white) applied to the HRF Rack drawers area. ...................... 38
Figure 45. Melamine foam liners (white) applied to the rear of the HRF Rack. .......................... 38
Figure 46. Views of melamine foam used in the MSG payload. ................................................... 39
Figure 47. JEM Saibo rack with packaged gold-colored acoustic liner pads on the left; the Kobairo sub-rack payload interior acoustic liner on the right. .................................... 39
Figure 48. Unwrapped ducting (left view) and some of the duct wrap (white colored) applied to the MELFI (on the right). .............................................................................................. 40
Figure 49. White fabric-covered barrier material lined with acoustic melamine foam (grey) covering around the MELFI primary noise source. ...................................................... 40
Figure 50. Fabric barrier material (white) lined with acoustic foam covering the front face. ..... 41
Figure 51. Hard-cover muffler boxes for casing noise reduction. ................................................ 41
Figure 52. Original Russian depressurization pump enclosure. ................................................... 42

NASA/SP-2015-624 – ACOUSTICS AND NOISE CONTROL IN SPACE CREW COMPARTMENTS – Goodman & Grosveld
Chapter II - 4
Figure 53. Redesigned enclosure for Russian depressurization pump in U.S. Airlock. ................ 42
Figure 54. Wrapped compressor and tubing as part of an on-orbit fix of the Service Module air conditioning noise. ...................................................................................................... 43
Figure 55. Cover over the air conditioning unit in the Service Module as part of an on-orbit installed noise mitigation package. ............................................................................. 43
Figure 56. PPA quieting kit. ........................................................................................................... 43
Figure 57. Original Space Shuttle sleep station material. ............................................................. 44
Figure 58. Multi-layer acoustic barrier used in ISS early Temporary Sleep Station (TeSS). ......... 44
Figure 59. ISS multi-layer acoustic barrier used on the Columbus cabin fan assembly. .............. 44
Figure 60. ISS Columbus module cover for accumulator [29] and partition wall layup. .............. 45
Figure 61. IMV fan blanket partially opened on-orbit. ................................................................. 45
Figure 62. ATV noise cover for cabin fan air intake. ..................................................................... 45
Figure 63. FGB ducting covers (green colored). ............................................................................ 46
Figure 64. Mid-deck floor views of penetration of frames and tubing. ....................................... 47
Figure 65. Benefits of sealing the Space Shuttle frame penetrations of the mid-deck floor. ...... 47
Figure 66. Four-tier sleep station periphery seal on mid-deck and a photo at mid-deck floor. .. 47
Figure 67. Effects of sound leaks on the noise attenuation performance of acoustic enclosures and panels [31]. ........................................................................................................... 48
Figure 68. Elastofoam® seal used in HRF Rack. ............................................................................ 48
Figure 69. Rubber seal for Saibo payload rack panel/doors. ........................................................ 49
Figure 70. Left and right view of the Spacelab forward and aft end cone covering. ................... 49
Figure 71. Estimated attenuation of the overall Spacelab background noise levels due to subfloor, end cone treatments, and Hamilton Standard fan improvements. ............ 50
Figure 72. U.S. Laboratory melamine and SOLIMIDE® absorbing cushion applications (Courtesy of S.A. Denham - Boeing). ............................................................................................ 50
Figure 73. JEM Saibo payload rack (left rack) and another rack on the right with gold-colored acoustic blankets. ........................................................................................................ 51
Figure 74. Space Shuttle four-tier sleep station. Acoustic liner kits attach to the white hook-and-loop tabs inside each bunk. ......................................................................................... 52
Figure 75. ISS TeSS, and the ISS and Service Module CQ.............................................................. 52
Figure 76. Crewmembers exercising with cycle ergometer (left) and treadmill (right) on Shuttle mid-deck (different missions). ..................................................................................... 53
Figure 77. Exercise treadmill, work area, and dining table in the same Service Module area. ... 53
Figure 78. Service Module treadmill in use. ................................................................................. 54
Figure 79. Service Module ergometer. ......................................................................................... 54

NOISE CONTROL - Goodman & Grosveld
Chapter II - 5
CHAPTER II
NOISE CONTROL
Jerry R. Goodman
Ferdinand W. Grosveld
1. INTRODUCTION
Limiting the acoustic exposure levels in the crew compartment and habitat is deemed essential to achieve a safe, functional, effective, and comfortable acoustic environment for the crew during space operations. A noise control plan is necessary to define and lay out the efforts required to achieve compliance with the acoustic requirements, and to make certain this happens. The status and progress of the noise control plan needs to be actively monitored to ensure good communications on efforts to limit noise, to identify any areas of emphasis and concerns early in the design process, and to allow timely remedial actions to be taken. Requirements for an acceptable acoustic environment during space operations are discussed in References [1] and [2], and presented in Chapter I, Acoustics. A detailed discussion of the noise control plan and its major components, followed by various applications of successful noise control designs in habitable space environments, are presented in this Chapter. These applications are used to discuss and illustrate generic noise control examples and the variety of approaches used in space crew compartments. Chapter III on Acoustics and Noise Control in Apollo and Chapter IV on the Space Shuttle Orbiter will further describe and elaborate on noise control approaches used in these programs, with emphasis on covering the noise control. The scope of the International Space Station (ISS), Chapter V, is limited because the efforts were so extensive; therefore, only selected examples of noise control efforts are covered. Some ISS noise control cases used herein will not be included in the ISS Chapter.
2. NOISE CONTROL PLAN
A noise control plan is a document that defines the efforts necessary to meet defined requirements. A robust and effective noise control plan should include, at a minimum, the following steps and implementation:
Define the overall noise control strategy Sub-allocate the noise source control limits and identify the control approach for
each source and sub-allocated group or complement Identify all the continuous, intermittent, and other noise sources Determine the character of the noise (broadband, tonal, impulsive, etc.)
NASA/SP-2015-624 – ACOUSTICS AND NOISE CONTROL IN SPACE CREW COMPARTMENTS – Goodman & Grosveld
Chapter II - 6
Rank the sources relative to one another Identify the receiver locations Formulate the acoustics requirements at the receiver locations (sleep,
communications, exercise, long term, occasional use, etc.) Determine the source-to-receiver paths Establish an acoustics analysis approach and testing-based plans for updates Estimate the noise reduction and absorption for the source-to-receiver pathway
treatments in each one-third octave band, and potentially as a function of narrowband frequency
Estimate the attenuation by other noise control measures (mufflers, resonators, active noise/structural control, etc.)
Determine the relative contribution of each source to the total noise after implementing the noise control treatments
Establish testing and verification of noise control approaches and related procedures for the system and hardware components
Conduct acoustic measurements and breadboard testing of systems Update the noise control strategy, the analyses, and the verification testing to
converge to meeting the requirements
2.1 Noise Control Strategy
A sound source radiates energy that is perceived at the receiver location as a pressure deviation from the local ambient pressure. The continuous source is characterized by the sound energy per unit time, or sound power; pressure deviations at the receiver location are measured as sound pressure levels. The sound energy emitted from the source follows various paths into the crew compartment. The acceptability of the resultant acoustic levels at the crew receiver location is defined by the requirements for the habitable environment. Unwanted sound is defined as noise. The application of designs and technologies needed to limit the noise at the source, along its path, and at the receiver location to acceptable levels is referred to as noise control [3][4].
It is very important that noise control be incorporated at the earliest possible time in the design and development cycle. In the Space Shuttle Program, noise control was implemented only after very high levels were evident and problematic. The noise control was stifled for a long time into the program because the desired acoustic limits were set as goals instead of requirements. In the European crewed orbital laboratory Spacelab program, where 20 decibels (dB) of noise reduction was required, it was reported that “It cannot be too frequently stressed for future noise control programs that noise control should be incorporated at the very earliest design stage.” Equipment positioning for Spacelab was not optimized for noise control, as noise abatement was not considered early enough in the program [5]. This point was further elaborated in another paper on Spacelab [6]: “Although it (noise control) was introduced early for Spacelab, it still was not early enough with the consequence that equipment positioning was not optimized for noise control and furthermore new ducts of a larger diameter had to be manufactured to replace the smaller diameter ducting partway through the Spacelab program.
NOISE CONTROL - Goodman & Grosveld
Chapter II - 7
In addition there are possibilities for reducing noise from the noise generating equipment if this is identified early enough, otherwise modification costs become prohibitive.” The Space Shuttle Program implemented some noise control features late, such as the addition of isolators on fans and pump installations and some barriers. Installation of major noise control hardware, such as mufflers, was necessary when unacceptable levels were found right before delivery of the first flight vehicle. Most acoustic problems with the Space Shuttle and the ISS have occurred as the result of the lack of emphasis or focus on meeting the defined requirements and on insufficient noise control in the early stages of the design and development, or the late verification testing with an unacceptable remedial recovery time. As the design and the development continue in a program, the noise control options are more restricted and impacts associated with making changes are more significant or even prohibitive.
2.1.1 Noise Sources
It is important to identify and control the sources of noise, as they provide the acoustic energy to the crew compartment or the habitat of a spacecraft. Controlling noise at the source is most effective since the noise is then prevented from spreading through adjacent structures and passageways. The noise limits allowed for each source should be based on the lowest levels practically attainable when applying the most effective noise source control treatment and considering the total contribution of all similar sources. This will be the most efficient way to facilitate compliance with the established acoustics requirements. Acoustic source and treatment analysis tools may aid in determining whether an individual noise source can be used as is or will need modification or noise control treatment, or whether a new, quieter source will need to be found and implemented.
It is essential that each individual noise source be considered and controlled since a single source can dominate the overall sound spectrum or be prominent at certain frequencies. In the Space Shuttle and the ISS, the vehicle or module level sources were controlled to not exceed a specified level. In ISS, payloads were significant contributors to the overall noise, which were controlled by limits both individually and as a sub-allocated payload group complement. Noise control was also applied by choosing what combination of payloads to fly and by scheduling their operating times.
As noted previously, predominant noise sources affecting the crew compartment, like fans, pumps and other noise producing hardware in spacecraft like those in Apollo, Space Shuttle Orbiter, and International Space Station (ISS) modules are for the most part located behind closeout panels, in bays or ducting, or otherwise located in what is not considered the crew compartment.
Strong consideration should be given to incorporating vibration isolators, muffling provisions, or barriers into the noise sources (fans, pumps, or compressors) to remedy high acoustic emissions by this hardware. Examples of these types of path changes made in noise sources will be shown later in the Section 3, Noise Control Design Applications.
Spacecraft environmental limits for operations are classified as continuous (operate longer than 8 hours during a 24-hour period) or intermittent (operate less than 8 hours during a 24-hour period). Similarly, flight hardware needs to be classified as continuous or intermittent

NASA/SP-2015-624 – ACOUSTICS AND NOISE CONTROL IN SPACE CREW COMPARTMENTS – Goodman & Grosveld
Chapter II - 8
based on the expected operation profile. Fans, pumps, motors, and compressors are usually the dominant continuous noise sources. In crewed space vehicles, the most significant and prevalent noise sources are often the environmental control and life support systems, and the thermal control systems hardware. Special consideration should be given to the design, procurement, and noise control of such hardware. Such hardware needs to have limits established for them – limits that can be controlled and are consistent with achieving compliance with the set habitable volume requirements. Chapter VI, European Noise Control in International Space Station, describes the European approach used in the ISS.
There are two basic alternatives to noise source control:
Select or develop noise sources that are quiet by design while considering acoustic emission, as well as other characteristics in the choice of this hardware; or
Focus on development activities to quiet the selected design or hardware to the extent required.
Sound sources should be characterized by their sound power output level. This information is mostly provided by either the designer or the supplier, and is measured in accordance to the applicable international standards [7]. It is important that noise sources be tested and characterized to reflect their installed configuration in the system, operational mode, and “loading” (e.g., at appropriate flow rates and back pressure). It is recommended that sources be characterized for the possible range in which they could be used, since experience has shown that originally estimated fan flow rate settings can change with more operational experience. In addition, spare flight units of these sources should be characterized so that if a spare is needed to replace an operating one, its acoustic levels and effects can be considered when deciding which unit should be selected for use. Where practical, it is recommended that sound power be used in the noise control strategy, instead of sound pressure (refer to Chapter VI, European Noise Control in International Space Station). Note that the sound power of hardware can be significantly changed by the mounting or other installation effects. It is important to identify the relative contribution of each noise source to the overall noise environment. This helps establish the technical and funding priorities for quieting the sources.
2.1.2 Noise Paths
Two basic sound paths need to be addressed: 1. Airborne 2. Structure-borne
Airborne noise travels through the air to reach the receiver and may come from the inlets and exhausts of air ducts, directly from exposed equipment or radiating structures, or from sound leaking through air passageways or gaps. The strategy for controlling this type of sound transmission involves breaking up the airborne path and/or reducing the emission levels by employing mufflers or silencers for broadband noise, resonators for narrowband noise, active acoustic noise control systems inside the duct or in the receiving space, applications of sound-absorbing materials in the duct lining, and by the use of appropriate materials to seal gaps or block the noise, or balance the duct outlet/diffuser or inlet flow to minimize noise generation.

NOISE CONTROL - Goodman & Grosveld
Chapter II - 9
Structure-borne noise originates from a vibrating source or an impact event, and is transmitted by structural vibrations and the resultant energy transfer at mountings, connections, and from surfaces. This noise can be reduced by the use of vibration isolators, active vibration control systems, applications of passive or active damping materials, by the decoupling of lines to preclude the transfer of vibration, or by otherwise limiting the energy flow through the structure to radiating surfaces. The addition of vibration isolators to fans and pumps is now considered a good design practice in noise control.
Sound radiated from or transmitted through structural enclosures, panels, shelves, and other types of closeout materials may have both airborne and structure-borne components. This noise contribution can be lowered by material changes, the addition of barrier or stiffening materials to reduce transmission, the addition of damping or viscoelastic materials to minimize radiation, the addition of absorbent materials inside the enclosure to absorb acoustic energy, or through the use of active structural acoustic control. The basic task in noise control of these paths is to determine the silencing required, decide on the means to achieve it, and then perform testing to verify the effectiveness of the noise mitigation applications.
2.1.3 Noise at the Receiver Location
Acoustic requirements for the various limits to be met at the location of the receiver or the ear of a crewmember are discussed in Chapter I, Acoustics, and in several publications [1][2][8]. The acoustic environment in the receiving space is affected by the volume, the surface area, the dimensions relative to the acoustic wavelength, the ratio of the dimensions, the reverberation time, and the absorption properties of the crew compartment. At higher frequencies, where the sound pressure levels in the reverberant field are more uniform, the noise in the receiving space is best controlled by increasing the absorption coefficient of the bounding surface areas.
The application of these absorption materials to the interior surfaces of the crew habitat may have to be limited because of flammability, outgassing, wear-and-tear resistance, and other properties of the material. Although porous acoustic materials often have good sound absorbing properties, they might not be suitable for use within the crew compartment if they either particulate or collect moisture, dirt, or other contaminants detrimental to the health and well-being of the inhabitants. If the use of these materials is necessary, they need to be covered or contained such that the aforementioned concerns are remedied, their surfaces need to be hygienically cleanable, and the porous materials need to provide good absorption properties.
At the lower frequencies, a noise control strategy can be based on active acoustic noise control if the application can be made practical and lightweight, using reliable hardware and robust control software. The design should address redundancy and mitigation measures relating to a possible failure of the active control system. When active noise control was considered for the Space Shuttle and ISS, these conditions were considered too difficult to meet and the technology was used only in the ISS headsets. The acoustic environment in the crew compartment or habitat should be controlled at all potential receiver locations. At crew receiver locations, other approaches for reducing the sound pressure levels or changing the effects of the factors described are limited. Options at the receiver location are: enclose the receiver; move the receiver; or require that the receiver wear hearing protection. If the receiver acoustic levels are too high because the predicted or measured levels have been

NASA/SP-2015-624 – ACOUSTICS AND NOISE CONTROL IN SPACE CREW COMPARTMENTS – Goodman & Grosveld
Chapter II - 10
underestimated or not understood adequately, the remedial alternatives lead back to reducing emissions from the noise sources or along the paths to the receiver. This is all the more reason why early testing of the crew compartment with the basic systems installed should be planned and performed to ensure that problems can be found and quantified, and that appropriate remedial actions can be implemented in a timely fashion. When this assessment is postponed until late in the schedule, any noncompliance discovered at that time will more severely impact the design and delivery schedules. Remedial action then will prove to be more difficult and costly. The noise control plan and program flow schedules should include time for this valuable effort, and they should be conducted as early in the program as possible.
The option of moving the receiver is practical only if it is operationally acceptable to move the crew, and if the crew can be relocated to areas not affected by the higher noise levels. By providing separate sleeping quarters, the crewmembers can be isolated from noise that otherwise would disturb their rest or sleep cycles. Controlling the noise directly at the ear of the receiver usually is not acceptable for long-term use because the levels would be tolerable only with the use of hearing protection. In addition, the use of hearing protection presents a number of other crew and operational concerns such as crew discomfort from wearing protection, infections in the ears, and operational problems with their use (e.g., having to remove the hearing protection to communicate). Exceptions can be made for short-duration events such as cabin depressurization, the launch sequence, or some segments during the descent of the space vehicle.
2.2 Acoustic Analysis
An acoustic analysis is an important part of the noise control plan because its predictions provide an estimate for the resultant noise levels in the crew compartment habitat throughout the design phase. The acoustic analysis should be based on a semi-empirical approach in which possibly inaccurate estimates or assumptions, calculations, and procedures in the analysis can be replaced by validated test results later in the program schedule. The analyses should be performed at the component or assembly levels of the contributing sources, and along their paths to the receiver location. The purpose of the semi-empirical acoustic analysis is to have a continuously updated and documented, more realistic and accurate assessment of the acoustic environment as it relates to compliance with the requirements, and to provide insight and understanding of the underlying acoustic principles. This will allow a basis for efficient and effective noise control implementation, and a timely focus on priority remedial actions.
The first step in estimating the noise environment is to quantify the sound power of the noise sources to determine which measures need to be implemented along the pathways to the receiver location, and to establish priorities for noise control efforts. Analysis and testing should be maximized to provide updated information on source, path, and receiver information. Breadboard testing or piggyback testing on major noise source subsystems should be employed to expose acoustic effects. Materials applications should be evaluated experimentally to determine their noise transmission loss. The results from these tests should be used to update the analysis.

NOISE CONTROL - Goodman & Grosveld
Chapter II - 11
Tools are available for the acoustic analyses, each of which has advantages and disadvantages depending on the frequency range of interest, the computational and financial resources available, the accuracy required, the type of source, the nature of the noise paths, and the characterization of the receiving space. These tools include the use of analytical formulas, geometric Computer Aided Design (CAD) models, finite element and boundary element codes, acoustic ray tracing programs [9], Statistical Energy Analysis (SEA) programs, technical and mathematical computing languages, and the traditional programming languages.
2.3 Testing and Verification
Sound power and directivity measurements of noise sources need to be performed, pathway losses determined, and the results should be used to establish possible noise control approaches. Simple mock-ups or prototypes can be employed to determine, inexpensively, the effectiveness of mufflers or other noise-reduction devices. Testing of the designs and design approaches should be performed as often as possible prior to formal verification testing to minimize unforeseen results, provide time for remedial actions if required, and supply a basis for updating the analysis to reflect test results. Acoustic measurements should be included in the breadboard testing of systems such as the Environmental Control System.
It is important to operate each equipment item individually to determine its noise contribution and frequency content relative to the total noise. This provides information for the ranking of the contributing sound sources in selected frequency bands, and helps establish priorities for the work to be done. It will also highlight the frequency bands that become more problematic because of the addition of levels from different sources in the same frequency band. Basic testing requirements for vehicle and hardware should be included in the noise control plan. A test plan needs to be established. The plan needs to include testing to be performed, test setup, conditions, instrumentation, and procedures. Test results need to be documented in a test report, and both the test plan and the test report need to be referenced in the noise control plan, along with applicable updates. As noted previously, it is recommended to allow for testing early in the final checkout so that time is available for remedial action with minimized impact. Verification is very important in that it defines how and what needs to be done to prove that the requirements have been met. Verification plans need to address the testing, demonstrations, analyses, and equipment and programs used in the verification process.
3. NOISE CONTROL DESIGN APPLICATIONS
The noise control plan should define the approach to be used, and the efforts needed to control the noise at the source, along its path, and at the receiver location. The plan should also reflect analyses and testing updates on the noise sources, the pathway effects, and the receiver levels. The applicable acoustic limits at the receiver location(s) need to be identified. All continuous noise sources need to be characterized, the sound power emitted by them determined, and the limits for each noise source or for the noise source complements

NASA/SP-2015-624 – ACOUSTICS AND NOISE CONTROL IN SPACE CREW COMPARTMENTS – Goodman & Grosveld
Chapter II - 12
established to be consistent with the overall limits. Source-to-receiver paths need to be determined as well as the enclosure, transmission, absorption, bend, or other losses along these paths. Fan-powered source radiation emanating from the inlet and exhaust and through ducting with line, branch, and bend losses needs to be addressed. Structural-borne vibration is affected by structural losses, any joints, and the mass and damping of the structural element. Structure-borne effects need to be determined and reduced or isolated by isolators, changes in stiffness, flexible ducting, reduction in radiating area, or other means. The contribution of each source relative to the total noise needs to be estimated to help prioritize which items need remedial actions. Finally, the source surface radiation is reduced by the enclosure losses, transmission losses, and absorption losses within the enclosure, as well as mass, stiffness, and damping of the enclosure. The basic noise control approach used in the Space Shuttle Program is shown in Table 1 [10], and is described in more detail in Chapter IV, Acoustics and Noise Control in the Space Shuttle Orbiter. The Spacelab program used a similar noise control approach, as outlined in Table 1, but balanced the sound power allocated to the noise sources with the sound power absorbed by the spacecraft structure and its contents [5].
Table 1. Space Shuttle noise control.
SYSTEMS ENGINEERING APPROACH
IDENTIFY ALL NOISE SOURCES
PART NUMBER, SYSTEM, LOCATION
CONTINUOUS OR INTERMITTENT
RELATIVE SIGNIFICANCE (CONTRIBUTION TO TOTAL CREW MODULE NOISE)
DETERMINE SOURCE-TO-LISTENER NOISE PATHS
AIRBORNE
ENCLOSURE TRANSMISSION
STRUCTURE-BORNE
ESTIMATE COMBINED SYSTEMS NOISE IN FLIGHT DECK AND MID-DECK
ESTABLISH RELATIVE CONTRIBUTION OF EACH SOURCE TO TOTAL NOISE
SPECIFY NOISE CRITERIA FOR EACH SOURCE (ALLOWABLE)
DEFINE NOISE TEST REQUIREMENTS, COMPONENTS, SYSTEM, GENERAL & ADJACENT WORKING AREAS
IDENTIFY COMPONENTS/SYSTEM ELEMENTS REQUIRING NOISE CONTROL MEASURES
PERFORM ANALYSES TO ESTABLISH DYNAMIC BEHAVIOR OF SUSPECT HARDWARE (FINITE ELEMENT METHODS) AS REQUIRED
DETERMINE SILENCING REQUIRED IN EACH OCTAVE BAND
EVALUATE AVAILABLE OPTIONS (SEE SILENCING OPTIONS)
ASSESS COST, WEIGHT, DOWN-TIME, WORK-AROUND
OPTIMIZE SILENCING MODIFICATIONS
PERFORM NOISE TEST(S) TO VERIFY EFFECTIVENESS OF NOISE MITIGATION APPLICATIONS
COMPARE WITH ALLOWABLE NOISE REQUIREMENTS
NON-COMPLIANCE=REASSESSMENT/ADDITIONAL SILENCING
In the Space Shuttle and the ISS, the noise permitted in the habitable environment is
controlled by budgeting allocations to the equipment sources and the noise pathways.

NOISE CONTROL - Goodman & Grosveld
Chapter II - 13
European modules for the ISS used a somewhat different approach. Budgets are established for the allowable sound power of hardware systems. The sound power contributions of these sources are then determined, and any necessary pathway reduction efforts using testing or a database of prior testing are implemented. Module systems tests are used to verify compliance. Chapter VI discusses the European approach to ISS noise control in more detail.
The sound power present in the crew compartment is the result of controlling the noise source power being channelled through the various radiation and transmission paths, taking into account the acoustic losses through panels, ducts, and inlets/outlets. The sound power at the receiver is then converted to sound pressure level by using the room equation and constants [3]. Although concentrating more on predictions than on the budgeting and control, the approach used for the ISS U.S. Laboratory module similarly focused on the sound power and resultant effects of the design [11]. The ISS Program also developed a comprehensive noise control plan for ISS payload racks [12].
In the Space Shuttle Program, use of sound power limits was considered more effective and preferable to sound pressure level limits, but considered impractical due to costs and complexity. Space Shuttle payload and Government Furnished Equipment (GFE) sources had to comply with a sound pressure limit at 1 foot from the payload surface. The same applied to ISS, except the distance was changed to 2 feet.
3.1 Noise Control at the Source
Research efforts were made to develop quiet fans and pumps for the Space Shuttle because of acoustic concerns [13][14]. Fans were the dominant noise sources within the Space Shuttle flight deck and mid-deck, and are significant noise contributors in the ISS.
Starting in the ISS, the Acoustics Office at NASA Johnson Space Center (JSC) established a quiet fan program to find, test, and catalogue quiet fans for payloads. Fans were tested for flow speed and capacity, flow resistance, and acoustic emissions. The Russians developed larger, module-type quiet fans for the ISS Service Module and other Russian modules because of the multitude of internal noise sources (including more than 40 fans) for which pathway improvements were not able to reduce the noise sufficiently. This significant design effort was highly successful at reducing the emitted noise of a fan from about 61-64 A-weighted decibels (dBA) to 48 dBA, measured at a distance of 1 meter normal to the fan axis [15]. These more quiet fans, plus other measures, helped in lowering high acoustic levels in the Russian modules. More of these quieter fans are planned for modules now on-orbit.
NASA highly recommended improving the fans in the ISS Russian Functional Cargo Block (FGB), or installing at least isolators or other path treatments in the areas of the fans. The noise reduction implemented consisted of a number of large area louvers and standoffs lined with absorbent material that used some of the habitable volume of the crew compartment, and added mass. The farther away from the source, the broader the footprint of the required remedial action. After significant noise control efforts on four ISS Crew Quarters (CQ) by passive means, the noise control provisions contributed to 15% of the CQ volume and to 1% of its mass.

NASA/SP-2015-624 – ACOUSTICS AND NOISE CONTROL IN SPACE CREW COMPARTMENTS – Goodman & Grosveld
Chapter II - 14
The impact is substantial for the ISS, which had four CQ and is in low-Earth orbit. Advanced quiet fans and active noise cancellation would be beneficial for future vehicles [16]. In such designs, it is important to check and adjust the fan balance, minimize the fan rotational speed, optimize the blade shape, evaluate the bearings and motor design, and ensure that the air passageways are smooth inside the fans, the connected ducting, and any bellows used, thereby reducing associated turbulence noise. NASA identified several concerns with protrusions or abrupt corners within the fan during an assessment and testing of the Japanese Life Sciences Glovebox (LSG) payload. These protrusions or abrupt corners created noise amplified by flow path/flow resistance [17]. One recommendation was to use a flow straightener to alleviate the effects of a sharp bend in the fan outlet duct air flow passageway. Testing showed that fans were excessively loud at the higher speeds, with seven speeds planned. NASA recommended quieting the fan design. To preclude excessive acoustic levels and impacts, it was proposed to limit fan speeds to the lower settings. Similar fan and flow path concerns were found and remedied on a Microgravity Science Glovebox (MSG), which was a joint NASA/European Space Agency (ESA) project [18], and in other payloads, including the Human Research Facility (HRF) [19]. NASA worked on a muffler design to quiet the two sets of air filtration fans on each side of the ISS FGB module. This feature was necessary because the fan and installation design were not acoustically optimized and, therefore, generated significant aerodynamic and structure-borne noise [20] [21].
The NASA Constellation Program started multicenter efforts to focus on acoustics in the design of larger, environmental, and thermal fans. Fan design is a trade-off involving many factors that must be matched – factors such as fan source noise, power versus frequency requirements, and size as a function of speed [22]. This experienced spacecraft supplier source reported that “historically, the fans in cabin, rack, and experiments cooling packages, and in life support packages have been a significant source of cabin noise. By paying proper attention to noise control, these can become whisper-quiet.” Also, the ISS Avionics Air Assembly (AAA) fan “operating speeds were selected specifically to match muffler and case-radiation acoustic management characteristics.”
It is important to understand how the noise changes with fan speed, since the operating speed may change as the program evolves. This can be accomplished by fan performance and acoustic characterization testing early in the program hardware selection phase. Reducing the fan speeds to lower the noise emission levels, including reducing the voltage or by using fan speed controllers, has been used where feasible.
Other approaches need to be considered in source noise control. One consideration is to avoid collocating noise sources, but instead spreading the noise sources out to different and, if possible, more isolated areas of the spacecraft. Several examples exist where collocation created problems with high noise levels. The high-noise-level Space Shuttle treadmill was located in the Orbiter mid-deck, which was in the center of crew daytime activity and in close proximity to the sleep station. In the initial ISS Service Module, a large number of fans, air inlets, the carbon dioxide (CO2) removal system, air conditioning/compressor, exercise devices (e.g., treadmill and bicycle ergometer), and the waste management system are collocated in the same area as two sleeping quarters and a dining table. When the Russians transitioned from Mir to ISS, a lot of the high-noise-level fans and other noise producers, which were spread

NOISE CONTROL - Goodman & Grosveld
Chapter II - 15
out over various modules in Mir, were collocated and used in the Service Module, thus creating a difficult acoustic situation.
Although fans are drawing most of the attention, pumps, compressors, and other notable noise sources need to be attended to in the same manner. Pumps created high noise levels in the Apollo Command Module (CM) and Lunar Module (LM). Before the Apollo 7 CM lifted off, a glycol pump was so noisy that it needed to be quieted before flight. This pump was also loud during flight after the fixes. Much effort was expended to quiet the LM glycol pump, which had troublesome high levels, including numerous high narrowband elements, as discussed in Chapter III on Acoustics and Noise Control in Apollo. Two pumps in the ISS U.S. Laboratory generated the loudest noise in the original module. NASA recommended that isolators be used on each of these pumps, but the recommendation was not implemented. As a result, other design modifications were made to reduce emissions, which will be discussed later in this Chapter. Other significant ISS noise sources that required quieting were a depressurization pump in the U.S. Airlock and the air conditioning compressor in the Service Module.
In the case of the ISS Service Module, considerable design and development efforts, funding, and costly on-orbit time was spent on finding mitigation methods to remedy flight noise problems that existed for a long period of time. Applying resources and technology early in a program to obtain quiet noise sources and implementing noise control is recommended.
3.2 Path Noise Control
Many areas need to be dealt with regarding acoustics in pathways and related treatments. This is another reason why source control is so important - to abate high source emissions that otherwise spread out away from them.
3.2.1 Mufflers, Resonators, and Other Absorbers
Noisy fans generate excessive airborne noise in air duct inlets and exhausts. This noise is transmitted into the crew compartment. Considerable noise concerns existed for the Space Shuttle before its first flight, and GFE inlet and outlet mufflers were developed to quiet the effects of the most dominant noise source – the Inertial Measurement Unit (IMU) fans. A sketch of these mufflers is shown in Figure 1 [10]. This design was subsequently changed to a unified muffler that combined the inlet and outlet mufflers in one container. One type of muffler developed for an Extended Duration Orbiter (EDO) is shown in Figure 2 [23]. A number of Space Shuttle mufflers, and most of their benefits, are described in Chapter IV.
As noted, mufflers were also used extensively in the European Spacelab. The ducting in Spacelab was enlarged partway through its program to accommodate added acoustic duct lining. NASA also considered enlarging the Space Shuttle ducting to add mufflers, but there were concerns about associated impacts, as described in Chapter IV, Acoustics and Noise Control in the Space Shuttle Orbiter. More than 200 muffler approaches and material combinations were considered when designing the AAA fan for the ISS [22]. It is good practice to reserve an envelope and provisioning for future addition of mufflers (scaring) in the design of space systems so that, if needed, mufflers can be added later without major impacts.

NASA/SP-2015-624 – ACOUSTICS AND NOISE CONTROL IN SPACE CREW COMPARTMENTS – Goodman & Grosveld
Chapter II - 16
Figure 1. Space Shuttle GFE IMU fan mufflers.
Figure 2. Space Shuttle muffler used in the EDO.
Feltmetal™ (a micron-size fiber sinter bonded into continuous felt) was also used as a lining material in Spacelab. A resonator system is formed in combination with the air gap behind this material and enclosed by the outer surface of the duct, thus consuming sound energy present in the duct [5]. The S-bend and the outlet duct section of the avionics heat exchanger are shown in Figure 3.
Figure 3. Typical lined air duct section for the reduction of inlet and outlet noise.
33.75
1.50 DIA HOLE
1.1
6.75
11.20
5.7
2.05 REF
3.75 DIA
1.50 DIA HOLE
A
A
EXHAUST MUFFLER
DISSIPATIVE
ALUMINUM TUBING
FOAM LINING
INLET MUFFLER
REACTIVE
ALUMINUM TUBING
FOAM LINING
All dimensions in inches

NOISE CONTROL - Goodman & Grosveld
Chapter II - 17
The impedance tube method was employed during the development phase of the duct to measure the absorption coefficients as function of frequency. Some results for different clearances between the Feltmetal™ and the duct wall are shown in Figure 4 [5].
Figure 4. Absorption coefficients of different duct linings with Feltmetal™.
Spacelab acoustic personnel performed impedance tube measurements on various types of Feltmetal™ to help select the most effective material to use in their mufflers, as shown in Figure 5 [5].
Figure 5. Absorption coefficients of different duct linings with Feltmetal™.
One-third Octave Band Center Frequency, Hz
Ab
so
rpti
on
Co
eff
icie
nt,
%
0
20
40
60
80
100
100 200 500 1000 2000 5000 10000
H = 5 cm (95%)H = 2.5 cm (98%)H = 1.25 cm (98%)
Octave Band Center Frequency, Hz
Ab
so
rpti
on
Co
eff
icie
nt,
%
0
20
40
60
80
100
63 125 250 500 1000 2000 4000 8000
FM 127 + 90 mm Polyurethane FoamFM 127 + 90 mm AirgapFM 190 + 13 mm AirgapFM 190 + 25 mm Airgap
DUCT WALL
FELTMETAL
H™

NASA/SP-2015-624 – ACOUSTICS AND NOISE CONTROL IN SPACE CREW COMPARTMENTS – Goodman & Grosveld
Chapter II - 18
The noise reduction obtained by installing the acoustic lining on a standpipe is illustrated in Figure 6 as a function of frequency [5].
Figure 6. Noise reduction of a standpipe muffler.
Mufflers are commonly used accessories in ISS modules to lower noise produced by fans. A
football-shaped muffler or silencer used at the Inter-Module Ventilation (IMV) fan inlet and outlet in the U.S. segment is shown in Figure 7. It is lined inside with a type of Feltmetal™ screen covering applied over absorbent foam material.
Figure 7. U.S. Laboratory IMV fan muffler and cross-section (upper right hand illustration and lower photograph are courtesy, S.A. Denham - Boeing).
WITHOUT ACOUSTIC LINING
WITH ACOUSTIC LINING
NOISE REDUCTION
FREQUENCY, Hz
SO
UN
DP
RE
SS
UR
EL
EV
EL
,d
B
STANDPIPE WITHOUT
ACOUSTIC LINING
WITH ACOUSTIC LINING
STANDPIPE WITHOUT ACOUSTIC LINING
WITH ACOUSTIC LINING

NOISE CONTROL - Goodman & Grosveld
Chapter II - 19
Approximate insertion loss obtained from this muffler is shown in Figure 8.
Figure 8. Node 3 acoustic insertion loss of IMV muffler averaged over 20 different serial numbers (Courtesy, S.A. Denham - Boeing).
The European ISS modules use similar Feltmetal™ mufflers but are lined with Kevlar®, as shown in Figure 9, for a typical muffler design and Node 2 mufflers [24][25][26].
Figure 9. Typical muffler design (left) and Node 2 inlet and outlet mufflers.
Octave Band Center Frequency, Hz
Ins
ert
ion
Lo
ss
, d
B
0
10
20
30
40
50
63 125 250 500 1000 2000 4000 8000

NASA/SP-2015-624 – ACOUSTICS AND NOISE CONTROL IN SPACE CREW COMPARTMENTS – Goodman & Grosveld
Chapter II - 20
A similar muffler installed in the Columbus module is shown in Figure 10.
Figure 10. Columbus muffler (right-hand view showing inside during maintenance).
Foam mufflers have distinct weight advantages over other mufflers such as Feltmetal™ ones, as discussed in Reference [22]. The ISS U.S. Airlock used a foam muffler with a tortuous flow route to improve absorption, as shown in Figure 11.
Figure 11. U.S. Airlock pump inlet muffler.
A centrifuge and an LSG payload were developed, but not implemented, for a Japanese ISS module termed the Centrifuge Accommodations Module (CAM). The enclosure portion of the LSG where the crewmembers inserted their arms to perform work was termed the Work Volume Assembly (WVA). A prototype foam-filled muffler and cover lining quieted noise from the WVA. The WVA prototype muffler and acoustic cover are shown in Figure 12.
A quieting approach considered during the Orbiter development was to add simple mufflers to cabin inlets and outlets. A similar approach was used in the ISS although it was determined not to be effective enough in that application. Some ISS EXPRESS (EXpedite the PRocessing of Experiments for Space Station) Rack payloads originally did not meet their acoustic requirements. “Add-on” flight mufflers were developed and installed on-orbit with hook-and-loop fasteners to remedy this problem. Use of these mufflers meant incursion into other

NOISE CONTROL - Goodman & Grosveld
Chapter II - 21
designated crew volumes, so appropriate waivers had to be processed to allow the mufflers. The mufflers could be readily added to the payload hardware with the hook-and-loop fasteners because the payloads were front breathers, where the air exchange occurred at the front inboard faces of the payloads. Figure 13 shows several of these mufflers attached on the outside front surface of payloads in one of the EXPRESS Racks housing these payloads. Figure 14 shows one of these muffler sets with its hook-and-loop fasteners for payload attachment with red and white covers. Figure 15 shows 5 dBA overall reduction offered by all the EXPRESS Rack mufflers on one flight configuration rack.
Figure 12. LSG WVA prototype mufflers (colored yellow) and cover (right photograph).
Commercial Generic Bioprocessing Apparatus
Protein Crystal Growth Single Thermal Enclosure System
Commercial Protein Crystal Growth
Space Acceleration Measurement System II
Figure 13. Add-on mufflers on the exterior of the EXPRESS Rack payloads.

NASA/SP-2015-624 – ACOUSTICS AND NOISE CONTROL IN SPACE CREW COMPARTMENTS – Goodman & Grosveld
Chapter II - 22
Figure 14. Commercial Generic Bioprocessing Apparatus muffler view showing hook-and-loop fastener interface with EXPRESS Rack and muffler interiors (outlet muffler on left, inlet on right).
Figure 15. Integrated rack noise levels with and without mufflers (EXPRESS Rack 4, Flight 8A).
For the ISS FGB, NASA developed a unique muffler (Figure 16) incorporating improved flow,
noise barrier, absorption, and Helmholtz resonator concepts that reduced both broadband and narrowband noise [20]. The muffler was designed to quiet a pair of dust collector fans, and another similar muffler would be used to quiet a pair of fans located on the opposite wall of the FGB. However, a Russian-provided muffler option was used, having numerous Helmholtz resonators within a rectangular-shaped box-type structure, as shown in Figure 17.
Octave Band Center Frequency, Hz
So
un
d P
res
su
re L
ev
el,
dB
30
35
40
45
50
55
60
65
70
63 125 250 500 1000 2000 4000 8000 Overall dB
Overall dBA
Integrated Express Rack Without MuflersIntegrated Express Rack With Mufflers

NOISE CONTROL - Goodman & Grosveld
Chapter II - 23
Figure 16. NASA muffler for the FGB.
Figure 17. Russian-provided FGB muffler.
This muffler design was subsequently changed to an improved design muffler that still included Helmholtz resonators, but also covered the fan inlets, therefore blocking direct radiation of fan noise into the module, as shown in Figure 18 and Figure 19. Noise coming through air inlets and outlets of the large cooling fans, located at both ends of the FGB, was reduced by large surface area standoffs and louvers covered with absorbent materials (Figure 20). Photographs of their installation in the FGB are shown in Figure 21. These devices were effective in reducing noise levels, but they were also large and occupied significant space in the crew compartment, signifying the impact of post-design added treatment if used instead of quieting the source.

NASA/SP-2015-624 – ACOUSTICS AND NOISE CONTROL IN SPACE CREW COMPARTMENTS – Goodman & Grosveld
Chapter II - 24
Figure 18. Two mufflers installed in FGB (left); inboard face of muffler (right).
Figure 19. Outboard face of the muffler showing holes for the Helmholtz muffler approach (left); a close-up of outboard/fan-facing side of muffler on the right.
Figure 20. FGB acoustic standoff (left); an acoustic louver (right).
Typical side, facing outboard towards fan
Typical side facing inboard

NOISE CONTROL - Goodman & Grosveld
Chapter II - 25
Figure 21. Installed standoffs (left) and louvers (right) in FGB.
Acoustically treated devices, termed splitters, with Helmholtz resonators tuned to attenuate fan inlet or outlet noise were added in a number of places in the ISS U.S. Laboratory ducting to attenuate duct noise [11]. Supply ducts in the laboratory’s cabin fan include rectangular acoustic panels called “warts,” which are applied externally to the duct without changing the inside geometry of the duct (Figure 22).
Figure 22. Supply duct including a series of rectangular acoustic panels (warts) applied externally to the duct.
Each of these panels is a sandwich structure, composed of Feltmetal™ liner, Nomex® honeycomb core, and a fiberglass/epoxy outer shell. The components are bonded together with a structural film adhesive.
5X 1.51
5X 1.58
3.64 4X 3.50 = (14.00)
STARBOARD
PORT
TOP OF THE DUCT
WART
WART
AIRFLOW
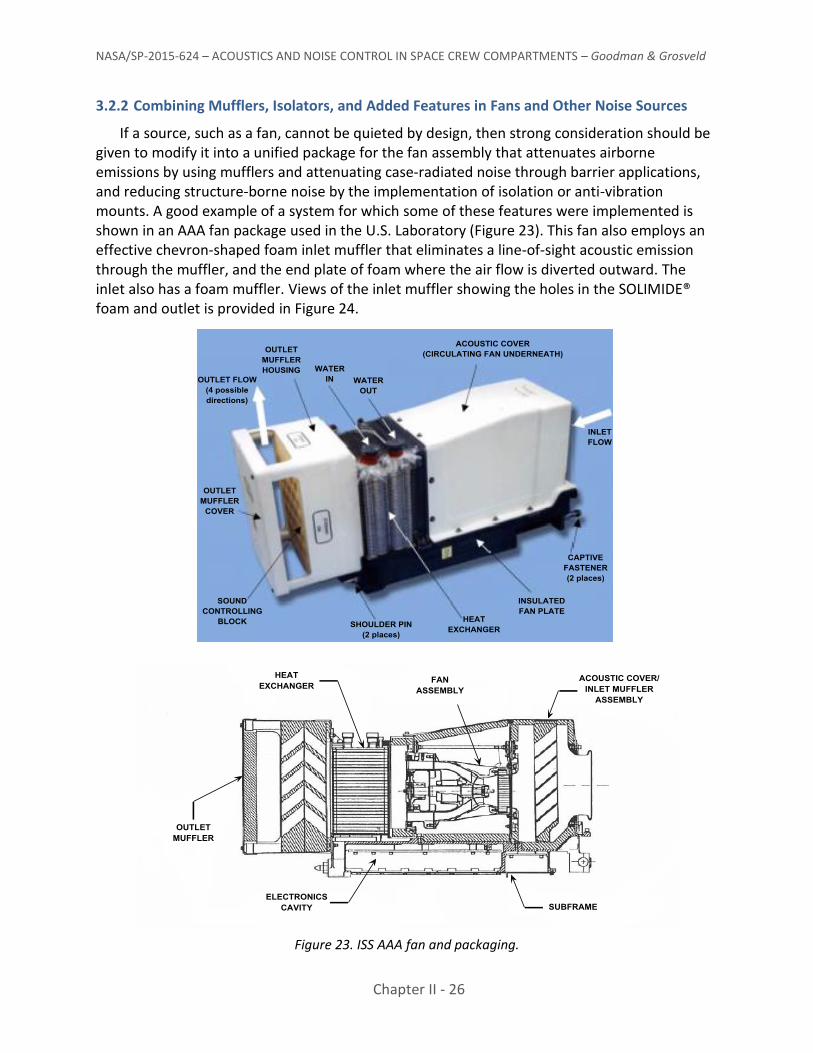
NASA/SP-2015-624 – ACOUSTICS AND NOISE CONTROL IN SPACE CREW COMPARTMENTS – Goodman & Grosveld
Chapter II - 26
3.2.2 Combining Mufflers, Isolators, and Added Features in Fans and Other Noise Sources
If a source, such as a fan, cannot be quieted by design, then strong consideration should be given to modify it into a unified package for the fan assembly that attenuates airborne emissions by using mufflers and attenuating case-radiated noise through barrier applications, and reducing structure-borne noise by the implementation of isolation or anti-vibration mounts. A good example of a system for which some of these features were implemented is shown in an AAA fan package used in the U.S. Laboratory (Figure 23). This fan also employs an effective chevron-shaped foam inlet muffler that eliminates a line-of-sight acoustic emission through the muffler, and the end plate of foam where the air flow is diverted outward. The inlet also has a foam muffler. Views of the inlet muffler showing the holes in the SOLIMIDE® foam and outlet is provided in Figure 24.
Figure 23. ISS AAA fan and packaging.

NOISE CONTROL - Goodman & Grosveld
Chapter II - 27
Figure 24. AAA fan inlet slanted muffler holes, with inlet hose removed (left and center views) and outlet muffler showing outlets (right view).
Another U.S. Laboratory fan, the IMV fan, illustrates several noise control measures – i.e., isolators, a flow straightener and acoustic barriers with spacer fabric covering the fan housing – that can be implemented on fans (Figure 25 and Figure 26). The U.S. Laboratory also incorporates two Common Cabin Air Assembly (CCAA) fans to which the fan contractor added a cover to reduce case radiated noise. Fan casing noise was further attenuated by a honeycomb closeout panel.
Figure 25. ISS IMV fan.

NASA/SP-2015-624 – ACOUSTICS AND NOISE CONTROL IN SPACE CREW COMPARTMENTS – Goodman & Grosveld
Chapter II - 28
Figure 26. ISS IMV fan.
3.2.3 Airflow Concerns and Attenuation
With reference to the prior discussion on fans and flow restrictions in various ISS payloads (Section 3.1), the airflow passageways to and from fans can produce noise because of their length, restrictions, and turbulent flow, thereby raising the total fan-related noise. Ducting also increases noise with increasing length and with bends. ISS air inlet and outlet registers were designed or were later modified to lower the noise in the outlets. During in-flight acoustic measurements in the ISS Node 2, the crew reported excessive noise from a common air diffuser that was part of the Temperature and Humidity Control System. It was found that ground testing was performed with airflow moving slower than it should have because a flow valve was in the wrong position. The result was faster airflow in flight with associated higher noise levels. The perforated plate in the inlet and outlet diffusers were changed out, on orbit, significantly lowering the module noise level (Figure 27 and Figure 28.). Details of what happened in this situation and benefits of changing these plates are discussed in Reference [15].
Figure 27. Old upstream (left) and new Node 2 (Temperature and Humidity Control System back pressure plates) cabin air diffuser plate doubling the open area.

NOISE CONTROL - Goodman & Grosveld
Chapter II - 29
Figure 28. Old downstream (left) and new Node 2 cabin air diffuser plate with 80% more open area.
3.2.4 Isolators/Anti-Vibration Mounts and Treatments with Viscoelastic Materials
Use of vibration isolation is strongly recommended to control structure-borne noise by mechanically isolating fans, motors, pumps, compressors, other major noise sources, as well as the ducting and the lines connected to them. The prime purpose of isolators is to reduce the vibration/structural loads on the hardware they support, but that also reduces the acoustic emission. Vibration paths in ducting-to-ducting or fan-to-ducting connections can be reduced by using rubber-type bellows for connections. Figure 29 shows the Orbiter Avionics Bay fan installation, with use of the red-colored convoluted rubber-type bellows for isolation of the fan-to-structure interface.
Figure 29. Orbiter Avionics Bay fan with rubber-type bellows isolators.
The Apollo CM and LM both had structural-borne noise problems. In the CM, cabin fan and
gas flow noise passing through the heat exchanger was amplified by the cabin structure, resulting in fans being turned off because of high noise levels. In the LM, the glycol pump created resonances in the lines and the structure required a series of modifications to lower the

NASA/SP-2015-624 – ACOUSTICS AND NOISE CONTROL IN SPACE CREW COMPARTMENTS – Goodman & Grosveld
Chapter II - 30
noise levels. Penetrating pipes or cables should be as flexible as possible to avoid creating structural flanking paths; tubing and ducting should have flexible attachments at interfaces with the prime mover. Vibration isolators are used widely in the Space Shuttle and in the ISS. The rubber type of Space Shuttle isolators used under baseline fans and pumps is shown in Figure 30; the isolators for humidity separator and avionics bay fans are shown in Figure 31. The Spacelab program found that special restraints for Spacelab equipment did not allow the use of common anti-vibration mount designs. Limitations were the existing fixed geometrical conditions, space availability, mounting principles, and an inconsistent stiffness requirement for launch dynamics [5]. In some locations, a simple rubber mount would suffice, whereas special designs were needed in other locations.
Figure 30. Baseline Space Shuttle fan and pump isolator assembly.
Humidity separator mounting
Avionics bay fan mounting
Figure 31. Baseline Space Shuttle isolator used in various hardware mountings.

NOISE CONTROL - Goodman & Grosveld
Chapter II - 31
The isolators used on the IMV fan previously discussed are shown in Figure 32.
Figure 32. Isolator designs used in IMV fan mounting.
In the ISS Service Module, isolators were added to 20 of the 40 total number of fans, as an effective remedial measure before quiet fans were developed [15]. The European ISS modules use isolators, termed anti-vibration mounts (AVMs). A typical example is shown in Figure 33 [24][26].
Figure 33. AVM in a European ISS module.
One significant location in the ISS U.S. Laboratory where vibration isolators were not used was in the mounting of the Pump Package Assemblies (PPAs). One PPA is used in each of two separate thermal cooling loops, each located in separate racks. The operating PPA produces high-level noise, and excites the structure of the rack within which it is mounted because of its

NASA/SP-2015-624 – ACOUSTICS AND NOISE CONTROL IN SPACE CREW COMPARTMENTS – Goodman & Grosveld
Chapter II - 32
hard-mounting, and its high mass and energy emission. As a result, the pump rack had to have remedial treatments (Figure 34), including adding acoustic foam and damping material to the rack. The dual PPA units operating within the U.S. Laboratory produced the highest continuous noise levels of any source. Sound pressure levels on-orbit were measured to be very high in locations near the racks. In later ISS missions, it was found that one pump in the U.S. Laboratory could be used to cool both loops by using a by-pass between loops, thus significantly reducing the acoustic noise levels in the Laboratory from a mean of NC-56 to NC-52 [15]. Nonetheless, the resultant single PPA operation still produces the highest broadband noise and narrowband tones of all prime movers in the U.S. Laboratory. As noted previously, the same type pumps used in ISS Nodes were quieted by adding isolators.
Figure 34. ISS Rack with PPA.
A PPA quieting kit design approach was developed to silence this hardware by encasing it in barrier material, but implementation was delayed because of cost until the kit was needed.
NASA successfully quieted a very loud depressurization pump in the U.S. Airlock, primarily by the addition of four inexpensive off-the-shelf, commercial isolators [27]. Figure 35 shows the pump assembly and the location of the four isolators.

NOISE CONTROL - Goodman & Grosveld
Chapter II - 33
Figure 35. Locations of the four commercially available isolators used to quiet the U.S. Airlock
depressurization pump.
The type of isolator used is depicted in Figure 36.
Figure 36. Barry Controls 505 series vibration isolators.
95.2 mm
31
.8 m
m
41.4 mm
Barry Controls Isolators
Typ. (4)

NASA/SP-2015-624 – ACOUSTICS AND NOISE CONTROL IN SPACE CREW COMPARTMENTS – Goodman & Grosveld
Chapter II - 34
The depressurization pump, PPA, and fans noted previously are good examples of where vibration isolation should be applied. In structure-borne noise situations, it is important to reduce the radiating surface area of the vibrating parts to minimize the noise emissions. The original Russian-provided depressurization pump installation for the ISS U.S. Airlock had no isolators and a considerable structural radiating surface area. Rubber pads for isolation were used successfully in other Space Shuttle and ISS applications where there was insufficient room for an isolator, or to isolate ducts or tubing at their mounting to a structure. In a Space Shuttle television application (Figure 37), thin silicone rubber pads were installed underneath six small fans, providing a 5 dB reduction in overall noise level and resulting in compliance with the requirements.
Figure 37. Shuttle dreamtime television avionics cooling.
Rubber pad materials were used in the ISS Service Module to isolate the hardware, as
depicted in Figure 38.
Figure 38. Rubber pad used as a hardware isolator in the ISS Service Module.
THREE MUFFIN FANS
SILICONE RUBBER
PAD INSTALLED
UNDER FANS
Rubber pad under fan used as isolator
Three muffin fans
Silicone rubber pad Installed under fans
Silicone rubber pad Installed under fans

NOISE CONTROL - Goodman & Grosveld
Chapter II - 35
One problem that was frequently encountered in the Space Shuttle and is currently encountered in the ISS is how to use isolators for mounting equipment that work well in zero gravity and also work for launch vibrations/loads. One method is to design a structural link that can be released during on-orbit operations, shown in Figure 33. Another approach, used by Spacelab, was specially designed AVMs, which were tailored for a cabin fan and water separator, as shown in Figure 39 [5].
Figure 39. Spacelab special AVMs for cabin fan and water separator.
A soft and a hard spring were used to accommodate both launch vibration and zero-gravity
needs in one AVM. In the Space Shuttle Program, representatives from the SpaceHab module (which was installed in the payload bay) requested some acoustic support in efforts to lower noise levels. It was found that the basic cabin fan package, which had a hard-mounted installation, produced a significant amount of noise. A procedure was developed to loosen the fan mounts when the module was on-orbit and to install a silicone-type pad under the package so the package could free-float on-orbit. This lowered the noise level significantly. AVM bolts were installed in the ISS Columbus module for launch support of two cabin fan assemblies and two Condensate Water Separators (CWSAs). The bolts were then loosened during on-orbit operations. Figure 40 shows the benefits gained by releasing these AVMs on-orbit. In the ISS Automatic Transfer Vehicle (ATV) module, the Europeans found that the cabin fan assembly mount shown in Figure 33 and Figure 41 could be made acceptably “soft” by reducing the on-orbit nominal torque by one-third [26].

NASA/SP-2015-624 – ACOUSTICS AND NOISE CONTROL IN SPACE CREW COMPARTMENTS – Goodman & Grosveld
Chapter II - 36
Figure 40. Summary chart showing Columbus modules benefits of unlocked on-orbit AVMs on cabin fan and CWSAs (Courtesy Marucchi-Cierro, Pietro).
Figure 41. ATV AVM launch (left) and on-orbit configurations.
Damping treatments should be applied to surfaces of structural members or closeout panels when problems are encountered with resonances that cannot be resolved with isolators. Damping treatment can range from simple thin coatings of viscoelastic materials to multi-layered constrained treatments. An example of a treatment is shown in Figure 34 on the ISS pump package door structure that was found to vibrate. This is similar to a viscoelastic material that was applied to machined-out waffle panels in the four-tiered Space Shuttle sleep station.
Octave Band Center Frequency, Hz
So
un
d P
res
su
re L
ev
el,
dB
10
20
30
40
50
60
70
80
31.5 63 125 250 500 1000 2000 4000 8000
System with locked AVM
System with unlocked AVM
Background noise
NC-50minus 3 dB
NC-50
System Test 3.1.1.X derived - with unocked AVMSystem Test 3.1.1.X directly measured (with locked AVM)Background noise - Test 2.3.2.XNC-50 requirementNC-50 minus 3 dB audible noise requirement

NOISE CONTROL - Goodman & Grosveld
Chapter II - 37
After the STS-40 acoustic problems, NASA proposed several remedial actions to lower the noise of the Spacelab module, including the addition of viscoelastic coverings to the S-bend assembly, the CO2 control assembly, and the inlet area of the cabin fan, as shown in Figure 42. The Japanese Experiment Module (JEM) Kobairo sub-rack payload used rubber grommets under fasteners to vibration isolate outer rack panels, as shown in Figure 43.
Figure 42. Proposed Spacelab viscoelastic modifications.
Figure 43. JEM Kobairo outer rack face isolation approach.

NASA/SP-2015-624 – ACOUSTICS AND NOISE CONTROL IN SPACE CREW COMPARTMENTS – Goodman & Grosveld
Chapter II - 38
3.2.5 Absorbing Material within Enclosures and Wraps, Covers, and Barriers
To reduce enclosure radiation and internal reverberation, acoustic foam was effectively used inside a large number of ISS module and payload racks to absorb sound, and thus lower noise levels inside the racks. Figure 34 shows foam added to the PPA rack interior door and to the underside of the PPA mounting shelf, as well as damping material added to the inside face of the rack door to reduce vibrations.
Figure 44 and Figure 45 show melamine foam liners (white color) added to the HRF Rack tray areas and to the rear of the rack [19]. Figure 46 shows two views of melamine foam used in the MSG payload. Figure 47 shows gold-colored acoustic absorption liners that are used inside the JEM Saibo (living cell) Experiment Rack and for the Clean Bench part of the rack. Also shown is interior to the rack liners in the Kobairo sub-rack payload. This rack and the JEM Kobairo rack both use a significant number of such liners inside rack outer panels. It is believed that these pads consist of TA-301 SOLIMIDE® foam covered by Kevlar® fabric.
Figure 44. Melamine foam liners (white) applied to the HRF Rack drawers area.
Figure 45. Melamine foam liners (white) applied to the rear of the HRF Rack.

NOISE CONTROL - Goodman & Grosveld
Chapter II - 39
Barriers were used to enclose noise sources, to apply onto structural enclosures, or to wrap around ducting to reduce the radiated noise. During initial Orbiter Flight Tests, flexible barriers were applied on-orbit in the Space Shuttle mid-deck floor to cover screens in the floor that had to be opened during launch and entry, thereby blocking off the noise from the equipment in the lower equipment bay. Barrier material was also needed to attenuate noise emanating from three Space Shuttle avionics bays through existing structural closeouts and was used in the IMV fan shown in Figure 25 and Figure 26 to reduce case-radiated noise. Flexible barrier wrap was found to help attenuate duct noise in the ISS JEM and in a NASA-provided cover layup for a Russian depressurization pump installation in the U.S. Airlock. Such applications were also implemented in the quieting of the ducting in the Minus Eighty Degree Laboratory Freezer (MELFI) payload rack (Figure 48) [28].
Figure 46. Views of melamine foam used in the MSG payload.
Figure 47. JEM Saibo rack with packaged gold-colored acoustic liner pads on the left; the Kobairo sub-rack payload interior acoustic liner on the right.

NASA/SP-2015-624 – ACOUSTICS AND NOISE CONTROL IN SPACE CREW COMPARTMENTS – Goodman & Grosveld
Chapter II - 40
Area of tubing covered in right view
Figure 48. Unwrapped ducting (left view) and some of the duct wrap (white colored) applied to the MELFI (on the right).
Barrier material, with decoupling and absorbent acoustic foam underneath, was wrapped
around (Figure 49) the principal MELFI noise source – a Brayton engine – to reduce the source noise and was added to the front face by a hook-and-loop attachment (Figure 50).
Figure 49. White fabric-covered barrier material lined with acoustic melamine foam (grey) covering
around the MELFI primary noise source.
Area of tubing covered in right view

NOISE CONTROL - Goodman & Grosveld
Chapter II - 41
Figure 50. Fabric barrier material (white) lined with acoustic foam covering the front face.
Hard-cover muffler boxes lined with foam were used in Spacelab to attenuate the noise from the cabin fan, the avionics fan, and the water separator (Figure 51) [5].
Figure 51. Hard-cover muffler boxes for casing noise reduction.
WATER SEPARATOR
MUFFLER BOX
CABIN FAN
MUFFLER BOX
Water separator muffler box
Cabin fan muffler box

NASA/SP-2015-624 – ACOUSTICS AND NOISE CONTROL IN SPACE CREW COMPARTMENTS – Goodman & Grosveld
Chapter II - 42
Isolators were previously discussed as being added to quiet a Russian depressurization pump in the U.S. Airlock. In addition to the isolator change, the pump was removed from its metal container as shown in Figure 52, and placed inside an enclosure that was lined with foam and barrier material to absorb and block radiated noise. The inside of liner was made up of more porous fabric, followed by foam, a barrier material, and then a much tighter weave fabric, as shown in Figure 53. The change to the enclosure provided improved means for absorbing and blocking acoustic emissions, and eliminated a large radiating metal surface that was the original container for the pump.
Figure 52. Original Russian depressurization pump enclosure.
Inside Liner Outside liner Folded into box
Depressurization pump installed Lid closed, final configuration
Figure 53. Redesigned enclosure for Russian depressurization pump in U.S. Airlock.
The noise of an air conditioning compressor, a principal noise generator in the ISS Service Module, was reduced by acoustic wrap covering around the compressor and the tubing as an on-orbit fix, and then by adding a closeout panel to cover the unit (Figure 54 and Figure 55).
Inside liner Outside liner Folded into a box
Depressurization pump installed Lid closed, final configuration

NOISE CONTROL - Goodman & Grosveld
Chapter II - 43
Figure 54. Wrapped compressor and tubing as part of an on-orbit fix of the Service Module air conditioning noise.
Figure 55. Cover over the air conditioning unit in the Service Module as part of an on-orbit
installed noise mitigation package.
In view of the high noise levels emitted by the ISS PPA, shown in Figure 34, NASA investigated a PPA quieting kit, with Boeing and pump contractors support. A barrier wrap shown in Figure 56 was developed and tested. This approach, although effective, was not implemented because of costs, and was later not required because of the use of only one of the two pumps for cooling both loops, as previously discussed.
Figure 56. PPA quieting kit.
3.2.6 Other Material Options
The original Space Shuttle sleep station was made out of honeycomb panels with Kevlar® face sheets, with the core made out of nylon/phenolic and filled with fiberglass to lessen noise transmission into the bunks (Figure 57).
Cover added

NASA/SP-2015-624 – ACOUSTICS AND NOISE CONTROL IN SPACE CREW COMPARTMENTS – Goodman & Grosveld
Chapter II - 44
Figure 57. Original Space Shuttle sleep station material.
Multi-layer blankets consisting of material layups, as shown in Figure 58, have been proven to be an exceptional barrier when significant transmission loss is needed. These multi-layer blankets are used in numerous applications in ISS modules, including the U.S. Temporary Early Sleep Station (TeSS) and in European modules. The layup was modified somewhat in later CQ. Single-layer Nomex®, double-layer Nomex® separated by a gap, and a number of variations of materials layups have been used and perfected by Italian engineers in European modules (Chapter VI). The ISS Columbus module used a similar cover for the cabin fan assembly (Figure 59), the accumulator, and for a partition wall design, which is shown in Figure 60.
Figure 58. Multi-layer acoustic barrier used in ISS early Temporary Sleep Station (TeSS).
Figure 59. ISS multi-layer acoustic barrier used on the Columbus cabin fan assembly.
Nomex® Nomex® Felt
BISCO® BISCO®

NOISE CONTROL - Goodman & Grosveld
Chapter II - 45
Figure 60. ISS Columbus module cover for accumulator [29] and partition wall layup.
The ATV module used a multi-layer wrap over the Cabin Fan Assembly (CFA) similar to that used on the Columbus module. Figure 61 shows this blanket partially opened up on-orbit. Figure 62 shows the ATV noise cover for the cabin fan air intake.
Figure 61. IMV fan blanket partially opened on-orbit.
Figure 62. ATV noise cover for cabin fan air intake.
PORON® HT
Nomex®
Durette®
PORON® HT

NASA/SP-2015-624 – ACOUSTICS AND NOISE CONTROL IN SPACE CREW COMPARTMENTS – Goodman & Grosveld
Chapter II - 46
Covers were installed on the ventilation ducting in the FGB to lower noise that was radiated into the module (Figure 63). Various types of materials and material lay-ups were employed to reduce emissions through rack front faces, structural closeouts, fan casings, and shrouds, or used simply as other closeouts. Closeout materials are often made of Nomex®, honeycomb, aluminum, rigid fiberglass, or composite structural materials that are covered with sound barrier materials or multi-layer layups of barrier materials and spacers, depending upon the structural needs and the amount of sound transmission loss required. Materials and their properties are very important in acoustic applications; it is essential to have space-qualified materials with good acoustic properties available. Materials and their applications are covered in Chapter VII.
Figure 63. FGB ducting covers (green colored).
3.2.7 Sealing of Pathways
Also important when considering pathway treatment is the sealing off of leak paths between high noise areas and the habitable volume. In the Space Shuttle, a large number of areas needed to be sealed: the floor that separated the lower equipment bay from the Orbiter mid-deck; the avionics bays; all removable panels in the floor or avionics bays; sidewall panels between decks at avionics bay junctions; and at cable and tubing penetrations. Figure 64 shows several instances of typical frame, structural frame, and tubing penetrations in the mid-deck floor and sealing of the tube penetrations. Figure 65 shows the effect of sealing off 22 frames running down the Orbiter sidewalls and penetrating the mid-deck floor. The transmission loss varied from 29 dB with sealing to 10 dB without sealing [30]. The four-tier sleep station installation include a bulbous seal around the periphery where interfaced with the Space Shuttle mid-deck wall, floor, and ceiling (Figure 66). This seal is believed to have helped to structurally isolate the sleep station from the Orbiter structure. The effects of direct air path leakage through openings such as these and other cut-outs or pass-throughs can result in serious degradation of the noise control performance, as shown in Figure 67 [31]. Using the example in Reference [31], the figure shows that “if a 100 square foot (9.3 square meter) partition or panel has a potential of 40 dB transmission loss at any given frequency, and then having a 1 square foot loss or leak in that panel, the transmission loss will be reduced to about 20 dB unless it is acoustically sealed. Thus it is seen that only a small leak resulted in a gross decrease in the acoustical performance of the panel.”

NOISE CONTROL - Goodman & Grosveld
Chapter II - 47
Mid-deck floor
Penetrations
Figure 64. Mid-deck floor views of penetration of frames and tubing.
Figure 65. Benefits of sealing the Space Shuttle frame penetrations of the mid-deck floor.
Figure 66. Four-tier sleep station periphery seal on mid-deck and a photo at mid-deck floor.
Octave Band Center Frequency, Hz
Tra
ns
mis
sio
n L
os
s,
dB
0
10
20
30
40
63 125 250 500 1000 2000 4000 8000
Sealed
1% Leak
10% Leak
Penetrations Mid-Deck Penetrations

NASA/SP-2015-624 – ACOUSTICS AND NOISE CONTROL IN SPACE CREW COMPARTMENTS – Goodman & Grosveld
Chapter II - 48
Figure 67. Effects of sound leaks on the noise attenuation performance of acoustic enclosures and panels [31].
The HRF Rack in the ISS needed several different types of sealing to effectively lower noise emittance, including gaskets and clips [19]. Figure 68 shows Elastofoam® material that was applied to rack seat tracts in the HRF, providing a rack-to-payload seal.
Figure 68. Elastofoam® seal used in HRF Rack.
The JEM Saibo and Kobairo Experiment Racks both use rubber-type material or gaskets to seal off slits and vacant holes in racks, and door seals such as shown in Figure 69 of the Saibo rack to seal panel door when closed. Aluminum tape is also used to seal crack areas in JEM.
Potential Transmission LossWithout Leaks, dB
Tra
nsm
issio
n L
oss W
ith
Leaks, d
B
1
2
3
5
7
10
20
30
50
70
100
0 10 20 30 40 50 60
% Opening
0
0.1
1
25
10
20
30
40
50
Elastofoam®

NOISE CONTROL - Goodman & Grosveld
Chapter II - 49
Figure 69. Rubber seal for Saibo payload rack panel/doors.
3.3 Noise Control in the Receiving Space
Russian engineers have used material linings to dampen ambient noise during the life of Salyut 6. The internal sound insulation layer was thickened by 50% to enable it to dampen the stations ambient noise, although afterward the cosmonauts still considered it noisy [32]. The materials were described as “hero” cloth that mildewed and was subsequently replaced by washable leather, which was easier to clean [33].
During the period after STS-40 (1991-1992) when NASA Headquarters convened an Acoustics Working Group to remedy acoustic concerns in the Space Shuttle Program, the Spacelab Program at NASA Marshall Space Flight Center proposed adding 1 inch of acoustic foam to the forward end and aft end cone of the Spacelab to reduce noise levels, as shown in Figure 70. This proposed change, plus subfloor treatments offered significant noise reductions from 250 Hz to 4000 Hz. The subfloor and end cone benefits on the background noise are shown in Figure 71 (it is not known whether this change was implemented).
Figure 70. Left and right view of the Spacelab forward and aft end cone covering.
Rubber type seal for payload panel door
1” SOLIMIDE® foam with perforated Tedlar® face

NASA/SP-2015-624 – ACOUSTICS AND NOISE CONTROL IN SPACE CREW COMPARTMENTS – Goodman & Grosveld
Chapter II - 50
Figure 71. Estimated attenuation of the overall Spacelab background noise levels due to subfloor, end cone treatments, and Hamilton Standard fan improvements.
Applications of foam end cone cushions were considered for use in the U.S. Laboratory as a way to break up acoustic standing wave patterns and to help lower acoustic levels by changing the absorption properties of the module and the related room coefficient. Analysis results are shown in Figure 72.
Figure 72. U.S. Laboratory melamine and SOLIMIDE® absorbing cushion applications (Courtesy of S.A. Denham - Boeing).
Octave Band Center Frequency, Hz
So
un
d P
ressu
re L
evel, d
B
30
40
50
60
70
80
63 125 250 500 1000 2000 4000 8000
NC-50 Spacelab requirement
NC-40 Payload requirement
Spacelab average background noise per SL-1Including the attenuation due to subfloor treatmentIncluding the attenuation due to subfloor and endcone treatmentsIncluding Hamilton Standard fan improvements
Octave Band Center Frequency, Hz
So
un
d P
ressu
re L
evel, d
B
40
45
50
55
60
65
70
63 125 250 500 1000 2000 4000 8000
NC-52U.S. Laboratory without cushions (60.0 dBA)One-inch Melamine cushions (58.1 dBA)One-inch Solimide cushions (57.7 dBA)

NOISE CONTROL - Goodman & Grosveld
Chapter II - 51
This approach, although beneficial, was not used because of concerns with the cushions being damaged and contents being released during on-orbit operations. This subject matter is worthy of further consideration to improve the absorption, if surfaces can be made durable and reliable. In the ISS, the JEM has a Saibo (living cell) Experiment Rack, which is partially covered with acoustic materials to raise the JEM overall absorption. Figure 73 shows the Saibo rack with gold-colored fabric acoustic blankets and another JEM payload with similar acoustic blankets attached to it, further adding to the absorptive area of the JEM. Another example where large surface areas of absorbent material were applied was in the numerous covered standoffs and louvers in the ISS FGB module. Their purpose was to quiet the large fan noise emanating from inlets and outlets at both ends of the module, but their very large surface area also helped as a module absorber and demonstrates the benefits of using large area absorbent surfaces. (Figure 20 and Figure 21).
It is suggested that research be performed into new materials that are wear resistant, cleanable, and resistant to microbiological growth to enhance the acoustic absorption of interior surfaces of the crew compartment and closeout materials.
Figure 73. JEM Saibo payload rack (left rack) and another rack on the right with gold-colored acoustic blankets.
Another way to provide acceptable sound pressure levels at the receiver location is to
provide special isolating enclosures such as sleep stations for use by the crew during periods of rest and sleep. This approach was used in the Space Shuttle (Figure 74) and the ISS (Figure 75). Such enclosures, generally designed into the crew compartment or added later as a kit, accommodate the need for lower noise levels for rest and sleep, and help protect the crew for intermittent noises that have been found to awake the crew on missions.

NASA/SP-2015-624 – ACOUSTICS AND NOISE CONTROL IN SPACE CREW COMPARTMENTS – Goodman & Grosveld
Chapter II - 52
VERTICAL DIRECTION AT LANDING
Figure 74. Space Shuttle four-tier sleep station. Acoustic liner kits attach to the white hook-and-loop tabs inside each bunk.
TeSS ISS Crew Quarters TeSS Service Module (Kayuta)
Figure 75. ISS TeSS, and the ISS and Service Module CQ.
In the Space Shuttle, the treadmill, cycle ergometer, and rowing devices were located in the center of the mid-deck, where crews slept, ate, accessed stowed items, and performed experiments with payloads mounted on the mid-deck. The treadmill was measured at 99 dBA. Figure 76 shows crewmembers using the cycle ergometer and treadmill on the mid-deck, in the same area where the rower devices were located on other missions.

NOISE CONTROL - Goodman & Grosveld
Chapter II - 53
Figure 76. Crewmembers exercising with cycle ergometer (left) and treadmill (right) on Shuttle mid-deck (different missions).
Initially, the exercise treadmill, crew work space, and dining table were in the same area of the Service Module as where the crew members ate, slept, and conducted waste management (Figure 77). In Figure 78, a Service Module crewmember is shown exercising on the treadmill; in Figure 79, another crew member is using the ergometer. The exercise equipment generates noise that raises the acoustic levels and the resultant exposures for all the crew in that module. Total exercise time on the original ISS averaged about 7.5 hours per day for a three-person crew, or nearly half of the crew wake time. The provision of special, closed-off areas for exercise or use of exercise modules are approaches to lower the noise exposure to crewmembers who are not exercising.
Figure 77. Exercise treadmill, work area, and dining table in the same Service Module area.

NASA/SP-2015-624 – ACOUSTICS AND NOISE CONTROL IN SPACE CREW COMPARTMENTS – Goodman & Grosveld
Chapter II - 54
Figure 78. Service Module treadmill in use.
Figure 79. Service Module ergometer.
In other cases, systems can be turned off or flows can be diminished to lower ambient noise
levels during sleep if such adjustments are acceptable. The use of hearing protection devices for launch, entry, and during limited applications also is an acceptable way to control levels at the receiver locations, but only for relatively short durations. These devices have been used in Apollo, Space Shuttle, ISS, and other space programs. Unfortunately, use of hearing protection may have a negative effect on communication (e.g., where the wearer has pre-existing hearing loss or removal of devices is frequently required to hear the other person). Such devices have become uncomfortable for long-term wear, or have been creating pain or irritation in the ear canals and have caused infections. They have been reluctantly used in nosier modules in ISS.
As can be seen from these examples, options for reducing noise at the receiver are limited, which is why efforts need to be focused and expended on effective source and path measures.
3.4 Post-Design Noise Mitigation
Noise control is most effective when it is implemented early and as part of the normal design effort, and it should be approached in that manner. Noise control in Space Shuttle development was inadequate and changes were made late in the process with GFE mufflers and sealing applications to resolve high acoustic levels. Shuttle payloads also had problems with

NOISE CONTROL - Goodman & Grosveld
Chapter II - 55
not meeting requirements and, because of impacts to remedy their problems, waivers were required (until after STS-40 when waivers were much more difficult to obtain). Noise control was part of the design process during Space Shuttle modifications for EDO, and the modifications were successful. There are many examples of successful noise control efforts designed into ISS modules and payloads. Most ISS modules were successful in meeting their acoustic requirements, or being within an acceptable deviation from them. ISS payloads implemented a comprehensive noise control plan. For the most part, these plans were successful in obtaining compliance. Good examples of this are the HRF payload quieting efforts [19] and those on the EXPRESS Sub-Rack payloads, discussed previously and shown in Figure 13, Figure 14, and Figure 15.
When mitigation efforts are required to remedy an unacceptable noise situation after design completion, there is risk of considerable impacts being made to development, costs, and schedules. It is also possible that late mitigation is only partially effective because the design or impacts preclude a more effective remedy. A highly successful mitigation effort to limit noise along numerous pathways was implemented late in the flight assembly process for the MELFI payload [28]. This effort, however, was only possible because the design allowed such modifications and special efforts were expedited to implement them. It took substantial MELFI project cooperation, technical consultation, design efforts, travel, materials support, testing efforts, and impacts to be successful.
As discussed previously, the ISS Service Module mitigation effort has taken considerable time, and has been costly in terms of funding and mission timeline impacts. Remedial pathway actions have been extensive, but insufficient to bring the module to specification levels without further work at the noise sources. The ISS FGB is another example where mitigation efforts added a lot of additional hardware after the first flights, although implementation of measures was accomplished relatively quickly and without significant module design impacts. These and other experiences show that acoustics should be considered and designed into the crew compartments and habitats early in their development phases.
4. CONCLUSIONS AND RECOMMENDATIONS
A noise control plan is essential to define and layout all the basic efforts required to achieve resultant acoustic compliance. Included in the plan should be the overall noise control strategy and acoustic analysis approach, testing and verification plans, and focused efforts to use or develop reasonably quiet noise sources, and otherwise deal with pathway treatments. Current baseline data for noise sources, pathway measures and their effectiveness, and resultant receiver levels should be included in the plan. Pathway noise control measures and the many design approaches that can be taken warrant careful consideration. If feasible, quieting the noise source itself is still the best approach. The noise control plan needs to be actively updated and monitored. To implement effective noise control in the design, it is necessary to understand the principles of acoustics, have noise control experience, and be able to apply these to making the acoustics in the compartment acceptable. Such background and capabilities are needed by those responsible for a safe, functional, and comfortable acoustic

NASA/SP-2015-624 – ACOUSTICS AND NOISE CONTROL IN SPACE CREW COMPARTMENTS – Goodman & Grosveld
Chapter II - 56
environment in the crew compartment. It is imperative that the program management be supportive of the need to comply with established requirements, and use the noise control efforts required to achieve compliance. Support of this nature is necessary for acoustics to be successfully designed into space crew compartments and enclosures.
5. REFERENCES
1. Goodman, Jerry R. and Grosveld, Ferdinand W., Acoustics in habitable space vehicles and enclosures. Proceedings of the Third IAASS Conference, Rome, Italy, 21-23 October 2008.
2. Goodman, J.R. and Grosveld, F.W., Part I - Space Environment (Natural and Induced) - Acoustics, Safety Design for Space Systems, Ed. Gary Musgrave, Axel Larsen and Tommaso Sgobba, Elsevier Publishing Company, 2008.
3. Beranek, L.L., ed., Noise and Vibration Control. New York: McGraw-Hill, 1988.
4. Goodman, J.R. and Grosveld, F.W., Part III – Noise Abatement Design. Safety Design for Space Systems, Editors: Gary Musgrave, Axel Larsen and Tommaso Sgobba, Elsevier Publishing Company, 2008.
5. Eilers, D., Wyn-Roberts, D. and Borches, I.U., Audible Noise Control in Spacelab - As Part of Manned Spacecraft Environmental Control. Proceedings of Spacecraft Thermal and Environmental Control Systems Symposium, Munich, 10-12 October 1978 (ESA SP-119, November 1978).
6. Wyn-Roberts, D. and Hassan, H., Noise Control in Spacelab. Noise and Fluids Engineering; Proceedings of the Winter Annual Meeting, Atlanta, Ga., 27 November - 2 December 1977.
7. ISO, Acoustics - Determination of sound power levels of noise sources using sound pressure - Precision methods for anechoic and hemi-anechoic rooms. ISO Standard 3745:2003E. Geneva, Switzerland: International Standards Organization, 2003.
8. Smith, Suzanne D., Goodman, Jerry R. and Grosveld, Ferdinand W., Vibration and Acoustics. Fundamentals of Aerospace Medicine, 4th Edition, Editors: Jennifer A. Fogarty, Jan Stepanek, Robert Johnson, Jeffrey R. Davis, Lippincott Williams and Wilkins, USA, 2008.
9. Pilkinton, G.D. and Denham, S.A., Accuracy of the International Space Station acoustic modeling. Proceedings of NOISE-CON 2005. Washington, DC: US Institute of Noise Control Engineering, 2005.
10. Hill, R.E., Space Shuttle crew module prior noise reduction efforts. Presentation to the Acoustical Noise Working Group. NASA Johnson Space Center, Houston, Texas, 1992.
11. Denham, S.A. and Kidd, G., US laboratory architectural control document. Volume 14: Acoustics. NASA D683-149-147-1-14. Houston, TX: NASA Johnson Space Center, 1996.
12. NASA, Acoustic noise control plan for ISS payloads. NASA SSP-57010B Draft, Appendix H. Houston, TX: NASA Johnson Space Center, 2000.

NOISE CONTROL - Goodman & Grosveld
Chapter II - 57
13. Misoda, J. and Magliozzi, B., Fan and pump noise control. Hamilton Standard Division of United Aircraft, Windsor Locks, Connecticut, Contract NAS 9-12457, May 1973.
14. Lovell, John S. and Magliozzi, Bernard, Design guidelines for quiet fans and pumps for space vehicles. Hamilton Standard Division of United Aircraft, Windsor Locks, Connecticut, NASA/CR-2008-215427, October 2008.
15. Allen, Christopher S. and Denham, Samuel A., International Space Station Acoustics - A Status Report. AIAA 2011-5128, 41st International Conference on Environmental Systems, Portland, Oregon, 17-21 July 2011.
16. Broyan, James L., Welsh, David A. and Cady, Scott M., International Space Station Crew Quarters Ventilation and Acoustic Design Implementation. AIAA 2011-5128, 41st International Conference on Environmental Systems, Portland, Oregon, 17-21 July 2011.
17. Tang, Punan, Goodman, Jerry and Grosveld, Ferdinand, Vibro-Acoustic Characteristics of the Life Sciences Glovebox Work Volume Qualification Module. Heerle, Netherlands, 30 March 2004.
18. Grosveld, F.W., Goodman, J.R. and Pilkinton, G.D., International Space Station acoustic noise control - Case studies. Proceedings of NOISE-CON 2003. Washington, DC: US Institute of Noise Control Engineering, 2003.
19. Phillips, E.N. and Tang, P., ISS Human Research Facility (HRF) acoustics. Proceedings of NOISE-CON 2003. Washington, DC: US Institute of Noise Control Engineering, 2003.
20. Grosveld, F.W. and Goodman, J.R., Design of an acoustic muffler prototype for an air filtration system inlet on International Space Station. Proceedings of NOISE-CON 2003. Washington, DC: US Institute of Noise Control Engineering, 2003.
21. Goodman, Jerry and Grosveld, Ferdinand, Functional Cargo Block (FGB) Acoustic Considerations. NASA Johnson Space Center, 8 May 2001.
22. O’Conner, E.W., Space vehicle fan package acoustic characteristics. SAE Technical Paper 951647. Society of Automotive Engineering, 1995.
23. Hill, R.E., Space Shuttle crew module prior noise reduction efforts. Presentation to the ISS acoustic noise technical interchange meeting with NASA/NASDA, 1996.
24. Marucchi-Chierro, P.C., Destafanis, S., Martini, M. and Ullio, R., Audible Noise and Microgravity Control of Pressurized Module under On-Orbit Vibro-Acoustic Environment. ESA SP-581. European Conference on Spacecraft Structures, Materials and Mechanical Testing 2005, Noordwijk, The Netherlands, 10-12 May 2005.
25. Marucchi-Chierro, P.C., Cabodi, G., Quagliotti, F., and Riva, Nicola, Testing and Characterization of ISS Pressurized Modules vs. On-Orbit Vibro-Acoustic Environment - Lessons Learned. Acta Astronautica, V. 63, Iss. 1-4 July 2008, pp. 310-323.
26. Marucchi-Chierro, P.C., Destafanis, S. and Bandini, F., Comfort and Microgravity Design of Pressurized Module Node 2 under On-Orbit Vibro-Acoustic Environment. IAC-03-I.2.06.

NASA/SP-2015-624 – ACOUSTICS AND NOISE CONTROL IN SPACE CREW COMPARTMENTS – Goodman & Grosveld
Chapter II - 58
Proceedings of the 54th International Astronautical Congress, Bremen, Germany, 29 September – 3 October 2003.
27. Grosveld, F.W., Goodman, J.R. and Pilkinton, G.D., International Space Station acoustic noise control - Case studies. Proceedings of NOISE-CON 2003. Washington, DC: US Institute of Noise Control Engineering, 2003.
28. Tang, P., Goodman, J. and Allen, C.S., Testing, evaluation, and design support of the Minus Eighty Degree Laboratory Freezer (MELFI) payload rack. Proceedings of NOISE-CON 2003. Washington, DC: US Institute of Noise Control Engineering, 2003.
29. Martini, M., Marucchi, P.C., Beruto, E., et. al., Audible noise/human vibration assessment for integrated Columbus payload. Alcatel Alenia Space, Italia S.p.A., CPI_RP-AI-0006, 2006.
30. Hill, R.E., Space Shuttle Orbiter crew compartment acoustic noise - environments and control considerations. Report 94SSV154970. Rockwell International, Houston, Texas, 1994.
31. Hirschorn, Martin, Noise Control Reference Handbook. Industrial Acoustics Company, 1989.
32. Bluth, B.J. and Helppie, M., Soviet Space Station Analogs. Second edition, NASA Grant NAGW-659, August, 1986.
33. Konoalov, B., New features of ‘Salyut-7’ Station. Moscow Izvestia, 82N32277, 1982.
6. ACRONYMS
AAA Avionics Air Assembly
ATV Automatic Transfer Vehicle AVM anti-vibration mount CAD Computer Aided Design CAM Centrifuge Accommodation Module CCAA Common Cabin Air Assembly CFA Cabin Fan Assembly CM Command Module CO2 carbon dioxide CQ Crew Quarters CWSA Condensate Water Separator dB decibel dBA A-Weighted decibel
EDO Extended Duration Orbiter ESA European Space Agency EXPRESS EXpedite the PRocessing of Experiments for Space Station FGB Functional Cargo Block GFE Government Furnished Equipment HRF Human Research Facility IMU Inertial Measurement Unit

NOISE CONTROL - Goodman & Grosveld
Chapter II - 59
IMV Inter-Module Ventilation
ISS International Space Station JEM Japanese Experiment Module
JSC Johnson Space Center
LM Lunar Module
LSG Life Sciences Glovebox MELFI Minus Eighty Degree Laboratory Freezer MSG Microgravity Science Glovebox PPA Pump Package Assembly SEA Statistical Energy Analysis TeSS Temporary Early Sleep Station WVA Work Volume Assembly

NASA/SP-2015-624 – ACOUSTICS AND NOISE CONTROL IN SPACE CREW COMPARTMENTS – Goodman & Grosveld
Chapter II - 60
This page intentionally left blank

CHAPTER III
ACOUSTICS AND NOISE CONTROL IN APOLLO
Jerry R. Goodman
CONTENTS
1. INTRODUCTION ........................................................................................................................ 6
2. COMMAND MODULE ............................................................................................................... 6
2.1 Acoustic Requirements .................................................................................................... 6
2.2 Command Module Crew Compartment Configuration ................................................... 9
2.3 Preflight Acoustic Tests and Noise Control Efforts ........................................................ 13
2.4 Acoustics and Noise Control During Operational Flights .............................................. 19
2.4.1 Apollo 7.............................................................................................................. 20
2.4.2 Apollo 8.............................................................................................................. 20
2.4.3 Apollo 9.............................................................................................................. 20
2.4.4 Apollo Missions 10-17 ....................................................................................... 20
2.5 Command Module Summary Discussion and Comments ............................................. 21
3. LUNAR MODULE ..................................................................................................................... 23
3.1 Acoustic Requirements .................................................................................................. 23
3.2 Lunar Module Crew Compartment and System Configuration ..................................... 26
3.3 Preflight Acoustic Tests ................................................................................................. 32
3.4 Lunar Module Acoustics and Noise Control During Operational Flights and During This Time Period .................................................................................................................... 32
3.4.1 Apollo 9, LM-3 (Launched March 1969) ............................................................ 32
3.4.2 Apollo 10, LM-4 (Launched May 1969) ............................................................. 36
3.4.3 Apollo 11, LM-5 (Launched July 1969) .............................................................. 36
3.4.4 LM-7 Acoustic Testing During Altitude Tests at Kennedy Space Center, 7 November 1969 ................................................................................................. 37

NASA/SP-2015-624 – ACOUSTICS AND NOISE CONTROL IN SPACE CREW COMPARTMENTS – Goodman & Grosveld
Chapter III - 2
3.4.5 Late 1969 Meetings and Efforts on Remedial Actions for the Lunar Module Cabin Noise ........................................................................................................ 41
3.4.6 Lunar Module Test Article 8 Testing (November-December 1969) .................. 46
3.4.7 Other Efforts on Lunar Module Noise Analysis, Testing, and Control .............. 49
3.4.8 Apollo 12, LM-6 (Launched November 1969) ................................................... 50
3.4.9 Apollo 13, LM-7 (Launched April 1970) ............................................................. 50
3.4.10 Apollo 14, LM-8 (Launched January 1971) ........................................................ 50
3.4.11 Apollo 15, LM-10 ............................................................................................... 51
3.4.12 Apollo 16, LM-11 ............................................................................................... 51
3.4.13 Apollo 17, LM-12 ............................................................................................... 51
3.5 Summary Comments Lunar Module Acoustics and Noise Control ............................... 51
4. DISCUSSION, CONCLUSIONS, AND RECOMMENDATIONS ..................................................... 53
5. REFERENCES ........................................................................................................................... 55
6. ACRONYMS ............................................................................................................................. 59
APPENDIX A: LUNAR MODULE-7 ACOUSTIC ALTITUDE TESTS AT KENNEDY SPACE CENTER, 7 NOVEMBER 1969 ................................................................................................................. 60
TABLES
Table 1. 1969 Block II CM crew compartment acoustic limits. ....................................................... 8
Table 2. LM-7 Altitude Chamber tests, sound pressure levels for depressurized and ambient environments experienced at the CMDR’s and LMP’s sleep and operating locations with varying hardware noise sources (P1=Water Glycol Pump #1; P2= Water Glycol Pump #2; F1=Suit Fan #1; Off=All systems off). .............................................................................. 37
Table 3. Candidate acoustic treatments including expansion chamber, cylindrical with protruding inlets developed by R. Dickson, NASA-MSC, and others developed by GAC and LM Contractor (Table from R. Dickson). .................................................................. 46
Table 4. The memorandum [46] summarizes the results of LTA-8 at 14.7 psia acoustic testing and muffler benefits. ....................................................................................................... 48
FIGURES
Figure 1. 1963 specification noise tolerance, emergency limits. ................................................... 7
Figure 2. CM “all systems” one-third octave band specifications with and without the suit compressor. ..................................................................................................................... 8
Figure 3. CM “all systems” octave band specifications with and without the suit compressor. ... 9
Figure 4. CSM. ................................................................................................................................. 9

APOLLO - Goodman
Chapter III - 3
Figure 5. CM. ................................................................................................................................. 10
Figure 6. Split view of the CM crew compartment layout. ........................................................... 10
Figure 7. CM basic crew locations. ............................................................................................... 11
Figure 8. CM ECS simplified flow diagram [4]. .............................................................................. 11
Figure 9. Location of CM ECS hardware in the left-hand equipment bay, without closeout panels. ............................................................................................................................ 12
Figure 10. CM cabin fan location. ................................................................................................. 12
Figure 11. Three suited crewmembers in CM couches. ............................................................... 13
Figure 12. Measured acoustic one-third octave band data in the CM 2TV-1 at 5 psia internal pressure compared with the CM specifications for all systems operating. ................ 14
Figure 13. Measured acoustic octave band data in the CM 2TV-1 at 5 psia internal pressure compared with the CM specifications for all systems operating and applicable NC curves. .......................................................................................................................... 15
Figure 14. Additional individual system contributors to the full-up system acoustic levels in the CM 2TV-1, measured at 5 psia. .................................................................................... 15
Figure 15. Individual system contributors to the full-up system acoustic levels in the CM 2TV-1, measured at 5 psia. ..................................................................................................... 16
Figure 16. Measured one-third octave band suit compressor data at 5 psia in the CM 2TV-1 compared with the Table 1 specification limits. ......................................................... 16
Figure 17. Measured equivalent octave band suit compressor data in the CM 2TV-1 compared with the Table 1 specification limits and measured 5 psia data, CM all-systems. ...... 17
Figure 18. Measured referenced source acoustic octave band data in the CM 2TV-1 compared with published reports on ground test data for the Apollo CM and the CM specifications for “all systems operating” and “all systems operating, except the suit compressor.” ............................................................................................................... 17
Figure 19. One-third octave band 2TV-1 acoustic data from referenced source data at 5 and 14.7 psia. ...................................................................................................................... 18
Figure 20. Octave band 2TV-1 acoustic data at 5 and 14.7 psia from measured reference source data. ............................................................................................................................. 18
Figure 21. LM NCA-55 noise limits (1965). ................................................................................... 23
Figure 22. LM stressed noise limits (1965). .................................................................................. 24
Figure 23. Unprotected ear noise tolerance limit (1968). (Note: The 2.5 seconds in the original plot was suspected to be a typographical error and has been changed to 25 seconds in this figure, corresponding to the time between 5 and 30 seconds.) ...................... 25
Figure 24. NCA-55 curve compared with “old” NC curves and “new” NC curves ........................ 25
Figure 25. LM noise limits used in 1969 IES test report. .............................................................. 26
Figure 26. LM, ascent and descent stages on lunar surface. ........................................................ 27

NASA/SP-2015-624 – ACOUSTICS AND NOISE CONTROL IN SPACE CREW COMPARTMENTS – Goodman & Grosveld
Chapter III - 4
Figure 27. LM, labeled by hardware. ............................................................................................ 27
Figure 28. LM ascent stage. .......................................................................................................... 28
Figure 29. LM view looking forward. ............................................................................................ 28
Figure 30. LM view looking forward. ............................................................................................ 29
Figure 31. LM view looking aft. ..................................................................................................... 29
Figure 32. Aft cabin views of starboard side environmental control system (left) and portside stowage area (right). ................................................................................................... 30
Figure 33. Flight crew locations within LM (sleeping provisions were for Apollo12 and subs). .. 30
Figure 34. Original flight crew sleep locations Apollo 11. ............................................................ 31
Figure 35. LM atmospheric revitalization section simplified schematic, showing cabin, and suit fans. ............................................................................................................................. 31
Figure 36. LM glycol pump noise suppression modification. ....................................................... 32
Figure 37. LM suit fan noise attenuation modification. ............................................................... 32
Figure 38. LM heat transport system, including primary and secondary glycol pump. ............... 33
Figure 39. Bare glycol pump, without attachments (left), and suit fan-motor (right). ................ 33
Figure 40. Glycol pump location in the LM. .................................................................................. 34
Figure 41. LM ARS, with suit fans in upper left-hand corner. ....................................................... 34
Figure 42. LM cabin fan and heat exchanger package (LM Delta). .............................................. 35
Figure 43. LM view of primary/secondary glycol pump, suit circuit with two suit fans, and cabin fan location in LM Ascent Stage. ................................................................................. 35
Figure 44. Plan view of glycol pump, suit fan, and cabin fan location in LM. .............................. 35
Figure 45. LM-7 test data, acoustic levels for CMDR and LMP, for P1F1 operations at 4.8 psia, in one-third octave bands. .............................................................................................. 38
Figure 46. LM-7 test data, acoustic levels for CMDR and LMP, for P2F1 operations at 4.8 psia, in one-third octave bands. .............................................................................................. 38
Figure 47. LM-7 test data, acoustic levels for CMDR and LMP, for P1F1 operations at 4.8 psia, in full octave bands. ......................................................................................................... 40
Figure 48. LM-7 test data, acoustic levels for CMDR and LMP, for P2F1 operations at 4.8 psia, in full octave bands. ......................................................................................................... 40
Figure 49. LM-8 acoustic test results from LMP CDR at 14.7 psia. ............................................... 41
Figure 50. LM-8 narrowband data for high sleep location, with fan #2 (left) and glycol pump #1 operating. .................................................................................................................... 42
Figure 51. LM-8 test data, at 14.7 psia, sound pressure levels for four individual noise sources at the CMRD “operate” location. ..................................................................................... 43

APOLLO - Goodman
Chapter III - 5
Figure 52. LM-8 test data, at 14.7 psia, sound pressure levels for noise source combinations of Suit Fan #1 with Glycol Pumps #1 and #2, measured at the high sleep location........ 43
Figure 53. IES testing at 14.7 psia, with pump #1 operating, pump and pump lines with double knit beta cloth wrapped data taken in CMDR high sleep location. ............................. 45
Figure 54. Three types of mufflers tested. ................................................................................... 46
Figure 55. LTA-8 vehicle with added expansion muffler and connecting line from glycol pump to muffler. ........................................................................................................................ 47
Figure 56. Apollo LM published acoustic levels [10] [11] [48]. ..................................................... 49
FIGURES APPENDIX A
Figure A-1. Sleep location levels with P1F1 and P2F1 operating at 4.8 psia. ............................... 61
Figure A-2. Crew “operate” locations for both P1F1 and P2F1 operating at 4.8 psia. ................. 61
Figure A-3. Acoustic levels with only P1 operating, for all crew locations at 4.8 psia. ................ 62
Figure A-4. Acoustic levels P1 only versus P1F1 operating in the CMDR sleep and operate locations at 4.8 psia. .................................................................................................. 62
Figure A-5. P1 one-third octave band levels at the CMDR sleep and operate locations for 14.7 and 4.8 psia conditions. ............................................................................................. 63
Figure A-6. P1 one-third octave band levels at the LMP sleep and operate locations for 14.7 and 4.8 psia conditions. .................................................................................................... 64
Figure A-7. P1 octave band levels at the CMDR sleep and operate locations for 14.7 and 4.8 psia conditions. ................................................................................................................. 64
Figure A-8. P1 octave band levels at the LMP sleep and operate locations for 14.7 and 4.8 psia conditions. ................................................................................................................. 65
Figure A-9. P2 and P2F1 octave band levels at the CMDR sleep and operate locations for 14.7 and 4.8 psia conditions. ............................................................................................. 65
Figure A-10. P2 and P2F1 octave band levels at the LMP sleep and operate locations for 14.7 and 4.8 psia conditions. ............................................................................................ 66

NASA/SP-2015-624 – ACOUSTICS AND NOISE CONTROL IN SPACE CREW COMPARTMENTS – Goodman & Grosveld
Chapter III - 6
CHAPTER III
ACOUSTICS AND NOISE CONTROL IN APOLLO
Jerry R. Goodman
1. INTRODUCTION
The purpose of this Chapter is to discuss acoustics and noise control in the Apollo Program. There were two manned spacecraft in Apollo: the Command Module (CM) portion of the Command and Service Module (CSM) and the Lunar Module (LM). NASA set acoustic requirements as the standards to which noise control must comply. This Chapter presents the acoustic requirements, test-based spacecraft noise levels, and mission-related acoustic problems and concerns, including crew comments. Noise control features that were considered and implemented are described and discussed (as many as can be determined). Focus of this Chapter is on in-flight continuous noise. It covers all the manned Apollo missions starting with Apollo 7, which was launched in October 1968, and ending with Apollo 17, which landed back on Earth on 7 December 1972. In the Apollo CM, crews could move about within their spacecraft during orbital operations for the first time. Crewmembers could access the lower equipment bay toward the foot end of their couches, or sleep in or under their couches. Initially, the discussion is focused on the physical CM or LM module, and then later noise control is discussed from a program standpoint. In general, encountering and solving noise control problems in Apollo resulted in a new design standard for noise control in future spacecraft, which had to be addressed in the Space Shuttle and later in the International Spacecraft System.
2. COMMAND MODULE
2.1 Acoustic Requirements
The original acoustic limits for the CM interior were defined in a 1962 Apollo Design Criteria Specification [1]. The overall sound pressure level (OASPL) in the CM for the Earth orbit, lunar transition, and trans-Earth environment was not allowed to exceed 75 decibels (dB) while the crew Speech Interference Level (SIL) was limited to 55 dB. In 1963, the Apollo Master Spacecraft Specification [2] indicated that the noise non-stressed limit shall be 80 dB as OASPL

APOLLO - Goodman
Chapter III - 7
and 55 dB in the 300 to 4800 cycles-per-second (cps) range. This specification included lunar mission requirements. The SIL in the document was equivalent to the arithmetic average of the levels in the 300, 600, 1200, 2400 and 4800 cps frequency bands. Also, the stressed limit shall be the maximum noise level that will permit, at all times, communications with the ground and between crewmembers. Emergency limits were defined as 143 dB for approximately 10 seconds, then logarithmically sloping down to 115 dB after 2 hours, as shown in Figure 1.
Figure 1. 1963 specification noise tolerance, emergency limits.
The Block I CM spacecraft was for Earth orbit operations, whereas Block II CM was for lunar missions. In 1969, the lunar mission configuration (Block II) specification [3] established the more detailed crew compartment acoustic limits listed in Table 1. These limits were specified for all systems operating, and for all systems operating except the suit compressor. The limits defined in Table 1 are shown as one-third octave bands in Figure 2, and as octave bands in Figure 3. Note that the full-up systems Noise Criterion (NC) limits in Figure 3 are approximately NC-69 and far exceed NC-50 and NC-55. The limit for all systems, less the suit compressor, is equivalent to NC-57 (Figure 3). It is believed that the 1962/1963 55 dB crew sound interference and non-stressed limit was intended for systems operating without the suit compressor, as the data in Table 1 reflect limits not exceeding 55 dB when the suit compressor is not used. The 1969 specification effectively replaced the 1962/1963 55 dB SIL, based upon Table 1 values, which is now covering octave bands with center frequencies of 500, 1000, 2000, and 4000 Hz (Chapter I, Acoustics, Section 2.1.2). This revised SIL (0.5, 1, 2, 4) is equivalent to 65.6 dB for all systems operating, and 55.3 dB for all systems operating except the suit compressor. From data received at the end of the Apollo Program, NASA considered NC-55 to be the limit for the CM; early Space Shuttle acoustics briefings and the literature indicated that this was indeed the case [4][5]. Figure 3, with all systems operating except the suit compressor, the CM acoustic level is close to a NC-55 rating. Note that octave bands at that time were different than they are currently defined. As it turned out, the suit loop was used extensively in later flights because the cabin fans created too much noise. It is believed that the CM specification was never revised to reflect the way the system was operating, with the suit loop running and cabin fans turned off, and the limit was NC-55, which is consistent with a SIL (0.5, 1, 2, 4) of 55 dB.
Exposure Time
So
un
d P
res
su
re L
ev
el, d
B
100
110
120
130
140
150
1 10 30 60 2 15 30 2 10 20I I I I I I I I I I I I I I I
seconds minutesoneday
hours
MAXIMUM EMERGENCY NOISE EXPOSURE- UNPROTECTED -

NASA/SP-2015-624 – ACOUSTICS AND NOISE CONTROL IN SPACE CREW COMPARTMENTS – Goodman & Grosveld
Chapter III - 8
Table 1. 1969 Block II CM crew compartment acoustic limits.
One-third octave band center frequency [Hz]
All systems operating [dB]
All systems operating except suit compressor [dB]
25 50 40 31.5 50 41 40 50 41 50 51 42 63 51 43 80 51 43
100 52 44 125 52 45 160 52 46 200 53 47 250 53 47 315 54 47 400 55 47 500 56 48 630 57 52 800 59 55
1000 60 53 1250 61 53 1600 63 51 2000 64 50 2500 66 50 3150 65 49 4000 62 49 5000 60 49 6300 59 48 8000 58 47
Overall SPL 74 67
Figure 2. CM “all systems” one-third octave band specifications with and without the suit compressor.
One-Third Octave Band Center Frequency, Hz
So
un
d P
res
su
re L
ev
el,
dB
35
40
45
50
55
60
65
70
31.5 63 125 250 500 1000 2000 4000 8000
Command Module Specification, all systems operatingCommand Module Specification, all systems without suit compressor

APOLLO - Goodman
Chapter III - 9
Figure 3. CM “all systems” octave band specifications with and without the suit compressor.
2.2 Command Module Crew Compartment Configuration
The CM was part of the CSM assembly, as depicted in Figure 4, until reentry when the CM was separated and became the configuration that is shown in Figure 5.
Figure 4. CSM.
Octave Band Center Frequency, Hz
So
un
d P
res
su
re L
ev
el,
dB
45
50
55
60
65
70
75
80
85
31.5 63 125 250 500 1000 2000 4000 8000 OASPL dBA
NC-60
NC-55
NC-50
NC-45
NC-40
NC-70
NC-65
73.7 dBA
62.3 dBA
Command Module Specification, all systems operatingCommand Module Specification, all systems without suit compressor

NASA/SP-2015-624 – ACOUSTICS AND NOISE CONTROL IN SPACE CREW COMPARTMENTS – Goodman & Grosveld
Chapter III - 10
Figure 5. CM.
The internal configuration of the CM and the equipment locations are shown in Figure 6.
Figure 6. Split view of the CM crew compartment layout.
Various crew operating locations within the CM are depicted in Figure 7.

APOLLO - Goodman
Chapter III - 11
Figure 7. CM basic crew locations.
Figure 8 shows the CM Environmental Control System (ECS) flow diagram and Figure 9 shows the location of the ECS hardware in the equipment bay on the left-hand side of the crew compartment, and the three suit umbilical sets for suited operations. Figure 10 depicts the cabin fan location within the CM. Figure 11 shows one these umbilical sets routed to the center crewmember.
Figure 8. CM ECS simplified flow diagram [4].

NASA/SP-2015-624 – ACOUSTICS AND NOISE CONTROL IN SPACE CREW COMPARTMENTS – Goodman & Grosveld
Chapter III - 12
Figure 9. Location of CM ECS hardware in the left-hand equipment bay, without closeout panels.
Figure 10. CM cabin fan location.
Three pairs of suit umbilical hoses are attached here

APOLLO - Goodman
Chapter III - 13
Figure 11. Three suited crewmembers in CM couches.
2.3 Preflight Acoustic Tests and Noise Control Efforts
Acoustic testing was performed in the Boiler Plate (BP) 14, Command Module 101, Spacecraft 008, and the 2TV-1 Spacecraft simulator before the first manned Apollo flight in October 1968. BP 14 acoustic data were obtained at 14.7 pounds-per-square-inch absolute (psia), with microphone locations unknown. The Spacecraft 008 data collected at 14.7 psia demonstrated that the OASPL with no flow in the CM was 80 dB with a SIL of 73 dB [6]. It was reported in that same reference in 1966, that it was doubtful that the goal of 80 dB OASPL and 55 dB SIL could be achieved when there is flow into the cabin or suit. In 1967, it was reported by the Mission Staff Engineer for the Block I Apollo 7 that it “is doubtful the design goal of 80 dB overall and 55 dB SIL can be achieved” [7]. Command Module 101 testing was performed in April 1968, with recommendations that further testing should be performed in the 2TV-1 at the Manned Spacecraft Center (MSC) in Houston, Texas. 2TV-1 acoustic data, with manned testing in a high-altitude testing facility at MSC, were obtained in mid-summer 1968. These data represent the last CM configuration update and acoustic testing data available. Figure 12 shows the one-third octave band sound pressure level (SPL) data obtained from this 1968 testing, with full CM systems operating at 5 psia internal CM pressure compared to the limits defined in Table 1. Figure 13 shows the same SPL data converted to octave bands and compared with equivalent octave band plots of the one-third octave band limits defined in Table 1 and applicable NC curves. Sound pressure levels reached the equivalent of NC-68. These data and figures are from three independent sources, designated “reference source data” or “measured data” herein [5][8][9]. These data consisted of full spectrum plots of the measured data for full-up systems and combinations of hardware sources. Testing was performed to determine the individual system contributors to the full-up system acoustic levels as shown in Figure 14 and Figure 15. The uppermost curve in Figure 14 is for all noise sources, and equivalent to the measured acoustic data curve in Figure 12. The most prominent sources were the glycol pumps,

NASA/SP-2015-624 – ACOUSTICS AND NOISE CONTROL IN SPACE CREW COMPARTMENTS – Goodman & Grosveld
Chapter III - 14
the cabin fan, the suit compressors, the body-mounted attitude gyros (BMags), and the guidance and navigation system. Figure 16 shows the measured suit compressor one-third octave band data compared with the Table 1 specification limits, for all systems operating. Figure 17 shows these data converted to octave bands. However, there is another documented interpretation of the resultant full-up systems octave band levels, which is different from those derived from the “referenced source data,” which herein is termed “ground test data” [10][11] [12]. These data consisted of only selected octave band measurements. Figure 18 shows these ground test Apollo CM data compared with the above-referenced source data. Figure 18 shows lower levels for the ground test data than the referenced source data, especially at 500 Hz, and above 1000 Hz, and levels equivalent to NC-64 versus NC-68 obtained from the referenced source data. Both versions of testing data clearly exceed the NC-55 levels previously noted to be the Apollo CM limit. The referenced source data seem more likely to be the most representative of the 2TV-1 test results, although the ground test data have appeared in several internal NASA documents and one formal NASA publication as the resultant acoustic levels of the CM. It could be that the differences between the above-referenced sources on what the CM levels were stated to be is due to a difference in measurement locations. Another report on CM levels at 14.7 psia has the same data for measured CM data shown in Figure 12 and Figure 14, lending more credence to the referenced source data (or measured data) as being more representative of CM acoustic levels [13].
In addition to 5 psia, 2TV-1 acoustic data were also obtained at 14.7 psia. Figure 19 shows levels obtained from the referenced source data testing in one-third octave bands, whereas Figure 20 shows these data converted to octave bands.
Figure 12. Measured acoustic one-third octave band data in the CM 2TV-1 at 5 psia internal pressure compared with the CM specifications for all systems operating.
One-Third Octave Band Center Frequency, Hz
So
un
d P
res
su
re L
ev
el,
dB
35
40
45
50
55
60
65
70
31.5 63 125 250 500 1000 2000 4000 8000
Command Module Specification, all systems operatingMeasured data Command Module 2TV-1

APOLLO - Goodman
Chapter III - 15
Figure 13. Measured acoustic octave band data in the CM 2TV-1 at 5 psia internal pressure compared with the CM specifications for all systems operating and applicable NC curves.
Figure 14. Additional individual system contributors to the full-up system acoustic levels in the CM 2TV-1, measured at 5 psia.
Octave Band Center Frequency, Hz
So
un
d P
res
su
re L
ev
el,
dB
45
50
55
60
65
70
75
80
85
31.5 63 125 250 500 1000 2000 4000 8000 OASPL dBA
NC-60
NC-55
NC-50
NC-45
NC-40
NC-70
NC-65
73.7 dBA
70.5 dBA
Command Module Specification, all systems operatingMeasured data Command Module 2TV-1
One-Third Octave Band Center Frequency, Hz
So
un
d P
res
su
re L
ev
el,
dB
35
40
45
50
55
60
65
70
31.5 63 125 250 500 1000 2000 4000 8000
Glycol Pump; Cabin Fan; Suit Compressors; B Mags; Guidance/Nav System; InvertersGlycol Pump; InvertersCabin Fan; Inverters

NASA/SP-2015-624 – ACOUSTICS AND NOISE CONTROL IN SPACE CREW COMPARTMENTS – Goodman & Grosveld
Chapter III - 16
Figure 15. Individual system contributors to the full-up system acoustic levels in the CM 2TV-1, measured at 5 psia.
Figure 16. Measured one-third octave band suit compressor data at 5 psia in the CM 2TV-1 compared with the Table 1 specification limits.
One-Third Octave Band Center Frequency, Hz
So
un
d P
res
su
re L
ev
el,
dB
35
40
45
50
55
60
65
70
31.5 63 125 250 500 1000 2000 4000 8000
B Mags; InvertersGuidance and Navigation System; InvertersSuit Compressor; Inverter
One-Third Octave Band Center Frequency, Hz
So
un
d P
res
su
re L
ev
el,
dB
35
40
45
50
55
60
65
70
31.5 63 125 250 500 1000 2000 4000 8000
Command Module Specification, all systems operatingMeasured suit compressor data

APOLLO - Goodman
Chapter III - 17
Figure 17. Measured equivalent octave band suit compressor data in the CM 2TV-1 compared with the Table 1 specification limits and measured 5 psia data, CM all-systems.
Figure 18. Measured referenced source acoustic octave band data in the CM 2TV-1 compared with published reports on ground test data for the Apollo CM and the CM specifications for “all systems
operating” and “all systems operating, except the suit compressor.”
Octave Band Center Frequency, Hz
So
un
d P
res
su
re L
ev
el,
dB
40
45
50
55
60
65
70
75
80
85
31.5 63 125 250 500 1000 2000 4000 8000 OASPL dBA
NC-60
NC-55
NC-50
NC-45
NC-40
NC-70
NC-65
73.7 dBA
67.3 dBA
Command Module Specification, all systems operatingMeasured suit compressor data
Octave Band Center Frequency, Hz
So
un
d P
res
su
re L
ev
el,
dB
40
45
50
55
60
65
70
75
80
85
31.5 63 125 250 500 1000 2000 4000 8000 OASPL dBA
NC-60
NC-55
NC-50
NC-45
NC-40
NC-70
NC-65
73.7 dBA
62.3 dBA
Command Module Specification, all systems operatingMeasured data Command Module 2TV-1Ground test Apollo Command ModuleCommand Module Specification, all systems operating without suit compressor

NASA/SP-2015-624 – ACOUSTICS AND NOISE CONTROL IN SPACE CREW COMPARTMENTS – Goodman & Grosveld
Chapter III - 18
Figure 19. One-third octave band 2TV-1 acoustic data from referenced source data at 5 and 14.7 psia.
Figure 20. Octave band 2TV-1 acoustic data at 5 and 14.7 psia from measured reference source data.
One-Third Octave Band Center Frequency, Hz
So
un
d P
res
su
re L
ev
el,
dB
35
40
45
50
55
60
65
70
75
80
31.5 63 125 250 500 1000 2000 4000 8000
Measured data Command Module 2TV-1 (14.7 psi)Measured data Command Module 2TV-1 (5.2 psi)
Octave Band Center Frequency, Hz
So
un
d P
ressu
re L
evel, d
B
40
45
50
55
60
65
70
75
80
85
31.5 63 125 250 500 1000 2000 4000 8000 OASPL dBA
NC-70
NC-65
NC-60
NC-55
NC-50
82.9 dBA
70.5 dBA
Measured data Command Module 2TV-1 (14.7 psia)Measured data Command Module 2TV-1 (5 psia)

APOLLO - Goodman
Chapter III - 19
Apollo 7 crews expressed concern with high noise levels experienced in vehicle testing. As a result, Spacecraft 101 was modified after integrated tests to fix the noise issues: the glycol pump was isolated, a procedural change was made to leave the fan off, and a flapper valve in between fans was fixed [4]. This was the first significant noise control change known to be implemented up until that time.
2.4 Acoustics and Noise Control During Operational Flights
In an Apollo ECS experience report, it was stated: “During the early Apollo missions, the crews registered numerous complaints about the excessive noise levels when the cabin fans were operating” [14]. Methods of acoustically isolating the fans were identified, but were never implemented on flight vehicles. It was determined from additional flight experience that the fans were not mandatory for cabin thermal control for the types of missions planned, and that the expense of the modifications was not justifiable. Both in Apollo missions and in long-term ground-based tests, it was concluded that added emphasis must be placed on reducing or controlling the noise output from spacecraft components and fluid flow systems. In a listing of the more significant problems encountered in the program, noisy cabin fans are identified as a problem, with the cause being “lack of noise suppression.” The CM cabin fan was an axial flow fan with four rotor blades and five stator blades. Under mission impact, it was noted “discontinued most fan use” and under corrective action “none” meaning that cabin fan use was discontinued and no corrective action was required since use of the suit ventilation system was an acceptable option. Recommendations for future systems design were to “add acoustical design requirements” [14], although no reference to established limits can be found. The same basic verbiage for a summary was used in another report on the Apollo CM ECS [15]. This report also states that “the suit loop, usually considered as a backup for cabin cooling and ventilation, became the prime means when it was found that the crew preferred to keep the cabin fans off.” This statement is rather elusive of responsibility, since the reason the crews did not use the cabin cooling and ventilation was because it was too noisy. The recommendation in both of these reports that future systems should add acoustic requirements is interesting since the existing module acoustic limits discussed above were in effect. In an Apollo Crew Experience Report on crew station where noise anomalies are discussed for both the CM and LM, it is noted that crew station acoustics was one of three areas where special attention is needed [16]. Furthermore, “an integrated approach to noise reduction is required, including the early application of MSC Design and Procedural Standard 145, Acoustical Noise Criteria” [17]. This recommendation and previously noted recommendations on future systems acoustic requirements will be further discussed in the summary discussions.
A biomedical report indicated that “Crews did not operate the cabin fans except during short specified periods and relied upon the suit heat exchanger for the total thermal control of the cabin gas. This was because of the fan noise and because the noise passing through the cabin heat exchanger was amplified by the cabin structure” [18]. This report also provided a mission summary table wherein cabin fans were listed as noisy for all missions and the cause was lack of noise suppression. Fan use was discontinued. Corrective action listed was “none,”

NASA/SP-2015-624 – ACOUSTICS AND NOISE CONTROL IN SPACE CREW COMPARTMENTS – Goodman & Grosveld
Chapter III - 20
and the recommendation for future systems design was to “add acoustical design requirement.” This was stated, again, without reference to existing specification limits.
Another report indicated that noise from the cabin fans was considered objectionable by the crew. The use of the fans discontinued except to remove lunar dust from the cabin atmosphere [19]. The following sections discuss noise concerns reported by mission.
2.4.1 Apollo 7
As noted previously, before this mission started, the crew complained about excessive glycol pump noise, which precipitated a quieting effort. After the mission, the crew reported the cabin fans were so noisy that first one fan, then both fans were turned off [20]. Crewmembers said they were comfortable without the fans operating. Later it was indicated that fan noise was attributed to foreign particles hitting fan blades and moving back and forth between the fan and the heat exchanger. Loud noise was reported at lift-off due to launch noise thrust and after separation from the Service Module. There was excessive noise in S-band communications due to loss of phase-lock with the ground. This was effectively controlled by the crew via adjustment of the volume control.
2.4.2 Apollo 8
Lift-off noise blocked communications between the crew and ground for about 35 seconds [21]. Cabin fans were turned off early in the mission, after orbital insertion, to reduce the noise levels. Fan #2 was reported to be quite noisy. It was commented that the noise was probably caused by a resonant condition within the duct system for the existing environment. However, it was noted that no further investigation was necessary since results of Apollo 7 and 8 demonstrated that the cabin fans were not required for maintenance of a comfortable environment, and the anomaly reported was closed [22]. Another report indicated there was disconcerting noise from cabin fans [16].
2.4.3 Apollo 9
Soon after orbital insertion, the cabin fans were turned off to determine their effect on the noise level [23]. Although the noise was not objectionable when the fans were operating, they remained off for most of the mission. The communication systems adequately supported the mission; however, it was stated that the quality of voice reception both in the spacecraft and at ground stations was degraded by noise from cabin fans, glycol pumps, and suit compressors.
2.4.4 Apollo Missions 10-17
Cabin fans were generally turned off. The Apollo summary document indicated that fans were noisy and that possible resonant conditions existed in ducting [24]. Glycol pump noise was a concern on Apollo 10; one crewmember indicated “it kept me awake” and “it really bugged me” [25].

APOLLO - Goodman
Chapter III - 21
2.5 Command Module Summary Discussion and Comments
Requirements for all systems or all systems except suit compressor operations far exceed the NC-50 recommendations in Chapter I, Acoustics. Measured acoustic levels are lower than the specification limits for all systems operating, exceed the specification limits for all systems, without suit compressor, and exceed the NC-55 limit generally considered the goal for Apollo. Limits for all systems except the suit compressor operating were much lower than all systems operating because it was believed that the nominal operations would be with just the cabin fan operating. Glycol pumps were quieted late in the vehicle design flow before the first flight (Apollo 7) because of crew objections. The measured test data shown in Figure 18 was 70.7 dB OASPL whereas the ground test data level was 66.8 dB OASPL, compared to the corrected limit of 74 dB OASPL (in Table 1) for all systems operating and the 67.0 dB OASPL for all systems operating except the suit compressor. The SIL (0.5, 1, 2, 4) for the measured test data was 63.6 dB and the ground test data was 59.0 dB, compared with the SIL limits of 65.6 dB with all systems operating and 55.4 dB for all systems operating except the suit compressor. Crews turned off the cabin fans because of unacceptable noise levels. The specification limits for continuous noise, SIL, and emergency limits were set too high, leading to the previously noted recommendations for future systems to add acoustic requirements and to utilize Design and Procedural Standard 145 [17], which calls for a NC-50 limit for all systems operations. Note that CM operations were at 5 psia, which would have been easier to meet than hardware designs for the higher 14.7 psia pressure. Vibration isolators were considered in the cabin fan mounting, but were not implemented as recommended in Chapter II on Noise Control, possibly because suit loop operations were an acceptable option.
In biomedical results of Apollo in the CSM and LM environmental control section, recommendations for future systems design was to “add acoustical design requirements” [18]. In an Apollo Crew Station design experience document, acoustic noise anomalies were very prominent when all of them were identified by mission in one document and grouped together. It was emphasized that noise was a generic problem that needed to be attended to in future spacecraft [16]. It was also stated that “an integrated approach toward noise reduction is required,” including “early application of MSC Design and Procedural Standard 145 on acoustic noise criteria.” No references can be found in debriefings or other documentation that the program specification limits (NC-55 or SIL limits) were not complied with – references in anomaly sections of mission summaries indicated fans or pumps were noisy, but the summaries did not address limits.
In a letter to NASA Headquarters Space Medicine Office in late July 1969, the Deputy Director of Medical Research and Operations stated “it is clear, in retrospect, that the right people failed to pay sufficient heed to the existing noise limits in the Apollo specifications at the time when it might have done some good” [26]. The focus was on loss of hearing and supporting crew sleep, rather than meeting the NC-55 limit or SIL limits. This reference [26] also reported that “George Low (Apollo Program Office Manager) exerted strenuous efforts to find an effective way of reducing the overall noise level in the spacecraft when it was first determined in Wally Schirra’s ship (CM used in Apollo 7), that the cabin noise levels were higher than they should be, but turning off the cabin fans turned out to be the only practical solution for the Command Module.”

NASA/SP-2015-624 – ACOUSTICS AND NOISE CONTROL IN SPACE CREW COMPARTMENTS – Goodman & Grosveld
Chapter III - 22
The previously referenced CSD memorandum also addressed the adequacy of the face-to-face communications, indicating from Apollo data collected on Spacecraft 008 that “the levels measured are well below the acceptable limit,” and data collected “are sufficient to show that acoustics will not be a communications problem” [6]. Also, the memorandum states that “the present schedule for Apollo precludes detailed studies in acoustics that will dictate a new design, since a new design would create schedule impacts and undue cost.” This CSD memorandum was written in response to a NASA Headquarters request for a response to broader questions about the acoustic environment of Apollo Spacecraft raised by Bellcomm, Inc. in April 1966 [27]. Bellcomm expressed concerns about the environment: noise levels anticipated; design criteria for crew tolerance and performance; and the Apollo acoustic test program. Included was concern that during coast phase of flight, crew hearing impairment levels based upon Boiler Plate vehicle BP-14 measurements, may have been exceeded by as much as 8 dB, and that the SIL for 90% intelligibility exceeded by as much as 14 dB (Note: the BP-14 data referred to have not been found). Concern was expressed that then-current analyses by MSC were limited in scope and did not consider the overall performance of the man-machine system, and that additional test data were required to determine the physiological effects of long-term exposure to noise. The Director of Medical Research and Operations responded to NASA Headquarters with the referenced CSD Memorandum, and statements that “the noise levels anticipated in the Apollo mission, including the coast phase, do not, in our opinion, represent a threat to the hearing of the crewmembers of sufficient consequence to justify a specific test program” [28]. Also, “the noise level within the cabin does not pose a significant problem with respect to communications or voice intelligibility” and “if subsequent experience proves present judgment to be in error, we are aware of the availability of remedial measures which will not impact spacecraft design or flight schedules.” This refers to the use of hearing protection.
The new standard resulting from Apollo issues with acoustics, Design Standard 145 [17], was approved by the MSC Director in October 1972. It referenced the Air Force Design Handbook, dated January 1969 [29], and a Compendium of Human Responses to the Aerospace Environment, dated November 1968 [30] – information that was available before Apollo 9, which launched in March 1969. Therefore, some acoustic information eventually put into the 1972 Design Standard was available, but was not used during the later stages of the Apollo Program.
Although there were overall acoustic limits for both vehicles, and the ECS hardware operations were primarily responsible for exceedances to these limits, it appeared that NASA ECS representatives didn’t take much ownership of these limits in experience reports, and no known acoustic limits were set for the hardware that created the noise concerns. Apollo fan and pump problems did lead to an effort of evaluating fan and pump noise control because “In Mercury, Gemini, and Apollo the noise level of ECS components caused an annoying cabin environment for the occupants” [31]. This effort was initiated and sponsored by the CM ECS Subsystems Manager who was concerned about the fan and pump. This author personally was involved with this manager in developing quiet fans with a fan supplier, and attempting to use them in the Space Shuttle Orbiter (Chapter IV, Acoustics and Noise Control in the Space Shuttle Orbiter).

APOLLO - Goodman
Chapter III - 23
3. LUNAR MODULE
3.1 Acoustic Requirements
The initial set of acoustic requirements for the LM stated the following [32]:
“3.1.2.6.3 Noise Limits. – The noise non-stressed limits to the crew’s ear canals shall not be greater than that shown in Figure 6, including an average at 55 dB in the 600 cps to 4800 cps range to a reference level of 0.0002 dynes/cm2. The stressed limit is that noise level where combinations of white noise duration and decibel level, measured at the entrance of the crewman’s ear canal, shall not be greater than that defined by Figure 7. A limiting constraint shall be that the maximum noise level permissible is that which will permit communications with the ground and between crew members at all times, and which will not induce physiological disturbances. The emergency limit shall be considered that limit at which the crew finds the noise painful or tissue damage can occur. For design and test purposes, 127 dB or higher peak value sustained for a period of no more than 2.5 seconds, in a pattern of equal periods of rest or low noise relief, is defined as the emergency limit. Pure tones generated in the cabin by operating equipment will be kept to a minimum intensity level”
NOTE: The “Figure 6” limits referenced above is reproduced as Figure 21. It shows that the noise limits were defined as NCA-55 alternate Noise Criterion curves. The stressed limits (unprotected ear noise tolerance) referred to as “Figure 7” referenced above are shown in Figure 22.
Figure 21. LM NCA-55 noise limits (1965).
Frequency Band, cps
So
un
d P
ressu
re L
ev
el, d
B
40
45
50
55
60
65
70
75
80
85
90
2075
75150
150300
300600
6001200
12002400
24004800
480010000

NASA/SP-2015-624 – ACOUSTICS AND NOISE CONTROL IN SPACE CREW COMPARTMENTS – Goodman & Grosveld
Chapter III - 24
Figure 22. LM stressed noise limits (1965).
In a 1968 LM technical specification, the above limits were modified to be the following: “The non-stressed limits to the crew’s ear canal shall not be greater than 80 dB overall and 55 dB in the 600 cps to 4800 cps range” [33]. The stressed limits were modified to allow a higher level of exposure, as shown in Figure 23. The 127 dB or higher limit in the 1965 specification was changed to 144 dB, and 100 dB was allowed for up to 8 hours. It is important to note that the statement in the earlier specification about minimizing pure tones was retained.
The relationship between NC-55 and the NCA-55 limit given in the 1965 specification is shown as Figure 24. As evidenced in this figure, NCA-55 allows higher levels than NC-55 at frequencies below 2000 Hz, but are the same at the 4000 Hz and 8000 Hz frequencies. This figure also shows how octave band definitions have changed. The noise-criterion-adjusted curve NCA-55 shown in Figure 21 was not included in the 1968 limits. Note that the specification limits also indicate that “a limiting constraint shall be that the maximum noise level permissible is that which will permit conversation with ground and between crewmembers at all times, and which will not induce physiological disturbances.”
The 55 dB limit in the 600 to 4800 cps range was retained, which supposedly was to satisfy this communication and physiological requirement. The SIL used in the LM specification, Section 3.1 in this Chapter, covers the four octave bands from 600 to 4800 cps, which includes the octave bands with center frequencies 1000 Hz, 2000 Hz, and 4000 Hz or SIL (1, 2, 4). The CM specification used a four-octave-band speech interference level SIL (0.5, 1, 2, 4), which also includes the 500 Hz octave band.
Exposure Time
Ma
xim
um
Pe
rmis
ible
Ove
rall
So
un
d P
res
su
re L
ev
el,
dB
100
110
120
130
140
150
2.5 10 30 2 10 30 120 480
II
I I I I I I I I I I I I
_
III<< seconds >> << minutes >>
148 dB - MAXIMUM ALLOWABLE HUMAN EXPOSURE LIMIT
2.5 seconds

APOLLO - Goodman
Chapter III - 25
Figure 23. Unprotected ear noise tolerance limit (1968). (Note: The 2.5 seconds in the original plot was suspected to be a typographical error and has been changed to 25 seconds in this figure, corresponding
to the time between 5 and 30 seconds.)
Figure 24. NCA-55 curve compared with “old” NC curves and “new” NC curves.
Exposure Time
Ma
xim
um
Pe
rmis
ible
Ove
rall
So
un
d P
res
su
re L
ev
el,
dB
100
110
120
130
140
150
2.5 10 30 2 10 30 120 480
II
I I I I I I I I I I I I
_
III<< seconds >> << minutes >>
148 dB - MAXIMUM ALLOWABLE HUMAN EXPOSURE LIMIT
0.29 seconds
25 seconds
Frequency Band, cps
Octave Band Center Frequency, Hz
So
un
d P
res
su
re L
ev
el,
dB
0
10
20
30
40
50
60
70
80
9063 125 250 500 1000 2000 4000 8000
2075
75150
150300
300600
6001200
12002400
24004800
480010000
NC-70
NC-20
NC-25
NC-30
NC-35
NC-40
NC-45
NC-50
NC-55
NC-60
NC-65
NCA-55Red: New NC curvesGrey: Old NC curvesBlue: NCA-55

NASA/SP-2015-624 – ACOUSTICS AND NOISE CONTROL IN SPACE CREW COMPARTMENTS – Goodman & Grosveld
Chapter III - 26
As indicated in the CM acoustic requirements section of this Chapter, it was stated that the Apollo limits were equivalent to NC-55 [4][5]. The specification limits, however, only covered 55 dB from 1000 Hz to 4000 Hz, not the rest of the NC-55 spectrum. Later in the program, during Internal Environment Simulator (IES) tests performed at MSC in 1969, the test results used a LM noise criteria curve with limits shown in one-third octave bands as in Figure 25 [34]. It is believed that, at the time, the one-third octave band curve in Figure 25 was derived from the NC-55 full octave band curve. One may convert one-third octave band values to octave band data for comparison with the octave band standards, but not convert octave band standards to one-third octave “equivalent” standards for evaluation of the one-third octave band data. When the one-third octave band levels in Figure 25 are converted to equivalent octave bands, the resultant curve is not NC-55, but a higher curve, very close to NC-60.
It is a confusing situation, but if Figure 25 was the established LM limit, the LM limits were effectively NC-60, not NC-55 as reported in the literature. However, specifications still call for the 55 dB limit between 600 and 4800 cps, which is equal to NC-55 in those frequencies, and no LM specifications found to date refer to the limits as that shown in Figure 25. Most probably the NC-55 requirement was attempted to be converted to one-third octave limits.
Figure 25. LM noise limits used in 1969 IES test report.
3.2 Lunar Module Crew Compartment and System Configuration
Figure 26 is a photograph of a flight LM on the lunar surface, with its ascent and descent stage intact. Figure 27 shows the LM configuration and hardware location on the LM. The LM ascent stage is shown in Figure 28. Figure 29 is a drawing of the LM view looking forward, from a location forward of the LM ascent engine cover.
One-Third Octave Band Center Frequency, Hz
So
un
d P
res
su
re L
ev
el,
dB
40
45
50
55
60
65
70
75
80
85
90
63 125 250 500 1000 2000 4000 800063 125 250 500 1000 2000 4000 800063 125 250 500 1000 2000 4000 800063 125 250 500 1000 2000 4000 800063 125 250 500 1000 2000 4000 800063 125 250 500 1000 2000 4000 800063 125 250 500 1000 2000 4000 8000

APOLLO - Goodman
Chapter III - 27
Figure 26. LM, ascent and descent stages on lunar surface.
Figure 27. LM, labeled by hardware.

NASA/SP-2015-624 – ACOUSTICS AND NOISE CONTROL IN SPACE CREW COMPARTMENTS – Goodman & Grosveld
Chapter III - 28
Figure 28. LM ascent stage.
Figure 29. LM view looking forward.

APOLLO - Goodman
Chapter III - 29
The console and windows in the LM are shown in a forward-looking view in Figure 30. Figure 31 shows LM equipment in a view aft of the crew standing locations for landing.
Figure 30. LM view looking forward.
Figure 31. LM view looking aft.

NASA/SP-2015-624 – ACOUSTICS AND NOISE CONTROL IN SPACE CREW COMPARTMENTS – Goodman & Grosveld
Chapter III - 30
Figure 32 provides views of the starboard ECS console and the port stowage area. The various crew locations in the LM are depicted in Figure 33, including Apollo 12 and subsequent mission sleeping locations in hammocks.
Figure 32. Aft cabin views of starboard side environmental control system (left) and portside stowage area (right).
Figure 33. Flight crew locations within LM (sleeping provisions were for Apollo12 and subs).

APOLLO - Goodman
Chapter III - 31
Figure 34 provides a view of the Apollo 11 crew sleep locations, with the Commander (CMDR) located on the ascent engine cover and the Lunar Module Pilot (LMP) on the LM floor. The LM atmospheric revitalization section of the ECS is provided in a simplified schematic in Figure 35.
Figure 34. Original flight crew sleep locations Apollo 11.
Figure 35. LM atmospheric revitalization section simplified schematic, showing cabin, and suit fans.

NASA/SP-2015-624 – ACOUSTICS AND NOISE CONTROL IN SPACE CREW COMPARTMENTS – Goodman & Grosveld
Chapter III - 32
3.3 Preflight Acoustic Tests
Lunar Module Test Article 8 (LTA-8) was the first production human-rated LM and was used in thermal vacuum testing at MSC. Testing supported the Apollo 9 mission (LM-3 flight vehicle) first, followed by the Apollo 11 mission (LM-5 flight vehicle). Vacuum testing was completed in June 1968, although the LTA-8 was later used for ambient pressure level testing of a proposed muffler design to remediate high noise levels. Note that the LM was controlled to a 5.0 psia pressure during vacuum (and lunar) operations, versus 4.8 psia for the CM.
The crew reported excessive noise during vacuum chamber testing. Measurements of LM acoustic levels were not known to be taken during these initial tests, but subsequent spacecraft tests included measurements, as will be discussed.
3.4 Lunar Module Acoustics and Noise Control During Operational Flights and During This Time Period
3.4.1 Apollo 9, LM-3 (Launched March 1969)
Apollo 9, LM-3 was the first flight for the LM in Earth orbit. Crews reported excessive noise in the cabin during helmets-off operation [23]. Noise was caused by operation of the cabin fans, glycol pumps, and suit compressors. One crewmember improvised ear pieces to provide some noise reduction. The crewmember who did not wear the ear pieces was most aware of the noise level. It was reported that noise measurements made in a LM showed that the glycol pump was the highest-level source. When the crewmembers had their helmets off, the cabin noise was of sufficient amplitude to interfere with normal communications, and reduced intercom and received-voice intelligibility. One crewmember indicated that the noise levels of the fans were very high, and said that it was “very uncomfortable” with helmets off and that the glycol pump was squealing [35]. To reduce the overall noise in the cabin, the Apollo 10 crewmembers were fitted and trained with ear protection, which was noted to reduce the noise by approximately 10 dB. For subsequent missions, sleep in the LM was required and modifications were noted as being tested. Testing included flexible couplings between the glycol pumps and bulkhead, as shown in Figure 36, and Beta padding added around the suit compressors, as shown in Figure 37. Also, subsequent missions used only one cabin fan to reduce overall cabin levels.
Figure 36. LM glycol pump noise suppression modification.
Figure 37. LM suit fan noise attenuation modification.

APOLLO - Goodman
Chapter III - 33
Figure 38 is a simplified sketch of the heat transport system with the three glycol pumps and their installation with the glycol pump termed “primary or secondary pump” (two pumps were primary, one was backup or secondary). It is believed that the primary and secondary pump features were combined into one unit. Figure 39 shows a bare glycol pump without its attached hardware and connections, and a sketch of the suit fan-motor configuration, both of which were major noise sources.
Figure 38. LM heat transport system, including primary and secondary glycol pump.
Figure 39. Bare glycol pump, without attachments (left), and suit fan-motor (right).
Figure 40 shows a combined primary and secondary glycol pump location in the LM ascent stage, and the cluttered and close connections to the pump and its surroundings. The suit fan configuration is shown in Figure 37 and in its location within the LM Atmospheric Revitalization System (ARS), with its cover removed, in Figure 41. The ARS package with its cover installed is

NASA/SP-2015-624 – ACOUSTICS AND NOISE CONTROL IN SPACE CREW COMPARTMENTS – Goodman & Grosveld
Chapter III - 34
shown it the upper left hand part of Figure 42. The cabin fan was another major noise source. Figure 42 shows the cabin fan design and location. The glycol pump, the cabin and the suit fan locations within the LM cabin are shown in Figure 43, and in the plan view of Figure 44.
Figure 40. Glycol pump location in the LM.
Figure 41. LM ARS, with suit fans in upper left-hand corner.
Ascent engine cover
Glycol pump loop heat exchanger
Glycol pump

APOLLO - Goodman
Chapter III - 35
In spacecraft In red mounting fixture
Figure 42. LM cabin fan and heat exchanger package (LM Delta).
Figure 43. LM view of primary/secondary glycol pump, suit circuit with two suit fans, and cabin fan location in LM Ascent Stage.
Figure 44. Plan view of glycol pump, suit fan, and cabin fan location in LM.
Ascent engine cover
Cabin fan
Cabin fan location
Suit circuit assembly
Glycol pump location
Glycol pump area
Cabin fan area Suit fan area

NASA/SP-2015-624 – ACOUSTICS AND NOISE CONTROL IN SPACE CREW COMPARTMENTS – Goodman & Grosveld
Chapter III - 36
3.4.2 Apollo 10, LM-4 (Launched May 1969)
The crew reported that the Apollo 10, LM-4 cabin was noisy, primarily because of the glycol pump [36]. The S-band antenna made a grinding noise every time it was moved. The crew commented about the high noise from the glycol pump, the suit fans, and the cabin fans. It was noted that the pump was by far the loudest and most annoying noise source in the LM. In the technical debriefing, the crew stated that “the pump winds up and screams as if the bearings are going out any minute. It’s not an extremely high-pitch scream; it’s a very loud solid volume scream, like that of a wheel that needs a great deal of oil” [25]. Also, it was reported that the noise level increased when putting the helmet on. A lot of air was flowing through the helmet and although it was cooler, “the noise level was so high, I felt it was not worth trying to operate it in that condition.” The other crewmember agreed, as he tried it and “had a high noise level” (suit fan noise). The crew stated the following about cabin fan noise: “we turned the fan back off and operated probably 90 percent of the LM mission with both fans off.” At another time in the debriefing it was stated that “the noise of the cabin fan was the majority of the noise in the LM.” The mission report noted that one of the cabin fans was used for approximately 30 minutes and then turned off because it was not needed. Molded ear pieces provided significant attenuation of the pump noise, but did not eliminate it. It was reported that tests were performed in LM-8 to verify the use of flexible hoses to isolate the pump from the tubing and act as an attenuator; however, noise was only slightly reduced (LM-8 tests will be discussed later in this Chapter). It was noted that further modification to the LM did not seem practical; therefore, ear plugs were planned for the crew to use during sleep periods. The related noise anomaly was closed.
3.4.3 Apollo 11, LM-5 (Launched July 1969)
It was reported that the noise from the glycol pumps during Apollo 11, LM-5 was loud enough to interrupt sleep when the helmets were removed, and that one of the more annoying problems was the noise from the suit circuit flow, the glycol pumps, and the cabin fans [37]. The CMDR and the LMP were provided with communications carrier adapters and ear tubes, having molded earpieces for use in the LM. The purpose of these adaptors was to increase the audio level to the ear. The LMP had discomfort from the earpieces on the lunar surface, and removed them. The CMDR did not use them since audio volume was adequate. The earpieces were planned to be used as optional, crew preference on subsequent missions [38]. After the LMP first entered the LM, he checked out the ascent battery. “The variations in voltage produced a noticeable pitch and intensity variation in the already loud noise of the glycol pump.” Also, “the rest period was almost completely unsatisfactory. The helmets and gloves were worn to relieve subconscious anxiety about loss of cabin pressure, and they presented no problem. But noise, lighting, and lower-than-desired temperature were annoying. The suits were uncomfortably cool, even with the water flow disconnected. Oxygen flow was finally cut off, and the helmets removed, but the noise from the glycol pumps was then loud enough to interrupt sleep.” The crew also found sleeping on the floor was uncomfortable, cold, and noisy, therefore hammocks were added on all subsequent vehicles.

APOLLO - Goodman
Chapter III - 37
3.4.4 LM-7 Acoustic Testing During Altitude Tests at Kennedy Space Center, 7 November 1969
Extensive acoustic tests were performed during altitude chamber tests at NASA Kennedy Space Center (KSC) and were documented in a test report [39]. Tests were performed at a cabin pressure of 4.8 psia, with glycol pump #1 (P1) and suit fan #1 (F1) running, in the following four crew locations: CMDR Sleep; CMDR Work; LMP sleep, and LMP work. Normal operations were for pump P1 and suit fan F1 running together at the same time (termed P1F1), with another pump and fan available for backup, and a third pump used only for contingencies. Then tests were run at the same cabin pressure and crew locations, with glycol pump #2 (P2) together with suit fan F1 (P2F1). Then, at the same pressure and crew locations, with just P1 operating. Next, background noise measurements were performed with all pumps and fans off. Subsequently, measurements were taken at ambient pressures, at all the same crew locations as above, with just P1 operating, and after that, with just P2. Crew sleep locations changed after Apollo 11, from the crew locations in Figure 33 to the locations shown in Figure 34 for Apollo 12 through 17. Since these data were taken after the Apollo 11 mission and just before Apollo 12, the measurement locations of the microphones were in the hammock locations shown for Apollo 12 and subsequent missions. A summary of measurements acquired during these tests is provided in Table 2. Mufflers were in the process of being developed to quiet the noise levels, but were not available for this testing.
Table 2. LM-7 Altitude Chamber tests, sound pressure levels for depressurized and ambient environments experienced at the CMDR’s and LMP’s sleep and operating locations with varying hardware noise sources
(P1=Water Glycol Pump #1; P2= Water Glycol Pump #2; F1=Suit Fan #1; Off=All systems off).
Depressurized - 4.8 psi Ambient - 14.7 psi
P1 & F1 P2 & F1 P1 Off P1 P2 Off
Commander 400 Hz 84.0 83.3 58.1 33.5 74.0 76.5 40.0
--Sleep 800 Hz 75.0 71.6 67.2 37.0 82.5 80.5 41.0
O/A 85.2 85.0 74.5 62.0 84.0 83.0 59.1
dBA 81.7 82.3 72.8 61.8 83.2 81.6 56.3
Commander 400 Hz 73.5 77.0 75.7 41.0 77.5 84.5 42.0
--Operate 800 Hz 70.5 73.7 65.0 34.5 69.0 63.0 41.5
O/A 76.8 79.8 76.7 58.8 78.7 85.0 57.9
dBA 73.9 77.1 73.0 54.8 74.9 80.6 55.9
Lunar Module 400 Hz 71.7 73.7 76.5 36.5 79.0 78.5 42.5
Pilot 800 Hz 59.5 67.5 61.0 34.5 68.5 71.0 43.0
--Sleep O/A 73.5 75.7 77.5 55.7 79.9 79.6 57.6
dBA 69.6 72.1 72.9 54.0 75.8 75.9 53.9
Lunar Module 400 Hz 76.0 78.6 75.3 35.7 76.0 76.5 40.5
Pilot 800 Hz 62.0 63.8 48.0 34.0 66.5 65.6 41.5
--Operate O/A 77.4 79.6 75.9 55.4 77.5 78.2 58.1
dBA 73.9 76.1 71.4 53.6 74.5 75.5 55.6
Figure 45 shows the one-third octave band levels measured at 4.8 psia in the four crew
locations for combined P1 and F1 (P1F1) operations. Figure 46 shows the levels measured at the same locations for P2 and F1 (P2F1). The OASPL for P1F1 operations was 86 dB in the CMDR’s sleep location and 85 dB for P2F1 operations, exceeding the 80 dB OASPL limit.

NASA/SP-2015-624 – ACOUSTICS AND NOISE CONTROL IN SPACE CREW COMPARTMENTS – Goodman & Grosveld
Chapter III - 38
Figure 45. LM-7 test data, acoustic levels for CMDR and LMP, for P1F1 operations at 4.8 psia, in one-third octave bands.
Figure 46. LM-7 test data, acoustic levels for CMDR and LMP, for P2F1 operations at 4.8 psia, in one-third
octave bands.
One-Third Octave Band Center Frequency, Hz
So
un
d P
res
su
re L
ev
el,
dB
40
45
50
55
60
65
70
75
80
85
90
95
100
31.5 63 125 250 500 1000 2000 4000 8000 OASPL dBA
81.7 dBA
69.6 dBA
Pump #1 and Fan #1; Commander - SleepPump #1 and Fan #1; Commander - OperatePump #1 and Fan #1; Lunar Module Pilot - SleepPump #1 and Fan #1; Lunar Module Pilot - Operate
One-Third Octave Band Center Frequency, Hz
So
un
d P
res
su
re L
ev
el,
dB
35
40
45
50
55
60
65
70
75
80
85
90
95
31.5 63 125 250 500 1000 2000 4000 8000 OASPL dBA
82.3 dBA
72.1 dBA
Pump #2 and Fan #1; Commander - SleepPump #2 and Fan #1; Commander - OperatePump #2 and Fan #1; Lunar Module Pilot - SleepPump #2 and Fan #1; Lunar Module Pilot - Operate

APOLLO - Goodman
Chapter III - 39
The glycol pumps have four vanes and operate at approximately 6000 rotations per minute (rpm), resulting in a vane passage frequency (vpf) of about 400 Hz. The CMDR’s sleep location was the loudest at the 400 Hz vpf and its harmonics, resulting in an A-weighted overall sound level of 81.7 dBA for P1F1 (Figure 45) and 82.3 dBA for P2F1 (Figure 46).
Figure 45 and Figure 46 show, for both P1F1 and P2F1 operations, that high narrowband peaks at 400 and 800 Hz – and sometimes 1250 Hz and 2000 Hz – are predominant in the spectrum with the pumps running. The P1F1 operations spectra for both CMDR and LMP sleep locations were very similar in profile, with levels at the CMDR location higher than the LMP location by about 8 to 15 dB from 250 Hz to 8000 Hz. The CMDR sleep location was at an 81.7 dBA level, and the LMP location was at a 69.6 dBA level. CMDR and LMP operating locations had very close levels except at 1000 Hz, where they were about 8 dB apart but at the same dBA level. The P2F1 operations at the CMDR and LMP sleep locations were louder than for the P1F1 operating condition. The CMDR and LMP sleep location levels between 250 Hz and 8000 Hz were very similar in profile, with the CMDR location about 8 to 18 dB higher. CMDR and LMP operating locations had close levels except at 1000 Hz, where they were about 10 dB apart while having approximately the same dBA level.
Figure 47 and Figure 48 show acoustic levels for P1F1 and P2F1, respectively, for all four crew locations, converted to octave bands and with NC curves plotted for reference. Both P1F1 and P2F1 operations show considerable exceedances ranging from about 12 to 20 dB above the 55 dB limit between 1000 Hz and 4000 Hz, and NC-55. A greater exceedance of about 27 dB was shown at 500 Hz, which was not covered by the 55 dB, 1000-4000 Hz limit, but was considered pertinent, as will be discussed later. For both the P1F1 and the P2F1 operation, the highest levels were at the CMDR sleep location, then at the CMDR work location, then at LMP work, and finally at the LMP sleep location.
A 400 Hz peak was the predominant, highest level during P1F1 and P2F1 operations at all crew locations. Usually this 400 Hz peak creates higher level peaks at 800 Hz, 1250 Hz, and other harmonics. P1-only levels were very low at 800 Hz for the LMP operating location, but P1 by itself for the LMP sleep location had higher levels than for P1F1 operations. With P1F1 functioning, the levels were 15.5 dB lower at 800 Hz for the LMP sleep location than the CMDR sleep location. There was considerable variability in pump levels at any given location in the LM because of fluctuating pump pressures, and differences in levels at the various crew locations in the LM.
Appendix A includes additional figures of the test results including: pump only data; pump by itself versus pump and fan tests; plots of 4.8 psia versus 14.7 psia tests; and assessment of the data and figures.
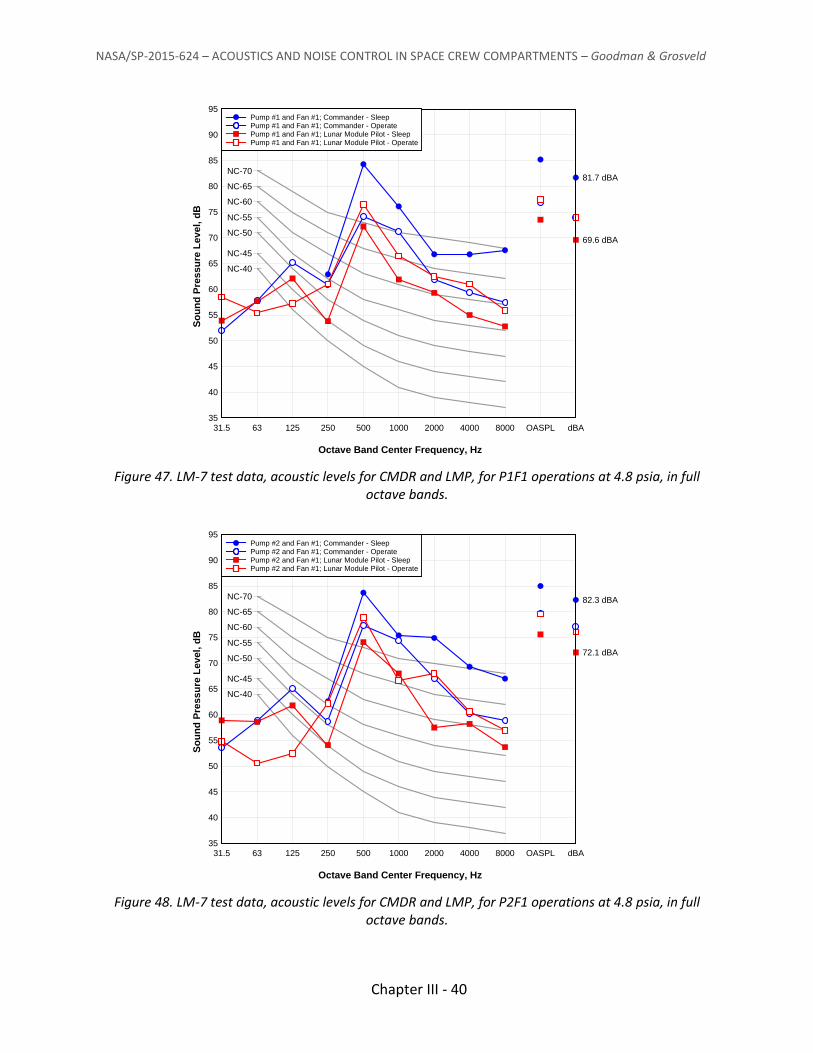
NASA/SP-2015-624 – ACOUSTICS AND NOISE CONTROL IN SPACE CREW COMPARTMENTS – Goodman & Grosveld
Chapter III - 40
Figure 47. LM-7 test data, acoustic levels for CMDR and LMP, for P1F1 operations at 4.8 psia, in full octave bands.
Figure 48. LM-7 test data, acoustic levels for CMDR and LMP, for P2F1 operations at 4.8 psia, in full octave bands.
Octave Band Center Frequency, Hz
So
un
d P
res
su
re L
ev
el,
dB
35
40
45
50
55
60
65
70
75
80
85
90
95
31.5 63 125 250 500 1000 2000 4000 8000 OASPL dBA
NC-60
NC-55
NC-50
NC-45
NC-40
NC-70
NC-65 81.7 dBA
69.6 dBA
Pump #1 and Fan #1; Commander - SleepPump #1 and Fan #1; Commander - OperatePump #1 and Fan #1; Lunar Module Pilot - SleepPump #1 and Fan #1; Lunar Module Pilot - Operate
Octave Band Center Frequency, Hz
So
un
d P
res
su
re L
ev
el,
dB
35
40
45
50
55
60
65
70
75
80
85
90
95
31.5 63 125 250 500 1000 2000 4000 8000 OASPL dBA
NC-60
NC-55
NC-50
NC-45
NC-40
NC-70
NC-65
82.3 dBA
72.1 dBA
Pump #2 and Fan #1; Commander - SleepPump #2 and Fan #1; Commander - OperatePump #2 and Fan #1; Lunar Module Pilot - SleepPump #2 and Fan #1; Lunar Module Pilot - Operate

APOLLO - Goodman
Chapter III - 41
3.4.5 Late 1969 Meetings and Efforts on Remedial Actions for the Lunar Module Cabin Noise
In mid-September 1969, a Critical Design Review (CDR) for the Lunar Module Modification Program (LMMP) was held at the LM contractor Grumman Aircraft Company (GAC) facility in Bethpage, New York [40]. The purpose of the LMMP was to establish modifications for extended LM duration stays on the lunar surface. Originally, it was to start for LM-10 after five previous missions. A request for action (RFA) was submitted at this review. The RFA indicated that cabin noise needed to be reduced to a level conducive to crew sleep. It noted that the present heat transport section of the LM produces noise levels that degrade cabin habitability during sleep periods and that, as lunar stay increased, noise concerns may reduce lunar surface effectiveness [41]. It also stated that simple fixes in LM-8 implemented by GAC provided little change in level, that fixes other than those tried will require an extensive test program, and that such a program was discussed at the 20 June 1969, Configuration Control Board (CCB) meeting, with results that endorsed providing ear protection for the crew while sleeping. This RFA went to the LMMP CDR board for information and disposition. The major noise producer was stated to be fluid vibration in lines; LM-8 cabin noise survey results, at 14.7 psia, were presented (Figure 49).
Figure 49. LM-8 acoustic test results from LMP CDR at 14.7 psia.
For the high sleep location in the LM, the levels just met the 80 dB OASPL limit (79.4 dB) but
were about 14.0 to 19.9 dB over the 55 dB limit between 1000 Hz and 4000 Hz. The GAC installed fixes in LM-8 were reported to result in little change to the acoustic levels. Attempted fixes included fan blankets and flex lines for the glycol pump. The NASA MSC acoustic filter design concept to reduce the pressure pulses generated from the glycol pump was shown, and it was indicated that the glycol pump provided a reduction of 12 dB at 400 Hz. Note that the
Octave Band, Hz
So
un
d P
res
su
re L
ev
el,
dB
40
45
50
55
60
65
70
75
80
85
250 500 1000 2000 4000 8000 OASPL dBA
NC-70
NC-65
NC-55
NC-60
NC-50
78.5 dBA
76.2 dBA
Pilot positionHigh sleep position

NASA/SP-2015-624 – ACOUSTICS AND NOISE CONTROL IN SPACE CREW COMPARTMENTS – Goodman & Grosveld
Chapter III - 42
results were based upon testing at ambient pressures and not at the cabin 4.8 psia levels. The program suggested implementing acoustic filters consistent with vehicle constraints, testing designs for effectiveness in a test rig, and evaluating designs in a test rig. The LMMP board agreed to joint efforts of the MSC/GAC/Astronaut Office to review the program and to develop fixes, with early incorporation of results to be sought for prompt inclusion into flight vehicles. Astronaut Gene Cernan emphasized the need for a comprehensive long-term program to create effective solutions. Such efforts were planned at that time to be tested, evaluated in the LM-2, and installed in the LM-10.
LM-8 narrowband data, found separate from the above LMMP CDR referenced data, show the extensive narrowband peaks across the spectrum for both the glycol pump and suit fans [42]. These data also show levels in the high sleep location with the operation of suit fan #2 and the glycol pump #1. Figure 50 shows narrowband data for the fan #2 and pump #1 each operating alone.
Figure 50. LM-8 narrowband data for high sleep location, with fan #2 (left) and glycol pump #1 operating.
Figure 51 shows both individual pumps and suit fan profiles in one-third octave bands obtained from this referenced, LM-8 separate data [42]. Cabin fan data effects are not included. These data were taken at ambient pressure (14.7 psia). Figure 52 shows LM-8 acoustic levels at 14.7 psia for combinations of suit fan #1 and either glycol pump #1 or #2 as noise sources and measured at the high sleep location.
On 25 September 1969, NASA MSC and GAC met at MSC to discuss cabin noise problems to follow-up on the LMMP action [43]. The following items were discussed:
Flexible lines, approximately 1-foot long, were planned to be installed in LM-10 in the primary loop, but the resulting noise reduction was not sufficient to solve the problem.
Frequency, Hz
So
un
d P
ressu
re L
evel, d
B
40
45
50
55
60
65
70
75
80
85
100 200 300 400 500 700 1000 2000 3000 5000 8000
| | | | | | | | | | | | | | | | |
Frequency, Hz
So
un
d P
ressu
re L
evel, d
B
40
45
50
55
60
65
70
75
80
85
100 200 300 400 500 700 1000 2000 3000 5000 8000
| | | | | | | | | | | | | | | |

APOLLO - Goodman
Chapter III - 43
Figure 51. LM-8 test data, at 14.7 psia, sound pressure levels for four individual noise sources at the CMRD “operate” location.
Figure 52. LM-8 test data, at 14.7 psia, sound pressure levels for noise source combinations of Suit Fan #1 with Glycol Pumps #1 and #2, measured at the high sleep location.
One-Third Octave Band Center Frequency, Hz
So
un
d P
res
su
re L
ev
el,
dB
35
40
45
50
55
60
65
70
75
80
85
90
95
250 500 1000 2000 4000 8000 OASPL dBA250 500 1000 2000 4000 8000 OASPL dBA250 500 1000 2000 4000 8000 OASPL dBA250 500 1000 2000 4000 8000 OASPL dBA250 500 1000 2000 4000 8000 OASPL dBA250 500 1000 2000 4000 8000 OASPL dBA250 500 1000 2000 4000 8000 OASPL dBA250 500 1000 2000 4000 8000 OASPL dBA
77.0 dBA
66.9 dBA
Suit Fan #1; Commander - OperateSuit Fan #2; Commander - OperateGlycol Pump #1; Commander - OperateGlycol Pump #2; Commander - Operate
One-Third Octave Band Center Frequency, Hz
So
un
d P
res
su
re L
ev
el,
dB
35
40
45
50
55
60
65
70
75
80
85
90
95
250 500 1000 2000 4000 8000 OASPL dBA250 500 1000 2000 4000 8000 OASPL dBA250 500 1000 2000 4000 8000 OASPL dBA250 500 1000 2000 4000 8000 OASPL dBA250 500 1000 2000 4000 8000 OASPL dBA250 500 1000 2000 4000 8000 OASPL dBA250 500 1000 2000 4000 8000 OASPL dBA250 500 1000 2000 4000 8000 OASPL dBA
78.7 dBA
76.6 dBA
Suit Fan #1 + Glycol Pump #1Suit Fan #1 + Glycol Pump #2

NASA/SP-2015-624 – ACOUSTICS AND NOISE CONTROL IN SPACE CREW COMPARTMENTS – Goodman & Grosveld
Chapter III - 44
Potential remedies discussed were to: install a stub filter (one-quarter wavelength long) – potentially a minimum of three, tuned to 400 Hz, 800 Hz, and 1600 Hz, with total weight less than one pound; add an in-line filter; add acoustic insulation to water/glycol lines and determine the type of treatment and effectiveness; optimize the stiffness to achieve more noise reduction for the flexible lines at the pump outlet.
Materials being investigated for wrapping were beta cloth and quartz fiber. Other remedial efforts (including versions of previous items), which could involve
longer lead times and potentially be available for LM-11, were to: improve vibration isolation of lines; provide vibration absorption; provide line tuning, including geometry changes; and tighten quality assurance tolerances on pump performance possibly for LM-12, LM-13, and LM-14.
Other items discussed were: obtain baseline data on LM cabins; use an LM water/glycol loop bench test rig to evaluate candidate remedies; determine acoustic impedance, absorption, and transmission loss of all materials that could be used for noise control; evaluate noise reduction effectiveness of the primary candidates in the LTA-8 ascent stage (scheduled for December 1969); define and recommend a criterion for noise reduction; and define and recommend a remedy for LM-10 and subsequent missions.
On 3 October 1969, the proposed LM noise reduction program was presented to the Apollo Spacecraft Program Office (ASPO) CCB. An action was assigned to resolve whether LTA-8 or LM-2 should be used for testing noise control options and a proposal for obtaining inflight noise measurements on LM-6 was requested (it was subsequently determined to use LTA-8). The board also decided to vigorously implement the noise control program and to produce two or more noise control options for implementation in LM-10. Longer-term efforts would be for LM-11 and subsequent vehicles [44]. The following items were among those reported by Wade Dorland/MSC:
Water/glycol line vibration in the heat exchanger system is the primary noise generator. Suit fans and cabin fans are secondary sources.
The sound field in the LM cabin is extremely non-uniform, based upon IES tests performed at MSC.
Cabin wall vibration is an insignificant sound source. In IES [43] tests, a 22 dB reduction was obtained with beta cloth wrap (weight of
11.8 kg [23 lbs]). Pump wrap, lighter line wrap, and line wedges were not effective. GAC conducted noise surveys in LM-7 and LM-8 at 14.7 psia. Flex lines and suit fan
wrap had little benefit. Subjective test conducted indicated a reduction of 12 dB at 400 Hz and 800 Hz would be acceptable.
Four control remedies were discussed as potential candidates for LM-10: stub hydraulic filters; in-line hydraulic filter (GAC proposed configuration); acoustic insulation on lines; and optimized flexible couplings in lines. Bench testing would be performed to select the hardware to be installed in LTA-8 or LM-2.
Medical Research and Operations will establish the criteria for acceptable noise.

APOLLO - Goodman
Chapter III - 45
The above statement on pump wrap and pump line wrap not being beneficial at first, seemed contrary to the available data. IES test data performed at 14.7 psia, showed very positive results with pump #1 operating in the CMDR high sleep location, with 10.8 kg (23.7 lbs) double knit beta cloth wrapping on pump #1 and pump lines, as shown in Figure 53 [34]. Results of this wrapping showed a 12.7 dBA reduction in sound pressure level. The LM cabin noise criteria curve in Figure 53 is the same curve as the noise limit curve in Figure 25. The curve labeled AVO (avoid verbal orders) relates to the type of document on LM-8 testing for measurements taken at the CMDR high sleep location [42]. These fixes did not seem beneficial because of their weight, volume, and cost impact, which will be discussed later in this Chapter. Glycol line vibration was predominant in IES tests. Also, there were some fidelity differences in IES vs. flight hardware. Flight type-water glycol line runs in the IES facility were different than those in the LM-8, and it was noted that the measured acoustic levels in IES were not very similar to those found in the LM-8. Levels in the IES were much higher than in the LM-8 [34].
Figure 53. IES testing at 14.7 psia, with pump #1 operating, pump and pump lines with double knit beta cloth wrapped data taken in CMDR high sleep location.
However, the priority at the time was to make the LM acceptable for crew sleep. Since the
glycol pump was running 24 hours per day for cooling purposes, the focus was on quieting the pump and its lines. The goal was to reduce the high acoustic level at 400 Hz by 30 dB, and to do the quieting with minimum LM weight, volume, and vehicle design and cost impacts.
Further design efforts and bench testing performed in October 1969 resulted in five acoustic treatment candidates as shown in Table 3 [45].
Photographs of the cylindrical expansion muffler, the expansion muffler with low aspect ratio, and the expansion chamber with the inlet and outlet offset are provided in Figure 54.
One-Third Octave Band Center Frequency, Hz
So
un
d P
res
su
re L
ev
el,
dB
35
40
45
50
55
60
65
70
75
80
85
90
95
63 125 250 500 1000 2000 4000 8000 OASPL dBA63 125 250 500 1000 2000 4000 8000 OASPL dBA63 125 250 500 1000 2000 4000 8000 OASPL dBA63 125 250 500 1000 2000 4000 8000 OASPL dBA63 125 250 500 1000 2000 4000 8000 OASPL dBA63 125 250 500 1000 2000 4000 8000 OASPL dBA63 125 250 500 1000 2000 4000 8000 OASPL dBA63 125 250 500 1000 2000 4000 8000 OASPL dBA
71.7 dBA
84.4 dBA
LM Cabin Noise CriteriaLM Grumman AVO No.IES Pumps and Pipes UntreatedIES Pumps and Pipes Treated

NASA/SP-2015-624 – ACOUSTICS AND NOISE CONTROL IN SPACE CREW COMPARTMENTS – Goodman & Grosveld
Chapter III - 46
Table 3. Candidate acoustic treatments including expansion chamber, cylindrical with protruding inlets developed by R. Dickson, NASA-MSC, and others developed by GAC and LM Contractor
(Table from R. Dickson).
Type of acoustic treatment
Dimensions [in]
Volume [in3]
Weight increase (fluid only)
[lbs]
Measured insertion loss**
[dB]
Effects on harmonics
Helmholtz resonator
3.6 x 2.0
11.3
0.43
15
No attenuation
Expansion chamber
(Cylindrical) 12.0 x 2.15
43.4
1.65
34
Harmonics reduced to negligible values
Expansion chamber
(Cylindrical with protruding inlets)
13.69 x 2.15
43.4
1.65
34
Harmonics reduced to negligible values
Expansion chamber
(Low aspect ratio cylindrical)
4.57 x 2.32
19.1
0.73
23
Harmonics reduced to negligible values
Expansion chamber*
(Inlet and outlet offset) 5.46 x 2.87
35.3
1.34
30
Harmonics reduced to negligible values
** This is the amount the amplitude of the fundamental frequency of the fluctuating pressure was reduced. This frequency was reduced from 300 Hz to 375 Hz in the bench testing.
* Approximately the same as muffler to be installed in LTA-8.
Figure 54. Three types of mufflers tested.
3.4.6 Lunar Module Test Article 8 Testing (November-December 1969)
The candidate muffler with the offset inlet and outlet, as shown in Figure 54, was selected to be tested in LTA-8 at MSC. LTA-8 testing at ambient pressures ran from early November to 22 December 1969, with the selected muffler configuration tested on 20 November 1969. It
Cylindrical expansion muffler
Expansion muffler with inlet and outlet offset
Expansion muffler with low aspect ratio

APOLLO - Goodman
Chapter III - 47
was determined that the 30 dB reduction from the expansion muffler at 400 Hz would also reduce the sound pressure levels at the 400 Hz harmonic frequencies and lower the overall levels sufficiently to provide an acceptable LM environment. Figure 55 shows the muffler installed in the LTA-8 vehicle, with a treated line running from the pump to the muffler. The treated line materials makeup is unknown, but from examination of an enlarged Figure 55, it looks as though it is wrapped on its exterior surface with aluminum tape.
Figure 55. LTA-8 vehicle with added expansion muffler and connecting line from glycol pump to muffler.
Table 4 provides test results with and without the muffler installed within the thermal
control system [46].
In a preliminary test report, LTA -8 results were summarized, as follows [47]:
Data obtained show that the muffler used was very effective in reducing fluctuating fluid pressure and vibrations at locations downstream of the muffler.
The data also show that, when the muffler is inserted, the most significant contributor to the ECS noise is the fluid transport line between the pump and the muffler. For this reason, the line length should be reduced as much as possible, potentially by relocating the muffler. If the muffler cannot be relocated, then treatment of the line should be considered.
Several line treatments produced no significant reduction of noise. However, two line treatments showed promising results. These treatments involved use of rubber-like materials absorbing energy by friction against the outer surface of the aluminum line. Use of a molded rubber shape for maximum friction was suggested.
It was recommended to incorporate the selected and tested expansion muffler design in LM-10 and subsequent vehicles.
MC-4 and MC-2 test locations in Table 4 have not been resolved.
New offset inlet and outlet expansion muffler
Treated pump outlet line connecting glycol pump to muffler
Glycol pump

NASA/SP-2015-624 – ACOUSTICS AND NOISE CONTROL IN SPACE CREW COMPARTMENTS – Goodman & Grosveld
Chapter III - 48
Table 4. The memorandum [46] summarizes the results of LTA-8 at 14.7 psia acoustic testing and muffler benefits.
Microphone location With muffler
[dB] Without muffler
[dB] Attenuation
[dB]
400 Hz 65 78 13
Commander 800 Hz 60 60 0
Sleep “A” Overall” 69.5 77.5 8
Linear 71 80 9
400 Hz 55 80 25
Commander 800 Hz 56.5 60 3.5
Operate “A” Overall” 65.5 78 12.5
Linear 65.5 81 15.5
400 Hz 57 79 22
Pilot 800 Hz 53.5 50.5 -3.0
Sleep “A” Overall” 62 76 14
Linear 67 80.5 13.5
400 Hz 63 76 13
Pilot 800 Hz 56 61.5 5.5
Operate “A” Overall” 64.5 74 9.5
Linear 68 77 9
400 Hz 67 77 10
MC 4 800 Hz 49 68 21
“A” Overall” 72 78 6
Linear 75.5 80 4.5
400 Hz 67.5 77 9.5
MA-2 800 Hz 61.5 69 7.5
“A” Overall” 69.5 76.5 7
Linear 72 79 7
400 Hz 15.4
Average 800 Hz 5.8
attenuation “A” Overall” 9.5
Linear 9.8
The selected expansion muffler design was qualified by the LM contractor, GAC, in testing of the muffler and the glycol system loop, which was completed in June 1970 [47] and was installed in the LM-8 in time for the Apollo 14 mission. The qualification testing involved pressure cycling, shock, and burst pressure, but did not include acoustic testing.
Several sources refer to final acoustic levels of the LM as the LTA-8 acoustic levels based upon unmanned LTA-8 ground testing as shown in Figure 56 [10][11][48]. It is believed that these results reflect post-muffler installation and were obtained during ambient pressure operations, after which they possibly were corrected for 5 psia operations. Varying opinions exist regarding how to convert 14.7 psia data to 5 psia, as will be discussed in Section 4.0.

APOLLO - Goodman
Chapter III - 49
Figure 56. Apollo LM published acoustic levels [10] [11] [48].
3.4.7 Other Efforts on Lunar Module Noise Analysis, Testing, and Control
In addition to the expansion muffler and flexible line installation on Apollo 14, other quieting efforts considered for later incorporation on Apollo 16 and subsequent missions were vibration isolation of lines, tighter pump tolerances, and pump configuration changes [4]. It is not known to what extent these changes were put into effect.
In November 1970, it was reported that, in LM-9 ambient pressure testing, use of the expansion muffler resulted in a fluid noise reduction of 30 dB and a resultant airborne reduction of 12 dB [49].
Hamilton Standard Division of United Aircraft conducted a pressure fluctuation investigation and reported on the testing of the LTA-8 Coolant Recirculation Assembly in December 1968 [50]. Among the conclusions: the pressure ripple could be reduced by operating the system, and the use of a flexible line in the coolant circulation system considerably reduced the magnitude of the peak-to-peak pressure ripple. It was recommended that the flexible lines be used to reduce the ripple magnitude or the actual ripple magnitude be measured in each system to ensure it was safe. As a secondary benefit, the flex lines could reduce the vehicle cabin noise, which was caused by a combination of mechanical and hydraulic resonances. Note it was reported that LM-8 testing showed little benefit from the use of flex lines or covers on lines.
In December 1969, The Boeing Company, Space Division, Houston, completed a report on the analysis of noise generation mechanisms associated with the LM ECS coolant system [51]. This report discussed noise radiators, and LTA-8 data/observations, which included effects of
Octave Band Center Frequency, Hz
So
un
d P
res
su
re L
ev
el,
dB
45
50
55
60
65
70
75
80
85
31.5 63 125 250 500 1000 2000 4000 8000 OASPL dBA
NC-60
NC-55
NC-50
NC-45
NC-40
NC-70
NC-65
72.2 dBA

NASA/SP-2015-624 – ACOUSTICS AND NOISE CONTROL IN SPACE CREW COMPARTMENTS – Goodman & Grosveld
Chapter III - 50
radial and lateral pulsations in the primary system cooling, as well as oscillations of the pump and panel surfaces. LTA-8 expansion muffler testing results were not yet available. If use of the muffler did not produce the necessary reduction in noise, it was recommended that vibration isolation of the pump, use of flexible tubing, and enclosing the pump in a sound-attenuating container be considered.
3.4.8 Apollo 12, LM-6 (Launched November 1969)
The new muffler and line change that were developed, as discussed in the previous Section, were not implemented on the Apollo 12, LM-6 mission. On this mission, the crewmembers were provided with hammocks, which helped them sleep. Procedural changes precluded pre-chilling of the crewmembers prior to their sleep periods. Crewmembers reported that although they were comfortable during sleep periods, they were awakened on occasion by an apparent change in the sound pitch produced from the water/glycol pump installation [52]. Performance data indicated that the pump frequency could not have varied perceptibly. The only explanation for the change of pitch, while unlikely, was that the fluid lines and supporting structure near and downstream from the pump experienced physical changes, which altered the vibration harmonics sufficient to produce, on occasion, detectable changes in pitch frequency. It was noted that because all pump parameters indicated normal operation, no system modifications were required. However, reports on past flights with an annoying noise in the cabin had prompted a modification to the plumbing for future flights, which significantly reduced noise and will probably eliminate any pitch variations from the surrounding structure. In a Boeing report on LM-6 ECS, the glycol pump noise anomaly was “not considered of major significance since the pump performance was satisfactory throughout the mission” [53].
One interesting conversation during the mission between the Capsule Communicator and the Apollo 12 crew – Charles (“Pete”) Conrad, Alan Bean, and Richard Gordon – involved the noise in the LM. Bean noted that “people have worried about the amount of sound in the LM bothering you. It is fairly noisy in there and there are a couple of pumps that change frequency every once in a while, but all in all, I don’t think that was any hindrance to sleep, do you Pete?” (Conrad, who was with him in the LM). Conrad replied “no” [54].
3.4.9 Apollo 13, LM-7 (Launched April 1970)
Accident in the CSM created abort of the lunar mission; however, when the crew attempted to sleep in the LM or docking tunnel, the glycol pump noise and frequent communications with the ground hindered sleep [55]. In the crew debriefing, crewmembers noted the glycol pump and the suit fans were powerful squeaky noise sources, and that they both changed frequency and gargle [56]. They sounded “pretty rough.”
3.4.10 Apollo 14, LM-8 (Launched January 1971)
The glycol pump noise, which was a nuisance on prior missions, was reduced below annoyance level by incorporating the expansion muffler and the connecting line from the glycol pump in the thermal control system. The crew did not use earplugs [57]. A Boeing ECS report stated that “glycol pump noise, which was a nuisance during the rest period on the lunar surface on previous missions, was reduced by a muffler in the pump system of LM-8. The crew had no complaints about the glycol pump noise” [58].

APOLLO - Goodman
Chapter III - 51
3.4.11 Apollo 15, LM-10
Noise was minimized by configuring the ECS in accordance with the checklist and by wearing earplugs [59]. Note that according to the LM-10 and subsequent Apollo Operations Handbook, “One suit fan must be on when the astronauts are on the LM ECS; otherwise atmosphere will not be reconditioned, leading to possible loss of consciousness” [60].
3.4.12 Apollo 16, LM-11
The crewmembers did not use earplugs, which they felt were unnecessary. ECS chattering noise was caused by sticking of a cabin gas return valve [61]. The glycol pump was reported to be louder than expected, probably because the suit loop was not yet turned on. Once it was turned on, the air noise drowned out the pump noise [62].
3.4.13 Apollo 17, LM-12
The glycol pump was reported to have been a little louder than expected, and it was noted that once the fan is operating, the air noise drowns out the glycol pump noise [63].
3.5 Summary Comments Lunar Module Acoustics and Noise Control
A good deal of professional effort was expended trying to resolve acoustic issues in the LM by the LM contractor and NASA MSC, and by other contractors. Considerable testing was performed in LM test articles, flight vehicles (LTA-8, LM-7, and LM-8), using a breadboard with flight-type hardware, and other hardware such as testing with the IES. The glycol pump created high-level narrowband noise, especially at 400 Hz, and harmonics. Other sources such as the cabin fan and the liquid cooled garment pump also had prominent narrowband spikes, and elevated sound pressure levels at 2000 Hz and higher frequencies in the speech interference range. Figure 51 on LM-8 test data shows higher fan readings than the glycol pumps, above 4000 Hz, as this frequency region was not affected by the pump quieting effort. With the muffler fix applied, there were still high levels in the speech interference range between the 500 Hz to 4000 Hz frequencies. However, the priority at the time was to make the LM acceptable, avoiding crew annoyance while trying to sleep. Suits inside the LM were removed after initial flights. Whereas the glycol pumps ran 24 hours per day, the suit fans and water garment cooling pumps did not. NASA’s prime objective was to reduce the 400 Hz narrowband levels by 30 dB and reduce the high-level narrowband harmonics so that the LM levels would not be annoying and thus prevent the crew from sleeping. The quieting needed to be accomplished with minimal LM weight, volume, vehicle design, and cost impacts. Weight was a very critical concern in the LM program, and many weight reduction reviews were held to attend to this concern. The expansion muffler, with a short, unrestrained line from the glycol pump to the muffler satisfied this goal. The resultant vehicle modification was relatively simple.
Figure 56 represents what is understood to be the resultant LM cabin noise profile of the final configuration with the expansion muffler. However, the LM test data reviewed had considerable variation due to individual glycol pump changes in intensity and frequencies, and the differences between the pumps. The benefits of the new muffler included elimination of vibration of the tubing and the structure downstream of the muffler, and associated structure-

NASA/SP-2015-624 – ACOUSTICS AND NOISE CONTROL IN SPACE CREW COMPARTMENTS – Goodman & Grosveld
Chapter III - 52
borne noise, including that from the pressure vessel penetrations. Apollo 14 and subsequent missions had these benefits that Missions 9, 10, 11, and 13 did not have.
The benefits achieved by incorporation of the muffler as defined in Table 4 and shown in Figure 56 were a significant improvement over previous LM acoustic environments. The defined specification limits for all systems exceed the NC-50 recommendations in Chapter I, Acoustics. The resultant levels were less than the 80 dB OASPL limit, but exceeded the NC-55 limit noise criteria set for the LM. In general, levels exceeded NC-55 by 10 dB or more from 500 Hz through 8000 Hz, except at 1000 and 2000 Hz. As a result of high levels in the LM and CM, NASA implemented the NC-50 requirement in a 1972 Design and Procedural Standard [17] for implementation on manned spacecraft.
It appears that even with incorporation of the expansion muffler and its benefits at 400 Hz and harmonics, the glycol pump and other sources mentioned still left high levels at 500 Hz and above, as shown in Figure 56. LM-8 data in Figure 51 show that the fan noise exceeds the pump noise at frequencies higher than 4000 Hz. The LM acoustic levels had a dramatic negative effect on speech intelligibility. The latest LM specification discussed in Section 3.1 limits the levels to 55 dB for the frequencies from 600 Hz to 4800 Hz [32], and the octave band frequencies shown in Figure 24. This covers the frequencies of 1000 Hz, 2000 Hz, and 4000 Hz or SIL (1, 2, 4). It is now accepted that speech interference should include four frequencies, including 500 Hz, SIL (0.5, 1, 2, 4), which would provide a higher resultant SIL as not only 500 Hz has a higher value on the NC-55 curve, but especially because the contribution of the high spike in the LM at 400 Hz [64]. The SIL (1, 2, 4) for the LTA-8 quieted LM was 64.0 dB versus the SIL (1, 2, 4) limit of 55 dB, whereas the SIL (0.5, 1, 2, 4) was 65.3 dB for the quieted LM. LM-7 testing, performed before the muffler was available, showed CMDR operating location SIL (1, 2, 4) for P1F1 at 64.1 dB, and P2F1 at 67.2, and SIL (0.5, 1, 2, 4) for P1F1 at 66.7 dB, and P2F1 at 69.7 dB. In LM-7 showed the CMDR sleep location SIL (1, 2, 4) for P1F1 at 69.9 dB and for P2F1 at 73.2 dB, and SIL (0.5, 1, 2, 4) for P1F1 at 73.5 dB and P2F1 at 75.8 dB. Again, the SIL (0.5, 1, 2, 4) values are the preferred ones to compare, as they are more representative using current speech interference standards. All of the SILs discussed exceeded the 55 dB limit.
The SIL was established to determine the effect of continuous, steady-state background noise on speech communications in a work environment, and is an indication of the sound pressure level that inhibits speech communications. The LM-8 testing included high tonal effects, and not the steady-state broadband spectrum normally considered when SIL values are evaluated. However, these SILs provide an indication of how problematic the LM acoustic environment was with high levels including significant and numerous narrowband spikes across the spectrum, as shown in Figure 50. Constant use of crew communication carriers was required to help communications and minimize noise exposure.
Note the LM specification requirement that “every effort shall be made to insure that pure tones generated in the cabin by operating equipment will be kept to a minimum.” Chapter I, Acoustics, Section 2.4 of this book states “The maximum sound pressure level of any narrowband component should be at least 10 dB less than the sound pressure level of the octave band that contains the component.” The genesis of this requirement was Apollo concerns with excessive narrowband noise components in the LM, which resulted in these

APOLLO - Goodman
Chapter III - 53
narrowband limits. Along with NC-50 these were incorporated into the previously referenced 1972 Design and Procedural Standard [17].
The unprotected ear noise tolerances as shown in Figure 23 are too high. These limits permit an exposure of 100 dB for 8 hours, and do not address how often these high exposures will be tolerated.
Although there were significant ground testing and remedial efforts, the results were obtained in the LM fleet after development, and changes to remedy the acoustics were made late in the program. This is inconsistent with the recommended focus on having a noise control plan and having noise control practiced by dedicated acoustic personnel, as recommended in Chapter II, Noise Control. It is most effective when noise control is addressed and implemented early in the design/development process. Also, specific defined limits early in the program would have helped to resolve whether levels obtained were acceptable, rather than having specification verbiage that was subject to wide interpretation, such as: “the noise level permissible is that level which permits communications with the ground and between crewmembers, and which will not induce physiological disturbances.”
Apollo management was very supportive of the noise reduction efforts, starting with the referenced LMMP Board, CCB, and follow up activities.
4. DISCUSSION, CONCLUSIONS, AND RECOMMENDATIONS
Very high acoustic levels were permitted for limited duration in both the CM and LM specifications. These type of limits were originally in NASA Standard 145 [17], but were not allowed later in the Space Shuttle and during the International Space Station (ISS), because they were deemed inappropriate for manned spaceflight crew compartments. It is very impractical to allow such limits – especially those higher-level limits over a few minutes or 8 hours – and, at the same time, indicate that the levels should also permit communications at all times. Note that there was also no limit on how many of these permitted high-level acoustics incidents would be allowed over a time period. Measured acoustic levels in the CM and LM were high and exceeded specifications. Limits for unprotected ears were based upon physiological limits, not what should be set for good communications, comfort, and habitability. The NC-55 limits appear to have been in effect, especially since both the CM and the LM had limits of 55 dB in the 300 or 600 cps to 4800 cps range. The stated limits in the CM and LM were that noise levels should permit communications with the ground and between crewmembers. In the CM, it was believed the crews would use the cabin fan system for nominal on-orbit operations, and that ended up being avoided due to cabin fan noise.
SIL limits should be based upon the required communicating distances between the crew, which should have been shorter in the LM than the CM. The CM SIL (0.5, 1, 2, 4) limit was effectively 55 dB. SIL for measured test or referenced source data was 63.6 dB and for ground test data was 59.0 dB (Figure 18). The LM SIL (1, 2, 4) limit was 55 dB, but was measured high at 64.0 dB as shown by the LTA-8 results in Figure 56. When using the SIL (0.5, 1, 2, 4) metric, the high sound pressure level in the 500 Hz band raises the SIL higher still to 65.3 dB, even after fixes were installed.

NASA/SP-2015-624 – ACOUSTICS AND NOISE CONTROL IN SPACE CREW COMPARTMENTS – Goodman & Grosveld
Chapter III - 54
The LM remedial action impetus was reducing the noise to an acceptable level for crew sleep, not for other operations, with the previously mentioned LMMP CDR RFA being a good example – noise reduction was requested for compatibility with crew sleep, not to meet specification limits.
From what was reported, these limits were not regarded as firm requirements, and references to non-compliance with them was lacking. During Apollo, the CSD in the Engineering Directorate at MSC was responsible for acoustics, but was also reporting to the Director of Medical Research and Operations on acoustic levels and their acceptability. In one memorandum on Apollo acoustics, the CSD chief reported relative to CM levels that “the design goal of 80 dB OASPL and the SIL of 55 dB will be exceeded” [6]. In another NASA document, a memorandum from the Mission Staff Engineer for Apollo 7 CM also stated that it “is doubtful the design goal of 80 dB overall and 55 dB SIL can be achieved” [8]. These were limits to be addressed and met, not simply “goals”! This author now has an allergic reaction to this term, since the same emphasis on using goals to “soften” or replace limits was repeated throughout the Space Shuttle Program and, at times, even on the ISS. The focus was on loss of hearing and supporting crew sleep, rather than meeting the NC-55 or SIL limits. This 1969 reference [26] also reported that “we had to go to the traditional last resort of hanging protective equipment on the crew for the LM.”
From an Apollo Program standpoint, acoustic concerns were successfully dealt with. In the CM, the suit circuit functioned adequately as a backup system so the normal ECS could be turned off. In the LM, earplugs were provided to alleviate loud noise, equipment was powered down, and procedures helped relieve noise concerns until the muffler change could be implemented. It was regarded that “the performance of both the CM and LM environmental control systems during the Apollo Program was highly satisfactory,” and “only minor problems were experienced” [18]. The Apollo Program Summary Report indicated that “although flight problems were encountered in the environmental control system, none endangered the crewman” [24].
The CM and LM data show different acoustic levels at the 5.0/4.8 psia and 14.7 psia ambient pressures, are not consistent over the frequency range, and are not constant as widely believed. Reference [42] indicated a decrease of 4.5 dB from 14.7 psia levels was expected by GAC to provide 5.0 psia levels, but that North American Rockwell had indicated the difference should be more like 7 to 8 dB. Johnston reported that 14.7 psia data can be reduced by 4.7 dB to predict levels at 5.0 psia [13].
Structure-borne noise, including noise at locations where penetrations passed through the cabin structure, was a common CM and LM problem. Chapter IV, Acoustics and Noise Control in the Space Shuttle Orbiter and in Chapter V, Acoustics and Noise Control in International Space Station discuss how this problem was addressed early in the design/development and, as a result, numerous isolation mounts were implemented to attend to this area of concern. Isolator applications are currently considered a good design practice for fans, pumps, and compressors. However, in the LM – with its crowded installations and very tight weight restrictions – it was understood why installation of vibration isolators for all of the fans and pumps would be difficult and costly to implement, especially later when the design was hardened, weight so

APOLLO - Goodman
Chapter III - 55
critical, and when acoustic problems became evident after manufacturing and in production vehicles. The LM glycol noise problem, however, was caused primarily by the pressure pulses downstream of the pump, which started structure-borne noise propagation.
As noted previously, ECS hardware operations were generally responsible for exceedances in the CM, and this applies to the LM as well. All kinds of special efforts were made in spacecraft development because of the uniqueness of vehicle hardware; however, ECS hardware did not seem to merit noise control efforts in spite of the hardware’s significant role in spacecraft acoustics. Chapter VI, ISS Noise Control, A European Perspective discusses that this can be avoided by allocating limits to noise-producing hardware systems and exerting management attention and control over hardware performance. The need to ensure that noise sources are adequately controlled is brought out dramatically in Chapter V, Acoustics and Noise Control in International Space Station, with the long struggle to quiet the Service Module and its fans. This involved addition of vibration isolators, wrapping fans, and other techniques, and the eventual successful redesign of fan units by the Russians to produce “quiet fans.”
The Apollo experience forced attention on designing for acceptable acoustic limits. It not only provided the impetus for later efforts on setting lower acoustic limits, but also efforts to ensure compliance by early testing, having effective noise control plans, and having more mature and focused acoustics and noise control oversight and implementation throughout the program. The Apollo Program was our first manned spacecraft program where crewmembers left their seats and moved about within their spacecraft. The importance of noise control in spacecraft and existing technology to do so was not applied, nor was technology very well developed or utilized on spacecraft at that time. The overriding program emphasis was getting to the moon safely by the deadline for the purpose of exploration, not the habitability in the spacecraft and meeting acoustics limits. As one who worked on Apollo in the crew station area, it would be difficult to argue with the success of Apollo and our overriding focus on safely accomplishing the lunar landing and exploration in the timeframe that was set. We were fortunate to have hardware systems and designs that provided options in operations and, for the LM, to have enough lunar modules, missions, and stretched-out time to develop acceptable changes in later spacecraft.
5. REFERENCES
1. Apollo Design Criteria Specification. SID 62-65, North American Aviation Inc., Revised May 1962.
2. Apollo Master Spacecraft Specification. SID 63-313, North American Aviation Inc., Space and Information Systems Division, 31 October 1963.
3. CSM Technical Specification, Block II. SID 64-1344C, Space Division of North American Rockwell, N7976448, 1 January 1969.
4. Goodman, Jerry R., Cabin Acoustic Noise Criteria and Control. Briefing to Orbiter Management Review, 26 August 1974

NASA/SP-2015-624 – ACOUSTICS AND NOISE CONTROL IN SPACE CREW COMPARTMENTS – Goodman & Grosveld
Chapter III - 56
5. Parker, James F. and West, Vita R., editors, Bioastronautics Data Book. Second Edition, NASA SP-3006, 1973.
6. Memorandum, Apollo acoustic environment. From EC/Chief, Crew Systems to DA/Director of Medical Research and Operations, 27 July 1966.
7. Vibroacoustic Noise Source Data-Literature Survey Results. NASA Report JSC-24148, March 1980.
8. Figure, One-third octave band plot of Apollo CM noise. Informally provided by Rockwell International Corporation to Jerry Goodman during early Shuttle development.
9. Figure, Measured cabin noise levels in 2 TV-1 CM with one-third octave band plots of 5 psia, 14.7 psia, and noise floor. Obtained by Jerry Goodman from acoustics personnel who worked Apollo during early Shuttle development.
10. Memorandum, What was the measured dB level for the CM and LM? From SA/Director Space and Life Sciences to Deputy Director NASA-JSC, 18 August 1980.
11. Homick, Jerry L., The Physiological Basis for Spacecraft Environmental Limits. Chapter V Sound and Noise. NASA Reference Publication 1045, November 1979.
12. Space Station Vibroacoustic Control Plan. Prepared for NASA Headquarters by Tracor Applied Sciences, Inc., not dated.
13. Memorandum, Skylab Acoustics Evaluation. From ES/Chief, Structures and Mechanics Division to PT/Chief Test Division, written by Johnston, J., 28 February 1973.
14. Samonski, F.H. and Tucker, E.M., Apollo experience report - Command and Service Module environmental control system. NASA TN D-6718, March 1972.
15. Hughes, D.F., Owens, W.L. and Young, R.W., Apollo Command and Service Module environmental control system - mission performance and experience. ASME Publication 73-ENAs-29, 1973.
16. Allen, Louis and Nussman, Dale, Apollo Experience Report - Crew Station Integration. Volume I - Crew Station Design and Development, NASA TN D-8178, 1976.
17. MSC Design and Procedural Standard, Design Standard 145, Acoustical Noise Criteria. NASA Manned Spacecraft Center (MSC), NASA Johnson Space Center, 16 October 1972.
18. Johnston, Richard S., Dietlein, Lawrence F. and Berry, Charles A., editors, Biomedical Results of Apollo. NASA SP-368, 1975.
19. Berry, Charles A., MD, Apollo 7 to 11: Medical Concerns and Results. NASA TM X-58034, November 1969.
20. Apollo 7 Mission Report. MSC-PA-68-15, Dec. 1968.
21. Apollo 8 Technical Debriefing. January 2, 1969.
22. Apollo 8 Mission Report. MSC-PA-R-69-1, Feb. 1969.
23. Apollo 9 Mission Report. MSC-PA-R-69-2, May 1969.

APOLLO - Goodman
Chapter III - 57
24. Apollo Program Summary Report. JSC-09423, 1975.
25. Apollo 10 technical crew debriefing. 2 June 1969.
26. Letter from Catterson, A.D., M.D. deputy Director of Medical Research and Operations, DA-69-464, to McLaughlin, E.J., Office of Manned Space Flight, NASA, 24 July 1969.
27. Bottomly, T.A. and Chen, R.K., Trip Report-Acoustic Environment of Apollo Spacecraft. Bellcomm, Inc., 29 April 1966.
28. Memorandum DA-66-L68, The Acoustic Environment of Apollo Spacecraft. To NASA Headquarters, Attention: General Bollerud, MM, 6 October 1966.
29. Air Force Stems Command Design Handbook. DH1-3, DN 3F1, Effects of Acoustical Noise on Hearing, Subnotes 3.2(1) and 3.2(2), and DN 3F2, Effects of Acoustic Noise on Communication, Subnote 1.2(1) Noise Criteria Curves, 1 January 1969.
30. Compendium of Human Responses to the Aerospace Environment. Volume II, Section 7-9, Lovelace Foundation Medical Education and Research, NASA CR-1205(II), November 1968.
31. Misoda, J. and Magliozzi, B., Fan and pump noise control. NASA-CR-128986, Hamilton Standard report number SVHSER 6183, May 1, 1973.
32. Volume VIII, Phase 1, Laboratory Master End Item Specification. Apollo Extension Systems-Lunar Excursion Module Phase B Final Report, 8 December 1965.
33. Contract Technical Specification for Lunar Module System. LSP-470-1D, 1 October 1968.
34. Dickson, Randy, Sound Profile in Commanders Sleep Area-IES Building 7. IES files, 22 September 1969.
35. Apollo 9 Crew Technical Debriefing. 20 March 1969.
36. Apollo 10 Mission Report. MSC-00126, August 1969.
37. Apollo 11 Mission Report. NASA SP-238, 1973.
38. Apollo 11 Mission Report. MSC-00171, November 1969.
39. Preliminary data package, LM-7 Delta altitude chamber test, performed in MSOB Altitude Chamber R. Kennedy Space Center, 4 November 1969.
40. CDR for the LMMP (Lunar Module Modification Program). Memorandum PD141/M251-69, from HA/Manager Advanced Mission Program Office, 25 August 1969.
41. Franklin, George, Cabin Noise. RFA 2.2-3, 9 September 1969.
42. Interim acoustic measurements report for several components of the LM ECS equipment, LM-8 testing results. GAC report number LD-ENG-69-96, 1969.
43. Dorland, Wade, Joint MSC/GAC. 25 September 1969 meeting minutes on LMMP cabin noise problem, 26 September 1969.
44. Memorandum ES2-M113-69, Status of LM noise reduction project. From ES26/Head Experimental Dynamics Section to ES2/Members of VATF Engineering Staff, 8 October 1969.

NASA/SP-2015-624 – ACOUSTICS AND NOISE CONTROL IN SPACE CREW COMPARTMENTS – Goodman & Grosveld
Chapter III - 58
45. Dickson, Randy, Summary chart of mufflers candidates developed to reduce LM noise, prior to LTA-8 muffler testing. 1969.
46. West, W.W., LTA-8 Acoustics Test Summary. Preliminary Memorandum, 26 January 1970.
47. Results of the qualification tests of the muffler assembly certification test requirements, LCQ 330-124. Test Report LTR 906-21004, 14 July 1970.
48. Tracor Applied Sciences, Inc., Space Station vibroacoustic control plan. Prepared for NASA Headquarters, not dated.
49. Mullen, H.R., Goss, R. and Dorland, W., Quieting of the hydraulic noise in the Lunar Module. 80th Meeting Acoustical Society of America, 4 November 1970. (Reported in J. Acoust. Soc. Am. Volume 49, Issue 1A, 1971).
50. LM-ECS Item 290, LTA-8 Pump pressure fluctuation test report, Hamilton Standard Engineering Report, December 1968.
51. Analysis of noise generation mechanisms associated with the LM ECS coolant system. The Boeing Company, Space Division - Houston Report S-2961-Hou-112, 23 December 1969.
52. Apollo 12 Mission Report. MSC-01855, March 1970.
53. LM-6 Environmental Control System performance during the Apollo 12 mission, D2-118279-1, 30 December 1969.
54. Dickson, Randy, Apollo 12 Mission Commentary, Air-to-Ground. Recorded 18:39 P.M. CST, 23 November 1969.
55. Apollo 13 Mission Report. MSC-02680, September 1970.
56. Apollo 13 Technical Crew Debriefing. 24 April 1970.
57. Apollo 14 Mission Report. MSC-04112, May 1972.
58. LM-8 Environmental Control System performance during the Apollo 14 mission. JSC-24148, D2-118379-1, 12 April 1971.
59. Apollo 15 Mission Report. MSC-05161, December 1971.
60. Apollo Operations Handbook Lunar Module, LM10 and Subsequent. Volume I subsystems data, LMA790-3-LM 10 and subsequent, 1 April 1971.
61. Apollo 16 Mission Report. MSC-07230, August 1972.
62. Apollo 16 Technical Crew Debriefing. 5 May 1972.
63. Apollo 17 Technical Crew Debriefing. 4 January 1973.
64. ANSI S12.65-2006. American National Standard for Rating Noise with Respect to Speech Interference, 2006.

APOLLO - Goodman
Chapter III - 59
6. ACRONYMS
ARS Atmospheric Revitalization System
ASPO Apollo Spacecraft Program Office
BMags body-mounted attitude gyros
BP Boiler Plate
CAPCOM Capsule Communicator
CCB Configuration Control Board
CDR Critical Design Review
CM Command Module
cps cycles-per-second
CSM Command and Service Module
dB decibel
ECS Environmental Control System
F1, F2 suit fan #1, #2
GAC Grumman Aircraft Company
IES Internal Environment Simulator
ISS International Space Station
KSC NASA Kennedy Space Center
LM Lunar Module
LMMP Lunar Module Modification Program
LMP Lunar Module Pilot
LTA Lunar Module Test Article
MSC Manned Spacecraft Center
NC Noise Criterion
NCA alternate Noise Criterion
OASPL overall sound pressure level
P1, P2 water glycol pump #1, #2
psia pounds-per-square-inch-absolute
RFA request for action
rpm rotations per minute
SIL Speech Interference Level
SPL sound pressure level
vpf vane passage frequency

NASA/SP-2015-624 – ACOUSTICS AND NOISE CONTROL IN SPACE CREW COMPARTMENTS – Goodman & Grosveld
Chapter III - 60
APPENDIX A: LUNAR MODULE-7 ACOUSTIC ALTITUDE TESTS AT KENNEDY SPACE CENTER, 7 NOVEMBER 1969
Note: The first part of the Chapter text on LM-7 is partially repeated here so that this
Appendix contains all pertinent information on LM-7 altitude test results.
Considerable variability in acoustic LM pump levels existed because of fluctuating pump pressures and the variety of crew locations in the LM, as demonstrated by the following:
During P1F1 and P2F1 operations, levels at 400 Hz were always higher than at 800 Hz.
During P1F1 operations, the CMDR sleep location was 12.3 dB higher than the LMP sleep location at 400 Hz, and 9.6 dB higher at that frequency during P2F1 operations. Also, during P1F1 operations the CMDR sleep location was 15.5 dB higher at 800 Hz than the LMP sleep location, and 4.1 dB higher during P2F1 operations.
During P1F1 operations, the 400 Hz acoustic level at the LMP location was 2.5 dB higher than the CMDR, and was 1.6 higher during P2F1. During P1F1 operations, the CMDR work location was 8.5 dB higher than the LMP at 800 Hz, and was 9.9 dB higher during P2F1 operations.
For P1 alone, 4.8 psia operations at the CMDR sleep station, measured levels were 17.7 dB lower at 400 Hz than the averaged sound pressure level of the other three locations. For the P1-alone operations at 800 Hz, the LMP operate location was 16.4 dB below the average sound pressure level of the other three locations. Also, P1 had higher values than P1F1 at the LMP sleep location, meaning the pump itself had higher levels when tested than the same pump plus the fan.
Figure A-1 shows measured levels at both CMDR and LMP sleep stations for both P1F1 and P2F1 operations. Figure A-2 shows levels measured at CMDR and LMP crew operating locations for both P1F1 and P2F1 operations. The sleep stations levels for the CMDR are much higher than the LMPs location for both P1F1 and P2F1 operations, whereas crew operating locations had close to the same levels for both CMDR and LMP. The CMDR sleep location had the highest acoustic level due to its location in the LM, being very close and in direct line of sight with the glycol pump, and close to noise from vibration of pump lines downstream of the pump (Figure 43 and Figure 44).
Of note, the following are for P1-only data (Figure A-3 and Figure A-4):
P1-alone levels were at times higher than P1F1 levels – i.e., for LMP sleep location – but were significantly lower than P1F1, for the CMDR sleep location.
For LMP sleep location, 400 Hz, 800 Hz, OASPL, and dBA levels are higher than for the P1F1 measured operation.
For the CMDR sleep location, 400 Hz and 800 Hz are at very low readings compared to P1F1.

APOLLO - Goodman
Chapter III - 61
Figure A-1. Sleep location levels with P1F1 and P2F1 operating at 4.8 psia.
Figure A-2. Crew “operate” locations for both P1F1 and P2F1 operating at 4.8 psia.
One-Third Octave Band Center Frequency, Hz
So
un
d P
res
su
re L
ev
el,
dB
35
40
45
50
55
60
65
70
75
80
85
90
95
31.5 63 125 250 500 1000 2000 4000 8000 OASPL dBA31.5 63 125 250 500 1000 2000 4000 8000 OASPL dBA31.5 63 125 250 500 1000 2000 4000 8000 OASPL dBA
82.3 dBA
69.6 dBA
Pump #1 and Fan #1; Commander - SleepPump #1 and Fan #1; Lunar Module Pilot - SleepPump #2 and Fan #1; Commander - SleepPump #2 and Fan #1; Lunar Module Pilot - Sleep
One-Third Octave Band Center Frequency, Hz
So
un
d P
res
su
re L
ev
el,
dB
35
40
45
50
55
60
65
70
75
80
85
90
95
31.5 63 125 250 500 1000 2000 4000 8000 OASPL dBA31.5 63 125 250 500 1000 2000 4000 8000 OASPL dBA31.5 63 125 250 500 1000 2000 4000 8000 OASPL dBA31.5 63 125 250 500 1000 2000 4000 8000 OASPL dBA31.5 63 125 250 500 1000 2000 4000 8000 OASPL dBA31.5 63 125 250 500 1000 2000 4000 8000 OASPL dBA31.5 63 125 250 500 1000 2000 4000 8000 OASPL dBA31.5 63 125 250 500 1000 2000 4000 8000 OASPL dBA
77.1 dBA
73.9 dBA
Pump #1 and Fan #1; Commander - OperatePump #1 and Fan #1; Lunar Module Pilot - OperatePump #2 and Fan #1; Commander - OperatePump #2 and Fan #1; Lunar Module Pilot - Operate

NASA/SP-2015-624 – ACOUSTICS AND NOISE CONTROL IN SPACE CREW COMPARTMENTS – Goodman & Grosveld
Chapter III - 62
Figure A-3. Acoustic levels with only P1 operating, for all crew locations at 4.8 psia.
Figure A-4. Acoustic levels P1 only versus P1F1 operating in the CMDR sleep and operate locations at 4.8 psia.
P1 and P2 were also run at 14.7 psia to provide comparative data with the measurements performed at 4.8 psia. Ambient-pressure-level testing at 14.7 psia was easier and cheaper to
One-Third Octave Band Center Frequency, Hz
So
un
d P
res
su
re L
ev
el,
dB
35
40
45
50
55
60
65
70
75
80
85
90
95
31.5 63 125 250 500 1000 2000 4000 8000 OASPL dBA31.5 63 125 250 500 1000 2000 4000 8000 OASPL dBA31.5 63 125 250 500 1000 2000 4000 8000 OASPL dBA31.5 63 125 250 500 1000 2000 4000 8000 OASPL dBA31.5 63 125 250 500 1000 2000 4000 8000 OASPL dBA31.5 63 125 250 500 1000 2000 4000 8000 OASPL dBA31.5 63 125 250 500 1000 2000 4000 8000 OASPL dBA31.5 63 125 250 500 1000 2000 4000 8000 OASPL dBA31.5 63 125 250 500 1000 2000 4000 8000 OASPL dBA
73.0 dBA 71.4 dBA
Pump #1; Commander - SleepPump #1; Commander - OperatePump #1; Lunar Module Pilot - SleepPump #1; Lunar Module Pilot - Operate
One-Third Octave Band Center Frequency, Hz
So
un
d P
res
su
re L
ev
el,
dB
35
40
45
50
55
60
65
70
75
80
85
90
95
31.5 63 125 250 500 1000 2000 4000 8000 OASPL dBA31.5 63 125 250 500 1000 2000 4000 8000 OASPL dBA31.5 63 125 250 500 1000 2000 4000 8000 OASPL dBA31.5 63 125 250 500 1000 2000 4000 8000 OASPL dBA31.5 63 125 250 500 1000 2000 4000 8000 OASPL dBA31.5 63 125 250 500 1000 2000 4000 8000 OASPL dBA31.5 63 125 250 500 1000 2000 4000 8000 OASPL dBA31.5 63 125 250 500 1000 2000 4000 8000 OASPL dBA31.5 63 125 250 500 1000 2000 4000 8000 OASPL dBAdBA
81.7 dBA
72.8 dBA
Pump #1; Commander - SleepPump #1; Commander - OperatePump #1 and Fan #1; Commander - SleepPump #1 and Fan #1; Commander - Operate

APOLLO - Goodman
Chapter III - 63
perform than testing at 4.8 psia because of the need to test in an activated altitude chamber to obtain 4.8 psia sound pressure level readings. NASA’s breadboard testing of the glycol pump and proposed mufflers was performed at 14.7 psia. Testing was performed in the LTA-8, with the proposed muffler design to remedy acoustic concerns. Figure A-5 shows measured P1 one-third octave band levels at the CMDR sleep and work locations for 14.7 psia and 4.8 psia. Figure A-6 shows P1 levels for all LMP sleep and work locations, also in one-third octave bands. The same data are shown in octave bands in Figure A-7 and Figure A-8. Octave band data for P2 and P2F1 operations at the CMDR sleep and work locations are provided in Figure A-9. Octave band data for P2 and P2F1 operations and LMP sleep and work locations are provided in Figure A-10.
As with the acoustic levels measured at 4.8 psia, there was considerable variability in pump pitch and intensity over time, and varying levels for the four crew locations in the LM. These data show the following:
In general, levels of the same source (P1 or P2) at 14.7 psia versus 4.8 psia are higher at the 14.7 psia condition, although the varying pump levels and changes in frequency causes some exceptions to this.
The levels for either P1 or P2 generally peak at 400 Hz, with the exception of P1 at the CMDR location for sleep.
An interesting trend is that for the sleep locations of either the CMDR or the LMP, the 4.8 psia levels at frequencies of 250 Hz and below tend to be higher than for the 14.7 psia condition.
Figure A-5. P1 one-third octave band levels at the CMDR sleep and operate locations for 14.7 and 4.8 psia conditions.
One-Third Octave Band Center Frequency, Hz
So
un
d P
res
su
re L
ev
el,
dB
35
40
45
50
55
60
65
70
75
80
85
90
95
31.5 63 125 250 500 1000 2000 4000 8000 OASPL dBA
83.2 dBA
72.8 dBA
Pump #1; 4.8 psia; Commander - SleepPump #1; 4.8 psia; Commander - OperatePump #1; 14.7 psia; Commander - SleepPump #1; 14.7 psia; Commander - Operate

NASA/SP-2015-624 – ACOUSTICS AND NOISE CONTROL IN SPACE CREW COMPARTMENTS – Goodman & Grosveld
Chapter III - 64
Figure A-6. P1 one-third octave band levels at the LMP sleep and operate locations for 14.7 and 4.8 psia conditions.
Figure A-7. P1 octave band levels at the CMDR sleep and operate locations for 14.7 and 4.8 psia conditions.
One-Third Octave Band Center Frequency, Hz
So
un
d P
res
su
re L
ev
el,
dB
35
40
45
50
55
60
65
70
75
80
85
90
95
31.5 63 125 250 500 1000 2000 4000 8000 OASPL dBA
75.8 dBA
71.4 dBA
Pump #1; 4.8 psia; Lunar Module Pilot - SleepPump #1; 4.8 psia; Lunar Module Pilot - OperatePump #1; 14.7 psia; Lunar Module Pilot - SleepPump #1; 14.7 psia; Lunar Module Pilot - Operate
Octave Band Center Frequency, Hz
So
un
d P
res
su
re L
ev
el,
dB
35
40
45
50
55
60
65
70
75
80
85
90
95
31.5 63 125 250 500 1000 2000 4000 8000 OASPL dBA
NC-60
NC-55
NC-50
NC-45
NC-40
NC-70
NC-65
83.2 dBA
72.8 dBA
Pump #1; 4.8 psia; Commander - SleepPump #1; 4.8 psia; Commander - OperatePump #1; 14.7 psia; Commander - SleepPump #1; 14.7 psia; Commander - Operate

APOLLO - Goodman
Chapter III - 65
Figure A-8. P1 octave band levels at the LMP sleep and operate locations for 14.7 and 4.8 psia conditions.
Figure A-9. P2 and P2F1 octave band levels at the CMDR sleep and operate locations for 14.7 and 4.8 psia conditions.
Octave Band Center Frequency, Hz
So
un
d P
res
su
re L
ev
el,
dB
35
40
45
50
55
60
65
70
75
80
85
90
95
31.5 63 125 250 500 1000 2000 4000 8000 OASPL dBA
NC-60
NC-55
NC-50
NC-45
NC-40
NC-70
NC-65
75.8 dBA
71.4 dBA
Pump #1; 4.8 psia; Lunar Module Pilot - SleepPump #1; 4.8 psia; Lunar Module Pilot - OperatePump #1; 14.7 psia; Lunar Module Pilot - SleepPump #1; 14.7 psia; Lunar Module Pilot - Operate
Octave Band Center Frequency, Hz
So
un
d P
res
su
re L
ev
el,
dB
35
40
45
50
55
60
65
70
75
80
85
90
95
31.5 63 125 250 500 1000 2000 4000 8000 OASPL dBA
NC-60
NC-55
NC-50
NC-45
NC-40
NC-70
NC-65
82.3 dBA
77.1 dBA
Pump #2; 14.7 psia; Commander - SleepPump #2; 14.7 psia; Commander - OperatePump #2 and Fan #1; 4.8 psia; Commander - SleepPump #2 and Fan #1; 4.8 psia; Commander - Operate

NASA/SP-2015-624 – ACOUSTICS AND NOISE CONTROL IN SPACE CREW COMPARTMENTS – Goodman & Grosveld
Chapter III - 66
Figure A-10. P2 and P2F1 octave band levels at the LMP sleep and operate locations for 14.7 and 4.8 psia conditions.
Octave Band Center Frequency, Hz
So
un
d P
res
su
re L
ev
el,
dB
35
40
45
50
55
60
65
70
75
80
85
90
95
31.5 63 125 250 500 1000 2000 4000 8000 OASPL dBA
NC-60
NC-55
NC-50
NC-45
NC-40
NC-70
NC-65
76.1 dBA
72.1 dBA
Pump #2; 14.7 psia; Lunar Module Pilot - SleepPump #2; 14.7 psia; Lunar Module Pilot - OperatePump #2 and Fan #1; 4.8 psia; Lunar Module Pilot - SleepPump #2 and Fan #1; 4.8 psia; Lunar Module Pilot - Operate

CHAPTER IV
ACOUSTICS AND NOISE CONTROL
IN THE SPACE SHUTTLE ORBITER
Jerry R. Goodman
CONTENTS
1. INTRODUCTION ........................................................................................................................ 5
2. INITIAL ORBITER ACOUSTIC REQUIREMENTS ........................................................................... 5
2.1 Continuous Noise............................................................................................................. 6
2.2 Intermittent and Short Duration Noise ........................................................................... 7
3. SPACE SHUTTLE ORBITER CONFIGURATION............................................................................. 8
4. NOISE CONTROL DESIGN APPLICATIONS DURING INITIAL ORBITER DEVELOPMENT ............ 12
4.1 Source Control ............................................................................................................... 14
4.2 Path Control ................................................................................................................... 16
4.3 Noise Control at the Receiver Locations ....................................................................... 26
5. UPDATED OFT AND OPERATIONAL ORBITER ACOUSTIC REQUIREMENTS ............................. 30
6. NOISE CONTROL DURING OPERATIONAL FLIGHTS ................................................................. 34
7. FINAL ORBITER ACOUSTIC REQUIREMENTS ........................................................................... 51
8. NOISE CONTROL DESIGN APPLICATIONS FOR EXTENDED DURATION ORBITER (EDO) MISSIONS ................................................................................................................................ 52
9. DISCUSSION OF THE NOISE CONTROL EFFORTS ..................................................................... 57
10. CONCLUSIONS ........................................................................................................................ 60
11. REFERENCES ........................................................................................................................... 61
12. ACRONYMS ............................................................................................................................. 65
TABLES
Table 1. STS-1 crew sound level meter acoustic measurements. ................................................ 33

NASA/SP-2015-624 – ACOUSTICS AND NOISE CONTROL IN SPACE CREW COMPARTMENTS – Goodman & Grosveld
Chapter IV - 2
Table 2. STS-2 crew sound level meter acoustic measurements (* indicates common data locations for the OFT measurements). (RS=forward air outlet in main display console; IMU=Inertial Measurement Unit; FWD= Forward; WCS=Waste Control System; ARS= Air Revitalization System) ..................................................................................................... 33
Table 3. STS-4 crew sound level meter acoustic measurements (* indicates common data locations for the OFT measurements). (W7/W8=overhead windows in aft flight deck) 33
Table 4. STS-6 acoustic measurements in OV-099. (WCS=Waste Control System; ARS=Air Revitalization System; FWD= Forward; IMU=Inertial Measurement Unit; F5=forward air outlet in main display console; W7/W8=aft windows facing payload bay) .................... 35
Table 5. Shuttle Astronaut Survey. ............................................................................................... 35
Table 6. Noise Criterion NC-50 compared with the Noise Rating NR 50. ..................................... 37
Table 7. Crew ratings of the STS-50 levels in Orbiter and Spacelab. ............................................ 46
Table 8. Sound Level Meter (SLM) and dosimeter readings during sleep on various missions. .. 47
Table 9. STS-57 acoustic measurements in Orbiter and SpaceHab. ............................................. 49
Table 10. Crew ratings of the STS-57 levels in Orbiter and SpaceHab. ........................................ 50
Table 11. Revised intermittent acoustic limits for Shuttle hardware. .......................................... 52
FIGURES
Figure 1. NC curves per NASA Design Standard 145 [1]. ................................................................ 6
Figure 2. Current Noise Criteria (NC) curves (equivalent dBA levels added for reference). .......... 7
Figure 3. Location of the Orbiter crew compartments and decks (split view). .............................. 8
Figure 4. Flight deck, looking aft and at the equipment bay. ......................................................... 9
Figure 5. Mid-deck, view looking forward and outboard. .............................................................. 9
Figure 6. Mid-deck, left side view looking outboard. ................................................................... 10
Figure 7. Orbiter flight-deck and mid-deck specification locations. ............................................. 10
Figure 8. Water tank, STS-3 below crewman................................................................................ 11
Figure 9. DFI Pallet, behind the STS-1 crewman. Numerous holes in the structural closeout panels are shown in the enlarged picture on the right. ................................................ 12
Figure 10. Orbiter approach to estimating continuous noise in the crew compartment. ........... 13
Figure 11. Orbiter noise paths. ..................................................................................................... 13
Figure 12. Orbiter cabin air and avionics bays air cooling systems. ............................................. 14
Figure 13. Source sound power data on the air revitalization system (cabin fan/ducting). ........ 15
Figure 14. Typical Space Shuttle Orbiter vibration isolator assembly. ......................................... 16
Figure 15. Avionics bay fan isolators. ........................................................................................... 17

SPACE SHUTTLE ORBITER - Goodman
Chapter IV - 3
Figure 16. Humidity separator isolators. ...................................................................................... 17
Figure 17. Cabin fan package installation isolators. ..................................................................... 18
Figure 18. Sealing of penetrations or passageways in mid-deck. ................................................. 18
Figure 19. Orbiter airborne noise path air duct attenuation. ....................................................... 19
Figure 20. Predicted OFT mid-deck levels..................................................................................... 19
Figure 21. Predicted OFT flight deck levels. .................................................................................. 19
Figure 22. Predicted operational mid-deck levels. ....................................................................... 20
Figure 23. Predicted operational flight deck levels. ..................................................................... 20
Figure 24. Proposed Orbiter mufflers in 1977 (not approved by the Control Board). ................. 20
Figure 25. Air Revitalization System ducting on starboard mid-deck wall (the booties are red-colored). Closeout panels covering this area are not installed. .................................. 21
Figure 26. Closeout panels in the forward starboard mid-deck. .................................................. 21
Figure 27. Some partial square screen areas in the mid-deck floor for the OFT configuration of the Space Shuttle Orbiter. Other floor screens were not yet installed. ...................... 22
Figure 28. OFT floor barrier blanket covers. ................................................................................. 22
Figure 29. OV-102 Palmdale test 1979 - Mid-deck. ...................................................................... 23
Figure 30. OV-102 Palmdale test 1979 - Flight deck. .................................................................... 23
Figure 31. Orbiter GFE inertial measurement unit (IMU) cooling fan mufflers (Dimensions in inches). ......................................................................................................................... 23
Figure 32. GFE IMU mufflers installed in OV-102. ........................................................................ 24
Figure 33. Orbiter inertial measurement unit (IMU) muffler attenuation. .................................. 24
Figure 34. Unified IMU muffler details. ........................................................................................ 25
Figure 35. Unified muffler installed in the Space Shuttle Orbiter. ............................................... 25
Figure 36. Orbiter sleeping bags in mid-deck. .............................................................................. 26
Figure 37. Three-tier plus one vertical sleeping bunk. ................................................................. 26
Figure 38. Four-tier sleep station with bunk access doors open showing ground operations equipment on the lower shelf. .................................................................................... 27
Figure 39. Three-tier and four-tier sleep station bunk structural comparison. ........................... 28
Figure 40. Four-tier sleep station bunk acoustic liner. ................................................................. 29
Figure 41. Four-tier sleep station air outlet louver cover/muffler. .............................................. 29
Figure 42. Orbiter four-tier sleep station. Acoustic liner kits attach to the white hook-and-loop tabs inside each bunk. ................................................................................................. 30
Figure 43. Source contributions on the Orbiter mid-deck, measured at the specification locations. ...................................................................................................................... 31
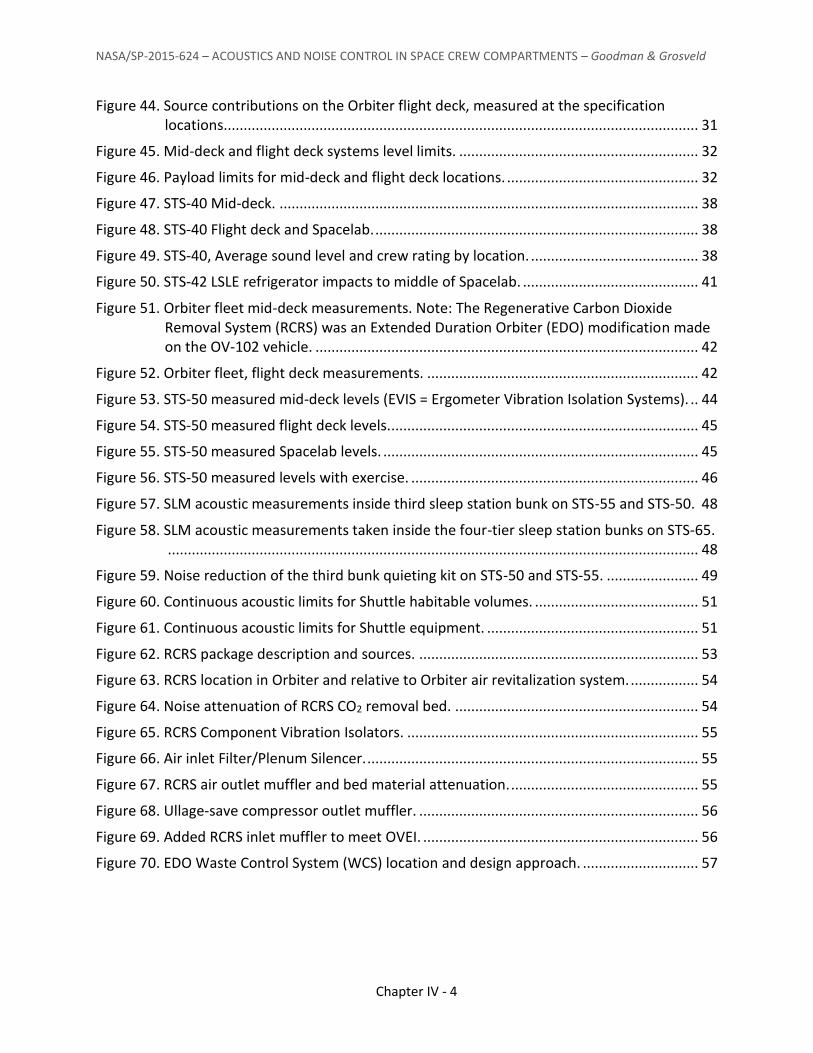
NASA/SP-2015-624 – ACOUSTICS AND NOISE CONTROL IN SPACE CREW COMPARTMENTS – Goodman & Grosveld
Chapter IV - 4
Figure 44. Source contributions on the Orbiter flight deck, measured at the specification locations. ...................................................................................................................... 31
Figure 45. Mid-deck and flight deck systems level limits. ............................................................ 32
Figure 46. Payload limits for mid-deck and flight deck locations. ................................................ 32
Figure 47. STS-40 Mid-deck. ......................................................................................................... 38
Figure 48. STS-40 Flight deck and Spacelab. ................................................................................. 38
Figure 49. STS-40, Average sound level and crew rating by location. .......................................... 38
Figure 50. STS-42 LSLE refrigerator impacts to middle of Spacelab. ............................................ 41
Figure 51. Orbiter fleet mid-deck measurements. Note: The Regenerative Carbon Dioxide Removal System (RCRS) was an Extended Duration Orbiter (EDO) modification made on the OV-102 vehicle. ................................................................................................ 42
Figure 52. Orbiter fleet, flight deck measurements. .................................................................... 42
Figure 53. STS-50 measured mid-deck levels (EVIS = Ergometer Vibration Isolation Systems). .. 44
Figure 54. STS-50 measured flight deck levels. ............................................................................. 45
Figure 55. STS-50 measured Spacelab levels. ............................................................................... 45
Figure 56. STS-50 measured levels with exercise. ........................................................................ 46
Figure 57. SLM acoustic measurements inside third sleep station bunk on STS-55 and STS-50. 48
Figure 58. SLM acoustic measurements taken inside the four-tier sleep station bunks on STS-65. ..................................................................................................................................... 48
Figure 59. Noise reduction of the third bunk quieting kit on STS-50 and STS-55. ....................... 49
Figure 60. Continuous acoustic limits for Shuttle habitable volumes. ......................................... 51
Figure 61. Continuous acoustic limits for Shuttle equipment. ..................................................... 51
Figure 62. RCRS package description and sources. ...................................................................... 53
Figure 63. RCRS location in Orbiter and relative to Orbiter air revitalization system. ................. 54
Figure 64. Noise attenuation of RCRS CO2 removal bed. ............................................................. 54
Figure 65. RCRS Component Vibration Isolators. ......................................................................... 55
Figure 66. Air inlet Filter/Plenum Silencer. ................................................................................... 55
Figure 67. RCRS air outlet muffler and bed material attenuation. ............................................... 55
Figure 68. Ullage-save compressor outlet muffler. ...................................................................... 56
Figure 69. Added RCRS inlet muffler to meet OVEI. ..................................................................... 56
Figure 70. EDO Waste Control System (WCS) location and design approach. ............................. 57

SPACE SHUTTLE ORBITER - Goodman
Chapter IV - 5
CHAPTER IV
ACOUSTICS AND NOISE CONTROL
IN THE SPACE SHUTTLE ORBITER
Jerry R. Goodman
1. INTRODUCTION
The purpose of this Chapter is to discuss acoustics and noise control in the Space Shuttle Program, Orbiter Project (herein termed Orbiter). Acoustics requirements set the standards to which noise control had to comply. The main focus is to describe and discuss the acoustic requirements throughout the program, in-flight continuous noise levels based upon analyses and testing, and descriptions of noise control features that were considered and/or implemented. Intermittent noise control is discussed as well because of its implications on spacecraft operations and crew health, but primarily from a specification and noise control standpoint. Another focus of this Chapter is the effectiveness of noise control and crew assessments of acoustics in operational Orbiter vehicles, after basic noise control modifications were implemented. This Chapter covers the activities from the start of the related Orbiter hardware development in 1973 until the time this author left the Orbiter Project Office at NASA Lyndon B. Johnson Space Center (JSC) in late 1995. The Extended Duration Orbiter (EDO), which had modifications and new systems requiring noise control for extended missions, is described after the operations section, for clarity, even though the EDO was part of the operational vehicles that flew.
2. INITIAL ORBITER ACOUSTIC REQUIREMENTS
Acoustics and noise control in the Orbiter was managed part time by the Crew Compartment Project Engineer in the Orbiter Project Office who had other responsibilities in addition to the crew compartment. An Acoustics Working Group (AWG) was established with NASA JSC representatives to obtain Center support of specification issues and overall acoustics in the Orbiter. Representatives were assigned from offices representing the Astronauts, Payloads, Space and Life Sciences Directorate, Crew Systems Division, Safety, Mission Operations Directorate, Human Factors, and others. The Crew Compartment Project Engineer, who chaired the AWG, led Orbiter acoustics and noise control in what was, in effect, a part time effort (hereafter termed the Acoustics Lead). Several briefings and acoustic demonstrations were made to the Orbiter Project Configuration Control Board (CCB), in an attempt to get the

NASA/SP-2015-624 – ACOUSTICS AND NOISE CONTROL IN SPACE CREW COMPARTMENTS – Goodman & Grosveld
Chapter IV - 6
requirements resolved and noise control efforts started and supported. Acoustics was included as a periodic agenda item in crew station reviews held with the Orbiter Contractor. The AWG was established early during Orbiter design and development. The Structures and Mechanics Division (SMD) in the Engineering Directorate supported the AWG and Orbiter Project with the design and fabrication of mufflers, which is described later. The AWG membership changed over time, especially when operational flights began. In the late 1980s, when payloads were being tested at the NASA JSC SMD acoustics facility, some active acoustics support to the Acoustics Lead was obtained from the lead contractor engineer in charge of acoustics testing in the laboratory. He became a valuable member of the AWG, performed testing on some payloads, GFE, and all Orbiters, and supported other efforts of the Acoustics Lead.
2.1 Continuous Noise
In 1972, as a result of Apollo Program noise control problems, NASA JSC developed a design standard (DS) for noise control of future spacecraft [1]. This standard called for the continuous acoustic noise to be limited to Noise Criterion (NC)-50 for work and NC-40 for sleep (see Figure 1 for the octave band limits specified). However, the NASA Contractor did not concur that these acoustic limits could or should be met because the Contractor considered the limits excessively stringent and decided that those limits would have a major impact on design [2][3]. Note that, at the time, the standard used a spectrum that was rated NC-50 with an equivalent of a 55 dBA level, and used octave bandwidths and center frequencies different than the current standards. These curves were superseded by the current NC-50, NC-40, and other NC curves based upon updated standards, with spectra equal to the NC curves. These curves and the equivalent dBA level for each NC curve are shown in Figure 2.
Figure 1. NC curves per NASA Design Standard 145 [1].
Octave Band, Hz
Octave Band Center Frequency, Hz
So
un
d P
res
su
re L
ev
el,
dB
0
10
20
30
40
50
60
70
80
90
37.575
75150
150300
300600
6001200
12002400
24004800
48009600
63 125 250 500 1000 2000 4000 8000
NC-40
NC-50

SPACE SHUTTLE ORBITER - Goodman
Chapter IV - 7
Figure 2. Current Noise Criteria (NC) curves (equivalent dBA levels added for reference).
In 1974, the Contractor agreed to NC-55 (62.6 dBA) as a “design goal” for work and as a requirement for sleep. Note that the “dBA” levels used in this Chapter are for overall, A-weighted levels and that “dB” levels are not weighted. NC ratings are based upon the intersection of the octave band frequency plot with the highest NC curve. In 1975, NC-55 (62.6 dBA) was accepted as both a work requirement and a sleep requirement, but was not accompanied by any significant hardware changes or efforts to ensure that this requirement could be met. At that time in the program, it was getting late to make necessary changes. Contractor studies and impact assessments of possible remedial actions were frequently delayed. Some important changes that were implemented early will be described in Section 4.2, Path Control. No major action to resolve specification exceedances was approved for implementation because of cost and schedule impacts, as well as Contractor and NASA management doubts about the need to make changes. In summary, specification levels were not resolved until late in the program and, until that time, noise control efforts were limited to those discussed in Section 4.2, Path Control. Acoustic limits were revised to those measured on the mid-deck and flight deck after tests on the first Orbiter which incorporated remedial changes in 1980 and then later in 1994. These changes will be discussed in Section 5 and Section 7, respectively.
2.2 Intermittent and Short Duration Noise
Originally, intermittent noises from Orbiter sources, payloads, or Government Furnished Equipment (GFE) were required to meet the limits in the 1972 Design Standard DS 145 [1]. The standard had two figures that defined the maximum allowable sound pressure levels during
Octave Band Center Frequency, Hz
So
un
d P
res
su
re L
ev
el,
dB
0
10
20
30
40
50
60
70
80
90
63 125 250 500 1000 2000 4000 8000
77.6 dBA
27.1 dBA
31.4 dBA
35.6 dBA
39.8 dBA
44.2 dBA
49.0 dBA
53.4 dBA
58.1 dBA
62.6 dBA
67.5 dBA
72.3 dBA
Approximate thresholdof hearing forcontinuous noise
NC-15
NC-20
NC-25
NC-30
NC-35
NC-40
NC-45
NC-50
NC-55
NC-60
NC-65
NC-70

NASA/SP-2015-624 – ACOUSTICS AND NOISE CONTROL IN SPACE CREW COMPARTMENTS – Goodman & Grosveld
Chapter IV - 8
launch or short-duration phases, for one exposure per day. Allowable sound pressure levels went up to 135 dB and durations varied, depending upon sound pressure level, from 1.5 minutes or less to 480 minutes. A third figure defined the sound pressure levels, frequencies, exposure times, and required quiet periods after intermittent noise. Later on during operational flights, intermittent noise sources were defined as noise sources whose duration was 8 hours or less. This will be discussed in Section 6 on Noise Control during Operational Flights.
3. SPACE SHUTTLE ORBITER CONFIGURATION
Figure 3 shows the location of the crew compartment on the Orbiter and its configuration. The crew occupied the flight and mid-decks, and at times accessed the lower equipment bay when in-flight maintenance was required into that bay. Figure 4 shows the operational flight deck configuration. Figure 5 and Figure 6 show the operational mid-deck configuration with an inside airlock and sleep station bunks (Figure 5 only).
Figure 3. Location of the Orbiter crew compartments and decks (split view).
The first four flights of the Space Shuttle were known as Orbital Flight Tests (OFT), and the individual flights were designated Space Transportation System (STS)-1 through STS-4. These flights were used to verify the operations of hardware systems and confirm the safety of the vehicle to continue into an operational phase. All OFT were undertaken with Columbia, Orbiter Vehicle (OV)-102. Flights after OFT were designated operational (OPS) flights. The location for compliance with specification limits were defined to be at the mid-deck center, whereas the flight deck limit was at ear level, halfway between the commander and pilot seated locations (Figure 7).

SPACE SHUTTLE ORBITER - Goodman
Chapter IV - 9
Figure 4. Flight deck, looking aft and at the equipment bay.
Figure 5. Mid-deck, view looking forward and outboard.

NASA/SP-2015-624 – ACOUSTICS AND NOISE CONTROL IN SPACE CREW COMPARTMENTS – Goodman & Grosveld
Chapter IV - 10
Figure 6. Mid-deck, left side view looking outboard.
Figure 7. Orbiter flight-deck and mid-deck specification locations.

SPACE SHUTTLE ORBITER - Goodman
Chapter IV - 11
The OFT configuration Orbiter was the OV-102/Columbia, which had two ejection seats on the flight deck. The Orbiter also had a water tank on the mid-deck, and a large floor-to-ceiling Development Flight Instrumentation (DFI) pallet, as shown in Figure 8 and Figure 9, respectively. The ventilation system ducting was modified later to add ventilation for operational sleep stations. The Orbiter had panels with screen openings on the flight deck and many more on the mid-deck to allow gas to flow out of the avionics bays, equipment bay below the mid-deck floor, and other volumes during cabin depressurization associated with crew ejection/abort to avoid structurally loading of these cavities and distortion that could affect safe ejection. Numerous holes in the structural closeout panels allowed venting of closed-off volumes during depressurization, as shown in the port closeout panels in the wall areas behind the DFI pallet and water tank shown in Figure 8 and Figure 9. This venting through openings precluded structural distortion of the crew ejection seat rails attached to the flight deck floor, and related crew hazards during ejection. The openings also allowed noise to come into the habitable volume from closed-out areas that had avionics, environmental control hardware, and other equipment. Provisions were developed for the crew to physically closeout a number of open floor areas with covers to reduce noise levels, which will be discussed later in this Chapter.
Figure 8. Water tank, STS-3 below crewman.

NASA/SP-2015-624 – ACOUSTICS AND NOISE CONTROL IN SPACE CREW COMPARTMENTS – Goodman & Grosveld
Chapter IV - 12
Figure 9. DFI Pallet, behind the STS-1 crewman. Numerous holes in the structural closeout panels are
shown in the enlarged picture on the right.
4. NOISE CONTROL DESIGN APPLICATIONS DURING INITIAL ORBITER DEVELOPMENT
The following discussion describes noise control efforts and acoustic measurements from initial development through OFT vehicles and initial operational vehicles, when the basic Orbiter noise control modifications were developed and implemented. Changes to the acoustic limits in this Section were made twice, later in the program, as will be discussed in Sections 5 and 7. Noise control for the EDO, which originally was designed for long term missions with durations up to 28 days, is described in Section 8.
During development the Space Shuttle Orbiter program used an approach in which all the continuous noise sources were identified; the source to receiver paths were determined; the combined systems noise in the flight and mid deck were estimated; the contribution of each source relative to the total noise was established; and the applicable noise criteria were specified [4] [5]. The noise emitted from a fan consisted of contributions from the aerodynamic noise emanating from the inlet and exhaust, contributions from the structure-borne vibration at the mounting interface, and fan case radiated noise. The flow chart in Figure 10 [5] shows the Space Shuttle Orbiter approach to estimating continuous noise in the crew compartment.
The flowchart illustrates that the noise emitted at the duct outlet already has been reduced by losses within the duct due to absorption, and by the bends and branches of the duct. The structure-borne vibration is affected by structural losses, any joints, and the mass and damping of the structural elements. Finally, the source surface radiation is dependent upon the enclosure airborne and structural losses, the transmission loss, and the mass, stiffness, and damping of the enclosure. Typical noise paths aboard the Orbiter are shown in Figure 11 [5].

SPACE SHUTTLE ORBITER - Goodman
Chapter IV - 13
Figure 10. Orbiter approach to estimating continuous noise in the crew compartment.
Figure 11. Orbiter noise paths.

NASA/SP-2015-624 – ACOUSTICS AND NOISE CONTROL IN SPACE CREW COMPARTMENTS – Goodman & Grosveld
Chapter IV - 14
Noise control is the application of designs and technologies necessary to limit the noise at the source, along its path, and at the receiver location to acceptable levels as discussed in Chapter II, Noise Control, and References [6] and [7]. Examples of noise control and applications implemented in the Space Shuttle Orbiter will be addressed at the noise source, along its path, and at the receiver. Noise control discussed herein primarily applies to the Orbiter hardware ─ the payload hardware was managed by the Space Shuttle Program Office. The driving requisite in noise control was the acoustic requirements at the receiver locations in the Orbiter (Figure 7), so noise control was inextricably tied to what occurred on these requirements. Only after very high levels were found and determined to be problematic in the final testing of the first Orbiter was significant noise control implemented on the hardware that was one of the major noise sources. Implementation of any major noise control was stifled well into the program because: (1) the resolution of the initial requirements was slow; (2) the continuous acoustic limits were set as “goals” instead of requirements; (3) the final limits were established very late in the program; (4) delays occurred in determining design and cost impacts for noise control changes; and (5) there was concern over design and cost impacts, and debate over the necessity to make changes. Remedial actions were not pursued when analyses showed significant exceedances of the required limits, but much later, after testing of the completed Orbiter dictated remedial action. Noise control for EDO, which involved significant changes, was much better attended to because of previous experience, and mission problems with acoustics that resulted in more urgency and acceptance of noise control during the EDO design phase.
4.1 Source Control
Primary noise sources in the Orbiter were the fans, water pumps, water separators, inverters, avionics, and smoke detectors. There were five closed-loop fan cooling systems in the Orbiter: a cabin atmospheric revitalization system; an Inertial Measurement Unit (IMU) cooling system; and three avionics bay cooling systems. The air cooling systems are shown in Figure 12.
Figure 12. Orbiter cabin air and avionics bays air cooling systems.

SPACE SHUTTLE ORBITER - Goodman
Chapter IV - 15
It was important to develop quiet fans and pumps for the Orbiter because of problems with controlling the noise of this hardware in Apollo. Before the Orbiter contract was awarded, NASA had a program with an experienced aerospace company, Hamilton Standard, Division of United Aircraft (HSD), to develop quiet fans and guidelines for quiet fans and pumps. This contract successfully demonstrated design approaches to control the noise from this hardware in a prototype fan and pump [8]. The Space Shuttle Orbiter Contractor, Rockwell International (RI), selected HSD to provide Environmental Control System (ECS) hardware for the Orbiter. Use of the quiet fan technology was put into the RI statement-of-work. Initially, RI used the quiet fan approach as a design baseline. Later, RI chose another fan that was closer to meeting overall fan performance requirements, and had less overall cost and schedule impacts.
In 1974 predicted noise levels of key Orbiter noise sources were as follows [9]:
Cabin fan inlet plenum (3) NC-78 Cabin fans NC-78 Coolant pump (3) NC-65 Water separator (3) NC-65. Avionics bay fans (6) NC-69 Avionics inverters (9) < NC-50 Waste Management System To be determined
The Contractor later obtained detailed sound power tests on fans, pumps and other sources
used in the Space Shuttle Orbiter. Figure 13 shows sound power levels of the noise sources from the cabin fan [5]. Except for the quiet fan effort described previously, no major quieting or changes in these sources were made for acoustics.
Figure 13. Source sound power data on the air revitalization system (cabin fan/ducting).
Octave Band Center Frequency, Hz
So
un
d P
ow
erL
evel, d
B
40
50
60
70
80
90
63 125 250 500 1000 2000 4000 8000
CaseSupplyReturn

NASA/SP-2015-624 – ACOUSTICS AND NOISE CONTROL IN SPACE CREW COMPARTMENTS – Goodman & Grosveld
Chapter IV - 16
4.2 Path Control
The important acoustic modifications and efforts made during the development of the Orbiter were: the addition of vibration isolators to the mounting fixtures of all the fans and pumps and a few other ECS items on the Orbiter side of the mounting interface; the use of sound power tests on noise sources to support analyses and remedial design efforts for noise control; the sealing of gaps and penetrations to impede noise leaks; and the addition of acoustic barrier material to the closeouts in each of the three avionics bays (Figure 12) to block noise coming into the cabin. The standard vibration isolator assembly used in the Orbiter to dampen the various source emissions is shown in Figure 14, with the bottom two views showing the isolator by itself and the top view showing how it was used to support hardware [5]. This type of isolator was used extensively in a number of mounting applications including dampening out Orbiter launch vibrations, in addition to isolating the fans, pumps, and other ECS units.
Figure 14. Typical Space Shuttle Orbiter vibration isolator assembly.
Examples of the application of these types of isolators are shown in Figure 15 for isolation of avionics bay fans, in Figure 16 for isolation of the humidity separator, and in Figure 17 for isolation of a cabin fan installation package.

SPACE SHUTTLE ORBITER - Goodman
Chapter IV - 17
Figure 15. Avionics bay fan isolators.
Figure 16. Humidity separator isolators.
Isolators
Humidity separator mounting baseplate, with three isolators shown
Humidity separator installation
Avionics bay fan installation
Isolators

NASA/SP-2015-624 – ACOUSTICS AND NOISE CONTROL IN SPACE CREW COMPARTMENTS – Goodman & Grosveld
Chapter IV - 18
Figure 17. Cabin fan package installation isolators.
Figure 18 shows an example of sealing leakage locations in the crew module (sealing off noise coming from the lower equipment bay into the mid-deck, through frame and tubing penetrations in the mid-deck floor, and stowage boxes mounted to the mid-deck floor). The Orbiter ventilation system ducting was analyzed. Testing showed that the air cooling pathways provided the attenuation shown in Figure 19.
Figure 18. Sealing of penetrations or passageways in mid-deck.
Isolators
Leakage sources:
frame and tubing penetrations
stowage compartments bolted to mid-deck floor
22 frame penetrations of the mid-deck floor
Leakage sources

SPACE SHUTTLE ORBITER - Goodman
Chapter IV - 19
Figure 19. Orbiter airborne noise path air duct attenuation.
In 1977, predicted levels for OFT were 77.5 dBA (equivalent to NC-73) for the mid-deck and 70 dBA (equivalent to NC-66) on the flight deck [10]. The OPS flights were predicted to have a 72.6 dBA level (equivalent to NC-68) on the mid-deck and 66.9 dBA (equivalent to NC-62) on the flight deck [10]. Plots of these predicted levels are shown in Figure 20, Figure 21, Figure 22, and Figure 23. These levels were obviously higher than the NC-55 (62.6 dBA) limit and the desired standard of NC-50 (58.1 dBA). Differences between OFT and OPS predicted flight levels are due to configuration differences in Orbiters.
Figure 20. Predicted OFT mid-deck levels.
Figure 21. Predicted OFT flight deck levels.
Octave Band Center Frequency, Hz
So
un
d P
res
su
re L
ev
el,
dB
0
10
20
30
40
50
60
70
80
90
63 125 250 500 1000 2000 4000 8000
NC-70
NC-15
NC-20
NC-25
NC-30
NC-35
NC-40
NC-45
NC-50
NC-55
NC-60
NC-65
Octave Band Center Frequency, Hz
So
un
d P
res
su
re L
ev
el,
dB
0
10
20
30
40
50
60
70
80
90
63 125 250 500 1000 2000 4000 8000
NC-70
NC-15
NC-20
NC-25
NC-30
NC-35
NC-40
NC-45
NC-50
NC-55
NC-60
NC-65

NASA/SP-2015-624 – ACOUSTICS AND NOISE CONTROL IN SPACE CREW COMPARTMENTS – Goodman & Grosveld
Chapter IV - 20
Figure 22. Predicted operational mid-deck levels.
Figure 23. Predicted operational flight deck levels.
In 1977, when the predicted levels at the mid-deck and flight deck were high, as shown in Figure 20, Figure 21, Figure 22 and Figure 23, implementation of mufflers in various cabin air cooling loop ducting was proposed at an Orbiter Project CCB meeting to mitigate these high noise levels [10]. These provisions were not approved because of estimated cost and unacceptable schedule impacts for mufflers, on ducting, and the potential impacts to closeout covers. The proposed muffler locations are shown in Figure 24.
Figure 24. Proposed Orbiter mufflers in 1977 (not approved by the Control Board).
Octave Band Center Frequency, Hz
So
un
d P
res
su
re L
ev
el,
dB
0
10
20
30
40
50
60
70
80
90
63 125 250 500 1000 2000 4000 8000
NC-70
NC-15
NC-20
NC-25
NC-30
NC-35
NC-40
NC-45
NC-50
NC-55
NC-60
NC-65
Octave Band Center Frequency, Hz
So
un
d P
res
su
re L
ev
el,
dB
0
10
20
30
40
50
60
70
80
90
63 125 250 500 1000 2000 4000 8000
NC-70
NC-15
NC-20
NC-25
NC-30
NC-35
NC-40
NC-45
NC-50
NC-55
NC-60
NC-65

SPACE SHUTTLE ORBITER - Goodman
Chapter IV - 21
Most of the proposed mufflers were to be added to the air circulation system ducting, which were made of fiberglass type material that was oval shaped in cross-section. Ducting was not continuous, but was put together in segments that were joined by silicone booties with clamps. Figure 25 shows this ducting on the starboard wall in the mid-deck (the booties are red-colored). The proposed muffler design approach was to remove a ducting segment and replace it with an enlarged cross-section ducting that was lined with acoustic foam, of the same flow area cross-section as the replaced duct segment. The ducting shown installed along the side wall of the Orbiter in Figure 25 was covered for flight by closeout panels shown in Figure 26, which form the interface with the habitable volume. There was concern the mufflers might impact these closeout panels.
Figure 25. Air Revitalization System ducting on starboard mid-deck wall (the booties are red-colored). Closeout panels covering this
area are not installed.
Figure 26. Closeout panels in the forward starboard mid-deck.
For OFT flights only, there were five areas that contained a number of open screens within them for cabin depressurization, to let air out of the below-the-floor volume in the mid-deck. Barrier blanket covers to close off these holes, on-orbit by the flight crew, were developed to block the noise. Examples of two partial screen areas are shown in Figure 27. Four of the five covers were covered with lead vinyl barrier materials that were applied by unrolling them over the screens using hook-and-loop fasteners to hold them in place. The fifth cover was a large one covered on-orbit with a stowed barrier cover. A total of about 15.5 square feet open flow area was covered by these covers. The blanket covers are shown in Figure 28. For OPS vehicles these screen areas were replaced by solid closeouts, sealing was applied to the mid-deck floor, around the perimeter of the avionics bays, and to closeout panels. All penetrations for cables and lines were caulked.

NASA/SP-2015-624 – ACOUSTICS AND NOISE CONTROL IN SPACE CREW COMPARTMENTS – Goodman & Grosveld
Chapter IV - 22
Figure 27. Some partial square screen areas in the mid-deck floor for the OFT configuration of the Space Shuttle Orbiter. Other floor screens were not yet installed.
Figure 28. OFT floor barrier blanket covers.
No further remedial hardware changes were implemented to address the predicted acoustic levels until high levels were measured at the first Orbiter (OV-102, Columbia) pre-delivery tests at Palmdale, California in January 1979. In anticipation of excessive acoustic levels NASA provided GFE concept mufflers to quiet IMU cooling fans, and the Contractor provided some concept add-on flight deck ARS outlet mufflers and mid-deck floor closeouts, as shown in Figure 28. The IMU mufflers were developed and fabricated by NASA’s Structures and Mechanics Division, which worked out the Orbiter structural and flow interfaces with the Orbiter Contractor. Acoustic test data were obtained with and without these mid-deck closeouts, add-on flight deck outlet mufflers, GFE IMU mufflers, and avionics bay and floor closeouts. Levels without any silencing (mufflers, or barriers) were at 75.5 dBA on the mid-deck and 67 dBA on the flight deck. With the silencing approaches, the mid-deck level was reduced to 69 dBA and the flight deck to 64 dBA. Figure 29 and Figure 30 show the benefits of the silencing approaches. Testing was performed with all systems functioning, except the water separator and the avionics equipment. Incorporation of the IMU mufflers significantly improved the levels on both decks. The unmuffled levels (without IMU mufflers) were reviewed and determined to be unacceptable by acoustics representatives. Astronauts who listened to the

SPACE SHUTTLE ORBITER - Goodman
Chapter IV - 23
full-up system levels confirmed that the acoustic levels without IMU mufflers were very irritating and unacceptable, and that remedial action was necessary. The use of floor coverings (barrier materials) was also recommended based upon the large open area and test data with simulated closeouts of these openings. Sealing of all penetrations and gaps and using barriers planned to cover the avionics bays were also emphasized as being necessary changes to be implemented. As a result, the design was completed and the GFE mufflers were added to the Orbiter IMU cooling system (Figure 12), which was until then the loudest noise source. The GFE mufflers consisted of three inlet and one outlet muffler, the design of which is shown in Figure 31 [5]. Figure 32 shows these GFE mufflers installed in the Columbia spacecraft for OFT.
Figure 29. OV-102 Palmdale test 1979 - Mid-deck.
Figure 30. OV-102 Palmdale test 1979 - Flight deck.
Figure 31. Orbiter GFE inertial measurement unit (IMU) cooling fan mufflers (Dimensions in inches).
Octave Band Center Frequency, Hz
So
un
d P
res
su
re L
ev
el,
dB
45
50
55
60
65
70
75
80
63 125 250 500 1000 2000 4000 8000 OASPL dBA
75.5 dBA
62.6 dBA
NC-55UnsilencedSilenced (IMU & ARS Mufflers, Mid-deck Floor Cover)
Octave Band Center Frequency, Hz
So
un
d P
res
su
re L
ev
el,
dB
45
50
55
60
65
70
75
80
63 125 250 500 1000 2000 4000 8000 OASPL dBA
67.0 dBA
62.6 dBA
NC-55UnsilencedSilenced (IMU & ARS Mufflers, Mid-deck Floor Cover)
33.75
1.50 DIA HOLE
1.1
6.75
11.20
5.7
2.05 REF
3.75 DIA
1.50 DIA HOLE
A
A
EXHAUST MUFFLER
DISSIPATIVE
ALUMINUM TUBING
FOAM LINING
INLET MUFFLER
REACTIVE
ALUMINUM TUBING
FOAM LINING

NASA/SP-2015-624 – ACOUSTICS AND NOISE CONTROL IN SPACE CREW COMPARTMENTS – Goodman & Grosveld
Chapter IV - 24
Figure 32. GFE IMU mufflers installed in OV-102.
Acoustic tests were performed at Kennedy Space Center (KSC) in May 1980, with GFE IMU
flight mufflers installed, penetrations and gaps sealed, and flight mid-deck floor coverings in place.
The acoustic attenuation of the GFE foam lined reactive and dissipative muffler designs is shown in Figure 33 [6].
Figure 33. Orbiter inertial measurement unit (IMU) muffler attenuation.
Octave Band Center Frequency, Hz
So
un
d P
res
su
re L
ev
el,
dB
30
35
40
45
50
55
60
65
70
75
80
63 125 250 500 1000 2000 4000 8000
NC-55UnsilencedSilenced
Inlet muffler (typical)
Outlet muffler

SPACE SHUTTLE ORBITER - Goodman
Chapter IV - 25
In the second Orbiter to fly, the OV-099 Challenger Spacecraft, these GFE IMU mufflers subsequently were changed from the four individual mufflers to one unified muffler with four chambers having similar functions, to provide an improved line replaceable unit. The other Orbiter vehicles also incorporated the unified muffler. Figure 34 shows the unified muffler design approach and design details [11]. Figure 35 depicts the unified muffler installed in the Orbiter.
Figure 34. Unified IMU muffler details.
Figure 35. Unified muffler installed in the Space Shuttle Orbiter.
Typical air to IMU
Typical air inlet with filter
Outlet muffler exhaust to Crew Module located in this area

NASA/SP-2015-624 – ACOUSTICS AND NOISE CONTROL IN SPACE CREW COMPARTMENTS – Goodman & Grosveld
Chapter IV - 26
4.3 Noise Control at the Receiver Locations
The only noise control provisions at the receiver locations were focused at the sleeping accommodations. Originally, the crew slept in sleeping bags affixed to structure attachments in the mid-deck (Figure 36), or at times in the flight deck seats. Accordingly, the sleeping crew was exposed to the mid-deck or flight deck acoustic environments, except when they were wearing the provided hearing protection. When dual shift operations occurred, a three-tier horizontal, plus one vertical bunk were manifested that accommodated a crew of four (Figure 37).
Figure 36. Orbiter sleeping bags in mid-deck.
Figure 37. Three-tier plus one vertical sleeping bunk.

SPACE SHUTTLE ORBITER - Goodman
Chapter IV - 27
The one vertical position bunk created operational problems because the area was not very well physically or acoustically isolated and its location was a problem because on-duty crew needed access to stowage lockers in that vicinity, awakening sleeping crews. Measured acoustic levels in one of the horizontal bunks were 57 dBA [5] [12]. This sleep station was subsequently changed to provide for a four-tier sleep station where all four of the crew slept parallel to each other, occupying the same volume as the three-tier bunk. The four-tier bunk design is shown in Figure 38. Air to both types of sleep stations was provided by a kit that ducted ECS system air into outlets located on the starboard wall, on the sides of the sleep station bunks. Adjustable louvers provided some capability to adjust/direct flow.
Figure 38. Four-tier sleep station with bunk access doors open showing ground operations equipment on the lower shelf.
Figure 39 shows the construction differences between the three-tier and four-tier sleep stations, from a fiberglass foam filled honeycomb material to an aluminum waffle construction. It is believed that the waffle construction was used so the new bunk would not be heavier than the one it replaced and structural fittings would not have to be changed. The three-tier bunk was first flown on the STS-9 Spacelab mission in 1983. The four-tier bunk was first flown on STS-61A in 1985. These and the other quieting changes to them that will be described later are really operational period hardware changes, but are included here so all sleep station and related changes are together for clarity. A crew questionnaire was given to astronauts who had used sleep station bunks. Their concerns were stated as: outside levels, especially intermittent noises are disturbing; knocking/dinging on the outside of the sleep station occurs by crew outside the bunk; knocking inside the bunk with metal or hard surfaces occurs inside the sleep station; cold ECS air blows directly on the head and is uncomfortable; and overall comfort could

NASA/SP-2015-624 – ACOUSTICS AND NOISE CONTROL IN SPACE CREW COMPARTMENTS – Goodman & Grosveld
Chapter IV - 28
be improved. As a result, covered internal foam acoustic liners, external bump pads, covers on buckles and hard surfaces, and air outlet deflector/muffler covers were added as a mission kit to each bunk in 1993. These changes remedied the crew concerns and lowered the on-orbit acoustic levels and to meet the desired, NC-40 levels [7]. The fabric covered Solimide® foam liners attached to the inside of the bunk structure with loop fasteners stitched into the fabric cover, attached to sticky-backed hook fasteners secured to the inside bunk wall surfaces, shown in Figure 38 bunks. A sample liner kit is shown in Figure 40. Originally, there were two different thicknesses of liners for crews to choose from, the thicker one offering more noise attenuation, but less room within the bunk. The liners could be removed for a mission, as the crew desired. Figure 40 also shows an air deflector which was added to keep the cold airflow from blowing on a crewperson’s head, and also lower the noise level in the head area. To minimize the noise coming into the bunk from the mid-deck through the air outlet louvers, a DuPont Nomex® fiberboard lined with acoustic Solimide® foam was attached over the louvers, as shown in Figure 41. A pad was also added to the aft surface of the bunk to minimize the knocking/dinging that occurred due to non-sleeping crews accessing lockers in that area. Interior items that were metal or hard were changed to preclude contact noise. Survey results will be further discussed in Section 6. Figure 46 shows the four-tier bunk in use on a mission, with the white loop fastener attachment for the liners showing inside the bunks.
Figure 39. Three-tier and four-tier sleep station bunk structural comparison.

SPACE SHUTTLE ORBITER - Goodman
Chapter IV - 29
Figure 40. Four-tier sleep station bunk acoustic liner.
Figure 41. Four-tier sleep station air outlet louver cover/muffler.
Louver muffler cover inside with foam liner
Four-tier sleep station bunk air outlet
Louver muffler cover installed over bunk air outlet

NASA/SP-2015-624 – ACOUSTICS AND NOISE CONTROL IN SPACE CREW COMPARTMENTS – Goodman & Grosveld
Chapter IV - 30
Figure 42. Orbiter four-tier sleep station. Acoustic liner kits attach to the white hook-and-loop tabs inside each bunk.
5. UPDATED OFT AND OPERATIONAL ORBITER ACOUSTIC REQUIREMENTS
Testing performed at NASA KSC in May 1980, after the final configuration of GFE IMU mufflers was installed, identified the individual acoustic source contributions on the mid-deck (Figure 43) deck and the flight deck (Figure 44) [5]. Resultant acoustic levels were 67.5 dBA for the mid-deck and 62 dBA for the flight deck [13]. The emerging dominant noise source on both decks was the cabin fan. The levels attributable to the IMU fans were significantly reduced at 2000 Hz (Figure 33), showing the benefits of the added mufflers in reducing the mid-deck acoustic spike at this frequency.
The measured mid-deck and flight deck were adopted as the mid-deck and flight deck specifications, with margin, at 68 dBA and 63 dBA, respectively. These limits were put into the Orbiter Vehicle End-item (OVEI) Specification [14]. Note that these limits were applied to OFT and operational vehicles, although they were based on an OFT configured Orbiter vehicle. The OFT vehicle had the DFI pallet and water tanks on the mid-deck, and numerous holes in mid-deck and flight deck panels for cabin depressurization. Figure 27 shows mid-deck holes covered by screens. These limits did not include acoustics levels emitted from payloads or GFE hardware, only vehicle related noise.

SPACE SHUTTLE ORBITER - Goodman
Chapter IV - 31
Figure 43. Source contributions on the Orbiter mid-deck, measured at the specification locations.
Figure 44. Source contributions on the Orbiter flight deck, measured at the specification locations.
The mid-deck systems and flight deck level specification limits adopted are shown in Figure 45. Individual payloads limits for each deck were set at 10 dB below the “all systems” limits, as indicated in Figure 46 (58 dBA for the mid-deck and 53 dBA for the flight deck), with the intent that the sum of individual payloads, or the resultant payload complement for a given mission, would be controlled so as to not impact the Orbiter limits, since they represented the “all systems” limits.
Octave Band Center Frequency, Hz
So
un
d P
res
su
re L
ev
el,
dB
30
40
50
60
70
80
63 125 250 500 1000 2000 4000 8000
Mid-Deck
NC-55All systems "ECLSS" + avionicsWater pumpCabin fanSmoke detectorsAvionics fanIMU fanWater sep (calc)Avionics
Octave Band Center Frequency, Hz
So
un
d P
res
su
re L
ev
el,
dB
30
40
50
60
70
80
63 125 250 500 1000 2000 4000 8000
Flight Deck
NC-55All systems "ECLSS" + avionicsWater pumpCabin fanSmoke detectorsAvionics fanIMU fanWater sep (calc)Avionics

NASA/SP-2015-624 – ACOUSTICS AND NOISE CONTROL IN SPACE CREW COMPARTMENTS – Goodman & Grosveld
Chapter IV - 32
Octave Band Center Frequency [Hz]
63 125 250 500 1K 2K 4K 8K O/A
dBA
Flight Deck
66 59 56 56 59 54 52 45 68 63
Mid-deck 62 62 65 61 62 63 58 54 71 68
Figure 45. Mid-deck and flight deck systems level limits.
Octave Band Center Frequency [Hz]
63 125 250 500 1K 2K 4K 8K O/A
dBA
Flight Deck
56 49 46 46 49 46 42 35 58 53
Mid-deck 52 52 55 51 52 53 48 44 61 58
Figure 46. Payload limits for mid-deck and flight deck locations.
The measurement location for specification compliance of each payload was the worst case reading at a one foot distance away from the payload, although reporting of levels measured at three feet away were also required as a data submittal. The three feet approximated the distance that payloads were located away from the mid-deck centerline, and where most payloads were manifested on the mid-deck. Initially, levying sound power measurements was strongly recommended over sound pressure level measurements, as it was considered a far better way to manage/control and understand the acoustic noise impacts of payloads. However, this presented significant impacts to the payloads and was disregarded (this action will be discussed later). It should be noted that in July 1980, the Director of Space and Life Sciences had backed off of the previously recommended NC-50 limit for OFT, and noted that NC-55 was acceptable for OFT flights only, and NC-50 for mature Shuttle operations [15]. Furthermore, it was recommended that continuous noise levels should not exceed a 24 hour time-weighted average of 76 dBA to preclude permanent hearing damage, and recommended
Octave Band Center Frequency, Hz
So
un
d P
res
su
re L
ev
el,
dB
30
40
50
60
70
80
63 125 250 500 1000 2000 4000 8000
MID-DECK CENTER
FLIGHT DECK BETWEENCOMMANDER AND PILOT
AT EAR LEVEL
Octave Band Center Frequency, Hz
So
un
d P
res
su
re L
ev
el,
dB
30
40
50
60
70
80
63 125 250 500 1000 2000 4000 8000
MID-DECK CENTER
FLIGHT DECK BETWEENCOMMANDER AND PILOT
AT EAR LEVEL

SPACE SHUTTLE ORBITER - Goodman
Chapter IV - 33
guidelines for wearing of hearing protection, wherein for noise less than 65 dBA during a 24 hour time-weighted period no hearing protection was required. Later, the 24 hour limit was added to the Space Shuttle flight rules and audio dosimeters were periodically added to missions where exposures were monitored. Dosimeters were first added to the STS-40 mission.
Acoustic requirements for the Orbiter and payloads would be changed in 1993, to make the limits for the mid-deck, flight deck, and attached payloads like Spacelab all the same levels, as will be discussed in Section 7. During OFT flights acoustic data were obtained on-orbit by the crew with hand-operated sound level meters, and also from Data Flight Instrumentation (DFI) microphones. Acoustic test data from crew measurements on STS-1, STS-2 and STS 4 are shown in Table 1, Table 2, and Table 3. Note that the WCS operations shown in Table 2 were classified as intermittent noise. Note that the values for NC-50 used in the tables were based upon the older NC standards, for which NC-50 was equivalent to 55 dBA.
Table 1. STS-1 crew sound level meter acoustic measurements.
Octave Band Center Frequency [Hz]
63 125 250 500 1K 2K 4K 8K dBA
JSC Standard 145 (NC-50) 73 66 60 55 52.5 50 48 47.5 55
Flight Deck (between seats) 64 58 55 55 58 53 48 42 60
Flight Deck (aft overhead windows) 63 61 55 59 63 57 51 46 66
Mid-deck (center) 61 61 63 58 61 61 58 53 67
Mid-deck (sleep station) 60 63 67 59 62 61 58 52 67
Table 2. STS-2 crew sound level meter acoustic measurements (* indicates common data locations for the OFT measurements). (RS=forward air outlet in main display console; IMU=Inertial Measurement Unit;
FWD= Forward; WCS=Waste Control System; ARS= Air Revitalization System)
Octave Band Center Frequency [Hz]
63 125 250 500 1K 2K 4K 8K dBA
JSC Standard 73 66 60 55 52.5 50 48 47.5 55
Flight Deck (aft overhead windows) 65 64 58 59 66 62 62 48 67*
RS Air Outlet (Flight Deck) 76
Aft Air Outlet (Flight Deck) 77
Sleep Location (Flight Deck, Seats) 61
Sleep Location (Flight Deck, Floor Behind Seats) 59 60 63 57 61 56 51 44 64
Mid-deck Center (Mid-deck) 68*
IMU Inlet (Mid-deck) 64 63 66 57 62 62 61 55 68
Ceiling Air Outlet (Mid-deck) 71
FWD Avionics Bay (Mid-deck) 80
WCS Air Inlet (Mid-deck) 75
WCS Operations (Mid-deck) 87
ARS Servicing Housing (Mid-deck) 77
Table 3. STS-4 crew sound level meter acoustic measurements (* indicates common data locations for the OFT measurements). (W7/W8=overhead windows in aft flight deck)

NASA/SP-2015-624 – ACOUSTICS AND NOISE CONTROL IN SPACE CREW COMPARTMENTS – Goodman & Grosveld
Chapter IV - 34
Octave Band Center Frequency [Hz]
63 125 250 500 1K 2K 4K 8K dBA
W7/W8 Windows (Flight Deck) 65 67 58 58 62 56 51 46 65*
Sleep Location (Mid-deck) - - - - - - - - 69*
Note that at a number of locations in both decks acoustic levels exceeded the specification
limits. For example air outlets in the flight deck had levels of 76 and 77 dBA. Crews operating in the aft flight deck were exposed to levels higher that the flight deck measurement location between the commander and pilot seats as shown in Figure 7. Likewise, the forward mid-deck avionics bay shown in this figure was measured at 80 dBA, whereas the mid-deck center, the specification measurement location on this deck, was 68 dBA. This illustrates the problem of having measurement locations for acoustic limits and compliance that are not representative of most of the locations where the crew works or sleeps. DFI data were not taken at the specification locations, so it was not comparable with the handheld crew measurements in the specification locations. DFI mid-deck levels were as follows for STS missions: 72 dBA for STS-1; 71.5 dBA for STS-2; 70 dBA for STS-3; 74 dBA for STS-4 and 72 dBA for STS-5 (operational flight, but vehicle in a basically OFT configuration). DFI flight deck levels for STS missions were: 66 dBA for STS-1; 64.5 dBA for STS-2; 63.5 dBA for STS-3; 65.0 dBA for STS-4 and 63.5 dBA for STS-5. Note that the DFI pallet microphones were not located in the center of the mid-deck, and this pallet, the water tank, and other configuration changes made OFT acoustics different than the OPS configuration. From DFI measurements on STS-3, a pure tone at 200 Hz was found to increase 12 dB between STS-2 and STS-3. On STS-4 another high tone at 100 Hz was found to increase 13 dB from STS-3 to STS-4, and remedial action was taken to quiet these sources.
6. NOISE CONTROL DURING OPERATIONAL FLIGHTS
As noted previously, the Space and Life Sciences Directorate at JSC went on record indicating that NC-50 was still required for operational Space Shuttle flights and NC-55 was acceptable only for OFT, because of OFT’s short duration flights and limited crew [15].
During early operational flights, starting with STS-6, the DFI pallet and the IMU water tanks were deleted, and vehicles were equipped with the following: integrated IMU mufflers shown previously (Figure 34 and Figure 35); solid and sealed mid-deck metal floor panels; solid panels in most areas that previously had flight deck screens for OFT; and new air revitalization system ventilation ducting provisions for addition of sleep station bunk kits on the starboard side of the Orbiter mid-deck.
On the STS-6, OV-099 Challenger, readings from a handheld sound level meter showed the vehicle mid-deck at 69 dBA, which was close to the OVEI Specification limit of 68 dBA. Acoustic levels were higher in locations other than the specification measurement locations, as noted before on OFT measurements. The measurement results are presented in Table 4. As indicated previously, the WCS operations readings were taken during waste collection system operations, and were categorized as an intermittent noise. The sound level meter was de-manifested after STS-6 during a weight scrub.

SPACE SHUTTLE ORBITER - Goodman
Chapter IV - 35
Table 4. STS-6 acoustic measurements in OV-099. (WCS=Waste Control System; ARS=Air Revitalization System; FWD= Forward; IMU=Inertial Measurement Unit; F5=forward air outlet in main display console;
W7/W8=aft windows facing payload bay)
Octave Band Center Frequency [Hz]
63 125 250 500 1K 2K 4K 8K dBA
JSC Standard 145 (NC50) 73 66 60 55 52.5 50 48 48 55
Air Lock (Mid-deck) 62 63 58 56 56 54 45 35 62
WCS Operation (Mid-deck) 80 78 71 85 86 88 78 77 92
ARS Serv. Housing (Mid-deck) 67 67 70 68 70 73 68 60 77
FWD Avionics Bay (Mid-deck) 70 69 66 65 63 60 66 57 70
WCS Air Inlet (Mid-deck) 69 71 73 67 66 68 60 43 73
IMU Inlet (Mid-deck) 69 65 64 63 63 63 56 55 68
F5 Air Outlet (Flight Deck) 73 66 66 65 62 62 56 51 70
Aft Air Outlet (Flight Deck) 70 67 65 67 71 63 55 48 72
Mid-deck Center 62 64 62 62 67 62 53 47 69
W7/W8 Windows (Flight Deck) 68 65 57 57 63 58 48 40 65
Sleep Location (Mid-deck) - - - - - - - - 65
A 1985 survey of thirty-three astronauts who flew in eight shuttle missions, starting with
STS-9, revealed a number of complaints regarding the Orbiter acoustic levels, including: preference for lower noise; experiencing sleep disturbance; speech interference; annoyance and interference during relaxation; the need to block out unpleasant noise; and strong agreement about needing lower Space Station noise levels [16]. More than half of the respondents reported that noise interfered with their sleep, while nearly half experienced speech interference (Table 5).
Table 5. Shuttle Astronaut Survey.
Question Yes No No Response Major Comments
Hearing protection used 6 21 6
Sleep disturbed 18 9 6 Need better isolation
Speech interference 16 11 6 Must shout between decks
Annoyed 13 10 10 Intermittent noise bothersome
Interference with concentration 5 16 12 More quiet desirable
Interference with relaxation 14 9 10
Notice vibration 17 10 6
Notice noise more late in flight 7 26 0
Notice noise more when tired 4 21 8
Block out unpleasant noise 17 10 6
Greater sensitivity in space 1 25 7
Prefer lower background noise 20 7 6
Lower Space Station noise 25 2 6 Strong agreement on this
In 1988 crew comments about noise on Space Shuttle Orbiter flights 51-I, 61-B and 61-C were reviewed [17]. Comments on STS 51-I were that the vacuum cleaner was really loud. On

NASA/SP-2015-624 – ACOUSTICS AND NOISE CONTROL IN SPACE CREW COMPARTMENTS – Goodman & Grosveld
Chapter IV - 36
STS 61-B, four of seven crew members complained about loss of sleep due to an electrophoresis payload, which is believed to have run continuously. No crew concerns about noise were made on STS-61-C.
As payloads were increasingly added to missions, it was found that they created noise problems. To minimize the impacts on the overall system levels, continuous noise levels of each payload were restricted to 10 dB below the overall limit of each deck, 58 dBA for the mid-deck and 53 dBA for the flight deck (Figure 45 and Figure 46). It was considered that it would take ten payloads equal to the payload specification to be equivalent to the mid-deck limits, and increase the resultant overall levels by 3 dB. Unfortunately, some payloads were seldom delivered meeting the shape or the individual octave band limits of the specification limits, and as a mission composite, they frequently presented impacts to the mid-deck limit. Manifesting and use of mid-deck payloads increased as the Space Shuttle Program evolved, with increased difficulty maintaining the complement levels of these payloads so they would not impact the continuous noise limits. There was an increased effort on determining the resultant payload flight complement noise levels to ensure individual payloads met their requirements. In retrospect, the individual payload should have been better controlled to meet the payload specification. Lower sub-allocated limits should have been established that would have made impacts to the Space Shuttle Orbiter systems limits less likely; acoustic measurements on the payloads should have been performed and their complement levels should have been known earlier, so that payload manifesting could have been better controlled to ensure no impact on the overall system limits. These lessons were later applied to the ISS Program and increased payload oversight and design/development support was implemented. Generally, the concern was more with combinations of payloads that exceeded their continuous noise specification, or with high level intermittent payloads. At times, it was not discovered, that individual payloads or payload complements were excessively loud until late, just before flight. These payloads were manifested or in some cases installed, and flight crews were trained for their operation. As a result, there was a good deal of pressure to accept acoustic waivers, and waivers were accepted. Information on payload compliance was changed so it was provided earlier in the pre-flight process, and more support was attempted by acoustics personnel to help offending payloads meet their requirements in the development process or earlier before flight.
In August 1990, before the STS-40 mission in June 1991, the Acoustics Lead expressed concern about the four items planned to be flown in the Space Shuttle Orbiter on this mission: the Orbiter Refrigerator/Freezer (ORF), the two Animal Enclosure Modules (AEMs), and the Payload Utility Panel Number 200 (PUP-200) [18]. In April 1991 the acoustic noise exceedances for the STS-40 mission were discussed and concerns and options were presented. Focus was on the STS-40 payload complement impacting the Orbiter OVEI specification, with unacceptable impacts to the habitable environment, the need for payloads to comply with their established limits, and the need to deal with payload acoustic aspects of earlier missions [18]. Also, there was concern about exceeding the JSC Life Sciences 24 hour exposure limit of 76 dBA established in 1980. Later, projected high levels for the Space Shuttle Orbiter and Spacelab were shown, significant concerns were identified, and options were discussed [19]. As a result of these efforts the PUP-200 was removed from the manifest and the ORF was somewhat quieted. An audio dosimeter developed for flight use by the Orbiter Project, was manifested on the STS-40

SPACE SHUTTLE ORBITER - Goodman
Chapter IV - 37
mission because of concerns with impeding acoustics problems on this mission, and the need to obtain crew exposure measurements.
After Space Shuttle Flight STS-40 mission was launched in June 1991, payload noise concerns on board occurred in abundance, in both the Spacelab and the Crew Module. Spacelab continuous acoustic limits were originally set at NC/NR-50. The difference between the Noise Criterion NC-50 and the Noise Rating NR 50, which is commonly used in Europe, is illustrated in Table 6. During STS-40, the Spacelab levels were very loud and troublesome. Sound levels in the Spacelab module increased on some days to as high as 75.5 dBA due to payload operations, and up to 84 dBA during ergometer operations [20]. Measured time-weighted average was 71 dBA for the second flight day, 73 dBA for the third flight day, and on another day increasing to 75.5 dBA over a 12 hour period. The Life Sciences Laboratory Equipment (LSLE) Refrigerator/Freezer (R/F) was a continuous noise source in Spacelab, which was very loud and especially disturbing to the crew. The bicycle ergometer in the laboratory was also a very loud, but intermittent, noise source. As a result, there were serious problems with Spacelab communications, both with the ground and between crew members. The communications capability within Spacelab had become obscured by the high ambient noise levels of the experiment hardware, and the crew had to move into the airlock to communicate with the ground (away from the experiments that they were operating). In Spacelab, the crew’s callouts needed to be repeated. “Say again” was the phrase repeated over and over again, and the crew became very frustrated. Communication distances were significantly larger in Spacelab than on either one of the Orbiter decks, due to the length of Spacelab. The levels in the Orbiter Crew Module during STS-40 also were high, reaching daily averages as high as 71 to 73 dBA compared to 73 to 75.5 dBA in Spacelab. The high levels in the Orbiter were due to the AEM and ORF payloads in the mid-deck. The crew was very irritated during operations and sleep periods, and most of them had headaches due to the high noise levels experienced during the mission. The mission was the most problematic from an acoustics standpoint, and resulted in much more management emphasis on payload and overall acoustic compliance.
Table 6. Noise Criterion NC-50 compared with the Noise Rating NR 50.
Octave Band Center Frequency [Hz]
63 125 250 500 1K 2K 4K 8K
NC-50 71 64 58 54 51 49 48 47
NR 50 75 66 59 54 50 47 45 44
A summary of the results of another acoustics assessment during STS-40 was made by NASA
human factors personnel, via a NASA sponsored Detailed Secondary Objective (DSO) 904 performed during the mission [21]. Sound level data taken for this DSO during the mission is shown in Figure 47 for the Orbiter mid-deck and in Figure 48 for the Orbiter flight deck [22]. A dedicated DSO sound level meter was provided for measurements. This report indicated that mid-deck levels averaged 63 dBA with payloads off, and 65 dBA with AEMs on and ORF off, the flight deck averaged 61.8 dBA, and 70.1 dBA was registered for Spacelab. Levels increased depending upon which experiment was activated. Crew questionnaires showed that six of the seven crew members found that noise interfered with their ability to relax, with three crew

NASA/SP-2015-624 – ACOUSTICS AND NOISE CONTROL IN SPACE CREW COMPARTMENTS – Goodman & Grosveld
Chapter IV - 38
members stating that it occurred frequently, and another saying that noise always interfered. One of the crew reported no interference with noise for relaxation or ability to concentrate. The entire crew agreed that current noise levels would be unacceptable for longer missions and that reductions in noise were mandatory in Spacelab. The crew indicated that sleep interference was prevalent, even though earplugs were used. Six crew members wore hearing protection at night and all recommended that the noise levels be reduced. Four of them believed the reductions were mandatory. Temporary hearing threshold shifts were found and one of the crew verbally reported to this author that he experienced hearing loss. The crew rated each deck in the Orbiter and the Spacelab as shown in Figure 49. Speech interference was significant. NC-50 was recommended for the mid-deck and Spacelab, and it was stated that Space Station Freedom (later designated ISS) should specify NC-50 for work and NC-40 for sleep in the Manned Spacecraft Integration Standards.
Figure 47. STS-40 Mid-deck.
Figure 48. STS-40 Flight deck and Spacelab.
* 5 – Improvements Mandatory 4 – Improvements Necessary 3 – Improvements Desirable 2 – Improvements Possible 1 – Improvements NOT Needed
Figure 49. STS-40, Average sound level and crew rating by location.
Octave Band Center Frequency, Hz
So
un
d P
ressu
re L
evel, d
B
30
40
50
60
70
80
31.5 63 125 250 500 1000 2000 4000 8000
Measurement 1 (MD)Measurement 2 (MD)Measurement 3 (MD)NC-50 (SSF Limit)
Octave Band Center Frequency, Hz
So
un
d P
res
su
re L
ev
el,
dB
30
40
50
60
70
80
31.5 63 125 250 500 1000 2000 4000 8000
Measurement 4 (FD)Measurement 5 (SL)Measurement 6 (SL)NC-50 (SSF Limit)
Spacelab Mid-deck Flight deck
LOCATION
Ov
era
ll A
-we
igh
ted
So
un
d P
res
su
re L
ev
el,
dB
0
1
2
3
4
5
Cre
w R
ati
ng
0
5
10
15
20
25
30
35
40
45
50
55
60
65
70
Average sound levelAverage crew rating

SPACE SHUTTLE ORBITER - Goodman
Chapter IV - 39
In September 1991, the mid-deck specification area levels during three flights were reported as follows: STS-37 (April 1991) had a level of 69 dBA; STS-43 (August 1991) had a level of 69.5 dBA, and a level of 70 dBA was projected on STS-48 (September 1991) [23].
At an April 1991 JSC AWG meeting (before STS-40), the Astronaut Office reported on the results of an acoustic questionnaire [24]:
All crew members should be capable of hearing air-to-ground communications at all times
Crewmembers strongly prefer to use direct voice communications over a headset during continuous noise operations
During high noise levels, wearing an earmuff style headset would be acceptable Prime noise contributors were:
Intermittent: IMAX camera Treadmill and ergometer Cabin depressurization/repressurization for Extravehicular Activity (EVA) Waste collection system
Continuous: Cabin fan Avionics Protein Crystal Growth Payload Refrigerator/Incubator (RIM) Payload
The current Space Shuttle Orbiter noise levels would be acceptable for EDO, but not
for the Space Station Recommend lower Space Shuttle noise Overall, the noise on the Orbiter is acceptable
Later, in December 1991 (after STS-40), the Astronaut Office reported on results of an updated acoustic questionnaire, as follows [25]:
All crew members should be able to hear air-to-ground communications at all times Air-to-air communications are strongly recommended over headset use for inside
the Space Shuttle (aft flight deck to aft flight deck, mid-deck to mid-deck, and module-to-module). Most crewmembers would consider a headset as an alternative
Earmuff style headsets are not acceptable to alleviate high noise levels The majority recommended reducing Space Shuttle noise, but also felt that the flight
noise was acceptable Noise was acceptable, but marginal, seemed to be the opinion of several crew
members The cabin noise was very noticeable when the cabin fan was turned off for lithium
hydroxide canister change-out Prime noise contributors: the cabin fan, waste control system, galley, avionics,
teleprinter, text and graphics (TAGs), cabin depressurization and repressurization for 10.2 absolute pounds-per-square-inch (psia) EVA preparation (unbearable)
Sleep station is a great improvement over the sleeping bag (a crewmember was kept awake by noises and others mentioned specifically noise from galley pump cycling)

NASA/SP-2015-624 – ACOUSTICS AND NOISE CONTROL IN SPACE CREW COMPARTMENTS – Goodman & Grosveld
Chapter IV - 40
Subsequent to STS-40 in 1991, this author contacted the National Research Council (NRC) Committee on Hearing, Bioacoustics, and Biomechanics (CHABA) for guidance on acoustics limits. An informal meeting was held with some of the CHABA representatives at a conference in Houston, Texas. The representatives emphasized the need for acoustics to satisfy the communications, habitability, and hearing loss requirements, with the lowest level of the three to be satisfied being for communications, where NC-50 was necessary as a requirement.
As a result of the STS-40 mission acoustic problems, a NASA Headquarters AWG was setup in late 1991 and 1992 with representatives from NASA Centers to review Space Shuttle acoustic concerns and remedial actions [26][27]. This effort was a very significant one that systematically addressed acoustics in the Space Shuttle Orbiter and payloads at a high management level with the responsible NASA Center parties. The working group was divided into subgroups, including subgroups on Specifications and Orbiter Elements, Spacelab Subsystems, Mission Management, and Payload Experiment Development Hardware. It was reported that audio dosimeters were manifested on all flights and measuring each Orbiter was emphasized [26]. The Specifications and Orbiter Elements Working Subgroup was chaired by the Acoustics Lead at JSC (this author), who met with his representatives from Spacelab, payloads, and others to formulate and resolve proposed acoustic specification revisions, and manage Space Shuttle Orbiter and flight acoustic testing and analysis. The Acoustics Lead also reported on other acoustic efforts under his jurisdiction to the Headquarters AWG [26][27]. Detailed test objectives were produced and manifested for on-orbit audio dosimeter and sound level meter measurements. The need to ensure that the acoustic limits were adequate and allowed good communications was emphasized at the Headquarters AWG (this need was met by the NC-50 limit in NASA Design Standard DS-145). Projected payload exceedances of their specifications were reported on STS-42, STS-43, STS-44, STS-48, and STS-50. Orbiter exercise equipment measurements showed high intermittent noise events up to 99 dBA for the Orbiter treadmill and 85 dBA for the rower [26].
Mid-deck payload acoustic exceedances were also reported to the Headquarters AWG for STS-46, STS-47, STS-49, and STS-52, so payloads still struggled to meet their limits (Figure 46) [27]. On STS-42, which was a Spacelab mission, audio dosimeter readings were at 70.9 dBA on the first day for a period of 11 hours; 69.2 dBA on the second day for 10 hours and 40 minutes, and 74.9 dBA on the third day for a 10 hour period. In Spacelab, the LSLE refrigerator was 75.8 dBA with the compressor off, for a 13 hour time period, and in the Spacelab aft end the readout was 70.6 dBA. The Protein Crystal Growth (PCG) payload readout was 84.4 dBA for a period of about 2.25 hours. The Orbiter mid-deck had a readout of 68 dBA on the fourth day for 2 hours. Figure 50 shows the effect of the LSLE R/F on the middle of Spacelab and how one payload created levels that exceeded the payload and overall Spacelab limits, and could have dramatically impacted the acoustics.
Other JSC acoustic efforts that were reported to the NASA Headquarters AWG were as follows: In 1992 covers were approved for large holes in the mid-deck floor, large slots in the avionics bay “3A”, and for numerous depressurization holes in the mid-deck closeout panels that were found to still exist in operational Orbiters [27]. The depressurization holes in mid-deck panels were significant in quantity, and are shown on Orbiter port side in Figure 8 and on starboard side in Figure 26. Orbiters OV-102, OV-103, OV-104, and OV-105 were verified for

SPACE SHUTTLE ORBITER - Goodman
Chapter IV - 41
acoustic compliance, without any payloads running. This testing of the Orbiter fleet showed that the operational vehicles, without payloads, had mid-deck levels which ranged from 61 dBA to 64 dBA (Figure 51). Testing was completed on the Orbiter fleet in mid1993. OV-102 measured 64 dBA, which was lower than the 67.5 dBA measured previously in this vehicle [11], although the carbon dioxide removal system changed for this vehicle. Principle changes from OFT to the operational configuration were: the DFI pallet and water tank were removed; ejection seats were deleted and Commander and Pilot seats were added to the flight deck, and crew seats were added to the aft flight deck and mid-deck; open screens in the mid-deck floor and flight deck areas were replaced with solid panels. Later in 1992, numerous depressurization holes in mid-deck closeout panels were covered. EDO related changes are covered in Section 8.
The flight decks were found to have levels from 60 to 63 dBA (Figure 52). OV-102 measured 63 dBA compared to its 1980 measurement of 62 dBA, with a different carbon dioxide removal system implemented. Other Orbiters measured 61 dBA. The Orbiter fleet tested had, at that time, an airlock which was inside the crew compartment. Later in the late 1990’s, some Orbiters were modified to move the airlock into the forward part of the payload bay. Thus operational Orbiters, except for OV-102 with the aforementioned changes, were found to be lower than their limits on both decks which left more margins for payloads to not impact the deck limits, since Orbiter systems were quieter than required at limit measurement locations. However, note again that limits for both decks were not representative of the levels that crews could be exposed to during operations at other locations.
Figure 50. STS-42 LSLE refrigerator impacts to middle of Spacelab.
Octave Band Center Frequency, Hz
So
un
d P
res
su
re L
ev
el,
dB
40
45
50
55
60
65
70
75
80
63 125 250 500 1000 2000 4000 8000 OASPL dBA
Spacelab noise with LSLE (74 dBA)OVEI (68 dBA)Mid-deck payload noise spec (58 dBA)

NASA/SP-2015-624 – ACOUSTICS AND NOISE CONTROL IN SPACE CREW COMPARTMENTS – Goodman & Grosveld
Chapter IV - 42
Figure 51. Orbiter fleet mid-deck measurements. Note: The Regenerative Carbon Dioxide Removal System (RCRS) was an Extended Duration Orbiter (EDO) modification made on the OV-102 vehicle.
Figure 52. Orbiter fleet, flight deck measurements.
Octave Band Center Frequency, Hz
So
un
d P
res
su
re L
ev
el,
dB
35
40
45
50
55
60
65
70
75
63 125 250 500 1000 2000 4000 8000 OASPL dBA
Proposed OVEIOV-102 (RCSR pump on)OV-102 (RCRS pump off)OV-103OV-104OV-106
Octave Band Center Frequency, Hz
So
un
d P
res
su
re L
ev
el,
dB
35
40
45
50
55
60
65
70
75
63 125 250 500 1000 2000 4000 8000 OASPL dBA
NC-40
NC-50
Proposed OVEINC-50NC-40OV-102OV-103OV-104OV-106

SPACE SHUTTLE ORBITER - Goodman
Chapter IV - 43
In December 1991 and later in April 1992, the specifications subgroup reported to the Headquarters AWG on progress with new proposed intermittent noise specifications [26] [27]. The intermittent portions of NASA Design Standard 145 [1] discussed previously were found to be difficult to use because they dealt with noise sources and their allowable levels and exposure times. It also called for limited time between high level noise exposures. In Space Shuttle operations a number of sources, not just one item, could produce high level noise. This part of the standard was not practical to use as an operational limit for all potential noise sources that could occur during a mission. It was determined that reasonable, lower allowable intermittent limits needed to be applied to each individual source so each hardware item was designed to be acceptable when it operates intermittently and there would be fewer problems with multiple sources operating in close time proximity. Also, the higher levels allowed precluded the previously stated Astronaut Office recommendation to ensure that crews are always able to communicate with the ground. It was also determined that the limits set by NASA Design Standard 145 should not be the high levels defined in that standard, as they were associated with what could be tolerated without hearing loss from high level commercial and ground type hardware, and were based on the Occupational Safety and Health Administration (OSHA) eight hour work day and sixteen hours off work standards. Hardware should be designed to meet in-flight-needed continuous and intermittent limits: be compatible with protecting the ears from excessive levels and hearing loss, and acceptable from a habitability and communications/intelligibility standpoint.
For the first time continuous and intermittent noise were defined in a new way. A continuous noise source was defined as all equipment collectively that functions as a system while actively powered on for a cumulative time of more than eight hours per (24 hour) day. An intermittent noise was defined as all equipment collectively that functions as a system for eight hours or less during a 24 hour period. Limits were decided to be established in terms of time allowed for given dBA levels. Astronaut crews had earlier participated in testing at various levels, simulating Space Shuttle configuration/operations, where various levels of intermittent payload levels were assessed [28]. Also, an analysis was made of the effects of a number of intermittent sources at various levels incurred simultaneously, on the overall levels and the 24 hour time weighted average level.
The NASA Headquarters AWG was disbanded in 1992, after the proposed actions and continuous noise specification change actions were basically agreed to, and forward action agreed to draft changes and bring them to the Orbiter and Space Shuttle Change Control Boards (CCBs).
Two missions after STS-40 are of interest, STS-50 and STS-57, as they had detailed human factors DSO type acoustic measurements, crew questionnaires, and they showed benefits of the remedial efforts discussed above, i.e., more concentration on acoustic compliance and, as a result, less acoustic noise concerns over time.
STS-50 was flown in June 1992 with a crew of seven for nearly fourteen days, using the OV-102/Columbia vehicle which had EDO related changes that affected the vehicle acoustics. These changes and their acoustic noise control effectiveness are described in Section 8. STS-50 carried the United States Microgravity Laboratory (USML) housed in a Spacelab module.

NASA/SP-2015-624 – ACOUSTICS AND NOISE CONTROL IN SPACE CREW COMPARTMENTS – Goodman & Grosveld
Chapter IV - 44
Measured mid-deck levels met the specification limits, except when exercising with a bicycle and during vacuum cleaner operations as shown in Figure 53 [29]. The measured flight deck noise levels were close to the specification limit at 500 Hz and higher frequencies, but above the limits at 250 Hz, as shown in Figure 54. Note that the flight deck limits were 63 dBA. Spacelab background module levels are presented in Figure 55 and the Spacelab levels with exercise equipment in use is shown in Figure 56. Note that in Figure 53 the measured middeck levels without payload noise are lower than the specification limits and closer to NC-50. The same applied to Spacelab levels. The higher than specification levels recorded in Spacelab were attributable to the Ergometer Vibration Isolation System (EVIS), the Drop Physics Module, the glovebox circulation system, and other payload hardware. The crew provided ratings for the overall acoustic environment on the flight deck, the mid-deck and Spacelab, as summarized in Table 7. Note that crew comments apply to the entire deck, not necessarily the specification limit location on either deck, but for general operations on these decks where levels could be higher than the limits. Other crew comments and the more negative ratings in the referenced figure on crew sleep in the mid-deck resulted from dual shift operations when the sleeping crew was awakened by noises from locker operations and by locker doors hitting the four-tier configuration bunk. Six of the seven crew reported that noise woke them up and two reported that the noise resulted in experiencing “ringing ears”. However, the report also highlighted the need for lower acoustic levels to ensure adequate communications, similar to what was previously addressed on numerous occasions over the years, at NASA Orbiter CCB’s by acoustics and Space and Life Sciences representatives, what was informally provided in 1991, by NRC/CHABA representatives, and discussed in other documents reported later in this Chapter.
Figure 53. STS-50 measured mid-deck levels (EVIS = Ergometer Vibration Isolation Systems).
Octave Band Center Frequency, Hz
So
un
d P
res
su
re L
ev
el,
dB
30
40
50
60
70
80
31.5 63 125 250 500 1000 2000 4000 8000
NC-50Mid-deck noise limitMid-deck backgroundMid-deck background + bike + EVISMid-deck background + vacuum cleaner

SPACE SHUTTLE ORBITER - Goodman
Chapter IV - 45
Figure 54. STS-50 measured flight deck levels.
Figure 55. STS-50 measured Spacelab levels.
Octave Band Center Frequency, Hz
So
un
d P
res
su
re L
ev
el,
dB
30
40
50
60
70
80
31.5 63 125 250 500 1000 2000 4000 8000
NC-50Flight-deck noise limitFlight-deck background
Octave Band Center Frequency, Hz
So
un
d P
res
su
re L
ev
el,
dB
30
40
50
60
70
80
31.5 63 125 250 500 1000 2000 4000 8000
NC-50Mid-deck noise limitSpacelab background + DPMSpacelab background + GBXSpacelab background + STDCE

NASA/SP-2015-624 – ACOUSTICS AND NOISE CONTROL IN SPACE CREW COMPARTMENTS – Goodman & Grosveld
Chapter IV - 46
Figure 56. STS-50 measured levels with exercise.
Table 7. Crew ratings of the STS-50 levels in Orbiter and Spacelab.
Crew Postflight Rating, Tally (Inflight Rating)
Question Completely
Acceptable
Moderately
Acceptable Borderline
Moderately
Unacceptable
Extremely
Unacceptable
1. Noise overall 2 (1)*t 4 (2)
2. Noise in the Orbiter Flight deck:
__during nominal operations
__during experiment operations
4
4
2 (3)
1
3. Noise in the Orbiter Mid-deck:
__during nominal operations
__during experiment operations
2 (1)
4 (2)
4
2
4. Noise in Spacelab:
__during nominal operations
__during experiment operations
5 (2)
3
1 (1)
2
5. Noise during sleep periods 2 1 (1) 2 (1) (1)
6. Noise from:
__Drop Physics Module (DPM)
__EVIS
__Glovebox (GBX)
__Surface Driven Convection Experiment (STDCE)
4(3)
2
3
2
2
2
1
1
* Numbers In parentheses represent inflight responses.
Octave Band Center Frequency, Hz
So
un
d P
res
su
re L
ev
el,
dB
30
40
50
60
70
80
31.5 63 125 250 500 1000 2000 4000 8000
NC-50Mid-deck noise limitSpacelab backgroundSpacelab background

SPACE SHUTTLE ORBITER - Goodman
Chapter IV - 47
A crew questionnaire to the Astronaut Office provided the following results on the four-tier sleep station:
56% of the crew members recommended that noise be reduced in sleep station 75% of the crew members stated that noise absorbing panels were needed 77% of the crew members stated that they were awakened due to noise
Specific concerns that were expressed included:
Outside levels, especially intermittent are disturbing Knocking/dinging of metal/hard surface on inside of station Cold air blows out directly on head and is uncomfortable Overall comfort could be improved
As a result of this survey and concern with the importance of providing a quiet sleep station for crews, changes were made to add acoustic liners, mufflers, a bump pad on the outside of the bunk, and air deflectors, as shown in Figure 40 and Figure 41. On four flights, STS-50, STS-55, STS-59, and STS 65 various improvements were evaluated on the four-tier sleep station (different liner thicknesses, and installation of an aft bumper pad and air deflectors at the head ventilation outlets). Sound level meter and dosimeter measurements were taken in the sleep station in bunks as summarized in Table 8. STS-50 flew with approximately one inch liners, while two inch are believed to be used on STS-55 and possibly other missions. Figure 57 shows sound level meter measurements taken in the third bunk down on STS-55 and STS-50. Sound level measurements taken on STS-65 in all four bunks are shown in Figure 58. Figure 59 shows the noise reduction measurements of the third bunk quieting kit obtained on STS-50 and STS-55 missions. Improved noise reduction is thought to be achieved because thicker acoustic pad kits were used, although the thicker liners provided less room in each bunk for the crew.
Table 8. Sound Level Meter (SLM) and dosimeter readings during sleep on various missions.
Sound level meter Dosimeter
STS-50 STS-55 STS-65 STS-59 STS-55 STS-65 STS-59
60 dBA 56 #1 top bunk
54 dBA 59 dBA #2 61.0 dBA/61.4 dBA 62.8 dBA/63 dBA
59 dBA 51.5 dBA 54 dBA 54 dBA #3 with liner 58.6 dBA 60.9 dBA/60 dBA 58.8 dBA/60.4 dBA
64 56 #4 62.9 dBA 63.5 dBA
STS-57, having a crew of six, was flown in June 1993 for nearly ten days, using the OV-105/Endeavor vehicle with a SpaceHab module installed in the Orbiter payload bay. This mission was not an EDO flight. A human factors assessment was performed and the reported acoustic measurement levels are shown in Table 9 [30]. The values in this table came from calculating the dBA from the octave band measurements, whereas the measured dBA value came from the dBA measured by the sound level meter (SLM). The reference report indicates the differences between the measured and calculated values in Table 9 were due to the random nature of the acoustic environment. In addition, this author believes that the SLM operational complexity added to the time to take readings, making environmental changes

NASA/SP-2015-624 – ACOUSTICS AND NOISE CONTROL IN SPACE CREW COMPARTMENTS – Goodman & Grosveld
Chapter IV - 48
more likely. Mid-deck levels were within the limits except during the charging of the Extravehicular Mobility Unit (EMU) battery when the levels were slightly higher (an intermittent noise). SpaceHab exceeded its limits in the center of the module.
Figure 57. SLM acoustic measurements inside third sleep station bunk on STS-55 and STS-50.
Figure 58. SLM acoustic measurements taken inside the four-tier sleep station bunks on STS-65.
Octave Band Center Frequency, Hz
So
un
d P
res
su
re L
ev
el,
dB
15
20
25
30
35
40
45
50
55
60
65
70
75
63 125 250 500 1000 2000 4000 8000 OASPL dBA
NC-40
Proposed OVEI Acoustic SpecificationSTS-55 - Inside Third BunkSTS-50 - Inside Third Bunk
Octave Band Center Frequency, Hz
So
un
d P
res
su
re L
ev
el,
dB
15
20
25
30
35
40
45
50
55
60
65
70
75
63 125 250 500 1000 2000 4000 8000 OASPL dBA
NC-40
Orbiter total systems specificationBunk #1Bunk #2Bunk #3 with liner and door vent baffleBunk #4

SPACE SHUTTLE ORBITER - Goodman
Chapter IV - 49
Figure 59. Noise reduction of the third bunk quieting kit on STS-50 and STS-55.
Crew in-flight ratings in Table 10 show that three of the crew members rated the nominal operations in the mid-deck as barely acceptable, when levels were in the range of 62 to 66 dBA. Half of the crew noted that noise interfered with the ability to concentrate, as well as with their performance of a task. Also note the percentage of time each crew had difficulty hearing another crewmembers speech on the same deck. The ratings, similar to earlier mission ratings, were also noted to demonstrate that “susceptibility to noise was highly individualistic.”
Table 9. STS-57 acoustic measurements in Orbiter and SpaceHab.
Overall A-Weighted Decibels
Measurement Location MET Condition Measured Calculated Acoustic
(Memory Number) (Primary Noise Source) Value Value Limit
Flight deck, Center (0) 4/21:37 Nominal Operations (ECLSS, SAREX) 72 64 63
Flight deck. Center (1) 5/5:26 Nominal Operations (ECLSS. A/G) 62 62 63
Mid-deck, Center (6) 5/0:51 Nominal Operations (ECLSS) 63 66 68
Mid-deck, Center (7) 5/5:15 Nominal Operations (ECLSS) 62 62 68
SpaceHab, Center (4) 4/21:53 Nominal Operations (ECLSS, Fans off) 63 76 68
SpaceHab. Center (5) 5/5:20 Nominal Operations (ECLSS, Fans on) 66 78 68
Mid-deck, Center (8) 4/21:42 EMU Battery Charging Cycle 67 63 68
Mid-deck, 1’ from MF28E (9) 4/21:47 EMU Battery Charging Cycle 61 70 68
Mid-deck, Center (3) 402:01 EMU Battery Charging Cycle (C/W alarm) 71 69 68
Mid-deck, Center (2) 4/23:16 End of EMU Batten Charging Cycle 66 69 68
Octave Band Center Frequency, Hz
No
ise
Re
du
cti
on
, d
B
-10
-5
0
5
10
15
20
25
30
63 125 250 500 1000 2000 4000 8000
STS-55 third bunk noise reductionSTS-50 third bunk noise reduction

NASA/SP-2015-624 – ACOUSTICS AND NOISE CONTROL IN SPACE CREW COMPARTMENTS – Goodman & Grosveld
Chapter IV - 50
Table 10. Crew ratings of the STS-57 levels in Orbiter and SpaceHab.
CREWMEMBERS
QUESTION A B C D E F
1 2 3 4 5 6 7
Completely
Unacceptable
Reasonably
Unacceptable
Barely
Unacceptable Borderline
Barely
Acceptable
Reasonably
Acceptable
Completely
Acceptable
S1. Noise overall: 6 4 5 3 4 6
S2. Noise in the Orbiter flight deck: 7 6 7 4 5 6
S3. Noise in the Orbiter middeck during:
a.___nominal operations (background noise) 7 4 7 4 4 6
b.___experiment operations (peak noise) 7 3 7 4 4 2
S4. Noise in the SpaceHab during:
a.___nominal operations (background noise) 6 3 5 2 4 6
b.___experiment operations (peak noise) 6 2 5 1 4 2
S5. Noise during sleep periods: 7 3 6 4 4 7
S6. Noise from:
a.___Penn State experiment (PSE) 7 3 6 3 4 3
b.___Orbiter maneuvering system (OMS) 7 6 7 4 5 2
c.___Waste control system (WCS) 7 4 7 4 5 3
d.___Vacuum cleaner 4 3 3 1 2 1
S7. If I were on a 30-day mission, noise levels like those
on this mission would be: 6 3 6 2 4 4
S8. If I were on a 6-month mission, noise levels like those
on this mission would be: 6 3 4 2 3 4
Percentage of Time
S9. During what percentage of the mission did you have
difficulty hearing another crewmember’s speech
without the use of an intercom:
a. between FD and MD? 50 95 100 80 90 90
b. on the same deck? 0 0 20 20 30 20
c. between MD and SH? 100 100 100 100 100 100
S10. During what percentage of the mission did you have to
raise your voice to be heard by another crew member:
a. between FD and MD? 50 95 10 80 90 90
b. on the same deck? 25 0 10 20 30 20
c. between MD and SH? 100 * 100 * * *
S11. During what percentage of the mission did noise
interfere with your ability to concentrate in the:
a. Orbiter? 0 0 0 10 20 10
b. SpaceHab? 0 0 0 30 N/A 10
S12. During what percentage did noise interfere with your
ability to relax in the:
a. Orbiter? 0 90 0 N/A 40 N/A
b. SpaceHab? 0 N/A 0 N/A N/A N/A
S13. During what percentage of the mission did noise interfere
with your ability to monitor the a/g loop in the:
a. Orbiter? 0 30 0 20 30 20
b. SpaceHab? 0 30 0 40 30 30
S14. During what percentage of the mission did noise interfere
with your ability to monitor the speaker in the:
a. Orbiter? 0 30 0 20 30 20
b. SpaceHab? 0 30 0 40 30 30
Yes or No
S15. Was any source/payload particularly loud or irritating?
If so, please state the source(s). Y Y N Y Y Y
S16. Did noise wake you up? (Please state the source) N Y N Y Y N
S17. Did noise result in: a. fatigue? N Y N N Y N
b. headaches? N N Y N Y N
c. ringing ears? N N N N N N
S18. Did noise cause you to have difficulty hearing a caution
or warning alarm? N N N N N N
S19. Did noise interfere with your performance on a task?
Briefly explain when and how it interfered. N N Y N Y Y
*No rating prompted by this statement

SPACE SHUTTLE ORBITER - Goodman
Chapter IV - 51
7. FINAL ORBITER ACOUSTIC REQUIREMENTS
In November 1993, new revised acoustic requirements for the Space Shuttle Program were presented [31]. In 1994 these new requirements were formally approved as an updated revision to the NASA Design Standard 145 applicable to the Space Shuttle Program [32]. The revision included the definitions of continuous and intermittent noise previously described, new continuous limits for Space Shuttle habitable volumes (both Orbiter decks, and Spacelab), new continuous noise limits for payloads, and new intermittent limits for payloads. Basically the prior flight deck limit was changed to be the same as the mid-deck limit, and the Spacelab or attached manned payloads were made to have the same limits as the mid-deck. Also, any payload located in these three areas now had the same limits. Most of the change was a result of prior efforts and follow-up actions resulting from the Headquarters AWG. Figure 60 and Figure 61 present the new continuous limits for the Shuttle habitable volumes and equipment, respectively. Revised intermittent A-weighted sound pressure level limits for Space Shuttle hardware are summarized in Table 11. Renewed efforts were made to review and reduce loud, “bad actors” in Orbiter, GFE, and payloads to ensure adherence to the new acoustic limits [33].
Figure 60. Continuous acoustic limits for Shuttle habitable volumes.
Figure 61. Continuous acoustic limits for Shuttle equipment.
During JSC AWG discussions of the new standard change to the continuous limits for
habitable volumes, it was considered using the worst case Orbiter mid-deck levels based upon the fleet measurements shown in Figure 51 as the new limits. This was determined ill-advised because of the status of payloads that existed at that time. Noise control was still not “designed into” a majority of the payloads and the Space Shuttle Program would continually be processing waivers. It would have been the way to try to get a quieter vehicle, but it was felt to be impractical.
Octave Band Center Frequency, Hz
So
un
d P
res
su
re L
ev
el,
dB
40
45
50
55
60
65
70
75
63 125 250 500 1000 2000 4000 8000 OASPL dBA
.
Octave Band Center Frequency, Hz
So
un
d P
res
su
re L
ev
el,
dB
40
45
50
55
60
65
70
75
63 125 250 500 1000 2000 4000 8000 OASPL dBA
.

NASA/SP-2015-624 – ACOUSTICS AND NOISE CONTROL IN SPACE CREW COMPARTMENTS – Goodman & Grosveld
Chapter IV - 52
Table 11. Revised intermittent acoustic limits for Shuttle hardware.
A-weighted SPL* [dBA]
Maximum Allowable Duration**
55-60 8 hours
61-65 4 hours
66-70 2 hours
71-75 1 hour
76-80 5 minutes
81-85 1 minute
86 and above Not allowed
* A-weighted Sound pressure Level, dB re 20 μPa. Measured at 0.3 meters distance from the noisiest surface with equipment operating in the mode or condition that produces the maximum acoustic noise. Round dBA to the nearest whole number. ** Per 24-hour period.
Payload managers were willing to attempt to reduce the noise generated by payloads, but it
was more difficult and costly to modify hardware and implement noise control measures after a design had already been completed. Unfortunately attitude still prevailed with some payloads that it was too difficult to design quieter payloads. The Acoustics Lead enlisted more support of payload testing using the JSC acoustic testing facilities. The acoustician who ran the testing in the facilities helped with potential quieting efforts whenever possible. However, as a result of the pressure from the Headquarters AWG and NASA Shuttle Program management, payload acoustic testing results were made available earlier and payloads representatives emphasized payload compliance with their hardware limits for missions.
8. NOISE CONTROL DESIGN APPLICATIONS FOR EXTENDED DURATION ORBITER (EDO) MISSIONS
EDO missions were designed to be up to twenty-eight days in duration. Design efforts started in 1989 for missions to take place in mid-1992. At a March 1989 EDO review a number of acoustic concerns were identified and subsequently submitted to a May Orbiter CCB [34]. The longer EDO missions presented a number of concerns that would cause exacerbated acoustics: increased mission duration; working and resting in the same mid-deck areas during needed multi-shift operations; increased mid-deck experiments supported by new rack accommodations; increased housekeeping; and a more cramped crew habitable volume. At the CCB it was requested that new EDO hardware meet the limits that payload hardware was required to meet, as shown in Figure 46, rather than the “to be determined (TBD)” statement in the EDO review. The Orbiter Contractor performed major assessments and implemented noise control efforts to see how to best meet NASA’s intent. Noise control approaches were similar to those implemented during Orbiter development, with the exception that much more effort was spent in looking into and testing options to meet the requirements, expedited resolution of changes required, and testing to verify and ensure compliance. Although requested limits were not officially adopted, there were no debates on limits or impacts of noise control features, as occurred during OFT development stages. Prior experience with IMU mufflers, STS-40 problems, the Headquarters AWG emphasis, and Orbiter management support helped overcome previous forms of resistance and the lack of NASA and Contractor management support.

SPACE SHUTTLE ORBITER - Goodman
Chapter IV - 53
The four-tier sleep station, with added acoustic liners, was expedited for EDO and intermittent noise limits were changed from the original high levels in Design Standard 145.
The Orbiter was modified for EDO missions by adding two major systems: the Regenerative Carbon Dioxide Removal System (RCRS) and a new waste control system (WCS). The RCRS was a new hardware system used to replace the carbon dioxide removal system using lithium hydroxide canisters. It was installed in the lower equipment bay of the Orbiter and was plumbed into the air revitalization system previously described [35]. Figure 62 shows the RCRS package and sources and Figure 63 shows the RCRS location relative to the Orbiter air revitalization system [35].
Figure 62. RCRS package description and sources.
Its prime noise sources were a compressor and a high speed fan. Secondary noise sources included the repressurization gas flow, the vacuum cycle valve actuators, and the solenoid valves. NASA had previously expressed concern over the selection of the RCRS fan being the baseline Orbiter IMU fan because it was so loud, and the system would use two of these. The RCRS noise sources were both continuous and intermittent. Sound power data were obtained on these sources, and the attenuation of the CO2 removal bed was determined, as shown in Figure 64.
In the RCRS system vibration isolation was incorporated in the fan and compressor mountings, as part of the RCRS package design, with isolators as shown in Figure 65. Three mufflers were implemented as part of the RCRS package: a foam lined air inlet muffler (Figure 66); a foam lined outlet muffler (Figure 67); and a compressor outlet muffler (Figure 68). When

NASA/SP-2015-624 – ACOUSTICS AND NOISE CONTROL IN SPACE CREW COMPARTMENTS – Goodman & Grosveld
Chapter IV - 54
the Contractor could not fully comply with the new EDO limit, he proposed adding another inlet muffler that would allow compliance (Figure 69). An RCRC acoustic test was performed in OV-102 at NASA KSC in 1992. OV-102 test results for RCRS contributions in the Orbiter mid-deck fleet summary are shown in Figure 51 (note the curves for the RCRS pump on and off). The RCRS complied with its limits, although the EDO modifications had some margin to comply with the 68 dBA and associated limits because the vehicle was quieter than the OVEI limits, as shown in Orbiter fleet measurements (Figure 51). OV-105 was modified later and was flown as an EDO vehicle in 1995.
Figure 63. RCRS location in Orbiter and relative to Orbiter air revitalization system.
Figure 64. Noise attenuation of RCRS CO2 removal bed.

SPACE SHUTTLE ORBITER - Goodman
Chapter IV - 55
Figure 65. RCRS Component Vibration Isolators.
Figure 66. Air inlet Filter/Plenum Silencer.
Figure 67. RCRS air outlet muffler and bed material attenuation.
Octave Band Center Frequency, Hz
So
un
d P
ressu
re L
evel, d
B
30
40
50
60
70
80
90
31.5 63 125 250 500 1000 2000 4000 8000

NASA/SP-2015-624 – ACOUSTICS AND NOISE CONTROL IN SPACE CREW COMPARTMENTS – Goodman & Grosveld
Chapter IV - 56
Figure 68. Ullage-save compressor outlet muffler.
Figure 69. Added RCRS inlet muffler to meet OVEI.

SPACE SHUTTLE ORBITER - Goodman
Chapter IV - 57
The EDO WCS was a system that consisted of a waste compactor as an intermittent noise source. Noise was contributed by the compactor itself, the commode fan, the urine fan, and the liquid separator. Its location and design approach are shown in Figure 70. Noise attenuation of the commode bacteria/odor filter was measured, and it is believed that both fans were isolation mounted.
Figure 70. EDO Waste Control System (WCS) location and design approach.
9. DISCUSSION OF THE NOISE CONTROL EFFORTS
Early in Orbiter design, there was a limited attempt to utilize quiet fan technology into the Orbiter ARS cabin fans which did not work out, but other than that there was no emphasis to find or develop quiet noise sources. Some fundamental noise control pathway techniques or provisions were implemented in the original baseline Orbiter to manage the noise, such as: isolators to support fans and pumps; sound power testing of noise sources; analyses of predicted noise levels; barriers to block noise emitted from the three avionics bays; and sealing of all major leak paths. Except for these changes, noise control efforts were minimal. This was due to the problems previously discussed with resolving acoustic requirements, delays in performing studies and determining the impacts of remedial changes, and the failure to implement noise control measures to meet the set goals or requirements in a timely manner. Acoustic verification was not performed until the first spacecraft was at Palmdale, California

NASA/SP-2015-624 – ACOUSTICS AND NOISE CONTROL IN SPACE CREW COMPARTMENTS – Goodman & Grosveld
Chapter IV - 58
undergoing final checkout before delivery, which was very late in the process to take remedial actions. Noise control efforts were also affected by the posture of both the NASA and the Contractor management organizations, which were not considering the acoustics environment a significant enough concern to merit the impacts that were predicted. The Contractor indicated that the impacts to meet NASA standards would be significant and that the proposed limits were unnecessary. Numerous attempts to implement more effective noise control and to apply the NASA standard of NC-50 were unsuccessful, partly because of long delays in performing studies and determining impacts. The use of “goals” proved to be very disappointing, as there was little incentive or efforts to meet them at the time.
When high acoustic levels were discovered at Palmdale, technical personnel and astronauts who witnessed the final acoustic testing helped provide an impetus to fix the high level acoustic noise from the IMU fans. The noise control efforts that were readied (GFE IMU mufflers) were quickly sanctioned by management. It was fortunate that the GFE muffler approach did not involve a significant vehicle impact to incorporate. The resultant Space Shuttle Orbiter mid-deck levels were well above the NC-55 requirement, but they would have been much higher if the IMU cooling system would not have been quieted. There was also a basic lack of efforts to make changes based upon high predicted levels and to perform timely testing to verify that the flight test Orbiter complied with the limits (NC-55) in place. As a result, there was little time to make acoustic changes without significant design impacts. Noise control efforts improved with the addition of the four-tier sleep station and it was especially significant and proactive with EDO modifications. These modifications were well designed and the limits set were treated as requirements that had to be met. Resultant designs showed that with appropriate focus and sanctions of efforts, noise control can be very effective. STS-40 and Headquarters AWG efforts helped emphasize noise control at the time and both NASA and the Contractor managements changed to be more supportive of noise control.
During operational flights the addition of payloads produced significant noise control issues. Space Shuttle payloads came from Universities and some small companies around the United States, and other locations. The intent of payload management was to have low-cost development of hardware and testing. The AWG discussed requiring sound power measurements of payloads rather than sound pressure level testing to improve the analysis, and better determine the system acoustic impacts and acceptability of manifesting payloads hardware. This was categorically dismissed due to the significant impacts of this approach on payloads (testing for sound power was much more complicated and expensive than the use of an off-the-shelf sound level meter). As a result, requirements were set for sound pressure limits based on sound level meter testing at one foot distance and for data submittal at three feet. However, most payloads had limited experience or expertise with acoustic noise control, and noise control was not properly planned for in design/development, with the result that acoustic limits tended to not be “designed-in” or predicted, and acoustic levels were primarily determined after design completion and flight hardware testing. Payload acoustic compliance information before STS-40 was often submitted late in the flow for the mission they were manifested on. Payloads and payload management at JSC were resistant to meet the established limits indicating they were too stringent, costly, and too difficult to meet. After STS-40 when noise “hit-the-fan,” payloads became much more responsive. Some payloads

SPACE SHUTTLE ORBITER - Goodman
Chapter IV - 59
attempting to fix loud hardware faced the obstacle of trying to quiet hardware with designs that were difficult to quiet. Payloads did improve acoustically over time after STS-40 and the Headquarters AWG focus, and they increasingly took advantage of JSC acoustic testing and limited NASA sponsored consulting efforts. It was also found that oversight needed to be applied to ensure that individual payloads and payload complements complied with their limits, and that the scheduling of payload operations during a mission was sufficiently managed to preclude acoustic problems.
It was previously noted that continuous noise specification levels for the Space Shuttle were to be complied with at only one location in either the mid-deck or the flight deck. This allowed higher levels in other locations within the habitable volume, especially in a number of locations where crews spent more time. For example, the original 63 dBA and later 68 dBA specification levels were exceeded on the aft flight deck near air distribution outlets where flight crews spent a good deal time, as well as on the mid-deck near the forward avionics bay and in other areas. As a result, it was recommended that for ISS the acoustic levels needed to be controlled at all locations where the crew can be within the habitable volume. All recommended requirements for acoustics in Chapter 1 should apply throughout the crew compartment habitable volume.
Changes in the acoustic requirements to add definitions of intermittent and continuous noises and addition of specific limits for intermittent noise, depending on the time they were active was a significant step in limiting noise levels of intermittent noises to reasonable values, instead of the high limits previously imposed. Those limits were related to hearing loss and were not manageable for controlling noise in manned spacecraft.
Another important aspect of noise control during the development of the Orbiter, and the EDO efforts was the acoustics personnel involved from the Orbiter Contractor and NASA. The Contractor had a competent acoustics point of contact in their Structures and Dynamics group who oversaw modifications, developed acoustic plans, performed testing and analyses, worked with sub-contractors and design groups on internal acoustic efforts, and reported to the JSC AWG. The Contractor also had a counterpart to the NASA Acoustics Lead, who would attempt to expedite resolution of issues and noise control within his organization. Noise control features implemented in the crew compartment, especially those relating to EDO, were well designed and implemented. A good summary of this work is documented in Reference [5]. Some aspects of Space Shuttle Orbiter noise control are also discussed in publications [3] and [12].
The NASA Acoustics Lead was this author, who could only attend to acoustics and noise control on a part time basis, due to other duties. Since GFE crew equipment and limited payloads testing were performed at the JSC laboratory, some insight into the GFE and payload hardware acoustic problems were uncovered early. However, in general, remedial actions and consulting were very restricted, since visibility into payload designs was very limited, not requested, not really wanted. Where such expertise was applied it was very helpful, especially early in the design of the hardware. As a result of the Space Shuttle experience, emphasis was made during ISS development to provide an appropriate dedicated staff with oversight and the ability to perform acoustic testing of modules, payloads, and GFE, and to proactively support remedial actions to achieve compliance with requirements, where justified. For the first time, an acoustics office was formed for this endeavor on ISS.

NASA/SP-2015-624 – ACOUSTICS AND NOISE CONTROL IN SPACE CREW COMPARTMENTS – Goodman & Grosveld
Chapter IV - 60
It would be remiss to not discuss an important issue on Space Shuttle acoustics, one that continued into the ISS Program and today with commercial spacecraft, i.e. the adoption of the NC-50 continuous noise limit in the 1972 NASA Design Standard 145. The standard was generated because of problems with Apollo spacecraft, where acoustics was a continual issue over years. The standard was updated in 1991, but retained the NC-50 limit [36]. Both of these standards were applicable to all manned spacecraft programs, although any program had the option of documenting exceptions to the standards with rationale why these were required or deviated from. Quiet fan and pump technology was initiated by NASA after Apollo because of these acoustic problems, for use in future programs. NASA Standard 3000 and subsequent revisions all had NC-50 as the limit to be applied for manned spacecraft [37]. NASA-STD-3001 which superseded NASA-STD-3000 in January 2011 also specifies that NC-50 be used [38]. Since 1972 NC-50 has been the NASA standard with limits for all manned spacecraft. During the Orbiter development the NC-50 limit was continuously recommended by the AWG, the Space and Life Sciences Directorate, and was reaffirmed in 1975 independently by Bolt, Beranek, and Newman, a leading acoustics company [39], and in 1987 by CHABA/NRC [40]. In 1991, NC-50 was recommended by the medical representative of Space and Life Sciences to the AWG Chairman based upon previous rational that NC-50: prevented permanent hearing loss; caused minimal temporary hearing loss, if at all; permitted 90% speech intelligibility at five feet distance; provided no performance decrements; and was consistent with CHABA and other recommendations [41]. Human factors personnel evaluating STS-40, STS-50, and STS-57 also recommended that NC-50 be used, referencing the effects of higher acoustic levels on speech and communications, and the ability to relax and concentrate. There have been two main objections to NC-50 as a limit: (1) it is not required, and (2) it is too stringent and creates extensive design impacts. The above discussion, the previously shown crew surveys and comments, and mission reports based upon real flight experience with acoustic exposure during flight operations, and Chapter 1 have addressed and hopefully settled the first objection. As for the second objection, legitimate requirements justify reasonable design efforts and impacts. In Apollo and early Shuttle, limited emphasis or efforts were made to design or find existing hardware that would meet acoustic design standards. Efforts to ensure adequate crew communications, habitability, and safety are certainly of high importance in habitable spacecraft volumes. It was found that effective noise control can be accomplished on hardware, if there is determination to do so, if it is done early in the design cycle, and is performed by experienced personnel. Shuttle EDO hardware is a good example of incorporating noise control features early into hardware design. This was further demonstrated later in ISS, especially by European efforts on their modules [42]. Improved space compatible noise control materials and applications that make noise control more effective are now available.
10. CONCLUSIONS
Implementing effective noise control measures during the Space Shuttle Orbiter design/development was hampered by problems with the timely resolution of which acoustic limits to apply. All hardware items that contribute to the system need to have acoustic limits applied to control overall levels, in effect “go” or “no-go” limits. Acoustic limits need to be

SPACE SHUTTLE ORBITER - Goodman
Chapter IV - 61
“designed in,” starting in the early stages of the design phase of the vehicle. Establishment of acoustic requirements and noise control efforts were adversely affected by Contractor and NASA management attitude towards acoustics, strong opinions about excessive impacts to comply with requirements, and excessive time to determine the impacts. Noise control plans were not developed to ensure efforts were made throughout the design/development phases. Acoustic verification was not performed until the first spacecraft was at Palmdale undergoing final checkout, which was very late in the design process to take remedial actions. Noise control for EDO related efforts were very well done and proactive, because of flight experience, and primarily because problems experienced during STS-40 and follow-up NASA Headquarters AWG attention and focus.
The NASA Acoustics Lead level of attention to acoustics and noise control was part time, but to some extent effective in oversight of noise control efforts and payload acoustic compliance. There was lack of attention to individual payload designs for compliance because of limited resources and because the responsibility for payloads was with other NASA organizations, who for the most part did not see the need for or wanted any external oversight.
The lessons learned from Space Shuttle Orbiter acoustics and noise control efforts were to resolve and implement acoustics requirements early in the development of a manned habitable spacecraft, and pursue noise control early in the program to ensure compliance with the requirements. A noise control plan should be established which includes analyses, the testing of hardware and the proposed noise control measures. Focused attention needs to be applied to ensure noise sources are designed to be acoustically compatible with their use/operations in manned spacecraft, especially environmental control and thermal control systems hardware. Full-up systems tests should be conducted early in the program, time should be allowed for remedial measures to be implemented, and the program should have dedicated, experienced oversight of the noise control efforts. A small team of experienced acoustics personnel with the right type of management support can be of significant aid to hardware suppliers and save valuable time and costs in helping implement noise control in design, and supporting acoustic testing. Acoustic requirements and oversight needs to be appropriately staffed and handled by experienced acoustics personnel. Acoustic requirements need to control not only the overall system limits, but individual payloads, payload complements and other hardware as well. Acoustics personnel need to delegate or have oversight over each individual payload or other hardware that is manifested. Flight approved acoustic materials and techniques need to be developed and made available for noise control applications. Finally, it is important that management understands, supports, and sanctions early resolution of requirements and noise control efforts.
11. REFERENCES
1. MSC Design and Procedural Standard, Design Standard 145, Acoustical Noise Criteria, NASA Manned Spacecraft (MSC), 16 October 1972.
2. Letter 73MA2110, from Smith, Edward P., Chief Program Engineer Space Shuttle Program to National Aeronautics and Space Administration, 9 April 1973.

NASA/SP-2015-624 – ACOUSTICS AND NOISE CONTROL IN SPACE CREW COMPARTMENTS – Goodman & Grosveld
Chapter IV - 62
3. Goodman, J.R., Noise Control in Space Shuttle Orbiter, Proceedings of NOISE-CON 2010. Baltimore, Maryland. US Institute of Noise Control Engineering, 2010.
4. Hill, R.E., Space Shuttle crew module prior noise reduction efforts. Presentation to the Acoustics Noise Working Group. NASA Johnson Space Center, Houston, Texas, 1992.
5. Hill, R.E., Space Shuttle Orbiter Crew Compartment Acoustic Noise - Environments and Control Considerations. Report 94SSV154970. Rockwell International, Houston, Texas, 1994.
6. Goodman, J.R. and Grosveld, F.W., Part III – Noise Abatement Design. Safety Design for Space Systems. Ed. Gary Musgrave, Axel Larsen and Tommaso Sgobba, Elsevier Publishing Company, 2008.
7. Grosveld, Ferdinand W., and Goodman, Jerry R., Noise Control in Habitable Space Vehicles and Enclosures, Proceedings of the Third IAASS Conference, Rome, Italy, 21-23 October 2008.
8. Misoda, J. and Magliozzi, B., Fan and pump noise control. Hamilton Standard Division of United Aircraft, Windsor Locks, Connecticut, Contract NAS 9-12457, May 1973.
9. Goodman, Jerry, Cabin Noise Criteria Control , Presentation to Orbiter Management Review (OMR), 26 August 1974
10. Goodman, J.R., Cabin Acoustical Noise Criteria and Design Implementation. Presented to the Orbiter Configuration Control Board, July 1977.
11. Hill, R.E., Space Shuttle Crew Module Acoustic Noise Materials Applications and Test Results, Presentation to the Acoustics Noise Working Group, NASA Johnson Space Center, Houston, Texas, April 1992
12. Goodman, J.R., Acoustics inside the Space Shuttle Orbiter and the International Space Station. Proceedings of SAE 2009 Noise and Vibration Conference and Exhibition, St. Charles, Illinois, 2009.
13. Silveira, Milton, Results of OV-102 Acoustical Noise Test at NASA Kennedy Space Center. Memorandum from MA/Manager, Orbiter Project, 1 July 1980.
14. NASA, Orbiter Vehicle and Item Specification (OVEI) (MJ070-0001-1, Houston, Texas: National Aeronautics and Space Administration, 1973.
15. Piland Robert O., Evaluation of OV-102 Acoustical Noise Test at Kennedy Space Center. Memorandum from Director of Space and Life Sciences, 25 July 1980.
16. Willshire, Kelli F., “Shuttle Astronaut Survey” 1985 briefing, related to efforts in human response to vibroacoustic environments of space vehicles. Technical Memorandum 86316, NASA Langley Research Center, 1984.
17. Goodman, J.R., Crew Module Acoustical Noise Limits. Presented to the Orbiter Configuration Control Board, March 1988.
18. Goodman, J.R., Acoustical noise concerns with SLS-1 Mission payloads. Signed by Daniel Germany. Memorandum from Manager of the Orbiter and GFE Projects, 24 August 1990.

SPACE SHUTTLE ORBITER - Goodman
Chapter IV - 63
19. Goodman, J.R., Acoustical Noise Exceedance for SLS-1 payloads Animal Enclosure Module (AEM), and Orbiter Refrigerator/freezer (ORF), 19 April 1991.
20. Goodman, J.R., STS-40 Acoustical Noise Results and Summary. Signed by Daniel Germany. Memorandum from Manager, Orbiter and GFE Projects to distribution, 30 July 1991.
21. Koros, A, Chandlee, G., Adam, S. Goldsberry, B., and Bagian, T., Human factors assessment of STS-40/SLS-1, Section B, Objective and subjective measures of noise on STS-40/SLS-1. JSC-28514, NASA Johnson Space Center, December 1991.
22. Koros, Anton S., Adam, S., and Wheelwright, Charles D., Noise levels and their effects on Shuttle crewmembers’ performance: operational concerns, sixth annual workshop on space operation applications and research. Volume 2, 1992.
23. Goodman, Jerry R., Space Shuttle Orbiter acoustical noise briefing to Orbiter and GFE Projects Office, 19 September 1991
24. Stanton, E., Status of crew surveys and questionnaires to Acoustics Working Group, April 1992.
25. Godwin, L., Report on crew survey and questionnaires to Acoustics Working Group, 3 December 1991.
26. Goodman, Jerry R., Acoustics Working Group Specifications and Orbiter Elements Subgroup Status, Report to NASA Headquarters Acoustics Working Group, 4 December 1991.
27. Goodman, Jerry R., Specifications and Orbiter Elements. Report to NASA Headquarters Acoustics Working Group, April 1992.
28. Godwin, Linda, Spacelab/payloads Working Group, 21 April 1992
29. Koros, Anton S., Wheelwright, Charles D., and Adam, Susan C., An evaluation of noise and its effect on Shuttle Crewmembers during STS-50/USML-1. NASA Technical Memorandum 104775, National Aeronautics and Space Administration, Houston, Texas, September 1993.
30. Mount, Francis E., and Adams, Susan, Human factors Assessments of the STS-57 Spacehab-1 Mission. NASA Technical Memorandum 104802, 1994.
31. Goodman, J.R., New Acoustical Noise Control Requirements for the Space Shuttle Program. Briefing to the Space Shuttle Program Control Board, November 1993.
32. Space Shuttle Program Design and Procedural Standard, Design Standard 145A, NASA Johnson Space Center, 14 January 1994.
33. Goodman, J.R., S-86792A PRCB Action: Report Adherence to New Noise Control Specification. Briefing to the Space Shuttle Program Control Board, 7 November 1994.
34. Goodman, J.R., Acoustical noise control limits for EDO hardware. Briefing to the Orbiter Configuration Control Board, 2 May 1989.
35. Hill, R.E., Noise reduction efforts on EDO RCRS and WCS. Briefing to JSC Acoustics Working Group, 8 April 1992.

NASA/SP-2015-624 – ACOUSTICS AND NOISE CONTROL IN SPACE CREW COMPARTMENTS – Goodman & Grosveld
Chapter IV - 64
36. JSC Design and Procedural Standard, Design Standard G-41, Acoustic Noise criteria, NASA Lyndon B Johnson Space Center, 1 April 1991.
37. Man-System Integration Standard, NASA STD-3000, Volume I, Part A. NASA Johnson Space Center, 1995.
38. NASA Space Flight Human System Standard, Volume 2: Human Factors, Habitability, and Environmental Health, NASA-STD-3001, 10 January 2011.
39. Pearsons, Karl S., Recommendations for Noise Levels in the Space Shuttle. Bolt, Beranek and Newman, Job No. 157160, 1975.
40. CHABA: Guidelines for Noise and Vibration levels for the Space Station, NASA CR 178310. Committee on Hearing, Bioacoustics, and Biomechanics, Commission on Behavioral and Social Sciences and Education, National Research Center, Washington, D.C., 1987.
41. Baisden, Denise, Recommendations for noise levels - background continuous noise. Communication with J. Goodman, 11 November 1991.
42. Allen, Christopher S, and Denham, Samuel A., International Space Station Acoustics - A Status Report. AIAA 2011-5128, 41st International Conference on Environmental Systems, Portland, Oregon, 17 - 21 July 2011.

SPACE SHUTTLE ORBITER - Goodman
Chapter IV - 65
12. ACRONYMS
AEM Animal Enclosure Modules ARS Air Revitalization System AWG NASA Headquarters Acoustics Working Group CCB Configuration Control Board
CHABA Committee on Hearing, Bioacoustics, and Biomechanics
dB Decibel dBA A-weighted sound level in dB DFI Data Flight Instrumentation DFI Data Flight Instrumentation DPM Drop Physics Module DS Design Standard
DSO Detailed Secondary Objective EDO Extended Duration Orbiter EMU Extravehicular Mobility Unit EVA Extravehicular Activity EVIS Ergometer Vibration Isolation System F5 Forward air outlet in main display console FWD Forward GBX Glovebox GFE Government Furnished Equipment Hz Hertz
IMU Inertial Measurement Unit
ISS International Space Station JSC NASA Lyndon B. Johnson Space Center KSC NASA Kennedy Space Center LSLE Life Sciences Laboratory Equipment NASA National Aeronautics and Space Administration NC Noise Criterion
NR Noise Rating NRC National Research Council OFT Orbital Flight Tests OPS Operational Flights Orbiter Space Shuttle Orbiter OV Orbiter Vehicle
STS Space Transportation System STDCE Surface Driven Convection Experiment

NASA/SP-2015-624 – ACOUSTICS AND NOISE CONTROL IN SPACE CREW COMPARTMENTS – Goodman & Grosveld
Chapter IV - 66
This page intentionally left blank

CHAPTER V
ACOUSTICS AND NOISE CONTROL IN
INTERNATIONAL SPACE STATION
Jerry R. Goodman
Ferdinand W. Grosveld
CONTENTS
1. INTRODUCTION ...................................................................................................................... 12
2. MANAGEMENT, OVERSIGHT, AND SCOPE OF ACOUSTICS OFFICE EFFORTS ......................... 14
3. ACOUSTIC REQUIREMENTS .................................................................................................... 16
3.1 Resolution of Basic Sub-Allocations .............................................................................. 19
3.2 Segments and Modules Requirements ......................................................................... 20
3.3 Module Verification ....................................................................................................... 25
3.4 Payloads ......................................................................................................................... 26
3.5 Government Furnished Equipment ............................................................................... 27
4. CERTIFICATION OF FLIGHT READINESS PROCESS ................................................................... 28
5. MISSION SUPPORT: HARDWARE, MONITORING, MEASUREMENTS, TRAINING AND HEARING PROTECTION ........................................................................................................................... 29
6. RUSSIAN SEGMENT ................................................................................................................. 33
6.1 Functional Cargo Block .................................................................................................. 36
6.2 Service Module .............................................................................................................. 48
6.2.1 Service Module Configuration ............................................................................ 49
6.2.2 Service Module Efforts before Its First Flight ..................................................... 55
6.2.3 Service Module Noise Control Efforts Just Preceding and After the First Flight 71
6.2.4 Renewed Service Module Noise Control Efforts ................................................ 87
6.2.5 Summary of Service Module Efforts ................................................................. 101
7. U.S. MODULES IN U.S. SEGMENT ......................................................................................... 104
7.1 U.S. Laboratory ............................................................................................................ 104

NASA/SP-2015-624 – ACOUSTICS AND NOISE CONTROL IN SPACE CREW COMPARTMENTS – Goodman & Grosveld
Chapter V - 2
7.1.1 U.S. Laboratory Noise Control Measures ......................................................... 109
7.1.2 U.S. Laboratory Vacuum Exhaust System Noise Control .................................. 114
7.2 U.S. Airlock ................................................................................................................... 117
7.2.1 Airlock Depressurization Problem .................................................................... 118
7.2.2 NASA Noise Control Measures ......................................................................... 120
7.2.2.1 Russian Depressurization Pump ........................................................... 120
7.2.2.2 Added Inlet muffler .............................................................................. 123
7.2.2.3 Benefits of Noise Control Measures .................................................... 124
7.2.2.4 Airlock Noise Associated with Equalization Valves .............................. 127
7.2.3 Airlock Operations Not Associated with Depressurization .............................. 128
7.3 Node 1 ......................................................................................................................... 128
8. JAPANESE MODULES ............................................................................................................ 133
8.1 Japanese Experiment Module/Kibo Facility and its Modules ..................................... 133
8.2 H-II Transfer Vehicle Configuration and Hardware Contents ..................................... 135
8.3 Centrifuge Accommodation Module, Centrifuge Rotor, and Life Sciences Glovebox 137
8.3.1 Original Acoustic Allocations for the Centrifuge Accommodation Module, Centrifuge Rotor, and Life Sciences Glovebox Payloads .................................. 140
8.3.2 Centrifuge Rotor Design, Acoustic Limits, and Centrifuge Rotor-in-the-Centrifuge Accommodation Module ................................................................ 141
8.3.3 Life Sciences Glovebox ...................................................................................... 144
8.3.4 Centrifuge Accommodation Module, Centrifuge Rotor, and Life Sciences Glovebox Overview ........................................................................................... 152
9. EUROPEAN MODULES .......................................................................................................... 153
10. PAYLOADS ............................................................................................................................. 155
10.1 Minus Eighty-Degree Laboratory Freezer for International Space Station ................. 156
10.2 EXpedite the PRocessing of Experiments for Space Station Racks ............................. 165
11. GOVERNMENT FURNISHED EQUIPMENT ............................................................................. 168
11.1 Temporary Early Sleep Station .................................................................................... 169
11.2 Portable Electrical Equipment Kit ................................................................................ 175
12. DISCUSSION OF THE NOISE CONTROL EFFORTS ................................................................... 176
13. CONCLUSIONS ...................................................................................................................... 179
14. REFERENCES ......................................................................................................................... 181
15. ACRONYMS ........................................................................................................................... 189

INTERNATIONAL SPACE STATION - Goodman & Grosveld
Chapter V - 3
TABLES
Table 1. Examples of the Acoustic Office support efforts on ISS. ................................................ 17
Table 2. ISS continuous noise requirements for all modules, except those of the Russian Segment. .......................................................................................................................... 20
Table 3. ISS U.S. continuous noise requirements for payloads and EXPRESS sub-rack payloads. 20
Table 4. Russian Segment module limits for continuous noise for work and sleep. .................... 21
Table 5. ISS intermittent noise requirements for non-integrated GFE and payload racks. ......... 24
Table 6. Russian Segment maximum daily allowable sound levels in habitable volumes during the operation of additional noise sources as a function of exposure time. ................... 24
Table 7. Acoustic levels measured in the FGB, Increment 4, on 2 February 2002. ...................... 48
Table 8. Mir Acoustic Dosimeter reading from Mir-25/NASA-7, 11 August 1998. ...................... 58
Table 9. Systems with significant noise sources, preliminary list. ................................................ 63
Table 10. ISS flight rule related hearing protection requirements, based on 24-hour noise exposure dose. ............................................................................................................. 66
Table 11. Schedule dates for ISS Increments 1 through 34. ......................................................... 72
Table 12. Increment 1 and 2 acoustic dosimetry.......................................................................... 73
Table 13. Increment 6 acoustic dosimeter readings..................................................................... 81
Table 14. Dosimeter chronology Increment I through Increment 8. ........................................... 85
Table 15. SM noise levels Leq in dBA. ............................................................................................ 97
Table 16. Sound pressure level [dB] measurements in USL, Expedition VI, 3 April 2003. ......... 109
Table 17. Node 1 sound pressure level [dB] measurements, Expedition III, 29 September 2001 (Note: Specification values used in the table are for NC-50). .................................... 132
Table 18. Summary of MELFI tests, dates, locations, and configurations. ................................. 162
Table 19. EXPRESS muffler insertion loss data. .......................................................................... 168
Table 20. Expedition 8 TeSS measurements – 11 December 2003. ........................................... 174
FIGURES
Figure 1. ISS at Assembly Complete (May 2011 ULF6-STS-134). .................................................. 12
Figure 2. Overview of NAL and Acoustics Offices products, key teams and players, and scope of efforts. Abbreviations: USS-U.S. Segment; A/L-Airlock; RS-Russian Segment; SM-Service Module; FGB-Functional Cargo Block; DC-Docking Compartment; ES-European Segment; JS-Japanese Segment; JEM-Japanese Experiment Module; ELM-PS- Experiment Logistics Module, Pressurized Section; CAM-Centrifuge Accommodation Module; RSA-Russian Space Agency; ASI-Italian Space Agency; ESA-European Space Agency; CSA-Canadian Space Agency. ....................................... 16

NASA/SP-2015-624 – ACOUSTICS AND NOISE CONTROL IN SPACE CREW COMPARTMENTS – Goodman & Grosveld
Chapter V - 4
Figure 3. Early summary of ISS acoustic requirement documents for U.S. segments or modules. PIDS is Prime Item Development Specification. ........................................................... 21
Figure 4. ISS acoustic requirements for modules and payload complements (Shuttle limits for reference). .................................................................................................................... 21
Figure 5. ISS sound level meter (SLM). ......................................................................................... 30
Figure 6. ISS audio dosimeter. ...................................................................................................... 30
Figure 7. The SLM used in SM (left view) and in SM Kayuta sleeping quarters (Kayuta), Increment 1. ................................................................................................................. 31
Figure 8. Crew worn audio dosimeter (left view), and in fixed position in SM at central post.... 32
Figure 9. Early ISS hearing protection devices. ............................................................................. 33
Figure 10. From left: Soyuz, SM (Zvezda), FGB (Zarya) and Node 1 (Unity) mated together....... 35
Figure 11. FGB (Zarya) on-orbit and its crew compartment. ........................................................ 36
Figure 12. FGB systems layout with the Node 1 end on the right side. ....................................... 37
Figure 13. FGB layout and acoustic measurements taken at Khrunichev, 30 October 1997. ...... 38
Figure 14. FGB acoustic standoff locations. .................................................................................. 39
Figure 15. FGB acoustic standoffs. ................................................................................................ 39
Figure 16. Acoustic louvers installed in FGB. ................................................................................ 40
Figure 17. Close up of typical acoustic louver. ............................................................................. 40
Figure 18. FGB debris filter grid. ................................................................................................... 40
Figure 19. Debris filter fans attached to inlet plenum.................................................................. 40
Figure 20. One debris filter fan removed (fan hub showing, blades not very visible at other end). ............................................................................................................................ 41
Figure 21. U.S. FGB muffler, inboard face for covering dust collector. ........................................ 41
Figure 22. Outboard side of muffler for mating with FGB wall over dust collector grid, etc. ...... 42
Figure 23. Outboard side of muffler showing acoustic foam and Helmholtz resonators. ........... 42
Figure 24. Inboard corner. The blue-colored material is visco-elastic damping material. ........... 42
Figure 25. NASA FGB Air Filtration muffler, results of Helmholtz resonator testing. .................. 42
Figure 26. NASA FGB Air Filtration muffler, broad band insertion loss. ....................................... 42
Figure 27. Original Russian FGB muffler for dust collectors. ........................................................ 43
Figure 28. Installation of the Russian muffler in the FGB. ............................................................ 43
Figure 29. Acoustic measurements taken in the flight FGB module before launch, and then on-orbit during ISS Missions 2A, 2A.1, and 2A.2. ....................................................... 44
Figure 30. Improved FGB dust collector muffler. Inboard surface is shown with outboard surface of muffler facing dust collector fans. .......................................................................... 45

INTERNATIONAL SPACE STATION - Goodman & Grosveld
Chapter V - 5
Figure 31. The outboard surface (facing dust collector fans) of the improved FGB dust collector muffler. ....................................................................................................................... 45
Figure 32. Improved FGB dust collector mufflers on both sides of aisle. ..................................... 46
Figure 33. Location of FGB Muffler used to quiet ventilation fan noise. ..................................... 46
Figure 34. FGB Muffler used to quiet ventilation fan noise. ........................................................ 46
Figure 35. SLM panel locations in the FGB in Increment 4, on 2 February 2002. ........................ 48
Figure 36. SM (Zvezda) on-orbit. .................................................................................................. 48
Figure 37. Mir Space Station. ........................................................................................................ 49
Figure 38. Soyuz docked to the MIR Core Module. ...................................................................... 50
Figure 39. Areas of the pressurized SM and views of both ends of the crew compartment. ...... 51
Figure 40. SM plan view of operational flight acoustic measurement locations with equipment locations. ..................................................................................................................... 51
Figure 41. Profile view of the SM (“V” is the location of the Vozdukh). ...................................... 52
Figure 42. View of starboard air conditioner area (CKB), with panel cover installed. ................. 52
Figure 43. Configuration of air conditioner (CKB) hardware, with access panel removed. ......... 52
Figure 44. View of Expedition I SM starboard air conditioner with access cover removed. ........ 53
Figure 45. Vozdukh (CO2 removal system). .................................................................................. 53
Figure 46. SM fans. ........................................................................................................................ 53
Figure 47. Toilet compartment access door (left view) and view inside compartment (right view). ........................................................................................................................... 54
Figure 48. U.S. treadmill and bicycle ergometer installed in SM, views looking aft. ................... 54
Figure 49. Mir configuration and MAD measurement locations. ................................................. 58
Figure 50. SM test instrumentation layout. .................................................................................. 60
Figure 51. SM Acoustic Noise Survey, all systems except two refrigerators, Vozdukh, and other noise sources, Run 49a. .............................................................................................. 61
Figure 52. SM Acoustic Noise Survey, all systems except Vozdukh, and other noise sources, Run 49b. ...................................................................................................................... 61
Figure 53. SM noise survey. Comparison of one-third octave band spectra for significant noise sources. ....................................................................................................................... 62
Figure 54. Forward action plan for SM acoustic modifications. ................................................... 63
Figure 55. The 18 and 19 April 2000 Russian instrumentation locations for ground acoustic testing and the dBA readings at these locations. ....................................................... 69
Figure 56. The 18 and 19 April 2000 acoustics tests in the SM Complex Stand, all systems on. RM is the Russian microphone. .................................................................................. 70

NASA/SP-2015-624 – ACOUSTICS AND NOISE CONTROL IN SPACE CREW COMPARTMENTS – Goodman & Grosveld
Chapter V - 6
Figure 57. Increment 1 and 2 dBA sound level measurements (CPXK: Progress oxygen supply equipment). ................................................................................................................ 73
Figure 58. Air Conditioner/CKB wrapping. .................................................................................... 74
Figure 59. Increment 2 SLM acoustic measurements. ................................................................. 75
Figure 60. Increment 1 and 2 Kayuta SLM plots. .......................................................................... 76
Figure 61. Increment 1 and 2 Vozdukh SLM plots. ....................................................................... 76
Figure 62. Vozdukh cover fashioned by crew. .............................................................................. 77
Figure 63. Another Increment 2 Vozdukh cover. .......................................................................... 77
Figure 64. SM measured acoustic spectrum at measurement locations, Increment 5, 3 September 2002. ......................................................................................................... 80
Figure 65. SLM measurements in dBA at measurement locations, for three different Increment 6 measurement dates in 2003. ................................................................. 81
Figure 66. Variance in levels, at KT3 measurement point from Increment 6 through Increment 8. ................................................................................................................ 83
Figure 67. Variance in levels at SM measurement point KT5 (Vozdukh area) from Increment 6 through 8. ............................................................................................... 83
Figure 68. Variance in levels at SM measurement point KT7 (Kayuta) from Increment 6 through 8. .................................................................................................................... 84
Figure 69. Variance dBA in SM measurement points from Increment 1-8, which ended in April 2004. ................................................................................................................... 84
Figure 70. Starboard Kayuta with door off and bracketry and cable across door opening. ........ 86
Figure 71. Fish eye lens view of SM, looking forward. Later when Kayuta doors were installed and closed. .................................................................................................................. 86
Figure 72. The two left-hand photographs show typical vibration isolators for fans added during Increment 9. The right photograph shows a similar type of isolator not yet installed on Increment 13. ......................................................................................................... 87
Figure 73. Air conditioning system (CKB) quieting approach. ...................................................... 89
Figure 74. SM fans; Highlighted fans have vibration isolation and/or acoustic lining. ................ 90
Figure 75. Acoustic fan duct linings in fan inlet (left) and fan outlet (center) for Kayuta area, and padded register outlet (right photograph). ................................................................ 90
Figure 76. Fan vibration isolator. .................................................................................................. 91
Figure 77. Fan vibration isolator. .................................................................................................. 91
Figure 78. Fan, foam isolator pads and springs. ........................................................................... 92
Figure 79. Fan, foam isolator pads and springs. ........................................................................... 92
Figure 80. Fan foam isolator pad (brown) with spring not showing and absorbent pad. ............ 92
Figure 81. Fan with foam isolator and absorbent pad. ................................................................ 92

INTERNATIONAL SPACE STATION - Goodman & Grosveld
Chapter V - 7
Figure 82. Soundproof wrap on fan. ............................................................................................. 92
Figure 83. Soundproof wraps on fan installation. ........................................................................ 92
Figure 84. Another fan wrap/soundproofing wraps. .................................................................... 93
Figure 85. Isolator and soundproofing wrap. ............................................................................... 93
Figure 86. Fan soundproofing wrap, isolator, and acoustic absorbent pads. .............................. 93
Figure 87. Fan (not installed), with isolator pad and absorbent pad. .......................................... 93
Figure 88. Padded louver on Kayuta fan inlet. ............................................................................. 94
Figure 89. SM Kayuta control points in SPL over time. Courtesy, NASA, Jose Limardo-Rodriguez. ..................................................................................................... 94
Figure 90. Vozdukh fan. ................................................................................................................ 95
Figure 91. Hard cover. ................................................................................................................... 95
Figure 92. Soft cover. .................................................................................................................... 95
Figure 93. Soundproof covers. ...................................................................................................... 95
Figure 94. Hard air conditioner (CKB) cover (left), and benefits of adding this cover (right). ..... 95
Figure 95. Air conditioning (CKB) modifications-covers for compressor and lines (left), and white padded cover for fan (right). ....................................................................................... 96
Figure 96. SM Control point KT3 from Increments 14-16, (December 2006 - February 2008). ... 98
Figure 97. SM control point KT5 (near Vozdukh) from Increments 14-16, (December 2006 - February 2008). ........................................................................................................... 98
Figure 98. SM control point KT7 (starboard Kayuta) from Increments 14-16, (December 2006 - February 2008). ........................................................................................................... 99
Figure 99. Crew-worn dosimeter readings for 24-hour period over Increments 1 through 27. Hearing protection wear time is in red at right side of figure. ................................. 100
Figure 100. Crew-worn acoustic dosimeter readings for sleep, work, and Leq(24), Increments 1-26. ....................................................................................................... 101
Figure 101. U.S Laboratory being deployed by the Space Shuttle and crew compartment, Expedition IV. ............................................................................................................ 105
Figure 102. Initial USL acoustic levels and sources. Note: PPA stands for Pump Package Assembly; LT stands for low temperature; CCAA stands for Common Cabin Air Assembly; IMV stands for Inter-Module Ventilation; CHeCS stands for Crew Health Care System; and RWS stands for Robotics Workstation. ........................................ 106
Figure 103. USL overall module levels from ground testing, plus payload complement of NC-48. ................................................................................................................... 107
Figure 104. USL levels variance at various centerline rack bays along its length. ...................... 108
Figure 105. USL levels measured during Expedition II on 5 April 2001. ..................................... 109
Figure 106. CCAA fan installation in a rack (left) and the CCAA fan by itself (right). ................. 110

NASA/SP-2015-624 – ACOUSTICS AND NOISE CONTROL IN SPACE CREW COMPARTMENTS – Goodman & Grosveld
Chapter V - 8
Figure 107. CCAA noise control features: fan vibration isolation mount (left) and vibration isolation of the fan acoustic case. ............................................................................. 111
Figure 108. USL Environmental Control System. ........................................................................ 111
Figure 109. IMV fan (left) and internal configuration (right)...................................................... 112
Figure 110. IMV mufflers for fan. ............................................................................................... 112
Figure 111. AAA fan inlet and outlet........................................................................................... 112
Figure 112. AAA fan acoustic features (left), with foam inlet (right). ........................................ 112
Figure 113. PPA pump installed in its rack (left) and acoustic treatments on the rack door (right). ....................................................................................................................... 113
Figure 114. PPA hush kit tested and concept of implementation. ............................................. 113
Figure 115. Benefits of barrier type of enclosure tested. ........................................................... 114
Figure 116. VES tubing configuration in USL. ............................................................................. 115
Figure 117. Predicted acoustic levels for various USL payloads. ................................................ 115
Figure 118. Acoustic levels from VES testing in the USL without racks installed, December 1999. ........................................................................................................ 116
Figure 119. NASA acoustics, VES ducting transition approach. .................................................. 116
Figure 120. U.S. Airlock after assembly and CL for EVA operations. .......................................... 117
Figure 121. Airlock depressurization pump and muffler locations in the Airlock. ..................... 118
Figure 122. RDP mounts on pump bottom (left), and protruding through the inverted blue enclosure. .................................................................................................................. 119
Figure 123. RDP in its stowage box. ............................................................................................ 119
Figure 124. Top portion of the stowage box with fasteners to attach to the bottom part of the box. ..................................................................................................................... 119
Figure 125. One end view of the RDP installation within the lower part of its box. .................. 119
Figure 126. The other end of the RDP installation within the lower part of its box. ................. 119
Figure 127. Side view of the RDP within the lower part of its box. ............................................ 120
Figure 128. Locations of the four commercially available isolators used to quiet the U.S. Airlock RDP. View of one isolator is blocked by baseplate. .................................................. 121
Figure 129. Barry Controls 505 series vibration isolators. .......................................................... 121
Figure 130. Multi-layer enclosure for the Airlock Depressurization Pump Quieting Kit in the U.S. Airlock. ...................................................................................................................... 122
Figure 131. Layout of the Airlock Depressurization Pump Quieting Kit assembly. .................... 122
Figure 132. Airlock Depressurization Pump Quieting Kit in final configuration in the vehicle. . 123
Figure 133. Depressurization pump inlet heat exchanger/acoustic muffler. ............................. 123

INTERNATIONAL SPACE STATION - Goodman & Grosveld
Chapter V - 9
Figure 134. Sound power levels for the original and acoustically treated Airlock pump and inlet. .......................................................................................................................... 124
Figure 135. Estimated EL noise, with the CL-to-EL hatch open. ................................................. 125
Figure 136. Estimated EL noise, with the CL-to-EL hatch closed. ............................................... 125
Figure 137. Benefits of GFE inlet muffler on estimated EL noise. .............................................. 126
Figure 138. RDP acoustic levels in the Airlock. ........................................................................... 126
Figure 139. Results of integrated Airlock testing at the center of the EL, with GFE Depressurization Pump Kit, considering other noise sources in the EL. .................. 127
Figure 140. Acoustic measurements in Airlock........................................................................... 128
Figure 141. Node 1 (Unity) Module grappled by the Space Shuttle Remote Manipulator System (left) and the crew compartment interior, Expedition III (right). ............................. 129
Figure 142. Node 1, THC and IMV ducting. Mufflers are called silencers in the schematic (Courtesy, Roger Von Jouanne, MSFC). .................................................................... 129
Figure 143. IMV fan with inlet and outlet football type mufflers and Bisco® wrap on both sides of fan. ........................................................................................................................ 130
Figure 144. Acoustic silencer installed in inlet ducting to THC fan (CCAA fan). ......................... 130
Figure 145. Node 1 acoustic test results, July 1998. ................................................................... 131
Figure 146. Node 1 Acoustic measurement locations. ............................................................... 131
Figure 147. Node 1 average acoustic measurements, and since 2002. ..................................... 132
Figure 148. JEM/Kibo facility. ..................................................................................................... 133
Figure 149. Kibo, Pressurized Module (PM), during deployment (left) and its crew compartment (right). ....................................................................................................................... 133
Figure 150. The ELM-PS (left) and its location when mated to the PM (right). ......................... 134
Figure 151. JEM/Kibo PM and ELM-PS acoustic levels. .............................................................. 135
Figure 152. HTV configuration (top) and flight vehicle (bottom). .............................................. 136
Figure 153. HTV PLC cabin ventilation system (PCBM: Pressurized Common Berthing Mechanism). ............................................................................................................. 136
Figure 154. HTV1 Acoustic measurements taken 21 September 2009, and during ground tests in 2008. ..................................................................................................................... 137
Figure 155. CAM concept showing the cylindrical shaped CR (blue colored in figure), and LSG rack (orange colored) extended with habitat attached near center of module, and other racks. ............................................................................................................... 138
Figure 156. CAM size and layout. CR Rotor is the CR shroud outline shown without supporting structure in the bottom figure. LSG is the Life Sciences Glove box (in stowed position), IMV is the Inter-Module Ventilation, HHR is Habitat Holding Rack, and CCAA is Common Cabin Air Assembly....................................................................... 138

NASA/SP-2015-624 – ACOUSTICS AND NOISE CONTROL IN SPACE CREW COMPARTMENTS – Goodman & Grosveld
Chapter V - 10
Figure 157. Views of CR shroud and support structure in CAM. ................................................ 139
Figure 158. NASA-ARC CAM low-fidelity mock-up. The LSG is shown in a nearly stowed position, with its arm holes marked in red on the left. ........................................................... 139
Figure 159. LSG configuration for on-orbit operations, with the LSG deployed into the CAM aisleway. .................................................................................................................... 140
Figure 160. Centrifuge Rotor shroud outer shell, front side (left) and back side (right). ........... 141
Figure 161. CR analyses using CR as a point source in the CAM. ............................................... 143
Figure 162. LSG including WVA with Habitat or Cryo payload attachments. ............................. 144
Figure 163. Acoustic measurements locations during NASA testing of partial LSG and WVA. .. 145
Figure 164. Back view showing WV configuration (left). Photograph of the back of the WV (right). ................................................................................................................. 145
Figure 165. WV air flow diagram. ............................................................................................... 146
Figure 166. Additional WV air flow diagram. .............................................................................. 146
Figure 167. Rear view of the LSG, with access panels removed showing AAA and WV fan locations. ................................................................................................................... 146
Figure 168. WV fans operating at seven fan speeds. ................................................................. 148
Figure 169. Narrowband spectrum for WV fan, fan speed number 4. ....................................... 148
Figure 170. Some of LSG remedial measures shown in yellow, as used in IHI’s December 2004 testing. ...................................................................................................................... 152
Figure 171. MPLM being deployed. ............................................................................................ 154
Figure 172. Node 2 before flight. ................................................................................................ 154
Figure 173. Figure 121, Node 3/Cupola during deployment. ..................................................... 154
Figure 174. Figure 122 Cut-away sketch of Columbus module. ................................................. 154
Figure 175. Columbus module. ................................................................................................... 155
Figure 176. ATV vehicle on-orbit. ............................................................................................... 155
Figure 177. MSG payload. ........................................................................................................... 156
Figure 178. HRF payload. ............................................................................................................ 156
Figure 179. MELFI rack, frontal layout. ....................................................................................... 157
Figure 180. Outer metal Cold Box rack cover removed showing Brayton machine................... 158
Figure 181. Top portion of MELFI rack. ....................................................................................... 158
Figure 182. Multi-layer cover of the Cold Box (top left), acoustic foam added (top right), and then a multi-layer cover (bottom left). A Bisco® barrier was added to the back of the closeout panel (bottom right). .................................................................................. 159
Figure 183. Coolant tube routing, tubing and foam added to the MELFI rack (center), and a section of tubing wrap. ............................................................................................. 159

INTERNATIONAL SPACE STATION - Goodman & Grosveld
Chapter V - 11
Figure 184. MELFI during the ISS Expedition 13 flight. ............................................................... 160
Figure 185. Acoustic test microphone (Mic.) locations for MELFI. Each measurement was taken 2 ft from the MELFI rack surface, and there were no top or bottom surface locations. ................................................................................................................... 161
Figure 186. Narrowband elements found during MELFI testing. ............................................... 161
Figure 187. Summary of the benefits of acoustic measures/controls to MELFI at 85,000 rpm. 162
Figure 188. Summary of MELFI testing results at Microphone 1, performed in 2002 at 85,000 rpm. ............................................................................................................... 163
Figure 189. Summary of MELFI testing results at Microphone 2, performed in 2002 at 87,000 rpm. ............................................................................................................... 163
Figure 190. Summary of MELFI testing results at Microphone 4, performed in 2002 at 87,000 rpm. ............................................................................................................... 164
Figure 191. EXPRESS Rack Number I, with four add-on muffler designs (shown in red aside of them) developed by the ISS acoustics team. ............................................................ 166
Figure 192. CGBA payload front face, without mufflers. ............................................................ 167
Figure 193. CBGA prototype mufflers. ........................................................................................ 167
Figure 194. CBGA payload with Delrin® mufflers. ...................................................................... 167
Figure 195. Mufflers, view of the side facing the CBGA payload. .............................................. 167
Figure 196. PGBA muffler hole pattern. ..................................................................................... 167
Figure 197. PGBA Inlet muffler (left view), and exhaust muffler side. ....................................... 167
Figure 198. EXPRESS payloads with mufflers plotted against NC-40 curve limit. ...................... 168
Figure 199. TeSS Fibrelam® structure with integral hinges (white colored) are shown in left view, and a typical hinge is shown in the right view. ......................................................... 170
Figure 200. Microphone setup and test configuration for TeSS................................................. 171
Figure 201. Microphone setup exterior to TeSS. ....................................................................... 171
Figure 202. Test results, sound pressure levels measured inside TeSS. ..................................... 172
Figure 203. Noise reduction measured in TeSS test. .................................................................. 172
Figure 204. TeSS with doors open and crew working on laptop (left), and with closed doors (right). ....................................................................................................................... 173
Figure 205. Expedition 3 TeSS SLM measurements. ................................................................... 173
Figure 206. Expedition 8 TeSS measurements............................................................................ 174
Figure 207. 120 VDC portable power strip. ................................................................................ 175

NASA/SP-2015-624 – ACOUSTICS AND NOISE CONTROL IN SPACE CREW COMPARTMENTS – Goodman & Grosveld
Chapter V - 12
CHAPTER V
ACOUSTICS AND NOISE CONTROL IN
INTERNATIONAL SPACE STATION
Jerry R. Goodman
Ferdinand W. Grosveld
1. INTRODUCTION
The International Space Station (ISS) is a complicated, sophisticated machine and a significant technological challenge considering all the modules and the plethora of operating equipment that were assembled and integrated to make it an on-orbit laboratory and long-term home for crews. Figure 1 shows the ISS and its modules at Assembly Complete.
Figure 1. ISS at Assembly Complete (May 2011 ULF6-STS-134).

INTERNATIONAL SPACE STATION - Goodman & Grosveld
Chapter V - 13
The resultant environment is challenging from an acoustics standpoint because of the multitude of noise sources, the relatively restricted volume for crew operations, co-location of the noise sources and crews, and the design complexities and operational repercussions of controlling an acoustic environment. Crew confinement over the mission duration is a long-term, continuous 24-hour-per-day affair unlike typical workdays on Earth (nominally 8 hours at work, then time for recreation, rest, and sleep away from work, all in between free weekends). As noted in previous Chapters, it is important to maintain the acoustic environment in space operations at manageable levels so that crewmembers can remain safe, functional, effective, and reasonably comfortable, thereby ensuring that missions are safe and successful. A safe acoustic environment is one where crewmembers can communicate effectively and efficiently and hear warning alarms; where crewmembers can live without being agitated by noise and can rest without being awakened during their periods of sleep; and of course, where crewmember’s auditory organs will not sustain temporary or permanent hearing loss or other injury.
Some control of individual hardware or hardware systems is required to ensure the overall acoustic environment is maintained at acceptable levels. The challenge to regulate acoustics is further complicated by the fact that there are numerous suppliers of ISS hardware, including the International Partners (IPs), and three different types of hardware to monitor and control: modules, payloads, and Government Furnished Equipment (GFE). Suppliers of modules and equipment, and personnel working on the ISS are located in numerous countries, speak different native languages, have different cultures, and have varied experience and approaches with acoustics and noise control in spacecraft hardware.
A NASA Acoustics Lead (NAL) was established to oversee, coordinate, and manage all ISS acoustics efforts, including chairing of an Acoustics Working Group (AWG). The AWG acted as an advisory committee and was chaired by the NAL, who later formed and became manager of the Acoustics Office at NASA Johnson Space Center (JSC). The members of the AWG included representatives from the Acoustics Office and other NASA JSC disciplines, as will be discussed below. Some of the other organizations that were involved will also be discussed.
ISS acoustic requirements were created for the three categories—modules, payloads, and GFE—by the type of hardware involved. Establishing acoustic requirements for the three categories was an important place to start. The process feeds into the verification and certification testing of modules and hardware, and then into the broader ISS Certification of Flight Readiness (CoFR) process, which provides for review of acoustic compliance and comprehensively ensuring the safety of the crew, and ISS mission support. Mission support included providing measurement equipment to monitor and evaluate the acoustic environments, setting up measurements during missions, training astronauts to use measurement equipment, supporting all acoustics aspects of the missions, responding to developing real-time noise issues, and finally reporting and publishing the mission results. The primary purpose of these efforts was to ensure safe acoustic levels and crew exposures in a habitable environment, and was deemed very important because of high sound levels in the Russian Segment, especially in the Service Module (SM).
This Chapter describes the efforts and processes put in place to monitor and control the ISS acoustic environment from 1995 until 2006. The extent of acoustical control measures taken

NASA/SP-2015-624 – ACOUSTICS AND NOISE CONTROL IN SPACE CREW COMPARTMENTS – Goodman & Grosveld
Chapter V - 14
during the period is too broad to describe in detail here, so only a limited and varied selection is included with emphasis on ISS segments and some modules, payloads, or GFE. Efforts varied from providing consultation and assistance in design/development, materials or test support, and compliance testing, to actually supporting the design and fabrication in cases where difficulties or areas of concern were encountered. The Russian SM is discussed at length for several reasons: the significance of the SM as the primary place for ISS crew habitation early on and long term, because of its function as a control center, and because of its facilities (i.e., waste management and personal hygiene provisions, dining table, exercise treadmill and ergometer, and two sleeping quarters); and since the SM had unacceptably high acoustic levels and was the loudest module, it was the most significant acoustics challenge in the ISS—a situation that persisted for a long time. The SM required the most attention and considerable support efforts over the period covered in this Chapter.
2. MANAGEMENT, OVERSIGHT, AND SCOPE OF ACOUSTICS OFFICE EFFORTS
Several references describe the ISS acoustics efforts performed by the NASA Acoustics Office [1][2][3]. Reference [4] offers a stellar summary of past and current changes to quiet the SM, and the status of ISS acoustics. Reference [5] is an excellent paper on ISS noise exposure.
From 1996 until sometime in 1997, this lead author provided the acoustics support effort to the ISS through task agreements while working as a Space and Life Sciences Directorate (SLSD) civil servant, along with a contractor who ran the acoustics test facility at NASA JSC and with whom this author worked with on Space Shuttle acoustics and noise control. This author had worked as the NASA Lead on Space Shuttle acoustics from the beginning of the Orbiter design until 1995 during Space Shuttle operations. Based on Space Shuttle experience/lessons learned, an AWG was formed before an Acoustics Office was established. Responsibilities of this AWG will be covered later in this Chapter. A smaller NASA Tiger Team was formed with this author, the contractor referred to above, a part-time contractor who was an engineer from the Shuttle Program, and another engineer that worked GFE. This Tiger Team worked to develop ISS acoustics requirements, set up efforts for monitoring NASA’s GFE and payload compliance with acoustic requirements, worked with Boeing (NASA’s ISS Prime Integrating Contractor and provider of the U.S. Laboratory [USL], Airlock, and Node 1 Modules), and worked with IPs as consultants on their acoustics efforts. The Tiger Team efforts started with the testing and quieting of a Russian Depressurization Pump (RDP) that was to be used in the U.S. Airlock. The Tiger Team also reviewed the acoustic work of Boeing, its U.S. Segment Product Groups and Marshall Space Flight Center (MSFC), on the USL and Node 1. Early in 1997, ISS management approached this author to take over the acoustics role held by Boeing. This role was accepted and an Acoustics Office was setup at NASA JSC in the SLSD. This office was established to focus and manage ISS acoustics and noise control, ensure a safe and habitable environment in the ISS, review and verify acoustic designs, monitor and support ISS missions, and support acoustic testing of hardware. In this author’s experience, prior space programs lacked such focus and support. It was particularly important to the ISS to provide such a focus because of all the ISS acoustic challenges discussed in Section 1. Contractor staffing and support of this office was necessary to do its job, and ISS funding was obtained for this support.

INTERNATIONAL SPACE STATION - Goodman & Grosveld
Chapter V - 15
Initially, the Acoustics Office supported ISS only. The Acoustics Office was originally staffed by a civil servant/manager and supported by contractor representatives and consultants, when required. Johnson Engineering, a subsidiary of Spacehab Inc. (now Astrotech Corporation), provided the original contractor support, which was later provided by Lockheed Martin, as part of the Bioastronautics Contract when Wyle Laboratories was the Prime Contractor. For a limited time, some support of acoustic consultants and other personnel was also obtained from the National Space Biomedical Research Institute (NSBRI). Johnson Engineering personnel joined in the RDP quieting efforts, procuring hardware, helping develop acoustic specifications, and other Acoustics Office initiatives. The Acoustics Office performed the following tasks with its contractor and consultant support: generated acoustic requirements; provided expertise in acoustics and noise control; provided oversight and design support of modules, payloads, and GFE; shared information and lessons learned; participated in the design/development process of hardware, payloads, and modules; maintained an acoustics laboratory and hardware to perform acoustic emission testing and later taking over and running an acoustic testing facility at JSC; provided acoustic advice and consultation; developed acoustic materials and applications for noise control; maintained a supply of acoustic materials for noise control applications and support of customers; developed prototype noise control measures; provided materials information and samples to hardware manufacturers and IPs; supported Boeing efforts to predict ISS acoustic levels; obtained flight acoustic measurement hardware and generated procedures to perform on-orbit acoustic measurements; trained flight crews on the use of this; and performed ISS mission monitoring of measurements and support. The Acoustics Office also supported a selection of payloads that should be manifested together on future missions; evaluated the acceptability of acoustics from a flight readiness standpoint for each flight or for a group of flights (called an Increment or Expedition in ISS); and dispositioned acoustic waivers/exceptions. An Acoustics Office Charter, with agreement from the ISS Program Office, documented and sanctioned the Acoustic Office tasks listed above. The contractor staff was increased to support this effort. The NAL position was created with the ISS Program to: serve as a single point of contact for acoustics for the ISS Program; oversee and manage all ISS acoustics efforts; and chair the AWG, all technical interchange meetings with module suppliers and ISS module acoustic teams, and all other technical meetings on ISS acoustics. The NAL also held the NASA position of manager of the Acoustics Office when it was established.
An AWG had earlier been setup with NASA representatives from JSC key organizations. The AWG was formed following the precedent set for such a group in the Space Shuttle Program. The initial group was made up of representatives from the following organizations: the ISS Program Office; the Astronaut Office; the Payload Engineering & Integration (PE&I) Office; NASA’s lead flight surgeon; Boeing Acoustics; and the Safety, Reliability and Quality Assurance Office. Representatives from other areas were also included, as required, to cover agenda items. The functions of this group were: to serve as a focal point/voice for JSC Acoustics; review all aspects of the ISS acoustic environment and acceptability of non-compliant acoustic levels; review acoustic effects on the crew; determine safety issues related to acoustics; establish and resolve an individual or group position on concerns, waivers/exceptions, and provide recommendations to the ISS Program; and help perform acoustic oversight and support to the ISS. Much later, a representative from Boeing became a co-chair of the AWG and a partner in

NASA/SP-2015-624 – ACOUSTICS AND NOISE CONTROL IN SPACE CREW COMPARTMENTS – Goodman & Grosveld
Chapter V - 16
managing AWG efforts over time. The Acoustics Office and Boeing integrated and performed most of the technical acoustic work, and presented it to the rest of the AWG for review and disposition. Later, the ISS PE&I Office hired an acoustics specialist and joined in presenting payload status to the AWG. Figure 2 provides an overview of the NAL and Acoustics Offices products and scope of efforts.
Figure 2. Overview of NAL and Acoustics Offices products, key teams and players, and scope of efforts. Abbreviations: USS-U.S. Segment; A/L-Airlock; RS-Russian Segment; SM-Service Module; FGB-Functional
Cargo Block; DC-Docking Compartment; ES-European Segment; JS-Japanese Segment; JEM-Japanese Experiment Module; ELM-PS- Experiment Logistics Module, Pressurized Section; CAM-Centrifuge
Accommodation Module; RSA-Russian Space Agency; ASI-Italian Space Agency; ESA-European Space Agency; CSA-Canadian Space Agency.
Special focus and efforts were marshalled to help salvage or remedy the situation at times when ISS modules or hardware items were in need of help with design, testing, or consultant support, or in serious non-compliance with requirements. Examples of these efforts are listed in Table 1. These efforts supported the ISS Program and, where applicable, helped quiet the hardware to obtain compliance or lower emissions. Further description and discussion of some of these efforts will be covered later in this Chapter.
3. ACOUSTIC REQUIREMENTS
Recommended acoustic requirements for habitable volumes and their importance were covered in Chapter I, Acoustics. The first step in the noise control process for the ISS was the development and implementation of acoustic emissions requirements to which the flight hardware must comply. The acoustics requirements used in the ISS, including continuous and intermittent limits, have been previously well documented [1][2][10][11][12][13].
Teams
• Acoustics Office/SF22
• Boeing Environments (Modules)
• Boeing PE&I (Payloads)
• Acoustic Working Group (AWG)
Products
• Acoustic Requirements
• SRP and ISS Support
• Acoustic Testing/On-Orbit Predictions
• On-orbit Monitoring and Training
• Acoustic Materials and Technology/Applications
• Vehicle Reviews and Support
• Acoustic “Fixing/Quieting” (limited)
Oversight / Assessment / Consulting
End-to-End Verification
Mission Assessment / Planning
RSA
ASI
CSA
ESA
NASDA
USS
RS
ES
JS
USLab, Node 1, A/L
SM, FGB, DC
Columbus, Nodes 2 & 3
JEM, ELM-PS, CAM
Non-Integrated
ISS Acoustics Overview (and how support has evolved)
Segments & Modules
International Partners
PayloadsGFE
Integrated
Acoustics

INTERNATIONAL SPACE STATION - Goodman & Grosveld
Chapter V - 17
Table 1. Examples of the Acoustic Office support efforts on ISS.
Effort Purpose Ref.
Developed noise measurement procedures for testing ISS equipment and payloads
Establish standard procedures for testing of GFE and payloads, using Space Shuttle hardware experience base
Provided testing support of SM and FGB modules Help support testing with NASA equipment. Provide knowledge of vehicle design and Russian capabilities
Designed and tested quieting hardware for an Airlock Module depressurization pump and developed a heat exchanger muffler used in the U.S. Airlock
To help resolve unacceptably high acoustic emissions of pump and resultant high levels in the airlock without inlet muffling
[6]
Supported development of quieting approaches and tested the Human Research Facility (HRF) rack
Helped implement effective HRF noise control design and meet acoustic limits. Saved HRF funding by use of expertise and measurement equipment
[7]
Supported EXpedite the PRocessing of Experiments to Space Station (EXPRESS) rack development and testing, and developed flight muffler approaches
To resolve difficult non-compliance with selected EXPRESS payloads
Provided acoustic materials, acoustic measurement equipment, and support of Boeing USL payload vacuum line quieting
To help resolve USL design issue and provide acoustics expertise, acoustic materials, and testing capabilities
Supported design and testing efforts to quiet the Microgravity Science Glovebox (MSG), a German provided payload
Payload Program Manager requested help. Supported with acoustics expertise and flight approved materials
[6]
Performed significant testing on the Minus Eighty-degree Laboratory Freezer for ISS (MELFI) payload rack, a French payload. Provided design recommendations and materials to resolve high acoustic levels in the payload rack and acoustic materials for flight racks
Payload was seriously over its limits and into production
[8]
Suggested quieting approaches for modules, payloads, and GFE
Numerous examples, i.e., FGB remedial fixes standoffs and louvers, EXPRESS rack mufflers, Airlock depressurization pump quieting
Developed a U.S. muffler design for the Russian FGB to quiet loud fan assemblies and supported testing of it in the module
Russians agreed with NASA providing muffler option to help fix problem
[9]
Provided design/development, testing, and materials support of the first Temporary Early Sleep Station (TeSS) used in ISS
Part of team effort to expedite quiet sleeping quarters for ISS
Supported design efforts, design and management reviews, and testing efforts on the Centrifuge Accommodations Module (CAM), the Centrifuge Rotor (CR), and the Life Sciences Glovebox (LSG). Tested LSG prototype at NASA-ARC
Part of ISS team efforts on CAM, CR, and LSG. Acoustics was significant technological challenge
[6]
Provided acoustic measurement hardware and flight type instruments to the Russians for their acoustic testing, crew training, and mission support
Russians needed acoustic measurement equipment to support their remedial actions and testing on SM. They also needed SLM and dosimeters for training and flight hardware, the same type used by U.S.
Developed a quieting kit for potential use in quieting of the Russian Segment and provided the Russians with samples of U.S. acoustic materials
The quieting kit was a potential solution to implement remedial actions quicker in the SM. It was highly recommended by Increment 2 crew and a sponsored ISS Program action.
Provided test facilities and testing of numerous payloads and GFE items
Provided facilities and test expertise to save hardware suppliers funding, provide insight into payload acoustic status, and provide capability to help remedy acoustic problems found
Supported payload conferences with acoustic consultation and design support
Payloads needed advise on design problems, recommended fixes, and materials samples

NASA/SP-2015-624 – ACOUSTICS AND NOISE CONTROL IN SPACE CREW COMPARTMENTS – Goodman & Grosveld
Chapter V - 18
Three basic criteria should be met by the acoustics levels throughout the ISS: (1) they must not present a health hazard to the crew; (2) they should not present significant impact or degradation to crew performance and operations; and (3) they should provide a habitable, comfortable work, rest, or sleep environment. Crew health hazards of most concern are temporary or permanent hearing loss, although other psychological or physiological effects can be significant. Crew performance concerns include the inability to effectively communicate and understand what is being said or what is happening around them (e.g., intelligibility, speech interference, or inability to hear alarms or other important auditory cues such as equipment malfunctioning, inability to concentrate, or strain of vocal cords, and degradation of situational awareness). Also of concern are any resultant negative effects on crew operations or efficiency.
As indicated in Chapter 1, acoustic noise requirements need to be established early in a program, and be treated as true requirements. Procedures that assure compliance with the requirements need to be established and implemented. Establishing this framework was one of the first priorities the NAL and Acoustics Office had for the ISS Program. The Manned Spacecraft (MSC) Design Standard 145 [14], referred to previously in Chapter 1, specified integrated systems levels only, and did not effectively sub-allocate requirements to hardware that made up the system. As a result, some individual hardware items used the system’s limits for lack of any definition of hardware requirements and because these limits had higher levels and were easier to meet. To ensure that the overall full-up system noise was controlled, it was determined that all elements contributing to the system’s noise had to have appropriate limits; i.e., acoustic requirements sub-allocated to individual hardware items.
Experience has shown that one always has to deal with precedents set in prior programs such as the Space Shuttle Program, and justify why limits should be changed. Shuttle experience led toward recommending that NC-50, the limit in the NASA Design Standard 145 [14], be met for all ISS systems. Also, ensuring that limits be assigned for the individual hardware items to act as “go, no-go” limits, and for necessary groups of like equipment such as payloads. In the Space Shuttle, the resistance to using NC-50 early during the program was based upon opinion and there was not much flight data or experience to say that NC-50 was necessary or practical to meet. As a result of Space Shuttle missions (Chapter IV), there was significant operational experience, crew surveys, and reports supporting the need to implement NC-50. Operational experience such as that gained during Space Transportation System (STS)-40 and other missions associated with the higher acoustic levels provided good reason to implement lower acoustic limits. In the ISS, difficulties were dealt with in trying to levy acoustic limits of NC-50 for overall module levels and NC-40 for payloads, and in determining what to levy for a complement of payloads. At the time, the USL could have up to 10 payloads manifested and in use. The capability to meet NC-50 limits in modules had not been demonstrated very well, although there was limited success in quieting some payloads in the Orbiter, and Extended Duration modifications for the Orbiter. Demonstrations of acoustic limits (NC-50, NC-52, etc.) were set up with representatives of the ISS Program, Astronaut Office, ISS Safety, and Boeing. Crew representatives strongly preferred NC-50 as an overall limit. The NAL, in a subsequent ISS briefing, expressed there was “no ownership of acoustics as an integrated system nor apportionment of requirements to hardware or payloads” and that specifications needed to be upgraded to add definitions, additional specification levels, and other information

INTERNATIONAL SPACE STATION - Goodman & Grosveld
Chapter V - 19
[15]. Space Shuttle lessons learned were discussed: “acoustic noise requirements must be set up early in the program, steadfastly maintained, and given high priority by NASA and Contractor management. Emphasis should be on compliance and design/testing to ensure it.” As a result, efforts were focused on resolving acceptable acoustic limits for all types of ISS hardware and procedures for implementing them.
3.1 Resolution of Basic Sub-Allocations
As noted previously, studies and assessments during the Space Shuttle development and early ISS Program indicated that NC-50 was a good limit for full-up module systems. However, the overriding view was that module suppliers in the ISS were not providing or controlling the payloads or GFE, and therefore should not be responsible for ensuring NC-50 compliance with inclusion of this hardware. Generally, it was proposed to limit payloads to NC-40 individually and to adopt a module complement limit for payloads of NC-48. This was agreed to and implemented. As a result, full-up continuous integrated systems noise became controlled to the combination of NC-50 for modules plus the NC-48 for the payload complement. The NC-50 and NC-48 combination is termed herein the NC-52 total specification. This results in a derived systems limit curve of this combination, which carries a value equivalent to 60 A-weighted Overall Sound Pressure Level (OASPL), in dBA re 20 μPa (versus 58 dBA for NC-50). In 2003, the NC-50 plus NC-48 systems derived requirement was challenged as too restrictive, and the ISS Program asked an independent assessment team to review the ISS acoustic requirements to determine whether these indeed were too stringent and could be relaxed. This team’s response to the ISS was that current requirements are good and appropriate. These requirements have not been changed, but there always seemed to be questions about whether higher levels could be allowed to relieve impacts, or the pressure to use “design goals” instead of limits and, if so, what would this do to crew hearing loss and performance. During the CR, CAM, and the LSG efforts covered later in this Chapter, sub-allocations were considered again, and were of increased concern because of the unique hardware, location, and composite configuration of the CAM with this equipment. Note that modules that carried no payloads had to meet the NC-50 requirement, although management at times wanted to grant an increase in acoustic limits for these cases to the NC-52 level to ease module efforts.
The NASA Acoustics Office developed the original specifications for payloads and GFE in 1996. Then, all IP specifications for segments and modules were finalized. As most of the recommended acoustic limits are described in detail in Chapter I on Acoustics and in other referenced ISS documents in this Chapter, they will only be briefly described herein.
The acoustic requirements and the roll-up of the component acoustic requirements are different for the Russian Segment than for the U.S. and other IP Segments. The Russian modules were granted an exception to the ISS System Specification, SSP 41000R [16]. The NASA/RSA Joint Specification Standards Document for the Russian Segment Specification covers requirements for Russian modules [17]. It uses the most stringent GOST R 50804-95 (Russian Federal Standards) noise level requirements that are set for crews rest and sleep periods [18]. Most of the discussion will focus on the U.S. and other IP Segment requirements, which are based on the U.S. Noise Criterion (NC) family of curves.

NASA/SP-2015-624 – ACOUSTICS AND NOISE CONTROL IN SPACE CREW COMPARTMENTS – Goodman & Grosveld
Chapter V - 20
3.2 Segments and Modules Requirements
As noted previously, NC-50 was the limit for all modules except for modules in the Russian Segment. The SSP 41000R Systems Specification for the ISS states: “The integrated acoustic environment in habitable areas shall not exceed NC-50 criterion for noise sources averaged over any 10 second time interval [16].” The Segment Specification for the U.S. On-Orbit Segment had the same limits [19].
An early summary of acoustic limits for all ISS modules, except for those in the Russian Segment is shown in Table 2. Continuous noise sources are defined in ISS acoustic specifications as sources that operate for a cumulative total of more than 8 hours in any 24-hour period. All other noise sources that operate 8 hours or less are classified as intermittent noise sources. Payload continuous acoustic limits for individual payloads, and payload complements, and non-integrated GFE limits are shown in Table 3. Similar limits for the U.S. Segment modules that were derived from the basic requirements of SSP 41000R [16] are shown in Figure 3. Verification will be discussed later in this Chapter. The NASA/RSA Joint Specification Standards Document sets limits for Russian modules that are documented in Table 4 and are shown relative to NC curves in Figure 4 [17].
Table 2. ISS continuous noise requirements for all modules, except those of the Russian Segment.
Octave Band Module with Payloads Module without Payloads
Center Frequency [Hz]
NC-48 (payloads +NC-50 (module) [dB]
~NC-52 [dB]
NC-50 [dB]
63 69.4 + 71.0 73.3 71.0
125 62.4 + 64.0 66.3 64.0
250 56.4 + 58.0 60.3 58.0
500 52.0 + 54.0 56.1 54.0
1000 49.0 + 51.0 53.1 51.0
2000 47.0 + 49.0 51.1 49.0
4000 46.0 + 48.0 50.1 48.0
8000 45.0 + 47.0 49.1 47.0
dBA 60.0 58.1
Table 3. ISS U.S. continuous noise requirements for payloads and EXPRESS sub-rack payloads.
Octave Band
Payload Rack and Non-Int. GFE
Aisle-Mounted Payload
Payload Compliment
EXPRESS Sub-rack
Center Frequency [Hz]
NC-40 [dB] (SSP 57000)
NC-34 [dB] (SSP 57000)
NC-48 [dB] (SSP 57011)
Mod. NC-32 [dB]
(SSP 54000)
63 64 59 69.4 58
125 56 52 62.4 50
250 50 45 56.4 42
500 45 39 52 38
1000 41 35 49 32
2000 39 33 47 32
4000 38 32 46 32
8000 37 31 45 31

INTERNATIONAL SPACE STATION - Goodman & Grosveld
Chapter V - 21
Figure 3. Early summary of ISS acoustic requirement documents for U.S. segments or modules. PIDS is Prime Item Development Specification.
Table 4. Russian Segment module limits for continuous noise for work and sleep.
Flight duration over 30 days Octave-band Sound Pressure Levels [dB] A-weighted OSPL
Geo. mean [Hz] 63 125 250 500 1000 2000 4000 8000 [dBA]
Work 79 70 63 58 55 52 50 49 60
Rest 71 61 54 49 45 42 40 38 50
Figure 4. ISS acoustic requirements for modules and payload complements (Shuttle limits for reference).
Octave Band Center Frequency, Hz
So
un
d P
res
su
re L
ev
el,
dB
35
40
45
50
55
60
65
70
75
80
63 125 250 500 1000 2000 4000 8000
NC-52
NC-50
NC-48
NC-40
NC-55
NC-60
NC-65
NC-45
NC-52 Total SpecificationsNC-50 Module SpecificationsNC-48 Payload ComplementShuttle SpecificationsRussion Specifications
“R” is Requirement “V” is Verification

NASA/SP-2015-624 – ACOUSTICS AND NOISE CONTROL IN SPACE CREW COMPARTMENTS – Goodman & Grosveld
Chapter V - 22
As noted previously, ISS acoustic requirements for modules and their “integrated” GFE are defined by the System Specification for the ISS, SSP 41000R [16]. It is applicable to all ISS segments except the Russian Segment. The Russian Segment modules were granted an exception to the SSP 41000 NC-50 requirement. Note that the NC-50 limit applies to ISS “habitable areas.” The NC-50 criterion specifies limits for octave band frequency spectra, and is shown in Figure 4 and tabulated in Table 2. The word “integrated” GFE in this requirement was interpreted to mean integrated GFE that contributes to the nominal operating acoustic levels of the module, as part of the functioning module, as opposed to non-integrated GFE that has different functions than module ones, such as a vacuum cleaner or electrical power strip. Non-integrated GFE is governed by separate requirements as will be discussed in a later section. The Medium-rate Communications Outage Recorder (MCOR) is an example of an “integrated” GFE item that was a significant noise source in the operation of the USL module.
Another key issue was how to verify the module was meeting the requirement that the “integrated acoustic environment in habitable areas shall meet the NC-50” or Russian limits, and specifically where to verify this. As it turned out, the USL was verified only in the center of the laboratory, and it was much louder at one end than in the center, close to fans and pumps installed in racks, that were also away from the module centerline. This will be shown later in this text. The fact that Boeing used only the center of the laboratory was not discovered until after verification testing was completed, but it became a verification issue and one that needed resolution for all modules. NASA’s NAL position was that the center was not a reasonable location to verify levels in “habitable areas of a module.” USL levels are obviously louder at crew work stations for payload operations near payloads or near other high-level module sources, which were located away from the center of the module and its centerline. Later in meetings with the IPs, the team resolved key measurement locations to verify limits along the centerline length of the modules. Plans were made to use these locations for in-flight measurements to ensure a flight measurement was obtained that related to the ground measurement location. The Russians reported they had found ground testing values different from flight ones, and it was understood that ground testing may produce situations where testing is not representative of on-orbit conditions; i.e., equipment supported by isolators may be loaded or compressed during ground testing conditions, not free-floating as they may be on-orbit and create more structural-borne noise as a result.
The Italians and other European partners agreed to have module limits expanded from the centerline, up to 1 meter from rack surfaces. Periodically, on-orbit measurements were made with dosimeters in areas closer to racks where levels were suspected to be higher. The SM in effect was mapped to determine acoustic “hot spots” to advise the crewmembers to minimize their exposure at these locations. After modules were on-orbit, monitoring of levels throughout the modules was accepted by all parties. Measured levels were shared and published in the applicable ISS Increment Reports.
The U.S. requirement for sleep is that sleep compartments shall not exceed the NC-40, as shown in Figure 4, with octave band limits for NC-40 defined in Table 3 [16][20]. Also, the continuous broadband noise level shall not be less than NC-25.

INTERNATIONAL SPACE STATION - Goodman & Grosveld
Chapter V - 23
Russian requirements for sleep specify a limit with a contour 10 dB less than the Russian specification contour shown in Figure 4, with octave band limits defined in Table 4. The Russian specification defined this contour as equivalent to 50 dBA.
The Russian module limits for work and sleep periods defined in the NASA/RSA Joint Specifications, Standards Document are shown in Table 4 [17]. The limits that apply to Russian modules were Russian State Standards, which follow the International Organization for Standardization (ISO), rather than the American National Standards Institute (ANSI). The Russians signed up to be a partner in ISS based upon use of existing hardware such as used in the Mir Program. In Mir, significant noise-producing hardware was spread out within the complex of modules. For ISS, noise became a problem when this Mir-based hardware was congregated in the SM. Resultant SM acoustic levels exceeded Russian Standards that were accepted by ISS for the Russian Segment.
The individual noise source limit in the Russian Specification is noted to be: “Sound pressure levels in octave frequency bands during the operation of individual assemblies, instruments and acoustic noise sources must be 5 dB or lower than sound pressure levels specified in Table 6.5.4.1-1,” which is Table 4 in this section [17].
ISS module requirements discussed thus far are for “continuous” noise sources. Exceptions exist for some module high-level intermittent noise sources—e.g. the vacuum exhaust system—that were treated on an individual basis. Other exceptions and special modifications were generally considered in the AWG’s acoustic environment review and flight certification process. Since intermittent noise affects the overall acoustic levels and the crew exposure dosage, the flight acoustic dosimeters were used to pick up continuous noise, crew-to-crew and air-to-ground voice communications, and intermittent noise levels in the modules. Acoustic levels monitored by these dosimeters were therefore more representative of overall levels, and crew-worn dosimeter readouts provided time-weighted crew acoustic dosage wherever the crew ventured. These crew dosage readouts were used to understand levels crews were exposed to and to support the flight rules in determining the extent that hearing protection needed to be implemented.
Intermittent limits apply to U.S. payloads and GFE hardware and are provided in Table 5. There are no U.S. Segment module intermittent noise limits because these limits were thought to be implemented better on the payload and GFE hardware, which are either in defined locations in the modules or can be controlled by crew operations. Also, the module surrounds the crew and noise can come from a multitude of uncontrolled locations, such as inlet and outlet ventilation ducts.
The intermittent requirements and associated limits on crew stay time or occupancy, for the Russian Segment Specification Standards SSP 50094 [17], are as follows:
“When intermittent noise sources are present, the total daily cumulative A-weighted noise level in habitable volumes (including areas of limited crew stay time) cannot exceed the levels specified in Table 6.5.2.4.2-1. This equivalent level for crew activity shall not exceed 60 dBA.

NASA/SP-2015-624 – ACOUSTICS AND NOISE CONTROL IN SPACE CREW COMPARTMENTS – Goodman & Grosveld
Chapter V - 24
Permissible level increases in the table do not include voice-to-voice communication.” Table 6.5.2.4.2-1 is Table 6 in this Chapter.
Table 5. ISS intermittent noise requirements for non-integrated GFE and payload racks.
Maximal noise duration A-weighted Overall Sound Pressure Level [dBA]
8 hours 49
7 hours 50
6 hours 51
5 hours 52
4.5 hours 53
4 hours 54
3.5 hours 55
3 hours 57
2.5 hours 58
2 hours 60
1.5 hours 62
1 hour 65
30 minutes 69
15 minutes 72
5 minutes 76
2 minutes 78
1 minute 79
Not Allowed 80
Table 6. Russian Segment maximum daily allowable sound levels in habitable volumes during the
operation of additional noise sources as a function of exposure time.
Maximal exposure time (hours)
Permissible increase in exposure levels (dBA)
4 +3
2 +6
1 +9
0.5 +12
This meant that the maximum daily allowable exposure would be: 65 dBA for 4 hours;
70 dBA for 2 hours; 75 dBA for 1 hour; and 80 dBA for 30 minutes.
Another area that was problematic in relation to the module design limits was the duration of stay inside a Russian module when limits in Table 6 were exceeded. Shortening the stay within the Russian FGB and DC was the method used to accept higher than the specification limits. After this rationale was accepted for the DC, it was discovered that a crewmember slept in that compartment, which was contrary to the understanding about the manning of that spacecraft. It was difficult to predict situations that could occur where crews spend more time in a module than expected. Relative to the Russian limits on crew stay time or occupancy, crews never left the SM when acoustic limits were exceeded. Instead, crewmembers used hearing protection because occupancy was required for ISS operations. As a result, hearing protection

INTERNATIONAL SPACE STATION - Goodman & Grosveld
Chapter V - 25
was used during long-term operations. Such protection, as recommended in Chapter I on Acoustics, should only be worn for short-term operations, and only when justified. Hearing protection ended up being used to allow operations to continue, with various negative effects of wearing this hardware, and pushing the burden of maintaining a safe environment onto the crew.
It is important to note that the Russian requirements deal with the permissible increase in the overall system levels and thus are not applied to the hardware that affect the acoustic levels in the module. If several intermittent items are on-board, then there is no sub-allocation defined for individual hardware items. There were limits for individual hardware that produced continuous noise, discussed previously. The U.S. experience is that “go, no-go limits” for continuous and intermittent noise should be placed on individual payloads and GFE, so limits can be accommodated in the hardware design.
3.3 Module Verification
Verification is a key step in controlling acoustic levels in modules and hardware, and in confirming that levels comply with established limits. Initially, the ISS Program called for verification of acoustic compliance by analyses and documentation. In ISS, as in the Space Shuttle, sound pressure levels were used to define limits at a certain distance from the surfaces of racks or payloads, rather than the preferred method of using sound power. This was done because of the significant expense and difficulties in levying sound power measurements. NASA acoustics personnel met with Boeing representatives to discuss USL status and acoustic noise prediction [21]. NASA came away from the meeting very concerned as only analyses were used for predicting noise in the ISS U.S. Segment, without experimental verification. The USL was an example where the range of predictability was ± 7 dB. After the review, Boeing conducted a further uncertainty assessment of the predictability range, which showed the calculation should be shifted from a NC-55 center up to NC-60 with a +8/-6 dB range [22]. The reason for this was “the large uncertainties in the individual effective source sound power levels,” and “the sound pressure level (SPL) itself is dependent upon the uncertainties in the 27 source sound power levels” [22]. Note that errors were calculated for each of the eight octave band SPLs. NASA proposed that acoustic testing was a necessity, as it accurately measures the environment and validates the models, and should include available source data; i.e., sound power. Another broader concern was that other modules had integrated analyses as the primary means of verification, as noted in Figure 3. Working with the NASA Safety Review Panel, the NAL recommended to the ISS Program that acoustic testing be implemented to validate ISS acoustic models as early as possible [23]. At the onset, this was considered a debatable verification issue. Over time, it was agreed that testing needed to be performed on modules, payloads, GFE, and it became the prime method for verification. During NASA’s Space Shuttle testing of payloads, it was found that copies of the same manufactured payload could have significantly different acoustic profiles or levels, and hardware with even the same part number needed to have each unit tested for verification. Space Shuttle Orbiters also had different profiles and levels, as noted in Chapter IV. The differences between the same part numbers were a reason

NASA/SP-2015-624 – ACOUSTICS AND NOISE CONTROL IN SPACE CREW COMPARTMENTS – Goodman & Grosveld
Chapter V - 26
to recommend that replacement hardware units be compared in acoustic emissions with the units they replaced, to ensure that the acoustic levels/effects were managed effectively.
NASA had significant concerns about complete reliance on analyses for verification, about the degree of uncertainty in the verification, and about cases where the analyses used not very well founded assumptions, or where gaps existed in the expected knowledge. Also, Boeing used a certain type of analyses, but IPs were not bound to use the same type of analyses. Error bars were found to be larger depending upon the octave band frequency, which was affected by the type of analyses. Most of the time there was some form of systems or breadboard testing in the module or payload programs where acoustics could be measured without significant impacts, to provide early feedback/confirmation of analyses and minimize risk.
Testing of modules or payloads proved to be a wise approach. Similar issues of over-reliance on analyses came up later on the CAM, CR, and LSG in reviews with the Japanese. Uncertainty in acoustic prediction in the ISS USL is discussed in a later assessment [24]. Boeing analyses discussed in this reference reflected updates from module testing prior to delivery, and evaluated flight measurements for comparison. IPs used various analyses, and with the CAM/CR, for example, there was no proposed test to correlate data. The Russians working the SM indicated they needed to do testing to confirm and perfect their calculation methods. This was especially the case for the SM, which has numerous noise sources and is a very complicated design compared with other modules. Further discussions of analyses are covered in related subject sections of this Chapter.
3.4 Payloads
The ISS payload acoustic requirements are specified at several different levels of payload integration. The top-level requirement, NC-48, is specified for the integrated complement of payloads in a module. Such an overall payload acoustic allocation was considered necessary to reduce the risk of overall module acoustic exceedance. There was the concern that any one payload could exceed its NC-40 limit or, for that matter, the complement limit of NC-48. If the USL had six payload racks, and if each rack was at NC-40, the complement contribution would be assumed to be equal to NC-48. The complement is made up of aisle-mounted payloads and integrated payload racks, which have requirements at a composite level. In addition, payload racks are made up of sub-rack payloads, which have their own requirements. This requirements break-out is designed to accommodate the number of payloads that needs to be managed, and the number of organizations involved. For example, a payload rack facility may be designed and built by one organization, yet several different independent experiments may be developed by different organizations to operate simultaneously inside the rack facility. The requirements described below were designed to provide sub-allocation limits for each hardware supplier to satisfy to assure the final integrated result is acceptable.
At the highest level of integration, the continuous noise generated by the total complement of payloads inside a given pressurized module is required to meet the NC-48 criterion. Originally, acoustic requirements were prepared as being applicable to both payloads and GFE. The payload requirements were split off from the GFE, were specified in the Payload

INTERNATIONAL SPACE STATION - Goodman & Grosveld
Chapter V - 27
Verification Program Plan, SSP 57011 [25], and are shown in Figure 4 and in Table 2. To satisfy this requirement, the results of all continuous payload emissions in a given module are evaluated for compliance at the center of the module. Originally, the U.S. Destiny Lab was the only module subject to this requirement in which payloads were routinely deployed or changed out. However, later on other modules had payloads to which this requirement was applied.
Payloads are routinely deployed in the Russian Segment, though they are not nearly as abundant as those installed in the other segments. The acoustic requirements for these payloads are given in SSP 50094 [17], but will not be discussed here.
The complement of payloads in a given module is made up of payload racks and aisle-mounted payloads. According to the Pressurized Payloads Interface Requirements Document SSP 57000 [26], payload racks and aisle-mounted payloads are required to meet the NC-40 and NC-34 criteria, respectively, for continuous noise emissions at a distance of 0.6 m (2 ft) from the loudest point on the hardware. Both of these types of payloads are also subject to intermittent requirements that are the same as those described for non-integrated GFE, except there were originally more breakdowns of times and allowable levels defined for payloads. The intermittent noise requirements are based on the A-weighted OASPL, in dBA, and depend on the length of time in any 24-hour period that levels are generated exceeding NC-40. This time is denoted the “maximum duration” for intermittent operations. These intermittent requirements are given in Table 5. The NC-40 and NC-48 curves are shown in Figure 4 and all payload-related limits are listed in Table 3. Additional requirements are included in SSP 57000 [26] to limit acoustic levels inside a rack. These requirements pertain to payload racks where the crewmember’s head is required to go into the rack, and are out of the scope of this Chapter.
As discussed previously, payload racks sometimes contain or are made up of individual experiments, which are referred to as sub-rack payloads. The acoustic requirements for sub-rack payloads are determined by the payload rack integrator, as the rack integrator is the responsible party for ensuring that the integrated rack meets the SSP 57000 requirements. Typically, the rack integrator will determine sub-rack acoustic requirements based on the rack subsystems and the expected sub-rack payloads so that the rack-level requirements will be met. Sub-allocation of limits for sub-racks was necessary to ensure racks complied, following the basic approach that individual noise sources need to have limits to ensure they will not impact the area to which they are sub-allocated. It is important that sub-rack payloads apply noise control principles and develop an acoustic noise control plan as discussed in Chapter II, Noise Control, and Reference [2].
A noise model is typically used to determine these sub-allocations. The EXPRESS rack requires their sub-rack payloads to meet a modified NC-32 criterion for continuous noise emissions at a 0.6 m (2 ft) distance from the loudest sub-rack payload surface. The values for this modified NC-32 curve are shown in Table 3.
3.5 Government Furnished Equipment
Work on specifications for GFE started in 1996 when the acoustic requirements for all NASA JSC GFE were reviewed. At that time, there were three specific areas of concern: the RDP (a GFE

NASA/SP-2015-624 – ACOUSTICS AND NOISE CONTROL IN SPACE CREW COMPARTMENTS – Goodman & Grosveld
Chapter V - 28
item in the U.S. Airlock Module), NASA’s treadmill, and the vacuum cleaner. Later, GFE was considered from a specification standpoint, in two categories from a vehicle standpoint: integrated or non-integrated. Integrated GFE was previously described. Non-integrated GFE means hardware items that do not directly contribute to the module systems part of overall acoustic levels, but are used for other functions on-board.
Non-integrated GFE items include hardware such as the vacuum cleaner or exercise equipment that are required for the crew or other support, yet are not required by the module to perform a necessary module function. The ISS acoustic requirements for non-integrated GFE are defined in JSC 28322 [27]. These requirements specify acoustic emission limits at a 0.6 m (2 ft) distance from the loudest point on the hardware in terms of continuous and intermittent noise. Boeing, as Prime Integrating Contractor for ISS, was provided non-integrated GFE acoustic levels to include the GFE contributions in acoustic flight predictions for modules.
As previously noted, continuous noise sources are defined in ISS acoustic specifications as sources that operate for a cumulative total of more than 8 hours in any 24-hour period. All other noise sources that operate for a cumulative total of less than 8 hours or less are classified as intermittent noise sources. The 0.6-m (2 ft) limit for continuous noise is the NC-40 curve and is provided in Figure 4 and defined by octave bands in Table 3.
As with payloads, the intermittent noise requirements are based on the A-weighted OASPL, in dBA, and depend on the total amount of time in any 24-hour period that the item will generate levels above NC-40. This time is denoted the “maximum duration” for intermittent operations. These intermittent requirements for GFE are provided in Table 5.
4. CERTIFICATION OF FLIGHT READINESS PROCESS
The Acoustics Office and AWG reviewed all aspects of the ISS acoustic environment, acoustic effects on the crew, and safety issues related to acoustics. In support of the CoFR process, the AWG reviewed the final expected continuous, intermittent, and impulsive noise in each module. These efforts were previously covered in Reference [2]. It was common practice to deal with hardware non-compliances early in the process, before the CoFR process and AWG review, as efforts were made to preclude or resolve problems. The Acoustics Office often acted as a resource to help hardware developers in this regard and worked to test and quiet many hardware items, with a few examples listed previously. Some of these efforts will be discussed in more detail below. Other organizations such as the MSFC acoustics team also helped hardware providers meet acoustic requirements, especially for ESA-provided modules. For most modules, acoustic testing was performed for verification to the greatest extent possible. On-orbit data for all modules was obtained after modules were added to the ISS, and monitored periodically after that to ensure levels stayed acceptable. For the modules where new or additional hardware was installed—in the USL, for example—the predicted noise and the method of prediction were reviewed. Safety Non-Compliance Reports (NCRs), and open or proposed waivers were also reviewed. Payload rack or complement waivers proceeded in the form of Preliminary Interface Revision Notices (PIRNs). These PIRNs were submitted when a payload rack did not meet its rack-level requirements, or when the payload complement did

INTERNATIONAL SPACE STATION - Goodman & Grosveld
Chapter V - 29
not meet its continuous noise payload complement requirement. When waivers or NCRs were reviewed, the AWG discussed the data and information, and developed a disposition on whether the levels were acceptable. The NAL, who chaired the AWG, had the ultimate responsibility for the hardware acoustic compliance and the acoustic levels on the ISS. In some cases, the NAL and AWG recommended that hardware fixes be implemented. In other cases, operational constraints were placed on some payload racks to limit the duration of the noise that they created, changes were made to the sequence of payload operations so as to preclude excessive levels for the payloads operating, or limits on payload operations were created because the number of power outlets in use was limited. In extreme cases, the NAL and AWG may have recommended that the hardware not be manifested on the ISS until the acoustic levels were reduced or the situation was resolved.
Several factors were considered in review of non-compliant hardware. These factors included not only the acoustic levels emitted by the hardware and their corresponding requirements, but other factors such as how many other hardware items were in operation during the same time period, and how long the hardware under question would be operating on the ISS. Many other possible factors were hardware specific, such as operational details, criticality of equipment, etc. Based upon careful establishment of the requirements, it was assumed that if the hardware met its requirements, it would be able to operate on the ISS according to those requirements. If it did not meet the requirements, it may still have been able to operate on the ISS, but there may have been constraints placed on its operation. Each item that did not meet requirements was reviewed for each ISS Stage, and decisions on these items were made. In some cases, hardware may have been approved to operate on a given Stage, but not on another because of changing conditions. To ensure payloads met their design requirements and avoided operational constraints, hardware providers needed to implement effective noise control in the design and development phase of the hardware.
Once the AWG established its position on the acoustic levels for a given Stage, this information was forwarded into the Space and Life Sciences Directorate CoFR process, since the Acoustics Office resided in this Directorate (the Directorate name has been changed to the Human Health and Performance Directorate). As part of this process, open items, issues, and concerns were addressed and then integrated into the ISS CoFR process. All waivers, exceptions and NCRs were dispositioned by the responsible ISS organizations. For example, NCRs were processed through the Safety Review Panel. PIRNs were reviewed through the PIRN Review Team (PRT) and then approved through the ISS Program Payload Control Board (PCB). All payload operational constraints were included in the PE&I Stage Analysis Report, which the Payload Operations Integration Center (POIC) used to coordinate payload operations.
5. MISSION SUPPORT: HARDWARE, MONITORING, MEASUREMENTS, TRAINING AND HEARING PROTECTION
Every attempt was made to ensure that hardware met its established acoustic limits. It was also important, as a final noise control measure, to determine the acoustic levels of modules by themselves, and of modules with all the hardware manifested and operating inside. This was to ensure that the acoustics environment was defined and that the levels and crew dosage were

NASA/SP-2015-624 – ACOUSTICS AND NOISE CONTROL IN SPACE CREW COMPARTMENTS – Goodman & Grosveld
Chapter V - 30
safe, compared with preflight acoustic levels, and monitored over time. Measurements to monitor the known high acoustic levels of the SM and the FGB module were specifically required, and both the U.S. and Russians crews were trained to take these measurements. Preflight assessments of module levels needed to be verified by flight measurements. New modules were added, and module hardware was changed over time, and new additions, change-out of payloads, or remedial actions to lower the noise levels, made it important to monitor acoustic levels over time. Acoustic measurement equipment was also required in the event of contingencies when unanticipated high levels would occur and the levels and spectral data could be used to assess remedial course of action.
Two types of measurement equipment were provided: sound level meters (SLMs) and audio dosimeters. SLMs were provided to determine the continuous acoustic levels/frequency spectra at predetermined locations throughout the modules and habitable volumes of the ISS. Care was taken during SLM measurements to ensure that voice communications or other intermittent noises did not occur. The SLM used was a Brüel and Kjær® (B&K) 2260 Investigator (Figure 5). The dosimeter used was an AMETEK® Mark I Audio Dosimeter (Figure 6). The AWG reviewed and sanctioned flight rules that were approved to limit the flight crew daily noise exposure, and dosimeters were provided to determine the noise exposure of each crewmember. The SLM readouts were scheduled once per month during the first four Expeditions [3], but the SLM could have been used at other times, if necessary. The Russians were provided with flight and training SLMs, and a joint Russian/U.S. measurement plan was established. As a result, the U.S. and Russian SLM on-board was the same instrument, and common procedures and training hardware were available for both countries (the Russian SLM was called the Russian Shumomer). Figure 7 shows the SLM used in the SM cabin and Kayuta areas.
Figure 5. ISS sound level meter (SLM).
Figure 6. ISS audio dosimeter.

INTERNATIONAL SPACE STATION - Goodman & Grosveld
Chapter V - 31
Figure 7. The SLM used in SM (left view) and in SM Kayuta sleeping quarters (Kayuta), Increment 1.
Current ISS dosimeter hardware (described in Reference [5]), which was implemented after the subject period in review, is different from this hardware described, and will not be covered in this Chapter. The data obtained from the original dosimeter measurements were in dBA over the specified period of time and used a 5 dB exchange rate. Dosimeter measurements included voice communications and other intermittent noises and, as such, represented actual acoustic levels on-board over a time-weighted period that was not registered by the SLM measurements. The original dosimeter shown in Figure 6 also had a SLM mode. This dosimeter was used in the Space Shuttle, and was updated to fly in the U.S./Russian Mir Program (flammability changes and a temperature decal was added for battery failure). Two types of dosimeter uses included: crew-worn to provide crew exposure dosage, and static measurements for use at selected measurement locations, which helped determine overall module levels at key locations. Figure 8 shows crew-worn and fixed-position dosimeter use.
As ISS evolved and new modules were added, crews traversed into these modules, so exposures measured included wherever the crews traversed and the effects of these environments on their exposures. During the first five Expeditions, the dosimeter measurements were scheduled twice per increment. Acoustic measurements were also made for several other reasons such as troubleshooting a mission acoustics problem, supporting resolution of design issues or effectiveness of noise-reduction measures such as sleeping provisions or remedial measures, or performing acoustical experiments. Acoustic data obtained were shared with all ISS IPs.
Acoustic hardware for flight, including hearing protection provisions, were provided in an Acoustics Countermeasure Kit. A good deal of effort was expended with establishing measurement procedures, preparing lessons for training and training of flight crews, and reducing flight data, analyzing the data, and publishing data and increment reports.

NASA/SP-2015-624 – ACOUSTICS AND NOISE CONTROL IN SPACE CREW COMPARTMENTS – Goodman & Grosveld
Chapter V - 32
Figure 8. Crew worn audio dosimeter (left view), and in fixed position in SM at central post.
Since acoustic levels were known to be very high in the original Russian SM and FGB, it was considered necessary to provide, as a priority, hearing protection on-board ISS. Originally, mission support also included the Acoustics Office determining hearing protection requirements for modules with high-level noise, testing of various potential options/provisions, and providing the initial hearing protection hardware for flight.
Hearing protection hardware was selected, and flight and training hardware was provided for initial flights. ISS acoustics monitoring and mission support was previously very well described in References [2] and [3].
Development of protective measures for the crews for use on ISS required development of flight rules to ensure safe levels were maintained, and hearing protection was worn when required. Two types of U.S. hardware were provided to cover initial Expedition crews: (1) hearing protection hardware, which provides hardware that protects crew hearing during nominal work day operations, sleep, rest breaks, and other periods (this hardware blocks the noise from entering the ear canal); and (2) communications equipment, which provides for effective, crew-to-crew, crew-to-ground, and ground-to-crew communications in a high ambient noise environment, with capability to also protect the crew hearing mechanism from excessive noise. Figure 9 shows the hearing protection and communications protective hardware provided in early ISS. Active Noise Control (ANR) was used on the headsets shown. In the SM, the Russians provided other headsets, primarily for air-to-ground communications.

INTERNATIONAL SPACE STATION - Goodman & Grosveld
Chapter V - 33
Figure 9. Early ISS hearing protection devices.
6. RUSSIAN SEGMENT
The FGB was the first ISS module put into orbit, and the Russian SM would soon follow. From 1995 until 1998, seven American astronauts spent nearly 1,000 days living in orbit with Russian cosmonauts on-board the space station Mir. American Space Shuttles rendezvoused ten times with the Russian space station Mir. The U.S participation was called "Phase 1 Mir program," the Shuttle-Mir Program that prepared the way for the ISS. The Phase 1 Mir program was important to the ISS in several ways: U.S. crews were included in Mir flights, and this author was involved with Russian counterparts working Mir on acoustics. The ISS Russian Segment module and equipment designs were based upon the Mir Core Module (also termed Base Block Module) and Mir equipment. This lead author became Principal Investigator of the Mir Audible Noise Measurement (MANM) experiment, which facilitated U.S.-Russian acoustic interactions for the ISS Program.
NASA participation in Mir was for seven specific missions, termed NASA-1 through NASA-7, starting in 1995 and ending in June 1998. During the NASA Space Shuttle mission STS-74 in

NASA/SP-2015-624 – ACOUSTICS AND NOISE CONTROL IN SPACE CREW COMPARTMENTS – Goodman & Grosveld
Chapter V - 34
November 1995, which occurred between NASA-1 and NASA-2, a NASA MANM experiment was conducted on-board the Mir with a NASA SLM and a NASA Mir Acoustic Dosimeter (MAD), an upgraded Shuttle dosimeter. For STS-74, SLM and MAD measurements were made in the Core Module, with readings as follows: Mir location 1, SLM=61.4 dBA, MAD=72.3 dBA; location 2, SLM=62.5 dBA, MAD=71.8 dBA; and location 3, SLM=65.1 dBA, MAD= 71.2 dBA [28]. Mir measurements and acoustics will be further discussed in Section 6.2 on SM. The difference between SLM readings and dosimeter readings were caused by the fact that the SLM readings are taken without voice communications and during steady-state acoustic levels, whereas voice and/or intermittent noise were present during dosimeters measurements.
One of the early ISS Technical Interchange Meetings (TIMs) held with RSC-Energia (RSC-E), the SM supplier, Khrunichev, the FGB supplier, and the Russian Institute of Biomedical Problems (IBMP) was held in June 1996 [29]. There was an agreement for NASA and Russian representatives to conduct further joint activities as part of medical monitoring to measure noise levels on Mir. NASA presented results of the MANM 1 at this TIM in Houston, Texas. There was agreement to approve the NASA Mir report.
At an August 1996 TIM, NASA requested the Russians to provide Mir data, as NASA dosimeter measurements taken on STS-74 did not fully characterize the acoustic spectrum, and were limited data [30]. NASA wanted to know the acoustic environment to which the crewmembers were exposed. IBMP and RSC-E concurred technically (at NAL and Russian counterpart levels) with providing Mir acoustic data and it was agreed to elevate the request to higher Russian and U.S. authorities. The NASA-2 Mir mission was in progress at that time. U.S. dosimeters were subsequently added to determine module levels and crew exposure dosage. Principal Mir noise sources were spread out in the various modules making up the Mir complex. NASA had concerns that Mir data indicated that Mir noise sources were now clustered together in the SM and would result in higher, problematic levels and crew acoustic doses. It became obvious that there were differences between U.S. and Russian approaches and attitudes toward exposure to higher-than-specification levels, and that the Russian side had significantly more experience with long-duration flights than NASA. The requested Mir acoustic levels from the Russian counterparts were not provided until almost a year later. The reluctance to provide these data created more concern. This author expressed strong concerns to NASA management that the acoustic levels in Mir should be identified so we would know what exposure our crews were being exposed to in Mir. When one NASA crewmember on the Mir Space Station experienced a Temporary Threshold Shift (TTS) due to exposure levels, NASA management became more concerned and there was more pressure to find out what the Mir levels were and to ensure that the SM did not result in a similar situation.
This author was also concerned by a published report on results of a Mir experiment, and hearing threshold impairments and what seemed like over-reliance on hearing protection to protect crews operating in Mir [31]. As a result of these concerns, in 1999, the director of Life Sciences at JSC visited the IBMP and documented medical findings with acoustics in which temporary hearing loss in Russian crewmembers after Russian flights was documented [32].
Other findings and concerns were also discussed, and included:

INTERNATIONAL SPACE STATION - Goodman & Grosveld
Chapter V - 35
The Russian medical experts reviewed cosmonaut hearing data from their experience of flying 50 cosmonauts on long-duration missions and 20 cosmonauts on two or more long-duration missions.
In this population, they found that 100% of the cosmonauts had “hearing fatigue” (temporary hearing loss) on audiograms obtained after landing (typically in the high-frequency range).
Fifty percent of the cosmonauts had complete hearing recovery to their pre-flight levels within 6 months of landing (particularly if they complied with the acoustic countermeasure program).
Approximately 30% of cosmonauts had persistent high-frequency hearing loss.
This information from IBMP and related Shuttle experience with high acoustic levels further elevated the concerns with acoustic levels in the ISS Russian Segment. The first ISS Expedition flight had the configuration of the mated FGB, SM, and Node 1, so initial major modules of the Russian Segment were inhabited. Crewmembers would be required to spend most of their time in the SM and FGB on initial ISS missions. Figure 10 shows these initial ISS modules joined together, with the addition of a docked Soyuz module (on the left side of the photograph). Only the acoustic efforts on the FGB and SM will be discussed here.
Figure 10. From left: Soyuz, SM (Zvezda), FGB (Zarya) and Node 1 (Unity) mated together.

NASA/SP-2015-624 – ACOUSTICS AND NOISE CONTROL IN SPACE CREW COMPARTMENTS – Goodman & Grosveld
Chapter V - 36
6.1 Functional Cargo Block
The FGB (Zarya) is pictured on orbit in an external view and internal, crew compartment view in Figure 11.
Figure 11. FGB (Zarya) on-orbit and its crew compartment.
It is believed that the FGB design-for-acoustics was first discussed in detail between the U.S. and the Russian side at the TIM held in Moscow in August 1996 [30]. Representatives at this TIM were: FGB supplier, Khrunichev; SM supplier, RSC-E; IBMP; and NASA.
NASA provided lessons learned from the Space Shuttle Program, and the FGB design was reviewed, as well as some SM items. NASA design recommendations on the FGB were as follows: for all interior cooling water pumps, provide vibration isolation and flexible lines to attach these pumps to the system; and vibration isolation mounts and flexible lines were also recommended for exterior cooling water pumps. Broader concerns and recommendations, including improved vibration isolation, were expressed for the Environmental Control and Life Support System (ECLSS) fans and ventilation flow path. The major flow path for these fans was in the exterior bays, in the outer part of the module near the pressure vessel. Figure 12 shows the basic FGB module layout, ventilation fans, and air flow paths.
NASA suggested that the external fan mount padding was much too thin. The agency recommended that additional material for vibration isolation between the fan case and the support structure be added, and that mufflers or acoustic lining be included in the exterior bay design. The exterior bays were open to the habitable volume through circulation grids located at both ends of the FGB (see air inlet and outlet, shown in Figure 12). NASA recommended that acoustic absorption blankets be added to the flow path in these outboard bays and offered several approaches. FGB representatives did not want to change the design to add isolators at the fan mounting or add acoustic insulation in the outboard fan flow path for various reasons. At a subsequent TIM, Khrunichev indicated that they had their fan manufacturer assess adding

INTERNATIONAL SPACE STATION - Goodman & Grosveld
Chapter V - 37
improved vibration isolators on the fans [33]. The manufacturer indicated that this change was feasible and was estimated to reduce the noise about 4-5 dBA, but costs were too high. The specification for each of these fans was 60 dBA. Smaller-size fans had a specification limit of 55 dBA. The Russian Specification SSP 50094 [17] calls out that individual sources should be at least 5 dBA below the 60 dBA module limit. This means that the 60 dBA fans were at the module limit instead of 5 dBA less (see Section 3.2 on module requirements). A level of 55 dBA would be too high if there were many fan noise sources, as will be further discussed in SM Section 6.2.
Figure 12. FGB systems layout with the Node 1 end on the right side.
Khrunichev also indicated that the FGB would comply with the SSP 50094 limits equivalent to 60 dBA, although no calculations or testing had been performed to support that claim. Future testing plans were discussed. Testing was planned in November 1997 with panels off at an electrical facility in Khrunichev Center, prior to delivery, and at the launch site.
Acoustic tests on the FGB were performed at Khrunichev, in Moscow, on 30 October 1997. Levels ranged from 68 dBA to 77 dBA, as shown in Figure 13. Note that Figure 13 has the Node 1 interface end, opposite of that in Figure 12. The FGB had no additional quieting provisions over the baseline, such as the standoffs, louvers, hose wraps with barriers, or dust collector mufflers that were added later, and will be described shortly. The NAL was concerned about the resultant levels being non-compliant with Russian specifications and requested a follow-up TIM to review possible remedial action. This TIM was held in January 1998 [34]. To quiet the effects of these fans in the outer part of the FGB, NASA suggested standoffs with louvers and lined with absorptive material for the ventilation inlet area and lined louvers for the ventilation inlets and outlets. A number of other design approaches were discussed to quiet the FGB. Subsequent to the TIM, NASA had concerns with ensuring the FGB remedial fixes were made prior to flight and tested to verify their benefits.
Pair of dust collector fans, nc1 and nc2, on each side of the aisle
Air outlet
Air inlet
Large ventilation fans
Large ventilation fans

NASA/SP-2015-624 – ACOUSTICS AND NOISE CONTROL IN SPACE CREW COMPARTMENTS – Goodman & Grosveld
Chapter V - 38
Standoffs and louvers discussed at the January 1998 TIM were subsequently implemented as on-orbit modifications. The designs were very professional. The marked ventilation inlet area shown in Figure 12 is where the standoffs were implemented. Figure 14 shows the standoffs installed at the end of the FGB, covering the inlets. Figure 15 shows one standoff design. Figure 16 and Figure 17 show the louvers installed, covering the air outlets, at the other end of the aisle. Chapter II, Noise Control shows other views of the FGB standoffs and louvers.
Note: Data obtained with some of the interior panels removed. Measurements made at axial centerline in the center of the zones identified as measurement locations during nominal hardware operations. The Node 1 interface is shown on the left side of the figure.
Figure 13. FGB layout and acoustic measurements taken at Khrunichev, 30 October 1997.
Two other areas of concern associated with high FGB levels were: the ventilation ducting in the end of the FGB that mated with the Node 1 needed a barrier wrap to minimize noise
Octave Band Center Frequency, Hz
So
un
d P
res
su
re L
ev
el,
dB
40
45
50
55
60
65
70
75
80
63 125 250 500 1000 2000 4000 8000 dBA
77 dBA
69 dBA 70 dBA
68 dBA
PGO-1PGO-2PGO-3GARussian Acoustic Requirement

INTERNATIONAL SPACE STATION - Goodman & Grosveld
Chapter V - 39
emittance into the cabin; and the pair of air filtration/dust collector filters on both sides of the FGB aisle produced high noise levels. NASA provided BISCO® barrier materials for FGB use in covering the ducts. These covers were flown, but flight crews did not feel the covers made any significant difference (see Figure 14 for the location of the ducts and the green-colored cover used). The concern with this feedback was that it is difficult for crews to discern up to a 3 dB increase or twice the SPL levels. As a result, it was initially difficult to motivate the crews to keep the covers installed. These ducts were modified over time to further improve their noise transmission loss.
Figure 14. FGB acoustic standoff locations.
Figure 15. FGB acoustic standoffs.
= Acoustic standoffs
S
Covered ventilation duct S
S
S
S
S
S

NASA/SP-2015-624 – ACOUSTICS AND NOISE CONTROL IN SPACE CREW COMPARTMENTS – Goodman & Grosveld
Chapter V - 40
Figure 16. Acoustic louvers installed in FGB.
Figure 17. Close up of typical acoustic louver.
Noise came from two pair of enclosed fans that provided suction in each dust collector assembly, with another dust collector assembly with two more fans installed on the opposite side of the FGB aisle. Figure 12 shows the locations of the dust collectors in the FGB. Figure 18 shows the debris filter grid on one side of the FGB aisle that covers one pair of fans (a similar pair was on the opposite side). Figure 19 shows the pair of debris filter fans installed on the inlet plenum (the photograph shows assembly removed from its module installation and a view of the fans). The debris filter and grid are installed onto the interior aisle wall surface, in front of the plenum.
Figure 18. FGB debris filter grid.
Figure 19. Debris filter fans attached to inlet plenum.
Figure 20 shows one debris filter fan removed from installation. The fan created a lot of aerodynamic noise because of its design, the fan hub and its thick structural support being upstream in the flow path created wakes that caused increased blade passage frequency noise,

INTERNATIONAL SPACE STATION - Goodman & Grosveld
Chapter V - 41
fan blade pressure fluctuations, and resultant structure-borne noise. A high narrow-band frequency spike was present at approximately 360 Hz. NASA recommended the fan and plenum be redesigned and replaced to resolve these issues. Khrunichev indicated this was a vendor-provided assembly and they did not want to redesign it for various reasons.
Figure 20. One debris filter fan removed (fan hub showing, blades not very visible at other end).
NASA agreed to develop a low-profile muffler prototype approach that could be attached over the collector assemblies in the FGB aisleway. This muffler could be tested in the FGB to quiet these filter areas. This effort was previously described in Reference [9]. The NASA prototype muffler design is shown in Figure 21. The muffler was tested at NASA and proved to be a very successful design. The U.S. muffler provided the following design features, as discussed in Reference [9]: noise transmission loss, by covering up the entire area of the dust collector inlet; inlet flow guidance to minimize turbulence; acoustic absorption by use of melamine foam; Helmholtz resonators to reduce the narrow-band noise, with plug-in adaptors to modify the size of the hole closeout to the resonator (provides adjustments for adapting to changes in fan blade passage frequency); and structural damping incorporated in its assembled design. Figure 22 through Figure 24 show other views of the prototype muffler.
Figure 21. U.S. FGB muffler, inboard face for covering dust collector.

NASA/SP-2015-624 – ACOUSTICS AND NOISE CONTROL IN SPACE CREW COMPARTMENTS – Goodman & Grosveld
Chapter V - 42
Figure 22. Outboard side of muffler for mating with FGB wall over dust collector grid, etc.
Figure 23. Outboard side of muffler showing acoustic foam and Helmholtz resonators.
Figure 24. Inboard corner. The blue-colored material is visco-elastic damping material.
Results of testing the Helmholtz resonators on the NASA muffler is shown in Figure 25, in delta sound pressure level loss per frequency band. Octave band insertion loss is shown in Figure 26, which was attributable to noise transmission loss, viscoelastic damping, foam absorption, and improved flow guidance.
Figure 25. NASA FGB Air Filtration muffler, results of Helmholtz resonator testing.
Figure 26. NASA FGB Air Filtration muffler, broad band insertion loss.
Visco-elastic
damping
Reactive attenuation (Left)
Reactive attenuation (Right)

INTERNATIONAL SPACE STATION - Goodman & Grosveld
Chapter V - 43
The agreed-to NASA muffler interface with the FGB was a flat surface on the FGB surrounding the filter inlet. The muffler, when tested in the FGB, would not fit because a fitting precluded a flat muffler attachment. As a result, NASA stopped further efforts on this muffler.
The initial Russian-designed muffler for the dust collector assembly is shown in Figure 27. This muffler fit on the module wall area over the debris filter assembly, and was flown. This muffler used Helmholtz resonators like the U.S. muffler, but had more open coverage over the filter surface area. The installation of the Russian muffler in the FGB is shown in Figure 28.
Figure 27. Original Russian FGB muffler for dust collectors.
Figure 28. Installation of the Russian muffler in the FGB.

NASA/SP-2015-624 – ACOUSTICS AND NOISE CONTROL IN SPACE CREW COMPARTMENTS – Goodman & Grosveld
Chapter V - 44
Acoustic tests of the FGB were performed on 21 and 22 October 1998 at the FGB launch site [35]. The FGB, with the previously described standoffs, louvers, hose wraps, and initial dust collector mufflers installed, was tested for acoustics at the launch site. Acoustic measurements were taken in four different segments of the FGB, and dBA levels obtained were as shown in the grey-colored boxes, at the top of Figure 29. The FGB was launched by a Russian Proton rocket in November 1998.
Figure 29. Acoustic measurements taken in the flight FGB module before launch, and then on-orbit during ISS Missions 2A, 2A.1, and 2A.2.
During the TIM that was held at the launch site, it was agreed that “the American and Russian specialists are to continue their joint effort to modify (improve) the noise suppressing devices.” Stay time in the FGB was discussed as rationale for accepting higher acoustic levels than FGB limits during the review of the FGB NCR report [35][36].
Acoustic tests were performed on-orbit with improvements during ISS Mission 2A, and with other improvements on Missions 2A.1 (May 1999) and 2A.2a (May 2000). Figure 29 shows a summary of levels at key locations for ground testing and flight during these missions.
At Launch Site 2A 2A.1 2A.2a

INTERNATIONAL SPACE STATION - Goodman & Grosveld
Chapter V - 45
New improved dust collector mufflers shown in Figure 30, Figure 31, and Figure 32 were flown on Mission 2A.2a. Figure 33 and Figure 34 show a muffler used to quiet noise from a ventilation fan that cooled the circular section (shown in Figure 12) at the Node end of the FGB.
The new dust collector mufflers helped lower noise levels by 5 dBA in two areas. Improvements in remedial measures and measurements in the flight FGB module continued. After Mission 2A.2, levels were lower than the levels shown in Figure 29. The lower levels were attributed to a significant amount of deep stowage provisions added to the module in the floor area.
Figure 30. Improved FGB dust collector muffler. Inboard surface is shown with outboard surface of muffler facing dust collector fans.
Figure 31. The outboard surface (facing dust collector fans) of the improved FGB dust collector muffler.

NASA/SP-2015-624 – ACOUSTICS AND NOISE CONTROL IN SPACE CREW COMPARTMENTS – Goodman & Grosveld
Chapter V - 46
Figure 32. Improved FGB dust collector mufflers on both sides of aisle.
Figure 33. Location of FGB Muffler used to quiet ventilation fan noise.
Figure 34. FGB Muffler used to quiet ventilation fan noise.

INTERNATIONAL SPACE STATION - Goodman & Grosveld
Chapter V - 47
In several places noted previously, Khrunichev indicated that they would not change their hardware in response to NASA suggestions, for various reasons. In the case of the outboard fans area, major schedule and cost impacts were associated with adding improved structural isolation and acoustic absorption in the outboard flow paths. Standoffs and louvers were used to offset the effects of these fans. These provisions added a number of new hardware items, more weight, and ended up taking up some space in the habitable volume. They were a practical remedy to lower acoustic levels, but they illustrated the impacts of not quieting noise at the source, or as close as possible to the source.
High levels due to the FGB dust collector fans and plenum were remedied by the addition of the FGB mufflers described previously. The changes suggested by NASA that were not carried out were difficult to implement due to supplier cost impacts, lack of funds, and potential significant impacts to the design and delivery/flight schedule. Also, the Russians signed up to the ISS with the understanding that MIR-type hardware would be used.
In retrospect, Khrunichev did an excellent and responsive job in doing what was necessary to quiet the FGB with well-designed provisions, excellent management support, and proactive changes to improve provisions over time. The FGB dust collector muffler approach was a very practical and reasonable way to resolve acoustics problems in that area. Khrunichev also acquired help from acoustics specialists from the Technology Acoustics Center in Moscow on the dust collector muffler and possibly other mufflers. The louvers and standoffs took some time to install on-orbit. Later, updates and other modifications were made, but on-the-whole efforts were expedited, improvements were made when needed, and FGB noise levels were reduced in a timely fashion.
Measurements taken in the FGB during Increment 4, on 2 February 2002 (Figure 35 shows panel locations used in test summary), are shown in Table 7. Figure 29 also shows panel locations and locations of the dust collectors, etc. Bold numerical levels in Table 7 show where specification levels were exceeded. Measurements in other Increments were lower or somewhat higher than these levels, but those shown are fairly representative of FGB levels. Levels varied with the amount of stowage in the FGB aisleway, which blocked emissions and provided a more-absorbent surface area. The FGB acoustic environment has been accepted “as is” for 15 years, as documented in a waiver based on the crew occupancy rate, where it was anticipated occupancy would be limited to 2 hours per day. Also, as original rationale for the waiver, it was noted that the resultant levels in the FGB were comparable to the Space Shuttle mid-deck, which ranged in the various Space Shuttle Orbiters from 62-65 dBA.
The formal waiver closure rationale, which also addresses difficulty with trying to further quiet the FGB, was as follows: “The resulting noise levels are considered acceptable since the FGB will host limited crew activity/noise exposure, the noise does not interfere with critical communications, and hearing protection is available for the crew. The FGB acoustic levels are in the mid to high 60 dBA range, making the exposure in these areas acceptable and manageable for the limited exposures anticipated. Additional on-orbit quieting is not practical without basic quieting changes in primary noise sources, which is a major redesign effort [36].” The FGB waiver has been extended to the end of ISS, and includes a schedule to replace existing fans with newly designed, quieter units.

NASA/SP-2015-624 – ACOUSTICS AND NOISE CONTROL IN SPACE CREW COMPARTMENTS – Goodman & Grosveld
Chapter V - 48
Figure 35. SLM panel locations in the FGB in Increment 4, on 2 February 2002.
Table 7. Acoustic levels measured in the FGB, Increment 4, on 2 February 2002.
Octave Band Center Frequency [Hz]
SM Hatch FGB Side
SM Hatch SM Side
Panel 219
Panel 215
Panel 206
Panel 204/205
Spherical section
Spec
63 61.0 60.6 59.4 61.5 67.1 68.6 60.4 79.0
125 61.5 63.0 72.6 69.4 64.6 68.4 56.8 70.0
250 67.3 66.0 61.1 63.3 66.3 67.9 66.7 63.0
500 60.5 59.7 59.8 58.5 58.5 61.7 59.4 58.0
1000 58.4 57.9 56.5 59.9 59.9 62.2 60.5 55.0
2000 52.6 53.1 51.7 54.9 54.9 56.3 56.3 52.0
4000 46.4 47.6 44.7 46.1 46.1 47.9 49.6 50.0
8000 38.2 40.2 30.0 41.7 41.7 43.8 47.1 49.0
OASPL 70.1 69.5 73.4 71.6 71.6 73.8 69.5
dBA 63.6 63.0 62.4 63.9 63.9 66.1 64.6 60.0
6.2 Service Module
Figure 36 shows the SM (Zvezda) on-orbit.
Figure 36. SM (Zvezda) on-orbit.

INTERNATIONAL SPACE STATION - Goodman & Grosveld
Chapter V - 49
6.2.1 Service Module Configuration
The SM provides station living and sleeping quarters, life support systems, electrical power distribution, data processing systems, flight control systems, thermal control, and propulsion systems. The SM also provides a docking port for the Russian Soyuz and Progress spacecraft as well as the European Automated Transfer Vehicle (ATV).
The SM was a follow-on design derived from the Mir Core Module. It also provides a communications system that includes remote command capabilities from ground flight controllers. Figure 37 shows the Mir Space Station assembled, including a docked Space Shuttle in the lower part of the figure. The lower part of Figure 37 shows the modules making up the Mir and their location relative to the Core Module.
Figure 38 shows the Mir Core Module with labeled configuration.
Figure 37. Mir Space Station.
Progress-M Spectr
Priroda
Kvant 2
Soyuz-TM
Kristall
Docking
Module
Shuttle
Mir Core
Module
Kvant

NASA/SP-2015-624 – ACOUSTICS AND NOISE CONTROL IN SPACE CREW COMPARTMENTS – Goodman & Grosveld
Chapter V - 50
Figure 38. Soyuz docked to the MIR Core Module.
Figure 39 shows designated areas of the SM crew compartment. Also included are views of both ends of the SM crew compartment areas, which are very similar to the Mir Core Module in Figure 38.
The Kvant 1 module in Mir had the Vozdukh (carbon dioxide [CO2] removal system) installed inside. The toilet was installed in the Kvant 2 module. A treadmill was located in the Kristall and Base Block modules. The two principal individual noise sources in the SM were the Russian air conditioner compressor (CKB) and Vozdukh. The central post area is shown in View A of Figure 39, where the group of computers are located. Two CKBs are also installed in this area (section PO1) with one on the starboard side (CKB1) and one opposite it on port side (CKB2). One CKB system is used as a backup for the other. A plan view of the SM is shown in Figure 40, with numbers indicating the adopted operational acoustic measurement locations, and the locations of the starboard CKB, the Vozdukh, and the Kayutas (sleeping compartments). Designations are preceded by the symbol KT (Control Point), so Kayutas are designated KT7 (starboard) and KT9 (port). Ground test measurement locations were designated differently. Figure 41 is a profile view that shows the location of the CKBs, the Vozdukh, and the Kayutas, as well as the air conditioning ventilation flow moved by fans into and out of the CKB. Figure 42 shows the starboard CKB air conditioner installation area with cover panel, as it was originally configured. The configuration of the CKB hardware behind this panel is depicted in Figure 43.
1. Soyuz TM craft 2. Interlock 3. Axial docking port 4. Approach & rendezvous
system antenna 5. EVA handrails 6. Work module hatch cover
7. Connection for possible auxiliary solar array
8. Mir work module 9. Solar panels 10. Rendezvous antenna 11. Telemetry antenna 12. Individual sleeping compartment
13. Approach & rendezvous system antenna 14. Transfer module 15. Satellite communication antenna 16. Toilet & wash area 17. Alt docking port, primarily for progress resupply 18. Main engine
19. Docking light 20. Docking hatch 21. Transfer module 22. Treadmill exerciser 23. Attitude control thrusters 24. Propellant tanks 25. Work & dining table 26. Exercise bicycle 27. Station control consoles, provide
access to eight control computers 28. Observation window 29. Multiple docking adapter, one aft
docking port & four axial ports 30. Axial docking port 31. Socket for attachment of remote
manipulator arm on docking modules
32. EVA handrails 33. Observation window
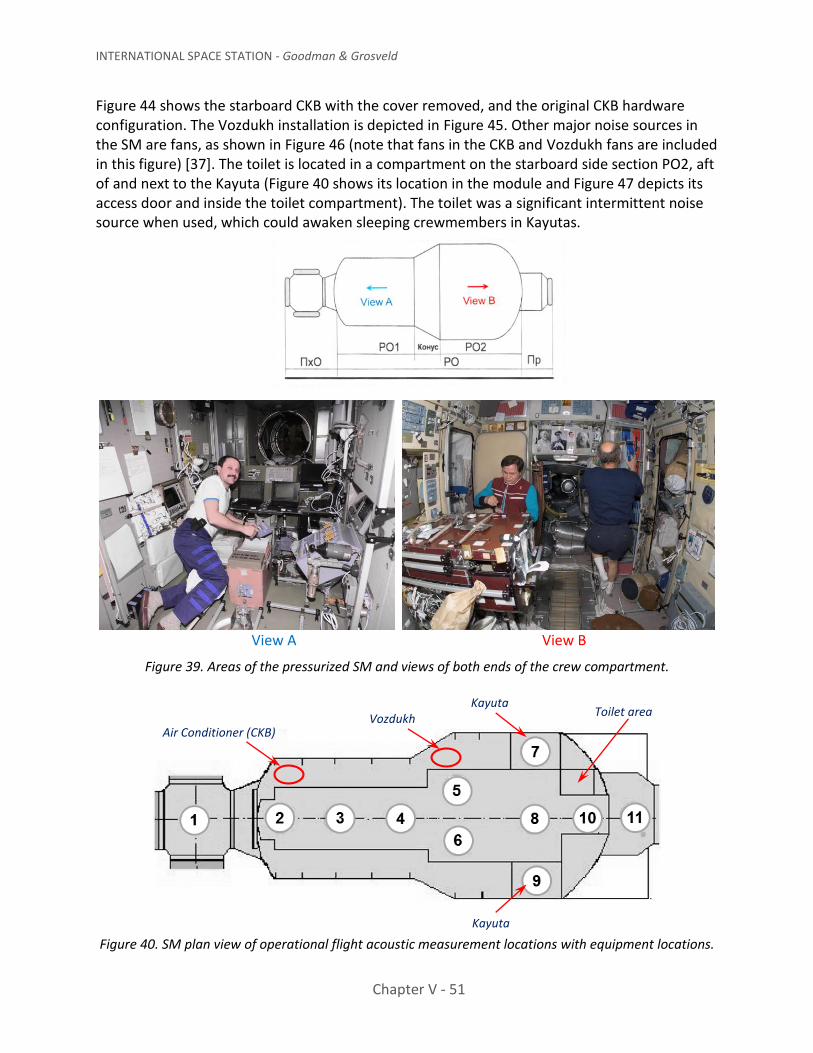
INTERNATIONAL SPACE STATION - Goodman & Grosveld
Chapter V - 51
Figure 44 shows the starboard CKB with the cover removed, and the original CKB hardware configuration. The Vozdukh installation is depicted in Figure 45. Other major noise sources in the SM are fans, as shown in Figure 46 (note that fans in the CKB and Vozdukh fans are included in this figure) [37]. The toilet is located in a compartment on the starboard side section PO2, aft of and next to the Kayuta (Figure 40 shows its location in the module and Figure 47 depicts its access door and inside the toilet compartment). The toilet was a significant intermittent noise source when used, which could awaken sleeping crewmembers in Kayutas.
View A View B
Figure 39. Areas of the pressurized SM and views of both ends of the crew compartment.
Figure 40. SM plan view of operational flight acoustic measurement locations with equipment locations.
Air Conditioner (CKB) Vozdukh
Kayuta Toilet area
Kayuta

NASA/SP-2015-624 – ACOUSTICS AND NOISE CONTROL IN SPACE CREW COMPARTMENTS – Goodman & Grosveld
Chapter V - 52
Figure 41. Profile view of the SM (“V” is the location of the Vozdukh).
Figure 42. View of starboard air conditioner area (CKB), with panel cover installed.
Figure 43. Configuration of air conditioner (CKB) hardware, with access panel removed.
Return air duct fan
Kayuta inlet fan Kayuta air register
Air Conditioner (CKB)

INTERNATIONAL SPACE STATION - Goodman & Grosveld
Chapter V - 53
Figure 44. View of Expedition I SM starboard air conditioner with access cover removed.
Figure 45. Vozdukh (CO2 removal system).
Figure 46. SM fans.

NASA/SP-2015-624 – ACOUSTICS AND NOISE CONTROL IN SPACE CREW COMPARTMENTS – Goodman & Grosveld
Chapter V - 54
Figure 47. Toilet compartment access door (left view) and view inside compartment (right view).
Intermittent noise sources in the SM of particular concern were the Vozdukh, which also had a continuous noise source, a toilet, a treadmill, and a bicycle ergometer. The treadmill was a NASA GFE assembly installed in section PO2 (Figure 39, View B) and located at measurement location 8 in Figure 40. A bicycle ergometer was also installed in the module close to location 4 in Figure 40. Figure 48 shows the treadmill and the ergometer in use, with both views looking aft, same as view B in Figure 39. The treadmill especially was a source of high intermittent noise that both U.S. and Russia were concerned with, that added to already high levels in the SM when crews exercised on it during the workday and to the noise exposure of all crewmembers in the SM.
Figure 48. U.S. treadmill and bicycle ergometer installed in SM, views looking aft.

INTERNATIONAL SPACE STATION - Goodman & Grosveld
Chapter V - 55
6.2.2 Service Module Efforts before Its First Flight
This section covers in more detail the TIMs and acoustic efforts on the SM until the early Expedition flights. This time period involved extensive efforts and was significant in terms of precedents and issues. Emphasis is on the problems with high SM acoustic levels and remedial actions taken to achieve acceptable lower levels. Many other areas covered with the Russian side were significant and time consuming, such as resolving ground test and flight measurement hardware, joint measurement plans and testing, and sharing of the flight data. These other areas may be mentioned, but not covered to any significant extent. It needs to be emphasized that during this period, there were numerous reviews with management about the SM status on acoustic levels, and the progress made on lowering the SM acoustic levels. A good deal of redundancy can be found in discussions over this period about “unacceptable” SM levels. What is reported here transpired during this period and reflects SM status at that time, for which the U.S. and Russian sides were jointly responsible for resolving. Some redundancy was necessary because progress was too slow in remedial actions, and there was a need to expedite corrective actions and obtain the necessary resources to implement them. However, there is no intent to belabor this point or be critical—just document and reflect on what occurred.
SM acoustics was discussed at the TIM held in Houston, 3-7 June 1996, with RSC-E, IBMP, and Khrunichev in attendance [29]. Mir-related business was discussed, as noted earlier. Both sides agreed to mutually exchange information, and the Russian Segment specification was reviewed. Both parties agreed that it would be beneficial to conduct acoustic analyses and incorporate a more vigorous noise control effort during the design process in the future.
At a subsequent TIM in Moscow in August 1996 [30], which included RSC-E, Khrunichev, and IBMP representatives, NASA presented experience with acoustic noise control on the Shuttle, lessons learned, and provided briefings and samples of acoustic materials and related literature. RSC-E agreed to prepare a SM acoustic noise control plan, and agreed to Russian Segment Specification changes.
At a Moscow TIM in July and August 1997, significant issues came up. These issues are summarized, as follows [38]:
The SM design is mainly completed. SM equipment is partly ready and partly ordered. Due to the limited funding, there is no possibility of making any complex design changes or replacements of hardware and equipment.
The SM has a prototype, the Core Module of Mir Space Station, both in terms of design and composition of equipment. Additional measures were undertaken to reduce the noise level of the SM versus Mir, which is why the SM is expected to be quieter.
Mir acoustic data previously requested by NASA were provided by RSC-E. NASA review shows Mir exceeding the Russian Segment Specification (SSP 500094) limits. RSC-E reported that quieter fans are used in the SM ventilation system, and additional fixes for noise baffling and vibration isolation will be used, which is why noise levels in the ISS should be lower than those on-board the Mir Space Station.

NASA/SP-2015-624 – ACOUSTICS AND NOISE CONTROL IN SPACE CREW COMPARTMENTS – Goodman & Grosveld
Chapter V - 56
The U.S. side expressed concern that there was no prediction of the noise levels on-board the SM. The Russian side indicated it was premature to indicate the SM would not meet limits, and that SM tests scheduled in November 1997 would provide appropriate information. Based upon test results of the SM flight article, additional noise baffling and vibration isolation could be made.
NASA noted that the remedial action plan and acoustic data presented by the Russian side on Mir and SM indicated that the SM will not comply with SSP 50094 limits prior to launch. The NASA position was that the limits must be complied with prior to launch (Note: the NASA position stated at the TIMs was of the NASA TIM chair, not NASA in general).
The Russian side was not planning to implement complicated SM noise reduction modifications because schedule and cost precluded any further remedial design modifications. This position was unacceptable to NASA, and the issue required U.S. and Russian side management attention. NASA expressed concern with having flight crews fix problems that could be solved before flight.
The Russian plan indicated that it would take remedial actions to ensure compliance within the first 3 years after the SM launch, which NASA found unacceptable. The Russian side did not agree, since any remedial actions are useful.
NASA indicated use of hearing protection during routine operations (continuous noise operations or worst-case nominal operations) is not acceptable. Hearing protection is intended only for short-term use, not for long-term operations. The Russian side indicated hearing protection should be available for short periods of intermittent noise or can be used anytime at the discretion of the crew. Hearing protection will be necessary in the event safety limits are exceeded. Further discussion was documented, but the main point of the U.S. side was that hearing protection should not be required to protect the crew from routine operations or from continuous noise levels. Both sides agreed that if SM complies with noise limits in the Russian specification the use of hearing protection would not be necessary. Both parties agreed to a U.S. specialist participating in the noise test of SM during Ku-band Interface System (KIS) (also termed high-fidelity ground test facility, Complex SM Mock-up [CSMM], or Complex Stand) testing, and joint dosimetry measurements on the NASA-7 Mir mission, and on subsequent Mir missions.
RSC-E provided a detailed listing of SM noise sources and the noise levels emitted by each source. Noise sources were mostly fans, but also other devices such as compressors, pumps, a power supply, and a solid fuel generator. About 38 fans were listed, along with two compressors, six pumps, 11 devices, and one U.S. treadmill, including the measured levels from each source. Fan levels generally ranged from 55 to 65 dBA, and pumps from 60 to 65 dBA. The Russian specification calls out that each individual noise source should be at least 5 dBA less than the 60 dBA module limit, or 55 dBA or less. The overall quantity of fans operating in the SM makes it important to be no more than 55 dBA, but less than this value is preferable (see Section 3.2 on module requirements).
Other items covered were: U.S.-provided up-to-date information on acoustic materials data, their certifications, and samples; NASA description of Russian depressurization pump quieting

INTERNATIONAL SPACE STATION - Goodman & Grosveld
Chapter V - 57
efforts; NASA recommendation that acoustic testing of the SM be conducted to identify contribution of each source to the total levels and the total levels; and information on testing instrumentation.
At an October 1997 TIM, NASA’s participation and review of SM test procedures were discussed [39]. Testing would be in the KIS, with NASA participation. RSC-E provided a revision to their Russian Noise Control Plan (RNCP), which was later termed the Remedial Action Plan (RAP). NASA concurred with the basic approach and schedules outlined in this plan with the stipulation and clarification that “every effort be made to comply with the acoustic requirements of SSP 50094, prior to launch. Only if it is not possible to implement all of the remedial actions at this time, should in-flight remedial actions be considered” [39]. The Russian side agreed to start implementing design changes to reduce SM noise from equipment known to be major noise sources, to predict where the SM stands in relation to its acoustic requirements and what actions need to be taken to ensure compliance.
The RAP contained some further clarification of the RSC-E situation and position relative to remedial actions:
Because of constraints, it would not be possible to undertake any conceptual design changes to exchange noisy devices and equipment for less noisy ones. Main measures will be related to introducing means for noise absorption and vibration isolation (no specific details or examples were identified).
Problems will be solved experimentally. To achieve this, an experimental installation for vibration and acoustic noise testing was set up. No specific details were identified.
Noise calculations are, for the most part, based upon statistical energy-related methods and may be used only for preliminary assessments. Special testing will be conducted to confirm and perfect the calculation methods.
In January 1998 at a pre-brief NASA/Russian Space Agency (RSA) Joint Program Review (JPR), NASA management indicated that Mir data showed acoustic levels in the SM will likely violate the U.S./Russian agreed — to specification by a significant amount [40]. The Russian response was that they have funded a detailed design and test plan. In comments, they noted that a full-up SM acoustic test will be run in the February 1998 timeframe with NASA participation. Until then, the actual acoustic levels will not be known. The Russians brought up the concern that the U.S. GFE Treadmill with Vibration Isolation Stabilization (TVIS) system in the SM may exceed specified noise levels. NASA agreed with the concern, and responded that they are working a plan to make the TVIS as quiet as possible. The resulting recommendation was to advise RSA that predicted high SM levels need to be addressed, and that NASA analysis and design expertise is offered to assist in fixing the problem.
In early 1998, the NASA MAD provided stationary acoustic level data in the various Mir modules and the crew worn readouts for the Mir-25/NASA-7 Mission (Table 8). Figure 49 shows locations in the Mir complex where the measurements were taken. Dosimeters at fixed locations in the Core Module indicated levels in the mid-60’s dBA, with levels up to 70.9 dBA at the work table area. The Kvant 2 readings were in the low 70’s dBA. Note the crew worn values reflect readings taken wherever the crew operated and traversed within the Mir complex.

NASA/SP-2015-624 – ACOUSTICS AND NOISE CONTROL IN SPACE CREW COMPARTMENTS – Goodman & Grosveld
Chapter V - 58
Table 8. Mir Acoustic Dosimeter reading from Mir-25/NASA-7, 11 August 1998.
Location Average Reading (dBA)
Start Stop
Core Module Central Control Panel
64.7 65.5
2 Feb, 12:00 26 Mar
03 Feb, 12:00 27 Mar
Core Module Work Table 70.9*
67.7 9 Mar 21 Apr
10 Mar 22 Apr
Core Module, near Galley next to Table 65.7 27 Apr, 10:00 28 Apr, 10:50
Quarters for CMDR 66.0 12 Mar 13 Mar
Quarters for Engineer 68.0*
64.5 16 Mar 19 May
17 Mar 20 May
Kvant 1 69.9* 68.9*
27 Feb, 11:20 13 Apr
28 Feb, 12:00 14 Apr
Kvant 2 (panel 417) Kvant 2 Russian
72.3* 70.4* 71.8*
23 Feb, 17:34 31 Mar 27 Jul
24 Feb, evening 01 Apr 28 Jul
Krystall- Panel 217 Krystall-Russian
66.5 59.2 63.9
06 Mar 05 May 24 Jul
07 Mar 06 May 25 Jul
Priroda (near sleep area) 58.7 63.1
03 Feb, 13:00 20 Mar
04 Feb, 16:00 21 Mar, 04:16
Crew worn
62.3 63.9 68.3*
65.3
04 Feb, 16:00 09 Feb, 13:00 08 Apr 13 May
05 Feb, 16:00 10 Feb, 13:00 09 Apr 14 May
Note: Readings with * are equal to or higher than the 68.0 dBA maximum noise limit allowed
Figure 49. Mir configuration and MAD measurement locations.
Key:
No. Location
0 Docking Module / center 1 Mir Core Area / center 2 Mir Core Sleep Cabin / center 3 Mir Core Living Area / center 4 Kvant 1 / center 5 Kvant 2 Living Compartment / center 6 Kvant 2 Science Compartment / center 7 Kvant 2 Airlock Compartment / center 8 Priroda Inboard / center 9 Priroda Outboard / center 10 Kristall / Panel 217 11 Spektr (closed-out)
1
4
6
0
100
8
5
9
11
3 2

INTERNATIONAL SPACE STATION - Goodman & Grosveld
Chapter V - 59
In a July 1998 NASA Mir acoustics report based upon debriefings of the seven astronaut Mir crewmembers, it was concluded that the ambient noise level in Mir was acceptable, with a few exceptions [41]. A few crewmembers expressed the need for reduction in ambient noise, and two crewmembers noted a higher level existed in the Core Module, and others observed elevated noise in the Kvant and Kvant-2 modules. Two of the crewmembers reported degradation in hearing. One crewmember reported noise was stressful and caused problems with sleep. Crewmembers reported many problems regarding the comfort of the hearing protection, with one reporting that wearing hearing protection was not “operationally realistic in that it was interfering with both comfort and productivity.” Another crewmember expressed that he was very sensitive to noise and had concerns with the noise and its significant effects on his visit to Mir. Since NASA only had seven astronauts flying in Mir, looking at these crewmember comments, it is difficult to understand the subject report’s conclusion that the ambient noise in Mir was acceptable.
In August 1998, the NAL expressed concern that it had not received results of recent RSC-E testing that NASA asked to be provided in June and July 1998, and received no substantial information on status of remedial actions and plans [42]. There was some lack of coordination in the teleconferences, and NASA was concerned that it was maybe too late to incorporate quieting provisions, and that late testing could result in less options and increased risk.
At a TIM in October/November 1998 in Moscow, further discussions were held on future KIS testing, and RSC-E provided results on the April 1998 acoustic tests in the KIS facility [43]. NASA provided a large sample of BISCO® wrap, and comments on proposed SM testing requirements. NASA support of the flight SM testing late in 1998 or January 1999 was discussed. NASA participated in a tour of the KIS where noise sources were identified. The Russian side took the action to provide results from tests performed after April 1998. NASA concurred with Russian plans to add vibration isolators to fans, cover the Vozdukh system with barrier material, and implement results found for adding covers with absorption/barrier materials to fans in the SM. No defined schedules for implementation of the fixes were discussed. Russian data assessment was that the SM levels should be in the mid to high 70s (dBA). NASA was concerned again about the intent to apply on-orbit fixes, rather than fixing the SM before flight, and the need to demonstrate compliance by test before flight, or at least define flight levels expected.
An important TIM was held in Moscow in January 1999 [44] to perform the following actions: jointly conduct acoustic noise tests in the flight SM; identify and mutually agree on major noise contributors requiring noise mitigation treatment and to prioritize them; and develop a forward action plan quieting equipment and the SM. U.S. and Russian microphones were installed in the SM to measure acoustic levels. The SM test instrumentation positions for this test are shown in Figure 50 (locations are different for flight mission measurements). During testing, each noise source was activated individually so its contribution to the total could be understood and each source could be ranked for its priority to be quieted (a previous NASA recommendation). This was followed by a test of available noise sources. Some noise sources were not available, including the Vozdukh system (which was not operable), refrigerators, and some panels that were not installed. Quick-turnaround noise data in one-third octave band and narrowband were obtained and compared with the Russian specification. The Russians agreed to use U.S. microphone data to identify exceedances to the specification limits.

NASA/SP-2015-624 – ACOUSTICS AND NOISE CONTROL IN SPACE CREW COMPARTMENTS – Goodman & Grosveld
Chapter V - 60
Figure 50. SM test instrumentation layout.
Results of two separate test runs are shown in Figure 51 and Figure 52. The U.S. and Russian microphones used are indicated in these figures. The maximum levels measured were between 70 and 74 dBA depending upon location. Figure 53 shows a comparison of one-third octave band spectra for significant noise sources. The unavailability of Vozdukh for testing was unfortunate since it is known to be a significant noise source having many operational modes. Noise sources for the Vozdukh included a pump, a micro-compressor, and a fan that ran all the time. The Russian side described Vozduhk system changes—muffler, isolators, and an aluminum shell cover filled with absorbent fibrous material. The Russian side provided a table that summarized the locations where U.S. provided BISCO®-type barrier material was being considered for implementation. The conclusion of the data evaluation was that this preliminary analysis, while not complete, was sufficient to identify those flight hardware items that both sides agreed were the primary noise sources, and which must be quieted to achieve specification compliance. Listed below are decisions based upon test results [45]:
Both sides agree certain items must be modified to achieve acoustic specification compliance. This will be achieved by the addition of mufflers, vibration isolators, acoustic wrap, and barrier covers.
Refrigerators are the most significant noise sources, but they will not be launched with the SM. The Russians agreed on performing a redesign to lower the noise levels before they are flown.
All data analysis will be completed and documented. The list of noisy equipment will be adjusted, as required.
Preliminary data review indicates maximum noise to be 70 to 74 dBA versus 60 dBA for the Russian specification.
A few items were not available for test. Noise attributable to those must be added. Bench test data, or estimates from similar items are to be used.
Equipment noise reduction fixes must be verified by either bench tests, SM before launch, or on-orbit tests.

INTERNATIONAL SPACE STATION - Goodman & Grosveld
Chapter V - 61
Figure 51. SM Acoustic Noise Survey, all systems except two refrigerators, Vozdukh, and other noise sources, Run 49a.
Figure 52. SM Acoustic Noise Survey, all systems except Vozdukh, and other noise sources, Run 49b.
Octave Band Center Frequency, Hz
So
un
d P
res
su
re L
ev
el, d
B
40
45
50
55
60
65
70
75
80
63 125 250 500 1000 2000 4000 8000 OASPL dBA
U.S. #1U.S. #2U.S. #3U.S. #4Russian Spec.Russian Mic.
Octave Band Center Frequency, Hz
So
un
d P
res
su
re L
ev
el, d
B
40
45
50
55
60
65
70
75
80
63 125 250 500 1000 2000 4000 8000 OASPL dBA
U.S. #1U.S. #2U.S. #3U.S. #4Russian Spec.Russian Mic.

NASA/SP-2015-624 – ACOUSTICS AND NOISE CONTROL IN SPACE CREW COMPARTMENTS – Goodman & Grosveld
Chapter V - 62
Figure 53. SM noise survey. Comparison of one-third octave band spectra for significant noise sources.
A preliminary list of systems with significant noise sources was developed after testing, as shown in Table 9. Nearly all of these sources have measured acoustic levels in excess of the 55 dBA specification limit discussed previously, and some exceed by themselves the 60 dBA SM limit. It is believed that these measurements were taken at a distance of 1 meter from the source.
A forward action plan for acoustic design modifications agreed to is shown in Figure 54.
It was agreed that the implementation plan for each equipment item selected for acoustic design modifications would include the following information:
Identification of each internal noise source and the acoustic transmission path. Proposed modification method(s) for each source; e.g. mufflers, isolations, and
absorbers. Also, include the rationale for each selected modification method and an estimate of the quieting to be achieved.
Equipment, materials, resources, or assistance desired from the U.S. Schedule for joint review of detailed engineering design modifications (Critical
Design Review [CDR]). Plan and schedule for pre-launch verification of effectiveness of modifications; e.g.
testing on flight article, in Complex Stand, or bench test. Schedule for manufacturing of modifications. Schedule for incorporation of modifications into Flight Article: pre-launch or flight
number designation. Plan for on-orbit measurements to verify on-orbit performance.
Octave Band Center Frequency, Hz
So
un
d P
ressu
re L
evel, d
B
10
20
30
40
50
60
70
80
63 125 250 500 1000 2000 4000 8000
OASPLdBAAll Systems Maximum
Russian Spec.converted fromoctave band
Run 27Run 30Run 35Run 36Run 22ARun 33
Run 38Run 39Run 43Run 44Run 46Run 49B

INTERNATIONAL SPACE STATION - Goodman & Grosveld
Chapter V - 63
Table 9. Systems with significant noise sources, preliminary list.
System/source Microphone
number dBA Test number
US RSE-E
1 CKB1 Air conditioning system 2 Fans 1 Compressor
4 3
68.2 61.9
5 4
2 CKB2 Air conditioning system 2 Fans
4 3
62.1 56.7
7 6
3 BAΠ1 Equipment fan 4 56.3 9 8
4 BAΠ2 Equipment fan 4 54.8 10 8
5 BΠΟ5 Instrumentation area fan 4 61.5 15 14
6 BΠΟ6 Instrumentation area fan 4 3
63.5 55.9
16 15
7 BΠΟ4 Instrumentation area fan 3 55.2 19 18
8 EMΠ Harmful contaminant removal system 3 55.4 20 19
9 BΟ1 Crew compartment fan 3 60.5 22 21
10 BΟ2 Crew compartment fan 3 57.7 23 22
11 BГЖТ1 BГЖТ4
Sensor fans 3 55.1 27 25
12 BBΠрК Transfer tunnel fan 1 3
58.4 56.0
30 28
13 BB1PΟ Air duct fan 1 3
57.3 55.2
35 31
14 BB2PΟ Air duct fan 1 3
56.7 55.3
36 32
16 BΠΟS Instrumentation area fan 1 2 3
57.1 56.5 55.2
38 44
17 BΠΟS Instrumentation area fan 1 2 3
57.5 57.5 53.5
39 45
18 BΟЛ Lira avionics fan 1 2 3
61.0 58.6 54.2
43 49
19 ЭHAKΟ5 Electric pump for heating loop 1 2
57.4 54.6
46 52
*This refrigerator will be redesigned before it is launched and installed on-orbit
Figure 54. Forward action plan for SM acoustic modifications.
26-01-99 (A)
27-01-99 (A)

NASA/SP-2015-624 – ACOUSTICS AND NOISE CONTROL IN SPACE CREW COMPARTMENTS – Goodman & Grosveld
Chapter V - 64
The U.S. and Russian sides both produced test reports [46][47]. In the Russian report, the Russian side decided to consider quieting individual noise sources less than 55 dBA, because a number of sources less than 55 dBA can add up to impact the SM limits of 60 dBA. They also indicated the differences between the SM interior at the time of testing, being at a loss of CKB and some missing panels, should be such that the flight SM will be less than testing values. In addition, the Russian side provided a proposal to acquire test measuring equipment they felt necessary to complete and expedite testing and development of acoustic modifications. The U.S. agreed to loan the Russian side the use of the U.S. equipment used during this SM testing [48]. Also, a list of equipment RSC-E needed to resolve noise problems was generated as a TIM enclosure to support subsequent near-term funding of equipment needed. Another device astronauts tested in the KIS was the caution and warning system. The astronaut’s SM test results were provided to NASA, over time. RAP provided in early 1999 started showing the schedules for issuance of design documentation, manufacturing of materials, testing of designs, and issuance of Engineering Judgements for implementation of fixes. Vozdukh noise abatement, replacement of flight fan dampers during flight, modification of the on-board refrigerator and the delivery of the modified refrigerator, the installation of additional noise abatement devices, and the development of quiet fan technology and new low-noise electric motors were included. Completion dates for most items were in 1999, although it was not clear what hardware items would be implemented into the SM before flight. Testing of measures occurred throughout 1999 and the second quarter of 2000.
U.S comments on the Russian acoustic implementation plan were documented in the March 1999 TIM [49]. The U.S. recognized the significant amount of emphasis and efforts applied by the Russian side in their development plan efforts. However, it was noted that the implementation plan was deficient in the following areas:
The U.S. side strongly believes that the acoustic environment to which the first Expedition crew would be exposed needs to be characterized before flight and tested in the launch configuration, at the launch site. Acoustic modifications installed by the crew after launch should be characterized by testing, and the U.S. requested a plan for acoustic testing at the launch site.
The Russian implementation plan did not include details agreed to in the January 1999 TIM.
The implementation plan did not include noise requirements during periods of crew sleep, which is important.
Intermittent noise sources are significant contributors to the total SM noise, and the plan did not address this.
In April 1999 at a TIM, the Russian side presented status of their remedial action testing [50]. They provided considerable detailed descriptions of remedial actions on items such as the Vozdukh quieting modifications, where changes included sound insulating housing for the micro-compressor, a sound insulating screen on the front panel, the addition of a muffler to be installed on the vacuum pump outlet, addition of sound insulation on the pump air duct, and sealing of interior panel joints. Two types of vibration isolators being developed for fan mounting were described as well as the numerous locations where each type was planned to be implemented. Both sides agreed with the Russian priority list of sources to be quieted and

INTERNATIONAL SPACE STATION - Goodman & Grosveld
Chapter V - 65
acoustic quieting approaches, including reduced emissions from the Vozdukh, CKB, fans, and pumps. It was also agreed that it was important to control the noise in the sleeping quarters, especially dealing with the fan and the air diffuser blowing air into the Kayuta. However, the Russian position on remedial action measures became clearer, as they indicated hardware should be available and installed within the first 3 months after Expedition crew manning of the SM. The modified U.S. position was that hardware should be available within 2 weeks after Expedition crew manning of the SM. Both sides agreed to call on management to expedite implementation of priority measures during early on-orbit operations. Preflight items to control noise were limited to adding insulation to the inner side of the CKB cover, and sealing some ducts and panels. Both sides agreed the maximum allowable for separate single sources, which is 55 dBA, is insufficient for all systems operating because it does not result in compliance with the overall requirement of 60 dBA. Sources need to be lower than that so that accumulated effects meet module limits.
In a June/July 1999 TIM further review of the Russian remedial action plan, the Russian side indicated a delay of KIS testing because of SM priority on software verification [51]. Revised updates to the RAP would be sent to NASA. The Russian side presented Vozdukh quieting efforts and indicated very few, if any, remedial measures would be made and incorporated before launch of the SM. The U.S. side showed two different muffler approaches, which it designed, that might be of benefit to RSC-E. These two approached include: a foam muffler for use in such items as the sleep station overhead outlet muffler; and a muffler made of BISCO® barrier wrap and rounded, cone-shaped foam absorbers. Both approaches performed quite well in NASA testing. Both sides reviewed proposed dampers in four locations in the SM KIS facility. In the KIS facility, a U.S. astronaut verified that these items could be installed on-orbit by crews. The Russian side indicated their priorities for remedial action/quieting hardware were: 1) Vozdukh; 2) fan damping/isolators; 3) noise isolation of interior panels; and 4) intermittent noise sources. In general, the Russian side provided a significant amount of information on their efforts.
NASA was concerned about the acoustics, especially in the SM but also in the FGB, and formulated risk mitigation strategies. Risk mitigation strategies developed over time involved the following [52][53]:
Implement acoustic engineering controls - Initially use hearing protection, implement RAP acoustic countermeasures
(isolators, mufflers, absorbers, and covers for SM), then develop and use quiet fans/pumps.
- Quiet the Russian sleep quarters and provide a quiet sleep station kit to add to the ISS, Temporary Early Sleep Station (TeSS).
Implement operational procedures - Power off the loudest hardware when feasible. - Reschedule the timeline so that significant noise sources do not run
simultaneously. - Ensure quiet sleep areas to recover from exposure. - Control sources affecting noise when in sleep quarters.

NASA/SP-2015-624 – ACOUSTICS AND NOISE CONTROL IN SPACE CREW COMPARTMENTS – Goodman & Grosveld
Chapter V - 66
Monitor ISS acoustic levels and crew acoustic exposure dose - Use U.S. and Russian SLMs and audio dosimeters. Efforts were being made to
obtain mission time for periodic readings. - Perform three types of acoustic measurements:
(1) SLM—measures and characterizes noise. (2) Dosimeter, crew worn—measures crew exposure wherever the crew goes
and supports compliance with flight rules. (3) Dosimeter, static—measures long-term average noise at a given location.
Monitor biological impact to hearing - Comprehensive preflight and post-flight testing of crew hearing with an in-flight
testing capability is being worked.
Implement flight rules - At the time, flight rules were in the process of being generated and approved by
the AWG. If continuous noise levels exceed 65 dBA in work areas, perform the following steps: where possible, reschedule the operation of noise-producing hardware and/or crew activities to limit cumulative exceedances; power off loudest noise producers at the discretion of mission control/support; or encourage use of hearing protection. Table 10 shows the resultant approved flight rule requirements for use of hearing protection, based on a crew 24-hour exposure (crew work plus sleep periods) [54] using a 5 dB exchange rate. The SM was expected to require significant long-term wearing of hearing protection. The audio dosimeter was planned to be used to determine the 24-hour dBA (Leq(24)) exposure average by adding the crew worn readings to the sleep period readings to obtain Leq(24).
Use hearing protection - Use U.S. active, and U.S. and Russian passive hearing protection individually
fitted for each crewmember (See Figure 9). - Provide several options of crew hearing protection to alleviate problems
anticipated with long-term use of these devices.
Table 10. ISS flight rule related hearing protection requirements, based on 24-hour noise exposure dose.
Leq(24) [dB] 65-66 67 68 69 70 71 72 73 74-75 76-77 >77
Hours per day of hearing protection (in addition to 2-hour exercise period)
0 2 7 11 14 16 17 19 20 21 22
In August/September 1999, there were a number of concerns expressed by some NASA
astronauts about the expected high acoustic levels in the SM and the need to use hearing protection for long periods of time. Concerns were expressed in various Safety Review Panel meetings and e-mails.

INTERNATIONAL SPACE STATION - Goodman & Grosveld
Chapter V - 67
A JPR, which involved ISS Program management of the U.S. and Russian sides, met from 30 September through 1 October 1999 to discuss SM acoustics [55]. NASA and the RSA agreed that the acoustic environment in the SM is unacceptable for long-term operation of the ISS (levels in the SM were described as 73 dBA versus the 60 dBA limit when discussing the SM NCR). It was agreed that the SM is acceptable for launch if corrective actions are planned and scheduled, and crew protection measures are taken in accordance with the plan. It was stated that the RSC-E/NASA joint technical team had the action to develop a plan to reduce the noise level in the SM. Implementation of the high-priority noise reduction features were to be installed during “Increment 1”. An “Increment” is the period of time from the launch of the Russian Soyuz vehicle with the rotating ISS crewmembers to the undocking from the return vehicle of that same crew. Expedition is another term used for Increment. All corrective measures will be tested in the KIS prior to flight with participation of NASA and RSA technical and medical representatives to ensure the effectiveness and to assess the resultant acoustic levels. It was also agreed to implement measures and operational constraints to minimize noise levels during rest and sleep periods.
An acoustic TIM was held in September/October 1999, during the above-mentioned JPR timeframe [56]. The September JPR protocol was discussed. RSC-E indicated “high priority measures” applied to Vozdukh quieting. Isolators, barriers, and mufflers available on-orbit would be ready to be implemented by April or May 2000. Revisions to the RAP were reviewed, and further updates would be provided within 3 weeks. These measures consisted of the Vozdukh having noise-dampening covers for installation on-orbit and replacing ventilation fan dampers with softer ones on-orbit. The “quiet fan” technology and development was discussed in detail, and current status of efforts and schedule was reflected in revisions to the RAP. This was a Category 2 effort, one in which measures were planned to be implemented during operation of the SM. It was evident that the “quiet fan” efforts involved a lot of technology and materials development efforts. Completion dates for the various items ranged from mid-1999 to January 2000, with no clear dates for implementation into the flight SM. The U.S. side felt this “quiet fan” effort was a very important one, and considered needed to achieve and assure meeting the SM acoustic limits. The U.S. side requested the Russian side to consider what can be done to expedite the efforts described, and submit a proposal to outline what can be implemented with expedited priorities and identify its associated impacts. It was agreed that priority measures will be tested in the KIS facility to the full extent possible before being flown up to the SM. Several other areas of the plan that merit mentioning include: actions concerning on-orbit monitoring of hardware; pump quieting efforts; actions pertaining to noise-reducing procedures during crew rest and sleep; and rules for intermittent operating equipment use to limit the noise. On-orbit measurements were discussed and agreed upon. As a joint effort, NASA and RSC-E would manufacture and launch hearing protection. The U.S. provided RSC-E with documentation on its current requirements for hearing protection and communications. RSC-E agreed to consider implementing the same requirements. RSC-E reviewed their experience with hearing protection measures. Earplugs had been in use for many years, and ANC headgear was recently used on Mir. Cosmonauts recommended a mix of provisions for this purpose because of comfort and various applications. Difficulties in wearing hearing protection were discussed. Cosmonauts experienced comfort/wear problems with excessive pressure

NASA/SP-2015-624 – ACOUSTICS AND NOISE CONTROL IN SPACE CREW COMPARTMENTS – Goodman & Grosveld
Chapter V - 68
around the ear and increased sensitivity of the head area. The headsets were uncomfortable during sleep. Concerns with the use of ANC interfering with communications were exchanged. In-flight monitoring was discussed and the type of SLM the U.S. proposed was settled. The U.S. agreed to provide the Russian side with two flight-approved SLMs—one for training and one for engineering use.
In October 1999, RSC-E sent the U.S. a report on successful testing performed in the flight vehicle in July 1999 [57]. Results were very successful on Vozdukh modifications and on the use of rubber dampers/shock absorbers on fans.
Several concerns developed in late 1999, after teleconferences:
Russian counterparts indicated that there was no need for testing of flight SM at the launch site, since no significant modifications would be made to the SM. NASA was concerned that previous testing did not include the Vozdukh and refrigerator, and had some panels off, included a false floor, and that testing was performed without the current modifications.
The U.S. side neither had the necessary details of the RAP priority actions nor understood the implications on crew training and of SM in-flight incorporation of noise control measures.
The recent changes in technical approaches and their effectiveness show “slow progress” in lowering overall SM noise levels.
RAP designs and schedules were reviewed at an Acoustic TIM, 13-28 April 2000 [58]. Two nights (April 18 and 19) were spent testing in the KIS facility. The test module was configured as it would be used by the Expedition 1 crew. On the first night, the total system noise was appraised and individual noise contributions including the Caution and Warning (C&W) system were evaluated throughout the module. On the second night, acoustic blankets, damping foil, and vibration isolation on the Vozdukh were evaluated. The design status of the blankets and mufflers was discussed. Vibration isolators for fans, pumps, and mufflers would be evaluated in other test facilities before incorporation in the Complex Stand. Concerns that the acoustic levels in the crew sleep quarters (Kayutas) would significantly exceed the 50 dBA limit were discussed. RSC-E indicated that they were planning an acoustically absorptive lining on the interior and an outlet vent with an integrated muffler into the door. These provisions would be added to the Complex Stand and evaluated by testing. C&W tests were conducted with subjects wearing various flight hearing protection devices. Testing proved that the C&W system could be heard while using the hearing protection devices. Testing of countermeasures showed the following results: the Vozdukh design modification showed a reduction of 6-7 dB on modifications; blankets/mats that were installed on interior panels provided an average reduction of 1 dB; aluminum foil lagging around a fan resulted in a 0.5-1 dB reduction, and some system fans and mats tests showed a reduction of up to 2 dB. The revised RAP provided readiness for delivery dates of the following: sound-absorbing mats for interior panels, January 2001; installation of sound-absorbing housing for the Vozdukh system, December 2000; installation of sound-insulating devices for the Vozdukh micro-compressor and vacuum pump, April 2000; development of absorbers for fans, April 2001; development and delivery of mufflers for fans and air ducts, April 2001; use of individual noise protection gear, July 2000;

INTERNATIONAL SPACE STATION - Goodman & Grosveld
Chapter V - 69
development of low-noise fans, 2002; and delivery of acoustic measurement equipment for on-orbit measurements, September 2000. Both sides agreed that the RAP countermeasure due dates do not ensure that the SSM noise will be reduced to acceptable levels for the Expedition 1 crews. It was agreed that the RAP lacks details necessary for tracking and planning, which should be provided by May 2000. Figure 55 provides the Russian microphone locations in the SM Complex Stand for these tests (later flight measurement locations were different), and the dBA readings obtained for those locations during acoustic testing. Figure 56 shows the testing results for all systems running, using Russian microphones. The close group of curves in Figure 56 is considered to be representative of prevalent SM acoustic levels, found later in the flight SM, with levels up to 70-73 dBA. SM levels without the RAP fixes exceeded the limits by up to 17 dB in some octave bands, and these levels totalled 13 dBA on the centerline, and up to 14-18 dBA near working equipment. Sleep areas of the SM exceeded the work area limit (60 dBA), with overall levels up to 15-17 dBA over the sleep limit of 50 dBA. The U.S measurements were at fewer locations, but were consistent with the Russian measurements.
Figure 55. The 18 and 19 April 2000 Russian instrumentation locations for ground acoustic testing and the dBA readings at these locations.
Port
View from above

NASA/SP-2015-624 – ACOUSTICS AND NOISE CONTROL IN SPACE CREW COMPARTMENTS – Goodman & Grosveld
Chapter V - 70
Figure 56. The 18 and 19 April 2000 acoustics tests in the SM Complex Stand, all systems on. RM is the Russian microphone.
At the end of April 2000, a Stafford Task Force-Utkin Advisory Expert Council Joint Commission met at both NASA Kennedy Space Center (KSC) and JSC to review the status of the SM and key open issues [59]. The NASA Administrator and the KSC and JSC Center Directors participated in this review. The NASA Administrator had expressed concerns to NASA JSC about SM acoustics before this meeting. Acoustics was covered in a plenary meeting on 27 April 2000. The NASA SLSD staff representative presented the status of SM acoustics. Findings based on preliminary evaluation of the acoustic levels on the ISS were presented, which indicated that the SM exceeded the specification requirements. An overall plan and sequence of measures regarding noise level abatement on the SM was proposed, which was supported by the Joint Commission. Measures to be taken would permit the ISS environment to be used without personal hearing protection, except for short periods of intermittent noise. This was the ultimate intent of the measures.
The results of the April TIM were reviewed at the Flight Readiness Review (FRR) for the SM launch (Flight 1R), held at the end of May 2000, and left open the following issues/risks [60]:
Current acoustic levels in the SM are unacceptable, but are not a launch constraint. Hearing protection is required to ensure habitable/safe level of crew exposure. April testing shows that hearing protection needs to be worn during exercise and,
depending upon exposure levels, 14 hours or more per day. Comfort/irritability and infections may preclude, or make it difficult to wear the
hearing protection for the entire time required. Problems with excessive noise exposure were discussed.
31.5 63 125 250 500 1000 2000 4000 8000 16000 A-wtd OASPL
Octave Band Center Frequency, Hz
So
un
d P
ressu
re L
evel, d
B
90
80
70
60
50
40
30
20
INTERNATIONAL SPACE STATION - Goodman & Grosveld
Chapter V - 71
Concerns are expressed that quiet areas for crew rest/recovery from noise exposure are needed, and the two Kayutas in SM are very loud (65-67 dBA versus the limit of 50 dBA) and there is no third sleep station.
6.2.3 Service Module Noise Control Efforts Just Preceding and After the First Flight
In early June 2000, the U.S. received an updated RAP reporting on when the various kits would be sent up to the ISS by various Progress rockets. Three separate Progress rockets were used to transport the kits. Dates were the same as provided in the April TIM.
In June 2000, the NAL provided levels that the SM would not exceed for a draft change of a Russian SM waiver [61]. The waiver would allow predicted work levels up to 74 dBA until completion of the second expedition flight, which was the estimated time by which the RAP changes should be in place. The waiver was eventually approved with this effectivity, but also with the verbiage that these acoustics limits were in effect until Assembly Complete [62].
On 12 July 2000, the SM was launched atop a Russian Proton rocket. ISS Missions 2A.2b and 2A Space Shuttle supply missions to the ISS followed in September and October 2000. It should be noted that anticipated SM launch dates slipped over time, providing more time for remedial action resolution before flight. In June 1997, the SM launch was scheduled for December 1998, and in June 1999 the launch date was predicted to be in November 1999. The first Increment or Expedition flight mission where crewmembers permanently inhabit the ISS was scheduled in October 2000, when adding the SM to the FGB, and Unity/Node 1 modules. Actual schedule dates for ISS Increments 1 through 34 are shown in Table 11, which will be referred to in subsequent discussions.
In an October 2000 Stage Operations Readiness Review (SORR) for the initial manning of ISS starting the first Expedition Flight or Increment, (designated Mission 2R), the SM continuous noise levels were predicted to be 70 to 75 dBA, and some intermittent noise sources exceeded those levels [63]. The risk mitigation strategy, similar to the one discussed for 1R FRR previously, was presented and the RAP dates for availability of the SM remedial measures were announced. The dates were the same as those defined at the April 2000 TIM, except the Vozdukh modifications slipped from December 2000 until April 2001.
The following was also presented:
Current acoustic levels in the SM are unacceptable, but are not a constraint to launch.
High noise levels in the SM present potential for hearing loss and will require extensive use of hearing protection. Requiring the ISS crew to wear hearing protection measures for 24 hours per day is unacceptable.
The ISS needs to develop a “safe haven” for the ISS crew for 8 to 10 hours per day, keep the two SM sleep stations habitable, and provide an acceptable location for the third crewman.
The goal is to implement the near-term noise reduction modifications during Increment 1.
The acoustics team does not expect the near-term modifications to meet the SM requirement. Quiet fans will be needed to meet the requirement.

NASA/SP-2015-624 – ACOUSTICS AND NOISE CONTROL IN SPACE CREW COMPARTMENTS – Goodman & Grosveld
Chapter V - 72
Table 11. Schedule dates for ISS Increments 1 through 34.
Increment No. Launch Date Landing Date
Increment 1 November 2000 March 2001
Increment 2 March 2001 August 2001
Increment 3 August 2001 December 2001
Increment 4 December 2001 June 2002
Increment 5 June 2002 November 2002
Increment 6 November 2002 April 2003
Increment 7 April 2003 October 2003
Increment 8 October 2003 April 2004
Increment 9 April 2004 October 2004
Increment 10 October 2004 April 2005
Increment 11 April 2005 October 2005
Increment 12 October 2005 April 2006
Increment 13 April 2006 September 2006
Increment 14 September 2006 April 2007
Increment 15 April 2007 October 2007
Increment 16 October 2007 April 2008
Increment 17 April 2008 October 2008
Increment 18 October 2008 March 2009
Increment 19 March 2009 May 2009
Increment 20 May 2009 October 2009
Increment 21 October 2009 December 2009
Increment 22 December 2009 March 2010
Increment 23 March 2010 May 2010
Increment 24 May 2010 September 2010
Increment 25 September 2010 November 2010
Increment 26 November 2010 March 2011
Increment 27 March 2011 May 2011
Increment 28 May 2011 September 2011
Increment 29 September 2011 November 2011
Increment 30 November 2011 April 2012
Increment 31 April 2012 July 2012
Increment 32 July 2012 September 2012
Increment 33 September 2012 November 2012
Increment 34 November 2012 March 2013
The ISS Program needs to reach agreement with RSA on a firm date for meeting the SM
acoustic requirements. New concerns were presented about the following:
Installation of noise control measures will be labor intensive, so the benefits of the measures must be worth manifesting and installing (full-up testing will help resolve).
Further ground testing has slipped to the to-be-determined (TBD) date, and therefore little time exists to collect data before flying the hardware.
The possibility exists that all measures will not prove to be of very significant benefit, which would mean use of hearing protection may be required to be used for a significant amount of the time later, beyond Increment 1.

INTERNATIONAL SPACE STATION - Goodman & Grosveld
Chapter V - 73
Graphs were presented that showed that the Vozdukh modifications tested in April were beneficial in lowering the SM levels at a number of locations, but other modification testing provided minimal benefit.
RSC-E quiet fan technology needs additional funding support and is important in the long term to ensure compliance with SM acoustic limits.
The first Increment started with a crew of three, and the FGB, SM, and Node 1 modules joined together for the beginning of manned ISS operations. The acoustic dBA measurements taken in the SM for the first and second Increments are shown in Figure 57 for the SLM and in Table 12 for the acoustic dosimeter [64].
Increment 1 Increment 2
Position
Vozdukh
CPXK Before mats
After mats
12/19/00 12/28/00 01/03/01 01/10/01 03/04/01 04/03/01 04/03/01 05/25/01 06/26/01
1 62 66 63 65 64.5
2 73.5 72.5 68
3 71 71 71.5 68 68 66.9
4 69 69 66
5 80 77 77 77 67 68 68
6 76 70 75 75 72
7 63 65.5 66 58
8 73 71 71 71.5 67 66 70 66.8 68.5
9 64 65.6 65.5 59
10 74 74 65.3 67 75
11 71 72 68 84 68.6 64.9
Figure 57. Increment 1 and 2 dBA sound level measurements (CPXK: Progress oxygen supply equipment).
Table 12. Increment 1 and 2 acoustic dosimetry.
Increment 1 Increment 2
11/23/00 04/12/00 07/27/01
Sleep compartment 61.6
Sleep compartment 63.8
SM Crew worn 69.9
SM Crew worn 69.6 dBA
SM Crew worn 71.5 73 71.2 Lmax during sleep 84
SM sleep 66.5 Lmax during work >99

NASA/SP-2015-624 – ACOUSTICS AND NOISE CONTROL IN SPACE CREW COMPARTMENTS – Goodman & Grosveld
Chapter V - 74
New operational flight measurement locations adopted refer to these measurement locations as KT positions, with KT3 being at the central post near the CKB, KT5 being near the Vozdukh, and KT7 and KT9 being the starboard and port Kayuta sleep stations (see Figure 57). Note that the dosimeter readings were crew worn and went with the crewmembers wherever they traversed, and where the crew and air-to-ground voice could affect dosimeter readings. On the other hand, SLM measurement protocol was to take measurements without any voice communications or intermittent noises present. During Increment 1, there were problems with the U.S. SLM and dosimeter that resulted in fewer measurements and a reliance on the Russian SLM readings. Increments 1 and 2 acoustic measurements showed higher-than-expected levels in the SM, especially near the Vozdukh and CKBs. Acoustic noise levels in the SM far exceeded the specification limits, were considered unacceptable, and dictated significant crew use of hearing protection devices (ear plugs, noise-cancelling headsets, etc.). The levels on-orbit were considered 10 dBA higher than expected. The Unity/Node 1 module and FGB module were quieter than the SM. During Increment 1, the SM Kayuta doors were removed, elevating the acoustic levels for sleep of the two crewmembers in the Kayutas. Note that one of the NASA recommendations from Mir participation was that the sleeping compartments should have doors added to the compartments, so that crewmembers in the compartments would have a much quieter place to rest and/or sleep [41]. The third crewmember had no sleeping quarters, although at the time the NAL was working at JSC with his Division on a NASA sleeping quarters design approach for use in the SM [65]. Crew-worn dosimeter measurements inside the Kayutas ranged from 61.6 dBA to 71.5 dBA, which was significantly higher than the Russian sleep limit of 50 dBA. Sometime during this expedition, the CKB was wrapped by the crew in an attempt to quiet noise emissions, as shown in Figure 58.
Figure 58. Air Conditioner/CKB wrapping.

INTERNATIONAL SPACE STATION - Goodman & Grosveld
Chapter V - 75
Figure 44 shows the CKB prior to the wrapping. After obtaining Leq(24) averages with the dosimeter of 80 dBA in the vicinity of the Vozdukh and 85 dBA near the CKB, the NAL consulted with IBMP in Russia and relayed requests to the U.S. flight surgeons that two of the three crewmembers wear dosimeters for a 24-hour period and follow the flight rules for wearing of hearing protection [66] (these two crewmembers spent more time in the SM than the other crewmember). This was perceived by the crewmembers as unreasonable, and they wore hearing protection devices (HPDs) during sleep and minimally during the work day [67]. The headsets were an annoyance when worn longer than 2 or 3 hours. The highest crew-worn dosimeter readings shown in Table 12 would result in the crewmembers wearing hearing protection from 17 to 19 hours if values were for 24-hour time-weighted exposure (Table 10).
On 7 February 2001, near the end of Increment I, the Destiny/USL was mated to the ISS complex, adding to the ISS a relatively quiet module that the crew could occupy. The USL and Unity/Node 1 helped lower the accumulated acoustic exposures when the crews spent time in those modules.
Increment 2 SLM readings at the various measurement locations in the SM are shown in Figure 59. Figure 60 shows SLM measurements of the Kayuta in Increment 1 (December and January 2000 readings) and in Increment 2 (April 2001) [67]. Figure 61 shows SLM readings of the Vozdukh taken in both Increments 1 and 2. The Increment 2 crew reported that acoustics was one of the top concerns about habitability. During this Increment, the 17 mats sent up as part of the RAP were installed on interior surfaces, structural elements, and in air ducts showing 0.2 dBA to 3.7 dBA improvements, with reductions partly shown in levels documented in Figure 57 [68]. The 3.7 dBA improvement was at location 11 in Figure 57.
Figure 59. Increment 2 SLM acoustic measurements.
Octave Band Center Frequency, Hz
So
un
d P
res
su
re L
ev
el, d
B
40
45
50
55
60
65
70
75
80
63 125 250 500 1000 2000 4000 8000 OASPL dBA
Point 1Point 2Point 3Point 4Point 5
Point 6Point 7Point 8Point 10Russian Spec.

NASA/SP-2015-624 – ACOUSTICS AND NOISE CONTROL IN SPACE CREW COMPARTMENTS – Goodman & Grosveld
Chapter V - 76
Figure 60. Increment 1 and 2 Kayuta SLM plots.
Figure 61. Increment 1 and 2 Vozdukh SLM plots.
The crew also fashioned a soft cover from on-orbit materials for covering the Vozdukh to reduce its emissions. The cover reduced the levels at the table and Kayuta positions KT7 and KT9 by 3 dBA and 2 dBA, respectively. The Vozdukh cover is shown in Figure 62. Another Vozdukh cover or a modified version that was used in Increment 2 that continued to be used
Octave Band Center Frequency, Hz
So
un
d P
res
su
re L
ev
el, d
B
35
40
45
50
55
60
65
70
75
31.5 63 125 250 500 1000 2000 4000 8000 OASPL dBA
71.6 dB
70.1 dB
December 28thJanuary 10thApril 5th
Octave Band Center Frequency, Hz
So
un
d P
res
su
re L
ev
el, d
B
45
50
55
60
65
70
75
80
85
31.5 63 125 250 500 1000 2000 4000 8000 OASPL dBA
80.2 dB
72.5 dB
December 28thJanuary 10thApril 5th

INTERNATIONAL SPACE STATION - Goodman & Grosveld
Chapter V - 77
through later missions is shown in Figure 63. It is believed that mufflers over outlets were also added at measurement locations KT5 and KT6. The on-orbit fixes made by the crew helped lower acoustic levels. During the checkout procedures, the crewmember performed sample readings close to the Vozdukh with and without the cover. SLM readings were 68 dBA with the cover, and 72 dBA without the cover.
Figure 62. Vozdukh cover fashioned by crew.
Figure 63. Another Increment 2 Vozdukh cover.
These values were close to what was expected. It is believed that the lower Vozdukh
measurement readings in Figure 57 and Figure 61 were taken with the cover installed. The Vozdukh was a continuous and intermittent noise source. It had many modes of operation for which emissions changed dramatically. A Russian report noted that the installation of sound-absorbing mats on interior panels and sound-insulating housing for the Vozdukh system enabled the noise level to be reduced an average of 5 dBA, including a decrease of 8 to 9 dBA in the maximum noise area near the Vozdukh (based on the results of actual flight measurements other than those shown [69]). Also, Vozdukh operational modes could have changed during testing. In another report, the following measurements were reported: the transfer compartment (ПXO) levels were 75 dBA, with fans being the primary sources; the working compartment small diameter PO was 75 to 76 dBA with the CKB and the condensate pump the primary noise sources; the working compartment large diameter section was 68 dBA, caused mainly by the Vozdukh system, and the Kayutas 57 to 61 dBA with the one on starboard quieter. Noise was exceeding the limits by 4 to 16 dBA in the SM, by 11 dBA in the port Kayuta, and by 7 to 9 dBA in the starboard Kayuta. Note the high maximum dosimeter (Lmax) readings in Table 12, going up to 84 dBA during sleep and greater than 99 dBA during work. These Lmax dosimeter readings were of concern as they indicated that these high levels occurred during the time the dosimeter was operating, which was especially troublesome during sleep periods because of potential sleep disruption.
The U.S. Increment 2 crew voiced concerns about the acoustic levels in the SM and strongly recommended that a kit of quieting materials should be flown that could be used in the same manner as what they fashioned for mufflers, using on-board materials. As a result, the U.S. started developing a kit from flight-certified materials. As for the rationale, it was indicated that

NASA/SP-2015-624 – ACOUSTICS AND NOISE CONTROL IN SPACE CREW COMPARTMENTS – Goodman & Grosveld
Chapter V - 78
the acoustic noise levels in the SM far exceeded the specification limits and dictated substantial use of hearing protection devices (ear plugs, noise-cancelling headsets, etc.) [70]. The SM acoustic environment was a serious concern because the crew spent so much of their time in the SM, which was the primary reason for high crew noise exposure readings. RSC-E action to quiet the SM was considered too slow and insufficiently effective (the schedule for the formal plan had slipped and the Russians indicated funding was not available). NASA had advised that the CKB compressor be covered by barrier material to achieve better blockage of emissions and BISCO® barrier material was to be included in the kit. The Russian side expressed concerns with crews fashioning noise control measures that could affect performance or would otherwise technically not be acceptable. However, RSC-E indicated a basic agreement with the Quieting Kit approach, provided that adequate controls were made with its use and a materials/safety review follow-up was held. Flight crews would identify the specific use of the kit (i.e., cover a panel, put an isolation pad underneath a pump, etc.), and identify which materials and tools would be used. Specifically, targeted quieting modification of ISS hardware in modules would be developed after the kit was manifested. This approach could be used for items such as: Pump Package Assembly (PPA) hush kits for the USL; SM sleeping quarters quieting kit; and SM Air Conditioning (CKB) compressor vibration isolation kit. Such kits would be specifically designed to control the noise of targeted hardware that needed quieting, and would use materials from the general purpose kit. A process was proposed on how to manage real-time changes using the kit.
Samples of proposed kit materials, and materials data were taken to a TIM with RSC-E in June 2002 [71]. At this TIM, NASA noted the use of “improvisational” acoustics fixes, using samples of materials on-board, provided significant noise reduction per chronology reviewed, even though the materials did not have especially good acoustic absorption properties. This is believed to be because they blocked and diffused the emissions. After further discussions, the NAL and NASA decided to table their efforts on the quieting kit because of the following reasons: it was felt that the Russian side was not really supportive about using the kit due to concerns about oversight of on-orbit fixes; the potential of time-consuming trial-and-error crew activity; and that it would be best for RSC-E to be developing fixes, and having ownership of them. Also, because these noise control measures could be worked out and tested beforehand in the KIS/Complex Stand facility to ensure flight fixes would be worthwhile and their incorporation would be technically acceptable. In addition, noise control measures need not only lower emissions from principal noise sources, but also lower overall exposure levels, and the KIS would be a better place to resolve accumulative benefits of these measures and perform trial-and-error efforts than the flight SM. In retrospect, this was a sensible decision considering all of the iterative remedial action changes that were subsequently developed in ground testing, and used to lower SM levels with tepid results. Most fixes had to be tailored for the location in which they were used. The status of the RAP was reviewed at this June 2002 TIM [71]. Locations of RAP hardware changes were assessed in the KIS facility to enable NASA’s understanding of these changes. Both sides agreed to the items in the RAP. NASA expressed concerns about the long lead time to get modifications designed, fabricated, and flown. Both sides agreed it was essential to have the Kayuta door closure implemented to achieve specification levels. Actions to review potential use of ISS fans in the SM were agreed to, and

INTERNATIONAL SPACE STATION - Goodman & Grosveld
Chapter V - 79
the Acoustic Measurement Plans for Increments 5 and 6 were agreed to. NASA offered RSC-E acoustic materials samples at the meeting and expressed its willingness to provide support in the form of materials either for prototyping or for flight, upon RSC-E request.
As discussed previously, the initial ISS flights only had two sleep stations (Kayutas) in the SM, and their interior acoustic levels were very high. It was strongly felt that sleep stations had to be quiet to offer the crews hearing mechanisms rest and recovery time. Since the original crew of the ISS existed of up to three members, one of the crewmembers had to sleep in a module open area, susceptible to unreduced module emissions. There was a good deal of pressure to provide a third, quiet sleeping quarters. As noted previously, NASA was looking into a sleeping enclosure approach to use in the SM in 1998 [65]. The TeSS was developed to be installed in the USL for this purpose, and to provide privacy and other features. The TeSS was launched on Flight 7A.1 at the end of Increment 2, and was installed for use by the Expedition 3 crewmembers and future crew in the USL, which was sent up earlier on ISS flight 5A. The TeSS helped lower the acoustic dosage for the crew that used it. Further discussions on the TeSS development and hardware will be provided in Section 11.1.
In October 2002, the following was presented about acoustics for the 11A SORR for Flight of Stage 11A and Increment 6 [72]:
Acoustic levels are acceptable for flight of this Stage and Increment. Use of HPDs are required in the SM and when sleeping in the SM Kayutas. Acoustic levels in the SM are unacceptable and remedial action fixes are not planned
for this Increment (see Figure 64 for levels in the SM during Increment 5 [73]). Acoustic levels in the FGB and Russian Docking Compartment are high, but have
been accepted due to limited stay time/operations. SM levels impact crew health (threshold shifts, etc.), habitability, and performance. ISS crews have reported acoustics as one of the top habitability issues. Use of hearing protection was intended as a temporary measure. It does not afford
adequate protection, and is not a long-term solution. SM noise levels are dominating all crew noise exposure readings because all
crewmembers have their meals, exercise, waste management/hygiene, and other functions in the SM.
Leq(24) exposure levels are very much affected by high noise exposures in the SM. SM Remedial Action fixes have not been very effective in lowering noise levels and
reducing crew exposure. Acoustics information/data on payloads/experiments added on-board SM is lacking. Treadmill (NASA provided GFE) adds to the already high SM levels and Leq(24)
exposure levels (treadmill acoustics had been a Russian and U.S. concern for some time since it added significant emissions to an already high noise level in the SM).
The Increment 6 NASA Flight Surgeon inputs on acceptability of SM levels are: SM levels are unacceptable. “GO” for launch (with reservations).
A conclusion was that the SM needed to be quieted. Several comments were included on the RAP: A number of RAPs have existed since 1999, but schedules slipped and the content changed; several remedial action fixes have been implemented: improvisational fixes (mufflers,

NASA/SP-2015-624 – ACOUSTICS AND NOISE CONTROL IN SPACE CREW COMPARTMENTS – Goodman & Grosveld
Chapter V - 80
CKB wrap, Vozdukh cover) and manifested fixes (Vozdukh cover, sound insulation of the micro-compressor and vacuum pump of Vozdukh, 17 mats, CKB isolators and flex lines, and other modifications); concern that RAP implementation dates, as related to “technical decisions” (a Russian document), needed to be addressed; and RAP delays and current baseline/dates are not known.
Figure 64. SM measured acoustic spectrum at measurement locations, Increment 5, 3 September 2002.
It was noted in the October 2002 briefing that the NASA ISS Program Manager had approved a SM waiver until ISS Assembly Complete at the end of January 2002, and this was just recently discovered. It was also noted at this meeting that the NASA ISS Program Office had indicated they would provide funding for SM quieting. Developments of plans were in process to provide incremental funding based upon performance milestones, establish current RAP status, etc. ISS requested RSC-E to pull together estimated costs and an updated schedule for the acoustic RAP with the information to be available by the end of October 2002. At that time, a follow-up Acoustics TIM was anticipated to be set up in late November or early December 2002. Other efforts to resolve the contract details, and the availability and acceptability of transfer of funds delayed this TIM until in 2004. Further efforts concerning NASA funding for SM quieting would be discussed at a later time.
Increment 6 took place from late November 2002 until late April 2003. Acoustic measurements in dBA for each location, taken on three different days during this Increment, are presented in Figure 65. Increment 6 measurements taken with crew worn dosimeters are provided in Table 13 for three different dates and three different crewmembers [74]. Table 13 is color coded to show the effect on the dosimeter readings for the crew time spent in the work location, crew time spent in the sleep location, and the Leq(24) time-weighted average. Note that Crew A slept in the Node 1, rather than a Kayuta, and worked part of a day in the USL. The
Octave Band Center Frequency, Hz
So
un
d P
res
su
re L
ev
el, d
B
35
40
45
50
55
60
65
70
75
80
85
63 125 250 500 1000 2000 4000 8000 OASPL dBA

INTERNATIONAL SPACE STATION - Goodman & Grosveld
Chapter V - 81
Crew B members, who spent most of their time in the Russian Segment experiencing very high acoustic levels at the work location as well as the Kayuta sleep location would, per the flight rules, be required to wear HPDs 11 hours on one day, 14 hours on another day, and 17 hours on the last day (flight rules were shown earlier in Table 10). Crew B reported use of HPDs for 20 to 22 hours per day, and another reported wearing HPDs 80% of the time. Note that Crews A and C spent some of their workday in the SM, raising their exposure levels. However, their exposure did not dictate use of hearing protection except for 10 February 2003, when 2 hours of hearing protection wear was required. Sleeping in the Node and TeSS, and working in the USL and Node 1 helped minimize the Leq(24) exposure levels. Remember that the SLM measures steady-state continuous noise, whereas the dosimeter also measures intermittent noise, including voice and air-to-ground communications.
Date KT1 KT2 KT3 KT4 KT5 KT6 KT8 KT10 KT11 Spec
01/03/2003 65.8 66.9 67.1 68.1 69.3 68.8 66.8 66.6 68.9 60
02/14/2003 65.4 71.4 67.7 68.6 67.6 69.4 61.2 68.3 66.1 60
04/03/2003 64.6 69.2 65.7 69.2 68.1 68.8 68.5 70.8 66.3 60
Figure 65. SLM measurements in dBA at measurement locations, for three different Increment 6
measurement dates in 2003.
Table 13. Increment 6 acoustic dosimeter readings.
Work Sleep 24-Hour
Date Crew A Crew B Crew C Crew A Crew B Crew C Crew A Crew B Crew C
12/20/2002 67 70 66 56 62 52 66 69 64
02/10/2003 69 71 69 58 67 51 67 70 67
04/01/2003 66 72 67 58 72 48 64 72 65
Red – Majority in Russian Segment Green – Node 1 Sleep Values Orange – TeSS Sleep Values Blue – Majority in USL Purple – Kayuta Sleep Values White – Split Time Work Values
Overall SM levels, while somewhat reduced by RAP measures implemented at that time,
were still unacceptable into Increment 6. Some RAP hardware is believed to have been available but not yet installed: vibration isolators and revised long spiral wrap for CKB; sound insulating mat for CKB cover panels; 14 fan isolators; and vibration isolator and sound-absorbing cover on the Vozdukh housing. Other RAP measures researched or developed were not available yet for flight, primarily due to lack of funding. At times, there were RAP measures on-board, but insufficient time/priority to install them. In April 2003 during a teleconference with RSC-E, NASA asked what could be done to speed up measures to reduce noise. RSC-E responded by providing a list of items that were under consideration, including: vibration isolators; sound-absorbing mats; sound-absorbing inserts in air ducts; mufflers at the inlet and

NASA/SP-2015-624 – ACOUSTICS AND NOISE CONTROL IN SPACE CREW COMPARTMENTS – Goodman & Grosveld
Chapter V - 82
outlet of three fans; and vibration damping foil to sections of the air ducts [75]. There was also interest in using some NASA materials, chosen from samples provided to RSC-E by NASA at a TIM. NASA had previously provided more data on U.S. materials to RSC-E.
In March 2003, during Increment 6, it was noted in a contractor input in support of an ISS briefing that, based upon flight mission monitoring for the Acoustics Office: “the Crew reports that acoustics is the most significant habitability issue.” Also, “Increased use of hearing protection devices results in discomfort, increased infection risk, and decreased desire/ability to wear them for required periods” [76].
In the spring of 2003, a Joint NASA Advisory Council Task Force (TF) and Rosaviakosmos Advisory Expert Council (AEC), Stafford-Anfimov Joint Commission was setup to assess the readiness of the ISS Expedition (Increment) 7 mission for the NASA Administrator and his Russian counterpart [77]. Commission meetings were held in Houston, Texas, in March 2003 and in Moscow in April 2003. Acoustics was one of the items reviewed. During the Houston meeting, Russian officials indicated that the SM acoustic levels were as quiet as the meeting room, the 9th floor conference room in Building 1 at NASA JSC (“when no one was talking”). The next morning, NASA acoustics representatives provided a simulation that demonstrated the noise levels from a recent ISS mission. Flight-type SLMs and flight data supplemented the demonstration to show that the sound levels presented audibly were accurate. A number of the representatives from the Russian side took strong exception to the high noise levels of the demonstration, articulating that the SM was quiet, and that this demonstration was too loud and incorrect. An experienced Expedition 7 astronaut was called in to see whether the demonstration was really representative of SM acoustic levels. The astronaut indicated the demonstration was representative.
It was difficult to understand why, at this stage, any doubt remained on the Russian side that the SM needed quieting. However, the Stafford-Anfimov Joint Commission, including the Russian management agreed with the plan to reduce noise levels in the SM, including improving the methods for manufacturing fans and installing soft air ducts and noise-absorbing panels. The Stafford Commission strongly recommended full implementation of this plan as soon as possible, in accordance with the planned schedule, with the highest priority given to reducing noise in the crew sleep stations and SM volumes. When the meeting minutes of this commission were forwarded to the NASA Administrator and head of Russian Aviation and Space Agency, it was noted that the agreed-to schedule of the RAP was uncertain due to funding concerns [78].
Another complication with installation of measures was the crew size. Crew size was only three through Increment 6, and then was reduced to two in Increment 7 until Increment 13, when it increased to three again. So there was difficulty getting time for installing remedial acoustic measures and, on occasion, performing acoustic measurements. The planned crew size of six did not occur until Increment 22/23 (Increment 22 started in November 2009).
The progress of lowering acoustic levels in three critical areas of the SM for Increments 6 through 8 is shown as follows: KT3 measurements near the central post are shown in Figure 66; KT5 measurements close to Vozdukh are shown in Figure 67; and KT7 measurements in the starboard Kayuta are depicted in Figure 68 [79].

INTERNATIONAL SPACE STATION - Goodman & Grosveld
Chapter V - 83
Figure 69 shows how measurement points varied in dBA from Increment 1 through Increment 8 [80]. Increment 8 ran from October 2003 until the end of April 2004. Acoustic levels at measurement locations varied somewhat between Increments.
Figure 66. Variance in levels, at KT3 measurement point from Increment 6 through Increment 8.
Figure 67. Variance in levels at SM measurement point KT5 (Vozdukh area) from Increment 6 through 8.
Octave Band Center Frequency, Hz
So
un
d P
res
su
re L
ev
el, d
B
40
45
50
55
60
65
70
75
80
63 125 250 500 1000 2000 4000 8000 dBA
Octave Band Center Frequency, Hz
So
un
d P
res
su
re L
ev
el, d
B
40
45
50
55
60
65
70
75
80
63 125 250 500 1000 2000 4000 8000 dBA

NASA/SP-2015-624 – ACOUSTICS AND NOISE CONTROL IN SPACE CREW COMPARTMENTS – Goodman & Grosveld
Chapter V - 84
Figure 68. Variance in levels at SM measurement point KT7 (Kayuta) from Increment 6 through 8.
Figure 69. Variance dBA in SM measurement points from Increment 1-8, which ended in April 2004.
Octave Band Center Frequency, Hz
So
un
d P
ressu
re L
evel, d
B
30
35
40
45
50
55
60
65
70
75
80
63 125 250 500 1000 2000 4000 8000 dBA

INTERNATIONAL SPACE STATION - Goodman & Grosveld
Chapter V - 85
Figure 66, Figure 67, Figure 68, and Figure 69 show that acoustic levels were still high in the different areas. Each measurement point had a range of varying curves with only a small downturn in levels, in spite of RAP measures. Crews still had to wear HPDs for long periods, because the Leq(24) was as high as 72 dBA (17 hours of wearing HPDs were required at that level) and crew-to-crew communications and habitability in the SM were compromised. A summary of acoustic dosimetry taken from Increment 1 through Increment 8 is provided in Table 14 [79]. Reference 79 indicated the following: “The 24-hour crew-worn exposure levels were, on average, between 66 dBA and 72 dBA. Almost all of the daytime values for Increments 7 and 8 fall between 68 and 72 dBA, depending on which module the crew worked in. The daytime values when working in the USL are consistently around 66 dBA, but when in the SM, they are closer to 70 dBA. This difference, between working in the two areas, shows why wearing hearing protection in the SM is recommended. Normally, during Increments where there are only two crewmembers, less time is spent by any one crewmember in the SM. Increment 8, also a two-man crew, actually showed increased SM activity by both crewmembers during the measurements.” During Increment 8, six modules were available for the crew to occupy. Reference 79 also reported on static dosimeter measurements at three locations in the SM on 22 March 2004. The 14-hour time-weighted average for each location was as follows: Vozdukh (KT5), 74 dBA; TVIS location (KT8), 72.3 dBA; and the Central post location (KT3), 67.9 dBA. Another factor influencing the 24-hour time-weighted average was the sleep location, whether it was in a Kayuta, in the TeSS, or in Node 1. The TeSS and Node 1 were much quieter, with the TeSS the quietest. On 9 December 2003, one crewmember had an approximately 9-hour dBA reading of 51.9 dBA (in TeSS), where another crewmember had a 65.7 dBA measurement (in the SM), a significant difference [79].
Table 14. Dosimeter chronology Increment I through Increment 8.
Work Sleep 24-Hour
Date CDR FE1 FE2 CDR FE1 FE2 CDR FE1 FE2
Inc. 1 11/17/2000 70 70
11/21/2000 70 72 70 72
Inc. 2 04/11/2001 73 60
07/24/2001 71 69 67 52 70
Inc. 3 11/1/2001 67 65 70 67 65 70
Inc. 4 01/02/2002 65 64 59 44 64 62
03/05/2002 72 67 64 50 71 65
Inc. 5 07/10/2002 72 70 73 60 44 63 70 68 72
09/12/2002 73 69 73 64 57 65 72 67 72
Inc. 6 12/30/2002 67 70 66 56 62 52 66 69 64
02/10/2003 69 71 69 58 67 51 67 70 67
04/01/2003 66 72 67 53 72 48 64 72 65
Inc. 7 05/27/2003 67 67 64 47 66 65
07/01/2003 69 73 63 59 68 71
08/04/2003 67 65 65 65 66 65
Inc. 8 12/09/2003 70 70 52 66 68 69
03/22/2004 68 72 67 72
Green = Node 1 Sleep values Blue = US Lab Work values Purple = Kayuta Sleep values
Orange = TeSS Sleep values Red = SM Work values Black = Split Time Work values, 24-Hour Equivalent Levels

NASA/SP-2015-624 – ACOUSTICS AND NOISE CONTROL IN SPACE CREW COMPARTMENTS – Goodman & Grosveld
Chapter V - 86
Since early SM acoustic TIMs, the NASA and Russian sides agreed to have a quiet Kayuta, or sleeping quarters. During the first Increment, the doors were removed and it was difficult to get the doors back on, partly because of computer cables that were passing from the outside to the inside of the Kayutas and computer-related bracketry that precluded the door from closing (cables and bracketry supported crew use of computers inside the Kayutas). When doors were installed, crews would sometimes close the doors as much as they could, but sometimes they would not. Figure 70 shows a photograph taken during Increment 2 of the starboard Kayuta with the bracketry and cable crossing the door threshold. Note the door seal is a black rubber-type material around the periphery of the door opening. The photograph in view B of Figure 39 shows both Kayuta doors off, or the starboard door at that time open or stowed near the doorway, and the portside Kayuta door off with and partially filled with stowage items (Increment 1). The right view in Figure 7 shows the cable and bracketry, with the starboard Kayuta door removed during Increment 1. Not having doors on or not having the ability to close the Kayuta doors all the way for the duration of the ISS flight helped create high Kayuta acoustic levels. Figure 71 shows a “fish eye” lens view of the SM looking forward, with both Kayuta doors on and closed (doors are at the far right and left sides of this figure) in a much later Increment. Further quieting of the Kayuta structure, fan flow inlets and the fans were also needed to bring the Kayuta acoustic environment down to an acceptable level.
Figure 70. Starboard Kayuta with door off and bracketry and
cable across door opening.
Figure 71. Fish eye lens view of SM, looking forward. Later when Kayuta doors were installed and closed.
In 2004, four isolators were installed in Increment 9. Two examples are shown in Figure 72, with an isolator before it was installed on a later flight.

INTERNATIONAL SPACE STATION - Goodman & Grosveld
Chapter V - 87
Figure 72. The two left-hand photographs show typical vibration isolators for fans added during Increment 9. The right photograph shows a similar type of isolator not yet installed on Increment 13.
In March 2004 (near the end of Increment 8), meetings were held in Moscow to discuss the NASA new contract funding and key facets/terms of a related contract with the Russians on the following: development of quiet fans; further assessment of NASA materials to support remedial actions; and modifications to the ventilation system, air conditioner, and Vozdukh [81]. A large number of isolators (three sizes) and mufflers, and some mats and panels, were included in the ventilation phase, adding to previous limited quantity. Payments were incentivized, based upon performance, with the design objective to reach a 63 dBA level for the SM centerline work areas, and 50 dBA in the Kayuta sleep compartments. The 63 dBA exceeded the 60 dBA specification level, but was determined to be acceptable both medically and operationally. The 63 dBA would eliminate the need for continuous hearing protection, and would also be low enough that communications would be improved to an acceptable degree. Three TIMs were included as part of the programs schedule. This effort would infuse sorely needed funding into the program, put stronger emphasis on more timely and effective SM quieting, and set up milestones for performance, delivery dates for measures, and reporting on progress. The reporting to NASA was more incentivized, which NASA hoped would lead to a significant improvement. The experience RSC-E had up to this point with the development of individual RAP measures, testing them in the KIS facility, and then incorporating the measures in the flight SM provided an experience base for a more disciplined, more thorough, and well-funded effort. The contract was signed by the RSA in June 2004.
6.2.4 Renewed Service Module Noise Control Efforts
The first new contract related acoustics TIM was setup in Moscow from 28 June until 2 July 2004, which occurred near midway in Increment 9 [82][83]. The TIM was considered very successful and a promising first step in restructuring remedial actions necessary on the SM. Key items that resulted from the meeting were as follows:
The Russian side will concentrate on each significant continuous noise source.

NASA/SP-2015-624 – ACOUSTICS AND NOISE CONTROL IN SPACE CREW COMPARTMENTS – Goodman & Grosveld
Chapter V - 88
To manufacture the noise reduction means, RSC-E needs materials from the U.S. The materials will be shipped from the U.S. as soon as possible. This was the most important issue at that time. U.S. Nomex® fabric and Durette® materials were planned to line the walls of air ducting. U.S rubber materials would be considered for isolation mounting of some fans. Fan shock absorbers previously developed had their deliveries expedited, but not all were installed. Four isolators were reported previously to be installed during Increment 9 (Figure 72). RSC-E presented detailed information on the planned noise reduction steps for each of the above-mentioned systems in the SM. All the dates corresponding to the ventilation system were contingent on the U.S. material delivery. Figure 73 shows a proposed air conditioner system (СКВ) configuration before and after installation of noise-reduction hardware, with a new extended muffler cover installation, wraps, and fan vibration isolator applications [84]. The multi-layer blanket proposed by RSC-E used some U.S. materials. The noise reduction system for the Vozdukh microprocessor was scheduled to be delivered on an upcoming Progress vehicle. Some mufflers for the air conditioner (CKB) fans and air duct were delivered and others were to be provided on future Progress vehicles.
The manufacturing of flight hardware made from U.S. materials and designed to reduce the ventilation system noise needs to be completed by November 2004 to meet the Progress launch date in January 2005. RSC-E had concerns about meeting the schedule because of the delay in U.S. materials delivery.
The dominant noise sources for each of the different SM areas were discussed. Four ventilation fans were the dominant noise sources for the crew quarters. Vibration of the walls due to fans was of concern and a thicker shock absorber was planned.
RSC-E designed special cables to control speeds of some fans so they could be turned off at night, a very helpful tool to minimize noise during sleep.
In order for the noise requirements in the crew-cabins (sleeping quarters) to be met, the cabin doors must be closed. To enable these doors to close, new computer brackets were being produced beyond the frame of the contract.
RSC-E presented the plan for low-noise fan development. The main specific features of this fan would be reduced rotations per minute (rpm) of the working wheel and new blade profiles. The new fans would keep the main characteristics of the current fans. According to the assessment, the overall duration to manufacture the flight-qualified fans is 3.25 years. NASA expressed concern about the overall length of time to produce the fans. The manufacturing and manifesting of the low noise fans will be completed by RSC-E outside of the current contract.
Current data show SM working level limits are exceeded by 1.2 to 18.4 dBA, night-time levels by 1.6 to 13.7 dBA, and Kayuta sleep limit levels by 9.2 to 24.6 dBA.
Weekly teleconferences were held with RSC-E to review progress, and facsimile transmittals of documentation were exchanged. This was done previously, before the new contract was in place, but progress had been slow, dropouts in communications and deferrals of TIMs had occurred, along with indications of a lack of funding. Now there was increased flow of information on RSC-E progress, and expedited efforts.

INTERNATIONAL SPACE STATION - Goodman & Grosveld
Chapter V - 89
Figure 73. Air conditioning system (CKB) quieting approach.
In a Russian and U.S Chapter on “The Habitable Environment of the ISS,” it was reported that the SM exceeded allowable levels at work places in the first nine Increments“ by 1 to 18 dBA, in transfer compartments by 2 to 14 dBA, and cabin (Kayutas) by 9 to 25 dBA” [85]. Average work place levels were 68 ± 0.5 dBA, and Kayutas 67 ± 2 dBA. Increment 9 ended in October 2004. The SM noise levels varied and diminished over time as some of the older and mainly the newer RAP measures were implemented. Levels varied for a number of reasons, including: it was hard to control all the noise sources that were operating at the time of measurements; and control what experiments were added that were “on” during measurements and the mode in which the hardware was operating (i.e., Vozdukh). Also, hardware was periodically changed out because of the life of the hardware, repaired or modified, potentially affecting acoustic levels. In addition, when RAP changes were implemented, this usually resulted in panels being opened that would normally be closed, thereby increasing acoustic levels in the SM.
Significant progress in the status of ventilation system remedial actions was reported to the ISS Program near the end of March 2005, as follows [86]: ventilation fans that have vibration isolators or acoustic-lined ducting are shown in Figure 74 [37]; vibration isolators are now on-board for 20 of 22 fans planned to have isolators added (two of them have been installed); eight planned wraps of fan casings are on-board with five of them installed; five inlet and five outlet mufflers are on-board to be added, with one of each installed; two Kayuta mufflers for the register are on-board and ready to be installed; and two soft duct insert, acoustic louvers are on-board, ready to be installed. In a number of cases, the U.S. materials would later be replaced with comparable Russian materials when they need to be replaced. It was not clear

NASA/SP-2015-624 – ACOUSTICS AND NOISE CONTROL IN SPACE CREW COMPARTMENTS – Goodman & Grosveld
Chapter V - 90
about whether the isolators on-board reflected the four already documented to be installed in Increment 9. It is believed that some of the isolators were the 14 isolators previously noted to be available in April 2003, before the new contract was put in place, and were delayed, but now expedited. Photos of tested Kayuta acoustic treatments that were planned to be installed in the SM shown are shown in Figure 75 [86].
Figure 74. SM fans; Highlighted fans have vibration isolation and/or acoustic lining.
Figure 75. Acoustic fan duct linings in fan inlet (left) and fan outlet (center) for Kayuta area, and padded register outlet (right photograph).
The second TIM on the new contract and new RAP progress was held in Houston, April 2005 [87][88]. Each system modified under the new contract was discussed as well as the following topics: noise measurements taken inside the SM; effects of noise (by NASA and RSC-E medical experts); U.S. presentations on fan noise reduction; status of the RSC-E low noise fans; and the contract status. Other items of significance were as follows:
Phase 2 on ventilation modifications on the contract was to be completed by February 2005, but was delayed until December 2005. Phase 2 Air conditioner modifications moved from completion in April 2005 to December 2005, and Phase 2 Vozdukh modifications were changed from December 2004 to September 2005. Low
Highlighted FANS feature: - vibration isolation - acoustic lined duct

INTERNATIONAL SPACE STATION - Goodman & Grosveld
Chapter V - 91
noise fan effort Phase 1 was completed in September 2004, and production had been delayed until TBD date.
As noted previously, RSC-E designed special cables to control speeds of some fans so they could be turned off at night, to minimize noise during sleep.
RSC-E presented information on fans that were quieter than current fans being used, termed “medium noise fans,” which would be installed upon failure of current fans and exhaustion of on-orbit spares.
Noise-reducing system for the Vozdukh micro-compressor will be delivered on an upcoming Progress rocket.
Some mufflers for the CKB air conditioner and the air duct were delivered. What needs to be done to complete resolution of the Kayuta quieting was discussed,
including stiffening the fan duct, and adding rubber and absorbing mats, such as those shown in Figure 75.
Both U.S. and Russian sides were concerned about the installation of measures in the flight SM. It was estimated that the installation of all measures would take 24 working hours.
More TIMs followed, but it may be meaningful to take a look at the hardware changes made to the most significant systems as a result of efforts applied on the new contract. Ventilation system modifications included installation of vibration isolators on 20 fans; casing wraps on 10 fans; six fan inlet mufflers; and four fan outlet mufflers. Vibration isolators of the type previously developed and installed on Increment 9 (Figure 72) continued to be expedited and installed, and are shown in Figure 76 and Figure 77. Other isolator types with foam pads and springs, using NASA-provided isolator pad materials, are depicted in Figure 78 and Figure 79. Fans with foam isolator pads and absorbent pads are shown in Figure 80 and Figure 81 [89]. Soundproof wraps to reduce fan casing emissions were also applied to fans, as can be seen in Figure 82 through Figure 86. Figure 86 also shows an isolator. Figure 87 depicts a foam isolator pad on an unattached fan and an absorbent pad [89].
Figure 76. Fan vibration isolator.
Figure 77. Fan vibration isolator.

NASA/SP-2015-624 – ACOUSTICS AND NOISE CONTROL IN SPACE CREW COMPARTMENTS – Goodman & Grosveld
Chapter V - 92
Figure 78. Fan, foam isolator pads and springs.
Figure 79. Fan, foam isolator pads and springs.
Figure 80. Fan foam isolator pad (brown) with spring not showing and absorbent pad.
Figure 81. Fan with foam isolator and absorbent pad.
Figure 82. Soundproof wrap on fan.
Figure 83. Soundproof wraps on fan installation.
Spring
Foam isolator
pads

INTERNATIONAL SPACE STATION - Goodman & Grosveld
Chapter V - 93
Figure 84. Another fan wrap/soundproofing wraps.
Figure 85. Isolator and soundproofing wrap.
Figure 86. Fan soundproofing wrap, isolator, and acoustic absorbent pads.
Figure 87. Fan (not installed), with isolator pad and absorbent pad.
Controls were added to regulate the Kayuta fan speed and cable routing holes were included for the Kayuta doors (both doors installed). Figure 75 shows the type of Kayuta fan duct linings and padded outlet register that were later added. Figure 88 shows an added padded louver on the Kayuta fan inlet, mounted on a panel to be installed, with the circular inside padding attached to the fan in this area [86]. As a result of the Kayuta doors being added and closed during sleep, and other Kayuta modifications, the Kayuta acoustic levels over time were significantly reduced in 2006 and early 2007, as shown in Figure 89. The Kayuta doors were reinstalled with corrected bracketry on the starboard Kayuta (KT7 location) at the end of 2005, and on the port Kayuta (KT9 location) in October 2006 [4]. These dates correspond to Increments 12 and 14, respectively.

NASA/SP-2015-624 – ACOUSTICS AND NOISE CONTROL IN SPACE CREW COMPARTMENTS – Goodman & Grosveld
Chapter V - 94
Figure 88. Padded louver on Kayuta fan inlet.
Figure 89. SM Kayuta control points in SPL over time. Courtesy, NASA, Jose Limardo-Rodriguez.
Vozdukh controls include the outer cover over the installation used in Increment 2, shown in Figure 63. Also added was an acoustic cover for the micro-compressor, a cover over the fan (which operated all the time), and an additional cover behind the closeout panel. Figure 90 through Figure 93 show a progression of quieting steps for the Vozdukh fan [89][90]. Figure 90 shows the fan installation. Figure 91 shows a portion of a planned soundproof cover installed over the fan. The complete installation was unsuccessful because clearances necessary to install the upper half of the cover were insufficient. Figure 92 shows soundproof wrap added to the
Kayuta inlet fan
View at backside/outboard side of louver installed on panel
= Air direction Ceiling panel with the Kayuta air inlet louver installed
Kayuta air register
68
66
64
62
61
58
56
54
52
50 2001 2002 2003 2004 2005 2006 2007

INTERNATIONAL SPACE STATION - Goodman & Grosveld
Chapter V - 95
Figure 91 configuration, whereas Figure 93 shows soundproof blankets installed over the configuration shown in Figure 92. With this final installation noise from the fan was measured to be reduced by approximately 9 dBA in the vicinity of the Vozdukh.
Figure 90. Vozdukh fan.
Figure 91. Hard cover.
Figure 92. Soft cover.
Figure 93. Soundproof covers.
The following CKB modifications were included: a hard one-piece outer cover was installed
over the CKB in Increment 13 as shown in Figure 94, replacing the two-piece cover shown in Figure 42. Benefits of this cover are shown in Figure 94; a cover for each compressor and its lines and isolators for two fans per CKB (Figure 95); modified compressor isolators; and a noise dampening cover for fan BP shown in Figure 95 [89] and in a sketch in Figure 73.
Integrated interior panel 204+205 installed on-board the ISS RS SM
Noise spectra in zone of [CKB] before and after the installation of soundproofing panels 204+205
Figure 94. Hard air conditioner (CKB) cover (left), and benefits of adding this cover (right).
16 20 2531.50
40 50 63 80 100
125
160
200
250
315
400
500
630
8001000
1250
1600
2000
2500
3150
4000
5000
6300
8000
1000
0
1250
0 A L
частота, Гц
ур
ов
ен
ь, д
Б

NASA/SP-2015-624 – ACOUSTICS AND NOISE CONTROL IN SPACE CREW COMPARTMENTS – Goodman & Grosveld
Chapter V - 96
Figure 95. Air conditioning (CKB) modifications-covers for compressor and lines (left), and white padded cover for fan (right).
Resulting sequence and overview of progress is best summarized by what was reported in the SM NCR, number NCR-RS-017, dated 2008 [91]. NCRs are reports required to document a non-compliance and the status of resolving the issue. In September 2005, a proposed NCR update to the ISS Program resulted in the following NCR verbiage [92], which reported progress as follows:
”Since the March 2004 NCR update, and the initiation of the SM Noise Reduction Contract significant progress has been made with the development and implementation of noise reduction hardware for the SM. Most of the ventilation system noise reduction hardware and all of the Vozdukh noise reduction hardware has been developed, designed, fabricated, tested, and delivered to the ISS. Vibration isolators have been installed on eight out of twenty-two fans, and fan casing wraps have been installed on five out of eight fans. Duct lining has also been installed above the starboard Kayuta and has resulted in a 4 dBA noise reduction within the starboard Kayuta with the door completely shut. The lowest Kayuta night-time levels (56 dBA compared to the 50 dBA requirement) ever recorded were measured after this partial installation of the Kayuta’s noise reduction measures. Quiet fan development is continuing using available technology, but was implemented on one specific SM model fan. The remainder of the hardware, not including quiet fans, is scheduled to be launched prior to the middle of Calendar Year 2006. With this progress, challenges still remain. The installation of this noise reducing hardware is dependent upon crew time allocations, and installations are proceeding slowly. This is not an insurmountable problem, but this area needs attention. Also because of

INTERNATIONAL SPACE STATION - Goodman & Grosveld
Chapter V - 97
crew-time issues, some of the regularly-scheduled acoustic monitoring measurements are not being performed.”
“During the time period between February 2006 and April 2007, phase II installations were completed for the ventilation, Vozdukh, and air conditioner (CKB) systems.”
“Ventilation system modifications include installation of vibration isolators on twenty fans, casing wraps on ten fans, and twelve fan inlet or exit mufflers, as well as other controls such as Kayuta fan speed controls and cable routing holes for the Kayuta doors (both doors now installed). Vozdukh controls include an acoustic cover for the micro-compressor, and an additional cover behind the closeout panel. Air conditioner modifications include a cover for each compressor, an acoustic enclosure for each centrifugal fan, hose lagging, and a new double-panel (combined) closeout for each unit.”
“As a result of the noise-reduction modifications performed in the ventilation system (СВ), the air conditioner (СКВ) and the Vozdukh system, the noise levels in the main work zones and cabins in the SM were decreased significantly.”
The Leq noise levels (dBA) in main work zones and cabins in the SM that were reached in 2007 are compared with those that occurred at the beginning of crewed flight of the SM in Table 15 [91]. The reduction in the SM noise levels after performing the modifications, compared to the beginning of SM flight, consisted of at least 12 to 13 dBA in cabins, and from 3 to 16 dBA in the main SM work zones [92].
Table 15. SM noise levels Leq in dBA.
Measurement site Reference point КТ2
КТ3 КТ4 КТ5 КТ8 КТ10 КТ7 КТ9
SM Zone [СКВ] Central
Post pnl. 416 Vozdukh Treadmill
Toilet Zone
Stbd Cabin
Port Cabin
3 January 2001 73 71.1 68 79.9 70.7 73.9 64.4 65
29 January 2007 67.1 63.5 64.8 65.1 64.3 66.2 52.2 51.6
2 March 2007 66.6 62.8 - 63.3 - - - -
Noise reduction 5.9 8.3 3.2 16.6 6.4 7.7 12.2 13.4
Projected noise level in SM with noise reduction equipment
≈ 66 ≈ 65 ≈ 64 ≈ 64 ≈ 64 ≈ 65
Figure 96 shows the reduction in levels at SM control point KT3, near Central Post, from
December 2006 (Increment 14) until February 2008 (Increment 16) [93].
Figure 97 shows the reduction of SM control point KT5, near the Vozdukh, during the same timeframe [93]. Measurement levels still vary, but are lower than measured during earlier Increments. Figure 98 shows the reduction in starboard Kayuta levels during this same timeframe [93].

NASA/SP-2015-624 – ACOUSTICS AND NOISE CONTROL IN SPACE CREW COMPARTMENTS – Goodman & Grosveld
Chapter V - 98
Figure 96. SM Control point KT3 from Increments 14-16, (December 2006 - February 2008).
Figure 97. SM control point KT5 (near Vozdukh) from Increments 14-16, (December 2006 - February 2008).
Octave Band Center Frequency, Hz
So
un
d P
res
su
re L
ev
el,
dB
20
25
30
35
40
45
50
55
60
63 125 250 500 1000 2000 4000 8000
Octave Band Center Frequency, Hz
So
un
d P
res
su
re L
ev
el,
dB
40
45
50
55
60
65
70
75
80
63 125 250 500 1000 2000 4000 8000

INTERNATIONAL SPACE STATION - Goodman & Grosveld
Chapter V - 99
Figure 98. SM control point KT7 (starboard Kayuta) from Increments 14-16, (December 2006 - February 2008).
The major changes made to the ventilation system, which involved fans throughout the SM, the air conditioner (CKB), and the Vozdukh, and the benefits achieved from these modifications have been covered in this section. The last part of the new contract was the quiet fan development. A quiet fan was developed, manufactured, and tested under this agreement. The basic differences between the original fan design and the new quiet fan are described in Reference [4]. A more efficient fan operating at a lower speed, with increased blade loading to maintain performance was designed with a quieter fan motor, which resulted in much higher flow rates and lower acoustic emissions (reduction in acoustic levels from 61 to 64 dBA to 48 dBA measured at 1 m (3 ft) distance, normal to the fan plane). In June 2010, the contract effort was proposed to be finally accepted and the contract closed out [94]. RSC-E previously had agreed to fund and provide the flight fans for the ISS. By the end of 2013, 16 fans were provided for ISS. Seven of these quiet fans were installed in the SM in December 2012. By the end of August 2014, four of these fans were installed in the new Russian module, the Mini-Research Module 1 (MRM1) and four were installed in the DC by March 2015 [95]. A total of 18 quiet fans were originally planned to be installed in the SM. SLM measurements taken after these fans were installed show significantly lower acoustic levels at interior measurement locations KT3, KT4, KT5, KT6, KT8, and KT12 (newly added measurement location between KT5 and KT6). This shows when comparing the Increment 34 survey report [96] with these new fans installed to the last SLM measurements taken in the SM Increment 32 report [97]. Resultant acoustic levels are very close to the SM limits except for location KT5, which is in close proximity to the Vozdukh. Between December 2012 and August 2014, 19 quiet fans were installed in the SM [98].
Octave Band Center Frequency, Hz
So
un
d P
res
su
re L
ev
el,
dB
20
25
30
35
40
45
50
55
60
65
70
63 125 250 500 1000 2000 4000 8000

NASA/SP-2015-624 – ACOUSTICS AND NOISE CONTROL IN SPACE CREW COMPARTMENTS – Goodman & Grosveld
Chapter V - 100
The effectiveness of all of the remedial actions, except for the quiet fans, are addressed in this section. Figure 99 shows a summary of Leq(24) crew-worn dosimeter readings versus ISS Increments from Increment 1, which started in November 2000, through Increment 27, which started in March 2011 [5].
Figure 99. Crew-worn dosimeter readings for 24-hour period over Increments 1 through 27. Hearing protection wear time is in red at right side of figure.
The amount of HPD wear time per the ISS flight rules is noted in red on the ordinate axis. The Leq(24) average fell dramatically below the 67 dBA level after Increment 21 started in October 2009. This was due primarily because of remedial action improvements, but also because of the addition of quieter modules and an increased crew size, where some of the crewmembers were dispersed to these quieter modules. As indicated in Reference [5], the workday exposure is higher in the Russian Segment than in the U.S. Segment, and the levels during work periods played a major role in the resultant 24-hour exposure levels. Figure 100 shows the crew-worn time-weighted averages for work periods and occasions of sleep [5]. While the work day average level decreased somewhat over time, it was disappointing that it had not diminished more, considering all the remedial action fixes that were implemented. It is believed that the levels did not fall more over time because of several factors, including: in-flight maintenance in the SM for repairs, hardware change out, and acoustic remedial actions resulted in removal of SM closeout panels, creating increased acoustic levels; over time the debris clogging fan filters or inlets caused noise level increases in the modules until they were cleaned out [4]. It was also apparent that there were limitations in the remedial actions in bringing down acoustic levels, and that quieter fans were needed to further lower the acoustic levels. The SM fans measured levels in 1999 SM tests, as shown in Table 9, indicated that there were a number of fans in excess of the 55 dBA limit. As discussed previously, combining
HPD wear
20 hours
17 hours
14 hours
7 hours
2 hours
Hearing protection required at and above 67 dBA (JSC Flight Rule B13-152)

INTERNATIONAL SPACE STATION - Goodman & Grosveld
Chapter V - 101
emissions of a number of even lower level fans close to each other can result in high levels and impact the 60 dBA limit. During the April 1999 TIM, both sides agreed that the maximum allowable level of 55 dBA for separate single sources is insufficient for all systems operating, because it does not result in compliance with the overall requirement of 60 dBA [50].
Figure 100. Crew-worn acoustic dosimeter readings for sleep, work, and Leq(24), Increments 1-26.
Quieting of the noise sources, as noted in Chapter II Noise Control, is the preferred noise control approach and was recommended early in the SM reviews in view of the large number of fans in the SM. It is believed that originally no isolators, or only a few, were used under the SM fans. Adding isolators, wraps on fans, and absorbent materials were definite improvements, which were successful as noted. Changing out a loud fan for a quiet one is a lot easier in design/development and implementation than making all the RAP fixes implemented, and should be much easier for flight crews to change out. The reduction in sleep station levels in the Kayutas was another goal that was achieved, as shown in Figure 89.
6.2.5 Summary of Service Module Efforts
As previously discussed, the SM was a very important module to ISS as it was a "full time" occupied module that served as the “control center.” Originally, all of the crew was required to eat, exercise, sleep, and perform waste management and personal hygiene operations in the SM. Even when other modules were added, crews spent a significant amount of time in the SM. The acoustics efforts on this important module were very arduous, long in duration, and, most significantly, were the most difficult and challenging of all noise control efforts on the ISS. This merits further discussion and a look back at what occurred and the reasons why this effort took so long and was so difficult:
As discussed previously, the SM for ISS was based upon the Russians using their Mir hardware and design approaches. In the SM NCR-RS-017, the verbiage submitted by

NASA/SP-2015-624 – ACOUSTICS AND NOISE CONTROL IN SPACE CREW COMPARTMENTS – Goodman & Grosveld
Chapter V - 102
RSC-E indicated that the cause for the non-compliance was that “The SM equipment was developed with supplies on hand at the time” [90]. The Russians had significant long-term Mir operations and experiences for averages of 180 days in duration. In Mir, the Russians lived with exceedances on their acoustic limits and consequences of them previously discussed. The SM, as a modification to Mir, had a more problematic built-in acoustics situation, which was adopted in the ISS for the Russian Segment. The SM congregated a number of loud Mir systems such as the Vozdukh and the toilet, and a large number of fans into its module to perform the functions it had to provide. On the ISS, the Russians agreed to specification levels with which the SM did not comply. The Russians had accomplished lowering some of the individual specifications for fans on the ISS. However, in spite of these improvements, hardware was found to exceed the specification limits in numerous cases. The individual fan limits were set too high when considering the large number of fans in the SM. It is believed that the Russians initially had few indications or reasons to think they would have to make any significant changes to lower hardware and module levels, or provide funding to do this. Both the U.S. and Russian sides certainly did not anticipate how difficult these efforts would be.
The Russians at first did not accept there was a need to meet specification limits, based upon their past experience and design approaches. Russian acoustic counterparts were initially resistant to address remedial action and efforts and they lacked management support to modify the SM. This changed later when the need to make modifications was established and they got increased management support. As a result, both sides became cooperative partners in resolving a mutual problem. There was still some reluctance from Russian management to establish acoustics as a priority item and to find funding for this (there were a number of times early in the program when it was indicated that funding was not available). It was significant that at the JPR in September/October 1999, both sides agreed that the acoustics environment in the SM was unacceptable for long-term operation of the ISS [55].
The basic approach of the U.S. with the SM, as well as other modules, was to ensure that the module would comply with the limits and see that verification testing would be performed before its first flight so that acoustic levels on-board would be known before flight. To accomplish this, it was necessary to verify that hardware would comply with its requirements before flight by “designing in” acoustics with noise control practices, and perform acoustic testing early enough to implement any changes necessary to remedy the problem(s).
The underlying problem resolving acoustics in the SM was the difficulty in quieting the numerous high-level noise sources throughout the SM, and the SM design complexity. The SM had many more noise sources than the FGB and, as a result, had many more impacts to the hardware manufacturers and contractors. The SM was much more complex in its design of the ventilation and thermal control than other ISS modules. Solving the SM acoustic problems was a much more difficult task than managing the FGB acoustics. The FGB not only had significantly fewer noise sources, but the quieting efforts by Khrunichev were far easier to implement, without having to change the noise sources themselves, by using relatively simple “pathway”

INTERNATIONAL SPACE STATION - Goodman & Grosveld
Chapter V - 103
measures. All basic FGB remedial hardware, with the exception of the interface attachments for louvers and perhaps standoffs, was fabricated separately from the module and installed as a kit and without significant changes to the module. The SM needed numerous changes at or close to the noise sources, which is what is normally recommended to be done in design phases, not on an operational flight vehicle. This required a significant number of changes to the hardware items and module installations. Resultant in-flight changes were difficult and time consuming to make.
The SM RAP was constantly changing. The development of remedial measures to quiet the SM involved a good deal of research. Before procurement could proceed, the contractor and subcontractor needed to resolve approaches, then test them, and finally install and test them in the KIS facility to verify their individual and overall benefits. The process involved was very iterative. Remedial actions affected many hardware items and installations. There was substantial pressure on the Russians to make the SM acoustically acceptable, providing dates for resolving designs of remedial measures, fabricating them, and committing to a date when they would be implemented in the module. RAP measures were so iterative, took so long, and resulted in slow incremental improvements, further increasing frustration with efforts, and enlisting more pressure.
The Russian side expended a significant and worthy effort to implement the remedial actions required over time. They also provided NASA with considerable data and information on design approaches and status.
Initially NASA Acoustics appealed to NASA management for initiating help in getting remedial actions started and implemented before the first flight, and to obtain a better understanding of projected flight levels. NASA management was resistant to take remedial actions on the SM before launch because of the concerns with slipping the flight date of the SM, lack of funding, and some lack of insight in the significance of the acoustic concerns on ISS operations.
It is believed that once the Expedition flights started, flight acoustic measurements were obtained, and crews complained about the noise and the use of hearing protection, there was an obvious disparity between the acoustic levels in the SM and other modules. As a result, there was more pressure to fix the SM and the reluctance to do this was reduced.
The difficulties of implementing SM changes and improvements to meet their specification limits can be considered a further testament to the recommendation that vehicles and modules need to have acoustics “designed-in”, as emphasized in Chapter II on Noise Control. It also was a testament to the recommendation to focus on reducing noise at the source, or, as sometimes can happen, one ends up with “paying the price” with extensive and difficult pathway measures. The complex design of the SM made resultant remedial pathway changes more extensive, difficult, and expensive in cost, in both ground and flight operations. Some hardware fixes developed on the ground would not fit in the flight module. The result was delays in lowering the noise, and crews having to work around the high noise levels, wearing hearing protection, having poor communications/speech intelligibility, increased stress and fatigue, as well as having negative effects on crew operations

NASA/SP-2015-624 – ACOUSTICS AND NOISE CONTROL IN SPACE CREW COMPARTMENTS – Goodman & Grosveld
Chapter V - 104
and the habitable flight environment. This carried on for too many years. Time had to be allocated to make remedial fixes, which took time away from nominal ISS operations, and it was especially difficult to allocate time when the crew size was two or three members. Also, as noted, SM levels increased during the time of performing remedial measures since areas normally closed out were opened up, letting noise out.
Originally, the Russians did not have sophisticated acoustic measurement instrumentation for vehicle measurements, SLMs, and audio dosimeters. NASA ended up supporting the RSC-E/Russian Space Agency testing and loaning them instrumentation for testing. NASA later provided funding for upgrading their instrumentation, and provided flight type SLMs and dosimeters. NASA also provided funding to implement further efforts to develop remedial fixes and development of quiet fan technology on their revised RAP.
The Russian side implemented effective quieting provisions over time, and were very competent and successful in designing quiet fans, once appropriate resources were made available [4].
7. U.S. MODULES IN U.S. SEGMENT
The U.S. Orbital Segment (USOS) is the name given to the components of the ISS built and operated by NASA, ESA, CSA, and Japan Aerospace Exploration Agency (JAXA). The segment consists of pressurized components and various external elements, all of which were delivered by the Space Shuttle. Figure 1 of ISS shows the Russian Segment, mated to the USOS at the FGB/Node 1 intersection of the USOS portion. Boeing was the Prime Contractor for ISS and designed and provided: USL, Destiny; Node 1, Unity; and the U.S. Airlock, Quest. Boeing was also ISS systems integrator, was responsible for overall acoustic analyses of the USOS and its modules, and was an AWG participant and, later, a co-chair of the AWG. NASA MSFC worked acoustics with ESA, coordinating with the NAL and AWG. A good deal of the NAL/Acoustics Office initial effort was concentrated on the USL and Airlock designed and fabricated by Boeing, since these modules required more oversight and help with testing and development, and set a U.S. precedent on acoustics design and noise control with our first ISS modules. This section deals only with the noise control efforts applied to the USL and Airlock, and to the Node 1 module, which Boeing provided. Node 1 was the first of these modules to fly, but it will be covered last because NASA MSFC provided most of the oversight on the module, and it is better to discuss Node 1 after the USL and Airlock hardware descriptions. European and JAXA Modules, payloads, and GFE, which made up the USOS segment, are covered in other sections that follow.
7.1 U.S. Laboratory
The USL was an important module to be acoustically acceptable because it was the first ISS Laboratory, where a good deal of crew time was to be spent, and it was to be populated with numerous payloads. It was also important that a good noise control precedent be established

INTERNATIONAL SPACE STATION - Goodman & Grosveld
Chapter V - 105
with Boeing early and on this module, and to demonstrate NC-50 could be achieved for the module, and NC-52 for module plus payloads (this was especially important because of the NAL’s long-troubled Space Shuttle experience, attempting to secure NC-50 level as a limit). A photograph of the USL being deployed from the Space Shuttle payload bay in February 2001, and the interior crew compartment of the USL during Expedition IV, are shown in Figure 101. One of the first acoustic design reviews the NAL had on the USL was to meet in 1996 at Huntsville, Alabama, with Boeing counterparts [99]. The NAL and NASA consultants presented acoustic countermeasures (descriptions of mufflers and isolators, acoustic materials) and lessons learned on acoustics from the Space Shuttle Program. Boeing presented the status of USL acoustics. Boeing discussed the USL design and provided a walkthrough of the flight module. At the conclusion of the review, NASA made recommendations to Boeing, including the following: more emphasis should be placed on attending to structural-borne vibration/noise; the GFE Russian pump to be used in the U.S. Airlock needs more oversight/attention and testing, and vibration isolation should be applied to it; it needs to be ensured that acoustic foam used in ISS modules and payloads is protected from its inherent friability; more emphasis should be applied to quantifying tolerances of analytical models and testing verification of the models; effects of use of GFE hardware on module noise need to be resolved; requirements for intermittent noise need to be added as well as a clarification of how to perform verification of module limits [100].
Figure 101. U.S Laboratory being deployed by the Space Shuttle and crew compartment, Expedition IV.
A number of very good noise control features were implemented in the USL, as will be discussed later. However, the USL in ground testing exceeded the NC-50 module continuous noise limit, as shown in Figure 102. The figure shows the noise sources that contributed to make up the total level. The predominate noise sources in the module were the dual PPAs, which originally operated together during normal operations. Two PPAs are located on opposite sides of rack bay 6 in the aft part of the USL. NASA had recommended all pumps and fans to have vibration isolation; in general, this was implemented, except for the PPAs. Description of PPA installation in the USL and PPA quieting hush kit considered will be covered in more detail below. Discussion of the PPA installation in the USL was also provided in Section 3.2 Chapter II on Noise Control.

NASA/SP-2015-624 – ACOUSTICS AND NOISE CONTROL IN SPACE CREW COMPARTMENTS – Goodman & Grosveld
Chapter V - 106
The acoustic levels of the USL module in June 2000 are shown in Figure 102. A complement of payloads at their full NC-48 limit would produce overall levels as shown in Figure 103. Significant efforts were expended on working out how and when to achieve compliance. The module exceedances noted above were approved with the stipulation that three acoustic improvements be implemented later after the launch of the USL, as a sustaining engineering effort: reduction in Carbon Dioxide Removal Assembly (CDRA) air-save duty cycle; a PPA hush kit be implemented to offset high emissions resulting from structural-borne vibration; and the MCOR be quieted.
Figure 102. Initial USL acoustic levels and sources. Note: PPA stands for Pump Package Assembly; LT stands for low temperature; CCAA stands for Common Cabin Air Assembly; IMV stands for Inter-Module
Ventilation; CHeCS stands for Crew Health Care System; and RWS stands for Robotics Workstation.
As a result, the CDRA and the MCOR modifications were incorporated, and efforts were pursued by NASA and Boeing on a “hush kit” for the PPA. The CDRA fix was to reduce its duty cycle with a software change. The MCOR modification was as follows: ISODAMP® foam was applied to the enclosure door (ISODAMP® is viscoelastic material that absorbs mechanical vibrations); blocks of melamine foam (acoustic absorber) were added inside the enclosure at locations where it would not affect thermal properties; and a silicone vibration isolator gasket was applied at the fan mounting surface on the MCOR on-orbit installation kit.
On the PPA hush kit, the effectiveness of a barrier enclosure design approach for the kit was verified by testing. Its implementation was held up due to costs and further justification to implement it. Boeing was to provide the PPA quieting kit, with NASA/Boeing developing the design approach, NASA providing for testing and testing results of the design approaches, and contributing flight-approved materials for testing. Later, PPA operations in the USL were
So
un
d P
ress
ure
Le
ve
l, d
B
Octave Band Center Frequency, Hz

INTERNATIONAL SPACE STATION - Goodman & Grosveld
Chapter V - 107
modified for ISS missions so that only one PPA was required to operate to provide system cooling, rather than two simultaneously. The result was a significant lowering of the module acoustic levels, thus alleviating the need to implement this kit, although the single pump remained a dominant noise source.
Figure 103. USL overall module levels from ground testing, plus payload complement of NC-48.
A key issue that came up with the acoustic levels in the USL from an Acoustics Office and AWG standpoint was that the USL verification location was only at the center of the laboratory, not at multiple locations throughout the habitable volume. This location in the USL was not considered representative of the “habitable areas” called out in the U.S. Segment Specification, which stated “the integrated acoustic environment in habitable areas shall not exceed the U.S. NC-50 criterion” [16]. The specification for the USL also had similar verbiage [101]. When Boeing performed the module verification testing, the paperwork for this testing defined the verification point as being on the module centerline, and at the center of the module. This went unnoticed until later, when the issue came up and, when it did, it was very much a concern. Note that the crew frequently works closer to payloads where levels are higher than those on a nearby centerline, and payloads can be far from the module center. Boeing responded to requests to show module level variance along the length of the USL with the dBA levels shown in Figure 104. Note that of the six measurements in Figure 104, only one measurement—the one nearest the forward hatch—complied with the NC-50 equivalent dBA level of 58.1 dBA. To address this concern, it was agreed to take measurements on-orbit in the center of all USL rack bays, along the centerline of the module. Measurements would be taken on-orbit with a SLM, and with dosimeters placed in fixed positions in areas of concern within a module. Results would be documented in NASA Increment reports. This approach was basically adopted for verification and in-flight measurements with other ISS modules.
69
6361
57
54 54
50
46
61
71
35
40
45
50
55
60
65
70
75
63 125 250 500 1000 2000 4000 8000 A-wtd. O.A.
Frequency Band, Hz
SP
L,
dB
re
20
µP
a
USL+NC48
USLab
NC-52 Total Spec
NC-50 Lab Spec
NC-48 Payload Compliment Spec
Octave Band Center Frequency, Hz
So
un
d P
ress
ure
Le
ve
l, d
B

NASA/SP-2015-624 – ACOUSTICS AND NOISE CONTROL IN SPACE CREW COMPARTMENTS – Goodman & Grosveld
Chapter V - 108
Figure 104. USL levels variance at various centerline rack bays along its length.
Figure 105 shows acoustic levels taken in the USL during Expedition II on 5 April 2001, by rack bays. In particular, rack bays 5 and 6 and the aft hatch area exceeded the NC-52 level (60.3 dBA). PPAs were located nearby, in Bay 6. It should be noted that some module equipment such as the CDRA and two IMV fans were off during this measurement time, and only a few payloads and GFE were operating. Table 16 shows USL measurements taken during Expedition VI, on 5 April 2003, which shows acoustic levels in the center of the USL and on centerline, at the center of each of the six rack bays and the two endcones. Only one PPA was operating at that time, lowering module levels to what would become its new PPA operating mode. Forward IMVs were off as well, since Node 2 had not yet been attached to the USL forward port. Some payloads were operating during this time, but it is not known what their contributions were as a complement. Specification values are for NC-52 equivalent (NC-50 + NC-48). Bolder marked measurement values were exceedances of the NC-52 equivalent specification.
The USL acoustic levels increased from initial flights over time, primarily due to additional payloads, and also because of other systems added to support ISS needs. Once flight operations of the PPA were changed to single PPA operation (since Increment IV), acoustic levels for the module were close to NC-50 and missions consistently achieved or were close to the NC-52 limit [4].
Position along module centerline, ft
So
un
d P
ress
ure
Le
ve
l, d
BA

INTERNATIONAL SPACE STATION - Goodman & Grosveld
Chapter V - 109
Figure 105. USL levels measured during Expedition II on 5 April 2001.
Table 16. Sound pressure level [dB] measurements in USL, Expedition VI, 3 April 2003.
One-third Octave Band Center Frequency
[Hz]
0
1
2
3
Center
4
5
6
7
Spec
63 52.9 50.6 53.8 53.5 53.3 53.1 53.5 54.5 56.1 73.3
125 52.3 50.4 52.9 54.4 55.7 55.4 55.9 54.7 55.1 66.3
250 55.9 55.5 57.6 58.1 57.2 57.3 57.9 57.5 53.5 60.3
500 50.7 51.6 53.7 55.1 56.7 56.5 55.9 55.9 54.1 56.1
1000 46.3 47.0 50.7 53.6 54.5 54.5 52.6 51.4 50.8 53.1
2000 43.7 44.7 46.8 50.8 51.4 51.5 51.8 52.2 50.3 51.1
4000 39.7 41.1 43.7 45.7 46.5 47.3 47.5 49.0 48.3 50.1
8000 35.3 37.4 42.0 40.7 41.2 42.2 43.0 43.1 42.0 49.1
OA 59.8 59.1 61.6 62.7 63.1 63.1 63.1 62.9 61.8
dBA 53.0 53.6 56.2 58.4 59.2 59.3 58.7 58.7 57.2
7.1.1 U.S. Laboratory Noise Control Measures
Under Boeing ISS contracts, significant ECLSS hardware was developed for use in the USL. Fans developed incorporated good noise control features (at the source) in the delivered units. These fans included the CCAA fan, the IMV fan, and the Avionics Air Assembly (AAA) fan. Hamilton Standard, a Division of United Aircraft Corporation (now United Technologies Corporation), was the provider of this hardware. These fans ended up being used extensively throughout the ISS and were also described in Chapter II, Noise Control because of their good features. As discussed in this Chapter, a number of noise control features were incorporated
Octave Band Center Frequency, Hz

NASA/SP-2015-624 – ACOUSTICS AND NOISE CONTROL IN SPACE CREW COMPARTMENTS – Goodman & Grosveld
Chapter V - 110
into these fans, including flow straighteners, barriers, vibration isolators, fan case treatments, and built-in mufflers. Other Boeing noise control features incorporated in the USL related to treating the pathway in proximity to the fans (i.e., IMV mufflers and acoustically treated splitters) and other remedial features in the module (i.e., acoustic foams, barriers, and damping materials).
CCAA fans are used to provide general ventilation and for cooling hardware, as part of the module thermal control system. There are two CCAA fans in the USL, located in separate racks in Bay 6, on opposite sides of the USL. Only one CCAA fan is used at a time. Figure 106 shows a CCAA fan in one of its thermal control system assembly racks and alone, as a unit. The fan has a white-colored acoustic cover that is shown in the figure. This acoustic cover reduced the case-radiated noise. Noise control features implemented in this fan are shown in Figure 107, as follows: the fan is mounted on vibration isolators to support the frame structure (left-hand view); its acoustic cover blocks acoustic emissions and it is isolated from the structure by rubber-type grommets, as shown in the right-hand view [102]. Figure 108 shows the Environmental Control System in the USL, with the location of the CCAA fans, and interfaces with the IMV fans. The ducting at the inlet and outlets of the fans have treatments to attenuate emissions (the return ducts have acoustically treated splitters and Helmholtz resonators, and the supply ducts have acoustic mufflers composed of Feltmetal™ liner, Nomex® honeycomb, and fiberglass/epoxy outer shell).
Figure 106. CCAA fan installation in a rack (left) and the CCAA fan by itself (right).
Mounting Brackets and Captive Fasteners
(4 places)
Acoustic Enclosure
Handling Tabs (for Zero G use only)
Inlet Flange
FL
OW
Outlet Flange
Retaining Band
Air Outlet
Temperature Scanner
ORU
TCCV ORU
HX ORU
Inlet ORU
Air Inlet
CCAA fan
CCAA fan

INTERNATIONAL SPACE STATION - Goodman & Grosveld
Chapter V - 111
Figure 107. CCAA noise control features: fan vibration isolation mount (left) and vibration isolation of the fan acoustic case.
Figure 108. USL Environmental Control System.
IMV fans provide ventilation between modules, with one IMV fan installed at each junction between modules. There are three of these fans in the USL. The fan shown in Figure 109 has a number of built-in noise control features, including: acoustic barrier wraps on the sides of the fan and honeycomb closeout panels to block case radiated noise; a flow straightener; and vibration isolators.
On the inlet and outlets of the IMV fan, USL-provided IMV mufflers are installed as shown in Figure 110. These mufflers include Feltmetal™ backed by melamine foam. These mufflers were very effective in reducing emissions, as discussed in Chapter II, Noise Control.
The AAA fans were provided to ventilate inside the EXPRESS racks. Figure 111 shows an AAA fan. Figure 112 shows a number of very good noise control features built into this hardware: the fans are soft mounted inside their container; chevron-shaped holes are carved into the Solimide® foam for flow through the outlet muffler (precluding direct line-of-sight flow); an end plate at the fan outlet is covered with acoustic foam; and slanted inlet holes were made with acoustic foam (see Figure 112).
One of the PPAs is shown installed in its rack in Figure 113. The PPA was hard-mounted to the rack shelf, without vibration isolation, and created significant acoustic emissions. Acoustic foam was added to the inside of the rack around the PPA. Treatments were provided on the rack door to quiet resulting emissions (white acoustic foam and silver-colored damping material) and are also shown in this figure.
Self-Retracting Captive Fastener
Fan Mounting Foot
Fan Mounting Bracket
Vibration Mount
Ground Strap
Mounting Flange
Grommet
Acoustic Shell

NASA/SP-2015-624 – ACOUSTICS AND NOISE CONTROL IN SPACE CREW COMPARTMENTS – Goodman & Grosveld
Chapter V - 112
Figure 109. IMV fan (left) and internal configuration (right).
Figure 110. IMV mufflers for fan.
Figure 111. AAA fan inlet and outlet.
Figure 112. AAA fan acoustic features (left), with foam inlet (right).

INTERNATIONAL SPACE STATION - Goodman & Grosveld
Chapter V - 113
Figure 113. PPA pump installed in its rack (left) and acoustic treatments on the rack door (right).
The PPA hush kit consisted of two primary quieting approaches: Bisco® barrier material wrapping of the pump and fluid lines to reduce case-radiated noise; and a Bisco® foam cushion used underneath the pump, between the pump and the rack structure, to reduce structure-borne noise (reference Acoustic Spaceflight Materials, Chapter VII). Figure 114 shows the configuration of the PPA barrier enclosure tested (photograph), and sketches showing the concept for containing the pump [103]. Figure 115 shows the benefits of using the barrier type of enclosure around the periphery of the PPA, based upon testing. As noted previously, this kit was cancelled when PPA operations changed from two pumps operating at the same time, to only one pump operating.
Figure 114. PPA hush kit tested and concept of implementation.
Tested barrier configuration Barrier material in box configuration
PPA enclosed in barrier box

NASA/SP-2015-624 – ACOUSTICS AND NOISE CONTROL IN SPACE CREW COMPARTMENTS – Goodman & Grosveld
Chapter V - 114
Figure 115. Benefits of barrier type of enclosure tested.
7.1.2 U.S. Laboratory Vacuum Exhaust System Noise Control
NASA supported Boeing in resolving USL payload Vacuum Exhaust System (VES) acoustics. This VES system provided for venting of various payloads in the USL to vacuum through connections with one of three separate 2.5-in-diameter by 0.35-in-thick wall metal tubing lines distributed along the length of the laboratory. Figure 116 shows the VES tubing layout in the USL. The concern was that unpredictably high noise levels are produced during blow down of the air to vacuum that can "startle" the crew. Boeing provided a test setup of the VES system to evaluate venting of different volumes. NASA provided acoustic measurement instrumentation and Bisco® barrier wrap to cover the tubing in a VES prototype configuration test, and testing results. The wrapping of the lines reduced the blow-down levels to an acceptable acoustic level. Acoustic levels generated varied with the volume of the payload chamber evacuated and its initial pressure. One of the three vacuum lines could not be wrapped due to minimal clearances. However, it is believed that the manifesting of payloads having lower noise-producing payloads on this line (such as the EXPRESS payload and other non-VES payload users) was considered, but not agreed to by the ISS Payloads Office [104]. Acoustic attenuation was provided by the Bisco® wrap, but also by vehicle close-outs, by fire detection system partitions, and by racks in-place [105]. Figure 117 shows estimated acoustic levels at one time predicted from various payload racks [104]. Acoustic levels in the USL, obtained during December 1999 VES testing at KSC without racks installed, are shown in Figure 118. The VES acoustic levels were reduced down to 74 dBA and vent noise demonstrations were played to the Astronaut Office for their agreement with the results [106].
NC-40 17,200 RPM No Wrapping
17,200 RPM Total Wrap

INTERNATIONAL SPACE STATION - Goodman & Grosveld
Chapter V - 115
Figure 116. VES tubing configuration in USL.
Figure 117. Predicted acoustic levels for various USL payloads.
Duration (seconds)
Sound Pressure (dBA)
Volume x Pressure (l…
0
25
50
75
100
125
150
175
200
MS
RF
(6
-8h
rs)
MS
G (
co
ntin
uous)
FC
F (
10-1
5/d
ay)
SP
D
AD
SE
P-P
U
ALF
CF
Z
ET
TF
MID
AS
NLO
-PV
T
OF
PS
SE
F
US
CE
PS
Vulc
an
XC
F
ZC
G-F
U
ZC
G/H
TF
ZC
G/H
VF
ZC
G/Q
CF
HR
F (
contingen
cy)
Bio
tech
75
0.5
0.5
78 85
7272
72
122.6
248.6
219.9
6.7
PAYLOAD ACOUSTICS (Predicted)Closeout panels & all rack locations filled
MSRF & FCF can be Scheduled

NASA/SP-2015-624 – ACOUSTICS AND NOISE CONTROL IN SPACE CREW COMPARTMENTS – Goodman & Grosveld
Chapter V - 116
Figure 118. Acoustic levels from VES testing in the USL without racks installed, December 1999.
The NAL communicated with JEM and Columbus representatives on this concern and wrapping approach, since the Columbus and JEM modules had a similar VES system.
During the time this support was provided, the Acoustics Office also developed some acoustically optimized transition sections from the large, 2.5-in-diameter ducting to the smaller diameter line of the VES, as shown in Figure 119. It is believed that this approach was not used because of impacts, and since the Bisco® wrap sufficed in reducing the noise to an acceptable level.
Figure 119. NASA acoustics, VES ducting transition approach.
S
ou
nd
Pre
ss
ure
Le
ve
l, d
B
63 125 250 500 1k 2k 4k 8k 16k
Octave Band Center Frequency, Hz
NC-70
NC-60
NC-50
100
90
80
70
60
50
40

INTERNATIONAL SPACE STATION - Goodman & Grosveld
Chapter V - 117
7.2 U.S. Airlock
The U.S. Airlock is the primary path for the ISS spacewalk entry and departure for astronauts in U.S. spacesuits, which are known as Extravehicular Mobility Units (EMUs). The Joint Airlock is also designed to support the Russian Orlan spacesuit for extravehicular activity (EVA). The Joint Airlock is a U.S.-provided pressurized flight element consisting of two cylindrical chambers attached end-to-end by a connecting bulkhead and hatch. The cylinders are the Equipment Lock (EL) and the Crew Lock (CL) where the crewmembers prepare and egress EVA. The Airlock is composed of the EL and CL. The EL is used for donning, doffing, and storage of the space suits, suit check-out equipment, and Airlock functional hardware. The CL is primarily used for depressurization, re-pressurization, and egress-ingress to and from space. Boeing provided the Airlock. Figure 120 shows the outside of the Airlock Assembly in a ground view after its assembly (left), and inside of the CL showing the EVA hatch (right).
Figure 120. U.S. Airlock after assembly and CL for EVA operations.
A combination of the RDP and pressure equalization valves located within the hatches provides the depressurization/pressurization capability of the CL, and precludes a major loss of air (environmental consumables). To support EVA operations, the Airlock is depressurized to 10.2 psia for “crew campout” prior to the EVA. After that, the EVA crewmembers don their EMUs and perform final depressurization to a vacuum in the CL. The depressurization pump transfers CL air into Node 1 rather than lose the air overboard, as was done in Space Shuttle airlock operations. The RDP is used for depressurization for about 15-20 minutes, three times during an EVA operation. The RDP was therefore an intermittent noise source, which had to meet the 65 dBA limit defined in Table 5. Figure 121 shows the final flight configuration of the depressurization pump and inlet and outlet mufflers located in the Airlock EL, with lines running into the CL and Node 1. Node 1 has a hatch that closes off the Airlock at the Airlock/Node 1 interface for EVA operations, which is illustrated in Figure 121. The efforts on the Airlock depressurization pump quieting and the addition of a new pump inlet muffler are discussed below, and in a 2003 conference paper on Acoustic Case Studies [6].

NASA/SP-2015-624 – ACOUSTICS AND NOISE CONTROL IN SPACE CREW COMPARTMENTS – Goodman & Grosveld
Chapter V - 118
Figure 121. Airlock depressurization pump and muffler locations in the Airlock.
7.2.1 Airlock Depressurization Problem
The original acoustic requirement for the RDP by itself was to meet NC-40 (49 dBA). Testing performed by NASA after a pump was delivered indicated that this requirement was not met. When measured in a semi-anechoic acoustic chamber, the pump A-weighted SPL was 82 dBA. The A-weighted SPL of the Airlock pump, measured inside a simulated airlock test chamber at NASA JSC, was 96 dBA. The equivalent sound power level (PWL) was 95 dB. The overall PWL of the unmuffled inlet was measured at 101 dB.
The RDP delivered to NASA was mounted to a baseplate using 10 metric bolts fastened to five heavy metal mounts machined into the bottom of the pump. These five mounts are shown on the pump in Figure 122 (left view) and protruding through the NASA-provided blue fabric enclosure in the picture on the right, to be described later. The pump was contained within a sturdy metal box, which had its lower part hard mounted through the five mounts to the mounting plate, and a mating upper part of the box with a lid affixed to it. Figure 123 shows the upper and lower parts of the box mounted atop the baseplate. The upper part of the box was fastened to the lower part with the 11 bolts shown at the top of the box in Figure 123. These bolts and acoustic insulation that lined the top part of the box are shown in Figure 124. The bolts attach the top part of the box to the lower part through a common internal mating flange on the upper and lower parts of the box with a gasket on the flange at the lower part of the box at the mating junction. Figure 125 and Figure 126 show both ends of the RDP mounted on the mounting plate, inside the lower part of the box, which also had acoustic insulation installed in it. Figure 127 shows the side of the pump mounted to the baseplate, in the lower part of the box. Figure 125, Figure 126, and Figure 127 also show the very close clearances between the pump and the flange on the upper and lower parts of the box that protrude toward the center of the box (a concern with pump-to-box contact during pump operations). When the upper part of the box was installed, the box and baseplate were structurally tied together and with the pump activated, the assembly formed a large radiating surface for structural-borne noise. The pump was not isolated from the baseplate, and the 11 bolts structurally fastened the top to the bottom of the box also without isolation.
New added inlet muffler Off-the-shelf Russian muffler

INTERNATIONAL SPACE STATION - Goodman & Grosveld
Chapter V - 119
Figure 122. RDP mounts on pump bottom (left), and protruding through the inverted blue enclosure.
Figure 123. RDP in its stowage box.
Figure 124. Top portion of the stowage box with fasteners to attach to the bottom part of box.
Figure 125. One end view of the RDP installation within the lower part of its box.
Figure 126. The other end of the RDP installation within the lower part of its box.

NASA/SP-2015-624 – ACOUSTICS AND NOISE CONTROL IN SPACE CREW COMPARTMENTS – Goodman & Grosveld
Chapter V - 120
Figure 127. Side view of the RDP within the lower part of its box.
7.2.2 NASA Noise Control Measures
The following noise control measures were implemented: a muffler was added to the inlet to the pump; lines connecting to the pump in the vehicle were wrapped to minimize emissions; and the changes noted below were implemented on the depressurization pump assembly.
7.2.2.1 Russian Depressurization Pump - The NAL started a Tiger Team to develop noise control measures that would attenuate the RDP-generated noise. A proof-of-concept demonstration of the noise abatement procedures and materials was identified as a project requirement. Other requirements included that the redesign should not impact the pump and/or motor assembly design or performance, and vehicle mounting interfaces. There should be a capability to perform in-flight maintenance on the pump and motor assembly. No modifications were permitted to the original hardware, including stowage box, unless they were readily “reversible.” Final designs and materials should be compatible with ISS use in the Airlock and with the pump/motor assembly. The overall weight of the noise abatement hardware could not exceed that of the delivered RDP and container/mount. The center of gravity of the noise abatement kit should be within the envelope of the limits defined by the pump assembly package, or accepted deviations should be worked out.
Remedial action was to implement an “Airlock Depressurization Pump Quieting Kit” to quiet the pump. Several design approaches were tried, but the principal one was to structurally isolate the pump vibrating on its mounting by isolators added between the pump and its baseplate. Figure 128 shows the revised layout of the pump with the four new isolator locations (one isolator view is blocked by the baseplate). The Barry 505-type isolators used to support the pump are shown in Figure 129. The pump was enclosed within a folded multi-layer container made up, from inside to outside, as follows: porous Nomex® fabric to act as a restraint cover; acoustic foam to absorb the pump's acoustic emissions; barrier material to block what

INTERNATIONAL SPACE STATION - Goodman & Grosveld
Chapter V - 121
emissions were left; and a virtually non-porous Nomex® fabric used as a barrier and outer wrap for containment (Figure 130 shows various views of this container). Materials used in this enclosure are described in Chapter VII on materials. Figure 131 shows the overall assembly of the Airlock Depressurization Pump Quieting Kit with recommended clearances/air gaps between the multi-layer enclosure installed over the RDP, and the enclosure covered by a new outer metal box. The sketch does not show the direct connection of the isolators through the bottom of the multi-layer enclosure to the pump. The new external metal outer box is attached to the baseplate and is the physical mounting interface with the vehicle as shown in Figure 132.
Figure 128. Locations of the four commercially available isolators used to quiet the U.S. Airlock RDP. View of one isolator is blocked by baseplate.
Figure 129. Barry Controls 505 series vibration isolators.
Barry Controls Isolators Typ. (4)

NASA/SP-2015-624 – ACOUSTICS AND NOISE CONTROL IN SPACE CREW COMPARTMENTS – Goodman & Grosveld
Chapter V - 122
Figure 130. Multi-layer enclosure for the Airlock Depressurization Pump Quieting Kit in the U.S. Airlock.
Figure 131. Layout of the Airlock Depressurization Pump Quieting Kit assembly.
Inside liner Outside liner Folded into box
Depressurization pump installed Lid closed, final configuration

INTERNATIONAL SPACE STATION - Goodman & Grosveld
Chapter V - 123
Figure 132. Airlock Depressurization Pump Quieting Kit in final configuration in the vehicle.
The developed “proof-of-concept” design approach, a set of design requirements for the new design, and acoustic testing results were turned over to another design group within the NAL’s Division, for final flight design, verification testing, and delivery. Acoustic fabrics, barrier, foam, and isolators were provided by the Acoustics Office for flight hardware.
7.2.2.2 Added Inlet muffler - As noted previously, the inlet to the pump was originally not muffled. The outlet used a large cylindrical Russian muffler that was tested, and was found acceptable for use “as is.” An inlet muffler combined with a heat exchanger was designed by an acoustic consultant, and a prototype was fabricated and tested. The muffler used acoustic foam and a long, arduous pathway through the foam to muffle the emissions. Figure 133 shows the muffler foam, heat exchanger (metal block with holes in it), and assembly.
Figure 133. Depressurization pump inlet heat exchanger/acoustic muffler.

NASA/SP-2015-624 – ACOUSTICS AND NOISE CONTROL IN SPACE CREW COMPARTMENTS – Goodman & Grosveld
Chapter V - 124
7.2.2.3 Benefits of Noise Control Measures - The overall sound power level of the original pump configuration was 95 dB. After installation of the GFE Airlock Depressurization Pump Quieting Kit, the overall sound power level was attenuated by 23 dB down to 72 dB. The sound power levels of the original pump and GFE pump kit configurations before and after installation of the muffler are plotted as functions of the octave band center frequency in Figure 134 [6]. Finally, the A-weighted sound pressure level measured at the center of the equipment lock was reduced by 23 dBA, from the initial 96 dBA down to 73 dBA. Measurements were conducted with the inlet and outlet mufflers installed and all closeout panels in place. The 73 dBA is the same level as the maximum allowable sound pressure level for a 20-minute intermittent noise during a 24-hour period according to the intermittent noise requirements for ISS pressurized payloads (Table 5). However, if the pump operated for 20 minutes three times per day, the limit would be 65 dBA.
The overall sound power level of the inlet was measured at 101 dB. The newly designed muffler provided 24 dB attenuation. With the GFE muffler on the inlet, the overall benefits on equipment lock noise, based upon NASA testing and estimates, are shown in Figure 135.
Overall benefits on equipment lock noise with the crew hatch closed between the Airlock cabin and EVA compartment for the GFE Airlock Depressurization Pump Quieting Kit over the Russian configuration, based upon NASA testing of prototype hardware and simulated Airlock chamber, and estimates made is shown in Figure 136. The GFE pump kit acoustic level is lowered when the hatch is closed compared to what it was with the hatch open, by 3 dBA. Benefits of the new GFE inlet muffler/silencer and the Russian-provided outlet muffler on estimated equipment lock noise are shown in Figure 137.
Figure 134. Sound power levels for the original and acoustically treated Airlock pump and inlet.
Octave Band Center Frequency, Hz
So
un
d P
ow
er
Le
ve
l, d
B
0
20
40
60
80
100
120
125 250 500 1000 2000 4000 8000
Original pumpOriginal inletGFE pumpMuffled inlet

INTERNATIONAL SPACE STATION - Goodman & Grosveld
Chapter V - 125
Figure 135. Estimated EL noise, with the CL-to-EL hatch open.
Figure 136. Estimated EL noise, with the CL-to-EL hatch closed.
Figure 138 shows the GFE pump kit acoustic level using final verified flight GFE pump hardware in flight configured Airlock integrated ground tests [107]. Figure 139 shows final
Octave Band Center Frequency, Hz
So
un
d P
ress
ure
Le
ve
l, d
B
So
un
d P
ress
ure
Le
ve
l, d
B
Octave Band Center Frequency, Hz
WITH MUFFLER ON INLET – CL/EL HATCH OPEN
Total noise, Russian configuration
Total noise, GFE configuration
Inlet noise contribution
Russian case contribution
GFE case contribution
NC-40
NOTE: ESTIMATE DOES NOT INCLUDE STRUCTURALLY TRANSMITTED NOISE
NOTE: ESTIMATE DOES NOT INCLUDE STRUCTURALLY TRANSMITTED NOISE
WITH MUFFLER ON INLET – CL/EL HATCH CLOSED
Total noise, Russian configuration Total noise, GFE configuration Russian case contribution GFE case contribution NC-40

NASA/SP-2015-624 – ACOUSTICS AND NOISE CONTROL IN SPACE CREW COMPARTMENTS – Goodman & Grosveld
Chapter V - 126
acoustic levels based upon these tests in the flight configured EL, considering other noise sources in the EL [107]. The U.S. Segment Specification indicates that the acoustic emission limit during Campout-depress mode would not exceed 73 dBA [108].
Figure 137. Benefits of GFE inlet muffler on estimated EL noise.
Figure 138. RDP acoustic levels in the Airlock.
So
un
d P
ress
ure
Le
ve
l, d
B
Octave Band Center Frequency, Hz
NOTE: ESTIMATE DOES NOT INCLUDE STRUCTURALLY TRANSMITTED NOISE
GFE CONFIGURATION – CL/EL HATCH OPEN
Total noise without inlet muffler
Total noise with inlet muffler
Inlet noise contribution, no muffler
Inlet noise contribution with muffler
GFE case contribution
NC-40
So
un
d P
ress
ure
Le
ve
l, d
B
63 125 250 500 1k 2k 4k 8k 16k
Octave Band Center Frequency, Hz
70
65
60
55
50
45
40
35
30
25
20
15
10
NC-70
NC-60
NC-50
NC-40
NC-30

INTERNATIONAL SPACE STATION - Goodman & Grosveld
Chapter V - 127
Figure 139. Results of integrated Airlock testing at the center of the EL, with GFE Depressurization Pump Kit, considering other noise sources in the EL.
7.2.2.4 Airlock Noise Associated with Equalization Valves - Substantial effort was expended on ensuring that the Manual Pressure Equalization Valves (MPEVs) and other valves used in the Airlock were designed to have acceptable acoustic emissions associated with their operations (they were an intermittent noise source). The MPEV was to be used most frequently in an EVA operation. Voice Communication was critical at this interface for the IVA crewmember to support the EVA suited crewmembers during depress and repress operations in the Airlock. Loud background noise could interfere with crew communications. A positive pressure equalization valve (PPRV) was also used at the Airlock and Node 1 hatch interface. The PPRVs were used during contingency operations only, except during Station assembly. This acoustic focus on these valves started with the Airlock and Node interface, but was a concern that applied to pressure equalization values used in the Shuttle-to-ISS interfaces, and other ISS modules/locations. Acceptance of higher than desired levels are based upon the rationale that the MPEV and other pressure equalization operations were limited occurrences, are of short duration, hearing protection was available during these operations, and in cases where the crew was suited - the suit offered some acoustic attenuation. Boeing implemented designs that reduced the acoustic emission of the MPEV valves through the use of a screw-on muffler, and snout and/or disk-stack design options. They also implemented a muffler for the PPRV. The attenuation from the MPEV muffler was 25 dBA and the attenuation from the disk-stack was 30 dBA [109]. Original objectives were for MPEV valve acoustic emissions (sound pressure level 2 feet from either the inlet or the outlet) during pressure equalization operations to be no greater than 85 dBA wideband. Acoustic levels were estimated to be 120 dBA for the PPRV without the muffler, and 95 dBA with the muffler [109].
So
un
d P
ress
ure
Le
ve
l, d
B
70
65
60
55
50
45
40
35
30
25
20
15
10
NC-70
NC-60
NC-50
NC-40
NC-30
63 125 250 500 1k 2k 4k 8k 16k
Octave Band Center Frequency, Hz

NASA/SP-2015-624 – ACOUSTICS AND NOISE CONTROL IN SPACE CREW COMPARTMENTS – Goodman & Grosveld
Chapter V - 128
7.2.3 Airlock Operations Not Associated with Depressurization
Since 2003, airlock levels during operations not involving Airlock depressurization were consistently below the NC-50 continuous noise requirement, except at the 500 Hz octave band where levels met NC-50; however, depending upon the amount of stowage in the Airlock’s CL, levels inside that part of the module can be significantly reduced [110]. Figure 140 shows measured acoustic levels in the Airlock, including reduced levels in CL [4].
Figure 140. Acoustic measurements in Airlock.
7.3 Node 1
Nodes are modules that connect the elements of the ISS. Node 1 serves as the interface between the USOS and the Russian On-orbit Segment (RSOS). Node 1 was built by Boeing in Huntsville, Alabama, at NASA MSFC. It was launched in December 1998 and later joined with the Russian FGB, which was launched earlier. Figure 141 shows Node 1 being deployed on-orbit, and its interior crew compartment. In December 1997, concern was expressed that Node 1 was predicted to exceed NC-50 limit (module without payloads), and that noise control efforts seem to be lacking in Node 1 [111]. This was at a time when significant efforts were made to ensure that the Russian SM and FGB, and the Japanese modules were complying with specifications. The Astronaut Office representative on the AWG at that time later expressed concern that Node 1 acoustics efforts were not being coordinated with the NAL and AWG [112]. Efforts on noise control subsequently improved after the module exceeded the NC-50 requirement. Some ISS crews used this module to sleep in because it was quieter than the SM sleeping quarters (Kayutas).
Octave Band Center Frequency, Hz
So
un
d P
res
su
re L
ev
el, d
B
25
30
35
40
45
50
55
60
65
63 125 250 500 1000 2000 4000 8000 dBA SIL(4)
Airlock - Equipment LockAirlock - Crew LockU.S. Continuous Noise Requirement (NC-50, module only)

INTERNATIONAL SPACE STATION - Goodman & Grosveld
Chapter V - 129
Figure 141. Node 1 (Unity) Module grappled by the Space Shuttle Remote Manipulator System (left) and the crew compartment interior, Expedition III (right).
Node 1 had a ventilation system, termed Temperature and Humidity Control (THC) for cooling, with no heat exchanger or water separator. It also carried no payloads, so its full-up limit was NC-50. The THC fan was a CCAA fan. Figure 142 shows a schematic of THC and IMV.
Figure 142. Node 1, THC and IMV ducting. Mufflers are called silencers in the schematic (Courtesy, Roger Von Jouanne, MSFC).

NASA/SP-2015-624 – ACOUSTICS AND NOISE CONTROL IN SPACE CREW COMPARTMENTS – Goodman & Grosveld
Chapter V - 130
Node 1 used IMV mufflers/silencers that are the same as the FeltmetalTM football mufflers (Figure 110) used in the U.S. Lab (Chapter II on Noise Control). The mufflers used in Node 1 are shown in Figure 143. Three IMV fans and six of these mufflers are used in Node 1. There are also acoustically treated jumper ducts between the U.S. Lab and Node 1. In July 1998, two additional modifications were made to reduce overall noise levels: two supply registers were modified to remove perforated plates and diffusers, and were replaced with a modified slotted plate used to control delta pressure in the system; since delta pressure was reduced, the fan speed was also reduced while still maintaining total system supply requirements [113]. In August 1998, several acoustic modifications were made to Node 1: the IMV fan mufflers were redesigned; acoustic wrap was applied to areas identified by the Flight 2A acoustic team at various duct joints; and one aft IMV fan duct was modified to straighten its flow path [113]. Figure 144 shows an acoustics muffler/silencer used in the inlet elbow line of the THC fan. An acoustic foam-lined distribution plenum was added downstream of the THC fan outlet. Another silencer was added in the zenith cross-ship duct.
Figure 143. IMV fan with inlet and outlet football type mufflers and Bisco® wrap on both sides of fan.
Figure 144. Acoustic silencer installed in inlet ducting to THC fan (CCAA fan).

INTERNATIONAL SPACE STATION - Goodman & Grosveld
Chapter V - 131
Audio acoustic tests were performed to verify noise levels in July 1998. Node 1 was launched in November of that year. Figure 145 shows sound pressure levels measured in these 1998 tests. Node 1 had three IMV fans that operate after ISS assembly connecting and one THC fan. The Node 1 exceeded the NC 50 limit at 500 Hz band (4 dB) and 1000 Hz (1 dB). It was noted that the starboard IMV was louder than normal fans, and this fan may have been replaced at a later date.
Figure 145. Node 1 acoustic test results, July 1998.
Node 1 was measured on-orbit in Increment III when two of the three IMV fans were activated. Figure 146 shows where acoustic measurements were taken in Node 1, and Table 17 shows the levels that were obtained [114]. Node III was not yet part of the ISS, so the one IMV leading to it was not activated. Levels were lower than NC-50.
Figure 146. Node 1 Acoustic measurement locations.
(Forward) (Aft)
NODE
END CONE
+X
0 1 2 3 4 5

NASA/SP-2015-624 – ACOUSTICS AND NOISE CONTROL IN SPACE CREW COMPARTMENTS – Goodman & Grosveld
Chapter V - 132
Table 17. Node 1 sound pressure level [dB] measurements, Expedition III, 29 September 2001 (Note: Specification values used in the table are for NC-50).
One-third Octave Band Center Frequency
[Hz]
Bay 1
Bay 2
Bay 3
Bay 4
Spec
63 59.8 54.3 53.1 54.3 71.0
125 58.5 51.7 47.0 45.9 64.0
250 54.9 39.3 46.4 47.1 58.0
500 54.5 37.5 46.0 48.3 54.0
1000 50.8 40.4 43.4 46.5 51.0
2000 45.9 33.2 40.5 43.5 49.0
4000 42.3 31.2 36.5 38.9 48.0
8000 35.8 29.2 33.2 33.2 47.0
OA 63.9 56.5 55.8 57.0 72.3
dBA 56.0 44.2 48.6 51.1 58.1
Acoustic measurements of Node 1 originally showed exceedances of NC-50 in the 500 Hz
octave band in all four measured bays. There was an accepted exceedance of the 500 Hz octave band sound levels in Node 1, and the SPL in this band varied significantly over time, though the average values were fairly consistent [4]. Figure 147 shows the spatial average over the four measurement locations in Node 1 and this spatial average is also averaged over time for measurements taken since 2002 [4].
Figure 147. Node 1 average acoustic measurements, and since 2002.
Octave Band Center Frequency, Hz
So
un
d P
res
su
re L
ev
el, d
B
25
30
35
40
45
50
55
60
65
63 125 250 500 1000 2000 4000 8000 dBA SIL(4)
Node 1 - Average (also average since 2002)U.S. Continuous Noise Requirement (NC-50, module only)

INTERNATIONAL SPACE STATION - Goodman & Grosveld
Chapter V - 133
8. JAPANESE MODULES
Originally, the Japanese space agency that participated in ISS and addressed the ISS acoustic efforts was the National Space Development Agency of Japan (NASDA). On 1 October 2003, NASDA combined with the National Aerospace Laboratory of Japan and the Institute of Space and Aeronautical Science to form the Japan Aerospace Exploration Agency (JAXA).
8.1 Japanese Experiment Module/Kibo Facility and its Modules
JEM/Kibo is a complex facility consisting of the following major elements: Japanese Pressurized Module (PM); Exposed Facility (EF); ELM-PS (or JLP); Experiment Logistics Module - Exposed Section (ELM-ES); Japanese Experiment Module Remote Manipulator System (JEMRMS); and Inter-orbit Communication System (ICS) (Figure 148) [115]. NASA acoustics was only involved in the PM and ELM-PS. The Kibo PM during deployment to the ISS and a view inside its crew compartment is shown in Figure 149.
Figure 148. JEM/Kibo facility.
Figure 149. Kibo, Pressurized Module (PM), during deployment (left) and its crew compartment (right).
Experiment Logistics Module Pressurized Section (ELM-PS)
Airlock
Remote Manipulator System (JEMRMS)
Experiment Logistics Module Exposed Section (ELM-ES) Inter-orbit Communication System (ICS)
Exposed Facility (EF)
Pressurized Module (PM)

NASA/SP-2015-624 – ACOUSTICS AND NOISE CONTROL IN SPACE CREW COMPARTMENTS – Goodman & Grosveld
Chapter V - 134
The PM is the largest pressurized module on the ISS. As many as 23 racks (10 of which are International Standard Payload Racks [ISPRs]) can be accommodated in the PM. The PM is Kibo's main facility and a laboratory. All the system racks necessary for Kibo's on-orbit operations are installed in the PM. The PM was delivered and connected to the ISS during the STS-124 mission. Kibo also has a scientific airlock through which experiments are transferred and exposed to the external environment of space.
Kibo’s ELM-PS is a stowage facility that provides stowage space for experiment payloads samples and spare parts. This facility and its location attached to the PM is shown in Figure 150. The pressurized interior of the ELM-PS is maintained at one atmosphere for shirt-sleeve operations. Crewmembers can move freely between the PM and the ELM-PS.
Figure 150. The ELM-PS (left) and its location when mated to the PM (right).
Although the PM and ELM-PS were not added to the ISS until the spring of 2008, a number of TIMs, design reviews, and other efforts were made in the time period covered by this book that affected the acoustic results of these modules Figure 151 shows the acoustic levels in the PM and the ELM-PS that were measured before flight in 2002. As shown in this figure, the PM fully complied with the NC-50 module limit. The ELM-PS complied with NC-50 except for a 2 dB exceedance at 1000 Hz and 2000 Hz. A Bisco® barrier cover was available to lower the sound pressure levels so the ELM-PS could be in complete compliance with NC-50, but NASDA determined not to use the cover since access to the logistic module would be for limited occasions and since duration of crew ingress are very limited, and also because there is no other continuous acoustic noise source such as payloads in this laboratory. It was recently reported that both the JEM-PM and the ELM-PS (now termed JPL) were well below the NC-50 module limit [4].
Japanese efforts on Kibo and ELM-PS were very well done, without any significant issues. JAXA was the first known IP that attempted to lower module levels via increase of the absorption level on the in-board surface of payloads installed within the JEM-PM, a way of lowering levels at the receiving location recommended in Chapter II, Noise Control. The SAIBO payload had such treatments, as discussed in Section 3.2 of Chapter II.
Exposed Facility Unit (ELM-PS)
∅ 4.4 𝑚
4.2 𝑚

INTERNATIONAL SPACE STATION - Goodman & Grosveld
Chapter V - 135
Figure 151. JEM/Kibo PM and ELM-PS acoustic levels.
8.2 H-II Transfer Vehicle Configuration and Hardware Contents
The H-II Transfer Vehicle (HTV), developed and built in Japan, is an uncrewed cargo transfer spacecraft that delivers supplies to the ISS. The configuration of the HTV is shown in Figure 152 [116]. NASA acoustics provided reviews only on the Pressurized Logistics Carrier (PLC) portion on the HTV, since the crew was able to inhabit it during ISS operations. The HTV acoustic requirement was to not exceed NC-50 in the habitable areas. The limit did not apply during alarm or warning conditions.
The U.S. side went through a second HTV CDR without any significant acoustic issues. HTV-1 launched in September 2009.
The PLC has two rack bays, with an HTV unique cabin ventilation fan and a ventilation system ducting that connects the fan to air inlets and air outlet diffusers, as shown Figure 153 [117]. Silencers shown in Figure 153 were installed in the fan inlet and outlet to muffle the acoustic levels. Acoustic measurements were taken in HTV-1 during Increment 20, in September 2009 [118]. Measurements were taken in three places—at the hatch area, and at the center of two rack bays—with levels shown in Figure 154 [118]. The measurements taken in ground tests at the hatch area in 2008 are also shown in this figure. Levels met NC-50 in the rack bays except in Bay 2 at 500 Hz, where the total level was 56 dBA, and overall levels were at NC-53.4 rating.
Octave Band Center Frequency, Hz
So
un
d P
res
su
re L
ev
el,
dB
30
35
40
45
50
55
60
65
70
75
80
63 125 250 500 1000 2000 4000 8000
NC-50
JEMJEM ELM-PS

NASA/SP-2015-624 – ACOUSTICS AND NOISE CONTROL IN SPACE CREW COMPARTMENTS – Goodman & Grosveld
Chapter V - 136
Figure 152. HTV configuration (top) and flight vehicle (bottom).
Figure 153. HTV PLC cabin ventilation system (PCBM: Pressurized Common Berthing Mechanism).

INTERNATIONAL SPACE STATION - Goodman & Grosveld
Chapter V - 137
Figure 154. HTV1 Acoustic measurements taken 21 September 2009, and during ground tests in 2008.
8.3 Centrifuge Accommodation Module, Centrifuge Rotor, and Life Sciences Glovebox
During the time period covered in this Chapter, the Japanese had a suite of biological research specimen support equipment that collectively constituted the Gravitational Biology Facility (GBF). NASA Ames Research Center (ARC) was responsible for the GBF. Housed within the CAM, the GBF was to support research on how the space environment affects a broad range of biological systems. The centerpiece of the GBF was a 2.5-m-diameter CR that accommodated multiple biological habitats for maintaining a variety of bio specimen types, from cells to rodents to large plants. A Life Sciences Glovebox (LSG) was also contained within the CAM along with Habitat Holding racks for holding and stowing specimens. The CAM, CR, and LSG were JAXA-provided hardware, which were cancelled in 2005.
Considerable acoustics support effort was expended in support of this hardware development, including program-sponsored design reviews, teleconferences, and TIMs with the Japanese. This hardware presented significant and unique types of challenges worthy of discussion. Figure 155 shows the CAM concept, with the large CR occupying one end of the module and facing the module center with its centerline parallel to the long axis of the CAM, and the LSG payload extending toward the centerline of the module. Figure 156 shows the relative size and layout of hardware within the CAM (the Habitat Holding Rack position changed from what is shown in Figure 155). The grey color in the bottom figure shows the crew cabin volume free of equipment or racks, except when the LSG is extended into that volume, in the aisleway. The supporting structure for the CR shroud in the CAM is shown in Figure 157. Figure 158 shows a NASA ARC low-fidelity mock-up of the CAM, with the LSG in a nearly stowed position. Figure 159 shows the LSG in extended position for operation, where crewmembers are working on the LSG in the CAM aisleway.
1 Hatch 59.2 dBA NC-55.9 2 Bay 1 56.0 dBA NC-53.4
3 Bay 3 52.6 dBA NC-48.7 HTV1 Ground Test Data (2008) 58.7 dBA NC-53.6
NC-60 NC-50
NC-40
NC-30
HTV1 Ground Test Data from 2008

NASA/SP-2015-624 – ACOUSTICS AND NOISE CONTROL IN SPACE CREW COMPARTMENTS – Goodman & Grosveld
Chapter V - 138
Figure 155. CAM concept showing the cylindrical shaped CR (blue colored in figure), and LSG rack (orange colored) extended with habitat attached near center of module, and other racks.
Figure 156. CAM size and layout. CR Rotor is the CR shroud outline shown without supporting structure in
the bottom figure. LSG is the Life Sciences Glove box (in stowed position), IMV is the Inter-Module Ventilation, HHR is Habitat Holding Rack, and CCAA is Common Cabin Air Assembly.
CR Rotor
CCAA
(Fan, W/S) Stowage
Rack HHR #1
HHR #2
Freezer Stowage
Rack
LSG
CR
Rack
IMV Fan
Cabin
IMV Fan
2.1 m
2.1 m
.1
.1
8.9 m
2
1.7 m
2.1 m
∅2.9 m
2.1 m

INTERNATIONAL SPACE STATION - Goodman & Grosveld
Chapter V - 139
Figure 157. Views of CR shroud and support structure in CAM.
Figure 158. NASA-ARC CAM low-fidelity mock-up. The LSG is shown in a nearly stowed position, with its arm holes marked in red on the left.
CR
LSG

NASA/SP-2015-624 – ACOUSTICS AND NOISE CONTROL IN SPACE CREW COMPARTMENTS – Goodman & Grosveld
Chapter V - 140
Figure 159. LSG configuration for on-orbit operations, with the LSG deployed into the CAM aisleway.
8.3.1 Original Acoustic Allocations for the Centrifuge Accommodation Module, Centrifuge Rotor, and Life Sciences Glovebox Payloads
In 2001, NASDA reported CAM acoustic levels to be excessive, at about NC-65 level at the CAM centerline [119]. At that time, acoustics was classified as a “Red-Light issue” with concentration on the need for remedial measures, a proposed increase in the CR limit from NC-40 to NC-45, and a reduction in limits to the habitats that were installed within the CR during its operation. Red-Light issues were those where: a technically feasible solution was not found; forward actions did not necessarily mitigate the risk or impact; or it presented significant program risk. Efforts to resolve CAM, CR, LSG, and habitat limits continued with teleconferences and acoustic TIMs.
In 2002, the flow-down of acoustic limits for the CAM, and the CR, LSG and other payloads were agreed to with NASDA (before renamed to JAXA in 2005) [120]:
CAM full-up operating system (all noise sources, including the CAM, CR, and other payloads): acoustic limits of NC-48, plus module systems of NC-50, or NC-52 total
CAM module systems: NC-50 Payload Complement: NC-48 CR with habitats: sound power allocation (roughly NC-46) LSG (if continuous), HHR #1 and #2, and Cryo Freezer: NC-40 for each payload
The CR originally had NC-40 as its acoustic limits. As development of the CR progressed, there was an increasing concern with the CR limits being NC-40, as it was felt that this was not high enough for a large rotating and radiating drum, with specimens inside, and including other noise sources that are to be further discussed below. NC-43 and NC-46 were considered as options. The limit later turned into a CR-in-the-CAM acoustic limit. There were concerns that the CR had direct noise sources, and questions arose on how to deal with them in the CAM. NASA also had concerns with how to accomplish verification.
The LSG NC-40 allocation noted above was based upon the initial LSG specification [121].
Secondary Operator Subrack Payload
Laptop PC
Work Volume
Primary Operator
Crew Restraints
Air Ducts from/to Subrack Payloads Airlock Water Umbilicals
CEILING
LSG
FLOOR
PORT

INTERNATIONAL SPACE STATION - Goodman & Grosveld
Chapter V - 141
8.3.2 Centrifuge Rotor Design, Acoustic Limits, and Centrifuge Rotor-in-the-Centrifuge Accommodation Module
The CR, in combination with a capability to install a set of up to four habitats, was termed the Integrated Centrifuge System. Figure 160 shows the CR outer shell (shroud) shape/configuration including front and back sides. As the centrifuge rotates within its outer shell, artificial gravitational forces are produced upon the attached habitats that house various biological specimens. Originally planned accelerations ranging from 0.01 g to 2.0 g would permit scientists to compare how differing gravity levels affect the biology of organisms housed in habitats under otherwise identical conditions, thus separating the effects of gravity from other factors in the space environment. The centrifuge provided life support resources and electrical power to the habitats as well as data transfer links to ISS systems and to the ground. The hub, or center, around which the centrifuge rotates, provides structural support for the CR and rotating part of the centrifuge, and it provides life support to the specimen habitats. The access door for habitat installation/removal is shown in the front view of Figure 160.
Figure 160. Centrifuge Rotor shroud outer shell, front side (left) and back side (right).
NASDA developed a CR acoustic analysis report and noise control plan in the early stages of the project to ensure compliance with the payload acoustic requirement that originally was NC-40, measured at 0.6 m from the CR front surface at the loudest location. NASA reviewed this plan, found that more information and verification details should be added, provided inputs, and emphasized the importance of having a good plan for controlling the CR acoustics. The CR was a one-of-a-kind payload that had a rotating mechanism with bearings, noise sources within its shroud (habitats, and airflow dynamic effects), noise sources on its outside surface such as fan air flow inlets and outlets, unknown acoustic properties caused by its varying structural makeup, and a very large outside radiating surface area of about 25 m2. The CR occupied a unique payload position in the rear of the CAM, with its front surface radiating area facing down the CAM aisleway, and its rear and side surfaces surrounded by the CAM end cone, forcing acoustic radiation from those surfaces into the CAM as well. The CR needed a design limit that could be verified and, because of the unique aspects of the CR design, it was agreed that the CR should have a higher limit than NC-40. Later it was agreed that the limit should be NC-46. A sound power table was also added to the CR specification that was associated with

NASA/SP-2015-624 – ACOUSTICS AND NOISE CONTROL IN SPACE CREW COMPARTMENTS – Goodman & Grosveld
Chapter V - 142
the CR being NC-46 when it was installed within the CAM. Both the analysis and the noise control plan were continuously updated to accommodate changes in the design, and incorporate the latest materials and test data.
The analysis generated considered all the noise sources in the CR that contributed to the noise at the compliance location. It also addressed the acoustic absorption, structural damping, and the transmission loss characteristics of the CR shroud. Three particular configurations of the shroud material makeup were considered for the acoustic analysis and selection, which were discussed in a 2003 conference paper [6]. The shroud design was primarily driven by structural and weight considerations. In the first configuration, the shroud was built as a frame structure carrying 3-mm-thick aluminum alloy panels. The second configuration analyzed was a 2-mm-thick aluminum panels with a lining of 40-mm-thick acoustic absorption material facing the inside of the CR enclosure. A honeycomb configuration panel attached to various thicknesses of aluminum sheets was the final configuration considered, and was selected.
Sound attenuation measures that were considered included visco-elastic damping tape on the honeycomb panels, double-wall construction with different resonance frequencies of the individual panels, absorption material between the panels and inside the CR enclosure, and avoidance of resonance interaction. Finite element analysis results and test data from a structural evaluation of an engineering model were anticipated, along with the results from acoustic verification tests. These analyses, test results, and other considerations were to be a basis of a revised noise control plan and an updated analysis report to help ensure compliance with acoustic requirements.
In February 2004, the following was presented on CAM/CR systems noise at a high-level ISS management review relative to ISS acoustics [122]:
CR and LSG are unique, located in the CAM centerline aisle, have large emitting surface areas, and will be significant CAM acoustic sources. The CR has a very large emitting surface area compared with a standard rack.
CAM Module system level limits are in jeopardy. The latest CR/CAM analysis shows that the Bradford AAA and Specimen Air
Assembly (SAA) fans are the predominant sources and exceed JAXA’s sound power limits. (The AAA fans used were provided by Bradford Engineering, not the same AAA fan used in USL and other modules in the U.S. Segment. The AAA fans provided air cooling to habitats and the SAA fans provided cabin air flow through the CR. The AAA and SAA fans were mounted on the rear of the CR). Quieting efforts on the AAA and SAA fans were dropped by JAXA (a NASA Review Item Disposition [RID] at Interim Progress Review [IPR]).
The CCAA is the principal noise source of the CAM module systems. NASA has requested that JAXA consider a lower sub-allocation than NC-50, especially at lower frequencies, to help achieve overall CAM NC-52 system limits. The CCAA is being redesigned to reduce the size of the inlet and outlet muffler, so there was concern that this may be counterproductive to reducing CCAA acoustic levels. Disposition of Acoustics, IPR RID on this subject is TBD, and Boeing indicated a move to eliminate mufflers.

INTERNATIONAL SPACE STATION - Goodman & Grosveld
Chapter V - 143
CR acoustic specification is unresolved due to disagreement on acoustic analyses/acoustics. NASA’s input is that the CR needs to meet the requirement of NC-46 in CAM. JAXA wants to use sound power, without reference to NC-46 in CAM. NC-46 may be too high of a sub-allocation.
JAXA is not planning to do verification testing on the CR final design, to verify analyses (Acoustics IPR RID issue, TBD). NASA is concerned that analyses are not being updated per the Acoustics Noise Control Plan (ANCP) and are currently based upon unverified assumptions.
The CAM becomes NASA’s responsibility after the first CAM flight, so issues need to be resolved before NASA assumes responsibility for the CAM.
In early 2004, it was agreed to use “the sound power emitted from the CR loaded with four operating habitats, internal noise sources shall not exceed limits defined in a table,” which was added to the CAM/CR ICD. CAM representatives indicated they could not be sure to meet the NC-46 sound power-related limit unless direct noise is controlled. Direct noise sources on the CR exterior were the SAA fan inlet on the front face of the CR shroud, four SAA fan outlets near the front surface but on the sides of the shroud, and potentially fan-case-radiated noise.
Another NASA issue was brought forward to the CAM CDR with Mitsubishi Heavy Industries, Ltd, JAXA’s CAM contractor. This issue dealt with the acceptability of using the CR as a point noise source in the CR-in-the-CAM analyses [123]. NASA considered the use of a point source an oversimplification and unrealistic representation of how the CR radiates acoustics within the CAM (Figure 161). To address the large CR frontal surface area, the CR design at the time included a heavy barrier across the front surface of the CR facing the center of the CAM. This issue was being worked at the time of the CR cancellation.
An additional issue at the CDR dealt with the requirement to ensure that the CR met the requirement of NC-46 when the CR was operating in the CAM. The CR payload sound power equivalent for this NC-46 limit was accepted by NASA, but NASA had concerns that the relationship between the NC-46 and the sound power was dependent upon several defined- but-unsubstantiated parameters and assumptions. Further analyses and testing were needed to resolve this relationship.
Figure 161. CR analyses using CR as a point source in the CAM.
CR (Noise Source) Cabin: 100 m2 Racks

NASA/SP-2015-624 – ACOUSTICS AND NOISE CONTROL IN SPACE CREW COMPARTMENTS – Goodman & Grosveld
Chapter V - 144
JAXA and its contractor expended much effort on CR acoustic design and analyses. In July 2005, the JAXA/contractor executive summary data for the CR Systems CDR showed the following [124]:
Adopting NC-52 for “full-up” continuous noise was “still a concern”; transmission loss of the CR shroud’s honeycomb materials were measured and CR system noise assessment was updated.
There were acoustic measures such as the SAA fan inlet and outlet mufflers, and potentially an additional muffler to reduce a 250 Hz band SAA inlet noise.
In addition, mufflers for the AAA fan inlet and outlet were provided and an additional noise cover for the AAA fan was under consideration to reduce case radiated noise.
Also, there were concerns that any further countermeasures would cause significant schedule and cost impacts.
Other design features planned were the use of acoustic absorbing material inside the shroud’s honeycomb panels and use of an acoustic barrier across the entire front face of the CR.
No known additional progress was made on the issues described above at the time of cancellation of the CR and CAM efforts.
8.3.3 Life Sciences Glovebox
The movable portion of the LSG was its Work Volume Assembly (WVA). As indicated previously, the location of the LSG in the CAM, when the WVA is not deployed, is shown in Figure 156 and Figure 161. When the WVA is deployed out of the LSG rack, its configuration in the CAM is shown in Figure 155 and Figure 159. Further views of the LSG with its Work Volume (WV) deployed are provided in Figure 162.
Figure 162. LSG including WVA with Habitat or Cryo payload attachments.
Habitat or Cryo Attach (two)
WVA Interface w/ LSG Rack & Gap
WVA
2 Fans
LSG Rack
Air Inlet
Hose, typ. 4 plcs.
AAA Fan

INTERNATIONAL SPACE STATION - Goodman & Grosveld
Chapter V - 145
The front side of the WV, including acoustic measurement locations used in February 2004 testing, is shown in Figure 163. Figure 164 shows the configuration of the back side of the WV with the three WV circulation fans (left) and other hardware, and a photograph of the rear of the WV [125][126]. These fans were a major noise source in the WVA. The AAA fan is for cooling of electronics and rack internal cooling and cooling of Sub-Rack Payloads (SRPs) attached to the LSG. Air flow diagrams for the WV are shown in Figure 165 and Figure 166 [125]. Figure 167 shows a rear view of the LSG with the rear closeout panel removed, showing the location of the AAA fan, which was also a major contributing noise source in the LSG [127].
Figure 163. Acoustic measurements locations during NASA testing of partial LSG and WVA.
Figure 164. Back view showing WV configuration (left). Photograph of the back of the WV (right).
Left hand side #2
Back side #1
Top #5
Front side #4
Bottom #6
Right hand side #3

NASA/SP-2015-624 – ACOUSTICS AND NOISE CONTROL IN SPACE CREW COMPARTMENTS – Goodman & Grosveld
Chapter V - 146
Figure 165. WV air flow diagram.
Figure 166. Additional WV air flow diagram.
Figure 167. Rear view of the LSG, with access panels removed showing AAA and WV fan locations.

INTERNATIONAL SPACE STATION - Goodman & Grosveld
Chapter V - 147
In 2002, in response to a NASA request for a copy of an LSG ANCP (as required by SSP 57000), it was indicated that NASDA and Ishikawajima-Harima Heavy Industries (IHI) Aerospace were not preparing one and may not be required to prepare one [128]. In response, concern was expressed about needing to clarify responsibilities for the LSG integrated with Habitats or Science experiments, and who was responsible, as that was not clear at the time [129].
An analysis of the LSG in 2003 showed LSG levels at NC-64, equivalent to 69.6 dBA [130]. This level was far in excess of the NC-40 limit designated in the LSG specification [131], and was even higher than the NC-52 systems limit for the operating CAM, including all module noise sources (CR, LSG, and other sources). NASA noted in a briefing [130] that JAXA indicated “the analyses has many unrealistic assumptions” [132]. NASA added that the analysis was an immature one, and that significant problems with this analysis required attention [130].
In July 2003 at an Acoustics TIM with NASA ARC, it was confirmed that the LSG specification required that the LSG, integrated with a full complement of Habitats and scientific equipment (SE), shall meet the SSP 57000 acoustic noise requirement, and that the acoustic profiles of the Habitats and SE in a LSG shall be subject to sub-rack ICD [133]. It was noted that the LSG was now considered an intermittent payload. Intermittent noise limits apply if payloads operate for 8 hours or less and lowering the payload operational time per workday raises the limits [134]. It was also noted that the LSG is operated by two crewmembers who may be working for long periods of time with their heads in close proximity to the WV (in fact closer to the source than the 2-ft-away limit allows and therefore louder at that location), which could make it very difficult to communicate. It was related that the Astronaut Office had some concerns about classifying the LSG as an intermittent source and alleviating overall payload requirements, especially since this payload requires close proximity operations. The need to establish sub-rack apportionments compatible with program requirements in SSP 57000 was also emphasized and discussed.
In February 2004, vibro-acoustic tests on the LSGs qualification WVA unit and a related TIM were held in Heerle, The Netherlands. NASA provided measurement equipment, performed testing on the WVA unit, and provided a test debriefing [135]. The three WV fans used to circulate WV air were operated at the seven baseline work speeds, which provided varying air exchanges in the WV. Tests showed that the WV exceeded its acoustic limit for all seven operational WV fan speeds. Note that the acoustic requirement is with the LSG, of which the WV is a part, and includes hardware in the rack that supports the WV, such as the AAA fan and the WV attached SE or SRPs. Only the WVA and a LSG type support frame was available for testing. The LSG had to meet acoustic limits for both the WV extended and retracted. SE and SRP hardware was not available for this testing. Figure 168 shows an example of these high acoustic levels for the WV fan speeds that were acquired at the WV top measurement location, while the WV was extended. Figure 169 illustrates that this testing revealed significant narrowband tones and effects across the frequency spectrum.
In an introductory briefing, JAXA/IHI noted that shock mounts had been added to the WV fan in the qualification units, and the fan had improved balancing, reduced sharp edges, and smoother radii in outlet ports [125]. Based upon this testing and review of fan drawings, NASA recommended that further efforts be made to quiet the WVA fans. This effort could have

NASA/SP-2015-624 – ACOUSTICS AND NOISE CONTROL IN SPACE CREW COMPARTMENTS – Goodman & Grosveld
Chapter V - 148
included minimizing the WVA fan’s case-radiated noise through the use of multi-layer wraps used in other ISS Applications, such as discussed in Chapter II, on Noise Control.
Figure 168. WV fans operating at seven fan speeds.
Figure 169. Narrowband spectrum for WV fan, fan speed number 4.

INTERNATIONAL SPACE STATION - Goodman & Grosveld
Chapter V - 149
NASA also indicated the following at the debriefing after testing: the LSG has no defined acoustics sub-allocation for noise sources; the LSG specification calls for the WV alone to meet NC-40 at all fan speeds (although Boeing indicated at this TIM that this was not a requirement); and the LSG is being designed without appropriate attention to acoustics, including sub-allocations to ensure system limits are not exceeded. At this TIM JAXA/IA received an action item to implement effective noise control measures on closeout designs for the WVA interfaces and extension areas with the LSG rack. The intent of the covers was to cover/block the large WV fan noise leakage paths through which WV fan noise could readily leak from the rear of the WVA. NASA’s final report on WV testing was provided in March 2004 [136].
At the February 2004 ISS management briefing that followed the WVA testing, the following items were presented with respect to the LSG/WV [122]:
Hardware is being designed without appropriate attention to acoustics as a design discipline. Hardware is built into the flight configuration, and then tested. At that time, the impacts to acoustically fix the WV hardware are significant. Waiting until the flight hardware is tested is too late to address acoustics issues. Resultant impacts can be too great or available solutions can no longer be practical.
Sub-allocations are not being considered in items such as the LSG, to ensure that the system limits are not exceeded (if the total requirements are equal to a whole pie, appropriate sub-allocated size slices need to be established. Each party is allocated an appropriate slice).
Two crewmembers working in close proximity to the LSG, closer than the 2-ft requirement, raises concerns for excessive noise exposure (including LSG near field noise and noise from the CAM environment) and lack of adequate communications.
Rack integrators are not active or knowledgeable in establishing sub-allocations.
In March 2004, subsequent to the February 2004 NASA testing, JAXA indicated that designs were being developed for closeouts between WVA and rack structure, to block and absorb WV fan noise emissions through leakage paths [137]. Barrier material and acoustic foam were under consideration and sketches of the approach were provided.
In April 2004, JAXA and its subcontractor for the LSG, IHI Aerospace, tested remedial noise control measures in the integrated LSG facility rack engineering model with significant results [138]. Testing included the AAA fan in the LSG, which supplies air to the WVA and the attached sub-racks, and returns air to the LSG. The manifold receives air from the AAA fan. This fan was another major noise source in the LSG, and was not available in the February 2004 WVA testing performed by NASA.
AAA fans were run at speeds 1, 3, and 6, and the WVA fans were run at speeds 0, and 1 through 7. Preliminary testing results were as follows: for the AAA fan and the WVA fans running at speed 1, before noise control measures were installed, the LSG measured NC-48 equivalent at 250 Hz and 500 Hz; after noise control was applied, the measurement met NC-40; at AAA fan speed 6, and WVA fans at speed 7, before measures were installed, the measurement was NC-70 equivalent at 500 Hz, 69 dBA A-weighted OASPL; after noise control

NASA/SP-2015-624 – ACOUSTICS AND NOISE CONTROL IN SPACE CREW COMPARTMENTS – Goodman & Grosveld
Chapter V - 150
was applied, measurements were NC-55 equivalent at 500 Hz, 57 dBA OSPL. It is not clear whether the measurement location at 2 ft from the LSG or at the crew location was the worst case when operating the WVA. Regardless, this was a very strong indication that the noise control efforts implemented were very promising, and that LSG levels could be lowered enough to be manageable, and meet or approach current payload limits.
In early May 2004, NASA ARC processed a change request to an ISS Control Board to baseline the LSG to the SRPs and SE’s Interface Control Document (ICD), including the acoustic limits for SRPs and SE, establishing sub-allocated limits needed for these items [139].
In June 2004, a TIM was held with JAXA/IA (IA was used as an abbreviation for IHI) to discuss the following: the testing results of the remedial measures; the integrated level by analysis review, the review of the noise mitigation implementation plan; the LSG operational scenarios; inputs to Prototype Flight Model (PFM) testing; and comments on design approaches [140]. The JAXA/IA proposal was to operate the LSG for 8 hours at low AAA/WV fan speed without SRP/SE attached, and operate the LSG for 3 hours at high AAA/WV fan speed with the SRP/SE attached. NASA ARC and JSC agreed that the NC-40 continuous noise source requirement was not applicable, since it was proposed to operate the LSG intermittently─ intermittent noise requirements can apply for the LSG operating 8 hours or less in any 24-hour period. Some remedial measures reviewed were eliminated because of impacts to crew setup time or crew difficulty. Measures presented and agreed to included the following: muffler for reference duct, numerous rack closeouts, cover over manifold, lagging over ducting, cover and barrier sheet over the AAA fan, and an added AAA muffler. It was estimated that these measures would add 50 kg (110.2 lbs) of mass to the LSG [140].
The LSG CDR was held in Kawagoe Japan, 26 July through 5 August 2004. A number of suggestions and issues brought up at the CDR. These issues were resolved and closed [141]. Important issues included:
Acoustic countermeasures add mass and there is a need for approval of the mass increase. Response from JAXA/IA team was that the team recognized that the acoustic countermeasure design and associated mass are not at CDR level. The team agrees, based upon EM acoustic testing and acoustic concept design, that there is minimum risk to proceed to the next design phase when this will be addressed.
The verification of the SSP 57000 acoustic compliance is open since verification was not based upon final flight hardware testing and designs. JAXA/IA agrees that verification is open at this time.
LSG PFM testing needs to add SRP/SE hardware, speed setting combinations, and testing to find the loudest point away from the LSG; and include gauntlet and vacuum cleaner operations use in testing. This was agreed to by JAXA/IHI.
Requested that JAXA\IA consider a number of recommendations on acoustic measures. JAXA/IA team agreed that NASA recommendations would be considered.

INTERNATIONAL SPACE STATION - Goodman & Grosveld
Chapter V - 151
In addition to the type of acoustic countermeasures described previously, a considerable number of sound absorber blankets were proposed to be added to the inside surfaces of the LSG rack.
LSG design efforts continued after CDR, with focus on resolving final acoustic countermeasures and test plans for the PFM. Acoustic testing of the LSG continued in December 2004.
In late April 2005, NASA was requested to review the LSG PFM test plan [142]. The criteria the test was to meet were: (1) in LSG Operational Configuration 1, the SPL at any point 0.6 m (2 ft) away from the LSG surface does not exceed 49 dBA, which is the dBA limit for more than 8 hours of operation; and (2) in LSG Operational Configurations 2 and 3, the SPL at any point 0.6 m (2 ft) apart from the LSG surface does not exceed 50 dBA and 57 dBA, respectively, when the SRP and SE noise data are incorporated into the result by analysis. The 50 dBA and 57 dBA were based upon intermittent payload noise criteria for 7 hours and 3 hours of operation during a workday. A number of sketches showing noise control approaches were provided.
A number of NASA comments were forwarded to JAXA/IA on the measures and the test plan. JAXA/IA and NASA interchanged responses ending with a final JAXA response to NASA provided on 22 July 2005 [143]. During these interchanges, JAXA agreed that if PFM testing with the proposed countermeasures exceeds the limits, additional noise control measures will be investigated to reduce the noise level, and there will be discussion on the different fan speeds, or review of operational conditions with NASA [144]. Other status or issues identified during these exchanges include the following:
NASA materials management wants to minimize the use of melamine foam as LSG countermeasures because of outgassing concerns with the foam.
There has been a concern with the amount of crew time spent to install some of the remedial measures before (setting up the LSG brackets, AAA fan muffler, and covers) and after WVA is extended (covers and closeouts). JAXA/IA provided estimated times to install these items.
Remedial measures proposed were numerous, including: an AAA fan inlet muffler; an AAA fan and heat exchanger cover; an elbow cover for AAA fan ducting; a WVA top cover; a number of other covers; avionics air duct lagging; and sealing of holes and gaps. Most of the measures involved use of Bisco® HT-200 and typeTA-301 Solimide® foam, with Kevlar® fabric as an outside cover, similar materials as used by NASA, except for the Kevlar® fabric. Figure 170 shows some preliminary remedial measures implemented in the LSG testing (closeouts and muffler with hoses attached). NASA complimented JAXA and IHI on their noise control efforts, which were very successful in reducing the LSG noise to a manageable level.
Later, it was indicated that the PFM audible noise test was scheduled for 8-19 October 2005 [145]. After this time, a dropout of communications occurred between NASA JSC and JAXA/IHI on the LSG, since work stoppage on the LSG was about to be finalized. However, remedial acoustic efforts were continued by JAXA/IHI, and tests were performed on the LSG proto flight model PFM. The PFM testing report is dated 21 November 2005 [146]. Testing results were

NASA/SP-2015-624 – ACOUSTICS AND NOISE CONTROL IN SPACE CREW COMPARTMENTS – Goodman & Grosveld
Chapter V - 152
again very promising, and although the final remedial measures were not fully resolved, the countermeasures used were close to satisfying the acoustic limits for proposed LSG operations. It is not believed that associated weight impacts due to remedial measures obtained approval because the LSG program was being phased out.
Figure 170. Some of LSG remedial measures shown in yellow, as used in IHI’s December 2004 testing.
8.3.4 Centrifuge Accommodation Module, Centrifuge Rotor, and Life Sciences Glovebox Overview
Tight program funding is believed to have caused a cutback of efforts or non-initiation of efforts that were significant to noise control. Acoustic problems encountered with the overall CR effort were: not quieting significant noise sources (SAA and AAA fans) early in the development; lack of good noise control plans with the CR early in the program; overemphasis on the reliance of analyses in noise control instead of using testing in the program early to check on the analyses; and understanding the risk or validity of relying on acoustic assumptions used (i.e., proposing not to test the final CR design, but instead using analyses that had debatable assumptions); and attempting to use “goals” to ease efforts, rather implementing the above recommendations and using requirements as a “forcing function.” It is noted that in spite of the late availability of good CR noise control plans, the efforts that were made to update the plans over time were very beneficial as they much improved focus and communications on what needed to be done to resolve CR acoustic issues and struggles.

INTERNATIONAL SPACE STATION - Goodman & Grosveld
Chapter V - 153
As indicated previously, the LSG had established seven fan speeds for the WV fans, and testing on the qualification model in February 2004 found that these speeds all exceeded the WV NC-40 limit and were higher in level than the CAM systems [136]. Quieting of the WVA fans was recommended at that time by NASA to minimize the LSG acoustics problem. This was difficult to do because this was found out so late in development that it was too loud, and changing it would cause significant schedule and cost impacts. So other remedial pathway efforts were expedited to remedy these high noise levels. Early acoustics testing of the WVA fans, the AAA fan and the entire LSG, including WVA interfaces, could have helped identify design changes that could have precluded or minimized the impacts of the remedial pathway measures that were later needed. For example, early incorporation of LSG designs for closing out the large LSG to WVA interface gaps that existed could have helped lessen the need for the extensive, heavy closeouts being added—closeouts that required crew time to install. The need for closeouts was evident for some time, and was discussed at the SSBRP Acoustic TIM in July 2003 [133], and later in communications on this subject, in December 2003 [147]. Also, use of multi-layer fan case wraps or other methods to better encase and acoustically isolate the WV fans close to them could have lessened impacts of new measures. This would block case-radiated fan emissions close to the noise source, not farther away at the WVA/LSG interfaces. Improving the acoustic absorption of fan emissions at the rear of the WVA could also lessen the mass impacts on the closeouts used to both absorb and block noise (closeout designs used included acoustic foam with a lot of barrier material on the closeout areas facing the crew).
Reducing the noise emissions of the AAA fan was continuously emphasized by NASA, and would have helped both the LSG and the CR. The LSG WVA and AAA fan situations are other prime examples of a missed opportunity to quiet noise sources, which in this case resulted in significant pathway weight and crew operational time impacts.
The progress made on CAM/CR acoustics was slow, but significant. The CR and the CR-in-the-CAM acoustics badly needed some prototype configured hardware to further update and verify assumptions and analyses, minimize risk, and identify realistic, test-proven acoustic levels, and work remedial actions required. The LSG program lacked prototype testing, as noted, but ended up having the benefit of flight configured hardware for testing, even though this too was late in the program. The CAM and CR did not progress this far.
The CAM, with its related CR, and LSG hardware effort was a significant technological challenge, and difficult from an acoustic design standpoint because of what the hardware had to do, its design complexity and configuration, and tough established acoustic limits for this hardware. Significant design efforts were expended by the Japanese on the CAM, CR, and LSG hardware, and all of this hardware was very promising and at an advanced stage. It was unfortunate that these efforts were curtailed.
9. EUROPEAN MODULES
ESA had considerable experience with acoustics and noise control with their involvement in Spacelab activities. Chapter II on Noise Control used a significant number of examples of noise control measures developed for Spacelab and European provided ISS modules.

NASA/SP-2015-624 – ACOUSTICS AND NOISE CONTROL IN SPACE CREW COMPARTMENTS – Goodman & Grosveld
Chapter V - 154
An acoustic TIM was held in January 1997 with the Italian Alenia Aerospazio to discuss Multipurpose Logistics Module (MPLM) status, NASA’s acoustics and noise control lessons learned with the Space Shuttle and Airlock depressurization pump, and NASA’s positions on acoustic limits, and high-frequency and ultrasonic noise [148]. A subsequent acoustic TIM was held with ESA/European Space Research and Technology Centre (ESTEC), Daimler Chrysler Aerospace Aktiengesellschaft (DASA), and Alenia representing the Italian Space Agency, in 1998 [149]. A number of acoustic items were discussed on MPLM and Node 2, and the U.S. provided information on acoustic materials, including multi-layer layups, applicable test data, and material samples. Follow-up TIMs on acoustics were held with Alenia (later named Alcatel Alenia Space, now Thales Alenia Space), who took the lead in acoustics, noise control design and development, and testing/verification on the MPLM, Node 2 and Node 3, Cupola, Columbus Module, and ATV.
Figure 171 shows MPLM being deployed on-orbit, and Figure 172 shows Node 2 before flight. Deployment of Node 3/Cupola is shown in Figure 173. The Columbus Module in a cutaway illustrative view is provided in Figure 174, and the flight Columbus Module on-orbit being installed in Figure 175. Figure 176 shows an ATV vehicle on-orbit.
Figure 171. MPLM being deployed.
Figure 172. Node 2 before flight.
Figure 173. Figure 121, Node 3/Cupola during deployment.
Figure 174. Figure 122 Cut-away sketch of Columbus module.

INTERNATIONAL SPACE STATION - Goodman & Grosveld
Chapter V - 155
Figure 175. Columbus module.
Figure 176. ATV vehicle on-orbit.
MSFC worked acoustics with the Italians and ESA through most of the Columbus module development and flights, coordinating with the NAL/Acoustics Office on status and concerns. NASA JSC assumed the lead in working with ESA more directly on the ATV.
The Italians provided excellent noise control plans, reports, and testing/verification documentation and results. They implemented the use of sound power allocations for these modules—which NASA felt was a superior approach to using sound pressure level limits—managed effective noise control plans, and applied efficient testing and other efforts to achieve acoustic compliance on their modules. They also made significant progress in testing a wide range of beneficial acoustic materials applications for module applications, a number of which are highlighted in Chapter II, Noise Control.
The ESA modules were, in general, very quiet, although addition of some ISS-related system additions have raised levels on some of their modules; i.e., Node 3 was originally below NC-50 until the ISS Program added a U.S.-provided regenerative ECLSS system. One significant issue was that Node 2 and Node 3 THC backpressure plates needed to be changed out, similarly to what was done for Node 1. The Node 2 change-out had to be done on-orbit. However the Node 3 change-outs were performed on the ground prior to launch (see Reference [4] for further discussion on this issue). Another significant issue that came up early in interfaces with Alenia were high-contingency acoustic limits. This book’s dedication takes special notice of Pietro Marruchi’s efforts to noise control on the ISS, some of which are presented in Chapter VI, ISS Noise Control – A European Perspective.
10. PAYLOADS
A large number of payloads were tested in JSC’s acoustic testing facilities. In addition, a number of payloads were supported in design efforts to varying degrees. Several payload conferences were held with payloads developers and integrators participating, with the Acoustics Office representatives and consultants offering advice and consultation. A description is presented of significant support efforts on the following two payloads: the Minus Eighty-degree Laboratory Freezer for ISS (MELFI); and the EXpedite the PRocessing of Experiments to Space Station (EXPRESS) Rack facility. Although not covered in this Chapter, quieting efforts on

NASA/SP-2015-624 – ACOUSTICS AND NOISE CONTROL IN SPACE CREW COMPARTMENTS – Goodman & Grosveld
Chapter V - 156
the Microgravity Science Glovebox (MSG) was an important effort where NASA support was requested by ESA, and accomplished by NASA. These efforts are described in Reference [6] (see Figure 177 for the MSG payload on ISS Expedition XII). The Human Research Facility (HRF) is another payload the Acoustics Office supported. This effort is described in a 2003 technical paper [7]. Figure 178 shows the HRF in Destiny, USL.
Figure 177. MSG payload.
Figure 178. HRF payload.
10.1 Minus Eighty-Degree Laboratory Freezer for International Space Station
The MELFI payload rack is a multi-purpose cooling/low temperature storage for specimens, samples, and suppliers on the ISS. Various ESA sources designed and provided components of the MELFI, and Astrium Space Company in Toulouse France assembled and tested the MELFI as an ESA/NASA-bartered payload. The rack had to meet the NC-40 limit at 2 ft from its surfaces. This effort was described in Reference [8].
The MELFI consists of four subsystems: (1) rack subsystem, which provides accommodation for other subsystems and stowage compartment; (2) the Brayton engine subsystem, which produces cooling. Cold power production relies on closed-loop gas cycle, which is turbo-compressed, cooled, and then turbo-expanded to reach the needed cold temperature. The Brayton engine speed range varies from about 65,000 to 87,000 rpm. The Brayton machine is contained within a metallic Cold Box, with heat exchangers and nitrogen inlet and outlet; (3) after nitrogen is cooled by the Brayton machine it is distributed to four thermally isolated insulated volumes, termed Dewar subsystems, which dictate cooling and provide cold volume stowage; and (4) an electrical subsystem, which provides power and command/control [150][151]. The original front inboard layout of the rack is shown in Figure 179.

INTERNATIONAL SPACE STATION - Goodman & Grosveld
Chapter V - 157
Figure 179. MELFI rack, frontal layout.
NASA reviewed a MELFI report on testing performed in September 2001 by Onera Aerospace Laboratories in France, and was very concerned that the levels documented were significantly higher than the NC-40 limit [152]. As a result, the NAL contacted NASA and MELFI project engineers with the Astrium Space Company in Toulouse France, and proposed that NASA would perform acoustic testing on MELFI in France on the first production unit, to see how close it was to compliance. If the unit met the limit, NASA would provide the testing data and depart. NASA also proposed that if testing verified that the rack was significantly over the NC-40 specification limit, NASA personnel would stay to help quiet the rack. NASA and Astrium MELFI project engineers agreed with the NAL proposal. NASA performed testing on the MELFI rack in November 2001—testing confirmed unacceptably high levels. NASA had brought acoustic measurement equipment for testing of the MELFI, and more than one large suitcase of flight-qualified acoustic materials for use in the quieting efforts, should they be necessary to use. The exterior Cold Box was found to be bare in its attached location, as shown in Figure 180. Figure 181 shows the closeout cover on the outside of rack, over the Cold Box area. The Cold Box/Brayton machine is a high-speed turbo pump with variable maximum rotational speeds as

NASA/SP-2015-624 – ACOUSTICS AND NOISE CONTROL IN SPACE CREW COMPARTMENTS – Goodman & Grosveld
Chapter V - 158
high as 92,000 up to 96,000 rpm and resulting rotational dynamics. It was rigidly hard-mounted to the rack with eight “L” brackets, and mounted without any vibration isolation. It produced high-frequency noise levels above 1000 Hz with harmonics, and narrowband noise. Structure-borne noise was transmitted to the machine mounting structure and throughout via metal tubing connecting the Cold Box and the Dewars, as shown in Figure 179. Excessive noise radiated throughout the rack interior and outwards from the rack. The loudest location was in top front of the rack, in front of the Cold Box location, as shown in Figure 179 and Figure 181.
Figure 180. Outer metal Cold Box rack cover removed showing Brayton machine.
Figure 181. Top portion of MELFI rack.
A number of noise control approaches were tried to quiet the MELFI during the initial visit
to France, and testing continued with a follow-up visit at the end of February through the beginning of March 2002, and with tests at KSC after delivery. Due to the lack of a test facility quiet enough to perform verification testing at KSC, the Acoustics Office and NASA KSC contractor personnel designed and built a special test enclosure for MELFI testing using on-site materials assets. Early MELFI testing dates, hardware configuration, and objective are summarized in Reference [8].
The remedial action approach was as follows: Multi-layer barrier wraps were implemented around the exterior wall of the Cold Box, encasing this prime noise source as much as possible, as shown in the upper left-hand view of Figure 182. The front of the Cold Box with its connecting lines, shown in Figure 180, had to be accessible. Acoustic foam was added to cover this frontal area, and it was subsequently covered with a multi-layer barrier, as shown in the lower left-hand view of Figure 182. A barrier was added to the back of the metal cover over the front of the Cold Box area as shown in the lower right view of Figure 182.
Dewar (typ.)

INTERNATIONAL SPACE STATION - Goodman & Grosveld
Chapter V - 159
Figure 182. Multi-layer cover of the Cold Box (top left), acoustic foam added (top right), and then a multi-layer cover (bottom left). A Bisco® barrier was added to the back of the closeout panel (bottom right).
Multi-layer wrap was added to the metal ducting that distributes cooling from the Brayton Subsystem to the Dewar Subsystem, which provides the cold volume storage (Figure 183). The tubing also dispersed noise from the Brayton Subsystem throughout its routing and the wrap was applied to minimize the radiated noise from the tubing.
Area of tubing covered in right view
Figure 183. Coolant tube routing, tubing and foam added to the MELFI rack (center), and a section of tubing wrap.
Area of tubing covered in right view

NASA/SP-2015-624 – ACOUSTICS AND NOISE CONTROL IN SPACE CREW COMPARTMENTS – Goodman & Grosveld
Chapter V - 160
Acoustic foam was added as much as possible to gaps and cavities in the rack interior, especially in the back areas of the rack where there was volume available (see some of the white acoustic foam added during testing in the center photograph of Figure 183). This acoustic foam helped diminish reverberations and absorb acoustic emissions from hardware within the rack. NASA used white melamine foam (shown in Figure 183) when it first visited Astrium Space Company in France. After that, an equivalent grey-colored melamine available in Europe was used, shown in the top right view of Figure 182.
External to the MELFI rack, a white Nomex® acoustic cover with Bisco® barrier and acoustic foam was added to the top front of the rack, as shown in use during an ISS flight (Figure 184). This cover further diminished emissions from the top of the MELFI and Cold Box area.
Figure 184. MELFI during the ISS Expedition 13 flight.
The microphone locations used during testing are shown in Figure 185. Figure 186 shows narrowband elements that were observed during testing, including frequency spikes at 1 kHz and its harmonics up to 8 kHz. Table 1 shows testing performed on MELFI, dates, locations, and configurations. Recommended remedial design changes were developed and were evaluated at Astrium, France, in March 2002. Flight hardware implementation and verification was performed at KSC, Florida, starting in April 2002.

INTERNATIONAL SPACE STATION - Goodman & Grosveld
Chapter V - 161
Figure 185. Acoustic test microphone (Mic.) locations for MELFI. Each measurement was taken 2 ft from the MELFI rack surface, and there were no top or bottom surface locations.
Figure 186. Narrowband elements found during MELFI testing.

NASA/SP-2015-624 – ACOUSTICS AND NOISE CONTROL IN SPACE CREW COMPARTMENTS – Goodman & Grosveld
Chapter V - 162
Table 18. Summary of MELFI tests, dates, locations, and configurations.
Test Date and Location Hardware
Combination Acoustical Design Development and Remarks
Date Location MELFI Rack FM1
09/03/2001 ONERA, France CB1&BM1 Original rack without acoustical redesign. It was used as MELFI’s original noise radiation baseline.
11/19-20/2001 ASTRIUM,
Toulouse, France CB1&BM1
Tests were conducted by NASA JSC on MELFI rack with original ASTRIUM acoustical designs.
02/31-3/01/2002 ASTRIUM,
Toulouse, France CB1&BM1
NASA JSC acoustic design recommendations and design concept evaluation.
04/26-28/2002 KSC, Florida, USA CB1&BM1 Acoustic flight verification tests. Additional design concepts and evaluation such as rack front external panel effects.
06/16-18/2002 KSC, Florida, USA CB1&BM2 The same as above, except using an appropriate acoustic test environment, and also more tests on external acoustic panel effects.
09/26-27/2002 KSC, Florida, USA CB2&BM1
Final Flight rack acoustic verification tests with the same acoustical designs, but without two-triangle acoustical foam block underneath Cold Box corners. Other approaches were tested such as dual external acoustic panels on the front of the MELFI.
A summary of the resultant benefits of the acoustic measures/controls at 85,000 rpm is shown in Figure 187.
Figure 187. Summary of the benefits of acoustic measures/controls to MELFI at 85,000 rpm.

INTERNATIONAL SPACE STATION - Goodman & Grosveld
Chapter V - 163
Data from testing at Microphone 1 at 85,000 rpm, Microphone 2 at 87,000 rpm, and Microphone 4 at 87,000 rpm are shown in Figure 188, Figure 189, and Figure 190, respectively, for a number of the tests, including the original data from Onera Laboratory testing in France.
Figure 188. Summary of MELFI testing results at Microphone 1, performed in 2002 at 85,000 rpm.
Figure 189. Summary of MELFI testing results at Microphone 2, performed in 2002 at 87,000 rpm.

NASA/SP-2015-624 – ACOUSTICS AND NOISE CONTROL IN SPACE CREW COMPARTMENTS – Goodman & Grosveld
Chapter V - 164
Figure 190. Summary of MELFI testing results at Microphone 4, performed in 2002 at 87,000 rpm.
Although some variations in acoustic levels existed, all testing performed in April, June, and September 2002 at KSC verified the promising results of the new designs [8]. However, it is suspected that the main reason for different levels measured in these tests was that the flight hardware components were different for each test; i.e., different part number Brayton machines or Cold Boxes. The tests in September 2002 were the final measurements on flight hardware rack FM1; its non-compliance was shown to occur only at 85,000 and 87,000 rpm. The maximum exceedance, compared with NC-40, was 4 dB in the 2 kHz octave band. Compared with the original MELFI noise levels per ONERA tests [152], the maximum improvement was as much as 14 dB in the 8 kHz band, at 85,000 rpm.
NASA/Astrium testing proved that noise control measures could substantially reduce MELFI acoustic emissions to reach acceptable levels. NASA loaned Astrium acoustic materials for flight implementation of remedial measures, since flight-certified materials were not readily available to them (Bisco® barrier and Nomex® fabric).
It needs to be emphasized that the entire effort was only possible with NASA, Astrium, and MELFI project cooperation and actions that were expedited to support the remedial efforts on the MELFI payload and their flight implementation. It was very fortunate that permission was given to develop remedial measures on the qualification test model, and demonstrate that substantial noise reductions could still be achieved without significant impacts to the flight hardware. Efforts were expedited by using available NASA testing equipment and acoustic materials, Astrium and KSC facilities, and by using available and tried noise control approaches. This effort was successful to a large extent because it was focused on quickly resolving a significant non-compliance, and because, in this case, the design was adaptable to the changes made.

INTERNATIONAL SPACE STATION - Goodman & Grosveld
Chapter V - 165
10.2 EXpedite the PRocessing of Experiments for Space Station Racks
The EXPRESS Rack system was developed by NASA MSFC and built by the Boeing Company in Huntsville, Alabama. EXPRESS Racks provide simple, standard interfaces to accommodate up to 10 small payloads, resulting in a total capability to operate as many as 80 experiments [153]. NASA planned for eight EXPRESS racks with various payloads. The requirement for EXPRESS Racks, including integrated sub-rack payloads was NC-40 measured 2 ft from the loudest point.
Four payloads to be integrated into the first EXPRESS rack had high acoustic levels and were in need of help with lowering their levels: Commercial Generic Bio-processing Apparatus (CGBA), an experiment used for studying long-duration space flight effects on the fermentation process; the Commercial Refrigerator Incubator Module (CRIM), an incubator used for other experiments; the Plant Generic Bio-processing Apparatus (PGBA), an experiment used for growing Loblolly pine tree seedlings; and the Protein Crystal Growth-Single Locker Thermal Enclosure System (PCG-STES), an experiment used for growing large protein crystals [154].
The Acoustics Office assessed what could be done to help these payloads reduce their high acoustic levels. Considering the fact that the payloads were designed with air inlets and outlets on the front surface of the payload rack, it was proposed that mufflers be added to the front of these payloads, attached via use of “Hook 'n Loop” fasteners. Waivers had to be processed to do this because these mufflers would take up reserved volume in the front of the rack surface (protrusion limits of 3.5 to 6 inches from the front face of the payload). Prototype mufflers were developed using NASA funding to prove out the muffler design approaches. Once these approaches were tested and proved beneficial, it was agreed that these mufflers should be provided for flight. NASA’s support contractor at the time, Johnson Engineering, received separate funding to provide flight units. A description of some of these mufflers and their benefits follows. Figure 191 shows the EXPRESS Rack Number 1, with four sets of add-on mufflers marked in red.
The mufflers were tailored to suit the needs of each individual payload. The following description comes, for the most part, from a 2003 draft paper with some additions and changes [154]: The exterior shells of all mufflers were constructed out of 6061-T6 Aluminum. “Hook ‘n Loop” fasteners were used to attach the mufflers on-orbit to the face of the payload, sealing the inlets or outlets with CHORlastic® foam for a tight gasket interface.
The CGBA payload front face without the new mufflers in place is shown in Figure 192, with the air cooling inlet screen covering the center opening of the payload front face, and the exhaust screen shown on the left side. Figure 193 shows the prototype CGBA mufflers fitted on the test hardware. Figure 194 shows a sketch of the mufflers installed on the payload. The CGBA muffler used a polymer called Delrin® (similar to Teflon®) for spacers and to isolate vibration and thermal conductance between the inlet and outlet side mufflers, which was also a requirement for that particular design. The side of the CGBA mufflers facing the payloads is shown in Figure 195.
The interior of the mufflers had two basic designs. The first design, for the CRIM, another EXPRESS payload, and the STES, had the fan air flowing into the muffler and being directed

NASA/SP-2015-624 – ACOUSTICS AND NOISE CONTROL IN SPACE CREW COMPARTMENTS – Goodman & Grosveld
Chapter V - 166
toward the right side. The entire cavity was lined with melamine foam. Melamine is a flexible, open-cell foam, possessing a combination of low mass, good sound absorption properties and flammability characteristics, and acceptable off-gassing characteristics for that application at the time. There was a melamine lined baffle in the middle, and the exits were staggered. This forced the sound to impinge on the foam for acoustic absorption. The other two payloads, the CGBA and the PGBA (another EXPRESS payload), used a lamination of melamine foam and a thin, perforated aluminum plate to impede both the high- and low-frequency noise. Reduction in narrowband noise transmission loss was provided by adding the aluminum plate, which, in this case, combined with the broadband noise transmission loss normally produced by a layer of foam material. For the PGBA, a block of foam roughly 14.5 by 3.5 by 2 inches was placed directly in front of the flow. An angled hole pattern was cut to force the airflow through the foam and out the exits, so there was no direct line-of-sight through the muffler holes (this type of design was a spin-off of a Hamilton Standard AAA fan muffler design shown in Figure 112). Figure 196 shows part of the drawing of the hole pattern for the foam in the PGBA exhaust muffler. The CGBA had a similarly designed chevron muffler hole pattern. Figure 195 shows the holes in both CBGA mufflers. Figure 197 shows the PGBA inlet and exhaust mufflers.
Figure 191. EXPRESS Rack Number I, with four add-on muffler designs (shown in red aside of them) developed by the ISS acoustics team.
ADVASC MAMS SAMS-II
CGBA PCG-STES CPCG
PCG-STES SAMS-II

INTERNATIONAL SPACE STATION - Goodman & Grosveld
Chapter V - 167
Figure 192. CGBA payload front face, without mufflers.
Figure 193. CBGA prototype mufflers.
Figure 194. CBGA payload with Delrin® mufflers.
Figure 195. Mufflers, view of the side facing the
CBGA payload.
Figure 196. PGBA muffler hole pattern.
Figure 197. PGBA Inlet muffler (left view), and exhaust muffler side.
A
A SECTION A-A

NASA/SP-2015-624 – ACOUSTICS AND NOISE CONTROL IN SPACE CREW COMPARTMENTS – Goodman & Grosveld
Chapter V - 168
Table 19 shows insertion loss measured with five EXPRESS mufflers that were developed. Figure 198 shows the signature of the each EXPRESS payload with these mufflers installed. There were a number of EXPRESS payloads, and other mufflers were developed when they were needed.
Table 19. EXPRESS muffler insertion loss data.
Muffler Insertion loss, dB
Octave Band Frequency [Hz]
63 125 250 500 1000 2000 4000 8000
CGBA 11 10 4 11 18 14 21 25
CRIM 8 6 1 4 6 10 14 18
PGBA (Inlet) 13 9 4 6 12 17 21 28
PGBA (Outlet) 11 7 1 3 7 18 20 26
STES 7 7 2 4 7 12 18 24
Figure 198. EXPRESS payloads with mufflers plotted against NC-40 curve limit.
11. GOVERNMENT FURNISHED EQUIPMENT
Acoustic requirements for GFE were generated as noted previously [27]. Numerous GFE hardware were supported by the NASA Acoustics Office, including the following: U.S. treadmill flown in the SM; other exercise equipment such as the Advanced Resistance Exercise Device (ARED) and Cycle Ergometer with Vibration Isolation system; Oxygen Recharge Compressor

INTERNATIONAL SPACE STATION - Goodman & Grosveld
Chapter V - 169
Assembly (ORCA); vacuum cleaner; airlock circulation fan; impact driver; Portable Breathing Apparatus (PBA); laptops; color printer; and battery charger. A good deal of technical design and testing support was expended on the treadmill, GFE depressurization pump quieting kit, and TeSS. Other lower-level testing and remedial design efforts were expended for items such as the Portable Electric Equipment Kit (PEEK), and testing only was performed on some items that met their acoustic limits. The treadmill support was very involved and stretched out over a long time with the Acoustics Office providing an acoustics consultant, acoustic testing and test data, and support of other acoustic consultants/contractors assigned to the treadmill project. The GFE depressurization pump quieting kit support effort was covered in the U.S. Airlock Section 7.2 because it was an integral part of the Airlock design and depressurization operations. The TeSS and PEEK efforts are described in the text that follows.
11.1 Temporary Early Sleep Station
As discussed in Section 6.2 on the Service Module, there was a need for a quiet sleep station on the ISS because only two sleeping quarters (Kayutas) were included in the original ISS, starting with Increment 1, and acoustic levels in the SM were very high. Acoustic levels were also higher than the limits in the Kayutas since they were configured without doors and because of design problems discussed previously. As noted before, this author worked on an early sleeping quarters approach for use on the ISS [65]. The multi-layer acoustics blanket developed during this effort was used on the TeSS. This layup will be described below. A special project team at NASA JSC was later set up to develop the TeSS for flight. The TeSS was designed to be foldable for launch, deployable, and installed in a rack bay in the U.S. Laboratory. The TeSS provided a crewmember with a private and personal space to accommodate sleeping, donning and doffing of clothing, personal communication, and performance of recreational activities. There was a need for adequate ventilation and audible caution and warning notification inside the TeSS. As a kit, the TeSS was flown up to the ISS on ISS Mission 7A.1 in June 2001, and was installed by the crew in the U.S. Laboratory during Increment II.
NASA Acoustics played an important role in the TeSS design configuration by developing acoustics designs and enhancing materials layups to keep the TeSS quiet inside, protected from the U.S. Laboratory environment (noise external to it), and protected from generating excessive interior noise from fans and TeSS-related hardware emissions. The TeSS structure and envelope was formed using Fibrelam® honeycomb-type panel modeled with an aramid core (orthogonal solid) and a woven carbon skin (isotropic solid). Fabric hinges, made from Nomex® cloth, provided for articulation and connection between panels, to allow the entire structure to be collapsible for transportation to the ISS in the Space Shuttle, and for deployment on-orbit in the U.S. Laboratory. Figure 199 shows the Fibrelam® structure and hinges used in a TeSS fabrication.
Sleep Stations are normally required to meet NC-40 internally, per Section 3.2. Although the TeSS did not have NC-40 as a hard requirement to meet because it was an expedited effort, it was agreed upon that the design team would do its best to meet that limit.

NASA/SP-2015-624 – ACOUSTICS AND NOISE CONTROL IN SPACE CREW COMPARTMENTS – Goodman & Grosveld
Chapter V - 170
Figure 199. TeSS Fibrelam® structure with integral hinges (white colored) are shown in left view, and a typical hinge is shown in the right view.
The acoustic materials layup used is as follows [155] (reference Chapter VII on Acoustic Spaceflight Materials):
Interior liner, from honeycomb-type structure to interior
- White Nomex®, HT90-40 - Durette® felt, F-400-11, two layers. Two layers were used to ensure there was no
noise from crew or hardware contact with the hard inside TeSS surface (this was a Space Shuttle sleep station problem)
- Mix of white or blue Nomex® (HT-90-40 or 60650 ROY royal blue Nomex®)
Exterior liner, from honeycomb-type wall to exterior
- White Nomex®, HT90-40 - BISCO® barrier, HT-200 (0.25 PSF) - Durette® felt, F-400-11 - BISCO® barrier, HT-200 (0.25 PSF) - White Nomex® (HT-90-40).
The NASA Acoustics Office provided acoustic materials for both the prototype TeSS and the flight TeSS.
AutoSEA II, a Statistical Energy Analysis (SEA) software package by VibroAcoustics Sciences, Inc. [155] was used for the acoustical modeling. The software program allowed for constructing models of real structures and prediction of responses to simulated vibration and acoustic environments. After the Fibrelam® structure was created, the model was used to simulate how the blankets would interact with the structure to reduce the noise inside the sleep station. The actual material acoustic characteristics were plugged into the software providing the flexibility to add layers of material to optimize sound treatment.

INTERNATIONAL SPACE STATION - Goodman & Grosveld
Chapter V - 171
Verification testing of a prototype assembled TeSS was performed in in the NASA JSC Vibration and Acoustic Test Facility (VATF), which later became the Acoustics Office responsibility. The TeSS was setup in a small reverberant room, which also contained microphones and loudspeakers, as shown in Figure 200 and Figure 201. A narrowband spectrum control system was used with four of the microphones in an active control loop to shape the acoustic field in front of the TeSS to simulate the one expected for the U.S. Laboratory (NC-55). Testing determined that the effects of a U.S. Laboratory noise level on the inside of the TeSS with the doors closed would be acceptable, close to or lower than NC-40. The four microphones were used to set the noise outside of TeSS (Figure 201). Four microphones were set inside: near the lower vents, near the upper vent, in the middle, and at the subject’s ear. Other loud speakers were used to project C&W signals from the general location of the Audio Terminal Unit (ATU) and to simulate CCAA fan noise at the outlet duct diffuser location in the TeSS. An activated personal computer and a portable utility light were included on the inside during testing. The big black speaker was used to simulate caution and warning tones. The small top vent speaker was used to simulate cabin air noise from the USL ventilation system, which was used instead of a dedicated fan. A plywood enclosure to surround the TeSS was constructed for five sides to simulate how the TeSS was installed in a module in a USL rack (Figure 149 and Figure 150).
Figure 200. Microphone setup and test configuration for TeSS.
Figure 201. Microphone setup
exterior to TeSS.
Figure 202 shows levels obtained inside the TeSS, without the effects of the PEEK. The resultant levels inside of the TeSS with USL were close to NC-40, especially at medium and lower positions of the crew inside the TeSS. Levels were significantly lower than the Kayuta levels in the SM. Figure 203 shows the resultant noise reduction for the crew positions within the TeSS, based upon test results.
Caution & warning speaker
Ventilation simulation speaker
Plywood box
Plywood box

NASA/SP-2015-624 – ACOUSTICS AND NOISE CONTROL IN SPACE CREW COMPARTMENTS – Goodman & Grosveld
Chapter V - 172
The development and manifesting of the TeSS was a very successful effort in support of early ISS crews and set a good example and precedent for what sleep stations can do for crew relaxation, privacy, and noise control.
Figure 202. Test results, sound pressure levels measured inside TeSS.
Figure 203. Noise reduction measured in TeSS test.
Octave Band Center Frequency, Hz
So
un
d P
ress
ure
Le
ve
l, d
B
20
25
30
35
40
45
50
55
60
65
63 125 250 500 1000 2000 4000 8000 OASPL dBA
NC-40
49.0
49.9
46.7
48.248.8
NC
EarTopMiddleBottomNC-40
Octave Band Center Frequency, Hz
No
ise
Re
du
cti
on
, d
B
0
5
10
15
20
25
30
63 125 250 500 1000 2000 4000 8000 OASPL dBA
18.3
14.5
EarTopMiddleBottom
TeSS meets NC-46 (without PEEK)

INTERNATIONAL SPACE STATION - Goodman & Grosveld
Chapter V - 173
Figure 204 shows photographs of the flight TeSS in the USL during Expedition 3. Figure 205 shows acoustic levels taken on-board inside the flight TeSS during Expedition 3 [110]. It is suspected that these levels are high because the TeSS doors were not fully closed.
Figure 204. TeSS with doors open and crew working on laptop (left), and with closed doors (right).
Figure 205. Expedition 3 TeSS SLM measurements.
Octave Band Center Frequency, Hz
So
un
d P
res
su
re L
ev
el,
dB
30
35
40
45
50
55
60
65
70
75
63 125 250 500 1000 2000 4000 8000 OASPL dBA
NC-40
NC-50
NC-52 48.8
57.9
59.8
54.355.7
56.0
NC
TeSS lowTeSS midTeSS highNC-52NC-50NC-40

NASA/SP-2015-624 – ACOUSTICS AND NOISE CONTROL IN SPACE CREW COMPARTMENTS – Goodman & Grosveld
Chapter V - 174
Levels in the lower, middle, and high crew positions were close to NC-50 except at 500 Hz. Levels in TeSS can vary depending upon: the ventilation outlet setting; what the crew inside is wearing or has stowed inside the TeSS; the size of the crewmember; the SLM position when taking measurements; what hardware inside the TeSS is activated; and how well the entry doors are shut and sealed. Figure 206 shows levels measured in the TeSS during Expedition 8, on 11 December 2003, which had levels less than NC-40 at all three crew positions [79]. Table 20 shows measurements taken in the TeSS on this date. When taking the highest acoustic levels measured in the TeSS compared with the lower of the two SM Kayutas on the same date, the TeSS was 16.1 dBA quieter. Expedition 9 TeSS levels were similar to those shown for Expedition 8.
Figure 206. Expedition 8 TeSS measurements.
Table 20. Expedition 8 TeSS measurements – 11 December 2003.
One-third Octave Band Center Frequency
[Hz]
TeSS low
TeSS mid
TeSS high
NC-40
63 52.8 52.7 54.2 64
125 50.8 44.4 49.7 56
250 47.0 44.3 41.6 50
500 38.6 40.1 33.2 45
1000 33.8 38.2 27.6 41
2000 31.4 32.1 23.2 39
4000 29.0 29.0 20.5 38
8000 27.0 29.0 29.0 37
OA 55.7 54.1 55.8
dBA 42.9 43.0 38.8
Octave Band Center Frequency, Hz
So
un
d P
res
su
re L
ev
el, d
B
20
25
30
35
40
45
50
55
60
65
70
63 125 250 500 1000 2000 4000 8000 OASPL dBA
55.8
42.9
TeSS lowTeSS midTeSS highNC-40

INTERNATIONAL SPACE STATION - Goodman & Grosveld
Chapter V - 175
11.2 Portable Electrical Equipment Kit
The primary hardware items in the Portable Electrical Equipment Kit (PEEK) receiving support were 28 VDC Power Extension Cables with lengths of 10 and 20 ft (3 and 6 m), and 120 VDC Power Extension Cable with lengths of 10, 20, and 40 ft (3, 6, and 12 m). Hardware had to comply with the NC-40 limit measured at 0.6 m from the noisiest point on the hardware in accordance with GFE requirements [27]. Testing of training units showed one 120 VDC Intravehicular (IVA) Portable Power Strip (IPPS) unit meeting the NC-40 limit and another one exceeding the limit. This hardware came assembled in a container with a fan inside to cool the unit. A sketch of the unit is shown in Figure 207 [156]. In addition to having to meet the NC-40 limit, another concern was the large number of units planned to be manufactured and the resultant number of units that could be used at one time within any module. Also an issue was whether acoustic acceptance could be with one particular unit, or all units, since there was a possible variability in acoustic signatures because of the fan unit used in the installation.
Figure 207. 120 VDC portable power strip.
Prototype 120 VDC IPPS was tested and found to exceed the acoustic specification. The Acoustics Office provided several possible solutions, including replacing the fans, building an acoustic plenum, and isolating fans from the mounting structure [156]. An acoustic plenum was not designed into the hardware due to volume constraints. One of the recommended fans from the Acoustics Office’s fan database was chosen based on vendor data for acoustics output. As recommended by the Acoustics Office, the design was changed to try and dampen vibration by using damping materials to isolate the mounting hardware from the box. The changes improved the resultant acoustic levels; however, even with these changes in implementation the hardware still could not meet the NC-40 requirements [157]. After incorporating the changes noted, the 120 VDC IPPS exceeded the NC-40 curve for continuous noise at 500 Hz and 1 kHz. At 500 Hz the exceedance was approximately 2 dB, and at 1 kHz the exceedance was close to 3 dB. An assessment of the impacts of using the two IPPS units on the USL showed a minimal impact (0.4 dB). It was agreed that all future units were to meet the NC-40 limit. A NCR was approved to address the efforts pursued to meet the limits, levels achieved, and acceptability of the resultant levels. Limits on the number of items used at any one time were also imposed [157].
120 VDC
120 VDC

NASA/SP-2015-624 – ACOUSTICS AND NOISE CONTROL IN SPACE CREW COMPARTMENTS – Goodman & Grosveld
Chapter V - 176
12. DISCUSSION OF THE NOISE CONTROL EFFORTS
ISS crews reported that acoustics was one of the most significant habitability issues on the ISS and, in general, that noise needs to be reduced, where possible. This was due primarily to the high levels in the SM. The addition of numerous other quiet modules to the ISS and the remedial actions in the SM and FGB helped lower the resultant crew noise exposure levels and made the ISS more habitable over time. The FGB was quieted relatively quickly, but the SM stayed loud for a number of years. As noted previously, the initial crew of six became three until it dropped to two, then increased to six again in October 2009. In addition to having high levels in the SM, crews had to implement remedial measures during the missions when crew size was limited. Modules with an increased number of payloads or other changes tended to increase their acoustic levels and challenge the NC-52 limit of the module, plus payloads. Many ISS modules implemented successful noise control features, and achieved levels at or below the NC-50 module limit.
Establishment of the NAL, Acoustics Office (including support contractors and consultants to support this office throughout the period discussed), and the AWG was instrumental in providing early and continuing oversight of the ISS modules, payloads, and GFE hardware. It was important to resolve acoustic limits and their sub-allocation for this hardware early in the ISS Program, based upon prior experiences with Apollo and the Space Shuttle. This was accomplished in the ISS. It was also important that the Acoustics Office and AWG set the tone that hardware was expected to meet limits, to show by example where remedial actions were taking place on problem hardware, and to do so with oversight. The NAL was assigned to be a single point of contact for ISS acoustics and was given the responsibility for oversight of in-flight acoustics. A dedicated acoustics office was set up to support the NAL’s role, and was sanctioned by the ISS program. The approach used for ISS acoustics was to have a small team of dedicated acoustics representatives responsible for providing oversight and support to hardware suppliers to help ensure successful compliance and assist them more actively, when required. The team had training and experience in acoustics, had access to very experienced acoustic consultants, and had the following resources: use of acoustics measurement instrumentation and NASA or contractor acoustic test facilities; a supply of flight-certified acoustic materials developed by the team; access to design support, and soft goods and mechanical fabrication facilities; and the capability to provide or more actively support testing and remedial actions to resolve acoustic issues. Based upon Space Shuttle involvement, payload suppliers had limited experience and capability to “design-in acoustics,” and had minimal acoustics test hardware, access to acoustic testing facilities, and knowledge of flight-certified acoustic materials or applications. A number of modules, and many payloads and GFE suppliers, took advantage of these NASA-provided capabilities, thereby saving significant time and financial resources. The AWG ensured NASA JSC review, oversight, and overall NASA organizational support.
Only in the case of the SM and to a limited extent with CAM hardware did acoustic requirements become an issue for reasons discussed in Sections 6.2 and 8.3. GFE was part of the original ISS requirements, which were later split into separate payloads and GFE requirements. The ISS Program Payloads Office helped enhance these requirements and put them into formal documentation for payloads.

INTERNATIONAL SPACE STATION - Goodman & Grosveld
Chapter V - 177
Noise control at the source was recommended in Chapter II, and was discussed in the Apollo and Shuttle Chapters. The FGB had large ventilation fans and dust collectors fans as principal noise sources that required corrective action. The FGB remedial measures (louvers, standoffs, mufflers, and duct wraps) were effective and relatively easy pathway changes or additions that did not involve complex and costly changes to contracted hardware. These measures were quickly improved over several flights.
As noted in Section 6.2, SM noise levels were excessive in large part because of the Mir Base Block design precedent and the resultant congregation of a large quantity of fans in the module and pumps, and their noise levels. The need to quiet these fans was acknowledged and development of them funded in remedial action efforts. It was very difficult to implement corrective pathway measures associated with these fans because of their large number, different designs in those fan locations, difficult access to the hardware, and impacts to change designs. Vibration isolators, fan wraps, and local absorbent pads were used to minimize noise emission until the fans were redesigned to be quiet. SM design complexity did not lend itself to good acoustic analyses. A replica of the SM was required to work out the necessary remedial designs, determine benefits and priorities of changes, and then produce flight items. Remedial measures then had to be flown up to the ISS, and be installed by the crew when time was available. This approach was costly and time consuming, with a lot of inertia. Pathway measures were implemented over a long period of time for fans and the two other principal individual noise sources in the SM—the CKB and CO2 removal system (Vozdukh). SM noise control relied, for a long period of time, on the use of hearing protection during normal operations. As noted previously, hearing protection should be used only for short-term operations. In effect, use of hearing protection shifted the burden of maintaining an acceptable acoustic environment from the module supplier to the crew, resulting in crewmembers wearing hearing protection and enduring long-term use of them. Furthermore, acoustic fixes on-orbit had to be implemented by the crew. After a good deal of effort and time, successful quiet fan technology was developed, and these new fans were manufactured. The recent population of these quiet fans in the SM and new Russian modules have helped modules lower their acoustic levels much more quickly.
In noise control of the USL, Boeing implemented good overall noise abatement measures (fans with built-in noise control features of vibration isolators, flow straighteners, mufflers, barriers, and added effective pathway mufflers such as the ones for the IMV mufflers, splitters, acoustic foam, and other noise control provisions in ducting and racks). The one place vibration isolators were not implemented was with the PPAs, which caused use of a lot of absorbent foam and other treatments in its rack in an attempt to lower levels. The PPA ended being the most significant noise source in the U.S. Laboratory, even with the subsequent operational change to use one PPA rather than two. Other modules using PPAs adopted vibration isolators to quiet these pumps.
Node 1 implemented good pathway noise control features and ended up being one of the quieter modules.
The Airlock was quiet during routine operations, and remedial actions on the RDP helped keep the Airlock at acceptable levels during EVA preparations.

NASA/SP-2015-624 – ACOUSTICS AND NOISE CONTROL IN SPACE CREW COMPARTMENTS – Goodman & Grosveld
Chapter V - 178
In the Japanese Segment, the Japanese PM and ELM-PS, noise control features were very well done and modules came out at or below NC-50. Considerable effort was expended on acoustics and noise control in the CAM and CR because of acoustic design complexity and challenges with the large rotating CR because of its size, emissions, and location in the CAM. The LSG installation added to the challenge of controlling CAM limits. The LSG had significant problems with its fans that were discovered late in WV development—another example where effort on quieting the noise source (fans) was not addressed early, when it is best and recommended. JAXA and IHI worked diligently on the LSG to implement effective pathway noise control features to remedy problems found earlier, and test them in a production LSG unit. Overall, the CAM, CR, and LSG encountered difficult problems in noise control─ these problems were being addressed and progress was being made on them—when this hardware was cancelled.
European modules with Alenia taking the lead in noise control did an excellent job in their technical approach in controlling and managing acoustic levels, and in their expertise and implementation of proficient isolators, mufflers, acoustic wraps, and material applications. Chapter VI is included in this book to cover the European approach to noise control, which was very effective. There were dedicated noise control design and testing efforts to meet acoustic limits in these European modules, which generally ended up below the NC-50 level. These modules were among the quietest in the ISS.
Payloads had their share of problems with loud fans or other noise sources (LSG, CR, HRF, MSG, EXPRESS Racks, and other payloads). In recognition of the problems that existed with loud fans, the Acoustics Office initiated and developed a Quiet Fan database and selection tool primarily to help payloads with selecting quiet noise sources. Later, funding was obtained to update and improve the database with NASA ARC performing tests on fans and providing fan performance-related data. In the PEEK example previously discussed in Section 11.2, the database was used to select a quieter fan for the GFE hardware [157]. There was wide use of acoustic foam within USOS payloads to absorb acoustic emissions generated and to reduce reverberation within their interiors. Barriers and multi-layer barrier layups were used to block acoustic emissions from fan casings and ducting. Mufflers were used on fan inlets and outlets; in the case of the EXPRESS Rack, external mufflers were added to the front faces of payloads because volume was not available within the payloads for mufflers. Gaps and some cracks were sealed. The MELFI pathway remedial measures (wrapping the principal noise source with an effective multi-layer layup, adding acoustic foam inside the rack, wrapping distribution ducting, and adding a partial front cover blanket) were feasible to make because of timely proactive efforts, and because these changes were possible to make without significant impacts.
Pathway measures were discussed in Chapter II on Noise Control, and in the Apollo and Space Shuttle Chapters (Chapters III and IV). A variety of pathway measures were implemented in the ISS (as shown in previous examples) in modules, payloads, and GFE. Sharing of examples of such measures and flight materials/materials applications occurred with hardware developers and, in some cases such as the SM, FGB, MELFI, MSG, HRF, and other hardware, flight materials were provided to support remedial efforts. GFE pathway changes to the airlock depressurization pump were effective and made relatively easy.

INTERNATIONAL SPACE STATION - Goodman & Grosveld
Chapter V - 179
Treatment at the receiving location in the crew compartment was discussed in Chapter II on Noise Control. One approach used in the Space Shuttle was to isolate the crew for sleep by use of the three-tier-plus-one or four-tier sleep station bunks. In the ISS, the SM provided the crew two Kayutas, which were louder than the Russian limits because of the design and also because the doors on them were not installed for some time. Remedial actions included redesigning the Kayutas and areas to improve them acoustically, and making changes to support putting the doors back on. The TeSS was added to the U.S. Laboratory early in the ISS missions to provide a third sleeping quarters for the crew. The TeSS provided a significant improvement in ISS sleep station acoustic levels, being generally lower than NC-40, and was considered the quietest place in the ISS. The SM workplace, as a receiving location, had problems due to co-location of exercise equipment in the prime work space and a toilet close to the sleeping quarters, causing sleep problems for crews in Kayutas.
Noise control at the receiving location by interior surface treatment was also discussed in Chapter II on Noise Control a way of lowering acoustic levels. Using absorptive materials to lower module levels is a promising approach. Previously, such efforts were addressed in the Spacelab project, and proposed by the NAL for use in the USL. As noted in this Chapter, JAXA implemented some beneficial absorbent materials applications in the JEM-PM, especially on the front face of the SAIBO payload rack. The Acoustics Office at JSC is currently considering the use of more absorbent materials in ISS modules.
Another way to control noise at the receiving location is to consider the position of the hardware within a module or crew compartment, and to partition it off, or isolate it. Sleeping quarters should be well separated or isolated from working areas. Placement of the toilet in the SM adjacent to one Kayuta and near the other created sleep interruption problems. The SM toilet could be quieted by improved design or better compartmentalizing, or by relocating it in another module away from the sleeping quarters. The ISS has now added a toilet to Node 3. Installation and use of the treadmill and bicycle ergometer in the major work space in the SM resulted in added noise exposure to all crewmembers in the module. Exercise provisions should also be quieted, isolated, or located away from areas that can affect other crewmembers. The ISS recently decommissioned the SM treadmill and placed a new treadmill in Node 3. Four new sleeping quarters were also added in Node 2.
Although most of the hardware items worked on and described in this chapter have dealt with continuous noise, the Airlock depressurization pump, the GFE ORCA, the VES and CDRA in the USL, the WMS in the ISS, the treadmill and other exercise devices, relief valves, and the LSG payload were intermittent noise sources. The Vozdukh system in the SM emitted both continuous and intermittent noise. Both types of noise need to be addressed and controlled.
13. CONCLUSIONS
From this author’s experience, ISS was the first program where acoustics in crewed spacecraft received appropriate early and continued attention, and noise control was more fully appreciated and applied. Overall, the ISS successfully implemented noise control to comply with established limits, with exceptions discussed in previous sections. The NC-52 and NC-50

NASA/SP-2015-624 – ACOUSTICS AND NOISE CONTROL IN SPACE CREW COMPARTMENTS – Goodman & Grosveld
Chapter V - 180
limits were met in a number of modules, and payloads and GFE complied with their limits, with some exceptions. The ISS has shown that NC-50 or lower levels can be achieved for modules, which is a significant accomplishment, given past history. NC-50 is certainly a rational standard for modules. This author believes NC-50 is a meaningful and practical limit for full-up systems─the total of all sources in module or spacecraft. Limits should apply to all work stations in habitable volumes.
As noted before, acoustics was a significant habitability issue on the ISS. High noise levels were considered unpleasant and too high for general comfort, and such levels had negative effects on communications. The effect of noise varies with each crewmember and with the type of noise, its levels, and duration of exposure. As indicated in Chapter I, Acoustics and Chapter IV, Acoustics and Noise Control in the Space Shuttle Orbiter, there are considerable differences between crew sensitivity to noise, where some crewmembers are affected by noise and others are not.
The ISS Program has benefited significantly from having a dedicated acoustic team supporting it, and performing the efforts described in this Chapter.
For future long-duration missions that take humans on planetary missions, such as those to the moon or Mars, we need to implement the NC-50 acoustic limits and design equipment—especially fans, pumps, and compressors—to support compliance with limits, and to minimize the pathway impacts that have to be dealt with when sources are too loud. It is important that these noise sources be further developed so that they are available. The quieted Russian SM fans are a good example of improved, state-of-the-art spacecraft fans.
Quiet noise sources that were recommended in Chapter II, Noise Control. Chapters on Apollo, the Space Shuttle Orbiter, along with this Chapter on ISS, provide numerous examples of methods of dealing with high-level noise sources. It is important that noise sources undergo a selection process that includes the importance of acoustics, and that every attempt is made to ensure compatibility of the sources with acoustic limits. Efforts should be made to select quiet sources, or modify them to become quieter, preferably by the source manufacturer. Isolation and containment of noise producers is recommended as close as possible to the noise source. Reserving volume for mufflers, acoustic wraps, or other measures should be provided, in case they need to be added later. Attention should be given to ensuring that spares have acoustic limits and are controlled as well so that, when used, they do not create higher acoustic levels than items they replace. Intermittent noise sources in or near sleeping quarters need to be firmly controlled to preclude sleep/rest interference. Noise control technology, including acoustic materials and materials applications used and developed for the ISS, have been a positive step in controlling noise levels. This author recommends that the benefits of the various noise control applications, including noise reduction features of acoustic materials, mufflers, isolators, multi-layer case radiated fan wraps, and of various other effective measures, be compiled and better documented so that future users have ready access to them for noise control.

INTERNATIONAL SPACE STATION - Goodman & Grosveld
Chapter V - 181
14. REFERENCES
1. Goodman, Jerry R., International Space Station Acoustics. Proceedings of NOISE-CON 2003. Washington, DC: US Institute of Noise Control Engineering, 2003.
2. Allen, C.S. and Goodman, J.R., Preparing for Flight - The Process of Assessing the ISS Acoustic Environment. Proceedings of NOISE-CON 2003. Washington, DC: US Institute of Noise Control Engineering, 2003.
3. Pilkinton, Gregory D., ISS Acoustics Mission Support. Proceedings of NOISE-CON 2003. Washington, DC: US Institute of Noise Control Engineering, 2003.
4. Allen, Christopher and Denham, Samuel, International Space Station Acoustics - A Status Report. Proceedings of the American Institute of Aeronautics International Conference on Environmental Systems (ICES), Portland, Oregon, 2011.
5. Limardo, Jose and Allen, Christopher, Analysis of Noise Exposure Measurements Acquired On-board the International Space Station. Proceedings of the American Institute of Aeronautics International Conference on Environmental Systems (ICES), 2011.
6. Grosveld, F.W., Goodman, J.R. and Pilkinton, G.D., International Space Station acoustic noise control - Case studies. Proceedings of NOISE-CON 2003. Washington, DC: US Institute of Noise Control Engineering, 2003.
7. Phillips, E.N. and Tang, P., ISS Human Research Facility (HRF) acoustics. Proceedings of NOISE-CON 2003. Washington, DC: US Institute of Noise Control Engineering, 2003.
8. Tang, P., Goodman, J.R. and Allen, C.S., Testing, evaluation, and design support of the Minus Eighty Degree Laboratory Freezer (MELFI) payload rack. Proceedings of NOISE-CON 2003. Washington, DC: US Institute of Noise Control Engineering, 2003.
9. Grosveld, F.W. and Goodman, J.R., Design of an acoustic muffler prototype for an air filtration system inlet on International Space Station. Proceedings of NOISE-CON 2003. Washington, DC: US Institute of Noise Control Engineering, 2003.
10. Goodman, Jerry R., Acoustics in habitable space vehicles and enclosures. Proceedings of the Third International Association for the Advancement of Space Safety (IAASS) Conference, Rome, Italy, 21-23 October 2008.
11. Goodman, J.R. and Grosveld, F.W., Part I - Space Environment (Natural and Induced) – Acoustics, Safety Design for Space Systems, Ed. Gary Musgrave, Axel Larsen and Tommaso Sgobba, Elsevier Publishing Company, 2008. Fifth volume of the Space Biology and Medicine series – U.S.-Russian Cooperation in Space Biology and Medicine.
12. Smith, Suzanne D., Goodman, Jerry R. and Grosveld, Ferdinand W., Vibration and Acoustics. Fundamentals of Aerospace Medicine. 4th edition. Jennifer A. Fogarty, Jan Stepanek, Robert Johnson, Jeffrey R. Davis, eds., Lippincott Williams and Wilkins, USA, 2008.

NASA/SP-2015-624 – ACOUSTICS AND NOISE CONTROL IN SPACE CREW COMPARTMENTS – Goodman & Grosveld
Chapter V - 182
13. Goodman, J.R., Acoustics inside the Space Shuttle Orbiter and the International Space Station. Proceedings of the Society of Automotive Engineers (SAE) 2009 Noise and Vibration Conference and Exhibition, St. Charles, Illinois, 2009.
14. MSC Design and Procedural Standard, Design Standard 145, Acoustical Noise Criteria, NASA Manned Spacecraft (MSC), 16 October 1972.
15. Goodman, J.R., ISSA Acoustical Noise. 2 November 1995.
16. System Specification for the International Space Station. Space Station Program Document SSP 41000R, March 2000.
17. NASA/RSA Joint Specification. Standards Document for the Russian Segment SSP-50094, Revision A, Technical Interchange Meeting (TIM) 20 July 1997.
18. GOST R 50804-95. Cosmonaut habitation environment in a manned spacecraft. General medical and technical requirements, 1995.
19. Segment Specification for the United States On-orbit Segment, Draft 30 September 2002.
20. NASA International Space Station Flight Crew Integration Standard. NASA–STD–3000/T, International Space Station, Revision D, 30 August 2004.
21. Acoustic Summit, meeting between NASA-JSC and Boeing, Huntsville Alabama, 11 April 1996.
22. Error Bars on the U.S. Laboratory Acoustic Estimate. Coordination Sheet number CS-IPT32-SAD/96-015, 1996 from M/S JR-33, 1 August 1996.
23. Baumer, Greg, International Space Station Acoustic Noise Issue. 25 August 1997.
24. Pilkinton, G.D. and Denham, S.A., Accuracy of the International Space Station Acoustical Modeling. Proceedings of NOISE-CON 2003, Washington, DC: US Institute of Noise Control Engineering, 2005.
25. Payload Verification Program. International Space Station Program Document SSP 57011-B, NASA Johnson Space Center, 2003.
26. Pressurized Payload Interface Control Document. International Space Station Program Document SSP 57000, Rev E. NASA Johnson Space Center, 2000.
27. ISS Acoustic requirements and testing document for non-integrated equipment. JSC 28322, March 1999.
28. Beierle, Jason, Mir acoustic environment. Society of Automotive Engineers (SAE) Technical Paper Series 961609, 26th International Conference on Environmental Systems, Monterey California, 8-11 July 1996.
29. Flight Crew Systems and Integration (FCS&I) Technical Interchange Meeting (TIM) Protocol, NASA-JSC, Houston, Texas, U.S., 3-7 June 1996.
30. Flight Crew Systems and Integration (FCS&I) Technical Interchange Meeting (TIM) Protocol, Moscow, Russia, 12-21 August 1996.

INTERNATIONAL SPACE STATION - Goodman & Grosveld
Chapter V - 183
31. Temporary results of the examination of the audition of Cosmonauts during a long-term flight in the Space Station “Mir” with the audiometer “ELBE 2” (Experiment “AUDIO 2”), IAF/IAA-90-519, 41st Congress of the International Astronautical Federation, Dresden, GDR, 8-12 October 1993.
32. Williams, David B., Acoustic Issues for SVC Module/Treadmill. 5 February 1999.
33. Acoustics Mini Technical Interchange Meeting (TIM) with Khrunichev, Moscow, 11-12 August, 1997.
34. Acoustics Mini- Technical Interchange Meeting (TIM) Protocol. Moscow, 12-16 January 1998.
35. Protocol of Russian and American Specialists meeting to discuss measurements results of noise levels and efficiency of FGB noise suppressing devices. Baikonur, Kazakhstan, 21-23 October 1998.
36. Request for waiver: FGB acoustics requirements. International Space Station Program Change Directive SSCN: 001787 R1, 7 November 2001.
37. Olsen, Randy, Service Module Quiet Fan Installation and Sound Level Meter Result Histories as of August 2014. 12 August 2014.
38. Acoustics Mini Technical Interchange Meeting (TIM) Protocol, Moscow, Russia, 28 July through 8 August 1997.
39. Technical Interchange Meeting (TIM) 21 Protocol, Acoustics Team 7B, Moscow, Russia, 20-29 October, 1997.
40. Pre-brief NASA/RSA Joint Program Review, Houston Texas, U.S., 9 January 1998.
41. Assessment of Acoustic environment comments from Phase 1 NASA-Mir U.S. crewmembers debriefs. NASA Johnson Space Center, Flight Crew Support Division, Operational Habitability Project, July 1998.
42. Goodman, Jerry, Service Module Acoustics. August 1998.
43. Acoustics Technical Interchange Meeting (TIM) Protocol, Moscow Russia, 21 October - 12 November 1998.
44. Acoustics Technical Interchange Meeting (TIM) Protocol, Moscow Russia, 11-29 January 1999.
45. Hill, Robert, ISS Service Module Noise Specification Compliance status. 8 February 1999.
46. Tang, Punan, Christian, Tatiana and Hill, Robert, Service Module Acoustic Test Report. No. SM-02-22-99, 22 February 1999.
47. Results of measurements of noise from the operation of ISS SM flight article on-board systems during tests on 18-20 January 1999. Technical report П 34343 – 016. March 1999.
48. Acoustics Technical Interchange Meeting (TIM) Protocol for loan of acoustic instrumentation equipment. Moscow, Russia, 29 January 1999.

NASA/SP-2015-624 – ACOUSTICS AND NOISE CONTROL IN SPACE CREW COMPARTMENTS – Goodman & Grosveld
Chapter V - 184
49. Protocol Service Module Implementation Plan. Houston, Texas, and Moscow, Russia, 26 March 1999.
50. Acoustics Technical Interchange Meeting (TIM) Protocol, Houston Texas, 12-23 April 1999.
51. Acoustics Technical Interchange Meeting (TIM) Protocol, Moscow, Russia, 21 June through 2 July 1999.
52. Goodman, Jerry, R. ISS Acoustics and Plan of Action, 9 September 2000.
53. Fischer, Craig, NASA ISS Acoustics Plan, partial slide summary sent to J. Goodman, 25 August 2000.
54. ISS Flight Rule B13-152, Noise Level constraints. Part A.1, NSTS-12820, Volume B: ISS Generic Operational Flight Rules, 8 November 2001.
55. Joint Program Review (JPR). NASA/Russian Aviation and Space Agency, Moscow, Russia, 30 September through 1 October 1999.
56. Acoustics Mini Technical Interchange Meeting (TIM) Protocol, Moscow, Russia, 27 September through 6 October 1999.
57. Trans-Tech International, Russian Language and Logistics Contract translation number SS10437, 25 October 1999.
58. Acoustics Technical Interchange Meeting (TIM) Protocol, Moscow, Russia, 13-28 April 2000.
59. Protocol on the meetings of Stafford Task Force-Utkin Advisory Expert Council (TF-AEC) Joint Commission, 24-28 April 2000, held at NASA KSC and JSC.
60. Goodman, Jerry, Flight 1R CoFR-Acoustics. Requirements, activities, open issues/risks, and plans, 31 May 2000.
61. Russian Service Module acoustics waiver. Draft International Space Station Change Request SSCN 3678, Russian Service Module acoustics waiver, 30 June 2000.
62. Russian Service Module acoustics waiver. International Space Station Change Directive SSCN 3678R1, 31 January 2002.
63. Goodman, Jerry, 2R Stage Operations Readiness Review (SORR)-Acoustics. 3 October 2000.
64. Pilkinton, Gregory, PICB slides, e-mail to Jerry Goodman, 14 August 2001.
65. Goodman, Jerry, ISS Acoustics, Presentation to Development Control Board, 26 February 1998.
66. Goodman, Jerry, E-mail entitled “1st increment acoustics in Service Module” to Terry Taddeo/SD, and others, 17 November 2000.
67. Pilkinton, Gregory, Mission Update. 7 June 2000.
68. On Results of acoustic measurements. Russian report no. 2/2, 25 May 2001 and 26 June 2001 taken by the ISS-2 crew. Translation number SS17168/TTI/KS, 12 July 2001.
69. Russian Report П36503-511. 23 July 2001.

INTERNATIONAL SPACE STATION - Goodman & Grosveld
Chapter V - 185
70. Goodman, Jerry, On-board Acoustics quieting kit. 3 September 2001.
71. Acoustics Technical Interchange Meeting (TIM) Number 27 Protocol, Moscow, Russia, 3 through 7 June 2002.
72. Goodman, Jerry, Summary of 11A SORR acoustics and service Module status. 3 October 2002.
73. International Space Station Acoustic Environment Mission Report for Increment V, Final Report, August 2003.
74. Acoustics Office, ISS Acoustic Environment and Monitoring Expedition 6, Post-increment Review (PIR), 24 June 2003.
75. Dementjey, Vladimir, E-mail to Tatiana Christian and Jerry Goodman, no title, 11 April 2003.
76. Pilkinton, Gregory, Updated slides. E-mail to Allen, Christopher, and Goodman, Jerry, 5 March 2003.
77. Protocol of the NASA Advisory Council Task Force (TF)-Rosaviakosmos Advisory Expert Council (AEC) (Stafford-Anfimov) Joint Committee, 26 March - 11 April 2003. (25-28 March 2003 in Houston, Texas, and 7-11 April 2003 in Moscow, Russia).
78. Letter to Mr. Sean O’Keefe, NASA Administrator and Mr. Yuri Koptev, General Director, Russian Aviation and Space Agency, on NASA Advisory Council Task Force (TF)-Rosaviakosmos Advisory Expert Council (AEC) (Stafford-Anfimov) Joint Committee review of safety and operational readiness of the ISS Expedition 7 crew, and flight control team preparedness to perform the Expedition 7 Mission. 16 April 2003.
79. International Space Station Acoustic Environment Measurement Report for Increment VIII. Released June 2004.
80. Pilkinton, Gregory, unknown reference, 2004.
81. Protocol between Rosaviakosmo, RSC-Energia, and NASA. Moscow, 10 March 2004.
82. Acoustics Technical Interchange Meeting (TIM), Moscow, Russia, 28 June through 2 July 2004.
83. Pilkinton, Gregory, Informal notes. Acoustic Technical Interchange Meeting (TIM), Moscow, Russia, 28 June through 2 July 2004.
84. Allen, Christopher, SM Noise reduction Technical Interchange Meeting (TIM) summary. 14 July 2004.
85. Bogatova, R.I., Allen, C.S., Kutina I.V. and Goodman, J.R., Fifth volume of the Space Biology and Medicine series – U.S.-Russian Cooperation in Space Biology and Medicine. Chapter 5, The Habitable Environment of the ISS, Section 1, Microclimate, Acoustic Environment, and Lighting Conditions, 2008
86. Allen, Christopher, Goodman, Jerry, Denham, Sam and Chu, Reynold, Acoustic Measurement plan for Increment 14. Presentation to IMT, 24 March 2005.

NASA/SP-2015-624 – ACOUSTICS AND NOISE CONTROL IN SPACE CREW COMPARTMENTS – Goodman & Grosveld
Chapter V - 186
87. Acoustics Technical Interchange Meeting (TIM) Protocol, Houston, Texas, 18 through 22 April 2005.
88. Pilkinton, Greg, Informal notes. Acoustics Technical Interchange Meeting (TIM) Protocol Notes, Houston, Texas, 18 through 22 April 2005.
89. Allen, Christopher, Modules Acoustic Status. Briefing to JSC AWG, 10 May 2007.
90. Allen, Christopher, Engle, Michael and Denham, Sam, Update to NCR-RS-017. Presentation to SSPCB, 22 May 2007.
91. Allen, Christopher, Acoustic Noise in the Service Module. Service Module Noncompliance Report, Number NCR-RS-017, 14 October 2008.
92. Allen, Christopher, Engle, Michael, Pilkinton, Greg and Goodman, Jerry, Update to NCR-RS-017. Acoustic Noise in the Service Module, presentation to SSPCB, 20 September 2005.
93. Denham, Sam, Allen, Christopher and Chu, Reynold, ISS Sound Level Survey Report. 3 February 2008.
94. Allen, Christopher and Denham, Sam, Service Module Acoustics Contract Closeout-Quiet Fan and Final Acceptance. Presentation to the SSPCB, 22 June 2010.
95. Limardo-Rodriguez, Jose, Quiet Fans. E-mail to Goodman, Jerry, 17 September 2014; updated by Allen, Christopher, 6 March 2015.
96. Olsen, R., Allen, C., Limardo-Rodriguez, J., Welsh, D. and Smith, H., Final Survey Report, ISS Sound Level Meter Survey, Increment 34, 30 January 2013. ISS-SLM-12-06, February 2013.
97. Denham, S., Olsen, R., Allen, C., Welsh, D. and Smith, H., Preliminary Data from the ISS Sound Level Meter Survey. Increment 32, ISS-SLM-12-04 Preliminary Survey Report, 15 August 2012.
98. Limardo-Rodriguez, Jose, Quiet Fans, E-mail to Jerry Goodman, 17 September 2014.
99. NASA/Boeing meeting on Acoustics, NASA-MSFC, Huntsville, Alabama, 11-12 April 1996.
100. Goodman, Jerry, JSC Acoustical Noise Assessment. NASA Johnson Space Center, Houston, Texas, 11-12 April 1996.
101. Prime Item Development Specification for the United States Laboratory International Space Station. Specification Number S683-29523D, Cage Identification No. 3A 768, 28 March 1995.
102. Hamilton Standard Division of United Aircraft Corporation information obtained by NASA from Boeing, no date available.
103. Goodman, Jerry and Lambert, James, USL PPA Hush Kit. CR 4071, 27 June 2011.
104. Tichenor, D.R., Lab Acoustics Summary, Vacuum Exhaust System (VES) only. DCB presentation, 29 June 1998.
105. Tichenor, D.R., Lab Acoustics Action Items AI 1142. 9 September 1998.

INTERNATIONAL SPACE STATION - Goodman & Grosveld
Chapter V - 187
106. Goodman, Jerry, JEM Payload Vacuum Venting. E-mail, 9 August 2002.
107. Lambert, James, Airlock Acoustic Requirements Exception. CR 3338, 2 November 2000.
108. System Specification for the International Space Station. Space Station Program Document SSP 41000 CC, 21 March 2014.
109. Stage 7A Integrated Acoustic Noncompliance, Tracking Number NCR-ISS-7A-021, August 2000.
110. International Space Station Acoustic Environment Measurement Report for Increment III, released 18 September 2002.
111. Goodman, J, Node 1 Acoustic testing for sound power & proposed Action on Node 1. E-mail to distribution, December 4, 1997
112. Wisoff, Jeff, Node 1 and 2 Microsoft PowerPoint presentation, e-mail to distribution, 12 July 12 1998.
113. Pest, Alex and Wang, Mark, Audio Acoustic Test Results. 23 August 1998.
114. International Space Station Acoustic Environment Measurement Report for Increment III, 18 September 2002.
115. http://iss.jaxa.jp/en/kibo/about/kibo/jpm [cited 14 June 2014].
116. http://iss.jaxa.jp/en/htv/mission/htv-1/ [cited 14 June 2014].
117. Matsuda, Status of HTV Acoustics. 11 June 2004.
118. Denham, S., Allen, C. and Welsh, David, ISS Sound Level Meter Survey report, Increment 20, December 2009.
119. Centrifuge Project Status. CR Red-Light TIM Number 3, 8-10 May 2001.
120. Goodman, Jerry, CAM/CR/Payload Acoustics. Reference to December 2002 Acoustic TIM with NASDA, 22 July 2003.
121. Life Sciences Glovebox (LSG) Specification, Document Number JCX98006, Draft, 24 April 1998.
122. Goodman, Jerry and Danielson, Richard, International Space Station Acoustics. Briefing to ISS Program Manager, February 2004.
123. CAM Systems CDR Board, Tsukuba, Japan, 17 December 2004.
124. Executive Summary CR Systems CDR, CR15-Y04018, 15 July 2005.
125. Life Sciences Glovebox (LSG) Work Volume Assembly (WVA) Acoustic TIM, JAXA and IHI briefing, 3-6 February 2004.
126. Life Sciences Glovebox (LSG) System CDR Presentation, IHI Aerospace Document 677-Y-16-001, Kawagoe, Japan, 26 July-4 August 2004.
127. Life sciences Glovebox (LSG) Safety Data Package, NASDA, Document JEX-2000005, 25 February 2000.

NASA/SP-2015-624 – ACOUSTICS AND NOISE CONTROL IN SPACE CREW COMPARTMENTS – Goodman & Grosveld
Chapter V - 188
128. Otoshi, Jason, LSG Noise Control Plan. E-mail, 15 July 2002.
129. Goodman, Jerry, LSG Noise Control Plan. E-mail, 16 July 2002.
130. Goodman, Jerry, Acoustic Issues. May 28, 2003.
131. Life Sciences Glovebox (LSG) Specification. Document SSP 50430, 22 June 1999.
132. Suzuki, Keisuke, LSG Acoustic Issues (As a response to action #2-5-3 at CI telecom May 2003) NASDA, forwarded by e-mail to Jerry Goodman, 23 May, 2003.
133. Otoshi, Jason, SSBRP Acoustic TIM, Life Sciences Glovebox, 22-24 July 2003.
134. Goodman, Jerry, LSG Acoustics. 22 July 2003.
135. Goodman, Jerry, LSG WVA Acoustic/Vibration Characterization Measurements at Bradford Engineering, BV. Representing NASA Acoustics Team, 3-7 February 2004.
136. Tang, Punan, Goodman, Jerry and Grosveld, Ferdinand, Vibro-Acoustic Characterization of the Life Sciences Glovebox Work Volume Qualification Module. Test Location: Bradford Engineering, BV, Heerle, Netherlands, tests performed 3-7 February 2004, Report 30 March 2004.
137. Suzuki, Keisuke, LSG WVA Action Status. E-mail to Jerry Goodman, 10 March 2004.
138. Phillips, Eric, Life Sciences Glovebox. Acoustic system integration testing at Tsukuba, Japan during period 12-20 April 2004, Boeing Payload Engineering and Integration Report, 3 May 2003.
139. Rosner, Stefan, Baseline SSP 57900, Life Sciences Glovebox-to-Subrack Payloads and Science Equipment Interface Control Document (ICD). NASA ARC, Space Station change request 008688, 14 May 2004.
140. LSG Acoustic TIM, Tsukuba, Japan, 10-11 June 2004.
141. Otoshi, Jason, NASA ARC, E-mail, LSG Systems RID Closures, 13 August, 2004.
142. Otoshi, Jason, PFM Acoustic test plan. NASA ARC, E-mail 21 April 2005.
143. Suzuki, Keisuke, PFM Acoustic noise test plan. JAXA, E-mail, 22 July, 2005
144. Otoshi, Jason, PFM Acoustic noise test plan. NASA ARC, E-mail 6 June 2005, which enclosed JAXA’s responses, entitled JAXA/IA Response to NASA comments on LSG PFM Acoustic Noise Test Plan.
145. Otoshi, Jason, Updated Schedule for LSG PFM Test. NASA ARC, E-mail 18 August 2005.
146. Life Sciences Glovebox Audible Noise Analysis Report, Document Number, 613-Y-16-048A, 21 November 2005.
147. Otoshi, Jason, LSG Acoustics Discussion with JAXA-IA, E-mail, 4 December 2003.
148. Mini Pressurized Logistics Module Acoustics TIM, Turin, Italy, 23 January 1997.
149. Acoustics Technical Integration Meeting with ESA/ESTEC, DASA, and Alenia Aerospace, held at Alenia Aerospace, Turin, Italy, 21-24 September 1998.

INTERNATIONAL SPACE STATION - Goodman & Grosveld
Chapter V - 189
150. Cartee, Gary, MELFI Overview and backup charts, payload training, not dated
151. MELFI\MELFI-CRYO, Home page. Internal website NASA-JSC, http://ctsd.jsc.nasa.gov/melfi/pages/MELFI~CRYO.htm [cited 14 June 2014].
152. Biron, D. and Pauzin, S., MELFI Rack Acoustical Test report-ONERA Tests. September 2001.
153. (EXPRESS SITE) www.nasa.gov/mission_pages/station/research/experiments/608.html [cited 14 June 2014].
154. Pilkinton, Gregory, Case study: Payload Mufflers. Draft, unpublished paper for NOISE-CON 2003, 5 March 2003.
155. Pilkinton, Gregory and Warnix, James, draft paper for NOISE-CON 2003, The Acoustic Design and Performance of the Temporary Early Sleep Station (TeSS). 18 March 2003.
156. Cudnik, Su, Portable Electrical Equipment Kit (PEEK). 26 May 1999.
157. Non-Compliance Report (NCR) Number PEEK-II-001, 20 August 2001.
15. ACRONYMS
AAA Avionics Air Assembly AEC Advisory Expert Council ANC Active Noise Control ANCP Acoustics Noise Control Plan ARC Ames Research Center ARED Advanced Resistance Exercise Device
ATU Audio Terminal Unit ATV Automated Transfer Vehicle AWG Acoustics Working Group B&K Brüel and Kjær® C&W Caution and Warning
CAM Centrifuge Accommodation Module CCAA Common Cabin Air Assembly CDR Critical Design Review CDRA Carbon Dioxide Removal Assembly CGBA Commercial Generic Bio-processing Apparatus CKB Russian air conditioner
CL Crew Lock CoFR Certification of Flight Readiness
CO2 carbon dioxide
CPXK Progress oxygen supply equipment CR Centrifuge Rotor CRIM Commercial Refrigerator Incubator Module CSA Canadian Space Agency CSMM Complex Service Module Mock-up

NASA/SP-2015-624 – ACOUSTICS AND NOISE CONTROL IN SPACE CREW COMPARTMENTS – Goodman & Grosveld
Chapter V - 190
DASA Daimler Chrysler Aerospace Aktiengesellschaft
DC Docking Compartment DM Docking Module ECLSS Environmental Control and Life Support System EF Exposed Facility EL Equipment Lock ELM-ES Experiment Logistics Module - Exposed Section ELM-PS Experiment Logistics Module - Pressurized Section (JLP) EMU Extravehicular Mobility Unit ESA European Space Agency
ESTEC European Space Research and Technology Centre EVA extravehicular activity
EXPRESS EXpedited the PRocessing of Experiments to Space Station FGB Functional Cargo Block
FRR Flight Readiness Review GBF Gravitational Biology Facility GFE Government Furnished Equipment HHR Habitat Holding Rack HPD Hearing Protection Device HRF Human Research Facility HTV H-II Transfer Vehicle IBMP Institute of Biomedical Problems ICD Interface Control Document ICS Inter-orbit Communication System
IHI Ishikawajima-Harima Heavy Industries (IA) IMV Inter-Module Ventilation IP International Partner IPPS IVA Portable Power Strip IPR Interim Progress Review ISPR International Standard Payload Rack ISS International Space Station IVA Intravehicular JAXA Japan Aerospace Exploration Agency JEM Japanese Experiment Module JEMRMS Japanese Experiment Module Remote Manipulator System
JPR Joint Program Review JSC Johnson Space Center KIS Ku-band Interface System KSC Kennedy Space Center lab laboratory Leq Equivalent A-weighted sound level over a given time interval Leq(24) Equivalent A-weighted sound level over 24 hours Lmax Maximum A-weighted sound level for a given time interval

INTERNATIONAL SPACE STATION - Goodman & Grosveld
Chapter V - 191
LSG Life Sciences Glovebox
MAD Mir Acoustic Dosimeters MANM Mir Audible Noise Measurement MCOR Medium rate Communications Outage Recorder MELFI Minus Eighty-degree Laboratory Freezer for International Space Station MHI Mitsubishi Heavy Industries MPEV Manual Pressure Equalization Valve MPLM Multipurpose Logistics Module MSC Manned Spacecraft MSFC Marshal Space Flight Center MSG Microgravity Science Glovebox NAL NASA Acoustics Lead
NASA National Aeronautics and Space Administration NASDA National Space Development Agency of Japan NC Noise Criterion NCR Non-Compliance Report NSBRI National Space Biomedical Research Institute OASPL Overall Sound Pressure Level ORCA Oxygen Recharge Compressor Assembly PBA Portable Breathing Apparatus PCB Payload Control Board PCG-STES Protein Crystal Growth – Single Locker Thermal Enclosure System PE&I Payload Engineering & Integration PEEK Portable Electric Equipment Kit
PFM Prototype Flight Model PGBA Plant Generic Bio-processing Apparatus PIRN Preliminary Interface Revision Notice PLC Pressurized Logistics Carrier PM Pressurized Module POIC Payload Operations Integration Center PPA Pump Package Assembly PPRV positive pressure equalization valve PRT PIRN Review Team PWL Sound Power Level ПXO transfer compartment
RAP Remedial Action Plans RDP Russian Depressurization Pump RID Review Item Disposition RNCP Russian Noise Control Plan rpm rotations per minute RS Russian Segment RSA Russian Space Agency RSC-E Rocket Space Corporation-Energia

NASA/SP-2015-624 – ACOUSTICS AND NOISE CONTROL IN SPACE CREW COMPARTMENTS – Goodman & Grosveld
Chapter V - 192
RSOS Russian On-orbit Segment
SAA Specimen Air Assembly SE Scientific Equipment SEA Statistical Energy Analysis SLM Sound level meter SLSD Space and Life Sciences Directorate SM Service Module SORR Stage Operations Readiness Review SPL sound pressure level SRP Sub-Rack Payloads STS Space Transportation System TBD to be determined
TeSS Temporary Early Sleep Station TF Task Force THC Temperature and Humidity Control TIM Technical Interchange Meeting TTS Temporary Threshold Shift TVIS Treadmill with Vibration Isolation Stabilization USL U.S. Laboratory USOS U.S. Orbital Segment USS U.S. Segment VATF Vibration and Acoustic Test Facility VDC Volts Direct Current VES Vacuum Exhaust System
WV Work Volume WVA Work Volume Assembly

CHAPTER VI
EUROPEAN NOISE CONTROL IN
INTERNATIONAL SPACE STATION
Pietro C. Marucchi-Chierro
Ferdinand W. Grosveld
CONTENTS
1. INTRODUCTION ........................................................................................................................ 4
2. AUDIBLE NOISE SYSTEM LIMITS ............................................................................................... 4
2.1 Hearing Conservation ...................................................................................................... 5
2.2 Voice Communication and Crew Annoyance .................................................................. 5
3. NOISE MANAGEMENT APPROACH ........................................................................................... 5
4. AUDIBLE NOISE CONTROL ........................................................................................................ 8
4.1 Source Sound Power Allocation Approach ...................................................................... 8
4.2 Sound Power Budgeting ................................................................................................ 12
4.3 Audible Noise Transfer Functions .................................................................................. 13
5. DESIGN GROUND RULES, STANDARDS AND COMPUTATIONAL MODELS.............................. 15
5.1 Design Ground Rules ..................................................................................................... 15
5.1.1 Control at the Source .......................................................................................... 16
5.1.2 Interruption, Damping or Absorption along the Transmission Path .................. 16
5.1.3 Protection at the Receiver Location (not desirable for the crewmembers) ...... 18
5.2 Audible Noise Standards ............................................................................................... 18
5.2.1 Standards Requirements and Definitions ........................................................... 18
5.2.2 Measurement and Test Standards ..................................................................... 18
5.3 Computational Models .................................................................................................. 19
6. DESIGN AND DEVELOPMENT TASKS ....................................................................................... 20
6.1 System Level Audible Noise Control Activities .............................................................. 20
6.1.1 System Architecture Integrity ............................................................................. 20

NASA/SP-2015-624 – ACOUSTICS AND NOISE CONTROL IN SPACE CREW COMPARTMENTS – Goodman & Grosveld
Chapter VI - 2
6.1.2 Audible Noise Requirements at the System Level .............................................. 21
6.1.3 System Design and Development Activities ....................................................... 21
6.1.4 Analysis and Budget Report ................................................................................ 24
6.1.5 Function and Other Government Furnished Equipment/Contractor Furnished Equipment Budget Requirements ...................................................................... 25
6.1.6 External Interface Control .................................................................................. 25
6.1.7 Internal Interface Control ................................................................................... 25
6.2 System Function Level ................................................................................................... 25
6.2.1 Audible Noise Design and Development Activities ............................................ 25
6.2.2 Government Furnished Equipment/Contractor Furnished Equipment Sub-Budget Requirements ......................................................................................... 29
6.3 Government Furnished Equipment/Contractor Furnished Equipment Level ............... 29
6.3.1 Audible Noise Design and Development Activities ............................................ 29
6.3.2 Government Furnished Equipment/Contractor Furnished Equipment Analysis and Budget Report .............................................................................................. 30
7. ASSEMBLY, INTEGRATION AND VERIFICATION ...................................................................... 30
7.1 System Audible Noise Verification ................................................................................ 30
7.2 Function Audible Noise Verification .............................................................................. 30
7.3 Government Furnished Equipment/Contractor Furnished Equipment Audible Noise Tests ............................................................................................................................... 31
8. CRITICAL TECHNOLOGIES ....................................................................................................... 32
9. CONCLUSIONS ........................................................................................................................ 32
10. REFERENCES ........................................................................................................................... 33
11. ACRONYMS ............................................................................................................................. 34
TABLES
Table 1. NC-50 continuous noise requirements. ............................................................................ 5
Table 2. NC-50 minus 3 dB acoustic design goal. ........................................................................... 8
Table 3. Habitable spacecraft total sound power allowance. ...................................................... 10
Table 4. Node 2 sound power budget (instantaneous). ............................................................... 12
Table 5. On-ground and on-orbit verification activities (typical). ................................................ 31
FIGURES
Figure 1. Principal audible noise control approach – design and development cycle. .................. 6

EUROPEAN NOISE CONTROL IN INTERNATIONAL SPACE STATION - Marucchi & Grosveld
Chapter VI - 3
Figure 2. Audible noise management approach – design, specification and verification responsibilities. ................................................................................................................ 7
Figure 3. Habitable spacecraft audible noise requirements, reference design goal sound pressure level spectrum of 55 dBA, corresponding to NC-50 minus 3 dB. ..................... 8
Figure 4. Habitable spacecraft sound power control model. ......................................................... 9
Figure 5. Node 2 total sound power allowance. ........................................................................... 11
Figure 6. Control model for the structure-borne vibration transmission path. ........................... 14
Figure 7. Habitable spacecraft acceleration-to-force transfer function (between any internal habitable spacecraft source-to-receiver location and direction). ................................. 15
Figure 8. Typical corrective actions for source noise control (Courtesy [8]). ............................... 16
Figure 9. Vibration control methods at the source. ..................................................................... 17
Figure 10. Vibration control on the transmission path. ............................................................... 17
Figure 11. ECLS cabin loop sound power control model (typical logic flow) – (CCAA=Common Cabin Air Assembly; WS=Water Separator attached to CCAA; TWV=Three-Way Valve; ASD=Area Smoke Detector; NIA=Nitrogen Interface Assembly. ................................. 26
Figure 12. ECLS IMV supply line sound power control model (typical logic flow) – (IMV=Inter Module Ventilation (air ducts fans). ............................................................................ 26
Figure 13. ECLS IMV return line sound power control model (typical logic flow) – (IMV=Inter Module Ventilation (air ducts fans). ............................................................................ 27
Figure 14. TCS sound power control model (typical logic flow) – (PPA=Pump Package Assembly; SFCA=System Flow Control Assembly; TWMV=Three-Way Mixing Valve; SPCU=Suit Processing Control Unit; H/X=Heat Exchanger). ......................................................... 27
Figure 15. AVS, EPS, video and audio sound power control model (typical logic flow) – (RPCM=Remote Power Control Module; GLA=General Luminaire Assembly (lights); DDCU=Direct-to-Direct Converter Unit; ABC=Audio Bus Coupler; ATU=Audio Terminal Unit; CVIU=Common Video Interface Unit; VSU=Video Switch Unit; MDM=Multiplexer – De-Multiplexer; UOP=Utility Outlet Panel). .............................. 28

NASA/SP-2015-624 – ACOUSTICS AND NOISE CONTROL IN SPACE CREW COMPARTMENTS – Goodman & Grosveld
Chapter VI - 4
CHAPTER VI
EUROPEAN NOISE CONTROL IN
INTERNATIONAL SPACE STATION
Pietro C. Marucchi-Chierro
Ferdinand W. Grosveld
1. INTRODUCTION
The acoustic environment within a habitable pressurized spacecraft has to be kept within acceptable limits to allow the crew to live and work without being disturbed by noise and/or vibration. The noise should be limited to minimize annoyance, to protect the crew from hearing loss, and to allow clear verbal communication between the crew members in the cabin without special technical aids. Background noise should not interfere with the voice communication system of the spacecraft, or with the caution and warning system audible tones.
Thales Alenia Space developed an integrated design, control, and verification methodology to ensure that efficient vibro-acoustic control can be exercised in the design phase to meet the applicable audible noise requirements [1][2][3][4]. The methodology is described in a noise control plan and includes the activities to be implemented for the design and verification of the habitable module along with an allocation of the associated tasks and responsibilities. The noise control plan outlines how the system and the Government Furnished Equipment/Contractor Furnished Equipment (GFE/CFE) requirements are related by way of budget allocations. The methodology has been published in several conference papers and journal articles (i.e., References [1][2][3][4]) and has been concurred to by the European Aeronautic Defence and Space (EADS) Company, the Italian Space Agency (ASI), and the European Space Agency (ESA) [4]. The methodology has been used in the designs of the International Space Station (ISS) Node 2 and 3 modules, the Multi-Purpose Logistics Module (MPLM), Columbus, Cupola, and the Automated Transfer Vehicle (ATV) [4].
2. AUDIBLE NOISE SYSTEM LIMITS
The system-level design requirements on the audible noise limits are presented in References [5] and [6]. These requirements are implemented by the applicable Prime Item Development Specifications (PIDS), which is the specification used by the hardware provider that addresses the specific requirements to be implemented vs. program-imposed

EUROPEAN NOISE CONTROL IN INTERNATIONAL SPACE STATION - Marucchi & Grosveld
Chapter VI - 5
requirements. The audible noise requirements are broken down into hearing conservation, and voice communication and crew annoyance.
2.1 Hearing Conservation
To avoid damage to the crew hearing (hearing conservation), the sound pressure levels at the crewmember’s ears, as generated by all the sources of the habitable spacecraft, its system functions, and the GFE/CFE (excluding payloads, servicing, crew activities, maintenance, reconfiguration, manned core station) during in-orbit crewed periods, shall not exceed the following:
broadband, long-term and short-term continuous audible noise shall not exceed 80 dBA equivalent level over 24 hours, or 100 dBA maximum not exceeding 2 minutes per 24 hours (Note: NASA Flight Rules govern crew exposure levels)
narrowband, long-term audible noise shall not exceed minus 10 dB of the octave band limit level containing the narrowband component
impulse audible noise, which is a change in sound pressure level of 10 dB for less than one second, shall not exceed a peak value of 120 dB
2.2 Voice Communication and Crew Annoyance
To provide an efficient work environment and avoid crew annoyance, the space averaged sound pressure levels at a distance of at least 1 m from any reflecting surface within the crew compartment, emanating from all the sources of the habitable spacecraft, its system functions, and the GFE/CFE (excluding noise from payloads, servicing, crew activities, maintenance, reconfiguration, manned core station), shall be subject to the following requirements:
broadband, long-term and short term continuous audible noise shall not exceed a sound level of 58 dBA, instantaneous, and shall not exceed the Noise Criterion (NC)-50 sound pressure level requirements in each octave band listed in Table 1
narrowband, long-term audible noise shall not exceed minus 10 dB of the octave band limit level containing the narrowband component
infrasonic long-term noise, in the 1.0 to 16 Hz octave bands, shall not exceed the 120 dB overall sound pressure level equivalent over a period of 24 hours
Table 1. NC-50 continuous noise requirements.
Octave Band Center Frequency [Hz] 31.5 63 125 250 500 1000 2000 4000 8000
Sound Pressure Level [dB] 77 71 64 58 54 51 49 48 47
3. NOISE MANAGEMENT APPROACH
A number of steps need to be taken to implement the necessary control measures:

NASA/SP-2015-624 – ACOUSTICS AND NOISE CONTROL IN SPACE CREW COMPARTMENTS – Goodman & Grosveld
Chapter VI - 6
any competing requirements at the system level need to be identified and followed up by an appropriate system definition or a requirements re-definition
all sources of audible noise need to be identified and characterized at all relevant operational settings and loads
the breakdown and the allocation of individual hardware requirements need to be applied to all the essential noise sources
the means for prevention, attenuation, or compensation of the noise needs to be identified, and assessed on its merits and drawbacks
Subsequently, a very strict design, hardware, and software evaluation should be performed with respect to the allocated requirements and with an emphasis on the major noise sources early on in the process.
Early design assurance can be achieved with analytical tools and preliminary tests that properly describe and help evaluate the noise and vibration disturbance factors as well as their transmission paths and effects. The tools consist of computational models based on empirical input data that are suitable for a front-end concept evaluation, and that are also fitting for subsequent evaluation and integration of individual effects. This necessitates an appropriate representation of the individual and integrated design as well as maintaining model consistency. The design and development cycle in Figure 1 should be followed for the audible noise control approach.
Figure 1. Principal audible noise control approach – design and development cycle.
The design and development cycle starts with the definition of the detailed specifications and plans, and later with the definition of the acceptance test procedure (ATP) to ensure that the hardware complies with these specifications. The preliminary design definition serves to perform an initial noise and vibration analysis, which will result in the identification of possible design optimization needs. The analytical assessment by itself is limited and the analysis has to

EUROPEAN NOISE CONTROL IN INTERNATIONAL SPACE STATION - Marucchi & Grosveld
Chapter VI - 7
be supported by tests and measurements as soon as the test hardware is available. The final performance of the units has to be tested to determine the fulfillment of the requirements contained in the applicable specifications, possibly with analytical corrections.
The design and development activities do not rely on the control of the noise and vibration sources only.
The noise and vibration transmission paths and the receiving volumes also have to be analyzed and, if necessary, optimized. The design and development cycle will occur in principle at all project levels; i.e., the system level, the system functions level and the GFE/CFE level.
The relationship between the design specification and the verification responsibilities, if broken down from the system level to the GFE/CFE level, is shown in Figure 2. The flow diagram describes the specifications breakdown to the GFE/CFE level and the reverse basic design verification from the GFE/CFE level up to the system level.
The audible noise control engineering, design, analysis, and manufacturing activities are scheduled in accordance with the master project milestones and bar charts. The applicable noise requirements shall be specified in the configuration item (CI) specifications. The CI is any piece of hardware that is manufactured according to a certain specification. General design and development plans have to refer to the noise control plans. General environmental and test specifications have to implement sections on audible NC and test procedures.
Figure 2. Audible noise management approach – design, specification and verification responsibilities.

NASA/SP-2015-624 – ACOUSTICS AND NOISE CONTROL IN SPACE CREW COMPARTMENTS – Goodman & Grosveld
Chapter VI - 8
4. AUDIBLE NOISE CONTROL
The primary design driver for the overall system noise control is that the functions and the GFE/CFE will not introduce an acoustical environment in excess of the specified sound pressure level of 58 dBA and the NC-50 criterion levels, in addition to other specified noise limits.
4.1 Source Sound Power Allocation Approach
To allow control of the most design-driving noise requirement in the habitable spacecraft, rather than monitoring only, the specified overall A-weighted sound pressure level criterion of 58 dBA was scaled by minus 3 dB as a system design goal, to provide system margin for payload effects and system unknowns. As the 58 dBA represents the NC-50 octave band spectrum criterion, the 55 dBA corresponds to NC-50 minus 3 dB in each octave band. The budget sound pressure levels for the system design goal are shown in Table 2 and depicted in Figure 3.
Table 2. NC-50 minus 3 dB acoustic design goal.
Octave Band Center Frequency [Hz] 31.5 63 125 250 500 1000 2000 4000 8000
Sound Pressure Level [dB] 74 68 61 55 51 48 46 45 44
Figure 3. Habitable spacecraft audible noise requirements, reference design goal sound pressure level spectrum of 55 dBA, corresponding to NC-50 minus 3 dB.
Octave Band Center Frequency, Hz
So
un
d P
res
su
re L
ev
el,
dB
40
45
50
55
60
65
70
75
80
31.5 63 125 250 500 1000 2000 4000 8000
Overall 58 dBAOverall 55 dBA

EUROPEAN NOISE CONTROL IN INTERNATIONAL SPACE STATION - Marucchi & Grosveld
Chapter VI - 9
The sound pressure level at a given point in the cabin space depends on various parameters such as the distance and the transmission path between the noise source and the receiver, the volume of the receiving room, and the sound absorptive properties of the surfaces within the receiving volume. The system sound pressure level requirement cannot be used as a system function or GFE/CFE audible noise requirement, since it defines a sound pressure level that is related to the acoustical properties of the receiving volume, which is not available for verification noise measurements at the lower system function or GFE/CFE level. Instead, budgeted sound power levels are considered sub-requirements. This noise control approach will maintain a sound power balance between all the acoustic power sources after the sound has been transmitted into the module cabin and absorbed by the cabin interior without exceeding the sound pressure level criterion. The sound power is the fixed quantity radiated by the source that can be measured under various conditions. The resulting sound power control model for the habitable space in an example pressurized module is outlined in Figure 4. Cabin sound power budgets are allocated to, among others, the Environmental Control and Life Support (ECLS) System, the Thermal Control System (TCS), the Electric Power System (EPS), and the Audio Video System (AVS).
Figure 4. Habitable spacecraft sound power control model.
Noise in the cabin is produced by various noise sources either by direct radiation or by
transmission via other airborne or structure-borne noise paths. Typical noise transmission paths include the direct noise from the sources and the adjacent modules, radiation from the rack panels and the floor panels, and noise entering the cabin as structure-borne sound. The sound power flow from an individual source to the receiver room is affected by the specific transmissibility functions of surrounding or connecting units. The sound power control flow model in Figure 4 identifies such general transmission functions that have to be supplied to the

NASA/SP-2015-624 – ACOUSTICS AND NOISE CONTROL IN SPACE CREW COMPARTMENTS – Goodman & Grosveld
Chapter VI - 10
designer of the noise sources for the prediction of their cabin-related sound power budgets. Figure 4 illustrates that the apportionment of the overall requirement must be done across all functional subsystems, taking into account factors such as transmission paths, direct radiation, insertion loss, and other factors.
The fundamental relationship used to equate the sound pressure level (SPL), Lp, at a point in space with the sound power level (PWL), Lw, and the room absorptivity is [7]
210log
4p w
Q 4L = L +
d R
where Q is the quality factor or the source directivity, d is the distance from the source to the location of the Lp measurement, and R is the room constant, all in metric system units. The room constant is defined by [7]
1
SR
where is the average absorption coefficient and S is the surface area. The sound pressure level at a point depends on the power radiated by a source, its directivity properties, the distance to the source, and the reverberation characteristics of the room. In a reverberant
sound field, where 2
4
4
Q
R d and R S the sound power level is related to the sound
pressure level by
10log4
w p
SL = L
Sabine’s equation [7] relates to the area S, the volume V and the reverberation time T60
60
log logS 0.161V
10 10 4 4T
The maximum sound power transmitted into the cabin shall be used to control the interior noise level. The cabin room absorptivity 10log( S/4) was derived from Spacelab reverberation time measurements as listed in Table 3. The volume of Spacelab is 38 m3 while the total surface area equals 93.3 m², resulting in the sound power level allowances tabulated in Table 3.
Table 3. Habitable spacecraft total sound power allowance.
Octave Band Center Frequency [Hz]
31.5 63 125 250 500 1K 2K 4K 8K
Reference Lp (Table 2) [dB] 74 68 61 55 51 48 46 45 44
Spacelab reverberation time T60 [s] 1.907 0.427 0.392 0.557 0.545 0.668 0.627 0.566
Average absorptivity Spacelab 10log(
S/4) 0 0 5.5 5.9 4.4 4.5 3.6 3.9 4.3
Average absorptivity Manned Spacecraft
0 0 2.8 3.2 1.7 1.8 0.9 1.2 1.6
Allowable Lw for Spacelab [dB] 74 68 66.5 60.9 55.4 52.5 49.6 48.9 47.6
Allowable Lw for Node 2 [dB] 74 68 63.8 58.2 52.7 49.8 46.9 46.2 45.6

EUROPEAN NOISE CONTROL IN INTERNATIONAL SPACE STATION - Marucchi & Grosveld
Chapter VI - 11
Assuming the same reverberation times and other factors for other habitable spacecraft (modules), the allowable sound power is related to the allowable sound power for Spacelab by the ratio of the surface areas
10log modulew w Spacelab
Spacelab
SL = L
S
For example, ISS Node 2 has a total surface area of S=50 m2. Assuming the same sound power levels and their spatial distribution and other factors are present in Node 2 as in the Spacelab, the allowable sound power level in the module can be obtained by subtracting 2.7 dB from the Spacelab sound power allowances in Table 3. The absorption in the two lowest octave bands, 31.5 Hz and 63 Hz, was assumed to be negligible and the allowable sound power is unaffected. The expected cabin total sound power budget for Node 2 is shown in Figure 5, which is 3 dB less than the NASA NC-50 requirement for Node 2 in each octave band.
Figure 5. Node 2 total sound power allowance.
The above referenced Spacelab information was used initially, until updated data were available from testing of later modules.
A sound power sub-budget apportionment to the various functions with reference to the module cabin shall be made after the total allowable system sound power level and spectrum have been determined.
Octave Band Center Frequency, Hz
So
un
d P
ow
er
Le
ve
l, d
B
45
50
55
60
65
70
75
80
31.5 63 125 250 500 1000 2000 4000 8000
NASA requirement in power level (NC-50)NC-50 - 3 dB power

NASA/SP-2015-624 – ACOUSTICS AND NOISE CONTROL IN SPACE CREW COMPARTMENTS – Goodman & Grosveld
Chapter VI - 12
4.2 Sound Power Budgeting
The total system sound power budget is apportioned at the system level to the various system functions and other GFE/CFE for the individual noise control activities. The system functions power budgets shall be sub-allocated to GFE/CFE levels by the system functions themselves. The reference location for all budgets shall be the habitable volume in the cabin. GFE/CFE power budgets shall consider the acoustical properties of the pathway between the acoustical noise source somewhere in the module and the receiver location in the cabin. The transmission paths are affected, for example, by the attenuation of the internal panels or the rack faces and the vibro-acoustical susceptibility of the mounting structure. Based on study results, manufacturer's data, electrical power consumption, and previous experience in similar systems, a sound power contribution evaluation was made for system functions and other GFE/CFE specifications, taking into account airborne and structure-borne noise. Intermittent noise sources were considered and their equivalent contributions were established.
The habitable spacecraft budget levels are defined at the system level. The system functions and other GFE/CFE sound power budgets in terms of cabin sound power octave band levels can be derived by adjusting the total allowable sound power level in each octave band (Table 3 and Figure 5 for Node 2) such that
10log100
w wbudget allowableL L
The inverse application of the system function and other GFE/CFE requirement budgeting is the superposition of single budget contributions for system verification purposes. Superposition of single budget contributions shall be done by sound power level summation as follows:
{ } /1010log w ibudgetL
w allowablei
L = 10
In the Node 2, for example, 44% of the total habitable spacecraft sound power was allocated to the ECLS as a sound power source, 35% to the TCS, 5% to the EPS, and 8% to the AVS. The system function sound power internal budget allocation is listed in Table 4. A margin of about 8% will result if the design shows that the stick/slip effect due to thermal gradient on structural joints is precluded.
Table 4. Node 2 sound power budget (instantaneous).
Budget percentage of (Lw)allowable
%10log
100
[%] [dB]
ECLS 44 -3.5
TCS 35 -4.5
EPS 5 -13.0
AVS 8 -11.0
STRUCTURE 0 1) 0
MARGIN 8 -11.0
TOTAL 100 Lw
1) if the design precludes stick/slip

EUROPEAN NOISE CONTROL IN INTERNATIONAL SPACE STATION - Marucchi & Grosveld
Chapter VI - 13
4.3 Audible Noise Transfer Functions
Insertion loss and vibro-acoustic transfer functions are needed for the transmission paths between the sound sources and the receiver locations, as indicated by the sound power flow diagram in Figure 4. The transfer functions are applied to the system functions and other GFE/CFE using the specifications, analyses, tests, and budget-level requirements.
The functions are initially derived from a preliminary habitable spacecraft mathematical model. The functions presented here require further updating and verification as more detailed design data and hardware become available in the habitable spacecraft project. The transfer functions for the habitable spacecraft are defined by the system. Any change implication belongs to the system responsibility.
The sound power insertion loss (ILw) functions shall be used to account for the noise reduction effect of partition walls. The sound power insertion loss is defined as the difference in sound power in the receiving room with and without the partition wall installed
w wi wIL L L
where Lwi is the sound power delivered by the source to the cabin without partition walls.
The vibration budget levels are concerned primarily with structure-borne vibrations transmitted from vibration sources and other perturbation functions directly to the crewmembers via vibrating surfaces and contact areas. The control model depicted in Figure 6 is based on input-to-output functions similar to the audible noise control model shown in Figure 4. The vibration levels are generated by several sources at the same time and transmitted to various crew interfaces. Therefore, a multiple input/output approach was selected.
To account for the structure-borne noise, two vibro-acoustic susceptibility functions may serve as a transfer function to correlate mechanical vibration with radiated sound power.
The sound power Wrad to excitation force F relation is expressed by
4
2
rad
2 2
W S 1p
cF F
and the radiated sound power level LW to excitation force transfer function HF is written as
20logF WH L F
The sound power Wrad to source vibration u squared relation is expressed by
4
2
rad
2 2
W S 1p
cu u
and the radiated sound power level LW to acceleration transfer function HA is written as
20logA WH L u
In the majority of the cases, the source is considered to be excited by a force rather than the structure exhibiting acceleration and, hence, the transfer function HF is mostly applicable.

NASA/SP-2015-624 – ACOUSTICS AND NOISE CONTROL IN SPACE CREW COMPARTMENTS – Goodman & Grosveld
Chapter VI - 14
The relation of the acceleration response at the point of excitation p to the exciting force in combination with the GFE/CFE properties and mounting structure properties can be found by the structural point impedance zp, which is expressed as
Pp
P
F =z
u
and
10log | |p pZ z (dB re 1 Ns/mm)
_______________________________________________________
Figure 6. Control model for the structure-borne vibration transmission path.
The acceleration-to-force transfer function is given as a ratio in m/s² per Newton for each one-third octave band, and shall be valid for any source-to-receiver location and direction. It forms a worst-case envelope over any structural transfer function, depending on the local mass concentration at the source or receiver location. The typical envelope for the acceleration-to-force transfer function is depicted in Figure 7. The predicted levels in terms of insertion loss have been decreased by 3 dB and the vibro-acoustic transfer functions have been increased by 3 dB to take into account the model uncertainties.
2
n mF F
2
i jF F iH
1iH
nH
1nH 1na
,2
,( )i n
i na u
F /H a Fa

EUROPEAN NOISE CONTROL IN INTERNATIONAL SPACE STATION - Marucchi & Grosveld
Chapter VI - 15
Figure 7. Habitable spacecraft acceleration-to-force transfer function (between any internal habitable spacecraft source-to-receiver location and direction).
5. DESIGN GROUND RULES, STANDARDS AND COMPUTATIONAL MODELS
5.1 Design Ground Rules
Noise and vibration travel different paths to reach the recipient. Airborne noise travels through the air ducts and other openings that exist in enclosures as well as directly between the source and the receiver ear in the case of exposed GFE/CFE. Noise emitted into GFE/CFE enclosures, such as the avionics and GFE/CFE bays, couples with the enclosure surfaces and radiates into the crew module where the noise again reaches the ear through airborne transmission. Vibration generated by rotating motors, fans, pumps, and transformer oscillations travels through the structural support members and is finally radiated into the crew module as sound from vibrating surfaces. The amount of noise and vibration at the receiver is dependent on the source level and the degree to which the transmission paths reduce the disturbances due to the various attenuation factors encountered along the path. Special care has to be taken for the material selection and the load accommodation during launch.
The control of noise and vibration involves three interdependent elements: 1) at the source, 2) along the transmission path, and 3) at the receiver.
One-third Octave Band Center Frequency, Hz
Ac
ce
lera
tio
n-t
o-F
orc
e T
ran
sfe
r F
un
cti
on
, m
/s2N
So
urc
e o
r R
ec
eiv
ing
Ma
ss
0.1 1 10 100 1000
0.001
0.01
0.1 m Local = 10-100 kg
m Local > 100 kg

NASA/SP-2015-624 – ACOUSTICS AND NOISE CONTROL IN SPACE CREW COMPARTMENTS – Goodman & Grosveld
Chapter VI - 16
5.1.1 Control at the Source
The sources of GFE/CFE/system noise are vibration, impact, friction, and fluid flow turbulence. Typical methods to control noise at the source are listed in Figure 8. Figure 9 provides a list of vibration control methods at the source.
Figure 8. Typical corrective actions for source noise control (Courtesy [8]).
5.1.2 Interruption, Damping or Absorption along the Transmission Path
A source of acoustic noise can radiate sound directly into the air or induce vibrations into a structural path that, in turn, can radiate sound into the air. Airborne noise can be reduced by:
enclosures and barriers between the noise source and the crewmembers at the receiver locations
sound absorption linings sealing of the enclosure and perimeter wall penetrations structurally transmitted vibration and radiated noise can be reduced by:
- vibration isolation of panels and machinery supports - panel damping applications - decoupling pipes from pumps with a section of hose - detuning vibration frequencies by panel stiffening
Details of vibration path control are presented in Figure 10.

EUROPEAN NOISE CONTROL IN INTERNATIONAL SPACE STATION - Marucchi & Grosveld
Chapter VI - 17
Figure 9. Vibration control methods at the source.
Figure 10. Vibration control on the transmission path.

NASA/SP-2015-624 – ACOUSTICS AND NOISE CONTROL IN SPACE CREW COMPARTMENTS – Goodman & Grosveld
Chapter VI - 18
5.1.3 Protection at the Receiver Location (not desirable for the crewmembers)
The design of the space module/GFE/CFE and the control of noise and vibration are initially implemented by defining the GFE/CFE procurement specifications and locating the GFE/CFE remotely from the crewmembers’ workstations. The SSP 50290 habitable spacecraft PIDS shall be considered for the design selections [5]. This document limits when hearing protection devices can be used.
5.2 Audible Noise Standards
5.2.1 Standards Requirements and Definitions
The reference standard used for the definition of acoustical terms shall be the International Organization of Standardization ISO 1996/1:1982, Acoustics – Description, measurement and assessment of environmental noise – Part 1: Basic quantities and assessment procedures [9].
The method of rating noise involves the measurement of the A-weighted sound pressure level in decibels, commonly called dBA. Since the sound power levels can also be A-weighted, the quantity given in dBA always needs to have the indication as to whether it is sound pressure or power.
According to the International Electrotechnical Commission (IEC) publication entitled "Octave, half-octave and one-third octave band filters intended for the analysis of sound and vibrations" [10], at minimum, an octave band analysis of the noise in the range from 31.5 Hz to 8000 Hz band center frequencies shall be made with filters.
The A-weighting network characteristics were originally defined in IEC publication 123, Recommendations for Sound Level Meters, and IEC Publication 179, Precision Sound Level Meters. Both publications were replaced by publication 651, which was later renamed IEC 60651 [11].
5.2.2 Measurement and Test Standards
In light of appropriate methods for the verification of the requirements, general standards shall be made applicable to the GFE/CFE. For the determination of functional GFE/CFE sound power the ISO 3740 standard shall be consulted [12]. The ISO 3740 provides several important guidelines, including:
brief explanations of the principles underlying the set of basic International Standards for measuring the noise emitted by machinery and GFE/CFE
assistance in the selection of the appropriate basic International Standards general information on supplementing the basic International Standards with
instructions concerning the installation and operating conditions for the particular type of machines or GFE/CFE (such instructions are usually incorporated in test codes)
The ISO 3740 applies only to airborne sound and is applicable only to the test codes requiring the determination of sound power levels of noise sources.

EUROPEAN NOISE CONTROL IN INTERNATIONAL SPACE STATION - Marucchi & Grosveld
Chapter VI - 19
Adequate International Standards for the determination of sound power induced by structure-borne noise and vibration with guidelines for the use of basic standards and for the preparation of test codes are currently not available. System-level documentation provides for a general specification and test code definition for both, the airborne noise by ISO Standard 3740 [12] and the structure-borne noise and vibration by the direct method and the indirect method.
Structure-borne noise and vibration shall be determined by the GFE/CFE operational interface forcing function, the root-sum-squared octave or one-third octave band force level over the GFE/CFE interface connection points, due to GFE/CFE operation.
The force level over the broad spectral range can either be directly measured by an interface force transducer against a seismic foundation or be indirectly measured by means of the impedance approach on a reference test structure to which the GFE/CFE is mounted. In both cases, the GFE/CFE impedance has to be determined for later system level vibro-acoustic transfer function impedance corrections.
During preliminary design, the interface forcing function of the noise and vibration source shall be coupled directly with the general system-level vibro-acoustic transfer functions to derive the cabin sound power output or structural vibration. The ratio of the GFE/CFE impedance and transfer function input impedance will be set to 1 (one) for the initial approach. If no general standard is used, the procedure selected needs special approval by the next-higher project-level authority.
5.3 Computational Models
Computational models for the prediction of the audible noise environment shall be used, if applicable. One candidate model is the fluid-structure interaction computational model during the development of the habitable spacecraft based on:
Test Data Analysis System Test data processing for the study of the vibro-acoustic transmissibility and for experimental modal synthesis.
Finite Element Analysis To study the fluid/structure interaction at low modal densities and simulate the on-orbit dynamically free-free boundary conditions.
Fluid-Dynamic Analysis To take into account the flow-induced vibration.
Vibro-Acoustic Boundary Element Analysis To capture the fluid/structure interaction simulation in the low/medium frequency region.
Statistical Energy Analysis To analyze the contribution of the fluid/structure interaction at medium to high modal densities.

NASA/SP-2015-624 – ACOUSTICS AND NOISE CONTROL IN SPACE CREW COMPARTMENTS – Goodman & Grosveld
Chapter VI - 20
Computational models and software programs selected for design analysis of audible noise need prior approval by the next higher project-level authority.
6. DESIGN AND DEVELOPMENT TASKS
6.1 System Level Audible Noise Control Activities
6.1.1 System Architecture Integrity
Aspects relevant to the audible noise/characteristics of the habitable spacecraft system to accommodate crew for the execution of work and maintenance include
balanced use of project resources common use items that impact audible noise qualifications with regard to the system-level requirements control of system-level interfaces future growth and autonomy acceptance of system products
The applicable audible noise requirements demand certain types of GFE/CFE. In this context, particular planned activities ensure that the project resources (time, cost) are used for the most appropriate technical activities or GFE/CFE relevant to noise and vibration. On the system level, this involves all items relevant to the noises and vibration characteristics of the habitable spacecraft (e.g., air loops, active cooling loops, structural friction-sticking phenomena, etc.) and includes the following activities:
define/levy requirements at the systems that are compatible with the objectives of cost efficiency
investigate/trade the different (proposed) design concepts at GFE/CFE mechanical interfaces (i.e., anti-vibration mount (AVM), muffler, etc.) that generate major audible noise disturbances
establish a ranking of emphasis for the design and development areas that would improve audible noise characteristics
perform technical reviews to ensure that the designs will, with high probability of success, meet the audible noise requirements
draw the necessary conclusions from initially produced items and feed the respective results back into flight hardware design/production
define/levy verification requirements that are compatible with the objectives of cost efficiency
investigate/trade the different (proposed) verification concepts for audible noise requirements verification
perform technical reviews to ensure that the verification and test programs are effective (minimum redundancies, no gaps, adequate information, adequate credibility of data and results)

EUROPEAN NOISE CONTROL IN INTERNATIONAL SPACE STATION - Marucchi & Grosveld
Chapter VI - 21
Computational models for common audible noise disturbances are needed for requirements assessment and re-assessment of activities, for design optimization, and partially for verification purposes. These models are defined at the system level.
Finally, the acceptance of system products requires the following system-level steps:
establish the overall noise control philosophy prepare the overall Audible Noise Control plan define the design practices and analyses to be applied or performed to verify the
given audible noise requirements evaluate the noise and vibration analysis and equipment level test reports to ensure
that sound and vibration budgets are met, requirements are complied with, and analysis methods are suitable and adequate for verification
6.1.2 Audible Noise Requirements at the System Level
System audible noise requirements are given by SSP 50290 – Manned Spacecraft PIDS [5] and defined under Section 4.3 of this document and SSP 50005, Rev. B + DCN001 ISS Flight Crew Integration Standard [6].
6.1.3 System Design and Development Activities
These tasks define and specify the habitable spacecraft system activities related to lower levels, which are mainly the GFE/CFE.
For audible noise, this involves the analysis and definition of sensitive parameters, the impact of requirements on configuration definition/specification.
Contractually relevant tasks with regard to the GFE/CFE include:
allocation of design responsibilities for GFE/CFE directly relevant to the decoupling/attenuation/ compensation of audible noise disturbances at the system level
definition of the GFE/CFE content and capabilities as they relate to audible noise performance
review and acceptance of the allocated GFE/CFE design performances, assuring that no item relevant to obtaining the required audible noise quality standard is omitted
review and acceptance of the cost and time allocations for audible noise-related activities at the function and GFE/CFE levels
oversight that tasks prescribed in the applicable statements of works are performed as required
With regard to assuring cost-efficient operation of a system, the related contributions result from determining/investigating the sensitivity of the operationally pertinent parameters and their interdependency.
Relevant activities encompass:
defining/levying requirements for an optimal audible noise environment defining/levying the verification requirements

NASA/SP-2015-624 – ACOUSTICS AND NOISE CONTROL IN SPACE CREW COMPARTMENTS – Goodman & Grosveld
Chapter VI - 22
The verification activities at the system level include:
the definition of the verification philosophy control of the lower-level verification data the verification of source interaction effects the verification of cumulative parameters
The audible noise verification philosophy defined at this level establishes an integrated structure of analysis that leads to ultimate verification.
Lower-level verification steps are controlled through the evaluation/acceptance of the particular verification approach that the steps and the results are authentic and responsive to the requirements.
Delta verification activities (design verification, qualification, and acceptance) are performed to close the gap between lower-level configuration/verification data and the data required for the full verification of the system-level requirements.
In regard to source interaction effects and cumulative parameters, this level verifies that respective resultant disturbances, as measured and analyzed, are below the limits specified for the system.
In broad terms, the system level performs:
overall detailed design and design control hardware product control integration verification/qualification
The overall system design, which involves the definition of functions controlled GFE/CFE, has to be responsive to the audible noise objectives. This is ensured by allocating noise and vibration requirements for individually effective disturbance sources to functions and other GFE/CFE. In the process of requirements breakdown and functional allocation, the allotment of appropriate disturbance compensation or attenuation measures has to be considered. Particular decisions have to be taken with regard to the adoption and the location of counteracting measures, if necessary (e.g., within the disturbing mechanism, which can be a GFE/CFE). The decisions are to be based on technical as well as on programmatic criteria such as development schedule and cost.
The system level scrutinizes function and other GFE/CFE designs and assures that they can be developed and built within the existing programmatic and contractual constraints. This applies, in particular, to the GFE/CFE, which has to be enhanced in order to comply with the audible noise objectives and requirements.
General compliance of function and other GFE/CFE configurations and performances with the related specifications is to be controlled as follows:
review all the configuration data on functions and other GFE/CFE, as designed and built, which are necessary for the verification of the audible noise requirements
evaluate/approve the validity of these data

EUROPEAN NOISE CONTROL IN INTERNATIONAL SPACE STATION - Marucchi & Grosveld
Chapter VI - 23
evaluate/approve the adequacy/sufficiency of these data to constitute verification
Compliance of the GFE/CFE configurations and performances to mutual interface requirements and design is to be controlled in similar terms. In this case, relevant data shall relate the audible noise disturbance inputs/outputs and the related interactions and the adequacy/sufficiency of the interface designs.
System assembly, integration, and verification are to be supported by the related activities as follows:
verify the source output verify the disturbance output of assemblies that are authentically assembled for the
first time perform the delta verification required to amend the lower-level verification results
in the process of system-level verification check the parameters required for analyses on the assembled/integrated hardware
(this includes, in particular, the location/orientation of disturbance sources and the transmission paths of noise and vibration)
For system acceptance, a final "as verified" budget shall be prepared, including clear traceability to the requirements.
Compliance control related to the system specification is conducted. This applies similarly to the control of interface compliance, with the understanding that International Space Station interfaces are considered. The system shall perform the design development, perform the analyses to verify the applicable requirements for the integrated system and ensure that the system complies with these requirements as specified by the system specifications.
To control the total cabin sound power, the system has allocated an internal budget for the functions and has also defined suggested new GFE/CFE specifications in terms of new NC (NC-XX) to be converted at the system level in sound power by the following assumptions:
hemispherical propagation surface area of the hemisphere versus the distance at which the sound pressure
level will be measured by the GFE/CFE suppliers
The formula used for the first Design Review (DR1) assessment, normally held at the time of Preliminary Design Review (PDR), is the following
2
10 2
2logW P
RL L
m
where 2R2 is the surface area of the hemisphere, which means adding + 4 dB to NC-50 or NC-40 (sound pressure level measured at 0.61 m) to obtain the equivalent emitted sound power level for the GFE/CFE (NC-50 is used when the system is involved, NC-40 when a payload equipment item is involved). GFE/CFE suppliers shall produce an audible noise analysis and budget report stating what the noise and vibration levels are versus the allocated sound and vibration requirements and give these data to the system level for analysis and acceptance. They shall implement compliant GFE/CFE.

NASA/SP-2015-624 – ACOUSTICS AND NOISE CONTROL IN SPACE CREW COMPARTMENTS – Goodman & Grosveld
Chapter VI - 24
The system design shall ensure that the overall system and performance is supporting the need for a low noise and vibration environment in the cabin of the habitable spacecraft. That means, confirmation of system arrangements with a minimum number of noise-producing GFE/CFE payloads, functional performances allowing low noise, etc.
System noise and vibration control engineering shall review, and shall provide support and guidance to the other system engineering design disciplines. System noise and vibration control engineering shall provide guidance and review functions and other GFE/CFE noise control activities.
Early system analysis and test evaluation shall determine the detailed noise and vibration transfer functions and room characteristics, which need to be used for internal function performance control and for GFE/CFE noise and vibration impact analysis. The initial analysis shall show provisions to optimize the system with regard to noise and vibration attenuation, shall indicate volume and mass resources to accommodate noise and vibration attenuation, and shall provide direction for room surface acoustic properties.
At the GFE/CFE level, noise and vibration test data shall be implemented, as they become available. Equipment-level final system requirement verification steps shall include the analytical evaluation of the integrated system noise and vibration of the habitable spacecraft.
Mainly, the lower frequency vibration level shall be determined by a low frequency on-orbit structural dynamics and vibro-acoustic response analysis, because the ground test simulations are limited by the suspension and boundary conditions on the ground in the frequency domain below 3 Hz.
The habitable spacecraft shall determine by analysis the system cabin room absorptivity, the sound power insertion losses of the partition walls (racks, etc.), and the vibro-acoustic and vibrational transfer functions (such as the lateral/ceiling rack to cabin, the cone and shell structure to cabin, sound power due to force and vibration excitation with adjacent input impedances).
6.1.4 Analysis and Budget Report
The system audible noise analysis and budget report as defined by the Bilateral Data Exchange Agreement (BDEA) between NASA and ESA provides that the module supplier shall predict the induced noise and vibration-level contributions versus the allocated requirements and shall ensure the system noise requirement fulfillment.
The system noise analysis has been done with a preliminary assessment of the sound power generated by the GFE/CFE payloads. Based on this assessment, the function design goal (i.e., the method or tool to control the function and GFE/CFE contribution) has been defined. Early system analysis and test evaluation shall determine the detailed system noise and vibration transfer functions and the room characteristics. System noise analysis shall collect function and GFE/CFE analysis and test data and shall evaluate and combine them with analytical system specific data to a system-level noise and vibration environment prediction. The analysis and budget report shall include the function and the GFE/CFE budget status.

EUROPEAN NOISE CONTROL IN INTERNATIONAL SPACE STATION - Marucchi & Grosveld
Chapter VI - 25
System noise and vibration analysis and budget reports shall be periodically available at least for each system design review.
6.1.5 Function and Other Government Furnished Equipment/Contractor Furnished Equipment Budget Requirements
Following the control approach outlined in Section 4 of this document, the system has allocated the requirement at the function level as a design goal to better control the function. The specification values in this plan are given for definition and information purposes. They are not binding for the relevant contractual level.
Hearing conservation requirements are treated on an individual basis, which is the most technically feasible approach.
Narrowband, long-term audible noise and impulse audible noise requirements are specified relative to broadband, long-term and short-term audible noise requirements and, therefore, broken down to budget levels in the same way.
Infrasonic long term noise requirements are also treated on a single-source basis.
6.1.6 External Interface Control
Requirements about the allowable transmission from and to the habitable spacecraft are specified in the external Interface Control Documents (ICDs). Noise transmitted through an open hatch between mating ISS modules is controlled by mating module documentation.
Inter Module Ventilation (IMV) ducting that interfaces with the module should have IMV in-duct sound power levels specified in the interfacing module documentation. IMV ducting must also be considered as a noise source.
6.1.7 Internal Interface Control
Internal interface design and development shall take care of the interactive behavior with respect to noise transmission and attenuation among the GFE/CFE of the element.
Due consideration shall be given to the system level in control of the internal interfaces between GFE/CFE by means of internal ICDs; e.g., structural joints and the associated stick/slip effect.
6.2 System Function Level
6.2.1 Audible Noise Design and Development Activities
Function design and development activities to control the noise generated or transmitted by the functions shall be based mainly on a noise control model consistent with the system noise control sound power flow model. Schematic sound power flow models for ECLS, TCS, and other GFE/CFE are given in Figure 11 through Figure 15. The functions shall select the GFE/CFE with the optimum noise and vibration performance. The function performances shall consider minimum noise generation; e.g., low speeds, low flow rates, smoothed bends, and discontinuities, etc.

NASA/SP-2015-624 – ACOUSTICS AND NOISE CONTROL IN SPACE CREW COMPARTMENTS – Goodman & Grosveld
Chapter VI - 26
Figure 11. ECLS cabin loop sound power control model
(typical logic flow) – (CCAA=Common Cabin Air
Assembly; WS=Water Separator attached to CCAA;
TWV=Three-Way Valve; ASD=Area Smoke Detector;
NIA=Nitrogen Interface Assembly.
Figure 12. ECLS IMV supply line sound power control
model (typical logic flow) – (IMV=Inter Module
Ventilation (air ducts fans).

EUROPEAN NOISE CONTROL IN INTERNATIONAL SPACE STATION - Marucchi & Grosveld
Chapter VI - 27
Figure 13. ECLS IMV return line sound power control model (typical logic flow) – (IMV=Inter Module Ventilation (air ducts fans).
Figure 14. TCS sound power control model (typical logic flow) – (PPA=Pump Package Assembly; SFCA=System Flow Control Assembly; TWMV=Three-Way Mixing Valve; SPCU=Suit Processing Control
Unit; H/X=Heat Exchanger).

NASA/SP-2015-624 – ACOUSTICS AND NOISE CONTROL IN SPACE CREW COMPARTMENTS – Goodman & Grosveld
Chapter VI - 28
Figure 15. AVS, EPS, video and audio sound power control model (typical logic flow) – (RPCM=Remote Power Control Module; GLA=General Luminaire Assembly (lights); DDCU=Direct-to-Direct Converter Unit;
ABC=Audio Bus Coupler; ATU=Audio Terminal Unit; CVIU=Common Video Interface Unit; VSU=Video Switch Unit; MDM=Multiplexer – De-Multiplexer; UOP=Utility Outlet Panel).
The functions firstly transform the allocated design goal (i.e., internal function requirements allocation) into design requirements for the individual GFE/CFE in terms of relevant parameters such as allowable sound power sub-budgets and design parameters like residual unbalances, mechanical ripple, fluid turbulences, cavitation, etc. At this stage, compliance with the requirements is to be shown by applicable analyses and/or GFE/CFE assembly test data. Due consideration to the design ground rules in Section 5 shall be given.
A specific problem for the structure and mechanism is to avoid structural noise by stick/slip in joints, caused by thermal expansion and retraction or other effects.
The control of function-induced vibrations at the crew interfaces follows a similar approach and, thus, causes similar activities.
The functions shall perform the design and analyses to verify the applicable requirements for the integrated function. NASA shall ensure that the GFE/CFE comply with the suggested audible noise requirements. The system evaluates the GFE/CFE noise and vibration analysis, as well as the test reports and design development documentation.
Functions audible noise analysis, design and development documentation will be reported at the system level.

EUROPEAN NOISE CONTROL IN INTERNATIONAL SPACE STATION - Marucchi & Grosveld
Chapter VI - 29
6.2.2 Government Furnished Equipment/Contractor Furnished Equipment Sub-Budget Requirements
Following the control approach outlined in Section 4 of this document, the system/function shall allocate the GFE/CFE sub-budget requirements and shall made them applicable in GFE/CFE specifications.
Hearing conservation requirements are treated on an individual basis, which is the most technically feasible approach.
Narrowband, long-term audible noise and impulse audible requirements are specified relative to broadband, long-term and short-term audible noise requirements and, therefore, broken down to budget levels in the same way.
Infrasonic and ultrasonic long-term noise requirements are treated on a single-source basis.
6.3 Government Furnished Equipment/Contractor Furnished Equipment Level
6.3.1 Audible Noise Design and Development Activities
The GFE/CFE design and development forms a vital part of the habitable spacecraft systems audible noise control because the reduction of the noise and vibration at the source is the most effective. After the function performance criteria are defined by the system and specified for the GFE/CFE, the possibility to incorporate and accept the GFE/CFE unit design shall be based on the noise and vibration performance criteria and GFE/CFE noise and vibration limits.
The design optimization activities shall follow the ground rules specified in Section 5. GFE/CFE design and development activities are related not only to the units that have to be considered as noise and vibration sources. Other configuration items on the GFE/CFE level are noise and vibration attenuation or transmission hardware, such as duct sections, case covers, mufflers, vibration isolation support structures, etc.
The GFE/CFE supplier shall perform detailed design and development, and analyses and tests to verify the applicable audible noise requirements on the hardware as defined in the GFE/CFE specifications.
GFE/CFE noise and vibration analysis reports, noise and vibration test reports, and design and development documentation shall be prepared and submitted to the function/function level (this means that all the documentation delivered with a certain component [GFE/CFE], in particular vibration test reports and design and development documentation, is delivered to the function responsible [“owner”] of a certain equipment).
The GFE/CFE supplier shall produce GFE/CFE compliant with the audible noise requirements and sound power and vibration budget allocations.
They shall prepare a GFE/CFE audible noise/budget report, together with the analysis report, providing information on the noise and vibration levels produced by the GFE/CFE versus the allocated sound power and vibration budget. This report shall be submitted to the function/function level.

NASA/SP-2015-624 – ACOUSTICS AND NOISE CONTROL IN SPACE CREW COMPARTMENTS – Goodman & Grosveld
Chapter VI - 30
6.3.2 Government Furnished Equipment/Contractor Furnished Equipment Analysis and Budget Report
A GFE/CFE noise and vibration analysis and budget report, as defined by the Document Requirement Description (DRD), shall be prepared by the supplier of the GFE/CFE. It shall include an identification code for each type of document produced, i.e., a Computer Aided Design (CAD) model, plan, and report, etc. – as reported in the related Statement of Work (SOW). GFE/CFE noise analysis shall predict the noise and vibration levels and transmission functions of the GFE/CFE, initially by an assessment of the design data and by a later update with the evaluation of test data.
The results of the analysis and the budget report, considering test data where appropriate, shall verify the requirements. The analysis shall present all quantities related to the specified values; e.g., GFE/CFE generated sound power spectra, GFE/CFE self-induced vibration interface forcing functions. GFE/CFE noise and vibration transmission and attenuation functions shall be evaluated, where applicable.
The GFE/CFE budget requirement status shall be provided to the customer (NASA, ESA, or others), as part of the analytical verification of the specified requirement (generally, to be later confirmed by test).
GFE/CFE noise and vibration analysis and budget reports shall be delivered to the customer, at a minimum, together with each GFE/CFE design review data package.
7. ASSEMBLY, INTEGRATION AND VERIFICATION
7.1 System Audible Noise Verification
System audible noise verification shall be performed by analytical system models for the prediction of the on-orbit noise and vibration environment.
The final requirement verification is provided by analytical assessment of the anticipated on-orbit conditions and, if practical, by ground test verification simulating these conditions. Table 5 shows all the experimental and analytical activities to be performed for the audible noise requirements verification.
7.2 Function Audible Noise Verification
The structural flight model, which is planned for the characterization of the micro-g structural transmissibility by testing, shall be utilized as a check of the mathematical models quality indicator.
The final requirement verification is provided by testing of the flight configuration hardware or, in cases where it is not practical to do, by the analytical assessment of the anticipated on-orbit condition(s) based on test data obtained during the on-ground system test. An example of
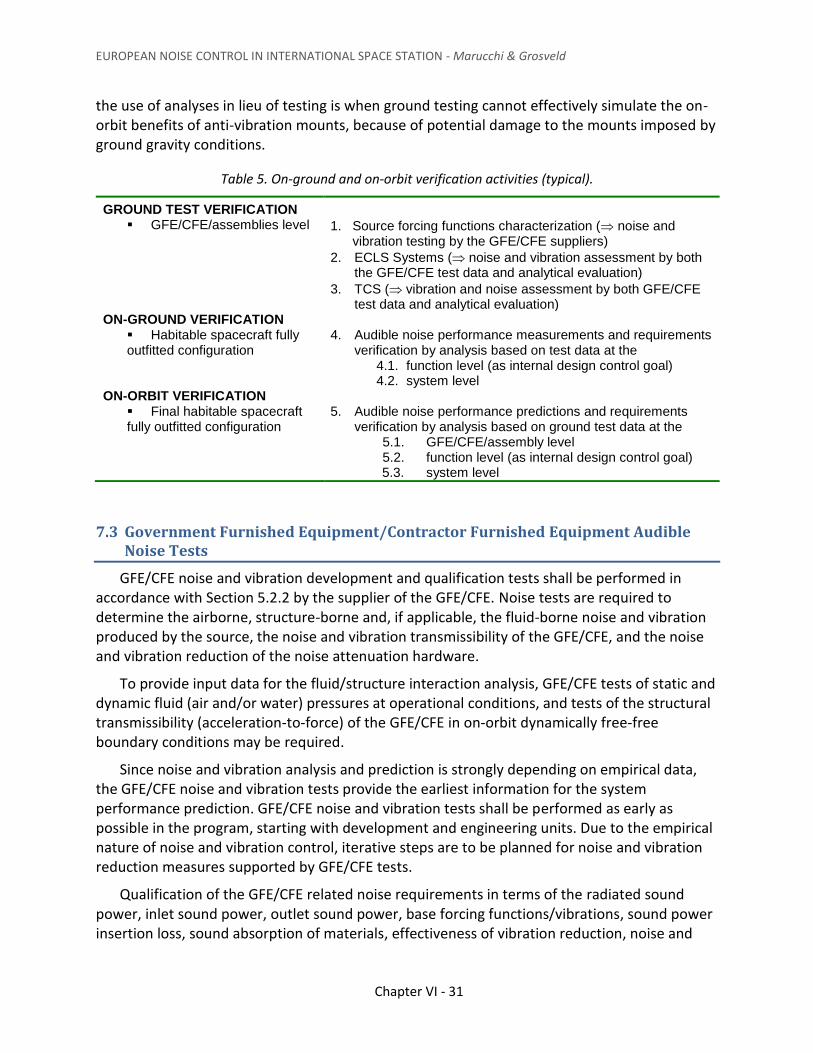
EUROPEAN NOISE CONTROL IN INTERNATIONAL SPACE STATION - Marucchi & Grosveld
Chapter VI - 31
the use of analyses in lieu of testing is when ground testing cannot effectively simulate the on-orbit benefits of anti-vibration mounts, because of potential damage to the mounts imposed by ground gravity conditions.
Table 5. On-ground and on-orbit verification activities (typical).
GROUND TEST VERIFICATION GFE/CFE/assemblies level 1. Source forcing functions characterization ( noise and
vibration testing by the GFE/CFE suppliers)
2. ECLS Systems ( noise and vibration assessment by both the GFE/CFE test data and analytical evaluation)
3. TCS ( vibration and noise assessment by both GFE/CFE test data and analytical evaluation)
ON-GROUND VERIFICATION Habitable spacecraft fully outfitted configuration
4. Audible noise performance measurements and requirements verification by analysis based on test data at the
4.1. function level (as internal design control goal) 4.2. system level
ON-ORBIT VERIFICATION Final habitable spacecraft fully outfitted configuration
5. Audible noise performance predictions and requirements verification by analysis based on ground test data at the
5.1. GFE/CFE/assembly level 5.2. function level (as internal design control goal) 5.3. system level
7.3 Government Furnished Equipment/Contractor Furnished Equipment Audible Noise Tests
GFE/CFE noise and vibration development and qualification tests shall be performed in accordance with Section 5.2.2 by the supplier of the GFE/CFE. Noise tests are required to determine the airborne, structure-borne and, if applicable, the fluid-borne noise and vibration produced by the source, the noise and vibration transmissibility of the GFE/CFE, and the noise and vibration reduction of the noise attenuation hardware.
To provide input data for the fluid/structure interaction analysis, GFE/CFE tests of static and dynamic fluid (air and/or water) pressures at operational conditions, and tests of the structural transmissibility (acceleration-to-force) of the GFE/CFE in on-orbit dynamically free-free boundary conditions may be required.
Since noise and vibration analysis and prediction is strongly depending on empirical data, the GFE/CFE noise and vibration tests provide the earliest information for the system performance prediction. GFE/CFE noise and vibration tests shall be performed as early as possible in the program, starting with development and engineering units. Due to the empirical nature of noise and vibration control, iterative steps are to be planned for noise and vibration reduction measures supported by GFE/CFE tests.
Qualification of the GFE/CFE related noise requirements in terms of the radiated sound power, inlet sound power, outlet sound power, base forcing functions/vibrations, sound power insertion loss, sound absorption of materials, effectiveness of vibration reduction, noise and

NASA/SP-2015-624 – ACOUSTICS AND NOISE CONTROL IN SPACE CREW COMPARTMENTS – Goodman & Grosveld
Chapter VI - 32
vibration transmissibility, etc. shall be performed on flight standard qualification type GFE/CFE units.
The noise and vibration tests shall be performed according to standard procedures as specified in Section 5.2.2 in suitable noise and vibration test facilities.
8. CRITICAL TECHNOLOGIES
The most critical areas with regard to audible noise control are the selection and the development activities for function GFE/CFE, which produce the noise and vibration, such as the air loop fans, fluid loop pumps, centrifuges, etc. Presently, the state of the art in air loop fan design indicates a very critical technology area susceptible to exceedance of sound power budget limits.
The GFE/CFE dedicated for habitable spacecraft will be newly designed due to the specific requirements of the spacecraft and the ISS. Effective noise and vibration control at the source often needs the experience with hardware items in iterative steps. It has to be addressed here, that even at the beginning of the GFE/CFE design, the noise and vibration limits have to be considered and not only the functional performance criteria.
Active noise and vibration control is a means to counteract automatically against sound pressure waves, vibrational forces, or deflections after the measurement of the original and applying a phase-shifted reaction to the origin by an actuator via closed-loop control. Active noise and vibration control could be applied at the source, which is the noise and vibration generating GFE/CFE, or at the receiver, which is the crew cabin or the crew ear. Active noise suppression is a proven technology for one-dimensional applications – e.g., noise transmitted via intercom systems or hearing aids or duct transmitted sound – but not so much for three-dimensional reverberant rooms, such as the cabin, at many spatial locations. If the source would be limited to air duct delivered noise only, the associated resources in terms of funding, mass, volume, development risk and time, and the associated technology, would be out of proportion with the other remaining noise sources requesting attenuation. Special hearing protection is often disregarded by the user, especially, if they are uncomfortable and only marginally effective. Active vibration suppression at the source will become complex by the sources interfaces and the larger number of sources.
Thus, active noise and vibration suppression should not be the preferred solution, but should be viewed as an optional technology in the habitable spacecraft design phase.
9. CONCLUSIONS
Dedicated control plans for audible noise environment control described in this chapter were implemented as a guideline for ESA module development and verification during each module design cycle. These plans called for controlling all levels, from the equipment up to the system, considering the contributions of all the disturbance sources in order to converge to the system compliance. This noise control approach defined and maintained a sound power

EUROPEAN NOISE CONTROL IN INTERNATIONAL SPACE STATION - Marucchi & Grosveld
Chapter VI - 33
balance between all acoustical power sources after transmission into the module cabin and the acoustical power absorbed by the cabin interior such that the resulting sound pressure level criterion is not exceeded. The implementation of these noise control approach plans and sound power applications proved unique in the ISS, which generally used sound pressure level requirements for hardware and the overall system. This design methodology proved to be successful technically, and resulted in very quiet modules that met or were below the ISS requirements.
10. REFERENCES
1. Marucchi-Chierro, P.C., Destafanis, S. and Bandini, F., Comfort and Microgravity Design of Pressurized Module Node 2 under On-Orbit Vibro-Acoustic Environment. IAC-03-I.2.06. Proceedings of the 54th International Astronautical Congress, Bremen, Germany, 29 September – 3 October 2003.
2. Marucchi-Chierro, P.C., Cabodi, G., Quagliotti, F. and Riva, Nicola, Testing and Characterization of ISS Pressurized Modules vs. On-Orbit Vibro-Acoustic Environment – Lessons Learned. Acta Astronautica, V. 63, Iss. 1-4 July 2008, pp. 310-323.
3. Marucchi-Chierro, P. and Martini, M., Columbus Verification Control Approach Versus Micro-gravity Requirement. Proceedings of the 5th International Symposium on Environmental Testing for Space Programmes, Noordwijk, The Netherlands, ESA SP-558, June 2004, p.471-480.
4. Marucchi-Chierro, P.C., Destafanis, S., Martini, M., and Ullio, R., Audible Noise and Microgravity Control of Pressurized Module under On-Orbit Vibro-Acoustic Environment. ESA SP-581. European Conference on Spacecraft Structures, Materials and Mechanical Testing 2005, Noordwijk, The Netherlands, 10-12 May 2005.
5. NODE2 Prime Item Development Spec. NASA SSP-50290, Rev. C, Draft 4, NASA Johnson Space Center, Houston, TX, January 2001.
6. ISS Flight Crew Integration Standard. NASA SSP-50005, Rev. B, NASA Johnson Space Center, Houston, TX, August 1995.
7. Beranek, L.L., ed., Noise and Vibration Control. New York: McGraw-Hill, 1988.
8. Man-System Integration Standard, NASA STD-3000. Volume I, Part A. NASA Johnson Space Center, 1995.
9. ISO, Acoustics – Description, measurement and Academic Press assessment of environmental noise – Part 1: Basic quantities and assessment procedures. ISO 1996-1:1982. Geneva, Switzerland: International Organization for Standardization, 1982.
10. IEC, Octave, half-octave and third-octave band filters intended for the analysis of sounds and vibrations. P_IEC 60225 ed1.0 (1966-01). Geneva, Switzerland: International Electrotechnical Commission, 1960.

NASA/SP-2015-624 – ACOUSTICS AND NOISE CONTROL IN SPACE CREW COMPARTMENTS – Goodman & Grosveld
Chapter VI - 34
11. IEC, Sound level meters. P-IEC 60651 ed1.2 Consol. with am1&2. Geneva, Switzerland: International Electrotechnical Commission, 2001.
12. ISO, Acoustics – Determination of Sound Power Levels of Noise Sources – Guidelines for the Use of Basic Standards and for the Preparation of Noise Test Codes. ISO 3740-1980. Geneva, Switzerland: International Organization for Standardization, 1980.
11. ACRONYMS
ABC Audio Bus Coupler ASD Area Smoke Detector ASI Italian Space Agency ATP acceptance test procedure
ATU Audio Terminal Unit
ATV Automated Transfer Vehicle AVM anti-vibration mount AVS Audio Video System BDEA Bilateral Data Exchange Agreement CAD Computer Aided Design CCAA Common Cabin Air Assembly CFE Contractor Furnished Equipment CI configuration item CVIU Common Video Interface Unit DDCU Direct-to-Direct Converter Unit
DR1 First Design Review DRD Document Requirement Description EADS European Aeronautic Defence and Space ECLS Environmental Control and Life Support EPS Electric Power System
ESA European Space Agency
GFE Government Furnished Equipment GLA General Luminaire Assembly H/X Heat Exchanger ICD Interface Control Document IEC International Electrotechnical Commission IMV Inter Module Ventilation
ISO International Organization of Standardization ISS International Space Station MDM Multiplexer – De-Multiplexer MPLM Multi-Purpose Logistics Module NC Noise Criterion NIA Nitrogen Interface Assembly PDR Preliminary Design Review

EUROPEAN NOISE CONTROL IN INTERNATIONAL SPACE STATION - Marucchi & Grosveld
Chapter VI - 35
PIDS Prime Item Development Specifications
PPA Pump Package Assembly RPCM Remote Power Control Module SFCA System Flow Control Assembly SOW Statement of Work SPCU Suit Processing Control Unit TCS Thermal Control System TWMV Three-Way Mixing Valve TWV Three-Way Valve UOP Utility Outlet Panel VSU Video Switch Unit WS Water Separator

NASA/SP-2015-624 – ACOUSTICS AND NOISE CONTROL IN SPACE CREW COMPARTMENTS – Goodman & Grosveld
Chapter VI - 36
This page intentionally left blank

CHAPTER VII
ACOUSTIC SPACEFLIGHT MATERIALS
Jerry R. Goodman
Charles Hill
CONTENTS
1. INTRODUCTION ........................................................................................................................ 5
2. SOUND ABSORBERS .................................................................................................................. 7
2.1 Absorbent Cushions ......................................................................................................... 7
2.2 Primary Absorbent Materials .......................................................................................... 8
2.2.1 Foams .................................................................................................................... 9
2.2.1.1 Melamine foam ..................................................................................... 10
2.2.1.2 SOLIMIDE® foam.................................................................................... 10
2.2.1.3 Soundfoam® HT ..................................................................................... 12
2.2.1.4 Pyrell® foam .......................................................................................... 12
2.2.1.5 SCOTTFELT® foam .................................................................................. 12
2.2.1.6 Other foams........................................................................................... 12
2.2.2 Fibrous Material and Felts .................................................................................. 12
2.2.2.1 Kevlar® felt ............................................................................................ 12
2.2.2.2 Thinsulate™ ........................................................................................... 13
2.2.2.3 Durette® felt .......................................................................................... 14
2.2.2.6 Foam Absorption ................................................................................... 14
2.3 Feltmetal™ Materials ..................................................................................................... 15
2.3.1 Feltmetal™ with Absorbent Materials ................................................................ 15
3. BARRIERS ................................................................................................................................ 16
3.1 BISCO® HT-200 ............................................................................................................... 16
3.2 Non-Reinforced Barrier ................................................................................................. 18

NASA/SP-2015-624 – ACOUSTICS AND NOISE CONTROL IN SPACE CREW COMPARTMENTS – Goodman & Grosveld
Chapter VII - 2
3.3 Multi-layer Barriers ........................................................................................................ 18
4. VIBRATION ISOLATION AND DAMPING .................................................................................. 21
4.1 Strip-N-Stick® .................................................................................................................. 21
4.2 Damping Foil .................................................................................................................. 21
4.3 ISODAMP® ...................................................................................................................... 22
4.4 COHRlastic® .................................................................................................................... 22
4.5 BISCO® HT-800® .............................................................................................................. 22
4.6 Armaflex ........................................................................................................................ 22
5. ACOUSTIC FABRICS ................................................................................................................. 23
5.1 HT90-40 Nomex®............................................................................................................ 26
5.2 60650 ROY Nomex® ....................................................................................................... 26
5.3 FDI 307 Dark Blue Nomex® ............................................................................................ 26
5.4 GORE-TEX® ..................................................................................................................... 27
5.5 Beta Cloth ...................................................................................................................... 27
6. ACOUSTIC MATERIAL SUPPORT.............................................................................................. 27
6.1 Coroplast® ...................................................................................................................... 27
6.2 Nomex® Pressboard ....................................................................................................... 28
6.3 Armalon ......................................................................................................................... 28
6.4 Foam Core ...................................................................................................................... 29
6.5 Kapton® Tape ................................................................................................................. 29
6.6 Aluminum Tape ............................................................................................................. 30
7. MATERIALS CONTROL ............................................................................................................. 30
7.1 Requirements Overview ................................................................................................ 30
7.1.1 Flammability ....................................................................................................... 30
7.1.2 Flammability Configuration Analysis .................................................................. 33
7.1.3 Offgassing Toxicity .............................................................................................. 34
7.1.4 Outgassing/Thermal Vacuum Stability ............................................................... 34
7.2 Requirements Documents ............................................................................................. 35
7.3 Materials and Processes Technical Information System Database ............................... 35
8. CONCLUSIONS ........................................................................................................................ 38
9. REFERENCES ........................................................................................................................... 38
10. ACRONYMS ............................................................................................................................. 39
APPENDIX A: SELECTED MATERIALS SOURCES AND MAPTIS NUMBERS ...................................... 40

ACOUSTIC SPACEFLIGHT MATERIALS - Goodman & Hill
Chapter VII - 3
APPENDIX B: MATERIALS DOCUMENTATION ............................................................................... 42
TABLES
Table 1. Flight approved materials for noise control...................................................................... 6
Table 2. Foam properties (for comparison purposes). ................................................................... 9
Table 3. Manufacturer absorption coefficients of several flight-approved acoustic absorption materials. ......................................................................................................................... 14
Table 4. Sound Transmission Loss Test Data for BISCO® HT-200. ................................................ 18
Table 5. Permeability of acoustic fabrics. ..................................................................................... 24
Table 6. Maximum oxygen concentrations and pressures for NASA manned spacecraft [8]. ..... 31
FIGURES
Figure 1. Absorbent cushion. .......................................................................................................... 8
Figure 2. Typical absorbent cushion with hook-and-loop fastener sewn into the enclosure. ....... 8
Figure 3. Acoustic blanket made up of Thinsulate™® absorber and a double layer of Durette® fabric. ............................................................................................................................... 8
Figure 4. Melamine foam samples: The edge of the sample on the left has broken off. The photograph on the right shows a textured sheet of foam installed in a payload rack. 10
Figure 5. SOLIMIDE® foam samples. ............................................................................................. 11
Figure 6. TA-301 SOLIMIDE® with Kapton® covering.................................................................... 11
Figure 7. Pyrell® Foam. ................................................................................................................. 12
Figure 8. T010655-TRNP90 type Kevlar® felt. ............................................................................... 13
Figure 9. Thinsulate™, with right figure showing scrim separated. ............................................. 13
Figure 10. F400-11 Durette® felt. .................................................................................................. 14
Figure 11. Feltmetal™ used in IMV muffler. ................................................................................. 15
Figure 12. Feltmetal™ tested at JSC. ............................................................................................. 15
Figure 13. Acousti-Flo® material, Feltmetal™ side in left view. ................................................... 16
Figure 14. Acousti-Flo® Feltmetal™ side magnified. ..................................................................... 16
Figure 15. BISCO® HT-200 samples 0.25 psf on left and 1.5 psf on right. .................................... 17
Figure 16. BISCO® (0.25psf) with fiberglass backing on the left and, on the right, BISCO® backed by pressure-sensitive adhesive with release paper layer open.................................. 17
Figure 17. BNR material samples. ................................................................................................. 18
Figure 18. A multilayer barrier layup. ........................................................................................... 19
Figure 19. Type of multilayer blanket originally proposed for the ISS sleep station (TeSS). ........ 20
Figure 20. Interior (left) and exterior (right) acoustic multi-layer blanket material layers. ......... 20

NASA/SP-2015-624 – ACOUSTICS AND NOISE CONTROL IN SPACE CREW COMPARTMENTS – Goodman & Grosveld
Chapter VII - 4
Figure 21. Strip-N-Stick® sample. .................................................................................................. 21
Figure 22. 3M® Damping Foil 2552 samples. ................................................................................ 21
Figure 23. COHRlastic® samples, soft on left, medium-soft on right, under a Russian fan. ......... 22
Figure 24. Black and red BISCO® HT-800® pads. ........................................................................... 23
Figure 25. Russian Depress Pump enclosure. Note that the color of the inside fabric is sage green, which does not show very well in the left-hand photographs. ....................... 25
Figure 26. Nomex® used from left, HT90-40, 60650 ROY, and FDI-307. ...................................... 25
Figure 27. Durette® 400-6 Nomex® sample.................................................................................. 25
Figure 28. HT90-40 Nomex® sample. ............................................................................................ 26
Figure 29. 60650 ROY, royal blue Nomex® (color appears to vary depending upon angle of view)...................................................................................................................................... 26
Figure 30. FDI 307 Nomex® sample. ............................................................................................. 27
Figure 31. Coroplast® material samples. ...................................................................................... 28
Figure 32. Coroplast® cut and bent at right angles and used with BISCO® PSA to add barrier features. ...................................................................................................................... 28
Figure 33. Armalon sheet. ............................................................................................................. 29
Figure 34. Foam core muffler prototype. ..................................................................................... 29
Figure 35. Kapton® (Polyimide) Tape. ........................................................................................... 29
Figure 36. Needle-rake mount for thin-film samples. .................................................................. 32
Figure 37. Typical J-configuration specimen for surface ignition of soft goods. .......................... 32
Figure 38. Flammability assessment logic diagram [15]. .............................................................. 33
Figure 39. MAPTIS website. .......................................................................................................... 36
Figure 40. MAPTIS properties search window. ............................................................................. 36
Figure 41. MAPTIS material selection list search window. ........................................................... 37

ACOUSTIC SPACEFLIGHT MATERIALS - Goodman & Hill
Chapter VII - 5
CHAPTER VII
ACOUSTIC SPACEFLIGHT MATERIALS
Jerry R. Goodman
Charles Hill
1. INTRODUCTION
Acoustic materials are key tools of the trade used in noise control of habitable volumes. Their effectiveness is important and can affect overall acoustic levels, mass, cost, and other factors. Acoustic emissions can be blocked, reflected, absorbed, or dissipated. These materials and their use in the design approach are generally more effective when applied at or close to the noise source, but they are also quite beneficial when used along the path of the noise, and at the receiver location. A limited list of acoustic materials that have been approved for flight in Space Shuttle and International Space Station (ISS) applications, including the product designation, manufacturer, material property and/or usage, and the NASA Materials and Processes Technical Information System (MAPTIS) code (http://maptis.nasa.gov) is presented in Table 1. Approval of a particular material may be applicable only to the individual hardware usage configuration and specific requirements imposed by the program at the time. For instance, if the key environmental exposures change, materials specialists need to verify whether these materials are still acceptable for use in each new application and usage configuration as described further in Section 7, Materials Control. Also, a description of these materials and the applications in which they have been or could have been used is provided. Examples of materials applications can be found in Chapter II, Noise Control and Chapter IV, Acoustics and Noise Control in the Space Shuttle Orbiter. A list of materials sources and their MAPTIS numbers is included in Appendix A.
Some of the materials included in this Chapter may no longer be available, or may have been modified, or replaced. Also, new materials for acoustic applications may be made available and may offer promising improvements over what is noted herein, so these methods should be considered. Note also that there can be various suppliers and trade names for materials like melamine (i.e., SONEXone™ and PROSPEC™) and SOLIMIDE® foams, and materials such as polyimide that are base materials for foams, felts, tapes, or other applications.
The Acoustics Office at NASA Johnson Space Center (JSC) is a recommended source of additional information: http://www.nasa.gov/centers/johnson/slsd/about/divisions/hefd/facilities/acoustics-noise.html.

NASA/SP-2015-624 – ACOUSTICS AND NOISE CONTROL IN SPACE CREW COMPARTMENTS – Goodman & Grosveld
Chapter VII - 6
Table 1. Flight approved materials for noise control.
Material Product designation Source Material property/usage MAPTIS(*) Code
Polyimide foam SOLIMIDE® HT340 Imi-Tech Sound absorption 03612
Polyimide foam SOLIMIDE® AC406 Imi-Tech Sound absorption 88764
Polyimide foam SOLIMIDE® TA301 Imi-Tech Sound absorption 62322
Polyimide foam Soundfoam® HT Soundcoat Sound absorption 85481
Constrained layer Foam Damping IsoDamp® C3201 E.A.R. (Cabot Corp.)
Visco-elastic structural damping material
02461 and/or 04565
Kevlar® felt fabric T010655 - TRNP90-14.00-BATT-74 National Nonwovens Sound absorption 08422
Metal Felt Feltmetal™ FM1812 Technetics Sound absorption or duct lining
10431 (CRES 300)
BISCO® HT-200 Rogers Corporation Acoustic barrier 04131 & 07185
BISCO® with fiberglass backing HT-200 Rogers Corporation Acoustic barrier 00179
BISCO® with pressure sensitive acrylic adhesive (PSA) HT-200 (A) Rogers Corporation Acoustic barrier 07688 & 05256
BISCO® silicone sponge rubber HT-800 Rogers Corporation
Visco-elastic damping gasket 00183
Nomex® Blue Fabric 60650 Noah Lamport, Inc Absorber or cover encapsulation 04878
Nomex® White Fabric HT-90-40 Stern & Stern Industries Absorber or cover encapsulation 06362
Nomex® Dark Blue FDI-307 Fabric Development Absorber or cover encapsulation 88139
Nomex®, Durette® Gold Fabric F-400-6 Fire Safe Products
Absorber or cover encapsulation
Durette® Nomex® Felt F400-11 Fire Safe Products Sound absorption and barrier spacer 06294
Melamine Foam Melamine or Wiltec® Illbruck Sound absorption 00243
Thinsulate™ AU 6020-6 3M™ Sound absorption 08176
Hook 'n Loop Fastener VELCRO® Acoustic panel fastener 63277
Thread MIL-T-43636 Eddington Thread Mfg. Fabric for sewing around foam 01596
Adhesive Tape PPP-T-66 Scotch® 471 3M For wrapping BISCO® and sealing cracks
N/ 20945
Adhesive Tape KPT-2 Kapton® 1 mil Polyimide Tape www.kaptontape.com
Sealing fiberglass backing on BISCO® TBD
Adhesive Tape Blue Flashbreaker® Tape 4148
Great American Tape Company All purpose 86665
Adhesive Tape Aluminum Tape 3M™ and others All purpose Various
Adhesive Tape Silicone Glass Tape 3M-361™ 3M™
Wrapping and sealing cracks when using BISCO® as a barrier 06188
Damping Tape Damping Foil 2552 3M™ Structural damping 04869
Strip ‘n Stick® 100-S Saint-Gobain Performance Plastics
Gasket material and vibration damping 62352
COHRlastic® 10480 soft or med foam
Saint-Gobain Performance Plastics Vibration isolation
03265 Soft 05251 Med
Coroplast® Plastic Corrugated Muffler structure, divider 01121 *NASA Materials and Processes Technical Information

ACOUSTIC SPACEFLIGHT MATERIALS - Goodman & Hill
Chapter VII - 7
The website offers numerous absorption and transmission loss tests that are not reported in this Chapter, as well as new information and test results on materials. The website is updated on a regular basis.
2. SOUND ABSORBERS
2.1 Absorbent Cushions
Absorbent cushions have been extensively used in applications to reduce the overall noise radiated from hardware, especially noise within enclosures such as payloads or payload racks. The recommended guidelines for installing an absorbent material cushion or blanket assembly inside an enclosure to absorb noise emissions and lessen the reverberation within that enclosure are expanded upon below.
If the absorbent material is installed in an area where there is minimal concern with the likelihood of inadvertent abrasion or contact with the material, then sheets of absorbent foam may be bonded to the interior surface of the enclosure, or the absorbent material may be installed within a fabric pouch/container and then attached to the inner surface (Figure 1). One effective approach to fasten the pouch to the enclosure is to sew hook fasteners onto the outer fabric surface and attach the cushion/container assembly to mating loop fasteners adhered to the enclosure surface (Figure 2). This approach was used to attach bunk liners as a kit into the Space Shuttle sleep station bunks, as described in Section 3.2.5, Chapter IV, Acoustics and Noise Control in the Space Shuttle Orbiter. Figure 3 shows a typical ISS absorption cushion.
If the absorbent material is installed where abrasion or wear is likely, then use of the pouch/container approach as a cushion or blanket is recommended. The fabric composition that makes up the pouch/container is very important. A more permeable fabric that is able to contain particulate matter from the absorbent material layer, facing the area to be absorbed is advised. Durette® 400-6 fabric is suggested for the pouch/container for surfaces facing the area where the noise is to be absorbed (see Figure 3). During flammability testing of initial samples of materials layups, NASA found that a single layer of Durette® 400-6 covering Thinsulate™ AU 6020-6 insulation was insufficient and a second layer of the Durette® 400-6 was required to be acceptable for flammability, because the two layers of fabric were shown to prevent ignition of the flammable Thinsulate™ filler in a carefully designed flammability test of the assembly. In this case, the two layers of non-flammable Durette® were shown by test to “contain” the flammable Thinsulate™ and also form a barrier from potential ignition sources. Development of this type of design, appropriate test methods, and acceptance rationale should be coordinated with the responsible materials control organization, or certifying agency, when such testing is necessary. The areas where the pouch/container is positioned firmly against the inside surface of the enclosure, a tighter weave fabric, such as HT-90-40 Nomex® is recommended as it will help that area perform better as a barrier. If the absorbent pouch is a cylindrical tube to cover loud noise within a pipe or tube, the tighter weave fabric is recommended for the outer layer. Figure 3 is used to illustrate the above recommendations. If the pouch/container is attached to

NASA/SP-2015-624 – ACOUSTICS AND NOISE CONTROL IN SPACE CREW COMPARTMENTS – Goodman & Grosveld
Chapter VII - 8
the enclosure surface with side D, then sides A, B, and C should have an open weave fabric such as Durette® 400-6, and side D a tighter weave such as HT90-40. If the pouch is placed within the payload rack or volume, then only the area attached to the surface should have the HT-90-40 material and the rest Durette® 400-6 to maximize absorption of the sound.
Figure 1. Absorbent cushion.
Figure 2. Typical absorbent cushion with hook-and-loop fastener sewn into the enclosure.
Figure 3. Acoustic blanket made up of Thinsulate™® absorber and a double layer of Durette® fabric.
The recommended basic materials for absorption are Thinsulate™ AU 6020-6 or Kevlar® felt
fabric T010655 - TRNP90-14.00-BATT-74. These materials are described in more detail in the next Section. The frequencies at which the noise source needs to be reduced may have a bearing on the materials or combination of materials that are chosen for optimum sound absorption. The number of fabric layers required to contain these absorbent materials is dependent upon the composite acceptability of both the fabric cover layer and the absorbent material used in flammability testing to show whether the design is acceptable.
2.2 Primary Absorbent Materials
Major properties necessary for the primary absorbent materials are: good acoustic absorption, lightweight, low cost, acceptable flammability and offgassing toxicity properties, acceptable odor, tolerable wear and tear, minimum abrasion and friability/particulation susceptibility, suitable machinability or formability, and satisfactory age life [1].
HT90-40 Nomex®
ThinsulateTM AU 6060-6
Durette® Gold Fabric F-400-6 Nomex®

ACOUSTIC SPACEFLIGHT MATERIALS - Goodman & Hill
Chapter VII - 9
2.2.1 Foams
Acoustics foams are primarily of an open cellular structure to best absorb acoustic waves and effectively convert the acoustic energy into heat. A comparison of most acoustic foams used at NASA JSC is listed, for comparison purposes, in Table 2.
Table 2. Foam properties (for comparison purposes).
Property Unit
English (metric)
Urethane Pyrell®
Neoprene Soflite II
Soft
Neoprene Soflite II Medium
Neoprene Soflite II High firm
Polyimide AC-406
Polyimide Wilimid®
SF
Melamine Willtec®
Melamine PRF
Density lb/ft3
(kg/m3) 2
(32) 2.7-3.2 (43-51)
3.4-3.7 (54-59)
3.7-4.1 (59-66)
0.6 (9.6)
0.5 (8.0)
0.5 (11.2)
0.7 (11.2)
Tensile strength
psi (kPa)
22 (152)
8 (55)
8 (55)
8 (55)
12 (83)
12 (83)
8 (55)
18 (124)
Elongation % 210 150 150 150 18 54 8 15
Indentation force
deflection
lb/50in2 (kg/323cm2)
@25% 15-25 (7-11)
30-40 (14-18)
45-55 (20-25)
40 (18)
50%
65%
Compression force
deflection
psi (kPa)
25% 0.7
(4.8)
50% 1.4
(9.6) 1.2
(8.3)
65% 1.0
(6.9)
Compression set
% 8 12 12 12 37 30
Tear strength lb/in
(kg/m) 2.5 (45)
2.0 (36)
2.0 (36)
2.0 (36)
0.3
(5.4) 0.5
(8.9)
Notes: Pa=Pascal (N/m2), psi=lb/in2, W=watt (joule/sec), lb=0.454 kg
Table 2 compares the density, the tensile strength, elongation, indentation force deflection, compression force deflection, compression set, and tear strength [2]. Note that the NASA Acoustics Office had a good deal of experience with applications of melamine, Pyrell® and SOLIMIDE® foams, but once acceptable Thinsulate™® and Kevlar® absorber designs were developed and tested, the improvement in performance and ease of use was significant and these materials became used more frequently, whereas use of the Pyrell® and SOLIMIDE® foams was reduced. As new products come to market with potentially improved performance or otherwise advantageous properties, they should be considered, for example, a non-flammable closed-cell polyvinylidene difluoride (PVDF) (Kynar®) foam was recently accepted for use in cushions. If an open-cell version of PVDF foam becomes available, it should be considered and tested for acoustic applications. Likewise, recent development of

NASA/SP-2015-624 – ACOUSTICS AND NOISE CONTROL IN SPACE CREW COMPARTMENTS – Goodman & Grosveld
Chapter VII - 10
nanotechnology flame retardants show significant promise and could prove useful in application to acoustic foams [3].
2.2.1.1 Melamine foam – Melamine is a porous open-cell foam, which has excellent noise absorption properties and has a very low-density of 11.2 kg/m3 (0.7 lb/ft3). The foam was previously marketed with the trade name Willtec® from Illbruck Acoustic, Inc. (now Pinta Acoustic, Inc.). It was used extensively in a number of ISS muffler and payload applications until the quantity of foam used grew so high that formaldehyde outgassing concerns curtailed its use. It should be noted that any new foams with similar composition should be tested for offgassing toxicity with special evaluation of trace formaldehyde levels, which must be carefully considered for acceptability in the specific end-use application. Melamine can be easily shaped or formed. Cutters were developed to cut circular holes and electric bread slicers or special carving knives were used to cut it. Melamine was used in a prototype muffler for the ISS Cupola Module where air passed through numerous holes bored through the foam. This foam has been frequently installed inside payload rack volumes and mufflers for noise attenuation (see Section 3.2.5, Chapter II, Noise Control for description and photographs). Melamine foam will particulate if rubbed, can be broken off if it is bent too much, and has poor tear strength. If inadvertent wear or contact is expected in an application, it is recommended that the foam is placed in an acceptable fabric pouch/container and hook-and-loop fasteners are used for attachment to the surface(s), as described previously. Melamine foam can be applied to either flat or contoured surfaces. During ISS efforts, NASA found that a grey-colored, hydrophobic-type of melamine foam, labeled Willtec® H foam with a density of 10.5 to 11.5 kg/m3 (0.66 to 0.72 lb/ft3), was available in Europe. This foam is shown in Minus Eighty Degree Laboratory Freezer (MELFI) payload photos, in Section 3.2.5, Chapter II, Noise Control. Willtec® is Class 1 rated for fire spreading and smoke density. Melamine foam samples are shown in Figure 4.
Figure 4. Melamine foam samples: The edge of the sample on the left has broken off. The photograph on the right shows a textured sheet of foam installed in a payload rack.
2.2.1.2 SOLIMIDE® foam – SOLIMIDE® foam is a lightweight, open-cell, polyimide insulation foam that is designed for thermal and acoustic insulation. The foam is usually yellow or orange in color and will easily particulate when brushed, compressed, or otherwise manipulated. In fact, SOLIMIDE® was used to help evaluate fabrics for containment since it particulates so easily. SOLIMIDE® foam was a familiar product because of its use in the Space Shuttle as a cushion material for extra-vehicular activities (EVAs) tool stowage provisions in the Space

ACOUSTIC SPACEFLIGHT MATERIALS - Goodman & Hill
Chapter VII - 11
Shuttle payload bay. It was adopted and used in the four-tier Space Shuttle sleep station outlet muffler and in the cushions used as a kit inside each bunk (Section 3.2.5 in Chapter IV, Acoustics and Noise Control in the Space Shuttle Orbiter). When SOLIMIDE® was adopted, it was not known that the cut in the block of foam termed “bun” was important in the material efficiency as an acoustic absorber. A horizontal cut was later found to a have a much higher acoustic absorption. SOLIMIDE® AC-406 was used in these applications. It was later used in quieting the Russian Depressurization (Depress) Pump in the ISS U.S. Airlock Module. It is believed that Spacelab used 1-in thick TA-301 SOLIMIDE® foam with a perforated Tedlar® face to help preclude foam particulation. TA-301 SOLIMIDE® was used in the ISS in the Avionics Air Assembly (AAA) fan muffler. The AAA fan was used in a muffler section. Holes were cut through the foam to form the chevron. A DAPCO® 2030 fluoroelastomer sealant/insulation was used as a coating to precondition the foam to maintain structural integrity. The fan supplier established a process specification on the materials for applying the sealant/insulation to the TA-301 foam. Because of NASA’s concerns with the fragility of this material, JSC evaluated the use of DAPCO® spray-on and brush applications (using the fan contractors specification) to see whether it could readily be used by JSC or recommended to other users. The foam to be treated required compressing with a roller before the delicate process of applying the coating. It was found that such treatments were not practical for JSC use because of the efforts and costs involved. An Armstrong® 520 adhesive was used to bond mating edges of TA-301 SOLIMIDE® foam making up a muffler fabricated for use in ISS development by the Japanese ISS partners. Cutting of the foam was performed by a band saw. Three commonly used SOLIMIDE® foam samples are depicted in Figure 5 and Figure 6.
Figure 5. SOLIMIDE® foam samples.
Figure 6. TA-301 SOLIMIDE® with Kapton® covering.
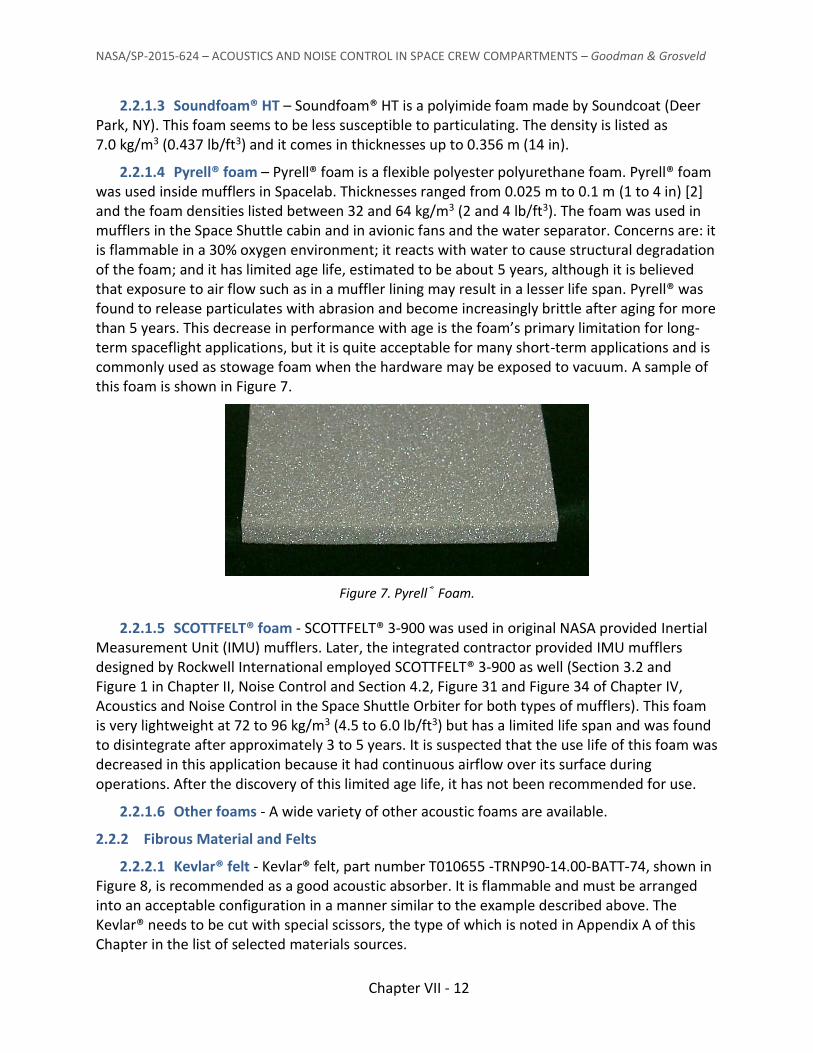
NASA/SP-2015-624 – ACOUSTICS AND NOISE CONTROL IN SPACE CREW COMPARTMENTS – Goodman & Grosveld
Chapter VII - 12
2.2.1.3 Soundfoam® HT – Soundfoam® HT is a polyimide foam made by Soundcoat (Deer Park, NY). This foam seems to be less susceptible to particulating. The density is listed as 7.0 kg/m3 (0.437 lb/ft3) and it comes in thicknesses up to 0.356 m (14 in).
2.2.1.4 Pyrell® foam – Pyrell® foam is a flexible polyester polyurethane foam. Pyrell® foam was used inside mufflers in Spacelab. Thicknesses ranged from 0.025 m to 0.1 m (1 to 4 in) [2] and the foam densities listed between 32 and 64 kg/m3 (2 and 4 lb/ft3). The foam was used in mufflers in the Space Shuttle cabin and in avionic fans and the water separator. Concerns are: it is flammable in a 30% oxygen environment; it reacts with water to cause structural degradation of the foam; and it has limited age life, estimated to be about 5 years, although it is believed that exposure to air flow such as in a muffler lining may result in a lesser life span. Pyrell® was found to release particulates with abrasion and become increasingly brittle after aging for more than 5 years. This decrease in performance with age is the foam’s primary limitation for long-term spaceflight applications, but it is quite acceptable for many short-term applications and is commonly used as stowage foam when the hardware may be exposed to vacuum. A sample of this foam is shown in Figure 7.
Figure 7. Pyrell® Foam.
2.2.1.5 SCOTTFELT® foam - SCOTTFELT® 3-900 was used in original NASA provided Inertial Measurement Unit (IMU) mufflers. Later, the integrated contractor provided IMU mufflers designed by Rockwell International employed SCOTTFELT® 3-900 as well (Section 3.2 and Figure 1 in Chapter II, Noise Control and Section 4.2, Figure 31 and Figure 34 of Chapter IV, Acoustics and Noise Control in the Space Shuttle Orbiter for both types of mufflers). This foam is very lightweight at 72 to 96 kg/m3 (4.5 to 6.0 lb/ft3) but has a limited life span and was found to disintegrate after approximately 3 to 5 years. It is suspected that the use life of this foam was decreased in this application because it had continuous airflow over its surface during operations. After the discovery of this limited age life, it has not been recommended for use.
2.2.1.6 Other foams - A wide variety of other acoustic foams are available.
2.2.2 Fibrous Material and Felts
2.2.2.1 Kevlar® felt - Kevlar® felt, part number T010655 -TRNP90-14.00-BATT-74, shown in Figure 8, is recommended as a good acoustic absorber. It is flammable and must be arranged into an acceptable configuration in a manner similar to the example described above. The Kevlar® needs to be cut with special scissors, the type of which is noted in Appendix A of this Chapter in the list of selected materials sources.

ACOUSTIC SPACEFLIGHT MATERIALS - Goodman & Hill
Chapter VII - 13
Figure 8. T010655-TRNP90 type Kevlar® felt.
2.2.2.2 Thinsulate™ – Thinsulate™ is an insulation material used in aircraft, marine, and other commercial applications. NASA selected AU 6020-6 for use because of its high acoustic absorption properties, availability, ease of use, low weight, and low cost. Thinsulate™ is a white non-woven fibrous material that is made up of mainly polypropylene and some poly (ethylene terephthalate) fibers, and has a reinforced, non-fibrous surface to lend strength for handling and cutting. This reinforced surface is termed scrim. Both sides of the Thinsulate™ are embossed with a pattern.
Thinsulate™ is very lightweight, flexible, and easily cut. It is nominally 44 mm (2 in) thick but in NASA’s use it has been compressed to 25 mm (1 in) and two layers are used, covered and contained within Nomex® fabric. The thin layer of scrim is peeled off, or removed, as shown in Figure 9, because its removal was demonstrated to improve the performance in flammability tests. The Thinsulate™ may be purchased without the scrim layer, but this would require the manufacturer to establish a new part number. The 44 mm layer mass-per-unit-area is 617 g/m2 (2.02 oz/ft2). Without the scrim the mass-per-unit-area is about 600 g/m2 (1.96 oz/ft2).
Figure 9. Thinsulate™, with right figure showing scrim separated.
Sound absorption coefficient measurements were performed in accordance with the ASTM C-423 Standard [4].

NASA/SP-2015-624 – ACOUSTICS AND NOISE CONTROL IN SPACE CREW COMPARTMENTS – Goodman & Grosveld
Chapter VII - 14
2.2.2.3 Durette® felt – Durette® felt F400-11 is a Nomex® batting that is used in duct lining, pipe lagging, and as a spacer layer in multi-layer layup applications, as can be seen in the photographs in Section 3.3 on Multi-layers Barriers. This felt is normally stitched into multi-layer layups. Durette® can be conformed to fit in and around many desired applications. This type of Durette® felt is shown in Figure 10.
Figure 10. F400-11 Durette® felt.
2.2.2.6 Foam Absorption – The octave band absorption coefficients for several flight approved acoustic foam materials are listed in Table 3.
Table 3. Manufacturer absorption coefficients of several flight-approved acoustic absorption materials.
Flight approved material
Density [kg/m3]
Thickness [mm]
Octave band center frequency [Hz]
125 250 500 1000 2000 4000
Absorption Coefficient [sabins/m2]
SOLIMIDE® (HT340) 6.4 25 0.08 0.22 0.58 0.93 0.85 0.81
SOLIMIDE® (HT340) 50 0.34 0.52 0.86 1.06 0.94 0.94
SOLIMIDE® (TA-301) 6.41 25 0.07 0.18 0.61 1.03 0.90 0.93
SOLIMIDE® (TA-301) 50 0.27 0.59 1.14 1.10 1.02 1.02
Melamine (resin) 8.5-11 30 0.06 0.09 0.25 0.56 0.80 0.95
Melamine (resin) 50 0.08 0.20 0.55 0.9 1.00 0.92
Melamine (wedge) 50.8 0.03 0.31 0.81 1.02 1.01 0.96
Melamine (wedge) 76.2 0.13 0.74 1.26 1.18 1.12 1.03
Melamine (wedge) 11 6 0.10 0.12 0.27 0.50 0.68 0.81
Melamine (wedge) 11 19 0.10 0.15 0.40 0.66 0.80 0.90
Melamine (wedge) 11 25 0.08 0.31 0.65 0.82 0.95 0.99
Melamine (wedge) 11 37 0.19 0.36 0.76 0.99 1.00 1.00
Melamine (wedge) 11 25.4 0.10 0.10 0.30 0.70 0.80 0.90
Melamine (wedge) 11 50.8 0.10 0.35 0.90 1.25 1.15 1.10
Melamine (wedge) 11 76.2 0.10 0.60 1.20 1.35 1.10 1.05
Thinsulate™ 11.7 10 0.06 0.08 0.20 0.52
Thinsulate™ 18.2 19 0.13 0.42 0.90 0.95

ACOUSTIC SPACEFLIGHT MATERIALS - Goodman & Hill
Chapter VII - 15
2.3 Feltmetal™ Materials
2.3.1 Feltmetal™ with Absorbent Materials
Feltmetal™ has been extensively used in ISS mufflers, usually combined with Kevlar® or foam materials, with the Feltmetal™ on the inside adjacent to the airflow. Feltmetal™ FM127 and FM190 were evaluated for use in Spacelab, with FM190 selected [5]. The ISS Inter Module Ventilation (IMV) football type mufflers are used in the U.S. Lab and Node 2 Module. European Modules use FM1812 with melamine foam behind the Feltmetal™. These mufflers were especially designed by subcontract to AcousticFab, LLC (now Tailwind Technologies, Inc.). Figure 11 shows the Feltmetal™ in the IMV muffler. An IMV jumper duct is used when there is not a football muffler downstream of the IMV fan. It uses FM1812 with a SOLIMIDE® foam liner. The European modules use Kevlar® behind the Feltmetal™ (see Section 3.2.1 and Figure 9 in Chapter II, Noise Control for ISS muffler information). NASA evaluated six different types in 2006. The various materials tested are shown in Figure 12. AcousticFab, LLC, the company that provided Feltmetal™ mufflers such as described in Section 3.2.1, Chapter II, Noise Control to Boeing for use in ISS, U.S. Lab and other modules, developed a new material section assembly with an Feltmetal™ cover over fiberglass. It was advertised under Hartzell Aerospace with AcousticFab, LLC Noise Control Products providing this material as an Acousti-Flo® product. This material has been tested and is being evaluated at JSC for acoustic benefits and possible applications.
Figure 11. Feltmetal™ used in IMV muffler.
Figure 12. Feltmetal™ tested at JSC.

NASA/SP-2015-624 – ACOUSTICS AND NOISE CONTROL IN SPACE CREW COMPARTMENTS – Goodman & Grosveld
Chapter VII - 16
Figure 13 shows a section of this material cut for absorption tube testing. Figure 14 shows the Acousti-Flo® Feltmetal™ magnified.
Figure 13. Acousti-Flo® material, Feltmetal™ side in left view.
Figure 14. Acousti-Flo® Feltmetal™ side magnified.
3. BARRIERS
3.1 BISCO® HT-200
Barium impregnated silicon oxide (BISCO®) HT-200 is a mass barrier that is used to block sound waves. BISCO® HT-200 is provided in various densities and is generally used to target blockage of lower frequencies (Figure 15). BISCO® HT-200 can be used in conjunction with foams to achieve optimal performance. BISCO® was widely used as a barrier wrap for ducts; as a cover for Inter Module Ventilation (IMV) fans and payload noise sources such as the MELFI (freezer) payload rack noise source; as a barrier in a Russian pump enclosure; as a wrap for payload vacuum ducting; and as part of numerous types of multi-layer layups. BISCO® comes in densities of 1.22 to 7.32 kg/m2 or 0.25 to 1.5 lb/ft2 (pound-per-square-foot [psf]). BISCO® is very flexible in 0.25 psf densities, and thus is an excellent material to wrap around ducts or other contours. BISCO® also comes with a fiberglass backing, which increases stiffness for freestanding or gap-bridging applications (Figure 16). The fiberglass-backed version is difficult to cut and handle because of skin irritation caused by fiberglass and can also be the source of

ACOUSTIC SPACEFLIGHT MATERIALS - Goodman & Hill
Chapter VII - 17
eye irritation. When fiberglass was used, it had to be covered with adhesive tape for containment, but this was problematic because fiberglass residue could not be prevented, thereby causing irritation and making handling difficult. However, the ISS IMV uses the fiberglass BISCO® with the fiberglass side facing the fan case, so it has been used in limited flight applications. In addition, BISCO® also comes with two different types of pressure-sensitive adhesives: an acrylic (HT-200) and a silicone option (see Figure 16 for one of these adhesive backings). Both types of BISCO® had high offgassing test results for the Space Shuttle crew cabin use, and had very tight limits on allowable weight (0.59 kg or 1.3 lb for acrylic and 0.91 kg or 2.0 lb for silicone). This brings up the importance of finding out the limitations of the amount of material that can be used in an application, the total that can be used in a space crew compartment and why this is important to work out with the materials representative.
Figure 15. BISCO® HT-200 samples 0.25 psf on left and 1.5 psf on right.
Figure 16. BISCO® (0.25psf) with fiberglass backing on the left and, on the right, BISCO® backed by pressure-sensitive adhesive with release paper layer open.
In lieu of the pre-applied pressure-sensitive adhesive (PSA), an adhesive film similar to
3M® 950 or 966 may be used instead, if necessary, to increase the thickness or improve adherence. Hook-and-loop fasteners may also be attached onto BISCO® surfaces by following appropriate surface preparation and bonding procedures. As a specific example, it was found that by using silicone primer SS4004 with a two-part silicone adhesive RTV 577 (both products from GE Silicones, now Momentive) an acceptable and durable adhesion of Nylon or Nomex® VELCRO® may be achieved.
BISCO® Manufacturers sound transmission loss measurement data are tabulated in Table 4.

NASA/SP-2015-624 – ACOUSTICS AND NOISE CONTROL IN SPACE CREW COMPARTMENTS – Goodman & Grosveld
Chapter VII - 18
Table 4. Sound Transmission Loss Test Data for BISCO® HT-200.
Surface Density
[kg/m2] Frequency [Hz]
100 125 160 200 250 315 400 500 630 800 1000 1250 1600 2000 2500 3150 4000 5000
Sound Transmission Loss [dB]
1.22 8 7 7 8 8 8 10 11 13 14 16 17 19 21 22 23 25 27
2.44 15 12 12 12 14 13 15 16 19 21 22 24 26 27 29 31 31 32
3.66 16 14 13 15 17 18 19 20 22 24 25 27 29 30 32 34 36 37
4.88 19 14 17 16 19 19 20 22 24 26 28 30 32 33 34 36 38 40
7.32 20 15 18 19 21 20 23 24 26 28 30 33 34 36 38 40 41 43
3.2 Non-Reinforced Barrier
Non-reinforced barrier (BNR) material is another barrier material used in noise control containment designs. This material is much stiffer than BISCO® wrap and is not recommended where flexibility is a desirable property. BNR samples are depicted in Figure 17.
Figure 17. BNR material samples.
A 4.88 kg/m2 (1.0 psf) thick layer of BNR barrier (United Process, Inc.) used in addition to BISCO® barrier on the Russian Depress Pump enclosure at physical pass-throughs of penetrations such as pump tubing.
A KNB-5LR lead vinyl barrier was used in the Space Shuttle to cover openings in the mid-deck floor, as discussed in Section 4.2 and Figure 28 in Chapter IV on Acoustics and Noise Control in the Space Shuttle Orbiter. It was flexible, but had to be covered with glass/Teflon® material to make it acceptable from a materials standpoint.
3.3 Multi-layer Barriers
Multi-layer barriers offer a very promising way to implement blockage of sound emanating from sources. Included here are techniques primarily used by the U.S. side for noise control. The European Space Agency (ESA), with Italians taking the lead, developed a range of multi-layer barrier assemblies that are very efficient and suit their varying module noise control needs. Refer to Section 3.2.6, Chapter II, Noise Control for photos and results of these efforts.

ACOUSTIC SPACEFLIGHT MATERIALS - Goodman & Hill
Chapter VII - 19
The multi-layer barrier layup used in the first type of U.S. ISS sleep station is sketched in Figure 18. An exterior barrier and an interior barrier were used on each side of the sleep station honeycomb wall structure. The exterior barrier (on the side facing the interior of the module) was there to minimize noise coming into the sleep station from the interior of the module and was laid up, as follows, starting from the inside surface: white HT-90-40 Nomex®; 1.22 kg/m2 (0.25 psf) BISCO® barrier; F400-11 Durette® felt; 1.22 kg/m2 (0.25 psf) BISCO® barrier; and HT-90-40 white or 60650 ROY royal blue Nomex®, depending on location (Figure 18). The interior barrier layup was primarily to provide crew comfort and preclude reverberating impact noise caused by crew contact with hard surfaces inside the sleep station. The layup is quilted to ensure that the layers are held together in a thin section and do not billow. It was made up of HT-90-40 white Nomex®; two layers of F400-11 Durette® felt; and HT-90-40 white Nomex®. The blue Nomex® was 60650 ROY fabric. Porosity/permeability testing reported in Section 5 shows that the HT-90-40 is tightly woven, and performs better as a barrier than most available fabrics.
Figure 18. A multilayer barrier layup.
The originally proposed layup, shown in Figure 19, offered more attenuation by using two layers of 1.22 kg/m2 (0.25 psf) BISCO® barrier.
A later Crew Quarters (CQ) sleep station used a similar layup, but with Kevlar® felt and white GORE-TEX® fabric [6], as shown in Figure 20. In developing this design, NASA evaluated air permeability or porosity of various fabrics. HT-90-40 was found to have the lowest air permeability. However, the desire to have soil-resistant, easily cleanable, and stain-proof materials on interior and exterior surfaces of the quarters led to selection of the white GORE-TEX® fabric for the outer layer.
The ISS IMV fan has a multi-layer layup of 1.22 kg/m2 (0.25 psf) fiberglass BISCO® next to the fan case, with fiberglass facing the fan case, then a layer of felt, followed by a layer of fiberglass, and finally an outer layer of 1.22 kg/m2 (0.25 psf) BISCO® material.
BISCO® BISCO®
Felt Nomex® Nomex® Nomex® | Nomex® Foam
2-Felts or
ACOUSTIC BARRIER External of CQ
0.65 lb/SF
ACOUSTIC BARRIER External of CQ
0.25 lb/SF STRUCTURAL PANEL
(HONEYCOMB)
Total Acoustic Barrier Thickness = 0.35”
Acoustic Barrier Attenuation = 20 – 30 dB
Total Acoustic Barrier Thickness = 0.5”

NASA/SP-2015-624 – ACOUSTICS AND NOISE CONTROL IN SPACE CREW COMPARTMENTS – Goodman & Grosveld
Chapter VII - 20
Figure 19. Type of multilayer blanket originally proposed for the ISS sleep station (TeSS).
Figure 20. Interior (left) and exterior (right) acoustic multi-layer blanket material layers.
Another multi-layer application that is barrier related, but also serves as an absorber, was the Russian Depress Pump multi-layer enclosure, discussed in Section 5 on fabrics. The enclosure from inside to outside consisted of the following makeup: (1) sage green Nomex® fabric; (2) 25.4-mm (1-in) thick HT-340 SOLIMIDE®; (3) 3.67 kg/m2 (0.75 psf) BISCO® barrier; and (4) FDI-307 Nomex®. The permeable sage green fabric with SOLIMIDE® facing the BISCO® barrier provided good absorption of pump-generated noise, and the BISCO® with FDI-307 fabric provided a barrier to block any noise not absorbed and transmitted outward.
Section 3.2.6, Chapter II, Noise Control presents other multi-layer barrier approaches used in various ISS applications.
Finished Acoustic Panel
Nomex® BISCO® Felt BISCO® Nomex®

ACOUSTIC SPACEFLIGHT MATERIALS - Goodman & Hill
Chapter VII - 21
4. VIBRATION ISOLATION AND DAMPING
4.1 Strip-N-Stick®
Strip-N-Stick® is a silicone sponge tape that is used to provide gasketing and vibration isolation. Strip-N-Stick® is available with adhesive backing. A Strip-N-Stick® sample is depicted in Figure 21. This material was used in various applications, including as an isolation pad for Shuttle dreamtime television cooling fans. (Section 3.2.4 and Figure 37 in Chapter II, Noise Control).
Figure 21. Strip-N-Stick® sample.
4.2 Damping Foil
Damping foil composite is designed to reduce resonance vibration in sheet metal and other radiating surfaces. A somewhat wrinkled 3M® 2552 Damping Foil composite sheet and a roll form sample are depicted in Figure 22. The damping foil is constructed from lightweight aluminum bonded to a viscoelastic and pressure-sensitive adhesive backing. Spacelab used 1-mm-thick REVAC DD 2010 material. Soundcoat GP2 is thought to be another damping material used in the Spacelab (Section 3.2.4 and Figure 42 in Chapter II, Noise Control).
Figure 22. 3M® Damping Foil 2552 samples.

NASA/SP-2015-624 – ACOUSTICS AND NOISE CONTROL IN SPACE CREW COMPARTMENTS – Goodman & Grosveld
Chapter VII - 22
4.3 ISODAMP®
ISODAMP® C-3201-25ALPSA is another material used in the ISS U.S. Laboratory to dampen vibrations of a rack door that contains a pump (Section 3.2.4 and Figure 34 in Chapter II, Noise Control) [7]. ALPSA stands for aluminum constraining layer and pressure-sensitive adhesive. The number “25” in the material name stands for 0.25 in (6.35 mm) thick. An ISODAMP® C-1002-06 or C-1002-12 visco-elastic damping material was used in a prototype Russian Functional Cargo Block muffler, to dampen structural vibrations and minimize acoustic radiation. Note that this material was approved for ground testing, since it was sandwiched between solid materials. Visco elastic tape applications were also considered, if needed to further dampen structural-borne sound.
4.4 COHRlastic®
COHRlastic®is a flexible silicone, closed-cell sponge that is designed and used for vibration isolation mounting. It comes in both a soft and a medium-soft variety. The soft COHRlastic® type material is red in color, as shown in the left photograph of Figure 23. The stiffer medium COHRlastic® material is brown, and is shown in Figure 23 (right photograph) and in Figure 38 of Chapter II, Noise Control. Both types have a tough top and bottom skin surface (Figure 23).
Isolator pad
Figure 23. COHRlastic® samples, soft on left, medium-soft on right, under a Russian fan.
4.5 BISCO® HT-800®
BISCO® HT-800 is a medium soft cellular silicone material that can be used as an isolator pad or seal. It comes in black, gray, or red colors, and in thicknesses from 0.8 mm (1/32 in) to 12.7 mm (1/2 in). Its top and bottom surfaces are soft – not tough like COHRlastic® material. The black and red BISCO® HT-800® pads are shown in Figure 24.
4.6 Armaflex
Armaflex is a flexible, elastomeric, thermal, closed-cell insulation. It was used as a vibration isolator in the ISS for soft mounting of the ATV cabin fan. The insulation was compressed until it was released on-orbit by crew action. (Section 3.2.4 and Figure 33 in Chapter II, Noise Control).
Isolator pad

ACOUSTIC SPACEFLIGHT MATERIALS - Goodman & Hill
Chapter VII - 23
Figure 24. Black and red BISCO® HT-800® pads.
5. ACOUSTIC FABRICS
Fabrics are used for containment of absorbent materials and as a lightweight barrier when minimal transmission benefits are required. Three primary factors need to be addressed for containment uses, aside from meeting typical materials flammability and outgassing requirements, cost, wear properties, availability, etc. Factors include the following:
1) Ability to retain or encapsulate any particles that come from shedding of the absorbent material to be encapsulated. To evaluate this, candidate fabric materials were formed into pouches, and SOLIMIDE® and other particulate-forming foams were installed within the pouch. The assembly was then physically manipulated to see whether the fabric allowed particulate to be transmitted through.
2) Fabric should be sufficiently porous or permeable, with an open enough weave to let acoustic waves penetrate through the material. Permeability testing was performed on a number of Nomex® and other non-flammable fabrics to help determine the optimum fabrics for covering absorbent materials to make acoustic blankets [8]. Two methods were used to determine permeability: “Permeability to Air: Cloth; Falling Cylinder Method” in FED 5452 [9] and the “Standard Test Method for Air Permeability of Textile Fabric” in ASTM D737 [10]. Results of JSC testing are listed in Table 5. The HT-90-40 Nomex® was found to be the most resistant to permeability of the fabrics tested, with the F400-6 Durette® the least resistant. The first consideration of fabric permeability in enclosures by the JSC Acoustics Office was made in an enclosure for quieting the Russian Depress Pump used in the ISS Airlock Module. A sage green fabric that had both good permeability and particulate containment was used on the inside of the enclosure, close to the noise source, covering SOLIMIDE® foam. This fabric was the first found with good permeability and particulate retention, was acceptable from a materials standpoint, and was available at JSC for immediate use. A FDI-307 dark blue Nomex® was used on the outside of this enclosure, since this fabric was heavier and had less permeability, thereby serving more as a barrier. Figure 25 shows the fabrics used in this installation. Using a tighter weave and a more barrier-like fabric helps block acoustic waves that pass through the absorbent material, and reflects the waves back into the absorbing material. Note that the FDI fabric was used in some areas of the inner sage green Nomex® layer to block emissions where noise generating pump tubing passed through both the inner and outer layers

NASA/SP-2015-624 – ACOUSTICS AND NOISE CONTROL IN SPACE CREW COMPARTMENTS – Goodman & Grosveld
Chapter VII - 24
3) The weight and permeability of the fabric affects its ability to block flames getting to the material it covers. Nomex® HT90-40 is the fabric material most often used to encase materials such as sound absorbing foams or other materials. Historically, Nomex® fabrics in a single layer have about a fifty-fifty chance of failing the upward flame propagation test in 30% oxygen [11]. Double layers of fabric or the heavier-weight Nomex® fabrics, in general, are much more likely to pass. The mass of the fabric can be affected by the stock thread denier and weave. Larger denier and tighter weave result in a higher mass-per-unit-area. Figure 26 shows three of the fabrics that were used in acoustic applications to illustrate the tightness of their weaves. The bottom line is that both the fabric and the absorbing material configuration together affect the flammability, and some configuration flammability tests may show one fabric layer to be acceptable with a certain absorbing material, but not be acceptable for use with another material.
Table 5. Permeability of acoustic fabrics.
AML ID No. Type Fed. 5452 (s/300cc/0.1in2)
ASTM D737 (cm3/cm2/s)
S04034-A1 Sage Green Nomex® P.J.C. 5/200 2.2 113.5
S04034-A2 60650 Nomex® Royal Blue 9.7 15.9
S04034-A3 HT6-42 Natural Nomex® 1.6 190.5
S04034-A4 Nomex® FDI-307 FR Treated 33.9 3.60
S04034-A5 HT90-40 Natural Nomex® 76.8 0.849
S04034-A6 HT25-45 2.5 104.0
S04034-A7 HT5-41, Natural Nomex® 2.8 96.35
S04034-A8 HT29-42, Natural Nomex® 15.4 16.0
S04034-A9 HT92, Natural Nomex® 1.7 172.5
S04034-A10 HT-318-53 FR Treated 1.6 189.5
S04034-A11 Beige Trilok 0.4 677.5
S04034-A12 Kelvar® Felt Style TRNP 90-14.00 (Nat'l Nowovens) 4.4 35.3
S04034-A13 Durette® Batting, USA P/N 528-41650-1 4.0 52.9
S04034-A14 Durette® F400-11 3.4 57.3
S04034-A15 F400-6 Durette® Fabric, Gold Plain Weave (Fire Safety Products) 1.5 182.0
S04034-A16 FOI 307 40.4 3.1
S04034-A17 Felt Aramid Nomex® Beta Natural 8.9 22.4
S04034-A18 ST 11391-01 Teflon® Fabric 64.5 2.8
S04034-A19 Royal Blue Nomex® 11.7 14.2
S04034-A20 332 Face Cloth W/FR (Southern Mills) 1.9 133.5
Table Notes: The sage green Nomex® fabric was locally available at JSC only. The Trilok is a plastic separation layer material used in space suits, not a fabric. It is very open weave (netting-like) material.
Several of the Nomex® fabrics are acceptable, depending upon their use. Durette® 400-6 fabric is a gold-colored material that is very open weave/porous, but good in retaining particulate. This fabric is shown in Figure 27. It is now frequently used by JSC and recommended for containment where its porosity helps ensure maximum efficiency of the absorbent material. When used with Thinsulate™ AU 6020-6, two layers of the fabric were required because of materials flammability. When used with Kevlar® material, only one layer of Durette® 400-6 was required. This determination for Kevlar® and Thinsulate™ was the result of specific flammability configuration tests on these materials.

ACOUSTIC SPACEFLIGHT MATERIALS - Goodman & Hill
Chapter VII - 25
Interior layer, Sage Green Nomex Exterior layer, FDI-307 Nomex
Folded into container Russian depress Pump Installed
Figure 25. Russian Depress Pump enclosure. Note that the color of the inside fabric is sage green, which does not show very well in the left-hand photographs.
Figure 26. Nomex® used from left, HT90-40, 60650 ROY, and FDI-307.
Figure 27. Durette® 400-6 Nomex® sample.

NASA/SP-2015-624 – ACOUSTICS AND NOISE CONTROL IN SPACE CREW COMPARTMENTS – Goodman & Grosveld
Chapter VII - 26
5.1 HT90-40 Nomex®
This fabric is a white-colored, very closed weave Nomex® (Figure 28) that is extensively used for containment of foams, as a barrier where open weave, and more permeable properties for maximum absorption are not required. In fact, this fabric was found to have the least permeability of a number of fabrics tested. Its surface mass is 0.203 kg/m2 (6.0 oz/yard2). HT90-40 Nomex® was used on the inside and outside surfaces of the U.S. ISS sleep stations and CQ (see Section 3.2.6 in Chapter II, Noise Control).
Figure 28. HT90-40 Nomex® sample.
5.2 60650 ROY Nomex®
This fabric is a royal blue tighter weaved Nomex® that is widely used for containment of foams where open weave properties are not required for maximum absorption (Figure 29).
Figure 29. 60650 ROY, royal blue Nomex® (color appears to vary depending upon angle of view).
5.3 FDI 307 Dark Blue Nomex®
This material is a good, tight-weaved Nomex® that was used for the outer enclosure to contain the Russian Depress Pump. One disadvantage with its use is the need to have the Nomex®, provided by Fabric Development, Inc., treated with fire and water retardant solutions, which adds expense, and limits its availability and use. Figure 30 shows a photograph of this fabric and Figure 25 includes views of it used on the Russian Depress Pump application discussed above.

ACOUSTIC SPACEFLIGHT MATERIALS - Goodman & Hill
Chapter VII - 27
Figure 30. FDI 307 Nomex® sample.
5.4 GORE-TEX®
GORE-TEX® fabric was used in the interior and exterior of the CQ on the ISS because the fabric was much more resistant to staining than Nomex® fabrics, as discussed previously [6]. GORE-TEX® is a tough fabric used in the outer layers of space suits to protect from micrometeoroid penetration. GORE-TEX® fabric utilizes a porous polytetrafluoroethylene (PTFE) fiber that sheds dirt and is more easily cleaned than other non-flammable fabrics. In support of CQ design activities, permeability testing was performed on two types of GORE-TEX® fabric to compare it with Nomex HT-90-40 and other fabrics, using the same ASTM D737 test method as discussed earlier [12]. HT-90-40 was by far the least permeable.
5.5 Beta Cloth
Beta cloth is Teflon®-coated fiberglass. In the Japanese Centrifuge Accommodations Module (CAM) development, use of Beta cloth closeouts were proposed around the sides of the Centrifuge Rotor (CR), in lieu of hard closeouts, to block noise from coming from the back and sides of the CR. NASA advised that these curtains, as a single layer of cloth, were considered insufficient to block the expected radiation. The CAM program was cancelled before this could be resolved/tested.
6. ACOUSTIC MATERIAL SUPPORT
6.1 Coroplast®
Coroplast® is a corrugated polypropylene sheet that can be used as a lightweight, rigid structure, divider, or panel to help isolate noise sources, to attach barrier materials to, or be the structure used to make mufflers. Coroplast® is used by the U.S. Postal Service for containers and is frequently used in signs for political campaigns or home sales. It is highly flammable and

NASA/SP-2015-624 – ACOUSTICS AND NOISE CONTROL IN SPACE CREW COMPARTMENTS – Goodman & Grosveld
Chapter VII - 28
must be completely covered with a protective containment material such aluminum tape on all exposed surfaces to be acceptable in configurations for flammability. A Coroplast® sample is depicted in Figure 31. Coroplast® can be cut on one edge, with one side folded down to make a right angle, as shown in Figure 32. BISCO® with PSA may be applied to it to improve its sound barrier features.
Figure 31. Coroplast® material samples.
Figure 32. Coroplast® cut and bent at right angles and used with BISCO® PSA to add barrier features.
6.2 Nomex® Pressboard
T993 Nomex® pressboard was used to hold the muffling foam and attachment provisions for the exhaust outlet mufflers onto the Space Shuttle three tier sleep station, as described in Figure 41, Section 4.3, Chapter IV, Acoustics and Noise Control in the Space Shuttle Orbiter.
6.3 Armalon
Armalon is a semi-rigid sheet material that is constructed of fiberglass reinforced with polytetrafluoroethylene (PTFE). Armalon’s reinforcement material PTFE is well known under the name Teflon® by DuPont™ (Figure 33). It was used on the foldable crew couches in Apollo as the material for the backpan, the seatpan, and the legpan, and in a Shuttle payload bay as the container and divider material for EVA tools and cushions. It can be stitched with thread and can be used as a structural divider. It is used extensively as a stiffener for various crew equipment bays and soft goods hardware used in the ISS.

ACOUSTIC SPACEFLIGHT MATERIALS - Goodman & Hill
Chapter VII - 29
Figure 33. Armalon sheet.
6.4 Foam Core
Foam core is a very cheap and readily available material for prototyping of muffler designs. It is easy to cut and join with tape or adhesive. When NASA was working on a new muffler design for the Express Rack, the agency built a foam core muffler to demonstrate the proof-of-concept of the muffler design (Figure 34). A much more expensive metal model of this muffler was tested and had similar benefits as the foam core version.
Figure 34. Foam core muffler prototype.
6.5 Kapton® Tape
Kapton® tape has been very useful in acoustic applications. It is one tape that bonds well with BISCO® HT-90 barrier. Figure 35 shows rolls of this tape material.
Figure 35. Kapton® (Polyimide) Tape.

NASA/SP-2015-624 – ACOUSTICS AND NOISE CONTROL IN SPACE CREW COMPARTMENTS – Goodman & Grosveld
Chapter VII - 30
6.6 Aluminum Tape
Aluminum tape is frequently used to cover materials such as Coroplast®, which is flammable, to make the material acceptable for exposure in the cabin. 3M® 425, a 0.127 mm (0.005 in or 5 mil)-thick dead soft aluminum with acrylic adhesive backing, is one type of tape that is frequently used. Other types of aluminum tape are also available.
7. MATERIALS CONTROL
The materials control function of human spaceflight design and development has evolved to include all areas of performance and durability as well as the traditional safety and structural integrity aspects of materials selection. Materials and process requirement documents are implemented by materials control plans that specify standard test methods and documentation procedures intended to result in an acceptable and consistent package of verification data. Drawing level materials and manufacturing process details are often summarized in a Materials Identification and Usage List (MIUL) for critical or complex hardware, and/or may be reviewed and documented by memorandum as a Materials Analysis Summary Report (Certification Memo). It is important that hardware design projects include and consult with materials engineering early and often during the development process to enable optimum materials selection, and ensure the materials selected and their configurations are acceptable. This Chapter outlines the primary considerations for selection of acoustic materials in habitable spacecraft with respect to the existing requirements, test methods, and implementation plans, while providing specific examples.
Design projects should involve a materials engineer within their organization to consider the materials of construction and acceptability of the configuration relative to all applicable requirements. Any potential issues or need for materials usage agreements (MUAs) should be reviewed with a materials engineer representing the applicable certifying agency (in essence NASA, ESA, or the Japan Aerospace Exploration Agency).
7.1 Requirements Overview
Materials control requirements are intended to provide a means to ensure appropriate safe usage of materials in spaceflight hardware design and a systematic process for approval or certification of those designs for flight. A description of currently applicable requirements documents with a historical perspective is provided in Section 7.2 and Appendix B. A summary of the technical areas most applicable to acoustic materials is provided in this overview.
7.1.1 Flammability
Materials used in atmospheres containing oxygen must be tested for flammability to show self-extinguishing characteristics. The vertical flame propagation test per NASA-STD-6001, (Test 1) [13] is performed in the worst-case expected atmosphere, which is generally the highest oxygen concentration and pressure within the tolerance bounds of the control systems nominal operation. Most testing through the Space Shuttle Program and ISS Program was

ACOUSTIC SPACEFLIGHT MATERIALS - Goodman & Hill
Chapter VII - 31
performed at 10.2 pounds-per-square-inch-absolute (psia) and 30% oxygen because this was the upper control bound for EVA pre-breathe activity. If materials did not pass in that atmosphere and were only destined for ISS use, then a 14.7 psia and 24.1% oxygen test was used to verify acceptability for certification in ISS locations. Table 6 lists the test conditions for many previously used cases. Recently, a need for higher oxygen concentrations to enable rapid EVA by reducing pre-breathe time has driven the worst-case conditions to 8.2 psia at 34% oxygen for some exploration mission vehicles in the early planning stages [14].
Table 6. Maximum oxygen concentrations and pressures for NASA manned spacecraft [8].
Vehicle Maximum Oxygen Concentration (percent)
Cabin Pressure at Maximum Oxygen (psia)
Space Shuttle Orbiter Cabin1 30 10.2
Space Shuttle Orbiter 20.9 14.7
Payload Bay2 30 10.2
Spacehab1,3 24.5 14.7
Spacelab 24.1 14.5
Space Station Internal 30 10.2
Space Station Airlock4 20.9 14.7
Space Station External2 30 10.2
1 Maximum oxygen concentration is 25.9% at 14.5 psia during normal operations and 30% at 10.2 psia during preparation for EVA 2 Ground environment prior to launch 3 Current flight rules prohibit Spacehab operation during EVA preparation, so certification for 25.9% oxygen at 14.5 psia may be acceptable 4 Maximum oxygen concentration is 24.1% at 14.5 psia during normal operations and 30% at 10.2 psia during preparation for EVA
In the case of soft goods or fabrics with no-edge exposure in the hardware design, a “J-configuration specimen” is the type used for ignitor impingement on the lower curved edge rather than a cut edge of the specimen. The criteria for acceptance without limitations (or an “A” rating) are a burn length of less than 6 inches with no drip burning. Please refer to the test standard for all details and the MAPTIS for definitions of the rating criteria. It has been demonstrated that thickness has a significant effect on burn length for most polymer materials, so the minimum design thickness or less should be tested or referenced in all cases. Likewise, if the design thickness is more than that reported for available data, then the larger thickness may be considered acceptable without further testing. At margins between failing and passing thicknesses, testing may be recommended if it is considered likely that the material may pass. For instance, if MAPTIS data show that a material is acceptable at thicknesses greater than 2 mm, but flammable at thicknesses less than 1 mm, then it may be accepted in design thicknesses greater than 2 mm, rejected at less than 1 mm, and tested when proposed designs are between 1 and 2 mm. Figure 36 shows the needle-rake specimen mounting typically used for testing thin specimens. Figure 37 shows the J-configuration mounting.

NASA/SP-2015-624 – ACOUSTICS AND NOISE CONTROL IN SPACE CREW COMPARTMENTS – Goodman & Grosveld
Chapter VII - 32
Figure 36. Needle-rake mount for thin-film samples.
Figure 37. Typical J-configuration specimen for surface ignition of soft goods.
Several options exist for materials that do not meet the acceptance criteria, including design of acceptable configurations per JSC-29353 [15]. If the design may be shown acceptable in configuration, then the hardware item may be evaluated and accepted by a Category III MUA, which is documented at the hardware certification level. Other Category III level MUAs, often referred to as “push button” MUAs, include stowage rationale, usage time, and sandwiching between non-flammable materials. If no alternate non-flammable material can be identified or design mitigation employed, then a Category II MUA may be documented describing the non-conformance and rationale identifying the condition as non-hazardous or risk as acceptably low. The Category II MUA must be approved by the Materials and Processes (M&P) authority for the responsible regulatory agency such as a NASA center-level M&P Branch Chief. Category I MUAs are those that involve a materials/process usage that could affect the safety of the crew, vehicle, or mission, or affect the mission success, but must be used for functional reasons. Category I flight hardware MUAs shall be approved by the hardware manager, the M&P Branch Chief, and the applicable Program Office.

ACOUSTIC SPACEFLIGHT MATERIALS - Goodman & Hill
Chapter VII - 33
7.1.2 Flammability Configuration Analysis
The current guidelines in JSC-29353 “Flammability Configuration Analysis for Spacecraft Applications” [15] (formerly NHB22648) describe procedures to conduct flammability assessments that justify use of flammable materials as required by NSTS 1700.7B "Safety Policy and Requirements for Payloads Using the Space Transportation System" [16] and the NSTS 1700.7B ISS Supplement [17]. The set of guidelines may also be used to assess flammability hazards in flight hardware other than payloads. The document explains procedures and techniques that are considered by NASA to meet the intent of the safety requirements, but it does not preclude alternative approaches. The primary philosophy of the process is summarized in the logic diagram shown in Figure 38. Its inclusion here is not meant to preclude review of the entire document, but only to provide information. The primary philosophy is to determine by analysis or test that any flammable material is fully contained by non-flammable (barrier) materials with no propagation path. For analysis purposes, an ignition source is always assumed. Documentation of the flammability assessments may be included on a materials certification memo or approved as a separate document, depending upon the complexity of the hardware. It is recommended that a materials engineer with experience in performing the assessments be consulted when considering design options that include flammable materials “acceptable in configuration.”
Figure 38. Flammability assessment logic diagram [15].

NASA/SP-2015-624 – ACOUSTICS AND NOISE CONTROL IN SPACE CREW COMPARTMENTS – Goodman & Grosveld
Chapter VII - 34
7.1.3 Offgassing Toxicity
Offgassing toxicity requirements are prescribed by spaceflight toxicologists because the volume of air inside a spacecraft is usually fixed and must be maintained at a safe breathable condition by the Environmental Control and Life Support System (ECLSS). Materials selection criteria are utilized to keep levels of toxic contaminates below the levels that may be tolerated by crew and effectively removed by the ECLSS system. Materials requirements are designed to limit the quantity of toxic gas evolution from all materials within habitable volumes. M&P engineers are responsible for testing, documentation, and control of this requirement. The NASA-STD-6001 Test 7 [13] includes the testing of single materials or assembled items and calculates a unit-less “T-value”, which is the sum of the mass-per-unit-volume of each component evolved in 48 hours, weighted by the relative toxicity or the Spacecraft Maximum Allowable Concentration (SMAC) value. Since a lower SMAC value indicates a more toxic component, this is an inverse weighting. Test results are summarized with T-values, which must be less than 0.5 for a given quantity of material in a hardware item or for the item itself if tested as an assembly. In some rare cases, a Toxicological Assessment Memorandum may be prepared by a toxicologist, for individual items, to document acceptability when testing is not possible.
7.1.4 Outgassing/Thermal Vacuum Stability
Outgassing pertains only to materials that are exposed to vacuum or are external to a pressurized cabin/vehicle. To prevent confusion between offgassing and outgassing, it is helpful to think that “OUTgassing is only for materials OUTside.” Here, the contamination of spacecraft surfaces is the primary concern.
When a non-metallic material is exposed to vacuum, it initially will outgass at a relatively high rate for 24 to 48 hours, then it will exponentially decay to a much lower steady-state value. Materials that pass ASTM-E-595 [18], a basic screening test, with less than 1% total mass loss and less than 0.1% condensable matter in 48 hours at 250 °F (120 °C) may be used in small quantities without issue. Other materials or higher quantities require analytical modeling to determine the rate of contamination of sensitive surfaces such as solar arrays and radiators to prevent reduction of performance or age life. These models typically require ASTM-E-1559 [19] testing, which collects condensable matter at four temperatures using quartz crystal microbalances (QCMs) while the material is heated in an effluent cell for a period of 3 to 7 days. The QCMs may be heated post-test and the composition determined with a residual gas analyzer. The ISS or applicable vehicle contamination group, in addition to an organization M&P engineer, should be consulted any time questions arise about potential contamination. Acceptance rationale includes a small surface area, no line of sight to sensitive surfaces, inside a hermetically sealed container, and others. Since most of the materials discussed in this Chapter apply only to noise control materials used within crew compartments, this topic will not be discussed any further. However, outgassing performance would be of significant concern for materials used in external areas of vehicles to control noise or vibration during launch, for instance.

ACOUSTIC SPACEFLIGHT MATERIALS - Goodman & Hill
Chapter VII - 35
7.2 Requirements Documents
A brief description of the current and historical requirement documents for human spaceflight may be useful and is included in Appendix B at the end of this Chapter. A NASA-wide standard for materials and processes was first published as an interim document in 2006. New flight hardware and programs will be expected to comply with this new NASA-STD-6016 Standard Materials and Process Requirements for Spacecraft [20]. Previously, program-level documents governed materials usage, most notably, SSP30233 Space Station Requirements for Materials and Processes [21], SP-R-0006 Space Shuttle Program Requirements for Materials and Processes [22], and NSTS 1700.7B Safety Policy and Requirements for Payloads Using the Space Transportation System [16] (with ISS Addendum) [17].
These documents require agencies and their contractors to use approved materials control plans to describe individual details of implementation and documentation processes to verify that the requirements are met. The JSC-27301 Materials Control Plan for JSC Flight Hardware [23] would be expected to cover most government-furnished equipment and some contractor-furnished equipment for crewed spaceflight developed by or certified through JSC. Inter-center and inter-agency agreements recognize the validity of materials requirements or certifications approved by other entities, and may be accepted as verification that the standard requirements (or intent of such) are met.
7.3 Materials and Processes Technical Information System Database
MAPTIS is intended to be a single-point source for materials properties for NASA and NASA-associated contractors and organizations. MAPTIS contains physical, mechanical, and environmental properties for metallic and non-metallic materials. Complete details on the system may be obtained through the website address http://maptis.nasa.gov (Figure 39), which includes a link to request access.
Accounts are generally granted to anyone associated with NASA and ISS international partners as documented on the access application. The NASA Databases link and Materials Selection Database (or Database 2) lead to the most often utilized data for materials control. Clicking “non-metals” and “materials definitions” brings up a search window from which all available materials test data may be accessed. It is recommended that the user consult with an experienced M&P engineer who has used the system frequently in order to quickly master the best techniques to locate data and interpret test results. Screen shots of the two types of search windows are shown in Figure 40 and Figure 41.
A rating may be provided as shorthand summarizing specific results data within each category, such as flammability, toxicity, corrosion, etc. An “A” rating or better usually indicates a material is acceptable without limitations. The definitions of these short-hand ratings are found by clicking on any rating letter included in the results. The MAPTIS codes and rating letters, as well as any materials certification or acceptance memo, should always be documented in the MIUL.
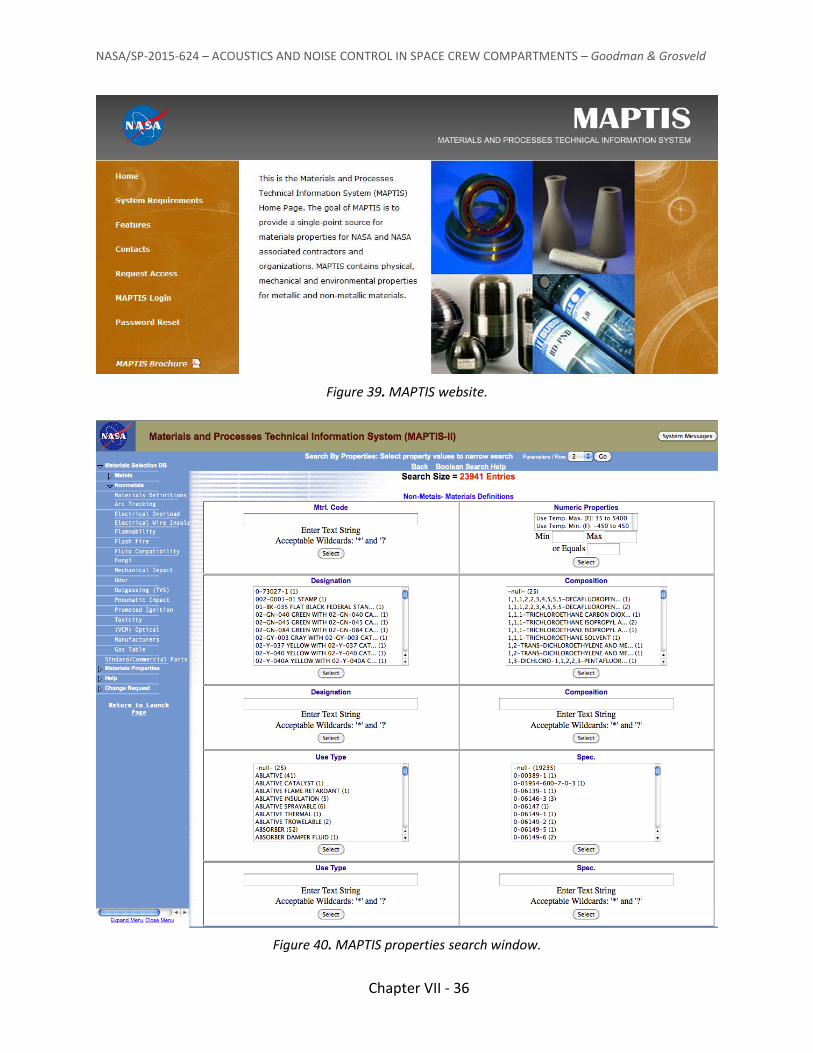
NASA/SP-2015-624 – ACOUSTICS AND NOISE CONTROL IN SPACE CREW COMPARTMENTS – Goodman & Grosveld
Chapter VII - 36
Figure 39. MAPTIS website.
Figure 40. MAPTIS properties search window.

ACOUSTIC SPACEFLIGHT MATERIALS - Goodman & Hill
Chapter VII - 37
Figure 41. MAPTIS material selection list search window.
The Materials Selection Database provides analyzed results of tests conducted on materials
in conformance with the Marshall Space Flight Center (MSFC)-HDBK-527/JSC-09604 documents [24] and the NASA-STD-6001 Test Specification [13]. This database is open to all registered users. The Materials Selection Database organizes results according to metallic and nonmetallic materials.
Metals – Metals data include analyzed results of tests relevant to corrosion, crack growth, creep rupture, flammability, fluid compatibility, fracture mechanics, frictional heat, high-cycle fatigue, low-cycle fatigue, mechanical impact, particle impact, pneumatic impact, promoted ignition, stress corrosion, and tensile strength. A list of manufacturers is also provided.
Nonmetals – Nonmetals data consist of test results submitted by NASA-approved test facilities. Contributors are as follows:
Materials Combustion Research Facility at MSFC – Arc Tracking, Electrical Overload, Electrical Wire Insulation, Flammability, Mechanical Impact, Vacuum Outgassing (Thermal Vacuum Stability [TVS]), Promoted Ignition, Heated Promoted Ignition,

NASA/SP-2015-624 – ACOUSTICS AND NOISE CONTROL IN SPACE CREW COMPARTMENTS – Goodman & Grosveld
Chapter VII - 38
Toxicity, Autogenous Ignition Temperature, Oxygen Index, and Heat of Combustion.
White Sands Test Facility – Configuration TVS, Electrical Wire Insulation, Flammability, Flash/Fire, Fluid Compatibility, Mechanical Impact, Odor, Outgassing (TVS), Pneumatic Impact, Promoted Ignition, Toxicity, Autogenous Ignition, Oxygen index, Heat of Combustion.
Kennedy Space Center – Flammability, Hypergol (future testing) Goddard Space Flight Center –TVS Commercial Test Facilities certified to ASTM E595 for TVS
8. CONCLUSIONS
Materials used in acoustics are very important in designing for effective noise control. Acoustic flight-certified materials were discussed based upon past experience. It is recommended that technology be kept up with, as improved materials are being developed and existing materials upgraded. Any hardware project engineer requiring material for noise control may use this list. It is recommended that materials experts be consulted to ensure the applications are acceptable from a materials compatibility standpoint.
9. REFERENCES
1. Pedley Michael D., Supkis, Daniel E. and Chang, Chia H., Acoustical Materials Development/Testing. 6 April 1992.
2. Goodman, J.R. Acoustic noise reduction/attenuation foam/materials, August 1996, which included acoustic materials information obtained in 1990’s believed to be from Pedley, Michael D., and/or Chang, Chia.
3. Kim, Y.S., Davis, R., Cain, A.A. and Grunlan J.C., Development of layer-by-layer assembled carbon nanofiber-filled coatings to reduce polyurethane foam flammability. Polymer 2011, 52, 2847.
4. ASTM C-423, Standard Test for Sound Absorption and Sound Absorption Coefficients by the Reverberation Room Method. 15 October 2009.
5. Eilers, D., Wyn-Roberts, D. and Borches, I.U., Audible Noise Control in Spacelab - As part of manned spacecraft environmental noise. Proceedings of Spacecraft Thermal and Environmental Control Systems Symposium, Munich, 10-12 October 1978 (ESA SP-119, November 1978).
6. Broyan, James L., Welsh, David A. and Cady, Scott M., International Space Station Crew Quarters Ventilation and Acoustic Design Implementation. AIAA 2011-5128, 41st International Conference on Environmental Systems, Portland, Oregon, 17-21 July 2011.
7. Denham, Sam, PPA Damping Material location on rack door. E-mail to J. Goodman, 5 March 2007.

ACOUSTIC SPACEFLIGHT MATERIALS - Goodman & Hill
Chapter VII - 39
8. Permeation Data. E-mail from Henry Tang to Jerry Goodman, 9 June 2005.
9. FED 5452, Permeability to Air: Cloth; Falling Cylinder Method.
10. ASTM D737, Standard Test Method for Air Permeability of Textile Fabric. 11 December 2004.
11. Sage Green Nomex® Covered Thinsulate™ Insulation. E-mail from Gary Peyton to Jerry Goodman, 5 May 2005.
12. Tang, Henry, E-mail enclosing permeation data, NASA_JSC CTSD Advanced Materials Laboratory, quick look test report, AML-07-02-R.doc, 2 July 2013.
13. NASA-STD-6001B, Flammability, Offgassing, and Compatibility Requirements and Test Procedures. Approved 26 August 2011.
14. JSC-63309, Recommendations for Exploration Spacecraft Internal Atmospheres, final report of the NASA Exploration Atmospheres Working Group, January 2006.
15. JSC-29353, Flammability Configuration Analysis for Spacecraft Applications. August 2002.
16. NSTS 1700.7B, Safety Policy and Requirements for Payloads Using the Space Transportation System. 13 January 1989.
17. NSTS-1700.7B, ISS Supplement. 13 January 1989.
18. ASTM-E-595-07, Standard Test Method for Total Mass Loss and Collected Volatile Condensable Materials from Outgassing in a Vacuum Environment. 1 December 2007.
19. ASTM-E-1559-09, Standard Test Method for Contamination Outgassing Characteristics of Spacecraft Materials. 1 April 2009.
20. NASA-STD-6016, Standard Materials and Process Requirements for Spacecraft. 11 July 2008.
21. SSP-30233, Space Station Requirements for Materials and Processes. Approved 15 November 2004.
22. SP-R-0006, Space Shuttle Program Requirements for Materials and Processes. Revision D, 4 August 1998.
23. JSC-27301, Materials Control Plan. July 2000.
24. MSFC-HDBK-527/JSC 09604, Materials Selection List for Space Hardware Systems. 29 December 1988.
10. ACRONYMS
AAA BISCO® BNR CAM CQ
Avionics Air Assembly Barium-impregnated silicon oxide Non-reinforced barrier Centrifuge Accommodations Module Crew Quarters

NASA/SP-2015-624 – ACOUSTICS AND NOISE CONTROL IN SPACE CREW COMPARTMENTS – Goodman & Grosveld
Chapter VII - 40
CR ECLSS ESA EVA IMU IMV ISS JSC M&P MAPTIS MELFI MIUL MSFC MUA PSA psia PTFE PVDF QCM SMAC TVS
Centrifuge Rotor Environmental Control and Life Support System European Space Agency Extravehicular activity Inertial Measurement Unit Inter Module Ventilation International Space Station Johnson Space Center Materials and Processes Materials and Processes Technical Information System Minus Eighty Degree Laboratory Freezer Materials Identification and Usage List Marshall Space Flight Center Materials usage agreement Pressure-sensitive adhesive Pounds per square inch absolute polytetrafluoroethylene polyvinylidene difluoride quartz crystal microbalance Spacecraft Maximum Allowable Concentration Thermal Vacuum Stability
APPENDIX A: SELECTED MATERIALS SOURCES AND MAPTIS NUMBERS
BISCO® Material: HT-200 Manufacturer: Rogers Corporation 1-800-237-2068 2300 E. Devon Avenue Elk Grove, Illinois 60007 One Technology Drive Rogers, CT 06263-0188 MAPTIS Number: 04131 Notes: Available in 0.25, 0.5, and 1.0 lb/ft2 densities. COHRlastic® Material: R10480 Medium Manufacturer: Saint Gobain Performance Plastics - 1-800-777-2647 407 East Street New Haven, Conn. 06511 MAPTIS Number: 05251

ACOUSTIC SPACEFLIGHT MATERIALS - Goodman & Hill
Chapter VII - 41
Durette® Material: F400-11 Source: Fire Safe Products 1- 800-444-4720 St. Louis Missouri 63114 MAPTIS Number: 06294 Melamine Material: Melamine Source: Illbruck 800-795-0134 MAPTIS Number: 00243 Nomex®, Blue Acoustic barrier materials Material: 60650 ROY MAPTIS Number: 04878 Nomex®, White Material: HT 90-40 Manufacturer: Stern and Stern industries 1-607-324-4485 188 Thatcher Street Hornell NY 14843 MAPTIS Number: 06362 Notes: White Nomex® is coated with Scotchguard. SCOTTFELT® 3-900 Scott Paper Company MAPTIS Number: 06277 Scissors for Cutting Kevlar® felt Kevlar® scissors are #14289 CLAUSS 2.5" cut 9" overall. (Must specify left or right handed) Notes: Used for cutting Kevlar® material Strip-N-Stick® Material: SNS 100S Manufacturer: Furon 1- 800-962-2666 14 McCaffrey Street Hoosick Falls, NY 12090 MAPTIS Number: 62352 Thinsulate™ Material: AU 6020-6-60 Source: 3M®, Thinsulate™ Acoustic Insulation-Technical service Center-314-721-1614 St. Paul, Mn 55144-1000 MAPTIS Number: 08176

NASA/SP-2015-624 – ACOUSTICS AND NOISE CONTROL IN SPACE CREW COMPARTMENTS – Goodman & Grosveld
Chapter VII - 42
APPENDIX B: MATERIALS DOCUMENTATION
B1. Requirements Documents
NASA-STD-6016, Standard Materials and Process Requirements for Spacecraft. 11 July 2008.
SSP-30233, Space Station Requirements for Materials and Processes. Approved 15 November 2004.
NSTS 1700.7B, Safety Policy and Requirements for Payloads Using the Space Transportation System. 13 January 1989.
SP-R-0006, Space Shuttle Program Requirements for Materials and Processes. Revision D, 4 August 1998.
B2. Control Plans
JSC-27301E, Materials and Processes Selection, Control, and Implementation Plan for JSC Flight Hardware, Approved: November 2005.
JSC-29353, Flammability Configuration Analysis for Spacecraft Applications. August 2002.
B3. Test Standards
NASA-STD-6001B, Flammability, Offgassing, and Compatibility Requirements and Test Procedures. Approved 26 August 2011.
ASTM-E-595-07, Standard Test Method for Total Mass Loss and Collected Volatile Condensable Materials from Outgassing in a Vacuum Environment. 1 December 2007.
ASTM-E-1559-09, Standard Test Method for Contamination Outgassing Characteristics of Spacecraft Materials. 01 April 2009.
B4. Marshall Space flight Center (MSFC) Contractor Plans
Prime and/or sub-contractors may prepare and submit for approval materials control plans in accordance with NASA-STD-6016 and specific contract requirements.
B5. Inter-Center and Inter-Agency Agreements
Materials and process requirements, control plans, and certification authority may also be delegated through an approved inter-center (between NASA Centers) or inter-agency (between ISS International Partners) agreement.

CHAPTER VIII
COMPENDIUM OF ACOUSTICS AND VIBRATION IN ENCLOSED VOLUMES
Ferdinand W. Grosveld
CONTENTS
1. INTRODUCTION ........................................................................................................................ 3
2. BASIC TERMINOLOGY AND METRICS ....................................................................................... 4
3. TYPES OF SOUND ...................................................................................................................... 8
4. MATHEMATICAL OPERATIONS ................................................................................................. 9
5. SOUND SOURCES .................................................................................................................... 11
6. SOUND RADIATION ................................................................................................................. 15
7. SOUND PROPAGATION ........................................................................................................... 15
8. SOUND IN ENCLOSED SPACES ................................................................................................ 17
9. SOUND ABSORPTION .............................................................................................................. 21
10. PANEL VIBRATION .................................................................................................................. 23
11. ACOUSTIC TRANSMISSION ..................................................................................................... 26
12. ACOUSTIC RESONATORS ........................................................................................................ 32
13. ACOUSTICS AND VIBRATION INSTRUMENTATION ................................................................. 33
14. FAST FOURIER TRANSFORM ANALYSIS ................................................................................... 34
15. NOISE EXPOSURE METRICS .................................................................................................... 36
16. SPEECH INTELLIGIBILITY RELATED TERMS .............................................................................. 38
17. STATISTICAL ENERGY ANALYSIS .............................................................................................. 41
18. OTHER VIBRO-ACOUSTIC SIMULATION AND ANALYSIS SOFTWARE SOLUTIONS .................. 44
19. REFERENCES ........................................................................................................................... 46
20. ACRONYMS ............................................................................................................................. 50
21. SYMBOLS (in order of appearance) ........................................................................................ 51

NASA/SP-2015-624 – ACOUSTICS AND NOISE CONTROL IN SPACE CREW COMPARTMENTS – Goodman & Grosveld
Chapter VIII - 2
TABLES
Table 1. Preferred octave (in bold) and one-third octave frequency bands. ................................. 5
Table 2. A- and C-weighting corrections for one-third octave bands 25 Hz – 20000 Hz. ............... 6
Table 3. Speed of sound in selected media. ................................................................................... 7
Table 4. Adding two in-phase and two incoherent sound pressure levels. ................................. 10
Table 5. Percentage of increase in acoustic energy with sound pressure level increase. ........... 11
Table 6. Pump constant Kp for power specified in horsepower. .................................................. 14
Table 7. Octave band reverberation times for different room classifications. ............................ 18
Table 8. Measured absorption coefficients in various space habitable volumes ........................ 22
Table 9. Values of k as function of relative humidity and frequency for a temperature of 20 °C. 23
Table 10. Manufacturer absorption coefficients of flight approved acoustic absorption materials........................................................................................................................ 23
Table 11. Mechanical transfer functions. ..................................................................................... 36
Table 12. Hearing protection requirements in hours per day for different 24-hour equivalent sound levels. .................................................................................................................. 36
Table 13. Octave band sound pressure levels, SIL and PSIL at several NC ratings. ...................... 39
Table 14. Example spectrum octave band SPL and corresponding NC values. ............................ 40
Table 15. Perceived Sound Level Changes .................................................................................... 41
FIGURES
Figure 1. Receiver location R at distance d from the center of a distributed incoherent planar radiator. ......................................................................................................................... 15
Figure 2. Sound pressure level as function of the distance from an acoustic source. ................. 16
Figure 3. Range of acceptable reverberation time. ...................................................................... 18
Figure 4. Several regions in a typical transmission loss curve. Mass and stiffness controlled regions have a 6 dB/octave slope. ................................................................................. 28
Figure 5. Example of a measured SPL spectrum projected onto the standard NC-curves........... 39

COMPENDIUM OF ACOUSTICS AND VIBRATION IN ENCLOSED VOLUMES – Grosveld
Chapter VIII - 3
CHAPTER VIII
COMPENDIUM OF ACOUSTICS AND VIBRATION IN ENCLOSED VOLUMES
Ferdinand W. Grosveld
1. INTRODUCTION
Crew compartment acoustics is a significant factor in the design, analysis and verification of habitable spacecraft, their integrated equipment and their payload complement to assure the safety, functionality and effectiveness of the crew in a habitable space environment [1][2][3][4]. The Acoustic Noise Control Plan (ANCP) [2][3] includes identification of the acoustic noise sources, the allocation of the noise requirement of each source, acoustic experiments and/or predictions for the components, analysis of the final acoustic noise emitted and verification with the applicable acoustic requirements.
The ANCP should be considered early in the design process to ensure an optimized acoustic crew compartment environment along with the successful acoustic implementation of habitats, equipment and/or payloads. Basic acoustic terminology, relevant analytical expressions, and pertinent acoustic data are widely available in the literature. However, this acoustic information dedicated to the habitable space environment is not available in an abbreviated, comprehensible format from any single source. The purpose of this Chapter is to provide a compendium of relevant acoustic information to be used in the acoustic design, analysis and verification of the habitable space environment, and the formulation and implementation of the related ANCP by acoustic designers, other discipline experts, and verification test engineers.
Many of the definitions, analytical formulae and other information presented in this Chapter can be found in any of the excellent acoustic textbook publications in References [5]-[18]. Material not found in these textbooks will be specifically referenced to other sources in the literature. The International System of Units (SI) is used throughout and is not specifically indicated unless ambiguity is encountered, or constants in the analytical expressions necessitate further definition of the variables used. Several of the formulas presented here are based on the assumption that the acoustic field in an enclosure is diffuse. However, when the enclosure dimensions are not large compared to the acoustic wavelength the diffuse field assumption is violated and the reader is advised to take the modal response of the enclosure into consideration. The limiting wavelength between the modal and the reverberant behavior of the enclosure is given by the Schroeder frequency which will be defined later in this Chapter.

NASA/SP-2015-624 – ACOUSTICS AND NOISE CONTROL IN SPACE CREW COMPARTMENTS – Goodman & Grosveld
Chapter VIII - 4
2. BASIC TERMINOLOGY AND METRICS
Acoustics – Acoustics is the scientific study of sound including the generation, propagation and the effects of sound waves.
Sound – Sound is the auditory sensation evoked by an oscillation in pressure, stress, particle displacement, particle velocity, etc., in a medium with internal forces, or the superposition of such propagated oscillations.
Noise – Noise is any undesired sound. Therefore the labeling of a particular sound is subjective, as noise has to do with an individual's perception. What is music to some listeners may be noise to others. Further, a person's response to sound also has to do with their perception of the sound. Noise control is needed to make levels acceptable to the receiver.
Sound pressure – The sound pressure is a fluctuating pressure superimposed on the static pressure by the presence of sound. The sound perceived by the human ear is commonly measured as a sound pressure. The unit of sound pressure is Pascal (Pa).
Sound power –Sound power, in Watts, is the total acoustic energy being radiated by a source in all directions.
Root-mean-square (rms) – The square root of the arithmetic mean of values squared.
Sound pressure level (SPL) – Lp is the symbol for SPL and is defined as
10
0
20log ( )p
pL
p
where p is the rms sound pressure and p0 is the reference sound pressure, internationally
accepted as 20 Pa [5]. The SPL is expressed in decibels (dB).
Sound power level (PWL) – Lw is the symbol for PWL and is defined by
10
0
20log ( )w
WL
W
where W is the sound power and W0 is the reference sound power (10-12 W).
Bandwidth – Spectra are usually based on a constant frequency bandwidth or a constant percentage bandwidth. Octave bands and one-third octave bands are examples where the bandwidth is a constant percentage of the band center frequency fbc with a lower band frequency fbl and upper frequency fbu. These limiting frequencies are defined as
3
2010
m
bl bcf f
and
3
2010m
bu bcf f
where m=1,½,⅓,…. octave band.
Octave band – A band of sound frequencies for which the upper frequency in the range is (within 2%) twice the lowest frequency. The position of the band is defined by the rounded geometric mean of the highest and lowest frequencies. The nominal mid-band frequencies of preferred octave bands are based on 1000 Hz as the reference center frequency [19][20] and are listed along with the octave band limiting frequencies in Table 1 (bold type face).

COMPENDIUM OF ACOUSTICS AND VIBRATION IN ENCLOSED VOLUMES – Grosveld
Chapter VIII - 5
One-third octave band – A band of sound frequencies that has a width of one-third the width of an octave band. One-third octave bands are numbered from 1 at 1.25 Hz through 43 at 20000 Hz. The center frequency fbc of each one-third octave band n is calculated by
1010n
bcf
Table 1. Preferred octave (in bold) and one-third octave frequency bands.
Band number [-]
Computed center frequency
[Hz]
Preferred center frequency
[Hz]
Lower limiting frequency
[Hz]
Upper limiting frequency
[Hz]
1 1.26 1.25 1.12 1.41
2 1.58 1.6 1.41 1.78
3 2.00 2 1.78 2.24
4 2.51 2.5 2.24 2.82
5 3.16 3.15 2.82 3.55
6 3.98 4 3.55 4.47
7 5.01 5 4.47 5.62
8 6.31 6.3 5.62 7.08
9 7.94 8 7.08 8.91
10 10.00 10 8.91 11.2
11 12.59 12.5 11.2 14.1
12 15.85 16 14.1 17.8
13 19.95 20 17.8 22.4
14 25.12 25 22.4 28.2
15 31.62 31.5 28.2 35.5
16 39.81 40 35.5 44.7
17 50.12 50 44.7 56.2
18 63.10 63 56.2 70.8
19 79.43 80 70.8 89.1
20 100.0 100 89.1 112
21 125.9 125 112 141
22 158.5 160 141 178
23 199.5 200 178 224
24 251.2 250 224 282
25 316.2 315 282 355
26 398.1 400 355 447
27 501.2 500 447 562
28 631.0 630 562 708
29 794.3 800 708 891
30 1000.0 1000 891 1122
31 1258.9 1250 1122 1413
32 1584.9 1600 1413 1778
33 1995.3 2000 1778 2239
34 2511.9 2500 2239 2818
35 3162.3 3150 2818 3548
36 3981.1 4000 3548 4467
37 5011.9 5000 4467 5623
38 6309.6 6300 5623 7079
39 7943.3 8000 7079 8913
40 10000.0 10000 8913 11220
41 12589.3 12500 11220 14130
42 15848.9 16000 14130 17780
43 19952.6 20000 17780 22390

NASA/SP-2015-624 – ACOUSTICS AND NOISE CONTROL IN SPACE CREW COMPARTMENTS – Goodman & Grosveld
Chapter VIII - 6
A preferred geometric series of acoustic frequencies has been adopted internationally to facilitate comparisons of measurements and data [19][20]. The computed and the preferred one-third octave bands are listed in Table 1 as function of band number. The upper and lower frequencies in the band are, respectively, 10(1/20) Hz higher and lower than the one-third octave band center frequency. The human audible frequency region is defined by the 13-43 one-third octave bands.
Sound levels – Sound levels are the sound pressure levels adjusted by a weighting to better represent the varying sensitivity of the human ear to different frequencies and sound pressure ranges. The A-weighting was introduced for levels below approximately 55 dB, B-weighting was for levels between 55 dB and 85 dB, and C-weighting was designed for levels above 85 dB. A-weighting is almost exclusively used for measurements relating to the human response to noise for both hearing damage and annoyance. The difference between A-weighted and C-weighted sound levels is an indication of the low-frequency energy content in a sound spectrum. The A- and C-weighting corrections for the one-third octave bands with center frequencies 20 Hz - 20000 Hz are listed in Table 2. The A-weighted sound level is denoted by LA and is expressed in dBA units.
Table 2. A- and C-weighting corrections for one-third octave bands 20 Hz – 20000 Hz.
Band number [-]
One-third octave band center frequency [Hz]
A-weighting [dB]
C-weighting [dB]
13 20 -50.4 -6.2
14 25 -44.7 -4.4
15 31.5 -39.4 -3.0
16 40 -34.6 -2.0
17 50 -30.2 -1.3
18 63 -26.2 -0.8
19 80 -22.5 -0.5
20 100 -19.1 -0.3
21 125 -16.1 -0.2
22 160 -13.4 -0.1
23 200 -10.9 0.0
24 250 -8.6 0.0
25 315 -6.6 0.0
26 400 -4.8 0.0
27 500 -3.2 0.0
28 630 -1.9 0.0
29 800 -0.8 0.0
30 1000 0.0 0.0
31 1250 0.6 0.0
32 1600 1.0 -0.1
33 2000 1.2 -0.2
34 2500 1.3 -0.3
35 3150 1.2 -0.5
36 4000 1.0 -0.8
37 5000 0.5 -1.3
38 6300 -0.1 -2.0
39 8000 -1.1 -3.0
40 10000 -2.5 -4.4
41 12500 -4.3 -6.2
42 16000 -6.6 -8.5
43 20000 -9.3 -11.2

COMPENDIUM OF ACOUSTICS AND VIBRATION IN ENCLOSED VOLUMES – Grosveld
Chapter VIII - 7
Spectrum – The spectrum of sound represents the sound pressure or power distributed across frequencies. It is commonly described in terms of levels in successive pass bands of octave, half-octave, and third-octave bandwidths but can be in a successive bandwidth of any size. The spectrum of acoustic energy important to human hearing is between 20 Hz and 20 kHz, which is termed the audio frequency range. Infrasound, energy below about 20 Hz, can be perceived at high-intensity levels but not as pure tones. Ultrasound is classically defined as acoustic energy above 20 kHz; however, the term is sometimes also applied to energy as low as 8 to 10 kHz, as sub-harmonics of ultrasonic levels above 20 kHz can impact sound pressure levels in the hearing range.
Speed of sound – The speed of sound in air is dependent on the ambient pressure and density, and the ratio of specific heats. Assuming the air behaves nearly like an ideal gas, the speed of sound in dry air can be expressed as a function of the temperature
20.05 273c T
where c is the speed of sound in m/s and T is the temperature in °C. At a temperature of 20 °C the speed of sound c in different media is given by the values in Table 3.
Table 3. Speed of sound in selected media.
Medium c [m/s]
Air 343
Helium 965
Oxygen 316
Water 1497
Aluminum 4877
Steel 5790
Titanium 6070
Atmospheric pressure correction equation – Microphone calibration is affected by atmospheric pressure in the following manner:
0.5460 30
10log528
tC
B
where C is the correction, in decibels, to be applied to the measured sound pressure level, t is the temperature in degrees Fahrenheit and B is the barometric pressure in inches of mercury.
Wavelength – The wavelength λ is the distance between analogous points on adjacent cycles of an acoustic wave and is inversely proportional to the frequency f
c
f
20.05 273c T
Wavenumber – The acoustic wavenumber k for a plane wave radiating into free space
2k

NASA/SP-2015-624 – ACOUSTICS AND NOISE CONTROL IN SPACE CREW COMPARTMENTS – Goodman & Grosveld
Chapter VIII - 8
Intensity – The intensity I for a free progressive wave is given by
2
rmspI
c
where prms is the rms pressure and ρc is the characteristic impedance of the medium. For a spherical wave the intensity I at radius r is given as a function of the total acoustic power of the source W by
24
WI
r
3. TYPES OF SOUND
Ambient sound – The composite of airborne sound from many sources near and far associated with a given environment at a particular location.
Background noise – Noise from all sources unrelated to a particular sound that is the object of interest at a specific location.
Continuous noise – In ISS and Space Shuttle, a significant noise source which operates for a cumulative total time of more than 8 hours in any 24-hour period is considered producing continuous noise.
Diffuse sound – The sound in a region where the intensity is the same in all directions and at every point.
Direct sound – The sound that arrives directly from a source without reflection.
Impulse sound – Impulse sounds are individual pressure pulses of sudden onset and brief duration, with a time interval of less than 1 second and a peaktorms ratio greater than 10 dB. Impulse sounds are typically described by the rise time, peak level, duration, and number of events or repetitions. The frequency content of impulse sounds is determined by spectral energydensity analysis.
Intermittent noise – Intermittent noise sources in ISS and Space Shuttle are defined as those that are a significant noise source operating for a cumulative total of 8 hours or less in any 24-hour period.
Narrow band noise – A narrow band component is a simple or complex tone, or a line spectrum having steady state frequency components in a very narrow band
Pink noise – Noise with a continuous frequency spectrum and equal power per constant percentage bandwidth. Pink noise is approximately flat when displayed as an octave band spectrum.
Pure tone – A pure tone is a single frequency acoustic signal produced by simple harmonic vibrations. The pressure as function of time t and frequency f is given by
cos(2 )p P ft

COMPENDIUM OF ACOUSTICS AND VIBRATION IN ENCLOSED VOLUMES – Grosveld
Chapter VIII - 9
where P is the amplitude and β is the phase angle of the signal.
Random noise – Random noise is a signal whose instantaneous amplitude changes randomly with time.
Reverberant sound – The sound in an enclosed or partially enclosed space that is being reflected repeatedly or continuously from the boundaries.
Steady-state sound – Steady-state sound (sound that is statistically stationary) in space vehicles is usually averaged over a time period of at least 10 seconds [21].
Significant noise source – A significant noise source in the Space Shuttle was defined as any individual item of equipment, or group of equipment items, which collectively function as an operating system, that generates an A-weighted SPL equal to or in excess of 37 dBA, measured at 0.6 meters distance from the noisiest part of the equipment [22].
White noise – Noise with a continuous frequency spectrum and equal power per unit bandwidth. White noise is basically flat when displayed as a constant bandwidth spectrum.
4. MATHEMATICAL OPERATIONS
SPL addition – Sound pressure levels Lp,i can be logarithmically added on an energy basis assuming their phase differences are random over time
,
1010
1
10log ( 10 )p iLn
p
i
L
Sound pressure levels can be logarithmically added across frequency bands to calculate an Overall Sound Pressure Level (OASPL) expressed in dB.
SPL averaging – The average sound pressure level pL of n noise sources is obtained by
,
1010
1
110log ( 10 )
p iLn
p
i
Ln
SPL subtraction – Sound pressure level Lp,2 can be logarithmically subtracted from Lp,1 on an energy basis assuming their phase difference is random over time
,1 ,2( ) ( )
10 101010log (10 10 )
p pL L
pL
Tonal sound addition – The total mean-square sound pressure of two coherent tonal sounds
cos( )i i ip P t for i=1,2
with amplitudes P1 and P2, the same rotational frequency 𝜔, and a constant relative phase difference of β1-β2 is given by [7]
2 2 2
1 2 1 2 1 22 cos( )tp p p p p

NASA/SP-2015-624 – ACOUSTICS AND NOISE CONTROL IN SPACE CREW COMPARTMENTS – Goodman & Grosveld
Chapter VIII - 10
If the two tones have the same amplitude (P1=P2) and phase (β1=β2) the total mean-square sound pressure will be four times the mean-square sound pressure of each individual tone and the total sound pressure level will be 10log10(4)=6 dB higher. If two tones with the same amplitude are 180 degrees out of phase cancellation will take place.
Practically, most sounds emanating from two sources are incoherent and are summed (in an acoustic free field) on a linear energy basis
2 2 2
1 2tp p p
resulting in a 10log10(2)=3 dB increase in sound pressure level. In settings where a reflector, such as the ground or a wall, is near the source the summation would be more than 3 dB as a result of the reflected energy. Table 4 shows the addition of two in-phase and two incoherent tonal sounds when their sound pressure levels are different.
Table 4. Adding two in-phase and two incoherent sound pressure levels.
Level difference [dB] Add to higher level [dB]
In phase Incoherent
0 6.0 3.0
1 5.5 2.5
2 5.1 2.1
3 4.6 1.8
4 4.2 1.5
5 3.9 1.2
6 3.5 1.0
7 3.2 0.8
8 2.9 0.6
9 2.6 0.5
10 2.4 0.4
11 2.2 0.3
12 1.9 0.3
13 1.8 0.2
14 1.6 0.2
15 1.4 0.1
16 1.3 0.1
17 1.1 0.1
18 1.0 0.1
19 0.9 0.1
20 0.8 0.0
PWL addition – Sound power levels Lw,i can be logarithmically added across audio frequency bands to calculate an overall sound power level
,
1010
1
10log ( 10 )w iLn
W
i
L
Summation of the sound power levels for all noise sources inside an enclosed space is a key factor in a number of analyses. Even though sound power levels and sound pressure levels are both reported in dB, the two levels are not interchangeable. If the sound power of a source is

COMPENDIUM OF ACOUSTICS AND VIBRATION IN ENCLOSED VOLUMES – Grosveld
Chapter VIII - 11
known and the acoustic characteristics of a room or other enclosure containing that source are also known, the sound pressure level can be calculated for a crew member’s location.
Energy factor – An energy factor of 2 or a 100% increase in sound energy (related to the pressure squared) results in a 3 dB sound level increase. Other conversions are listed in Table 5.
Table 5. Percentage of increase in acoustic energy with sound pressure level increase.
Decibel Increase
Energy Factor
% Energy Increase
Decibel Decrease
Energy Factor
% Energy Decrease
0 1.00 0 0 1.0000 0
1 1.26 26 -1 0.7943 21
2 1.58 58 -2 0.6310 37
3 2.00 100 -3 0.5012 50
4 2.51 151 -4 0.3981 60
5 3.16 216 -5 0.3162 68
6 3.98 298 -6 0.2512 75
7 5.01 401 -7 0.1995 80
8 6.31 531 -8 0.1585 84
9 7.94 694 -9 0.1259 87
10 10.00 900 -10 0.1000 90
15 31.62 3062 -15 0.0316 97
20 100.00 9900 -20 0.0100 99
5. SOUND SOURCES
Point source – A point source is a sound source with dimensions very small compared to the propagation wavelengths.
Fan noise – As noted frequently in Chapter II on Noise Control, and Chapter V, on ISS, experience has shown that fan noise has played a significant role in all crewed spacecraft programs covered in this book, and that a number of fans have needed treatment to quiet them. In ISS, significant materials and technology gains showed that new quiet fans could be developed as was accomplished by the Russians for the Service Module and other early Space Shuttle fans. Also, fan noise could be significantly reduced by the following means or combinations of them as demonstrated on numerous occasions in ISS modules and some payloads: addition of multi-layer wraps or fiberglass type covers over fans to reduce case radiated noise; use of mufflers upstream of fan inlets and downstream of fan outlets; installation of vibration isolation mounts underneath the fans; and the application of flexible couplings in attaching fan inlets and outlets to their ducting. In addition, the NASA Acoustics Office developed a selection tool that finds commercial off-the-shelf (COTS) fans with defined acoustic levels based on flow rate and differential pressure requirements [23].
Sources of fan noise – The ASHRAE Handbook – Fundamentals [24] lists various typical sources of fan noise
Non-uniform inflow to the fans due to obstructions can produce tonal noise at the blade passage frequency and its harmonics. The blade passage frequency is defined by
60BP
Bf n

NASA/SP-2015-624 – ACOUSTICS AND NOISE CONTROL IN SPACE CREW COMPARTMENTS – Goodman & Grosveld
Chapter VIII - 12
where n are rotations per minute (rpm) and B is the number of blades.
Vortex shedding noise from the blade trailing edge increases with the velocity of the flow over the blade, vb, as 50 to 60 log(vb).
Turbulence in the blade surface boundary layer generates broadband noise with levels that vary with the flow velocity over the blade as 60 to 80 log(vb).
Turbulence in the flow ingested by the fan, turbulent flow inside ducts, and turbulent flow impacting on ducts, plenum panels, pipes or exciting surfaces, all generate broadband noise with a dependency of 60 to 80 log(v0) on the freestream velocity v0.
Noise is also generated by air and fluids moving through ducts and pipes and interacting with grilles, diffusers, manifolds, etc.
Low-frequency noise is produced by flow separation from blade surfaces or due to sharp corners, elbows, etc.
Structure-borne noise due to fan imbalance manifests itself at the rotational frequency and integer multiples.
The A-weighted sound power level of a fan, as function of static pressure and airflow velocity, should be obtained from tests under approved test conditions [25][26][27] and are normally provided by the manufacturer. However, once the fan is installed in an air distribution system a new acoustic environment is created and measuring the sound power levels of the complete system becomes essential. This may be accomplished by the method described in AHRI Standard 260 [28] in which the entire system is tested including fans, filters, plenums, casings, ducts etc., and the sound power level at the inlet and discharge openings, as well as the radiated sound power, is measured in a qualified reverberant room. Sound power levels are determined in the reverberation room tests by comparing average sound pressure levels produced in the room to a reference sound source of known sound power level output. Alternatively, sound intensity tests may be conducted using measurements made at discrete points or by the scanning method [28]. Caution shall be exercised when performing these tests on a system already installed in the crew compartment as the surrounding sound field may not be diffuse. In those instances the intensity method is preferred. In any case, accuracy will be improved by including more receiver measurement locations. More details on fan operations and different fan types can be found in References [29] and [30].
The Noise and Vibration Control Chapter of the 2011 ASHRAE Handbook [29] presents basic acoustic design techniques to be considered to minimize noise when selecting fans or when designing an air distribution system.
Design the air distribution system such as to minimize flow resistance and turbulence.
Select a fan to operate as closely as possible to its rated peak efficiency when handling the required airflow and static pressure.
Design duct connections at both fan inlet and outlet for uniform and straight airflow.
Select duct silencers that do not significantly increase the required fan total static pressure.

COMPENDIUM OF ACOUSTICS AND VIBRATION IN ENCLOSED VOLUMES – Grosveld
Chapter VIII - 13
Minimize flow-generated noise by elbows or duct branch takeoffs whenever possible by locating them at least four to five duct diameters from one another. For high-velocity systems, it may be necessary to increase this distance to up to 10 duct diameters in critical noise areas.
Keep airflow velocity as low as possible by increasing the duct size in ducts serving sound-sensitive spaces to minimize turbulence and flow-generated noise.
Duct transitions should not exceed an expansion angle of 15°, or the resulting flow separation may produce rumble noise.
Use turning vanes in large 90° rectangular elbows and branch takeoffs. This provides a smoother directional transition, thus reducing turbulence.
Place grilles, diffusers, and registers into occupied spaces as far as possible from elbows and branch takeoffs.
Minimize use of volume dampers near grilles, diffusers, and registers in acoustically critical situations.
Vibration-isolate all reciprocating and rotating equipment connected to structure.
Vibration-isolate ducts and pipes, using spring and/or acceptable rubber or silicone type space qualified material for hangers.
Reference [29] presents a detailed discussion of lined and unlined ductwork attenuation that should be considered.
Fan Scaling Laws – Fan noise is dependent upon the fan design, the volume airflow rate, the total pressure and efficiency. After selecting the appropriate type of fan for a particular application the size should be determined based on efficiency, as the most efficient fans are usually the quietest. Fan laws relate performance variables for a series of aerodynamically similar fans at the same point of rating on the performance curve and can be used to predict the performance of another fan when test data are available for a same series fan. Caution should be exercised because the laws apply only for similar flow conditions. The performance of different size fans at different operating speeds can be estimated using the following scaling relationships [30][31]
Airflow: 3
a a a
b b b
Q D n
Q D n
Pressure: 2 2
a
b
t a a a
t b b b
p D n
p D n
Power: 5 3
a a a a
b b b b
P D n
P D n
70log 55log 20loga b
a a aW W
b b b
D nL L
D n

NASA/SP-2015-624 – ACOUSTICS AND NOISE CONTROL IN SPACE CREW COMPARTMENTS – Goodman & Grosveld
Chapter VIII - 14
where Q is the volume flow rate [m3/s], pt is the total pressure [kPa], P is the fan power [kW], LW is the sound power level [dB], D is the rotor diameter [m], n is the rotational speed [rpm] and ρ is the gas density [kg/m3]. The subscript a refers to data at the required performance conditions, while the subscript b indicates the data at base curve performance conditions.
It is important to realize that for a given type of fan, flow rate, and pressure only one size yields the highest efficiency for that fan. Designing a fan away from its highest efficiency will result in more noise. Early testing of the final fan configuration is paramount to ensure the acoustic levels emitted are compatible with the requirements.
Pump noise – The fundamental pumping frequency is given by the product of the speed in revolutions per second and the number of pump chamber pressure cycles per revolution. Noise emission is greatest at the fundamental frequency and/or at one of its harmonics. At frequencies exceeding approximately 3000 Hz the noise emission becomes mostly broadband in character [18]. The total sound power level LW generated by pumps in the 500, 1000, 2000 and the 4000 Hz octave bands combined can be estimated by
10logW pL P K
where P is the rated power of the pump [hp] and Kp is the pump constant given in Table 6. Add 1.3 dB to Kp when the pump power P is specified in kilowatts. The estimated pump noise is for units in isolation. When installing the pumps, they should be mounted on isolators, connections should be flex-couplings, and case radiated acoustic levels should be minimized by covers (multi-layers applications, honeycomb, etc.). The final configuration should be measured early in the design cycle and verified to meet the requirements.
Table 6. Pump constant Kp for power specified in horsepower.
Pump type <1600 rpm >1600 rpm
Centrifugal 90 95
Screw 95 100
Reciprocating 100 105
Subtract 6 dB from the total pump power to obtain the sound power level in each of the
four octave bands, assuming the level in each octave band is the same.
Noise from electric motors – The total sound power level LW from an electric motor in the 500, 1000, 2000 and the 4000 Hz octave bands combined can be estimated by
20log 15logW emL P n K
where P is the rated power of the electric motor [hp], n is the rated motor speed [rpm] and Kem is the electric motor constant (13 dB). This equation applies for motors up to 300 hp. Add 2.6 dB to Kem when the pump power P is specified in kilowatts. More information is provided in Reference [18].

COMPENDIUM OF ACOUSTICS AND VIBRATION IN ENCLOSED VOLUMES – Grosveld
Chapter VIII - 15
6. SOUND RADIATION
Radiated sound power – The power Ws radiated by a vibrating flat plate with length a and width b can be expressed by
2
sW c ab v
where ρc is the air impedance, 2v is the averaged, mean-square normal velocity of the
radiating surface and σ is the radiation efficiency.
Surface sound radiation – By modeling the front surface of a payload or closeout panel as a plane distribution of incoherent sources, radiating uniformly in all directions, the maximum mean-square acoustic pressure <p2> at distance d from the center of the surface is given by
2 1
2 2 2
2tan
2 4
scW abp
ab d a b d
where W is the radiated sound power, and a and b are the surface dimensions (Figure 1).
Figure 1. Receiver location R at distance d from the center of a distributed incoherent planar radiator.
Close to the surface, d approaches zero and the maximum mean-square pressure <p2> can
be approximated by
2 scWp
ab
When the surface sound radiation exceeds allowable levels, consideration should be given to treatments that reduce sound radiation, and increase sound transmission loss and damping characteristics.
7. SOUND PROPAGATION
Free field sound propagation – Theoretically, sound waves in a free field (i.e., an acoustic space with no reflections) spread spherically in all directions from an idealized point source. As a result of the spherical dispersion, the sound pressure is reduced to half of its original value as

NASA/SP-2015-624 – ACOUSTICS AND NOISE CONTROL IN SPACE CREW COMPARTMENTS – Goodman & Grosveld
Chapter VIII - 16
the distance is doubled, which is a 6 dB reduction in SPL. Practically, sound does not radiate uniformly in all directions, but follows directional patterns characteristic of the source and obstructions in the pathways.
Anechoic chamber – An anechoic chamber provides a nearly reflection free environment by absorbing the sound at the walls by special materials. The capability of these materials to absorb the sound energy is frequency dependent. Anechoic chambers are used to measure sound radiation from sources, test and calibrate equipment, determine sound directivity patterns and evaluate human response to sound.
Direct sound field – The direct field is only source and distance dependent and is not affected by the size of the enclosure or the reflective characteristics of the boundaries.
Near field – The sound field close to the source where the mean-square pressure does not vary inversely with the square of the distance from the source, and the particle velocity of the sound wave is not in phase with the pressure.
Far field – The far field is the sound field away from the source where the mean-square pressure varies inversely with the square of the distance from the source, and the particle velocity of the sound wave is in phase with the pressure. In the far field, while at the same time being in the free field, the sound pressure level will ideally be reduced by 6 dB for a doubling of the distance from the source (Figure 2).
Figure 2. Sound pressure level as function of the distance from an acoustic source.
Reverberation – The persistence of sound in an enclosed or partially enclosed space after the source of sound has stopped; by extension, in some contexts, the sound that so persists.
Reverberant sound field – The reverberant field is strongly dependent upon the dimensions of the enclosure and the sound absorbing properties of the bordering walls. Due to multiple wall reflections, the magnitude of the reverberant field builds up to a level determined by the acoustical absorption of the enclosure and the surface area of the enclosure. Sound energy density in an enclosure, of which the largest dimension is not more than three times any other
Log (distance)
So
un
d P
ressu
re L
evel, d
B
Near Field
Far Field
Free Field
Reverberant Field

COMPENDIUM OF ACOUSTICS AND VIBRATION IN ENCLOSED VOLUMES – Grosveld
Chapter VIII - 17
dimension and much larger than the acoustic wavelength (high frequencies), will approach uniformity throughout the enclosure away from the sound source and the enclosure walls. Figure 2 schematically shows the sound pressure level as function of the distance from an acoustic source in the free and reverberant propagation fields.
Diffuse sound field – The diffuse sound field consists of waves with random incidence with flow of acoustic energy equally probable in all directions and where the time average of the mean-square sound pressure is uniform everywhere. Ideally, the acoustic intensity at any location in the diffuse sound field is zero. The effective intensity I in any one particular direction is defined by
2
4
pI
c
where <p2> the mean-square pressure and ρc is the impedance of air.
Reverberation chamber – The walls in a reverberation chamber are highly reflective to set up an approximate diffuse acoustic field where the acoustic energy flow has equal probability in all directions. Reverberation chambers are used for determining the power from a source, the absorption coefficient of materials and to expose (launch) structures to very high levels of reverberant sound. They also are used in combination with an anechoic or reverberant chamber to measure the transmission loss of structures mounted in a window between the rooms.
8. SOUND IN ENCLOSED SPACES
Enclosed spaces – Enclosed spaces with sound sources are enclosures in which sound is reflected multiple times from the boundaries. A receiver within the enclosure is exposed to sound coming directly from the source (direct field) and sound arriving after having been reflected off one or more boundaries (reverberant sound field).
Reverberation time – The reverberant acoustic field is characterized by the reverberation time T60, which is the time required for the energy density to be reduced to 60 dB below its steady-state value after a sound source has been stopped. The reverberation time is an important parameter to determine adequate speech communication characteristics in an interior aerospace environment. The early decay time (EDT) is the reverberation time based on the SPL decay between 0 dB and -10 dB. T(20) and T(30) are the reverberation times based on the SPL decays between -5 dB, and -25 dB and -35 dB, respectively.
The expression for the mean of N reverberation times is
60
1 2
1 1 1...
N
NT
T T T
Rooms can be classified as dead, medium dead, average, medium live or live. Typical octave band reverberation time as listed in Table 7.

NASA/SP-2015-624 – ACOUSTICS AND NOISE CONTROL IN SPACE CREW COMPARTMENTS – Goodman & Grosveld
Chapter VIII - 18
Table 7. Octave band reverberation times for different room classifications.
Classification Octave band center frequency [Hz]
63 125 250 500 1000 2000 4000
Reverberation time [s]
Dead 0.26 0.30 0.35 0.40 0.43 0.46 0.52
Medium dead 0.24 0.22 0.18 0.25 0.30 0.36 0.42
Average 0.25 0.23 0.17 0.20 0.24 0.29 0.34
Medium live 0.25 0.23 0.15 0.15 0.17 0.20 0.23
Live 0.26 0.24 0.12 0.10 0.09 0.11 0.13
When speech communication is a consideration, the acoustic treatment of the enclosed
spaces should be sufficient to reduce the reverberation time below the applicable limits shown in Figure 3.
Figure 3. Range of acceptable reverberation time.
Room modes – In enclosures with parallel walls, some of the acoustic waves emanating from the source will propagate along certain paths where they repeat upon themselves and form normal modes of acoustic vibration or standing waves. In the presence of lower-order standing waves, the response of the interior space is a function of frequency and location, and the spatial sound pressure level distribution will be irregular and may vary substantially.
The normal mode frequencies of an enclosure are given by
22 2
2
yx zn
nn ncf
l w h
Room Volume, m3
Reverb
era
tio
n T
ime, s
100 200 300 500 700 1000 2000 3000 5000 10000 20000 50000 1000000
0.4
0.8
1.2
1.6
2
2.4
2.8
Auditoriums
GeneralPurpose
ConversationalSpeech

COMPENDIUM OF ACOUSTICS AND VIBRATION IN ENCLOSED VOLUMES – Grosveld
Chapter VIII - 19
where c is the speed of sound; l, w and h are the length [m], the width [m] and the height [m] of the room; and nx, ny and nz are the respective mode numbers in those directions.
The number of modes in a rectangular cavity is given by
3 2
3 2
4
3 4 8
V S PM f f f f
c c c
where M is the number of modes in the room, f is the one-third octave band center frequency, V is the volume, S is the total wall surface area, and P is the total edge length.
The modal density is defined by
2
3 2
4
2 8
dM V S Pf f
df c c c
The average asymptotic spacing ∆f between modal frequencies is given, in approximation, by the first right-hand side term
3
24
cf
Vf
Schröder frequency – The Schröder frequency is a cross-over frequency above which, on average, significant overlap occurs between adjacent modal frequencies of a reverberant enclosure, such that superimposed normal modes can be treated statistically and the modal density is sufficient to constitute a diffuse field.
The Schröder frequency fs results from equating the half-power bandwidth B of the modal resonances
6
60
ln10
2B
T
with a threefold average asymptotic spacing ∆f between modal frequencies [32]
3
60
4 ln10s
c Tf
V
where c is the speed of sound inside the enclosure, T60 is the reverberation time and V is the volume. When c=340 m/s the Schröder frequency fS can be approximated by
602000s
Tf
V
Reverberation (critical) distance – As the distance from the sound source increases the relative contribution of the reverberant field to the overall sound pressure level will increase until it dominates the direct sound field. The direct sound from the source decreases inversely with distance and will equal the reverberant sound at the critical distance Ds. The critical distance in meters may be approximated by [32]

NASA/SP-2015-624 – ACOUSTICS AND NOISE CONTROL IN SPACE CREW COMPARTMENTS – Goodman & Grosveld
Chapter VIII - 20
60
9ln10
2s
VD
c T
where V is the volume, c is the speed of sound and T60 is the reverberation time.
Enclosure acoustics – The sound pressure level Lp in an enclosure can be calculated from
0
2 2
410log 10log
4
ref
p w
ref
cWQL L
d R p
where Lw is the sound power of the source, Q is the quality factor, d is the distance to the source and R is the room constant. The third expression on the right hand side of the equation is approximately zero for most practical purposes as ρ0c equals 407 mks rayls (for air at 22° C
and 751 mm Hg), Wref is 1 pW and Pref is equal to 20 Pa. When 4/R dominates the Q/(4πd2) term the receiver location is in the reverberant field. When Q/(4πd2) is the dominant term the receiver is in the near field of the source. Q=1 for a source away from all surfaces. Q=2 when the source is located on a hard surface. Q=4 when the source is located in a two-way corner. Q=8 when the source is located in a three-way corner. The room constant R, which is the ability of the enclosure to absorb sound, is defined by
1 1
A SR
where A is the sound absorption in metric sabins, S is the total surface area in m2 and is average absorption coefficient. The average absorption coefficient is related to the volume V, the wall surface area S and the reverberation time T60 of the enclosure by
60
0.161V
T S
Combining the last two equations results in the following expression for the room constant
60
0.161
0.161
VSR
T S V
As R becomes smaller the enclosure becomes more reverberant. The previous four equations combine to give the classic relationship between the source sound pressure level and sound power level inside an enclosure
60
2
4( 0.161 )10log
4 0.161p w
T S VQL L
d VS
Thompson equation – A more practical relationship is given by the Thompson equation, which is based on the classic equation but is modified with empirical data [33]
2
410log 10log 0.5
4
md
p w
Qe MFDL L N
d d R

COMPENDIUM OF ACOUSTICS AND VIBRATION IN ENCLOSED VOLUMES – Grosveld
Chapter VIII - 21
where m is the air absorption coefficient, d is the distance from the source to the receiver, MFP is the mean free path and N is the number of point sources. The mean free path is given by
4VMFP
S
Schultz formula – Schultz investigated the conversion from sound power level to sound pressure level for several rooms and offices. He noticed a spatial attenuation of 3 dB per doubling of distance and developed an empirical formula [34]
10log 5log 3log 12p wL L r V f
where r is the distance from the source, V is the room volume and f is the frequency. Note that the sound absorption in the rooms was not included as an explicit term in the empirical formula.
Source sound power level – The sound power level Lw produced by a source in each one-third octave band was calculated from the equation
60
0 0 0
10log 10log 10log 1 10log 148
w p
T V S BL L
T V V B
where Lp is the mean one-third octave sound pressure level [dB], is the wavelength [m] at the one-third octave band center frequency, and B is the barometric pressure [Pa]. T0=1 s, V0=1 m3 and B0=105 Pa. The fourth term in the equation above is the Waterhouse correction term which compensates for the increased sound pressure and energy density along the walls relative to the central portion of the room where the sound pressure is measured.
9. SOUND ABSORPTION
Sound absorption – The process of absorbing sound energy by materials, objects, or structures such as an enclosure.
Sound absorption coefficient – The sound absorption coefficient of a surface, in a specified frequency band, the measure of the absorptive property of a material as approximated by test method ASTM C423 [35]. Ideally, the fraction of the randomly incident sound power absorbed or otherwise not reflected.
Absorption coefficient measurement – The sound absorption coefficient αs can be calculated from reverberation time measurements in a reverberation chamber with and without the test specimen present
0
0
0.161 1 1s
s s
V
S T T
where α0 is the absorption coefficient of the empty chamber, V is the volume of the reverberation chamber, Ss is the surface area of the test specimen, Ts is the reverberation time with the test specimen in the chamber and T0 is the reverberation time of the empty chamber.

NASA/SP-2015-624 – ACOUSTICS AND NOISE CONTROL IN SPACE CREW COMPARTMENTS – Goodman & Grosveld
Chapter VIII - 22
Absorption coefficients measured in various space habitable environments are listed in Table 8.
Table 8. Measured absorption coefficients in various space habitable volumes.
Habitable volume Octave band center frequency [Hz]
63 125 250 500 1000 2000 4000 8000
Spacelab (pre-1992) 0.035 0.157 0.173 0.12 0.123 0.1 0.107 0.118
Skylab (1973) 0.043 0.055 0.077 0.092 0.092 0.092 0.102 0.124
Long Module Mockup 0.153 0.131 0.115 0.106 0.109 0.115 0.125
ISS U.S. Laboratory 0.154 0.148 0.15 0.165 0.152 0.145 0.143 0.147
ISS Airlock 0.126 0.116 0.075 0.092 0.096 0.102 0.096 0.086
ISS Node1 0.129
ISS Node2 0.126
ISS JEM-PM JAMMS EI (2001) 0.049 0.15 0.12 0.18 0.16 0.15 0.15 0.17
ISS JEM JAMMS EI (2003) 0.060 0.103 0.142 0.194 0.161 0.164 0.159 0.155
ISS Columbus (2005) 0.4
Enclosure absorption – The absorption of the enclosure can be calculated assuming that
the sound field is diffuse. The equivalent sound absorption area A is defined by
60
55.34 p
VA Vm
cT
where T60 is the reverberation time, V is the room volume, and mp is power attenuation coefficient [1/m]. The value of mp is dependent on the temperature, relative humidity and atmospheric pressure and can be calculated from the attenuation coefficient [dB/m] for atmospheric absorption.
The absorption of room surface n is defined by the product of the absorption coefficient αn and the area Sn of that surface. The total absorption A is obtained by adding the N absorption values for all room surfaces.
1 1 1 1 ... ...n n N NA S S S S
The average Sabine absorption coefficient is calculated by dividing the equivalent sound absorption area by the total surface area of the room
A
S
where N
nS S
The minimum absorption coefficient in an enclosure is given by
min
40.00018
Vk f
S
where k is an experimental coefficient which is a function of relative humidity and frequency (Table 9), V is the enclosure volume, S is the surface area and f is the frequency.

COMPENDIUM OF ACOUSTICS AND VIBRATION IN ENCLOSED VOLUMES – Grosveld
Chapter VIII - 23
Table 9. Values of k as function of relative humidity and frequency for a temperature of 20 °C.
Relative humidity
[%]
Frequency [Hz]
2000 k [1/m]
4000 k [1/m]
8000 k [1/m]
30 0.0030 0.0095 0.0340
50 0.0024 0.0061 0.0215
70 0.0021 0.0053 0.0150
The octave band absorption coefficients for several flight approved acoustic absorption
materials are listed in Table 10. Note that these absorption coefficients are without the effects of encasing or covering the foam, which is recommended to preclude friability due to handling or personal contact.
Table 10. Manufacturer absorption coefficients of flight approved acoustic absorption materials.
Flight approved material
Density [kg/m3]
Thickness [mm]
Octave band center frequency [Hz]
Reference 125 250 500 1000 2000 4000
Absorption Coefficient [sabins/m2]
Solimide (HT340) Polyimide [36] 6.4 25 0.08 0.22 0.58 0.93 0.85 0.81
Solimide (TA-301) Polyimide [36] 6.4 25 0.07 0.18 0.61 1.03 0.90 0.93
Solimide (AC-530) Polyimide [36] 5.6 25 0.06 0.17 0.52 1.05 1.02 0.93
Solimide (AC-550) Polyimide [36] 7.1 25 0.15 0.30 0.71 0.94 0.97 0.79
Melamine (resin) [37] 8.5-11 30 0.06 0.09 0.25 0.56 0.80 0.95
Melamine (resin) [37] 50 0.08 0.20 0.55 0.9 1.00 0.92
Melamine (wedge) [38] 11 12.7 0.09 0.13 0.27 0.50 0.68 0.81
Melamine (wedge) [38] 11 19.1 0.09 0.15 0.39 0.65 0.80 0.90
Melamine (wedge) [38] 11 25.4 0.06 0.31 0.65 0.82 0.94 0.99
Melamine (wedge) [38] 11 38.1 0.19 0.35 0.75 0.98 1.01 1.03
Melamine (wedge) [39] 11 50.8 0.03 0.31 0.81 1.02 1.01 0.96
Melamine (wedge) [39] 11 76.2 0.13 0.74 1.26 1.18 1.12 1.03
Thinsulate AU0920 [40] 11.7 10 0.20 0.32 0.46 0.74
Thinsulate AU3002-2 [41] 18.2 19 0.34 0.82 1.13 1.10
10. PANEL VIBRATION
Vibration level – The vibration acceleration level is expressed in decibels (dB) by
2
10
0
10loga
aL
a
where a is the rms vibration amplitude and a0 is a reference acceleration (1 m/s2). For a sinusoidal waveform the rms and average amplitudes are related to the peak (crest) amplitude level by
0.707 0.637rms peak average peak

NASA/SP-2015-624 – ACOUSTICS AND NOISE CONTROL IN SPACE CREW COMPARTMENTS – Goodman & Grosveld
Chapter VIII - 24
If vibration is measured by acceleration levels the often used reference level is 1 micro G (acceleration of gravity is 9.8 m/s2, dependent on the location on earth). The reference level should be stated. The vibration quantities velocity and displacement are related to the acceleration, for pure harmonic motion with frequency f, by
2
accelerationvelocity
f
2(2 )
accelerationdisplacement
f
Bending stiffness – The bending stiffness per unit width B of a homogeneous plate is defined by [42]
3
212(1 )
EtB
where E is the elasticity modulus, t is the plate thickness and ν is the Poisson’s ratio.
The equivalent bending stiffness of a honeycomb sandwich panel is given by
2 32
2
2
1 2 3
E d t tB dt
where t is the thickness of the face plate and d is the core thickness.
Bending wave speed – The wave speed for bending waves cB is dependent on the rotational frequency ω and can be written as
2
4B
Bc
m
where B is the bending stiffness and m is the surface mass.
Bending wavenumber – The bending wavenumber kB is given by
B
B
kc
Loss factor – The structural loss factor of a panel is given by
1/3
2.2
f
where f1/3 denotes the one-third octave center frequency and T is the reverberation time in that frequency band.
Simply supported plate resonance frequencies – The acoustic transmission through a structure is generally highest at the lowest structural resonance frequencies. For a plate configuration with simply supported edge conditions the structural resonances fi,j can be calculated from
2 2
, 2 22i j
B i jf
m a b

COMPENDIUM OF ACOUSTICS AND VIBRATION IN ENCLOSED VOLUMES – Grosveld
Chapter VIII - 25
where B is bending stiffness of the structure per unit width, m is the surface mass, i and j are the mode numbers, a and b are the length and the width of the plate and c is the speed of sound in air. When assuming clamped edge conditions, a higher value of fi,j would be estimated.
Clamped plate resonance frequency – The fundamental resonance frequency fcc of a rectangular clamped supported plate of length a and width b can be approximated by [42]
4 2 2 4
6 7 2 7
2 2cc
Bf
m a a b b
where B is bending stiffness of the structure per unit width and m is the plate surface mass.
Curved panel resonance frequencies – Resonance frequencies fcurv(i,j) of a curved simply supported panel of straight length a and curved width b with radius R are defined by [43][44]
22
22 2
( , ) 2 2
1 12
2
y jx icurv i j i j
tktkBf k k
m B B t R
where B is the bending stiffness, m is the surface mass, t is the thickness and the factor Θ is defined by
4 2
22 2
(1 )i
i j
k
k k
with ki=iπ/a, kj=jπ/b. If the curved panel is pressurized with a pressure differential p, then the longitudinal stress is given by σx=pR/2t and the hoop stress is written as σy=pR/t.
Ring frequency – The ring frequency of a cylinder is defined by [44]
1
2R
Ef
R
where R is the radius, E is the elasticity modulus and ρ is the density.
Orthotropic plate resonance frequencies – The resonance frequencies of a simply supported rectangular orthotropic plate are expressed as [42]
3 2 24 4
, 4 4 2 2
3 3
62
a ba bi j
B B Gt i jB i B jf
a b a bm
where m is the surface mass, B is bending stiffness of the structure per unit width in the directions of the length a and the width b of the plate, ν is the Poisson ratio, t is the panel thickness and i and j are the mode numbers. The modulus of rigidity G is given by
2(1 )
EG
where E is the modulus of elasticity.

NASA/SP-2015-624 – ACOUSTICS AND NOISE CONTROL IN SPACE CREW COMPARTMENTS – Goodman & Grosveld
Chapter VIII - 26
Dilatational resonance – The first dilatational resonance fd of a honeycomb panel, where the compressible core act as a spring between the masses of the identical face plates, is approximated by [45]
31
(6 )
cd
p d
Ef
d m m
where Ec is the effective elasticity modulus for the core in compression, d is the core thickness and mp and md are the surface masses of the face plate and core, respectively.
Double panel structural resonance – The mass-air-mass resonance fmam of a double panel configuration can be calculated from
21 1.8
2mam
eff
cf
dm
with
1 2
1 1 1
effm m m
where m1 and m2 are the surface masses of the two panels and meff is the effective surface mass of the double panel configuration. The empirical factor 1.8 is included as the effective mass per unit area is less than the total mass per unit area of the double panel.
11. ACOUSTIC TRANSMISSION
Sound attenuation – The reduction of the intensity of sound as it travels from the source to a receiving location.
Sound insulation – The capacity of a structure to prevent sound from reaching a receiver location. Sound energy is not necessarily absorbed; impedance mismatch or reflection back toward the source is often the principal mechanism.
Homogeneous plate critical frequency – When the projected wavelength of the sound in air equals the wavelength of the bending wave in the structure a resonance condition is created. The sound waves are incident to the structure at many angles each having a resonance at a different frequency creating the coincidence frequency region. The critical frequency is the lowest frequency at which the coincidence resonance occurs for the condition that the sound waves graze the structure. The critical frequency is given by
2
2c
c mf
B
where c is the speed of sound, m is the surface mass (mass per unit area) and B is the bending stiffness.
Two-ply laminate critical frequency – The surface mass m2p of two homogeneous layers joined firmly together along their interface is given by
2 1 1 2 2pm t t

COMPENDIUM OF ACOUSTICS AND VIBRATION IN ENCLOSED VOLUMES – Grosveld
Chapter VIII - 27
where ρ is the density and the indices 1 and 2 refer to the two layers. The bending stiffness B2p of the two-ply laminate is defined by
2 2 2 21 1 1 2 2 22 1 2 12 2
1 2
12( ) 12( )12(1 ) 2 12(1 ) 2
p
E t t E t tB t y t y t
where E is the elasticity modulus, ν is the Poisson’s ratio and t is the thickness. The indices 1 and 2 refer to the two layers. The neutral axis y is defined by
1 1 2 1 2
1 2
(2 )
2( )
E t E t ty
E E
The two-ply critical frequency can be calculated from
22
22
p
c
p
mcf
B
where c is the speed of sound, m is the surface mass and B is the bending stiffness.
Orthotropic plate critical frequency – The critical frequency fc of an orthotropic plate is defined by
4
2
11 223c
c mf
D D
where m is the mass per unit area of the plate. D11 and D22 are the flexural rigidities in two perpendicular material directions which are given by
3
11,22
11,22
12 2112 1
h ED
where h is the thickness of the plate, E11 and E22 are the elasticity moduli along the two main material directions and ν12 and ν21 are the Poisson ratios. The parameter α is defined by
12 66
0.5
11 22
D D
D D
where D12 and D66 are flexural rigidity matrix values of the orthotropic plate. If α is not known, two critical frequencies in the primary directions of the laminate can be defined as
1,2
2
11,222c
c mf
D
Double panel acoustic resonances – The acoustic resonances between the two panels of a double panel configuration are given by
2na
ncf
d
where d is the distance between the two panels and n is the mode number.

NASA/SP-2015-624 – ACOUSTICS AND NOISE CONTROL IN SPACE CREW COMPARTMENTS – Goodman & Grosveld
Chapter VIII - 28
Double panel cross-over resonance – The double wall cavity cross-over resonance frequency fco is defined by
2co
cf
d
Sound transmission loss – The sound transmission loss (TL) of a panel is ten times the logarithm of the ratio of the power incident upon the panel over the power transmitted through the panel. The TL is a property of the panel and does not take into account the absorption, size and other characteristics of the enclosures on either side.
At frequencies below the structural resonances of a homogeneous panel the acoustic transmission is governed by the stiffness of the panel. Between the panel resonances and the critical frequency the transmission loss is controlled by the mass of the panel. The transmission loss curve has a 6 dB per octave slope in the stiffness and mass controlled regions as shown in Figure 4. Damping is most effective where resonances degrade the panel transmission loss.
Figure 4. Several regions in a typical transmission loss curve. Mass and stiffness controlled regions have a 6 dB/octave slope.
Mass law transmission loss – The ideal limp mass transmission loss TLm is given by
2
10log 1 cosm
fmTL
c
where f is the frequency, m is the surface mass, ρ is the density, c is the speed of sound and 𝜃 is the angle of the sound wave incidence. Integrating over the angle of incidence up to a limiting angle of 78° yields the field-incidence mass transmission loss which can be approximated by (assuming a diffuse sound field, one-third octave bands and TLm>15 dB)
20log 20log 47mTL m f
where m is the mass per unit area [kg/m2]. The TLm increases by 6 dB for doubling of frequency or doubling of mass. An increase of 5 dB is to be expected for panel type structures
Frequency, Hz
Tra
nsm
issio
n L
oss, d
B
0 0.1 0.2 0.3 0.4 0.5 0.6 0.7 0.8 0.9 10
0.1
0.2
0.3
0.4
0.5
0.6
0.7
0.8
0.9
1
Stiffness ControlledRegion
StructuralResonances
MassControlledRegion
CoincidenceControlledRegion

COMPENDIUM OF ACOUSTICS AND VIBRATION IN ENCLOSED VOLUMES – Grosveld
Chapter VIII - 29
as they have some inherent stiffness. Below the fundamental resonance the transmission loss of the structure is controlled by its stiffness and shows a negative slope of 6 dB for doubling of frequency.
Limiting angle of sound incidence transmission loss – The limiting angle of sound incidence 𝜃l has been shown to be dependent on the size of the panel for which the transmission loss is being calculated
1cos2
l
pA
where λ is the wavelength of the sound and Ap is the area of the panel. An expression for the transmission loss, which takes into account the limiting angle of sound incidence 𝜃l and the critical frequency fc, is given by
1) for the frequencies f ≤ 0.95fc
22
2 2
120log 20log 1 10log ln
1 cosc l
fm f aTL
c f a
where 2
1c
fm fa
c f
2) for the frequency region 0.95fc < f < 1.2fc
220log 10log b
fmTL
c
where η is the panel loss factor and Δb equals 0.236 for one-third octave bands and 0.707 for octave bands.
3) for frequencies f ≥ 1.2fc
220log 10log 1
c
fm fTL
c f
Collective transmission loss – The collective transmission loss of N elements is given by
1
10
1
10log
10n
N
n
nN TLN
n
n
S
TL
S
where Sn is the area of the element n having transmission loss TLn. The collective transmission loss may include openings with an area over which the transmission loss is zero.

NASA/SP-2015-624 – ACOUSTICS AND NOISE CONTROL IN SPACE CREW COMPARTMENTS – Goodman & Grosveld
Chapter VIII - 30
Averaged transmission loss – The averaged sound transmission loss is defined by
1 2
10 10 10
110log
10 10 ...10nTLTL TL
averTLn
Double panel transmission loss – The transmission loss for two isolated panels in a double panel configuration can be approximated by
sf f 1 220log 47TL f m m
s cof f f 1 2 20log( ) 29TL TL TL fd
cof f 1 2 6TL TL TL
where fs is the mass-air-mass resonance and fco is the double panel cross-over frequency.
Transmission loss of a cylindrical plate – The TL of a cylindrical plate TLcyl equals the TL of a flat plate with an extra term to account for the curvature
0.50.5
2
2
20log2arcsin 1
cyl flatplate
R cr
TL TL f f
f f
where fR is the ring frequency and fcr is the critical frequency.
Noise reduction (NR) – The noise reduction NR of a panel separating two enclosed spaces, with one or more sound sources in one of them, is the difference in sound pressure level measured on each side of the panel
1 2p pNR L L
where 1pL and
2pL are the sound pressure level measured within two wavelengths of the
panel surface. The measured sound pressure levels depend on location, and absorption and size characteristics of the enclosure. The noise reduction NR of a panel installed between two enclosures is given in terms of the transmission loss TL of the panel by
2
110log( )
4
pSNR TL
R
where Sp is the panel surface area and R2 is the room constant in the receiving enclosure. If the receiver location is in the reverberant field of the second enclosure the noise reduction becomes
2
10logpS
NR TLR
Hood noise reduction – The noise reduction NR between a location just inside the hood to a location just outside the hood is equal to the transmission loss TL of the walls if the hood is surrounded by virtual open space
NR TL

COMPENDIUM OF ACOUSTICS AND VIBRATION IN ENCLOSED VOLUMES – Grosveld
Chapter VIII - 31
Insertion loss (IL) – Insertion loss is defined as the sound pressure level at a receiver location with and without a panel installed between the source and receiver
0 2p pIL L L
where 0pL is the sound pressure level at the receiver location without the panel and
2pL is
the sound pressure level with the panel in place.
Hood insertion loss – The insertion loss of a hood placed over a noise source is given by
10logIL
( 1)
where is the average absorption coefficient under the hood and is the average transmission coefficient of the hood. When equals then IL=0. When =0 then IL=TL.
Silencer insertion loss – The insertion loss of a silencer or other sound-reducing element, in a specified frequency band, is the decrease in sound power level, measured at the location of the receiver, when a sound insulator or a sound attenuator is inserted in the transmission path between the source and the receiver.
Flanking – Flanking is acoustic energy reaching the receiver through acoustic or structural paths other than the direct sound propagation path. The acoustic power Wf radiated from a structural flanking element with surface area S is given by
2
fW cSv
where ρc is the impedance of air, 2v is average square normal velocity and σ is the radiation efficiency.
Sound transparency – Perforated panels selected as protection for absorptive materials need to be acoustically transparent allowing sound energy to reach the sound absorbing materials. The Transparency Index (TI) is given by [46]
2
2 20.04
nd PTI
ta ta
where n is the number of perforations, d is the perforation diameter, t is the panel thickness, a is the shortest distance between holes and P is the percent open area of the panel. The distance a between holes can be found by subtracting the perforation diameter d from the on-center hole spacing b. If not available a can be obtained from
( 1)a dP
where the constant κ is 9.5 for staggered and 8.9 for straight perforations. The value of TI increases with increasing hole size and number of holes, and with decreasing panel thickness and distance between holes. The resonance frequency fp is given by
2 100p
a
c Pf
hl

NASA/SP-2015-624 – ACOUSTICS AND NOISE CONTROL IN SPACE CREW COMPARTMENTS – Goodman & Grosveld
Chapter VIII - 32
Tuned resonant absorber – In noise control applications where noise attenuation is only needed over a limited frequency range, the perforated panel or lining could be used as a tuned resonant sound absorber. High sound absorption is then achieved without a heavy absorptive blanket, which will be discussed in the next section.
12. ACOUSTIC RESONATORS
Acoustic resonators are devices consisting of a combination of elements having mass and compliance, whose acoustical reactances cancel at a given frequency or within a small frequency bandwidth. They are often used to cancel undesirable frequency components in an acoustic field.
Cavity resonators – The Helmholtz resonator consists of a straight throat of length l and cross-sectional throat area A, connected to a closed resonator volume V to attenuate sound over a very small bandwidth. The Helmholtz resonance fHelm for a side branch is given by
2Helm
a
c Af
L V
0.8aL l A
where c is the speed of sound and La is the effective length of the throat. This formula is valid if the resonator dimensions are small compared to the wavelength at resonance and the throat dimensions are small relative to the enclosed space. For the highest absorption, but at a very limited frequency bandwidth, the resonator should be empty and the wall should be very stiff. The highest absorption AHelm [m2-Sabin] possible with a Helmholtz resonator is given by
2
2HelmA
The frequency bandwidth over which absorption can be obtained with a Helmholtz resonator can be widened by applying absorption material inside the resonator. However, the maximum absorption values of the resonator will be reduced. The Helmholtz resonator is analogous to a lumped one-degree of freedom system, where the air in the throat represents the mass, the volume in the resonator acts as the spring and the friction losses of the oscillating air in the throat constitute the damping.
Perforated panel absorbers – If a perforated plate is used in a membrane type of absorber the individual holes backed by the absorber cavity may be viewed as an arrangement of many small Helmholtz resonators. The resonance frequency is given by [46]
2 100perf
a
c pf
dL
where P is the perforation percentage (6-25%), d is the distance between the perforated plate and the wall, and La is the effective length of the throat. This formula is valid for circular shaped holes with diameters 1-4 mm and a perforated plate thickness 1-10 mm. Porous

COMPENDIUM OF ACOUSTICS AND VIBRATION IN ENCLOSED VOLUMES – Grosveld
Chapter VIII - 33
material behind the perforated plate widens the frequency range over which absorption is obtained but decreases its value. If the open area exceeds 25% only the porous material contributes to the absorption.
Slotted resonators – A slotted plate covering a cavity is another Helmholtz type resonator with the goal of keeping the thickness of the device to a minimum. The resonance frequency of a slotted plate resonator is given by
2 100
sslot
s
pcf
dc l
where ps is the slot perforation percentage, d is the distance between the slotted plate and the wall, cs (=1.2) is the mouth correction, and l is the plate thickness. The perforation percentage is given by
100 s
s s
wp
w r
where ws is the slot width and rs is the distance between slots. By mounting the slotted plate under a slight angle with the back wall the cavity depth will vary creating a resonator which is effective over a broader frequency range. However, the maximum possible absorption value will be reduced.
13. ACOUSTICS AND VIBRATION INSTRUMENTATION
Sound level meter (SLM) – The SLM [47][48] measures loudness of ambient sound according to ANSI Type 1 A and C weighting networks [49] and ANSI Class 1 octave and one-third octave band filters [50][51]. Selectable slow, fast, impulse, or peak sound level measurement averaging modes.
Dosimeter – The main function of a dosimeter is to measure the noise dosage level according to ANSI S1.25-1991 and ASA 98-1991 specifications [52].
Real-time analyzer (RTA) – is a measurement system that measures volts (converted to sound pressure levels) as function of frequency. An analog RTA uses a bank of constant fractional-width bandpass filters (such as octave band, one-third octave band, etc.) to measure the rms of the energy in each band at sequential time instances. RTAs are often used in the calculation of RT-60, sound TL measurements, and the determination of speech interference level (SIL). Modern RTAs use fast Digital Signal Processing (DSP) circuitries for acoustic analysis.
Fast Fourier Transform (FFT) spectrum analyzer – An FFT spectrum analyzer samples a time-varying signal and converts the time domain waveforms into frequency domain spectra. The analyzer measures all frequency components at the same time. A dual-channel FFT analyzer can perform a complex division of the output spectrum and the input spectrum to extract the magnitude and phase of a transfer function. These analyzers are used for room and device responses, noise identification, and intensity measurements; and structural dynamics analyses such health monitoring of fans and pumps, and close-out panel modal surveys.

NASA/SP-2015-624 – ACOUSTICS AND NOISE CONTROL IN SPACE CREW COMPARTMENTS – Goodman & Grosveld
Chapter VIII - 34
14. FAST FOURIER TRANSFORM ANALYSIS
The FFT is a fast and efficient algorithm to compute the discrete Fourier transform of an input vector, converting time domain waveforms into complex (real and imaginary, or amplitude and phase) frequency domain spectra [53][54].
Inverse FFT – The Inverse FFT reverts a signal defined by the real part and the imaginary part from the frequency domain into the time domain.
Sample – A numeric value proportional to the measured signal at one specific time instant.
Sampling frequency – The sampling frequency fs is the rate at which a continuous signal is converted into a discrete-time signal.
Discretization time – The discretization time Δts is the length of time between samples
1s
s
tf
Nyquist frequency – In digitally reproducing an analog signal, the digital sampling rate must be at least twice the highest frequency of the components making up the analog signal
2s Nyqf f
where the highest frequency fNyq is called the Nyquist frequency.
FFT bandwidth – The bandwidth of the FFT contains all frequencies up to the Nyquist frequency.
FFT bins – The FFT bandwidth is divided into bins of equal length, the number of which is half the size of the FFT.
FFT size – FFT computations are most efficient when the FFT size N is a power of 2. An FFT size of 214, or 16384, is referred to as a 16k FFT, and has its bandwidth divided into 8192 bins. Similarly, a FFT of 216 would be referred to as a 64k FFT, with its bandwidth divided into 32768 bins. The smaller the FFT size the faster the computations. The larger the FFT size the more accurate the results. The larger the size N of the FFT the greater the signal-to-noise-ratio (SNR) gain ( / 2N ) in the frequency domain [55].
FFT bin width – The FFT bin width is the sample rate fs divided by the FFT size N.
Measurement resolution – The measurement resolution is the number of bits available for defining individual measurement values. Having a 16-bit resolution means that values can range from -215 to +215-1 (-32768 to +32767) where the 16th binary digit is used for the sign of the number. The maximum input signal to the FFT system is typically around 1 Volt, regardless of resolution, but the advantage of higher resolution systems is that they can detect smaller signal values.
Window types – FFT-based measurements are subject to errors from leakage, which occurs when the FFT is computed from a block of data that is not periodic. To correct this problem appropriate windowing functions must be applied. A window is shaped such that it is exactly zero at the beginning and end of the data block with some special shape in between. The

COMPENDIUM OF ACOUSTICS AND VIBRATION IN ENCLOSED VOLUMES – Grosveld
Chapter VIII - 35
window type defines the bandwidth and shape of the filter used in the FFT processing. Rectangular windows give the best frequency resolution, but are only suitable if the signal is transient – completely contained in the time-domain window – or have a fundamental frequency component that is an integer multiple of the fundamental frequency of the window. Signals other than these will show spectral leakage making it difficult to resolve frequency details and amplitude accuracy. Another type of filter, the Hanning window is well suited for most measurements offering a good compromise between amplitude accuracy and frequency resolution. A Flattop window is a good choice if spectral peak amplitudes need to be accurately measured. If very small signals are close to very large amplitude signals the Blackman-Harris windows provide the highest dynamic range to resolve both signals.
Averaging – Averaging many spectra improves the signal to noise ratio and the accuracy and repeatability of the measurements. Root-mean-square averaging computes the weighted mean of the sum of the squared magnitudes (FFT times its complex conjugate). Weightings in common use are linear and exponential. Linear time averaging weighs all data in the average equally and is used when the rms detection is confined to a well-defined time interval. Exponential rms averaging weighs the latest data more than the older data and allows tracking of the signal that varies with time. In vector averaging the real and imaginary parts of the complex FFT spectrum are averaged separately.
Complex spectrum – The basic FFT analysis yield a complex spectrum, which can be displayed by its real and imaginary parts, or by amplitude and phase.
Power Spectral Density (PSD) – The PSD is the power spectral distribution obtained from the complex FFT spectrum normalized to a 1 Hz bandwidth.
Auto correlation – The auto correlation is a measure of how much overlap a signal has with a delayed version of itself. Auto correlation measurements are used to determine if any periodicity exists in seemingly random signals.
Cross correlation – The cross correlation is a measure of how much overlap a signal has with a delayed version of another signal. Cross correlation analysis is used to quantify the degree of similarity between two signals.
Transfer function – A transfer function is a mathematical representation of the relation between the input and output of a linear time-invariant system.
Auto spectrum – The auto power spectrum of a signal is defined as the product of the FFT of the signal times its complex conjugate.
Cross spectrum – The cross-spectrum represents the similarity of two signals in the frequency domain and corresponds with the cross correlation in the time domain. The cross spectrum is defined as the ratio of the FFT of one signal to the FFT complex conjugate of a second signal.
Frequency response function – The frequency response function is a transfer function in the frequency domain and is a mathematical representation of the relationship between two signals of a system. The frequency response function is expressed as the ratio of the cross-spectral density of the two signals and the auto-spectral density of the input.

NASA/SP-2015-624 – ACOUSTICS AND NOISE CONTROL IN SPACE CREW COMPARTMENTS – Goodman & Grosveld
Chapter VIII - 36
Coherence – Coherence is a measurement of the linear relation between two signals and is a unitless quantity between 0 and 1. It is computed as the ratio of the cross-power spectrum to the auto-power spectra of both signals.
Mechanical transfer functions – The definitions of some mechanical transfer functions are listed in Table 11.
Table 11. Mechanical transfer functions.
Transfer function Definition Equivalent
Dynamic stiffness Force/displacement
Admittance, compliance Displacement/force
Impedance Force/velocity
Mobility Velocity/force
Apparent mass Force/acceleration = Impedance/(jω)
Accelerance Acceleration/force = Mobility x jω
Force transmissibility Transmitted force/applied force = Impedance x jω
Motion transmissibility Transmitted velocity/applied velocity = Mobility/(jω)
15. NOISE EXPOSURE METRICS
Noise exposure monitoring and hearing conservation strategies, as well as dosimeter data, are discussed in Reference [56]. Following are the definitions and formulations of some noise exposure metrics applicable to the crew acoustic environments.
Equivalent sound level – The equivalent sound level Leq is the A-weighted sound pressure level of a fluctuating sound averaged over a given time interval. The time interval over which the levels are averaged is typically defined as 1 hour, 8 hours, 16 hours, or 24 hours depending upon the importance of the time interval and application. The Leq is defined by the following equation and has units of dBA
/10
( )
1
110log 10 Ai
eq
nL
eq T i
ieq
L tT
where i is the individual exposure interval, n is the total number of exposure intervals, ti is the duration in hours for interval i, Teq is the total time in hours for the Leq (such as 1, 8, 16 or 24), and LAi is the A-weighted sound level for interval i.
In ISS, crewmembers are required to wear approved hearing protection devices for the time periods listed in Table 12 when the 24-hour equivalent sound level Leq(24) exceeds 65 dBA [57].
Table 12. Hearing protection requirements in hours per day for different 24-hour equivalent sound levels.
Leq(24) [dBA] 65-66 67 68 69 70 71 72 73 74-75 76-77 >77
Hours per day of wearing hearing protection (in addition to 2-hour exercise)
0 2 7 11 14 16 17 19 20 21 22 (full
time)

COMPENDIUM OF ACOUSTICS AND VIBRATION IN ENCLOSED VOLUMES – Grosveld
Chapter VIII - 37
Statistical sound level – Time-varying sound can also be expressed by a sound level Ln indicating the percentage of time a level is exceeded. As an example, the sound level L10 indicates that the level is exceeded 10% of the time and signifies the high level components of a sound. At L90 the sound level is exceeded 90% of the time and constitutes a measure of the ambient or residual level.
Time-Weighted Average (TWA) – The 8-hour TWA sound level is a single number descriptor of the averaging of different exposure levels during an exposure period [58]. The TWA is expressed in dBA and is defined by
(log2)/
1
1log 10
log 2 8
Ai cr
nL L ER
i cr
i
ERTWA t L
where ER is the exchange rate, i is the individual exposure interval, n is the total number of exposure intervals, ti is the exposure time in minutes for exposure interval i, LAi is the A-weighted sound level at the ears for the exposure interval, and Lcr is the criterion level.
The exchange rate ER is the relationship between a change in sound level and the associated allowed exposure duration. An ER of 5 dBA for a doubling or halving of the noise exposure time is used by the U.S. Occupational Safety and Health Administration (OSHA) in calculations using the noise exposure criterion specified in an adopted hearing conservation program [59][60]. OSHA has set the Lcr criterion level in that program to 90 dBA. The National Institute for Occupational Safety and Health (NIOSH) has adopted an ER of 3 dBA on a sound energy basis [61] and a criterion level of 85 dB. Most U.S. Government Agencies and Nations worldwide use the 3 dBA ER [62] as well. The TWA can be calculated for any number of exposure intervals, each having its own exposure level, but is always normalized to 8 hours.
Dose (D) – The noise dose D is the amount of actual exposure relative to the amount of allowable exposure, and for which 100% and above represents exposures that are hazardous. The noise dose is calculated according to the following formula
1 2
1 2
100 ..... .....i n
i n
C CC CD
T T T T
where Ci is the total exposure time at a specified noise level and Ti is the reference noise exposure duration of the exposure event. The reference duration is defined as [63]
/2 Ai cr
cri L L ER
TT
where Tcr is the criterion exposure duration, Lcr is the criterion noise level, LAi is the measured A-weighted sound level and ER is the exchange rate.
The TWA may be calculated from the dose by
loglog 2 100
cr
ER DTWA L

NASA/SP-2015-624 – ACOUSTICS AND NOISE CONTROL IN SPACE CREW COMPARTMENTS – Goodman & Grosveld
Chapter VIII - 38
where the dose D is expressed in percent and the TWA in dBA. ER is again the exchange rate and Lcr is the criterion level. For Lcr equal to 85 dBA, ER equal to 3 and a dose of 50% the TWA is 82 dBA, while a dose of 200% would result in a TWA equal to 88 dBA.
In habitable space vehicles extended work shifts are standard. The extended shift projected dose Dprojected can be calculated from the measured dose Dmeasured by
shift
projected measured
sample
TD D
T
where Tshift is the extended work shift time and Tsample is the time for which the dose was measured. As stated in the ISS Increment IV report [64], dosimeters were used, either worn or installed in a static location, to determine the noise exposure equivalent sound pressure level, in dBA. The measurement period used during Increment IV was 24-hours. The sessions were split into a 16-hour workday and an 8-hour sleep period. These values were then combined mathematically into an equivalent 24-hour exposure level.
16. SPEECH INTELLIGIBILITY RELATED TERMS
Signal-to-noise-ratio – SNR is a measure comparing the power of the desired signal to the power of the background noise and is important when discussing intelligible communications (see Section 2.1.2 in Chapter I, Acoustics). The SNR is related to the coherence γ2 by
2
21SNR
Speech Interference Level (SIL) – SIL is an indicator used to evaluate the effect of steady background levels on the quality of facetoface speech communication. SIL is the arithmetic average of the interfering noise SPL in the four octave bands centered at 500, 1000, 2000, and 4000 Hz.
Preferred Speech Interference Level (PSIL) – The U.S. Federal Aviation Administration (FAA) uses PSIL which only includes the 500, 1000, and 2000 Hz octave bands [65].
Noise Criteria (NC) – NC is a single numerical index commonly used to define design goals for the maximum allowable noise in a given space. NC ratings are used to determine quality of speech communication based on the octave band levels of the noise in the environment of interest. The NC criteria consist of a family of curves that define the maximum allowable octave-band sound pressure level corresponding to a chosen NC design goal.
NC curves have been used for initial requirements in the Space Shuttle Orbiter and are implemented as requirements in ISS. The data values for the NC curves are presented in Table 13. The OASPL, A-weighted sound level, SIL and PSIL corresponding to these curves are also listed in Table 13 and represent the maximum possible values for each NC rating, which is the case when the measured data overlay the NC curve. The NC curves are plotted in Figure 5. An example of a measured spectrum (red line) is projected on top of the NC curves.

COMPENDIUM OF ACOUSTICS AND VIBRATION IN ENCLOSED VOLUMES – Grosveld
Chapter VIII - 39
Table 13. Octave band sound pressure levels, SIL and PSIL at several NC ratings.
Octave band center frequency [Hz]
(OASPL) A-weighted sound level
SIL
PSIL NC-rating 63 125 250 500 1000 2000 4000 8000
Sound pressure level [dB] [dB] [dBA] [dB] [dB]
15 47 36 29 22 17 14 12 11 47.4 27.1 16 18
20 51 40 33 26 22 19 17 16 51.4 31.4 21 22
25 54 44 37 31 27 24 22 21 54.5 35.6 26 27
30 57 48 41 35 31 29 28 27 57.7 39.8 31 32
35 60 52 45 40 36 34 33 32 60.8 44.2 36 37
40 64 56 50 45 41 39 38 37 64.9 49.0 41 42
45 67 60 54 49 46 44 43 42 68.1 53.4 46 46
50 71 64 58 54 51 49 48 47 72.1 58.1 51 51
52 72 65 60 56 53 51 50 49 73.4 59.9 52 53
55 74 67 62 58 56 54 53 52 75.2 62.6 55 56
60 77 71 67 63 61 59 58 57 78.6 67.5 60 61
65 80 75 71 68 66 64 63 62 82.1 72.3 65 66
70 83 79 75 73 71 70 69 68 85.7 77.6 71 71
Figure 5. Example of a measured SPL spectrum projected onto the standard NC-curves.
The SPL in each octave band is listed in Table 14 along with its corresponding NC value. Since the highest NC value for the measured spectrum is NC-55 in the 500 Hz octave band (Figure 5) the total measured spectrum will have a NC-55 rating. The OASPL, A-weighted sound level, SIL and PSIL corresponding to this measured spectrum are also listed in Table 14.
Octave Band Center Frequency, Hz
So
un
d P
res
su
re L
ev
el,
dB
0
10
20
30
40
50
60
70
80
90
63 125 250 500 1000 2000 4000 8000
Approximate thresholdof hearing forcontinuous noise
NC-15
NC-20
NC-25
NC-30
NC-35
NC-40
NC-45
NC-50
NC-55
NC-60
NC-65
NC-70

NASA/SP-2015-624 – ACOUSTICS AND NOISE CONTROL IN SPACE CREW COMPARTMENTS – Goodman & Grosveld
Chapter VIII - 40
Table 14. Example spectrum octave band SPL and corresponding NC values.
Octave band center frequency [Hz]
OASPL A-weighted sound level
SIL
PSIL
63 125 250 500 1000 2000 4000 8000 [dB] [dBA] [dB] [dB]
Measured SPL [dB] 52.3 55.1 49.0 57.8 48.2 49.0 43.0 38.4 61.3 57.1 50 52
NC rating NC-22 NC-39 NC-39 NC-55 NC-48 NC-50 NC-45 NC-42
Speech Intelligibility Index (SII) – The calculation of the articulation index (AI) has been
used for several decades as a measure of the intelligibility of voice signals, expressed as a percentage of speech units that are understood by the listener when heard out of context. The Speech Intelligibility Index (SII) is a major revision of the AI standard and defines computational methods that produce results highly correlated with the intelligibility of speech under a variety of adverse listening conditions, such as noise masking, filtering, and reverberation. The SII is computed from acoustical measurements or estimates of the speech spectrum level, the noise spectrum level, and from physical psychoacoustical measurements of the hearing threshold level. The intelligibility of a speech communication system is predicted by measuring the speechtonoise ratio in each contributing band and adding the results. The computed SII is converted to speech intelligibility scores.
Speech Transmission Index (STI) – The Speech Transmission Index (STI), like SII, is based on the articulation index and provides a single number index between 0 and 1 that correlates well with other psychophysical measures of speech intelligibility. An STI value of 0.6 is required for a communication with a minimal rating of "good." A value of 0.35 corresponds with about 50% intelligibility of redundant sentences.
Reverberation time – Reverberation time was previously defined as the time required for the energy density in an acoustic field to reduce to a level 60 dB below its steady state value. Reverberation time has a pronounced effect on speech intelligibility. A reverberation time of less than 0.5 (+0.1,-0.3) seconds is recommended in the 500 Hz, 1000 Hz and 2000 Hz octave bands for quiet environments in crew compartments where clear communications are required (consult Figure 3 and Section 2.7 in Chapter I, Acoustics). The reverberation time should be adjusted to the volume of the crew compartment, as per Mil-STD-1472A [66] or NASA STD-3000 [67].
Perceived Noisiness (PN) – Perceived Noisiness (PN) may be adequately determined by using the physical measurements of the sound to calculate PN in decibels (PNdB).
Relative loudness – Lowering the sound level by 10 dB results in an acoustic energy loss of 90% and is perceived to be half as loud as the original sound. Other perceived sound level changes are listed in Table 15.
A different concept of estimating annoyance incorporates both the duration and magnitude of all the acoustic energy occurring during a given time. The measurement used is the Leq as defined previously. The problem of quantifying environmental noise is greatly simplified using the statistical measures of the Leq. The Leq is one of the most important measures of

COMPENDIUM OF ACOUSTICS AND VIBRATION IN ENCLOSED VOLUMES – Grosveld
Chapter VIII - 41
environmental noise for assessing effects on humans, because experimental evidence suggests that the levels specified are an accurate indication of noise-induced hearing loss being developed and that it relates to human annoyance resulting from noise.
Table 15. Perceived sound level changes.
Sound Level Change
[dB] Acoustic Energy Loss
[%] Relative Loudness
0 0 Reference
-3 50 Perceptible Change
-6 75 Noticeable Change
-10 90 Half as Loud
-20 99 One-Quarter as Loud
-30 99.9 One-Eighth as Loud
-40 99.99 One-Sixteenth as Loud
17. STATISTICAL ENERGY ANALYSIS
Statistical energy analysis (SEA) is a method for predicting vibration transmission in dynamical systems made of coupled acoustic cavities and structural parts [54][68][69]. The vibrational behavior of the system is described in terms of potential and kinetic energy carried out by the modal resonances of the complex dynamic system. To solve a problem with SEA, the system must be partitioned into "subsystems", i.e. regions of the system where energy is equally shared among modes. SEA then writes a set of power-balanced equations that couples the power injected by the external loads (the sources) and the energies of the various subsystems.
A statistical average modal response within a frequency band can be obtained for each subsystem with high modal density and modal overlap and with the modal energy equally distributed among its modes. In SEA the power balance equations require that the time-averaged power input to a system equals the time-averaged power dissipated within the system due to damping and the net time-averaged power transmitted to other systems. The power balance equations take the form
ji iin i i ij i
i j i j
EEE n
n n
where 𝛱𝑖𝑛𝑖 is the external power input into the ith subsystem, ω is the rotational frequency,
𝜂i is the internal loss factor, 𝜂ij is the coupling loss factor between subsystems i and j, ni and nj are the modal densities, and Ei and Ej are the total dynamic energies of the subsystem modes in i and j. The first term on the right-hand side represents the power dissipated through damping and the second term is the power transmitted to connected subsystems. Basic terminology is further defined in the text below along with the formulations for some specific applications. The SEA analysis is useful for the contributions of fluid/structure interactions at medium/high modal densities.

NASA/SP-2015-624 – ACOUSTICS AND NOISE CONTROL IN SPACE CREW COMPARTMENTS – Goodman & Grosveld
Chapter VIII - 42
Subsystem – A subsystem is defined as a geometry containing a group of similar resonant modes capable of storing, dissipating or transmitting energy.
Group velocities – The group velocities of a beam are given by
Flexural
2
42*bf
b
Ec
Longitudinal bl
b
Ec
Torsional bt
b p
JGc
I
where E is the elasticity modulus, ω is the rotational frequency, κ is the radius of gyration, ρb is the beam mass density, J is the torsional moment of rigidity, G is the shear modulus and Ip is the polar moment of inertia of the beam.
The group velocities of a thin flat isotropic plate are given by
Flexural
2
42
2*12 1
pf
s
E hc
Longitudinal 2(1 )
pl
s
Ec
Torsional pt
s
Gc
where h is the plate thickness, ρs is the plate mass density, and ν is the Poisson’s ratio.
Modal density – The modal density of a system is the number of modes in a frequency band divided by its bandwidth.
The modal density of a beam/rod/bar with length L is defined by
Beam flexural sbf
Ln
E
Rod longitudinal 422
srl
hLn
EI
Bar torsional p
bt
ILn
GJ
The modal density of a thin flat isotropic plate with area S is defined by
Plate flexural 4
sp
hSn
D
where D is the plate bending stiffness.

COMPENDIUM OF ACOUSTICS AND VIBRATION IN ENCLOSED VOLUMES – Grosveld
Chapter VIII - 43
The modal density of a hard-walled rectangular chamber is given by
2
3 2
4
2 8a
V S Pn f f f
c c c
where V is the volume of the acoustic cavity, S is the total surface area of the walls, P is the total perimeter length, f is the frequency and c is the speed of sound.
Damping loss factor – The damping loss factor η defines the amount of energy dissipated in a subsystem spatially averaged over a frequency band. The damping loss factor can be measured by the Power Injection Method (PIM) [70], the decay rate technique [71] or by using the space averaged mean-square velocity, <v2>, in the following equation
2
1 in
N M v
where Пin is the input power, ω is the rotational frequency, and M is the mass of the subsystem.
The damping η is related to the T60 reverberation time by
60
2.2
fT
and the damping is related to the acoustic absorption by
4
Ac
V
where A is the total surface area, c is the speed of sound, V is the volume, and α is the sound absorption coefficient.
The structural damping coefficient η is equal to twice the critical damping ratio ζ
2
Coupling loss factor – The coupling loss factors η12 and η21 relate the time-averaged power transmitted Пtrans between connected subsystems 1 an 2 to the energies E1 and E2 in the subsystems
12
12 1 21 2trans E E
Using the consistency relationship n1 η12=n2 η21, where n1 and n2 are the subsystem modal densities, the coupling loss factors relating different subsystems can be defined by [16][72]
Plate to room/cavity
0 0 112
12
c
fm
Room to plate
0
2
0 2 2 2
12 3
1 28
cc S f
V m f

NASA/SP-2015-624 – ACOUSTICS AND NOISE CONTROL IN SPACE CREW COMPARTMENTS – Goodman & Grosveld
Chapter VIII - 44
Cavity to plate
0 0 2 212 2
24
cc f
f m
Room to room/cavity (non-resonant)
0 1212
18
c S
fV
Cavity to room
1212
4
Plate to plate (line)
1/2
1 1 1212 121/2
1
1
3
Lh c L
f S
Structure to structure (point)
2
12 2
1 1 2
Re
2
Y
fM Y Y
where ρ0 is the density of air, m is the surface density of the plate, M is the total subsystem mass, c0 is the wave speed in air, cL is the longitudinal wave speed of the structure, fc is the critical coincidence frequency, h is the thickness, S is the surface area, V is the volume, σ is the radiation efficiency, τ is the non-resonant room-to-room transmission coefficient, L is the length of the line connection, Y is the structural mobility and γ is the structure transmission coefficient.
The Space Station Interior Noise Analysis Program (SSINAP) [68] combines an SEA prediction of the space station vibroacoustic environment with a speech intelligibility model based on the Modulation Transfer Function and Speech Transmission Index (MTF/STI). MTF/STI provides a method for evaluating speech communication in the relatively reverberant and noisy environment of space stations. Other SEA packages include the Vibro-Acoustic Payload Environment Prediction System (VAPEPS) [73][74],which is managed at the NASA Jet Propulsion Laboratory (JPL), the SEAM acoustic and vibration design software from Cambridge Collaborative [75], and the VA One vibro-acoustic analysis software from ESI Group [76], which combines SEA with Finite Element Analysis (FEA) and Boundary Element Analysis (BEA) in one common environment. The reliability of SEA models depend on the accuracy in the estimation of the subsystem modal densities, the coupling loss factors and the damping loss factors.
18. OTHER VIBRO-ACOUSTIC SIMULATION AND ANALYSIS SOFTWARE SOLUTIONS
SEA and several types of other analysis methods and their ability to model on-orbit noise for Space Station Freedom were reviewed in Reference [77]. Some of the many acoustic and structural analyses packages currently in use worldwide, in addition to SEA, are listed here:

COMPENDIUM OF ACOUSTICS AND VIBRATION IN ENCLOSED VOLUMES – Grosveld
Chapter VIII - 45
LMS RAYNOISE is a computer-aided acoustic design and analysis program using advanced acoustic ray tracing methods. LMS SYSNOISE is the simulation solution for vibro-acoustic design, troubleshooting, and optimization. Both platforms are marketed by Siemens Product Lifecycle Management Software, Inc. [78].
The multidisciplinary structural analysis program MSC Nastran, the acoustic simulation software MSC Actran Acoustics (developed by Free Field Technologies), and the pre- and post-processor MSC Patran are all products available from the MSC Software Corporation to numerically simulate vibro-acoustic problems [79].
Dassault Systèmes markets Abaqus finite element-based software products for Structural-Acoustic Simulation, covering diverse application areas including noise transmission, radiation, acoustic attenuation or amplification. Abaqus integrates noise simulation within the finite element solver, allowing fully coupled structural-acoustic simulations to be performed within familiar Abaqus workflows [80].
Acoustics wave propagation problems such as noise caused by vibrating structural components, transmission of sound through thin panels, and many more can be analyzed in ANSYS Mechanical, where the fluid and structural domains are solved simultaneously. ANSYS Mechanical is a product of ANSYS, Inc. [81].
The Acoustics Module in the COMSOL Multiphysics Software Suite is designed specifically for those who work with devices that produce, measure, and utilize acoustic waves [82]. Noise control can be addressed in muffler design, sound barriers, and building acoustics applications.
ODEON room acoustics software is designed for simulating the interior acoustics of buildings and rooms [83]. Given the geometry and surface-properties, the acoustics can be predicted, illustrated and listened to. Sound reinforcement is easily integrated in the acoustic predictions. ODEON uses the image-source method combined with ray tracing.
Acoustics technical computing, data acquisition, simulation and visualization are possible using the high-level language MATLAB by MathWorks, Inc. [84]. MATLAB offers several toolboxes to solve specific type of problems. The program lets users manipulate numerical data and create graphical representations of the information in an interactive environment.
Applications for acoustics and vibration data acquisition, analysis and post-processing can be customized in the LabVIEW programming environment along with applicable hardware instrumentation [85]. LabVIEW is one of the many products and services offered by National Instruments Corporation.
Brüel & Kjær offers the PULSE platform, which is a stand-alone recording and FFT analyzer for real-time data acquisition and multi-purpose vibro-acoustic analysis [86]. PULSE LabShop and the PULSE Reflex Core are the software packages that simultaneously display and process live measurements data and/or can be used to post-process raw recorded data at a later stage.
Larsen Davis offers DNA (Data, Navigation, and Analysis) software to complement their extensive range of acoustics and vibration instrumentation [87]. DNA is used for display, analysis, and reporting of all project measurement data.

NASA/SP-2015-624 – ACOUSTICS AND NOISE CONTROL IN SPACE CREW COMPARTMENTS – Goodman & Grosveld
Chapter VIII - 46
19. REFERENCES
1. Goodman J.R. and Grosveld F.W., Acoustics. In: Principles of Safety Design for Space Systems, Musgrave G, Larsen A, and Sgobba T. (eds). Oxford, UK: Elsevier Science & Technology Books, February 2008.
2. Goodman J.R. and Grosveld F.W., Noise Control Design. In: Principles of Safety Design for Space Systems, Musgrave G, Larsen A, Sgobba T, (eds). Oxford, UK: Elsevier Science & Technology Books, February 2008.
3. Smith Suzanne D., Goodman Jerry R. and Grosveld Ferdinand W., Vibration and Acoustics. In: Fundamentals of Aerospace Medicine, 4th edition, Jennifer A. Fogarty, Jan Stepanek, Robert Johnson, Jeffrey R. Davis, editors, Lippincott Williams and Wilkins, USA, 2008.
4. Clark J.B. and Allen C.S., Acoustics Issues. In: Principles of Clinical Medicine for Spaceflight, Barratt, M.R. and Pool, S.L., eds., Springer Verlag, New York, 2008, pp 521-534.
5. Beranek L. L., ed., Noise and Vibration Control. New York: McGraw-Hill, 1988.
6. Ver I. and Beranek L.L., eds., Noise and Vibration Control Engineering: Principles and Applications. New Jersey: John Wiley and Sons, Inc., 2005.
7. Bies D.A. and Hansen C.H., Engineering Noise Control – Theory and Practice. Third Edition, London and New York: Spon Press, 1992.
8. Cox T.J. and D’Antonio P., Acoustic Absorbers and Diffusers. London, Spon Press, 2004.
9. Crocker M.J., Handbook of Acoustics. New York, John Wiley & Sons, Inc., 1998.
10. Everest, Frederick Alton, The Master Handbook of Acoustics. 4th ed. New York, McGraw-Hill Professional, 2001, 615 pages.
11. Fahy F.J. and Gardonio P., Sound and Structural Vibration Second Edition: Radiation, Transmission and Response. Academic Press, 2007.
12. Harris C.M., ed. Handbook of Acoustical Measurements and Noise Control. 3rd ed. New York: McGraw-Hill, 1998.
13. Harris C.S., Effects of Noise on Health. AL/OETR19970077. Wright-Patterson Air Force Base, Ohio: Noise Effects Branch, USAF Armstrong Laboratory, June, 1997.
14. Junger M.C. and Feit D., Sound, Structures and Their Interaction. MIT Press, 1972.
15. Kinsler L.E. and Frey A. R., Fundamentals of acoustics. Wiley, New York, 3rd edition, 1982.
16. Lyon R.H. and Dejong R.G., Theory and Application of Statistical Energy Analysis. Butterworth-Heinemann, Boston, 1995.
17. Pierce Allan D., Acoustics: An Introduction to Its Physical Principles and Applications. Acoustical Society of America, McGraw-Hill, New York, 1981.
18. Irwin J.D. and Graf E.R., Industrial Noise and Vibration Control. Prentice-Hall, Inc., Englewood Cliffs, New Jersey, 1979.

COMPENDIUM OF ACOUSTICS AND VIBRATION IN ENCLOSED VOLUMES – Grosveld
Chapter VIII - 47
19. ISO 266:1997 Acoustics – Preferred Frequencies. International Standards Organization, Geneva, 1997.
20. American National Standards Institute (ANSI). Preferred Frequencies, Frequency Levels, and Band Numbers for Acoustical Measurements. ANSI S1.6–1984 (R2006).
21. NASA Johnson Space Center, ISS Acoustic Requirements and Testing Document for ISS Non-Integrated Equipment. JSC 28322, March 1999.
22. NASA Johnson Space Center, System Specification for the International Space Station-3.3.10.2 Acoustic emission limits. Space Station Program Document SSP 41000R, March 2000.
23. http://www.nasa.gov/content/acoustics-and-noise-control-capability [cited 30 May 2015].
24. American Society of Heating, Refrigerating and Air-Conditioning Engineers, 2009 ASHRAE Handbook: Fundamentals – Chapter 8: Sound and Vibration. Atlanta, GA, 2009.
25. AMCA 2005, Reverberant room method for sound testing of fans. Standard 300-2005. Air Movement and Control Association International, Arlington Heights, IL.
26. AMCA 2008, Laboratory methods of sound testing of fans using sound intensity. Standard 320-08. Air Movement and Control Association International, Arlington Heights, IL.
27. AMCA 1997, Laboratory method of testing to determine the sound power in a duct. ANSI/AMCA Standard 330-97. Air Movement and Control Association International, Arlington Heights, IL.
28. AHRI 2012, Sound Rating of Ducted Air Moving and Conditioning Equipment. Standard 260-2012. Air-Conditioning, Heating, and Refrigeration Institute, Arlington, VA.
29. American Society of Heating, Refrigerating and Air-Conditioning Engineers, 2011 ASHRAE Handbook: HVAC Applications – Chapter 48: Noise and Vibration Control. Atlanta, GA, 2011.
30. American Society of Heating, Refrigerating and Air-Conditioning Engineers, 2012 ASHRAE Handbook: HVAC Systems and Equipment – Chapter 21: Fans. Atlanta, GA, 2012.
31. Cory William T.W., Fans and Ventilation: A practical guide. Elsevier, Amsterdam, First Edition, 2005.
32. Schroeder M.R., The “Schroeder frequency” revisited. Journal of the Acoustical Society of America, Vol. 99, No. 5. (1996), pp. 3240-3241.
33. Mitchell L.D., Thompson J.K. and Hurst C.J. A modified room acoustics approach to determine sound pressure levels in irregularly-proportioned factory spaces. Proceedings of Inter-Noise 1976, pages 465-468, Washington DC, USA, 1976.
34. Schultz T., Relationship between sound power level and sound pressure level in dwellings and offices. RP-339, ASHRAE Transactions 1985, V. 91, Pt. 1.

NASA/SP-2015-624 – ACOUSTICS AND NOISE CONTROL IN SPACE CREW COMPARTMENTS – Goodman & Grosveld
Chapter VIII - 48
35. ASTM C 423 – 02a. Standard Test Method for Sound Absorption and Sound Absorption Coefficients by the Reverberation Room Method. ASTM International, 100 Barr Harbor Drive, PO Box C700, West Conshohocken, PA 19428-2959, USA, 2002.
36. http://www.matweb.com [cited 30 May 2015].
37. http://www.soundservice.co.uk/documents/melamine.pdf [cited 30 May 2015].
38. http://www.noisecontrolproducts.com/pdfs/Foam/411_16_Art_Acoustic_Foam.pdf [cited 30 May 2015].
39. http://www.acousticsfirst.com/docs/Acoustics-First-TecSpec-2011-January.pdf [cited 30 May 2015].
40. http://multimedia.3m.com/mws/media/152514O/au-0920-high-performance-acoustic-insulation-technical.pdf?fn=AU_0920_data.pdf [cited 30 May 2015].
41. http://multimedia.3m.com/mws/media/879985O/3m-thinsulate-acoustic-insulation-au3002-2.pdf [cited 30 May 2015].
42. Leissa Arthur W., Vibration of Plates. Acoustical Society of America, American Institute of Physics (originally NASA SP-160), Woodbury NY, January 1993.
43. Petyt M. and Deb Nath, J.M., Vibration analysis of singly curved plates, Journal of Sound and Vibration 14 (1970), p. 387.
44. Szechenyi E., Approximate Methods for the Determination of the Natural Frequencies of Stiffened and Curved Plates, Journal of Sound and Vibration. 14 (3) (1971), pp. 401-418.
45. Vigran T.E., Building Acoustics. Taylor & Francis, New York NY, USA, 2008.
46. Schultz T.J., Acoustical Uses for Perforated Materials; Principles and Applications. Industrial Perforators Association, Boca Raton FL, USA, 1986.
47. ANSI/ASA S1.4-1983, Specification for Sound Level Meters. American National Standards Institute (ANSI) – Acoustical Society of America, New York NY, USA, 1983.
48. IEC, Sound level meters. P-IEC 60651 ed1.2 Consol. with am1&2. Geneva, Switzerland: International Electrotechnical Commission, 2001.
49. ANSI/ASA S1.42-2001 (R2011), Design Response of Weighting Networks for Acoustical Measurement, American National Standards Institute (ANSI) – Acoustical Society of America, New York NY, USA, 2011.
50. ANSI 1.11-2004, American National Specification for Octave-Band and Fractional-Octave-Band Analog and Digital Filters. American National Standards Institute (ANSI), Washington DC, USA, 2004.
51. IEC, Octave, half-octave and third-octave band filters intended for the analysis of sounds and vibrations. P_IEC 60225 ed1.0 (1966-01). Geneva, Switzerland: International Electrotechnical Commission, 1960.

COMPENDIUM OF ACOUSTICS AND VIBRATION IN ENCLOSED VOLUMES – Grosveld
Chapter VIII - 49
52. ANSI S1.25-1991/ASA 98-1991 (R2007), American National Standard Specification for Personal Noise Dosimeters. American National Standards Institute (ANSI) – Acoustical Society of America, New York NY, USA, 2007.
53. Bendat Julius S. and Piersol Alan G., Random Data: Analysis and Measurement Procedures. John Wiley & Sons, 2011.
54. Norton M.P. and Karczub D.G., Fundamentals of Noise and Vibration Analysis for Engineers. Cambridge University Press, Cambridge, UK, 2003.
55. Havelock David, Kuwano Sonoko and Vorländer Michael, Handbook of Signal Processing in Acoustics. Volume I, Springer Science and Business Media, New York, 2008.
56. Limardo, José G. and Allen, Chris, Assessment of Crewmember Noise Exposures on the International Space Station. AIAA-2013-3516, 43rd International Conference on Environmental Systems, Vail, Colorado, 14-18 July 2013.
57. NASA Johnson Space Center Flight Directors Office, International Space Station (ISS) Generic Operational Flight Rules, Vol. B, B13-152: Noise Level Constraints. NSTS-12820, 2007.
58. Berger, E.H., Royster L.H., Royster J.D., Driscoll D.P. and Layne M., The Noise Manual. American Industrial Hygiene Association, Fairfax, Virginia, Fifth Edition, 2003.
59. OSHA, Occupational Safety and Health Administration, Occupational Noise Standard 29 CFR 1910.95 and Appendices.
60. OSHA, Occupational Safety and Health Administration, OSHA Technical Manual – Chapter: Noise. OSHA Directive TED 01-00-015, 15 August 2013.
61. NIOSH, National Institute for Occupational Safety and Health, Criteria for a Recommended Standard: Occupational Noise Exposure – Revised Criteria, June 1998.
62. 3M Company, Job Health Highlights, Vol. 25, N0. 8, December 2007.
63. Karwowski, Waldemar, ed. International Encyclopedia of Ergonomics and Human Factors. 2nd Edition, CRC Press, Taylor and Francis Group, Boca Raton, Florida, 2006.
64. NASA Johnson Space Center. International Space Station Acoustic Environment Mission Report for Increment IV, Final Report, August 2003.
65. United States Air Force Armstrong Laboratory. Federal Interagency Committee on Aviation Noise: Report on Aviation Noise Research Conducted By U.S. Federal Agencies. AL/OE-TR-1997-0142, December 1997.
66. Human Engineering Design Criteria. MIL-STD 1472A, May 1970.
67. Man-System Integration Standard. NASA STD-3000, Volume I, Part A. NASA Johnson Space Center, 1995.
68. Stusnick E. and Burn M., Space Station Interior Noise Analysis Program. NASA Contractor Report 178190, February 1987.

NASA/SP-2015-624 – ACOUSTICS AND NOISE CONTROL IN SPACE CREW COMPARTMENTS – Goodman & Grosveld
Chapter VIII - 50
69. Lyon Richard H., Theory and Application of Statistical Energy Analysis. Butterworth-Heinemann, Elsevier, Newton, MA, 2014.
70. Lyon R.H., Statistical Analysis of Power Injection and Response in Structures and Rooms. Journal of the Acoustical Society of America. Vol. 45. Number 3, 1969.
71. Bolduc Maxime, Acquiring statistical energy analysis damping loss factor for complex structures with low to high damping characteristics. 2007. http://savoirs.usherbrooke.ca/handle/11143/1801 [cited 30 May 2015].
72. http://www.diracdelta.co.uk/science/source/s/e/sea%20coupling%20loss%20factors/source.html#.VXEEi0ZhThU [cited 30 May 2015].
73. Fernández J.P., Vibroacoustic Payload Environment Prediction System (VAPEPS), VAPEPS Management Center remote access guide, SuDoc NAS 1.26:189448, Jet Propulsion Laboratory, La Cañada Flintridge, CA, 1991.
74. Grosveld Ferdinand W., Plate Acceleration and Sound Transmission from Random Acoustic Excitation. Invited paper. VAPEPS – Vibroacoustic Payload Environment Prediction System, Iss. 5, Jet Propulsion Laboratory, Pasadena, CA, 1991.
75. SEAM – Acoustic and Vibration Design Software. Cambridge Collaborative, Concord, MA.
76. VA One – Vibro-acoustic Software. ESI North America, Farmington Hills, MI.
77. O’Keefe Ed, On-Orbit Noise Control for Space Station Freedom. AIAA 93-4080. AIAA Space Programs and Technologies Conference and Exhibit, Huntsville, AL, 21-23 September 1993.
78. LMS Raynoise, LMS Sysnoise – Siemens PLM Software, Plano, TX.
79. MSC Nastran, MSC Patran, FFT Actran – MSC Software Corporation, Newport Beach, CA.
80. Abaqus Multiphysics Dassault Systèmes Americas Corp., Waltham, MA.
81. ANSYS, Inc., Canonsburg, PA
82. COMSOL Multiphysics, Acoustics Module – COMSOL, Inc., Burlington, MA.
83. Odeon Acoustics Simulation Software, Odeon, Lyngby, Denmark.
84. MathWorks, Inc., Natick, MA.
85. National Instruments Corporation, Austin, TX.
86. Brüel & Kjær North America, Inc., Norcross, GA.
87. Larsen Davis, Provo, UT.
20. ACRONYMS
ANCP Acoustic Noise Control Plan
BEA Boundary Element Analysis
D dose
dB decibel

COMPENDIUM OF ACOUSTICS AND VIBRATION IN ENCLOSED VOLUMES – Grosveld
Chapter VIII - 51
dBA A-weighted SPL
DNA Data, Navigation, and Analysis
DSP Digital Signal Processing
EDT early decay time
ER exchange rate
FEA Finite Element Analysis
FEA Finite Element Analysis
FFT Fast Fourier Transform
IL insertion loss
ISS International Space Station
JPL Jet Propulsion Laboratory
MTF Modulation Transfer Function
NC Noise Criteria
NR noise reduction OASPL Overall Sound Pressure Level
OSHA Occupational Safety and Health Administration
Pa Pascal
PN Perceived Noisiness
PSD Power Spectral Density
PSIL Preferred Speech Interference Level
rms root-mean-square
RTA real-time analyzer
SEA Statistical Energy Analysis
SI International System of Units
SII Speech Intelligibility Index
SIL Speech Interference Level
SLM sound level meter
SNR signal-to-noise-ratio
SPL sound pressure level
SSINAP Space Station Interior Noise Analysis Program
STI Speech Transmission Index
TI Transparency Index
TL sound transmission loss
TWA Time-Weighted Average
VAPEPS VibroAcoustic Payload Environment Prediction System
21. SYMBOLS (in order of appearance)
Lp sound pressure level p rms sound pressure p0 reference sound pressure f frequency

NASA/SP-2015-624 – ACOUSTICS AND NOISE CONTROL IN SPACE CREW COMPARTMENTS – Goodman & Grosveld
Chapter VIII - 52
fbc band center frequency fbl band lower frequency fbu band upper frequency m 1,½,⅓,…. octave band n one-third octave band number c speed of sound T temperature in degrees Celsius C atmospheric pressure correction t temperature in degrees Fahrenheit B barometric pressure in inches of mercury λ wavelength k acoustic wavenumber I intensity prms root-mean-square pressure ρc characteristic impedance r radius W acoustic power Lp sound pressure level
pL average sound pressure level
P Pressure amplitude 𝛽 phase angel Lw sound power level fBP blade passage frequency B number of blades n rotations per minute vb flow velocity over blade v0 freestream velocity Q volume flow rate pt total pressure drop P fan power D rotor diameter n rotor speed Kp pump constant Kem electric motor constant Ws sound power
2 mean-square normal velocity
<p2> mean-square acoustic pressure a width b length d receiver distance R receiver location EDT reverberation time based on the SPL decay between 0 dB and -10 dB T(20) reverberation time based on the SPL decays between -5 dB, and -25 dB

COMPENDIUM OF ACOUSTICS AND VIBRATION IN ENCLOSED VOLUMES – Grosveld
Chapter VIII - 53
T(30) reverberation time based on the SPL decays between -5 dB, and -35 dB T60 reverberation time based on 60 dB below steady state value fn normal mode frequencies l length w width h height nx mode number in x-direction ny mode number in y-direction nz mode number in z-direction M number of modes V volume S area P perimeter length ∆f average asymptotic spacing between modal frequencies B half-power bandwidth Ds critical distance Lw sound power level Q quality factor d distance to the source R room constant Wref reference sound power – 1 pW
pref reference sound pressure level – 20 Pa A sound absorption in metric sabins average absorption coefficient m air absorption coefficient MFP mean free path T0 reference reverberation time – 1 s V0 reference volume – 1 m3 B0 reference barometric pressure – 105 Pa α0 empty chamber absorption coefficient Ss test specimen surface area
Ts reverberation time with test specimen installed A equivalent sound absorption area average Sabine absorption coefficient min minimum absorption coefficient La vibration level a rms vibration amplitude
a0 reference vibration – 1 m/s2 B bending stiffness per unit width E elasticity modulus t thickness ν Poisson’s ratio cB bending wave speed ω rotational frequency

NASA/SP-2015-624 – ACOUSTICS AND NOISE CONTROL IN SPACE CREW COMPARTMENTS – Goodman & Grosveld
Chapter VIII - 54
m surface mass kB bending wavenumber η structural loss factor f1/3 one-third octave center frequency i,j mode numbers c speed of sound fcc clamped fundamental resonance frequency fcurv curved simply supported fundamental resonance frequency
Θ curved panel factor σx longitudinal stress σy hoop stress fR ring frequency R radius G modulus of rigidity fd dilatational resonance Ec core effective elasticity modulus d core thickness mp face plate surface mass md core surface mass meff double panel effective surface mass fmam mass-air-mass resonance fc critical frequency
m2p surface mass of two joint homogeneous layers
ρ density y neutral axis D11,22 flexural rigidities in two perpendicular material directions α orthotropic plate parameter fa double acoustic resonances fco double panel cavity cross-over resonance frequency TL sound transmission loss 𝜃 angle of the sound incidence 𝜃l limiting angle of sound incidence Ap panel area Δb band number dependent parameter TLN N-element sound transmission loss TLaver averaged sound transmission loss TLcyl cylindrical plate sound transmission loss fR ring frequency fcr critical frequency NR noise reduction Sp panel surface area IL insertion loss average transmission coefficient Wf acoustic flanking power

COMPENDIUM OF ACOUSTICS AND VIBRATION IN ENCLOSED VOLUMES – Grosveld
Chapter VIII - 55
TI Transparency Index n number of perforations d perforation diameter P percent open area a shortest distance between holes b on-center hole spacing κ staggered perforations parameter fp perforated panel resonance frequency fHelm Helmholtz resonance frequency fperf perforated panel absorber resonance frequency P perforation percentage fslot slotted plate resonator ps slot perforation percentage d distance between slotted plate and wall cs mouth correction l plate thickness ws slot width rs distance between slots fs sampling frequency Δts discretization time fNyq Nyquist frequency Ts FFF bin width SNR signal-to-noise ratio Leq equivalent sound level Teq equivalent level reference time ti time duration at interval i LAi A-weighted sound level for interval i Leq,24 24-hour equivalent sound level Ln statistical sound level, exceeding n% of the time TWA Time-Weighted Average ER exchange rate Lcr criterion level D dose Ci total exposure time at specified noise level Ti reference noise exposure duration γ2 coherence Cn total exposure time Tn hazardous exposure time Tshift extended work shift time Tsample dose measurement time Leq equivalent sound level Пin external power input cbf flexural beam group velocity cbl longitudinal beam group velocity

NASA/SP-2015-624 – ACOUSTICS AND NOISE CONTROL IN SPACE CREW COMPARTMENTS – Goodman & Grosveld
Chapter VIII - 56
cbt torsional beam group velocity J torsional moment of rigidity G shear modulus Ip polar moment of inertia cpf flexural plate group velocity cpl longitudinal plate group velocity cpt torsional plate group velocity h plate thickness ρs plate mass density η Poisson’s ratio nbf beam flexural modal density nrl rod longitudinal modal density npt plate torsional modal density na modal density of hard-walled rectangular chamber η damping loss factor M subsystem mass ζ critical damping ratio E subsystem energy Пtrans time-averaged transmitted power cL longitudinal structural wave speed σ radiation efficiency τ non-resonant room to room transmission coefficient Y structural mobility

COMPENDIUM OF ACOUSTICS AND VIBRATION IN ENCLOSED VOLUMES – Grosveld
Chapter VIII - 57
This page intentionally left blank

HT90-40 Nomex®
ThinsulateTM AU 6060-6
Durette® Gold Fabric F-400-6 Nomex®
Finished Acoustic Panel
Nomex® BISCO® Felt BISCO® Nomex®
0
2 2
410log 10log
4
ref
p w
ref
cWQL L
d R p
,
1010
1
10log ( 10 )w iLn
w
i
L