
Widar: Decimeter-Level Passive Tracking via Velocity ...
10
Widar: Decimeter-Level Passive Tracking via Velocity Monitoring with Commodity Wi-Fi Kun Qian † , Chenshu Wu † , Zheng Yang † , Yunhao Liu † , Kyle Jamieson ‡ † School of Soſtware, Tsinghua University, China ‡ Department of Computer Science, Princeton University, USA {qiank10,wucs32,hmilyyz,yunhaoliu}@gmail.com,[email protected] ABSTRACT Various pioneering approaches have been proposed for Wi-Fi-based sensing, which usually employ learning-based techniques to seek appropriate statistical features, yet do not support precise tracking without prior training. us to advance passive sensing, the ability to track fine-grained human mobility information acts as a key enabler. In this paper, we propose Widar , a Wi-Fi-based tracking system that simultaneously estimates a human’s moving velocity (both speed and direction) and location at a decimeter level. Instead of applying statistical learning techniques, Widar builds a theoreti- cal model that geometrically quantifies the relationships between CSI dynamics and the user’s location and velocity. On this basis, we propose novel techniques to identify frequency components related to human motion from noisy CSI readings and then derive a user’s location in addition to velocity. We implement Widar on commercial Wi-Fi devices and validate its performance in real en- vironments. Our results show that Widar achieves decimeter-level accuracy, with a median location error of 25 cm given initial posi- tions and 38 cm without them and a median relative velocity error of 13%. CCS CONCEPTS •Human-centered computing →Ubiquitous and mobile com- puting; ACM Reference format: Kun Qian † , Chenshu Wu † , Zheng Yang † , Yunhao Liu † , Kyle Jamieson ‡ . 2017. Widar: Decimeter-Level Passive Tracking via Velocity Monitoring with Commodity Wi-Fi. In Proceedings of Mobihoc ’17, Chennai, India, July 10-14, 2017, 10 pages. DOI: hp://dx.doi.org/10.1145/3084041.3084067 1 INTRODUCTION Location awareness is a key enabler for a wide range of applications such as smart homes, virtual reality, augmented reality, security monitoring, and asset management. Traditional approaches track a user in an active manner via devices such as smartphones or Permission to make digital or hard copies of all or part of this work for personal or classroom use is granted without fee provided that copies are not made or distributed for profit or commercial advantage and that copies bear this notice and the full citation on the first page. Copyrights for components of this work owned by others than ACM must be honored. Abstracting with credit is permied. To copy otherwise, or republish, to post on servers or to redistribute to lists, requires prior specific permission and/or a fee. Request permissions from [email protected]. Mobihoc ’17, Chennai, India © 2017 ACM. 978-1-4503-4912-3/17/07. . . $15.00 DOI: hp://dx.doi.org/10.1145/3084041.3084067 wearable sensors aached to users [7, 12]. ese approaches, how- ever, pose inconvenience since users need to wear or take specific devices and thus are inapplicable in some scenarios such as security surveillance. Other approaches work passively with infrastructure installed in the area of interests, such as cameras and wireless sensor networks (WSNs) [20, 25]. Among them, camera based approaches only provide directional coverage with Line-Of-Sight (LOS) condi- tion and breach user privacy significantly. WSN-based approaches require densely deployed nodes. Recent innovations in wireless communications shed light on passive human sensing with Wi-Fi signals. Various approaches such as WiVi [3], E-eyes [19], CARM [18] have been proposed for human detection, activity classification, gesture recognition, etc. In principle, these works exploit the phenomenon that human motions distort multipath profiles during signal propagation. ese RF based approaches are more aractive than previous solutions since they do not require the user to carry a device, support omni- directional coverage even in Non-Line-Of-Sight (NLOS) scenarios, and preserve user privacy gracefully. Limitations of existing works. Existing works, however, can- not track fine-grained human mobility information (including speed, direction and location). Specifically, they do not quantitatively model the relationships between signal features and human mobil- ity. Instead, most of them employ learning techniques for gesture and activity recognition by seeking appropriate statistical features of Wi-Fi signals [10, 18, 19]. e key limitations are that they only recognize pre-defined gestures and activities and usually require prior training. Without an elaborate model that outputs locations directly from radio signals, user locations are sometimes identi- fied from recognized specific activities that are highly location- dependent rather than vice versa [19]. Similarly, a user’s mov- ing velocity can only be derived from successive locations rather than vice versa. ese drawbacks largely confine the application prospects and effects of passive sensing. To advance Wi-Fi-based human sensing, the ability to track fine-grained mobility informa- tion from RF signals acts as a fundamental primitive. Proposed approach. In this paper, we proposed Widar , a Wi- Fi-based tracking system that simultaneously estimates human’s moving velocity and locations at decimeter level. Specifically, we aempt to emulate a Wi-Fi-based velocimeter that measures the instantaneous velocity (both speed and direction), in order to track fine-grained continuous locations. Instead of applying statistical learning techniques, Widar achieves these goals by deriving ve- locities and locations both directly from the Channel State Infor- mation (CSI) of Wi-Fi signals [28]. Our key observation is that
-
Upload
khangminh22 -
Category
Documents
-
view
0 -
download
0
Transcript of Widar: Decimeter-Level Passive Tracking via Velocity ...
Widar: Decimeter-Level Passive Tracking via VelocityMonitoring with Commodity Wi-Fi
Kun Qian†, Chenshu Wu†, Zheng Yang†, Yunhao Liu†, Kyle Jamieson‡
†School of Software, Tsinghua University, China‡Department of Computer Science, Princeton University, USA
{qiank10,wucs32,hmilyyz,yunhaoliu}@gmail.com,[email protected]
ABSTRACT
Various pioneering approaches have been proposed for Wi-Fi-based
sensing, which usually employ learning-based techniques to seek
appropriate statistical features, yet do not support precise tracking
without prior training. Thus to advance passive sensing, the ability
to track fine-grained human mobility information acts as a key
enabler. In this paper, we proposeWidar , a Wi-Fi-based tracking
system that simultaneously estimates a human’s moving velocity
(both speed and direction) and location at a decimeter level. Instead
of applying statistical learning techniques, Widar builds a theoreti-
cal model that geometrically quantifies the relationships between
CSI dynamics and the user’s location and velocity. On this basis,
we propose novel techniques to identify frequency components
related to human motion from noisy CSI readings and then derive
a user’s location in addition to velocity. We implementWidar on
commercial Wi-Fi devices and validate its performance in real en-
vironments. Our results show that Widar achieves decimeter-level
accuracy, with a median location error of 25 cm given initial posi-
tions and 38 cm without them and a median relative velocity error
of 13%.
CCS CONCEPTS
•Human-centered computing→Ubiquitous andmobile com-
puting;
ACM Reference format:
Kun Qian†, Chenshu Wu†, Zheng Yang†, Yunhao Liu†, Kyle Jamieson‡.
2017. Widar: Decimeter-Level Passive Tracking via Velocity Monitoring
with Commodity Wi-Fi. In Proceedings of Mobihoc ’17, Chennai, India, July
10-14, 2017, 10 pages.
DOI: http://dx.doi.org/10.1145/3084041.3084067
1 INTRODUCTION
Location awareness is a key enabler for a wide range of applications
such as smart homes, virtual reality, augmented reality, security
monitoring, and asset management. Traditional approaches track
a user in an active manner via devices such as smartphones or
Permission to make digital or hard copies of all or part of this work for personal orclassroom use is granted without fee provided that copies are not made or distributedfor profit or commercial advantage and that copies bear this notice and the full citationon the first page. Copyrights for components of this work owned by others than ACMmust be honored. Abstracting with credit is permitted. To copy otherwise, or republish,to post on servers or to redistribute to lists, requires prior specific permission and/or afee. Request permissions from [email protected].
Mobihoc ’17, Chennai, India
© 2017 ACM. 978-1-4503-4912-3/17/07. . . $15.00DOI: http://dx.doi.org/10.1145/3084041.3084067
wearable sensors attached to users [7, 12]. These approaches, how-
ever, pose inconvenience since users need to wear or take specific
devices and thus are inapplicable in some scenarios such as security
surveillance. Other approaches work passively with infrastructure
installed in the area of interests, such as cameras andwireless sensor
networks (WSNs) [20, 25]. Among them, camera based approaches
only provide directional coverage with Line-Of-Sight (LOS) condi-
tion and breach user privacy significantly. WSN-based approaches
require densely deployed nodes.
Recent innovations in wireless communications shed light on
passive human sensing with Wi-Fi signals. Various approaches
such as WiVi [3], E-eyes [19], CARM [18] have been proposed
for human detection, activity classification, gesture recognition,
etc. In principle, these works exploit the phenomenon that human
motions distort multipath profiles during signal propagation. These
RF based approaches are more attractive than previous solutions
since they do not require the user to carry a device, support omni-
directional coverage even in Non-Line-Of-Sight (NLOS) scenarios,
and preserve user privacy gracefully.
Limitations of existing works. Existing works, however, can-
not track fine-grained humanmobility information (including speed,
direction and location). Specifically, they do not quantitatively
model the relationships between signal features and human mobil-
ity. Instead, most of them employ learning techniques for gesture
and activity recognition by seeking appropriate statistical features
of Wi-Fi signals [10, 18, 19]. The key limitations are that they only
recognize pre-defined gestures and activities and usually require
prior training. Without an elaborate model that outputs locations
directly from radio signals, user locations are sometimes identi-
fied from recognized specific activities that are highly location-
dependent rather than vice versa [19]. Similarly, a user’s mov-
ing velocity can only be derived from successive locations rather
than vice versa. These drawbacks largely confine the application
prospects and effects of passive sensing. To advance Wi-Fi-based
human sensing, the ability to track fine-grained mobility informa-
tion from RF signals acts as a fundamental primitive.
Proposed approach. In this paper, we proposedWidar , a Wi-
Fi-based tracking system that simultaneously estimates human’s
moving velocity and locations at decimeter level. Specifically, we
attempt to emulate a Wi-Fi-based velocimeter that measures the
instantaneous velocity (both speed and direction), in order to track
fine-grained continuous locations. Instead of applying statistical
learning techniques, Widar achieves these goals by deriving ve-
locities and locations both directly from the Channel State Infor-
mation (CSI) of Wi-Fi signals [28]. Our key observation is that

Mobihoc ’17, July 10-14, 2017, Chennai, India Kun Qian†, Chenshu Wu†, Zheng Yang†, Yunhao Liu†, Kyle Jamieson‡
movement at different locations with different velocities induces
different changes in the lengths of individual signal propagation
paths. Therefore, we investigate a CSI-mobility model that captures
the geometrical constraints between CSI and a human’s location
and velocity. On this basis, we propose techniques to extract the
rate of change of each signal propagation path length (which we
term path length change rate, or PLCR), from which we can directly
estimate both a user’s velocity and location. By doing this, we
enable precise tracking of a user’s moving velocity and location
using COTS Wi-Fi devices.
Widar advances the state-of-the-art onWi-Fi-based sensing from
two fronts. First,Widar models the relationship between CSI and
human mobility from a geometrical perspective, a simpler approach
than previous learning based techniques [19]. Such a model helps
understand the physical principles of the effects of human mobil-
ity on CSI changes. Moreover, our model does not require prior
training and can easily generalize to various scenarios. Second,
Widar directly estimates the velocity of human motion, which is
beyond the achievements of existing approaches. Previous works
either need to derive velocity from successive location estimates
or merely report the mixture of speeds of different body parts [18].
Estimates of moving velocity, as an additional dimension of mo-
bility, stimulate a wide variety of novel applications. For example,
velocity analysis provides valuable information for indoor fitness
and athletic training.
Challenges and our solutions. Building such a model and
translating it into a practical tracking system involves many chal-
lenges. The first challenge is to derive moving velocity from the
PLCR. PLCRs induced by human movements depend on both the
location and velocity of the human. Thus according to the target’s
specific location, the PLCR is not necessarily equivalent or propor-
tional to the velocity. A huge gap exists between CSI and velocity,
although existing models have associated CSI with motion-induced
propagation path changes [18]. In our work, we attempt to bridge
this gap and further extend to simultaneous estimation of moving
velocities and locations. To achieve this, a quantitative model is
required to precisely depict the physical constraints of CSI changes
and the user’s location and velocity.
The second challenge is to determine signs of PLCRs that in-
dicate moving direction. With only absolute PLCR, it is difficult
to tell whether a reflector is moving towards or away from the
link. Considering the simplest case where a user moves along the
extended line of a transmitter and a receiver, a movement of 0.5m ei-
ther towards or backwards the link both causes an identical change
of 1m in reflecting path length. To fully eliminate such direction
ambiguity, we integrate recent art [23], which enables estimation of
signs of PLCR in restricted moving directions provided sufficiently
long observations, to opportunistically identify signs of PLCRs for
particular links and search through the space of possible signs for
the other links using a novel error function based on the continuity
of sequential locations.
The third challenge is to identify moving velocity from the su-
perpositioned reflections from different human body parts. For
the purpose of tracking a user’s location, we mainly care about
the moving velocity. However, motion of different body parts (e.g.,
arms and legs) all potentially contribute to CSI changes, adding non-
negligible changes to PLCRs. Hence, Widar needs to distinguish
the mixed components and identify the relevant parts for velocity
estimation. To achieve this, we propose a novel PLCR extraction
algorithm based on dynamic programming to identify the targeted
frequency components.
Overcoming all these challenges,Widar enables precise tracking
of both human locations and velocities with CSIs. We implement
Widar on COTS Wi-Fi devices and conduct extensive experiments
in real world. The results demonstrate that Widar yields decimeter-
level tracking with a respective median location error of 25 cm
and 38 cm with and without initial positions and a mean relative
velocity error of 13%.
In a nutshell, our core contributions are as follows: First, we build
a geometrical model that captures the relationships of CSI dynamics
and human mobility, which underpins the feasibility of human
sensing without a training phase. Second, we design a system that
simultaneously and directly tracks human moving velocity (both
speed and direction) and location, which provides us richer mobility
information for various applications. We envision this capability as
a key enabler for future motion recognition applications. Third, we
implement Widar and validate its performance on COTS hardware.
Experimental results show thatWidar achieves a decimeter-level
accuracy with only one commercial Wi-Fi sender and two receivers.
2 PRELIMINARY
This section provides a primer on CSI and state-of-the-art model
relating CSI dynamics with human movement. The limitations
and challenges of adapting the existing model to passive human
tracking are discussed.
2.1 Channel State Information
Taking multipath propagation into consideration, the wireless chan-
nel has the following structure at frequency f and time t :
H (f , t) =K∑k=1
αk (t)e−j2π f τk (t ), (1)
where K is the total number of multipath components. αk (t) andτk (t) are the complex attenuation factor and propagation delay
for the k-th path respectively. CSI, provided as a software API by
off-the-shelf Wi-Fi NICs, is a discretely sampled version of channel
response in time-frequency space [4]. In the frequency domain, CSI
is sampled on certain OFDM subcarriers, while in time domain, CSI
is measured for each received 802.11 frame.
2.2 From CSI to PLCR
Relative movements between transceivers and reflectors lead to
Doppler effect, which shifts the frequency of the signal for observers,
as discussed in prior work [10, 15]. The root cause of Doppler
frequency shifts is the change in the length of the signal propagation
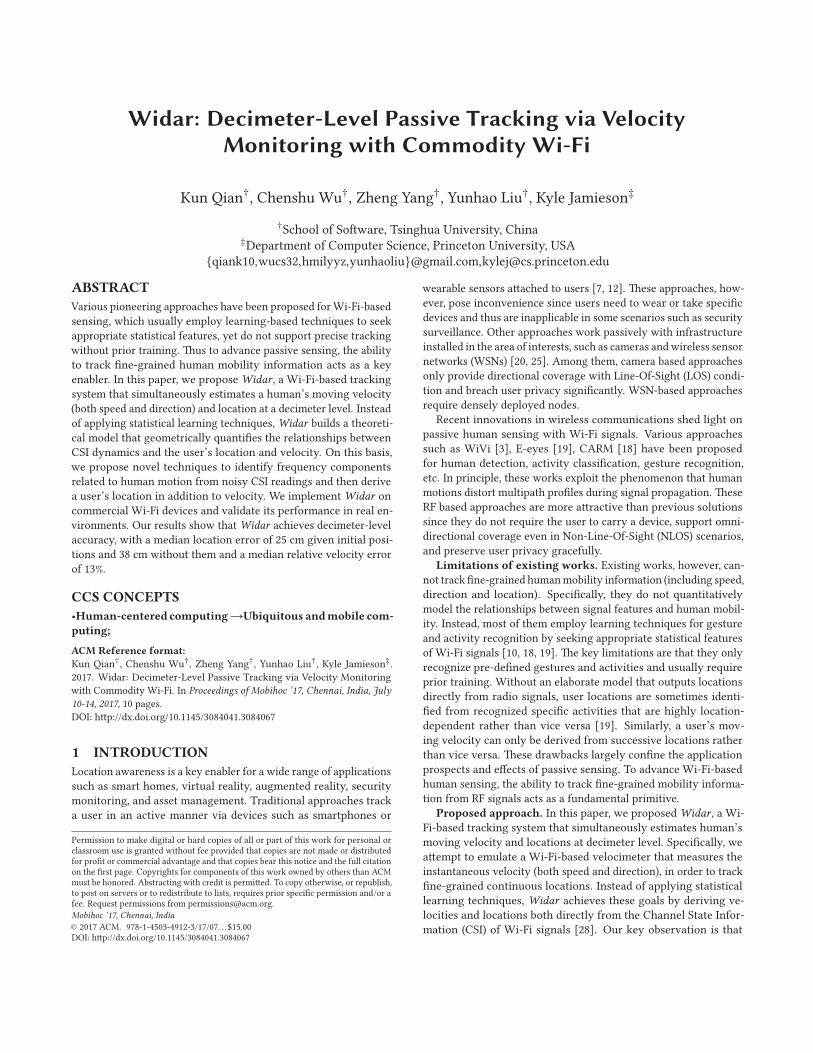
path [18]. As shown in Figure 1a, the frequency shift of the signals
reflected off the moving human is given by:
fD (t) = −1
λ
d
dtd(t) = −f
d
dtτ (t), (2)
where λ, f ,τ (t) are the wave-length, carrier frequency and time of
flight of the signal, and d(t) is the length of the path NLOS2, and
the PLCR r is mathematically defined as r � ddtd(t).
Widar: Decimeter-Level Passive Tracking via Velocity Monitoring with Commodity Wi-Fi Mobihoc ’17, July 10-14, 2017, Chennai, India
NLOS2
NLOS1Wall
Tx Rx
Human
LOS
(a) Multipath propagation.
P1
Tx Rx
Human
LOS2m
2.5m
0.5m
P2
P3
(b) Human walking paths P1, P2, P3
Time(s)0 0.5 1 1.5 2
Spe
ed(m
/s)
0
0.2
0.4
0.6
0.8
1
1.2
1.4
1.6
1.8
2
P1
P2P3
(c) PLCRs calculated from the three scenario in (b)
Figure 1: Typical movement and its effect on the path length change rate (PLCR).
Thus, CSI can be represented as superimposition of path re-
sponses modulated by Doppler frequency shift arising from moving
reflectors on each path:
H (f , t) = (Hs (f ) +∑k ∈Pd
αk (t)ej2π
∫t
−∞fDk (u)du )e−jκ(f ,t ), (3)
where Hs (f ) is the sum of responses for static paths (fD = 0), Pdis the set of dynamic paths(fD � 0). However, CSI is polluted
by unknown phase shifts κ(f , t). which is caused by residue fre-
quency and time offsets of imperfect hardwares. To eliminate the
unknown shift, CARM [18] calculates the CSI power (i.e. conjugate
multiplication of CSI) and extract PLCR through frequency domain.
2.3 Challenges for Tracking
The model described above is helpful for activity recognition when
approximating human velocity as a fixed function of PLCR, which
is, however, insufficient for tracking. To track with CSI, three
challenges exist.
From PLCR to target velocity. As PLCR only reflects the
Doppler frequency shifts, it is not real velocity of the moving tar-
get. Instead, both target velocity and location jointly determine
the PLCR of the target reflecting path. For example, as depicted
in Figure 1b, target P1 is on the perpendicular bisector of the link;
P2 is parallel with the link; P3 is on an ellipse whose foci are the
transmitter and receiver. Suppose an identical constant velocity
and the same length of each trace, we plot their respective PLCRs
in Figure 1c, which turn out to be significantly different from each
other. In conclusion, while PLCR provides some clues of human
motion, it can not directly measure movement. An advanced model
that outputs human mobility information from PLCRs is needed
for tracking.
Loss of the sign. While CSI power excludes unknown phase
offsets, it also loses the sign of frequency shifts due to conjugate
multiplication. Recall Equation 2, the sign of frequency shift is
identical to that of PLCR, which indicates whether the reflector
moves towards or away from the link. Without the sign information,
It is unable to obtain moving directions and further track locations
with velocities.
Interference terms. As shown in Equation 3, CSI contains
irrelevant multipath components, the CSI power, as conjugate mul-
tiplication of itself, may contain irrelevant cross-terms, unwanted
frequency shift terms and time-variant power terms that severely
interfere with the targeted frequency shift components for tracking.
Specifically, when a person walks, not only the torso but also other
moving body parts reflect significant signal power, resulting in mul-
tiple reflection components. To obtain movement velocity, we need
to eliminate disturbances of irrelevant body parts as well as other
sources of interference and retain only the relevant components
among the superimposed observations.
3 MODELING OF CSI-MOBILITY
In this section, we attempt to build a model to directly relate CSI
dynamics to human moving velocity together with location. We
achieve this by considering the geometrical constraints between
reflection paths and human movement. We start with the ideal
case where the sign of PLCR is available, and then extend to the
practical case without such knowledge.
3.1 The Ideal Model
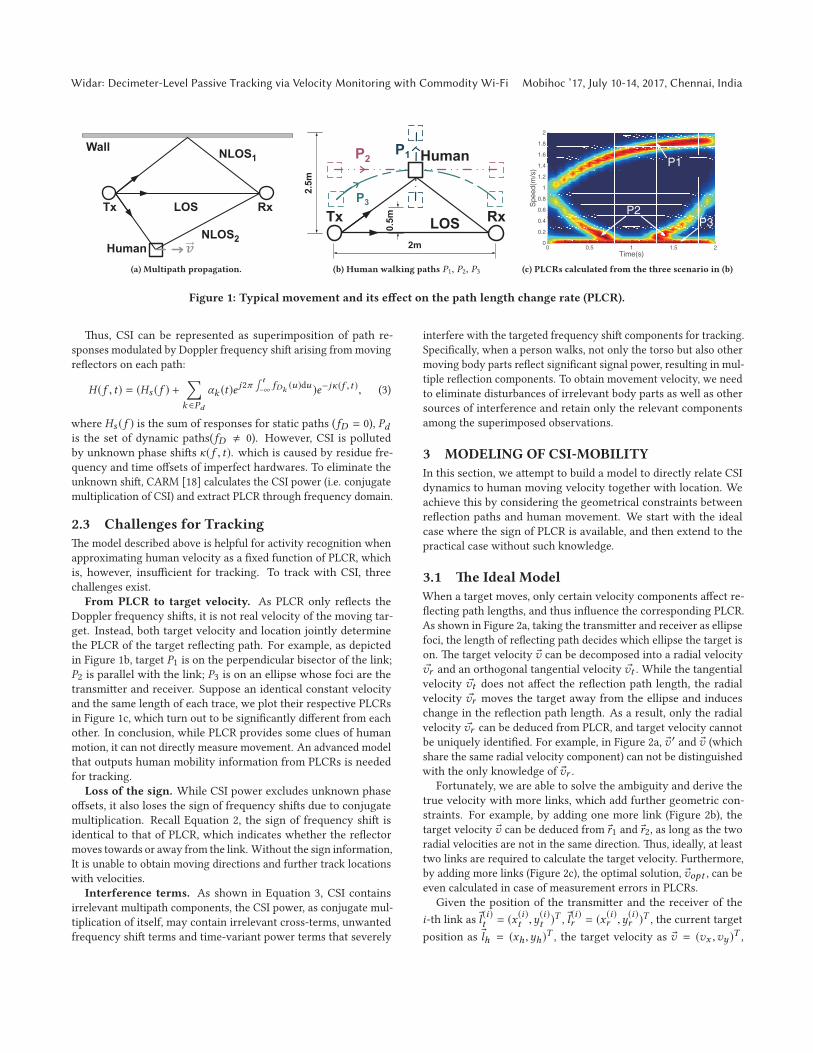
When a target moves, only certain velocity components affect re-
flecting path lengths, and thus influence the corresponding PLCR.
As shown in Figure 2a, taking the transmitter and receiver as ellipse
foci, the length of reflecting path decides which ellipse the target is
on. The target velocity �v can be decomposed into a radial velocity
�vr and an orthogonal tangential velocity �vt . While the tangential
velocity �vt does not affect the reflection path length, the radial
velocity �vr moves the target away from the ellipse and induces
change in the reflection path length. As a result, only the radial
velocity �vr can be deduced from PLCR, and target velocity cannot
be uniquely identified. For example, in Figure 2a, �v ′ and �v (which
share the same radial velocity component) can not be distinguished
with the only knowledge of �vr .Fortunately, we are able to solve the ambiguity and derive the
true velocity with more links, which add further geometric con-
straints. For example, by adding one more link (Figure 2b), the
target velocity �v can be deduced from �r1 and �r2, as long as the two
radial velocities are not in the same direction. Thus, ideally, at least
two links are required to calculate the target velocity. Furthermore,
by adding more links (Figure 2c), the optimal solution, �vopt , can be
even calculated in case of measurement errors in PLCRs.
Given the position of the transmitter and the receiver of the
i-th link as �l(i)t = (x
(i)t ,y
(i)t )T , �l
(i)r = (x
(i)r ,y
(i)r )T , the current target
position as �lh = (xh ,yh )T , the target velocity as �v = (vx ,vy )
T ,
Mobihoc ’17, July 10-14, 2017, Chennai, India Kun Qian†, Chenshu Wu†, Zheng Yang†, Yunhao Liu†, Kyle Jamieson‡
(f)(e)(d) (g)
(c)(b)(a)
Human
Tx Rx
Figure 2: Relation between target velocity and PLCR: the model with information of the sign of PLCR: (a)one link, (b)two
links, (c)three links; the model without the sign information: (d)one link, (e)two links, (f)three links; and (g)consecutiveness
of target movements.
and PLCR as r (i), the PLCR can be algebraically represented by the
target velocity:
a(i)x vx + a
(i)y vy = r
(i), (4)
where
a(i)x =
xh − x(i)t
| |�lh − �l(i)t | |+
xh − x(i)r
| |�lh − �l(i)r | |,
a(i)y =
yh − y(i)t
| |�lh − �l(i)t | |+
yh − y(i)r
| |�lh − �l(i)r | |.
(5)
Aggregating relations of all L links, we have:
A�v = �r , (6)
where
A =
(a(1)x a
(2)x · · · a
(L)x
a(1)y a
(2)y · · · a
(L)y
)T,
�r =(r (1) r (2) · · · r (L)
)T.
The optimal solution for �v can then be expressed in terms of A and
�r :
�vopt = (ATA)−1AT �r . (7)
3.2 The Real Model
The above elegant result, however, does not hold in practice when
the signs of PLCRs are unknown. As shown in Figure 2d, with only
the absolute PLCR value from one link, the target may move in
any direction other than the pair of tangential directions. With one
link added (Figure 2e), the number of velocity candidates reduces
to four, since there are in total four possible combinations of two
unsigned radial velocities of the two links. Adding another link
(Figure 2f) further excludes a pair of candidates with larger fitting
errors. However, further adding any number of extra links does
not solve the ambiguity of the remaining pairs of candidates, in
that all constraints (i.e. absolute PLCRs) added by additional links
are fulfilled by the two candidates due to central symmetry, as in
Figure 2f.
Fortunately, such symmetrical ambiguity can be resolved as long
as the sign of PLCR of any link is known. Recent art, WiDir [23],
proposes to identify the sign of PLCR through time lags of signal
variations of CSI subcarriers. The key insight is that different sub-
carriers experience non-zero time lags in motion-induced signal
variations due to their slightly different wavelengths. Specifically,
as the target moves towards a link, subcarriers with larger wave-
lengths experience constructive variations earlier than those with
smaller wavelengths, while later as the target moves away from
the link. Thus, the signs of PLCR could be inferred by inspecting
signs of the time lags.
However, WiDir has two major limitations: 1) The calculated
time lag is unstable due to severe noises and thus long duration
data is required to statistically identify the correct sign of PLCR. 2)
Even with sufficient data, WiDir fails to identify the sign of PLCR
when the target moves in approximately parallel with the link due
to evenly distributed time lags in such case. Thus, Widar integrate
WiDir to opportunistically obtain hints of signs of PLCR.
To fully resolve the ambiguity of solutions, we further introduce
constraints based on the continuity of target movement in the
real world. Specifically, for human movement, the directions of
consecutive velocities within a certain small time interval (e.g. 100
ms), are likely to be similar, due to natural limitations on people’s
moving accelerations and the high sampling rates supported by
commercial devices. Figure 2g illustratively demonstrates the effect
of the constraint. Suppose the last measurement of target velocity
is �vk−1. At time k , for the two symmetric velocity candidates,
�vk and �v ′kwith the smallest fitting error, �vk holds a significantly
higher probability to be the current velocity since it is almost in
Widar: Decimeter-Level Passive Tracking via Velocity Monitoring with Commodity Wi-Fi Mobihoc ’17, July 10-14, 2017, Chennai, India
5 10 15 20 25 30Subcarrier No.
5
10
15
20
25
30
Sub
carr
ier
No.
0.3
0.4
0.5
0.6
0.7
0.8
0.9
1
Cor
rela
tion
Coe
ffici
ent
(a) Walking
5 10 15 20 25 30Subcarrier No.
5
10
15
20
25
30
Sub
carr
ier
No.
0.2
0.4
0.6
0.8
1
Cor
rela
tion
Coe
ffici
ent
(b) Standing
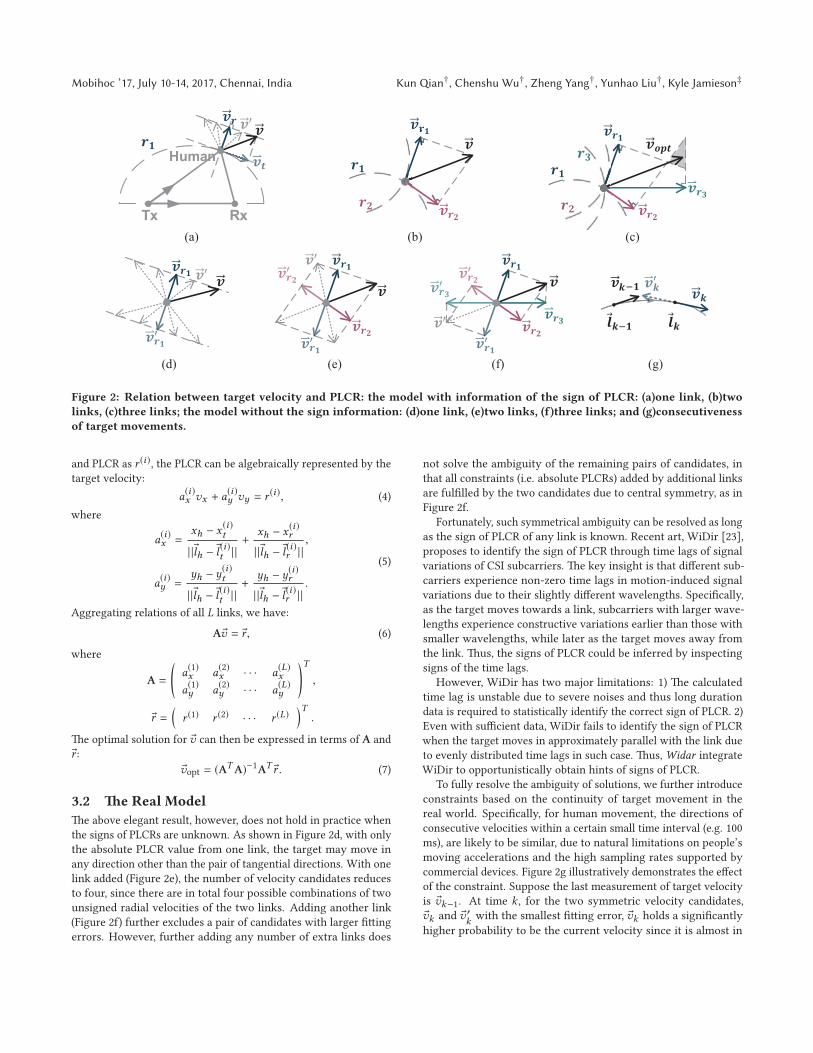
Figure 3: Cross-correlation of subcarriers when a person
walks and stands still
0 1 2 3 4Time(s)
0
0.5
1
1.5
2
2.5
3
Vel
ocity
(m/s
)
(a) Spectrogram
0 1 2 3 4Time(s)
0
0.5
1
1.5
2
2.5
3
Vel
ocity
(m/s
)
MaxAccSmooth
(b) PLCRs
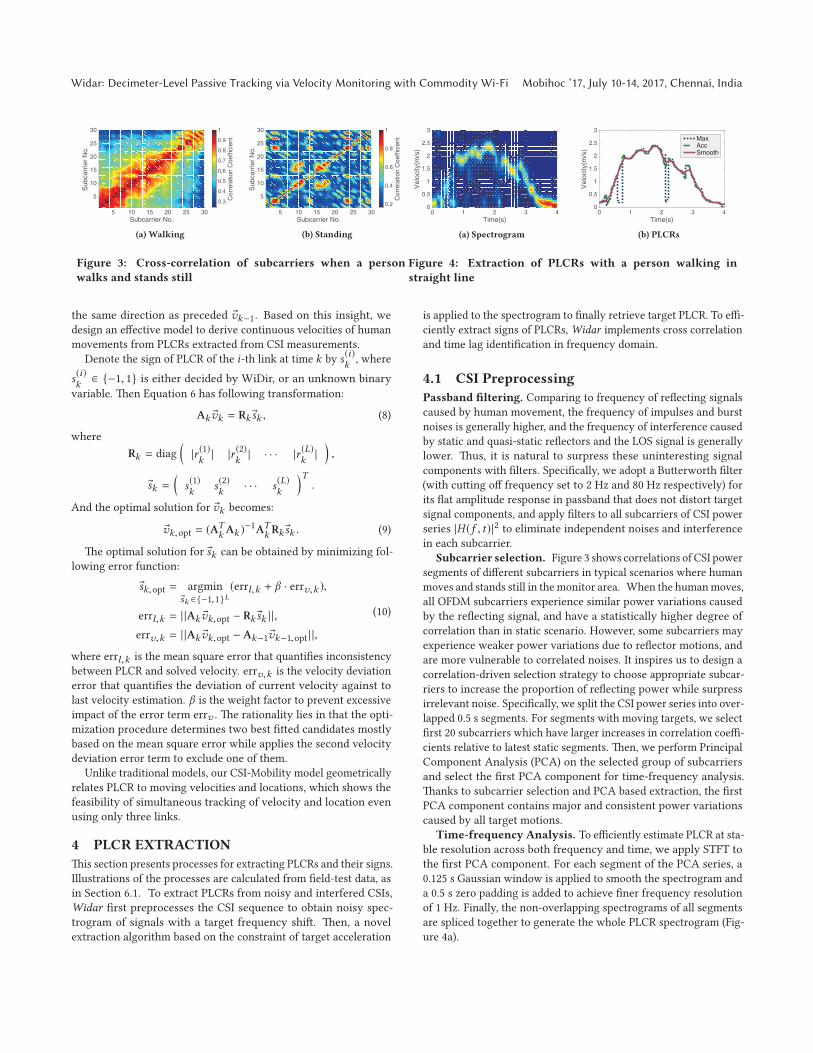
Figure 4: Extraction of PLCRs with a person walking in
straight line
the same direction as preceded �vk−1. Based on this insight, we
design an effective model to derive continuous velocities of human
movements from PLCRs extracted from CSI measurements.
Denote the sign of PLCR of the i-th link at time k by s(i)k, where
s(i)k
∈ {−1, 1} is either decided by WiDir, or an unknown binary
variable. Then Equation 6 has following transformation:
Ak �vk = Rk �sk , (8)
where
Rk = diag(|r(1)k
| |r(2)k
| · · · |r(L)k
|),
�sk =(s(1)k
s(2)k
· · · s(L)k
)T.
And the optimal solution for �vk becomes:
�vk,opt = (ATkAk )
−1ATkRk �sk . (9)
The optimal solution for �sk can be obtained by minimizing fol-
lowing error function:
�sk,opt = argmin�sk ∈{−1,1}L
(errl,k + β · errv,k ),
errl,k = | |Ak �vk,opt − Rk �sk | |,
errv,k = | |Ak �vk,opt − Ak−1 �vk−1,opt | |,
(10)
where errl,k is the mean square error that quantifies inconsistency
between PLCR and solved velocity. errv,k is the velocity deviation
error that quantifies the deviation of current velocity against to
last velocity estimation. β is the weight factor to prevent excessive
impact of the error term errv . The rationality lies in that the opti-
mization procedure determines two best fitted candidates mostly
based on the mean square error while applies the second velocity
deviation error term to exclude one of them.
Unlike traditional models, our CSI-Mobility model geometrically
relates PLCR to moving velocities and locations, which shows the
feasibility of simultaneous tracking of velocity and location even
using only three links.
4 PLCR EXTRACTION
This section presents processes for extracting PLCRs and their signs.
Illustrations of the processes are calculated from field-test data, as
in Section 6.1. To extract PLCRs from noisy and interfered CSIs,
Widar first preprocesses the CSI sequence to obtain noisy spec-
trogram of signals with a target frequency shift. Then, a novel
extraction algorithm based on the constraint of target acceleration
is applied to the spectrogram to finally retrieve target PLCR. To effi-
ciently extract signs of PLCRs, Widar implements cross correlation
and time lag identification in frequency domain.
4.1 CSI Preprocessing
Passband filtering. Comparing to frequency of reflecting signals
caused by human movement, the frequency of impulses and burst
noises is generally higher, and the frequency of interference caused
by static and quasi-static reflectors and the LOS signal is generally
lower. Thus, it is natural to surpress these uninteresting signal
components with filters. Specifically, we adopt a Butterworth filter
(with cutting off frequency set to 2 Hz and 80 Hz respectively) for
its flat amplitude response in passband that does not distort target
signal components, and apply filters to all subcarriers of CSI power
series |H (f , t)|2 to eliminate independent noises and interference
in each subcarrier.
Subcarrier selection. Figure 3 shows correlations of CSI power
segments of different subcarriers in typical scenarios where human
moves and stands still in the monitor area. When the humanmoves,
all OFDM subcarriers experience similar power variations caused
by the reflecting signal, and have a statistically higher degree of
correlation than in static scenario. However, some subcarriers may
experience weaker power variations due to reflector motions, and
are more vulnerable to correlated noises. It inspires us to design a
correlation-driven selection strategy to choose appropriate subcar-
riers to increase the proportion of reflecting power while surpress
irrelevant noise. Specifically, we split the CSI power series into over-
lapped 0.5 s segments. For segments with moving targets, we select
first 20 subcarriers which have larger increases in correlation coeffi-
cients relative to latest static segments. Then, we perform Principal
Component Analysis (PCA) on the selected group of subcarriers
and select the first PCA component for time-frequency analysis.
Thanks to subcarrier selection and PCA based extraction, the first
PCA component contains major and consistent power variations
caused by all target motions.
Time-frequency Analysis. To efficiently estimate PLCR at sta-
ble resolution across both frequency and time, we apply STFT to
the first PCA component. For each segment of the PCA series, a
0.125 s Gaussian window is applied to smooth the spectrogram and
a 0.5 s zero padding is added to achieve finer frequency resolution
of 1 Hz. Finally, the non-overlapping spectrograms of all segments
are spliced together to generate the whole PLCR spectrogram (Fig-
ure 4a).
Mobihoc ’17, July 10-14, 2017, Chennai, India Kun Qian†, Chenshu Wu†, Zheng Yang†, Yunhao Liu†, Kyle Jamieson‡
X(m)0 0.8 1.6 2.4 3.2 4 4.8
Y(m
)
0
0.8
1.6
2.4
3.2
4
4.8
Ground truthFalse SegmentTrue Segment
(a) Initial segment
X(m)0 0.8 1.6 2.4 3.2 4 4.8
Y(m
)
0
0.8
1.6
2.4
3.2
4
4.8
(b) 2nd segment
X(m)0 0.8 1.6 2.4 3.2 4 4.8
Y(m
)
0
0.8
1.6
2.4
3.2
4
4.8
(c) 3rd segment
X(m)0 0.8 1.6 2.4 3.2 4 4.8
Y(m
)
0
0.8
1.6
2.4
3.2
4
4.8
(d) Final segment
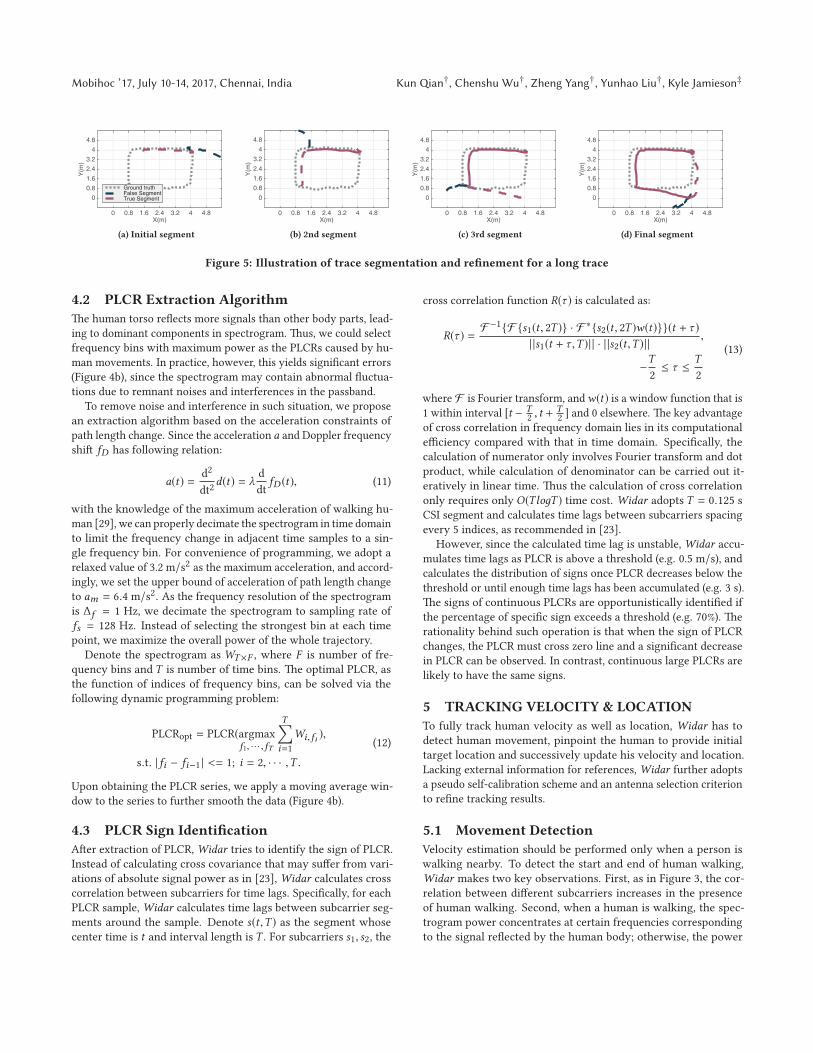
Figure 5: Illustration of trace segmentation and refinement for a long trace
4.2 PLCR Extraction Algorithm
The human torso reflects more signals than other body parts, lead-
ing to dominant components in spectrogram. Thus, we could select
frequency bins with maximum power as the PLCRs caused by hu-
man movements. In practice, however, this yields significant errors
(Figure 4b), since the spectrogram may contain abnormal fluctua-
tions due to remnant noises and interferences in the passband.
To remove noise and interference in such situation, we propose
an extraction algorithm based on the acceleration constraints of
path length change. Since the acceleration a and Doppler frequencyshift fD has following relation:
a(t) =d2
dt2d(t) = λ
d
dtfD (t), (11)
with the knowledge of the maximum acceleration of walking hu-
man [29], we can properly decimate the spectrogram in time domain
to limit the frequency change in adjacent time samples to a sin-
gle frequency bin. For convenience of programming, we adopt a
relaxed value of 3.2 m/s2 as the maximum acceleration, and accord-
ingly, we set the upper bound of acceleration of path length change
to am = 6.4 m/s2. As the frequency resolution of the spectrogram
is Δf = 1 Hz, we decimate the spectrogram to sampling rate of
fs = 128 Hz. Instead of selecting the strongest bin at each time
point, we maximize the overall power of the whole trajectory.
Denote the spectrogram asWT×F , where F is number of fre-
quency bins and T is number of time bins. The optimal PLCR, as
the function of indices of frequency bins, can be solved via the
following dynamic programming problem:
PLCRopt = PLCR(argmaxf1, · · · ,fT
T∑i=1
Wi,fi ),
s.t. | fi − fi−1 | <= 1; i = 2, · · · ,T .
(12)
Upon obtaining the PLCR series, we apply a moving average win-
dow to the series to further smooth the data (Figure 4b).
4.3 PLCR Sign Identification
After extraction of PLCR, Widar tries to identify the sign of PLCR.
Instead of calculating cross covariance that may suffer from vari-
ations of absolute signal power as in [23],Widar calculates cross
correlation between subcarriers for time lags. Specifically, for each
PLCR sample,Widar calculates time lags between subcarrier seg-
ments around the sample. Denote s(t ,T ) as the segment whose
center time is t and interval length is T . For subcarriers s1, s2, the
cross correlation function R(τ ) is calculated as:
R(τ ) =F−1{F {s1(t , 2T )} · F
∗{s2(t , 2T )w(t)}}(t + τ )
| |s1(t + τ ,T )| | · | |s2(t ,T )| |,
−T
2≤ τ ≤
T
2
(13)
where F is Fourier transform, andw(t) is a window function that is
1 within interval [t − T2 , t +
T2 ] and 0 elsewhere. The key advantage
of cross correlation in frequency domain lies in its computational
efficiency compared with that in time domain. Specifically, the
calculation of numerator only involves Fourier transform and dot
product, while calculation of denominator can be carried out it-
eratively in linear time. Thus the calculation of cross correlation
only requires only O(TloдT ) time cost. Widar adopts T = 0.125 s
CSI segment and calculates time lags between subcarriers spacing
every 5 indices, as recommended in [23].
However, since the calculated time lag is unstable,Widar accu-
mulates time lags as PLCR is above a threshold (e.g. 0.5 m/s), and
calculates the distribution of signs once PLCR decreases below the
threshold or until enough time lags has been accumulated (e.g. 3 s).
The signs of continuous PLCRs are opportunistically identified if
the percentage of specific sign exceeds a threshold (e.g. 70%). The
rationality behind such operation is that when the sign of PLCR
changes, the PLCR must cross zero line and a significant decrease
in PLCR can be observed. In contrast, continuous large PLCRs are
likely to have the same signs.
5 TRACKING VELOCITY & LOCATION
To fully track human velocity as well as location, Widar has to
detect human movement, pinpoint the human to provide initial
target location and successively update his velocity and location.
Lacking external information for references,Widar further adopts
a pseudo self-calibration scheme and an antenna selection criterion
to refine tracking results.
5.1 Movement Detection
Velocity estimation should be performed only when a person is
walking nearby. To detect the start and end of human walking,
Widar makes two key observations. First, as in Figure 3, the cor-
relation between different subcarriers increases in the presence
of human walking. Second, when a human is walking, the spec-
trogram power concentrates at certain frequencies corresponding
to the signal reflected by the human body; otherwise, the power
Widar: Decimeter-Level Passive Tracking via Velocity Monitoring with Commodity Wi-Fi Mobihoc ’17, July 10-14, 2017, Chennai, India
4m
4m
0.8m
0.8m
Setup2Setup1
Tx Rx1Rx2
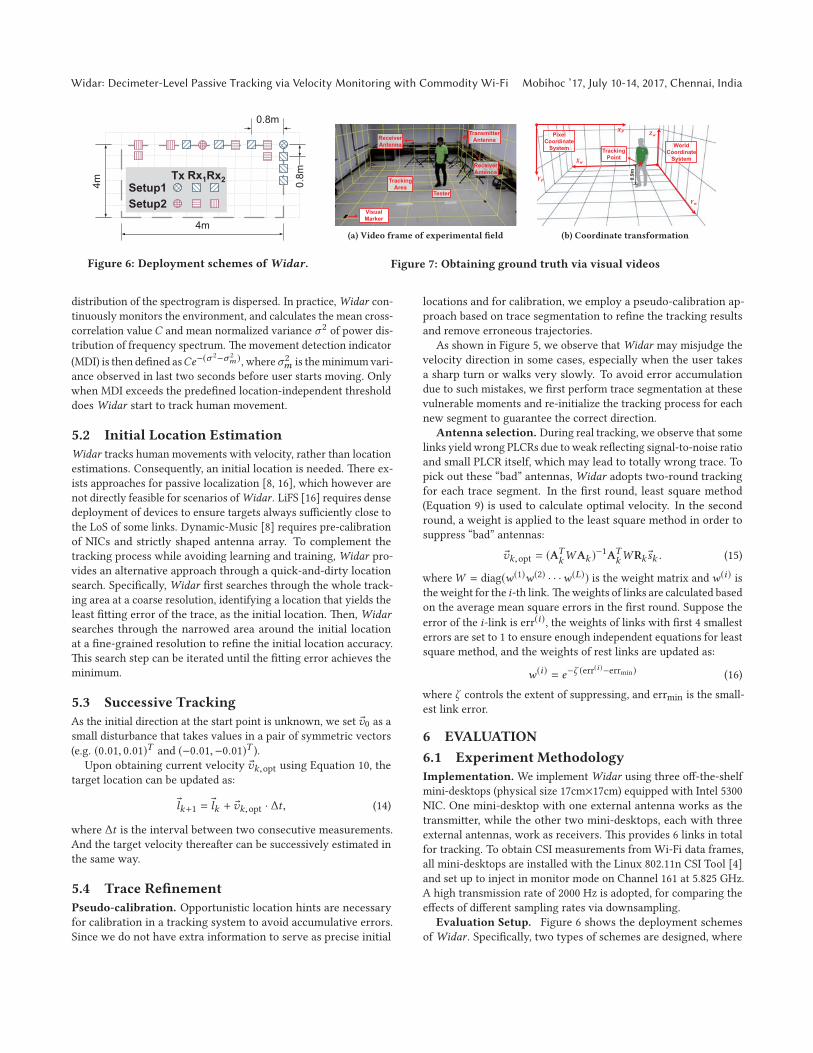
Figure 6: Deployment schemes ofWidar.
TrackingArea
Tester
TransmitterAntennaReceiver
Antenna
VisualMarker
ReceiverAntenna
(a) Video frame of experimental field
0.9m *
TrackingPoint
PixelCoordinateSystem World
CoordinateSystem
(b) Coordinate transformation
Figure 7: Obtaining ground truth via visual videos
distribution of the spectrogram is dispersed. In practice,Widar con-
tinuously monitors the environment, and calculates the mean cross-
correlation valueC and mean normalized variance σ 2 of power dis-
tribution of frequency spectrum. The movement detection indicator
(MDI) is then defined asCe−(σ2−σ 2
m ), whereσ 2m is theminimumvari-
ance observed in last two seconds before user starts moving. Only
when MDI exceeds the predefined location-independent threshold
doesWidar start to track human movement.
5.2 Initial Location Estimation
Widar tracks human movements with velocity, rather than location
estimations. Consequently, an initial location is needed. There ex-
ists approaches for passive localization [8, 16], which however are
not directly feasible for scenarios ofWidar . LiFS [16] requires dense
deployment of devices to ensure targets always sufficiently close to
the LoS of some links. Dynamic-Music [8] requires pre-calibration
of NICs and strictly shaped antenna array. To complement the
tracking process while avoiding learning and training, Widar pro-
vides an alternative approach through a quick-and-dirty location
search. Specifically, Widar first searches through the whole track-
ing area at a coarse resolution, identifying a location that yields the
least fitting error of the trace, as the initial location. Then,Widar
searches through the narrowed area around the initial location
at a fine-grained resolution to refine the initial location accuracy.
This search step can be iterated until the fitting error achieves the
minimum.
5.3 Successive Tracking
As the initial direction at the start point is unknown, we set �v0 as asmall disturbance that takes values in a pair of symmetric vectors
(e.g. (0.01, 0.01)T and (−0.01,−0.01)T ).
Upon obtaining current velocity �vk,opt using Equation 10, the
target location can be updated as:
�lk+1 = �lk + �vk,opt · Δt , (14)
where Δt is the interval between two consecutive measurements.
And the target velocity thereafter can be successively estimated in
the same way.
5.4 Trace Refinement
Pseudo-calibration. Opportunistic location hints are necessary
for calibration in a tracking system to avoid accumulative errors.
Since we do not have extra information to serve as precise initial
locations and for calibration, we employ a pseudo-calibration ap-
proach based on trace segmentation to refine the tracking results
and remove erroneous trajectories.
As shown in Figure 5, we observe that Widar may misjudge the
velocity direction in some cases, especially when the user takes
a sharp turn or walks very slowly. To avoid error accumulation
due to such mistakes, we first perform trace segmentation at these
vulnerable moments and re-initialize the tracking process for each
new segment to guarantee the correct direction.
Antenna selection. During real tracking, we observe that some
links yield wrong PLCRs due to weak reflecting signal-to-noise ratio
and small PLCR itself, which may lead to totally wrong trace. To
pick out these “bad” antennas,Widar adopts two-round tracking
for each trace segment. In the first round, least square method
(Equation 9) is used to calculate optimal velocity. In the second
round, a weight is applied to the least square method in order to
suppress “bad” antennas:
�vk,opt = (ATkWAk )
−1ATkWRk �sk . (15)
whereW = diag(w(1)w(2) · · ·w(L)) is the weight matrix andw(i) is
the weight for the i-th link. Theweights of links are calculated based
on the average mean square errors in the first round. Suppose the
error of the i-link is err(i), the weights of links with first 4 smallest
errors are set to 1 to ensure enough independent equations for least
square method, and the weights of rest links are updated as:
w(i) = e−ζ (err(i )−errmin) (16)
where ζ controls the extent of suppressing, and errmin is the small-
est link error.
6 EVALUATION
6.1 Experiment Methodology
Implementation. We implement Widar using three off-the-shelf
mini-desktops (physical size 17cm×17cm) equipped with Intel 5300
NIC. One mini-desktop with one external antenna works as the
transmitter, while the other two mini-desktops, each with three
external antennas, work as receivers. This provides 6 links in total
for tracking. To obtain CSI measurements from Wi-Fi data frames,
all mini-desktops are installed with the Linux 802.11n CSI Tool [4]
and set up to inject in monitor mode on Channel 161 at 5.825 GHz.
A high transmission rate of 2000 Hz is adopted, for comparing the
effects of different sampling rates via downsampling.
Evaluation Setup. Figure 6 shows the deployment schemes
ofWidar . Specifically, two types of schemes are designed, where
Mobihoc ’17, July 10-14, 2017, Chennai, India Kun Qian†, Chenshu Wu†, Zheng Yang†, Yunhao Liu†, Kyle Jamieson‡
0 20 40 60 80 100
Relative Speed Error(%)
0
0.2
0.4
0.6
0.8
1
CD
F
WidarMax PLCRSingle PLCR
(a) Velocity amplitude
-90 -60 -30 0 30 60 90
Direction Error(o)
0
0.2
0.4
0.6
0.8
1
CD
F
WidarWiDir
(b) Velocity direction
0 0.5 1 1.5
Tracking Error(m)
0
0.2
0.4
0.6
0.8
1
CD
F
With Intial LocationW/O Initial Location
(c) Location
0.8 1.6 2.4 3.2 4
X(m)
0.8
1.6
2.4
3.2
4
Y(m
)
0.1
0.2
0.3
0.4
0.5
0.6
Tra
ckin
g E
rror
(m)
(d) Tracking error map
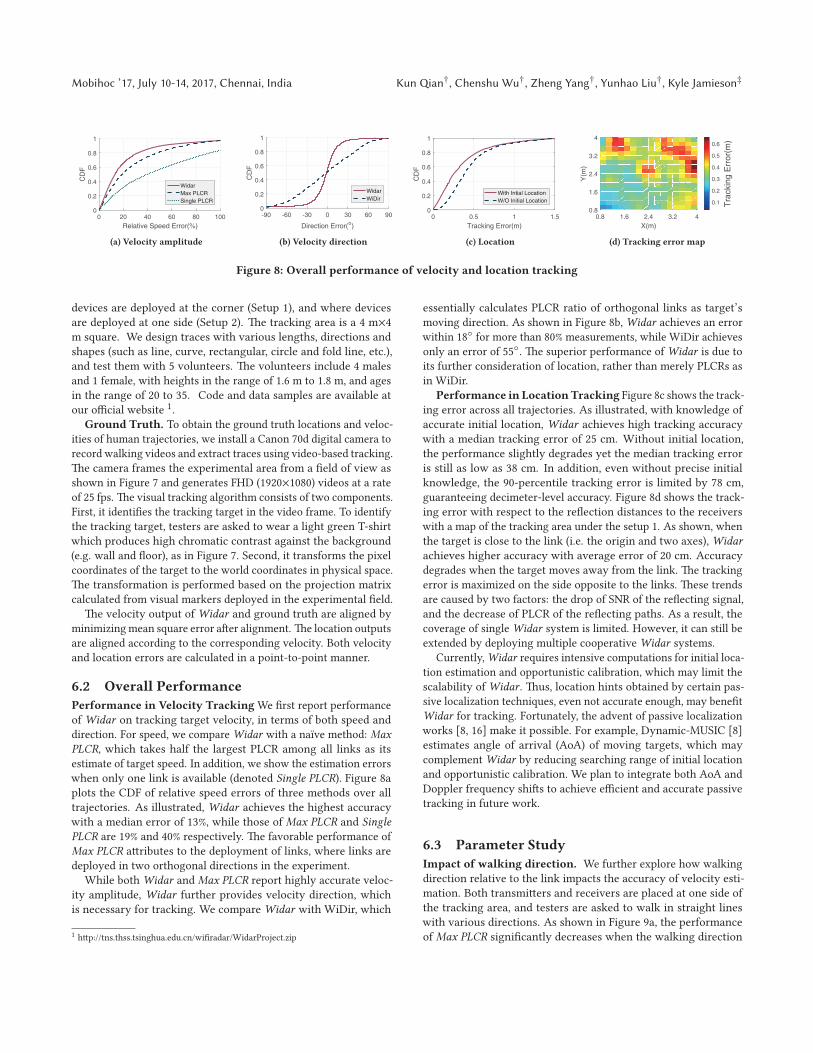
Figure 8: Overall performance of velocity and location tracking
devices are deployed at the corner (Setup 1), and where devices
are deployed at one side (Setup 2). The tracking area is a 4 m×4
m square. We design traces with various lengths, directions and
shapes (such as line, curve, rectangular, circle and fold line, etc.),
and test them with 5 volunteers. The volunteers include 4 males
and 1 female, with heights in the range of 1.6 m to 1.8 m, and ages
in the range of 20 to 35. Code and data samples are available at
our official website 1.
Ground Truth. To obtain the ground truth locations and veloc-
ities of human trajectories, we install a Canon 70d digital camera to
record walking videos and extract traces using video-based tracking.
The camera frames the experimental area from a field of view as
shown in Figure 7 and generates FHD (1920×1080) videos at a rate
of 25 fps. The visual tracking algorithm consists of two components.
First, it identifies the tracking target in the video frame. To identify
the tracking target, testers are asked to wear a light green T-shirt
which produces high chromatic contrast against the background
(e.g. wall and floor), as in Figure 7. Second, it transforms the pixel
coordinates of the target to the world coordinates in physical space.
The transformation is performed based on the projection matrix
calculated from visual markers deployed in the experimental field.
The velocity output of Widar and ground truth are aligned by
minimizingmean square error after alignment. The location outputs
are aligned according to the corresponding velocity. Both velocity
and location errors are calculated in a point-to-point manner.
6.2 Overall Performance
Performance in Velocity Tracking We first report performance
of Widar on tracking target velocity, in terms of both speed and
direction. For speed, we compare Widar with a naıve method: Max
PLCR, which takes half the largest PLCR among all links as its
estimate of target speed. In addition, we show the estimation errors
when only one link is available (denoted Single PLCR). Figure 8a
plots the CDF of relative speed errors of three methods over all
trajectories. As illustrated, Widar achieves the highest accuracy
with a median error of 13%, while those of Max PLCR and Single
PLCR are 19% and 40% respectively. The favorable performance of
Max PLCR attributes to the deployment of links, where links are
deployed in two orthogonal directions in the experiment.
While bothWidar and Max PLCR report highly accurate veloc-
ity amplitude, Widar further provides velocity direction, which
is necessary for tracking. We compareWidar with WiDir, which
1 http://tns.thss.tsinghua.edu.cn/wifiradar/WidarProject.zip
essentially calculates PLCR ratio of orthogonal links as target’s
moving direction. As shown in Figure 8b, Widar achieves an error
within 18◦ for more than 80% measurements, while WiDir achieves
only an error of 55◦. The superior performance of Widar is due to
its further consideration of location, rather than merely PLCRs as
in WiDir.
Performance in LocationTracking Figure 8c shows the track-
ing error across all trajectories. As illustrated, with knowledge of
accurate initial location, Widar achieves high tracking accuracy
with a median tracking error of 25 cm. Without initial location,
the performance slightly degrades yet the median tracking error
is still as low as 38 cm. In addition, even without precise initial
knowledge, the 90-percentile tracking error is limited by 78 cm,
guaranteeing decimeter-level accuracy. Figure 8d shows the track-
ing error with respect to the reflection distances to the receivers
with a map of the tracking area under the setup 1. As shown, when
the target is close to the link (i.e. the origin and two axes),Widar
achieves higher accuracy with average error of 20 cm. Accuracy
degrades when the target moves away from the link. The tracking
error is maximized on the side opposite to the links. These trends
are caused by two factors: the drop of SNR of the reflecting signal,
and the decrease of PLCR of the reflecting paths. As a result, the
coverage of single Widar system is limited. However, it can still be
extended by deploying multiple cooperativeWidar systems.
Currently,Widar requires intensive computations for initial loca-
tion estimation and opportunistic calibration, which may limit the
scalability ofWidar . Thus, location hints obtained by certain pas-
sive localization techniques, even not accurate enough, may benefit
Widar for tracking. Fortunately, the advent of passive localization
works [8, 16] make it possible. For example, Dynamic-MUSIC [8]
estimates angle of arrival (AoA) of moving targets, which may
complement Widar by reducing searching range of initial location
and opportunistic calibration. We plan to integrate both AoA and
Doppler frequency shifts to achieve efficient and accurate passive
tracking in future work.
6.3 Parameter Study
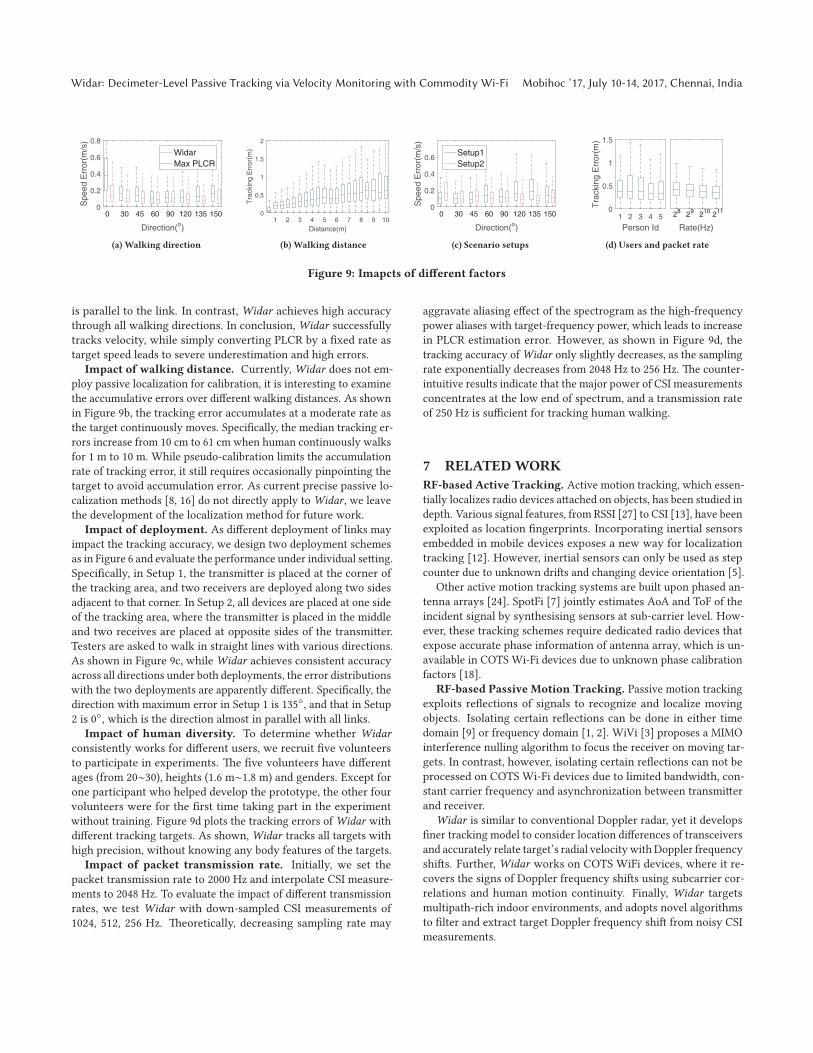
Impact of walking direction. We further explore how walking
direction relative to the link impacts the accuracy of velocity esti-
mation. Both transmitters and receivers are placed at one side of
the tracking area, and testers are asked to walk in straight lines
with various directions. As shown in Figure 9a, the performance
of Max PLCR significantly decreases when the walking direction
Widar: Decimeter-Level Passive Tracking via Velocity Monitoring with Commodity Wi-Fi Mobihoc ’17, July 10-14, 2017, Chennai, India
Direction(o)
0
0.2
0.4
0.6
0.8
Spe
ed E
rror
(m/s
)
0 30 45 60 90 120 135 150
WidarMax PLCR
(a) Walking direction
1 2 3 4 5 6 7 8 9 10
Distance(m)
0
0.5
1
1.5
2
Tra
ckin
g E
rror
(m)
(b) Walking distance
Direction(o)
0
0.2
0.4
0.6
Spe
ed E
rror
(m/s
)
0 30 45 60 90 120 135 150
Setup1Setup2
(c) Scenario setups
1 2 3 4 5
Person Id
0
0.5
1
1.5
Tra
ckin
g E
rror
(m)
Rate(Hz)
28 29 210 211
(d) Users and packet rate
Figure 9: Imapcts of different factors
is parallel to the link. In contrast, Widar achieves high accuracy
through all walking directions. In conclusion,Widar successfully
tracks velocity, while simply converting PLCR by a fixed rate as
target speed leads to severe underestimation and high errors.
Impact of walking distance. Currently,Widar does not em-
ploy passive localization for calibration, it is interesting to examine
the accumulative errors over different walking distances. As shown
in Figure 9b, the tracking error accumulates at a moderate rate as
the target continuously moves. Specifically, the median tracking er-
rors increase from 10 cm to 61 cm when human continuously walks
for 1 m to 10 m. While pseudo-calibration limits the accumulation
rate of tracking error, it still requires occasionally pinpointing the
target to avoid accumulation error. As current precise passive lo-
calization methods [8, 16] do not directly apply to Widar , we leave
the development of the localization method for future work.
Impact of deployment. As different deployment of links may
impact the tracking accuracy, we design two deployment schemes
as in Figure 6 and evaluate the performance under individual setting.
Specifically, in Setup 1, the transmitter is placed at the corner of
the tracking area, and two receivers are deployed along two sides
adjacent to that corner. In Setup 2, all devices are placed at one side
of the tracking area, where the transmitter is placed in the middle
and two receives are placed at opposite sides of the transmitter.
Testers are asked to walk in straight lines with various directions.
As shown in Figure 9c, whileWidar achieves consistent accuracy
across all directions under both deployments, the error distributions
with the two deployments are apparently different. Specifically, the
direction with maximum error in Setup 1 is 135◦, and that in Setup
2 is 0◦, which is the direction almost in parallel with all links.
Impact of human diversity. To determine whether Widar
consistently works for different users, we recruit five volunteers
to participate in experiments. The five volunteers have different
ages (from 20∼30), heights (1.6 m∼1.8 m) and genders. Except for
one participant who helped develop the prototype, the other four
volunteers were for the first time taking part in the experiment
without training. Figure 9d plots the tracking errors of Widar with
different tracking targets. As shown, Widar tracks all targets with
high precision, without knowing any body features of the targets.
Impact of packet transmission rate. Initially, we set the
packet transmission rate to 2000 Hz and interpolate CSI measure-
ments to 2048 Hz. To evaluate the impact of different transmission
rates, we test Widar with down-sampled CSI measurements of
1024, 512, 256 Hz. Theoretically, decreasing sampling rate may
aggravate aliasing effect of the spectrogram as the high-frequency
power aliases with target-frequency power, which leads to increase
in PLCR estimation error. However, as shown in Figure 9d, the
tracking accuracy ofWidar only slightly decreases, as the sampling
rate exponentially decreases from 2048 Hz to 256 Hz. The counter-
intuitive results indicate that the major power of CSI measurements
concentrates at the low end of spectrum, and a transmission rate
of 250 Hz is sufficient for tracking human walking.
7 RELATEDWORK
RF-based Active Tracking. Active motion tracking, which essen-
tially localizes radio devices attached on objects, has been studied in
depth. Various signal features, from RSSI [27] to CSI [13], have been
exploited as location fingerprints. Incorporating inertial sensors
embedded in mobile devices exposes a new way for localization
tracking [12]. However, inertial sensors can only be used as step
counter due to unknown drifts and changing device orientation [5].
Other active motion tracking systems are built upon phased an-
tenna arrays [24]. SpotFi [7] jointly estimates AoA and ToF of the
incident signal by synthesising sensors at sub-carrier level. How-
ever, these tracking schemes require dedicated radio devices that
expose accurate phase information of antenna array, which is un-
available in COTS Wi-Fi devices due to unknown phase calibration
factors [18].
RF-based Passive Motion Tracking. Passive motion tracking
exploits reflections of signals to recognize and localize moving
objects. Isolating certain reflections can be done in either time
domain [9] or frequency domain [1, 2]. WiVi [3] proposes a MIMO
interference nulling algorithm to focus the receiver on moving tar-
gets. In contrast, however, isolating certain reflections can not be
processed on COTS Wi-Fi devices due to limited bandwidth, con-
stant carrier frequency and asynchronization between transmitter
and receiver.
Widar is similar to conventional Doppler radar, yet it develops
finer tracking model to consider location differences of transceivers
and accurately relate target’s radial velocity with Doppler frequency
shifts. Further, Widar works on COTS WiFi devices, where it re-
covers the signs of Doppler frequency shifts using subcarrier cor-
relations and human motion continuity. Finally, Widar targets
multipath-rich indoor environments, and adopts novel algorithms
to filter and extract target Doppler frequency shift from noisy CSI
measurements.
Mobihoc ’17, July 10-14, 2017, Chennai, India Kun Qian†, Chenshu Wu†, Zheng Yang†, Yunhao Liu†, Kyle Jamieson‡
Recently, mTrack [21] designs a mmWave radio system to track
writing objects with signal phase shifting. WiDeo [6] jointly esti-
mates ToF and AoA to identify all reflectors and extract moving
ones by comparing successive estimation. Tadar [26] tracks hu-
man motion by extracting phase of signals reflected off human
body. WiDraw [14] tracks in-air hand motion by computing AoA of
blocked incident signals. D-Watch [17] tracks human by identifying
AoA of RFID tags’ backscatter signal blocked by human. Similarly,
phase information used in these tracking systems is unavailable in
COTS Wi-Fi devices.
Recent techniques achieve decimeter-level passive localization
using COTS Wi-Fi [8, 16]. LiFS [16] leverages shadowing effect of
targets near LoS of links and requires dense deployment of devices.
Dynamic-Music [8] leverages the incoherence between reflecting
signal and static signal to separate reflecting signal and estimate its
AoA. Thus it requires pre-calibration of NICs and strictly shaped
antenna array. In contrast,Widar targets at more practical scenarios
where only a few devices are casually deployed on area edges.
Wi-Fi-basedGesture andActivityRecognition. Wi-Fi-based
activity recognition attracts considerable research interests recently.
Many innovative applications and systems have been designed, in-
cluding gesture recognition [19], respiration detection [22] and
direction estimation [11], etc. These works mainly target at activity
recognition instead of location tracking and speed estimation. As
such, most of them employ learning-based solutions for recognition.
WiSee [10] leverages Doppler effect to enable gesture recognition
using specialized hardwares (USRP). CARM [18] uses off-the-shelf
Wi-Fi NICs and correlates CSI value dynamics with human motion,
yet without velocity. In this paper, Widar further reveals the re-
lationships of CSI dynamics and real human moving velocity. In
addition, Widar targets movement tracking and enables simultane-
ous estimation of human velocities and locations.
8 CONCLUSION
In this paper, we propose a Wi-Fi-based passive tracking system
Widar that simultaneously estimates human’s location and velocity
at decimeter level. First we build a model that geometrically quan-
tifies the relationships between CSI dynamics and human mobility.
Then we propose several novel techniques to translate this model
into a fine-grained tracking system. We implementWidar on COTS
Wi-Fi devices and evaluate it in real environments. Experimental
results show that Widar achieves decimeter-level accuracy with
a median location error of 25 cm and 38 cm with and without ini-
tial positions and a median relative velocity error of 13%. Future
work focuses on incorporating non-learning based localization and
applying Widar to fortify various sensing applications.
ACKNOWLEDGEMENT
This work is supported in part by the NSFC under grant 61522110,
61332004, 61472098, 61572366, 61602381, 61672319, 61632008, Na-
tional Key Research Plan under grant No. 2016YFC0700100.
REFERENCES[1] Fadel Adib, Zachary Kabelac, and Dina Katabi. 2015. Multi-person localization
via rf body reflections. In Proc. of USENIX NSDI.
[2] Fadel Adib, Zach Kabelac, Dina Katabi, and Robert C Miller. 2014. 3d trackingvia body radio reflections. In Proc. of USENIX NSDI.
[3] Fadel Adib and Dina Katabi. 2013. See through walls with wifi!. In Proc. of ACMSIGCOMM.
[4] Daniel Halperin, Wenjun Hu, Anmol Sheth, and David Wetherall. 2011. Pre-dictable 802.11 packet delivery from wireless channel measurements. Proc. ofACM SIGCOMM (2011).
[5] Yonghang Jiang, Zhenjiang Li, and Jianping Wang. 2017. PTrack: Enhancing theApplicability of Pedestrian Tracking with Wearables. In Proc. of IEEE ICDCS.
[6] Kiran Joshi, Dinesh Bharadia, Manikanta Kotaru, and Sachin Katti. 2015. Wideo:Fine-grained device-free motion tracing using rf backscatter. In Proc. of USENIXNSDI.
[7] Manikanta Kotaru, Kiran Joshi, Dinesh Bharadia, and Sachin Katti. 2015. Spotfi:Decimeter level localization using wifi. In Proc. of ACM SIGCOMM.
[8] Xiang Li, Shengjie Li, Daqing Zhang, Jie Xiong, Yasha Wang, and Hong Mei.2016. Dynamic-music: accurate device-free indoor localization. In Proc. of ACMUbiComp.
[9] Gerald Ossberger, Thomas Buchegger, Erwin Schimback, Andreas Stelzer, andRobert Weigel. 2004. Non-invasive respiratory movement detection and mon-itoring of hidden humans using ultra wideband pulse radar. In Conference onUltrawideband Systems and Technologies.
[10] Qifan Pu, Sidhant Gupta, Shyamnath Gollakota, and Shwetak Patel. 2013. Whole-home gesture recognition using wireless signals. In Proc. of ACM MobiCom.
[11] Kun Qian, Chenshu Wu, Zimu Zhou, Yue Zheng, Zheng Yang, and YunhaoLiu. 2017. Inferring Motion Direction using Commodity Wi-Fi for InteractiveExergames. In Proc. of ACM CHI.
[12] Souvik Sen, Jeongkeun Lee, Kyu-Han Kim, and Paul Congdon. 2013. Avoidingmultipath to revive inbuilding WiFi localization. In Proc. of ACM MobiSys.
[13] Souvik Sen, Bozidar Radunovic, Romit Roy Choudhury, and Tom Minka. 2012.You are facing the Mona Lisa: spot localization using PHY layer information. InProc. of ACM MobiSys.
[14] Li Sun, Souvik Sen, Dimitrios Koutsonikolas, and Kyu-Han Kim. 2015. Widraw:Enabling hands-free drawing in the air on commodity wifi devices. In Proc. ofACM MobiCom.
[15] Bo Tan, Karl Woodbridge, and Kevin Chetty. 2014. A real-time high resolu-tion passive WiFi Doppler-radar and its applications. In International RadarConference.
[16] Ju Wang, Hongbo Jiang, Jie Xiong, Kyle Jamieson, Xiaojiang Chen, Dingyi Fang,and Binbin Xie. 2016. LiFS: Low Human Effort, Device-Free Localization withFine-Grained Subcarrier Information. In Proc. of ACM MobiCom.
[17] Ju Wang, Jie Xiong, Hongbo Jiang, Xiaojiang Chen, and Dingyi Fang. 2016. D-watch: Embracing” bad” multipaths for device-free localization with COTS RFIDdevices. In Proc. of ACM CoNEXT.
[18] Wei Wang, Alex X Liu, Muhammad Shahzad, Kang Ling, and Sanglu Lu. 2015.Understanding and modeling of wifi signal based human activity recognition. InProc. of ACM MobiCom.
[19] Yan Wang, Jian Liu, Yingying Chen, Marco Gruteser, Jie Yang, and HongboLiu. 2014. E-eyes: device-free location-oriented activity identification usingfine-grained wifi signatures. In Proc. of ACM MobiCom.
[20] Bo Wei, Ambuj Varshney, Neal Patwari, Wen Hu, Thiemo Voigt, and Chun TungChou. 2015. drti: Directional radio tomographic imaging. In Proc. of ACM/IEEEIPSN.
[21] Teng Wei and Xinyu Zhang. 2015. mtrack: High-precision passive tracking usingmillimeter wave radios. In Proc. of ACM MobiCom.
[22] Chenshu Wu, Zheng Yang, Zimu Zhou, Xuefeng Liu, Yunhao Liu, and JiannongCao. 2015. Non-Invasive Detection of Moving and Stationary Human With WiFi.Selected Areas in Communications, IEEE Journal on (2015).
[23] Dan Wu, Daqing Zhang, Chenren Xu, Yasha Wang, and Hao Wang. 2016. WiDir:walking direction estimation using wireless signals. In Proc. of ACM UbiComp.
[24] Jie Xiong and Kyle Jamieson. 2013. ArrayTrack: a fine-grained indoor locationsystem. In Proc. of USENIX NSDI.
[25] Fan Yang, Qiang Zhai, Guoxing Chen, Adam C Champion, Junda Zhu, and DongXuan. 2016. Flash-Loc: Flashing Mobile Phones for Accurate Indoor Localization.In Proc. of IEEE INFOCOM.
[26] Lei Yang, Qiongzheng Lin, Xiangyang Li, Tianci Liu, and Yunhao Liu. 2015. Seethrough walls with cots rfid system!. In Proc. of ACM MobiCom.
[27] Zheng Yang, Chenshu Wu, and Yunhao Liu. 2012. Locating in fingerprint space:wireless indoor localization with little human intervention. In Proc. of ACMMobiCom.
[28] Zheng Yang, Zimu Zhou, and Yunhao Liu. 2013. From RSSI to CSI: Indoorlocalization via channel response. ACM Computing Surveys (CSUR) (2013).
[29] Jungwon Yoon, Hyung-Soon Park, and Diane Louise Damiano. 2012. A novelwalking speed estimation scheme and its application to treadmill control for gaitrehabilitation. Journal of neuroengineering and rehabilitation (2012).


![Passive design[1]](https://static.fdokumen.com/doc/165x107/63215c9580403fa2920cb59b/passive-design1.jpg)


