Why companies choose hybrid financing? - Repositorio ...
43
1 University Pontificia Comillas ICADE Business School Why companies choose hybrid financing? Author: Camila BERTRAND Director: Pedro MIRETE Madrid June 2019
-
Upload
khangminh22 -
Category
Documents
-
view
0 -
download
0
Transcript of Why companies choose hybrid financing? - Repositorio ...

1
University Pontificia Comillas
ICADE Business School
Why companies choose hybrid financing?
Author: Camila BERTRAND
Director: Pedro MIRETE
Madrid
June 2019

2
Camila
BERTRAND
Wh
y co
mp
anie
s ch
oo
se h
ybri
d f
inan
cin
g?

3
Abstract 2018 has been a record year for the hybrid issuing, whether there were contingent convertibles or other
equity related securities, more than 22 billion € were issued. This is still a lower amount compared to what
is issued on the capital or debt market, but it is increasing.
Hybrids appear on the liabilities side, but due to their double nature, part equity and part debt, their
definition may vary from one actor to another. For example, credit entities may consider hybrids more as
debt, and on the contrary equity investors may consider them more as capital but of course it also depends
on the conditions fixed at issuance and the characteristics of the instrument. In any cases this kind of
instrument can be used for a diversification purpose in a portfolio and in a capital structure.
The objective of this thesis is to explain why it could be interesting for companies to issue this kind of
securities and how to price them. How their double characteristics, mixing equity and bond attributes,
allows companies to reduce their costs of financing while having the possibilities to increase their capital
if needed. Also, how it affects the value of a company as different definitions lead to different valuations,
and so the prices of the securities may be affected and modified. And finally, what could be the impact in
an M&A transaction and a context of financing young companies like in the venture capital market or non-
quoted companies.
From the point of view of the investors, are the advantages higher than the risks? Does the yield offered
always compensate for the embedded risk? We see large-cap issuing a lot of hybrids, but isn’t it even
more interesting to see that small-cap and mid-cap use this method to circumvent rules and ratings they
are affected by when issuing bonds, then what will be the aversion to risk of the investor?
It will also be interesting to see how the hybrids are regulated, with Basel III and the recent changes in
capital requirements, their position and nature can offer an advantage for companies and banks with strict
requirements.
Acknowledgments I would like to thank Professor Mirete for his support and guidance during the development of this thesis.
Also, I am grateful for the help of Emilio Oliver for the discussions and its advices, and Benjamin Cass for
the real insights of the convertible bond market he was able to give me.

4
Content Abstract ......................................................................................................................................................... 3
Acknowledgments ......................................................................................................................................... 3
Introduction .................................................................................................................................................. 6
Coupon payments ..................................................................................................................................... 6
Permanence .............................................................................................................................................. 6
Subordination ........................................................................................................................................... 7
Notation .................................................................................................................................................... 7
A few definitions and key features ............................................................................................................... 8
Mezzanine debt ........................................................................................................................................ 8
Convertible bonds and mandatory convertibles ...................................................................................... 8
Contingent convertible ............................................................................................................................. 8
Other hybrid debt instruments ................................................................................................................. 9
Preferred shares .................................................................................................................................... 9
Hybrid Tier 1 .......................................................................................................................................... 9
Toggle bond .......................................................................................................................................... 9
Bail-in bonds ......................................................................................................................................... 9
Convertible bonds ....................................................................................................................................... 10
Definition and conventions ..................................................................................................................... 10
Pay-off and maturity ............................................................................................................................... 10
Call and put options ................................................................................................................................ 11
Global behavior and risks components................................................................................................... 11
Theoretical performance of the convertible........................................................................................... 15
Pricing...................................................................................................................................................... 16
Post-conversion ...................................................................................................................................... 19
Contingent convertibles .............................................................................................................................. 20
Conversion .............................................................................................................................................. 20
Write-down ............................................................................................................................................. 20
Other features ......................................................................................................................................... 21
The trigger event ..................................................................................................................................... 21
Impact of a CoCo issuance ...................................................................................................................... 21
Critics....................................................................................................................................................... 22
Valuation models ........................................................................................................................................ 23

5
Monte Carlo Model ................................................................................................................................. 24
Sensitivity analysis .................................................................................................................................. 25
The hybrid markets ..................................................................................................................................... 26
The corporate bond markets .................................................................................................................. 26
Origination .............................................................................................................................................. 26
Perspectives for investors ....................................................................................................................... 27
Fixed income investors ....................................................................................................................... 27
Equity investors ................................................................................................................................... 29
Effect on M&A transactions and in the VC market ................................................................................. 30
Acquisition deal ................................................................................................................................... 30
Advantages in the venture capital market .......................................................................................... 31
Situation, perspectives and expectations ............................................................................................... 31
Performance strategies ........................................................................................................................... 33
Regulation, international standards and rating agencies ........................................................................... 35
Historical evolution ................................................................................................................................. 35
Rethink the capital loss absorption......................................................................................................... 36
Capital base and quality ...................................................................................................................... 36
Liquidity standard ............................................................................................................................... 38
Towards Basel IV and future evolution ................................................................................................... 38
Taxation................................................................................................................................................... 39
Consideration by rating agencies ............................................................................................................ 39
Conclusion ................................................................................................................................................... 40
References .................................................................................................................................................. 41
Books ....................................................................................................................................................... 41
Papers ..................................................................................................................................................... 41
Prospectus ............................................................................................................................................... 42
Articles .................................................................................................................................................... 42

6
Introduction First of all, we have to begin defining what really is a hybrid security. In a very simplified perspective, they
are instruments that are not exactly equity but neither debt, in a balance sheet they are situated at the
frontier of these two. This instrument blends the characteristics of debt and equity into one element and
they have constant payments that could be considered as an equivalent of coupons or dividends.
Hybrids, particularly CoCos, have been the center of attention after the 2008 crisis and during the capital
regulation process. After the crisis, Basel III was published with the goal of stabilizing the financial system
through the company’s capital. As regulators knew banks had the tendency to be over leveraged and to
avoid bailing out banks with the tax-payer’s money again, Basel III required more capital of better quality
and reinforced the necessity of capital to be loss absorbing. So, in this context hybrids and other
convertibles were the perfect instruments to implement in companies and especially in banks to meet
with regulation.
Their complex structure makes it difficult to understand for average investors. It seems they are often
considered either too much as equity or too much as debt, with the wrong amount of risk associated.
Those different interpretations can cause problems in, for example, in the calculation of the value at risk
(VaR) of the financial instrument giving a wrong idea of the risk exposure.
In this thesis we are going to focus mainly on two hybrid securities: convertible bond and contingent
convertible also known as CoCos.
Coupon payments Hybrids have dividends or coupons payed regularly. The coupons can have different characteristics, in
some cases they can be postpone, it is called the optional deferral. The optional deferral implies more risk
for the investors which is compensated by higher premiums, but it does not trigger a default situation. Or
on the contrary they can have a mandatory deferral. This means that there are covenants behind the
payment of the coupon like leverage ratio, when the EBITDA cannot cover the coupons payment, or
interest rate coverage. In those situations, the coupon must be suspended for a determined period of
time.
The coupons can also be cumulative which means that the company must pay the deferred coupon before
paying any new one, or on the contrary non-cumulative. For this last case if the coupon is deferred and
non-cumulative at the same time, then one nonpaid coupon will be lost for the bond holder.
We also distinguish dividend pusher and dividend stopper. In the first case the hybrid coupon must be
paid if a common dividend has also been paid previously, in the second case the deferral of the hybrid
coupon stops any payment of common dividends.
Of course, a coupon can be fixed or floating. After a certain point or after a callable date, the fixed interest
can be switched to a floating one, or even can integrate a step up, increasing the spread over the reference
rate.
Permanence The maturity or perpetuity of the hybrid bond is something that influence heavily the risk and return of
the security, but also on the yield, coupon and step-up percentage or other features that are defined at
the issuing.

7
Subordination The degree of subordination is really important as it defines at which point the investor is going to be paid
and how much, so has direct consequences on the risk inherent to the instrument.
If we have to consider a scale of subordination from senior debt to equity, the more subordinated would
be the subordinated debt close to the senior debt, then convertible bonds, contingent convertible and
then closer to equity and deeply subordinated would be the preferred shares.
Notation Throughout the thesis, the following notations are going to be used to facilitate the description:
𝑁: face value 𝑐: coupon 𝐷: dividend yield
𝑡: current time 𝑇: maturity of the hybrid 𝐶𝑌: current yield
𝑆: share price 𝐶𝑝: conversion price 𝐶𝑟: conversion ratio
𝑃: price of the hybrid 𝑃𝑎: parity 𝐾: strike
𝐵: breakeven σ: volatility 𝑟: continuous interest rate
The Greeks:
𝛿 (delta): sensitivity of the hybrid to underlying stock variations
𝛾 (gamma): sensitivity of delta to underlying stock variations
𝜌 (rho): sensitivity of the hybrid to changes in interest rate
𝜃 (theta): sensitivity to time and maturity
Vega: sensitivity of the hybrid to changes in volatility of the underlying asset
Epsilon: sensitivity of the hybrid to changes of dividend yield

8
A few definitions and key features
Mezzanine debt It is an asset class with an increasing popularity especially in acquisition, buyouts and private equity.
Indeed, it is especially adapted to small and mid-cap in the first years of operation or with fast growing
rates.
In some cases, the mezzanine debt is just another word for hybrid instruments. Some consider mezzanine
debt as a way of financing that includes senior debt, convertibles and preferred stocks. It is a loan with no
collateral. Form this point of view, it is similar to any debt product. The difference lies in it can be
converted into equity through warrants (simply a financial instrument giving the right to buy or sell a
security) or options.
Like convertible bonds there are a way for small and medium companies to access financing without the
difficulties that come embedded to a public issuance are or simply the opening of the capital to new
investors.
The most common uses of mezzanine capital are for expansions, internationalization, project financing,
spin-off, MBO/MBI, optimization of the financing structure, acquisition…
Mezzanine characteristics are easier to understand than convertible or CoCo ones, the conversion
happens only in case of default of the issuer. The objective of mezzanine debts are similar to other hybrids.
They improve the capital structure while allowing to increase the leverage and avoid a direct dilution of
the shares.
The seniority of mezzanine debt is less than classic senior debt, and the rates required by investors are
often higher than senior debt.
Convertible bonds and mandatory convertibles Convertible bonds are similar to corporate bonds, they are originated as loans with regular coupon
payments, but they have a sort of call option for conversion that the investor can call at (almost) any time
and they don’t always have a fixed maturity.
Mandatory convertibles are also like corporate bonds but must be held until maturity and then they are
automatically converted into shares without any possibility of receiving cash. This is why the holders often
receive higher coupons than for preferred shares or convertible bonds.
Contingent convertible Those are the well-known CoCos but none follows the same structure. This non-standardization makes
them difficult to define and value. They are also like corporate bonds with different characteristics but
always loss absorbent.
The contingent convertibles can be converted when the bank’s capital ratios are not appropriate. The
positive effect about triggering such an instrument is that it doesn’t put the bank in a default position.
CoCos are triggered when the bank is still going concerned contrary to capital Tier 1 that are triggered
when the bank is already declared bankrupt, which was one of the reasons capital Tier 1 failed to save
banks during the 2008 crisis.

9
Other hybrid debt instruments
Preferred shares The preferred shares, although more basic than convertibles or contingents, are also important in the
hybrids category and could be considered as the one of the oldest hybrid instruments.
Preferred shares have on the one hand regular dividend and a priority over common dividend payments
but on the other hand no voting rights.
Hybrid Tier 1 Like the preferred, it is an old instrument. It is issued in the form of a bond with a call option and it doesn’t
include any equity properties strictly speaking. If the issuer skips this call option, the hybrid adopts a new
form for example a change in the coupon pricing until the next call is due or for perpetuity.
Toggle bond The toggle bond is a high-yield instrument and not commonly used. It is defined as a basic bond with
coupons, but the non-payment of a coupon leads to the increase of future coupons. If its “cash” it means
the coupon increases in the optic that the future coupon cannot be paid. Or it can be “PIK” (payment in
kind) which means that the issuer gives more bonds to the investor in case of deferral.
Bail-in bonds Bail-in capital is different from the convertibles seen previously as it always end up in a write down at the
moment of the bank reaches bankruptcy. This capacity is sometimes included in hybrids like some
contingent convertibles.
10
Convertible bonds
Definition and conventions Convertible bonds are similar to corporate bonds, they have coupons payments and a sort of call option
to conversion, but they don’t always have a fixed maturity. As we said the nature of the convertible is
between the equity and the debt but often in calculations it is more considered as an option or a
derivative. As we will see later most of the calculation and models are based on simulation previously
used for equity instruments.
The convertible bonds are often expressed as a percentage of a bond’s face value and as a clean price.
The clean price is the price without the accrued interest. The accrued interest being the interest
accumulated between the day of the calculation and the last payment. All the convertibles are expressed
this way except the French ones, that are directly a price in currency and include the face value and the
accrued interest, in other words the dirty price in cash.
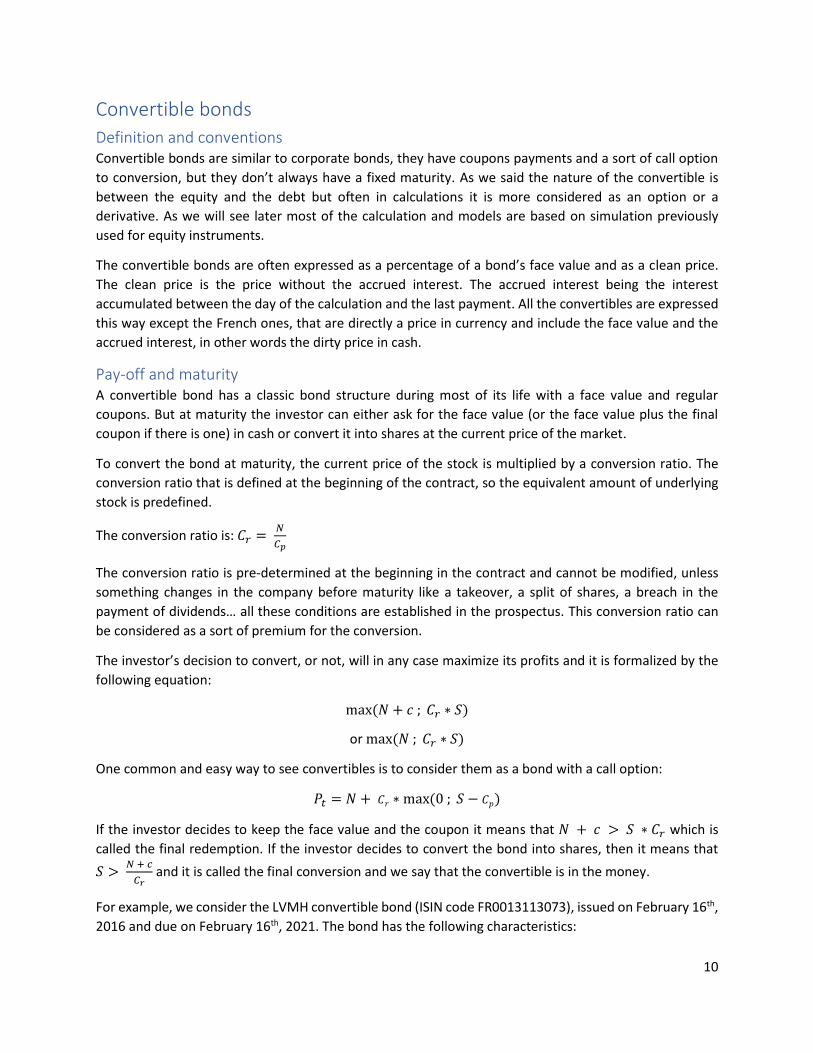
Pay-off and maturity A convertible bond has a classic bond structure during most of its life with a face value and regular
coupons. But at maturity the investor can either ask for the face value (or the face value plus the final
coupon if there is one) in cash or convert it into shares at the current price of the market.
To convert the bond at maturity, the current price of the stock is multiplied by a conversion ratio. The
conversion ratio that is defined at the beginning of the contract, so the equivalent amount of underlying
stock is predefined.
The conversion ratio is: 𝐶𝑟 = 𝑁
𝐶𝑝
The conversion ratio is pre-determined at the beginning in the contract and cannot be modified, unless
something changes in the company before maturity like a takeover, a split of shares, a breach in the
payment of dividends… all these conditions are established in the prospectus. This conversion ratio can
be considered as a sort of premium for the conversion.
The investor’s decision to convert, or not, will in any case maximize its profits and it is formalized by the
following equation:
max (𝑁 + 𝑐 ; 𝐶𝑟 ∗ 𝑆)
or max (𝑁 ; 𝐶𝑟 ∗ 𝑆)
One common and easy way to see convertibles is to consider them as a bond with a call option:
𝑃𝑡 = 𝑁 + 𝐶𝑟 ∗ max(0 ; 𝑆 − 𝐶𝑝)
If the investor decides to keep the face value and the coupon it means that 𝑁 + 𝑐 > 𝑆 ∗ 𝐶𝑟 which is
called the final redemption. If the investor decides to convert the bond into shares, then it means that
𝑆 > 𝑁 + 𝑐
𝐶𝑟 and it is called the final conversion and we say that the convertible is in the money.
For example, we consider the LVMH convertible bond (ISIN code FR0013113073), issued on February 16th,
2016 and due on February 16th, 2021. The bond has the following characteristics:

11
𝑁 = 250€
𝑐 = 0€
𝐶𝑝 = 204.1013€
𝑆 = 294.20€ value on February 16th, 2019
Hence, we can easily calculate the conversion ratio: 𝐶𝑟 = 250
204.1013= 1.2249
If the maturity of the convertible was February 16th, 2019 the investor would have to choose between
keeping the face value 𝑥 = 250€, as there are no coupons, or convert and obtain:
𝑥 = 𝐶𝑟 ∗ 𝑆 = 1.2249 ∗ 294.20 = 360.37
With this simple calculation we clearly see the advantage for the investor to convert its bond into shares.
Until now we have only considered the conversion at maturity, but there is also the possibility for the
investor to convert it before. In this case we have to compare the different outcomes depending on the
current price of the stock, the coupons, the time remaining, the yield, etc.
The forced conversion on the other hand, gives no choice to the investor if the issuer calls the convertible
bond. In this case, the investors will either receive the market value in cash or will have the possibility to
convert its hybrid into bonds. In both cases this conversion normally benefits the issuer, as this early
redemption should mean that there are good market conditions for the issuer.
If the issuer calls for an early mandatory conversion, then the investor cannot ask for cash but is forced to
convert the hybrid into shares.
Call and put options But everything not always rely on the investor’s decisions, the issuer can arbitrarily call the convertible, it
is the hard call, and the investor has no say in it. A hard call has also the option of protecting the investor,
it defines at which point the issuer can call the bond, there might be a few months or years depending on
the condition published in the prospectus.
Or it can be a soft call which means certain conditions or certain levels have to be reached to trigger a call
and conversion.
Global behavior and risks components The convertible’s price is affected by the value of the underlying asset so, there is a sensibility of the
convertible to the price of the stock. If the price of the stock is high the convertible will have the tendency
to act like the equity, on the contrary if the price of the underlying asset is low then the convertible will
behave more like a bond.
The value of the convertible that has no possibility of conversion is called the bond floor, as in the end it
would only have bond characteristics. On the contrary if the bond was immediately converted its value
would be called the parity:
𝑃𝑎 = 𝑆 ∗ 𝐶𝑟
𝑁=
𝑆
𝐶𝑝

12
This value is a percentage, it is like a premium that reflects various advantages of the convertible over the
classic share as the amount of the coupon or the yield and having at the end the possibility of conversion:
𝑃𝑟𝑒𝑚𝑖𝑢𝑚 = (𝐶𝑝 − 𝑃𝑎)
𝑃𝑎
𝑅𝑖𝑠𝑘 𝑝𝑟𝑒𝑚𝑖𝑢𝑚 = 𝑃𝑡 − 𝐵𝑜𝑛𝑑 𝑓𝑙𝑜𝑜𝑟
𝐵𝑜𝑛𝑑 𝑓𝑙𝑜𝑜𝑟
When the stock price is high, we said that the coupon behaves more like a stock and so it will tend to the
parity. But this is a theoretical approach and a general tendency of the corporate bond, the real outcome
can always be different, and we never have to consider it as an instrument with no downside risk.
For investors some elements of reference are really important like the yield or the yield to maturity (YTM)
for which a specialized investor will normally expect the bond to be called at the first occasion. The
calculation of the current yield is the same as for an equity:
𝐶𝑌 = 𝑐
𝑃𝑡
Then there is also the possibility of calculating the yield advantage defined by the difference between the
current yield and the dividend yield of the underlying asset.
Sum up of the LVMH convertible data and other calculation:
Face value 𝑁 = 250
Conversion price 𝐶𝑝 = 204.10
Conversion ratio 𝐶𝑟 = 1.23
Stock price at issuance (Feb 16th, 2016) 𝑆0 = 149.35
Stock price (Feb 16th, 2019) 𝑆 = 294.20
Continuation value 𝐶𝑣 = 350.01
Parity 𝑃𝑎 = 144.15
Premium 𝑝𝑟𝑒𝑚𝑖𝑢𝑚 = 42.59%
Bond floor 𝑏𝑜𝑛𝑑 𝑓𝑙𝑜𝑜𝑟 = 249.75
In order to do the calculations, we considered for the interest rate the 1-y French treasury bond, which
on February 15, 2019 was -0.50%. This assumption can be explained by the fact that an investor would
normally consider the bond at least for one year, until the next coupon or maturity. Then the French
treasury was chosen as the stock is quoted on the European and French market.
Also, we needed to calculate the future price of the stock in order to obtain the theoretical price of the
convertible and then the different premiums. To do so, an easy solution is to construct a trinomial tree

13
through a stochastic process. One of the main assumptions is to consider that the stock price follows a
defined function and that the interest rate, dividend yield and volatility are constant.
Here, the interest rate being -0.50%, the dividend yield 1.51% and the volatility over the past three years
(from June 2016 to June 2019) of 55.18%. Considering there are 2 periods, the variance is then
𝑉 = 𝜎2 ∗ 2 = 60.89
To establish the tree, we also need the distance between the two nodes obtained by the following
equation:
𝛥𝑥 = √𝑉 ∗ √3 = 1.35
With this we can obtain the transition probabilities up, down and middle point.
The starting point is always 𝑥0,0 = 𝑙𝑛(294.20) = 5.6842 as it starts at the current price of the stock. Then
we can calculate the final point: 𝑀0,0 = ln( 𝑆) + (𝑟 − 𝐷 − 1
2 𝜎2) ∗ 𝑡 = 5.3396.
Finally, each node will be the value of 𝑥 multiplied by a certain coefficient 𝑘, an integer obtain by the
following equation:
𝑘 = 𝑀0,0
𝛥𝑥 =
5.3396
1.3515 = 4
The position of the three outcomes is now determined:
- Up: 𝑥1,5 = (𝑘 + 1) ∗ 𝛥𝑥 = 6.7577
- Middle: 𝑥1,4 = 𝑘 ∗ 𝛥𝑥 = 5.4062
- Down: 𝑥1,3 = (𝑘 − 1) ∗ 𝛥𝑥 = 4.0546
All this data gives the probabilities:
- Up: 𝑝𝑢 = 𝑉
2 ∗ 𝛥𝑥2 + (𝑀0,0 − 𝑘 ∗ 𝛥𝑥)2
2 ∗ 𝛥𝑥2 + 𝑀0,0 − 𝑘 ∗ 𝛥𝑥
2 ∗ 𝛥𝑥 = 14.3245%
- Middle: 𝑝𝑚 = 1 − 𝑉
𝛥𝑥2 − (𝑀0,0 − 𝑘 ∗ 𝛥𝑥)2
𝛥𝑥2 = 66.4239%
- Down: 𝑝𝑑 = 𝑉
2 ∗ 𝛥𝑥2 + (𝑀0,0 − 𝑘 ∗ 𝛥𝑥)2
2 ∗ 𝛥𝑥2 − 𝑀0,0 − 𝑘 ∗ 𝛥𝑥
2 ∗ 𝛥𝑥 = 19.2516%
And we easily calculate the value of the different possible outcomes with their probability:
- 𝑆0 = 294.20
- 𝑆1,𝑢 = exp (𝑥1,5) = 860.7077
- 𝑆1,𝑚 = exp (𝑥1,4) = 222.7843
- 𝑆1,𝑑 = exp (𝑥1,3) = 57.6651
The last step is to calculate the value of the convertible bond departing from these prices and their
corresponding probability. Value of the bond:
- 𝑃0 = 𝑆0 ∗ 𝐶𝑟 = 294.20 ∗ 1.23 = 361.87
- 𝑃1,𝑢 = 860.7077 ∗ 1.23 = 1058.6705
- 𝑃1,𝑚 = 222.7843 ∗ 1.23 = 274.0247
- 𝑃1,𝑑 = 57.6651 ∗ 1.23 = 70.9281

14
If the price is expected to go down to 57.6651 and so the theoretical value of the convertible is 70.9281
which is under the par value. The investor wont considerate the value of the conversion but will require
the face value of the convertible bond: 250€. Other option for the pricing of the convertible will be
described and discussed onwards.
Another calculation could also be the breakeven, it gives the exact moment at which the convertible bonds
cash flows compensate for the investment.
𝐵 = 𝑃𝑟𝑒𝑚𝑖𝑢𝑚 (𝑐𝑎𝑠ℎ) 𝑜𝑟 𝑃𝑡 − 𝑃𝑎
𝑐 − (𝑃𝑡 ∗ 𝐷) 𝑜𝑟 𝑃𝑎 ∗ (𝐶𝑌 − 𝐷)
It is also possible to calculate the breakeven through the calculation of the cash flows. We consider the
coupon of the convertible, the stock dividend and the yield advantage. One of the main assumptions is
the interest rates to have accurate value of the convertible, especially in a context of low interest rates.
Overview of the global price and the main elements of the convertible (parity and premium):

15
Theoretical performance of the convertible
Depending on their position in the graph above: zone A, B, C or D, the convertibles will not behave the
same and so will not be traded as a same financial asset.
Here delta is defined as the sensitivity of the convertible to the movements of the underlying stock:
𝛿 = 𝑃
𝑆 ∗ 𝐶𝑟
• Zone A: distressed debt or junk convertibles
Parity: 0 – 40 Delta: –
Premium: > 100% Risk premium: < 5%
In this situation the share price is very low, and the convertible has an important correlation to it but
trades below par. The convertible displays high volatility levels and would be an equivalent of a high yield
instrument with high probabilities of default. In order to compensate for the risk, they have high
premiums.
• Zone B: busted convertibles or out-of-the-money convertibles
Parity: 40 – 70 Delta: 10% - 40%
Premium: > 35% Risk premium: 5% - 20%

16
In this situation the share price is also low and the convertible bond trades under the par value, but the
underlying asset has less volatility and the issuance company have a lower probability of default than for
junk bonds.
• Zone C: balanced convertibles or at-the-money convertibles
Parity: 70 – 130 Delta: 40% - 80%
Premium: 10% - 35% Risk premium: 20% - 40%
These kinds of bond have an important equity component and trades really close to the common stock
price. Therefore, they have an important exposure to stock volatility so high deltas, generally from 0.4 to
0.8.
• Zone D: butane convertibles or in-the-money convertibles
Parity: 130+ Delta: 80% - 100%
Premium: 0% - 10% Risk premium: > 40%
These are almost like equity. They trade way above the bond floor so have equity characteristics more
pronounced than balanced convertibles with a delta from 0.8 to 1.
• Zone E: discount convertible
Parity: high Delta: >= 100%
Premium: <= 0% Risk premium: > 40%
This last category situated after the zone D called discount convertible bonds, but those bonds are rare.
They have a negative premium, which could be used for arbitrage and converted immediately. But there
are some clauses that prevent this kind of trades in addition to long delays from the time of conversion to
the actual reception of the shares.
But the most traded aren’t the extreme ones but the busted and balanced convertible as there are also
the most common ones.
Pricing First, we need to obtain the probability and the value of the stock depending on different scenarios.
We use a different technique than the one used earlier. We calculate the time between the nodes and
the different probabilities with the following formulas:
- Upward movement: 𝑢 = 𝑒𝜎∗√(𝑇−𝑡)
The expected upward movement for one year: 𝑃(𝑢) = 𝑢 ∗ 𝑃𝑎
Probability of the prices going up: 𝑝(𝑢) =𝑒𝑟 ∗ (𝑇−𝑡) − d
𝑢 − 𝑑
- Downward movement: 𝑑 = 𝑒−𝜎∗√(𝑇−𝑡)
The expected upward movement for one year: 𝑃(𝑑) = 𝑑 ∗ 𝑃𝑎
Probability of the prices going up: 𝑝(𝑑) = 1 − 𝑝(𝑢)

17
After obtaining the value of the parity future value we can calculate the theoretical value of the
convertible.
Just with this small numerical example we easily obtain the values of the Greeks and the change in parity.
But we will develop furthermore the modeling process with binomial and trinomial trees onwards.
The convertible acting more like equity or a bond depending on the stock price is reflected mathematically
by the positive convexity. The value of this convexity is the exposure and so the variation that can imply
the equity to the convertible bond. There is of course a part of randomness in the price of a convertible
bond which increases or decreases depending on the range of the convexity. A positive convexity will
create value.
Sometimes we can have a negative convexity, in those cases its we better have an underlying stock with
almost no volatility, and as we said that positive convexity can create value the negative one can destroy
value.
This positive convexity that we find for most convertible bonds and so the positive effect that have stocks
will be reflected in the value of the coupon adding up to the fact that a company cannot default on the
payment on its obligation without consequences.
The relationship can be summarized by the following equation:
𝑑𝑃 = 𝑃(𝑆) − 𝑃(𝑆0)
𝑑𝑃 = (𝑆 − 𝑆0) ∗ (𝜕𝑃
𝜕𝑆) +
1
2 ∗ (𝑆 − 𝑆0)2 ∗ (
𝜕2𝑃
𝜕2𝑆)
We consider (𝜕𝑃
𝜕𝑆) = 𝛿 and (
𝜕2𝑃
𝜕2𝑆) = 𝛾
𝑑𝑃 = 𝑑𝑆 ∗ 𝛿 + 1
2 ∗ 𝑑𝑆2 ∗ 𝛾
As the exposure of the convertible to the movements of the common share is the first derivative from the
price, we can simplify the calculation of the convertible’s price as the following equation:
𝑃 = 𝑃0 + 𝑒𝑥𝑝𝑜𝑠𝑢𝑟𝑒 ∗ (𝑆 − 𝑆0)
This calculation allows a quick and easy way to value the price of the convertible, also called the dollar
neutral pricing. But a we see in the example the convertible bond can be disconnected to the movement
of the underlying share and have opposite movements as there is also the influence of the volatility of the
common stock, the interest rates or the credit spread.
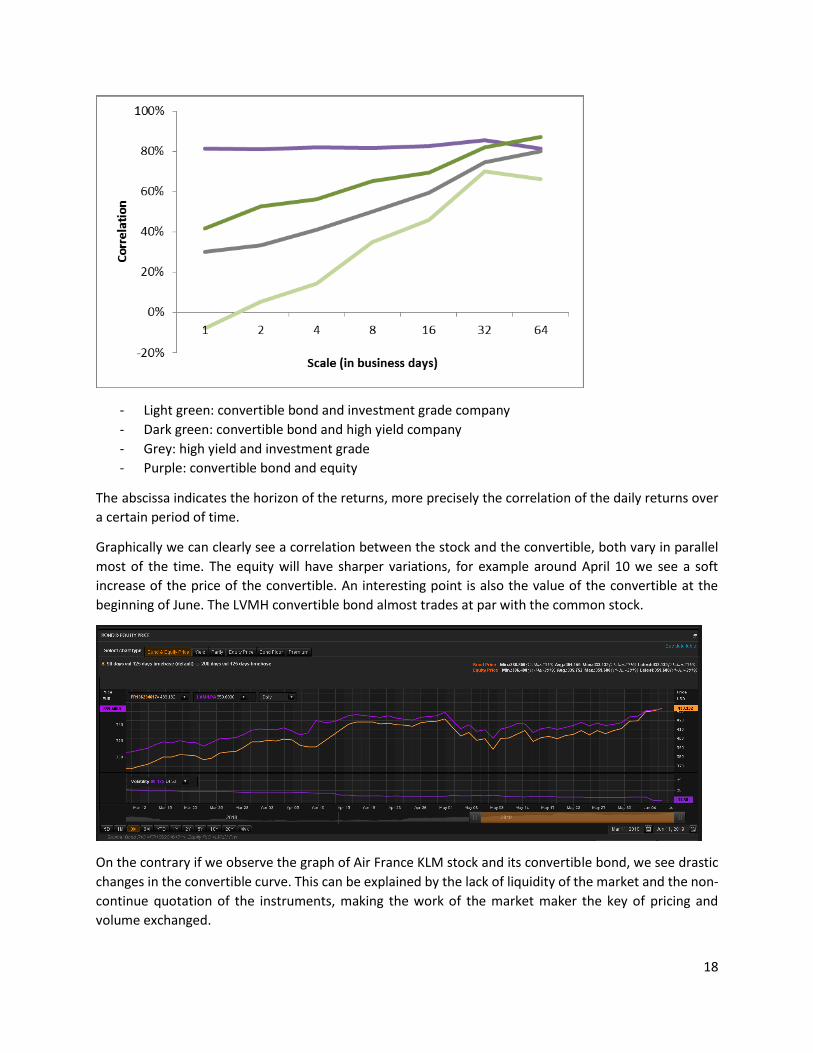
Figure of correlation between the equity (with differences of rating) and their convertible, with data from
July 2006 and January 2016:
18
- Light green: convertible bond and investment grade company
- Dark green: convertible bond and high yield company
- Grey: high yield and investment grade
- Purple: convertible bond and equity
The abscissa indicates the horizon of the returns, more precisely the correlation of the daily returns over
a certain period of time.
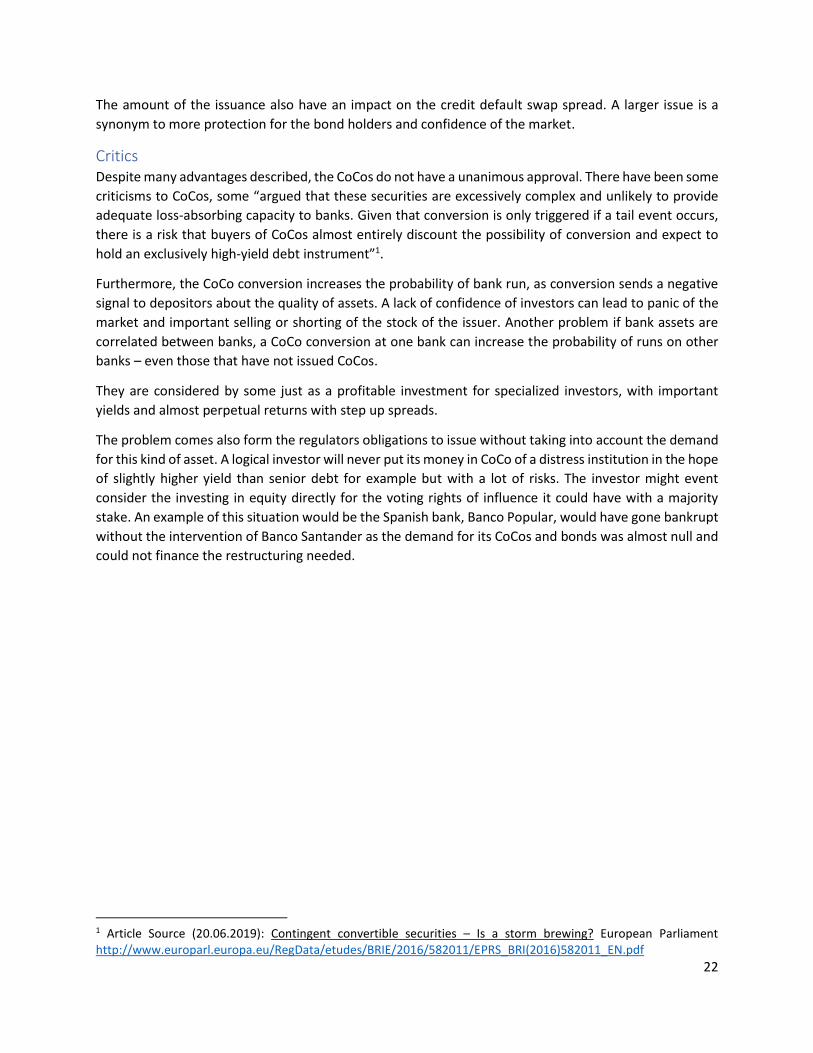
Graphically we can clearly see a correlation between the stock and the convertible, both vary in parallel
most of the time. The equity will have sharper variations, for example around April 10 we see a soft
increase of the price of the convertible. An interesting point is also the value of the convertible at the
beginning of June. The LVMH convertible bond almost trades at par with the common stock.
On the contrary if we observe the graph of Air France KLM stock and its convertible bond, we see drastic
changes in the convertible curve. This can be explained by the lack of liquidity of the market and the non-
continue quotation of the instruments, making the work of the market maker the key of pricing and
volume exchanged.

19
Post-conversion The conversion into shares has logically consequences on the capital and the value of the shares. For each
additional conversion the shareholders see the value of their asset decrease. The dilution of the share has
the same effect as an additional issuance.
A tricky clause exists and is too often forgotten by investors, the “look back”. After the maturity and the
calculation period, the issuer can choose to pay either in cash or in shares. This could mean for the issuer
huge savings depending on the value of its shares as the company will always prefer the cheaper way, and
the holder would have no say in it.

20
Contingent convertibles Contingent convertibles are pretty similar to convertible bond, but their key feature is the loss absorbing
characteristic. This is why they gain importance after 2008 and Basel III and the regulatory framework that
has been developing.
Their objective is to improve the capital structure of the issuer in time of accumulated losses or other
financial problems. The contingent convertible are more adapted to companies like banks or insurance
companies that have mandatory levels of capital to respect. For other types of companies their use would
not be entirely justified.
Contingent convertibles and convertible bonds have some common features but are not the same
financial instrument and have different behavior, for example regarding conversion or the role of the
issuer, as we will see later on.
The loss absorption can be made through two ways: mandatory conversion into shares (like the
convertible bond) or a principal write down (PWD). This happens when some conditions are triggered, the
most widespread is the regulatory condition imposed by the Bank of International Settlements and the
Basel Committee. Then we can also have additional triggers linked to the market conditions, like the share
price or the credit spread, or linked to the solvency of the company.
CoCos can fall into two categories according to Basel III in terms of maturity, either they have no fixed
maturity, so are close to equities and are considered as AT1 or can have a fixed maturity and are more
considered as T2.
Conversion They can either be converted at a floating price, which means the conversion is the current price of the
stock at the moment of the conversion, or a fixed price, which is the price of the stock at the moment the
convertible is issued. The price conversion has a third option, it can be the maximum between the price
at the moment of the conversion or a certain predefined amount decided arbitrarily.
Recently a new contingent appeared, the CoCoCo, issued by the Bank of Cyprus, the difference lies in the
conversion. There are actually two conversion conditions, the first one is optional and fixed at a certain
price, and the second one is a forced conversion option triggered at a certain level.
An investor usually expects the issuer to call back the instrument on the first occasion. That’s why for
example there was a huge shock wave in February, when Santander didn’t call back its contingent
convertible at the first call. The investors normally don’t consider the entire maturity of the convertible.
This information could have been received negatively by the markets, but this could be easily justified by
the rates, yield, etc. fixed in the prospectus. The price of the stock was only affected on the short term
with -0.16% on the February 12 and -0.92% on February 14, but apart from these days the stock continued
increasing.
Write-down This option for absorbing losses might seem a bit extreme, as the value of the bond can almost entirely
disappear. In some cases, this can actually be a better option, as the current shareholders don’t see the
value of their share decrease. There are also some investors that might prefer a write-down as they have

21
to comply to some obligation and only invest in a specific asset class, so if the hybrid implies a change in
asset class they will prefer to invest in pure bond or pure equity financial instruments.
The write-down can be for the entire value of the bond, partial so the invertor still receives a defined
percentage of its investment or it can even be a staggered write-down, which means that the write-down
will be of the amount needed to comply again with capital regulation.
After a time, when the bank is profitable again, the issuer can decide to do a write-up, so the investor
recovers his initial investment.
The write-down is a good solution for the investor as he knows what he will lose.
In recent issuance we see a clear enthusiasm for principal write down instead of mandatory conversion.
This could incentivize risk situation, as there is no dilution of the capital of the shareholders. On the other
hand, a mandatory conversion could favor accounting manipulation.
Other features Earlier we mention the tendency of convertible bond to have positive convexity of to the equity share, as
with a low share price it will get closer to the bond floor but if the price goes up it will get closer to parity.
The contingent convertible has exactly the opposite behavior as with high prices, so normally a healthy
company, the risk of conversion or write-down will be very low, but low prices and close to triggering ratio
the possibility of conversion or write-down will be important. Put in another way a CoCo which is likely to
be converted, will be more inclined to act like equity, but is the conversion is improbable then it will be
more considered as senior debt. Therefore, we can say that the contingent convertible is defined by a
negative convexity.
The trigger event The trigger event is the second key feature of a CoCo. This element fixes in which conditions the CoCo the
loss absorption capabilities will be effective. The objective of this trigger is to maintain the company
operating, so it must be activated as soon as the first signs of distress appear.
The trigger can be the Point of Non-Viability (PONV) is a level defined by the regulators, at which they
judge that the issuer should activate the loss absorption. At this point the company is considered to be a
bit too close to bankruptcy. There could also be a trigger with a lower focus, more like a going-concern
capital requirement, with mechanical activation, that only provides higher quality to the issuer.
Impact of a CoCo issuance The issuance of a CoCo can affects the credit default swap spread of the issuer through two main channels.
First, it decreases the probability of default as it increases the loss absorption capacity of the company.
Second, issuing a CoCo affects the risk-taking incentives of the bank’s management and shareholders,
having also an impact on the different levels of debt and capital elements depending on their level of
subordination.
Like for the convertible, the relation between a CoCo issue and the stock price is pretty difficult to
determine. Depending on the nature of the CoCo, its characteristics (trigger types, trigger levels, etc.) and
current situation of the issuer, we could have different outcomes. For the principal write down CoCos, as
there is no dilution effect of the capital, it could be expected that the stock price increases at issuance of
the CoCo. Indeed, it would be additional security for investors if the bank should enter a distress situation.
22
The amount of the issuance also have an impact on the credit default swap spread. A larger issue is a
synonym to more protection for the bond holders and confidence of the market.
Critics Despite many advantages described, the CoCos do not have a unanimous approval. There have been some
criticisms to CoCos, some “argued that these securities are excessively complex and unlikely to provide
adequate loss-absorbing capacity to banks. Given that conversion is only triggered if a tail event occurs,
there is a risk that buyers of CoCos almost entirely discount the possibility of conversion and expect to
hold an exclusively high-yield debt instrument”1.
Furthermore, the CoCo conversion increases the probability of bank run, as conversion sends a negative
signal to depositors about the quality of assets. A lack of confidence of investors can lead to panic of the
market and important selling or shorting of the stock of the issuer. Another problem if bank assets are
correlated between banks, a CoCo conversion at one bank can increase the probability of runs on other
banks – even those that have not issued CoCos.
They are considered by some just as a profitable investment for specialized investors, with important
yields and almost perpetual returns with step up spreads.
The problem comes also form the regulators obligations to issue without taking into account the demand
for this kind of asset. A logical investor will never put its money in CoCo of a distress institution in the hope
of slightly higher yield than senior debt for example but with a lot of risks. The investor might event
consider the investing in equity directly for the voting rights of influence it could have with a majority
stake. An example of this situation would be the Spanish bank, Banco Popular, would have gone bankrupt
without the intervention of Banco Santander as the demand for its CoCos and bonds was almost null and
could not finance the restructuring needed.
1 Article Source (20.06.2019): Contingent convertible securities – Is a storm brewing? European Parliament http://www.europarl.europa.eu/RegData/etudes/BRIE/2016/582011/EPRS_BRI(2016)582011_EN.pdf

23
Valuation models The double characteristics of the convertible, like other hybrids make their valuation difficult. Most of the
pricing models are based on Black and Scholes, and latter Merton research or Brennan and Schwartz,
Heston, Hull-White, etc. For example, Goldman Sachs model (1994) is a mix of a Black and Scholes method
and binomial tree. Then we have the Tsiveriotis and Fernandes approach (1998) that is based on the
previous model and also uses the Black and Scholes formula:
𝛿𝑢
𝛿𝑡 + 𝑟𝑔 ∗ 𝑆 ∗
𝛿𝑢
𝛿𝑆 +
1
2 ∗ 𝜎2 ∗ 𝑆2 ∗
𝛿2𝑢
𝛿2𝑆 − (𝑟 + 𝑟𝑐) ∗ 𝑢 + 𝑓(𝑡) = 0
With which we obtain the following theoretical price of a call option and a put option:
𝑃𝐶𝑎𝑙𝑙 𝑜𝑝𝑡𝑖𝑜𝑛 = 𝑆 ∗ exp(−𝐷(𝑇 − 𝑡)) ∗ 𝑁 (𝑑1) − 𝐾 ∗ exp(−𝑟 ∗ 𝑇) ∗ 𝑁(𝑑2)
𝑃𝑃𝑢𝑡 𝑜𝑝𝑡𝑖𝑜𝑛 = 𝐾 ∗ exp(−𝑟 ∗ 𝑇) ∗ 𝑁(−𝑑2) − 𝑆 ∗ exp(−𝐷(𝑇 − 𝑡)) ∗ 𝑁 (−𝑑1)
With 𝑑1 =1
𝜎 ∗ √(𝑇−𝑡) (log (
𝑆
𝐾) + (𝑟 − 𝐷 +
𝜎2
2) ∗ (𝑇 − 𝑡)) and 𝑑2 = 𝑑1 − 𝜎 ∗ √(𝑇 − 𝑡)
This model reflects the view of convertible more like bonds with a call and put option. But it fails to include
the credit quality of the issuer.
Generally, the models based on Black and Scholes are more oriented towards the valuation of equity but
without including bond characteristics. Hybrid models must consider more than one factor (not only the
underlying asset). The main assumptions are:
- Unique source of risk: one factor model that does not consider interest rates, volatility or credit
spread; all elements very relevant to a hybrid valuation but here considered as constant
- European options only: no changes in the nature of the convertible can be done and no early call
can be done, an American option would complicate exponentially the model and multiplied the
options
- Market efficiency with no spread and no costs
- Lognormal distribution: Black and Scholes originally base their research on the Brownian formula:
𝑑𝑆𝑡 = 𝜇 ∗ 𝑆𝑡 ∗ 𝑠𝑡 + 𝜎 ∗ 𝑆𝑡 ∗ 𝑑𝑊𝑡 and in this model the stochastic behavior follows a
lognormal distribution
The first example we did was a basic trinomial tree that relies on the one factor model. It gives a rapid
overview of the price but without considering all the risks related to the convertible bond. We considered
only two scenarios with the different options of going up, going down and staying at a middle point. Of
course, if we want to be more precise the more nodes and stages, we include the more accurate will be
our model.
In any case the most important part is not the model but the embedded assumptions. The main elements
that have to be defined in the model are the variables and the constants, then how the stochastic process
will be conducted: which will be the global behavior, or which will be the final distribution function; after
there is the numerical testing that usually is done by the Monte Carlo approach or the binomial and
trinomial tree.

24
But always be careful with de valuation models as the convertible tend to trade most of the time under
their theoretical value. First this is due to the difficulty of pricing, having then a consequence on the
heading. Some research has proven that convertible bonds with higher deltas tend to trade close to their
theoretical price.
We will try to determine a certain model considering the following factors: the underlying asset prices, its
volatility, the interest rates and the credit spread. Each one of them adds up a certain amount of risk and
uncertainty, but each can have their own independent stochastic process.
Monte Carlo Model The first step is to test each element with the OLS method – ordinary least squares – and see if the R-
squared could be acceptable. The objective is to approximate the exercise rules for all the options that
could be included in the convertible.
We said that with lattice methods one of the assumptions was that the convertible had European options,
here we will consider the convertible with American options or a Bermudan derivative, which is more
realistic. For example, at each possible conversion moment the investor compares the outcome of an
immediate conversion to the expected present value of the future cash flows from the convertible. A
rational investor will always decide to maximize its gains. Hence, the conversion will depend on the
expectations and assumptions considered by the investor.
For this example, we will use the price of the historical weekly changes in price of Air France KLM
convertible bond and the changes in market price over a week. After we can add the three other elements
we want also to include.
The following table represents the optimal option exercise behavior of both the issuer and the investor
and the corresponding payoffs at any exercise date 𝑡.
𝐹(𝑤, 𝑡𝑖) is the conditional expected value for continuation.
Payoff at 𝑡 Condition Action
𝛾𝑡 ∗ 𝑆𝑡 If 𝛾𝑡 ∗ 𝑆𝑡 > 𝐹(𝑤, 𝑡𝑖)and 𝑃𝑡 ≤ 𝛾𝑡 ∗ 𝑆𝑡 Voluntary conversion
𝑃𝑡 If 𝑃𝑡 > 𝐹(𝑤, 𝑡𝑖)and 𝑃𝑡 ≥ 𝛾𝑡 ∗ 𝑆𝑡 Put
𝐶𝑡 If 𝐶𝑡 < 𝐹(𝑤, 𝑡𝑖)and 𝐶𝑡 ≥ 𝛾𝑡 ∗ 𝑆𝑡 Call
𝛾𝑡 ∗ 𝑆𝑡 If 𝐶𝑡 < 𝐹(𝑤, 𝑡𝑖)and 𝐶𝑡 < 𝛾𝑡 ∗ 𝑆𝑡 Forced conversion
𝑥 ∗ 𝑁 If 𝑥 ∗ 𝑁 > 𝛾𝑡 ∗ 𝑆𝑡 Redemption
0 Otherwise Continue
Finding the optimal stop moment 𝑖 will be used to calculate the total expected cash flows up to that point
with the different paths. After the calculation of the cash flows of all possible paths, the price of the
convertible is then given as the average over all the simulated paths:
𝑃𝑡 = 1
𝑛 ∑ 𝑒−𝑟∗(𝑇−𝑡)
𝑛
𝑖=1
∗ 𝐶𝐹𝑡𝑜𝑡𝑎𝑙(𝑇𝑖)
Obviously, the accuracy of the entire model relies on the quality of this approximation. As mentioned,
many times and seen in other models, credit risk plays a major role in the analysis of convertibles. But as

25
any assumption, it reduces the accuracy of the pricing model. The main assumption states that the
different paths, even the ones made through different nodes, but leading to the final redemption in cash
have to be discounted at the credit rate. On the other hand, the paths that end up in a conversion into
shares have to be discounted at the risk-free rate.
Even though the Monte Carlo approach resolves many problems and facilitates many processes, it still has
some flaws. Indeed, increasing the speed and efficiency of a model often implies that simplifications must
be done. A convertible pricing model undergoes the same process, and, in this modeling, it is part of the
credit risk that will be the most affect by the simplification and assumptions. Another problem with the
Monte Carlo model, connected as well to the simplification problem, is that it does not consider the
payment of dividends and so neither for the coupons.
Sensitivity analysis Sensitivity analysis determines how the parameters of the model influence the value of the model and
event how its structure evolves or can be affected by the variations. Sensitivity analysis helps to confirm
design of the model with a certain confidence level.
It is a key element for the decision marking and the construction of a portfolio. It will confirm or not the
suitability of the strategy.
The positive point is that the sensitivity analysis can identify the sources of randomness and risk in the
model, even without knowing all the elements it is composed by.
The sensitivity analysis must not be confused with the Greeks. For example, the delta will only give the
theoretical value of the change in price depending on the change in price of the underlying stock, but it
won’t give a critical perspective.
From a calculation point of view the sensitivity is a normalized version of the Greek delta including the
standard deviation, hence the volatility. The sensitivity creates a link between the variance of the
theoretical price to the price of the input parameter:
𝑠𝑒𝑛𝑠𝑖𝑡𝑖𝑣𝑖𝑡𝑦 𝑋𝑖=
𝜎𝑋𝑖
𝜎𝑃 ∗
𝜕𝑃
𝜕𝑋𝑖
26
The hybrid markets
The corporate bond markets We can distinguish many actors on the convertible bond market, that are not only the buyer and the seller.
Indeed, even this kind of market are regulated it is more for regulatory purposes, but most of the deals
are done OTC. The market makers are in charge of the transactions and providing liquidity to the market.
Depending on the origin of the convertible, it will be considered in different way. For example, US
convertible bonds are used to be considered as equity-like assets, both by the banks which design them
and by the investors, whereas European convertible bonds are more likely to be considered as debt-like
assets. As a consequence, US convertible bonds are more often callable than European ones. Asian
convertibles are not so clearly defined, but they might be closer to European convertible.
Origination A convertible bond will be chosen by companies in order to diversify their way of financing, as an investor
could choose it for diversifying its portfolio. If the company is an investment grade the hybrids are
commonly called “safe haven hybrids” and on the contrary the high yield instrument are called “high beta
hybrids”. But there is an implicit need of a minimum liquidity as the convertible issue will affect the stock
price. Indeed, there is a real interconnection and we often see negative stock movements following a
convertible issuance:
• Issuance of the LVMH convertible bond on February 16, 2016, due on February 16, 2021.
Stock variation after issuance/settlement of the convertible -1.39%
• Issuance of the Air France convertible bond on March 25, 2019, due on March 25, 2026.
Stock variation after issuance/settlement of the convertible -0.58%
This movements are often due to investors shorting the stock or the market makers hedging the stock,
but it usually affects the quotation only on the short term. Knowing that, specialized investors not always
invest on the primary market, but they would rather wait for the quotation in the secondary market.
The origination of a convertible bond and CoCo is a really quick process, more like an accelerated book
building (ABB) in terms of timeline than a classic IPO.
The months before issuing, there are the pitches by banks, with the valuation, pricing, structure and size
of the issue. The book runner and the issuer agree on a certain volume, with minimum amounts to be
subscribed by investors.
For the launching, the price of reference considered for the stock is the average of the past five business
days, with that the price of the convertible is fixed. Regarding the credit default swap spread, especially
useful in CoCo issuance, a longer period is required and generally lasts up to ten days. In some cases,
during the issuing of a convertible, they can be some restrictions and the quoting of the common shares
can be suspended for some stakeholders in order to limit the manipulation of the stock price by insiders.
The book building lasts only a few hours, starts before the market opening and finishes at the beginning
of the afternoon. Once the process is complete and all the funds allocated, the investors are informed.
Following the convertible trades on the market as any financial instrument.

27
There are also other arguments that could be used for the issuing of convertibles instead of other ways of
financing like refinancing at lower cost.
Even though they are often perpetual, issuers do convertible financing in a medium short term. They never
consider it to the point of conversion; they often call it at the first opportunity they have.
Most of the issuance of convertible are located in the US. This situation might be explained by the
tendency of US companies to be less risk averse than European ones and so have a more important
proportion of equity or equity-like products in their balance sheet.
The investors base has also been shifting from trading desks and hedge funds to long-term investors with
buy-and-hold strategies.
Perspectives for investors
Fixed income investors For fixed income investors convertible bonds represent an alternative to 100% equity investments and so
a shot at diversification. Another advantage of the convertible would be that in a declining market even
though the convertible is linked to the stock, its price decreases at a slower pace, giving the investors
more time to sell and exit the market. There are a few strategies they mainly follow:
- Buy convertibles considering them as classic corporate bonds: the convertible will most of the
time trade above the bond floor, limiting the exposure to risk compared with an investment in
equity but having a higher yield
- Buy asset swapped convertible paper:
The idea behind this financial instrument is pretty simple and resembles to any swap instrument. In this
case the objective of the convertible investor is to sell the credit risk linked to the convertible and
conserves the equity exposure. Therefore, the buyer will only have the exposure to the credit risk
corresponding to the bond floor of the asset.
The main reasons to do a convertible asset swap would be to hedge the credit position as we said, but it
could also be for leverage. Once a position is swapped the investor receives the value of the bond floor in
cash then have the possibility of reselling the option. The final amount received in cash is the hedge ratio
multiplied by the stock price. There is also the possibility of cross margining, which is floating strike on the
28
call option, as the asset swap will have a new and different volatility compared to the convertible, it will
have more underlying equity, so will act as a new instrument with different returns.
The price at which is sold the bond floor is different as the traditional bond floor and called asset swap
bond floor. It is calculated with the present value of a reference interest rate plus a credit spread.
In practice the ownership of the convertible will go from the convertible investor to the swap intermediary
and ultimately to the credit investor. The convertible investor keeps a right on the instrument and can ask
for it at any time at a certain fixed recall spread. If the convertible investor decides to enter an asset swap
process, in case of call back it has to pay to the credit investor a “make whole” penalty, in most cases
really dissuasive meaning that usually they will either stay out of this kind of process or don’t call it until
maturity.
As the convertible bonds are some kind of bond with an embedded option, they will adopt a protective
attitude in declining markets due to their bond characteristics. On the other hand, they will outperform a
straight bond in rising equity market.
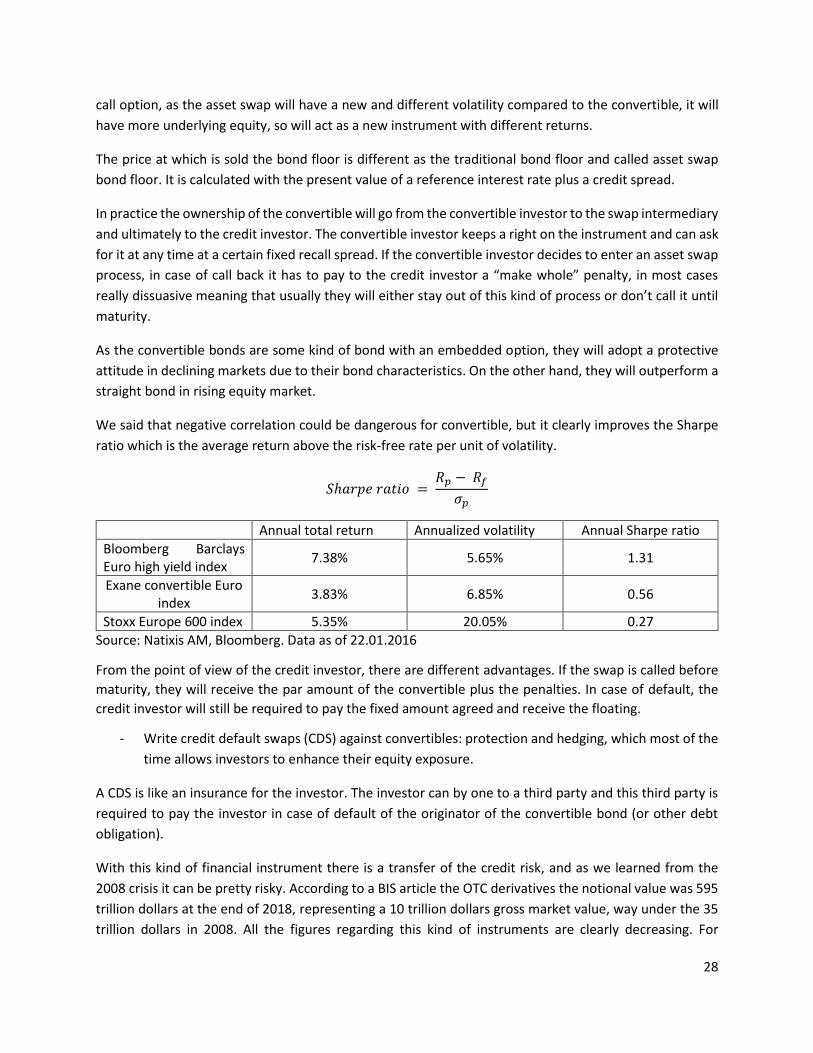
We said that negative correlation could be dangerous for convertible, but it clearly improves the Sharpe
ratio which is the average return above the risk-free rate per unit of volatility.
𝑆ℎ𝑎𝑟𝑝𝑒 𝑟𝑎𝑡𝑖𝑜 = 𝑅𝑝 − 𝑅𝑓
𝜎𝑝
Annual total return Annualized volatility Annual Sharpe ratio
Bloomberg Barclays Euro high yield index
7.38% 5.65% 1.31
Exane convertible Euro index
3.83% 6.85% 0.56
Stoxx Europe 600 index 5.35% 20.05% 0.27
Source: Natixis AM, Bloomberg. Data as of 22.01.2016
From the point of view of the credit investor, there are different advantages. If the swap is called before
maturity, they will receive the par amount of the convertible plus the penalties. In case of default, the
credit investor will still be required to pay the fixed amount agreed and receive the floating.
- Write credit default swaps (CDS) against convertibles: protection and hedging, which most of the
time allows investors to enhance their equity exposure.
A CDS is like an insurance for the investor. The investor can by one to a third party and this third party is
required to pay the investor in case of default of the originator of the convertible bond (or other debt
obligation).
With this kind of financial instrument there is a transfer of the credit risk, and as we learned from the
2008 crisis it can be pretty risky. According to a BIS article the OTC derivatives the notional value was 595
trillion dollars at the end of 2018, representing a 10 trillion dollars gross market value, way under the 35
trillion dollars in 2008. All the figures regarding this kind of instruments are clearly decreasing. For
29
example, of the 595 trillion dollars of the notional value, the CDS represented only 8 trillion dollars, which
is 4 trillion dollars less than at the end of 2016.
Here the main risk of the CDS would be the volatility of the convertible and the underlying stock.
To sum up the main differences between the asset swap and the CDS are that in the first case the investor
receives an up-front payment for the value of the asset swap bond floor and has the possibility to call but
at a premium. In the second case the investor pays an insurance, but the contract is not callable event
though it might be cheaper.
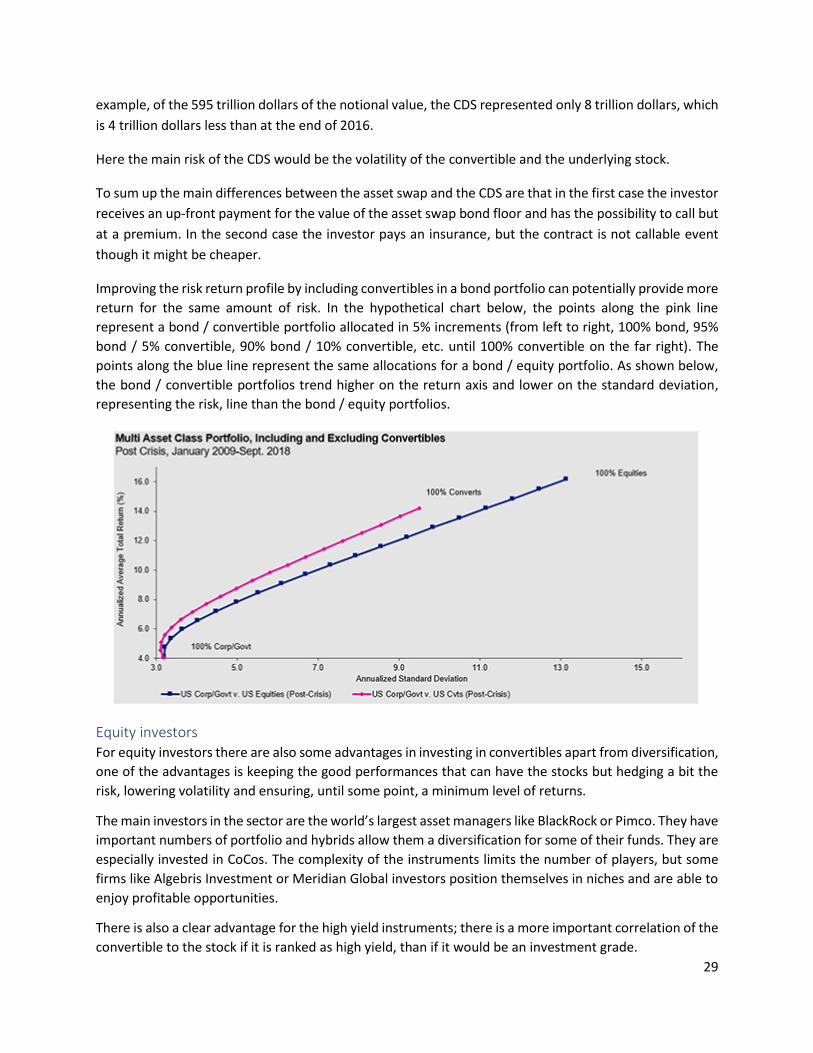
Improving the risk return profile by including convertibles in a bond portfolio can potentially provide more
return for the same amount of risk. In the hypothetical chart below, the points along the pink line
represent a bond / convertible portfolio allocated in 5% increments (from left to right, 100% bond, 95%
bond / 5% convertible, 90% bond / 10% convertible, etc. until 100% convertible on the far right). The
points along the blue line represent the same allocations for a bond / equity portfolio. As shown below,
the bond / convertible portfolios trend higher on the return axis and lower on the standard deviation,
representing the risk, line than the bond / equity portfolios.
Equity investors For equity investors there are also some advantages in investing in convertibles apart from diversification,
one of the advantages is keeping the good performances that can have the stocks but hedging a bit the
risk, lowering volatility and ensuring, until some point, a minimum level of returns.
The main investors in the sector are the world’s largest asset managers like BlackRock or Pimco. They have
important numbers of portfolio and hybrids allow them a diversification for some of their funds. They are
especially invested in CoCos. The complexity of the instruments limits the number of players, but some
firms like Algebris Investment or Meridian Global investors position themselves in niches and are able to
enjoy profitable opportunities.
There is also a clear advantage for the high yield instruments; there is a more important correlation of the
convertible to the stock if it is ranked as high yield, than if it would be an investment grade.

30
For this kind of investors convertible bonds value are calculated with the equity value (conversion ratio
multiplied by the number of bonds hold) plus the value of the put option on equity plus the value of the
yield advantage (which means the difference between receiving coupons instead of dividends).
There is also the option of using it for switching which is the strategy of going back and forward form the
convertible to the equity and from the equity to the convertible. Traders usually fix some rules, as for any
trading of financial instruments and deciding on when to enter or exit the market. Here the rules are set
as a percentage of stock variation or depending on the premium. These active way of management to
shift limits the negative returns and losses especially in a declining market.
Some convertibles can be cross currency, this means that they quote in a different currency than the
underlying asset. For investors that are required to invest only in a specific currency, these kinds of
convertible allow them to be exposed to other markets and other opportunities without having to
consider the currency rate risk.
Effect on M&A transactions and in the VC market
Acquisition deal Many articles mention an increase in the use of convertibles for mergers and acquisitions transactions.
Due to the different considerations regarding equity and debt, especially by the credit agencies which we
will look into more details later on, issuing hybrids allows them to raise funds without having to
deteriorate their credit risk and rating.
There is a tendency for very active companies in M&A to issue hybrids instead of common shares as it
allows the companies to issue a lower cost and with less difficulties than for common equity stocks. The
sectors that tend to use this kind of instruments are utilities, telecommunications and we see an increasing
tendency in the energy sector and the real estate.
The inherent conditions of the coupons are also an advantage as they also allow the issuing company to
avoid default.
But some problems of valuation can come up and of course the structure of the acquisition and amount
will have an undeniable influence over the future of the convertible of the companies whose being
bought.
Most of the time the bond holder will keep its rights of on-going conversion, but of course it depends on
the clauses included in the prospectus. Usually there is a change of control clause that fixes the options
of the investors.
There are three main scenarios, the first is the payment of the principal by the issuer plus the accrued
interest and a premium, the second is simply the payment of the principal plus the accrued interest as any
debt and finally a conversion under the rules predefined in the contract.
Depending also on the nationality of the company and the way of doing business locally, some companies
will be more inclined to allow a conversion of the convertible bond into the stock of the acquired company
others will concede into an enhanced conversion window. The conversion ratio frequently stays the same
and the price of reference of the stock is the one before the acquisition.

31
This conversion window can take two forms. The first one would be the step conversion clause which is
an enhanced ratio of conversion that decreases as time goes by and following a predefined schedule. The
investors have usually a 60-day period to convert. The second one would be the average premium
enhancement which is a premium calculated over a certain period on the bond. To beneficiate from this
premium the convertible holder also has approximately 60 days.
There is also the possibility of exchangeability that is frequently into shares of another company, but in
some rare cases cash, debt or debt-like products.
Advantages in the venture capital market We mentioned that one advantage of a convertible issuance was to avoid the funding difficulties that
could be linked to the rating of agencies or the deterioration of the credit rating.
Another important point is that VC firms are characterized by important rates of growth. Indeed,
companies with high historical and forecast growth rate generally have high corporate valuations but
whose uncertain nature of development is very important. The issuance of hybrid securities will therefore
make it possible to raise more capital from investors who will limit their potential loss risks by contributing
part of their capital in quasi-equity, giving rise to coupons and premiums, compare to a situation where
there would only be core capital available with even higher levels of risk.
It is specially adapted as a large number of managers and owners of this type of companies do not
necessarily wish to open up the capital to external investors. Thus, convertibles solve this problem since
at the time of issuance, the capital of the current owners is not diluted, until the conversion, or may not
even be in the event of a call back.
Of course, in case of financial difficulties, the owners of the company can do a forced conversion, allowing
them to strengthen their core capital
Situation, perspectives and expectations Nowadays, in a context of low interest rates, European convertible bond markets are supported by an
outbreak of new issues and attractive valuation. In 2017 the implied volatility was about 28%, at this level
of implied volatility, European convertible bonds valuations could be considered by portfolio managers as
cheap.
32
As a reminder, 2016 was also a dynamic year with EUR 25 billion new issues. It is essentially driven by
issuance of large caps and blue chips companies (recognized, well-established, leader of their sector and
financially sound) with investment grade ratings, low coupon yields and delta less than 30%.
In this environment, there is particular attention to equity and volatility levels. For instance, Michelin
launched a bond with a 2022 maturity and a coupon of 0%. The price at issuance was not that attractive
but on the secondary market the prices adjusted to lower levels.
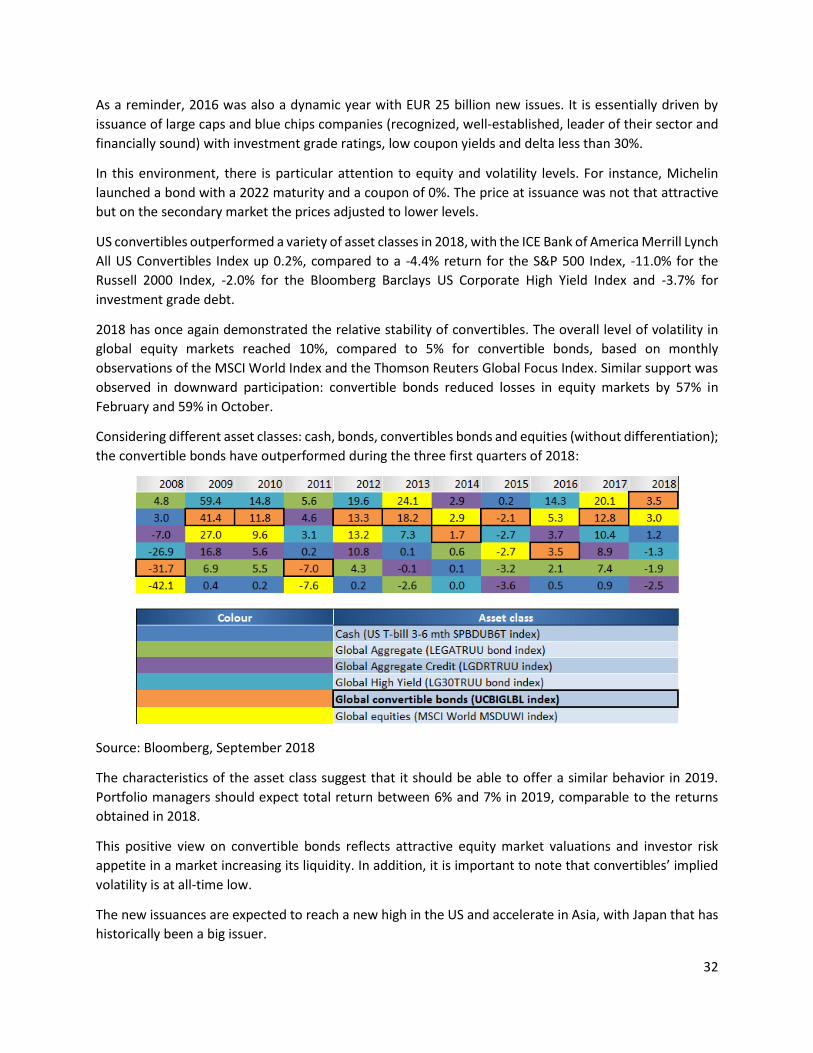
US convertibles outperformed a variety of asset classes in 2018, with the ICE Bank of America Merrill Lynch
All US Convertibles Index up 0.2%, compared to a -4.4% return for the S&P 500 Index, -11.0% for the
Russell 2000 Index, -2.0% for the Bloomberg Barclays US Corporate High Yield Index and -3.7% for
investment grade debt.
2018 has once again demonstrated the relative stability of convertibles. The overall level of volatility in
global equity markets reached 10%, compared to 5% for convertible bonds, based on monthly
observations of the MSCI World Index and the Thomson Reuters Global Focus Index. Similar support was
observed in downward participation: convertible bonds reduced losses in equity markets by 57% in
February and 59% in October.
Considering different asset classes: cash, bonds, convertibles bonds and equities (without differentiation);
the convertible bonds have outperformed during the three first quarters of 2018:
Source: Bloomberg, September 2018
The characteristics of the asset class suggest that it should be able to offer a similar behavior in 2019.
Portfolio managers should expect total return between 6% and 7% in 2019, comparable to the returns
obtained in 2018.
This positive view on convertible bonds reflects attractive equity market valuations and investor risk
appetite in a market increasing its liquidity. In addition, it is important to note that convertibles’ implied
volatility is at all-time low.
The new issuances are expected to reach a new high in the US and accelerate in Asia, with Japan that has
historically been a big issuer.

33
In the same time, portfolio managers favor small-and-medium-sized companies in order to benefit fully
from convexity and attractive growth in this market.
But investors should be prepared and protected against credit crises and possible increase in defaults. It
clear that the global situation and low or event bellow zero interest rates affect the market on the long
term, adding inefficiencies and allowing companies to continue their business when in a normal situation
they would go bankrupt. “The default risks have been increased by large investment flows into exchange-
traded funds (ETFs) and a potentially crowded trade in lower investment grade (IG) companies”2. Indeed,
if the refinancing cost increases, their accounting situation worsens, having as a consequence a
downgrade by rating agencies which will again increase the cost of funding, triggering a vicious circle of
selling pressure and illiquidity.
As a part of convertible bonds depends on credit risk, they are not immune to default risk, even though
convertible market is mainly composed by financial assets from strong companies, investment grade
companies or companies with an easy access to financial markets and liquidity.
Performance strategies We already mentioned a strategy that could be adopted by equity investors, the shifting strategy, but
there are others that focuses on different characteristics and have a hedging or arbitrage.
The most general one is the comparison of the cash obtain to the cash invested. It considers the payoff of
the convertible bond. The key element considered is the Gamma. A high Gamma would mean a good
balance between a stock performance influencing on the convertible as well as a good protection thanks
to the bond floor. A low Gamma generally means higher return if the underlying asset price increases.
To avoid this Gamma effect, investors generally combine convertible position with equity position. For
example, a long position in high Gamma could be hedged by a short position in common equity. The return
of the strategy will be calculated this way:
𝑟𝑒𝑡𝑢𝑟𝑛 = 𝑃𝑡+𝑇 − 𝑃𝑡
𝑃 −
100 ∗ 𝛿 ∗ (𝑆𝑡+𝑇 − 𝑆𝑡)
𝑃 ∗ 𝐶𝑝 (if the price of the convertible is notional, clean price)
Or 𝑟𝑒𝑡𝑢𝑟𝑛 = 𝑃𝑡+𝑇 − 𝑃𝑡
𝑃 −
𝛿 ∗ 𝐶𝑟 ∗ (𝑆𝑡+𝑇 − 𝑆𝑡)
𝑃 (if the price of the convertible is a French convertible, dirty price
in cash)
For a good implementation of the strategy the risk has to be adjusted, it should be confirmed by three
elements developed by Sortino, Ven der Meer and Plantinga.
First, the upside-potential ratio: 𝑈𝑝𝑠𝑖𝑑𝑒 − 𝑝𝑜𝑡𝑒𝑛𝑡𝑖𝑎𝑙 𝑟𝑎𝑡𝑖𝑜 = 𝐸{max (𝑟 − 𝑟∗,0)}
√𝐸{min (𝑟 − 𝑟∗,0)2}; with r* being the
minimum return required
Second, the Sortino ratio: 𝑆𝑜𝑟𝑡𝑖𝑛𝑜 𝑅𝑎𝑡𝑖𝑜 = 𝐸{𝑟 − 𝑟∗}
√𝐸{min (𝑟 − 𝑟∗,0)2}
2 Article Source (20.06.2019): Outlook 2019: Global convertibles. Schroders https://www.schroders.com/es/uk/adviser/insights/markets/outlook-2019-global-convertibles/

34
The small difference between the two, is that the upside-potential ratio only considers the positives
returns, whereas the Sortino ratio includes the overall performance. To include the gains as well as the
losses those ratios can be completement to the Omega ratio by Keating and Shadwick:
𝛺(𝑟∗) = ∫ (1 − 𝐹(𝑟)) 𝑑𝑟
+∞
𝑟∗
∫ 𝐹(𝑟) 𝑑𝑟𝑟∗
−∞
In addition to this calculation, the investing can be made related to the expectations of the trend of the
market and its volatility, the outlook of the economic and financial situation. In the end the long-term
performance depends on the same factors as the one affecting both equities and bonds, as convertible
combine both characteristics, but also option factors.

35
Regulation, international standards and rating agencies
Historical evolution Capital regulation has been changing and adapting crisis after crisis. The Basel Committee was created in
1975 with the goal of ensuring the stability of the financial system. It does not impose regulatory laws but
publishes general principles that have to be adopted by regulators whose job is indeed to implement
these principles in their country.
Basel I was published in 1988 and it was the first time a minimum amount of regulatory capital was
imposed to banks and financial actors. It required a minimum of 8% of regulatory capital to covert for the
risk-weighted assets. This 8% ratio is also called the “Cooke ratio” after Peter Cooke, head of the banking
supervision for the Bank of England and chairman of the Committee when Basel I was published.
This requirement intended to limit the risk taken by banks. The Committee came up with a weighting
scheme differentiating the different types of assets but without taking into account the individual credit
risk or the rating:
- 0%: cash, central bank debt, OECD government debt
- 10%: loans to domestic public sector entities
- 20%: loans to OECD banks, non-OECD banks (if the maturity is less than a year), non-OECD cash
and public sector
- 50%: loans for secured residential mortgages
- 100%: loans to private sector, non-OECD bank (if the maturity is more than a year), real estate,
plant and equipment…
As will prove the crisis in the years following Basel I, the regulation was clearly insufficient, but at least it
was the first time that appeared the idea of capital loss absorption and risks within the banks.
At the end of the 90’s and beginning of the millennium, a lot of deregulation took place in the financial
system and the banks’ business model changed. They shifted from their core business of giving loans and
financing to speculation and increase drastically the volumes of derivatives and structured products.
Then Basel II was published in 2004, after the dot com crisis, and started to be implemented in 2007. It
attempted to correct the Basel I regulations and adapt it depending on the risk profile of the asset. It
established three pillars:
- Minimum capital requirements
- Review of the supervisory entity
- Market discipline
And recognized three types of risk that should be covered: the credit risk (already present in Basel I), the
market risk and the operational risk.

36
Basel II also redefines the weighting scheme presented in Basel I, by splitting into different categories
banks, corporations and sovereign and including external rating:
Risk weights
Credit rating Sovereigns Banks
Corporations Under classic conditions
For short-term assets (maturity less than three months)
AAA to AA- 0% 20% 20% 20% A+ to A- 20% 50% 20% 50% BBB+ to BBB- 50% 50% 20% 100% BB+ to B- 100% 100% 50% 100% Below B- 150% 150% 150% 150% Unrated 100% 50% 20% 100%
But the better coverage of Basel II was not enough to avoid the 2008 crisis of liquidity, solvency, leverage,
etc.
Rethink the capital loss absorption The sequence of crisis from the black Monday (1987) and Basel I to the 2008 crisis revealed vulnerabilities
of the capital quality of banks and the consequences banks’ activities could have over the entire financial
system. Basel III is the evolution of the requirements that came after the 2008 crisis and the subprime
crisis. Its main objective, like Basel I and II, is to regulate companies’ capital in order to improve and
prepare them for the coming crisis.
After the 2008 crisis and many bankruptcies, like the well-known Lehmann Brothers, it was obvious that
something had to be done to the solvency and liquidity levels of banks. Deep changes of the sector had
to be operated. The initial requirement of 8% of capital was maintained but within this capital,
composition rules were imposed, and some additional buffers were established.
Capital base and quality The capital has now to ensure a certain level of loss absorption and there must be a leverage limit. The
capital is divided in three pillars: the first one regulates capital, risk coverage and containing leverage, the
second is for risk management and supervision and in the third one concerns market discipline.
Compared to the previous classification of capital in Basel I and II, Tier 3 has disappeared, Tier 2 is now
only one category without differentiation of Upper or Lower Tier 2 and Tier 1 has been redefined into
Common Equity Tier 1 (CET1) and Additional Tier 1.
Pillar 1
Pillar 1 is divided in three levels with each a determined percentage: First there is a 4.5% of core capital
CET 1 that includes common all equity and it is completely loss absorbing. Then we have 1.5% of Additional
Tier 1 that includes regulatory capital and hybrid instruments with different characteristics that modify
the degree of subordination and seniority and 2.5% of Tier 2 that incorporates mainly subordinated debt.
In either case the capital must have the ability to be loss absorbent through a write-off or a conversion
into common equity.
Then we have the buffers that must be held in common equity:

37
- Capital conservation buffer: 2.5% of risk-weighted assets
- Countercyclical buffer: it can be between 0 to 2.5% of risk-weighted assets
- Leverage ratio or systemic buffer: it is to have a better representation of the exposure of the bank;
the FSA made a study and found out that in some cases banks could be well capitalized if the
capitalization calculation was made through a certain risk-weighted asset model but was actually
one of the worst capitalized with the calculation of the leverage ratio. This ratio keeps track of the
real exposure of the bank, including the off-balance assets.
𝐿𝑒𝑣𝑒𝑟𝑎𝑔𝑒 𝑟𝑎𝑡𝑖𝑜 = 𝑇𝑖𝑒𝑟 1
𝐴𝑠𝑠𝑒𝑡𝑠
The minimum required by Basel is 3%, but some local regulators have required their banks to
respect a higher ratio.
Some additional buffers were also required for systemic banks, the SIBs or SIFIs, by the Financial Stability
Board in order to limit the size, the problems and repercussions these banks can have in a global economic
and financial world. These “too big to fail” banks are now required to hold an extra 1% to 3.5% of capital.
Then we have all the regulation regarding securitizations, trading books, counterparty credit risk and the
bank exposure to central counterparties (CCPs), that imposes a stricter follow up of the risk exposure of
the bank and so the compensation by higher levels of capital. Minimum capital ratio:
Pillar 2
This pillar focuses on the risk management and supervision, it a more global point of view of the company:
checking on the governance, monitoring the exposure of off-balance and securitizations activities,
managing the risk concentration and the risk-returns on the long term, stress testing, etc.
Tier 2
Additional Tier 1
SIB / SIFI extra requirement
Counter-cyclical buffer
Capital Conservation buffer
Common Equity Tier 1 4.50%
2.50%
0.00% - 2.50%
1.00% - 3.50%
1.50%
2.00%
4.50%
7.00%
7.00% - 9.50%
8.00% - 13.00%
9.50% - 14.50%
11.50% - 16.50%
38
Pillar 3
The third pillar is dedicated to the market discipline and the transparency of the capital of the bank, with
the obligation of such entities to disclose the details of their regulatory capital.
Liquidity standard It was clear that even though banks respected the capital requirements, their liquidity also should be
controlled, so a few mandatory ratios were introduced:
Liquidity coverage ratio
It is the obligation for a bank to have sufficient high-quality and liquid assets to cover at least 30 days of
stressed founding scenario, like a bank run.
𝐿𝑖𝑞𝑢𝑖𝑑𝑖𝑡𝑦 𝐶𝑜𝑣𝑒𝑟𝑎𝑔𝑒 𝑅𝑎𝑡𝑖𝑜 (𝐿𝐶𝑅) = 𝐿𝑖𝑞𝑢𝑖𝑑 𝑎𝑠𝑠𝑒𝑡𝑠
(𝐶𝑎𝑠ℎ 𝑜𝑢𝑡 − 𝐶𝑎𝑠ℎ 𝑖𝑛)30−𝑑𝑎𝑦𝑠 𝑝𝑒𝑟𝑖𝑜𝑑
Net stable funding ratio
This ratio complements the LCR and has a more long-term focus, its goal is that the liquidity of the assets
the banks own corresponds to the same time frame of the instruments it uses for founding.
𝑁𝑒𝑡 𝑆𝑡𝑎𝑏𝑙𝑒 𝐹𝑢𝑛𝑑𝑖𝑛𝑔 𝑅𝑎𝑡𝑖𝑜 (𝑁𝑆𝐹𝑅) = 𝐴𝑚𝑜𝑢𝑛𝑡 𝑎𝑣𝑎𝑖𝑙𝑎𝑏𝑙𝑒 𝑓𝑜𝑟 𝑓𝑢𝑛𝑑𝑖𝑛𝑔
𝐴𝑚𝑜𝑢𝑛𝑡 𝑟𝑒𝑞𝑢𝑖𝑟𝑒𝑑 𝑓𝑜𝑟 𝑓𝑢𝑛𝑑𝑖𝑛𝑔
Towards Basel IV and future evolution Basel III implementation deadline was 2019, and applying these new requirements are essential for the
financial stability of the system but the constant changes in technology and in world economies keep
regulators and the Basel Committee working. Recent deregulation in the US are low regulation in
emerging economies or in China could be the causes of the next crisis. That is why some suggest even
more draconian rules to be adopted gradually.
In 2016, the Basel Committee on Banking Supervision came up with the "Standardized Measurement
Approach for operational risk" to globalize and measure objectively the operational risk, through new
capital requirements and calculation of the market risk.
At the end of 2017, the committee published a paper called “Basel III: finalizing post-crisis reforms” also
known as Basel IV. They seemed eager to include a floor for the risk-weighted asset, regarding the interest
rate risk, and the risk related to data and IT system.
The capital floor was one of the central elements of the discussions and decisions. The regulators
established a floor for risk-weighted assets of banks, the RWAs calculated by the internal models and the
standardized approach could not represent less than 72.5%.
New set of requirements will be implemented by 2022 regarding market risk.
The credit risk was also revised. The approval of a standardized was adapted to improve resilience and
sensitivity to existing risk. For example, with the extension of the range of risk weights, especially in real
estate with more sensitivity to the LTV (Loan to value) of mortgages, or the obligation to do a due diligence
when using external ratings.

39
Regarding operational risk, a new standardized model was established to replace existing ones. The new
approach determines the capital requirements based on the measure of a bank’s income (the higher the
income, the higher the risk) and the measurement of a bank’s historic losses.
Regarding SIB additional requirement are imposed, a new leverage ratio buffer is set to be included to
limit furthermore the impact that could have a failure of an institution like those ones. This leverage ratio
can only be guaranteed by Tier 1 capital and has been increased so that SIBs have now to ensure 50% of
their risk weighted assets with loss absorbing capital.
One of the few elements that remains the same is the exposure to sovereign risk. As there was no
agreement it stays unchanged, keeping the current scale of countries as it is, so OECD members will
continue to be considered as risk free.
Then, there have also been some local changes and national regulations even stricter. In April 2019 for
example, the swiss government proposed new capital requirements for its two biggest banks. Forcing
them to issue new debt with the bail-in form.
Taxation One of the advantages that offers a convertible bond, or a contingent convertible compared to equity is
the imposition of taxes. Indeed, dividends of common equity are directly taxed at high percentages. On
the contrary, coupons do not follow the same assessment scheme and are by nature of a lower amount.
This could be considered as a tax-shield, some researchers observed that convertibles were often kept
alive in order to write down the interest payment et reevaluation as interest expenses.
Consideration by rating agencies From a rating agency to another the considerations defer and so does the valuation of the hybrid. This
impacts directly the level of debt that can handle the company and so its rating. But all agencies don’t
have the same methodology but follow almost the same processes.
First, they analyze the business risk, considering four characteristics: the country risk, the industry risk,
the company’s position in its market and its profitability and a peer comparison. This could be considered
as an environment and external analysis.
Second, they do a financial risk assessment, studying five key elements: accounting; governance, risk
tolerance, financial policy; cash flow adequacy, capital structure and liquidity or other short-term factors.
Here it is clearly an internal study.
Due to a strict methodology by rating agencies, small companies or newly created one’s face funding
difficulties. Indeed, the rating they obtain often enhances their credit risk forcing them to incur debt at
higher rates, affecting their ability to repay on the long term. But also have a disadvantage, as some
investors require only investment grade debt. With convertibles not only they sell debt but part of their
capital reducing the credit risk for investors.
The convertible instruments will typically get a grade 2 or 3 notches under the rating of the senior debt of
the company. For non-investment grade companies, the difference in rating can be even increased 1 or 2
extra notches.

40
Conclusion The hybrids are really complex instruments, but they offer opportunities that other asset classes could
not propose. The differentiation from other asset classes makes the hybrids an innovative asset class that
can be adapted to the needs of the issuer as well as the investors. They can be considered as a tailor-made
solution, where all elements can be personalized.
This non-standard structure makes the pricing and valuation of the asset difficult. Modeling through
common and well know models like Black and Scholes, the Monte Carlo approach or the binomial and
trinomial trees allows to have a general idea of the valuations but not a precise one as some flaws are
introduced by the simplifications and assumptions established in the models.
Hybrids also represent a way for investors of hedging the risk and optimizing their portfolio through
diversification while increasing their returns. The main advantage for issuer is also pretty clear: the cost
optimization, but it can also be an alternative to increasing the debt and downgrading their rating or even
for their funding diversification in currency for example.
We talked a lot about convertibles in a liquid financial market intended for big corporation, but hybrids
can be found in other forms and adapted to smaller companies. On the one hand, their flexible nature
makes these instruments a good option in mergers and acquisitions deals for rating purposes. On the
other hand, they complexify the company’s structure and valuation and can have an impact on the
shareholders structure of the buying company.
Hybrids have also been an important element in the stabilization of the economy and the consolidation
of the financial system after the burst of the bubbles, the huge reconsideration of the system and the
regulatory changes implemented with Basel III and other standards. The options and triggers make them
unique and facilitate the bail of the companies in difficult positions or improve the capital and debt
structure of a going concern company. Issuer can beneficiate of a cheaper funding on the medium term
and are not forced to issue expensive capital tier 1 and dilute their shareholding structure.
But in time of uncertainty they can represent a good option for all market participants as long as they
know the composition of the asset. Understanding the reactions and so the price of the convertibles must
go through the understanding of the exposure and options embedded. The sources of variation of the
convertible are more numerous than for a most common asset classes. The convertible may vary
depending on the quality of the issuer and its rating, but also its level of liquidity on the markets. For non-
quoted companies, the value and pricing of the convertible cannot only rely on the book value or the
origination price.
The market of hybrids is forecasted to keep growing as it is an interesting “asset class” somewhere
between bond and equity and as credit and loan markets might get tougher for issuers. In this context,
and in particular for small and medium companies, we could expect changes in stakes and in the balance
of power between equity holders and debt holders for important volumes of conversion.

41
References
Books Jan DE SPIELGELEER, Wim SCHOUTENS, Cynthia VAN HULLE. The handbook of the hybrid securities.
Convertible bonds, CoCo bonds and Bail-in (2014). Wiley finance series
Papers Beat THOMA. Convertible bonds – An introduction (?). Fisch Asset Management research paper.
William F. SHARPE. Asset allocation: management style and performance measurement (1992). Journal of
Portfolio Management, pp 7 – 19.
Santiago LEGUEY GALÁN, Francesc LLERENA GARRÉS. Valoración de opciones de compra bermuda con
precios de ejercicio variables (1998). Revista Española de economía.
Juan José GARCÍA MACHADO, María PILAR SANCHA DIONISIO, Concepción TEJERO RIOJA, David TOSCANO
PARDO. Opciones “exóticas” (2000). Boletín Económico de ICE.
Manuel AMMANN, Axel H. KIND, Christian WILDE. The Pricing of Convertible Bonds – An Analysis of the
French market (2001). University of St. Gallen.
Thomas HELLMANN. IPOs, Acquisition and the use of convertible securities in venture capital (2002).
Graduate School of Business Stanford University.
Mark DAVIS. Multi Asset Options (2003). Department of Mathematics, Imperial College London.
Colin BLAYDON, Fred WAINWRIGHT. Note on Private Equity deal structures (2005). Center for Private
Equity and Entrepreneurship, Dartmouth College.
Basel Committee on Banking Supervision. Basel III: a global regulatory framework for more resilient banks
and banking systems (2010, Review June 2011).
Jan DE SPIELGELEER, Wim SCHOUTENS. Pricing Contingent Convertibles: a derivatives approach (2011).
Maximilian MARTIN. Understanding the True Potential of Hybrid Financing Strategies for Social
Entrepreneurs (2011). Impact Economy.
Bill LEE. The case for convertible Bonds (2014). Palisade Capital Management.
Marc ERISMANN. Pricing Contingent Convertible Capital - A Theoretical and Empirical Analysis of Selected
Pricing Models (2015). University of St. Gallen.
Basel Committee on Banking Supervision. Standards – TLAC Holdings (2016).
Basel Committee on Banking Supervision. Basel III: finalizing post-crisis reforms (2017).
Ignacio FUENTES, Juan Carlos CASADO. Contingent convertible bonds and subordinated deabt of euro area
credit institutions (2017). Economic bulletin, analytical articles, Bank of Spain.
Ibrahima KOBAR, Nathalie PISTRE, Matthieu GARCIN, Chafic MERHY. Investing in global convertible bonds
– stylized facts, pricing and strategies (2017). Natixis Asset Management research paper.

42
Stefan KOCH, Sebastian SCHNEIDER, Roland SCHNEIDER, Gerhard SCHRÖCK. Basel “IV”: What’s next for
banks? Implications of intermediate results of new regulatory rules for the European banks (2017).
McKinsey & Company – Global Risk Practice.
Prospectus Air France KLM:
- Prospectus: Bonds convertible into and/or exchangeable for new or existing shares of Air France-
KLM due 2023 and guaranteed by Société Air France and KLM (2013)
- Early redemption document: Early redemption of the outstanding 2023 OCEANE (2017)
- Press release: Air France-KLM launches an offering of Bonds Convertible into New Shares and/or
Exchangeable for Existing Shares (OCEANE) due 2026 for a maximum nominal amount of €500
million (2019)
Arkema:
- Prospectus: Arkema convertible bond due 2017 (2010)
- Press release: Arkema successfully priced its €400 million undated hybrid notes (2019)
IAG:
- Press release: IAG convertible bond pricing (2015)
LVMH:
- Press release: LVMH successfully placed $600m cash-settled synthetic convertible bonds (2016)
- Press release: LVMH – $600 million cash-settled synthetic convertible bonds due 2021 (2016)
- Press release: LVMH – Notice to the holders of $750 million cash-settled synthetic convertible
bonds due 2021 (2018)
Articles Michael O’CONNOR, Jeremy HOWARD. “Convertible securities – An investor’s guide”. Deutsche Bank
(2001)
Stanford GSB Staff. “Tax Shield May Make Convertible Bonds Attractive” (2001)
Michael O’CONNOR, Frank KENNEDY, Clodagh MULDON. “Convertible Structures”. Deutsche Bank (2002)
Joseph MARIATHASAN. “How convertible securities are valued”. IPE (2009)
Jeff DAVIES, Gareth MEE. “Convertible bonds – A diverse and interesting investment proposition for
insurers”. EY (2014)
Craig SWANGER. “FIIG Securities says new "bail-in" hybrids are equity risk, not fixed income”. The wire
(2014)
Natixis Asset Management. “Fixed Income Insight: why invest in European convertible bonds?” (2015,
review 2017)
Stamford Associates Ltd. “Spotlight on convertible bonds” (2015)
Lynn STRONGIN DODDS. “Hybrid securities revolution is here to stay”. IPE (2015)

43
BBVA. “BBVA issues dollar-denominated CoCo bonds with the longest maturity and the lowest price for
an issuer from southern Europe” (2017)
Stefan KOCH, Sebastian SCHNEIDER, Roland SCHNEIDER, Gerhard SCHRÖCK. “Bringing Basel IV into focus”.
McKinsey & Company (2017)
Sebastian ZANK, Azza CHAMMEM, Klaus KOBOLD. “Hybrid bond issuance bounces back in Europe, helped
by M&A, low interest rates”. Scope Ratings (2017)
Bank for international settlements. “Statistical release: OTC derivatives statistics” (2018)
BNP Paribas Asset Management. “Global convertible bonds: this is their moment” (2018)
Arnaud BRILLOIS. “Convertible bonds: Welcome back, volatility”. IPE (2018)
Somkrit KRISHNAMRA, Frederic BERTHOLON-LAMPIRIS, Michael REY, Richard TICOALU, Justin ONG. “The
new “Basel IV”, what changed?”. Deloitte (2018)
Robert L. SALVIN, Anthony J. DAIGLE. “Holding the middle ground with convertible securities”. Putnam
Investment (2018)
Sebastian ZANK, Azza CHAMMEM, Klaus KOBOLD. “Europe’s hybrid bond market rebound gathers pace:
Issuance set to exceed EUR 20bn in 2018”. Scope Ratings (2018)
La financière de l’Echiquier. “2019: are convertible bonds making a comeback?” (2019)
Albertina TORSOLI. “Switzerland Plans to Tighten Capital Rules for Its Biggest Banks”. Bloomberg (2019)
Vernimmen. “LES INVESTISSEURS ET LA LOGIQUE DES MARCHÉS FINANCIERS : Les titres hybrides” (2019)
Guillaume BENOIT. “Les émissions de dette hybride devraient marquer le pas” Les Echos (2019)