Who Pays the Taxes?
89
FFB Forschungsinstitut Freie Berufe Fakultät II - Wirtschaft und Gesellschaft Postanschrift: Forschungsinstitut Freie Berufe Postfach 2440 21314 Lüneburg [email protected] http://ffb.uni-lueneburg.de Tel: +49 4131 677-2051 Fax: +49 4131 677-2059 Universität LÜNEBURG Who pays the taxes? C. A. de Kam, J. de Haan, C. Giles, A. Manresa, E. Berenguer, S. Calonge and J. Merz FFB Discussion Paper No. 18 July 1996
-
Upload
independent -
Category
Documents
-
view
3 -
download
0
Transcript of Who Pays the Taxes?

FFB ForschungsinstitutFreie Berufe
Fakultät II - Wirtschaft und Gesellschaft
Postanschrift:Forschungsinstitut Freie BerufePostfach 244021314 Lüneburg
[email protected]://ffb.uni-lueneburg.deTel: +49 4131 677-2051Fax: +49 4131 677-2059
UniversitätL Ü N E B U R G
Who pays the taxes?
C. A. de Kam, J. de Haan, C. Giles, A. Manresa, E. Berenguer, S.
Calonge and J. Merz
FFB Discussion Paper No. 18
July 1996

Who pays the taxes?
C. A. de Kam and J. de Haan1, C. Giles2,
A. Manresa, E. Berenguer and S. Calonge3, J. Merz4
Discussion Paper No. 18
Juli 1996 ISSN 0942-2595
1 Prof. Dr. C. A. de Kam and Prof. Dr. J. de Haan, both Groningen University, Groningen,
The Netherlands
2 C. Giles, The Institute for Fiscal Studies, London, United Kingdom
3 Prof. Dr. A. Manresa, Prof. Dr. E. Berenguer and Prof. Dr. S. Calonge, Universitat de Barcelona, Barcelona, Spain
4 Prof. Dr. J. Merz, University of Lüneburg, Department of Economics and Social Sciences, Research Institute on Professions (Forschungsinstitut Freie Berufe, FFB), Campus, Scharnhorststr. 1, Gebäude 4, 21332 Lüneburg, Germany, Tel.: 04131/78-2051, Fax: 04131/78-2059, e-mail [email protected], http://www.uni-lueneburg.de/fb2/ffb/ffbhome.htm

Who pays the taxes? C. A. de Kam, J. de Haan, C. Giles, A. Manresa, E. Berenguer, S. Calonge, and J. Merz FFB-Discussion Paper No. 18, Juli 1996, ISSN 0942-2595
Summary
The European Union is legally entitled to the revenue from (1) agricultural and sugar levies, (2) customs duties, (3) a 1 percent rate on each Member States' value added tax base, and (4) a resource on the basis of GNP. Currently, the Union is actively involved in the search for a fifth own revenue source. Therefore, the European Commission (DG XIX) has invited the authors to trace 'who pays the taxes'. As requested, our report gives a general account of methods to investigate impacts of taxation. More specifically, we have estimated the incidence of national tax systems (Germany, the Netherlands, Spain and the United Kingdom), and the incidence of present own resources and prospective new (tax) resources of the European Union. Up till now, such information was not (readily) available. JEL: D30, D31, H24 Keywords: tax incidence in the European Union, prospective new EU tax resources
Zusammenfassung
Der Europäischen Union werden gesetzlich folgende Einnahmearten zugeschrieben: (1) aus Agrarabschöpfungen, (2) aus Zöllen, (3) Mehrwertsteuer-Eigenmittel und (4) BSP-Eigenmittel. Gegenwärtig sucht die Europäische Union nach einer fünften Eigenmittelquelle. Daher hat die Europäische Kommission (DG XIX) die Autoren des vorliegenden Beitrags aufgefordert, zu der Frage 'Wer bezahlt die Steuern?' Stellung zu nehmen. Unser Bericht stellt zunächst einmal die Methoden zur Erforschung der Steuerwirkungen dar. Insbesondere haben wir das Aufkommen und die Verteilung nationaler Steuersysteme (Deutschland, Niederlande, Spanien und Großbritannien), der jetzigen EU-Eigenmittel und der zukünftigen Quellen der EU geschätzt. Bis jetzt waren Informationen dieser Art nicht direkt zugänglich. JEL: D30, D31, H24 Schlagwörter: Steuerinzidenz in der Europäischen Gemeinschaft, neue EU-Steuerressourcen Acknowledgements We acknowledge the financial support from the European Commission (Directorate General XIX) and the institutional support from the DIGCYT PB93-0751 and CICYT SEC96-1011-C02-01. We thank Mrs. Dipl.-Ök. Kshama Venkatarama, Research Institute on Professions, (Forschungsinsitut Freie Berufe, FFB), University of Lüneburg, for her assistance.

1
WHO PAYS THE TAXES?
C.A. de KAM and J. de HAAN, Groningen University, with C. GILES, The Institute for Fiscal Studies, London A. MANRESA, E. BERENGUER and S. CALONGE, Universitat de Barcelona J. MERZ, Universität Lüneburg
FINAL VERSION Groningen, 15 November 1995


i
Executive summary Introduction The European Union is legally entitled to the revenue from (1) agricultural and sugar levies, (2) customs duties, and (3) a 1 percent rate on each Member States' value added tax base. As from 1988 the Union can call on a fourth own resource, on the basis of GNP. As a consequence of the Edinburgh agreement, the share of this resource is estimated to rise from 14 percent (1992) to nearly 50 percent (1999). Currently, the Union is actively involved in the search for a fifth own revenue source. The European Council has explicitly requested the Commission for a report concerning possible candidates for a fifth own resource.1 New European taxes can be judged in the light of their contribution to a fair overall distribution of revenues and expenditures. One precondition for evaluating both the fairness of the present tax system of the Union and its Member States, and to assess proposals for its reform, is adequate knowledge about social and economic impacts of existing taxes, notably about the distribution of tax burdens within the European Union. However, as yet such information is not readily available. Therefore, the European Commission (DG XIX) has invited the authors to trace "who pays the taxes". As requested, our report gives a general account of methods to investigate impacts of taxation. More specifically, we have estimated the incidence of national tax systems, and the incidence of present own resources and prospective new (tax) resources of the European Union. Up till now, such information was not (readily) available. National tax systems of Member States show great variety. The Commission has stipulated that our analysis should cover at least three significant Member States. We have decided to include four, i.e. - in alphabetical order - Germany, the Netherlands, Spain and the United Kingdom. Together, these countries account for over fifty percent of GNP of the Union. Methodology The incidence of a tax is measured by the reduction in real income which results from the imposition of that tax. We want to establish who pays the taxes (statutory incidence) and who ultimately bears the tax burden (economic incidence). Both tax distributions will differ, since individuals and firms are inclined to shift taxes they must pay onto others. For this report, data on taxes households paid in the early 1990s have been taken from government administrations and nation-wide representative surveys among households. In a number
1 See Article 10 of the Decision on new own resources by the European Council, dated 31 October 1994 (94/728/EG, Euratom), Journal officiel des Communautés européennes, No L 293/13.

ii
of cases such data were run through a microanalytic model to simulate the amount households pay in certain taxes. Given the limitations inherent to available microdata, it was not possible to calculate the burden of all taxes. Once the statutory incidence of taxes has been established, their economic incidence may be traced under a variety of assumptions. Although some progress has been made in recent years in improving the methodology of tax analysis, economists still disagree about the economic incidence of several of the most important taxes in national tax systems. Reflecting the state of the art, our incidence assumptions are spelled out in section 6.3. Results are presented as tax shares of ten groups, each containing ten percent of all households (`deciles'). Households have been ranked into deciles by increasing income. Thus, the ten percent poorest households are located in the first decile, the ten percent richest households are found in the tenth decile. Incidence of present own resources Table 0.1 specifies tax revenues of the former European Community in the early 1990s. The economic incidence of each own resource is shown in tables 0.2 - 0.4.
Table 0.1 Tax revenues of the European Community (% share)a) 1991 1992 Agricultural and sugar levies 4 3 Customs duties 20 19 Value added tax base 54 58 Fourth resource (GNP-base) 13 14
a) Miscellaneous revenues produced 8 percent (1991) and 6 percent (1992) of total revenue; see table 1.1.

iii
Regarding the incidence of agricultural and sugar levies no reliable information is available at the EU level. Based on data from national consumer surveys, we have allocated these taxes to households in proportion to their consumption of food. Arguably, this is a rather strong assumption, but the approach adopted here seems to be defensible.
Table 0.2 Incidence of agricultural/sugar levies (% share) Decile 1 2 3 4 5 6 7 8 9 10 Total Germany 5 6 6 10 9 11 12 13 13 15 100 The Netherlands 5 6 7 9 9 10 12 13 13 16 100 Spain 5 7 8 10 10 11 11 12 12 14 100 United Kingdom 4 5 7 8 9 10 11 13 15 18 100
To establish the economic incidence of customs duties, it is assumed that households pay such taxes in proportion to their total consumption of goods and services. Table 0.3 shows the share of households in aggregate consumption, per decile.
Table 0.3 Incidence of customs duties (% share) Decile 1 2 3 4 5 6 7 8 9 10 Total Germany 4 5 5 9 8 10 12 13 14 19 100 The Netherlands 5 5 7 8 9 10 12 13 14 18 100 Spain 4 5 7 8 9 10 11 13 14 18 100 United Kingdom 3 4 6 7 8 11 11 13 16 21 100
The European Union collects the VAT-based contribution of its Member States by means of a notional harmonized base, and not as part of value added tax actually paid by consumers. The incidence of the VAT-based contribution will be reviewed when discussing the impact of new own resources (table 0.5).

iv
The incidence of the GNP-based own resources of the EU is in fact determined by the incidence of national tax systems of Member States. Table 0.4 shows the economic incidence of national tax systems of the four countries. For a correct interpretation of the information contained in table 0.4 it is very important to note that, due to missing data, the incidence of several taxes could not be traced. Given wide differences in national tax mixes, taking into account the spread in taxes covered (62-98 percent of aggregate tax revenue), and considering the substantial variation in GDP per capita (table 4.1) and in the inequality of the distribution of household incomes, the pattern of tax incidence in the four Member States included in our report is strikingly similar. The fifty percent poorest households carry 23-24 percent of the aggregate tax burden in Germany, the Netherlands and Spain, whereas the ten percent with the highest incomes contribute 25-26 percent. Only in the United Kingdom, tax burdens are more skewed towards rich households, which may perhaps be explained by the greater inequality of the personal income distribution in this country and zero-rated items for VAT-purposes.
Table 0.4 Incidence of GNP-based own resource (% share) a) Decile 1 2 3 4 5 6 7 8 9 10 Total Germany 2 3 5 7 7 9 11 13 16 26 100 The Netherlands 2 3 5 6 8 9 11 13 16 25 100 Spain 2 3 4 6 8 9 11 14 16 26 100 United Kingdom 1 2 3 4 7 9 11 14 18 32 100
a) Results presented here refer to the totals line (printed in bold) of tables 7.2 (Germany), 7.3 (the Netherlands),
7.4 (Spain) and 7.5 (United Kingdom). Incidence of prospective own EU resources In recent years, several proposals for new own EU resources have been fielded. We will assume here that new own resources are introduced within a framework of revenue neutrality. It follows that to judge the net impact of the introduction of any new resource the incidence of this new resource and the incidence of the present resource it (partly) replaces should be jointly considered. One proposal aims at the introduction of an own VAT-resource to finance part of the outlays of the Union. It is assumed here that the distribution of this tax would closely resemble the present distribution of national VAT. This assumption seems to be warranted, given that the VAT tax base is

v
effectively harmonised between Member States. However, keeping in mind the existing variation of tax rates and in national consumption patterns, it must be conceded that incidence patterns presented here are only indicative. On the other hand, we find a strikingly similar distribution of the value-added tax burden for Germany, the Netherlands and Spain (table 0.5).
Table 0.5 Incidence of new own resource: value added tax (% share) Decile 1 2 3 4 5 6 7 8 9 10 Total Germany 4 5 5 9 8 10 12 13 14 19 100 The Netherlands 4 5 6 8 9 10 12 13 15 19 100 Spain 4 5 7 8 9 10 11 13 14 18 100 United Kingdom 3 3 5 6 8 11 11 14 16 23 100
Over the years, various other proposals for new own resources have been fielded. For example, in the report Stable Money--Sound Finances experts have advanced a tax on `seigniorage', that is the return for central banks on interest-bearing assets which form the counterpart to the monetary base. The introduction of this tax would imply that the role of the GNP-based own resource would commensurately decrease. Given our assumptions, the introduction of a `seigniorage tax' would in effect not change the present overall incidence of EU own resources (see section 9.2).

vi
Table of contents Executive summary i-v 1. Introduction 1 2. Objectives and scope of report 4 3. Outline of report 4 4. Country profiles of four selected Member States 5 5. Tax systems of four selected Member States 7 5.1 Introduction 7 5.2 Germany 8 5.3 Netherlands 9 5.4 Spain 11 5.5 United Kingdom 12 6. Empirical analysis of tax incidence 15 6.1 Introduction 15 6.2 Statutory incidence of taxes 16 6.3 Economic incidence of taxes 18 6.4 Tax incidence in macroeconometric models 20 7. Incidence of national tax systems 24 7.1 Introduction 24 7.2 Germany 25 7.3 Netherlands 28 7.4 Spain 30 7.5 United Kingdom 32 7.6 Comparison of tax distributions 34 8. Incidence of present own EU resources 37 8.1 Introduction 37 8.2 Agricultural and sugar levies 37 8.3 Customs duties 39 8.4 VAT- and GNP-based own resources 39 8.5 GNP-based own resource 40 9. Incidence of prospective own EU resources 42 9.1 Introduction 42 9.2 Policy options 42 9.3 Incidence of a new own resource: value added tax 44

vii
Annexes 1. Economic Profiles of four EU Member States 45 1.A Germany 45 1.B Netherlands 46 1.C Spain 47 1.D United Kingdom 48 2. Data and models used to trace tax burdens 51 2.A Introduction 51 2.B Germany 52 2.C Netherlands 53 2.D Spain 53 2.E United Kingdom 54 3. Sensitivity analysis of tax incidence 55 4. Tax shifting in macroeconometric models 57 4.A Germany 57 4.B Netherlands 59 4.C Spain 61 4.D United Kingdom 63 References 65-68


1
1 Introduction In 1992 total spending of the then European Community (EC) amounted to slightly over ECU 58bn. The Treaty of Rome forbids the European Union (the former EC) to run deficits. So all outlays of the Union must be covered by current receipts. In 1992 revenue nearly touched ECU 60bn. Table 1.1 details the composition of the EC budget in 1991-1992.
Table 1.1 Composition of the European Community budget, 1991-1992 1991 1992 _________________ ________________ ECU bn % ECU bn % I Expenditure Agricultural policy 31.0 58 31.2 54 Structural operations 13.9 26 18.4 32 External policy 2.2 4 2.1 4 Research policy 1.7 3 1.9 3 Administration 2.7 5 2.8 5 Other policies 2.1 4 1.8 1 ____ ___ ____ ___ Total 53.6 100 58.1 100 II Revenue Agricultural/sugar levies 2.5 4 2.0 3 Customs duties 11.5 20 11.3 19 Value-added tax 30.3 54 34.7 58 Additional resource (GNP) 7.4 13 8.3 14 Miscellaneous 4.6 8 3.4 6 ____ ___ ____ ___ Total 56.8 100 59.7 100
Source: "Stable Money--Sound Finances", European Economy , no. 53 [1993, p.22] On the revenue side, the European Union (EU) does not possess fiscal sovereignty, since the EU budget authority is not empowered to introduce taxes on its own initiative. From 1958 to 1970 the budget of the former EC was therefore financed by a system of Member State contributions. In 1970 the system of `own resources' was introduced. From then on the present Union is legally entitled to the revenue from:

2
(1) agricultural and sugar levies; (2) customs duties; and (3) a 1 percent rate on each Member States' value-added tax base. This resource is collected from the Member States by means of a notional harmonized base, and not as part of value-added tax (VAT) actually paid by consumers. In 1984 the maximum rate of the VAT resource was raised from 1 to 1.4 percent. In 1989 the tax base itself was capped at 55 percent of the Gross National Product (GNP) of the Member State concerned. As from 1988 the European Union can call on a fourth own resource, on the basis of GNP, to cover the gap between revenue needed and receipts from the other three own resources mentioned. The Edinburgh Summit of December 1992 managed to reach a unanimous position on the development of the EU budget until 1999. After 1994 the ceiling for own resources will gradually increase from 1.2 to 1.27 percent of Union GNP. Also, the call-up rate of the VAT-resource will step-wise be reduced from 1.4 to 1 percent. In addition, the cap on the uniform VAT-base is to be reduced from the present 55 to 50 percent of GDP. All this implies that the relative importance of the fourth resource is bound to rise further from 1995 onward. Currently, the European Union is actively involved in the search for a fifth own revenue source. The European Council has explicitly requested the Commission for a report concerning possible candidates for a fifth own resource.2 Recently, a group of independent economists have examined the role of EU public finances in the perspective of economic and monetary union. These experts have advocated the following changes on the revenue side of the EU Budget. New own resources should substitute, at least partially, for the present third and fourth resource, while at least maintaining proportionality, i.e. ensuring that poorer countries do not pay more and richer ones not less than their respective GDP shares. European Central Bank profits are advanced as a candidate for new own resources. Other well-suited candidates, in the view of the experts, are a tax on C02 emissions, and corporate taxes. Qualifying new European taxes can be judged in the light of their contribution to a fair overall distribution of revenues and expenditures, both within the European Union and among individuals. One precondition for evaluating both the fairness of the present tax system of Member States, and to assess proposals for its reform, is adequate knowledge about social and economic impacts of existing taxes, notably about the distribution of tax burdens within the European Union. However, as yet such information is not readily available.
2 See Article 10 of the Decision on new own resources by the European Council, dated 31 October 1994 (94/728/EG, Euratom), Journal officiel des Communautés européennes, No L 293/13.

3
Recently, the European Commission (DG XIX) has taken initiatives to fill part of existing gaps in our knowledge of tax incidence in the European Union. As part of that initiative the Commission has invited the authors of this report to trace "who pays the taxes".

4
2 Objectives and scope of report The European Commission has laid down the following specifications. Our report should: a. give a general account of methods and results of empirical analyses of the impact of taxation; b. estimate the incidence of national tax systems; c. estimate the incidence of each own resource; d. estimate the incidence of a limited number of prospective new resources. The analysis should cover at least three significant Member States. We have decided to include four Member States, i.e. - in alphabetical order - Germany, the Netherlands, Spain and the United Kingdom. This selection guarantees the required spread in national "wealth" (measured in terms of GDP per capita), it covers three "significant" Member States (in terms of both population and GDP), while sufficient data are available to determine the distribution of tax burdens in each of these countries. 3 Outline of report Section 4 briefly outlines the economic profile of the Member States selected for further analysis. Annex 1 offers a more detailed picture of the economy and the public sector of each Member State over the 1980-1992 period. For selected Member States, section 5 summarises the national tax system and revenue trends over the 1980-1992 period. Next, section 6 offers an overview of methods and results of empirical work on the impact of taxes. Section 7 offers estimates of the incidence of national tax systems. Annex 2 discusses country by country the datasets and micromodels that were used to produce these estimates. Annex 3 demonstrates the sensitivity of our results for alternative incidence assumptions. Annex 4 reviews tax shifting in macroeconometric models. Section 8 presents our estimates of the incidence of each present own resource of the European Union. The incidence of a limited number of prospective new own resources of the Union will be taken on in the concluding section.

5
4 Country profiles of four selected Member States This section summarises key demographic and economic data for each EU Member State covered by the study. Table 4.1 compares the size of their populations, and GDP per capita in 1991. Germany had both the largest population and highest per capita income (data refer to former West Germany only). Purchasing power per capita in Spain was at two-thirds of the German level.
Table 4.1 Demographic and economic country profiles, 1991 Germany Netherlands Spain UK Population (x 1 mln) 63.9 15.1 39.0 57.6 GDP per capita ($) - current exchange rates 24,585 19,300 13,510 17,600 - purchasing power parity 19,500 16,530 15,720 15,720 - index ppp (Germany = 100) 100 85 65 81
Source: OECD [1993a, pp.6-7, 24-25] Table 4.2 compares the role of the public sector. In 1991, total public spending amounted to between 40.8 (UK) and 54.5 percent (Netherlands) of GDP. Such international comparisons of spending levels must be interpreted with care, because the role of off-budget items and tax expenditures may greatly vary from one country to another [OECD, 1985].
Table 4.2 Public sector, 1991 (% of GDP) Germany Netherlands Spain UK Total outlays 49.2 55.2 45.0 40.2 Current receipts 45.6 52.7 40.0 37.4 Deficit 3.6 2.5 5.0 2.8 Gross public debt 45.0 78.3 45.5 40.4
Source: EC, Tables on Public Finance, June 1993

6
By the early 1990s all countries ran deficits, because current public receipts fell short of outlays. In 1991, Spain showed the largest gap between public outlays and current receipts. The Netherlands boasted the smallest deficit, but on the other hand it had the largest public debt in terms of Gross Domestic Product. However, in just a few years time the debt picture may change dramatically. According to OECD projections net public debt in the UK and Germany might by 1996 have swollen to 55 and 58 percent of GDP respectively, whereas the Dutch debt will only slightly increase to 81 percent of GDP [OECD, 1994, p.29]. Such trends reflect that the Netherlands has rather successfully tackled its deficit, the recent recession not withstanding. Annex 1 offers a more detailed picture of economic trends and public sector developments in each of the four selected Member States. Broadly speaking, their economies moved in tandem, growth performance and the public finances reflecting the impact of the deep recession of the first half of the 1980s, the ensuing strong recovery during the second half of the 1980s, followed by the milder recession of the early 1990s. Over successive cycles, unemployment has risen to an increasingly higher structural level, presenting policymakers within the EU area with the formidable challenge to create more jobs for the many millions who are currently out of work. During the 1980s the distribution of personal incomes became more unequal, both in the United Kingdom and the Netherlands. In Spain and Germany, on the other hand, income inequality was reduced, although in Germany only very modestly so. Between 1980 and 1993 the level of public spending went up strongly in Spain, and increased somewhat in Germany. The Netherlands and the United Kingdom recorded a slightly lower ratio of public outlays to GDP. After 1980, the debt-to-GDP ratio rose markedly in three Member States. Only the United Kingdom substantially cut its public debt as a share of GDP, especially so during the second half of the 1980s.

7
5 Tax systems of four selected Member States 5.1 Introduction Ratios of total tax revenue to GDP display much diversity among EU Member States. Moreover, country positions may strongly vary according to the taxes which are taken into account. This is especially important as regards the inclusion or the exclusion of compulsory social security contributions. For example, excluding such contributions, in 1990 the tax level in the Netherlands was below the EU average. Including social insurance contributions, the Netherlands had and still has one of the highest tax levels in the whole EU area. This report reckons social insurance contributions as taxes. Table 5.1 shows the ranking of the four EU Member States by their tax-to-GDP ratios. The tax structure of any country may be characterised by the relative shares of various types of tax. In addition to total tax levels, table 5.1 displays the tax mix by type of tax for the Member States considered here. In Germany, the Netherlands and Spain social insurance contributions are the single most important source of public revenue. In the UK social insurance contributions remain far behind. Receipts from this source vary strongly among countries, reflecting varying degrees of coverage and generosity of programmes, as well as different methods of financing social security transfers.
Table 5.1 Tax mix of selected EU Member States, 1991 (% GDP)a) Personal Corporate Property Consump- Social Total income income tion insurance taxes contributions Netherlands 12.3 3.4 1.7 11.9 17.4 47.0 Germany 10.6 1.7 1.1 10.5 15.3 39.2 United Kingdom 10.3 3.2 3.0 11.8 6.4 36.0 Spain 8.1 2.7 1.8 9.8 12.3 34.7 EU average 10.9 3.0 1.9 12.9 11.9 41.2 a) Countries ranked by decreasing tax-to-GDP ratio. Source: OECD [1993a, pp.75-86]

8
Only in the Netherlands the share of personal income tax revenues exceeds the EU average. In Germany the share of the corporate income tax is below average. In relative terms, property is heavily taxed in the United Kingdom. In Spain, consumption and personal income are taxed relatively moderately. 5.2 Germany Germany finances its public expenditures out of tax revenues on the one hand, and through social contributions on the other hand. The personal income tax constitutes the single most important source of public revenue. In the FRG it consists of a wage withholding tax and the income tax proper. Table 5.2 shows that over the period 1980-1992 the share of the income tax has varied between 23 and nearly 26 percent of total revenue from taxes and contributions.3 Another important tax is the value-added tax (including the import turnover tax) with a tax share of about 15 percent. The corporate income tax has an average share in the tax mix of about 3 percent. Various duties and consumption taxes, including the mineral oil tax and tobacco taxes, are included in table 5.2 as `other taxes'. In recent years their share increased from 8 percent (1990) to 10 percent (1992). With the aim of making the tax system conducive to efficiency and growth, over the past years numerous changes have been made to tax laws. Examples are the Tax Reduction Act (1986/88) and the Tax Reform Act (1990). The national social insurance system, which includes old age pensions, health insurance, disability and unemployment insurance, is financed by both employers and employees. The share of employer contributions in the tax mix has slightly decreased, to 18.5 percent in 1992, whereas the share of employee contributions increased from 18 percent (1980) to more than 21 percent (1992). It is remarkable, that whereas total revenue from taxes and contributions has doubled after 1980 (from 580bn to 1160bn Dmarks in 1992), the structure of the tax mix has only marginally changed over the past fifteen years.
Table 5.2 Tax mix of Germany, 1980-1992 (% share) 1980 1985 1990 1991 1992 DM bn (1992) Personal income tax 25.6 23.8 23.0 23.1 23.5 273 Employee social insurance 17.9 22.0 22.5 21.5 21.2 246
3 Information given in table 5.2 is only available for the former Federal Republic of Germany (FRG), with the exception of data on municipal, federal and trade taxes, which as from 1991 include those of the five new states (Länder).

9
Employer social insurance 19.1 18.9 19.2 18.8 18.5 215 Value-added tax 16.1 14.8 15.9 16.4 16.5 192 Other taxes 8.7 8.3 8.2 9.9 10.0 116 Local government taxes 8.9 7.9 8.0 7.4 7.5 87 Corporate income tax 3.7 4.3 3.2 3.0 2.8 32 ___ ___ ___ ___ ___ Total 100 100 100 100 100 ____ Total revenue (DM bn) 580 740 930 1064 1161
Source: Statistisches Bundesamt, Statistisches Jahrbuch, various issues 5.3 Netherlands In the Netherlands, public outlays are over three-quarters financed out of taxes and social insurance contributions. Non-tax revenues and new debt bridge the gap that remains. In 1992 total tax revenues amounted to Gld 267bn (table 5.3), which roughly equalled 48 percent of GDP. In addition to Gld 162bn in central and local government taxes, contributions to finance public social insurance programmes constitute a very important source of revenue to the public sector (Gld 105bn). The personal income tax and contributions to finance the general social insurances dominate the tax system, each accounting for about one-quarter of total tax revenues. Less than 10 percent of income tax due is collected by assessment, the remainder being collected by withholding the tax at source, the latter method being applied to wages, private pensions, social insurance and welfare benefits (wage tax), and dividends (dividend tax). Resident tax-payers are taxed on their world-wide income, that has been earned within a given calendar year. As a rule, private capital gains are not taxed. Income is taxed under a three-bracket rate schedule at 13%, 50% and 60%, respectively. In 1991, contributions to finance general social insurances produced nearly Gld 63bn. All residents are covered by four general social insurance programmes, the most important one being the general old-age pension scheme. Contributions to finance the general social insurances have a flat rate (25%), with a cap, since these taxes are due on income in the first income tax bracket only, while the personal exemptions apply. Thus, the combined rate of the personal income tax and general social insurance contributions comes to (13+25=) 38%, 50% and 60% respectively. Households with a net worth over (roughly) Gld 200,000 are liable to a net wealth tax (rate 0.8%). Revenues from this net wealth tax amount to Gld 1.4bn. Value-added tax and contributions to finance the employee social insurances each raise over Gld 40bn. Participation in the employee social insurances is mandatory for all workers in the market sector. Insured workers are entitled to benefits in case of unemployment, sickness and disability.

10
The tax basis is gross wage. Part of this flat rate tax is withheld from employee wages, part is directly paid by employers. The maximum amount of earnings subject to contributions for employee social insurances is about Gld 75,000 (1992). In 1992, the corporation income tax produced over Gld 17bn in revenue. Under Dutch tax law corporate income is taxed both at the level of the company as well as at the level of the shareholders. As from 1988 the tax rate (which stood at 46% at the end of the 1970s) is 35%. Other central and local government taxes will not be detailed here.
Table 5.3 Tax mix of the Netherlands, 1980-1992 (% share) 1980 1985 1990 1991 1992 Gld bn (1992) Personal income tax 25.3 18.1 23.6 25.2 23.7 63.4 General social insurance 21.3 27.4 20.6 21.3 23.5 62.7 Employee social insurance 18.0 17.9 17.5 16.8 15.7 42.0 Value-added tax 15.7 16.1 16.0 15.2 15.1 40.5 Other taxes 7.0 7.1 7.6 7.5 7.6 20.1 Corporate income tax 6.5 6.8 7.5 7.2 6.5 17.3 Excise taxes 4.5 4.1 4.3 4.0 4.7 12.6 Local and green taxes 1.7 2.5 2.9 2.8 3.2 8.5 ___ ___ ___ ___ ___ Total 100 100 100 100 100 ___ Total revenue (Gld bn) 156 192 231 256 267
Source: CBS [1988, pp.133-39, 148]; CBS [1993, pp.151-55, 168] Over the whole 1980-1992 period, the tax mix in the Netherlands has not fundamentally changed. However, the share of the personal income tax and employee social insurance contributions has somewhat declined by -1.6 and -2.3 points respectively, whereas the share of general social insurance contributions and local plus green taxes increased by 2.2 and 1.5 points respectively. 5.4 Spain The present Spanish tax system has its origin in the Tax Reform of 1977 which introduced for the first time a veritable personal income tax, together with a net wealth tax. The present top rate of the income tax is 56%. Up till now, the wealth tax has not been very effective in reducing the share in national income of the most affluent individuals.

11
The corporation income tax was reformed in 1978. It has a flat rate of 35%. Presently, the tax base is eroded by a wide variety of tax allowances and deductions. The taxation of goods and services underwent important changes in the wake of the 1986 reform of most indirect taxes, which was motivated by the entry of Spain into the former EC. Particularly, the introduction of the value-added tax should be mentioned. The share of import taxes has dramatically dropped, also as a consequence of Spain joining the European Union.
Table 5.4 Tax mix of Spain, 1980-1992 (% share) 1980 1985 1990 1991 1992 Pst bn (1992) Social insurance contributions 46.3 39.5 35.5 35.9 36.0 7555 Personal income tax 18.5 19.3 22.3 24.0 25.0 5244 Value-added tax - - 14.4 14.3 14.7 3079 Other indirect taxes 18.9 25.0 12.8 12.8 13.5 2833 Corporate income tax 4.8 5.3 9.2 8.0 6.8 1438 Other direct taxes 2.8 2.8 2.4 2.1 1.6 331 Wealth tax 1.0 1.0 1.1 1.1 1.1 223 Customs duties 6.9 6.6 1.7 1.3 0.8 165 Capital tax 0.7 0.7 0.7 0.6 0.6 122 ___ ___ ___ ___ ___ Total 100 100 100 100 100 _____ Total revenue (Pst bn) 3908 8462 17221 18767 20990
Source: Banco de España (National Accounts) In Spain, social insurance contributions are the single most important revenue source of the public sector. By 1980, proceeds from such contributions accounted for nearly half of total public revenue. The share of contributions in the tax mix fell during the first half of the 1980s and remained more or less stable as from the mid 1980s. Still, social insurance contributions made up over one-third of total tax revenue in 1992. The second most important tax source is the personal income tax, producing one-fourth of total revenue in 1992. The share of the personal income tax in GDP has significantly expanded, as a consequence of progressive rate increases and a marked growth in the number of persons reporting their income to the tax authorities. Given major changes in the structure of indirect taxation, the share of taxes on consumption (value-added tax and other indirect taxes) has remained remarkably stable over the 1980-1992 period, revenue from these sources amounting to

12
over one-fourth of total tax proceeds. The share of the corporate income tax was rather volatile, with a clear peak in 1990. 5.5 United Kingdom In 1992, UK general government receipts from taxation amounted to £210bn, some 35 percent of GDP. In terms of revenue raised, the most important UK tax is personal income tax which generated 27 percent of total tax revenue in 1992. The other major UK taxes are National insurance (the UK social security tax), value-added tax, corporation income tax and excise duties. Together, these taxes produce over 80 percent of total UK tax revenues. The income tax has three rates of 20%, 25% and 40%, respectively. Every individual is entitled to a personal allowance, which varies according to marital status and age. Taxable income greater than £23,700 is taxed at 40%. For roughly three-quarters of taxpayers, the 25% rate is their marginal rate of tax. Income tax is levied on an annual basis. The vast majority of revenue is collected by withholding the tax at source, either by employers or by banks in the case of interest income and mortgage relief (MIRAS). The UK social security tax, National insurance, is also levied on current income of employees and the self-employed. National insurance was levied at a rate of 9%, up to a ceiling of £21,840 gross income in 1993-94. Employers must also pay National insurance with a main contributions rate of 10.4% and no cap. Consequently, the marginal rate faced by most employees in the UK was 34% in 1993-94, whilst some two million top rate taxpayers faced a 40% marginal rate. Value-added tax was introduced in 1973 when the UK entered the former EC. Since 1991 it has been levied at a standard rate of 17.5%. Roughly 60 percent of consumer spending is on goods that fall into the standard rate category, the major exceptions being food, children's clothing, books and newspapers and transport. Many basic necessities are taxed at zero rates. Excise duties - on beer, cider, wine, spirits, tobacco, petrol and vehicles - raise significant sums in the UK. In 1992 their revenue amounted to 70 percent of the proceeds from VAT.
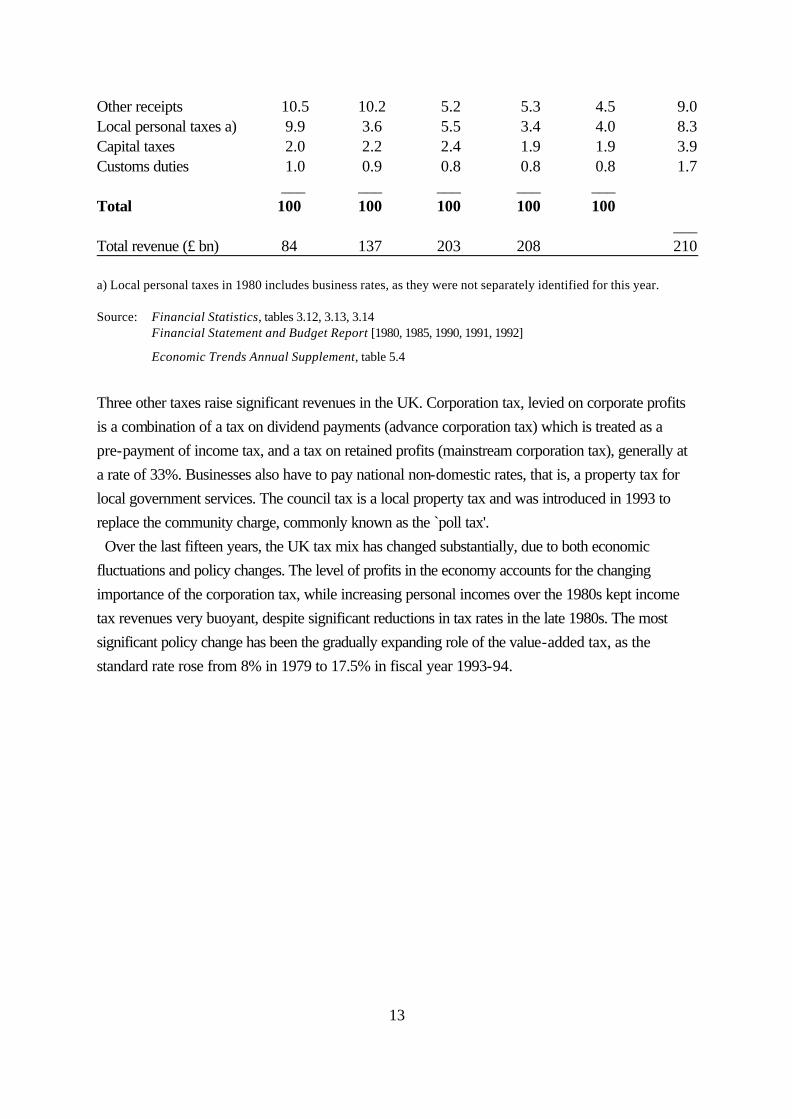
Table 5.5 Tax mix of the United Kingdom, 1980-1992 (% share) 1980 1985 1990 1991 1992 £ bn (1992) Personal income tax 28.0 24.8 26.4 27.6 27.4 57.6 Value-added tax 13.3 14.4 15.0 16.1 17.9 37.7 National insurance 16.6 17.7 16.0 16.5 16.6 35.0 Excise duties 12.8 13.1 11.9 12.2 12.7 26.6 Corporation tax 5.9 6.9 10.8 9.3 7.6 16.2 Business rates a) - 6.2 6.0 6.9 6.6 13.9
13
Other receipts 10.5 10.2 5.2 5.3 4.5 9.0 Local personal taxes a) 9.9 3.6 5.5 3.4 4.0 8.3 Capital taxes 2.0 2.2 2.4 1.9 1.9 3.9 Customs duties 1.0 0.9 0.8 0.8 0.8 1.7 ___ ___ ___ ___ ___ Total 100 100 100 100 100 ___ Total revenue (£ bn) 84 137 203 208 210 a) Local personal taxes in 1980 includes business rates, as they were not separately identified for this year. Source: Financial Statistics, tables 3.12, 3.13, 3.14 Financial Statement and Budget Report [1980, 1985, 1990, 1991, 1992]
Economic Trends Annual Supplement, table 5.4 Three other taxes raise significant revenues in the UK. Corporation tax, levied on corporate profits is a combination of a tax on dividend payments (advance corporation tax) which is treated as a pre-payment of income tax, and a tax on retained profits (mainstream corporation tax), generally at a rate of 33%. Businesses also have to pay national non-domestic rates, that is, a property tax for local government services. The council tax is a local property tax and was introduced in 1993 to replace the community charge, commonly known as the `poll tax'. Over the last fifteen years, the UK tax mix has changed substantially, due to both economic fluctuations and policy changes. The level of profits in the economy accounts for the changing importance of the corporation tax, while increasing personal incomes over the 1980s kept income tax revenues very buoyant, despite significant reductions in tax rates in the late 1980s. The most significant policy change has been the gradually expanding role of the value-added tax, as the standard rate rose from 8% in 1979 to 17.5% in fiscal year 1993-94.

14
6 Empirical analysis of tax incidence 6.1 Introduction The incidence of a tax is measured by the reduction in real income that results from the imposition of that tax. Taxes may reduce the income of individuals as producers; or they may increase the prices of consumer goods and thus reduce the purchasing power of a given money income. Both effects are measured in this report. However, no attempt is made to measure the burden that results from the reallocation of resources or the changes in consumption patterns that may be caused by taxation. We want to establish who pays the taxes (statutory incidence) and who ultimately bears the tax burden (economic incidence). Both tax distributions will differ, since individuals and firms are inclined to shift taxes they must pay onto others. Although some progress has been made in recent years in improving the methodology of tax analysis, economists still disagree about the economic incidence of several of the most important taxes in the tax system. Given the state of the art, estimates of economic incidence will usually be based on a set of incidence assumptions. Once the statutory incidence of taxes has been established, their economic incidence may be traced under a variety of such assumptions. To measure tax distributions, most economists will start to identify relevant income units, usually households or families.4 Then, many would prefer to employ a general equilibrium model to calculate the present value of tax burdens imposed upon each household over its lifetime. This burden would be compared to the households lifetime income. Recent work of Fullerton and Rogers [1993] stands as an example of the proper way to implement this methodology. However, economists who work in the policy arena usually do not follow this "lifetime approach" [Barthold, 1993]. Employing various methodologies, government organisations and policy advisors typically implement some form of "annual approach" [Joint Committee on Taxation, 1993]. This approach, pioneered by Pechman [1985], estimates the distribution of tax burdens in a given year. For all kind of practical reasons the annual approach will also be taken in the current research project, although some economists would maintain the theoretical superiority of the lifetime approach. Sections 6.2 and 6.3 explore the "Pechman approach" in greater detail and specify our shifting assumptions. Section 6.4 will clarify how these assumptions relate to the shifting of taxes as embodied in various, frequently used macroeconometric models. 6.2 Statutory incidence of taxes
4 Household definitions may vary from one country to another.

15
Individuals pay taxes on the income they earn and on benefits received from the public sector.5 When spending their income on goods and services, prices will usually include one or more taxes, such as value-added tax, excises and import duties. To establish how much tax an individual household actually pays in income and consumption taxes, any of two roads may be followed. First, the necessary data may directly come from government or private administrations. As an example, the amount of personal income tax paid by households can be taken from the records of the tax administration. However, in most cases researchers have no access to data from government administrations. The other route for them to follow is to ask individuals or private firms how much they pay in specific taxes. As an example, researchers may organise a survey and ask a representative sample of the population how much they paid in personal income tax or wealth tax in the previous year. In most cases, however, surveys do not contain explicit questions about amounts of taxes paid. Moreover, in many cases individuals are not aware how much they pay in consumption taxes because in Europe, typically, such taxes are not separately identified on sales slips. Still, given the necessary income and consumption data of households, the amounts paid in income and consumption taxes can be calculated, using a microanalytic model. Techniques available to microsimulate tax burdens of individual households are discussed in, among others, Orcutt et al. (1986), Atkinson and Sutherland (1988), and Brunner and Petersen (1990). Separate modules of such micromodels calculate personal income tax, and social insurance contributions due, given the income of each household in a representative sample, and taking account of its relevant socio-economic and demographic household characteristics. For example, the amount of personal income tax due will - apart from income - also depend on marital status and may vary with the number of children in the household. Also, provided the data set contains the relevant information, deductions and exempted income can be taken into account in simulating the amount of income tax due. If social insurance contributions are deductible for income tax purposes, the model first simulates contributions due. Next, this amount is deducted in simulating the income tax due. Likewise, the burden of value-added tax, excises and import duties can be estimated for each individual household in a representative sample, by applying relevant tax rates to all items consumed as known from survey data. To summarize, to establish who pays how much in taxes, researchers may: - take tax amounts as registered in government or private administrations; - use tax amounts as reported in household surveys;
5 It may be noted that Member States tend to exempt certain benefits from income taxation.
16
- allocate taxes in proportion to other items (for example, dividend income, food consumption) from administrations or surveys; - microsimulate tax amounts, using relevant information from administrations or surveys. The final column of tables 7.2 through 7.5, which detail tax incidence in each of the four Member States, indicates for each tax how its statutory incidence has been established. From the foregoing discussion, it follows that the availability of adequate data for a representative sample of households is essential to establish who pays the taxes. For each household in the sample the files must contain data on income from various sources, and also demographic and other economic information, such as the age of household members, the consumption on goods and services, home ownership, and so on. In case the necessary microdata are not or only partially available in one and the same dataset, tax researchers may combine data from two or more sources (administrations, surveys). If no tax and household data are available from administrations or representative surveys among the population, tax researchers might also take recourse to an analysis of the tax burden of a few selected representative economic agents, for example a low, medium and high income household with given socio-economic and demographic status, and calculate the statutory incidence of personal income tax and employee social insurance contributions, applying standard tax deductions only. This approach underlies calculations of the tax/benefit position of production workers that are annually published by the Organisation for Economic Co-operation and Development [OECD, 1994a]. Likewise, the burden of consumption taxes may be estimated by analyzing data - from budget surveys, and national accounts - for a few consumer households deemed to be sufficiently representative for the population as a whole. We will not report on tax burdens of such representative households, because fortunately rich datasets are available which allow to trace taxes actually paid by a representative sample from the total population. The datasets that have been used are detailed in Annex 2. 6.3 Economic incidence of taxes We have already remarked that in order to determine who bears the tax burden, it is necessary to consider how different taxes may be shifted from some individuals onto others. Studies which try to trace the economic incidence of taxes by income class must include a set of assumptions about the incidence of major taxes. Following Pechman [1985, Ch. 3] we have selected a set of rather eclectic incidence assumptions which underpin the results to be presented in chapters 7 through 9: A. Personal income tax (including wage tax) and net wealth tax are assumed not to be shifted and are thus borne by those who pay these taxes.

17
B. Value-added tax, excises, import duties, agricultural levies and the car tax are assumed to be borne by consumers of the taxed commodities in proportion to their consumption of taxed items. C. Social insurance contributions paid by workers, self-employed and benefit recipients are assumed to be borne by them. D. Social insurance contributions imposed on employers are assumed to be shifted for three-quarters to employees, and for one-quarter to consumers. E. Corporation income tax (plus dividend tax) is allocated one-third to shareholders, one-third to property income in general and one-third to consumers. F. Property tax on commercial and industrial buildings is assumed to be shifted to consumers; the property tax on houses is borne by renters and owner-occupiers respectively.6 Results presented in our report of course critically depend on this set of assumptions. However, our results do not change very much if alternative plausible sets of assumptions are adopted. This is explained because in the relevant literature the incidence of major taxes seems to be in little doubt. In his pathbreaking study, Pechman (1985, p.35) used nine separate sets of incidence assumptions. In each case, however, assumptions A, B and C were taken to apply. Pechman used alternative assumptions to trace the economic incidence of corporation income tax, property taxes and social insurance contributions levied from employers. Because these taxes have no dominant role in national tax mixes, it follows that the combined incidence of all taxes changes rather little, if alternative shifting assumptions are adopted. This conclusion is illustrated in Annex 3. Our incidence assumptions may also be compared to the shifting of taxes which is embodied in `behavioural equations' that are part of widely used macroeconometric models. There are a great many of such models, which are typically employed to analyse the short and medium term impacts of various policy measures, including effects of changes in tax rates. However, macroeconometric models are less suited to estimate the long term economic incidence of taxes, which is exactly the topic of our paper. Annex 4 surveys tax shifting in prominent macroeconometric models presently in
6 As to assumption C, it might be remarked that as employer social insurance contributions increase the gap between the producer price and the consumer price of labour, they are not different in incidence from employee social insurance contributions. Hence, it might alternatively be assumed that the burden would fully be shifted to employees, and not for only 3/4. As to assumptions D (and E) the following observation seems to be in order. Given efficient capital markets, share prices will change so as to equalise rates of return taking into account existing corporate tax regimes. For this reason, corporate taxes are not only paid by shareholders. It is most likely, that instead corporate taxes are borne in part by consumers and labour, the exact mix depending partly on the proportion of products that is exported. However, the incidence assumptions chosen here more closely reflect an `average' of Pechman's approach.

18
use in the four Member States. It appears that the specification of these models is very different. As a consequence, the effects of a shift in e.g. the VAT-rate by one point are not uniformly available for the countries included in this paper. Also, macroeconometric models do not cover the effects (and so the incidence) of changes in most smaller taxes on income, capital and consumption. For all of these reasons, macromodels are of limited help if one tries to assess the value of the shifting assumptions adopted in our paper. For good measure, section 6.4 discusses tax incidence in macroeconometric models in greater detail. 6.4 Tax incidence in macroeconometric models 6.4.1. Macroeconometric models Economic forecasters and policy analysts often rely on economic models. Such models describe the economy, generally at the national level. Using historical data, models give a consistent and comprehensive account of relevant interactions and interdependencies within the economy. Variables that are explained within the model are called `endogenous', whereas exogenous variables are given, i.e. they are input for the model and affect its outcomes, but they are not explained within the model. Nowadays, macroeconometric models often contain hundreds of equations. Some are so-called `behavioural equations', which try to capture behaviour of economic agents, like consumers, firms, etcetera. Such behavioural equations are pivotal to understand the nature of macroeconometric models, as will shortly be explained. Standard policy analysis with macroeconometric models includes "what-if" exercises. Here, analysts address the question what would be the economic consequences if present policies were changed. The answer is obtained by comparing the results of two simulation runs with the model. The first run produces a so-called baseline simulation, which could refer to a future forecast period, whereas in the second simulation the model is re-run over the same period, but now with policy variables deemed relevant given their new values. The baseline scenario is typically a forecast with a `no-change' or `neutral' policy stance. The difference between the two simulation runs for the endogenous variables provides an assessment of potential effects of the policy under scrutiny. Standard what-if exercises remain limited to studying the effects of policy instruments that are included in the original specification of the model. The effects of raising value-added tax rates might for example be simulated with a macroeconometric model. This implies that certain other policy proposals, like the introduction of a new tax, for instance a tax on emissions of carbon dioxide, cannot be properly evaluated with these models. The same applies for the introduction of new institutional arrangements. General equilibrium models (subsection 6.4.2) are better suited for this type of analysis.

19
Macroeconometric models typically analyze the short and medium term impacts of various policy measures, including effects of changes in tax rates. Their value to determine the economic incidence of taxes in the long run is thus subject to limitations, for example because many of these models are not stable over long simulation periods. Still, it may be useful to compare our incidence assumptions (as set out in section 7.1) with those included in macroeconometric models. After reviewing some trends in modelbuilding we will - for reasons to be explained - focus upon the modelling of wages. 6.4.2 Trends in model building Different models are built for different purposes, and both models and the problems they address evolve over time. New statistical evidence will sometimes change perceptions of existing relationships, and social and political changes may alter the focus of economic attention [Wallis, 1993]. Looking at the period 1960-1985, Bodkin [1988] found various trends. Initially, the trend was an evolution towards large scale modelling. Macroeconometric models grew bigger and bigger, which made their outcomes sometimes hard to interpret. A second trend to be discerned was the increasing theoretical sophistication of model building. Developments in macroeconomic theory tend to be incorporated into the models, albeit generally only after some time has passed. A final trend has been the increased orientation of model builders towards policy issues. However, it became increasingly clear that not all policy questions could be properly addressed by existing models. During the 1980s, at many academic research centers interest in macroeconometric models waned. Nevertheless, such models are still widely used for policy analysis, both by national governments and by international organisations like the OECD. Wallis [1993] has pointed out that the supply side became the catch-phrase of the 1980s. The previous macroeconomic paradigm over-emphasized effective demand, and had proved inadequate to deal with the supply-side shocks of the 1970s. As a consequence, macroeconometric modellers now showed greater interest in the supply side of the economy. A recent, very important development is the construction of so-called general equilibrium models. The aim of applied general equilibrium modelling is to transform abstract classical equilibrium models into realistic representations of actual economies and to use these models for policy analysis [Kehoe et al., 1988; Gelauff and Graafland, 1994]. An important advantage of this type of models is their solid theoretical foundation. The behaviour of economic agents in the model is based upon optimisation principles. Applied general equilibrium models are well suited to analyze the economic and welfare consequences of (changes in) the tax system. Such models are generally calibrated, which means that relevant elasticities are taken from the economic literature and that

20
other parameters are computed in such a way as to match the base year solution of the model with a benchmark dataset. Annex 4 reviews econometric models of the Dutch7 and the UK economy8; also the model of the Deutsche Bundesbank and the Spanish MOISEES model are presented here. 6.4.3 The wage equation Indirect taxes raise the price level. Wage tax and social insurance contributions eat into net wages. In response, workers will try to shift indirect and direct taxes by claiming higher nominal wages. This subsection discusses how the process of wage formation and tax shifting is represented in macroeconometric models. Usually, macromodels have no comparable equations describing the behaviour of economic agents which supply capital. For this reason, our discussion will be limited to the wage equation. Results are summarised here, so as to allow a comparison with our shifting assumptions (section 6.3). The most commonly adopted approach in current models of the German, Dutch, Spanish and UK economies assumes that firms and unions bargain over wages, and that employment is determined by firms. Wage negotiations typically focus on the level of nominal wages. This does not mean that employers and employees are insensitive to inflation, but rather that different wage concepts are relevant to their objectives [Wallis, 1993]. What matters for employers are real wage costs, i.e. nominal wages plus employers' taxes deflated by producer prices, whereas employees focus on their real consumption wage, i.e. nominal wages less direct taxes deflated by consumer prices. The wedge is defined as the gap between real labour costs of the firm, on the one hand, and real disposable income of workers on the other [Layard et al., 1991]. The building blocks of the wedge thus consists of the tax rates applying to both employers and employees and the price of consumer goods relative to value added. The way the wedge variable is included in macroeconometric models has different incidence implications. From our analysis of tax shifting behaviour as embodied in wage equations in large macroeconometric models the following conclusion can be drawn. There is clearly no consensus as 7 The Netherlands have a long tradition in econometric modelbuilding (see Barten [1988] and Bodkin et al. [1991] for reviews). Starting with the work of Jan Tinbergen, the Central Planning Bureau (CPB) has developed and used various macroeconometric models of the Dutch economy. The model presently in use (FKSEC) is quite eclectic in the sense that the supply side of the economy consists of a vintage model, whereas the demand side has certain Keynesian features. FKSEC is mainly used for short-term analyses. More recently, CPB has started work on general equilibrium models. The MIMIC model is such a model which is presently in use, especially to analyze the long-term effects of welfare state reform.
8 Reviews of UK econometric models are provided by Bodkin et al. [1991], Fisher et al. [1990] and Church et al. [1991, 1993].

21
to the degree labour is able - in the short to medium run - to shift forward higher wage taxes and social insurance contributions. Most models conclude that there is at least some forward shifting of such taxes, but estimates vary widely. Still, most models seem to agree that tax shifting is far from complete. However, some authors present evidence that elements of the wedge have a large and permanent effect on wages. For instance, Knoester and Van der Windt [1987] find that employee taxes have a permanent impact on wages in ten OECD countries. However, the coefficients found by these authors are extremely high and are out of line with most other available evidence. Cross-section evidence reported in OECD [1990, Annex 6A] indicates that short-run wedge effects are very important. On average, for sixteen OECD countries, a 1 percent rise in the wedge induces an immediate rise in labour costs of 0.5 percent. Even after five years, nearly half this effect remains. However, according to the same OECD study, in the long run increases of the wedge are entirely borne by labour, in line with our assumptions here (section 6.3).

22
7 Incidence of national tax systems 7.1 Introduction This section estimates and discusses distributions of statutory and economic tax burdens in four selected Member States of the European Union. Tax incidence will be estimated for some year in the early 1990s, using recent microdata for representative samples of households. It should be stressed that only this micro approach allows distributional analyses as presented here. Given the limitations inherent to available microdata, it was not possible to calculate the burden of all taxes. Taxes covered in this report range from between 62 percent of total taxes for Germany to 98 percent of all taxes for the Netherlands (table 7.1). Also, the base year is not exactly the same for countries included in our analysis. Given the small spread in the base year (1989-1993)9 and the generally observed relative stability of tax structures and income distributions over limited time periods, results presented here still allow comparison of the distribution of tax burdens in the four EU Member States under consideration. The surveys that have been used are detailed in Annex 2.
Table 7.1 Taxes covered and datasets used taxes covered (%) dataset year Germany 62 GSOEP 1990 EVS 1983 Netherlands 98 Panel Survey of Income 1991 Consumer Survey 1992 Housing Demand Survey 1989 Spain 93 Family Expenditure Survey 1990 United Kingdom 94 Family Expenditure Survey 1993
To calculate tax distributions, a four-step procedure will be followed. First, for each country one or more representative samples with household data have been selected. In their characteristics the households in these samples closely mirror the population at large. Second, the taxes each household in the sample pays have to be determined. It will be recalled from section 6.2 that the amount of taxes households pay may be traced in either of three ways. Sometimes information about taxes paid is directly available in the dataset (from an administration or survey). In other cases taxes paid have been simulated, for example by combining consumption data and statutory VAT-rates.
9 The German EVS (1983) is the exception here.

23
Also, given income components and household composition, levies on income may be simulated with a microanalytic model. The final column of tables 7.2 through 7.5, which detail tax incidence in each of the four Member States, contains a code, which indicates for each tax how its statutory incidence has been established: ADM - tax amount as registered in government or private administrations; or - taxes allocated in proportion to other items from administrations (for example, dividend
income); SUR - tax amount as reported in household surveys; or - taxes allocated in proportion to other items from surveys (for example, food
consumption); SIM - tax amount has been simulated, using relevant information from administrations or
surveys. Once taxes paid by each household have been determined, as a third step, all households are ranked in ten 10-percent groups - commonly called `deciles' - by increasing income. The first decile contains the ten percent of households with lowest incomes, the tenth decile comprises the ten percent of households with highest incomes. In the fourth step, the share of (households in) each decile in the total revenue from each separate tax is established. The combined economic incidence of all taxes is then found by weighing distributions of individual taxes over deciles by their share in total revenue collected. Apart from potential weaknesses embodied in our shifting assumptions, a further caveat applies. For technical reasons the crucial concepts of `household' and `income' may differ between countries. Such differences and their potential consequences are more fully examined in Annex 2A. 7.2 Germany Table 7.2 shows the economic incidence of 62 percent of all taxes levied in Germany (distribution of tax shares by decile). The results obtained are based on survey data for 1983 (value-added tax)10 and for 1990 (all other taxes). Given available data, the incidence of only three major taxes could be traced: the personal income tax, value-added tax and employee social insurance contributions. Given the three taxes included in the analysis and the composition of the German tax mix vis-à-vis the tax mix of the other three Member States, there is no reason to expect a priori a fundamentally different pattern of tax incidence between all countries considered in this report. Moreover, customs duties
10 Although consumption data refer to 1983, their use seems to be admissible, given the stability of consumption patterns and the structure of VAT-rates.

24
and agricultural levies have been apportioned to households proportional to total consumption and food consumption, respectively. From table 7.2 it can be concluded that in the early 1990s the top decile paid slightly over one-quarter of all taxes covered. The next 40 percent of households generated 50 percent of total tax revenue, while the bottom half of the distribution contributed only one-quarter of all taxes. Given the tax base and rate structure of levies not included in the analysis, one might assume that the distribution of all taxes is less skewed to deciles with higher ranking numbers.
Table 7.2 Distribution of tax shares, Germany (% share) Decile 1 2 3 4 5 6 7 8 9 10 Total Sharea) Code Personal income tax 1 2 3 5 6 7 9 12 17 39 100 23.5 SIM Employee social insurance contributions 1 3 5 6 8 9 11 13 16 28 100 21.2 SIM Value-added tax 4 5 5 9 8 10 12 13 14 19 100 16.5 SIM Customs duties 4 5 5 9 8 10 12 13 14 19 100 0.7 SURb) Agricultural levies 5 6 6 10 9 11 12 13 13 15 100 0.2 SURc) ____ Total all taxes 2 3 5 7 7 9 11 13 16 26 100 62.1 Memorandum items Gross personal income 2 4 6 8 9 10 11 13 15 21 100 SUR Net personal income 2 4 6 8 9 10 11 13 16 22 100 SUR Consumption 4 5 5 9 8 10 12 13 14 19 100 SUR
a) Share (%) in tax mix (1992). b) Tax share corresponds with share of each decile in aggregate household consumption. c) Tax share corresponds with share of each decile in aggregate food consumption.
Distributions of taxes paid by households in different deciles can present a misleading picture of the progressivity of the tax system, because such a presentation takes no account of the different income level in each decile. Therefore, Chart 7.1 also shows taxes paid by households in each decile as a proportion of gross personal income in that decile. This average tax burden is basically the economic incidence of all taxes included in the analysis, given our shifting assumptions.11 The distribution of the tax burden is remarkably flat, except for households ranked in the first decile. Clearly, regressive social insurance contributions largely outweigh the progressive personal income tax rate.
11 It should be noted that only personal income tax and employee social insurance contributions are included in chart 7.1.

25
* Only personal income tax and employee social insurance contributions are included in this chart.

26
7.3 Netherlands Table 7.3 shows the economic incidence of 98 percent of all taxes levied in the Netherlands (distribution of tax shares by decile). These results are based on data from the tax administration and on survey data for 1989, 1991 and 1992, respectively. In the early 1990s the top decile paid one-quarter of all taxes covered, the next 30 percent of households contributed 40 percent of total tax revenue, while the bottom half of the distribution generated 24 percent of all taxes. The personal income tax and net wealth tax are clearly the most progressive levies. On the other hand, the local waste management tax - a user fee - is distributed over deciles nearly proportionally. In the preceding section it has already been pointed out that distributions of taxes paid by households in different deciles can present a misleading picture of the progressivity of the tax system, because such a presentation takes no account of the different income level in each decile. Therefore, Chart 7.2 shows total tax paid by households in each decile as a proportion of aggregate gross household income in that decile. On average, households in the Netherlands hand over 60 percent of their gross income to the taxman.12 The top two deciles pay only a few percentage points more. The bottom two deciles clearly experience somewhat lighter tax burdens, which makes the total distribution of tax burdens slightly progressive. Still, even the poorest households on average contribute nearly half of their gross income to the fisc.
12 Taxes in the Netherlands amount to 47 percent of GDP, and absorb 60 percent of aggregate gross income of private households. Various factors may explain the difference. Mainly, value added tax (over 6 percent of GDP), retained corporate profits (around 5 percent of GDP) and investment income of pension funds (some 6 percent of GDP) are included in GDP, but none of these components is received as current income by private households.

27
Table 7.3 Distribution of tax shares, the Netherlands (% share) Decile 1 2 3 4 5 6 7 8 9 10 Total Sharea) Code Personal income tax 1 2 3 4 5 7 9 12 17 39 100 24.3 ADM Value-added tax 4 5 6 8 9 10 12 13 15 19 100 15.5 SIM Corporate income taxb) 3 2 4 5 6 7 10 12 16 36 100 7.2 ADM/SUR Excise duties 2 4 6 9 10 11 13 13 15 17 100 4.8 SUR Motor vehicle tax 2 3 6 10 11 11 11 13 15 18 100 1.6 SUR Special tax on cars 0 0 4 3 3 6 21 13 23 26 100 1.3 SIM Customs duties c) 5 5 7 8 9 10 12 13 14 18 100 1.3 SUR Green energy taxes 4 6 7 9 10 11 12 12 14 16 100 0.5 SIM Net wealth tax 12d) 1 1 1 2 5 6 10 14 48 100 0.8 ADM Agricultural leviese) 5 6 7 9 9 10 12 13 13 16 100 0.3 SUR Local property taxes 5 5 6 7 10 10 11 12 15 21 100 1.3 SUR/SIM Local waste man. tax 9 9 9 10 10 10 10 11 11 11 100 0.5 SUR Local sewer tax 6 8 9 9 12 9 12 12 11 12 100 0.3 SUR General social insurance contributions 2 3 5 7 9 11 13 14 16 19 100 28.8 SIM Employee social insurance contributions - employees 2 3 6 8 10 11 13 14 16 17 100 2.3 SIM - employers 2 4 6 8 10 11 13 14 15 16 100 7.3 SIM ____ Total all taxes 2 3 5 6 8 9 11 13 16 25 100 98.1 Memorandum items Gross household income 3 4 5 7 8 10 11 13 15 24 100 ADM Net household income 3 5 6 7 8 10 11 13 15 22 100 ADM/SUR Labour income 1 1 3 5 8 10 13 15 19 25 100 ADM Property income 2 2 3 5 7 9 10 13 17 33 100 ADM Dividend income 2 0 1 1 2 4 7 10 16 57 100 ADM Consumption 5 5 7 8 9 10 12 13 14 18 100 SUR a) Share (%) in tax mix (1992). b) Includes dividend withholding tax. c) Tax share corresponds with share of each decile in aggregate household consumption. d) The specific distribution of the Dutch wealth tax is a direct consequence of current tax planning practice. Several thousands of the most wealthy taxpayers have no (taxable) income and are therefore ranked in the first decile. Taxpayers with zero taxable income pay no wealth tax. Households concerned cover their costs of living through loans and tax-exempt capital gains. e) Tax share corresponds with share of each decile in aggregate food consumption.

28
7.4 Spain Table 7.4 shows the economic incidence of 93 percent of all taxes levied in Spain (distribution of tax shares by decile). These results are based on survey data for 1990. In that year 26 percent of all taxes covered were paid by the top decile, and 50 percent by the next 40 percent of households, while the bottom half of the distribution contributed 23 percent of total tax revenue. Similar to the case of the Netherlands, the personal income tax and net wealth tax are clearly the most progressive levies.13 The corporate income tax and consumption taxes are much more evenly spread over deciles. Chart 7.3 illustrates the average burden of all taxes included in table 7.4. On average, households in Spain hand over 53 percent of their gross income to the taxman. The top two deciles pay only two points more. The bottom three deciles experience somewhat lighter tax burdens, which makes the over-all distribution of tax burdens slightly progressive.
Table 7.4 Distribution of tax shares, Spain (% share) 13 It might be noted that in the case of Spain the wealth tax has been fully allocated to the tenth decile, not on the basis of survey data but based on statistical data as published by the Administration.

29
Decile 1 2 3 4 5 6 7 8 9 10 Total Sharea) Code Personal income tax 0 0 2 3 5 7 10 14 19 41 100 25.0 SIM Net wealth tax 0 0 0 0 0 0 0 0 0 100 100 1.1 SIM Corporate tax 4 5 6 7 9 8 10 10 14 27 100 6.8 SUR Other direct taxes 5 6 7 8 9 10 11 12 14 19 100 1.6 SIM Social insurance taxes - employer 2 3 5 7 8 11 12 15 17 21 100 25.6 SIM - employee 1 2 4 6 8 9 12 15 19 25 100 10.4 SIM Value-added tax 4 5 7 8 9 10 11 13 14 18 100 14.7 SIM Excise duties 2 4 6 8 9 11 12 14 15 18 100 6.8 SUR Customs dutiesb) 4 5 7 8 9 10 11 13 14 18 100 0.8 SUR Agricultural leviesc) 5 7 8 10 10 11 11 12 12 14 100 0.1 SUR ____ Total all taxes 2 3 4 6 8 9 11 14 16 26 100 92.7 Memorandum items Gross household inc. 2 4 5 6 8 9 11 13 16 27 100 SUR Net household income 3 4 6 7 8 9 11 13 15 24 100 SUR Labour income 0 1 4 6 8 10 12 16 17 26 100 SUR Property income 3 5 5 6 8 8 10 10 15 30 100 SUR Dividend incomed) 1 3 3 4 7 5 8 7 16 45 100 SUR Consumption 4 5 7 8 9 10 11 12 14 19 100 SUR a) Share (%) in tax mix (1992). b) Tax share corresponds with share of each decile in aggregate household consumption. c) Tax share corresponds with share of each decile in aggregate food consumption. d) Includes interest.

30
7.5 United Kingdom Table 7.5 shows the distribution of tax shares of nearly 94 percent of all taxes paid in the UK based on survey data for 1993.14 The table shows that the top decile pays over 30 percent of the taxes covered, the next 40 percent of households generate slightly over 50 percent of total tax revenues, while the bottom half of the income distribution contribute only 17 percent. The UK Income Tax, being the most progressive tax, is skewed very strongly to richer households, nearly 50 percent is paid by the top decile alone. The tax share paid by the top deciles is also relatively high for Social Security taxes (National Insurance) and VAT. National Insurance paid by employers is more progressive because there is no ceiling on payments. In comparison, other UK taxes and especially excise duties have burdens spread more evenly amongst income deciles. In particular, beer and cigarette revenues have burdens that are spread evenly across the income distribution.
14 The taxes not modelled are capital taxes such as capital gains tax and inheritance tax. The incidence assumptions underlying table 7.5 are as in A-F (section 6.3), except for corporation tax, which is allocated 50 percent to consumers and 50 percent to dividend income, because of data problems.

31
Table 7.5 Distribution of tax shares, United Kingdom, 1993-1994 (% share) Decile 1 2 3 4 5 6 7 8 9 10 Total Sharea) Code Personal income tax 0 0 1 2 4 6 9 13 19 46 100 27.4 SIM Social insurance taxes (NI) - employee 0 0 1 3 5 9 13 16 23 29 100 5.1 SIM - employer 1 1 2 3 6 8 12 15 21 32 100 10.5 SIM Value-added tax 3 3 5 6 8 11 11 14 16 23 100 17.9 SIM Excise duties 3 4 6 8 9 11 12 13 16 18 100 12.7 SUR Council tax + rebate 3 4 6 8 10 11 12 14 15 17 100 4.0 SIM Corporation tax 2 3 5 5 6 8 9 12 13 37 100 7.6 SUR Business rates 3 4 6 7 8 11 11 13 16 21 100 6.6 SIM Customs dutiesb) 3 4 6 7 8 11 11 13 16 21 100 0.8 SUR Agricultural leviesc) 4 5 7 8 9 10 11 13 15 18 100 0.1 SUR ____ Total all taxes 1 2 3 5 6 9 11 14 18 31 100 93.7 Memorandum items Gross household inc. 2 3 4 5 7 9 11 13 17 29 100 SUR Net household inc.d) 3 4 5 6 7 9 10 13 16 27 100 SUR/SIM Labour income 0 0 1 3 5 8 12 15 21 35 100 SUR Property income 1 2 3 2 2 3 8 10 14 55 100 SUR Dividend income 1 1 3 4 4 6 6 10 11 54 100 SUR Consumption 3 4 6 7 8 11 11 13 16 21 100 SUR a) Share (%) in tax mix (1992). b) Tax share corresponds with share of each decile in aggregate household consumption. c) Tax share corresponds with share of each decile in aggregate food consumption.
d) Income after deduction of all taxes that can be apportioned to individual households.
Chart 7.4 shows total taxes paid by households included in each decile as a proportion of aggregate gross income in that decile. On average, households pay 43 percent of their gross income to the Government in the included taxes. The distribution of payments is strongly progressive. The top decile pays several points more (48 percent) while households in lower deciles experience much lower average tax burdens. The sharply progressive nature of the UK tax system arises from the Income Tax system that exempts significant proportions of many households incomes and yet contributes more than a quarter of total government revenue. This very sharp increase in tax burdens displayed in Chart 7.4 would be slightly lessened if all taxes were included because the distribution of tax shares of the excluded taxes was found to be less progressive.

32
Note: this chart includes business taxes, customs duties and agricultural levies for which average burdens could
not be simulated. These taxes account for 15% of tax revenues. Average burdens were therefore calculated using
the distribution of the tax share, the distribution of gross income and the total tax revenue collected. Because the
definition of gross income used in the graph gives lower outcomes than administrative figures (for example
because employer social security contributions are excluded), the impact of these taxes on the overall burden is
overstated.
7.6 Comparison of tax distributions For three national taxes we can compare the distribution of tax shares over deciles in all four EU Member States: the personal income tax (table 7.6), employee social insurance contributions (table 7.7) and the value-added tax (table 7.8). Distributions of two traditional own resources of the European Union over deciles in the four Member States will be compared in section 8, tables 8.2 and 8.3. Table 7.6 compares distributions of the personal income tax. Given differences in the distribution of personal incomes, the tax base and rate structures, the similarity of income tax distributions over deciles in Germany and the Netherlands is striking indeed. The share in aggregate income tax revenue of Spanish households in deciles 8-10 is two points higher than it is in the two northern Member States. The distribution found for the UK income tax is still substantially more progressive.

33
Two reasons may be driving the apparent finding of a more progressive income tax structure, either a more unequal distribution of the income tax base itself, or the more progressive structure of UK income tax, due to the generous allowances against tax. As a result of these allowances, very few households in the bottom deciles have any income tax liability.
Table 7.6 Distribution of personal income tax (% share) Decile 1 2 3 4 5 6 7 8 9 10 Total Germany 1 2 3 5 6 7 9 12 17 39 100 The Netherland 1 2 3 4 5 7 9 12 17 39 100 Spain 0 0 2 3 5 7 10 14 19 41 100 United Kingdom 0 0 1 2 4 6 9 13 19 46 100
Table 7.7 compares national distributions of employee social insurance contributions. For the UK, which finances its social security rather different from the other three Member States, we have selected National insurance contributions. In the Netherlands households in deciles 1-5 bear 30 percent of this tax, as against 23 percent in Germany and 21 percent in Spain. On the other hand, in three Member States the share of the top decile exceeds 25 percent, to be compared with a share of only 17 percent in the Netherlands. As a result, the distribution of employee social insurance contributions is least progressive in the Netherlands.
Table 7.7 Distribution of employee social insurance contributions (% share) Decile 1 2 3 4 5 6 7 8 9 10 Total Germany 1 3 5 6 8 9 11 13 16 28 100 The Netherlands 2 3 6 8 10 11 13 14 16 17a) 100 Spain 1 2 4 6 8 9 12 15 19 25 100 United Kingdomb) 0 0 1 3 5 9 13 16 23 29 100 a) Because several caps apply, the share of the top decile in the Netherlands is smaller than in the other three Member States.
b) National insurance.

34
Table 7.8 compares distributions of the value-added tax. The tax shares of deciles are amazingly similar in Germany, the Netherlands and Spain. The distribution of the VAT-burden is clearly most progressive in the UK, probably as a consequence of the rate structure in that Member State (a number of basic necessities are zero-taxed).
Table 7.8 Distribution of value-added tax (% share) Decile 1 2 3 4 5 6 7 8 9 10 Total Germany 4 5 5 9 8 10 12 13 14 19 100 The Netherlands 4 5 6 8 9 10 12 13 15 19 100 Spain 4 5 7 8 9 10 11 13 14 18 100 United Kingdom 3 3 5 6 8 11 11 14 16 23 100

35
8 Incidence of present own EU resources 8.1 Introduction Outlays of the European Union are financed from revenue generated by its four `own resources' (section 1). Table 8.1 summarizes the revenue structure of the EU. Over the years, the importance of agricultural and sugar levies has dwindled to some 3-4 percent of total revenue. In quantitative terms, by 1992 customs duties were still the second most important revenue item, bringing in some 20 percent of total EU revenues. In the early 1990s the 1.4 percent rate on each Member States' value-added tax base constituted by far the most important revenue source, generating some 55-58 percent of total revenue. In years to come, the share of the VAT-resource will fall. The share of the so-called `fourth own resource' - a GNP-based contribution of Member States which in 1991-1992 produced some 13-14 percent of total revenue - will in the future rapidly increase. As a consequence of the Edinburgh agreement, the share of this resource is estimated to rise to nearly 50 percent in 1999. Following the approach outlined in section 6.2 and applying the incidence assumptions which have also been used to analyze the incidence of national tax systems (section 6.3), this section estimates the (economic) incidence of each own resource of the European Union. As before, the analysis is restricted to four Member States: Germany, the Netherlands, Spain and the United Kingdom. Together, these countries account for over 50 percent of GDP of the Union.
Table 8.1 Tax revenues of the European Community (% share)a) 1991 1992 Agricultural and sugar levies 4 3 Customs duties 20 19 Value-added tax base 54 58 Fourth resource (GNP-base) 13 14
a) Miscellaneous revenues produced 8 percent (1991) and 6 percent (1992) of total revenue; see table 1.1.
8.2 Agricultural and sugar levies Regarding the incidence of agricultural and sugar levies no reliable information is available at the EU level. It is possible to allocate these taxes in proportion to total consumption, or in line with food consumption, using data from national consumer surveys. It follows that to trace the incidence of this in itself minor EU revenue source, one additional incidence assumption must be introduced. It is assumed here that households pay agricultural and sugar levies in proportion to their consumption of food. Arguably, this is a rather strong assumption, but the approach adopted here seems to be

36
defensible, especially given the relative limited importance of this traditional own resource of the European Union. Regarding the amount of these levies to be apportioned to Member States, a further complication arises because both agricultural levies and customs duties (the two traditional own resources) are collected by Member States and transferred to the European Union. Duties are levied at the point where taxed goods enter the EU, such as Rotterdam or Antwerp. Since a substantial part of these imports are re-exported to other Member States, it would not be correct to allocate all levies and customs duties collected by, for example, Dutch tax authorities to households in the Netherlands. In fact, correcting for the `Rotterdam effect' is not possible, since there is no way "to break down duties levied at the Community borders by final inter-Community destination of imports".15 Likewise, the group of economic experts holds that "it is virtually impossible to apportion them [i.e. traditional resources] by country in a meaningful way".16 For all kind of practical reasons, therefore, we argue that aggregate revenues from the two traditional own resources might be apportioned to Member States by their share in aggregate EU consumption (on food). Tables 8.2 and 8.3 demonstrate the incidence of these resources in four separate Member States, by decile.
Table 8.2 Incidence of agricultural/sugar levies (% share) Decile 1 2 3 4 5 6 7 8 9 10 Total Germany 5 6 6 10 9 11 12 13 13 15 100 The Netherlands 5 6 7 9 9 10 12 13 13 16 100 Spain 5 7 8 10 10 11 11 12 12 14 100 United Kingdom 4 5 7 8 9 10 11 13 15 18 100
8.3 Customs duties To trace the incidence of customs duties, it is assumed that households pay this tax in proportion to their consumption. Table 8.3 shows the share of households in aggregate consumption, per decile. Regarding the amount of these levies to be apportioned to Member States the reader is referred to section 8.2.
15 European Communities Court of Auditors, Opinion No. 8/93 on an Assessment of the system of own resources introduced in 1988 in the light of the conclusions of the Edinburgh European Council Meeting [1993, p.21].
16 Stable Money -- Sound Finances [1993, p.82].

37
Table 8.3 Incidence of customs duties (% share) Decile 1 2 3 4 5 6 7 8 9 10 Total Germany 4 5 5 9 8 10 12 13 14 19 100 The Netherlands 5 5 7 8 9 10 12 13 14 18 100 Spain 4 5 7 8 9 10 11 13 14 18 100 United Kingdom 3 4 6 7 8 11 11 13 16 21 100
8.4 VAT The link between the VAT-resource and taxpaying consumers of the European Union is not a direct one. The VAT Member States pay into European coffers is not an identifiable part of the VAT paid on each purchase. This makes the VAT-resource tantamount to a national contribution calculated following an accounting definition of the VAT-base. Although for each Member State the incidence of national VAT and the EU VAT-resource will correspond, the VAT-base relative to national GDP may show substantial variation. Table 8.4 shows the incidence of the value added tax in four Member States. Table 8.4 Incidence of the value added tax (% share) Decile 1 2 3 4 5 6 7 8 9 10 Total Germany 4 5 5 9 8 10 12 13 14 19 100 The Netherlands 4 5 6 8 9 10 12 13 15 19 100 Spain 4 5 7 8 9 10 11 13 14 18 100 United Kingdom 3 3 5 6 8 11 11 14 16 23 100
8.5 GNP-based own resource The incidence of the GNP-based own resource of the European Union is in fact determined by the incidence of national tax systems of Member States. Table 8.5 shows the (weighted) incidence of all taxes levied in the four Member States. Results presented here refer to the totals on the bottom lines of tables 7.2 (Germany), 7.3 (the Netherlands), 7.4 (Spain) and 7.5 (United Kingdom). For a correct interpretation of the information contained in table 8.5 it is very important to note that, due to missing data, the incidence of several taxes could not be traced. Indeed, in terms of

38
revenue the incidence of only 62 percent of all German taxes has been analyzed. For the Netherlands, Spain and the UK the analysis covered 98 percent, 93 percent and 94 percent of aggregate tax revenue, respectively. Given wide differences in national tax mixes, taking into account the spread in taxes covered (62-98 percent of aggregate tax revenue), and considering the substantial variation in GDP per capita (table 4.1) and in the inequality of the distribution of household incomes, the pattern of tax incidence in the four countries included in our report is strikingly similar. The fifty percent poorest households carry 23-24 percent of the aggregate tax burden in Germany, the Netherlands and Spain, whereas the ten percent with the highest incomes contribute 25-26 percent. Only in the United Kingdom, tax burdens are more skewed towards rich households, which may perhaps be explained by the greater inequality of the personal income distribution in this country and zero-rated items for VAT-purposes.
Table 8.5 Incidence of GNP-based own resource (% share) Decile 1 2 3 4 5 6 7 8 9 10 Total Germany 2 3 5 7 7 9 11 13 16 26 100 The Netherlands 2 3 5 6 8 9 11 13 16 25 100 Spain 2 3 4 6 8 9 11 14 16 26 100 United Kingdom 1 2 3 4 7 9 11 14 18 32 100

39
9. Incidence of prospective own EU resources 9.1 Introduction The present four own resources of the European Union will be left unaltered for the period to 1999. A number of Member States and the European Parliament have in the past pressed for the introduction of a fifth resource, in the form of a Community or Union tax. The European Council has explicitly requested the Commission for a report concerning possible candidates for a fifth own resource.17 Section 9.2 reviews several proposals for new own resources of the European Community. The final section offers estimates of the incidence of one optional own resource. 9.2 Policy options In the past the European Parliament has repeatedly called for the introduction of a Community tax as a means of ensuring the Community's financial independence. In a recent Working Document published under the aegis of the Committee on Budgets of the European Parliament, its rapporteur Mr. Horst Langes concludes that of all different tax categories the value-added tax forms the most suitable basis so far for a Union tax, as this revenue source is the one most effectively capable of meeting the demands of being widespread, simple, transparent and linking taxpayers and the destination of the tax.18 This Union tax could, for example, take the form of a surcharge of 2 percentage points on national VAT-rates of Member States, or alternatively 1.5 points on basic products and 3 points on other goods and services. At the request of the European Commission's Directorates-General for Economic and Financial Affairs and for Budgets, a group of independent economists has examined the role of Community public finance in the perspective of economic and monetary union. In its report Stable Money--Sound Finances the expert group discusses a whole range of topics, including the question of what tax categories might be suited to serve as future revenue sources for the European Union. In the end, the experts advance three tax options [pp. 88-92]: 1. The introduction of a corporate tax on the net cash flow of firms. However, the experts are quick to note that as yet the introduction of a cash flow corporate tax is not on the political cards [p. 89]. Moreover, the datasets used to trace the incidence of existing national tax systems (section 7)
17 See Article 10 of the Decision on new own resources by the European Council, dated 31 October 1994 (94/728/EG, Euratom), Journal officiel des Communautés européennes, No L 293/13.
18 Committee on Budgets of the European Parliament, Report on a new system of own resources for the European Union, DOC EN\RR\250\250479, 8 April, 1994.

40
and present EU resources (section 8) do not contain the data that are needed to trace the incidence of a new tax, such as a cash flow corporate tax. Therefore, we are not able to trace its distributive impacts here. 2. The seigniorage of the future European System of Central Banks (ESCB). The greater part of the revenue of a central bank stems from its monopoly position as issuer of liabilities carrying no remuneration (in the case of bank notes) or one below the market rate of interest (in the case of compulsory commercial bank deposits). These liabilities make up the monetary base. Seigniorage is the return on interest-bearing assets which form the counterpart to the monetary base [Stable Money--Sound Finances, p. 89]. For practical matters, the transfer of central bank profits to the government (the only shareholder) is probably the more relevant concept to focus on. We will assume here that new own resources are introduced within a framework of revenue neutrality. It follows that to judge the net impact of the introduction of any new resource the incidence of this new resource and the incidence of the present resource it (partly) replaces should be jointly considered. If the proposal for a seigniorage tax were adopted, Member States would miss out on ESCB and national Central Bank profits that would otherwise be remitted to national public coffers and be available to finance public outlays. The introduction of this tax would imply that the role of the GNP-based own resource would commensurately decrease. Taking the level and pattern of public outlays in Member States as given, this policy option implies that Member States would have to raise an equivalent amount in higher national taxes. Assuming that the incidence of such tax hikes conforms to the present incidence of national tax systems as a whole, the introduction of a `seigniorage tax' would in effect not change the present over all incidence of EU own resources. 3. The introduction of environmental taxes, and more specifically a tax to reduce the emission of carbon dioxide (CO2), or some kind of energy tax. Such taxes should be levied on the basis of a harmonized tax base, if they are to qualify as a revenue source to the Union. 9.3 Incidence of a new own resource: value added tax This section considers the incidence of one potential new own resource left: a European value added tax (see table 9.1). In tracing the incidence of the own VAT resource, we assume that the distribution of the Union tax would closely resemble the present distribution of national VAT. This assumption seems to be warranted, given that the VAT tax base is effectively harmonised between Member States. However, keeping in mind the existing variation of tax rates and in national consumption patterns, it must be conceded that incidence patterns presented here are only indicative. On the other hand, we have found a strikingly similar distribution of the value-added tax burden for Germany, the Netherlands and Spain (table 7.8).

41
Table 9.1 Incidence of new own resource: value added tax (% share) Decile 1 2 3 4 5 6 7 8 9 10 Total Germany 4 5 5 9 8 10 12 13 14 19 100 The Netherlands 4 5 6 8 9 10 12 13 15 19 100 Spain 4 5 7 8 9 10 11 13 14 18 100 United Kingdom 3 3 5 6 8 11 11 14 16 23 100 Source: based on table 8.5

42
ANNEX 1 ECONOMIC PROFILES OF FOUR EU MEMBER STATES19 1.A Germany During the 1980s, macro economic trends in the German economy closely mirrored the fundamentals of the European business cycle. Table A.1 provides some key information on the performance of the German economy after 1980. Initially, the German economy was weakened by recessive tendencies in important export-countries, only to recover in the mid 1980s. Great demand from abroad as well as growing domestic demand triggered an impressive expansion of private investment. As a consequence, the unemployment rate of 7.1 percent [1985] fell to 4.8 percent [1990]. In 1990-1991 the reunification of Germany gave a strong boost to the economy and compensated for the moment lower demand from abroad. Only in 1992 the worldwide recession and internal economic problems resulted in lower growth rates. The rate of inflation over the 1985-1990 period seems to be moderate. In later years the inflation rate rose to 4.1 percent because of increasing budget deficits, higher indirect taxes (1991) and wage rounds. Higher unemployment in 1992 might be explained by further rationalizations and wage rises, as well as be ascribed to structural deficits in the wake of reunification. While in 1980 the fall of the external DM-value forced up import prices - resulting in a negative balance of payments - the development after 1985 was exactly the opposite. Since 1991 the balance of payments has deteriorated again, as a consequence of increased domestic demand and higher imports after reunification. Table A.1 Economy and public sector, Germany, 1980-1992 1980 1985 1990 1991 1992 Economy GDP (volume, % change) 1.1 1.9 5.1 3.7 1.5 Inflation (% change) 5.9 2.1 2.7 3.9 4.1 Unemployment (%) 2.7 7.1 4.8 4.2 4.5 Balance of payments (% GDP) -1.7 2.4 3.5 1.2 1.1 Income inequality (Theil)a) 0.260b) 0.243 0.244 n.a. n.a Public sector (% of GDP) Total outlays 48.5 47.7 45.9 49.2 50.1 Total revenues 45.6 46.5 43.9 45.6 47.4 Net borrowing requirement -2.9 -1.2 -2.0 -3.6 -2.8 Public debt 32.842.5 43.6 45.0 44.8 a) Individuals with reported wage earnings only. b) 1978. Source: Statistical Annex of European Economy , June 1993; De Haan, Sterks and De Kam [1994]; Hauser and Becker [1993]
19 These profiles were written in mid-1994.

43
The structure of public outlays has changed, because of higher transfer payments, unemployment costs and the enormous investment requirements in the five new federal states (Länder). Consequently, the public debt in relation to GDP increased and will probably rise further in the near future. 1.B Netherlands The Dutch economy is both small and extremely open. In 1990 exports and imports of goods and services constituted 58 percent and 54 percent of GDP, respectively. After 1980 the current balance of payments has continually shown a substantial surplus. Over the past decade, GDP growth reflected the worldwide recession of the early 1980s, the ensuing recovery of the world economy, and the following economic downturn. On average, over the last ten years annual volume growth of GDP hovered around two percent, slightly below the OECD average. Table A.2 provides some additional information on the performance of the Dutch economy. Inflation was (far) below the average experience of OECD countries. All told, employment measured in constant labour years hardly increased. Nevertheless, after 1983 the economy created nearly one million additional jobs. This reflects the marked growth of part-time jobs, and shorter working hours. As a result, by 1991 unemployment stood at 7 percent which is not especially high, in comparison with the OECD Europe average of 8.6 percent (OECD, [1994], p.A23). However, a statistical artefact hides the true size of unemployment, since perhaps as much as a quarter million of `hidden' unemployed have been absorbed by public disability programmes. Moreover, higher enrolment rates in tertiary education and substantial participation in newly introduced early retirement programmes have restricted labour supply. As from the mid 1980s inequality of the personal income distribution has increased, in line with trends in several other western industrial countries (UK, USA). Nevertheless, after taxes and transfers the personal income distribution in the Netherlands is still flatter than in most OECD countries. The rise of the welfare state has been reflected in a particularly strong growth in public spending and taxation levels after the mid 1950s. In the 1960s and early 1970s the expansion of the public sector was greatly facilitated by relatively high rates of economic growth. The decline in economic performance during the later 1970s and the 1980s triggered a financial crisis of the welfare state. As from 1982, the Dutch government has tried to rein in the share of outlays and the deficit in GDP, holding the level of taxes and other public sector revenues more or less constant. After ten years of restraint, the process of public sector consolidation has clearly met with some success. Improved macroeconomic performance and prolonged efforts to effectively curb public spending, enabled policymakers to gradually reduce the level of public outlays from 67 percent of GDP in 1983 to slightly less than 59 percent of GDP in the early 1990s. Relative to GDP, the public sector borrowing requirement fell by more than half, from 9.4 percent of GDP (1982) to some four percent of GDP at the beginning of the 1990s. Table A.2 Economy and public sector, the Netherlands, 1980-1992

44
1980 1985 1990 1991 1992 Economy GDP (volume, % change) 0.9 2.6 3.9 2.2 1.7 Inflation (% change) 6.9 2.2 2.3 3.3 3.3 Unemployment (%) 2.7 7.1 4.8 4.2 4.5 Balance of payments (% GDP) -1.5 4.1 4.0 3.9 3.2 Income inequality (Theil) 0.149 0.152 0.174 n.a. n.a Public sector (% of GDP) Total outlays 56.5 58.5 55.0 55.2 55.5 Total revenues 52.5 53.7 50.1 52.7 52.2 Net borrowing requirement -4.0 -4.8 -4.9 -2.5 -3.3 Public debt 47.673.3 78.8 78.3 79.6 Source: Statistical Annex of European Economy , June 1993; De Haan, Sterks and De Kam [1994] and CBS [1993a] 1.C Spain The growth rate of the Spanish economy has closely followed international trends in the level of business activity. Table A.3 summarises the performance of the Spanish economy. After low annual growth rates in the first half of the 1980s the economy picked up. In fact, from 1985 till 1991 Spain outperformed most other EU economies, its real GDP increasing by about 4 percent per year. As from 1992 the economy suffered a period of recession, in line with the general European experience. Despite the economic boom of the second half of the 1980s, in the last decade registered unemployment never fell below 16 percent of labour supply. In the 1990s, the number of job seekers is sharply up. Over the past decade, initially high inflation levels have gradually come down. In the early 1990s, inflation hovered around 6 percent. Policymakers have targeted lower inflation rates (3-3.5 percent) for the years to come. The current account of the balance of payments has deteriorated as Spain entered fully into the EU. Most observers attribute this trend to an overvalued peseta exchange rate after Spain joined the EMS in 1989. Successive devaluations of the peseta have helped to improve the position of the balance of payments. Table A.3 Economy and public sector, Spain, 1980-1992 1980 1985 1990 1991 1992 Economy

45
GDP (volume, % change) 1.2 2.3 3.7 2.3 1.0 Inflation (% change) 16.5 8.2 6.4 6.2 6.2 Unemployment a) 11.621.6 16.1 16.3 18.0 Balance of payments (% GDP) -2.4 1.4 -3.7 -3.8 -3.9 Income inequality (Theil) 0.209 n.a. 0.180 n.a. n.a Public sector (% of GDP) Total outlays 32.5 41.6 43.4 45.0 46.3 Total revenues 29.9 34.7 39.5 40.0 41.8 Net borrowing requirement -2.6 -6.9 -3.9 -5.0 -4.5 Public debt 17.645.2 44.5 45.5 48.5 Source: Statistical Annex of European Economy , June 1993; De Haan, Sterks and De Kam [1994] A marked expansion of welfare programmes and high priority for public investment and services may explain the rapid expansion of the public sector in the Spanish economy. Total outlays shot up from 32.5 percent of GDP in 1980 to 46.3 percent in 1992. Tax revenue also strongly increased, but not enough to balance the books of the government. The deficit has widened, even during the prosperous second half of the 1980s. Due to the recent recession, the gap between public outlays and receipts reached nearly 8 percent of GDP in 1994, up from 5 percent of GDP in the early 1990s. 1.D United Kingdom Within Europe, the United Kingdom is a large and industrialised economy. Table A.4 summarises the performance of the UK economy. In the 1980s, GDP growth tended to follow world trends but in the UK growth rates fluctuated more strongly. The UK economy started and ended the 1980s in the midst of recession. At the trough of the recession in 1981, GDP was 5 percent lower than its previous peak in 1979. From 1981 to 1988, the economy enjoyed increasing growth rates which peaked at 4.5 percent in 1988. Since then GDP growth slowed. The UK was one of the first European countries to experience recession but it has also been one of the first to emerge from the recession from the middle of 1992 onward. Over the whole cycle (1979-1990), volume GDP growth averaged 2.6 percent per annum. Table A.4 shows some additional information on recent trends in the UK economy. Unemployment rates followed changes in GDP but with a significant lag. The number of unemployed rose from 4 percent of the labour force at the beginning of 1980 to over 11 percent in 1986. In the late 1980s, unemployment rates fell rapidly as the economy was growing quickly, but the unemployment rate rose above 10 percent again in the early 1990s recession. Throughout the period, the composition of the labour force has changed markedly, with increases in service sector,

46
female, part-time and self-employed workers and corresponding decreases in the more traditional, male full-time industrial jobs. By 1993, women comprised 49 percent of all employees, a rise from 41 percent in 1979. UK retail prices tended to rise faster than the OECD average over the 1980s. They fell from a peak above 20 percent in 1980 to an average around 5 percent. After 1990 retail price inflation remained below four percent. The current balance of payments deteriorated steadily during the 1980s, as imports rose very quickly and the benefit of North-sea oil diminished after 1985. The balance of payments improved somewhat in 1990 as the recession reduced the level of UK imports. The inequality of personal net incomes has risen sharply since the late 1970s. A consistent series shows that the Gini coefficient rose from 0.25 in 1980 to 0.34 in 1991. The rise in inequality was caused by many factors. The most important of these were the widening earnings distribution, increases in unemployment and self-employment, tax policies pursued and demographic shifts, particularly the rise in lone parent families. Table A.4 Economy and public sector, United Kingdom, 1980-1992 1980 1985 1990 1991 1992 Economy GDP (volume, % change) -2.2 3.7 0.5 -2.2 -0.6 Inflation (% change) a) 16.3 5.3 5.3 7.2 4.8 Unemployment (%) 5.6 11.4 7.0 9.1 10.8 Balance of payments (% GDP) 1.5 0.5 -4.2 -1.8 -2.6 Income inequality (gini) b) 0.25 0.28 0.34 0.34 n.a. Public sector (% of GDP) Total outlays 43.1 44.2 40.0 40.2 42.6 Total receipts 39.7 41.3 38.7 37.4 36.4 Net borrowing requirement -3.4 -2.9 -1.3 -2.8 -6.2 Public debt 54.359.0 39.8 40.4 45.7 a) Retail prices. b) Goodman and Webb [1994]. Source: Statistical Annex of European Economy , June 1993; De Haan, Sterks and De Kam [1994] The size of the UK public sector has expanded in real terms every year since the second world war, except in 1988. However, as a proportion of GDP, public expenditure fell throughout most of the

47
1980s reflecting rapid economic growth. Public borrowing in the 1980s also followed trends in the economic cycle, with deficits in the early 1980s giving way to surpluses between 1987 and 1990, as economic growth swelled tax revenues. Significant increases in government spending, combined with recessionary effects on public expenditure and taxation has transformed a public sector surplus of 3 percent of GDP in 1988-89 into a deficit approaching 8 percent in 1993-94. Consequently, the debt-to-GDP ratio is climbing quickly again, after a period of falling ratios in the late 1980s.

48
ANNEX 2 DATA AND MODELS USED TO TRACE TAX BURDENS 2.A Introduction This annex details country by country which data and models have been employed to simulate the distribution of tax burdens. Section 7.1 already explained the four-step procedure employed to allocate taxes to households, which are then ranked into 10 percent groups (`deciles') by increasing income. First however, a preliminary note on two key concepts - household and income - seems to be in order, since for technical reasons these concepts differ from one country to another, thereby complicating cross-country comparisons of tax distributions. The household concept To trace tax incidence in Germany, data have been taken from two surveys. In both the German Socio-Economic Panel (GSOEP) and the Income and Consumption Survey (EVS '83) households are defined as persons occupying the same dwelling space.20 To trace tax incidence in the Netherlands, data have been drawn from three separate surveys. In the Panel Survey of Income (PSI) households are tax units, i.e. individuals with full year income. A married couple is treated as one tax unit, but individuals who otherwise share a dwelling space are each considered as separate tax units and, thus, as separate households. On the other hand, in the Consumer Survey and the Housing Demand Survey (HDS) households are defined as persons occupying the same dwelling space and sharing their budget(s). Although the household definition differs between these three surveys, information from the resulting datasets may be combined, given the large overlap of the respective household concepts. In the case of Spain researchers have used data from the Family Expenditure Survey. In this survey households are defined as persons occupying the same dwelling space and sharing their budget(s). In the Family Expenditure Survey which has been used to trace tax incidence in the United Kingdom households are defined as all people living in an accommodation with shared facilities. This can comprise more than one family if, for example, elderly relatives live in their children's home, or if students live together. The income concept Households are ranked into deciles by increasing income. Economists use various concepts of income. First, gross income, which is equal to the algebraic sum of income from labour (including taxable perks), from self-employment and from capital (dividends, interest received, and property income, including imputed taxable rents from owner-occupied housing), in the form of taxable net capital gains (realized capital gains from assets or bequests), and proceeds under private pension plans and public sector transfer payments received.
20 The Sfb 3/EVS '83 computations were done together with Prof. Dr. Hauser and Dr. Faik, University of Frankfurt. Their computations are gratefully acknowledged here.

49
Second, taxable income, which is equal to gross income less deductions for wage earners and equivalent deductions for other groups of taxpayers, contributions to private pensions plans and (capped) tax deductible mortgage interest and other interest paid. Finally, net income (or: disposable income), which is defined as taxable income less social security contributions, personal income tax, wealth tax and direct local taxes. Net income may be consumed, or saved. In the case of Germany, Spain and the United Kingdom households have been ranked into deciles on the basis of their net income. In the case of the Netherlands households have been ranked by gross income (PSI) and by net income (Consumer Survey, HDS), respectively. Although not ideal, this procedure is nevertheless thought to be acceptable, given the close statistical relation between gross and net income of households, and because households are lumped together in broad income classes which each contain 10 percent of all households. 2.B Germany Though in Germany many statistics on taxes and transfers are available within the Government Department of Finance or within the Statistical Offices, university researchers have almost no access to microdata.21 Therefore, the research community has followed its own course to obtain the necessary microdata. The former Sonderforschungsbereich 3 (Sfb3) `Microanalytic Foundation of Social Policy' at the universities of Frankfurt and Mannheim, for instance, was successful in creating new representative surveys for Germany. One outstanding survey is the German Socio-Economic Panel (GSOEP) from the Sfb3 and the DIW (German Institute for Economic Research, Berlin) which follows in a panel design some 6,000 households (more than 12,000 persons interviewed), as from 1984. This micro database with personal and household information allows to trace the process of income redistribution through tax and public transfer programmes with the help of MICSIM, a PC microsimulation model from the former Sfb3, now further developed at the University of Lüneburg.22 Because of the labour market focus of current research at this University, it is possible to provide gross and net income distributional figures based on the GSOEP. If GSOEP data are fed into MICSIM it is possible to simulate the amounts households pay in: o personal income tax; o employee social insurance contributions; and o value-added tax. Thus, the statutory incidence of 62 percent of total tax revenue can be traced.
21 See the recent report for the Ministry of Finance `Microsimulation for Tax Policy Analysis' by Spahn, Galler, Kaiser, Kassella and Merz [1992].
22 For a recent international survey of microsimulation principles, developments and applications, see Merz [1990; 1991].

50
Data relating to consumption patterns and indirect taxes have been taken from the Einkommens- und Verbrauchsstichprobe 1983 (EVS '83). This sample includes 44,507 households, representing 92 percent of all West-German households. 2.C Netherlands De Kam [1990] discusses datasets and micromodels available in the Netherlands to simulate the distribution of tax burdens. No single dataset contains all information needed about income and consumption of households. Thus data from several sources have been combined. The most reliable source of information concerning the personal income distribution in the Netherlands is the Panel Survey of Income (PSI), which is published annually by the Central Bureau of Statistics. For a representative sample of 75,000 households the CBS collects demographic and income data from various government administrations. Most income data in the sample are from the Tax Administration. The Panel Survey of Income has directly observed data on the statutory incidence of: o personal income tax (including wage withholding tax); o net wealth tax; and o general social insurance taxes. In addition, using data available in the PSI, the CBS has microsimulated employee social insurance taxes paid by households and their employers. The most recent PSI available is for year 1991. The CBS also organises an annual Consumer Survey, which offers detailed information on patterns of household spending. The number of households in this representative sample is about 2,000. In the Consumer Survey, some tax payments are directly observed, for example motor vehicle tax paid. The amounts households pay in most consumption taxes, notably VAT and various excise taxes, can be microsimulated, by applying relevant tax rates to taxable items consumed, as reported by households in the sample. The most recent Consumer Survey available is for year 1992. Finally, the Housing Demand Survey (HDS) of the CBS for 1989 contains data on the transactions tax, due when property changes hands. The HDS is organised every four years by the CBS at the request of the Department of Housing, and has data on some 40,000 households. Combining information from these three datasets, the statutory incidence of 98 percent of all taxes (in terms of revenue) has been traced. 2.D Spain The main dataset used to analyze tax distributions in Spain is the 1990 Family Expenditure Survey (Encuesta de Presupuestos Familiares). This representative survey includes a sample of 21,155 households. The dataset includes information on income, expenditures, living standards (such as housing conditions, etcetera) and various socioeconomic characteristics of household members. Income is classified by six major monetary and non-monetary sources and by recipient member of the household. The dataset offers information about household spending on 226 different consumption goods, as well as expenditures on housing (including real investment). From this dataset, under the incidence assumptions made in this report, the statutory incidence of the following taxes is calculated:

51
o personal income tax; o personal wealth tax; o corporate income tax; o other direct taxes; o social security contributions; o value-added tax; o excise taxes; o import duties. Value-added tax and excise taxes has been calculated for each household by applying the effective tax rates on their spending on a large desaggregated number of consumption items. The personal income tax, as well as social security taxes, have been estimated for each household in the survey by applying a micro-fiscal model which captures how legal provisions affect income from various sources as reported by households. Other indirect taxes are directly observable from the survey. Remaining taxes (import and wealth taxes) included in the analysis has been apportioned to households, applying indirect imputation methods and using information as available from various other sources. The above taxes account for 93 percent of total tax revenue. 2.E United Kingdom The Institute for Fiscal Studies (IFS) calculates the distribution of tax burdens in the United Kingdom, using data from the UK Family Expenditure Survey. This survey is collected annually by the Central Statistical Office. The resulting dataset contains information about income components and spending items of some 7,000 households. Households are ranked according to net income. Gross Income is defined as income from employment, self-employment, investments, social security benefits, private pensions, property income and other transfers. Income Tax and National insurance are deducted to derive net income. Capital gains are not included. Data from FES are fed into a micromodel (TAXBEN2) to simulate tax payments for each household. Johnson, Stark and Webb [1990] describe the IFS Tax and Benefit Model. The following taxes are calculated: o personal income tax; o national insurance contributions; o value-added tax; o various other indirect taxes; and o the council tax. In total IFS can thus directly model 94 percent of total government revenue. The IFS Tax and Benefit model simulates tax payments and benefit receipts. It does not use recorded payments and receipts from the Family Expenditure Survey, because its usual function is to analyze the distributional effect of reforms to the tax and benefit system and because some taxes and

52
benefits are recorded inaccurately in the FES. The simulation is complex. Calculations are made for each tax and benefit and for interactions between UK taxes and benefits. Indirect taxes are calculated from household expenditures on VAT and excised goods. House prices are imputed from a regression on household characteristics and council tax values are calculated on the basis of these prices and the households region.

53
ANNEX 3 SENSITIVITY ANALYSIS OF TAX INCIDENCE This annex discusses the sensitivity of results that have been presented in the main text for alternative specifications of the shifting assumptions. We consider the corporate income tax, employer social insurance contributions and the local property tax, respectively. In one specification it is assumed that these taxes especially hit consumers. Another specification assumes that these taxes are predominantly borne by owners of capital. Shifting assumptions Main text Consumption variant Capital variant Corporation Income Tax - dividend income 1/3 - 1 - property income 1/3 - - - consumption 1/3 1 - Employer social security tax - labour income 3/4 1/4 3/4 - consumption 1/4 3/4 1/4 Property Tax - property income - - 1 - consumption 1 1 - To illustrate, in the main text the economic incidence of the corporation income tax has been established assuming that shareholders, recipients of property income and consumers each shoulder one-third of the tax. Alternative specifications assume that consumers and property-owners respectively, bear the full burden of the corporation income tax. From the tables below it follows that the over-all distribution of tax shares hardly changes if alternative specifications are applied. Percentile shares change by one point at most, except in the 10-th decile, where the spread between variants amounts to five points at most (in the UK). Table A.5a Shares in total tax revenue under alternative assumptions, the Netherlands Decile 1 2 3 4 5 6 7 8 9 10 Total Main text 2 3 5 6 8 9 12 13 16 25 100 Consumption variant 3 3 5 7 8 10 12 13 16 24 100

54
Capital variant 2 3 5 6 8 9 11 13 16 27 100 Table A.5b Shares in total tax revenue under alternative assumptions, Spain Decile 1 2 3 4 5 6 7 8 9 10 Total Main text 2 3 5 6 7 9 11 14 17 27 100 Consumption variant 2 3 5 6 8 9 11 13 16 27 100 Capital variant 2 3 4 6 7 9 11 13 17 29 100 Table A.5c Shares in total tax revenue under alternative assumptions, United Kingdom Decile 1 2 3 4 5 6 7 8 9 10 Total Main text 2 2 3 5 6 9 11 14 18 31 100 Consumption variant 2 2 4 5 7 9 11 13 17 29 100 Capital variant 1 2 3 4 6 8 10 13 17 34 100

55
ANNEX 4 TAX SHIFTING IN MACROECONOMETRIC MODELS 4.A Germany The Deutsche Bundesbank runs a macroeconometric model. This model is a quarterly dynamic and interdependent system of the German economy. The current version has a total of 331 equations (120 of which are behavioural equations). The model contains a simulation block for eastern Germany. While part of the model is based on neo-Keynesian theory, increased attention is also paid to long-term equilibrium aspects. So far, the model follows `mainstream economics' and contains elements of both theoretical lines. Taxes are not directly included in the wage equations. Prices depend on specific indirect tax rates. Negotiated monthly wages in turn are a function of consumption prices, and, hence, indirectly of indirect taxes. Direct taxes are included in the definition of disposable income, labour force participation and investment. Again, the effect of taxes on wages is only indirect. Direct tax receipts are disaggregated in the model into wage tax, assessed income tax, corporation tax and other direct taxes (property tax, investment income tax, motor vehicle tax, etc.). Indirect taxes are divided into value-added tax, mineral oil tax, trade tax and other indirect taxes (customs duties, tobacco tax, spirits tax, taxes on land and buildings, capital transaction taxes: securities transfer tax, company tax, insurance and stamp taxes, etc.). Social security contributions are split into employees' and employers' contributions. In addition to income effects, tax measures also have cost effects. The extent to which enterprises use their capacity to produce goods depends inter alia on the cost involved in employing the capital stock. While an increase in enterprises' direct taxes directly raises the tax burden of firms, it indirectly increases the relief given in the form of tax deductible costs. Under the conditions prevailing in Germany as regards tax rates, interest rates and depreciation rules, the net effect is that user costs of capital tend to decrease slightly if direct taxes are increased. Other influences will, however, ultimately lead to lower capital spending if direct taxes are increased. The production costs of enterprises are made up of wage costs, the costs of using the capital stock and import prices. The burden of indirect taxes which initially likewise have to be borne by firms has to be added. The extent to which enterprises will be able to pass on their costs to buyers depends in particular on the market situation and the price elasticity of demand. Most increases in production costs resulting from a rise of wage costs, capital user costs and import prices or in the indirect tax burden are passed on by enterprises through their prices in a lengthy adjustment process.23 Prices then in turn affect wages, profits, interest rates and transactions and thus feed back onto the various tax assessment bases and other macroeconomic variables such as output and employment. The extent to which changes in tax rates or in social security
23 Since the demand for goods does not react with complete inelasticity to price changes a full pass-on of costs is not possible. The higher the price elasticity of demand, the smaller the scope for passing on costs and indirect tax increases. The price functions of the model have been described in more detail in Schlesinger and Jahnke [1987].

56
contributions will ultimately affect the economic situation will therefore depend on the dynamic interdependencies of the model. Table A.6 Effects of an increase in the direct tax rates by one percentage point in the econometric model of the German economya) Item 1994 1995 1996 1997 1998 1999 2000 Direct taxes 15.36 14.75 14.11 14.27 14.76 15.32 15.87 Gross wage income -2.92 -4.86 -5.35 -5.43 -5.30 -5.05 -4.69 Gross profit income -2.91 -4.01 -5.82 -6.53 -6.61 -6.49 -6.34 Disposable income of private households
-18.17 -22.22 -24.92 -27.21 -28.97 -30.38 -31.57
a) Deviation from baseline in DM bn.
Table A.7 Effects of an increase in the value-added tax rate by one percentage point in the econometric model of the German economya) Item 1994 1995 1996 1997 1998 1999 2000 Indirect taxes 10.91 11.48 11.70 12.16 12.85 13.66 14.57 Gross wage income -2.05 -1.92 -1.21 -0.67 -0.13 0.43 1.05 Gross profit income -1.20 -1.84 -3.26 -3.37 -3.11 -2.81 -2.54 Disposable income of private households
-1.15 -1.61 -2.67 -3.39 -3.58 -3.56 -3.46
a) Deviation from baseline in DM bn. Two different simulations are carried out to analyze the probable aggregate effects of these taxes, with wage, assessed income and corporation tax representing the impact of direct taxes and the value-added tax the effects of indirect taxes (see Jahnke, [1994]). The tax increase first of all is reflected in a decrease of households' disposable income. Lower demand for goods decreases output and employment. Capacity utilisation deteriorates and unemployment increases. This triggers some wage and price decreases. But as time proceeds, the real effects vanish and real GNP returns to the baseline scenario. In the long run there are no aggregate effects of raising direct taxes. Ultimately, an increase in direct tax rates has no adverse influence on the real growth rate. Just as in the case of higher direct taxes, the original impulse would increase considerably over time. The simulations with the model indicate that initially firms will be able to pass on only part of the extra cost through higher selling prices. Consequently, a considerable part of any value-added tax increase temporarily reduces the profits of enterprises. Although any value-added tax increase directly adds to the indirect tax burden of firms, even in the longer run only part of these extra costs can be passed on because there is a simultaneous adverse

57
impact on real demand. The simulations show that only 40 percent of a value-added tax increase will be passed on in prices in the long run. After a few years, there will be a self-adjustment here too. The rate of real growth returns to its rate in the baseline scenario. The decline in real growth, in the meantime, exerts smoothing effects on the price increase. In the long run, i.e. after seven years, real GDP has returned to its baseline value, whereas the price level has increased by 0.4 percent. An increase in the value-added tax rate, ultimately has no adverse effects on real output, but raises the price level. 4.B The Netherlands The effect of taxes on the wage level is very important in the most recent macroeconometric model of the Central Planning Bureau (CPB). In this model, best known under its acronym FKSEC [CPB, 1992], wages are modelled at the macro level and depend on labour productivity, a weighted average of consumer and producer prices, taxes and social insurance contributions, the level and the change of the unemployment rate, and the replacement ratio. In fact, taxes and social insurance contributions have always been part of wage equations in Dutch econometric models. Public levies are divided between the share paid by employers and by employees, since "this distinction consistently appears to be relevant empirically, and probably indicates some degree of nominal rigidity in the wage formation process" [CPB, 1992, p.31]. The main theoretical underpinning of the wage equation is a general type of bargaining model, in which the wage rate is determined as the outcome of a bargaining process between firms and unions. The relevant parts of the equation for the growth of the wage rate read as follows: wage = 0,50pc +0,50pyfr ... + 0,36[Dsll/(1 - sll1) + Dttl/(1 - tll1)] - 0,20 [Dslw/(1 + slw1)]
where pc and pyfr represent the growth rate of the prices of private consumption and gross value-added of the enterprise sector, respectively; sll denotes social insurance contributions paid by employees as a fraction of gross wages; ttl represents direct taxes on wage income paid by employees as a fraction of the total wage bill minus social insurance contributions, and slw denotes employers social insurance contributions as a fraction of gross wages. It is interesting, that in the present model of the CPB the coefficients for the wage tax and social insurance contributions are larger than in previous models, which implies that the incidence of these levies is more evenly divided between employers and employees. According to information provided by the CPB, the present coefficient has been calibrated on the basis of estimates for various sample periods with different wage regimes, and on the basis of the historical tracking performance of the model. This outcome is not so amazing as it perhaps may appear at first glance. It is well known that the degree of tax shifting in the wage equation is not very stable over time and depends very much on the estimation period. Indeed, Brunia and Kuper [1990] conclude that shifting of taxes and social insurance contributions has gradually diminished, whereas on the other hand shifting of employers contributions has increased over time.
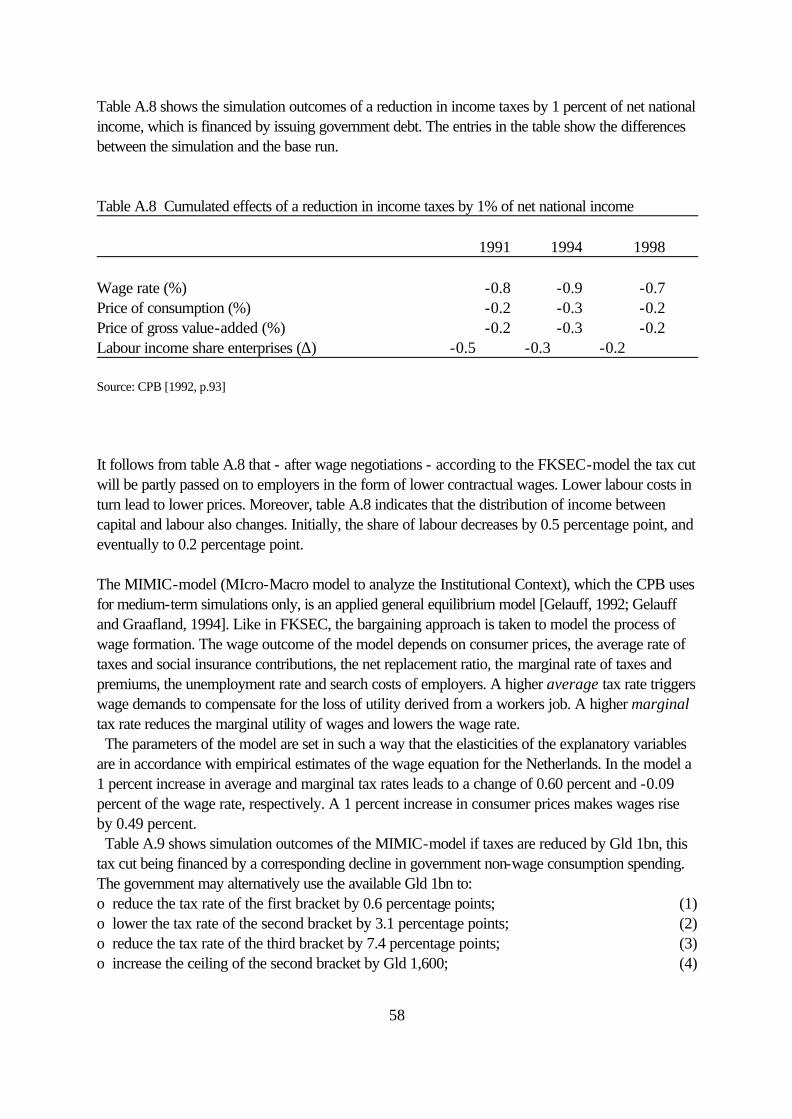
58
Table A.8 shows the simulation outcomes of a reduction in income taxes by 1 percent of net national income, which is financed by issuing government debt. The entries in the table show the differences between the simulation and the base run. Table A.8 Cumulated effects of a reduction in income taxes by 1% of net national income 1991 1994 1998 Wage rate (%) -0.8 -0.9 -0.7 Price of consumption (%) -0.2 -0.3 -0.2 Price of gross value-added (%) -0.2 -0.3 -0.2 Labour income share enterprises (∆) -0.5 -0.3 -0.2 Source: CPB [1992, p.93] It follows from table A.8 that - after wage negotiations - according to the FKSEC-model the tax cut will be partly passed on to employers in the form of lower contractual wages. Lower labour costs in turn lead to lower prices. Moreover, table A.8 indicates that the distribution of income between capital and labour also changes. Initially, the share of labour decreases by 0.5 percentage point, and eventually to 0.2 percentage point. The MIMIC-model (MIcro-Macro model to analyze the Institutional Context), which the CPB uses for medium-term simulations only, is an applied general equilibrium model [Gelauff, 1992; Gelauff and Graafland, 1994]. Like in FKSEC, the bargaining approach is taken to model the process of wage formation. The wage outcome of the model depends on consumer prices, the average rate of taxes and social insurance contributions, the net replacement ratio, the marginal rate of taxes and premiums, the unemployment rate and search costs of employers. A higher average tax rate triggers wage demands to compensate for the loss of utility derived from a workers job. A higher marginal tax rate reduces the marginal utility of wages and lowers the wage rate. The parameters of the model are set in such a way that the elasticities of the explanatory variables are in accordance with empirical estimates of the wage equation for the Netherlands. In the model a 1 percent increase in average and marginal tax rates leads to a change of 0.60 percent and -0.09 percent of the wage rate, respectively. A 1 percent increase in consumer prices makes wages rise by 0.49 percent. Table A.9 shows simulation outcomes of the MIMIC-model if taxes are reduced by Gld 1bn, this tax cut being financed by a corresponding decline in government non-wage consumption spending. The government may alternatively use the available Gld 1bn to: o reduce the tax rate of the first bracket by 0.6 percentage points; (1) o lower the tax rate of the second bracket by 3.1 percentage points; (2) o reduce the tax rate of the third bracket by 7.4 percentage points; (3) o increase the ceiling of the second bracket by Gld 1,600; (4)

59
o raise the ceiling of the third bracket by Gld 45,800; (5) o increase the basic personal allowance by Gld 270; (6) o reduce the basic VAT-rate by 0.8 percentage points (7) Table A.9 Consequences of tax reduction combined with a reduction of government spending by Gld 1bn, in 1992 (1) (2) (3) (4) (5) (6) (7) Level in 1992 13.0 50.0 60.0 42,966 85,930 6,225 17.5 Change -0.6 -3.1 -7.4 1,600 45,800 270 -0.8 Wages a) -0.63 -0.26 -0.11 -0.41 -0.07 0.16 -0.17 Production prices a) -0.43 -0.14 -0.03 -0.25 -0.02 0.09 -0.21 Consumer prices a) -0.28 -0.09 -0.02 -0.16 -0.01 0.06 -0.45
a) Percentage change Source: Gelauff and Graafland [1994] Reducing the tax rate of the first bracket increases labour supply, and lowers the wage level. Furthermore, the average tax rate drops, which reduces wage demands. In the second and third variant wages fall less, due to the smaller increase of labour supply. Other reasons for the smaller decline of the wage rate in these variants, in comparison with the first variant, are the larger reduction of the marginal tax rate and the smaller decline of the average tax. Variants four and five evoke a higher supply of labour, albeit in varying degrees. In the sixth variant the wage rate goes up, because of the negative income effect experienced by both the breadwinner and his/her partner. This alternative also leads to higher social insurance contributions, which also puts upward pressure an wages. Finally, it is interesting to note that in the MIMIC-model a lower value-added tax rate reduces consumer prices and thereby restrains wage demands. 4.C Spain The so called MOISEES model (see Molinas et al., [1990] and Andres, Dolado, Molinas and Zabalza, [1990]) is an integrated general equilibrium macroeconometric model of the Spanish economy. The model was built by the General Planning Division as a tool to simulate and help evaluate the consequences of most of the more important macroeconomic policies of the administration, including budgetary and monetary policies. In this model, nominal wages are understood as the result of a bargaining process between employers and employees (see Dolado, Malo de Molina and Zabalza [1986]). Since the outcome of this process depends upon the relative power of both parties, the wage equation, one of the building blocks of the simultaneous equations of the model, includes a vector Z of exogenous variables, which along with indirect taxes and other variables that may affect nominal wages, includes a subset of variables concerning the decision to participate or not in the labour market, and the strength of the unions. The form of the equation is the following:

60
log W = ao + al log P + a2 log(K(-1)/ L) + a3 log(1 + TEMCS) - a4v + a5Z where W is nominal wage cost, P is a GNP deflator price, K(-1)/L is a proxy for the labour productivity level, V is the unemployment rate, TEMCS is the effective social security rate paid by the employers, and Z is the vector with exogenous variables discussed above. The wage equation of the MOISEES model together with a GNP deflator equation is estimated (by three stage least squares) using log(W/P (1+TEMCS)) as the dependent variable, so the value of the coefficient a3 is lost. Using the dataset of the model (years 1964-1988) we have estimated by OLS a3, getting a value of 0.3. This parameter has also been estimated by Escobedo [1991], who applied a simultaneous model for the Spanish economy and obtained a value of 0.35, which is not very far from ours. Although we are tempted to conclude that the incidence hypothesis used in the text does not match the value of a3, at least two observations are in order. First, our shifting hypothesis has to be considered as the result of a long run equilibrium situation of the economy; and second, we should take into account that the legal changes, introduced in the Spanish economy during the late 1980's and 1990's, have injected a greater flexibility into the labour market, with firms having more and more bargaining power over the unions. This is shown by several studies on the Spanish labour market (see for instance: Bentolila and Dolado [1992]) and by tests of an insider-outsider model like Nickell and Wadhwani's (1990). We finally consider a simulation run with the MOISEES model, which consists of a permanent rise by 10 percent of the social security tax rates paid by employers, while additional revenues are used to redeem some of the outstanding public debt. This allows an assessment of the full impact of such a policy from a general equilibrium point of view (i.e. direct and indirect effects of the measure). Table A.10 illustrates the impacts of this policy change on various macroeconomic variables of the Spanish economy. The numbers indicate changes with respect to the values predicted by the model under no policy changes, which is considered the reference equilibrium. Table A.10 Cumulative effectsa) of a 10% increase in social security tax rates paid by employers 1989 1990 1991 1992 1993 Nominal labour costs 3.9 2.4 1.2 0.8 0.7 Real labour costs 1.7 1.3 1.0 0.9 0.8 Employment (Private Sector) -0.9 -1.7 -2.3 -2.4 -2.4 Real GDP -0.7 -1.4 -1.8 -1.8 -1.6 Nominal GDP 1.3 1.8 1.6 1.5 1.6 Inflation (CPI) 2.2 1.1 0.2 -0.1 -0.1 Personal income tax 1.8 2.8 2.6 2.3 2.4 Indirect taxes 0.2 0.5 1.5 0.5 0.5 Social security contributions 10.2 10.2 9.7 9.4 9.3

61
a) Percentage change of variables with respect to their reference value. The change of inflation is measured in percentage points. Source: Molinas et al. [1990, pp.100-101] The equilibrium nature of these results should be emphasized. In the short run, the policy change raises prices by 2.2 percentage points, with almost no change in the long run. This means that the average effect on prices is certainly small, because this policy measure tends to push up real labour costs, both in the short and in the long run, which in turn reduces employment by -2.4 percent, and lowers aggregate demand and real GDP by -1.6 percent in the long run. However, the government not only permanently collects a 10 percent increase in social insurance taxes but also, as nominal labour cost increases, it collects substantial additional tax revenues from personal income tax and, at some lower level, from indirect taxes. Hence, this exercise shows that, according to the MOISEES model, it is the worker who (in the long run) suffers the full cost of the policy change. Not only because he ends up paying additional taxes but also because of the great impact that the fiscal shock has on unemployment, which lends some support to the shifting assumption used in the main text. 4.D United Kingdom Church et al. [1993] review six major macroeconometric models of the UK economy. Models discussed include both `official' models, i.e. those of Her Majesty's Treasury (HMT) and the Bank of England (BE), and models that have been developed by Oxford Economic Forecasting (OEF), a private sector organization, and by three research institutes, namely those of the London Business School (LBS), the National Institute of Economic and Social Research (NIESR) and Strathclyde University (STR). The article of Church, which has inspired this subsection, analyses the versions of all these models as of 1992/1993. The key element of such models when used to analyze effects of changes in tax rates lies in the long-run solution to the wage equation. The role of the wedge can be assessed by writing the steady-state form of a wage equation, for example, for real wage costs as:
w - p - temp = a(tind + temp + tlab) - bv(p -p* - e) + other terms
where tind are indirect taxes and v(p-p*-e) is a measure of the real exchange rate scale by the import content (v) of gross output. The wedge therefore includes two components, namely a tax wedge and an import price wedge, with long-run effects α and ß. In contrast to previous versions of the models, it is now usual for the coefficients on the tax rates to be constrained to be equal. Empirically, a range of long-run wedge effects is found in the models: α = 0 in the STR and LBS models, α = 0.413 in NIESR, α = 0.5 in BE and α = 0.578 in OEF. However, different from equation (3), the dependent variable in the LBS and OEF models excludes the relevant tax term, i.e. employers taxes (in the case of real wage costs) and direct taxes (in the case of real consumption wages).

62
It follows that different taxes have different effects. In the LBS model a lower direct tax rate produces an upward effect on wages in the long run, rather than the effects implied by the above coefficient. In the OEF model a reduction in employers taxes again upwardly effects wages in the long run, rather than to lower wages as in the case other taxes are reduced. Table A.11 shows simulation outcomes of a cut in the standard income tax rate by 1 pence (= 1 percentage point), and a 1 percentage point reduction in the VAT rate. Table A.11 Simulation of tax reductions, United Kingdom income tax cut: LBS NIESR HMT BE OEF STR GDP year 1a) 0.09 0.40 0.08 0.14 0.19 0.58 GDP year 5 0.38 0.90 0.28 0.58b) 0.54b) 0.39 Inflation year 1 0.05 0.30 0.07 0.00 0.15 0.39 Inflation year 5 0.30 0.30 0.05 0.42b) -0.02b) 0.19 Wages year 1 -0.02 0.30 -0.01 -0.03 -0.18 0.36 Wages year 2 0.84 2.40 -0.21 -1.42b) -0.56b) 1.91 VAT reduction: GDP year 1 0.08 0.20 0.12 0.14 0.19 0.53 GDP year 5 0.06 0.70 0.45 0.38b) 0.62b) 0.33 Inflation year 1 -0.43 -0.10 -0.59 -0.58 -0.56 -0.31 Inflation year 5 -0.63 0.30 -0.14 0.49b) 0.43b) 0.15 Wages year 1 -0.14 0.40 -0.04 -0.35 0.03 0.30 Wages year 2 -1.95 2.30 -0.93 0.13b) 0.73b) 1.60 a) Percentage. b) After four years.

63
References Andrés, J., J.J. Dolado, C. Molinas and A. Zabalza, 1990, The influence of Demand and Capital
constraints on Spanish Unemployment, in: J.H. Drèze and C. Bean (eds.), Europe's Unemployment Problem, The MIT Press, Cambridge, Mass.
Atkinson, A.B. and H. Sutherland, 1988, Tax-Benefit Models, STICERD, London. Banco de España, 1993, Cuentas Financieras de la Economia Espanola (1983-1992), Madrid. Barten, A.P., 1988, The History of Dutch Macroeconomic Modelling (1936-1986), in: W.
Driehuis, M.M.G. Fase and H. den Hartog (eds.), Challenges for Macroeconomic Modelling, North-Holland, Amsterdam, 39-88.
Barthold, T.A., 1993, How Should We Measure Distribution?, National Tax Journal XLVI,
September, 291-299. Bodkin, R.G., 1988, A Survey of Non-Dutch European Macroeconometric Models: Some
International Perspective, in: W. Driehuis, M.M.G. Fase and H. den Hartog (eds.), Challenges for Macroeconomic Modelling, North-Holland, Amsterdam, 221-257.
Bodkin, R.G., L.R. Klein and K. Marwah, 1991, A History of Macroeconometric Model-
Building, Edward Elgar, Brookfield. Brunia, N. and G.H. Kuper, 1990, De specificatie van de afwenteling van de collectieve lasten,
Maandschrift Economie, 54, 49-55. Brunner, J.K. and H.-G. Petersen (eds.), 1990, Prospects and Limits of Simulation Models in
Tax and Transfer Policy, Campus, Frankfurt/New York. CBS, 1988, Nationale Rekeningen 1987, Den Haag. CBS, 1993, Nationale Rekeningen 1992, Den Haag. CBS, 1993a, "Inkomens van 1959-1990", 10 Sociaal-economische maandstatistiek 6, 40-47. Church, K.B., P.R. Mitchell, D.S. Turner, K.F. Wallis and J.D. Whitley, 1991, Comparative
Properties of Models of the UK Economy, National Institute Economic Review, 137, 59-74. Church, K.B., P.R. Mitchell, P.N. Smith and K.F. Wallis, 1993, Comparative Properties of Models
of the UK Economy, National Institute Economic Review, 145, 87-107.
64
CPB, 1992, FKSEC, a macroeconometric model for the Netherlands, Stenfert Kroese, Leiden. CPB, 1993, Centraal Economisch Plan 1993, Sdu, Den Haag. Deutsche Bundesbank, 1994, Macroeconometric model of the German economy, Frankfurt am
Main. Dolado, J.J., J. Malo de Molina and A. Zabalza, 1986, Spanish Industrial Unemployment: Some
Explanatory Factors, in: C. Bean, R. Layard and S. Nickell (eds.), The Rise in Unemployment, Basil Blackwell, London, 313-334.
Dolado, J.J. and S. Bentolila, 1992, Who are the Insiders? Wage setting in Spanish Manufacturing
firms, Banco de España, Servicio de Estudios, D.T. 9229. Escobedo, E., 1991, Un análisis empírico de los efectos finales producidos sobre el empleo
industrial por el sistema de financiación de la seguridad social española, 1975-1983, Investigaciones Económicas, Vol. XV, 1, 169-192.
Fisher, P.G., D.S. Turner, K.F. Wallis and J.D. Whitley, 1990, Comparative Properties of Models
of the UK Economy, National Institute Economic Review, 133, 91-104. Fullerton, D. and D. Lim Rogers, 1993, Who Bears the Lifetime Tax Burden?, The Brookings
Institution, Washington D.C. Galler, H.P. and G. Wagner, 1986, The Microsimulation model of the Sfb3 for the Analysis of
Economic and Social Policies, in: Orcutt et al., 227-247. Gelauff, G.M.M., 1992, Taxation, Social Security and the Labour Market, WIBRO, Helmond. Gelauff, G.M.M., 1993, Belastingverlaging, heffingskorting en overdraagbaarheid
belastingvrije voet, CPB working paper no. 50, The Hague. Gelauff, G.M.M. and J.J. Graafland, 1994, Modelling Welfare State Reform, North-Holland,
Amsterdam. Goodman, A. and S.J. Webb, 1994, For Richer, for Poorer: The changing distribution of
income in the United Kingdom, 1961-1991, IFS, London. De Haan, J., C.G.M. Sterks and C.A. de Kam, 1994, An assessment of margins for consolidation
in the Member States of the European Union, European Economy No. 3, 27-45, Brussels.

65
INE, 1993, Contabilidad Nacional de España, Serie Enlazada 1964-1991, Madrid. Jahnke, W., 1994, Macroeconometric Effects of Tax Policy Measures in an Econometric
Model of the German Economy, Discussion Paper. Johnson, P., G. Stark and W. Webb, 1990, TAXBEN2: The new IFS tax and benefit model,
IFS, London. Joint Committee on Taxation, 1993, Methodology and Issues in Measuring Changes in the
Distribution of Tax Burdens (JCS 7-93), June 14. De Kam, C. A., 1990, An Overview of Microanalytic Models and Datasets Presently Available in
the Netherlands for Simulation of Changes in Tax-Transfer Programs, in: Brunner and Petersen (eds.), 323-346.
Kehoe, T.J., et al., 1988, A General Equilibrium Analysis of the 1986 Tax Reform in Spain,
European Economic Review, 32, 334-342. Knoester, A. and N. van der Windt, 1987, Real Wages and Taxation in Ten OECD Countries,
Oxford Bulletin of Economics and Statistics, 49, 151-169. Layard, R., S. Nickell and R. Jackman, 1991, Unemployment, Macroeconomic performance
and the labour market, Oxford University Press, Oxford. Merz, J., 1990, The 1990 German Tax Reform - Microsimulations of Time Allocation Effects in the
Formal and Informal Economy, in: Brunner and Petersen (eds.), 509-537. Merz, J., 1991, Microsimulation - A Survey of Principles, Developments and Applications,
International Journal of Forecasting, 7, 77-104. Molinas, C. et al., 1990, MOISEES. Un modelo de Investigación y Simulación de la Economía
Española, Antoni Bosch Editor, Madrid. Nickell, S. and S. Wadhwani, 1990, Insider Forces and Wage Determination, The Economic
Journal, 100, 496-509. OECD, 1985, The Role of the Public Sector, OECD Economic Studies (4), Paris, 27-90. OECD, 1990, Employment Outlook, Paris. OECD, 1993, Economic Outlook, 54, December, Paris. OECD, 1993a, Revenue Statistics 1965-1992, Paris.

66
OECD, 1994, Economic Outlook, 56, December, Paris. OECD, 1994a, The Tax/Benefit Position of Production Workers, 1988-1991, Paris. Orcutt, G.H., J. Merz, H. Quinke (eds.), 1986, Microanalytic Models to Support Social and
Financial Policy, North-Holland, Amsterdam. Pechman, J.A., 1985, Who Paid the Taxes,/ 1965-1985, The Brookings Institution, Washington
D.C. Schlesinger, H. and W. Jahnke, 1987, Geldmenge, Preise und Sozialprodukt:
Interdependenzzusammenhänge im Lichte ökonometrischer Forschungsergebnisse für die Bundesrepublik Deutschland, Jahrbücher für Nationalökonomie und Statistik 203, 576-590.
Wallis, K.F., 1993, On Macroeconomic Policy and Macroeconometric Models, The Economic
Record, 69, 113-130.

Forschungsinstitut Freie Berufe (FFB), Universität Lüneburg Publikationen
1 FFB-Jahresberichte
FFB-Jahresbericht 2003/04, FFB-Jahresbericht 2001/02, FFB-Jahresbericht 1999/00, FFB-Jahresbericht 1997/98, FFB-Jahresbericht 1996, FFB-Jahresbericht 1995, FFB-Jahresbericht 1994, FFB-Jahresbericht 1993, FFB-Jahresbericht 1992, FFB-Jahresbericht 1991, FFB: 10 Jahre Forschung und Lehre 1989-1999, FFB-Forschung und Lehre 1989-1998, FFB-Forschung und Lehre 1989-1997, FFB-Forschung und Lehre 1989-1996.
2 FFB-Bücher in der FFB-Schriftenreihe
Ehling, M. und J. Merz, 2002, Neue Technologien in der Umfrageforschung, FFB-Schriften Nr. 14, 181 Seiten, ISBN 3-7890-8241-4, NOMOS Verlagsgesellschaft, Baden-Baden. Preis: € 31,--
Merz, J., 2002, Freie Berufe im Wandel der Märkte, FFB-Schriften Nr. 13, 168 Seiten, ISBN 3-7890-8107-8, NOMOS Verlagsgesellschaft, Baden-Baden. Preis: € 29,--
Merz, J., 2001, Existenzgründung 2 – Erfolgsfaktoren und Rahmenbedingungen, FFB-Schriften Nr. 12, 232 Seiten, ISBN 3-7890-7462-4, NOMOS Verlagsgesellschaft, Baden-Baden.
Preis: € 40,- / € 71,- (i. Vb. mit Band 1)
Merz, J., 2001, Existenzgründung 1 – Tips, Training und Erfahrung, FFB-Schriften Nr. 11, 246 Seiten, ISBN 3-7890-7461-6, NOMOS Verlagsgesellschaft, Baden-Baden.Preis: € 40,- / € 71,- (i. Vb. mit Band 2)
Merz, J. und M. Ehling, 1999, Time Use – Research, Data and Policy, FFB-Schriften Nr. 10, 571 Seiten, ISBN 3-7890-6244-8, NOMOS Verlagsgesellschaft, Baden-Baden. Preis: € 49 ,-
Herrmann, H. und J. Backhaus, 1998, Staatlich gebundene Freiberufe im Wandel, FFB-Schriften Nr. 9, 234 Seiten, ISBN 3-7890-5319-8, NOMOS Verlagsgesellschaft, Baden-Baden. Preis: € 34,-
Herrmann, H., 1996, Recht der Kammern und Verbände Freier Berufe, Europäischer Ländervergleich und USA, FFB-Schriften Nr. 8, 596 Seiten, ISBN 3-7890-4545-4, NOMOS Verlagsgesellschaft, Baden-Baden. Preis: € 56,-
Merz, J., Rauberger, T. K. und A. Rönnau, 1994, Freie Berufe in Rheinland-Pfalz und in der Bundesrepublik Deutschland – Struktur, Entwicklung und wirtschaftliche Bedeutung, FFB-Schriften Nr. 7, 948 Seiten, ISBN 3-927816-27-2, Lüneburg. Preis: € 95,-
Forschungsinstitut Freie Berufe (FFB) (Hrsg.), erstellt vom Zentrum zur Dokumentation für Naturheilverfahren e.V. (ZDN), 1992, 1993, Dokumentation der besonderen Therapierichtungen und natürlichen Heilweisen in Europa, Bd. I, 1. Halbband, 842 Seiten, Bd. I, 2. Halbband, 399 Seiten, Bd. II, 590 Seiten, Bd. III, 272 Seiten, Bd. IV, 419 Seiten, Bd. V, 1. Halbband, 706 Seiten, Bd. V, 2. Halbband, 620 Seiten, ISBN 3-88699-025-7, Lüneburg (nur zu beziehen über das Zentrum zur Dokumentation für Naturheilverfahren e.V. ZDN, Hufelandstraße 56, 45147 Essen, Tel.: 0201-74551). Preis: € 385,-
Sahner, H. und A. Rönnau, 1991, Freie Heilberufe und Gesundheitsberufe in Deutschland, FFB-Schriften Nr. 6, 653 Seiten, ISBN 3-927816-11-6, Lüneburg. Preis: € 58,-
Burmester, B., 1991, Ausbildungsvergleich von Sprachtherapeuten, FFB-Schriften Nr. 5, 54 Seiten, ISBN 3-927816-10-8, Lüneburg. Preis: € 9,-
Sahner, H., 1991, Freie Berufe in der DDR und in den neuen Bundesländern, FFB-Schriften Nr. 4, 177 Seiten, ISBN 3-927816-09-4, Lüneburg. Preis: € 25,-
Trautwein, H.-M., Donner, H., Semler, V. und J. Richter, 1991, Zur tariflichen Berücksichtigung der Aus-bildung, der Bereitstellung von Spitzenlastreserven und der Absicherung von Beschäftigungsrisiken bei Seelotsen, mit dem Anhang Steuerliche Aspekte des tariflichen Normaleinkommens der Seelotsen, FFB-Schriften Nr. 3, 183 Seiten, ISBN 3-927816-07-8, Lüneburg. Preis: € 19,-

Sahner, H. und F. Thiemann, 1990, Zukunft der Naturheilmittel in Europa in Gefahr? FFB-Schriften Nr. 2, 81 Seiten, ISBN 3-927816-06-X, Lüneburg. Preis: € 6,-
Sahner, H., Herrmann, H., Rönnau, A. und H.-M. Trautwein, 1989, Zur Lage der Freien Berufe 1989, Teil III, FFB-Schriften Nr. 1, 167 Seiten, ISBN 3-927816-04-3, Lüneburg. Preis: € 25,-
Sahner, H., Herrmann, H., Rönnau, A. und H.-M. Trautwein, 1989, Zur Lage der Freien Berufe 1989, Teil II, FFB-Schriften Nr. 1, 955 Seiten, ISBN 3-927816-02-7, Lüneburg.
Preis: € 20,- / € 35,- (i. Vb. mit Teil I)
Sahner, H., Herrmann, H., Rönnau, A. und H.-M. Trautwein, 1989, Zur Lage der Freien Berufe 1989, Teil I, FFB-Schriften Nr. 1, 426 Seiten, ISBN 3-927816-01-9, Lüneburg.
Preis: € 20,- / € 35,- (i. Vb. mit Teil II)
3 FFB-Bücher
Merz, J., D. Hirschel und M. Zwick, 2005, Struktur und Verteilung hoher Einkommen - Mikroanalysen auf der Basis der Einkommensteuerstatistik, Lebenslagen in Deutschland, Der zweite Armuts- und Reich-tumsbericht der Bundesregierung, Bundesministerium für Gesundheit und Soziale Sicherung, Berlin (http://www.bmgs.bund.de/download/broschueren/A341.pdf)
Merz, J. und J. Wagner (Hrg.), 2004, Perspektiven der MittelstandsForschung – Ökonomische Analysen zu Selbständigkeit, Freien Berufen und KMU, Merz, J., Schulte, R. and J. Wagner (Series Eds.), Entrepreneuship, Professions, Small Business Economics, CREPS-Schriftenreihe Vol. 1, 520 Seiten, Lit Verlag, ISBN 3-8258-8179-2, Münster. Preis: € 39,90
Merz, J. und M. Zwick (Hrg.), 2004, MIKAS – Mikroanalysen und amtliche Statistik, Statistisches Bundesamt (Serie Editor), Statistik und Wissenschaft, Vol. 1, 318 Seiten, ISBN 3-8246-0725-5, Wiesbaden
Preis: € 24,80
Hirschel, D., 2004, Einkommensreichtum und seine Ursachen – Die Bestimmungsfaktoren hoher Arbeitseinkommen, Hochschulschriften Band 82, 416 Seiten, Metropolis -Verlag Marburg, ISBN 3-89518-441-1.
Merz, J., 2001, Hohe Einkommen, ihre Struktur und Verteilung, Lebenslagen in Deutschland, Der erste Armuts- und Reichtumsbericht der Bundesregierung, Bundesministerium für Arbeit und Sozialordnung, 128 Seiten, Bonn, zu beziehen über: Bundesanzeiger Verlagsgesellschaft mbH, Südstraße 119, 53175 Bonn.
Ehling, M. und J. Merz u. a., 2001, Zeitbudget in Deutschland – Erfahrungsberichte der Wissenschaft, Band 17 der Schriftenreihe Spektrum Bundesstatistik, 248 Seiten, Metzler-Poeschel Verlag, ISBN 3-8246-0645-3, Stuttgart. Preis: € 16,-
Krickhahn, T., 1995, Die Verbände des wirtschaftlichen Mittelstands in Deutschland, 351 Seiten, DUV Deutscher Universitäts Verlag, ISBN 3-8244-0245-9, Wiesbaden. Preis: € 62,-
Spahn, P. B., Galler, H. P., Kaiser, H., Kassella, T. und J. Merz, 1992, Mikrosimulation in der Steuerpolitik, 279 Seiten, Springer Verlag, ISBN 3-7908-0611-0, Berlin. Preis: € 45,-
4 FFB-Reprints
Merz, J., Kumulation von Mikrodaten – Konzeptionelle Grundlagen und ein Vorschlag zur Realisierung,; in: Allgemeines Statistisches Archiv, Issue 88, S. 451-472, 2004 FFB-Reprint Nr. 35
Merz, J., Einkommens-Reichtum in Deutschland - Mikroanalytische Ergebnisse der Einkommensteuerstatistik für Selbständige und abhängig Beschäftigte, in: Perspektiven der Wirtschaftspolitik, Vol. 5, Issue 2, S. 105-126, 2004 FFB-Reprint Nr. 34
Merz, J., Vorgrimler, D. und M. Zwick, Faktisch anonymisiertes Mikrodatenfile der Lohn- und Einkom-mensteuerstatistik 1998, in: Wirtschaft und Statistik, Issue 10, S. 1079-1091, 2004
FFB-Reprint Nr. 33
Ackermann, D., Merz, J. and H. Stolze, Erfolg und Erfolgsfaktoren freiberuflich tätiger Ärzte – Ergebnisse der FFB-Ärzteumfrage für Niedersachsen, in: Merz, J. and J. Wagner (Eds.), Perspektiven der MittelstandsForschung – Ökonomische Analysen zu Selbständigkeit, Freien Berufen und KMU, Merz, J., Schulte, R. and J. Wagner (Series Eds.), Entrepreneuship, Professions, Small Business Economics, CREPS-Schriftenreihe Vol. 1, Lit Verlag, Münster, pp. 165-190, 2004 FFB-Reprint Nr. 32

Hirschel, D. und J. Merz, Was erklärt hohe Arbeitseinkommen Selbständiger – Eine Mikroanalyse mi Daten des Sozioökonomischen Panels, in: Merz, J. and J. Wagner (Eds.), Perspektiven der MittelstandsForschung – Ökonomische Analysen zu Selbständigkeit, Freien Berufen und KMU, Merz, J., Schulte, R. and J. Wagner (Series Eds.), Entrepreneuship, Professions, Small Business Economics, CREPS-Schriftenreihe Vol. 1, Lit Verlag, Münster, pp. 265-285, 2004 FFB-Reprint Nr. 31
Burgert, D. und J. Merz, Wer arbeitet wann? – Arbeitszeitarrangements von Serlbständigen und abhängig Beschäftigten: Eine mikroökonometrische Analyse deutscher Zeitbudgetdaten, in: Merz, J. and J. Wagner (Eds.), Perspektiven der MittelstandsForschung – Ökonomische Analysen zu Selbständigkeit, Freien Berufen und KMU, Merz, J., Schulte, R. and J. Wagner (Series Eds.), Entrepreneuship, Professions, Small Business Economics, CREPS-Schriftenreihe Vol. 1, Lit Verlag, Münster, pp. 303-330, 2004
FFB-Reprint Nr. 30
Merz, J. und M. Zwick, Hohe Einkommen – Eine Verteilungsanalyse für Freie Berufe, Unternehmer und abhängige Beschäftigte, in: Merz, J. and M. Zwick (Eds.), MIKAS – Mikroanalysen und amtliche Statistik, Statistik und Wissenschaft, Vol. 1, pp. 167-193, 2004 FFB-Reprint Nr. 29
Merz, J., Schatz, C. and K. Kortmann, Mikrosimulation mit Verwaltungs- und Befragungsdaten am Be ispiel ‚Altersvorsorge in Deutschland 1996’ (AVID ‚96), in: Merz, J. und M. Zwick (Hg.), MIKAS – Mikroanalysen und amtliche Statistik, Statistik und Wissenschaft, Vol. 1, S. 231-248, 2004
FFB-Reprint Nr. 28
Merz, J., Was fehlt in der EVS ? – Eine Verteilungsanalyse hoher Einkommen mit der verknüpften Ein kom-mensteuerstatistik für Selbständige und abhängig Beschäftigte, in: Jahrbücher für Nationalökonomie und Statistik, Vol. 223/1, p. 58-90, 2003 FFB-Reprint Nr. 27
Merz, J. und M. Zwick, Verteilungswirkungen der Steuerreform 2000/2005 im Vergleich zum ‚Karlsruher Entwurf’ – Auswirkungen auf die Einkommensverteilung bei Selbständigen (Freie Berufe, Unternehmer) und abhängig Beschäftigte, in: Wirtschaft und Statistik, 8/2002, p. 729-740, 2002
FFB-Reprint Nr. 26
Merz, J., Time Use Research and Time Use Data – Actual Topics and New Frontiers, in: Ehling, M. and J. Merz (Eds.), Neue Technologien in der Umfrageforschung – Anwendungen bei der Erhebung von Zeitverwendung, p. 3-19, 2002 FFB-Reprint Nr. 25
Merz, J., 2002, Time and Economic Well-Being – A Panel Analysis of Desired versus Actual Working Hours, in: Review of Income and Wealth, Series 48, No. 3, p. 317-346, FFB-Reprint Nr. 24, Department of Economics and Social Sciences, University of Lüneburg, Lüneburg. FFB-Reprint Nr. 24
Schatz, Ch., Kortmann, K. und J. Merz, 2002, Künftige Alterseinkommen - Eine Mikrosimulationsstudie zur Entwicklung der Renten und Altersvorsorge in Deutschland (AVID’96), in: Schmollers Jahrbuch, Journal of Applied Social Sciences, Zeitschrift für Wirtschafts - und Sozialwissenschaften, 122. Jahrgang, Heft 2, S. 227-260, FFB-Reprint Nr. 23, Fachbereich Wirtschafts- und Sozialwissenschaften, Universität Lüneburg, Lüneburg. FFB-Reprint Nr. 23
Merz, J. und M. Zwick, 2001, Über die Analyse hoher Einkommen mit der Einkommensteuerstatistik – Eine methodische Erläuterung zum Gutachten „Hohe Einkommen, ihre Struktur und Verteilung“ zum ersten Armuts- und Reichtumsbericht der Bundesregierung, in: Wirtschaft und Statistik 7/2001, S. 513-523, FFB-Reprint Nr. 22, Fachbereich Wirtschafts- und Sozialwissenschaften, Universität Lüneburg, Lüne-burg. FFB-Reprint Nr. 22
Merz, J., 2001, Was fehlt in der EVS? Eine Verknüpfung mit der Einkommensteuerstatistik für die Ve rteilungs-analyse hoher Einkommen, in: Becker, I., Ott, N. und G. Rolf (Hrsg.), Soziale Sicherung in einer dynamischen Gesellschaft, S. 278-300, Campus Verlag, Frankfurt/New York, FFB-Reprint Nr. 21, Fach-bereich Wirtschafts- und Sozialwissenschaften, Universität Lüneburg, Lüneburg.FFB-Reprint Nr. 21
Merz, J., 2001, 10 Jahre Forschungsinstitut Freie Berufe (FFB) der Universität Lüneburg – Forschungs-schwerpunkte und Perspektiven, in: Bundesverband der Freien Berufe (Hrsg.), Jahrbuch 2000/2001, der freie beruf, S. 158-174, Bonn, FFB-Reprint Nr. 20, Fachbereich Wirtschafts- und Sozialwissenschaften, Universität Lüneburg, Lüneburg. FFB-Reprint Nr. 20

Merz, J., 2000, The Distribution of Income of Self-employed, Entrepreneurs and Professions as Revealed from Micro Income Tax Statistics in Germany, in: Hauser, R. and I. Becker (eds.), The Personal Distribution of Income in an International Perspective, S. 99-128, Springer Verlag, Heidelberg, FFB-Reprint Nr.19, Department of Economics and Social Sciences, University of Lüneburg, Lüneburg.
FFB-Reprint Nr. 19
Merz, J., 1998, Privatisierung, Deregulierung und staatlich gebundene Freie Berufe – Einige ökonomische Aspekte, in: Herrmann, H. und J. Backhaus (Hrsg.), Staatlich gebundene Freiberufe im Wandel, S. 67-114, FFB-Schriften Nr. 9, NOMOS Verlagsgesellschaft, Baden-Baden, FFB-Reprint Nr. 18, Fachbereich Wirtschafts - und Sozialwissenschaften, Universität Lüneburg, Lüneburg. FFB-Reprint Nr. 18
Merz. J., 1997, Die Freien Berufe – Laudatio zur Verleihung der Ehrendoktorwürde des Fachbereiches Wirtschafts - und Sozialwissenschaften der Universität Lüneburg an Prof. J. F. Volrad Deneke, in: Bundesverband der Freien Berufe (Hrsg.), Jahrbuch 1997, der freie beruf, S. 133-151, Bonn, FFB-Reprint Nr. 17, Fachbereich Wirtschafts- und Sozialwissenschaften, Universität Lüneburg, Lüneburg.
FFB-Reprint Nr. 17
de Kam, C. A., de Haan, J., Giles, C., Manresa, A., Berenguer, E., Calonge, S., Merz, J. and K. Venkatarama, 1996, Who pays the taxes? The Distribution of Effective Tax Burdens in Four EU Countries, in: ec Tax Review, p. 175-188, FFB-Reprint No. 16, Department of Economics and Social Sciences, University of Lüneburg, Lüneburg. FFB-Reprint Nr. 16
Merz, J., 1996, MICSIM – A PC Microsimulation Model for Research and Teaching: A Brief View on its’ Concept and Program Developments, SoftStat ’95 – Advances in Statistical Software 5, in: Faulbaum, F. and W. Bandilla (eds.), Stuttgart, p. 433-442, FFB-Reprint No. 15, Department of Economics and Social Sciences, University of Lüneburg, Lüneburg. FFB-Reprint Nr. 15
Burkhauser, R. V., Smeeding, T. M. and J. Merz, 1996, Relative Inequality and Poverty in Germany and the United States using Alternative Equivalence Scales, in: Review of Income and Wealth, Series 42, No. 4, p. 381-400, FFB-Reprint No. 14, Department of Economics and Social Sciences, University of Lüneburg, Lüneburg. FFB-Reprint Nr. 14
Merz, J. 1996, Schattenwirtschaft und Arbeitsplatzbeschaffung, in: Sadowski, D. und K. Pull (Hrsg.), Vorschläge jenseits der Lohnpolitik, S. 266-294, Frankfurt/New York, FFB-Reprint Nr. 13, Fachbereich Wirtschafts - und Sozialwissenschaften, Universität Lüneburg, Lüneburg. FFB-Reprint Nr. 13
Merz, J., 1996, MICSIM – Concept, Developments and Applications of a PC Microsimulation Model for Research and Teaching, in: Troitzsch, K. G., Mueller, U. Gilbert, G. N. and J. E. Doran (eds.), Social Science Microsimulation, p. 33-65, Berlin/New York, FFB-Reprint No. 12, Department of Economics and Social Sciences, University of Lüneburg, Lüneburg. FFB-Reprint Nr. 12
Merz, J., 1996, Market and Non-Market Labour Supply and the Impact of the Recent German Tax Reform – Incorporating Behavioural Response, in: Harding, A. (ed.), Microsimulation and Public Policy, p. 177-202, Amsterdam/Tokyo, FFB-Reprint No. 11, Department of Economics and Social Sciences, University of Lüneburg, Lüneburg. FFB-Reprint Nr. 11
Merz, J. und R. Lang, 1996, Alles eine Frage der Zeit!? – Bericht über ein FFB-Forschungsprojekt zum Thema 'Zeitverwendung in Erwerbstätigkeit und Haushaltsproduktion – Dynamische Mikroanalysen mit Paneldaten', in: Uni Lüneburg – 50 Jahre Hochschule in Lüneburg, Jubiläums -Sonderausgabe, Heft 19/Mai 1996, S. 51-55, FFB-Reprint Nr. 10, Fachbereich Wirtschafts - und Sozialwissenschaften, Universität Lüneburg, Lüneburg. FFB-Reprint Nr. 10
Merz, J. und D. Kirsten, 1996, Freie Berufe im Mikrozensus – Struktur, Einkommen und Einkommensverteilung in den neuen und alten Bundesländern, in: BFB Bundesverband der Freien Berufe (Hrsg.), Jahrbuch 1996, S. 40-79, Bonn, FFB-Reprint Nr. 9, Fachbereich Wirtschafts- und Sozialwissenschaften, Universität Lüneburg, Lüneburg. FFB-Reprint Nr. 9
Deneke, J. F. V., 1995, Freie Berufe – Gestern, Heute, Morgen, in: BFB Bundesverband der Freien Berufe (Hrsg.), Jahrbuch 1995, S. 57-72, Bonn, FFB-Reprint Nr. 8, Fachbereich Wirtschafts- und Sozialwissen-schaften, Universität Lüneburg, Lüneburg. FFB-Reprint Nr. 8
Merz, J. and J. Faik, 1995, Equivalence Scales Based on Revealed Preference Consumption Expenditures – The Case of Germany, in: Jahrbücher für Nationalökonomie und Statistik, Vol. 214, No. 4, p. 425-447, Stuttgart, FFB-Reprint No. 7, Department of Economics and Social Sciences, University of Lüneburg, Lüneburg. FFB-Reprint Nr. 7

Merz, J., 1993, Statistik und Freie Berufe im Rahmen einer empirischen Wirtschafts - und Sozialforschung, in: BFB Bundesverband der Freien Berufe (Hrsg.), Jahrbuch 1993, S. 31-78, Bonn, FFB-Reprint Nr. 6, Fach-bereich Wirtschafts- und Sozialwissenschaften, Universität Lüneburg, Lüneburg.FFB-Reprint Nr. 6
Merz, J., 1993, Wandel in den Freien Berufen – Zum Forschungsbeitrag des Forschungsinsituts Freie Berufe (FFB) der Universität Lüneburg, in: BFB Bundesverband der Freien Berufe (Hrsg.), Jahrbuch 1993, S. 164-173, Bonn, FFB-Reprint Nr. 5, Fachbereich Wirtschafts- und Sozialwissenschaften, Universität Lüneburg, Lüneburg. FFB-Reprint Nr. 5
Merz, J. and K. G. Wolff, 1993, The Shadow Economy: Illicit Work and Household Production: A Microanaly-sis of West Germany, in: Review of Income and Wealth, Vol. 39, No. 2, p. 177-194, FFB-Reprint No. 4, Department of Economics and Social Sciences, University of Lüneburg, Lüneburg
FFB-Reprint Nr. 4
Trautwein, H.-M. und A. Rönnau, 1993, Self-Regulation of the Medical Profession in Germany: A Survey, Faure, in: M., Finsinger, J., Siegers, J. und R. van den Bergh (eds.), Regulation of Profession, p. 249-305, ISBN 90-6215-334-8, MAKLU, Antwerpen, FFB-Reprint No. 3, Depart ment of Economics and Social Sciences, University of Lüneburg, Lüneburg. FFB-Reprint Nr. 3
Herrmann, H., 1993, Regulation of Attorneys in Germany: Legal Framework and Actual Tendencies of Deregulation, in: Faure, M., Finsinger, J., Siegers, J. und R. van den Bergh (eds.), Regulation of Profession, p. 225-245, ISBN 90-6215-334-8, MAKLU, Antwerpen, FFB-Reprint No. 2, Depart ment of Economics and Social Sciences, University of Lüneburg, Lüneburg. FFB-Reprint Nr. 2
Merz, J., 1991, Microsimulation – A Survey of Principles, Developments and Applications, in: International Journal of Forecasting 7, p. 77-104, ISBN 0169-2070-91, North-Holland, Amsterdam, FFB-Reprint Nr. 1, Department of Economics and Social Sciences, University of Lüneburg, Lüneburg.
FFB-Reprint Nr. 1
5 FFB-Diskussionspapiere, ISSN 0942-2595
Merz, J. und Paic, P., 2005, Start-up success of freelancers – New microeconometric evidence from the German Socio-Economic Panel. FFB-Diskussionspapier Nr. 56, Fachbereich Wirtschafts- und Sozialwissenschaften, Universität Lüneburg, Lüneburg. FFB-DP Nr. 56
Merz, J. und Paic, P., 2005, Erfolgsfaktoren freiberuflicher Existenzgründung – Neue mikroökonometrische Ergebnisse mit Daten des Sozio-ökonomischen Panels, FFB-Diskussionspapier Nr. 55, Fachbereich Wirtschafts - und Sozialwissenschaften, Universität Lüneburg, Lüneburg. FFB-DP Nr. 55
Merz, J. und Stolze, H., 2005, Representative Time Use Data and Calibration of the American Time Use Studies 1965-1999, FFB-Diskussionspapier Nr. 54, Fachbereich Wirtschafts- und Sozialwissenschaften, Universität Lüneburg, Lüneburg. FFB-DP Nr. 54
Paic, P. und Brand, H., 2005, Die Freien Berufe im Sozio-ökonomischen Panel - Systematische Berichtigung der kritischen Wechsel innerhalb der Selbständigengruppe, FFB-Diskussionspapier Nr. 53, Fachbereich Wirtschafts - und Sozialwissenschaften, Universität Lüneburg, Lüneburg. FFB-DP Nr. 53
Merz, J., und Paic, P., 2005, Zum Einkommen der Freien Berufe – Eine Ordered Probit-Analyse ihrer Determinanten auf Basis der FFB-Onlineumfrage, FFB-Diskussionspapier Nr. 52, Fachbereich Wirtschafts - und Sozialwissenschaften, Universität Lüneburg, Lüneburg. FFB-DP Nr. 52
Burgert, D., 2005, Schwellenwerte im deutschen Kündigungsschutzrecht – Ein Beschäftigungshindernis für kleine Unternehmen?, FFB-Diskussionspapier Nr. 50, Fachbereich Wirtschafts- und Sozialwissenschaften, Universität Lüneburg, Lüneburg. FFB-DP Nr. 51
Merz, J., Böhm P. und Burgert D., 2005, Arbeitszeitarrangements und Einkommensverteilung – Ein Treatment Effects Ansatz der Einkommensschätzung für Unternehmer, Freiberufler und abhängig Beschäftigte, FFB-Diskussionspapier Nr. 50, Fachbereich Wirtschafts- und Sozialwissenschaften, Universität Lüneburg, Lüneburg. FFB-DP Nr. 50
Burgert, D., 2005, The Impact of German Job Protection Legislation on Job Creation in Small Establis hments – An Application of the Regression Discontinuity Design, FFB-Diskussionspapier Nr. 49, Fachbereich Wirtschafts - und Sozialwissenschaften, Universität Lüneburg, Lüneburg. FFB-DP Nr. 49
Merz, J. und D. Burgert, 2005, Arbeitszeitarrangements – Neue Ergebnisse aus der nationalen Zeit-budgeterhebung 2001/02 im Zeitvergleich, FFB-Diskussionspapier Nr. 46, Fachbereich Wirt schafts- und Sozialwissenschaften, Universität Lüneburg, Lüneburg. FFB-DP Nr. 48
Merz, J., Böhm, P. und D. Burgert, 2005, Timing, Fragmentation of Work and Income Inequality – An Earnings Treatment Effects Approach, FFB-Diskussionspapier Nr. 47, Fachbereich Wirtschafts- und Sozialwissenschaften, Universität Lüneburg, Lüneburg. FFB-DP Nr. 47

Merz, J. und P. Paic, 2004, Existenzgründungen von Freiberuflern und Unternehmer – Eine Mikro analyse mit dem Sozio-ökonomischen Panel, FFB-Diskussionspapier Nr. 46, Fachbereich Wirtschafts- und Sozialwissenschaften, Universität Lüneburg, Lüneburg. FFB-DP Nr. 46
Merz, J. und D. Burgert, 2004, Wer arbeitet wann? Arbeitszeitarrangements von Selbständigen und abhängig Beschäftigten – Eine mikroökonometrische Analyse deutscher Zeitbudgetdaten, FFB-Diskussionspapier Nr. 45, Fachbereich Wirtschafts- und Sozialwissenschaften, Universität Lüneburg, Lüneburg
FFB-DP Nr. 45
Hirschel, D. und J. Merz, 2004, Was erklärt hohe Arbeitseinkommen der Selbständigen – Eine Mikroanalyse mit Daten des Sozio-ökonomischen Panels, FFB-Diskussionspapier Nr. 44, Fachbereich Wirtschafts - und Sozialwissenschaften, Universität Lüneburg, Lüneburg. FFB-DP Nr. 44
Ackermann, D., Merz, J. und H. Stolze, 2004, Erfolg und Erfolgsfaktoren freiberuflich tätiger Ärzte – Ergebnisse der FFB-Ärztebefragung für Niedersachsen, FFB-Diskussionspapier Nr. 43, Fachbereich Wirtschafts - und Sozialwissenschaften, Universität Lüneburg, Lüneburg. FFB-DP Nr. 43
Hirschel, D., 2003, Do high incomes reflect individual performance? The determinants of high incomes in Germany, FFB-Diskussionspapier Nr. 42, Department of Economics and Social Sciences, University of Lüneburg, Lüneburg. FFB-DP Nr. 42
Merz, J., and D. Burgert, 2003, Working Hour Arrangements and Working Hours – A Microeconometric Analysis Based on German Time Diary Data, FFB-Diskussionspapier Nr. 41, Department of Economics and Social Sciences, University of Lüneburg, Lüneburg. FFB-DP Nr. 41
Merz, J. und M. Zwick, 2002, Hohe Einkommen: Eine Verteilungsanalyse für Freie Berufe, Unternehmer und abhängig Beschäftigte, Eine Mikroanalyse auf der Basis der Einkommensteuerstatistik, FFB-Diskussionspapier Nr. 40, Fachbereich Wirtschafts- und Sozialwissenschaften, Universität Lüneburg, Lüneburg. FFB-DP Nr. 40
Merz, J., and D. Hirschel, 2003, The distribution and re-distribution of income of self-employed as freelancers and entrepreneurs in Europe, FFB-Diskussionspapier Nr. 39, Department of Economics and Social Sciences, University of Lüneburg, Lüneburg. FFB-DP Nr. 39
Stolze, H. 2002, Datenbankbankgestützte Internetpräsenzen – Entwicklung und Realisation am Beispiel der Homepage des Forschungsinstituts Freie Berufe (FFB) der Universität Lüneburg http://ffb.uni-luene-burg.de, FFB-Diskussionspapier Nr. 38, Fachbereich Wirtschafts - und Sozialwissenschaften, Universität Lüneburg, Lüneburg. FFB-DP Nr. 38
Merz, J., 2002, Zur Kumulation von Haushaltsstichproben, FFB-Diskussionspapier Nr. 37, Fachbereich Wirtschafts - und Sozialwissenschaften, Universität Lüneburg, Lüneburg. FFB-DP Nr. 37
Merz, J., 2002, Reichtum in Deutschland: Hohe Einkommen, ihre Struktur und Verteilung – Eine Mikro analyse mit der Einkommensteuerstatistik für Selbständige und abhängig Beschäftigte, FFB-Dis kussionspapier Nr. 36, Fachbereich Wirtschafts- und Sozialwissenschaften, Universität Lüneburg, Lüneburg.
FFB-DP Nr. 36
Merz, J. und M. Zwick, 2002, Verteilungswirkungen der Steuerreform 2000/2005 im Vergleich zum ‚Karlsruher Entwurf Auswirkungen auf die Einkommensverteilung bei Selbständigen (Freie Berufe, Unternehmer und abhängig Beschäftigte), FFB-Diskussionspapier Nr. 35, Fachbereich Wirtschafts- und Sozialwissen-schaften, Universität Lüneburg, Lüneburg. FFB-DP Nr. 35
Merz, J., Stolze, H. und M. Zwick, 2002, Professions, entrepreneurs, employees and the new German tax (cut) reform 2000 – A MICSIM microsimulation analysis of distributional impacts, FFB-Diskussionspapier Nr. 34, Department of Economics and Social Sciences, University of Lüneburg, Lüneburg.
FFB-DP Nr. 34
Forschungsinstitut Freie Berufe, 2002, Freie Berufe im Wandel der Märkte - 10 Jahre Forschungsinstitut Freie Berufe (FFB) der Universität Lüneburg, Empfang am 4. November 1999 im Rathaus zu Lüneburg, FFB-Diskussionspapier Nr. 33, Fachbereich Wirtschafts- und Sozialwissenschaften, Universität Lüneburg, Lüneburg. FFB-DP Nr. 33
Merz, J., 2002, Time Use Research and Time Use Data – Actual Topics and New Frontiers, FFB-Discussion Paper No. 32, Department of Economics and Social Sciences, University of Lüneburg, Lüneburg.
FFB-DP Nr. 32

Merz, J., 2001, Freie Be rufe im Wandel der Arbeitsmärkte, FFB-Diskussionspapier Nr. 31, Fachbereich Wirtschafts - und Sozialwissenschaften, Universität Lüneburg, Lüneburg. FFB-DP Nr. 31
Merz, J., 2001, Was fehlt in der EVS? Eine Verteilungsanalyse hoher Einkommen mit der verknüpften Einkommensteuerstatistik für Selbständige und abhängig Beschäftigte, FFB-Diskussionspapier Nr. 30, Fachbereich Wirtschafts- und Sozialwissenschaften, Universität Lüneburg, Lüneburg.
FFB-DP Nr. 30
Merz, J., 2001, Informationsfeld Zeitverwendung – Expertise für die Kommission zur Verbesserung der informationellen Infrastruktur zwischen Wissenschaft und Statistik, FFB-Diskussionspapier Nr. 29, Fachbereich Wirtschafts- und Sozialwissenschaften, Universität Lüneburg, Lüneburg.
FFB-DP Nr. 29
Schatz, C. und J. Merz, 2000, Die Rentenreform in der Diskussion – Ein Mikrosimulationsmodell für die Altersvorsorge in Deutschland (AVID-PTO), FFB-Diskussionspapier Nr. 28, Fachbereich Wirt schafts- und Sozialwissenschaften, Universität Lüneburg, Lüneburg. FFB-DP Nr. 28
Merz, J., 2000, The Distribution of Income of Self-employed, Entrepreneurs and Professions as Revealed from Micro Income Tax Statistics in Germany, FFB-Discussion Paper No. 27, Department of Economics and Social Sciences, University of Lüneburg, Lüneburg. FFB-DP Nr. 27
Merz, J., Loest, O. und A. Simon, 1999, Existenzgründung – Wie werde ich selbständig, wie werde ich Freiberufler? Ein Leitfaden, FFB-Diskussionspapier Nr. 26, Fachbereich Wirtschafts- und Sozial-wissenschaften, Universität Lüneburg, Lüneburg. FFB-DP Nr. 26
Merz, J. und D. Kirsten, 1998, Extended Income Inequality and Poverty Dynamics of Labour Market and Valued Household Acitivities – A Ten Years Panelanalysis for Professions, Entrepreneurs and Employees in Germany, FFB-Discussion Paper No. 25, Department of Economics and Social Sciences, University of Lüneburg, Lüneburg. FFB-DP Nr. 25
Merz, J., Quiel, T., und K. Venkatarama, 1998, Wer bezahlt die Steuern? – Eine Untersuchung der Steuerbelastung und der Einkommenssituation für Freie und andere Berufe, FFB-Diskussionspapier Nr. 24, Fachbereich Wirtschafts- und Sozialwissenschaften, Universität Lüneburg, Lüneburg.
FFB-DP Nr. 24
Merz, J. und R. Lang, 1997, Preferred vs. Actual Working Hours – A Ten Paneleconometric Analysis for Professions, Entrepreneurs and Employees in Germany, FFB-Discussion Paper No. 23, Depart ment of Economics and Social Sciences, University of Lüneburg, Lüneburg. FFB-DP Nr. 23
Merz, J., 1997, Privatisierung und Deregulierung und Freie und staatlich gebundene Freie Beru fe – Einige ökonomische Aspekte, FFB-Diskussionspapier Nr. 22, Fachbereich Wirtschafts - und Sozial-wissenschaften, Universität Lüneburg, Lüneburg. FFB-DP Nr. 22
de Kam, C. A., de Haan, J., Giles, C., Manresa, A., Berenguer, E., Calonge, S., Merz, J. and K. Venkatarama, 1996, The Distribution of Effetcive Tax Burdens in Four EU Countries, FFB-Discussion Paper No. 21, Department of Economics and Social Sciences, University of Lüneburg, Lüneburg. FFB-DP Nr. 21
Deneke, J. F. V., 1996, Freie Berufe und Mittelstand – Festrede zur Verleihung der Ehrendoktorwürde, FFB-Diskussionspapier Nr. 20, Fachbereich Wirtschafts- und Sozialwissenschaften, Universität Lüneburg, Lüneburg. FFB-DP Nr. 20
Merz, J., 1996, Die Freien Berufe – Laudatio zur Verleihung der Ehrendoktorwürde des Fachbereiches Wirtschafts - und Sozialwissenschaften der Universität Lüneburg an Prof. J. F. Volrad Deneke, FFB-Diskussionspapier Nr. 19, Fachbereich Wirtschafts- und Sozialwissenschaften, Universität Lüneburg, Lüneburg. FFB-DP Nr. 19
de Kam, C. A., de Haan, J., Giles, C., Manresa, A., Berenguer, E., Calonge, S. and J. Merz, 1996, Who pays the taxes?, FFB-Discussion Paper No. 18, Department of Economics and Social Sciences, University of Lüneburg, Lüneburg. FFB-DP Nr. 18
Merz, J., 1996, Schattenwirtschaft und ihre Bedeutung für den Arbeitsmarkt, FFB-Diskussionspapier Nr. 17, Fachbereich Wirtschafts- und Sozialwissenschaften, Universität Lüneburg, Lüneburg.
FFB-DP Nr. 17

Merz, J. und D. Kirsten, 1995, Freie Berufe im Mikrozensus II – Einkommen und Einkommensverteilung an-hand der ersten Ergebnisse für die neuen und alten Bundesländer 1991, FFB-Diskussionspapier Nr. 16, Fachbereich Wirtschafts- und Sozialwissenschaften, Universität Lüneburg, Lüneburg.
FFB-DP Nr. 16
Merz, J. und D. Kirsten, 1995, Fre ie Berufe im Mikrozensus I – Struktur und quantitative Bedeutung anhand der ersten Ergebnisse für die neuen und alten Bundesländer 1991, FFB-Diskussionspapier Nr. 15, Fachbereich Wirtschafts- und Sozialwissenschaften, Universität Lüneburg, Lüneburg.
FFB-DP Nr. 15
Merz, J., 1995, MICSIM – Concept, Developments and Applications of a PC-Microsimulation Model for Research and Teaching, FFB-Discussion Paper No. 14, Department of Economics and Social Sciences, University of Lüneburg, Lüneburg. FFB-DP Nr. 14
Rönnau, A., 1995, Freie Berufe in der DDR, der Bundesrepublik Deutschland und im wiedervereinten Deutschland: Auswertungen von Berufstätigenerhebung und Arbeitsstättenzählung, FFB-Diskus-sionspapier Nr. 13, Fachbereich Wirtschafts- und Sozialwissenschaften, Universität Lüneburg, Lüneburg. FFB-DP Nr. 13
Burkhauser, R. V., Smeeding, T. M. and J. Merz, 1994, Relative Inequality and Poverty in Germany and the United States Using Alternative Equivalence Scales, FFB-Discussion Paper No. 12, Department of Economics and Social Sciences, University of Lüneburg, Lüneburg. FFB-DP Nr. 12
Widmaier, U., Niggemann, H. and J. Merz, 1994, What makes the Difference between Unsuccessful and Successful Firms in the German Mechanical Engineering Industry? A Microsimulation Approach Using Data from the NIFA-Panel, FFB-Discussion Paper No. 11, Department of Economics and Social Sciences, University of Lüneburg, Lüneburg. FFB-DP Nr. 11
Merz, J., 1994, Microdata Adjustment by the Minimum Information Loss Principle, FFB-Discussion Paper No. 10, Department of Economics and Social Sciences, University of Lüneburg, Lüneburg.
FFB-DP Nr. 10
Merz, J., 1994, Microsimulation – A Survey of Methods and Applications for Analyzing Economic and Social Policy, FFB-Discussion Paper No. 9, Department of Economics and Social Sciences, University of Lüne-burg, Lüneburg. FFB-DP Nr. 9
Merz, J., Garner, T., Smeeding, T. M., Faik, J. and D. Johnson, 1994, Two Scales, One Methodology – Expen-diture Based Equivalence Scales for the United States and Germany, FFB-Discussion Paper No. 8, De-partment of Economics and Social Sciences, University of Lüneburg, Lüneburg.
FFB-DP Nr. 8
Krickhahn, T., 1993, Lobbyismus und Mittelstand: Zur Identifikation der Interessenverbände des Mittelstands in der Bundesrepublik Deutschland, FFB-Diskussionspapier Nr. 7, Fachbereich Wirtschafts - und Sozialwissenschaften, Universität Lüneburg, Lüneburg. FFB-DP Nr. 7
Merz, J., 1993, Market and Non-Market Labor Supply and Recent German Tax Reform Impacts – Behavioral Response in a Combined Dynamic and Static Microsimulation Model, FFB-Discussion Paper No. 6, Department of Economics and Social Sciences, University of Lüneburg, Lüneburg. FFB-DP Nr. 6
Merz, J., 1993, Microsimulation as an Instrument to Evaluate Economic and Social Programmes, FFB-Discussion Paper No. 5, Department of Economics and Social Sciences, University of Lüneburg, Lüneburg. FFB-DP Nr. 5
Merz, J., 1993, Statistik und Freie Berufe im Rahmen einer empirischen Wirtschafts- und Sozialforschung, Antrittsvorlesung im Fachbereich Wirtschafts- und Sozialwissenschaften der Universität Lüneburg, FFB-Diskussionspapier Nr. 4, Fachbereich Wirtschafts- und Sozialwissenschaften, Universität Lüneburg, Lüneburg. FFB-DP Nr. 4
Merz, J. and J. Faik, 1992, Equivalence Scales Based on Revealed Preference Consumption Expenditure Microdata – The Case of West Germany, FFB-Discussion Paper No. 3, Department of Economics and Social Sciences, University of Lüneburg, Lüneburg. FFB-DP Nr. 3
Merz, J., 1992, Time Use Dynamics in Paid Work and Household Activities of Married Women – A Panel Analysis with Household Information and Regional Labour Demand, FFB-Discussion Paper No. 2, Department of Economics and Social Sciences, University of Lüneburg, Lüneburg. FFB-DP Nr. 2

Forschungsinstitut Freie Berufe, 1992, Festliche Einweihung des Forschungsinstituts Freie Berufe am 16. Dezember 1991 im Rathaus zu Lüneburg, FFB-Diskussionspapier Nr. 1, Fachbereich Wirtschafts- und Sozialwissenschaften, Universität Lüneburg, Lüneburg. FFB-DP Nr. 1
6 FFB-Dokumentationen, ISSN 1615-0376
Merz, J. und P. Paic, 2005, Die FFB-Onlineumfrage Freie Berufe – Beschreibung und Hochrechnung, FFB-Dokumentation Nr. 12, Fachbereich Wirtschafts - und Sozialwissenschaften, Universität Lüneburg, Lüneburg. FFB-Dok. Nr. 12
Stolze, H., 2004, Der FFB-Server mit Microsoft Windows Server 2003, FFB-Dokumentation Nr. 11, Fachbereich Wirtschafts- und Sozialwissenschaften, Universität Lüneburg, Lüneburg.
FFB-Dok. Nr. 11
Stolze, H., 2004, Zur Repräsentativität der FFB-Ärzteumfrage – Neue Hochrechnungen für Niedersachsen, Nordrhein und Deutschland, FFB-Dokumentation Nr. 10, Fachbereich Wirtschafts- und Sozialwissenschaften, Universität Lüneburg, Lüneburg. FFB-Dok. Nr. 10
Merz, J., Stolze, H. und S. Imme, 2001, ADJUST FOR WINDOWS – A Program Package to Adjust Microdata by the Minimum Information Loss Principle, Program-Manual, FFB-Documentation No. 9, Department of Economics and Social Sciences, University of Lüneburg, Lüneburg. FFB-Dok. Nr. 9
Merz, J., Fink, F., Plönnigs, F. und T. Seewald, 1999, Forschungsnetz Zeitverwendung – Research Network on Time Use (RNTU), FFB-Documentation Nr. 8, Fachbereich Wirtschafts - und Sozialwissenschaften, Universität Lüneburg, Lüneburg. FFB-Dok. Nr. 8
Merz, J., 1997, Zeitverwendung in Erwerbstätigkeit und Haushaltsproduktion – Dynamische Mikroanaly sen mit Paneldaten, DFG-Endbericht, FFB-Dokumentation Nr. 7, Fachbereich Wirtschafts- und Sozialwissenschaften, Universität Lüneburg, Lüneburg. FFB-Dok. Nr. 7
Merz, J. und F. Plönnigs, 1997, DISTRI/MICSIM – A Softwaretool for Microsimulation Models and Analyses of Distribution, FFB-Documentation No. 6, Department of Economics and Social Sciences, University of Lüneburg, Lüneburg. FFB-Dok. Nr. 6
Merz, J. und R. Lang, 1997, Neue Hochrechnung der Freien Berufe und Selbständigen im Sozio-ökonomischen Panel, FFB-Dokumentation Nr. 5, Fachbereich Wirtschafts - und Sozialwissenschaften, Universität Lüneburg, Lüneburg. FFB-Dok. Nr. 5
Merz, J. und F. Plönnigs, 1995, Forschungsinstitut Freie Berufe – Datenschutz und Datensicherung, FFB-Dokumentation Nr. 4, Fachbereich Wirtschafts- und Sozialwissenschaften, Universität Lüneburg, Lüneburg. FFB-Dok. Nr. 4
Merz, J., Hecker, M., Matusall, V. und H. Wiese, 1994, Forschungsinstitut Freie Berufe – EDV-Handbuch, FFB-Dokumentation Nr. 3, Fachbereich Wirtschafts- und Sozialwissenschaften, Universität Lüneburg, Lüne-burg. FFB-Dok. Nr. 3
Merz, J., 1993, Zeitverwendung in Erwerbstätigkeit und Haushaltsproduktion – Dynamische Mikroanalysen mit Paneldaten, DFG-Zwischenbericht für die erste Phase (1992-1993), FFB-Dokumentation Nr. 2, Fach-bereich Wirtschafts- und Sozialwissenschaften, Universität Lüneburg, Lüneburg.
FFB-Dok. Nr. 2
Merz, J. 1993, ADJUST – Ein Programmpaket zur Hochrechnung von Mikrodaten nach dem Prinzip des minimalen Informationsverlustes, Programm-Handbuch, FFB-Dokumentation Nr. 1, Fachbereich Wirtschafts - und Sozialwissenschaften, Universität Lüneburg, Lüneburg. FFB-Dok. Nr. 1
Available also in English as: Merz, J., 1994, ADJUST – A Program Package to Adjust Microdata by the Minimu m Information Loss
Principle, Program-Manual, FFB-Documentation No. 1e, Department of Economics and Social Sciences, University of Lüneburg, Lüneburg. FFB-Dok. Nr. 1e
7 Sonstige Arbeitsberichte, ISSN 0175-7275
Matusall, V., Kremers, H. und G. Behling, 1992, Umweltdatenbanken – vom Konzept zum Schema, Arbeitsbericht Nr. 112, Universität Lüneburg, Lüneburg. Mikrosimulation in der Steuerpolitik, 279 Seiten, Springer Verlag, ISBN 3-7908-0611-0, Berlin. Preis: € 6,-

Rönnau, A., 1989, Freie Berufe in Niedersachsen – Numerische und wirtschaftliche Entwicklung; Bedeutung als Arbeitgeber, Arbeitsbericht Nr. 60, Universität Lüneburg, Lüneburg. Mikrosimulation in der Steuerpolitik, 279 Seiten, Springer Verlag Berlin, ISBN 3-7908-0611-0, Berlin. Preis: € 6,-
Sahner, H., 1989, Freie Berufe im Wandel, Arbeitsbericht Nr. 59, Universität Lüneburg, Lüneburg. Mikrosimulation in der Steuerpolitik, 279 Seiten, Springer Verlag, ISBN 3-7908-0611-0, Berlin.
Preis: € 6,-
Sahner, H., 1988, Die Interessenverbände in der Bundesrepublik Deutschland – Ein Klassifikationssystem zu ihrer Erfassung, Arbeitsbericht Nr. 41, Universität Lüneburg, Lüneburg. Mikrosimulation in der Steuerpolitik, 279 Seiten, Springer Verlag, ISBN 3-7908-0611-0, Berlin. Preis: € 6,-