Understanding Conflict in Shakespeare's Plays and Chinese ...
Upload
khangminh22Category
view
5download
0
C O R P O R A T I O N
Research Report
ANAMARIE A. WHITAKER, GARRETT BAKER, LUKE J. MATTHEWS, JENNIFER SLOAN MCCOMBS, AND MARK BARRETT
Who Plays, Who Pays?Funding for and Access to Youth Sports
Youth sports are a popular extracurric-ular activity offered by both schools and community organizations. The majority of youths ages 6–18 partici-
pate in some type of organized or unorganized sports activity (Women’s Sports Foundation [WSF], 2018; Aspen Institute, 2017). Research from the Aspen Institute (2017), using 2016 Sports & Fitness Industry Association data, found that the youth sports participation rate in team or individual sports for children ages 6–12 was approximately 72 percent in 2016. However, participation rates vary by fam-ily income, with youths from lower-income
FatCamera/GettyImages
Research Report
families participating at a lower rate than their higher-income peers (Aspen Institute, 2017) and students in schools serving a high per-centage of students in poverty participating at lower levels than students in schools serving a low percentage of students in poverty (WSF, 2018). For example, Pew Research Center (2015) found that 84 percent of school-aged children (ages 6–17) from higher-income families (families making $75,000 or more a year) participated in sports, but only 59 per-cent of children from lower-income families (families making less than $30,000 a year) participated. Variations in participation rates

KEY FINDINGS ■ Parents, school administrators, and community sports program leaders who participated in our survey
perceive great benefits of youth sports participation in the areas of physical health, social and emotional skills, and academics.
■ Youth sports participation rates are relatively high, and perceived demand has grown for youth sports in schools and community-based programs, according to those surveyed.
■ Sports participation gaps exist between youths from lower-income families and middle- and higher-income families. Only 52 percent of parents from lower-income families reported that their student in grade 6–12 participated in sports, compared with 66 percent of middle- and higher-income families. Our finding is consistent with prior research which found a 25 percent sports participation gap between children from families earning less than $30,000 per year and those from families earning $75,000 or more per year (Pew Research Center, 2015).
■ School administrators and community leaders in our survey noted that, in the past five years, most school sports budgets have not increased, despite rising sports fees for both school and community-based sports. This places the burden on families to provide additional financial support. Higher fees are likely more difficult for lower-income families to bear. For lower-income parents (those with a household income of less than $50,000), expense was the second-most-common reason their child did not participate in sports.
2
may be linked to barriers that may disproportion-ately burden low-income families, such as pay-to-play fees, school budgets, family time commitment required, and potential transportation challenges. At the school level, although the majority of U.S. public high schools offer sports (77 percent), schools serving a high percentage of students in poverty are more likely not to offer sports (33 percent, compared with 13 percent of schools serving a low percentage of students in poverty [U.S. Government Accountability Office, 2017; WSF, 2018]). Additionally, schools serving a high percentage of students in poverty offer fewer sports, on average, when compared with schools serving a low percentage of students in poverty (15 sports for the former compared with 19 sports for the latter), thus creating an access gap for lower-income families.
To better understand sports participation rates for middle and high school–aged youths, the funding landscape, barriers and enablers to youth sports participation, and perceptions of the benefits and challenges of youth sports, RAND researchers launched three large-scale surveys of parents, school administrators, and community sports program leaders. Our study also includes a focus on youths from lower-income households. The surveys were
designed to meet two study goals: (1) to understand the current state of participation in, access to, and funding for youth sports in schools and community-based programs and (2) to gain insight on parents’, school administrators’, and community sports program leaders’ perceptions of the impact of youth sports participation on youth development outcomes. In this report, we provide results by topic (sports participation, access and funding, and perceptions about benefits and challenges of sports participation) across the three surveys, and we conclude with practice and policy implications.
What Are Youth Sports? Throughout this report, we define youth sports as an organized, team-based (including youths on a team that compete as individuals in an activity) physical activity that is competitive in nature. For example, youths participating in a school tennis team is considered a sport, whereas friends meeting up after school to play tennis at a local park is not.

3
for school sports. For programs that serve a majority of youths whose families are low income (defined as 51 percent or more of enrolled youths whose families are low income), 94 percent of sports leaders indicated that they serve youths who otherwise might not be able to play sports.
Almost all school administrators we surveyed indicated that their school offers sports programs (91 percent), which aligns with recent research showing that 77 percent of public high schools nationwide, serving 91 percent of students, provided sports programming to students in the 2013–2014 school year (U.S. Government Accountability Office, 2017).2 School administrators indicating that their school offered sports reported that their school offered, on average, ten sports (the results range was 1–33 sports).3 Schools serving a majority of low-income students offered eight sports, on average. When school administrators indicated that their school did not offer sports, the most common reasons were that the school was a specialty school
2 Our sample includes both middle and high school grades and is not nationally representative, which is likely leading to a higher estimate of schools with sports.3 The survey provided a list of 42 sports, including an “other” category.
Sports Participation, Access, and Funding
Results from the parent survey indicated that sports are the most popular extracurricular activity, with 64 percent of parents in the sample reporting that their child participated in sports (see Figure 1). Sports had higher rates of participation than music or arts activities (46 percent) or academic extracurricular activities (30 percent). Our survey results are consistent with research from the Aspen Institute (2017) and Zarrett, Veliz, and Sabo (2018) indicating that most youths are involved in at least one sports team or activity. Participation rates varied based on whether the family was lower income (we defined lower income as having a household income of less than $50,000, which is approximately twice the federal poverty level for a family of four [U.S. Department of Health and Human Services, 2018]) and varied slightly depending on child gender and grade level. Two-thirds of youths from middle- and higher-income families participated in sports, while only 52 percent of their lower-income peers did. Youths access sports through school and community organizations. Parents in our sample reported that their middle and high school–aged youths primarily accessed sports through schools (62 percent of sports), with community and recreational programs being the second-most-common access point (23 percent of sports).1 While parents reported that the majority of sports that youths are playing are through schools, community-based organizations (such as recreational and travel leagues) provide additional opportunities for youths to participate in sports, particularly because roster spaces on school teams may be limited or some schools may not offer a particular sport or any sports at all. This finding is reflected in the community sports leader survey: 83 percent of community sports leaders surveyed reported that they serve youths who otherwise might not have opportunities to play sports, and 64 percent reported that their organization serves as a pipeline
1 In the parent survey, parents were able to respond to some questions about the nature of their child’s sports participation for up to three sports that the child plays. This explains why these percentages are for sports, not number of participants.
Figure 1. Youth Sports Are the Most Popular Extracurricular Activity
NOTES: Authors’ calculations. N = 2,048. Parents were asked the question “Over the past 12 months, how many of the following extracurricular activities has your child participated in?” with sports being one option. Lower income is defined as household income of less than $50,000, while middle and higher income is $50,000 or more. Results are weighted.
Overall
64%
Females
60%
Males
67%
Middle-and higher-
income youths
66%
Lower- incomeyouths
52%

4
To understand whether the demand for sports has changed in schools and community-based organizations, school administrators and community sports leaders were asked to report on whether participation in sports has changed in the past five years. The majority of school administrators and community sports leaders in our surveys perceived that demand for sports has grown or remained consistent in the past five years for both males and females, indicating that sports continue to be a popular extracurricular activity in schools and community-based programs (see Table 1).
Barriers to Sports Participation and Access
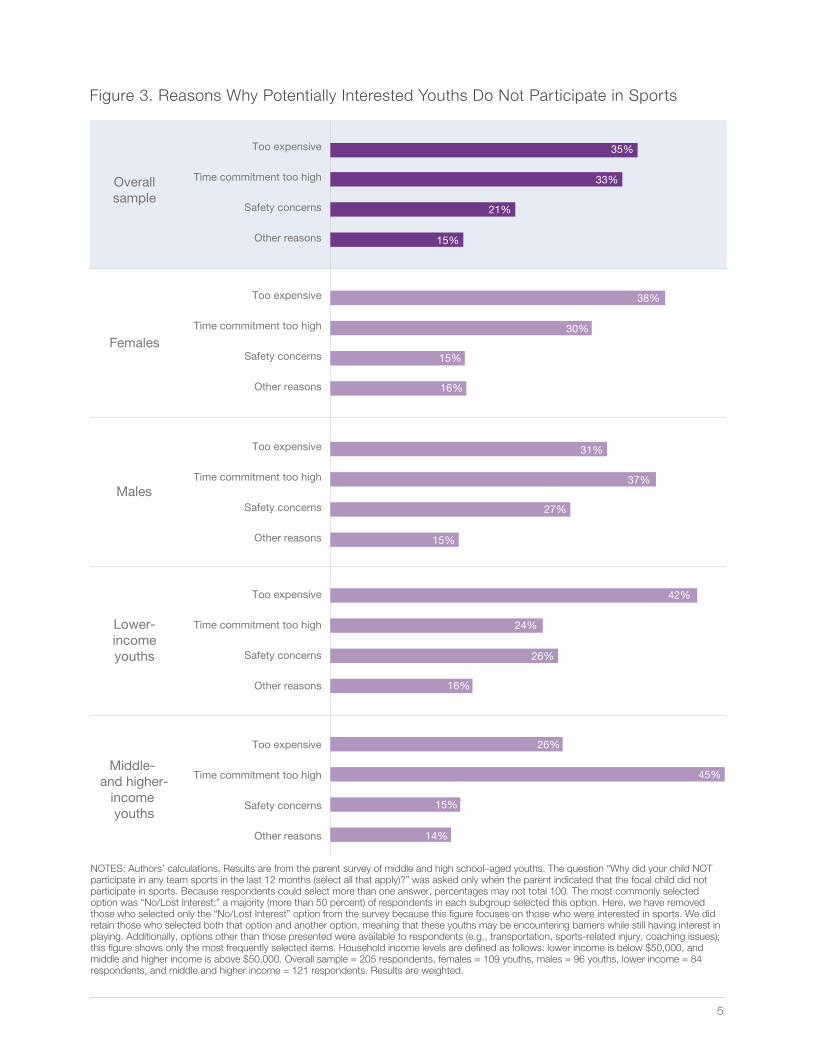
Numerous barriers can prevent youths from playing sports and create challenges for schools and commu-nity organizations offering youth sports teams and leagues. Along with lack of interest, parents in our survey reported the required time commitment and financial reasons (high expense) as the top reasons why youths do not participate in sports. In Figure 3, we provide the most common responses.
Financial reasons were more commonly cited by lower-income families to explain why their child was not participating in sports than by higher-income families (42 percent of lower-income families and
or that sports were offered through a collaborative hosted at another school (see Figure 2). Budgetary issues were the third-most-selected option, although it is possible that collaboratives were formed because of funding issues. This finding indicates that budget concerns are just one factor contributing to why a small number of schools are eliminating sports programs completely.
Figure 2. Reasons Why Public Schools in Our Sample Do Not Offer Sports
Collaborative hostedat another school
offers sports
Competitive sportsteams were eliminated
because of budgetary concerns
NOTES: Most public schools in our sample offered sports. A total of 48 public school administrators indicated that their school did not offer sports. Percentages are taken from the number of respondents (N = 48); respondents could select multiple options. Results are weighted.
School is a specialty school
38%
26%
Other schoolsoffering competitivesports teams are
too far away
11%
Other
15%
23%
Table 1. How Youth Sports Participation Has Changed in the Past Five Years
School Administrator Survey
Community Sports Leader Survey
How Participation Has Changed in the Past Five Years
Female Students
Male Students
Female Youths
Male Youths
Grown 41% 39% 45% 46%
Declined 23% 22% 25% 19%
Stayed the same 36% 39% 30% 35%
NOTES: Authors’ calculations. The N range for the school administrator survey is 531–532. The N range for the community sports leader survey is 169–178. School administrator survey results are weighted. Community sports leader survey results are not weighted. School administrators were asked “How has [GENDER] participation changed since the 2012–2013 school year?” and could select one of the three response options shown in the table. Community sports leaders were asked “How have participa-tion rates in your organization changed over the past 5 years?” for each gender and could select one of the three response options shown in the table.
5
Figure 3. Reasons Why Potentially Interested Youths Do Not Participate in Sports
NOTES: Authors’ calculations. Results are from the parent survey of middle and high school–aged youths. The question “Why did your child NOT participate in any team sports in the last 12 months (select all that apply)?” was asked only when the parent indicated that the focal child did not participate in sports. Because respondents could select more than one answer, percentages may not total 100. The most commonly selected option was “No/Lost Interest;” a majority (more than 50 percent) of respondents in each subgroup selected this option. Here, we have removed those who selected only the “No/Lost Interest” option from the survey because this figure focuses on those who were interested in sports. We did retain those who selected both that option and another option, meaning that these youths may be encountering barriers while still having interest in playing. Additionally, options other than those presented were available to respondents (e.g., transportation, sports-related injury, coaching issues); this figure shows only the most frequently selected items. Household income levels are defined as follows: lower income is below $50,000, and middle and higher income is above $50,000. Overall sample = 205 respondents, females = 109 youths, males = 96 youths, lower income = 84 respondents, and middle and higher income = 121 respondents. Results are weighted.
Other reasons
Safety concerns
Time commitment too high
Too expensive
Middle- and higher-
income youths
Lower-incomeyouths
Males
Females
Overallsample
Other reasons
Safety concerns
Time commitment too high
Too expensive
Other reasons
Safety concerns
Time commitment too high
Too expensive
Other reasons
Safety concerns
Time commitment too high
Too expensive
37%
27%
15%
21%
15%
30%
15%
16%
24%
26%
16%
33%
35%
38%
31%
42%
45%
15%
14%
26%
Other reasons
Safety concerns
Time commitment too high
Too expensive
6
research is needed to disentangle whether parents were reporting the time commitment as a barrier for their child (e.g., interferes with homework or schooling) or for their family (e.g., volunteering as a team coordinator).
School administrators and community sports leaders cited similar barriers when asked. Across the two surveys, the same three barriers emerged as the most prominent reasons for not participating, with a majority of participants agreeing or strongly agreeing that insufficient family resources, such as finances, time, and transportation, are barriers that families face with regard to youth sports participation. The financial costs of providing youth sports were also a common burden identified by schools and com-munity sports programs. The top three challenges identified by both groups of respondents in their respective surveys were availability and cost of equip-ment, gear, and uniforms; staffing; and facilities.
Youth Sports Funding
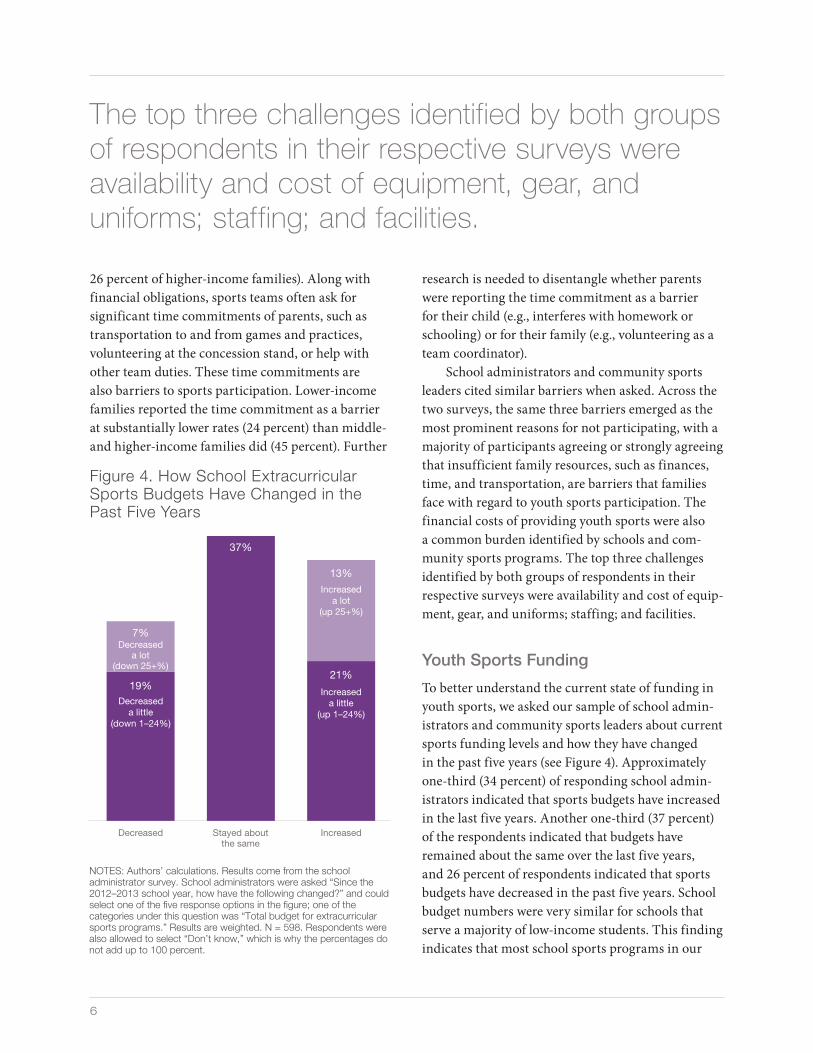
To better understand the current state of funding in youth sports, we asked our sample of school admin-istrators and community sports leaders about current sports funding levels and how they have changed in the past five years (see Figure 4). Approximately one-third (34 percent) of responding school admin-istrators indicated that sports budgets have increased in the last five years. Another one-third (37 percent) of the respondents indicated that budgets have remained about the same over the last five years, and 26 percent of respondents indicated that sports budgets have decreased in the past five years. School budget numbers were very similar for schools that serve a majority of low-income students. This finding indicates that most school sports programs in our
26 percent of higher-income families). Along with financial obligations, sports teams often ask for significant time commitments of parents, such as transportation to and from games and practices, volunteering at the concession stand, or help with other team duties. These time commitments are also barriers to sports participation. Lower-income families reported the time commitment as a barrier at substantially lower rates (24 percent) than middle- and higher-income families did (45 percent). Further
Figure 4. How School Extracurricular Sports Budgets Have Changed in the Past Five Years
NOTES: Authors’ calculations. Results come from the school administrator survey. School administrators were asked “Since the 2012–2013 school year, how have the following changed?” and could select one of the five response options in the figure; one of the categories under this question was “Total budget for extracurricular sports programs.” Results are weighted. N = 598. Respondents were also allowed to select “Don’t know,” which is why the percentages do not add up to 100 percent.
IncreasedStayed aboutthe same
Decreased
Increaseda lot
(up 25+%)
Increaseda little
(up 1–24%)
Decreaseda lot
(down 25+%)
Decreaseda little
(down 1–24%)
7%
19%
37%
13%
21%
The top three challenges identified by both groups of respondents in their respective surveys were availability and cost of equipment, gear, and uniforms; staffing; and facilities.

How Much Do Sports Cost?
NOTE: The percentages of sports survey results are not weighted because weights were designed only for person-level analyses, not sports-level analyses.
63% of the school budgets reported on in our surveys were stagnant or decreasing
Parents reported that most sports had an annual cost (including fees, equipment, and any additional expenses) of $101–$500
of sports had an annual cost of $251–$500
of sports had an annual cost of $101–$250
22% 28%
Parents had time commitments for most sports
of parents participated in fundraising
57%of parents participated in concession stand sales
38% 69%of parents provided some other form of team support (e.g., transportation, snacks)
49% of the sports reported on in the school administrator survey required fees
of sports had a fee range of $50–$100
37%of sports fees have increased since the 2012–2013 school year
56%
58% of the sports community leaders in our sample reported that participation fees had increased in the past five years
7

8
operating budgets. When asked to provide the percentages of funding sources that make up their budget (government support, grants or support from nonprofit organizations or foundations, business support or sponsorship, participation fees or tuition, and other sources), community sports leaders reported, on average, that participation fees and tuition composed 69 percent of the organization’s budget.
Sports fees—the “pay-to-play” fees that are passed on to families—are on the rise, as results from our school administrator and community-based sports leader surveys clearly show. School administrators reported that approximately half of their sports required participation fees from youth or their families. For sports that required fees, 56 percent of those fees have increased in the past five years. Although additional or increased sports fees are a burden for all families, fees may disproportionally affect low-income families and youths.
Perceived Benefits of Youth Sports Participation
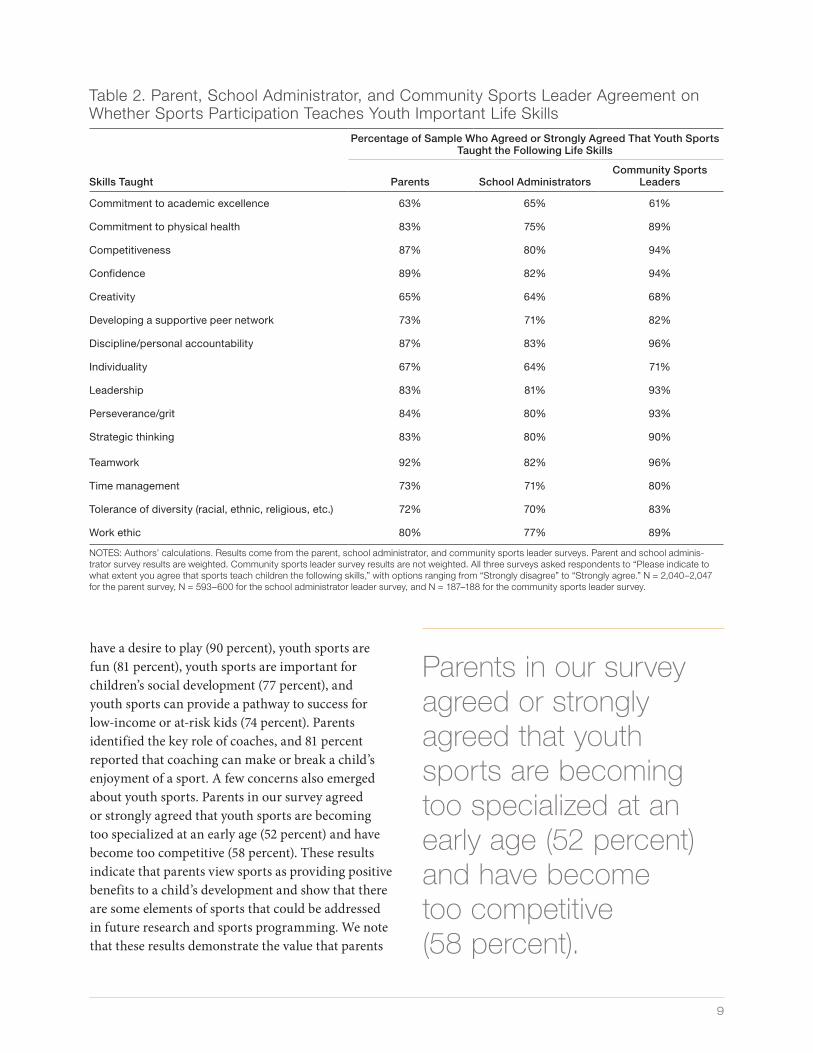
Parents, school administrators, and community sports program leaders perceive great benefits of youth sports participation. Each panel of participants was asked to what extent they agreed that sports participation taught youths life skills, such as leader-ship, teamwork, confidence, perseverance, discipline/personal accountability, and strategic thinking. We present the results in Table 2. Across all skills asked about, a majority of survey participants in each panel agreed or strongly agreed that sports participation taught youths important life skills. Among the five top-rated skills, there were three skills that all three panels of respondents agreed or strongly agreed that youths learn when participating in sports: teamwork, confidence, and discipline/personal accountability.
Apart from the perception of teaching important life skills, we also found that respondents of all three surveys had generally positive opinions about sports. Parents in our sample agreed or strongly agreed with the following statements: All children should have access to youth sports if they
sample are not experiencing funding cuts, which does not support prior research (Up2Us, 2012); how-ever, sports funding for approximately two-thirds of the schools in our sample is not increasing.
In some cases, schools provide all of the funding needed for sports. In other cases, schools attain sup-plemental resources from families and the commu-nity. We asked school administrators whether a sport was funded fully in the school budget—meaning that no supplemental funding was needed. If a sport was not fully funded, administrators were then asked what type of supplemental funding contributed to the sport. When supplemental funding was needed for specific sports, school administrators indicated that most of the additional funding came from student fundraising and participation fees paid by families. Additional supplemental funding sources, such as private donations or sponsorship or nonprofit donations, were not noted as frequently as the other sources. The most commonly cited supplemental funding sources were coming from families; thus, the onus falls on families to provide the additional funding (provision of participation fees and support through fundraising).
Many community sports required participation fees (though scholarships are sometimes offered to low-income students), and participation fees make up more than half of these organizations’
Sports fees—the “pay-to-play” fees that are passed on to families—are on the rise, as results from our school administrator and community-based sports leader surveys clearly show.
9
Parents in our survey agreed or strongly agreed that youth sports are becoming too specialized at an early age (52 percent) and have become too competitive (58 percent).
have a desire to play (90 percent), youth sports are fun (81 percent), youth sports are important for children’s social development (77 percent), and youth sports can provide a pathway to success for low-income or at-risk kids (74 percent). Parents identified the key role of coaches, and 81 percent reported that coaching can make or break a child’s enjoyment of a sport. A few concerns also emerged about youth sports. Parents in our survey agreed or strongly agreed that youth sports are becoming too specialized at an early age (52 percent) and have become too competitive (58 percent). These results indicate that parents view sports as providing positive benefits to a child’s development and show that there are some elements of sports that could be addressed in future research and sports programming. We note that these results demonstrate the value that parents
Table 2. Parent, School Administrator, and Community Sports Leader Agreement on Whether Sports Participation Teaches Youth Important Life Skills
Percentage of Sample Who Agreed or Strongly Agreed That Youth Sports Taught the Following Life Skills
Skills Taught Parents School AdministratorsCommunity Sports
Leaders
Commitment to academic excellence 63% 65% 61%
Commitment to physical health 83% 75% 89%
Competitiveness 87% 80% 94%
Confidence 89% 82% 94%
Creativity 65% 64% 68%
Developing a supportive peer network 73% 71% 82%
Discipline/personal accountability 87% 83% 96%
Individuality 67% 64% 71%
Leadership 83% 81% 93%
Perseverance/grit 84% 80% 93%
Strategic thinking 83% 80% 90%
Teamwork 92% 82% 96%
Time management 73% 71% 80%
Tolerance of diversity (racial, ethnic, religious, etc.) 72% 70% 83%
Work ethic 80% 77% 89%
NOTES: Authors’ calculations. Results come from the parent, school administrator, and community sports leader surveys. Parent and school adminis-trator survey results are weighted. Community sports leader survey results are not weighted. All three surveys asked respondents to “Please indicate to what extent you agree that sports teach children the following skills,” with options ranging from “Strongly disagree” to “Strongly agree.” N = 2,040–2,047 for the parent survey, N = 593–600 for the school administrator leader survey, and N = 187–188 for the community sports leader survey.

10
and increased delinquent behavior, such as alco-hol intake, cigarette and illicit drug use, and other risk-taking behaviors (Agans and Geldhof, 2012; Pate et al., 2000; Eccles and Barber, 1999; Fredricks and Eccles, 2008; Ferris, Oosterhoff, and Metzger, 2013). Additional research is needed to understand more about the relationship between sports and youths’ risky behavior and how programs can be structured to maximize benefits and reduce risk.
Research has also focused on how sports par-ticipation contributes to academic achievement and development. While the results are mixed, we see mostly positive or neutral results. Both correlational and causal research indicates a positive relation-ship between sports participation and some critical academic and labor outcomes, including higher grade point averages, higher high school graduation rates, and greater likelihood of college enrollment (Ferris, Oosterhoff, and Metzger, 2013; Stevenson, 2010; Eccles et al., 2003). For example, Stevenson (2010) used the passing of Title IX in 1972 as a nat-ural experiment to estimate causal effects of sports participation and found that an increase in female sports participation led to an increase in females’ rate of attending college and participating in the labor market. In addition, ongoing research by the WSF indicates that being highly involved in school sports is positively correlated with a range of academic outcomes (WSF, 2018). However, other studies, using both correlational and causal methods, indicate that sports are not related with increased academic achievement (Marsh, 1993; Ransom and Ransom, 2017). Additional rigorous research is needed to bet-ter understand what aspects of sports lead to the best possible youth outcomes, including focusing on how youths from low-income households may uniquely benefit from sports participation.
Practice and Policy Implications
Our survey results point to several potential policy and practice implications, as well as potential future research directions. We find that several perceived and actual barriers to participation exist for middle and high school youths who may be interested in playing sports, particularly around financial costs
and administrators ascribe to sports participation, not proven outcomes of sports participation.
Additionally, we asked school administrators and community sports leaders to rate their perception of wider community support of their school or organization’s sports programs. We found that 68 percent of school administrators and 43 percent of community sports leaders perceived their wider community to strongly or very strongly support their school or organization’s sports programs—meaning that they attended events or provided funding or support to programs.
Sports Participation and Youth Development: What the Research Says and Its Limitations
Sports activities and teams can provide important opportunities for youths to foster lifelong skills, expand their social circles, and develop physical fitness habits that can last into adulthood. Sports participation during adolescence is correlated with youths’ health and well-being, including reduced depression (Zarrett et al., 2009; Zarrett, Veliz, and Sabo, 2018), lower body mass index, and better nutri-tion and eating habits (Croll et al., 2006). Results on sports participation and risky behavior is mixed. For example, participation is linked both with reduced
Sports participation during adolescence is correlated with youths’ health and well-being, including reduced depression, lower body mass index, and better nutrition and eating habits.

11
equipment can be shared. Local governments and city officials can mandate that commu-nity resources, such as parks and sports fields, be shared across community organizations and open to schools that lack facilities. If fees are required to share fields, communities can determine whether the cost is a barrier for certain organizations.
We acknowledge that many schools and commu-nities are under-resourced and are unable to provide additional resources and supports to families. In these cases, it is likely necessary for foundations or external actors to provide funding and resources to ensure that low-income families have access to sports.
To address parental concerns regarding over-specialization and competition, we recommend the following actions:
• Parents, community organizations, and schools can encourage youths (particularly younger youths) to try multiple sports. This recommendation is consistent with the Aspen Institute (2017) recommendation to encour-age sport sampling. Encouraging youths to try multiple sports is not only likely to reduce the chances of overspecialization, but it also allows youths to explore sports that they would not have tried otherwise.
• Organizations offering sports can provide training to coaches on how to create sports environments that help develop youth social and emotional skills, develop health and well-ness (Up2Us, 2016), and promote a positive
and family time commitments, such as volunteer-ing and providing transportation. Lower-income families in our sample were more likely to name financial costs as a reason for not participating than were middle- and higher-income families. Schools and community-based organizations may need to examine how costs currently burdening families—both time based and financial—can be reduced or supplemented with outside sources. We suggest that schools, community sports programs, policymak-ers, and funders work to lower fees, particularly for low-income students. We know that, in many cases, this is already happening, but going further by pro-viding equipment and transportation and minimiz-ing parent time commitments may have the greatest effect on increasing sports participation among youths from lower-income households. Specifically, schools, local governments, philanthropic foun-dations, and other stakeholders can consider the following actions:
• Eliminate fees altogether for lower-income families and for all families when possible, and provide stipends for any necessary personal sports equipment that the school or organization does not supply. Private foundations that financially support youth sports may be willing to provide partial or full stipends for equipment costs.
• Conduct a thorough review of parent time commitments, and eliminate expectations or requirements when possible.
• Establish community collaboratives where field space and, potentially, gear and
We find that several perceived and actual barriers to participation exist for middle and high school youths who may be interested in playing sports, particularly around financial costs and family time commitments, such as volunteering and providing transportation.

12
participating in sports, and the challenges (e.g., time commitments, financial constraints) they experi-ence amidst sports participation. Additionally, more research is needed to fully understand how and why youth sports participation may or may not posi-tively impact youth development, particularly their health and wellness, social and emotional skills, and academic achievement. Specifically, studies can and should aim to identify which programmatic features promote positive youth development. Future research could also examine unique barriers and enablers that low-income families face with sports participation in both school- and community-based settings.
culture within the sports program or team (Agans, Ettekal, and Stack, 2016; See Change, 2012).
Through these recommendations, community and school leaders, along with policymakers and sports practitioners, can encourage youths to participate in multiple sports and activities and emphasize the benefits of playing sports aside from winning, such as promoting health and wellness and developing important skills, including teamwork, confidence, and leadership.
Finally, we believe that more research is needed to better understand youth perceptions about sports, the benefits that youths derive from playing or

Research Questions and Survey DetailsThis study answered the following three research questions associated with the two study goals:
Goal 1: Understand the current state of participa-tion in, access to, and funding for youth sports in schools and community-based programs.
Question 1: What is the current state of funding and anticipated future funding for youth sports? How has school and out-of-school funding for sports changed in the past five years?
Question 2: How do youths access sports? What are the barriers to participation?
Goal 2: Gain insight on parents’, school adminis-trators’, and community sports program leaders’ perceptions of the impact of youth sports partici-pation on youth development outcomes.
Question 3: What are the perceived benefits of sports participation? What are parents’, school administrators’, and community sports program leaders’ beliefs in regard to enablers and chal-lenges of youth sports participation?
The surveys, designed by RAND research-ers, were fielded in collaboration with Qualtrics, a survey firm. Qualtrics administered the survey and provided the sample for parents of middle and high school–age youths (N = 2,048) and administrators of public schools serving middle and high school grades (e.g., principals, vice principals, provosts; N = 603).1 School administrators were asked to answer detailed questions for up to six sports that their school offered. Parents and school administrators were drawn from existing panels maintained by Qualtrics. These are large panels of parents and school adminis-trators willing to take online surveys, but they do not constitute probabilistic samples. In the parent survey, one child in the specified grade range (grades 6–12)
was randomly selected for the participant to answer questions about throughout the survey. Parents could also answer questions for up to three sports in which the selected child participated. In the parent survey, we defined lower income as a household income of less than $50,000. This cut point includes the lowest two income categories in our survey, and approxi-mately one-third of the sample (31 percent) is consid-ered lower income based on this definition.
The community sports leader survey participants (N = 188) were recruited from public web searches conducted by RAND researchers and staff. Email addresses of community sports leaders (e.g., executive directors, program managers, league administrators, volunteers, coaches, instructors) at city and parks departments, local nonprofits (e.g., YMCAs, Boys and Girls Clubs), and specialized or competitive sports leagues or teams were collected, and leaders were invited to participate in the survey. Community sports leaders could answer questions for up to four sports that their organization offered. Detailed descriptions of the survey samples and methods are provided in the online appendix (available for download at www.rand.org/t/RR2581).
The survey samples are not nationally repre-sentative. The panels included people with internet access (the survey was online only) who had agreed to participate in research studies. Additionally, par-ent and school administrator panel participants were asked to participate for individual surveys, so non-response to the surveys could have introduced bias that we cannot adjust for in our analyses. However, in order to make the parent and school administrator results as representative as possible to the populations of interest, we generated weights for the data based on publicly available information for the national populations targeted by the parent and the school administrator surveys.2 Even with the weights, our results may not be fully generalizable.
1 In this report, we focus only on public school administrators. The online appendix (available for download at www.rand.org/t/RR2581) contains results for our full sample of school administrators (N = 821), which includes private school administrators (N = 218).2 Results from the parent and school administrator survey are weighted. Weighted results, in most cases, are very similar (usually within two percentage points) to the unweighted results. Note that we weighted only the percentages for which the number of respondents was the denominator, not those for which the number of sports was the denominator. This is because the weights were designed only for person-level analyses, not sports-level analyses.
13

14
ReferencesAgans, Jennifer P., Andrea Vest Ettekal, and Caroline Stack, “PCA Impact Comparison Study: Report of Findings,” Positive Coaching Alliance, September 2016. As of November 13, 2018: http://positivecoach.org/media/276708/pca_impactcomparisonstudy_final091316.pdf
Agans, Jennifer P., and G. John Geldhof, “Trajectories of Participation in Athletics and Positive Youth Development: The Influence of Sport Type,” Applied Developmental Science, Vol. 16, No. 3, 2012, pp. 151–165.
Aspen Institute, Project Play, State of Play 2017: Trends and Developments, 2017. As of November 13, 2018: https://assets.aspeninstitute.org/content/uploads/2017/12/FINAL-SOP2017-report.pdf
Croll, Jillian K., Dianne Neumark-Sztainer, Mary Story, Melanie Wall, Cheryl Perry, and Lisa Harnack, “Adolescents Involved in Weight-Related and Power Team Sports Have Better Eating Patterns and Nutrient Intakes Than Non–Sport-Involved Adolescents,” Journal of the American Dietetic Association, Vol. 106, No. 5, 2006, pp. 709–717.
Eccles, Jacquelynne S., and Bonnie L. Barber, “Student Council, Volunteering, Basketball, or Marching Band: What Kind of Extracurricular Involvement Matters?” Journal of Adolescent Research, Vol. 14, No. 1, 1999, pp. 10–43.
Eccles, Jacquelynne S., Bonnie L. Barber, Margaret Stone, and James Hunt, “Extracurricular Activities and Adolescent Development,” Journal of Social Issues, Vol. 59, No. 4, 2003, pp. 865–889.
Ferris, Kaitlyn A., Benjamin Oosterhoff, and Aaron Metzger, “Organized Activity Involvement Among Rural Youth: Gender Differences in Associations Between Activity Type and Developmental Outcomes,” Journal of Research in Rural Education, Vol. 28, No. 15, 2013, pp. 1–16.
Fredricks, Jennifer A., and Jacquelynne S. Eccles, “Participation in Extracurricular Activities in the Middle School Years: Are There Developmental Benefits for African American and European American Youth?” Journal of Youth and Adolescence, Vol. 37, No. 9, October 2008, pp. 1029–1043.
Marsh, Herbert W., “The Effects of Participation in Sport During the Last Two Years of High School,” Sociology of Sport Journal, Vol. 10, No. 1, March 1993, pp. 18–43.
Pate, Russell R., Stewart G. Trost, Sarah Levin, and Marsha Dowda, “Sports Participation and Health-Related Behaviors Among US Youth,” Archives of Pediatrics & Adolescent Medicine, Vol. 154, No. 9, September 2000, pp. 904–911.
Pew Research Center, Parenting in America: Outlook, Worries, Aspirations Are Strongly Linked to Financial Situation, Washington, D.C., 2015. As of November 13, 2018: http://assets.pewresearch.org/wp-content/uploads/sites/3/2015/12/2015-12-17_parenting-in-america_FINAL.pdf
Ransom, Michael R., and Tyler Ransom, “Do High School Sports Build or Reveal Character?” IZA Discussion Paper No. 11110, 2017.
See Change, “Triple-Impact Competitors: Survey Analysis of Middle School Youth in the Dallas Independent School District,” March 2012. As of November 13, 2018: https://www.positivecoach.org/media/1331/ pca-dallas-detailed-survey-findings_march-2012.pdf
Stevenson, Betsey, “Beyond the Classroom: Using Title IX to Measure the Return to High School Sports,” The Review of Economics and Statistics, Vol. 92, No. 2, May 2010, pp. 284–301.
U.S. Department of Health and Human Services, “Poverty Guidelines,” 2018. As of November 13, 2018: https://aspe.hhs.gov/poverty-guidelines
Up2Us, Going Going Gone: The Decline of Youth Sports, 2012.
Up2Us, Coaching for Impact: An Evaluation of Up2Us Sports Conducted by the Louisiana Public Health Institute, 2016. As of November 13, 2018: https://s3-us-west-2.amazonaws.com/up2us/uploads/center_resource/document/642/Coaching_For_Impact2016.pdf
U.S. Government Accountability Office, “K-12 Education: High School Sports Access and Participation,” 2017. As of November 13, 2018: https://www.gao.gov/assets/690/687164.pdf
Women's Sports Foundation, The State of High School Sports in America: An Evaluation of the Nation's Most Popular Extracurricular Activity, New York, 2018.
WSF—See Women’s Sports Foundation.
Zarrett, Nicole, Kristen Fay, Yibing Li, Jennifer Carrano, Erin Phelps, and Richard M. Lerner, “More Than Child’s Play: Variable- and Pattern-Centered Approaches for Examining Effects of Sports Participation on Youth Development,” Developmental Psychology, Vol. 45, No. 2, 2009, pp. 368–382.
Zarrett, Nicole, Philip Veliz, and Don Sabo, “Teen Sport in America: Why Participation Matters,” East Meadows, N.Y.: Women’s Sports Foundation, 2018. As of November 13, 2018: https://www.womenssportsfoundation.org/research/ article-and-report/recent-research/teen-sport-in-america/

RR-2581-DSGF
The RAND Corporation is a research
organization that develops solutions
to public policy challenges to help
make communities throughout
the world safer and more secure,
healthier and more prosperous.
RAND is nonprofit, nonpartisan, and
committed to the public interest.
RAND’s publications do not
necessarily reflect the opinions of
its research clients and sponsors.
is a registered trademark.
Limited Print and Electronic
Distribution Rights
This document and trademark(s)
contained herein are protected
by law. This representation of
RAND intellectual property is
provided for noncommercial use
only. Unauthorized posting of this
publication online is prohibited.
Permission is given to duplicate this
document for personal use only, as
long as it is unaltered and complete.
Permission is required from RAND
to reproduce, or reuse in another
form, any of our research documents
for commercial use. For information
on reprint and linking permissions,
please visit www.rand.org/pubs/
permissions.
For more information on this
publication, visit
www.rand.org/t/RR2581.
© Copyright 2019 RAND Corporation
About This ReportRAND researchers, in collaboration with the Dick’s Sporting Goods Foundation, developed and launched three large-scale online surveys of parents of middle and high school–age youths (grades 6–12); school administrators serv-ing middle and/or high school grades; and community sports leaders from city and park leagues, nonprofits, or specialized or travel leagues or teams. Surveys include diverse populations but are not nationally representative; therefore, the results may not be generalizable to the whole population.
The report should be of interest to youth sports policy leaders and decision-makers, youth sports and extracurricular program leaders, school administra-tors, researchers, funders, and the general public. The authors are grateful to Laura Reiser, Ryan Eckel, and Elizabeth Baran at the Dick’s Sporting Goods Foundation; Krista Kokjohn-Poehler at GOOD Inc.; and two peer reviewers for their thoughtful feedback. Additionally, the authors thank Katie Sieck, Maria DeYoreo, and Fatih Unlu at the RAND Corporation for invaluable insight and consultation on the research study.
This study was undertaken by RAND Education and Labor, a division of the RAND Corporation that conducts research on early childhood through postsec-ondary education programs, workforce development, and programs and policies affecting workers, entrepreneurship, and financial literacy and decisionmaking. This research was commissioned and funded by the Dick’s Sporting Goods Foundation.
More information about RAND can be found at www.rand.org. Questions about this report should be directed to [email protected], and questions about RAND Education and Labor should be directed to [email protected]. www.rand.org
C O R P O R A T I O N
Copyright © 2022 FDOKUMEN