Abolition of Irregular Marriage: Who worried, who spoke, who was heard?

EQUITAP Project: Working Paper #1
Who pays for health care in Asia? Owen O’Donnell University of Macedonia, Greece Eddy van Doorslaer Erasmus University, the Netherlands Ravi P. Rannan-Eliya Institute for Health Policy, Sri Lanka Aparnaa Somanathan Institute for Health Policy, Sri Lanka Shiva Raj Adhikari Nepal Health Economics Association, Nepal Baktygul Akkazieva WHO Health Policy Analysis Project, Kyrgyz Republic Deni Harbianto Gadjah Mada University, Indonesia Charu C. Garg Institute for Human Development, India Piya Hanvoravongchai International Health Policy Programme, Thailand Alejandro N. Herrin University of the Philippines, The Philippines Mohammed N. Huq Data International Ltd., Bangladesh Shamsia Ibragimova National Statistical Committee, Kyrgyz Republic Anup Karan Institute for Human Development, India Soon-man Kwon Seoul National University, South Korea Gabriel M. Leung University of Hong Kong, Hong Kong SAR Jui-fen Rachel Lu Chang Gung University, Taiwan Yasushi Ohkusa Osaka University, Japan Badri Raj Pande Nepal Health Economics Association, Nepal Rachel Racelis University of the Philippines, The Philippines Keith Tin University of Hong Kong, Hong Kong SAR Kanjana Tisayaticom International Health Policy Programme, Thailand Laksono Trisnantoro Gadjah Mada University, Indonesia Quan Wan National Health Economics Institute, China Bong-Min Yang Seoul National University, South Korea Yuxin Zhao National Health Economics Institute, China
April 2005 Acknowledgements: The European Commission, INCO-DEV programme (ICA4-CT-2001-10015), funds the EQUITAP project from which this paper derives. Analysis for Taiwan funded by Taiwan Department of Health (DOH91-PL-1001 and DOH92-PL-1001) and for Hong Kong by the Health, Welfare and Food Bureau, Government of the Hong Kong Special Administrative Region. Correspondence: Owen O’Donnell, Department of Balkan, Slavic and Oriental Studies, University of Macedonia, 156 Egnatia Street, Thessaloniki 54006, Greece. Tel.: 0030 2310 891478. Fax: 0030 2310 891436. email: [email protected]
1

Abstract
We describe the structure and the distribution of health care financing in 13 territories that account for 55% of the Asian population. Survey data on household payments are combined with Health Accounts data on aggregate expenditures by source to estimate distributions of total health financing. In all territories, high-income households contribute more than low-income households to the financing of health care. In general, the better off contribute more as a proportion of ability to pay in low and lower-middle income territories. The disproportionality is in the opposite direction in three high/middle income territories operating universal social insurance. Direct taxation is the most progressive source of finance and is most progressive in poorer economies with a narrow tax base. The distribution of out-of-pocket (OOP) payments also depends on the level of development. In high-income economies with widespread insurance coverage, OOP payments absorb a larger fraction of the resources of low-income households. In poor economies, it is the better off that spend relatively more OOP. This contradicts much of the literature and suggests the poor simply cannot afford to pay for health care in low-income economies. Among the high-income territories, Hong Kong is the one example of progressive financing arising from reliance on taxation, as opposed to social insurance, and an ability to shield those on low-incomes from OOP payments. Thailand has a similar financing structure and achieves a similar distributional outcome. The equity implications of a given distribution of financing depend on the extent to which the financing structure ties health care use to payments.
Keywords: health care financing, progressivity, equity, Asia JEL classification: D31, D63, H22, H23, I10
2

1. Introduction
Health care financing in Asia faces a variety of challenges. In low-income countries, the chief concern is
for the sufficiency of spending on health care and the identification of financing mechanisms that can
mobilise resources within severe economic and political constraints. In middle-income countries, attention
is focussed on shifting the balance of health care financing from direct to pre-payment. South Korea and
Taiwan have established universal social health insurance, while the process is on-going in the Philippines
and Thailand. In contrast, many pre-payment schemes have collapsed in China, resulting in heavy reliance
on out-of-pocket payments. Understanding and responding to these challenges requires good evidence on
how health care financing operates. Not least, from perspectives of justice, economics and politics, it is
important to know who pays for health care. The distribution of the financing burden is a major
consideration in appraising the fairness of the status quo and in assessing the equity consequences of
reforms. The impact of the health care system on the economy is determined not only by its size but also
the way in which it is financed. A heavy burden on workers weakens incentives to work. A heavy burden
on the poor, besides directly worsening poverty, may squeeze out investment in other forms of human
capital, with long-term consequences for growth. A steeply increasing burden with income may weaken
economic incentives and slow growth. The balance of political support for existing health care financing
arrangements, and hence the political feasibility of reforms, is dependent upon how the burden of financing
falls across the population.
To a large extent, the distribution of the economic burden of health care is determined by the
structure of financing: the split between direct payment and pre-payment and the relative contributions of
taxation, social insurance and private insurance to the latter. The balance between direct payment and pre-
payment determines the extent to which actual or potential users pay for health care. Direct payments are
charged in relation to actual costs, while private insurance premiums are related to (pooled) expected costs.
Taxation and social insurance break the link between use of health care, realised or expected, and financial
liability. Instead, liability can be made a function of ability to pay. Taxation addresses the bill for health
care to the taxpayer and, indirectly, it is mostly workers and consumers that pick up this bill. Social
insurance places the main burden on workers. Private insurance accumulates funds from those that choose
to insure against the cost of future illness.
Moving beyond the description of health care financing by source to a household level analysis
allows many more interesting questions to be addressed. Is it the rich, the middle income or the poor
workers and consumers that bear most of the burden of taxation and social insurance? Do these payments
rise in proportion or more than proportionately with income? Are public contributions more closely related
to ability to pay than private payments? Or, do positive income effects in the demand for health care and
insurance mean that, by default rather than by design, private payments are very closely related to ability to
3

pay? Do direct payments place a disproportionate burden on the poor as a result of their greater propensity
to sickness? Or, are the poor simply too poor to pay for health care? Or, do fee waivers and informal
arrangements shield the poor from out-of-pocket payments?
This paper presents the first comprehensive and consistent analysis of the structure and the
distribution of health care financing in thirteen territories that account for 55% of the total population of
Asia (33% of world population). The territories span the whole range of development, from Japan to Nepal
(see Table 1). This diversity makes it possible to explore links between economic development, the
structure of health financing and the distribution of payments. Not only does the structure of health
financing vary with development, so too does the distributional burden of any given source. Examination of
a heterogeneous group of territories gives some insight into how health financing systems and their
distributional consequences might be expected to evolve. This evolution is readily apparent in Asia, parts
of which have experienced rapid economic development with immediate consequences for health
financing.
We describe payments for health care both in the aggregate - by source - and at the household
level, in relation to ability to pay. To do this, we use both macro and micro data. The macro data are
mostly from National Health Accounts (NHA) estimates. Micro data are from household expenditure
or socio-economic surveys. To describe the distribution of total health payments in relation to ability to
pay, we combine the micro and macro data. The micro data give the distribution of each of the main
sources of finance. The macro data give the weight attached to each distribution when aggregating to
obtain the distribution of total payments.
The paper is structured as follows. The next section summarises the structure of health care
financing in each territory. Micro data and methods are discussed in section 3. Results for each of the
main sources of financing and in the aggregate are presented in section 4. In section 5, we summarise
the results and consider the interpretations that can be placed on them.
Table 1: Development indicators, 2000
2. Health care financing mix in Asia
In Table 2, we give the percentage of total expenditure on health (TEH) from each of the main sources of
finance. With the exceptions of Nepal and Indonesia, these figures are derived from formal and official
health accounts estimates. For Nepal, we use an independent study of health financing (Hotchkiss, Rous et
al. 1998), and in the case of Indonesia, we rely on preliminary health accounts estimates produced by its
Ministry of Health together with figures from the Public Health Expenditure Review. National health
4

accounts are not currently available for all of India, and our analysis is restricted to one of the states –
Punjab – where some estimates are available.
Private insurance plays a relatively minor role in most of the health systems considered. It
contributes a non-negligible share of TEH only in Hong Kong, Indonesia, the Philippines, Taiwan and
Thailand. Even in these cases the percentage is 10% or less. Consequently, the main distinguishing factor
in these health financing systems is the balance between public pre-payment and private out-of-pocket
(OOP) payment. The latter accounts for at least 30% of TEH in all territories except Japan. As is clear from
Figure 1, these Asian territories conform to the stylised fact that reliance on OOP payments declines with
the level of development (Musgrove and Zeramdini 2001). The poorest country, Nepal, obtains three-
quarters of its funding for health care from OOP payments, while the richest country, Japan obtains only
12% from this source. But the wealth of a country is not the only determinant of the extent to which health
care is financed from direct payments. At similar levels of income, the OOP share in China is greater than
that in Sri Lanka. The relative contribution from OOP is similar in Thailand and Taiwan, even though
Thailand is much less wealthy. South Korea relies on direct payments to the same extent as Sri Lanka but
has an income closer to that of Taiwan.
Table 2: Health care financing mix in Asia
Nepal, Bangladesh, Kyrgyz, Punjab and Sri Lanka are all very close to the 450 line in the health
financing triangle (Figure 2), indicating that health care is financed almost exclusively from OOP and
general government revenues (GGR). Nepal and Bangladesh rely more heavily on OOP, while the burden
is close to being evenly split in Kyrgyz, Punjab and Sri Lanka. Territories that lie below the 450 line make
some use of insurance, social and/or private. The distance from any point to the 450 line gives the share
contributed by insurance. The relative contributions from insurance are modest in Indonesia, the
Philippines, Hong Kong and Thailand but more substantial in China, Korea, Taiwan and Japan. Hong Kong
and Thailand are similar in relying most heavily on GGR followed by OOP, with the remainder made up
from private insurance in Hong Kong and both private and social insurance in Thailand. The high/middle-
income territories – Japan, Taiwan and South Korea - lying furthest below the 450 line have significant
social insurance systems. Hong Kong, the only other high-income territory, also relies predominantly on
publicly-financed pre-payment, but does this through taxation rather than social insurance. Japan and
Taiwan collect more than half of health system funding from social insurance, while high co-payments in
Korea mean that it still collects half of all financing from direct payments. The remainder of financing in
China come from social insurance (16.5%) and community financing arrangements (8.2%).
FIGURES 1 & 2
5

3. Data and methods
3.1 Sample surveys
To estimate the distribution of each type of health payment in relation to ability to pay (ATP), we use data
from the latest available household income and expenditure survey or a general socioeconomic survey (see
Appendix Table A1). For Japan, the 1998 Comprehensive Survey of Living Conditions (CSLC) is used to
estimate all distributions except that of OOP payments, which is obtained from a specially commissioned
survey of health care. Unfortunately the latter is not nationally representative, covering only a few
prefectures and was conducted in a different year (2002) from the CSLC. Most of the distributions for the
Philippines are estimated from the 1999 Poverty Indicator Survey. Since this contains no data on private or
social insurance premiums, the respective distributions are estimated from the 1994 Family Income and
Expenditure Survey.
3.2 Ability to pay
Many of the economies included in our study are characterised by a lack of formal labour markets,
substantial household-based production and high variability in the stream of household income. We adopt
the value of household consumption as the preferred measure of ability to pay (ATP) for low- and middle-
income countries, where household production makes a substantial contribution to living standards (Deaton
and Grosh 2000). The data are sufficiently rich to compute this measure, with the exception that a use value
of durable goods and a rental value of housing cannot be estimated in all cases (see Table A2). For the
richer territories, ATP is measured by household expenditure on market traded goods and services (Table
A2). The one exception is Japan, where the only available measure is income.
The unit of analysis is the household. Adjustment is made for the size and age structure of the
household through application of an equivalence scale to both ATP and each component of health
payments. The scale used is , where ( 0.750.5i i ie A K= + ) iA is the number of adults in the household and iK
the number of children (0-14 years).1
There are, of course, other proxies for ability to pay. Some have used non-food expenditure on the
basis that resources available after meeting basic food needs provide the best proxy of capacity to pay for
health care (World Health Organisation 2000). With respect to equity considerations, whether one examines
the ratio of health payments to total expenditure or to a sub-total depends upon the nature of one’s
distributional concern. Is it with inequality in all consumption or with inequality in non-food consumption?
We prefer to use total consumption for the following reasons. First, while expenditure on food might be
less discretionary than on many other items, it is nonetheless discretionary. Its income elasticity is less than
one but above zero. One could attempt to estimate the food needs of each household and subtract this from
total expenditure. Besides the difficulty of this exercise, there is the problem of what to do about
6

households apparently consuming less than their estimated needs. The analysis becomes less transparent
and results less easily interpretable. In any case, we are adjusting for variation in food, and other, needs
through application of the equivalence scale. Second, due to indirect taxation, expenditures on food imply
payments toward health care. In placing a normative interpretation on variation in the ratio of health
payments to ATP, it seems inconsistent to include an item in the numerator but not the denominator. Third,
one reason -- possibly the reason -- for examining proportionality in the relationship between health
payments and ATP is to infer the redistributive effect of such payments. To make such inferences, health
payments must be compared with a benchmark distribution of ATP that indicates the distribution of welfare
prior to the effect of the payments. Due to indirect taxation, food expenditures are responsive to the system
of finance. Subtracting food from total expenditure does not give a benchmark ATP distribution.
Admittedly, the same argument applies, with less force, to the use of total expenditure as a proxy for ATP.
The system of health financing, for example the extent of insurance, may affect saving, and even labour
supply, decisions. Finally, our purpose is not only to assess “fairness” in the distribution of health financing
but also to provide a description of the distribution, in relation to living standards, that is useful in a wide
range of economic and political analyses of the health sector.
3.3 Health payments
We are interested in the distribution of the economic burden of providing health care and not simply with
who hands over what money to whom. Consequently, we must make assumptions about the incidence of
non-voluntary payments. We assume the incidence of direct personal taxes is on the legal taxpayer, that of
consumption taxes is on the consumer and that both employer and employee social and private insurance
contributions are, in effect, paid for by the employee.
For some sources of finance, actual payments are reported in the survey data. This is typically the
case for OOP payments and it is sometimes true for income taxes, social insurance contributions and
private insurance premiums. Other payments are not directly reported and must be estimated from some
related variable reported in the survey. For example, payments of sales and excise taxes must be
estimated by applying product specific tax rates to the respective expenditures reported in the survey.
Likewise, tax schedules are applied to data on the respective reported incomes. Social insurance
contribution rates and rules are applied to reported earnings. Methods of measuring each source of
health payments from the survey data are described in the Appendix, Table A3.
Survey data on OOP payments are potentially subject to both recall bias and small sample bias due
to the infrequency with which some health care payments are made. Survey estimates of aggregate
payments tend to show discrepancies from production-side estimates, where the latter are available.
Whether estimates of the distribution, as opposed to the level, of OOP payments are biased depends upon
whether reporting of OOP payments is related systematically to ATP. Under the assumption, possibly
7

strong, of no systematic misreporting, survey data can be used to retrieve the distribution of payments and
mis-measurement of the aggregate level can be dealt with through application of a macro-weight that gives
the best indication of the relative contribution of OOP to total revenues.
Where payments are made on an individual basis, we aggregate across all household members to
get the household contribution and the equivalence scale is applied to this amount. In the case of OOP
payments, we aggregate across payments for different health services and estimate the distribution of the
aggregate. Payments for different services are often reported for different recall periods. We adopt the
recall period that applies for those payments accounting for the greatest share of the aggregate and scale the
others accordingly.
3.4 Summary indices of distribution
We describe the distribution of health care financing in relation to ATP. Two questions are examined: who
pays most absolutely and who pays most as a proportion of ATP? Since we examine distributions for a
number of payment sources across many territories, it is convenient to rely on summary indices of
distributions. The concentration index ( C ) is an index of the distribution of payments (Wagstaff and Van
Doorslaer 1992). It is restricted to the range (-1, 1). A negative (positive) value indicates that the poor (rich)
contribute a larger share than the rich (poor). A value of zero indicates that everyone pays the same,
irrespective of ATP. The Kakwani index ( K ), the difference between the concentration index and the Gini
coefficient of inequality, is used a summary measure of proportionality (Kakwani 1977). The value of K
ranges from –2 to 1. A negative number indicates that payments fall as a proportion of ATP as the latter
increases. A positive number indicates that the share of payments made by the rich is greater than their
share of total ATP. In the case of proportionality, the index is zero.
The indices are computed from convenient regressions of a transformation of the payments variable
on the fractional rank in the ATP distribution (Jenkins 1988). Sample weights are applied where they exist
(Lerman and Yitzhaki 1989). Standard errors for the indices, with a Newey-West correction for serial
correlation induced by the rank nature of the independent variable and heteroskedasticity, are obtained
directly from the convenient regressions (World Bank 2003).
3.5 Measuring the distribution of total health care financing
The additive separability of concentration and Kakwani indices means that an index of the distribution of
total health payments can be computed as a weighted average of the source-specific indices. Weights are
equal to the proportion of total payments accounted for by each source. For example,
8

1
J
j jj
K Kω=
=∑
where jK is the Kakwani index for finance source j and the weight jω is the proportion of total
expenditure on health care contributed by that source. In addition to being of computational convenience,
this allows decomposition of the distribution of total financing into the distribution of the different sources
of finance, on the one hand, and the financing mix, on the other. A further advantage is that, through the
choice of weights, correction can be made for the incomplete coverage of all sources of health financing in
the survey data and for biases in the survey estimates of aggregate payments. We use survey data to
estimate the indices and compute weights from NHA estimates of the financing mix.
Assumptions must be made about distributions of financing sources that cannot be estimated
from the survey data. It is assumed missing direct taxes are distributed as a weighted average of the
direct taxes for which distributions can be estimated. Likewise for indirect taxes. Where there is no
data on private insurance premiums, it is assumed these are distributed as OOP payments on the basis
that the latter is a proxy for the demand for private insurance. Non-tax government revenues are
assumed to be distributed as a weighted average of all other payments. That is, they are ventilated
(Wagstaff, van Doorslaer et al. 1999). We consider the distribution of financing across the domestic
population only and so exclude foreign aid completely from the analysis. As a result of these
adjustments, the weights do not correspond exactly to the financing mix.
4. Results
4.1 General Government Revenues
Governments tend to make substantial contributions to the financing of health care. In the Asian territories
examined here, the percentage of health expenditure financed from general government revenues (GGR)
ranges from over 50% in Thailand and Hong Kong to just less than 10% in Taiwan (Table 2). Government
revenues come from tax and non-tax sources. Taxes are direct – levied on earnings, income or wealth – and
indirect – levied on consumption. Non-tax revenues are from borrowing, foreign aid, fees/profit of public
enterprises and the exploitation of natural resources. The composition of GGR varies systematically with
national income. The poorest territories (Nepal, Kyrgyz, Bangladesh and Punjab), with narrow tax bases,
make little use of direct taxes, while this is the predominant source of revenue in the richest territories
(Hong Kong, Taiwan and South Korea) (Table 3). Direct taxes are mostly personal income tax and
corporation tax (Table 3).
The share of GGR contributed by indirect taxes is substantial and more consistent across the
territories (Table 3). China, Sri Lanka and Bangladesh rely particularly heavily on this source. General
sales / VAT taxes, together with excises, account for the greatest share of indirect tax revenue in all cases
9

except Hong Kong, where there is extensive use of commodity specific taxes and Stamp Duty (Table 3).
Import duties make a significant contribution, particularly in Bangladesh, Sri Lanka and Nepal.
Reliance on non-tax revenue is inversely related to the level of development. For the poorest
countries, non-tax revenue is mainly revenue from foreign aid and government borrowing. The Indian state
of Punjab raises 44.5% of general government revenues from borrowing and foreign aid (Table 3). For
Nepal and Bangladesh the respective percentages are 37% and 25%. Indonesia receives substantial revenue
from oil and wood resources, Punjab draws on the profits of public enterprises and Hong Kong collects a
significant share of revenue from fees for (non-health) public services (Table 3).
Who pays for these government revenues? Is it the rich or the poor? To address this, we use survey
data to examine the relationship between contributions made by households to government revenues and
their ability to pay. Not all sources of government revenue can be traced to households. Most obviously,
domestic households do not pay for foreign aid and the current generation pays for borrowing only to the
extent that taxes and other revenues are set to pay the interest and repay part of the capital. The
distributions of some taxes, for example corporation and capital gains, are difficult to estimate from the
data available. The same is true for the profits of public enterprises and revenue from the exploitation of
natural resources. In this sub-section, we describe the distributions of those sources of government revenue
that can be estimated from the survey data. These distributions are weighted to reflect the incidence of
revenues for which distributions cannot be estimated when we later estimate the distribution of total health
payments.
As is illustrated in Figures 3a and 3b, the burden of direct taxes is heavily concentrated on the
better-off, both in absolute terms and relative to ability to pay. In Bangladesh, Sri Lanka and Thailand, the
poorest 20% of households make virtually no contribution to direct taxes and the richest fifth contribute
more than 90% of revenues. The distribution is only slightly less uneven in the Philippines and in Hong
Kong. With broader tax bases in the high/middle income territories of Japan, Korea and Taiwan, the burden
is spread more evenly across middle-income groups and less heavily concentrated on the richest quintile. In
some low-income countries - China, Indonesia, Kyrgyz and Nepal - the poorest 20% contribute a greater
share to direct tax revenues than in Hong Kong, South Korea and Taiwan. In China, the share of direct
taxes paid by the poorest fifth of households is double that quintile’s share of total expenditure. This is due
to an agricultural tax that is heavily concentrated on the poor and which outweighs the effect of a personal
income tax paid mainly by the rich.
FIGURES 3a and 3b
Summary indices of the distribution of the direct tax burden are presented in Table 4. Taxes for
which distributions have been estimated from the survey data are identified in the first column. In all cases,
the distribution of personal income tax has been estimated. In many cases, the estimated distribution also
reflects payment of other direct taxes. This is possible, for example, when the total amount paid in all direct
taxes is reported in the survey, or when reported capital income can be used to estimate payments of
10

corporation and/or capital gains taxes.2 For every territory, the distribution is estimated from taxes that
account for at least 40% of all direct taxes. In many cases, the percentage is much higher. The second
column describes the incidence assumptions used for the distributions of direct taxes that cannot be
estimated. The distribution of personal income tax is assumed to provide the best proxy for the distribution
of corporation taxes. This is confirmed in the territories where it is possible to estimate both distributions.
The distribution of other taxes, including property tax, is assumed to be a weighted average of those that
can be estimated.
The concentration indices are all positive and at least 0.42 in magnitude, confirming that the better-
off pay the largest share of direct taxes. The index is above 0.8 in Bangladesh, the Philippines, Sri Lanka
and Thailand, reflecting the fact that direct taxes are paid almost exclusively by the better-off in these
countries. Note that the index for China is 0.6, which might seem inconsistent with the relatively high share
of direct taxes paid for by the poorest quintile (Figure 3a). The explanation is that Figure 3a gives the share
of income and agricultural taxes only. The former is heavily concentrated on the better off, while the latter
is concentrated on the poor. The concentration index is computed as a weighted average of the indices for
these two taxes, with weights reflecting relative shares of revenue and the weight on income tax inflated to
reflect the assumption that corporation tax is distributed as income tax.
The Kakwani indices are all positive, indicating that direct taxes are consistently progressive; the
proportion of household resources absorbed by direct taxes rises with household income. Progressivity is
strongest in Sri Lanka, Bangladesh and Thailand. Direct taxes are near proportional only in Japan. In low-
and middle-income countries only the richest households qualify to pay personal income tax and taxes on
capital. There is also a great deal of tax evasion and non-taxed production arising from the scale of the
informal economy. To the extent that informal sector activity is skewed toward the lower part of the
income distribution, this will also increase the progressivity of direct taxes. In the high income territories,
where a greater proportion of the population qualify to pay taxes on income and the informal sector is
smaller, the burden of direct taxes is more evenly spread. Hong Kong is an exception - a rich territory that
relies heavily on a very progressive system of direct taxation. Thailand and the Philippines, two middle-
income countries relative to those considered, manage to combine marked progressivity in the burden of
direct taxes with significant reliance on this source of finance. As a result, direct taxation makes a
substantial contribution to the overall progressivity of these systems. In part, this is a product of the
development process. As a country develops, the tax base expands and the efficacy of the tax
administration system improves. The Philippines and Thailand are able to rely more on direct taxes than the
poorer countries of South Asia.
Progressivity of tax implies redistribution. The rich pay more as a proportion of income than the
poor and so the distribution of post-tax income is more even than that of pre-tax income. The redistributive
effect, measured by the Gini coefficient of pre-tax income minus the Gini of post-tax income, is positive.
The magnitude of the redistributive effect is increasing both with the degree of progressivity, as represented
by the Kakwani index, and with the average rate of tax as a share of income (g). Under the assumption that
11

all households of the same income pay the same tax, i.e., horizontal equity, the redistributive effect is given
by 1
gKg
⎛ ⎞⎜ −⎝ ⎠
⎟ (Aronson, Johnson et al. 1994; Van Doorslaer, Wagstaff et al. 1999). This index is presented in
the final column of table 4. The g used in the computation is direct tax revenues spent on health care as a
share of GDP (see column 4).3 Hence, we do not compute the redistributive effect of all direct taxation but
only the portion that goes to fund health care.
Direct tax expenditures on health care are greater than 1% of GDP only in Hong Kong and Japan.
As a result, the redistributive effects are generally very modest, despite the highly progressive structure of
taxes, as reflected in the magnitude of the Kakwani indices. The scale of the redistributive effects can only
be appreciated by comparison with the Gini coefficients (see Table 1). The redistributive effect i.e., the
change in the Gini under the assumption of horizontal equity, is more than 1% of the original degree of
inequality only in Hong Kong. The next largest redistributive effects are in Thailand, the Philippines and
Sri Lanka, each of which raises a substantial share of health financing through direct taxes. Japan, where
direct taxes account for the largest share of GDP, has the fifth largest redistributive effect despite having
the second smallest Kakwani index. The importance of the average tax rate is evident in other comparisons.
The redistributive effect is ten times greater in Hong Kong than in Bangladesh despite the Kakwani for
Hong Kong being only two-thirds of that for Bangladesh. The Kakwani indices are similar for Bangladesh
and Sri Lanka but the redistributive effect is four times as large in Sri Lanka.
TABLE 4 HERE
The burden of indirect taxes is also concentrated on the better off but to a much lesser extent than
for direct taxes (Figures 3a & 3b). With the exception of Japan, the poorest fifth of households contribute
less than 10% of indirect tax revenues, whereas the richest fifth contribute 38% or more. Japan is the only
case in which the share contributed by the least well off is greater than their respective share of total ATP.
Disparities between shares of indirect taxes and ATP are much less than for direct taxes. Greater
proportionality is to be expected since indirect taxes are levied on expenditure and the ATP measure is
expenditure. This may explain the exceptional result for Japan, where ATP is measured by income. Sales
taxes will be less proportional to income than they are to total expenditures.
The concentration and Kakwani indices confirm these conclusions (Table 5). Indirect taxes are
most concentrated on the better off in Thailand, then Hong Kong SAR and China. Japan has a markedly
lower concentration index than all the others. The Kakwani indices are all positive but for Japan. In China,
Indonesia, South Korea, Kyrgyz, the Philippines, Punjab, Sri Lanka and Taiwan, the Kakwani is very close
to 0, indicating proportionality. Indirect taxes appear progressive in Thailand, Hong Kong, Nepal and
Bangladesh. Such progressivity is explained by the exemption of food from taxation in Thailand and
Bangladesh and the propensity of poor rural households in Bangladesh and Nepal to consume local
products that are not subject to taxation. In Sri Lanka, by contrast, only some food items are tax-exempt
and indirect taxes are broadly proportional.
12

The near proportionality of indirect taxes means that the vertical redistribution effects are, in
general, very small. We again approximate the redistributive effect by 1
gKg
⎛⎜ −⎝ ⎠
⎞⎟ but acknowledge that the
assumption of horizontal equity is less plausible for indirect taxes. Despite the fact that indirect taxes
generally contribute more than direct taxes to health financing, their impact on inequality is less as a result
of weaker progressivity. In no case does the Gini coefficient change by more than 1% (assuming horizontal
equity). The largest redistributive effect is in Japan, where indirect taxes are inequality increasing. The
largest negative effect on inequality is in Thailand, where indirect taxes contribute 27% of health financing
and account for 1% of GDP.
TABLE 5 HERE
4.2 Social Insurance
Social insurance is at varying stages of development across Asia. In Japan, South Korea and Taiwan there
is universal coverage funded through employee and employer contributions with state subsidies for low-
income groups (Table 6). In principle, there is universal coverage in the Philippines but effective coverage
remains at less than 50%. Indonesia and Thailand offer coverage of formal sector employees. In Thailand a
policy of extending coverage to the low-income population, with a goal of universalism, has been in
operation since 2001. In China and Punjab, coverage is restricted to state sector and low-earnings workers
respectively. With the exception of Japan, social insurance operates with a single fund but with separate
programs differing in financing rules and contribution rates for different population groups. The financing
split between employee, employer and state varies, with the universal systems in the richer territories
relying more on employee and employer contributions with the state subsidising cover of the poor only.
Only China, Indonesia and Japan operate without an upper earnings limit beyond which contributions are
not paid on additional earnings. In most cases, contributions are some percentage of earnings, although the
rates vary markedly. Taiwan operates under a structure of fixed premiums specific to earnings intervals.
TABLE 6 HERE
The distribution of social insurance contributions depends on the extent of population coverage. In
low and middle income countries where typically only formal sector workers are covered (China,
Indonesia, the Philippines, Thailand), the poor make little contribution to social insurance revenues simply
because they do not belong to the systems (see Figure 4a). Contributions are concentrated on the better off,
both absolutely and relative to ATP (Figure 4b). Concentration indices are large and Kakwani indices
significantly positive for these partial coverage systems (Table 7), indicating that contributions are paid
mainly by the better off and the average contribution is rising as a fraction of household expenditure. One
must be careful not to place a redistribution interpretation on these results. In partial social insurance
systems, the better-off do not only pay more, they get more. The poor do not contribute but they are also
denied the benefits of coverage. If the health care benefits of social insurance are taken into account in the
13

measurement of living standards, which seems reasonable, then to assess the redistributive effect it is
necessary to examine the distribution of the benefits as well as the costs.
FIGURES 4a & 4b
In the three universal social insurance systems (Japan, South Korea and Taiwan), concentration
indices are smaller than in the partial systems but still positive and significant (Table 7). The better off
contribute more. But Kakwani indices are negative but close to zero in Japan and, to a lesser extent, in
Taiwan. Such proportionality is built into social insurance systems through the, near constant, contributions
rates across the earnings distribution. Given this, the slight tendency toward regressivity arises because
labour market earnings fall as a proportion of total household resource as the latter rises. In Taiwan, there is
some deviation from proportionality since the premium is a fixed proportion of the upper bound of each of
29 earnings’ intervals. Within each interval, the fixed premium is a greater proportion of earnings for all
those below the upper bound. This source of regressivity has been partially addressed through an increase
in the number of earnings’ bands to 38 in 2002. Upper earnings limits beyond which the marginal
contribution rate is zero, which operate in all universal systems but for Japan (Table 6), also push the
distribution toward regressivity. The limit has been abolished in South Korea and so the current system is
less regressive than is indicated by the year 2000 data analyzed. The reasons for the greater regressivity of
the Korean system, relative to Japan and Taiwan, are the constant contribution rate (in Japan it varies with
earnings), the upper earnings limit (not present in Japan) and, unlike Taiwan, the lack of government
subsidies for any groups other than the poor.
4.3 Direct payments
Direct payments are the single most important component of health care financing in all the territories
examined except for Hong Kong, Japan, Taiwan and Thailand (Table 2). They account for at least a third of
total health financing in every case but for Japan (12%) and Taiwan (30%). In South Korea, where health
financing is based on the social insurance model, out-of-pocket payments (OOP) still contribute one half of
total revenue. Given such heavy reliance on direct payments in Asia, they are an important determinant of
the distribution of the overall financing burden.
OOP payments include payments for private care and medicines, co-payments for care covered by
social insurance and user charges for public care. In all countries, with the exception of Sri Lanka, charges
are levied for the vast majority of health services and medicines provided under the public or social
insurance system (see Van Doorslaer, O'Donnell et al. 2005, Table 2). Vaccinations, immunisations and
family planning services are usually provided free by publicly-funded services. Primary medical care is
sometimes free (Punjab, Kyrgyz and the Philippines) or highly subsidised (Nepal). Exemptions or reduced
charges for the poor in Bangladesh, Hong Kong, Indonesia, Nepal, the Philippines, Taiwan and Thailand
may shift the burden onto the better-off. But well-known problems with the implementation of fee waiver
14

may weaken this effect (Ahrin-Tenkorang 2000; Tien and Chee 2002). In Punjab, subsidisation of the poor
works indirectly, through price discrimination. The poor can opt for lower quality but cheaper inpatient
care on separate wards. This arrangement also operates in Indonesia. Exemptions or reduced charges for
civil servants in Bangladesh, Hong Kong and Punjab are likely to shift the burden of payment away from
the better-off.
In general, OOP payments are heavily concentrated on the better-off and more so in the poorer
countries. The poorest 20% of households contribute more than 8% of OOP payments only in Japan,
Kyrgyz, Punjab and Taiwan (Figure 4a). The same four territories are the only ones in which the richest
fifth contribute less than two fifths of OOP payments (Figure 4b). The richest quintile contributes more
than half of OOP payments in Bangladesh, Indonesia, the Philippines, Sri Lanka and Thailand. The poor do
not only pay less in absolute terms, but less as a proportion of total household resources. Only in Japan,
Kyrgyz and Taiwan does the share of OOP paid by the poorest quintile exceed its share of ability to pay.
The concentration indices confirm that, in general, the better-off pay more out-of-pocket for health
care (Table 7). The only exception is Japan.4 In general, there is a tendency for the concentration of OOP
payments on the better-off to fall with national income (Figure 5). The distribution is most heavily skewed
toward payments by the better-off in Bangladesh and the Philippines. Kyrgyz and Punjab are the only low-
income territories with relatively low concentration indices. In Hong Kong, payments are more
concentrated on the rich than would be expected, given its income level. A likely explanation is that OOP
payments are mainly for private care in Hong Kong and mainly the rich consume this. Although there are
charges in the public sector, these are very modest and the poor are exempted. In the social insurance
systems operating in the other high-income territories, OOP payments are co-payments and these are
incurred more evenly across the population.
FIGURE 5
Two factors are likely to be most responsible for the relationship between national income and the
distribution of OOP payments. First, the lack of insurance cover in low-income countries means that the
better-off must pay out-of-pocket to secure quality health care, typically from the private sector. Second,
there is the constrained ability of poor households to pay for health care. The poorest of the poor simply
cannot afford to pay. In high-income countries, almost everyone has health insurance cover and even the
poorer sections of society have the resources to incur the relatively modest costs of consuming a good as
basic as health care. It is perhaps helpful to recognize that a positive concentration index for OOP implies
positive income elasticity. Income elasticities for health care are greater in poorer countries since the
income constraint is tighter for more households and because health insurance does not exist to weaken the
dependence of consumption on income. It is more difficult to discern any effect of public sector fee waivers
on the distribution of OOPs. This is understandable since the majority of OOP payments are for care
outside the public sector (Van Doorslaer, O'Donnell et al. 2005, Table 1). Effective health card systems in
15
Indonesia and Thailand may be responsible for the greater concentration of payments on the better-off in
these countries relative to China and Punjab, for example.
In China, Hong Kong, South Korea, Kyrgyz and Punjab, the Kakwani indices are not significantly
different from zero, indicating proportionality of direct payments to ability to pay. In the remaining
territories, except for Japan and Taiwan, positive Kakwani indices indicate that the better-off pay
proportionately and not only absolutely more. In Japan and Taiwan, the rich spend proportionality less of
their income on direct health care payments than the poor.
The positive Kakwani indices for the majority of low-income territories contradict the common
assertion that direct payments are regressive (Whitehead, Dahgren et al. 2001). In part, this belief may derive
from observation of the distribution of OOP payments in developed countries, where, as we find here for
Japan and Taiwan, the respective Kakwani index is usually significantly negative (Wagstaff, van Doorslaer
et al. 1999). In high-income countries, where insurance cover is extensive and there are few people so poor
that they cannot afford modest charges for health care, OOP payments are regressive due to the pro-rich
distribution of health and the heavy use of health care by the poor. The evidence usually cited for the
regressivity of direct payments in low-income countries is typically not from nationally representative
expenditure surveys but from health surveys conducted in one, usually rural, region (Ensor and Pham 1996;
Pannarunothai and Mills 1997; Fabricant, Kamara et al. 1999; Segall, Tipping et al. 2002).5 Omission of
payments made by the better-off urban population is a significant limitation if one wishes to draw
conclusions about the distribution of payments across the whole population. Further, health surveys cannot
measure total household resources as accurately as expenditure surveys, often relying on income, which,
particularly for poor households, is less indicative of living standards than is consumption. Support for our
finding that the OOP health payments budget share rises with total household consumption is provided by a
study of India that is based on nationally representative expenditure survey data (Peters, Yazbeck et al.
2001). While it is true that a given charge represents a higher share of resources to a poor household, this
does not imply that the actual distribution of OOP payments is regressive. It is important, however, not to
place a redistributive interpretation on a Kakwani index for OOP payments. If there are no fee waivers,
then a positive Kakwani index implies that the rich spend proportionality more of their income on health
care but the benefits they get are also proportionately more. When you pay for what you get, there is no
redistribution from payments. If a positive Kakwani index is, at least in part, due to fee waivers for the
poor, then it might reflect redistribution but the interpretation would not be immediate.
TABLE 7
16

4.4 Distribution of total health care financing
Having examined the distributions of each of the main sources of health care financing, we average these to
get a picture of how the total financing burden is distributed across the population. In Table 7, we present
the concentration and Kakwani indices for total payments toward health care and show how these are
derived from weighted averages of the indices for each of the five main sources of health financing
that can be allocated to the household level. In addition to the distributions that have already been
examined, we present the distribution of private insurance premiums. These make a significant
contribution to health finance in only five territories (Table 2). In all cases, the concentration index is
strongly positive reflecting the fact that only the more wealthy households take out such cover.
Without exception, the concentration indices for total health care financing are positive (see Figure
6). The better-off pay most for health care in Asia. The concentration indices are smallest in the four social
insurance based systems (Japan, Taiwan, Kyrgyz and Korea) and in Punjab and largest in the Philippines,
Thailand, Hong Kong and Bangladesh. Kakwani indices are negative only in the three high-income
territories operating social insurance. The index is close to zero in the other universal social insurance
system – Kyrgyz. So, the structure of finance and national income appear to be the most important
determinants of the distribution of health care financing. Universal social insurance financed roughly in
proportion to earnings results in a proportional to regressive financing burden. This contrasts with the
predominantly tax financed system of Hong Kong that is substantially more progressive. Japan and Taiwan,
but not Korea, rely much less heavily than the other territories on direct payments and the distribution of
direct payments is more even than it is in poorer countries. This reflects income differences. The poor in
high-income countries are not so poor that they must forgo needed health care. Again, Hong Kong provides
an interesting contrast, with direct payments more heavily skewed toward the rich than is true in the social
insurance systems. OOP payments are made by the rich in Hong Kong choosing to opt out of the public
sector that can be used by the poor at little or no cost.
Aside from Hong Kong, health care financing is most concentrated on the better off in the
Philippines and Thailand, two lower-middle income countries. Both rely most heavily on direct payments
but do spread financing across a range of instruments. The distributions of the individual instruments are
broadly similar across the countries and are always concentrated more on the rich than the poor. Despite
these apparent similarities, the distributional implications of the two systems are likely to differ
substantially. Thailand collects one half of health care funding through taxation, while in the Philippines
the proportion is just over one third. The Philippines relies more on financing instruments – partial social
insurance, private insurance and direct payments – that tie access to payment. The better off not only pay
more in the Philippines, they most probably get more. This is likely to be less true in Thailand. The same
point applies, with even greater force, to Bangladesh, where payments are heavily concentrated on the
better off but this is achieved through extensive reliance on direct payments. Bangladesh actually has the
largest positive Kakwani index for total health payments but, given its financing structure, it would be
17
misleading to refer to this as the most progressive system. Hong Kong and Indonesia have the same
Kakwani index for total payments but in Hong Kong this arises from a system that collects more than half
of revenue through the public sector, whereas in Indonesia only just over a quarter of payments are public.
The same Kakwani index is therefore consistent with quite different redistributive and equity implications
in the two systems. The message is that, if one wishes to draw inferences for equity, it is not sufficient to
examine the distribution of overall financing. The structure of financing and the distribution of services
must be considered and, in particular, the balance between financing instruments that tie payments to use
and those that do not.
5. Discussion
Who pays for health care in Asia? The short answer is that the better-off pay more. This is true not only in
absolute terms but, in most cases, also relative to income. Exceptions are the three high-income territories
operating a social insurance model (Japan, South Korea and Taiwan), where the rich pay more in absolute
terms but less as a proportion of incomes. These systems, particularly the Japanese one, are regressive. The
relationship between payments and ability to pay is close to proportional in China, Kyrgyz and Punjab.
Hong Kong is the one high-income territory where health care financing is not regressive. This is largely
attributable to the adoption of a tax, rather than a social insurance, model of financing. The tendency for the
burden of health care financing to be less concentrated on the better-off in more developed economies
arises, in part, from differences in the structure of financing. As an economy grows, reliance on out-of-
pocket payments for health care falls and social insurance is typically established. The latter tend to be
broadly proportional because contributions are levied as a fixed percentage of earnings. In addition,
development broadens the tax base, allowing greater reliance on tax financing and the opportunity to shift
the balance of taxation from indirect to direct. But it is not only the financing mix that responds to
development. The distributions of specific sources of finance also change. This is true of direct taxation,
which becomes less progressive, but not necessarily less redistributive, as the tax base is broadened.
Similarly, social insurance contributions are spread more evenly across the population as a system matures
from partial to universal coverage. Conventional wisdom says that out-of-pocket payments are a regressive
means of financing. We confirm this for high- and middle-income economies, with the marginal exception
of Hong Kong, which seems to engage in substantial positive discrimination in favour of the worse-off. But
the belief does not stand up to the evidence from low- and lower-middle income countries, where OOP
payments absorb a larger share of the resources of the better-off households. While fee waivers may play
some role here, the most plausible explanation is that the absence of health insurance means that the better-
off must pay out-of-pocket for health care and the poor simply cannot afford to pay. In higher income
societies, absolute poverty is lower and OOP payments are less of a barrier to health care consumption.
Then, income-related health inequality can make OOP payments regressive.
18

The objective of this analysis is fairly modest. It is to describe distributions of payments for health
care. It is envisaged that these descriptions will be of interest from a wide variety of perspectives:
economic, political, public finance and distributive justice. The latter has traditionally aroused much of the
interest in health care financing. It is perhaps advisable to finish with some words of caution about the
interpretation of the results in relation to equity. Fairness in financing is an elusive and contentious concept.
One principle is that payments should not be a barrier to the use of health care. This amounts to the claim
that the allocation of health care should not be by the market mechanism. The distribution of health care
payments does not help confirm whether the principle is respected. Reliance on private sources of finance
violates the principle. A weaker form of this principle is that the poor should not be discouraged from using
health care because they cannot afford to pay. The extent to which this principle is respected cannot be
established from the distribution of payments alone. It requires examination of the relationship between
health care use and charges. The same is true of the, ideologically opposite, benefit principle that one
should pay for what one gets. One concept of fairness that does not concern the relationship between
payments and use is the ability to pay principle. Indeed, the principle, in its strictest form, requires that
liability for the financing of health care be divorced from use, expected or realised, and related only to
ability to pay in a proportional or progressive fashion. Note that the principle does not simply require that
there is a positive empirical relationship between payments and ability to pay. Provided health care is a
normal good, a positive relationship will arise even in a free market system founded on the benefit
principle. If health care is a luxury good, then, by definition, payments will be an increasing proportion of
ability to pay under a market system. With this in mind, the extent to which the distribution of health
payments can be used to verify consistency of financing with the ability to pay principle depends upon the
nature of the payments. Tax liabilities are independent of health care utilisation and the tax distribution is
directly relevant to the ability to pay principle. The same argument holds for social insurance contributions
within a universal system. When social insurance coverage is partial, restricted to formal sector employees
for example, payment is not independent of entitlement to use. It is then more difficult to interpret the
distribution of contributions in relation to the extent to which the ability to pay principle is respected.
Private sources of finance are determined by use, expected or realised, and only indirectly by ability to pay.
Finding that direct payments or private insurance premiums rise with income does not tell us that financing
is consistent with the ability to pay principle. Nonetheless, the relationship between private payments and
income is of interest for reasons of economics and politics. Under conditions, the relationship can also
inform on matters of distributional justice. Given an established negative relationship between illness or
medical need and income, a positive relationship between direct health payments and income strongly
suggests financial impediments to the consumption of health care by the less well off. Fee waivers and
services exempt from charges obscure the distribution of use that can be discerned from the payments
distribution. It is preferable to examine the distribution of utilisation directly. Elsewhere we confirm that
utilisation, particularly of hospital and private care, is increasing with household income in low-income but
not in high- and middle-income countries of Asia (Somanathan, O'Donnell et al. 2005).
19

Interest in the distribution of health financing arises, in part, from its potential redistributive effect.
This is obvious for compulsory health payments. Progressive taxation takes proportionately more from the
rich than the poor and equalises the post-payment distribution of income. Proportional social insurance
contributions have no effect on the income distribution. It is more difficult to place a redistributive
interpretation on payments that are voluntary. In the absence of fee waivers, those that pay more for health
care through direct payments also get more. From this viewpoint, private payments for health care are no
more redistributive than payments for fast cars or diamond rings. The argument rests upon whether
expenditures on health care are ever voluntary. Most of us would feel compelled to purchase life saving
surgery for a loved one. The compulsion to pay taxes is a legal one but the moral compulsion to purchase
critical health care for a relative is arguably no less severe. In this sense, one might treat direct payments
for health care as compulsory and examine the extent to which their differential incidence increases or
reduces inequality in the distribution of resources households have available to spend on welfare enhancing
goods after meeting health care needs. In reality some health care expenditures can be considered
unavoidable, while others are clearly more discretionary.
In this paper, we have examined the distribution of health care financing. The magnitude of
payments is also important. With restricted health insurance cover, large, unforeseen expenditures on health
care can have catastrophic consequences for living standards and, in the extreme, may push households
into, or further into, poverty (Wagstaff and Van Doorslaer 2003; Xu, Evans et al. 2003). We examine this
aspect of health financing in Asia in a companion paper (Van Doorslaer, O'Donnell et al. 2005).
20

Figure 1: Out-of-pocket (OOP) share of total expenditure on health (TEH) against national income (GNI per capita)
Thailand
Bangladesh China
Hong Kong
Indonesia
Japan
Korea Rep.
Kyrgyz Rep.
Nepal
Philippines
Punjab Sri Lanka
Taiwan
0%
10%
20%
30%
40%
50%
60%
70%
80%
5 6 7 8 9 10 11 12
log (GNI per capita)
OO
P as
% o
f TH
E
21
Figure 2: Out-of-pocket (OOP) and general government revenues (GGR) as share of total expenditure on health
Bangladesh
China
Hong Kong
Indonesia
Japan
Korea Rep.
Kyrgyz Rep.
Nepal
Philippines Punjab
Sri Lanka
Taiwan
Thailand
0%
10%
20%
30%
40%
50%
60%
70%
80%
90%
100%
0% 10% 20% 30% 40% 50% 60% 70% 80% 90% 100%
OOP as % of TEH
GG
R a
s % o
f TE
H

Figure 3a: Poorest quintiles' shares of taxes and ability to pay (ATP)
0% 2% 4% 6% 8% 10% 12% 14% 16%
ThailandTaiwan
Sri Lanka
PunjabPhilippines
NepalKyrgyzstanKorea Rep.
JapanIndonesia
Hong KongChina
Bangladesh
% share of ATP and taxes
direct taxindirect taxability to pay
Figure 3b: Richest quintiles' shares of taxes and ability to pay (ATP)
30% 40% 50% 60% 70% 80% 90% 100%
ThailandTaiwan
Sri Lanka
PunjabPhilippines
NepalKyrgyzstan Korea Rep.
JapanIndonesia
Hong KongChina
Bangladesh
% share of ATP and taxes
direct taxindirect taxability to pay
22

Figure 4a: Poorest quintiles' shares of SI contributions, direct payments and ATP
0% 2% 4% 6% 8% 10% 12% 14% 16% 18%
ThailandTaiwan
Sri LankaPunjab
P
hilippinesNepal
KyrgyzstanKorea Rep.
JapanIndonesia
Hong KongChina
Bangladesh
% share of ATP, contributions and payments
social insurancedirect paymentsability to pay
Figure 4b: Richest quintiles' shares of SI contributions, direct payments and ATP
20% 30% 40% 50% 60% 70%
ThailandTaiwan
Sri LankaPunjab
PhilippinesNepal
Kyrgyzstan Korea Rep.
JapanIndonesia
Hong KongChina
Bangladesh
% share of ATP, contributions and payments
social insurance
direct payments
ability to pay
23

Figure 5: Concentration index of direct payments against national income
Thailand Bangladesh
China Hong Kong
Indonesia
Japan
Korea Rep.
Kyrgyz Rep.
Nepal
Philippines
Punjab
Sri Lanka
Taiwan
0.0
0.1
0.2
0.3
0.4
0.5
0.6
0.7
5 6 7 8 9 10 11 1
log (GNI per capita)
CI o
f OO
2
Figure 6: Concentration and Kakwani indices for total health financing
-0.1 0.0 0.1 0.2 0.3 0.4 0.5 0.6
Japan Taiwan
Korea Rep. Kyrgyz Rep.
China Punjab Nepal
Sri Lanka Philippines
Hong Kong Indonesia Thailand
Bangladesh
Concentration index Kakwani index
24

Table 1: Development indicators, year 2000
Territory World Bank
Income Group
GNI per capita(a) Population % urban(b) Life
expectancy(c)
Infant Mortality
Rate(d)
Gini index(e)
Japan high 35620 126,870,000 78.75 80.72 3.8 0.3241
Hong Kong, SAR high 25920 6,797,000 100 79.82 2.9 0.3901
Taiwan
high 14188 22,276,672 63.25 74.9 5.86 0.2633
Korea Republic upper-middle 8960 47,275,000 81.88 73.15 8.16 0.3347
Thailand lower-middle 2010 60,728,000 19.83 68.82 27.92 0.3957
Philippines lower-middle 1040 75,580,000 58.55 69.27 30.72 0.4488
Sri Lanka lower-middle 850 19,359,000 22.8 73.14 14.95 0.3944
China lower-middle 840 1,262,460,000 35.79 70.26 32 0.4517
Indonesia low 570 210,421,000 40.99 66.03 40.88 0.2972
Punjab (India) low 537 24,324,749 27.66 64.1 57.1 0.2601
Bangladesh low 370 131,050,000 25 61.19 60 0.3401
Kyrgyz Republic low 280 4,915,000 34.38 67.3 61 0.3015
Nepal low 240 23,043,000 11.85 58.86 73.6 0.3392
Source: World Bank, WDI Tables (http://devdata.worldbank.org/data-query/) Notes:
a. GNI - gross national income, Atlas method (current US$). b. % of population which is urban. c. Life expectancy at birth (years). d. Infant mortality rate per 1000 live births e. Gini index of consumption/expenditure inequality. Authors’ calculations from survey data
25

Table 2: Health care financing mix (percentage of total health expenditure from main sources)
Public Finance Private Finance Territory (year)
General govt.
revenuea
Social
Insurance
All public
finance
Private
Insurance
Direct
payments
Other
Bangladesh (1999) 27.23%
0.00% 27.23% 0.0% 64.64% 8.13%b
China (2000) 14.89% 16.52% 31.4% 0.0% 60.35% 8.24%c
Hong Kong, SAR (1999-2000) 55.63% 0.00% 55.63% 12.29% 31.22% 0.86%
Indonesia (2001)d 32.97% 2.86% 35.83% 6.43% 57.74% 0.00%
Japan (2001) 33.20% 54.00% 87.20% 0.00% 12.80% 0.00%
Korea Rep. (2000) 16.22% 33.90% 50.12% 0.00% 49.88% 0.00%
Kyrgyz Rep. (2000) 44.52% 3.80% 48.32% 0.00% 51.68% 0.00%
Nepal (1994-5 & 1995-6)e 23.50% 0.00% 23.50% 0.00% 75.00% 1.50%f
Philippines (1999) 39.71% 5.09% 44.80% 10.29% 44.91% 0.00%
Punjab (1995-96) 40.73% 1.30% 42.03% 0.20% 56.41% 1.28%g
Sri Lanka (1996-97) 49.50% 0.00% 49.50% 0.91% 49.59% 0.00%
Taiwan (2000) 9.17% 51.78% 60.95% 8.90% 30.15% 0.00%
Thailand (2000) 56.28% 5.11% 61.39% 5.87% 32.74% 0.00%
Source: National / Domestic / Regional Health Accounts unless stated otherwise. Row totals sum to 100%. a. Includes revenues from donors / foreign aid. b. Private enterprise, NGOs and community health insurance. c. Payments by collective organisations, towns and villages through grass roots governments and rural cooperatives. d. Ministry of Health preliminary NHA estimates revised from Public Health Expenditure Review. e. Public finance data for 1994-5 (HMG/Nepal 2000), private expenditure data from 1995-6 Nepal Living Standards Survey (Hotchkiss, Rous et al. 1998). f. Private companies.
26g. Revenue from private firms and NGOs for finance of own facilities.

Table 3: Percentage of General Government Revenue from different sources
Bangladesh China Hong
Kong
Indonesia Japan Korea
Rep.
Kyrgyz
Rep.
Nepal Philippines Punjab Sri
Lanka
Taiwan Thailand
Direct Taxes: 14.76% 14.78% 48.01% 36.02% 58.80% 51.20% 13.95% 11.02% 42.63% 4.88% 21.20% 60.85% 29.15%
Personal income 8.08% 3.83% 17.88%
30.12% 33.75% 24.28% 7.62% 3.53% 14.05% 2.05% 9.17% 15.82% 11.75%
Corporation 5.73% 7.45% 24.03% 3.90% 21.70% 24.77% 5.79% 1.79% 16.34% 0.09% 9.27% 17.55% 17.39%
CG/Property/other 0.95% 3.49% 6.10% 2.00% 3.29% 2.16% 0.54% 5.70% 12.24% 2.83% 2.76% 27.49% 0.00%
Indirect Taxes: 60.01% 79.18% 22.20% 25.84% 38.10% 48.80% 63.67% 39.45% 37.22% 34.42% 65.08% 35.22% 49.23%
Sales / VAT 23.44% 33.98% 1.67% 16.96% 22.40% 32.44% 22.26% 13.77% 16.93% 23.38% 15.72% 16.31%
Excise taxes 2.06% 6.38% 0.00% 5.58% 42.45%
15.36% 2.51% 9.30% 17.49% 23.92% 11.01% 22.99%
Import duties 19.09% 5.57% 4.70% 3.30% 0.00% 0.00% 14.68% 7.44% 0.02% 16.66% 7.82% 9.93%
Other 15.41% 33.18% 15.83% 0.00%
15.69%
6.35% 15.87%with
excise 6.70% 0.00% 1.12% 0.68% 0.00%
Non-tax revenue 25.23% 6.04% 29.73% 38.14% 3.10% 0.00% 22.38% 49.53% 20.15% 60.70% 13.73% 3.93% 21.62%
Borrowing n.a. n.a. 0.00% 9.32% 0.00% 0.00% 0.00%. 25.02% 9.32% 38.36% 6.25% 0.00% 0.00%
Foreign Aid 25.23% n.a. 0.00% 0.00% 0.00% 0.00% 6.15% 12.34% 6.77% 6.11% ≅0.00% 0.00% 0.00%
Profits & resources n.a. n.a. 20.87% 28.03% 0.00% 0.00% 2.15% 10.83% 15.91% 1.76% 3.93% 13.62%
Fees & other n.a. n.a. 8.86% 0.79% 3.10% 0.00% 14.08% 12.17%
0.0% 0.32% 5.72% 0.00% 8.00%
Note: Sources and years as for Table 2. “Profits and resources” includes profits from public enterprises and revenue from natural resources (including land transactions). “Fees & other” are (non-health) fees from public services.
27

Table 4: Direct taxes – Concentration and Kakwani indices Direct tax expenditure
on health as
Tax distributions estimated from
data (these taxes as % total direct
taxes)
Allocation of other taxes
% TEH % GDPa
Concentration
index
Kakwani
index
Redistributive
effect
Bangladesh PIT, CT, PT, LT, LocT (100%) No others 4.02% 0.13% 0.8925 0.5523 0.0007
China PIT & agricultural tax (49.5%) CT allocated as PIT 2.20% 0.11% 0.6038 0.1521 0.0002
Hong Kong PIT, PT (48.3%) CT allocated as PIT 26.71% 1.49% 0.7840 0.3940 0.0060
Indonesia PIT (83.6%) CT & PT allocated as PIT 11.88% 0.32% 0.4935 0.1962 0.0006
Japan PIT (57.4%) CT & PT allocated as PIT 19.52% 1.54% 0.4192 0.0950 0.0015
Korea Rep. PIT (47.4%) CT and Others as PIT 8.31% 0.49% 0.6031 0.2683 0.0013
Kyrgyz Rep. PIT, CT (96.1%) weighted ave. of PIT & CT 6.21% 0.26% 0.5410 0.2395 0.0006
Nepal PIT, CT, PT (100%) No others 2.59% 0.14% 0.4828 0.1436 0.0002
Philippines PIT + PT + other tax levied on
individual (40.2%)
CT, CGT, others as direct tax
reported paid by indv.
16.93%
0.59% 0.8297 0.3809 0.0023
Sri Lanka PIT, 50% CT & CGT (65.1%) 50% CT & CGT and PT as
average of estimated taxes
10.49% 0.34% 0.9567 0.5693 0.0019
Taiwan PIT+CGT+PT+other (71.1%) CT as reported direct tax paid
by indv.
5.58% 0.30% 0.5071 0.2438 0.0007
Thailand PIT (40.3%) CT allocated as PIT 16.40% 0.61% 0.9057 0.5101 0.0031
PIT- personal income tax; CT – corporation tax; PT – property tax; LT- land tax; LocT – local tax; CGT – capital gains tax; TEH – total expenditure on health. a. Not total direct tax revenue as % of GDP but only direct tax revenue spent on health as % GDP.
28

Table 5: Indirect taxes – Concentration and Kakwani indices
Indirect tax expenditure on health as
Taxes for which distribution estimated from data. (% of all indirect taxes)
Allocation of other indirect taxes
% TEH % GDP
Concentration index
Kakwani index
Redistributive effect
Bangladesh ST/VAT, ET, ID, supp. tax (100%) No others 16.34% 0.52% 0.4511 0.1110 0.00058
China VAT, ET (51.0%) ID and others as weighted average of estimated taxes
11.79%
0.60% 0.4915 0.0398 0.00024
Hong Kong ST/VAT, ID (28.7%) Stamp Duty as PT, others as weight. ave. estimtd. taxes
12.35% 0.69% 0.5003 0.1102 0.00077
Indonesia ST/VAT, ET (87.2%) ID as weight. ave. estimtd. taxes
8.52% 0.23% 0.3713 0.0741 0.00017
Japan ST/VAT (58.8%) ET, ID & other as ST/VAT 12.65% 1.00% 0.1007 -0.2232 -0.00225
Korea Rep. ST/VAT, ET (87.0%) Others as estimated taxes 7.92% 0.47% 0.3726 0.0379 0.00018
Kyrgyz Rep. ST/VAT, ET, Other (100%) No others 28.35% 1.17% 0.3522 0.0508 0.00060
Nepal ST, ET, ID (100%) No others 9.27% 0.49% 0.4538 0.1143 0.00056
Philippines ST, ET, ID, Other (100%). No others 14.78% 0.51% 0.4511 0.0024 0.00001
Punjab ST, ET (89.9%) ID & others as estimated taxes 14.02% 0.49% 0.3103 0.0579 0.00028
Sri Lanka ST/VAT, ET, 50% transport taxes (73.5%)
ID as ST, 50% transport taxes and others as weight. ave. estimtd. taxes
32.21% 1.03% 0.3774 -0.0100 -0.00010
Taiwan ST/VAT (44.6%) ET, ID & other as ST 3.23% 0.17% 0.3037 0.0404 0.00007
Thailand ST/VAT, ET (79.8%) ID as weight. ave. estimtd. taxes.
27.71% 1.03% 0.5776 0.1819 0.001884
ST/VAT – Sales tax / value added tax; ET – excise taxes; ID – import duties; PT- property tax;
29
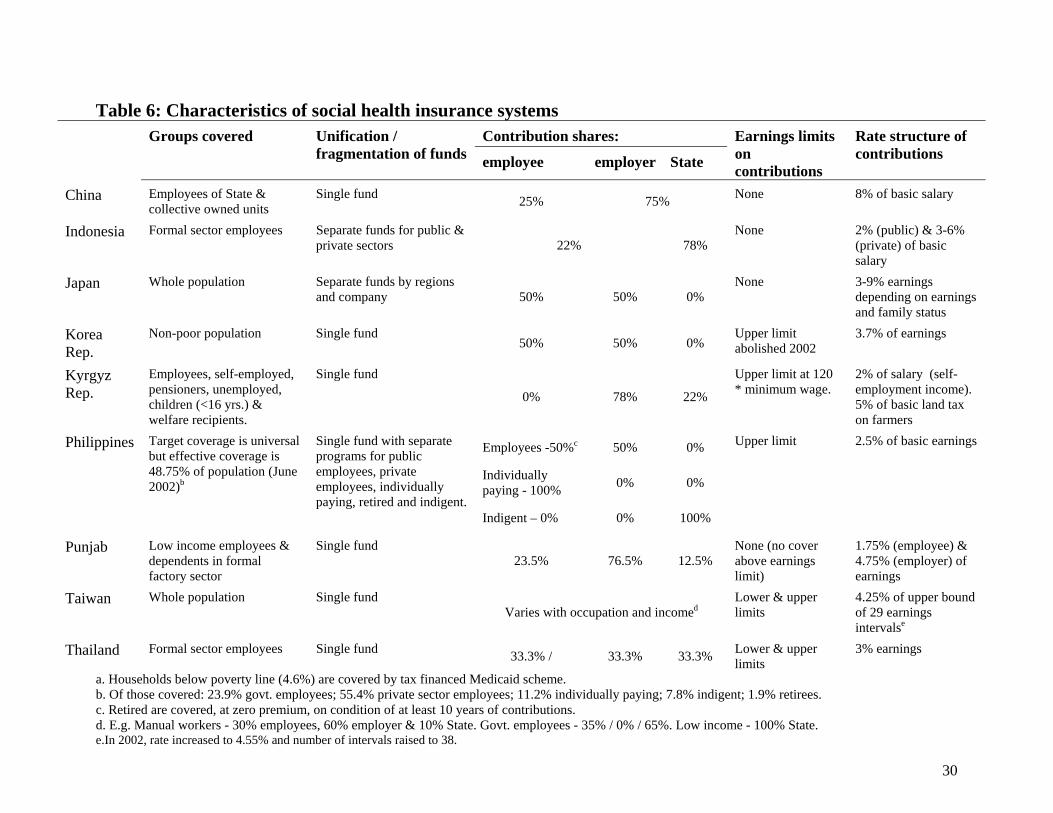
Table 6: Characteristics of social health insurance systems
Contribution shares: Groups covered Unification / fragmentation of funds employee employer State
Earnings limits on contributions
Rate structure of contributions
China Employees of State & collective owned units
Single fund 25% 75% None 8% of basic salary
Indonesia Formal sector employees Separate funds for public & private sectors 22%
78% None 2% (public) & 3-6%
(private) of basic salary
Japan Whole population Separate funds by regions and company 50% 50% 0%
None 3-9% earningsdepending on earnings and family status
Korea Rep.
Non-poor population Single fund 50% 50% 0%
Upper limit abolished 2002
3.7% of earnings
Kyrgyz Rep.
Employees, self-employed, pensioners, unemployed, children (<16 yrs.) & welfare recipients.
Single fund
0% 78% 22%
Upper limit at 120 * minimum wage.
2% of salary (self-employment income). 5% of basic land tax on farmers
Employees -50%c 50% 0%
Individually paying - 100% 0% 0%
Philippines Target coverage is universal but effective coverage is 48.75% of population (June 2002)b
Single fund with separate programs for public employees, private employees, individually paying, retired and indigent.
Indigent – 0% 0% 100%
Upper limit 2.5% of basic earnings
Punjab Low income employees & dependents in formal factory sector
Single fund 23.5% 76.5% 12.5%
None (no cover above earnings limit)
1.75% (employee) & 4.75% (employer) of earnings
Taiwan Whole population Single fund Varies with occupation and incomed
Lower & upper limits
4.25% of upper bound of 29 earnings intervalse
Thailand Formal sector employees Single fund 33.3% / 33.3% 33.3% Lower & upper limits
3% earnings
a. Households below poverty line (4.6%) are covered by tax financed Medicaid scheme. b. Of those covered: 23.9% govt. employees; 55.4% private sector employees; 11.2% individually paying; 7.8% indigent; 1.9% retirees. c. Retired are covered, at zero premium, on condition of at least 10 years of contributions. d. E.g. Manual workers - 30% employees, 60% employer & 10% State. Govt. employees - 35% / 0% / 65%. Low income - 100% State. e.In 2002, rate increased to 4.55% and number of intervals raised to 38.
30

31
Table 7: Distributional incidence of health care financing by component and in aggregate
Index Direct taxes
Indirect taxes
Social insurance
Private insurance
Direct payments
Total financing
Bangladesh Concentration 0.8925 0.4511 N/A N/A 0.5593 0.5543 (1999-2000) Kakwani 0.5523 0.1110 0.2192 0.2142 Weights 0.0473 0.1922 0.7605 China Concentration 0.6038 0.4915 0.6865 N/A 0.4349 0.4921
(2000) Kakwani 0.1521 0.0398 0.2348 -0.0168* 0.0404
Weights 0.0242 0.1298 0.1818 0.6642 Hong Kong Concentration 0.7840 0.5003 N/A 0.4304 0.4014 0.5590
(1999-2000) Kakwani 0.3940 0.1102 0.0403* 0.0113* 0.1689
Weights 0.3755 0.0975 0.1489 0.3781
Indonesia Concentration 0.4935 0.3713 0.6029 Allocated 0.4734 0.4704
(2001) Kakwani 0.1962 0.0741 0.3057 as direct 0.1761 0.1732
Weights 0.1358 0.0974 0.0327 0.7340
Japan Concentration 0.4192 0.1007 0.2827 No data 0.0550* 0.2553 (1998) Kakwani 0.0950 -0.2232 -0.0415 -0.2691 -0.0688 Weights
0.1952 0.1368 0.5400 0.1280 Korea Rep. Concentration 0.6031 0.3726 0.1714 N/A 0.3472 0.3108 (2000) Kakwani 0.2683 0.0379 -0.1634 0.0124* -0.0239 Weights
0.0831 0.0792 0.3390 0.4987 Kyrgyz Rep. Concentration 0.5410 0.3522 0.4437 N/A 0.2495 0.3101
(2000) Kakwani 0.2395 0.0508 0.1422 -0.0520* 0.0087
Weights 0.0690 0.3149 0.0422 0.5740 1
Nepal Concentration 0.4828 0.4538 N/A N/A 0.3925 0.3873
(1995-96) Kakwani 0.1436 0.1143 0.0533 0.0625
Weights 0.0298 0.1067 0.8635
Philippines Concentration 0.8297 0.4511 0.5948 0.5100 0.5878 0.6020 (1999) Kakwani 0.3809 0.0024 0.2048 0.1199* 0.1391 0.1631 Weights 0.1840 0.1607 0.0553 0.1118 0.4882 Punjab Concentration No data 0.3103 No data Allocated 0.2985 0.3009
(1999-2000) Kakwani No data 0.0579 as direct 0.0461* 0.0485
Weights 0.1984 payments 0.8016 Sri Lanka Concentration 0.9567 0.3774 N/A Included 0.4561 0.4724
(1996-7) Kakwani 0.5693 -0.0100 with direct 0.0687 0.0850 Weights 0.0818 0.3131 payments 0.6050 Taiwan Concentration 0.5071 0.3037 0.1884 0.4686 0.1853 0.2341 (2000) Kakwani 0.2438 0.0404 -0.0749 0.2053 -0.0780 -0.0292 Weights 0.0560 0.0324 0.5197 0.0893 0.3026 Thailand CI 0.9057 0.5776 0.5760 0.3995 0.4864 0.5929
(2002) Kakwani 0.5101 0.1819 0.1803 0.0039* 0.0907 0.1972
Weights 0.1868 0.3155 0.0582 0.0668 0.3728
N/A – not applicable (source does not exist). No data – data not available to estimate distribution. * indicates NOT significantly different from zero at 5%. Inference not undertaken for taxes and total financing indices since these are computed as weighted averages.
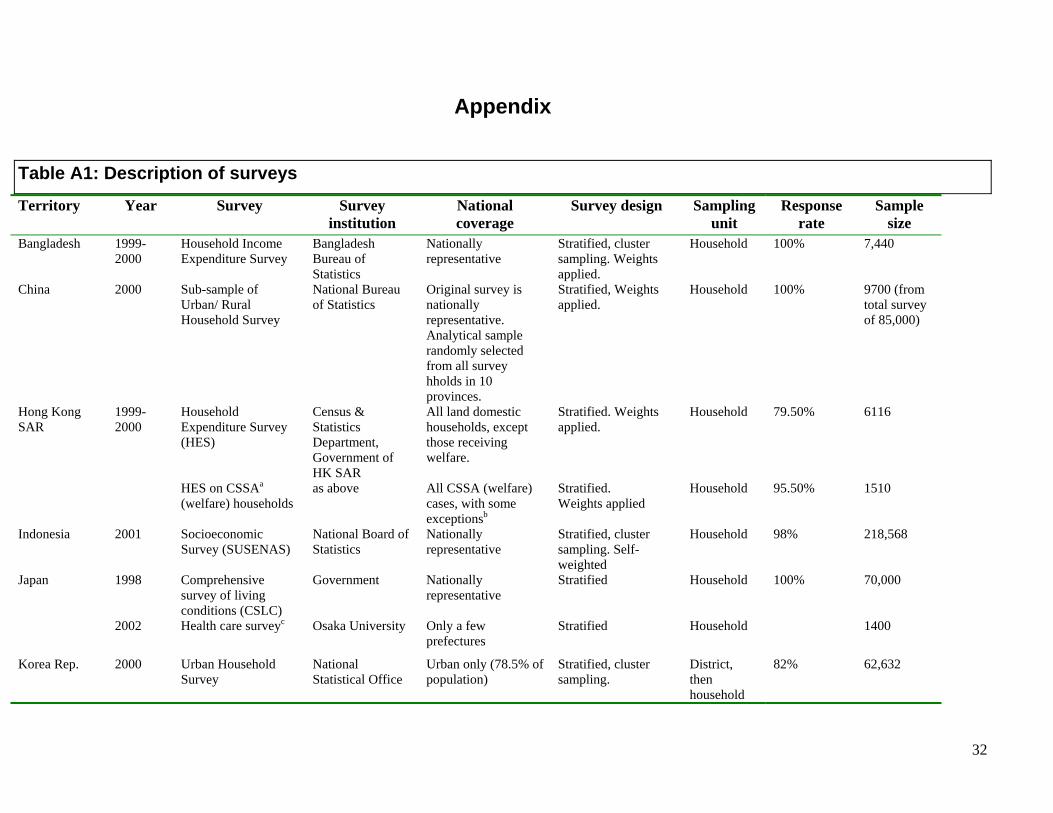
32
Appendix
Table A1: Description of surveys
Territory Year Survey Surveyinstitution
National coverage
Survey design Sampling unit
Response rate
Sample size
Bangladesh 1999-2000
Household Income Expenditure Survey
Bangladesh Bureau of Statistics
Nationally representative
Stratified, cluster sampling. Weights applied.
Household 100% 7,440
China
2000 Sub-sample ofUrban/ Rural Household Survey
National Bureau of Statistics
Original survey is nationally representative. Analytical sample randomly selected from all survey hholds in 10 provinces.
Stratified, Weights applied.
Household 100% 9700 (fromtotal survey of 85,000)
Hong Kong SAR
1999-2000
Household Expenditure Survey (HES)
Census & Statistics Department, Government of HK SAR
All land domestic households, except those receiving welfare.
Stratified. Weights applied.
Household 79.50% 6116
HES on CSSAa (welfare) households
as above All CSSA (welfare) cases, with some exceptionsb
Stratified. Weights applied
Household 95.50% 1510
Indonesia 2001 SocioeconomicSurvey (SUSENAS)
National Board of Statistics
Nationally representative
Stratified, cluster sampling. Self-weighted
Household 98% 218,568
Japan 1998 Comprehensivesurvey of living conditions (CSLC)
Government Nationallyrepresentative
Stratified Household 100% 70,000
2002 Health care surveyc Osaka University Only a few prefectures
Stratified Household 1400
Korea Rep. 2000 Urban Household Survey
National Statistical Office
Urban only (78.5% of population)
Stratified, cluster sampling.
District, then household
82% 62,632
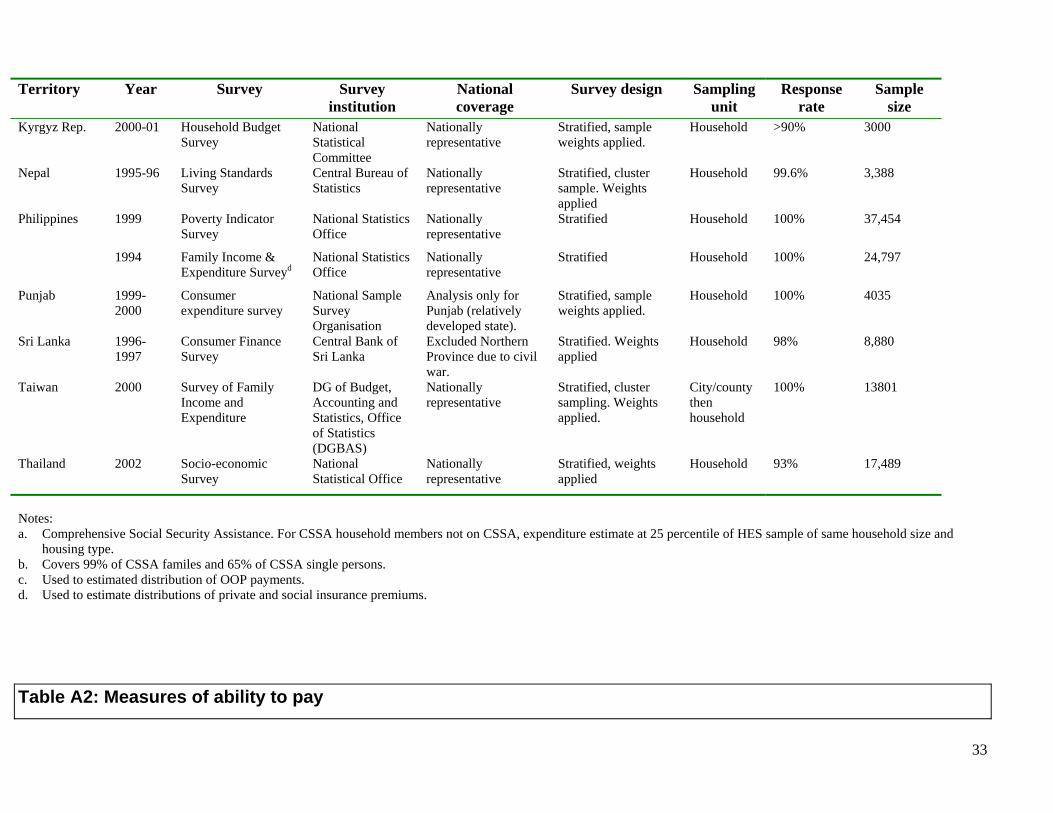
33
Territory Year Survey Survey institution
National coverage
Survey design Sampling unit
Response rate
Sample size
Kyrgyz Rep. 2000-01 Household Budget Survey
National Statistical Committee
Nationally representative
Stratified, sample weights applied.
Household >90% 3000
Nepal
1995-96 Living StandardsSurvey
Central Bureau of Statistics
Nationally representative
Stratified, cluster sample. Weights applied
Household 99.6% 3,388
Philippines 1999 Poverty IndicatorSurvey
National Statistics Office
Nationally representative
Stratified Household 100% 37,454
1994 Family Income & Expenditure Surveyd
National Statistics Office
Nationally representative
Stratified Household 100% 24,797
Punjab 1999-2000
Consumer expenditure survey
National Sample Survey Organisation
Analysis only for Punjab (relatively developed state).
Stratified, sample weights applied.
Household 100% 4035
Sri Lanka 1996-1997
Consumer Finance Survey
Central Bank of Sri Lanka
Excluded Northern Province due to civil war.
Stratified. Weights applied
Household 98% 8,880
Taiwan 2000 Survey of Family Income and Expenditure
DG of Budget, Accounting and Statistics, Office of Statistics (DGBAS)
Nationally representative
Stratified, cluster sampling. Weights applied.
City/county then household
100% 13801
Thailand 2002 Socio-economicSurvey
National Statistical Office
Nationally representative
Stratified, weights applied
Household 93% 17,489
Notes: a. Comprehensive Social Security Assistance. For CSSA household members not on CSSA, expenditure estimate at 25 percentile of HES sample of same household size and
housing type. b. Covers 99% of CSSA familes and 65% of CSSA single persons. c. Used to estimated distribution of OOP payments. d. Used to estimate distributions of private and social insurance premiums.
Table A2: Measures of ability to pay

34
Territory Concepta Treatment of durables and housing Period for which computedb
Bangladesh Consumption Actual expenditures on durables and housing included 1 year
China
Consumption Actual expenditures on durables and housing included 1 year
Hong Kong SAR Expenditure 1 month
Indonesia Consumption Use value of durables and rental values of housing imputed 1 month
Japan Income 1 year
Korea Rep. Expenditure 1 month
Kyryz Rep. Expenditure 1 year (from monthly data)
Nepal Consumption Use value of durables and rental values of housing imputed 1 year
Philippines Consumption Expenditure on durables excluded. Rental value of housing imputed 1 year
Punjab Consumption Actual expenditures on durables and housing included 1 month
Sri Lanka Consumption Actual expenditures on durables. Rental value of housing imputed. 1 year
Taiwan Expenditure 1 year
Thailand Consumption Actual expenditures on durables and housing included 1 month
Notes: Unit of observation is the household in all cases but for Sri Lanka, where it is the spending unit. a. Consumption includes the value of goods and services consumed from home production. Expenditure includes market purchases only. b. Recall periods vary with item of expenditure. Column gives the standardized period for which the ATP measure has been computed from the data.

35
Table A3: Methods used to measure health care payments
Territory Personalincome tax
Sales / Excise taxes
Social Insurance Private insurance
OOP payments
Bangladesh Estimated Estimated (detailed) No social insurance No data. Very small share (Table 2)
Consultation fees, hospital/clinic charges, medicines, test/investigation, transport, tips and other health service charges.
China
Reported Estimated (detailed) Estimated No privateinsurance
Inpatient, outpatient, medicines, etc
Hong Kong SAR Estimated Estimated (detailed) No social insurance Reported Outpatient, inpatient, medicines, traditional medicine, dental, medical supplies/equipment, health supplement, other health care.
Indonesia Estimated Estimated (detailed) Estimated No data Outpatient, inpatient & self-treatment medicines Japan Reported Estimated Reported No data Outpatient, inpatient, medicines and any co-payments. Korea Rep. Reported Estimated (detailed) Reported (employee
contrbn.*2 to reflect employer contrbn.)
No private insurance
Inpatient, outpatient, medicines, dental, medical supplies, tests.
Kyrgyz Rep Reported Estimated (detailed) Reported / estimated No private insurance
Inpatient, outpatient, medicines, dental, acute care.
Nepal Reported Estimated (detailed) No social insurance Almost none Consultation fees (modern & traditional), medicines (modern & traditional), hospital expenses, tests.
Punjab No data.Small share (Tables 2 &3).
Estimated (detailed) No data. Small share (Table 2).
No data Very small share (Table 2).
Outpatient, inpatient and medicines.
Philippines Reported Estimated (detailed) Reported Reported Fees, hospital charges and medicines (modern & traditional). Sri Lanka PAYE taxes
estimated. Non-PAYE income taxes reported.a
Estimated (detailed)b. Diesel and tax on luxuries reported.
No social insurance No data. Small share (Table 2).
Fees, hospital charges, medicines, tests, spectacles, dental, homeopathy and acupuncture, charms and others
Taiwan Reported Estimated (average indirect tax rate applied to all taxable expenditures).
Reported Reported Inpatient, outpatient, medicines, medical equipment, dental, nursing home, tests, traditional medicines, medical supplies.
Thailand Reported Estimated (detailed) Reported Estimated from life insurance premiums
Inpatient, outpatient, medicines, self-medication, traditional medicine
Notes: 1.Estimated income tax means the tax schedule is applied to reported incomes. Estimated (detailed) sales/excise tax means that product specific tax rates are applied to reported product specific expenditures or quantities. 2. Reported means the actual payment is reported in the survey. a. Corporate & capital gains taxes estimated from reported capital/corporate income. b. Reduced tax payments on vegetables by 25% in rural areas for non-payment and reduced all sales tax by 20% for non-payment in Northern Province.

36
References
Ahrin-Tenkorang, D. (2000). Mobilizing resources for health: The case for user fees revisited. Commission on Macroeconomics and Health WG3: 6. Geneva.
Aronson, J. R., P. Johnson, et al. (1994). “Redistributive effect and unequal tax treatment.” Economic Journal 104: 262-270.
Deaton, A. (1997). The analysis of household surveys: a microeconometric approach to development policy. Baltimore, Johns Hopkins University Press.
Deaton, A. and M. Grosh (2000). Consumption. Designing household questionaires for developing countries: lessons from fifteen years of the living standards measurement study. M. Grosh and P. Glewwe. Washington DC, World Bank. 91-133.
Ensor, T. and B. S. Pham (1996). “Access and payment for health care: The poor of nothern Vietnam.” International Journal of Health Planning and Management 11: 69-83.
Fabricant, S. J., C. W. Kamara, et al. (1999). “Why the poor pay more: Household curative expenditures in rural Sierra Leone.” International Journal of Health Planning and Management 14: 179-199.
HMG/Nepal (2000). Economic Survey 2000. Kathmandu. Hotchkiss, D. R., J. J. Rous, et al. (1998). “Household health expenditures in Nepal: implications for
health care financing reform.” Health Policy and Planning 13(4): 371-83. Jenkins, S. (1988). “Calculating income distribution indices from microdata.” National Tax Journal 61:
139-142. Kakwani, N. C. (1977). “Measurement of tax progressivity: An international comparison.” Economic
Journal 87(345): 71-80. Lerman, R. I. and S. Yitzhaki (1989). “Improving the Accuracy of Estimates of Gini Coefficients.”
Journal of Econometrics 42(1): 43-47. Musgrove, P. and R. Zeramdini (2001). A summary description of health financing in WHO member
states. Commission on Macroeconomics and Health WG3: 3. Geneva. Pannarunothai, S. and A. Mills (1997). “The poor pay more: health-related inequality in Thailand.” Soc
Sci Med 44(12): 1781-90. Peters, D., A. Yazbeck, et al. (2001). Better health systems for India's poor. Findings, analysis and
options. Washington DC, World Bank. Segall, M., G. Tipping, et al. (2002). “Economic transition should come with a health warning: the case of
Vietnam.” Journal of Epidemiology and Community Health 56: 497-505. Somanathan, A., O. O'Donnell, et al. (2005). Who gets health care in Asia? EQUITAP Working Paper # 4,
Erasmus University, Rotterdam and IPS, Colombo. Tien, M. and G. Chee (2002). Literature review and findings: Implementation of waiver policies.
Washington DC, Partners for Health Reformplus. Van Doorslaer, E., O. O'Donnell, et al. (2005). Paying out-of-pocket for health care in Asia: Catastrophic
and poverty impact. EQUITAP Working Paper #2, Erasmus University, Rotterdam and IPS, Colombo.
Van Doorslaer, E., A. Wagstaff, et al. (1999). “The redistributive effect of health care finance in twelve OECD countries.” Journal of Health Economics 18(3): 291-313.
Wagstaff, A. and E. Van Doorslaer (1992). “Equity in the finance of health care: Some international comparisons.” Journal of Health Economics 11(4): 361-87.
Wagstaff, A. and E. Van Doorslaer (2003). “Catastrophe and impoverishment in paying for health care: with applications to Vietnam 1993-98.” Health Economics 12: 921-934.
Wagstaff, A., E. van Doorslaer, et al. (1999). “Equity in the finance of health care: some further international comparisons.” Journal of Health Economics 18(3): 263-90.

37
Whitehead, M., G. Dahgren, et al. (2001). “Equity and health sector reforms: can low-income countries escape the medical poverty trap?” The Lancet 358: 833-36
World Bank (2003). The Concentration Index. Series on Quantitative Techniques for Health Equity Analysis, Technical Note #7, World Bank, Washington D.C.
World Health Organisation (2000). World Health Report 2000. Geneva, World Health Organisation. Xu, K., D. E. Evans, et al. (2003). “Household catastrophic health expenditure: a multicountry analysis.”
Lancet 362: 111-17.
Notes
1 Parameter values have been set following the advice of Deaton, A. (1997)., pp. 241-270. While emphasising the difficulty of identifying equivalence scales, Deaton suggests, on the basis of Rothbarth scales estimated for India, Indonesia, Pakistan and Sri Lanka, that the best approximation available is that a child costs roughly half that of an adult. The economies of scale parameter is set at 0.75 on the basis of the estimates of 0.72 and 0.87 estimated from Indian and Pakistani data. 2 In Sri Lanka, the available capital income data were used to estimate the distribution of only 50% of corporation/capital gains tax revenues to allow for non-sample error in the measurement of capital income and sampling error that is likely to be large due to the small number of households reporting such income. 3Health accounts data are used to compute this share as the product of the direct tax share of total health expenditure and TEH/GDP. 4 We should perhaps be a little cautionary about this particular result since the Japanese survey used to estimate the OOP distribution is rather small and not nationally representative. On the other hand, the results is perfectly consistent with findings for most other OECD countries Wagstaff, A., E. van Doorslaer, et al. (1999). 5 See also unpublished reports cited by Fabricant, S. J., C. W. Kamara, et al. (1999)., that are also usually specific to one rural region.
Copyright © 2022 FDOKUMEN