Financial Statements, Cash Flow, and Taxes
39
Financial Statements, Cash Flow, and Taxes W hen evaluating a company, who can you trust? The analysts at top brokerage firms rate compa- nies, using terms such as buy, hold, or sell. Maybe you think you can trust their ratings, since these analysts are highly trained and have access to great data sources. Think again. When the market was in the middle of a long, steady decline in the early 2000s, these analysts made 7,033 buy recommen- dations, but only 57 sells. What could possi- bly cause such optimism? How about their own personal compensation and their own firms’ profits, rather than their clients’ best interests? Most brokerage firms are mem- bers of a corporate family that includes an investment bank. If an analyst gives a com- pany a negative rating, the company will take its investment banking business to a banking firm that gives it a better rating. To prevent this defection, analysts are pres- sured to refrain from making low, offensive ratings. Indeed, analysts who don’t fall in line are often fired, such as Mike Mayo, for- merly of Credit Suisse First Boston, who gave honest (and subsequently shown to be accurate) negative ratings. In fact, at CSFB, the analysts actually reported to investment bankers, and internal e-mails revealed that analysts were often replaced to keep invest- ment banking clients happy. At Merrill Lynch, e-mail revealed an even more disturbing situation. Analysts consis- tently gave positive ratings to firms, but then blasted the firms in internal e-mails. For example, analysts gave one company a strong buy rating but wrote that the com- pany was “a piece of junk” in their internal e-mails. That’s actually better than the e-mail for another positively rated company, which was called a “piece of s—t.” Another company was rated “Neutral in the short term/Minimum 40% appreciation long term,” but e-mails stated that there was noth- ing interesting about the company, “except banking fees.” New York attorney general Eliot Spitzer brought action against a number of Wall Street firms, which eventually settled for $1.4 billion (but which didn’t stop the many suits brought against the firms by individ- ual investors who lost money after acting on chapter 3 Sources: Jeremy Kahn, “Frank Quattrone’s Heavy Hand,” Fortune, December 30, 2002, 78; Jeremy Kahn and Nelson D. Schwartz, “A New Investor Era? Ha!” Fortune, November 25, 2002, 35–38; David Rynecki, “The Price of Being Right,” Fortune, February 4, 2001, 126–141; Nelson D. Schwartz and Jeremy Kahn, “Can This Bull Run Again,” Fortune, December 30, 2002, 68–82; and Alynda Wheat, “Hall of Shame: Merrill Lynch-to-English Dictionary,” Fortune, April 29, 2002, 28.
-
Upload
khangminh22 -
Category
Documents
-
view
0 -
download
0
Transcript of Financial Statements, Cash Flow, and Taxes

Financial Statements, Cash Flow,
and Taxes
When evaluating a company, who
can you trust? The analysts at
top brokerage firms rate compa-
nies, using terms such as buy, hold, or sell.
Maybe you think you can trust their ratings,
since these analysts are highly trained and
have access to great data sources. Think
again. When the market was in the middle
of a long, steady decline in the early 2000s,
these analysts made 7,033 buy recommen-
dations, but only 57 sells. What could possi-
bly cause such optimism? How about their
own personal compensation and their own
firms’ profits, rather than their clients’ best
interests? Most brokerage firms are mem-
bers of a corporate family that includes an
investment bank. If an analyst gives a com-
pany a negative rating, the company will
take its investment banking business to a
banking firm that gives it a better rating. To
prevent this defection, analysts are pres-
sured to refrain from making low, offensive
ratings. Indeed, analysts who don’t fall in
line are often fired, such as Mike Mayo, for-
merly of Credit Suisse First Boston, who
gave honest (and subsequently shown to be
accurate) negative ratings. In fact, at CSFB,
the analysts actually reported to investment
bankers, and internal e-mails revealed that
analysts were often replaced to keep invest-
ment banking clients happy.
At Merrill Lynch, e-mail revealed an even
more disturbing situation. Analysts consis-
tently gave positive ratings to firms, but
then blasted the firms in internal e-mails.
For example, analysts gave one company a
strong buy rating but wrote that the com-
pany was “a piece of junk” in their internal
e-mails. That’s actually better than the
e-mail for another positively rated company,
which was called a “piece of s—t.” Another
company was rated “Neutral in the short
term/Minimum 40% appreciation long
term,” but e-mails stated that there was noth-
ing interesting about the company, “except
banking fees.”
New York attorney general Eliot Spitzer
brought action against a number of Wall
Street firms, which eventually settled for
$1.4 billion (but which didn’t stop the many
suits brought against the firms by individ-
ual investors who lost money after acting on
chapter 3
Sources: Jeremy Kahn, “Frank Quattrone’s Heavy Hand,” Fortune, December 30, 2002, 78; Jeremy Kahn and Nelson D. Schwartz,“A New Investor Era? Ha!” Fortune, November 25, 2002, 35–38; David Rynecki, “The Price of Being Right,” Fortune, February 4, 2001,126–141; Nelson D. Schwartz and Jeremy Kahn, “Can This Bull Run Again,” Fortune, December 30, 2002, 68–82; and Alynda Wheat,“Hall of Shame: Merrill Lynch-to-English Dictionary,” Fortune, April 29, 2002, 28.

A manager’s primary goal is to maximize the value of his or her firm’s stock.Value is based on the stream of cash flows the firm will generate in the future. Buthow does an investor go about estimating future cash flows, and how does a man-ager decide which actions are most likely to increase cash flows? The answers toboth questions lie in a study of the financial statements that publicly traded firmsmust provide to investors. Here, “investors” include both institutions (banks,insurance companies, pension funds, and the like) and individuals. Thus, thischapter begins with a discussion of what the basic financial statements are, howthey are used, and what kinds of financial information users need.
The value of any business asset—whether it is a financial asset such as a stock or a bond, or a real (physical) asset such as land, buildings, and equipment—dependson the usable, after-tax cash flows the asset is expected to produce. Therefore, thischapter also explains the difference between accounting income and cash flow.Finally, since it is after-tax cash flow that is important, this chapter provides anoverview of the federal income tax system.
3.1 Financial Statements and Reports
Of the various reports corporations issue to their stockholders, the annual report isprobably the most important. Two types of information are provided in an annualreport. First, there is a verbal section, often presented as a letter from the chairman,that describes the firm’s operating results during the past year and then discussesnew developments that will affect future operations. Second, the annual report pres-ents four basic financial statements—the balance sheet, the income statement, thestatement of retained earnings, and the statement of cash flows. Taken together, thesestatements give an accounting picture of the firm’s operations and financial posi-tion. Detailed data are provided for the two or three most recent years, along withhistorical summaries of key operating statistics for the past 5 or 10 years.1
The quantitative and verbal materials are equally important. The financialstatements report what has actually happened to assets, earnings, and dividendsover the past few years, whereas the verbal statements attempt to explain whythings turned out the way they did.
For illustrative purposes, we use data on MicroDrive Inc., a producer of diskdrives for microcomputers. Formed in 1982, MicroDrive has grown steadily and has earned a reputation for being one of the best firms in the microcomputer
the analysts’ recommendations). These legal
actions are getting some results. For example,
CSFB has reassigned analysts so that they
report to its general counsel instead of its secu-
rities division, and Morgan Stanley’s analysts
have actually increased the number of unfavor-
able ratings from 2% to over 22%.
Who can you trust? Your best bet is to learn
how to analyze a company, starting with this
chapter, and then trust yourself.
The textbook’s Web sitecontains an Excelfile that will guide youthrough the chapter’s calculations. The file forthis chapter is FM12 Ch 03 Tool Kit.xls and weencourage you to openthe file and follow alongas you read the chapter.
A source for links to theannual reports of manycompanies is http://www.annualreportservice.com.
1Firms also provide less comprehensive quarterly reports. Larger firms file even more detailed statements, givingbreakdowns for each major division or subsidiary, with the Securities and Exchange Commission (SEC). Thesereports, called 10-K reports, are available on the SEC’s Web site at http://www.sec.gov under the heading “EDGAR.”
84

The Balance Sheet 85
Corporate Valuation and Financial Statements
In Chapter 1, we told you that managers should striveto make their firms more valuable, and that the valueof a firm is determined by the size, timing, and risk
of its free cash flows (FCF). This chapter shows youhow to use a company’s financial statements to cal-culate FCF.
Value �FCF1
11 � WACC 21�
FCF2
11 � WACC 22�
FCF3
11 � WACC 23� p �
FCFq
11 � WACC 2q
components industry. MicroDrive’s earnings dropped a bit in the most recentyear, and management blamed a three-month strike that kept the firm from fullyutilizing a new plant that had been financed mostly with debt. However, man-agement went on to paint a more optimistic picture for the future, stating that fulloperations had been resumed, that several new products had been introduced,and that profits were expected to rise sharply. Of course, the profit increase maynot occur, and analysts should compare management’s past statements with sub-sequent results when judging the credibility of the projected improvement. In anyevent, the information contained in an annual report is used by investors to help form expec-tations about future earnings and dividends.
3.2 The Balance Sheet
Table 3-1 shows MicroDrive’s most recent balance sheets, which represent “snapshots” of its financial position on the last day of each year. Although mostcompanies report their balance sheets only on the last day of a given period, the“snapshot” actually changes daily as inventories are bought and sold, as fixedassets are added or retired, or as bank loan balances are increased or paid down.Moreover, a retailer will have much larger inventories before Christmas than laterin the spring, so balance sheets for the same company can look quite different atdifferent times during the year.
The left side of a balance sheet lists assets, which are the “things” the companyowns. They are listed in order of “liquidity,” or length of time it typically takes to convert them to cash at fair market values. The right side lists the claims thatvarious groups have against the company’s value, listed in the order in whichthey must be paid. For example, suppliers may have a claim called “accountspayable” that is due within 30 days, banks may have claims called “notespayable” that are due within 90 days, and bondholders may have claims that arenot due for 20 years or more. Stockholders come last, for two reasons. First, theirclaim represents ownership (or equity) and need never be “paid off.” Second, they
What is the annual report, and what two types of information are given in it?Why is the annual report of great interest to investors?What four types of financial statements are typically included in the annual report?
SELF-TEST

Assets 2007 2006 Liabilities and Equity 2007 2006
Cash and equivalents $ 10 $ 15 Accounts payable $ 60 $ 30
Short-term investments 0 65 Notes payable 110 60
Accounts receivable 375 315 Accruals 140 130
Inventories 615 415 Total current liabilities $ 310 $ 220
Total current assets $1,000 $ 810 Long-term bonds 754 580
Net plant and equipment 1,000 870 Total liabilities $1,064 $ 800
Preferred stock (400,000 40 40shares)
Common stock (50,000,000 130 130shares)
Retained earnings 766 710
Total common equity $ 896 $ 840
Total assets $2,000 $1,680 Total liabilities and equity $2,000 $1,680
MicroDrive Inc.: December 31 Balance Sheets (Millions of Dollars)Table 3-1
86 Chapter 3 Financial Statements, Cash Flow, and Taxes
have a residual claim in the sense that they may receive payments only if the otherclaimants have already been paid. The nonstockholder claims are liabilities fromthe stockholders’ perspective. The amounts shown on the balance sheets arecalled book values since they are based on the amounts recorded by bookkeeperswhen assets are purchased or liabilities are issued. As you will see throughout thistextbook, book values may be very different from market values, which are thecurrent values as determined in the marketplace.
The following sections provide more information about specific asset, liability,and equity accounts.
AssetsCash, short-term investments, accounts receivable, and inventories are listed ascurrent assets, because MicroDrive is expected to convert them into cash within ayear. All assets are stated in dollars, but only cash represents actual money thatcan be spent. Some marketable securities mature very soon, and can be convertedquickly into cash at prices close to their book values. These securities are called“cash equivalents,” and they are included with cash. Therefore, MicroDrive couldwrite checks for a total of $10 million. Other types of marketable securities have alonger time until maturity, and their market values are less predictable. Thesesecurities are classified as “short-term investments.”
When MicroDrive sells its products to a customer but doesn’t demand imme-diate payment, the customer then has an obligation called an “account receivable.”The $375 million shown in accounts receivable is the amount of sales for whichMicroDrive has not yet been paid.
Inventories show the dollars MicroDrive has invested in raw materials, work-in-process, and finished goods available for sale. MicroDrive uses the FIFO (first-in, first-out) method to determine the inventory value shown on its balancesheet ($615 million). It could have used the LIFO (last-in, first-out) method.
See FM12 Ch 03 ToolKit.xls for all details.

The Balance Sheet 87
During a period of rising prices, by taking out old, low-cost inventory and leavingin new, high-cost items, FIFO will produce a higher balance sheet inventory valuebut a lower cost of goods sold on the income statement. (This is strictly used foraccounting; companies actually use older items first.) Because MicroDrive usesFIFO, and because inflation has been occurring, (1) its balance sheet inventoriesare higher than they would have been had it used LIFO, (2) its cost of goods soldis lower than it would have been under LIFO, and (3) its reported profits are there-fore higher. In MicroDrive’s case, if the company had elected to switch to LIFO, itsbalance sheet would have inventories of $585 million rather than $615 million, andits earnings (discussed in the next section) would have been reduced by $18 million.Thus, the inventory valuation method can have a significant effect on financialstatements, which is important to know when comparing different companies.
Rather than treat the entire purchase price of a long-term asset (such as a fac-tory, plant, or equipment) as an expense in the purchase year, accountants“spread” the purchase cost over the asset’s useful life.2 The amount they chargeeach year is called the depreciation expense. Some companies report an amountcalled “gross plant and equipment,” which is the total cost of the long-term assetsthey have in place, and another amount called “accumulated depreciation,” whichis the total amount of depreciation that has been charged on those assets. Somecompanies, such as MicroDrive, only report net plant and equipment, which isgross plant and equipment less accumulated depreciation. Chapter 12 provides amore detailed explanation of depreciation methods.
Liabilities and EquityAccounts payable, notes payable, and accruals are listed as current liabilities,because MicroDrive is expected to pay them within a year. When MicroDrive pur-chases supplies but doesn’t immediately pay for them, it takes on an obligationcalled an account payable. Similarly, when MicroDrive takes out a loan that mustbe repaid within a year, it signs an IOU called a note payable. MicroDrive doesn’tpay its taxes or its employees’ wages daily, and the amount it owes on these itemsat any point in time is called an “accrual,” or an “accrued expense.” Long-termbonds are also liabilities because they, too, reflect a claim held by someone otherthan a stockholder.
Preferred stock is a hybrid, or a cross between common stock and debt. In theevent of bankruptcy, preferred stock ranks below debt but above common stock.Also, the preferred dividend is fixed, so preferred stockholders do not benefit if thecompany’s earnings grow. Most firms do not use much, or even any, preferred stock,so “equity” usually means “common equity” unless the words “total” or “preferred”are included.
When a company sells shares of stock, the proceeds are recorded in the com-mon stock account.3 Retained earnings are the cumulative amount of earnings thathave not been paid out as dividends. The sum of common stock and retainedearnings is called “common equity,” or sometimes just equity. If a company’sassets could actually be sold at their book value, and if the liabilities and preferred
2This is called accrual accounting, which attempts to match revenues to the periods in which they are earned andexpenses to the periods in which the effort to generate income occurred. Students sometimes call this “a cruel rule”because it can be confusing.3Companies sometimes break the total proceeds into two parts, one called “par” and the other called “paid-in-capital”or “capital surplus.” For example, if a company sells shares of stock for $10, it might record $1 of par and $9 ofpaid-in-capital. For most purposes, the distinction between par and paid-in-capital is not important, and most companies use no-par stock.

88 Chapter 3 Financial Statements, Cash Flow, and Taxes
stock were actually worth their book values, then a company could sell its assets,pay off its liabilities and preferred stock, and the remaining cash would belong tocommon stockholders. Therefore, common equity is sometimes called networth—it’s the assets net of the liabilities.
3.3 The Income Statement
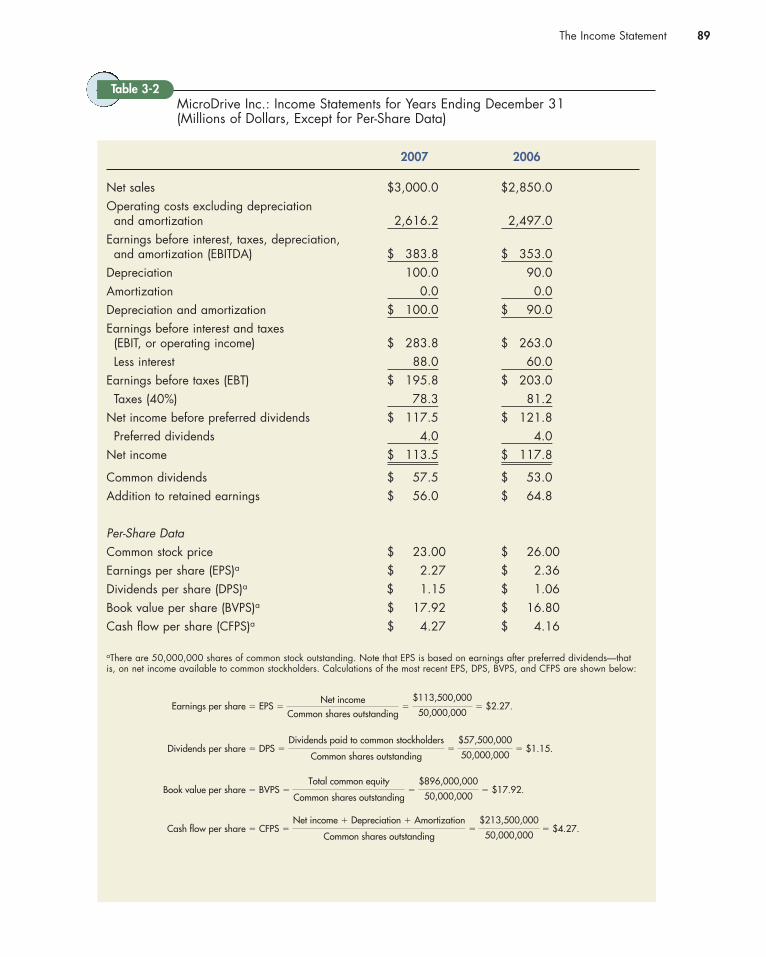
Table 3-2 gives the income statements for MicroDrive, which show its financialperformance over each of the last 2 years. Income statements can cover any peri-od of time, but they are usually prepared monthly, quarterly, and annually. Unlikethe balance sheet, which is a snapshot of a firm at a point in time, the income state-ment reflects performance during the period.
Subtracting operating costs from net sales but excluding depreciation andamortization results in EBITDA, which stands for earnings before interest, taxes,depreciation, and amortization. Depreciation and amortization are annual chargesthat reflect the estimated costs of the assets used up each year. Depreciationapplies to tangible assets, such as plant and equipment, whereas amortizationapplies to intangible assets such as patents, copyrights, trademarks, and goodwill.4
Because neither depreciation nor amortization is paid in cash, some analysts claimthat EBITDA is a better measure of financial strength than is net income. However,as we show later in the chapter, EBITDA is not as important as free cash flow. Infact, some financial wags have stated that EBITDA really stands for “earningsbefore anything bad happens.”
The net income available to common shareholders, which is revenues lessexpenses, taxes, and preferred dividends (but before paying common dividends),is generally referred to as net income, although it is also called profit or earnings,particularly in the news or financial press. Dividing net income by the number ofshares outstanding gives earnings per share (EPS), which is often called “the bot-tom line.” Throughout this book, unless otherwise indicated, net income meansnet income available to common stockholders.5
4The accounting treatment of goodwill resulting from mergers has changed in recent years. Rather than an annualcharge, companies are required to periodically evaluate the value of goodwill and reduce net income only if thegoodwill’s value has decreased materially (“become impaired,” in the language of accountants). For example, in 2002 AOL Time Warner wrote off almost $100 billion associated with the AOL merger. It doesn’t take too many $100 billion expenses to really hurt net income!5Companies report “comprehensive income” as well as net income. Comprehensive income is equal to net incomeplus several comprehensive income items. One example of comprehensive income is the unrealized gain or loss thatoccurs when a marketable security, classified as “available for sale,” is marked-to-market. For our purposes, weassume that there are no comprehensive income items, so we present only basic income statements throughout thetext. Although not required, some companies also report “pro forma income.” For example, if a company incurs anexpense that it doesn’t expect to recur, such as the closing of a plant, it might calculate pro forma income as thoughit had not incurred the one-time expense. There are no hard and fast rules for calculating pro forma income, andcompanies report it on a voluntary basis. As a result, it is often subject to abuse, with many companies finding ingen-ious ways to make pro forma income higher than traditional income. The SEC and the Public Company AccountingOversight Board (PCAOB) are taking steps to reduce deceptive uses of pro forma reporting.
What is the balance sheet, and what information does it provide?How is the order of the information shown on the balance sheet determined?Why might a company’s December 31 balance sheet differ from its June 30 balance sheet?A firm has $8 million in total assets. It has $3 million in current liabilities, $2 million in long-term debt,and $1 million in preferred stock. What is the total value of common equity? ($2 million)
SELF-TEST
The Income Statement 89
MicroDrive Inc.: Income Statements for Years Ending December 31(Millions of Dollars, Except for Per-Share Data)
Table 3-2
2007 2006
Net sales $3,000.0 $2,850.0
Operating costs excluding depreciation and amortization 2,616.2 2,497.0
Earnings before interest, taxes, depreciation, and amortization (EBITDA) $ 383.8 $ 353.0
Depreciation 100.0 90.0
Amortization 0.0 0.0
Depreciation and amortization $ 100.0 $ 90.0
Earnings before interest and taxes (EBIT, or operating income) $ 283.8 $ 263.0
Less interest 88.0 60.0
Earnings before taxes (EBT) $ 195.8 $ 203.0
Taxes (40%) 78.3 81.2
Net income before preferred dividends $ 117.5 $ 121.8
Preferred dividends 4.0 4.0
Net income $ 113.5 $ 117.8
Common dividends $ 57.5 $ 53.0
Addition to retained earnings $ 56.0 $ 64.8
Per-Share Data
Common stock price $ 23.00 $ 26.00
Earnings per share (EPS)a $ 2.27 $ 2.36
Dividends per share (DPS)a $ 1.15 $ 1.06
Book value per share (BVPS)a $ 17.92 $ 16.80
Cash flow per share (CFPS)a $ 4.27 $ 4.16
aThere are 50,000,000 shares of common stock outstanding. Note that EPS is based on earnings after preferred dividends—thatis, on net income available to common stockholders. Calculations of the most recent EPS, DPS, BVPS, and CFPS are shown below:
Cash flow per share � CFPS �
Net income � Depreciation � Amortization
Common shares outstanding�
$213,500,000
50,000,000� $4.27.
Book value per share � BVPS �
Total common equity
Common shares outstanding�
$896,000,000
50,000,000� $17.92.
Dividends per share � DPS �
Dividends paid to common stockholders
Common shares outstanding�
$57,500,000
50,000,000� $1.15.
Earnings per share � EPS �Net income
Common shares outstanding�
$113,500,000
50,000,000� $2.27.

90 Chapter 3 Financial Statements, Cash Flow, and Taxes
3.4 Statement of Retained Earnings
Table 3-3, the statement of retained earnings, shows that MicroDrive began 2007with $710 million of retained earnings, that during the year it earned $113.5 mil-lion and paid out $57.5 in dividends, and that it plowed the difference, $56 mil-lion, back into the business. These “corporate savings” caused retained earningsto increase from $710 million at the end of 2006 to $766 million at the end of 2007.
Note that “retained earnings” represents a claim against assets, not an asset perse. In 2007 MicroDrive’s stockholders allowed it to reinvest $56 million instead ofdistributing the money as dividends, and management spent this money on newassets. Thus, retained earnings as reported on the balance sheet does not representcash and is not “available” for the payment of dividends or anything else.6
MicroDrive Inc.: Statement of Retained Earnings for YearEnding December 31, 2007 (Millions of Dollars)
Balance of retained earnings, December 31, 2006 $710.0
Add: Net income, 2007 113.5
Less: Dividends to common stockholders (57.5)a
Balance of retained earnings, December 31, 2007 $766.0
aHere, and throughout the book, parentheses are used to denote negative numbers.
Table 3-3
6The amount reported in the retained earnings account is not an indication of the amount of cash the firm has. Cash (as of the balance sheet date) is found in the cash account, an asset account. A positive number in the retainedearnings account indicates only that in the past the firm earned some income, but its dividends paid were less thanits earnings. Even though a company reports record earnings and shows an increase in its retained earningsaccount, it still may be short of cash.
The same situation holds for individuals. You might own a new BMW (no loan), lots of clothes, and an expensivestereo, hence have a high net worth, but if you have only 23 cents in your pocket plus $5 in your checking account,you will still be short of cash.
See FM12 Ch 03 Tool
Kit.xls for all details.
What is an income statement, and what information does it provide?Why is earnings per share called “the bottom line”?What is EBITDA?Regarding the time period reported, how does the income statement differ from the balance sheet?A firm has $2 million in earnings before taxes. The firm has an interest expense of $300,000 and depreciation of $200,000; it has no amortization. What is its EBITDA? ($2.5 million)
SELF-TEST
What is the statement of retained earnings, and what information does it provide?Why do changes in retained earnings occur?Explain why the following statement is true: “Retained earnings as reported on the balance sheet doesnot represent cash and is not ‘available’ for the payment of dividends or anything else.”A firm had a retained earnings balance of $3 million in the previous year. In the current year, its net incomeis $2.5 million. If it pays $1 million in common dividends in the current year, what is its resulting retainedearnings balance? ($4.5 million)
SELF-TEST

Net Cash Flow 91
3.5 Net Cash Flow
Many financial analysts focus on net cash flow. A business’s net cash flow gen-erally differs from its accounting profit because some of the revenues andexpenses listed on the income statement were not received or paid in cashduring the year. The relationship between net cash flow and net income can beexpressed as follows:
(3-2)Net cash flow � Net income � Depreciation and amortization.
Net cash flow � $113.5 � $100.0 � $213.5 million.
To keep things simple, we will generally assume that Equation 3-2 holds. However,you should remember that Equation 3-2 will not accurately reflect net cash flow inthose instances where there are significant noncash items beyond depreciationand amortization.
We can illustrate Equation 3-2 with 2007 data for MicroDrive taken from Table 3-2:
To illustrate depreciation’s effect, suppose a machine with a life of 5 years anda zero expected salvage value was purchased in 2006 for $100,000 and placed intoservice in 2007. This $100,000 cost is not expensed in the purchase year; rather, itis charged against production over the machine’s 5-year depreciable life. If thedepreciation expense were not taken, profits would be overstated, and taxeswould be too high. So, the annual depreciation charge is deducted from sales rev-enues, along with such other costs as labor and raw materials, to determineincome. However, because the $100,000 was actually expended back in 2006, thedepreciation charged against income in 2007 and subsequent years is not a cashoutlay, as are labor or raw materials charges. Depreciation is a noncash charge, soit must be added back to net income to obtain the net cash flow. If we assume thatall other noncash items (including amortization) sum to zero, then net cash flowis simply equal to net income plus depreciation.
(3-1)Net cash flow � Net income � Noncash revenues � Noncash charges.
The primary examples of noncash charges are depreciation and amortization.These items reduce net income but are not paid out in cash, so we add them backto net income when calculating net cash flow. Another example of a noncashcharge is deferred taxes. In some instances, companies are allowed to defer taxpayments to a later date even though the tax payment is reported as an expenseon the income statement. Therefore, deferred tax payments are added to netincome when calculating net cash flow.7 At the same time, some revenues may not be collected in cash during the year, and these items must be subtracted fromnet income when calculating net cash flow.
Typically, depreciation and amortization are by far the largest noncash items,and in many cases the other noncash items roughly net out to zero. For this rea-son, many analysts assume that net cash flow equals net income plus depreciationand amortization:
7Deferred taxes may arise, for example, if a company uses accelerated depreciation for tax purposes but straight-linedepreciation for reporting its financial statements to investors.

92 Chapter 3 Financial Statements, Cash Flow, and Taxes
Financial Analysis on the Internet
A wide range of valuable financial information isavailable on the Internet. With just a couple of clicks,an investor can easily find the key financial state-ments for most publicly traded companies. Here’s apartial (but by no means a complete) list of placesyou can go to get started:
• One of the very best sources of financial infor-mation is Thomson Financial. Go to the text-book’s Web site and follow the directions toaccess ThomsonONE—Business School Edition.An especially useful feature is the ability to down-load up to 10 years of financial statements inspreadsheet form. First, enter the ticker for acompany and click GO. From the top tab (indark blue), select Financials. This will show asecond row of items (in light blue). SelectingMore from this row will reveal a drop-downmenu. Select SEC Database Reports & Charts.This will bring up another drop-down menuwhich includes the ten-year balance sheets,income statements, and statement of cash flows.To download the financial statements into aspreadsheet, first select one of the statements,such as the 10YR Balance Sheet. The balancesheets will then be displayed on your browserpage. To download, click on the Excel icontoward the right of the light blue row at the topof the ThomsonONE panel. This will bring up adialog box that lets you download the Excel fileto your computer.
• Try Yahoo’s finance Web site, http://finance.yahoo.com. Here you will find updated marketinformation along with links to a variety of inter-esting research sites. Enter a stock’s ticker sym-bol, click GO, and you will see the stock’s currentprice, along with recent news about the compa-ny. The panel on the left has links to key statistics,the company’s income statement, balance sheet,statement of cash flows, and more. The Yahoo
site also has a list of insider transactions, so youcan tell if a company’s CEO and other key insid-ers are buying or selling their company’s stock. Inaddition, there is a message board whereinvestors share opinions about the company, andthere is a link to the company’s filings with theSecurities and Exchange Commission (SEC).Note that, in most cases, a more complete list ofthe SEC filings can be found at http://www.sec.gov.
• Other sources for up-to-date market informationare http://money.cnn.com, and http://www.zacks.com. These sites also provide financial state-ments in standardized formats.
• Both http://www.bloomberg.com and http://www.marketwatch.com have areas where youcan obtain stock quotes along with companyfinancials, links to Wall Street research, andlinks to SEC filings.
• If you are looking for charts of key accountingvariables (for example, sales, inventory, depre-ciation and amortization, and reported earn-ings), along with the financial statements, take alook at http://www.smartmoney.com.
• Another good place to look is http://www.investor.reuters.com. Here you can find links toanalysts’ research reports along with the keyfinancial statements.
• Zacks (shown above) and http://www.hoovers.com each has free research available alongwith more detailed information provided to sub-scribers.
Once you have accumulated all of this information,you may be looking for sites that provide opinionsregarding the direction of the overall market andviews regarding individual stocks. Two popular sitesin this category are The Motley Fool’s Web site, http://www.fool.com, and the Web site for The Street.com,http://www.thestreet.com.
Differentiate between net cash flow and accounting profit.In accounting, the emphasis is on net income. What is emphasized in finance, and why is that itememphasized?A firm has net income of $5 million. Assuming that depreciation of $1 million is its only noncash expense,what is the firm’s net cash flow? ($6 million)
SELF-TEST
Statement of Cash Flows 93
3.6 Statement of Cash Flows
Even if a company reports a large net income during a year, the amount of cashreported on its year-end balance sheet may be the same or even lower than itsbeginning cash. The reason is that its net income can be used in a variety of ways,not just kept as cash in the bank. For example, the firm may use its net income topay dividends, to increase inventories, to finance accounts receivable, to invest infixed assets, to reduce debt, or to buy back common stock. Indeed, the company’scash position as reported on its balance sheet is affected by a great many factors,including the following:
1. Net income before preferred dividends. Other things held constant, a posi-tive net income will lead to more cash in the bank. However, as we discussbelow, other things generally are not held constant.
2. Noncash adjustments to net income. To calculate cash flow, it is necessaryto adjust net income to reflect noncash revenues and expenses, such asdepreciation and deferred taxes, as shown above in the calculation of netcash flow.
3. Changes in working capital. Increases in current assets other than cash, suchas inventories and accounts receivable, decrease cash, whereas decreases inthese accounts increase cash. For example, if inventories are to increase, thefirm must use some of its cash to acquire the additional inventory. Conversely,if inventories decrease, this generally means the firm is selling inventories andnot replacing all of them, hence generating cash. On the other hand, if payablesincrease, the firm has received additional credit from its suppliers, which savescash, but if payables decrease, this means it has used cash to pay off its sup-pliers. Therefore, increases in current liabilities such as accounts payableincrease cash, whereas decreases in current liabilities decrease cash.
4. Investments. If a company invests in fixed assets or short-term financialinvestments, this will reduce its cash position. On the other hand, if it sellssome fixed assets or short-term investments, this will increase cash.
5. Security transactions and dividend payments. If a company issuesstock or bonds during the year, the funds raised will increase its cash posi-tion. On the other hand, if the company uses cash to buy back outstandingstock or to pay off debt, or if it pays dividends to its shareholders, this willreduce cash.
Each of the above factors is reflected in the statement of cash flows, whichsummarizes the changes in a company’s cash position. The statement separatesactivities into three categories, plus a summary section:
1. Operating activities, which includes net income, depreciation, changes incurrent assets and liabilities other than cash, short-term investments, andshort-term debt.
2. Investing activities, which includes investments in or sales of fixed assets andshort-term financial investments.
3. Financing activities, which includes raising cash by issuing short-term debt,long-term debt, or stock. Also, because both dividends paid and cash used tobuy back outstanding stock or bonds reduce the company’s cash, such trans-actions are included here.

94 Chapter 3 Financial Statements, Cash Flow, and Taxes
Accounting texts explain how to prepare the statement of cash flows, but thestatement is used to help answer questions such as these: Is the firm generatingenough cash to purchase the additional assets required for growth? Is the firm gen-erating any extra cash that can be used to repay debt or to invest in new products?Such information is useful both for managers and investors, so the statement ofcash flows is an important part of the annual report.
MicroDrive Inc.: Statement of Cash Flows for 2007 (Millions of Dollars)
Table 3-4
Cash Provided or Used
Operating Activities
Net income before preferred dividends $117.5
Adjustments:
Noncash adjustments:
Depreciationa 100.0
Due to changes in working capital:b
Increase in accounts receivable (60.0)
Increase in inventories (200.0)
Increase in accounts payable 30.0
Increase in accruals 10.0
Net cash provided by operating activities ($ 2.5)
Investing Activities
Cash used to acquire fixed assetsc ($230.0)
Sale of short-term investments $ 65.0
Net cash provided by investing activities ($165.0)
Financing Activities
Increase in notes payable $ 50.0
Increase in bonds outstanding 174.0
Payment of preferred and common dividends (61.5)
Net cash provided by financing activities $162.5
Summary
Net change in cash ($ 5.0)
Cash at beginning of year 15.0
Cash at end of year $ 10.0
aDepreciation is a noncash expense that was deducted when calculating net income. It must be added back to show the correct cash flow from operations.bAn increase in a current asset decreases cash. An increase in a current liability increases cash. For example,inventories increased by $200 million and therefore reduced cash by a like amount.cThe net increase in fixed assets is $130 million; however, this net amount is after a deduction for the year’sdepreciation expense. Depreciation expense would have to be added back to find the increase in gross fixedassets. From the company’s income statement, we see that the 2007 depreciation expense is $100 million; thus,expenditures on fixed assets were actually $230 million.
See FM12 Ch 03 ToolKit.xls for all details.

Modifying Accounting Data for Managerial Decisions 95
Table 3-4 shows MicroDrive’s statement of cash flows as it would appear in thecompany’s annual report. The top section shows cash generated by and used in oper-ations—for MicroDrive, operations provided net cash flows of minus $2.5 million.This subtotal, the minus $2.5 million net cash flow provided by operating activ-ities, is in many respects the most important figure in any of the financial statements.Profits as reported on the income statement can be “doctored” by such tactics asdepreciating assets too slowly, not recognizing bad debts promptly, and the like.However, it is far more difficult to simultaneously doctor profits and the workingcapital accounts. Therefore, it is not uncommon for a company to report positive netincome right up to the day it declares bankruptcy. In such cases, however, thenet cash flow from operations almost always began to deteriorate much earlier, andanalysts who kept an eye on cash flow could have predicted trouble. Therefore, ifyou are ever analyzing a company and are pressed for time, look first at the trend innet cash flow provided by operating activities, because it will tell you more than anyother number.
The second section shows investing activities. MicroDrive purchased fixedassets totaling $230 million and sold $65 million of short-term investment, fora net cash flow from investing activities of minus $165 million.
The third section, financing activities, includes borrowing from banks (notespayable), selling new bonds, and paying dividends on common and preferred stock.MicroDrive raised $224 million by borrowing, but it paid $61.5 million in preferred and common dividends. Therefore, its net inflow of funds from financ-ing activities was $162.5 million.
In the summary, where all of these sources and uses of cash are totaled, we seethat MicroDrive’s cash outflows exceeded its cash inflows by $5 million during2007; that is, its net change in cash was a negative $5 million.
MicroDrive’s statement of cash flows should be worrisome to its managers andto outside analysts. The company had a $2.5 million cash shortfall from operations,it spent an additional $230 million on new fixed assets, and it paid out another $61.5million in dividends. It covered these cash outlays by borrowing heavily and by liq-uidating $65 million of short-term investments. Obviously, this situation cannotcontinue year after year, so something will have to be done. Later in the chapterwe consider some of the actions MicroDrive’s financial staff might recommend toease the cash flow problem.8
3.7 Modifying Accounting Data for Managerial Decisions
Thus far in the chapter we have focused on financial statements as they are presented in the annual report. However, these statements are designed more foruse by creditors and tax collectors than for managers and stock analysts.Therefore, certain modifications are needed for use in corporate decision making.
8For a more detailed discussion of financial statement analysis, see Lyn M. Fraser and Aileen Ormiston,Understanding Financial Statements, 8th ed. (Upper Saddle River, NJ: Prentice-Hall, 2007).
What types of questions does the statement of cash flows answer?Identify and briefly explain the three different categories of activities shown in the statement of cashflows.A firm has inventories of $2 million for the previous year and $1.5 million for the current year. Whatimpact does this have on net cash provided by operations? (Increase of $500,000)
SELF-TEST

96 Chapter 3 Financial Statements, Cash Flow, and Taxes
In the following sections we discuss how financial analysts combine stock pricesand accounting data to make the statements more useful.
Operating Assets and Total Net Operating CapitalDifferent firms have different financial structures, different tax situations, anddifferent amounts of nonoperating assets. These differences affect traditionalaccounting measures such as the rate of return on equity. They can cause twofirms, or two divisions within a single firm, that actually have similar operationsto appear to be operated with different efficiency. This is important, because ifmanagerial compensation systems are to function properly, operating managersmust be judged and compensated for those things that are under their control, noton the basis of things outside their control. Therefore, to judge managerial per-formance, we need to compare managers’ ability to generate operating income(EBIT) with the operating assets under their control.
The first step in modifying the traditional accounting framework is todivide total assets into two categories, operating assets, which consist of theassets necessary to operate the business, and nonoperating assets, whichinclude cash and short-term investments above the level required for normaloperations, investments in subsidiaries, land held for future use, and the like.Moreover, operating assets are further divided into operating current assets,such as inventory, and long-term operating assets, such as plant and equip-ment. Obviously, if a manager can generate a given amount of profit and cashflow with a relatively small investment in operating assets, then the amount ofcapital investors must put up is reduced and the rate of return on that capitalincreases.
Most capital used in a business is supplied by investors—stockholders, bond-holders, and lenders such as banks. Investors must be paid for the use of theirmoney, with payment coming as interest in the case of debt and as dividends pluscapital gains in the case of stock. So, if a company buys more assets than it actu-ally needs, and thus raises too much capital, then its capital costs will be unnec-essarily high.
Must all of the capital used to acquire assets be obtained from investors? The answer is no, because some of the funds are provided as a normal conse-quence of operations. For example, some funds will come from suppliers and bereported as accounts payable, while other funds will come as accrued wages andaccrued taxes, which amount to short-term loans from workers and tax authorities.Such funds are called operating current liabilities. Therefore, if a firm needs $100 million of assets, but it has $10 million of accounts payable and another $10 million of accrued wages and taxes, then its investor-supplied capital would beonly $80 million.
Net operating working capital is defined as operating current assets minusoperating current liabilities. In other words, net operating working capital is theworking capital acquired with investor-supplied funds. Here is the definition inequation form:
Net operating Operating current Operating currentworking capital � assets � liabilities (3-3).

Modifying Accounting Data for Managerial Decisions 97
Now think about how these concepts can be used in practice. First, allcompanies must carry some cash to “grease the wheels” of their operations.Companies continuously receive checks from customers and write checks tosuppliers, employees, and so on. Because inflows and outflows do not coincideperfectly, a company must keep some cash in its bank account. In other words,some cash is required to conduct operations. The same is true for most other cur-rent assets, such as inventory and accounts receivable, which are required for nor-mal operations. However, any short-term securities the firm holds generally resultfrom investment decisions made by the treasurer, and they are not used in the coreoperations. Therefore, short-term investments are normally excluded when calcu-lating net operating working capital.9
Some current liabilities—especially accounts payable and accruals—arise inthe normal course of operations. Moreover, each dollar of such current liabilitiesis a dollar that the company does not have to raise from investors to acquire cur-rent assets. Therefore, to calculate net operating working capital, we deduct theseoperating current liabilities from the operating current assets. Other current lia-bilities that charge interest, such as notes payable to banks, are treated as investor-supplied capital and thus are not deducted when calculating net working capital.
If you are ever uncertain about an item, ask yourself whether it is a naturalconsequence of operations or if it is a discretionary choice, such as a particularmethod of financing, or an investment in a financial asset. If it is discretionary, itis not an operating asset or liability.
We can apply these definitions to MicroDrive, using the balance sheet datagiven in Table 3-1. Here is the net operating working capital for 2007:
Net operating working capital � (Cash � Accounts receivable � Inventories) � (Accounts payable � Accruals)
� ($10 � $375 � $615) � ($60 � $140)
� $800 million.
MicroDrive’s total net operating capital at year-end 2007 was the sum of its netoperating working capital and its operating long-term assets (which consist onlyof net plant and equipment):
9If the marketable securities are held as a substitute for cash, and therefore reduce the cash requirements, then theymay be classified as part of operating working capital. Generally, though, large holdings of marketable securitiesare held as a reserve for some contingency or else as a temporary “parking place” for funds prior to an acquisition,a major capital investment program, or the like.
For the previous year, net operating working capital was
� $585 million.
Net operating working capital � ($15 � $315 � $415) � ($30 � $130)
(3-4)
� $1,800 million.
� $800 � $1,000
� 1Operating long-term assets 2
Total net operating capital � 1Net operating working capital 2

98 Chapter 3 Financial Statements, Cash Flow, and Taxes
Adding the $870 million of fixed assets, its total operating capital at year-end2006 was
� $1,455 million.
Total net operating capital � $585 � $870
Notice that we have defined total net operating capital as the sum of net operating working capital and operating long-term assets. In other words, ourdefinition is in terms of operating assets and liabilities. However, we can also cal-culate total net operating capital by adding up the funds provided by investors,such as notes payable, long-term bonds, preferred stock, and common equity. For MicroDrive, the total capital provided by investors at year-end 2006 was $60 � $580 � $40 � $840 � $1,520 million. Of this amount, $65 million was tiedup in short-term investments, which are not directly related to MicroDrive’s oper-ations. Therefore, only $1,520 � $65 � $1,455 million of investor-supplied capitalwas used in operations. Notice that this is exactly the same value as calculatedabove. This shows that we can calculate total net operating capital either from netoperating working capital and operating long-term assets or from the investor-supplied funds. We usually base our calculations upon the first definition since itis possible to perform this calculation for a division, whereas it is not possible todo so using the definition based on investor-supplied capital.
We use the terms total net operating capital, operating capital, net operatingassets, and capital to mean the same thing. Unless we specifically say “investor-supplied capital,” we are referring to total net operating capital.
MicroDrive increased its operating capital to $1,800 from $1,455 million, or by$345 million, during 2007. Furthermore, most of this increase went into working cap-ital, which rose from $585 to $800 million, or by $215 million. This 37% increase in netoperating working capital versus a sales increase of only 5% (from $2,850 to $3,000million) should set off warning bells in your head: Why did MicroDrive tie up somuch additional cash in working capital? Is the company gearing up for a bigincrease in sales, or are inventories not moving and receivables not being collected?We will address these questions in detail in Chapter 4, when we cover ratio analysis.
Net Operating Profit After Taxes (NOPAT)If two companies have different amounts of debt, hence different amounts ofinterest charges, they could have identical operating performances but differentnet incomes—the one with more debt would have a lower net income. Net incomeis certainly important, but it does not always reflect the true performance of acompany’s operations or the effectiveness of its operating managers. A bettermeasurement for comparing managers’ performance is net operating profit aftertaxes, or NOPAT, which is the amount of profit a company would generate if ithad no debt and held no financial assets. NOPAT is defined as follows:10
10For firms with a more complicated tax situation, it is better to define NOPAT as follows: NOPAT � (Net incomebefore preferred dividends) � (Net interest expense)(1 � Tax rate). Also, if firms are able to defer paying some oftheir taxes, perhaps by the use of accelerated depreciation, then NOPAT should be adjusted to reflect the taxes thatthe company actually paid on its operating income. See P. Daves, M. Ehrhardt, and R. Shrieves, CorporateValuation: A Guide for Managers and Investors (Mason, OH: Thomson South-Western, 2004) for a detailed explana-tion of these and other adjustments. Also see Tim Koller, Marc Goedhart, and David Wessels, Valuation: Measuringand Managing the Value of Companies (Hoboken, N.J.: John Wiley & Sons, Inc., 2005) and G. Bennett Stewart,The Quest for Value (New York: Harper Collins, 1991).
(3-5)NOPAT � EBIT11 � Tax rate 2 .

Modifying Accounting Data for Managerial Decisions 99
This means MicroDrive generated an after-tax operating profit of $170.3 mil-lion, a little better than its previous NOPAT of $263(0.6) � $157.8 million.However, the income statements in Table 3-2 show that MicroDrive’s earnings pershare actually declined. This decrease in EPS was caused by an increase in inter-est expense, and not by a decrease in operating profit. Moreover, the balancesheets in Table 3-1 show an increase in debt. But why did MicroDrive increase itsdebt? As we just saw, its investment in operating capital increased dramaticallyduring 2007, and that increase was financed primarily with debt.
Free Cash FlowEarlier in this chapter, we defined net cash flow as net income plus noncashadjustments, which typically means net income plus depreciation. Note, though,
Using data from the income statements of Table 3-2, MicroDrive’s 2007 NOPAT isfound to be
NOPAT � $283.8 (1 � 0.4) � $283.8 (0.6) � $170.3 million.
Financial Bamboozling: How to Spot It
Recent accounting frauds by Enron, WorldCom,Xerox, Merck, Arthur Andersen, Tyco, and many oth-ers have shown that analysts can no longer blindlyassume that a firm’s published financial statements arethe best representation of its financial position.Clearly, many companies were “pushing the enve-lope” if not outright lying in an effort to make theircompanies look better.
A recent Fortune article points out that there areonly three basic ways to manipulate financial state-ments: moving earnings from the future to the pres-ent, avoiding taxes, or hiding debt. For example,suppose one telecom firm (think WorldCom orGlobal Crossing) sold the right to use parts of itsfiber-optic network for 10 years to another telecomfirm for $100 million. The seller would immediatelyrecord revenues of $100 million. The buyer, how-ever, could spread the expense over 10 years andreport an expense of only $10 million this year. Thebuyer would simultaneously sell similar rights to theoriginal seller for $100 million. This way, no cashchanges hands, both companies report an extra$100 million in revenue, but each reports a cost ofonly $10 million. Thus, both companies “created”an extra $90 million in pre-tax profits, withoutdoing anything. Of course, both companies willhave to report an extra $10 million expense eachyear for the remaining 9 years, but they have eachboosted short-term profits and thus this year’s exec-
utive bonuses. To boost earnings next year, all theyhave to do is play the same game, but on a biggerscale.
For hiding debt, it’s hard to beat Enron’s specialpurpose entities (SPEs). These SPEs owed hundreds ofmillions of dollars, and it turned out that Enron wasresponsible for this debt, even though it nevershowed up on Enron’s financial statements.
How can you spot bamboozling? Here are sometips. When companies have lots of write-offs orcharges for restructuring, it could be that they areplanning on managing earnings in the future. In otherwords, they sandbag this year to pad next year’searnings. Beware of serial acquirers, especially ifthey use their own stock to buy other companies. Thiscan increase reported earnings, but it often erodesvalue since the acquirer usually pays a large premi-um for the target. Watch out for companies thatdepreciate their assets much slower than others in theindustry (this is shown in the financial statement’sfootnotes). This causes their current earnings to looklarger than their competitors’, even though theyaren’t actually performing any better. Perhaps thebest evidence of bamboozling is if earnings are con-sistently growing faster than cash flows, which almostalways indicates a financial scam.
Sources: Geoffrey Colvin, “Bamboozling: A Field Guide,” Fortune,July 8, 2002, 51; and Shawn Tully, “Don’t Get Burned,” Fortune,February 18, 2002, 87–90.

MicroDrive’s free cash flow in 2007 was
100 Chapter 3 Financial Statements, Cash Flow, and Taxes
that cash flows cannot be maintained over time unless depreciated fixed assets arereplaced, so management is not completely free to use net cash flows however itchooses. Therefore, we now define another term, free cash flow (FCF), which isthe cash flow actually available for distribution to investors after the company hasmade all the investments in fixed assets and working capital necessary to sustain ongoingoperations.
When you studied income statements in accounting, the emphasis wasprobably on the firm’s net income, which is its accounting profit. However, thevalue of a company’s operations is determined by the stream of cash flows thatthe operations will generate now and in the future. To be more specific, thevalue of operations depends on all the future expected free cash flows (FCF),defined as after-tax operating profit minus the amount of new investment inworking capital and fixed assets necessary to sustain the business. Thus, freecash flow represents the cash that is actually available for distribution toinvestors. Therefore, the way for managers to make their companies more valuable is toincrease free cash flow.
Calculating Free Cash FlowAs shown earlier in the chapter, MicroDrive had $1,455 million of total net oper-ating capital at the end of 2006, but $1,800 million at the end of 2007. Therefore,during 2007, it made a net investment in operating capital of
Net investment in operating capital � $1,800 � $1,455 � $345 million.
(3-6)
� �$174.7 million.
� $170.3 � $345
FCF � NOPAT � Net investment in operating capital
Net fixed assets rose from $870 to $1,000 million, or by $130 million. However,MicroDrive reported $100 million of depreciation, so its gross investment in fixedassets was $130 � $100 � $230 million for the year. With this background, we findthe gross investment in operating capital as follows:
� $345 � $100 � $445 million.
Because depreciation is a noncash expense, some analysts calculate operatingcash flow as
(3-8)Operating cash flow � NOPAT � Depreciation.
Gross investment in Net investment in operating capital � operating capital � Depreciation
(3-7)

Modifying Accounting Data for Managerial Decisions 101
MicroDrive’s most recent operating cash flow is
Operating cash flow � NOPAT � Depreciation � $170.3 � $100 � $270.3.
An algebraically equivalent expression for free cash flow in terms of operatingcash flow and gross investment in operating capital is
Equations 3-6 and 3-9 are equivalent because depreciation is added to bothNOPAT and net investment in Equation 3-6 to arrive at Equation 3-9. We usuallyuse Equation 3-6, because it saves us this step.
The Uses of FCFRecall that free cash flow (FCF) is the amount of cash that is available for distributionto all investors, including both shareholders and debtholders. There are five gooduses for FCF:
1. Pay interest to debtholders, keeping in mind that the net cost to the companyis the after-tax interest expense.
2. Repay debtholders, that is, pay off some of the debt.3. Pay dividends to shareholders.4. Repurchase stock from shareholders.5. Buy short-term investments or other nonoperating assets.
Recall that the company does not have to use FCF to acquire operating assets since,by definition, FCF already takes into account the purchase of all operating assetsneeded to support growth. Unfortunately, there is evidence to suggest that somecompanies with high FCF tend to make unnecessary investments that don’t addvalue, such as paying too much to acquire some other company. Thus, high FCF cancause waste if managers fail to act in the best interest of shareholders. As discussed in Chapter 1, this is called an agency cost, since managers are hired asagents to act on behalf of stockholders. We discuss agency costs and ways to controlthem in Chapter 15, where we discuss value-based management and corporate gov-ernance, and in Chapter 16, where we discuss the choice of capital structure.
In practice, most companies combine these five uses in such a way that the nettotal is equal to FCF. For example, a company might pay interest and dividends,issue new debt, and also sell some of its marketable securities. Some of these activi-ties are cash outflows (for example, paying interest and dividends) and some arecash inflows (for example, issuing debt and selling marketable securities), but the netcash flow from these five activities is equal to FCF.
FCF and Corporate ValueFCF is the amount of cash available for distribution to investors, and, as a result,the value of a company depends on the present value of its expected future FCFs,
(3-9)
� �$174.7 million.
� 1$170.3 � $100 2 � $445
FCF � Operating cash flow � Gross investment in operating capital

102 Chapter 3 Financial Statements, Cash Flow, and Taxes
discounted at the company’s weighted average cost of capital (WACC).Subsequent chapters will develop the tools needed to forecast FCFs and evaluatetheir risk. Chapter 15 ties all this together with a model that is used to calculate thevalue of a company. Even though you do not yet have all the tools to apply themodel, it’s important that you understand this basic concept: FCF is the cash availablefor distribution to investors. Therefore, the value of a firm primarily depends on its expectedfuture FCFs.
Evaluating FCF, NOPAT, and Operating CapitalEven though MicroDrive had a positive NOPAT, its very high investment in operat-ing assets resulted in a negative free cash flow. Because free cash flow is what is avail-able for distribution to investors, not only was there nothing for investors, butinvestors actually had to provide additional money to keep the business going.Investors provided most of this new money as debt.
Is a negative free cash flow always bad? The answer is, “Not necessarily; itdepends on why the free cash flow was negative.” If FCF was negative becauseNOPAT was negative, that is a bad sign, because then the company is probably expe-riencing operating problems. However, many high-growth companies have positiveNOPAT but negative free cash flow because they are making large investments inoperating assets to support growth. There is nothing wrong with profitable growth,even if it causes negative cash flows.
One way to determine whether growth is profitable is by examining the returnon invested capital (ROIC), which is the ratio of NOPAT to total operating capital.If the ROIC exceeds the rate of return required by investors, then a negative freecash flow caused by high growth is nothing to worry about. Chapter 15 discussesthis in detail.
To calculate the ROIC, we first calculate NOPAT and operating capital. Thereturn on invested capital (ROIC) is a performance measure that indicates how muchNOPAT is generated by each dollar of operating capital:
(3-10)ROIC �NOPAT
Operating capital.
If ROIC is greater than the rate of return investors require, which is the weightedaverage cost of capital (WACC), then the firm is adding value.
As noted earlier, a negative current FCF is not necessarily bad, provided it isdue to high growth. For example, during the late 1990s Home Depot had negativeFCF due to its rapid growth, but it also had a very high ROIC, and this high ROICresulted in a high market value for the stock.
MicroDrive had an ROIC in 2007 of 9.46% ($170.3/$1,800 � 0.0946). Is thisenough to cover its cost of capital? We’ll answer that question in the next section.
What is net operating working capital? Why does it exclude most short-term investments and also notespayable?What is total net operating capital? Why is it important for managers to calculate a company’s capitalrequirements?Why is NOPAT a better performance measure than net income?What is free cash flow? Why is it important?A firm’s total net operating capital for the previous year was $2 million. For the current year, its total netoperating capital is $2.5 million and its NOPAT is $1.2 million. What is its free cash flow for the currentyear? ($700,000)
SELF-TEST

MVA and EVA 103
3.8 MVA and EVA
Neither traditional accounting data nor the modified data discussed in the preceding section incorporates stock prices, even though the primary goal ofmanagement is to maximize the firm’s stock price. Financial analysts have there-fore developed two additional performance measures, MVA, or Market ValueAdded, and EVA, or Economic Value Added. These concepts are discussed in this section.11
Market Value Added (MVA)The primary goal of most firms is to maximize shareholders’ wealth. This goalobviously benefits shareholders, but it also helps to ensure that scarce resourcesare allocated efficiently, which benefits the economy. Shareholder wealth is maxi-mized by maximizing the difference between the market value of the firm’s stockand the amount of equity capital that was supplied by shareholders. This differ-ence is called the Market Value Added (MVA):
11The concepts of EVA and MVA were developed by Joel Stern and Bennett Stewart, co-founders of the consultingfirm Stern Stewart & Company. Stern Stewart copyrighted the terms “EVA” and “MVA,” so other consulting firms havegiven other names to these values. Still, EVA and MVA are the terms most commonly used in practice.
(3-11) � 1Shares outstanding 2 1Stock price 2 � Total common equity.
MVA � Market value of stock � Equity capital supplied by shareholders
To illustrate, consider Coca-Cola. In May 2006, its total market equity valuewas $104.8 billion, while its balance sheet showed that stockholders had put uponly $16.4 billion. Thus, Coca-Cola’s MVA was $104.8 � $16.4 � $88.4 billion. This$88.4 billion represents the difference between the money that Coca-Cola’s stock-holders have invested in the corporation since its founding—including retainedearnings—versus the cash they could get if they sold the business. The higher itsMVA, the better the job management is doing for the firm’s shareholders.
Sometimes MVA is defined as the total market value of the company minusthe total amount of investor-supplied capital:
For an updated estimateof Coca-Cola’s MVA, goto http://finance.yahoo.com, enter KO, and clickGO. This shows the mar-ket value of equity, calledMkt Cap. To get the bookvalue of equity, selectBalance Sheet from theleft panel.
(3-11a)
� Total investor supplied capital.
� 1Market value of stock � Market value of debt 2
MVA � Total market value � Total investor supplied capital
For most companies, the total amount of investor-supplied capital is the sum ofequity, debt, and preferred stock. We can calculate the total amount of investor-supplied capital directly from their reported values in the financial statements.The total market value of a company is the sum of the market values of commonequity, debt, and preferred stock. It is easy to find the market value of equity, sincestock prices are readily available, but it is not always easy to find the market valueof debt. Hence, many analysts use the value of debt that is reported in the finan-cial statements, the debt’s book value, as an estimate of its market value.

104 Chapter 3 Financial Statements, Cash Flow, and Taxes
For Coca-Cola, the total amount of reported debt was about $5.7 billion, and Coca-Cola had no preferred stock. Using this as an estimate of the market value ofdebt, Coke’s total market value was $104.8 � $5.7 � $110.5 billion. The total amountof investor-supplied funds was $16.4 � $5.7 � $22.1 billion. Using these total val-ues, the MVA was $110.5 � $22.1 � $88.4 billion. Note that this is the same answerthat we got using the previous definition of MVA. Both methods will give the sameresult if the market value of debt is approximately equal to its book value.
Economic Value Added (EVA)Whereas MVA measures the effects of managerial actions since the very inceptionof a company, Economic Value Added (EVA) focuses on managerial effectivenessin a given year. The basic EVA formula is as follows:
(3-12)
� EBIT11 � Tax rate 2 � 1Total net operating capital 2 1WACC 2 .
� After-tax dollar cost of capital used to support operations
EVA � Net operating profit after taxes 1NOPAT 2
(3-13)EVA � 1Operating capital 2 1ROIC � WACC 2 .
We can also calculate EVA in terms of ROIC:
As this equation shows, a firm adds value—that is, has a positive EVA—if itsROIC is greater than its WACC. If WACC exceeds ROIC, then new investments inoperating capital will reduce the firm’s value.
EVA is an estimate of a business’s true economic profit for the year, and it dif-fers sharply from accounting profit.12 EVA represents the residual income thatremains after the cost of all capital, including equity capital, has been deducted,whereas accounting profit is determined without imposing a charge for equitycapital. As we discuss in Chapter 10, equity capital has a cost, because funds pro-vided by shareholders could have been invested elsewhere, where they wouldhave earned a return. Shareholders give up the opportunity to invest elsewherewhen they provide capital to the firm. The return they could earn elsewhere in investments of equal risk represents the cost of equity capital. This cost is anopportunity cost rather than an accounting cost, but it is quite real nevertheless.
Note that when calculating EVA we do not add back depreciation. Althoughit is not a cash expense, depreciation is a cost since worn-out assets must bereplaced, and it is therefore deducted when determining both net income andEVA. Our calculation of EVA assumes that the true economic depreciation of thecompany’s fixed assets exactly equals the depreciation used for accounting andtax purposes. If this were not the case, adjustments would have to be made toobtain a more accurate measure of EVA.
12The most important reason EVA differs from accounting profit is that the cost of equity capital is deducted whenEVA is calculated. Other factors that could lead to differences include adjustments that might be made to deprecia-tion, to research and development costs, to inventory valuations, and so on. These other adjustments also can affectthe calculation of investor-supplied capital, which affects both EVA and MVA. See Stewart, The Quest for Value, citedin footnote 10.

MVA and EVA 105
EVA measures the extent to which the firm has increased shareholder value.Therefore, if managers focus on EVA, this will help to ensure that they operatein a manner that is consistent with maximizing shareholder wealth. Note toothat EVA can be determined for divisions as well as for the company as a whole,so it provides a useful basis for determining managerial performance at all lev-els. Consequently, EVA is being used by an increasing number of firms as theprimary basis for determining managerial compensation.
Table 3-5 shows how MicroDrive’s MVA and EVA are calculated. The stockprice was $23 per share at year-end 2007, down from $26 per share the previousyear. Its WACC, which is the percentage after-tax cost of capital, was 10.8% in2006 and 11.0% in 2007, and its tax rate was 40%. Other data in Table 3-5 weregiven in the basic financial statements provided earlier in the chapter.
Note first that the lower stock price and the higher book value of equity (dueto retaining earnings during 2007) combined to reduce the MVA. The 2007 MVAis still positive, but $460 � $254 � $206 million of stockholders’ value was lostduring the year.
EVA for 2006 was just barely positive, and in 2007 it was negative. Operatingincome (NOPAT) rose, but EVA still declined, primarily because the amount ofcapital rose more sharply than NOPAT—by about 26% versus 8%—and the cost of this additional capital pulled EVA down.
MVA and EVA for MicroDrive, Inc. (Millions of Dollars)Table 3-5
2007 2006
MVA Calculation
Price per share $ 23.0 $ 26.0
Number of shares (millions) 50.0 50.0
Market value of equity � Share price (Number of shares) $1,150.0 $1,300.0
Book value of equity $ 896.0 $ 840.0
MVA � Market value � Book value $ 254.0 $ 460.0
EVA Calculation
EBIT $ 283.8 $ 263.0
Tax rate 40% 40%
NOPAT � EBIT(1 � T) $ 170.3 $ 157.8
Total investor-supplied operating capitala $1,800.0 $1,455.0
Weighted average cost of capital, WACC (%) 11.0% 10.8%
Dollar cost of capital � Operating capital (WACC) $ 198.0 $157.1
EVA � NOPAT � Dollar cost of capital ($ 27.7) $ 0.7
ROIC � NOPAT/Operating capital 9.46% 10.85%
ROIC � Cost of capital � ROIC � WACC (1.54%) 0.05%
EVA � (Operating capital)(ROIC � WACC) ($ 27.7) $ 0.7
aInvestor-supplied operating capital equals the sum of notes payable, long-term debt, preferred stock, and com-mon equity, less short-term investments. It could also be calculated as total liabilities and equity minus accountspayable, accruals, and short-term investments. It is also equal to total net operating capital.
See FM12 Ch 03 ToolKit.xls for all details.

106 Chapter 3 Financial Statements, Cash Flow, and Taxes
Recall also that net income fell, but not nearly so dramatically as the declinein EVA. Net income does not reflect the amount of equity capital employed, butEVA does. Because of this omission, net income is not as useful as EVA for settingcorporate goals and measuring managerial performance.
We will have more to say about both MVA and EVA later in the book, but wecan close this section with two observations. First, there is a relationshipbetween MVA and EVA, but it is not a direct one. If a company has a history ofnegative EVAs, then its MVA will probably be negative, and vice versa if it hasa history of positive EVAs. However, the stock price, which is the key ingredientin the MVA calculation, depends more on expected future performance than onhistorical performance. Therefore, a company with a history of negative EVAscould have a positive MVA, provided investors expect a turnaround in thefuture.
The second observation is that when EVAs or MVAs are used to evaluate man-agerial performance as part of an incentive compensation program, EVA is themeasure that is typically used. The reasons are (1) EVA shows the value addedduring a given year, whereas MVA reflects performance over the company’s entirelife, perhaps even including times before the current managers were born, and (2)EVA can be applied to individual divisions or other units of a large corporation,whereas MVA must be applied to the entire corporation.
Sarbanes-Oxley and Financial Fraud
Investors need to be cautious when they review finan-cial statements. While companies are required to fol-low GAAP, managers still have quite a lot of discre-tion in deciding how and when to report certaintransactions. Consequently, two firms in exactly thesame operating situation may report financial state-ments that convey different impressions about theirfinancial strength. Some variations may stem fromlegitimate differences of opinion about the correctway to record transactions. In other cases, managersmay choose to report numbers in a way that helpsthem present either higher earnings or more stableearnings over time. As long as they follow GAAP,such actions are not illegal, but these differencesmake it harder for investors to compare companiesand gauge their true performances.
Unfortunately, there have also been cases wheremanagers overstepped the bounds and reportedfraudulent statements. Indeed, a number of high-profile executives have faced criminal chargesbecause of their misleading accounting practices. Forexample, in June 2002 it was discovered thatWorldCom (now called MCI) had committed the most
massive accounting fraud of all time by recording over $7 billion of ordinary operating costs as capital expen-ditures, thus overstating net income by the sameamount.
WorldCom’s published financial statements fooledmost investors—investors bid the stock price up to$64.50, and banks and other lenders provided thecompany with more than $30 billion of loans. ArthurAndersen, the firm’s auditor, was faulted for notdetecting the fraud. WorldCom’s CFO and CEO wereconvicted and Arthur Andersen went bankrupt. But thatdidn’t help the investors who relied on the publishedfinancial statements.
In response to these and other abuses, Congresspassed the Sarbanes-Oxley Act of 2002. One of itsprovisions requires both the CEO and the CFO tosign a statement certifying that the “financial state-ments and disclosures fairly represent, in all materialrespects, the operations and financial condition” ofthe company. This will make it easier to haul off inhandcuffs a CEO or CFO who has been misleadinginvestors. Whether this will prevent future financialfraud remains to be seen.
Define “Market Value Added (MVA)” and “Economic Value Added (EVA).”How does EVA differ from accounting profit?A firm has $100 million in total net operating capital. Its return on invested capital is 14% and its weight-ed average cost of capital is 10%. What is its EVA? ($400,000)
SELF-TEST

The Federal Income Tax System 107
3.9 The Federal Income Tax System
The value of any financial asset (including stocks, bonds, and mortgages), as wellas most real assets such as plants or even entire firms, depends on the stream ofcash flows produced by the asset. Cash flows from an asset consist of usableincome plus depreciation, and usable income means income after taxes. The fol-lowing sections describe the key features of corporate and individual taxation.
Corporate Income TaxesThe corporate tax structure, shown in Table 3-6, is relatively simple. The marginaltax rate is the rate paid on the last dollar of income, while the average tax rate isthe average rate paid on all income. To illustrate, if a firm had $65,000 of taxableincome, its tax bill would be
� $7,500 � $3,750 � $11,250.
Taxes � $7,500 � 0.25 ($65,000 � $50,000)
Its marginal rate would be 25%, and its average tax rate would be $11,250/$65,000� 17.3%. Note that corporate income above $18,333,333 has an average and margin-al tax rate of 35%.13
Interest and Dividend Income Received by a Corporation Interest income receivedby a corporation is taxed as ordinary income at regular corporate tax rates.However, 70% of the dividends received by one corporation from another is excluded fromtaxable income, while the remaining 30% is taxed at the ordinary tax rate.14 Thus, a cor-poration earning more than $18,333,333 and paying a 35% marginal tax ratewould pay only (0.30)(0.35) � 0.105 � 10.5% of its dividend income as taxes, so itseffective tax rate on dividends received would be 10.5%. If this firm had $10,000in pre-tax dividend income, its after-tax dividend income would be $8,950:
13Prior to 1987, many large, profitable corporations such as General Electric and Boeing paid no income taxes. Thereasons for this were as follows: (1) expenses, especially depreciation, were defined differently for calculating taxableincome than for reporting earnings to stockholders, so some companies reported positive profits to stockholders butlosses—hence no taxes—to the Internal Revenue Service; and (2) some companies that did have tax liabilities used vari-ous tax credits to offset taxes that would otherwise have been payable. This situation was effectively eliminated in 1987.
The principal method used to eliminate this situation is the Alternative Minimum Tax (AMT). Under the AMT, both cor-porate and individual taxpayers must figure their taxes in two ways, the “regular” way and the AMT way, and then paythe higher of the two. The AMT is calculated as follows: (1) Figure your regular taxes. (2) Take your taxable income underthe regular method and then add back certain items, especially income on certain municipal bonds, depreciation inexcess of straight-line depreciation, certain research and drilling costs, itemized or standard deductions (for individuals),and a number of other items. (3) The income determined in (2) is defined as AMT income, and it must then be multipliedby the AMT tax rate to determine the tax due under the AMT system. An individual or corporation must then pay the high-er of the regular tax or the AMT tax. In 2006, there were two AMT tax rates for individuals (26% and 28%, dependingon the level of AMT income and filing status). Most corporations have an AMT of 20%. However, there is no AMT forvery small companies, defined as those that have had average sales of less than $7.5 million for the last 3 years.14The size of the dividend exclusion actually depends on the degree of ownership. Corporations that own less than20% of the stock of the dividend-paying company can exclude 70% of the dividends received; firms that own morethan 20% but less than 80% can exclude 80% of the dividends; and firms that own more than 80% can exclude theentire dividend payment. We will, in general, assume a 70% dividend exclusion.
� $10,000 (1 � 0.105) � $10,000 (0.895) � $8,950.
� $10,000 31 � (0.30) (0.35) 4
� Before-tax income (1 � Effective tax rate)
� Before-tax income � (Before-tax income) (Effective tax rate) After-tax income � Before-tax income � Taxes

108 Chapter 3 Financial Statements, Cash Flow, and Taxes
If the corporation pays its own after-tax income out to its stockholders asdividends, the income is ultimately subjected to triple taxation: (1) the original cor-poration is first taxed, (2) the second corporation is then taxed on the dividends itreceived, and (3) the individuals who receive the final dividends are taxed again.This is the reason for the 70% exclusion on intercorporate dividends.
If a corporation has surplus funds that can be invested in marketable securi-ties, the tax factor favors investment in stocks, which pay dividends, rather thanin bonds, which pay interest. For example, suppose GE had $100,000 to invest, andit could buy either bonds that paid interest of $8,000 per year or preferred stockthat paid dividends of $7,000. GE is in the 35% tax bracket; therefore, its tax on theinterest, if it bought bonds, would be 0.35($8,000) � $2,800, and its after-taxincome would be $5,200. If it bought preferred (or common) stock, its tax wouldbe 0.35[(0.30)($7,000)] � $735, and its after-tax income would be $6,265. Otherfactors might lead GE to invest in bonds, but the tax factor certainly favors stockinvestments when the investor is a corporation.15
Interest and Dividends Paid by a Corporation A firm’s operations can be financedwith either debt or equity capital. If it uses debt, it must pay interest on this debt,whereas if it uses equity, it is expected to pay dividends to the equity investors(stockholders). The interest paid by a corporation is deducted from its operatingincome to obtain its taxable income, but dividends paid are not deductible.Therefore, a firm needs $1 of pre-tax income to pay $1 of interest, but if it is in the 40% federal-plus-state tax bracket, it must earn $1.67 of pre-tax income to pay$1 of dividends:
Corporate Tax Rates as of January 2006Table 3-6
If a Corporation’s It Pays This Plus this Percentage Average Tax Taxable Income Is Amount on the on the Excess Rate at Top
Base of the Bracket over the Base of Bracket
Up to $50,000 $0 15% 15.0%
$50,000–$75,000 $7,500 25 18.3
$75,000–$100,000 $13,750 34 22.3
$100,000–$335,000 $22,250 39 34.0
$335,000–$10,000,000 $113,900 34 34.0
$10,000,000–$15,000,000 $3,400,000 35 34.3
$15,000,000–$18,333,333 $5,150,000 38 35.0
Over $18,333,333 $6,416,667 35 35.0
Pre-tax income neededto pay $1 of dividends
�$1
1 � Tax rate�
$1
0.60� $1.67.
15This illustration demonstrates why corporations favor investing in lower-yielding preferred stocks over higher-yieldingbonds. When tax consequences are considered, the yield on the preferred stock, [1 � 0.35(0.30)](7.0%) � 6.265%,is higher than the yield on the bond, (1 � 0.35)(8.0%) � 5.2%. Also, note that corporations are restricted in their useof borrowed funds to purchase other firms’ preferred or common stocks. Without such restrictions, firms could engagein tax arbitrage, whereby the interest on borrowed funds reduces taxable income on a dollar-for-dollar basis, buttaxable income is increased by only $0.30 per dollar of dividend income. Thus, current tax laws reduce the 70% divi-dend exclusion in proportion to the amount of borrowed funds used to purchase the stock.
See FM12 Ch 03 Tool
Kit.xls for all details.

The Federal Income Tax System 109
Working backward, if a company has $1.67 in pre-tax income, it must pay $0.67 intaxes [(0.4)($1.67) � $0.67]. This leaves it with after-tax income of $1.00.
Of course, it is generally not possible to finance exclusively with debt capital,and the risk of doing so would offset the benefits of the higher expected income.Still, the fact that interest is a deductible expense has a profound effect on the way busi-nesses are financed—our corporate tax system favors debt financing over equity financing.This point is discussed in more detail in Chapters 10 and 16.
Corporate Capital Gains Before 1987, corporate long-term capital gains were taxedat lower rates than corporate ordinary income, so the situation was similar forcorporations and individuals. Under current law, however, corporations’ capital gains are taxed at the same rates as their operating income.
Corporate Loss Carryback and Carryforward Ordinary corporate operating lossescan be carried back (carryback) to each of the preceding 2 years and forward (carryforward) for the next 20 years and used to offset taxable income in thoseyears. For example, an operating loss in 2007 could be carried back and used to reduce taxable income in 2005 and 2006, and forward, if necessary, and used in2008, 2009, and so on, to the year 2027. After carrying back 2 years, any remainingloss is typically carried forward first to the next year, then to the one after that, andso on, until losses have been used up or the 20-year carryforward limit has beenreached.16
To illustrate, suppose Apex Corporation had $2 million of pre-tax profits (taxable income) in 2005 and 2006, and then, in 2007, Apex lost $12 million. Also,assume that Apex’s federal-plus-state tax rate is 40%. As shown in Table 3-7, thecompany would use the carryback feature to recompute its taxes for 2005, using
16In the wake of the terrorist attacks on the World Trade Center and Pentagon on September 11, 2001, Congresstemporarily changed the carryback provision in the Tax Code. The new provision allows operating losses incurred intax years ending in 2001 or 2002 to be carried back 5 years rather than the normal 2 years. This provision is set toexpire before this edition goes to print, so we will use a 2-year carryback provision in all of the examples.
Apex Corporation: Calculation of $12 Million Loss Carryback and Amount Available for Carryforward
Past Year 2005 Past Year 2006 Current Year 2007
Original taxable income $2,000,000 $2,000,000 �$12,000,000
Carryback credit 2,000,000 2,000,000
Adjusted profit $ 0 $ 0
Taxes previously paid (40%) 800,000 800,000
Difference � Tax refund due $ 800,000 $ 800,000
Total tax refund received $1,600,000
Amount of loss carryforward available
Current loss �$12,000,000
Carryback losses used 4,000,000
Carryforward losses still available �$8,000,000
Table 3-7
See FM12 Ch 03 Tool
Kit.xls for all details.

110 Chapter 3 Financial Statements, Cash Flow, and Taxes
$2 million of the 2007 operating losses to reduce the 2005 pre-tax profit to zero.This would permit it to recover the taxes paid in 2005. Therefore, in 2007 Apexwould receive a refund of its 2005 taxes because of the loss experienced in 2007.Because $10 million of the unrecovered losses would still be available, Apexwould repeat this procedure for 2006. Thus, in 2007 the company would pay zerotaxes for 2007 and also would receive a refund for taxes paid in 2005 and 2006.Apex would still have $8 million of unrecovered losses to carry forward, subjectto the 20-year limit. This $8 million could be used to offset future taxable income.The purpose of this loss treatment is to avoid penalizing corporations whoseincomes fluctuate substantially from year to year.
Improper Accumulation to Avoid Payment of Dividends Corporations could refrainfrom paying dividends and thus permit their stockholders to avoid personalincome taxes on dividends. To prevent this, the Tax Code contains an improperaccumulation provision that states that earnings accumulated by a corporation aresubject to penalty rates if the purpose of the accumulation is to enable stockholders toavoid personal income taxes. A cumulative total of $250,000 (the balance sheet item“retained earnings”) is by law exempted from the improper accumulation tax formost corporations. This is a benefit primarily to small corporations.
The improper accumulation penalty applies only if the retained earnings inexcess of $250,000 are shown by the IRS to be unnecessary to meet the reasonable needsof the business. A great many companies do indeed have legitimate reasons forretaining more than $250,000 of earnings. For example, earnings may be retainedand used to pay off debt, to finance growth, or to provide the corporation with acushion against possible cash drains caused by losses. How much a firm shouldbe allowed to accumulate for uncertain contingencies is a matter of judgment. We shall consider this matter again in Chapter 18, which deals with corporatedividend policy.
Consolidated Corporate Tax Returns If a corporation owns 80% or more of anothercorporation’s stock, it can aggregate income and file one consolidated tax return;thus, the losses of one company can be used to offset the profits of another.(Similarly, one division’s losses can be used to offset another division’s profits.)No business ever wants to incur losses (you can go broke losing $1 to save 35¢ in taxes), but tax offsets do help make it more feasible for large, multidivisionalcorporations to undertake risky new ventures or ventures that will suffer lossesduring a developmental period.
Taxes on Overseas Income Many U.S. corporations have overseas subsidiaries, andthose subsidiaries must pay taxes in the countries where they operate. Often, for-eign tax rates are lower than U.S. rates. As long as foreign earnings are reinvestedoverseas, no U.S. tax is due on those earnings. However, when foreign earningsare repatriated to the U.S. parent, they are taxed at the applicable U.S. rate, less acredit for taxes paid to the foreign country. As a result, U.S. corporations such asIBM, Coca-Cola, and Microsoft have been able to defer billions of dollars of taxes.This procedure has stimulated overseas investments by U.S. multinational firms—they can continue the deferral indefinitely, but only if they reinvest the earningsin their overseas operations.17
17This is a contentious political issue. U.S. corporations argue that our tax system is similar to systems in the rest ofthe world, and if they were taxed immediately on all overseas earnings they would be at a competitive disadvantagevis-à-vis their global competitors. Others argue that taxation encourages overseas investments at the expense ofdomestic investments, contributing to the jobs outsourcing problem and also to the federal budget deficit.
The Federal Income Tax System 111
Taxation of Small Businesses: S CorporationsThe Tax Code provides that small businesses that meet certain restrictions asspelled out in the code may be set up as corporations and thus receive the bene-fits of the corporate form of organization—especially limited liability—yet still betaxed as proprietorships or partnerships rather than as corporations. These cor-porations are called S corporations. (“Regular” corporations are called C corpo-rations.) If a corporation elects S corporation status for tax purposes, all of thebusiness’s income is reported as personal income by its stockholders, on a pro ratabasis, and thus is taxed at the rates that apply to individuals. This is an importantbenefit to the owners of small corporations in which all or most of the incomeearned each year will be distributed as dividends, because then the income istaxed only once, at the individual level.
Personal TaxesWeb Extension 3A provides a more detailed treatment of individual taxation, butthe key elements are presented here. Ordinary income consists primarily of wagesor profits from a proprietorship or partnership, plus investment income. For the2006 tax year, individuals with less than $7,550 of taxable income are subject to afederal income tax rate of 10%. For those with higher income, tax rates increase andgo up to 35%, depending on the level of income. This is called a progressive tax,because the higher one’s income, the larger the percentage paid in taxes.
As noted above, individuals are taxed on investment income as well as earnedincome, but with a few exceptions and modifications. For example, interestreceived from most state and local government bonds, called municipals or“munis,” is not subject to federal taxation. However, interest earned on most otherbonds or lending is taxed as ordinary income. This means that a lower-yieldingmuni can provide the same after-tax return as a higher-yielding corporate bond.For a taxpayer in the 35% marginal tax bracket, a muni yielding 5.5% provides thesame after-tax return as a corporate bond with a pre-tax yield of 8.46%: 8.46%(1 �0.35) � 5.5%.
Assets such as stocks, bonds, and real estate are defined as capital assets. Ifyou own a capital asset and its price goes up, then your wealth increases, but youare not liable for any taxes on your increased wealth until you sell the asset. If yousell the asset for more than you originally paid, the profit is called a capital gain;if you sell it for less, then you suffer a capital loss. The length of time you ownedthe asset determines the tax treatment. If held for less than one year, then yourgain or loss is simply added to your other ordinary income. If held for more thana year, then gains are called long-term capital gains and are taxed at a lower rate.See Web Extension 3A for details, but the long-term capital gains rate is 15% formost situations.
Under the 2003 tax law changes, dividends are now taxed as though theywere capital gains. As stated earlier, corporations may deduct interest paymentsbut not dividends when computing their corporate tax liability, which means thatdividends are taxed twice, once at the corporate level and again at the personallevel. This differential treatment motivates corporations to use debt relativelyheavily, and to pay small (or even no) dividends. The 2003 tax law did not elimi-nate the differential treatment of dividends and interest payments from the cor-porate perspective, but it did make the tax treatment of dividends more similar tothat of capital gains from investors’ perspectives. To see this, consider a companythat doesn’t pay a dividend but instead reinvests the cash it could have paid. The
See Web Extension 3Afor details concerningpersonal taxation.

112 Chapter 3 Financial Statements, Cash Flow, and Taxes
company’s stock price should increase, leading to a capital gain, which would betaxed at the same rate as the dividend. Of course, the stock price appreciation isn’tactually taxed until the stock is sold, whereas the dividend is taxed in the year itis paid, so dividends will still be more costly than capital gains for many investors.
Finally, note that the income of both S corporations and noncorporate business-es is reported as income by the firms’ owners. Since there are far more S corporations,partnerships, and proprietorships than C corporations (which are subject to the cor-porate tax), individual tax considerations play an important role in business finance.
Summary
The primary purposes of this chapter were (1) to describe the basic financial state-ments, (2) to present some background information on cash flows, and (3) to provide an overview of the federal income tax system. The key concepts coveredare listed below.
• The four basic statements contained in the annual report are the balancesheet, the income statement, the statement of retained earnings, and the state-ment of cash flows. Investors use the information provided in these state-ments to form expectations about the future levels of earnings and dividends,and about a firm’s riskiness.
• The balance sheet shows assets on the left-hand side and liabilities and equi-ty, or claims against assets, on the right-hand side. (Sometimes assets areshown at the top and claims at the bottom of the balance sheet.) The balancesheet may be thought of as a snapshot of the firm’s financial position at a par-ticular point in time.
• The income statement reports the results of operations over a period of time,and it shows earnings per share as its “bottom line.”
• The statement of retained earnings shows the change in retained earningsbetween balance sheet dates. Retained earnings represent a claim againstassets, not assets per se.
• The statement of cash flows reports the effect of operating, investing, andfinancing activities on cash flows over an accounting period.
• Net cash flow differs from accounting profit because some of the revenuesand expenses reflected in accounting profits may not have been received orpaid out in cash during the year. Depreciation is typically the largest noncashitem, so net cash flow is often expressed as net income plus depreciation.Investors are at least as interested in a firm’s projected net cash flow as inreported earnings because it is cash, not paper profit, that is paid out as divi-dends and plowed back into the business to produce growth.
• Operating current assets are the current assets that are used to support oper-ations, such as cash, inventory, and accounts receivable. They do not include
If a corporation has $85,000 in taxable income, what is its tax liability? ($17,150)Explain the difference between marginal tax rates and average tax rates.What is a municipal bond, and how are these bonds taxed?What are capital gains and losses, and how are they taxed?How does the federal income tax system treat dividends received by a corporation versus those receivedby an individual?What is the difference in the tax treatment of interest and dividends paid by a corporation? Does this fac-tor favor debt or equity financing?Briefly explain how tax loss carryback and carryforward procedures work.
SELF-TEST

Summary 113
• Operating current liabilities are the current liabilities that occur as a naturalconsequence of operations, such as accounts payable and accruals. They donot include notes payable or any other short-term debts that charge interest.
• Net operating working capital is the difference between operating currentassets and operating current liabilities. Thus, it is the working capital acquiredwith investor-supplied funds.
• Operating long-term assets are the long-term assets used to support opera-tions, such as net plant and equipment. They do not include any long-terminvestments that pay interest or dividends.
• Total net operating capital (which means the same as operating capitaland net operating assets) is the sum of net operating working capital and oper-ating long-term assets. It is the total amount of capital needed to run the business.
• NOPAT is net operating profit after taxes. It is the after-tax profit a companywould have if it had no debt and no investments in nonoperating assets.Because it excludes the effects of financial decisions, it is a better measure ofoperating performance than is net income.
• Free cash flow (FCF) is the amount of cash flow remaining after a companymakes the asset investments necessary to support operations. In other words,FCF is the amount of cash flow available for distribution to investors, so the value of a company is directly related to its ability to generate free cash flow. It is defined as NOPAT minus the net investment in operating capital.
• Market Value Added (MVA) represents the difference between the total mar-ket value of a firm and the total amount of investor-supplied capital. If themarket values of debt and preferred stock equal their values as reported onthe financial statements, then MVA is the difference between the market valueof a firm’s stock and the amount of equity its shareholders have supplied.
• Economic Value Added (EVA) is the difference between after-tax operatingprofit and the total dollar cost of capital, including the cost of equity capital.EVA is an estimate of the value created by management during the year, andit differs substantially from accounting profit because no charge for the use ofequity capital is reflected in accounting profit.
• The value of any asset depends on the stream of after-tax cash flows it produces. Tax rates and other aspects of our tax system are changed byCongress every year or so.
• Interest income received by a corporation is taxed as ordinary income; how-ever, 70% of the dividends received by one corporation from another areexcluded from taxable income.
• Because interest paid by a corporation is a deductible expense while dividendsare not, our tax system favors debt over equity financing.
• Ordinary corporate operating losses can be carried back to each of the pre-ceding 2 years and forward for the next 20 years and used to offset taxableincome in those years.
• S corporations are small businesses that have the limited-liability benefits of thecorporate form of organization yet are taxed as a partnership or a proprietorship.
• In the United States, tax rates are progressive—the higher one’s income, thelarger the percentage paid in taxes.
• Assets such as stocks, bonds, and real estate are defined as capital assets. If acapital asset is sold for more than its cost, the profit is called a capital gain. Ifthe asset is sold for a loss, it is called a capital loss. Assets held for more thana year provide long-term gains or losses.
• Dividends are taxed as though they were capital gains.
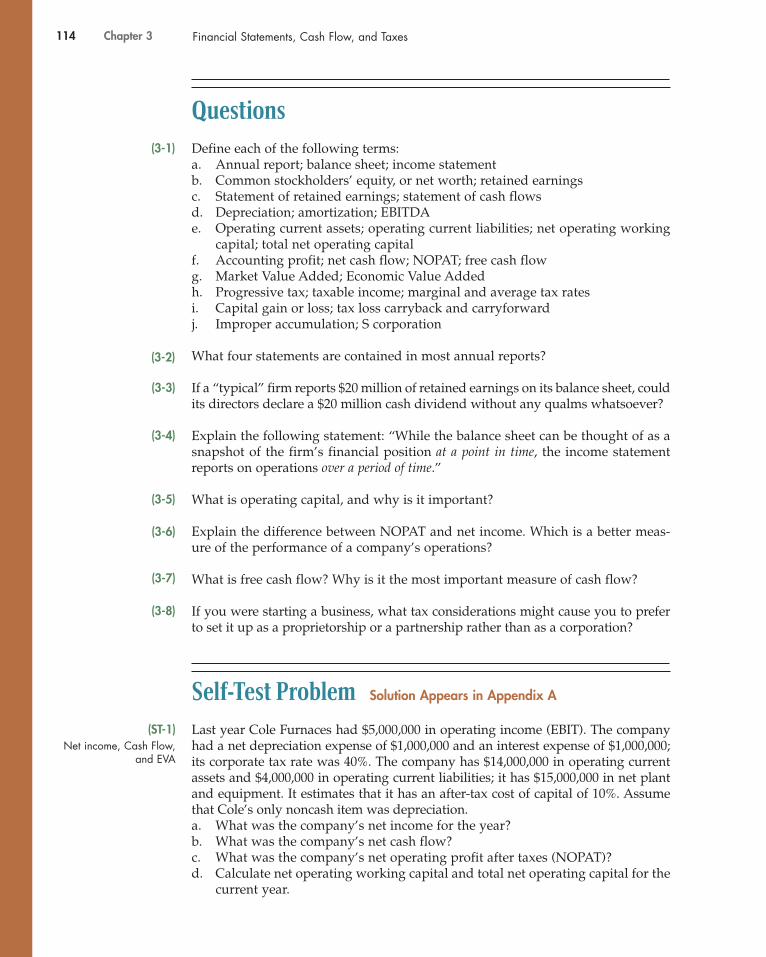
114 Chapter 3 Financial Statements, Cash Flow, and Taxes
Questions
Define each of the following terms:a. Annual report; balance sheet; income statementb. Common stockholders’ equity, or net worth; retained earningsc. Statement of retained earnings; statement of cash flowsd. Depreciation; amortization; EBITDAe. Operating current assets; operating current liabilities; net operating working
capital; total net operating capitalf. Accounting profit; net cash flow; NOPAT; free cash flowg. Market Value Added; Economic Value Addedh. Progressive tax; taxable income; marginal and average tax ratesi. Capital gain or loss; tax loss carryback and carryforwardj. Improper accumulation; S corporation
What four statements are contained in most annual reports?
If a “typical” firm reports $20 million of retained earnings on its balance sheet, couldits directors declare a $20 million cash dividend without any qualms whatsoever?
Explain the following statement: “While the balance sheet can be thought of as asnapshot of the firm’s financial position at a point in time, the income statementreports on operations over a period of time.”
What is operating capital, and why is it important?
Explain the difference between NOPAT and net income. Which is a better meas-ure of the performance of a company’s operations?
What is free cash flow? Why is it the most important measure of cash flow?
If you were starting a business, what tax considerations might cause you to preferto set it up as a proprietorship or a partnership rather than as a corporation?
Self-Test Problem Solution Appears in Appendix A
Last year Cole Furnaces had $5,000,000 in operating income (EBIT). The companyhad a net depreciation expense of $1,000,000 and an interest expense of $1,000,000;its corporate tax rate was 40%. The company has $14,000,000 in operating currentassets and $4,000,000 in operating current liabilities; it has $15,000,000 in net plantand equipment. It estimates that it has an after-tax cost of capital of 10%. Assumethat Cole’s only noncash item was depreciation.a. What was the company’s net income for the year?b. What was the company’s net cash flow?c. What was the company’s net operating profit after taxes (NOPAT)?d. Calculate net operating working capital and total net operating capital for the
current year.
(3-1)
(3-3)
(3-2)
(3-4)
(3-5)
(3-6)
(3-7)
(3-8)
(ST-1)Net income, Cash Flow,
and EVA

Problems 115
e. If total net operating capital in the previous year was $24,000,000, what wasthe company’s free cash flow (FCF) for the year?
f. What was the company’s Economic Value Added (EVA)?
Problems Answers Appear in Appendix B
Note: By the time this book is published, Congress might have changed ratesand/or other provisions of current tax law—as noted in the chapter, such changesoccur fairly often. Work all problems on the assumption that the information inthe chapter is applicable.
An investor recently purchased a corporate bond which yields 9%. The investor is inthe 36% combined federal and state tax bracket. What is the bond’s after-tax yield?
Corporate bonds issued by Johnson Corporation currently yield 8%. Municipalbonds of equal risk currently yield 6%. At what tax rate would an investor beindifferent between these two bonds?
Little Books Inc. recently reported $3 million of net income. Its EBIT was $6 mil-lion, and its tax rate was 40%. What was its interest expense? [Hint: Write out theheadings for an income statement and then fill in the known values. Then divide$3 million net income by (1–T) � 0.6 to find the pre-tax income. The differencebetween EBIT and taxable income must be the interest expense. Use this sameprocedure to work some of the other problems.]
Pearson Brothers recently reported an EBITDA of $7.5 million and net income of$1.8 million. It had $2.0 million of interest expense, and its corporate tax rate was40%. What was its charge for depreciation and amortization?
Kendall Corners Inc. recently reported net income of $3.1 million and depreciationof $500,000. What was its net cash flow? Assume it had no amortization expense.
In its most recent financial statements, Newhouse Inc. reported $50 million of netincome and $810 million of retained earnings. The previous retained earnings were$780 million. How much in dividends was paid to shareholders during the year?
The Talley Corporation had a taxable income of $365,000 from operations after alloperating costs but before (1) interest charges of $50,000, (2) dividends received of$15,000, (3) dividends paid of $25,000, and (4) income taxes. What are the firm’sincome tax liability and its after-tax income? What are the company’s marginaland average tax rates on taxable income?
The Wendt Corporation had $10.5 million of taxable income.a. What is the company’s federal income tax bill for the year?b. Assume the firm receives an additional $1 million of interest income from
some bonds it owns. What is the tax on this interest income?
(3-1)Personal After-Tax Yield
(3-2)Personal After-Tax Yield
(3-3)Income Statement
(3-4)Income Statement
(3-5)Net Cash Flow
(3-6)Statement of Retained
Earnings
(3-7)Corporate Tax Liability
Easy Problems 1–6
IntermediateProblems 7–11
(3-8)Corporate Tax Liability

c. Now assume that Wendt does not receive the interest income but does receivean additional $1 million as dividends on some stock it owns. What is the taxon this dividend income?
The Shrieves Corporation has $10,000 that it plans to invest in marketable securi-ties. It is choosing among AT&T bonds, which yield 7.5%, state of Florida munibonds, which yield 5%, and AT&T preferred stock, with a dividend yield of 6%.Shrieves’s corporate tax rate is 35%, and 70% of the dividends received are taxexempt. Find the after-tax returns on both securities.
The Moore Corporation has operating income (EBIT) of $750,000. The company’sdepreciation expense is $200,000. Moore is 100% equity financed, and it faces a40% tax rate. What is the company’s net income? What is its net cash flow?
The Berndt Corporation expects to have sales of $12 million. Costs other thandepreciation are expected to be 75% of sales, and depreciation is expected to be$1.5 million. All sales revenues will be collected in cash, and costs other than depre-ciation must be paid for during the year. Berndt’s federal-plus-state tax rate is 40%.Berndt has no debt.a. Set up an income statement. What is Berndt’s expected net cash flow?b. Suppose Congress changed the tax laws so that Berndt’s depreciation expenses
doubled. No changes in operations occurred. What would happen to reportedprofit and to net cash flow?
c. Now suppose that Congress, instead of doubling Berndt’s depreciation,reduced it by 50%. How would profit and net cash flow be affected?
d. If this were your company, would you prefer Congress to cause your depreci-ation expense to be doubled or halved? Why?
You have just obtained financial information for the past 2 years for BridgewaterEquine Corporation. Answer the following questions.a. What is the net operating profit after taxes (NOPAT) for 2007?b. What are the amounts of net operating working capital for both years?c. What are the amounts of total net operating capital for both years?d. What is the free cash flow for 2007?e. How can you explain the large increase in dividends in 2007?
(3-9)Corporate After-Tax Yield
(3-10)Cash Flows
(3-11)Income and Cash Flow
Analysis
(3-12)Free Cash Flows
116 Chapter 3 Financial Statements, Cash Flow, and Taxes
Bridgewater Equine Corporation: Income Statements for Year EndingDecember 31 (Millions of Dollars)
2007 2006
Sales $1,200.0 $1,000.0
Operating costs excluding depreciation 1,020.0 850.0
Depreciation 30.0 25.0
Earnings before interest and taxes $ 150.0 $ 125.0
Less interest 21.7 20.2
Earnings before taxes $ 128.3 $ 104.8
Taxes (40%) 51.3 41.9
Net income available to common stockholders $ 77.0 $ 62.9
Common dividends $ 60.5 $ 4.4
Challenging
Problems 12–13

The Bookbinder Company has made $150,000 before taxes during each of the last15 years, and it expects to make $150,000 a year before taxes in the future.However, in 2007 the firm incurred a loss of $650,000. The firm will claim a taxcredit at the time it files its 2007 income tax return, and it will receive a check fromthe U.S. Treasury. Show how it calculates this credit, and then indicate the firm’stax liability for each of the next 5 years. Assume a 40% tax rate on all income toease the calculations.
Spreadsheet Problem
Start with the partial model in the file FM12 Ch 03 P14 Build a Model.xls at thetextbook’s Web site. Cumberland Industries’ most recent balance sheets (in thou-sands of dollars) are shown below and in the partial model in the file:
Spreadsheet Problem 117
Bridgewater Equine Corporation: Balance Sheets as of December 31 (Millions of Dollars)
2007 2006
Assets
Cash and equivalents $ 12.0 $ 10.0
Short-term investments 0.0 0.0
Accounts receivable 180.0 150.0
Inventories 180.0 200.0
Total current assets $372.0 $360.0
Net plant and equipment 300.0 250.0
Total assets $672.0 $610.0
Liabilities and Equity
Accounts payable $108.0 $90.0
Notes payable 67.0 51.5
Accruals 72.0 60.0
Total current liabilities $247.0 $201.5
Long-term bonds 150.0 150.0
Total liabilities $397.0 $351.5
Common stock (50 million shares) 50.0 50.0
Retained earnings 225.0 208.5
Common equity $275.0 $258.5
Total liabilities and equity $672.0 $610.0
(3-13)Loss Carryback andCarryforward
(3-14)Build a Model: FinancialStatements, EVA, andMVA

118 Chapter 3 Financial Statements, Cash Flow, and Taxes
a. The company’s sales for 2007 were $455,150,000, and EBITDA was 15% ofsales. Furthermore, depreciation amounted to 11% of net fixed assets, interestcharges were $8,575,000, the state-plus-federal corporate tax rate was 40%,and Cumberland pays 40% of its net income out in dividends. Given thisinformation, construct Cumberland’s 2007 income statement. (Hint: Start withthe partial model in the file.)
b. Next, construct the firm’s statement of retained earnings for the year endingDecember 31, 2007, and then its 2007 statement of cash flows.
c. Calculate net operating working capital, total net operating capital, net oper-ating profit after taxes, and free cash flow for 2007.
d. Calculate the firm’s EVA and MVA for 2007. Assume that Cumberland had 10million shares outstanding, that the year-end closing stock price was $17.25per share, and its after-tax cost of capital (WACC) was 12%.
Cyberproblem
Please go to the textbook’s Web site to access any Cyberproblems.
2007 2006
Cash $ 91,450 $ 74,625
Short-term investments 11,400 15,100
Accounts receivable 103,365 85,527
Inventories 38,444 34,982
Total current assets $244,659 $210,234
Net fixed assets 67,165 42,436
Total assets $311,824 $252,670
Accounts payable $ 30,761 $23,109
Accruals 30,477 22,656
Notes payable 16,717 14,217
Total current liabilities $ 77,955 $59,982
Long-term debt 76,264 63,914
Total liabilities $154,219 $123,896
Common stock 100,000 90,000
Retained earnings 57,605 38,774
Total common equity $157,605 $128,774
Total liabilities and equity $311,824 $252,670

Mini Case 119
Donna Jamison, a graduate of the University of Tennessee with 4 years of bankingexperience, was recently brought in as assistant to the chairman of the board ofComputron Industries, a manufacturer of electronic calculators.
The company doubled its plant capacity, opened new sales offices outside itshome territory, and launched an expensive advertising campaign. Computron’sresults were not satisfactory, to put it mildly. Its board of directors, which consistedof its president and vice-president plus its major stockholders (who were all localbusinesspeople), was most upset when directors learned how the expansion wasgoing. Suppliers were being paid late and were unhappy, and the bank was com-plaining about the deteriorating situation and threatening to cut off credit. As aresult, Al Watkins, Computron’s president, was informed that changes wouldhave to be made, and quickly, or he would be fired. Also, at the board’s insistenceDonna Jamison was brought in and given the job of assistant to Fred Campo, aretired banker who was Computron’s chairman and largest stockholder. Campoagreed to give up a few of his golfing days and to help nurse the company backto health, with Jamison’s help.
Jamison began by gathering financial statements and other data.
Balance Sheets 2006 2007
Assets
Cash $ 9,000 $ 7,282
Short-term investments 48,600 20,000
Accounts receivable 351,200 632,160
Inventories 715,200 1,287,360
Total current assets $1,124,000 $1,946,802
Gross fixed assets 491,000 1,202,950
Less: Accumulated depreciation 146,200 263,160
Net fixed assets $344,800 $ 939,790
Total assets $1,468,800 $2,886,592
Liabilities and Equity
Accounts payable $ 145,600 $ 324,000
Notes payable 200,000 720,000
Accruals 136,000 284,960
Total current liabilities $ 481,600 $1,328,960
Long-term debt 323,432 1,000,000
Common stock (100,000 shares) 460,000 460,000
Retained earnings 203,768 97,632
Total equity $ 663,768 $ 557,632
Total liabilities and equity $1,468,800 $2,886,592
Mini Case

120 Chapter 3 Financial Statements, Cash Flow, and Taxes
Income Statements 2006 2007
Sales $3,432,000 $5,834,400
Cost of goods sold 2,864,000 4,980,000
Other expenses 340,000 720,000
Depreciation 18,900 116,960
Total operating costs $3,222,900 $5,816,960
EBIT $ 209,100 $17,440
Interest expense 62,500 176,000
EBT $ 146,600 ($ 158,560)
Taxes (40%) 58,640 (63,424)
Net income $ 87,960 ($ 95,136)
Other Data
Stock price $ 8.50 $ 6.00
Shares outstanding 100,000 100,000
EPS $ 0.880 ($ 0.951)
DPS $ 0.220 $ 0.110
Tax rate 40% 40%
Statement of Retained Earnings, 2007
Balance of retained earnings, 12/31/2006 $ 203,768
Add: Net income, 2007 (95,136)
Less: Dividends paid, 2007 (11,000)
Balance of retained earnings, 12/31/2007 $ 97,632
Statement of Cash Flows, 2007
Operating Activities
Net income ($ 95,136)
Adjustments:
Noncash adjustments:
Depreciation 116,960
Changes in working capital:
Change in accounts receivable (280,960)
Change in inventories (572,160)
Change in accounts payable 178,400
Change in accruals 148,960
Net cash provided by operating activities ($ 503,936)

Assume that you are Jamison’s assistant, and you must help her answer thefollowing questions for Campo.a. What effect did the expansion have on sales and net income? What effect did
the expansion have on the asset side of the balance sheet? What effect did ithave on liabilities and equity?
b. What do you conclude from the statement of cash flows?c. What is free cash flow? Why is it important? What are the five uses of FCF?d. What are operating current assets? What are operating current liabilities?
How much net operating working capital and total net operating capital doesComputron have?
e. What are Computron’s net operating profit after taxes (NOPAT) and free cashflow (FCF)?
f. Calculate Computron’s return on invested capital. Computron has a 10% costof capital (WACC). Do you think Computron’s growth added value?
g. Jamison also has asked you to estimate Computron’s EVA. She estimates thatthe after-tax cost of capital was 10% in both years.
h. What happened to Computron’s Market Value Added (MVA)?i. Assume that a corporation has $100,000 of taxable income from operations
plus $5,000 of interest income and $10,000 of dividend income. What is thecompany’s federal tax liability?
j. Assume that you are in the 25% marginal tax bracket and that you have $5,000to invest. You have narrowed your investment choices down to Californiabonds with a yield of 7% or equally risky ExxonMobil bonds with a yield of10%. Which one should you choose and why? At what marginal tax ratewould you be indifferent to the choice between California and ExxonMobilbonds?
Mini Case 121
Statement of Cash Flows, 2007—continued 2007
Investing Activities
Cash used to acquire fixed assets ($ 711,950)
Change in short-term investments 28,600
Net cash provided by investing activities ($ 683,350)
Financing Activities
Change in notes payable 520,000
Change in long-term debt 676,568
Change in common stock —
Payment of cash dividends (11,000)
Net cash provided by financing activities $1,185,568
Summary
Net change in cash ($ 1,718)
Cash at beginning of year 9,000
Cash at end of year $ 7,282