Who borrows to accumulate assets? Class, gender ... - Cepal
20
Who borrows to accumulate assets? Class, gender and indebtedness in Ecuador’s credit market Carmen Diana Deere and Zachary B. Catanzarite Abstract This article examines the propositions that wealth inequality supports credit market segmentation and that the financial system may reproduce economic inequality. Specifically, we discuss how the sources of credit and the purposes of borrowing may help perpetuate inequality. In Ecuador, the asset-poor are more likely than the asset-rich to borrow from the informal sector for expense purposes and to have higher debt-to-net-wealth ratios. We also investigate the correlates of borrowing by men and women to acquire assets and show that the main factor associated with holding asset debt for both men and women is having a formal savings account. Keywords Financial services, gender, gender mainstreaming, social classes, loans, debt, financial institutions, informal sector, economic indicators, Ecuador JEL classification N26, D31, J16 Authors Carmen Diana Deere is a Distinguished Professor Emerita of Latin American Studies and Food and Resource Economics with the University of Florida, and Honorary Emerita Professor-Researcher with FLACSO-Ecuador. deere@ufl.edu Zachary B. Catanzarite is a Research Associate with the Center for Latin American Studies at the University of Florida. zcatanz@ufl.edu
-
Upload
khangminh22 -
Category
Documents
-
view
0 -
download
0
Transcript of Who borrows to accumulate assets? Class, gender ... - Cepal

Who borrows to accumulate assets? Class, gender and indebtedness in Ecuador’s credit marketCarmen Diana Deere and Zachary B. Catanzarite
Abstract
This article examines the propositions that wealth inequality supports credit market segmentation and that the financial system may reproduce economic inequality. Specifically, we discuss how the sources of credit and the purposes of borrowing may help perpetuate inequality. In Ecuador, the asset-poor are more likely than the asset-rich to borrow from the informal sector for expense purposes and to have higher debt-to-net-wealth ratios. We also investigate the correlates of borrowing by men and women to acquire assets and show that the main factor associated with holding asset debt for both men and women is having a formal savings account.
KeywordsFinancial services, gender, gender mainstreaming, social classes, loans, debt, financial institutions, informal sector, economic indicators, Ecuador
JEL classificationN26, D31, J16
AuthorsCarmen Diana Deere is a Distinguished Professor Emerita of Latin American Studies and Food and Resource Economics with the University of Florida, and Honorary Emerita Professor-Researcher with FLACSO-Ecuador. [email protected]
Zachary B. Catanzarite is a Research Associate with the Center for Latin American Studies at the University of Florida. [email protected]

108 CEPAL Review N° 122 • August 2017
Who borrows to accumulate assets? Class, gender and indebtedness in Ecuador’s credit market
I. Introduction
For the past several decades, financial inclusion —expanding access to credit and other financial services for those who have typically been excluded from formal credit markets— has been a main objective of development policy in Latin America. While the explosion in the number of microfinance institutions (MFIs) throughout the region has undoubtedly increased access to credit, there is concern that the poor may be underrepresented in this expansion, as noted in repeated calls to further deepen outreach efforts (Peck and Miller, 2006; De la Torre, Ize and Schmukler, 2011). At the same time, recent microcredit crises in developing countries have sparked concern that the expansion of microfinance has led to over-indebtedness, particularly among the poor (Schicks, 2013a; Bastiaensen and others, 2013).
Figueroa (2011) argues that as long as wealth inequality in Latin America remains high, the region will continue to be subject to a three-tier financial structure in which the poor pay more for access to credit than the rich. The three-tier financial structure consists of: (i) private banks; (ii) formal, non-banking institutions such as savings and loans (S&L) cooperatives and credit unions; and (iii) the informal sector, comprised primarily of moneylenders but also family and friends. He also demonstrates how wealth inequality predicts market segmentation, with the wealthy relying on formal banks, the less wealthy on formal non-banking institutions and the poor on the informal sector. A hallmark of this financial structure is that credit is more expensive from non-banking institutions than from formal banks, and likewise, more expensive from the informal sector than from non-banking institutions.1
This is primarily due to the role played by collateral in reducing risk —always a requirement of private banks— and the economies of scale in transaction costs associated with large loans. In short, those with sufficient assets (the wealthy) are able to provide collateral and obtain better credit terms in the private banking sector, while the excess demand of the asset-poor is channelled into the more expensive segments.
In this paper, we illustrate this argument in the case of Ecuador and take it a step further by demonstrating how the purpose of borrowing may further exacerbate economic inequality. If the rich and the poor borrow for different purposes, with the rich borrowing to accumulate assets and the poor borrowing primarily to meet current expenses, then the expansion of access to credit through microfinance, for example, might mitigate poverty in the short run while reproducing the concentration of wealth among the asset-rich. Differences in the purpose of borrowing, combined with credit market segmentation, may also explain why the poor might have higher debt-to-net-wealth ratios than the wealthy and a greater likelihood of falling into a debt trap.
We investigate the relationship between household net wealth, sources of credit and the purpose of borrowing by drawing on a unique data set on household wealth for Ecuador. This data set allows us to analyse household and individual borrowing from all sources and for all purposes. In this analysis, we use household net wealth quintiles as a proxy for class, distinguishing between the asset-rich (those who have sufficient assets to provide collateral for loans) and the asset-poor (those who do not).2 Our survey also gathered information on which member of a household is responsible for repayment of a loan. Thus, we combine a class analysis with a gender analysis. We analyse the correlates of borrowing by men and women to acquire assets, as well as individual-level debt-to-net-wealth ratios by gender, topics that have not been explored in much depth.
1 See Banerjee and Duflo (2010) on some of the stylized facts on credit markets in developing countries, such as the difference in interest rates between the formal and informal sector.
2 Our net wealth quintiles likely correspond well to the analytic class structure proposed by Portes and Hoffman (2003) for Latin America, where the wealthiest quintile is made up of capitalists, managers of large and medium-sized firms and public institutions and salaried professionals, and the poorest quintile is comprised of informal sector workers.

109CEPAL Review N° 122 • August 2017
Carmen Diana Deere and Zachary B. Catanzarite
Most quantitative studies tend to focus only on households with businesses (or individual entrepreneurs) or households that engage in agricultural activities, and look at credit access and use only for those specific activities, i.e. what is often termed “productive credit”. Our household finance approach takes into account that households often engage in multiple income-generating activities and may take out loans from various sources for multiple purposes, and moreover that loans are fungible —they can be taken out for one purpose but used in multiple ways (Collins, 2008).
We define asset loans as loans taken out for the purpose of acquiring or enhancing any physical asset. Our definition of an asset loan is broader than the usual focus on “productive” credit because we are interested in the relationship between the distribution of wealth, access to credit and indebtedness. Wealth is conventionally defined as the sum of the value of physical assets (including housing and consumer durables) plus financial assets (Davies, 2008). In a three-tiered financial system, most physical and financial assets potentially serve as collateral for loans. For example, while consumer durables, with the possible exception of vehicles, would hardly suffice as collateral for a private bank loan, a television, stove or refrigerator may be acceptable as collateral at non-banking institutions and in the informal sector, since these can be sold or pawned to meet debt repayments (Vogelgesang, 2003).3 Moreover, even if a stove or refrigerator purchased on installment is not currently used in connection with a business, it may generate the means for a woman’s self-employment (selling cooked food or chilled drinks) if the need arises, much the same way that ownership of a vehicle may constitute a potential means for a man to generate income through transport services.
Expense loans include loans taken out to meet daily expenses such as food, utilities, transportation or clothing; expenses for schooling, health and celebrations; migration expenses; and repayment of previous loans. We thus also depart from conventional analysis by considering education and health as expenses rather than human capital investments, since their financial return may be in the long run as opposed to the short term and does not necessarily accrue to the household that holds the debt.
We demonstrate that those who are asset-rich in Ecuador are not only more likely to borrow from formal sources but also more likely to borrow for the purpose of asset accumulation. In contrast, the asset-poor rely more on informal sources and are more likely to borrow to meet household expenses. Not surprisingly, the poor have higher debt-to-net-wealth ratios than the wealthy. While the great majority of loans taken out in Ecuador are from formal sources, loans taken out individually by either men or women, but particularly women, are more likely to be from informal sources than those for which a couple is responsible. Similarly, while the great majority of loans are taken out for the purpose of asset accumulation, loans for which women are individually responsible are more likely to be expense loans.
Given our primary interest in the relationship between the use of credit and economic inequality, we perform a logistic regression analysis to investigate the correlates of borrowing to acquire assets. Our results suggest that, regardless of gender, the main factor associated with holding asset debt is having a formal savings account. Meanwhile, a major gender difference occurs in the relevance of earning own income, a variable that is significantly associated with women only in terms of borrowing for the purpose of asset accumulation. In the aggregate, those in the poorest wealth quintile, particularly the poorest men, have the most troubling debt-to-net-wealth ratios, but the poorest women may have the highest levels of debt distress as indicated by the need to recycle loans. Taken together, the analysis provides support for Figueroa’s (2011) proposition that under the three-tiered financial system, wealth begets wealth.
3 See CAF (2011, cuadro 4.7) for a detailed breakdown of the types of collateral accepted by a range of formal and informal lending sources in a study of micro-entrepreneurs in Colombia.

110 CEPAL Review N° 122 • August 2017
Who borrows to accumulate assets? Class, gender and indebtedness in Ecuador’s credit market
Following this introduction, the article is organized as followed. Section II describes Ecuador’s financial system and summarizes the available studies on household use of credit and economic inequality. Section III presents the methodology of the 2010 Ecuador national household asset survey and then investigates the sources and purpose of loans by class and gender. In section IV contains the logistic regression analysis of the factors associated with borrowing by individuals for the purpose of asset accumulation. Section V examines the indebtedness of men and women by class and section VI sets out our conclusions.
II. The Ecuadorian context
Ecuador’s financial system has recovered from the 1999-2000 financial crisis that led to the adoption of the United States dollar as the country’s official currency. That crisis was marked by the failure of 22 commercial banks, which held some 60% of the assets of the private financial system, and was the culmination of almost a decade of economic instability. Most analysts attribute that instability to a combination of financial deregulation and liberalization, excessive external debt, sharply fluctuating oil prices (the country’s major export) and political instability (Da Ros, 2003; Jácome, 2007).
The task in the next decade was to restore public confidence and this was done by rebuilding the public banking system that previously had been dismantled, along with State regulation of the private banking system. In 2006, private bank credit as a percentage of gross domestic product (GDP) was 22%, placing Ecuador below the Latin American average but above that of much larger economies such as Peru and Mexico (Fanelli, 2011, table 10.1). By 2010, this share had increased to 28%.4
Two institutions currently regulate the formal, private financial system: the Superintendence of Banking and Insurance (SBS) and the Superintendence of the Popular and Solidarity Economy (SEPS). SBS regulates all private, commercial banks, which numbered 24 in 2013, compared with 96 prior to the financial crisis. Since 2013, SEPS regulates all forms of cooperative financial associations. Prior to 2013, the largest S&L cooperatives (those with assets of more than US$ 1 million and deposits of more than US$ 200,000) were governed by SBS, and those below this threshold by the Ministry of Economic and Social Inclusion.
While many of the S&L cooperatives date back to the 1960s, their numbers expanded rapidly throughout the country following the collapse of the banking sector. A 2002 census of the S&L cooperatives and communal banks and funds revealed that at that time there were 26 regulated cooperatives reporting to SBS and 350 non-regulated institutions reporting to the Ministry; the latter had over half a million members (Jácome and Cordovéz, 2004). By June 2013, 773 S&L cooperatives reported to SEPS. As table 1 shows, these are stratified by size, with the largest cooperatives (segment 4) being the ones that previously reported to SBS.5
The composition of the loan portfolios of the private banks and the S&L cooperatives differ markedly, as table 1 also illustrates. The S&L cooperatives serve microenterprises and households, while the private banks are heavily focused on lending to the commercial sector (corporate firms). Consumer loans (as traditionally defined) make up a relatively large share of the loan portfolios of both the private banks and the S&L cooperative sector, at 36% and 50%, respectively.
4 See World Bank [online] http://econ.worldbank.org/WBSITE/EXTERNAL/EXTDEC/EXTRESEARCH/0,,contentMDK:20696167~pagePK:64214825~piPK:64214943~theSitePK:469382,00.html. Based on World Bank Financial Structure and Economic Development Database, for private credit by deposit money banks and other financial institutions as a share of GDP.
5 Included in the S&L cooperatives (mainly in segments 1 and 2) are what are known as communal banks or funds (often averaging only 25 to 30 members) and other local-level microfinance groups organized by non-governmental organizations (NGOs). A main distinction between these various forms, besides their size and geographical coverage, is that while S&L cooperatives can take deposits from non-cooperative members, the other forms can only hold the savings of their members (SEPS, 2014).

111CEPAL Review N° 122 • August 2017
Carmen Diana Deere and Zachary B. Catanzarite
Table 1 Ecuador: distribution of loans between private banks and savings and loan cooperatives
of different sizes by purpose, June 2013(Percentages)
Institution Number Commercial Consumer Housing Micro-enterprise Totala
Private banks 24 48 35.7 8.5 7.8 100%(US$ 16.3 billion)
Cooperativesb
Segment 4 40 4 51.2 7.3 37.5 100%(US$ 3.3 billion)
Segment 3 78 0.9 49.5 8.8 40.8 100%(US$ 1.2 billion)
Segment 2 296 4.9 39 2 54 100%(US$ 0.5 billion)
Segment 1 359 9.3 37.7 1.5 52.4 100%(US$ 0.1 billion)
Subtotal 773 3.4 49.5 7.1 40 100%US$ 5.0 billion)
Source: Prepared by the authors, on the basis of Superintendence of Banking and Insurances (SBS), Boletín de Series Bancos Privados, 2013 [online] http://www.sbs.gob.ec; and Superintendencia de Economía Popular y Solidaria (SEPS), Boletín Financiero – Sector Financiero Popular y Solidario al 30 de junio de 2013, 2013 [online] http://www.seps.gob.ec.
a The total also includes a fifth category, loans for education, which amount to less than 1% of the total portfolio.b Segments refer to the stratification of savings and loan cooperatives by size, defined by the value of their total assets, number
of members and extent of geographical coverage, with segment 4 representing the largest cooperatives.
Another feature of the Ecuadorian financial system is that the central bank sets the maximum interest rates that can be charged on formal sector loans. As table 2 shows, these vary by the type of institution and the purpose of the loan. As predicted by the Figueroa (2011) model, the lowest interest rates are offered by private banks to corporate clients and the highest rates are for microcredit offered by MFIs. In 2010, the maximum corporate rate was 9.3% per annum, whereas microcredit rates ranged from 25.5% to 30.5% depending on the size of the loan. In our qualitative fieldwork in Ecuador during 2009-2010, moneylenders were reported to charge between 10% and 20% per month.6
Table 2 Ecuador: maximum interest rates, December 2010
(Percentages)
Purpose Interest ratea
Commercial
Corporateb 9.3
Small and medium-sized businessesc 11.8
Housing 11.3
Consumer goods 16.3
Microcreditd
Loans $ 8 500 and more 25.5
Loans between $ 600 and $ 8 500 27.5
Loans less than $ 600 30.5
Source: Prepared by the authors, on the basis of Central Bank of Ecuador, Evolución del volumen de crédito y tasas de interés: análisis del sistema de finanzas públicas y privado del Ecuador, Quito, 2013 [online] http://contenido.bce.fin.ec/documentos/Estadisticas/SectorMonFin/BoletinTasasInteres/ect201312.pdf.
a These same maximum interest rates held through 2014.b Firms with annual sales above $ 5 million.c Firms with annual sales between $ 100,000 and $ 5 million.d Firms with annual sales below $ 100,000.
6 Focus groups in the provinces of Pichincha and Manabí. See also Floro and Messier (2006, p. 239) on the high interest rates charged by moneylenders in Quito and Guayaquil.

112 CEPAL Review N° 122 • August 2017
Who borrows to accumulate assets? Class, gender and indebtedness in Ecuador’s credit market
One of the main drivers of the microfinance movement in Ecuador since 2000 has been the Rural Finance Network (RFR), which brings together private banks working in this subsector,7
S&L cooperatives and NGOs with microfinance programmes. These MFIs, whose mission is financial inclusion, work both in rural areas and among the urban poor. Their combined loan portfolio has steadily increased, growing at around 10% per year during the 2000s (Readout, 2011, p. 30) and more than doubling between 2010 and 2013 (RFR, 2013).
Only a few largescale surveys have been carried out in Ecuador that look at credit use by households, as opposed to firms, and irrespective of source. These surveys point to a recovery of confidence in the private financial system and growing financial inclusion. A representative household survey in the three largest cities (Quito, Guayaquil and Cuenca) in 2003 found that only 12.5% of urban households had taken out a loan in the previous twelve months (Jácome, 2005). An analysis of the nationally representative 2006 Ecuador living standards survey showed that 51.5% of households had taken out a loan for any purpose in the previous year.8 In our nationally representative household assets survey from 2010, described below, we find that 46% of households have an outstanding loan. While the scope and methodology of these surveys differ, they support the conclusion that the financial system both recovered and expanded over the course of the 2000s.
Mideros (2010), utilizing the credit modules in the 2006 living standards survey, analyses the role of income inequality in the use of different types of credit in Ecuador. He finds a much lower incidence of consumer cash loans9 among households in the poorest two income quintiles (22% and 26%, respectively) than among those in the wealthiest two quintiles (31% in each). Installment loans for the acquisition of assets, products and services are the most frequently used form of credit reported in that survey. He finds even greater differentiation for this type of credit, with 24% of households in net wealth quintile I holding such loans as compared to 40% in quintile V (Mideros, 2010, figure 17). In terms of business credit, fewer households in the poorest quintile have a business (31%), and of these, only 9% have a business loan; in contrast, among households in the top quintile, approximately 57% have a business, and 20% of these have a business loan (Mideros, 2010, figure 18).10 Overall, his results suggest considerable differentiation in the use of credit depending on a household’s income quintile.11 We propose that a more robust measure of the role of economic inequality in the use of credit is provided by considering the distribution of wealth rather than income.
III. The Ecuador Household Asset Survey
The Ecuador Household Asset Survey (known as Encuesta Activos FLACSO-Florida (EAFF)) was carried out in 2010 by FLACSO-Ecuador and the University of Florida as part of an international comparative
7 The main banks engaged in microfinance include Banco Solidario, established in 1995 and linked to ACCION International; CREDIFE, established in 1999 as a subsidiary of the largest private bank, Banco Pichincha; and Banco ProCredit, established in 2001. The MIX Market website reports an additional four, all with gross loan portfolios of less than $ 100 million. See [online] http://www.mixmarket.org.
8 Authors’ calculations, based on INEC (2006) and aggregating at the household level all modules that included credit information.9 The possible uses of household consumer credit were for housing, health, food, education, clothing, consumer durables, land
acquisition, debt repayment and special occasions.10 Readout (2011, table 4.2) found similar results analysing the 2004 United States Agency for International Development (USAID)
micro-entrepreneur survey for Ecuador. Only 8% of micro-entrepreneurs in the lowest socioeconomic group had received a loan in the previous 12 months from any source, compared with 25% in the highest group.
11 Mideros (2010) also conducts an econometric analysis of the impact of the different types of credit on the median per capita household income gap. His most important finding is with respect to the potential impact of formal business credit on poverty, which increases the per capita income of households with businesses by 27% compared with those that do not have access to such credit.

113CEPAL Review N° 122 • August 2017
Carmen Diana Deere and Zachary B. Catanzarite
study.12 The survey was based on two-stage, stratified sampling, designed to be representative of the coastal and highland regions of Ecuador, and resulted in a sample of 2,892 households. The primary objective was to measure asset ownership at the household and individual level, and for this purpose we employed two instruments: a household assets inventory and an individual questionnaire. The survey was aimed at the heads of household, and the household inventory of physical assets was completed by the principal couple together, whenever possible.13 For each physical asset —the principal residence, agricultural land, other real estate, livestock, agricultural equipment and installations, businesses and consumer durables— a complete list of owners was obtained as well as information on whether there was an outstanding debt on the asset. The individual questionnaire was then completed by each respondent separately and focused on complementary information on asset ownership, including individual savings, current debt, loans made to third parties and other considerations such as household decision-making.
The individual debt module solicited information on all loans that were obtained by the respondent with current outstanding debt. Thus, the data may underestimate total borrowing activities during a given year due to the exclusion of short-term loans repaid during the previous twelve months. This shortcoming is balanced by the fact that the measure of outstanding debt, which includes loans acquired in previous years, gives a fuller picture of individual indebtedness. Since information on debt was gathered at both the household and individual level, there was a lengthy process of data reconciliation. While this method of data collection produced some duplication and potential misidentification (since husbands and wives sometimes provided contradictory information on the details of the same loan), it had the advantage of maximizing the possibility that information was captured on all outstanding debt. Another shortcoming of our survey was that we did not collect information on the interest rate or terms of these loans.14
Finally, we should note that the survey results are truncated, since we were unable to secure a representative sample of households in the wealthiest socioeconomic group, due primarily to a rejection rate of 100% among this group in Quito. Nonetheless, our estimated Gini coefficient of the concentration of gross wealth is 0.68 —as expected, much greater than the official estimate of the Gini income coefficient for the survey year of 0.52 (Deere and Contreras, 2011).
In the following analysis, the value of individual and household assets is estimated at market value (as reported by respondents for how much they could sell each asset today in its present condition). All results incorporate the sampling design and have been weighted utilizing the sample expansion factors so that the estimates are nationally representative.
1. Formal versus informal sources of loans
Overall, 70% of the 1,791 outstanding loans reported in the survey are from formal sources, and 30% are from informal sources. Figure 1 summarizes the distribution of loans by quintile and source and shows that the majority of loans across all quintile groups are from formal sources. Nonetheless, wealthier quintiles are more likely to have formal loans than poorer quintiles, and poorer quintiles are more likely than wealthier quintiles to rely on informal sources.15
12 See Doss and others (2011) for the comparative results on household wealth in Ecuador, Ghana and Karnataka, India; Deere and Contreras (2011) for more detailed information on the methodology of the Ecuador survey; and Grown and others (2015) for the comparative results on household and individual debt in the three countries.
13 On the rationale for interviewing the couple together for the household asset inventory, see Deere and Catanzarite (2016).14 For examples from Latin America on how interest rates and loan terms vary by formal and informal source in the case of
agricultural loans, see Barham, Boucher and Carter (1996) on Guatemala and Guirkinger (2008) on Peru. 15 Several small-scale surveys of households in urban “popular” neighborhoods in Quito and Guayaquil have found that these
households tend to rely more on informal than formal credit (Jácome and Cordovéz, 2004; Floro and Messier, 2006).

114 CEPAL Review N° 122 • August 2017
Who borrows to accumulate assets? Class, gender and indebtedness in Ecuador’s credit market
Figure 1 Ecuador: proportion of formal and informal loans by household net wealth quintile, 2010
(Percentages)
0
10
20
30
40
50
60
70
80
90
Quintile I Quintile II Quintile III Quintile IV Quintile V
Subtotal formal Subtotal informal
Source: Prepared by the authors, on the basis of Encuesta Activos FLACO-Florida (EAFF), 2010 [online] http://www.flacsoandes.edu.ec/pagina/60759-documentos-de-encuesta-activos-flacso-florida.
Table 3 presents this information at the household level —whether anyone in the household has an outstanding loan— and by net wealth quintile. While households differ as to whether they have a loan at all (53% of households in quintile V as compared to 43% in quintile I), they differ most with respect to the source of their loans. Among households in quintile V, 45% have a formal loan while only 15% have an informal loan; the corresponding figures for quintile I are 29% (formal) and 20% (informal).
Table 3 Ecuador: incidence of household formal and informal loans by net wealth quintile
and credit source, 2010 (Percentages)
SourceQuintile
Total householdsI II III IV V
State bank 2.3 3.9 6.5 4.8 11.4 5.8
Private bank 4.9 6.5 6.9 9.5 16.2 8.8
Cooperative/credit union 6.2 4.2 7.5 14.6 11.7 8.9
Other private/NGO 1.0 2.5 3.3 1.9 2.4 2.2
Business/store 16.2 18.2 14.6 10.7 11.2 14.2
Credit card 0.9 2.8 1.3 1.6 2.7 1.9
Subtotal formal 29.0 34.4 35.4 36.7 45.0 36.1Informal group 0.5 0.7 3.4 0.5 0.2 1.1
Moneylender 2.3 3.2 3.0 1.7 1.7 2.4
Employer 1.3 0.2 0.7 1.2 1.5 1.0
Friend 7.4 6.3 4.6 5.1 6.5 6.0
Family 9.2 7.6 5.3 7.3 5.6 7.0
Other 0.5 0.0 0.5 0.2 0.5 0.3
Subtotal informal 19.9 16.8 16.7 15.7 14.9 16.8Totala 43.2 44.8 46.1 47.9 52.7 46.9
n 575 601 592 540 584 2 892
N 668 995 668 593 669 070 668 756 668 419 3 343 832
Source: Prepared by the authors, on the basis of Encuesta Activos FLACO-Florida (EAFF), 2010 [online] http://www.flacsoandes.edu.ec/pagina/60759-documentos-de-encuesta-activos-flacso-florida.
a The total incidence refers to all households which have a loan irrespective of source and hence is less than the sum of formal and informal sources.

115CEPAL Review N° 122 • August 2017
Carmen Diana Deere and Zachary B. Catanzarite
Table 3 also provides a detailed breakdown of the sources of loans classified as formal or informal. In the formal sector, the most frequent source of loans overall is “business/store” credit (obtained by 14% of households); these are generally installment loans for the prior acquisition of goods or services.16 This is the most frequent type of formal loan available to households in quintiles I to III, which is not surprising given the rapid spread of installment credit by department stores in Ecuador over the past decade. The second most frequent source of loans overall are private banks and S&L cooperatives, the incidence of each being 9%. Loans from each of these sources are much more frequent among households in the upper 40% of the wealth distribution compared with the bottom 40%. Loans from State banks appear even more skewed towards households at the top of the wealth distribution.17 Only 2% of households have microfinance loans from NGOs or other private lenders (such as religious groups), and such loans are slightly less frequent among households in the poorest wealth quintile. The microfinance sector is, of course, broader than just NGO programmes, since this sector also includes all S&L cooperatives as well as seven microfinance banks, but, unfortunately, the latter cannot be disaggregated in our data.
Turning to informal sector loans, the most frequent source of these loans overall are friends and family, and this pattern holds across quintile groups, with households in the poorest quintiles being slightly more likely to hold loans from these sources than wealthier quintiles. Moneylenders are not a very frequent source of loans, reported by only 2% of households, although they are relied upon more by households in the bottom 60% of the distribution than wealthier households. Informal lending groups, such as rotating savings and credit associations (ROSCAs), are even less common. It is likely that the relatively low incidence reported of reliance on moneylenders and informal lending groups in our sample reflects the increase in competition that has been driven by the growth of MFIs in Ecuador since the early 2000s.
Table 4 presents the distribution of loans by the household member who is responsible for repayment of the debt. Respondents to the debt module were initially asked to report on all those loans for which they were responsible (the gateway question); they were then asked explicitly whether they alone were responsible for repayment or whether they shared this responsibility with another person. The information reported in this table is based on the latter question and includes not only loans for which an individual or a couple is responsible but also loans for which repayment is shared with someone other than their partner (who may or not be a household member), which comprise relatively few cases.
Overall, the outstanding loans of couples and other joint loans are more likely to be from formal sources than the loans for which a man or a woman alone is individually responsible. This is partly because formal sources of credit are more likely to follow legal norms and require that a loan to a married person be cosigned by his or her spouse. Nonetheless, lending to couples could also reflect institutional preferences; dual-income households, for example, are considered more creditworthy. As table 4 shows, private banks and cooperatives are overrepresented among the sources of loans to couples and other joint loans, compared with the distribution of individual loans.
16 Also included here are a few cases of direct financing of dwellings provided by developers, which did not fit in other categories. This category may also overstate formal loans to the extent that loans in kind provided by small shops in the informal sector cannot be disaggregated. However, the fact that the great majority of loans in this category are for the acquisition of consumer durables makes us confident that their categorization as formal loans is appropriate.
17 The main State bank that lends to individuals is the semi-public bank of the social security system, Bank of the Ecuadorian Social Security Institute (BIESS), which makes loans only to its members, including mortgages to finance the purchase or construction of housing.

116 CEPAL Review N° 122 • August 2017
Who borrows to accumulate assets? Class, gender and indebtedness in Ecuador’s credit market
Table 4 Ecuador: distribution of loans by who is responsible for debt repayment and source, 2010
(Percentages)
SourceResponsible party
Total loansMale alone Female alone Principal couple Other joint
State bank 11.7 8.7 6.8 9.5 9.4
Private bank 12.1 12.2 21.1 18.2 14.6
Cooperative/credit union 11.5 11.1 25.7 24.3 15.4
Other private/NGO 2.3 5.8 2.1 8.5 3.6
Business/Store 27.6 25.2 18.6 24.8 24.4
Credit card 4.2 3.2 1.3 0.0 3.0
Subtotal formal loans 69.4 66.3 75.6 85.3 70.3
Informal group 0.1 4.3 2.4 0.0 2.1
Moneylender 5.0 3.8 3.8 2.1 4.2
Employer 3.2 0.6 0.8 0.0 1.6
Friend 13.6 9.7 5.9 5.1 10.0
Family 7.6 15.1 11.4 7.5 11.2
Other 1.1 0.4 0.1 0.0 0.6
Subtotal informal loans 30.6 33.7 24.4 14.7 29.7
n 676 612 453 50 1 791
N 807 306 758 834 566 579 55 980 2 188 699
Source: Prepared by the authors, on the basis of Encuesta Activos FLACO-Florida (EAFF), 2010 [online] http://www.flacsoandes.edu.ec/pagina/60759-documentos-de-encuesta-activos-flacso-florida.
Note: F (2.86, 609.89) = 2.97, p = 0.033.
With respect to gender differences (comparing loans for which an individual man or woman is responsible), State banks make up a larger share of the loans for which individual men are responsible, while those from NGOs make up a larger share of the loans to individual women.18 Informal credit group loans are also more common among loans to individual women, while loans from employers are more common among loans to individual men, which reflects the fact that a greater share of men are employed than women. Finally, it is interesting to note that when women borrow alone, they rely more on loans from family members, whereas men in this case rely more on friends as a source of loans.
2. The purpose of borrowing
Of the total 1,821 sole-purpose loans reported, 68% have been taken out for the purpose of asset accumulation and 32% in order to meet expenses.19 As figure 2 shows, there are statistically significant differences by wealth quintile in the distribution of these asset and expense loans. Households in the poorest quintile are much more likely to take out expense loans compared with the other quintiles, whose borrowing activity is geared towards asset accumulation. This is a particularly worrisome finding since it suggests that the loans taken out by the asset poor are less likely to generate a future income stream, making it potentially difficult for them to repay the loan, a factor we will explore.
18 December 2013 data for the 46 MFIs reporting to the Rural Finance Network reveal that 69% of the loan clients of NGOs are women, compared with the overall average for RFN members of 54% (RFN, 2013).
19 Less than 2% of the total loans were reported as dual-purpose expense and asset loans, and these have been excluded from the analysis.

117CEPAL Review N° 122 • August 2017
Carmen Diana Deere and Zachary B. Catanzarite
Figure 2 Ecuador: proportion of asset and expense loans by household net wealth quintile, 2010
(Percentages)
0
10
20
30
40
50
60
70
80
90
Quintile I Quintile II Quintile III Quintile IV Quintile V
Asset Expense
Source: Prepared by the authors, on the basis of Encuesta Activos FLACO-Florida (EAFF), 2010 [online] http://www.flacsoandes.edu.ec/pagina/60759-documentos-de-encuesta-activos-flacso-florida.
Table 5 offers a more detailed breakdown of the incidence of household debt by purpose among those who have loans. This table takes into account that households may have multiple loans and loans for various purposes. It shows that, overall, the most frequent purposes are for the acquisition of consumer durables (28%) and explicitly for a business (27%). This is followed in frequency by loans to acquire a housing lot or dwelling or to improve or expand a dwelling (19%), to meet daily needs (15%) and for health expenses (10%).
Among the most striking class differences is the greater frequency of households in the poorest 40% of the wealth distribution taking out loans to acquire consumer durables (such as a stove, television or refrigerator) and to meet daily needs and health expenses. In contrast, households in the wealthiest 40% borrow most frequently to acquire or upgrade their dwelling or for business purposes. The wealthiest households are also much more likely to borrow to acquire a vehicle, whereas the poorest are more likely to borrow for education expenses. This analysis suggests that wealthier households are more likely than poorer ones to go into debt to acquire assets that will generate income directly and/or serve as collateral for future loans. Worth noting, however, is that households in quintiles I and V are equally like to borrow in order to repay previous loans. The recycling of loans is often noted as a potential signal of over-indebtedness (Schicks, 2013b).
With respect to who is responsible for these loans, figure 3 shows that couples and other joint borrowers are significantly more likely to have loans related to asset acquisition than expenses when compared with individual borrowers. Moreover, lone female borrowers are more likely than any other group to have expense rather than asset debt.
Finally, figure 4 presents the distribution of loans by purpose and source. It shows that while loans intended for asset acquisition are much more likely to be from formal lending sources, expense loans are more likely to be obtained from informal sources.

118 CEPAL Review N° 122 • August 2017
Who borrows to accumulate assets? Class, gender and indebtedness in Ecuador’s credit market
Table 5 Ecuador: incidence of loans by household net worth quintile and purpose among
households with loans, 2010 (Percentages)
PurposeQuintile
Total households with loans1 2 3 4 5
Dwelling/lot 3.9 16.6 14.0 28.1 29.8 19.2
Agricultural land 0.0 0.2 0.6 0.7 3.3 1.1
Other real estate 6.1 2.2 5.1 6.7 6.2 5.3
Business 21.1 17.8 31.3 25.4 37.5 27.1
Agricultural equipment and installations 0.4 0.9 0.0 0.2 1.6 0.6
Livestock 0.8 0.8 1.7 0.6 1.6 1.1
Agricultural inputs 0.4 3.6 3.7 0.3 1.6 1.9
Consumer durables 33.1 39.6 30.4 19.9 18.1 27.6
Vehicles 0.6 2.3 3.4 9.2 11.8 5.8
Asset debt 60.9 73.4 77.5 75.4 84.6 74.9
Daily needs 22.7 21.0 11.8 13.9 8.2 15.1
Health 18.9 11.0 9.2 5.5 7.7 10.2
Education 9.9 10.0 5.2 4.4 7.3 7.3
Celebrations 3.3 1.3 0.8 1.7 0.5 1.5
Repayment of other debt 11.1 5.3 7.8 6.6 11.4 8.5
Other 5.8 5.5 6.8 7.5 3.5 5.8
Expense debt 59.4 43.9 36.6 33.2 30.4 40.0
Any debt 43.6 45.3 48.0 49.9 55.1 48.4
n (with any loan) 253 266 272 249 318 1 358
N (with any loan) 291 826 302 798 321 428 333 354 368 445 1 617 851
Source: Prepared by the authors, on the basis of Encuesta Activos FLACO-Florida (EAFF), 2010 [online] http://www.flacsoandes.edu.ec/pagina/60759-documentos-de-encuesta-activos-flacso-florida.
Figure 3 Ecuador: asset and expense loans by responsible party, 2010
(Percentages)
0
10
20
30
40
50
60
70
80
90
Man alone Woman alone Couple Other joint Total
Asset Expense
Source: Prepared by the authors, on the basis of Encuesta Activos FLACO-Florida (EAFF), 2010 [online] http://www.flacsoandes.edu.ec/pagina/60759-documentos-de-encuesta-activos-flacso-florida.

119CEPAL Review N° 122 • August 2017
Carmen Diana Deere and Zachary B. Catanzarite
Figure 4 Ecuador: loans by purpose and source, 2010
(Percentages)
0
10
20
30
40
50
60
70
80
90
Asset Expense
Formal Informal
Source: Prepared by the authors, on the basis of Encuesta Activos FLACO-Florida (EAFF), 2010 [online] http://www.flacsoandes.edu.ec/pagina/60759-documentos-de-encuesta-activos-flacso-florida.
Note: F (1.213), p = 0.000.
IV. The likelihood of borrowing for asset accumulation
We now turn to the likelihood that an individual will acquire an asset loan. In order to conduct a gender analysis, an individual is considered to borrow for asset acquisition whether the loan for which he or she is responsible was obtained individually or jointly. We perform logit regressions for men and women separately. Our variables of interest are as follows: (i) being an income earner, which we define as being in remunerated employment (whether an employer, self-employed or any kind of wage worker) versus being an unpaid family worker, unemployed or not economically active; (ii) having a formal savings account; (iii) being a member of a social network; and (iv) the household net wealth quintile to which the individual belongs.
We hypothesize that individuals who earn income directly are considered more creditworthy than those who do not since they have a verifiable means of making loan repayments. Sometimes proof of employment or of ownership of a business may suffice as collateral, particularly among S&L cooperatives.20 Since obtaining a loan may be tied to having a previous relationship with the lender and having savings may serve as a form of collateral, we expect those who own a formal savings account to be more likely to obtain loans for the purpose of asset accumulation (CAF, 2011). It is common for private banks as well as S&L cooperatives in Ecuador to require potential borrowers to have a savings account and/or to maintain a minimum balance in the account; these conditions may also lower the cost of borrowing. Also, having formal savings might reduce the need for short-term credit, making account holders more likely to seek loans for asset acquisition (Kast and Pomeranz, 2014).
We expect individuals who are members of a social network or group to have greater access to information regarding the availability and conditions of credit and thus to be more likely to have asset loans (Fletschner and Mesbah, 2011). In addition, being a group member may increase the odds of
20 Authors’ review of the websites of the largest of the 39 Ecuadorian savings and loan cooperatives listed on the MIX Market (date of reference: January 2015).
120 CEPAL Review N° 122 • August 2017
Who borrows to accumulate assets? Class, gender and indebtedness in Ecuador’s credit market
being able to secure a guarantor for a loan, a requirement in Ecuador for loans from private banks and most S&L cooperatives. The most common groups to which women respondents belong are religious groups, followed by parents’ associations and community groups. For men, the rank ordering is different: trade unions, sporting associations and community groups. Finally, we expect those from asset-rich households to be more likely to access loans for asset acquisition than those from asset-poor households, since they can more easily provide collateral for a loan.
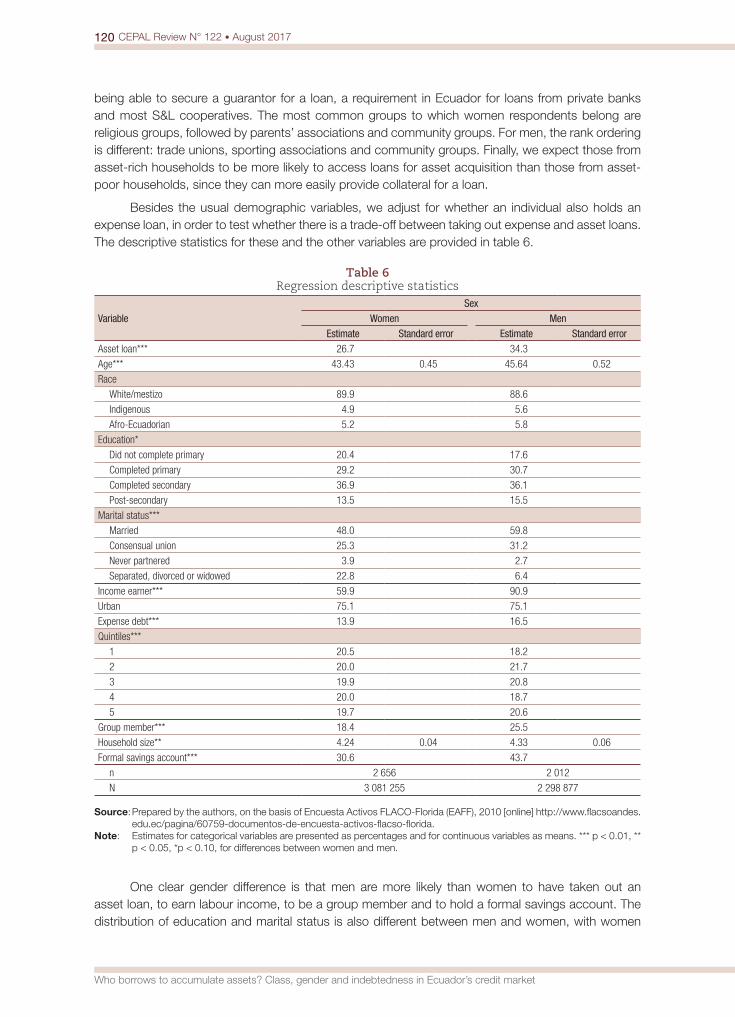
Besides the usual demographic variables, we adjust for whether an individual also holds an expense loan, in order to test whether there is a trade-off between taking out expense and asset loans. The descriptive statistics for these and the other variables are provided in table 6.
Table 6 Regression descriptive statistics
VariableSex
Women MenEstimate Standard error Estimate Standard error
Asset loan*** 26.7 34.3
Age*** 43.43 0.45 45.64 0.52
Race
White/mestizo 89.9 88.6
Indigenous 4.9 5.6
Afro-Ecuadorian 5.2 5.8
Education*
Did not complete primary 20.4 17.6
Completed primary 29.2 30.7
Completed secondary 36.9 36.1
Post-secondary 13.5 15.5
Marital status***
Married 48.0 59.8
Consensual union 25.3 31.2
Never partnered 3.9 2.7
Separated, divorced or widowed 22.8 6.4
Income earner*** 59.9 90.9
Urban 75.1 75.1
Expense debt*** 13.9 16.5
Quintiles***
1 20.5 18.2
2 20.0 21.7
3 19.9 20.8
4 20.0 18.7
5 19.7 20.6
Group member*** 18.4 25.5
Household size** 4.24 0.04 4.33 0.06
Formal savings account*** 30.6 43.7
n 2 656 2 012
N 3 081 255 2 298 877
Source: Prepared by the authors, on the basis of Encuesta Activos FLACO-Florida (EAFF), 2010 [online] http://www.flacsoandes.edu.ec/pagina/60759-documentos-de-encuesta-activos-flacso-florida.
Note: Estimates for categorical variables are presented as percentages and for continuous variables as means. *** p < 0.01, ** p < 0.05, *p < 0.10, for differences between women and men.
One clear gender difference is that men are more likely than women to have taken out an asset loan, to earn labour income, to be a group member and to hold a formal savings account. The distribution of education and marital status is also different between men and women, with women

121CEPAL Review N° 122 • August 2017
Carmen Diana Deere and Zachary B. Catanzarite
less likely to have completed primary school and men more likely to have pursued post-secondary education, and women much more likely than men to be separated, divorced or widowed.
The results in table 7 show that, of our variables of interest, the factor that correlates most positively and significantly with borrowing by both women and men to acquire assets is having a formal savings account, which increases the likelihood of having an asset loan by 18% and 20%, respectively. Having income-generating employment is associated with having an asset loan for women only, and it increases their probability of borrowing for asset acquisition by 14.2%. The lack of a significant association with this variable for men is likely due to the fact that the overwhelming proportion of men are reported as income-earning, which means that this variable has little power to distinguish men who have asset loans from those who do not.
Table 7 Logistic regression results of the likelihood of borrowing for asset accumulation
VariableSex
Women Mendy/dx Standard error p dy/dx Standard error p
Age -0.002 0.001 -0.005 0.001 ***
Race
White/mestizo Ref Ref Ref Ref
Indigenous 0.094 0.082 -0.037 0.057
Afro-Ecuadorian 0.154 0.058 *** 0.151 0.059 **
Education
Less than primary Ref Ref Ref Ref
Completed primary 0.035 0.037 -0.003 0.046
Completed secondary 0.068 0.046 0.021 0.034
Post-secondary 0.040 0.059 0.011 0.047
Marital status
Married Ref Ref Ref Ref
Consensual union -0.011 0.029 -0.069 0.031 **
Never partnered -0.124 0.043 *** -0.244 0.052 ***
Separated, etc. 0.003 0.026 -0.040 0.048
Income earner 0.142 0.019 *** -0.022 0.064
Urban -0.028 0.034 -0.019 0.029
Expense debt -0.017 0.034 -0.117 0.030 ***
Household net worth quintiles
I Ref Ref Ref Ref
II 0.010 0.036 -0.002 0.043
III 0.090 0.037 ** 0.068 0.041 *
IV 0.115 0.047 ** 0.070 0.038 *
V 0.144 0.036 *** 0.063 0.053
Group member 0.048 0.033 0.087 0.030 ***
Household size 0.000 0.006 0.013 0.008 *
Formal savings account 0.181 0.027 *** 0.196 0.024 ***
F(20, 194) 20.31*** 10.55***
n 2 656 2 012
N 3 081 255 2 298 877
Source: Prepared by the authors, on the basis of Encuesta Activos FLACO-Florida (EAFF), 2010 [online] http://www.flacsoandes.edu.ec/pagina/60759-documentos-de-encuesta-activos-flacso-florida.
Note: *** p < 0.01,** p < 0.05, *p < 0.10.
In contrast, being a group member is associated with having an asset loan for men only, and it increases the likelihood that they borrow for this purpose by 8.7%. This result, combined with the previously noted finding that women and men tend to belong to different types of groups, suggests

122 CEPAL Review N° 122 • August 2017
Who borrows to accumulate assets? Class, gender and indebtedness in Ecuador’s credit market
that the type of group to which an individual belongs may make a difference as to whether the group is a source of credit information as well as of potential guarantors for a loan. Whereas, for women, being in any household wealth quintile in the upper 60% of the distribution is associated with borrowing to acquire assets, for men, being in the top 20% is not significantly different from being in the poorest quintile in terms of the likelihood of having an asset loan. The magnitude of the effect also suggests that household wealth status is more important for women than for men in their ability to acquire loans for asset accumulation.
Having expense debt may represent a trade-off with asset debt for men only, which suggests that women may be more likely to have both types of loans or to use loans more often for multiple purposes. Never having been partnered, as compared with being married, lowers the likelihood of borrowing to acquire assets for both men and women. Interestingly, being in a consensual union, as opposed to being married, lowers this likelihood only for men. Being Afro-Ecuadorian (as opposed to white or mestizo) increases the likelihood of asset debt for both men and women.21 None of the categorical variables for schooling level are statistically significant, while age is negatively associated with asset debt for men only.
V. The indebtedness of men and women
There is considerable debate in the literature about how “over-indebtedness” should be measured and when it constitutes a problem (Betti and others, 2007; Disney, Bridges and Gathergood, 2008; Schicks, 2013a). The most common measure is the debt-servicing burden of households, measured as the flow of debt service (interest plus loan repayment) as a share of a household’s monthly income. Typically, a debt-to-income ratio of 50% or more is considered problematic. However, this measure does not take into account that the optimal ratio may vary over an individual’s life cycle, per the life-cycle or permanent income hypothesis, and thus may not be a good indicator of over-indebtedness. An alternative measure is the debt-to-assets or debt-to-net-worth ratio, which measures the overall stock of household debt and assets. This measure is criticized, in turn, for not taking into account the resources that households might have at a particular moment in time to service the debt. Moreover, few household surveys in developing countries collect information on asset ownership.
Both of the above measures have also been criticized as pertaining to a risk management perspective —suitable to lenders— rather than a consumer-protection point of view. Schicks (2013a and 2013b) argues that the latter focuses on the sacrifices that households and individuals must sometimes make to repay their debts. She proposes that over-indebtedness is best measured in terms of the share of a given population that struggles to make debt repayments, makes unacceptable sacrifices to repay a debt and/or makes sacrifices that indicate structural problems, such as asset seizure as a consequence of defaulting on a loan, loan recycling or the need to sell or pawn assets to make repayments.
While our survey did not collect information regarding the significance of debt repayment in terms of the relative sacrifice entailed, it is among the first in developing countries to rigorously measure individual-level asset ownership along with debt. Our contribution is primarily to offer indicators of the debt-to-net-wealth ratio for men and women. In addition, as noted earlier, loan recycling is not an uncommon phenomenon in Ecuador, with 8.5% of households having borrowed to repay previous loans (table 5).
In aggregate, households in Ecuador do not appear to be heavily indebted, with total debt representing only 5.8% of total net worth. According to Shorrocks, Davies and Lluberas (2012), in
21 However, given the relatively small share of Afro-Ecuadorians in the sample, this association may not be valid.
123CEPAL Review N° 122 • August 2017
Carmen Diana Deere and Zachary B. Catanzarite
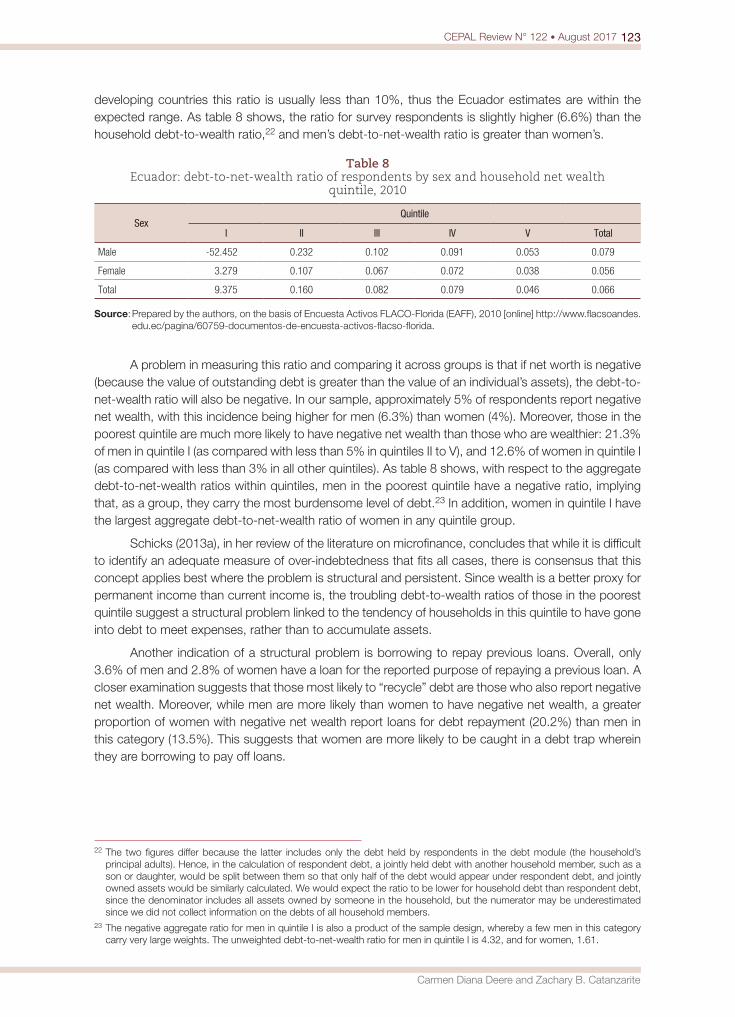
developing countries this ratio is usually less than 10%, thus the Ecuador estimates are within the expected range. As table 8 shows, the ratio for survey respondents is slightly higher (6.6%) than the household debt-to-wealth ratio,22 and men’s debt-to-net-wealth ratio is greater than women’s.
Table 8 Ecuador: debt-to-net-wealth ratio of respondents by sex and household net wealth
quintile, 2010
SexQuintile
I II III IV V Total
Male -52.452 0.232 0.102 0.091 0.053 0.079
Female 3.279 0.107 0.067 0.072 0.038 0.056
Total 9.375 0.160 0.082 0.079 0.046 0.066
Source: Prepared by the authors, on the basis of Encuesta Activos FLACO-Florida (EAFF), 2010 [online] http://www.flacsoandes.edu.ec/pagina/60759-documentos-de-encuesta-activos-flacso-florida.
A problem in measuring this ratio and comparing it across groups is that if net worth is negative (because the value of outstanding debt is greater than the value of an individual’s assets), the debt-to-net-wealth ratio will also be negative. In our sample, approximately 5% of respondents report negative net wealth, with this incidence being higher for men (6.3%) than women (4%). Moreover, those in the poorest quintile are much more likely to have negative net wealth than those who are wealthier: 21.3% of men in quintile I (as compared with less than 5% in quintiles II to V), and 12.6% of women in quintile I (as compared with less than 3% in all other quintiles). As table 8 shows, with respect to the aggregate debt-to-net-wealth ratios within quintiles, men in the poorest quintile have a negative ratio, implying that, as a group, they carry the most burdensome level of debt.23 In addition, women in quintile I have the largest aggregate debt-to-net-wealth ratio of women in any quintile group.
Schicks (2013a), in her review of the literature on microfinance, concludes that while it is difficult to identify an adequate measure of over-indebtedness that fits all cases, there is consensus that this concept applies best where the problem is structural and persistent. Since wealth is a better proxy for permanent income than current income is, the troubling debt-to-wealth ratios of those in the poorest quintile suggest a structural problem linked to the tendency of households in this quintile to have gone into debt to meet expenses, rather than to accumulate assets.
Another indication of a structural problem is borrowing to repay previous loans. Overall, only 3.6% of men and 2.8% of women have a loan for the reported purpose of repaying a previous loan. A closer examination suggests that those most likely to “recycle” debt are those who also report negative net wealth. Moreover, while men are more likely than women to have negative net wealth, a greater proportion of women with negative net wealth report loans for debt repayment (20.2%) than men in this category (13.5%). This suggests that women are more likely to be caught in a debt trap wherein they are borrowing to pay off loans.
22 The two figures differ because the latter includes only the debt held by respondents in the debt module (the household’s principal adults). Hence, in the calculation of respondent debt, a jointly held debt with another household member, such as a son or daughter, would be split between them so that only half of the debt would appear under respondent debt, and jointly owned assets would be similarly calculated. We would expect the ratio to be lower for household debt than respondent debt, since the denominator includes all assets owned by someone in the household, but the numerator may be underestimated since we did not collect information on the debts of all household members.
23 The negative aggregate ratio for men in quintile I is also a product of the sample design, whereby a few men in this category carry very large weights. The unweighted debt-to-net-wealth ratio for men in quintile I is 4.32, and for women, 1.61.

124 CEPAL Review N° 122 • August 2017
Who borrows to accumulate assets? Class, gender and indebtedness in Ecuador’s credit market
VI. Conclusions
This paper has provided empirical support for Figueroa’s (2011) proposition regarding the segmented structure of credit markets in Latin America. In the case of Ecuador, we have shown that while the formal sector is now the primary source of loans across quintiles, the poor are much more likely to rely on informal sources than the wealthy. Although we do not have primary information on the interest paid on these loans, the greater access of the wealthier quintiles to loans from private and State banks and the lower interest rates that they charge, which are capped by law, illustrates Figueroa’s proposition that asset wealth leads to privileged borrowing conditions and begets wealth.
We have taken this analysis of economic inequality a step further by considering the purposes of borrowing. We have shown that the wealthy are much more likely to borrow for purposes of asset accumulation than the poor. Those in the poorest quintile and individual women are more likely than others to borrow to meet expenses, and their asset acquisition loans are also less likely to generate an income stream in the short term. Not surprisingly, the poorest quintile ends up with the most troubling debt-to-net-wealth ratios, suggesting that their borrowing could lead to an unsustainable debt trap. Moreover, while the poorest men have the most worrisome debt-to-net-wealth ratios, the poorest women among those with negative net wealth may have the highest levels of debt distress given their more frequent practice of borrowing to repay previous loans.
Does this mean that expense loans are always ill advised? We think not since it is well recognized that access to such credit plays an important role in smoothing consumption and managing risks, particularly among those with volatile incomes. As Schicks (2013a) advises, situations of over-indebtedness require a careful analysis of causes, which might include external shocks, lender behaviour (unsuitable products and procedures) and/or borrower behaviour. If the causes are linked to lender behaviour, then the solution, as she suggests, might be “better credit”, not less.
Our regression analysis indicates that the main factor positively associated with the ability of both men and women to access loans for asset accumulation in Ecuador is having a formal savings account. The relationship between having a bank account and access to credit has often been posited in the literature (CAF, 2011). Our analysis provides evidence that this relationship is particularly important for asset accumulation, since lending for this purpose is concentrated in the formal financial sector. A policy implication of our findings is that the trend to “bank the unbanked”, which focuses on promoting savings accounts, might be more broadly successful in the long run than an approach that focuses solely on promoting loans. Moreover, to the extent that formal savings reduces the need for short-term credit, it should facilitate borrowing for the purposes of acquiring assets, as opposed to meeting expenses.
Our analysis confirms the important role of social networks in gaining access to information and credit institutions (Fletschner and Mesbah, 2011). However, in the case of Ecuador, our finding holds for men only. This is likely related to the different types of group to which men and women belong. The most common groups to which men belong are unions and sports associations, and while earning an income is not a point of distinction among men who are able to borrow to acquire assets, belonging to a union does reflect the importance of the type of employment, in this case, formal sector employment and access to the social security system. The Bank of the Ecuadorian Social Security Institute (BIESS) is an important source of State loans (see table 5), though it is only accessible to its members, who, historically, have mostly been male.24 Finally, whether or not women have their own source of income is an important factor in whether they borrow for asset accumulation. This factor alone —women’s independent income— should help reduce gender economic inequality.
24 In 2003, 40% of those enrolled in the social security system were women (ECLAC/CELADE, 2007).
125CEPAL Review N° 122 • August 2017
Carmen Diana Deere and Zachary B. Catanzarite
BibliographyBanerjee, A.V. and E. Duflo (2010), “Giving credit where it is due”, Journal of Economic Perspectives, vol. 24,
No. 3, Nashville, Tennessee, American Economic Association.Barham, B., S. Boucher and M. Carter (1996), “Credit constraints, credit unions, and small-scale producers
in Guatemala”, World Development, vol. 24, No. 5, Amsterdam, Elsevier.Bastiaensen, J. and others (2013), “After the Nicaraguan non-payment crisis: alternatives to microfinance
narcissism”, Development and Change, vol. 44, No. 4, Wiley.BCE (Central Bank of Ecuador) (2013), Evolución del volumen de credito y tasas de interes: analisis del
sistema de finanzas públicas y privado del Ecuador, Quito, 2013 [online] http://contenido.bce.fin.ec/documentos/Estadisticas/SectorMonFin/BoletinTasasInteres/ect201312.pdf.
Betti, G. and others (2007), “Consumer over-indebtedness in the EU: measurement and characteristics”, Journal of Economic Studies, vol. 34, No. 2.
CAF (Andean Development Corporation) (2011), Servicios financieros para el desarrollo: promoviendo el acceso en America Latina, Bogota.
Collins, D. (2008), “Debt and household finance: evidence from the financial diaries”, Development Southern Africa, vol. 25, No. 4, Taylor & Francis.
Da Ros, G. (2003), “El crédito rural y las cooperativas financieras en el Ecuador”, Revista de la UNIRCOOP (Red Universitaria de las Americas en Estudios Cooperativos y Asociativismo), vol. 1, No. 1.
Davies, J. (2008), “An overview of personal wealth”, Personal Wealth from a Global Perspective, J. Davies (ed.), Oxford, Oxford University Press.
De la Torre, A., A. Ize and S. Schmukler (2011), Financial Development in Latin America and the Caribbean: The Road Ahead, Washington, D.C., World Bank.
Deere, C.D. and Z.B. Catanzarite (2016), “Measuring the intra-household distribution of wealth in Ecuador: qualitative insights and quantitative outcomes”, Handbook of Research Methods and Applications in Heterodox Economics, F. Lee and B. Conin (eds.), Cheltenham, Edward Elgar.
Deere, C.D. and J. Contreras (2011), Acumulación de activos: una apuesta por la equidad, Quito, FLACSO-Ecuador [online] http://genderassetgap.org.
Disney, R., S. Bridges and J. Gathergood (2008), “Drivers of over-indebtedness. Report to the Department for Business, Enterprise and Regulatory Reform”, University of Nottingham.
Doss, C. and others (2011), The Gender Asset and Wealth Gaps: Evidence from Ecuador, Ghana and Karnataka, India, Bangalore, Indian Institute of Management [online] http://genderassetgap.org.
EAFF (Encuesta Activos FLACO-Florida) (2010) [online] http://www.flacsoandes.edu.ec/pagina/60759-documentos-de-encuesta-activos-flacso-florida.
ECLAC/CELADE (Economic Commission for Latin America and the Caribbean/Latin American and Caribbean Demographic Centre – Population Division of ECLAC) (2007), “Estudio sobre la protección social de la tercera edad en Ecuador”, Quito.
Fanelli, J.M. (2011), “Domestic financial development in Latin America”, The Oxford Handbook of Latin American Economics, J.A. Ocampo and J. Ros (eds.), Oxford, Oxford University Press.
Figueroa, A. (2011), “Income inequality and credit markets”, CEPAL Review, No. 105 (LC/G.2508-P), Santiago, Economic Commission for Latin America and the Caribbean (ECLAC).
Fletschner, D. and D. Mesbah (2011), “Gender disparity in access to information: do spouses share what they know?”, World Development, vol. 39, No. 8, Amsterdam, Elsevier.
Floro, M. and J. Messier (2006), “Tendencias y patrones de crédito entre hogares urbanos pobres en Ecuador”, La persistencia de la desigualdad: genero, trabajo y pobreza en America Latina, G. Herrera (ed.), Quito, National Women’s Council (CONAMU)/FLACSO-Ecuador.
Grown, C. and others (2015), Who Borrows? An Analysis of Gender, Debt and Assets in Ecuador, Ghana and Karnataka, India, New York, United Nations Entity for Gender Equality and the Empowerment of Women (UN-Women).
Guirkinger, C. (2008), “Understanding the coexistence of formal and informal credit markets in Piura, Peru”, World Development, vol. 36, No. 8, Amsterdam, Elsevier.
INEC (National Statistics and Census Institute) (2006), Bases de datos: Condiciones de vida [online] http://www.ecuadorencifras.gob.ec/condiciones-de-vida-ecv-bases-de-datos/.
Jácome, H. (2007), “El sistema financiero y su papel en el desarrollo económico y social”, La Tendencia. Revista de Analisis Político, No. 4, Quito.

126 CEPAL Review N° 122 • August 2017
Who borrows to accumulate assets? Class, gender and indebtedness in Ecuador’s credit market
(2005), “Alcance de las microfinanzas en las ciudades de Quito, Guayaquil y Cuenca”, Working Paper, No. 05/201, Quito, FLACSO-Ecuador.
Jácome, H. and J. Cordovéz (2004), “Microfinanzas en la economía ecuatoriana: una alternativa para el desarrollo”, Microfinanzas en la economía ecuatoriana: una alternativa para el desarrollo, H. Jácome, E. Ferraro and J. Sánchez (eds.), Quito, FLACSO-Ecuador.
Kast, F. and D. Pomeranz (2014), “Saving more to borrow less: experimental evidence from access to formal savings accounts in Chile”, NBER Working Paper, No. 20239. Cambridge, Massachusettes, National Bureau of Economic Research.
Mideros, A. (2010), Credito y desigualdad. Efecto del acceso a creditos en la brecha de ingreso de los hogares, Quito, FLACSO-Ecuador.
Peck, R. and J. Miller (2006), “Future challenges in Latin American microfinance”, An Insider View of Latin American Microfinance, M. Berger, L. Goldmark and T. Miller-Sanabria (eds.), Washington, D.C., Inter-American Development Bank.
Portes, A. and K. Hoffman (2003), “La estructura de clases en América Latina: composición y cambios durante la era neoliberal”, Desarrollo Económico, vol. 43, No. 171, Buenos Aires, Institute of Economic and Social Development.
Readout, B. (2011), “Balancing Outreach and Sustainability: The Double Bottom Line of Microfinance in Ecuador”, thesis, Gainesville, Florida, University of Florida.
RFR (Rural Finance Network) (2013), Boletín Microfinanciero Trimestral, No. 40, Quito [online] http://www.rfr.org.SBS (Superintendence of Banking and Insurances) (2013), Boletín de Series Bancos Privados [online] http://
www.sbs.gob.ec.Schicks, J. (2013a), “The definition and causes of microfinance over-indebtedness: a customer protection
point of view”, Oxford Development Studies, vol. 41, sup. 1, Taylor & Francis. (2013b), “The sacrifices of micro-borrowers in Ghana – A customer-protection perspective on measuring over-indebtedness”, Journal of Development Studies, vol. 49, No. 9, Taylor & Francis.
SEPS (Superintendencia de Economía Popular y Solidaria) (2014), Ley organica de la economía popular y solidaria y del Sistema Financiero Popular y Solidario de 28 de abril de 2011, Quito.(2013), Boletín Financiero – Sector Financiero Popular y Solidario al 30 de junio de 2013 [online] http://www.seps.gob.ec.
Shorrocks, A., J. Davies and R. Lluberas (2012), Credit Suisse Global Wealth Report 2012, Zurich, Credit Suisse Research Institute [online] https://publications.credit-suisse.com/tasks/render/file/index.cfm?fileid=88EE6EC8-83E8-EB92-9D5F39D5F5CD01F4.
Vogelgesang, U. (2003), “Microfinance in times of crisis: the effects of competition, rising indebtedness and economic crisis on repayment behavior”, World Development, vol. 31, No. 12, Amsterdam, Elsevier.