What location policy can bring to sustainable commuting: an empirical study in Brussels and...
11
What location policy can bring to sustainable commuting: an empirical study in Brussels and Flanders, Belgium Ann Verhetsel * , Thierry Vanelslander Department of Transport and Regional Economics, University of Antwerp, Prinsstraat 13, B-2018 Antwerp, Belgium article info Keywords: Mobility policy Location policy Spatial planning Commuting Census Belgium abstract Policies on spatial planning and on mobility often take it for granted that a location policy that favours situating human activities near junctions of public transport results in a frequent use of sustainable modes of transport. But in the daily practice of mobility planning we come across more and more critical statements. As the Flemish Ministry of Mobility and Public Works considers investing resources in an improved location policy, they asked for evidence on the possible results of location policy on sustainable commuting in a Flemish context, including Brussels. Quite exceptionally, we utilise the individual census data from nearly all 1, 2 million Flemish commuters. These detailed data allow a precise description of the commuter characteristics of different locations and allow the construction of a robust geographical pattern. We focus the analysis on four kinds of locations: railway stations, public transport junctions, urban areas and areas with a high economic density. An exploratory data analysis suggests that people working and/or living in these areas travel less distance, especially by car, and make more use of public transport and slow modes. A cluster analysis shows that there are spatial differences, resulting in clear geographical patterns, which suggest that policies should be spatially differentiated. As a result, we sup- port the idea of using location policy to produce more sustainable commuting. From a methodological point of view, we conclude that census data are irreplaceable to meet the requirements of spatial repre- sentativity needed to construct detailed geographical patterns of commuting. Ó 2009 Elsevier Ltd. All rights reserved. 1. Introduction In the Belgian practice of mobility management, we often hear, as we do elsewhere, that good spatial planning is needed to locate housing and economic activities in such a way that it results in more sustainable mobility. More sustainable mobility implies less travelled distance, less car use and more use of public transport. Nowadays, Belgium features quite a lot of strategic urban projects with the purpose of locating new offices, retail and housing, espe- cially around railway stations. Of course, the Belgian passenger railway company promotes this strategy, as they are the main owners of real estate and land around the stations. Through these projects, they can gain a substantial amount of money that can be invested in, for instance, costly new high-speed train infrastruc- tures. In several cases, these large projects incite some interest groups to resist these real estate projects for quick profit. But gen- erally, everyone agrees on the fact that the location of new activi- ties around the railway stations only has advantages for the successful implementation of urban mobility. In other words: there is a common belief that location policy contributes to sustainable mobility. During the last decade of the 20th century, The Nether- lands, Belgium’s neighbour, had already created an explicit loca- tion policy. The so-called A–B–C policy was an important policy measure in the 1990s, but eventually the strategy was abandoned, as it did not seem to work. This experience curbed the enthusiasm for location policy somewhat in Belgium. But a closer look at the failure in The Netherlands shows that location policy as a whole did not fail, but that the willingness of firms to participate (invest) faltered because they refused to accept the very tight planning reg- ulations near railway stations, especially the ban on building park- ing lots (Verroen et al., 2000). This paper explores the effects of location policy on the devel- opment of sustainable mobility in Flanders (Belgium). On the one hand, the Mobility Plan for Flanders (Ministerie van de Vlaamse Gemeenschap, 2001) considers location policy as a condition for sustainable transport. The reduction in the amount of trips, the reduction in travel distances as well as the improvement of the spatial structure to stimulate alternatives for road transport are in- tended effects. On the other hand, spatial planning as defined in the Spatial Plan for Flanders (Ministerie van de Vlaamse Gemeens- chap, 1997) states that a more compact land use for housing and economic activities will lead to more sustainable mobility. 0966-6923/$ - see front matter Ó 2009 Elsevier Ltd. All rights reserved. doi:10.1016/j.jtrangeo.2009.11.003 * Corresponding author. Tel.: +32 (0) 3 265 42 21; fax: +32 (0) 3 265 43 95. E-mail address: [email protected] (A. Verhetsel). Journal of Transport Geography 18 (2010) 691–701 Contents lists available at ScienceDirect Journal of Transport Geography journal homepage: www.elsevier.com/locate/jtrangeo
-
Upload
uantwerpen -
Category
Documents
-
view
2 -
download
0
Transcript of What location policy can bring to sustainable commuting: an empirical study in Brussels and...

Journal of Transport Geography 18 (2010) 691–701
Contents lists available at ScienceDirect
Journal of Transport Geography
journal homepage: www.elsevier .com/ locate / j t rangeo
What location policy can bring to sustainable commuting: an empirical studyin Brussels and Flanders, Belgium
Ann Verhetsel *, Thierry VanelslanderDepartment of Transport and Regional Economics, University of Antwerp, Prinsstraat 13, B-2018 Antwerp, Belgium
a r t i c l e i n f o
Keywords:Mobility policyLocation policySpatial planningCommutingCensusBelgium
0966-6923/$ - see front matter � 2009 Elsevier Ltd. Adoi:10.1016/j.jtrangeo.2009.11.003
* Corresponding author. Tel.: +32 (0) 3 265 42 21;E-mail address: [email protected] (A. Verhet
a b s t r a c t
Policies on spatial planning and on mobility often take it for granted that a location policy that favourssituating human activities near junctions of public transport results in a frequent use of sustainablemodes of transport. But in the daily practice of mobility planning we come across more and more criticalstatements. As the Flemish Ministry of Mobility and Public Works considers investing resources in animproved location policy, they asked for evidence on the possible results of location policy on sustainablecommuting in a Flemish context, including Brussels. Quite exceptionally, we utilise the individual censusdata from nearly all 1, 2 million Flemish commuters. These detailed data allow a precise description ofthe commuter characteristics of different locations and allow the construction of a robust geographicalpattern. We focus the analysis on four kinds of locations: railway stations, public transport junctions,urban areas and areas with a high economic density. An exploratory data analysis suggests that peopleworking and/or living in these areas travel less distance, especially by car, and make more use of publictransport and slow modes. A cluster analysis shows that there are spatial differences, resulting in cleargeographical patterns, which suggest that policies should be spatially differentiated. As a result, we sup-port the idea of using location policy to produce more sustainable commuting. From a methodologicalpoint of view, we conclude that census data are irreplaceable to meet the requirements of spatial repre-sentativity needed to construct detailed geographical patterns of commuting.
� 2009 Elsevier Ltd. All rights reserved.
1. Introduction
In the Belgian practice of mobility management, we often hear,as we do elsewhere, that good spatial planning is needed to locatehousing and economic activities in such a way that it results inmore sustainable mobility. More sustainable mobility implies lesstravelled distance, less car use and more use of public transport.Nowadays, Belgium features quite a lot of strategic urban projectswith the purpose of locating new offices, retail and housing, espe-cially around railway stations. Of course, the Belgian passengerrailway company promotes this strategy, as they are the mainowners of real estate and land around the stations. Through theseprojects, they can gain a substantial amount of money that can beinvested in, for instance, costly new high-speed train infrastruc-tures. In several cases, these large projects incite some interestgroups to resist these real estate projects for quick profit. But gen-erally, everyone agrees on the fact that the location of new activi-ties around the railway stations only has advantages for thesuccessful implementation of urban mobility. In other words: there
ll rights reserved.
fax: +32 (0) 3 265 43 95.sel).
is a common belief that location policy contributes to sustainablemobility. During the last decade of the 20th century, The Nether-lands, Belgium’s neighbour, had already created an explicit loca-tion policy. The so-called A–B–C policy was an important policymeasure in the 1990s, but eventually the strategy was abandoned,as it did not seem to work. This experience curbed the enthusiasmfor location policy somewhat in Belgium. But a closer look at thefailure in The Netherlands shows that location policy as a wholedid not fail, but that the willingness of firms to participate (invest)faltered because they refused to accept the very tight planning reg-ulations near railway stations, especially the ban on building park-ing lots (Verroen et al., 2000).
This paper explores the effects of location policy on the devel-opment of sustainable mobility in Flanders (Belgium). On the onehand, the Mobility Plan for Flanders (Ministerie van de VlaamseGemeenschap, 2001) considers location policy as a condition forsustainable transport. The reduction in the amount of trips, thereduction in travel distances as well as the improvement of thespatial structure to stimulate alternatives for road transport are in-tended effects. On the other hand, spatial planning as defined inthe Spatial Plan for Flanders (Ministerie van de Vlaamse Gemeens-chap, 1997) states that a more compact land use for housing andeconomic activities will lead to more sustainable mobility.
692 A. Verhetsel, T. Vanelslander / Journal of Transport Geography 18 (2010) 691–701
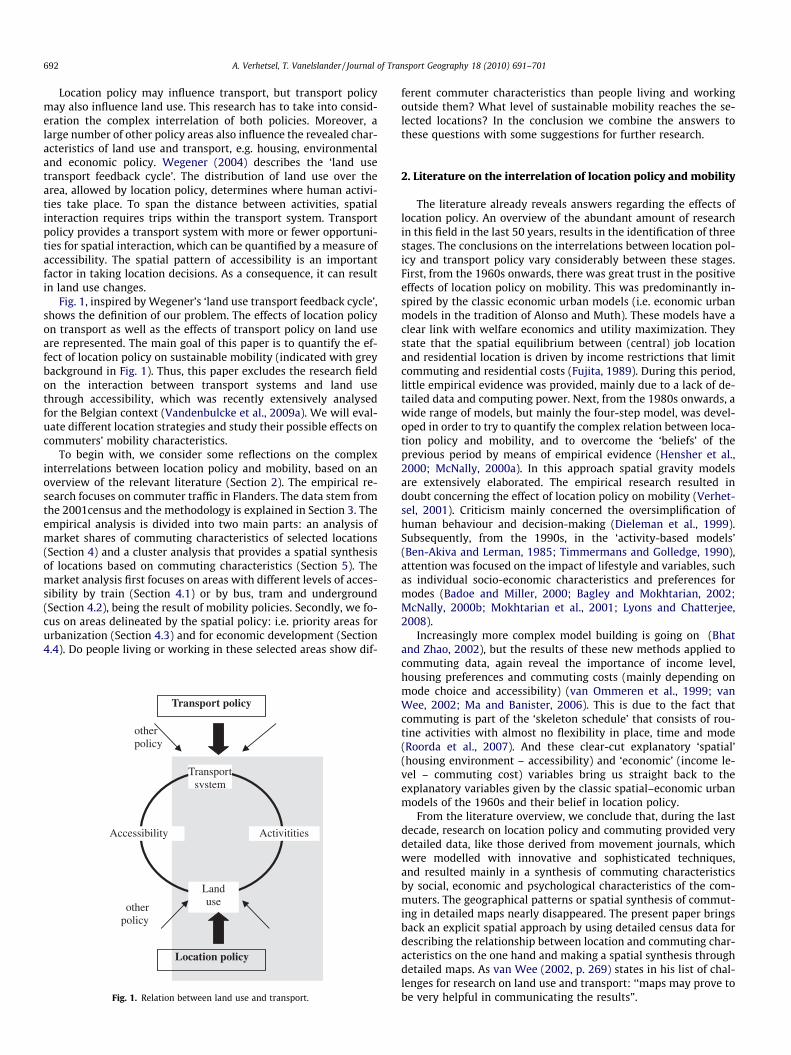
Location policy may influence transport, but transport policymay also influence land use. This research has to take into consid-eration the complex interrelation of both policies. Moreover, alarge number of other policy areas also influence the revealed char-acteristics of land use and transport, e.g. housing, environmentaland economic policy. Wegener (2004) describes the ‘land usetransport feedback cycle’. The distribution of land use over thearea, allowed by location policy, determines where human activi-ties take place. To span the distance between activities, spatialinteraction requires trips within the transport system. Transportpolicy provides a transport system with more or fewer opportuni-ties for spatial interaction, which can be quantified by a measure ofaccessibility. The spatial pattern of accessibility is an importantfactor in taking location decisions. As a consequence, it can resultin land use changes.
Fig. 1, inspired by Wegener’s ‘land use transport feedback cycle’,shows the definition of our problem. The effects of location policyon transport as well as the effects of transport policy on land useare represented. The main goal of this paper is to quantify the ef-fect of location policy on sustainable mobility (indicated with greybackground in Fig. 1). Thus, this paper excludes the research fieldon the interaction between transport systems and land usethrough accessibility, which was recently extensively analysedfor the Belgian context (Vandenbulcke et al., 2009a). We will eval-uate different location strategies and study their possible effects oncommuters’ mobility characteristics.
To begin with, we consider some reflections on the complexinterrelations between location policy and mobility, based on anoverview of the relevant literature (Section 2). The empirical re-search focuses on commuter traffic in Flanders. The data stem fromthe 2001census and the methodology is explained in Section 3. Theempirical analysis is divided into two main parts: an analysis ofmarket shares of commuting characteristics of selected locations(Section 4) and a cluster analysis that provides a spatial synthesisof locations based on commuting characteristics (Section 5). Themarket analysis first focuses on areas with different levels of acces-sibility by train (Section 4.1) or by bus, tram and underground(Section 4.2), being the result of mobility policies. Secondly, we fo-cus on areas delineated by the spatial policy: i.e. priority areas forurbanization (Section 4.3) and for economic development (Section4.4). Do people living or working in these selected areas show dif-
Accessibility Activitities
Land use
Transportsystem
Transport policy
Location policy
other policy
other policy
Fig. 1. Relation between land use and transport.
ferent commuter characteristics than people living and workingoutside them? What level of sustainable mobility reaches the se-lected locations? In the conclusion we combine the answers tothese questions with some suggestions for further research.
2. Literature on the interrelation of location policy and mobility
The literature already reveals answers regarding the effects oflocation policy. An overview of the abundant amount of researchin this field in the last 50 years, results in the identification of threestages. The conclusions on the interrelations between location pol-icy and transport policy vary considerably between these stages.First, from the 1960s onwards, there was great trust in the positiveeffects of location policy on mobility. This was predominantly in-spired by the classic economic urban models (i.e. economic urbanmodels in the tradition of Alonso and Muth). These models have aclear link with welfare economics and utility maximization. Theystate that the spatial equilibrium between (central) job locationand residential location is driven by income restrictions that limitcommuting and residential costs (Fujita, 1989). During this period,little empirical evidence was provided, mainly due to a lack of de-tailed data and computing power. Next, from the 1980s onwards, awide range of models, but mainly the four-step model, was devel-oped in order to try to quantify the complex relation between loca-tion policy and mobility, and to overcome the ‘beliefs’ of theprevious period by means of empirical evidence (Hensher et al.,2000; McNally, 2000a). In this approach spatial gravity modelsare extensively elaborated. The empirical research resulted indoubt concerning the effect of location policy on mobility (Verhet-sel, 2001). Criticism mainly concerned the oversimplification ofhuman behaviour and decision-making (Dieleman et al., 1999).Subsequently, from the 1990s, in the ‘activity-based models’(Ben-Akiva and Lerman, 1985; Timmermans and Golledge, 1990),attention was focused on the impact of lifestyle and variables, suchas individual socio-economic characteristics and preferences formodes (Badoe and Miller, 2000; Bagley and Mokhtarian, 2002;McNally, 2000b; Mokhtarian et al., 2001; Lyons and Chatterjee,2008).
Increasingly more complex model building is going on (Bhatand Zhao, 2002), but the results of these new methods applied tocommuting data, again reveal the importance of income level,housing preferences and commuting costs (mainly depending onmode choice and accessibility) (van Ommeren et al., 1999; vanWee, 2002; Ma and Banister, 2006). This is due to the fact thatcommuting is part of the ‘skeleton schedule’ that consists of rou-tine activities with almost no flexibility in place, time and mode(Roorda et al., 2007). And these clear-cut explanatory ‘spatial’(housing environment – accessibility) and ‘economic’ (income le-vel – commuting cost) variables bring us straight back to theexplanatory variables given by the classic spatial–economic urbanmodels of the 1960s and their belief in location policy.
From the literature overview, we conclude that, during the lastdecade, research on location policy and commuting provided verydetailed data, like those derived from movement journals, whichwere modelled with innovative and sophisticated techniques,and resulted mainly in a synthesis of commuting characteristicsby social, economic and psychological characteristics of the com-muters. The geographical patterns or spatial synthesis of commut-ing in detailed maps nearly disappeared. The present paper bringsback an explicit spatial approach by using detailed census data fordescribing the relationship between location and commuting char-acteristics on the one hand and making a spatial synthesis throughdetailed maps. As van Wee (2002, p. 269) states in his list of chal-lenges for research on land use and transport: ‘‘maps may prove tobe very helpful in communicating the results”.

A. Verhetsel, T. Vanelslander / Journal of Transport Geography 18 (2010) 691–701 693
3. How to measure the impact of location policy: method anddata
The central question is whether location policy can have an im-pact on transportation characteristics of commuters. Ideally, onewould compare the commuting characteristics in one neighbour-hood at two different moments in time: before and after the imple-mentation of the location policy. But as there are up until now noexplicit large-scale applications of location policy in Flanders, theimpact of location policy is analysed with the following construc-tion: the characteristics of commuters of neighbourhoods withspecific location characteristics (e.g. railway station areas) arecompared with the commuting characteristics of neighbourhoodsthat lack these location qualities. The Spatial Plan of Flanders de-fines different methods of location policy. First, the optimisationof the transport infrastructure is put forward, whereby transport-generating activities should be located near public transport junc-tions. This method is evaluated in the empirical analysis by deter-mining the results of commuting behaviour of locations nearrailway stations (Section 4.1) and bus, tram or underground stops(Section 4.2). A second method entails the promotion of urban re-gions for housing and the selection of special gateways for eco-nomic activities, which, consequently, protects the countrysidefrom further urbanization. Therefore, in Section 4.3, the neighbour-hoods assigned by the Spatial Plan of Flanders as ‘urban develop-ment areas’ are compared to areas outside this delineation, whilein Section 4.4 regions with different levels of economic densityare compared.
The data used in this contribution result from the processing ofthe 2001 census. The individual census data from nearly all 1.2 mil-lion Flemish commuters are available. All working people are in-cluded, also people living and working in the same localauthority. As we use a wide definition of commuting, all home-to-work trips are included. In our analysis, we aggregate these datato the level of neighbourhoods, which are the statistical sectorsdelineated by the Belgian Institute for Statistics and generally usedfor detailed geographical analysis. Flanders is the Dutch-speaking,northern part of Belgium. As a considerable amount of Flemishcommuters travel by train to their workplace in the central Brus-sels region, this region is included in the analysis of railway stationlocations near the workplace. The study includes for Flanders 9182statistical sectors of Flanders covering 13522 km2, thus having amean surface area of 1.47 km2. For the Brussels region the numbersare respectively 724, 161 km2 and 0.22 km2.
The information the census provides related to commuting en-tails: the neighbourhood of the workplace and the place of depar-ture, the distance and frequency of the movements, the means oftransportation generally used for commuting, the times of depar-ture and arrival for the outward journey and the return journey.This list is complemented with the number of cars that the house-hold has at its disposal. Finally, data on the median income level ofthe Flemish residential neighbourhoods are added in the spatialsynthesis as a controlling variable.
The following variables are constructed by the neighbourhood:transport variables (main commuting mode: car, bike, on foot,train, bus, tram or underground, the relative share of householdswith more than two cars in the neighbourhood, the average com-muting distance and average travel time) and location variables(share of commuters working in the CBD, share of commutersworking and residing in the same statistical sector (‘in = ss’), acces-sibility by public transport, urbanization level and level of eco-nomic density).
This detailed and complete database allows the calculation ofmarket shares of different transportation modes. Absolute num-bers of nearly the entire population are available, which provides
the unique advantage of not being dependent on estimations pro-duced by econometrics. When counting market shares, two differ-ent spatial approaches are always included. On the one hand, theresults calculated by the location characteristics of the place ofdeparture (mostly domicile) are presented, as well as, on the otherhand, those of the workplace. The market shares of different modesand commuter characteristics by location typologies are presentedin frequency tables in Section 4. A cluster analysis, presented inSection 5, provides a spatial synthesis of commuting in Flanders.Maps indicate the spatial inequalities in terms of commutercharacteristics.
4. Market analysis: what are the commuter characteristics ofselected locations?
Frequency tables are presented for various location types ofpublic transport, urbanization and economic density. For each ofthese location types, all the neighbourhoods of Flanders are as-signed to the subdivisions in Sections 4.1–4.4, detailed informationis provided on the definition of the different levels within the loca-tion types and the allocation of the neighbourhoods to these levels.
The market analysis focuses, firstly, on areas with different lev-els of accessibility by train (Section 4.1) or by bus, tram and under-ground (Section 4.2), being the result of mobility policies. Secondly,the focus is on areas delineated by the spatial policy: priority areasfor urbanization (Section 4.3) and for economic development (Sec-tion 4.4).
4.1. Railway station areas and their commuting characteristics
Levinson (2008) finds strong historical evidence on the co-development of land use and rail in London. In this paragraph,we analyse for Flanders and Brussels the use of rail, and more gen-eral the market share of different transport modes, for commutingin the vicinity of railway stations, not by comparing different situ-ations in time but in space. Every neighbourhood with more thanhalf of its surface within a distance of 3 km to a train station is de-fined as a railway station area. Four different railway station areaswere described according to the number of train stops per day.First, the neighbourhoods near a railway station with more than300 train stops on a weekday were grouped together. These rail-way stations are found mainly in the central metropolitan areasof Brussels, Antwerp and Ghent. The three main stations in Brus-sels even have more than 1000 train stops a day. On the second le-vel are the neighbourhoods around railway stations with less than300 but more than 150 train stops a day. The areas close to a rail-way station with less than 150 but more than 75 daily train stopsconstitute the third level. The fourth level consists of neighbour-hoods around railway stations with no more than 75 train stopsa day. Areas with no railway station within 3 km are the lowest le-vel. We are aware of the fact that this is a rather simple way ofmaking accessibility towards rail services operational. Further re-search could invest in methods as expressed by Ghebreegziabiheret al. (2006), but these are quite time-consuming due to the exten-sive data gathering. It seemed preferable to invest in testing fourdifferent location types, rather than limiting ourselves to railwaystation locations.
The last column in Table 1, which represents the amount ofcommuters belonging to a (certain) location type, shows that mostcommuters (40%) live in neighbourhoods classified as ‘nonrailwaystation areas’ constituting, consequently, a market share for railtravel of only 3%, while car use goes up to 79%. Also the use of otherpublic transport and slow modes is very low, whereas the need tohave two cars is high. The market share for rail travel doubles to 6%in areas with a small increase in rail services (less than 75 train

Table 1Commuting characteristics per type of railway station area.
Location type Car(%)
P2 cars(%)
Slowmodes(%)
Train(%)
Bus-tram-underground(%)
Job inCBD(%)
Residence and jobsameneighbourhood (%)
Averagedistance(km)
Averagetime(min)
Commuters(%)
Place of residence (in Flanders) 73 45 13 6.2 3.9 40 3.6 17 27 100Station areaTrain stops per day P300 55 26 22 10.9 9.0 69 3.1 16 29 9150 6 train stops < 300 65 37 16 12.4 2.8 40 3.4 17 28 775 6 train stops < 150 70 41 14 7.8 5.0 43 3.2 16 28 16Train stops per day <75 73 46 13 6.6 2.8 35 3.9 17 27 27No station area 79 52 11 3.1 3.2 34 3.8 18 27 40
Workplace (in Flanders andBrussels)
70 43 12 7.6 6.3 40 3.2 18 29 100
Station areaTrain stops per day P300 55 38 10 19.5 13.6 77 1.4 23 39 29150 6 train stops < 300 73 45 11 7.0 5.6 38 2.2 19 30 1275 6 train stops < 150 77 44 12 3.6 4.5 24 2.8 18 29 17Train stops per day <75 77 45 16 1.5 2.2 22 4.4 14 22 19No station area 79 46 13 0.6 2.0 21 5.1 16 23 23
694 A. Verhetsel, T. Vanelslander / Journal of Transport Geography 18 (2010) 691–701
stops a day). This small increase in rail services decreases the shareof car use to 73%. At the other end, 22% of the commuters still haverail services ranging from good to very good in their neighbour-hood, which results in trains being used by 8–10% of the commut-ers. In the areas with very good rail services, other means of publictransport are also frequently used together with slow modes; thisdecreases the market share of car use to 53% (average for Flanders:71%).
When we consider the workplace, a different picture arises. Inthis case, only the area with a very high train supply attracts traincommuting (20% market share). As soon as the supply lowers tomaximum 300 train stops per day, the train is not used more thanon average. In Flanders and Brussels, 29% of the commuters workin a neighbourhood with a railway station that has a very good ser-vice level (more than 300 train stops a day). These commuters tra-vel relatively long distances (40 min on average) to their job,almost always located in the CBD (77%); here, car use falls backto 55% together with car ownership.
We can conclude that people living nearby a railway station,and especially commuters who have a job nearby the main railwaystations, have more sustainable commuting characteristics. Obvi-ously, high-quality site and employment conditions (e.g. high pub-lic transport accessibility) have a natural advantage in reducingvehicle trips (Hwang and Giuliano, 1990; Hanssen, 1995; Thorpeet al., 2000; Hess, 2006). Areas around railway stations often shareseveral characteristics: for instance, the employer is located in anarea of high employment density, employee parking is restricted,public transport service is frequent and widespread, and a signifi-cant number of employees commute relatively long distances.Those conditions offer employees more alternatives to drivingalone and make it easier to use those alternatives.
4.2. Bus-tram-underground areas and their commuting characteristics
Railway stations will always imply huge investments, not onlyfinancially even more important is the large consumption of landthat is needed for the location of new railway stations, especiallyin densely populated and urbanized regions like Flanders. As partof a mobility policy, new bus, tram and underground infrastruc-tures are easier to build. The supply of bus, tram and undergroundstops is more spread out than that of rail stops, more neighbour-hoods have these public transportation stops nearby and thesestops are seldom points of high job density. We distinguish fourdifferent levels of waiting time for a bus, tram or undergroundon a Tuesday morning between 6 and 9 am: wait less than
15 min, wait between 15 and 30 min, wait between 30 and60 min, wait more than 1 h. Some neighbourhoods have no bus,tram or underground stop at all. The waiting time was calculatedby selecting all stops with a standstill for bus, tram or metro duringthe morning peak (6–9 am). Next, all standstills during that periodwhere counted and divided by three in order to know the amountof standstills per hour. Thereupon, a mean waiting time was de-duced. If a neighbourhood has more than one stop, the value ofthe stop with the shortest waiting time was assigned to theneighbourhood.
The longer the waiting time for a bus, tram or underground atthe place of residence, the higher the car use. The only substantialamount of public transport users can be found in neighbourhoodswith a waiting time of maximum 15 min. One-third of the Flemishcommuters live in a neighbourhood with a waiting time of lessthan 15 min for a bus, tram or metro between 6 and 9 am on anygiven Tuesday. More than half of them have a job in a CBD. Theyuse this kind of public transport twice as much as on average inFlanders. Together with a high market share for slow modes, thiscauses a relatively low share of car use, and the need for two carsis significantly lower in these areas. When the waiting time for abus, tram or underground near one’s home is more than 15 min,we see no additional positive effects on sustainable commutingbehaviour: car use is relatively high. As far as the workplace is con-cerned, again we see that commuters working close to publictransport stops with the highest frequencies of services (less than15 min waiting time) use the bus, tram or underground twice asmuch as on average. It can be concluded that only with a very goodand nearby supply of buses, trams or underground trains do com-muters use public transport (see Table 2).
4.3. Urbanization and commuting characteristics
As part of the implementation of the Spatial Plan for Flanders,urban areas were selected and delineated. The plan states thatnew urban functions must be located within the borders of theseurban areas as much as possible. The aim to reach a higher levelof sustainable mobility is one of the most important reasons forthis policy. This is entirely in line with the findings of Naess(2005), whose study shows that residential location affects behav-iour, also when taking into consideration socio-economic and atti-tudinal differences among inhabitants. Due to the location of theresidence in relation to concentrations of facilities, living in a densearea close to downtown Copenhagen contributes to less travel, alower share of car driving and more trips by bike or on foot. In

Table 2Commuting characteristics per type of bus-tram-underground area.
Location type Car(%)
P2cars(%)
Slowmodes(%)
Train(%)
Bus-tram-underground(%)
Job inCBD (%)
Residence and job sameneighbourhood (%)
Averagedistance (km)
Averagetime (min)
Commuters(%)
Place of residence (inFlanders)
73 45 13 6.2 3.9 40 3.6 17 27 100
Bus-tram-underground areaWait <15 min 66 36 17 6.3 7.1 55 4.3 16 27 3115 min 6wait < 30 min 74 47 13 6.0 2.9 35 4.1 18 27 2630 min 6wait < 60 min 76 50 12 6.0 2.1 32 3.4 18 27 18Wait P60 min 77 51 11 6.1 1.5 28 2.9 18 27 11No bus-tram-
underground-stop76 51 11 6.6 2.8 34 1.9 18 28 13
Workplace (inFlanders)
75 45 14 3.2 3.8 39 3.6 16 25 100
Bus-tram-underground areaWait <15 min 72 45 15 4.7 5.9 61 3.0 16 27 4915 min 6wait < 30 min 77 45 15 1.9 1.9 22 5.1 15 23 2130 min 6wait < 60 min 78 45 13 1.1 1.4 19 4.4 16 23 14Wait P60 min 78 44 14 1.3 1.1 8 4.1 14 22 7No bus-tram-
underground-stop79 45 12 2.2 1.9 17 2.2 17 25 9
A. Verhetsel, T. Vanelslander / Journal of Transport Geography 18 (2010) 691–701 695
the present research we check this conclusion for commuting fromdifferent levels of urban hierarchy in Flanders. A hierarchy of urbanareas is introduced: at the top we find the metropolitan areas ofAntwerp and Ghent, followed respectively by the regional urbanareas and the small urban areas, the Flemish urban Border aroundBrussels is a separate group. Outside these areas urbanization isbeing discouraged (see Table 3).
Most Flemish commuters live outside the delineated urbanareas (57%). The least sustainable commuting behaviour is foundamong this large group of commuters which, evidently, determinesthe average. When it comes to commuting, the metropolitan areasare the most sustainable. Bus, tram and/or metro are used fairlyfrequently, but there is also a relatively good use of slow modesto the workplace. Going to work by bike or on foot are popularmeans of transport in regional and small urban areas. The rela-
Table 3Commuting characteristics per type of planned urban areas.
Location type Car(%)
P2cars(%)
Slowmodes(%)
Train(%)
Bus-tram-underground (%)
Job iCBD
Place of residence(in Flanders)
73 45 13 6.2 3.9 40
Planned urban areasMetropolitan
Antwerp65 32 15 3.4 12.3 68
Metropolitan Gent 61 32 18 9.0 8.6 74Regional urban
areas64 36 21 7.6 3.0 55
Small urban areas 67 37 19 8.6 2.0 23Flemish Border
Brussels76 43 6 3.6 12.1 26
Other areas 78 52 10 5.7 2.3 31
Workplace (inFlanders)
75 45 14 3.2 3.8 39
Planned urban areasMetropolitan
Antwerp68 40 12 5.9 11.2 77
Metropolitan Gent 68 43 14 6.9 7.4 93Regional urban
areas73 45 16 4.0 3.2 73
Small urban areas 77 46 17 2.0 1.5 0Flemish Border
Brussels86 48 4 4.5 3.6 0
Other areas 78 46 14 0.9 1.4 12
tively short distances and reduced levels of traffic, thus resultingin a safer environment, almost certainly play a role in this (Van-denbulcke et al., 2009b). In all types of urban areas the ownershipand use of a car for commuting purposes is relatively low. Com-muters travelling from the Flemish Border around Brussels usethe bus, tram or underground quite frequently, since the distanceto work is relatively short (13 km compared to 17 km on averagefor Flanders).
Thirty four percentage of the commuters work outside thedelineated urban areas. Their commuting behaviour determinesthe average. The most sustainable commuting routes lead to themetropolitan areas of Antwerp and Ghent. The least sustainablecommuting route, characterized by a relatively greater car use aswell as a longer travel distance and longer travel times, is to theFlemish-speaking municipalities surrounding Brussels.
n(%)
Residence and job sameneighbourhood (%)
Averagedistance (km)
Averagetime (min)
Commuters(%)
3.6 17 27 100
2.3 13 28 9
3.6 18 28 53.5 16 25 15
4.9 17 26 112.3 13 29 3
3.7 19 28 57
3.6 16 25 100
1.7 18 32 14
2.6 17 28 72.4 15 24 24
3.9 13 20 151.4 26 38 5
5.7 15 22 34

696 A. Verhetsel, T. Vanelslander / Journal of Transport Geography 18 (2010) 691–701
This division into different urbanization groups is very useful.Depending on the type of urbanization area that we are dealingwith, we can observe a noticeably different kind of commutingbehaviour. What is particularly remarkable is the exceptionalattraction that the Flemish Border around Brussels seems to exude.Commuters working in this region often have to travel a long dis-tance and are apparently willing to spend a significant amount oftime in their car to do so. Further research is needed to determinewhether these are highly skilled professionals who have special-ized jobs in the peripheral office districts, and whether part of theirincome comprises a company car, which is then, naturally, used toits full advantage.
4.4. Economic density and commuting characteristics
In Flanders, for decades we had a spread of economic activitiesdue to spatial–economic politics aimed at giving everybody a job inhis/herown region/commune. The recent Spatial Plan of Flandersseeks to concentrate jobs in zones and corridors with accessibilityprofiles that attribute to sustainable mobility. In this paragraph wefocus on areas that have already a higher density of jobs, where wecheck if commuter characteristics are different. We expect a moresustainable profile of commuters in employment-rich regions, asreported by several case studies (van Wee and van der Hoorn,1996; Schwanen et al., 2004; Shuttleworth and Lloyd, 2005). Forthe sake of spatial–economic policy, Flanders is divided into fourareas with a different economic density. These areas are delimitedwith parameters concerning employment, value-added and turn-over (Cabus and Vanhaverbeke, 2004). Economic core area 1 hasthe strongest economic density: it contains more than half of Flan-ders’ economic activity. Economic core area 2 is three times lessimportant. Areas of more than local importance host 10% of theeconomy, whereas the other areas are for the main part rural, sub-urban and coastal municipalities. These economic density areas aredefined on the scale of municipalities, not on the more detailed le-vel of neighbourhoods. This results in a somewhat less precisedelineation that includes some neighbourhoods that do not coverthe mentioned characteristics of economic density (see Table 4).
Only commuters residing in economic core area 1 (42% of theFlemish commuters) show a little more sustainable travel behav-iour: less car use and ownership, more commuting by bus, tramand underground and slow modes, and the distance to their placeof work is relatively shorter. Commuters living in an area of lowereconomic density (22%) travel a longer distance to their workplace,and they commute far more by car and less by slow modes as wellas by bus, tram or underground.
Table 4Commuting characteristics per type of economic density area.
Location type Car(%)
P2 cars(%)
Slow modes(%)
Train(%)
Bus-tramundergrou
Place of residence (inFlanders)
73 45 13 6.2 3.9
Economic densityEconomic core area 1 68 38 16 6.3 6.0Economic core area 2 74 47 14 6.1 2.6More than local area 77 51 11 5.3 2.3Lower economic density 77 52 10 6.8 2.2
Workplace (in Flanders) 75 45 14 3.2 3.8Economic densityEconomic core area 1 74 44 13 4.4 5.2Economic core area 2 76 45 16 1.5 1.7More than local area 78 47 16 0.9 1.3Lower economic density 75 46 18 0.9 1.2
Commuters working in economic core area 1 (nearly two-thirdsof the Flemish commuters) use public transport more often. Thetravel time for these commuters is longer: they are recruited froma wider area, as this dense economic area attracts more workersand offers specialized employment. Areas with lower density at-tract more workers living in the same neighbourhood or on shorterdistances.
5. Spatial patterns of location and commuting characteristics inflanders
In order to get a spatial synthesis, the Flemish and Brusselsneighbourhoods are grouped through a cluster analysis using thecommuting characteristics. The median income of the place of res-idence is also included as a controlling variable. We clustered the9906 neighbourhoods using Ward’s ascending hierarchical method(Ward, 1963). The results help us to understand the geography ofcommuter characteristics and suggest clues for a location policy.Fig. 2 represents the average of the commuting characteristics ofneighbourhoods in Flanders and Brussels, for the place of residenceand the workplace respectively. In the next sections, the deviationof commuting characteristics will be set out against these averagesfor each cluster.
5.1. Cluster analysis per place of residence
A first cluster analysis deals with the commuters having Flan-ders or Brussels as their place of residence. Seven different clustersof neighbourhoods are distinguished. Fig. A1 represents the calcu-lated Z-scores for each commuting variable in the differentclusters.
Cluster 1 shows commuters who use a bus, tram or under-ground more than average. Their distance to work is short andthe median income is rather low. Commuters in cluster 2 have ahigh income, and therefore possess more cars and commute moreby car. 14% of the commuters belong to cluster 3, they use moreslow modes and go to work in the Central Business District. Cluster4 also contains slow mode commuters, but their travel time is veryshort and they do not work in the CBD as much as the averagecommuter. Commuters from cluster 5 are more than average trainusers who travel a long distance and have a long travel time towork. Cluster 6 displays a rather average commuting behaviourwith slightly more car use. Cluster 7 contains neighbourhoods withrelatively many commuters who go to work in local labour marketsby bike or on foot.
-nd (%)
Job inCBD(%)
Residence andjob sameneighbourhood(%)
Averagedistance(km)
Averagetime(min)
Commuters(%)
40 3.6 17 27 100
51 3.1 16 27 4233 4.0 17 26 2031 4.0 18 27 1631 4.1 20 29 22
39 3.6 16 25 100
61 2.2 17 28 628 4.7 14 21 170 5.9 13 20 100 8.5 13 19 10

Residence Flanders and Brussels
0
10
20
30
40
50
60
70
80
car (%) ≥ 2 cars (%) slow modes(%)
train (%) bus tramsubway (%)
work inCBD (%)
in = ss (%) aver.distance
(km)
aver. time(min)
median-income
(1,000 EUR)
Workplace Flanders and Brussels
0
10
20
30
40
50
60
70
80
car (%) ≥ 2 cars (%) slow modes(%)
train (%) bus tramsubway (%)
in = ss (%) aver. distance(km)
aver. time (min)
Fig. 2. Average (in %) of the commuting characteristics of neighbourhoods in Flanders and Brussels (place of residence and workplace).
mk520
very much bus-tram-subway; less car(-possession); short distance
car-commuting; high income
with slow modes to work in CBD
much slow modes; short travel time
Cartography: UA - Department of Transport and Regional EconomicsSource: NIS SEE 2001
long distance commuting by train
less than 30 commuters
average commuting behaviour; little more car-commuting
with slow modes to work in own neighbourhood
Fig. 3. Map of clusters based on characteristics of commuters residing in Flanders or Brussels.
A. Verhetsel, T. Vanelslander / Journal of Transport Geography 18 (2010) 691–701 697
The distinguished clusters are mapped out in Fig. 3. Cluster 1 ismerely found in and around Brussels. The supply of public trans-port is very good and these commuters have only a short distanceto travel to work. Around the big cities, and particularly aroundBrussels, there are many neighbourhoods with a relatively largenumber of car commuters who have a high income (cluster 2).Commuters in the centres of the Flemish cities (cluster 3) use moreslow modes. Living in the close vicinity of their work in rather low-income neighbourhoods may play a role. Other slow mode com-muters who do not work in the CBD, but have a rather short dis-tance to travel to work can be found scattered in rural areas(cluster 4). Cluster 5 are the areas with relatively many train com-muters, you can find them west and southwest of Brussels, andalong railroad lines at a distance of 20–40 km from Flemish cities.Cluster 6 dominates the map and represents statistical sectors witha lot of car commuters. The last cluster is found in peripheral areaswith many commuters working in their own neighbourhood (clus-ter 7), they commute with slow modes more than on average.
5.2. Cluster analysis per workplace
This second cluster analysis groups the neighbourhoods of Flan-ders and Brussels together with the commuting characteristics that
were calculated on the basis of the data of people having theirwork address in the quarter. For the workplace only eight variableswere considered. The variables ‘work in CBD’ and ‘median incomeof the neighbourhood’ were removed, as they are not useful for thisanalysis. Again seven clusters arise Fig. A2.
Cluster 1 makes up 10% of the commuters who work in Flandersor Brussels. They are characterized by a more than average use oftrain and bus, tram or underground over a long distance and witha relatively long travel time. The car is used far less than on aver-age. Cluster 2 also shows sustainable commuting behaviour, butwith more bus, tram and underground users than train users. Theirdistance and travel time to work are relatively long as well. Com-muters to neighbourhoods in cluster 3 also have a long travel dis-tance to work, but they use their car more than on average. Cluster4 shows an average commuting behaviour with a slightly highercar use. 35% of the commuters are found in cluster 5, they too dis-play average commuting behaviour, but they work in their ownneighbourhood to a lesser extent than the average commuter. Clus-ter 6 is characterized by the use of slow modes and covers a shortdistance. Cluster 7 contains commuters working in their ownneighbourhood who commute by bike or on foot.
Fig. 4 maps out the seven clusters. Cluster 1 depicting trainusers as well as bus, tram and underground users is found in the

mk520
very much train; bus-tram-subway; very long distance and time
much bus-tram-subway; train; long time and distance
much car-commuting; long distance
average commuting behaviour; little more car-commuting
Cartography: UA - Department of Transport and Regional EconomicsSource: NIS SEE 2001
average commuting behaviour; little less work in own neighbourhood
slow modes
much slow modes; work in own neighbourhood
less than 30 commuters
Fig. 4. Map of clusters based on characteristics of commuters with a workplace in Flanders or Brussels.
698 A. Verhetsel, T. Vanelslander / Journal of Transport Geography 18 (2010) 691–701
centre of Brussels and also in the centre of Mechelen. Cluster 2areas with a lot of bus, tram and underground commuting can befound around the centre of Brussels and in the centre of certainFlemish cities. Long distance commuting by car (cluster 3) goesto the periphery of big cities such as Antwerp and Brussels. Carcommuting at short distance (cluster 4) is more widely spread, atlonger distances from the cities. Cluster 5 represents average com-muting behaviour and covers mainly the Flemish suburban areas.Commuters travelling to their job by slow modes can be found inrural regions (cluster 6), while neighbourhoods with workers usingmore pronounced slow modes are found in traditional villages inrural regions (cluster 7).
6. Conclusions and suggestions for further research
Due to the extensively available census data, which allowedconstructing variables by neighbourhood out of data on individu-als, we get a geographically complete image of commuting in Flan-ders and Brussels. Since no complex methodologies were needed toovercome data problems, we have managed to obtain very clear re-sults. Needless to say, it is extremely regrettable that this was thevery last chance to carry out such a task in Belgium, as no new cen-sus will be held in the future. This paper tried to take full advan-tage of this last opportunity.
The empirical study evaluates mobility strategies that were putforward in the Spatial Plan for Flanders and location strategies ofthe Flemish Mobility Plan. The main purpose of these plans is tooptimise the traffic and transport infrastructure by situating traf-fic-generating activities around public transport hubs as much aspossible. In the empirical section, we verified whether these loca-tions effectively attract or generate sustainable commuting behav-iour. This enabled us to conclude that a location near a railwaystation leads to more sustainable commuting and that the proxim-ity of bus, tram or metro stops also attracts more users of thosemodes of transportation. However, we have to confirm that thecar is still the most important mode of transport by far. This is eventhe case when the offer of public transport is exceptionally good.Subsequently, the hypothesis that increasing the density of urbanareas potentially leads to more sustainable commuting was tested.The data analysis took the proposed planning delineation of urban
areas as its starting point. From this we were able to deduce that,compared to the average commuting behaviour of the Flemish,inhabitants of the urban areas display relatively more sustainablecommuting behaviour. However, these results should not lead totoo much optimism, in both the inner cities and the metropolitanareas commuting by car is still the most popular mode of transportby far. Finally, the Spatial Plan for Flanders also intends to continuegrouping the economic activities in highly accessible zones. Thisgoal was assessed for commuting sustainability by dividing Flan-ders into areas with a different economic density. It emerged thatthe commuting differences between these areas are limited.
We conclude that future spatial planning strategies that supportthe location of activities in urban areas and near stations and junc-tions of public transport, will have positive effects on commutercharacteristics, in the sense that inhabitants or workers will movetowards more sustainable characteristics. But we have to put thisconclusion into perspective. To sum up, our exploratory data anal-ysis tells us that, as far as commuting is concerned, the car is stillthe undisputed ruler as the preferred mode of transport: a littleover 70% of commutes occur by car. On the one hand, car use goesup to 80% when commuters do not live in the vicinity of a railwaystation, live outside an economic core area or outside an urbanarea. This persistent use of the car is also true of those who donot work near a railway station or those who work in a locationwhere they have to wait more than 15 min for a bus, tram or me-tro. On the other hand, for commuters who live or work close towell connected railway stations car use drops to 55% and slow traf-fic (by bike, on foot) constitutes the second most important modewith a market share of 15–20%. The use of trains for commutingpurposes totals 6% on average. In areas that include a railway sta-tion with more than 150 stops, this rises to 10%. For those whowork near railway stations in Brussels, this number even increasesto 20%. The use of bus, tram and metro in urban areas with a veryshort waiting time (<15 min) has a market share of 8%, which dropsto 1–3% in most other areas.
As a result, we have to conclude that only an extremely strictlocation policy that is focused on concentrating housing and work-ing activities in or near urban areas, together with a very extensivepublic transport offer, can reduce the market share of cars with re-gard to commuting by 10–15% at the most. This percentage is

A. Verhetsel, T. Vanelslander / Journal of Transport Geography 18 (2010) 691–701 699
rather low, and what is more, it can only be reached in a limitednumber of locations, in combination with considerable invest-ments in the offer of public transport. The geographical analysisthrough maps shows that the opportunities for location policyare restricted to the urban areas.
In the light of these results, a number of opportunities for fur-ther research show up. From a methodological point of view, itwould be very interesting to compare over time the commutercharacteristics of neighbourhoods before and after the implemen-tation of the spatial and mobility measures. Unfortunately, spatialrepresentative data will be lacking due to the abolition of the cen-sus by the Belgian government. Currently we lobby for the organi-sation of a ‘short form’ census providing data that cannot bededucted from administrative data bases (together with commutercharacteristics these are mainly housing data). The results of thepresent research can also help in more operational research. Oneproposal has to do with the provision of public transport infra-structures. The spatial analysis put forward in this paper can in-
Cluster 1 (12%)very muchbus-tram-subway; less car(-possession); short distance
-2
-1
0
1
2
3
car slowmodes
bus tramsubway
in = ss aver.time
Cluster 3 (14%)with slow modes to work in CBD
-2
-1
0
1
2
3
car slowmodes
bus tramsubway
in = ss aver.time
Cluster 5 (13%)long distance commuting by train
-2
-1
0
1
2
3
car slowmodes
bus tramsubway
in = ss aver.time
Cluster 7 (9%)with slow modes to work in own neighbourhood
-2
-1
0
1
2
3
car slowmodes
bus tramsubway
in = ss aver.time
Fig. A1. Z-scores for commuting characteristics of neighbourhoods by cluster (Flanders oto the cluster).
spire the search, on a more detailed level, for additional locationsthat could benefit from new infrastructures, such as the latesttramways or improvements in the service levels of public transpor-tation, for example the upgrading of railway stations. The questionthen is if investments in accessibility of selected locations wouldbe enough in order to change commuting behaviour around theselocations in a more sustainable way. Another application is foundin the field of geomarketing, which includes the detailed searchfor neighbourhoods with a high accessibility where the marketshare of sustainable commuting is actually too low. Is it possibleto organise some (marketing) actions in these neighbourhoods inorder to convince commuters to change their habits into more sus-tainable mobility characteristics?
Appendix A
See Figs. A1 and A2.
Cluster 2 (9%)car-commuting; high income
-2
-1
0
1
2
3
car slowmodes
bus tramsubway
in = ss aver.time
Cluster 4 (8%)slow modes; short travel time
-2
-1
0
1
2
3
car slowmodes
bus tramsubway
in = ss aver.time
Cluster 6 (34%)average commuting behaviour; little more car-commuting
-2
-1
0
1
2
3
car slowmodes
bus tramsubway
in = ss aver.time
r Brussels as place of residence, percentages give the share of commuters belonging

Cluster 1 (10%)very much train, bus-tram-subway; very long distance and time
-3
-2
-1
0
1
2
3
4
5
2
Cluster 2 (18%)much bus-tram-subway; train; long time and distance
-3
-2
-1
0
1
2
3
4
5
Cluster 3 (16%)much car-commuting; long distance
-3
-2
-1
0
1
2
3
4
5
car ≥ 2 cars slowmodes
train bus tramsubway
in = ss aver.distance
aver. time
Cluster 4 (12%)average commuter behaviour; little more car-commuting
-3
-2
-1
0
1
2
3
4
5
Cluster 5 (35%)average commuting behaviour; little less work in own neighbourhood
-3
-2
-1
0
1
2
3
4
5
car ≥ 2 cars slowmodes
train bus tramsubway
in = ss aver.distance
aver. time car ≥ 2 cars slowmodes
train bus tramsubway
in = ss aver.distance
aver. time
car ≥ 2 cars slowmodes
train bus tramsubway
in = ss aver.distance
aver. time
car ≥ 2 cars slowmodes
train bus tramsubway
in = ss aver.distance
aver. timecar ≥ 2 cars slowmodes
train bus tramsubway
in = ss aver.distance
aver. time
car ≥ 2 cars slowmodes
train bus tramsubway
in = ss aver.distance
aver. time
Cluster 6 (8%)slow modes
-3
-2
-1
0
1
2
3
4
5
≥
Cluster 7 (1%)much slow modes; work in own neighbourhood
-3
-2
-1
0
1
2
3
4
5
Fig. A2. Z-scores for commuting characteristics of neighbourhoods by cluster (Flanders or Brussels as workplace, percentages give the share of commuters belonging to thecluster).
700 A. Verhetsel, T. Vanelslander / Journal of Transport Geography 18 (2010) 691–701
References
Badoe, D., Miller, E., 2000. Transportation–land use interaction: empirical findingsin North America, and their implications for modelling. Transportation ResearchPart D 5, 235–263.
Bagley, M., Mokhtarian, P., 2002. The impact of residential neighbourhood type ontravel behaviour: a structural equations modelling approach. Annals of RegionalScience 36, 279–297.
Ben-Akiva, M., Lerman, S., 1985. Discrete Choice Analysis: Theory and Application toTravel Demand. MIT Press, Cambridge (Mass), London.
Bhat, C., Zhao, H., 2002. The spatial analysis of activity stop generation.Transportation Research Part B 36, 557–575.
Cabus, P., Vanhaverbeke, W., 2004. Strategisch Plan Ruimtelijke Economie.Academia Press, Gent.
Dieleman, F., Dijst, M., Spit, T., 1999. Planning the compact city: the RandstadHolland experience. European Planning Studies 7 (5), 605–621.
Fujita, M., 1989. Urban Economic Theory. Cambridge University Press.Ghebreegziabiher, D., Pels, E., Rietveld, P., 2006. The Impact of Rail Transport on Real
Estate Prices: An Empirical Analysis of the Dutch Housing Markets. TinbergenInstitute Discussion Paper, TI 2006-031/3.
Hanssen, J., 1995. Transportation impacts of office relocation. Journal of TransportGeography 3, 247–256.
Hensher, D., Button, K., Haynes, K., Stopher, P., 2000. Handbook of TransportGeography and Spatial Systems. Pergamom, Amsterdam.
Hess, P., 2006. Changes in employee travel and activity associated with officerelocations from urban to suburban settings. Annual Meeting of the Associationof American Geographers, Chicago.
Hwang, K., Giuliano, G. 1990. The Determinants of Ridesharing: Literature Review.Working Paper, UCTC No. 38.
Levinson, D., 2008. Density and dispersion: the co-development of land use and railin London. Journal of Economic Geography 8, 55–77.
Lyons, G., Chatterjee, K., 2008. A Human perspective on the daily commute: costs,benefits and trade-offs. Transport Reviews 28 (2), 181–198.
Ma, K., Banister, D., 2006. Excess commuting: a critical review. Transport reviews 26(6), 749–767.
McNally, M., 2000a. The four-step model. In: Hensher, D., Button, K., Haynes, K.,Stopher, P. (Eds.), Handbook of Transport Geography and Spatial Systems.Pergamom, Amsterdam, pp. 35–53.
McNally, M., 2000b. The activity-based approach. In: Hensher, D., Button, K. (Eds.),Handbook of Transport Modelling. Pergamom, Amsterdam, pp. 53–69.
Ministerie van de Vlaamse Gemeenschap, 1997. Ruimtelijk StructuurplanVlaandereren, Brussel.
Ministerie van de Vlaamse Gemeenschap, 2001. Naar een Duurzame Mobiliteit inVlaanderen, Ontwerp Mobiliteisplan Vlaanderen, Brussel.
Mokhtarian, P., Salomon, I., Redmond, L., 2001. Understanding the demand fortravel: it’s not purely ‘derived’. Innovation 14, 355–380.
Naess, P., 2005. Residential location affects travel behaviour – but how and why?The case of Copenhagen metropolitan area. Progress in Planning 63, 167–257.

A. Verhetsel, T. Vanelslander / Journal of Transport Geography 18 (2010) 691–701 701
Roorda, M., Saneinejad, S., Miller, E., 2007. Analysis of routine weekly activity/travelpatterns. Paper Submitted to the 11th World Conference on Transport Research,June 24–29, San Francisco.
Schwanen, T., Dieleman, F., Dijst, M., 2004. The impact of metropolitan structure oncommute behavior in The Netherlands: a multilevel approach. Growth andChange 35 (3), 304–333.
Shuttleworth, I., Lloyd, D., 2005. Analysing average travel-to-work distances inNorthern Ireland using 1991 census of population: the effects of locality, socialcomposition, and religion. Regional Studies 39 (7), 909–921.
Timmermans, H., Golledge, R., 1990. Applications of behavioural research on spatialproblems II: preference and choice. Progress in Human Geography 14 (3), 311–354.
Thorpe, N., Hills, P., Jaensirisak, S., 2000. Public attitudes to TDM measures: acomparative study. Transport Policy 7, 243–257.
Vandenbulcke, G., Steenberghen, T., Thomas, I., 2009a. Mapping accessibility inBelgium: a tool for land-use and transport planning? Journal of TransportGeography 17, 39–53.
Vandenbulcke, G., Thomas, I., de Geus, B., Degraeuwe, B., Torfs, R., Meeusen, R., IntPanis, L., 2009b. Mapping bicycle use and the risk of accidents for commuterswho cycle to work in Belgium. Transport Policy 16, 77–87.
Van Ommeren, J., Rieteld, P., Nijkamp, P., 1999. Job moving, residential moving, andcommuting: a search perspective. Journal of Urban Economics 46, 230–253.
van Wee, B., van der Hoorn, T., 1996. Employment location as an instrument oftransport policy in The Netherlands. Fundamentals, instruments andeffectiveness. Transport Policy 3 (3), 81–89.
van Wee, B., 2002. Land use and transport: research and policy changes. Journal ofTransport Geography 10, 259–271.
Verhetsel, A., 2001. The impact of planning and infrastructure measures on rushhour congestion in Antwerp, Belgium. Journal of Transport Geography 9 (2),111–123.
Verroen, E., Martens, M. and Lange, M., 2000. Research Agenda on ‘Integration ofTransport and Land Use Planning’: The Transland Project. TBO-Report 2000-05,Delft, Department of Transport.
Ward, J., 1963. Hierarchical grouping to optimize an objective function. Journal ofAmerican Statistical Association 58 (301), 236–244.
Wegener, M., 2004. Overview of land use transport models. In: Hensher, D., Button,K., Haynes, K., Stopher, P. (Eds.), Handbook of Transport Geography and SpatialSystems. Pergamom, Amsterdam, pp. 129–267.