What is the test's accuracy in my practice population? Tailored ...
38
University of Birmingham What is the test's accuracy in my practice population? Tailored meta-analysis provides a plausible estimate Willis, B H; Hyde, CJ DOI: 10.1016/j.jclinepi.2014.10.002 License: Other (please specify with Rights Statement) Document Version Peer reviewed version Citation for published version (Harvard): Willis, BH & Hyde, CJ 2015, 'What is the test's accuracy in my practice population? Tailored meta-analysis provides a plausible estimate', Journal of Clinical Epidemiology, vol. 68, no. 8, pp. 847–854. https://doi.org/10.1016/j.jclinepi.2014.10.002 Link to publication on Research at Birmingham portal Publisher Rights Statement: NOTICE: this is the author’s version of a work that was accepted for publication in Journal of Clinical Epidemiology. Changes resulting from the publishing process, such as peer review, editing, corrections, structural formatting, and other quality control mechanisms may not be reflected in this document. Changes may have been made to this work since it was submitted for publication. A definitive version was subsequently published in Journal of Clinical Epidemiology, Vol 68, Issue 8, 847-54. DOI: http://dx.doi.org/10.1016/j.jclinepi.2014.10.002 General rights Unless a licence is specified above, all rights (including copyright and moral rights) in this document are retained by the authors and/or the copyright holders. The express permission of the copyright holder must be obtained for any use of this material other than for purposes permitted by law. • Users may freely distribute the URL that is used to identify this publication. • Users may download and/or print one copy of the publication from the University of Birmingham research portal for the purpose of private study or non-commercial research. • User may use extracts from the document in line with the concept of ‘fair dealing’ under the Copyright, Designs and Patents Act 1988 (?) • Users may not further distribute the material nor use it for the purposes of commercial gain. Where a licence is displayed above, please note the terms and conditions of the licence govern your use of this document. When citing, please reference the published version. Take down policy While the University of Birmingham exercises care and attention in making items available there are rare occasions when an item has been uploaded in error or has been deemed to be commercially or otherwise sensitive. If you believe that this is the case for this document, please contact [email protected] providing details and we will remove access to the work immediately and investigate. Download date: 26. Mar. 2022
-
Upload
khangminh22 -
Category
Documents
-
view
1 -
download
0
Transcript of What is the test's accuracy in my practice population? Tailored ...

University of Birmingham
What is the test's accuracy in my practicepopulation? Tailored meta-analysis provides aplausible estimateWillis, B H; Hyde, CJ
DOI:10.1016/j.jclinepi.2014.10.002
License:Other (please specify with Rights Statement)
Document VersionPeer reviewed version
Citation for published version (Harvard):Willis, BH & Hyde, CJ 2015, 'What is the test's accuracy in my practice population? Tailored meta-analysisprovides a plausible estimate', Journal of Clinical Epidemiology, vol. 68, no. 8, pp. 847–854.https://doi.org/10.1016/j.jclinepi.2014.10.002
Link to publication on Research at Birmingham portal
Publisher Rights Statement:NOTICE: this is the author’s version of a work that was accepted for publication in Journal of Clinical Epidemiology. Changes resulting fromthe publishing process, such as peer review, editing, corrections, structural formatting, and other quality control mechanisms may not bereflected in this document. Changes may have been made to this work since it was submitted for publication. A definitive version wassubsequently published in Journal of Clinical Epidemiology, Vol 68, Issue 8, 847-54.DOI: http://dx.doi.org/10.1016/j.jclinepi.2014.10.002
General rightsUnless a licence is specified above, all rights (including copyright and moral rights) in this document are retained by the authors and/or thecopyright holders. The express permission of the copyright holder must be obtained for any use of this material other than for purposespermitted by law.
•Users may freely distribute the URL that is used to identify this publication.•Users may download and/or print one copy of the publication from the University of Birmingham research portal for the purpose of privatestudy or non-commercial research.•User may use extracts from the document in line with the concept of ‘fair dealing’ under the Copyright, Designs and Patents Act 1988 (?)•Users may not further distribute the material nor use it for the purposes of commercial gain.
Where a licence is displayed above, please note the terms and conditions of the licence govern your use of this document.
When citing, please reference the published version.
Take down policyWhile the University of Birmingham exercises care and attention in making items available there are rare occasions when an item has beenuploaded in error or has been deemed to be commercially or otherwise sensitive.
If you believe that this is the case for this document, please contact [email protected] providing details and we will remove access tothe work immediately and investigate.
Download date: 26. Mar. 2022
1
What is the test’s accuracy in my practice population?
Tailored meta-analysis provides a plausible estimate
Brian H Willis1, Christopher J Hyde
2.
1. School of Health and Population Sciences, University of Birmingham, UK
2. Institute of Health Research, University of Exeter Medical School, University of Exeter,
UK.
Key words: Data interpretation, statistical; Decision making; Diagnosis tests, routine; Mass
screening; Meta-analysis; Models, statistical
Running title: Tailored meta-analysis
*Manuscript (with PAGE numbers)

2
Abstract
Objective
Diagnostic test accuracy studies and meta-analyses may, in some cases, provide estimates
which are highly improbable in practice; tailored meta-analysis provides a potential solution.
To investigate the utility of tailored meta-analysis in synthesising estimates of a test’s
accuracy compared with conventional meta-analysis for three case examples.
Study design and setting
MEDLINE, EMBASE, AND CINAHL were searched for relevant studies and routine data
were collected on the test positive rate and disease prevalence from the case settings to define
an applicable region for each setting. Three cases were evaluated: Mammography in the NHS
Breast Screening Program; PHQ-9 questionnaire to screen for depression in general practice;
Centor’s criteria used to diagnose group A beta-haemolytic streptococcus in general practice.
For conventional meta-analysis, studies were selected using standard systematic review
methods; for tailored meta-analysis this selection was refined to those with results compatible
with the applicable region for the setting.
Results
In each example, studies were excluded as a result of incorporating an applicable region for
the setting. Comparing tailored with conventional meta-analysis, the positive likelihood ratios
(with 95% confidence intervals in brackets) were 36.5 (23.0-57.9) and 19.8 (12.8-30.9)
respectively for mammography; and 4.89 (2.02-11.8) and 2.35 (1.51-3.67) respectively for
Centor’s criteria. This had the effect of increasing the positive predictive value from 17 to
27% for mammography and 23% to 38% for Centor’s criteria.
Conclusion
Tailored meta-analysis has the potential to provide a plausible estimate for a test’s accuracy
which is specific to the practice setting. When compared with conventional meta-analysis, the
difference may, in some cases, be sufficient to lead to different decisions on patient
management.
3
What is new?
This paper illustrates a novel method that provides a basis for evidence-based diagnosis in
practice.
Key findings
The study demonstrates that routine data from real-life general practice and screening
programmes may be combined with test evaluation research to assist in making decisions on
the applicability of test research
What was known?
Meta-analysis may be used to synthesise summary estimates for a test’s sensitivity and
specificity when there are multiple studies. However, these summary estimates may be
unrepresentative of the test accuracy in practice, and may be virtually impossible to achieve
in some cases.
What this study adds
Tailored meta-analysis may be used to synthesise estimates for a test’s accuracy that are
customised to practice. Compared with estimates derived from conventional meta-analysis
these may lead to different decisions on patient management. This method generalises to
different tests and different settings including routine tests used in general practice.
What is the implication
The increased use of electronic patient records provides an opportunity to collect routine data
on tests used in practice. If these are combined with test evaluation research there is the
potential to improve diagnostic decision-making at an individual practice level.

4
Introduction
One of the main concerns in diagnostic test research is the evaluation of a test’s accuracy. In
relevant studies the objective is to determine how ‘accurate’ the test is at discriminating those
patients with a target disorder from those who do not.
Although, primary diagnostic test accuracy (DTA) studies do provide estimates of a test’s
accuracy, these in general may vary between studies; being governed by factors relating to
the conduct of the study, test execution and patient spectrum [1]. Some of the variation may
be mitigated by standardizing the study conduct, but this is more difficult to achieve for the
other factors. Hence a single study reports on the average performance for the test for
circumstances particular to the study’s setting. This clearly has implications for meta-analysis
and explains why heterogeneity is frequently observed [2].
In therapeutics, meta-analysis as a technique has been largely successful at ‘ironing out’ the
effects of differences between individual studies to make assertions about the underlying
effect [3]. In diagnostics such an approach may be taken to estimate the average performance
of the test across all the studies [4,5]. However, for the specific question of ‘what is the
performance of the test in my practice population’, it is not clear whether knowing the
average accuracy across a number of studies is that useful, particularly when there is
widespread heterogeneity. If a test’s performance in a particular practice is better represented
by one of the outlier studies, the estimate derived from meta-analysis is likely to be
significantly different from that experienced – indeed, in some cases the estimate may be
virtually impossible in the practice setting of interest [6].
It is this observation that motivated the development of a novel method which uses
information from the target setting in order to select the studies most likely to be informative
in practice [6]. Although the method has been developed and described in detail elsewhere its
utility has yet to be fully investigated [6]. Here we will evaluate its utility in three case
examples. In the first example, like the previous study [6], we will illustrate its use by
applying it to a UK national screening programme. However, in the next two examples we
will demonstrate for the first time how the method may help individual clinicians directly by
applying it to a single general practice setting.

5
Method
The aim is to provide a plausible estimate for the accuracy of a test within a specific setting
without conducting a further primary study. Broadly, the approach relies upon using routine
data from the target setting in order to define an ‘applicable region’ where the test’s
performance is likely to lie [6]. This is used to ‘tailor’ the selection of included studies in a
systematic review by excluding those that report test performances which are incompatible
with this region [6].
The principal statistic for defining the applicable region is the test positive rate, r, which is
obtained from counting the number of test positives in the setting at a particular threshold as a
proportion of all those tested. Such data are collected routinely in the NHS screening
programmes and it is increasingly possible to do the same in UK general practice through the
electronics record systems. Having an estimate for r allows us to constrain the region in ROC
space (after Receiver Operating Characteristic curve) where the sensitivity, s, and false
positive rate, f, for the test must lie. The size of the applicable region is dependent on both
the size of r and its standard error. Thus, large sample sizes provide more precise, narrower
applicable regions.
The region may be refined further by including estimates of the prevalence, p, which if
known without error will constrain the sensitivity and false positive rate to a straight line.
When the error in the estimate is incorporated the applicable region is narrowed usually to a
trapezium-shaped area [6]. Thus, the applicable region for the setting represents the set of
feasible values for the sensitivity and false positive rate given the estimates for the test
positive rate and prevalence for the setting. This should be contrasted with the prediction
region of conventional meta-analysis which is the model prediction on where a new study’s
estimate would lie based only on data from the included studies [7]. The applicable region is
in effect a prediction region, but more specific; it is for a particular setting based on data from
the actual setting of interest. When there is no such data, the best prediction for the setting of
interest would be provided by the prediction region otherwise it is provided by the applicable
region. The corollary of this is where the prediction region lies outside of the applicable
region this is an improbable estimate for the test in the setting.

6
Systematic review methods are used to provide an initial selection of studies for conventional
meta-analysis. Each study’s compatibility with the setting is then determined by the
magnitude of the tail probability of the study’s estimate for a potential study parameter lying
in the applicable region. From all candidate parameters within the applicable region the
maximum likelihood estimate is chosen when calculating probabilities - the level of
significance is set to 0.025 for selecting studies. Consistent with previous analyses the
sensitivity and false positive rate are assumed to have independent binomial distributions
[5,6]. A summary of the process is given in appendix 1, and is detailed elsewhere [6].
Data collection
Three diagnostic/screening tests were analysed using data collected from practice. In the first
case, data were obtained from the NHS Breast screening programme (available in the public
domain) and the applicable region was defined using r only. For the next two cases both r and
p were used to define the applicable region for the test after collecting data from a single
general practice in the UK.
To obtain estimates on the accuracy of each of the tests analysed, the literature was searched
for relevant meta-analyses. These provided the primary studies which were assessed for
applicability in the target setting. Where appropriate, meta-analyses were either updated or
synthesised de novo.
Statistical methods used to aggregate studies
The bivariate random effects model was used to derive summary estimates for the sensitivity
and specificity (1 – false positive rate) [5] from which other relevant statistics were
calculated. Confidence and predictions regions, as determined by methods previously
described [8, 9] were also included in the figures. When the prediction region is much larger
than the associated confidence region this suggests heterogeneity between studies [10]. The
results of ‘tailored’ meta-analysis, where only applicable studies were aggregated were
compared with ‘conventional’ meta-analysis where all the studies were aggregated. Unless
otherwise stated, any estimate is followed by a 95% confidence interval (CI) in brackets.

7
Results
1. Breast Screening with mammography
In the UK, there has been a national breast screening programme since 1988 [11]. It
originally screened women between the ages 50-64 years with single view mammography,
but since 2005 it has screened women between 50-70 years old with two-view mammography
(mediolateral oblique and craniocaudal) triennially [11].
Following screening, patients are recalled for further investigation if, for technical reasons,
the mammogram is an inadequate view or has features indicative of a potential abnormality
[11]. Investigation involves further views, clinical or ultrasound examination or biopsy.
Although several reviews have evaluated the efficacy of breast screening in terms of its effect
on mortality [12-16] only one meta-analysis aimed to estimate the sensitivity and specificity
of the mammogram as a screening test for breast cancer [17]. In that review they used the
following definitions: a positive test result was when a patient was referred for further work-
up on the basis of the mammogram result; a false positive as those patients referred for
further investigation and diagnosed negative by biopsy; and a false negative as a cancer
detected in the interval between screens.
The original meta-analysis published in 1998, included six studies in their analysis [17].
However, the studies reported on the first round (prevalent) screening performance and none
reported on the programme screening performance which is mixture of prevalent and
subsequent (or incident) screens. In addition, as there have been several large-scale studies
since this review, the analysis was updated (see appendix 2). Ten studies were included.
In 2012, the NHS Breast Screening programme screened 1,722,677 women between the ages
50-70 with a mammogram; 67,415 were referred for further assessment [18] – this equates to
a test positive rate, r = 3.91% [99% CI: 3.88-3.95]. Imposing this on the results of the meta-
analysis leads to six of the ten included studies being outside the range of performance
possible in the UK Breast Screening programme (figure 1). Only one study was conducted in
the UK and it reported test performances which were compatible with the applicable region
and was included.

8
For the conventional meta-analysis the sensitivity and specificity were 87.2% [95% CI: 81.1-
91.5] and 95.6% [95% CI: 93.0-97.3]. This compared to the tailored meta-analysis where the
sensitivity and specificity were 78.0% [95% CI: 70.0-84.4] and 97.9% [95% CI: 96.4-98.7].
Although tailoring the study selection brings about a modest increase in specificity, the effect
on the positive likelihood is more striking: 19.8 [95% CI: 12.8-30.9] compared with 36.5
[95% CI: 23.0-57.9].
The NHS Breast screening programme reports 8.1 cases of breast cancer per 1000 women
screened. This is likely to be an underestimate of the prevalence due to the presence of false
negatives [18]. If we assume the background prevalence of breast cancer to be 1%, the effect
of nearly doubling the positive likelihood ratio is to increase estimates of the post-test
probability from 17% to 27%. Thus, when either the sensitivity or specificity is estimated to
be close to 1, modest differences between estimates may have significant effects on the
predictive values.
2. Screening for depression using the PHQ-9 in general practice
In general practice in the UK, the patient health questionnaire (PHQ-9) is most commonly
used to monitor depression [19,20]. However, it was originally developed as a screening tool
[21] and it is its accuracy as a screening tool that is of interest here. It consists of 9 questions
with each question scored between 0 and 3, giving a maximum of 27 points. The usual
threshold for a positive test result is 10 and all subsequent analyses will be at this threshold
[21].
The accuracy of the PHQ-9 as a screening tool for depression was evaluated in a meta-
analysis published in 2012 [22]. Studies were included if the target disorder was a major
depressive disorder as defined by a standardised diagnostic interview schedule based on the
Diagnostic and Statistical manual of mental disorders (DSM) or the International
Classification of Diseases (ICD).
However, to estimate its performance in general practice and to capture the latest studies, a
more specific meta-analysis was synthesised, where, in addition to the inclusion criteria
above, we considered only those studies that had evaluated the tool in a family or general
practice setting (see appendix 3).
9
There were ten included studies which reported the performance characteristics for the PHQ-
9 questionnaire at a test threshold of 10. Two studies evaluated an English version of the
PHQ-9 questionnaire and only one study was located in the UK. There were also six different
versions of the reference standard used between the studies which may have implications for
the definition of the target disorder.
To gain an insight on the performance of the PHQ-9 as a screening tool for depression in a
particular general practice, audit data were collected on adult patients attending a general
practice surgery of one of the authors (BHW) which has a patient population of circa 6500.
In particular, those attending were asked to complete a PHQ-9 questionnaire, irrespective of
their presenting complaint. Over a 6 week period, a total of 124 patients completed the
questionnaire. Twenty-eight patients scored 10 or more, giving a test positive rate r = 22.6%
[99% CI: 14.4-33.5]. Thus for the applicable region, r was taken to vary between 14.4 and
33.5.
To estimate the background prevalence of depression, a UK household survey of mental
health carried out in 2007 was consulted [23]. These surveys are used to monitor the mental
health of 16-74 year olds in the community. The methods involve interviewing subjects on
average for 90 minutes, using the clinical interview schedule (CIS-R) to ascertain any mental
health symptoms. These are then combined using a computer algorithm to give an ICD-10
diagnosis. The survey reported a prevalence of depression of 2.8%, with 849 individuals
taking part in the overall survey [23]. Based on this, a range of 1-10% was taken as the
estimated prevalence range prior to testing.
To summarise, the intervals 0.144 ≤ r ≤ 0.335 and 0.01 ≤ p ≤ 0.1 were used to derive the
applicable region for the PHQ-9 tool in this general practice. Studies were then selected for
tailored meta-analysis based on the individual study estimate being compatible (not
improbable) with this region (see figure 2).
Although the one UK-based study [24] was applicable to this general practice, the most
striking feature is that three of the studies reported performances which were incompatible
with this practice despite all being conducted in primary care settings. This adds weight to the
argument that studies which are performed in settings that are prima facie similar to the
practice setting may still be uninformative.

10
The effects on the performance characteristics were as follows: for conventional meta-
analysis the sensitivity and specificity were 74.2% [95% CI: 63.1-82.9] and 91.5% [95% CI:
86.4.-94.8]; for tailored meta-analysis the sensitivity and specificity were 79.7 [95% CI: 71.5-
86.1] and 87.9 [95% CI: 83.1-91.5].
In fact, the changes in all of the statistics were fairly modest and as a result would be unlikely
to have any significant effect on clinical decision making.
3. Using Centor’s criteria in the diagnosis of sore throats in general practice.
Centor’s criteria is a clinical prediction rule used to diagnose group A beta haemolytic
streptococcus (GABHS) infection in those patients presenting with a sore throat [25]. It
consists of eliciting four clinical features from those patients presenting with a sore throat.
The test result is usually considered positive when three or more features are found to be
present [25].
Over the course of a 4-month period, 83 patients presented with a sore throat to the general
practice of one of the authors (BHW) with a patient population of circa 6500. Each patient
was tested using Centor’s criteria and the responses recorded. There were 7 [8.4%; 99% CI:
3.4-19.6%] patients who scored 3 or more on Centor’s criteria. Thus, when imposing the
constraints, r was taken to have a range of 0.34-0.196.
To estimate the prevalence of GABHS in those attending with a sore throat, the first 45
patients had their throats swabbed. The prevalence was found to be 11.1% [99% CI: 3.7%-
28.4%] and so p was considered to have the range of values 0.037-0.284 for the linear
constraints.
To estimate the accuracy of Centor’s criteria in general practice we reviewed the literature for
studies which had evaluated the prediction rule in a primary care or general practice setting.
The target disorder was GABHS and a throat swab was considered to be a suitable reference
standard (see appendix 4 for details). In addition, the references from a previous meta-
analysis were located [26].

11
Twelve studies were included for analysis; none was in a UK setting. Although a sore throat
was the predominant presenting symptom amongst patients selected, there was variation in
the patient selection criteria between studies. Furthermore the age ranges of patients selected
varied and blinding between the reference standard and test was not always reported.
The results of applying constraints to the meta-analysis and defining an applicable region are
given in figure 3. Five studies reported performances which were feasible in the practice
setting analysed here. It is also worth reiterating that the seven excluded studies were all in
primary care settings, supporting the hypothesis that superficial equivalence of setting does
not necessarily lead to applicability.
The corresponding sensitivity and specificity for the tailored meta-analysis were 38.4% [95%
CI: 30.3-47.2] and 92.1% [95% CI: 83.4-96.5] respectively. In contrast the sensitivity and
specificity estimated from the conventional meta-analysis were 50.3% [95% CI: 42.7-58.4]
and 78.5% [95% CI: 65.7-87.5].
The effects of using the different estimates of the likelihood ratios on the predictive values
are considered in table 1. For a mean prevalence of GABHS of 11.1%, the more than
doubling of the positive likelihood ratio may potentially lead to an increase in the PPV from
23% to 38%. This could influence clinical decisions, such as whether to investigate further
with other tests or to institute treatment without further testing.
The performance statistics for all three tests are summarised in table 1.
Discussion
The central issue raised by the foregoing analysis is whether it is safe to apply the results of a
DTA study or meta-analysis to clinical practice without more specific knowledge of the test
in the intended setting than has hitherto been considered.
One of the blights of meta-analysis in general is heterogeneity and it affects around 70% of
meta-analyses of diagnostic test accuracy studies [2]. Indeed in each of the three cases

12
analysed here, the prediction regions were larger than the confidence regions for both tailored
and conventional meta-analysis suggesting heterogeneity (figures 1-3). However, it should be
noted that the size of the prediction region is also influenced by the number of studies and
where there are few studies, such as in tailored meta-analysis, this significantly increases the
region’s size irrespective of the tightness of clustering of the constituent studies.
When there is heterogeneity, methodologists usually advocate hunting for the sources of
variation by extending the base model with the relevant covariates [27]. In principle such a
deterministic approach allows for biases to be studied and for homogeneous sub-groups to be
defined. However, in practice, reviewers are often faced with insufficient data of adequate
quality to initiate or at least be comprehensive with such analyses, as illustrated by the three
examples evaluated here. As discussed earlier there are likely to be multiple factors
contributing to the estimates reported by studies and meta-regression models may allow for
the effects of study design factors such as blinding to be investigated. However, it is more
difficult to incorporate in these models other important factors such as differences in patient
spectrum, test execution and position of threshold.
This has meant that clinicians and policy-makers have been left with a largely subjective
decision on whether the results of a meta-analysis on a test’s accuracy are even plausible for
their practice or not. Methods of appraisal of both primary studies individually and as part of
a larger systematic review go some way to deciding when a study may be applicable. The
limitations and problems arising from transferring results between different settings have also
been described [1]. However, what seems to have been overlooked is the possibility of using
more specific information on the clinical setting to help decide which studies are applicable
particularly when the sources of heterogeneity between studies may be largely unknown.
Specifically, estimates of the prevalence and the use of unverified test positive data from the
practice setting can help determine which studies should be excluded from providing
information on the test accuracy. Thus, the included studies report performances which lie
within the range of possible performances for the test in that setting which is not always the
case with conventional meta-analysis. The corollary of this is that without a tailored approach
to study selection, conventional meta-analysis may provide summary estimates which are
virtually impossible for the test in some settings – this was demonstrated when applying the
results of a meta-analysis of the Pap test to the NHS Cervical screening programme [6]. As a

13
result, tailored meta-analysis provides a summary estimate that is at least plausible for the test
in the setting.
Of course plausibility does not necessarily equate to accuracy and without a separate primary
study in the setting in question it is difficult to determine how close any estimate is to the
‘true’ accuracy. Undoubtedly meta-regression [27] and, better still, individual patient data
(IPD) analyses [28] would provide a more accurate estimate if the relative contributions that
each of the factors which drive a test’s accuracy could be established. The use of IPD has
been at the forefront of recent prediction research and one proposed framework suggested
that different model intercepts may be appropriate depending on the data available [29].
However, as with all model approaches, their effectiveness is contingent upon the availability
of high quality data which ultimately depends on the adequate reporting of research.
Thus, tailored meta-analysis represents a probabilistic and pragmatic approach to the question
of applicability based on the information available. Consequently, any summary estimate
should be interpreted as the most plausible estimate for the test in the setting in question
given the available studies and the region of feasible performances for the test in the setting,
(a comparison between conventional and tailored meta-analysis is given in table 2).
Also of interest is the importance the test positive rate, r has in determining the size of the
applicable region and hence the feasible values for the sensitivity and specificity [6]. Studies
have shown how presenting symptoms may influence a test’s sensitivity and specificity [30]
and a potential mechanism could be their effect on r. Once r is known, changing the
prevalence also affects the shape of the applicable region. Thus, affirming empirical research
that the sensitivity and specificity also depend on the prevalence [30,31].
Although defining an applicable region allows us to tailor the selection of studies for the test
to the practice setting it is clear from the examples analysed that this does not always lead to
a significant change in the aggregate estimates - such as in the case of applying the PHQ-9
questionnaire to screen for depression. Nonetheless, there were two examples here where it
was important, and, in a previous study, it was demonstrated to have a significant effect on
the results [6]. This suggests that if information on the test positive rate, r and background
prevalence, p, is available then it may be useful in meta-analysis.

14
As systems of data collection improve, knowing total numbers of test results is becoming
increasingly possible at all levels from primary to tertiary care, as well as on a national scale.
As a result, greater information on diagnostic and screening performance may influence
policies on patient management and follow up.
The example of applying Centor’s criteria to patients with sore throats, in general practice,
establishes what may be achieved with a relatively small sample of test positive data from
practice. A larger sample size would have narrowed the applicable region further and
potentially refined the selection of studies more as a result. It also demonstrated that the
methods extend beyond screening tests, even when the test positive rates are higher. Not only
did the summary estimates from aggregating all studies lie outside the applicable region for
the practice setting, the effect of using a more targeted selection of studies was to potentially
increase the predictive value by 15%.
It is clear, from the examples of the diagnostic/screening tests applied in general practice, that
conducting studies in a similar setting (primary care) is not sufficient to guarantee that the
findings will be applicable. This should be considered as a natural consequence of having
more specific information on the target setting. It also suggests that external validity or
generalizability of a study’s findings may be unachievable in some cases.
Future research
Although the benefits of taking a tailored approach to meta-analysis have been demonstrated,
several areas relating to the method are worthy of further research. In particular, the current
model has been developed within a classical framework but could be explored within a
Bayesian framework. This would allow both the incorporating of prior information and the
assessment of heterogeneity using a recently developed bivariate I2 statistic [32].
One of the shortcomings of tailored meta-analysis is a loss of statistical precision from
excluding improbable studies. Whilst the potential for bias would not be eliminated, meta-
regression models that include some of the characteristics analysed here have the potential to
improve the precision of summary estimates and could be investigated in future studies.
In summary, the analysis given here demonstrates that performing meta-analyses without
specific information regarding the intended clinical setting may result in misleading summary

15
statistics on a test’s performance. Furthermore, if information is available on the test positive
rate and prevalence for the target setting, this should be used when deciding which studies are
likely to provide a plausible estimate of performance within that setting.
Acknowledgements
We would like to thank Altrincham Medical Practice, Altrincham, UK, for helping BHW
collect audit data on patients presenting to his practice. We would also like to thank all those
who have read this or earlier drafts of this manuscript and provided comments that have
helped develop and add clarity to the work. In particular, we are grateful to Graham Dunn,
Aneez Esmail, Andrew Pickles, Hans Reitsma, Andy Vale and Jon Deeks.
Conflicts of interest
None.
Funding
During the development of this work BHW was in receipt of a Medical Research Council
fellowship (grant reference G0701649) to conduct research into diagnostic tests.

16
References
1. Irwig LM, Bossuyt PM, Glasziou P, Gatsonis C, Lijmer JG. The evidence base for clinical
diagnosis: Designing studies to ensure that estimates of test accuracy are transferable. BMJ
2002;324:669–71.
2. Willis BH, Quigley M. Uptake of newer methodological developments and the deployment of
meta-analysis in diagnostic test research: a systematic review. BMC Med Res Methodol 2011;
11:27
3. DerSimonian R, Laird N. Meta-analysis in clinical trials. Control Clin trials 1986;7: 177-
188.
4. Reitsma JB, Glas AS, Rutjes AW, Scholten RJ, Bossuyt PM, Zwinderman AH. Bivariate
analysis of sensitivity and specificity produces informative summary measures in diagnostic
reviews. J Clin Epidemiol 2005;58:982-90.
5. Chu H, Cole SR. Bivariate meta-analysis of sensitivity and specificity with sparse data: a
generalized linear mixed model approach. J Clin Epidemiol 2006; 59:1331-1332.
6. Willis BH, Hyde CJ. Estimating a test’s accuracy using tailored meta-analysis – How
setting-specific data may aid study selection. J Clin Epidemiol 2014; 67: 538-546.
7. Chew V. Confidence, prediction and tolerance regions for the multivariate normal
distribution. J Am Stat Assoc 1966;61:605-17.
8. Douglas JB. Confidence regions for parameter pairs. Am Statist 1993;47(1):43-45.
9. Harbord R, Deeks JJ, Egger M, Whiting P, Sterne JAC, A unification of models for meta-
analysis of diagnostic accuracy studies, Biostatistics. 2007; 8(2):239-51.
10. Bossuyt P, Davenport C, Deeks J, Hyde C, Leeflang M, Scholten R. Chapter 11:
Interpreting results and drawing conclusions. In: Deeks JJ, Bossuyt PM, Gatsonis C (editors),
Cochrane Handbook for Systematic Reviews of Diagnostic Test Accuracy Version 0.9. The
Cochrane Collaboration, 2013. Available from: http://srdta.cochrane.org/.
11. Advisory Committee on Breast Cancer Screening. Screening for breast cancer in England:
past and future. NHSBSP Publication No 61, February 2006
12. Gøtzsche PC, Nielsen M. Screening for breast cancer with mammography. Cochrane
Database of Systematic Reviews 2006, Issue 4. Art. No.: CD001877. DOI:
10.1002/14651858.CD001877.pub2.
13. Blamey RW, Wilson ARM, Patnick J. ABC of breast diseases: Screening for breast
cancer. BMJ 2000;321;689-693.
14. Humphrey LL, Helfand M, Chan BKS, Woolf SH. Breast Cancer Screening: a summary
of the evidence for the U.S. Preventive Services Task Force. Ann Intern Med 2002;137:347-
360.
15. Kerlikowske K, Grady D, Rubin SM, Sandrock C, Ernster VL. Efficacy of screening
mammography. A meta-analysis. JAMA 1995;273:149-154.

17
16. Nyström L, Andersson I, Bjurstam N, Frisell J, Nordenskjöld B, Rutqvist LE. Long-term
effects of mammography screening: updated overview of the Swedish randomised trials.
Lancet 2002; 359: 909–19.
17. Mushlin AI, Kouides RW, Shapiro DE. Estimating the Accuracy of Screening
Mammography: A Meta-analysis. Am J Prev Med 1998;14:143-153).
18. http://www.hscic.gov.uk/catalogue/PUB10339/bres-scre-prog-eng-2011-12-rep.pdf (table
7a) (Accessed January 12th
, 2014).
19.
http://www.nhsemployers.org/Aboutus/Publications/Documents/QOF_Guidance_2009_final.
pdf (Accessed January 12th
, 2014).
20. Depression: the treatment and management of depression in adults (Updated edition),
National clinical practice guideline 90. British Psychological Society and the Royal College
of Psychiatrists, 2010. ISBN: 978-1-904671-85-5.
21. Spitzer RL, Kroenke K, Williams JBW. Validation and utility of a self-report version of
PRIME-MD: the PHQ primary care study. Primary care evaluation of mental disorders.
Patient health questionnaire. JAMA 1999; 282: 1734-1744.
22. Manea L, Gilbody S, McMillan D. Optimal cut-off score for diagnosing depression with
the Patient Health Questionnaire (PHQ-9): a meta-analysis. CMAJ 2012; 184(3):E191-E196.
23. McManus S, Meltzer H, Brugha T, Bebbington P, Jenkins R, (editors). Adult psychiatric
morbidity in England, 2007: results of a household survey. The NHS Information Centre for
health and social care 2007. http://www.hscic.gov.uk/catalogue/PUB02931/adul-psyc-morb-
res-hou-sur-eng-2007-rep.pdf (Accessed January 15th
2014)
24. Gilbody S, Richards D, Barkham M. Diagnosing depression in primary care using self-
completed instruments: UK validation of PHQ–9 and CORE–OM. BJGP 2007; 57: 650–652.
25. Centor RM, Witherspoon JM, Dalton HP, Brody CE, Link K. The diagnosis of strep
throat in adults in the emergency room. Med Decis Making 1981; 1; 239-246.
26. Aalbers J, O’Brien KK, Chan WS, Falk G, Teljeur C, Dimitrov BD, Fahey T. Predicting
streptococcal pharyngitis in adults in primary Care: a systematic review of the diagnostic
accuracy of symptoms and signs and validation of the Centor Score. BMC Med 2011 Jun
1;9:67.
27. Macaskill P, Gatsonis C, Deeks JJ, Harbord RM, Takwoingi Y. Chapter 10: Analysing
and presenting results. In: Deeks JJ, Bossuyt PM, Gatsonis C (editors), Cochrane Handbook
for Systematic Reviews of Diagnostic Test Accuracy Version 1.0. The Cochrane
Collaboration, 2010. Available from: http://srdta.cochrane.org/.
28. Riley RD, Dodd SR, Craig JV, Thompson JR, Williamson PR. Meta-analysis of
diagnostic test studies using individual patient data and aggregate data. Stat Med
2008;27(29):6111-36.

18
29. Debray TP, Moons KG, Ahmed I, Koffijberg H, Riley RD. A framework for developing,
implementing, and evaluating clinical prediction models in an individual participant data
meta-analysis. Stat Med 2013; 32:3158-3180
30. Knottnerus JA, Leffers P. The influence of referral patterns on the characteristics of
diagnostic tests. J Clin Epidemiol 1992;45:1143-54.
31.Willis BH. Evidence that disease prevalence may affect the performance of diagnostic
tests with an implicit threshold: a cross sectional study. BMJ Open 2012; 2:e000746.
32. Zhou Y, Dendukuri N. Statistics for quantifying heterogeneity in univariate and bivariate
meta-analyses of binary data: the case of meta-analyses of diagnostic accuracy. Stat Med
2014; 33:2701-2717.

19
Figure 1. Breast Screening using Mammography.
Studies lying within the range of performance for the NHS Breast screening program (green
rectangle) are depicted as red boxes. The corresponding summary performance estimate (red
cross) and associated 95% confidence ellipse (red continuous) and prediction ellipse (red
dashed) are also given. Studies outside the applicable region are depicted as blue triangles.
For conventional meta-analysis (where all studies are included), the summary performance
estimate (black cross) with 95% confidence ellipse (black continuous) and prediction ellipse
(black dashed) are also given
Figure 2. PHQ-9 as a screening tool for depression for a test threshold of 10.
The applicable region for the general practice is represented by the green trapezium. The red
coloured studies have performance estimates which lie in the applicable region for the
practice and their associated summary estimate, confidence ellipse (continuous) and
prediction ellipse (dashed) are also in red. Studies whose performances are improbable for the
practice setting are depicted by the blue triangles. The overall summary estimate with 95%
confidence ellipse (continuous) and prediction ellipse (dashed) from conventional meta-
analysis (where all studies were included) are in black.
Figure 3. Centor’s criteria for diagnosing GABHS for a test threshold of 3.
The applicable region for the general practice is represented by the green enclosed region.
The applicable region is represented by the green trapezium. The red coloured studies have
performance estimates which lie in the applicable region for the practice and their associated
summary estimate, confidence ellipse and prediction ellipse (dashed) are also in red. Studies
whose performances are improbable for the practice setting are depicted by the blue triangles.
The overall summary estimate with 95% confidence ellipse and prediction ellipse from
conventional meta-analysis (where all studies were included) are in black

20
Test Studies Sensitivity (%) Specificity (%) Positive LR Negative LR
Mammography All (n=10) 87.2 (81.1-91.5) 95.6 (93.0-97.3) 19.8 (12.8-30.9) 0.13 (0.09-0.20)
AR (n=4) 78.0 (70.0-84.4) 97.9 (96.4-98.7) 36.5 (23.0-57.9) 0.22 (0.16-0.31)
PHQ-9 All (n=10) 74.2 (63.1-82.9) 91.5 (86.4-94.8) 8.8 (5.7-13.5) 0.28 (0.20-0.41)
AR (n=7) 79.7 (71.5-86.1) 87.9 (83.1-91.5) 6.6 (4.6-9.5) 0.23 (0.16-0.33)
Centor All (n=12) 50.3 (42.7-58.4) 78.5 (65.7-87.5) 2.35 (1.51-3.67) 0.63 (0.54-0.73)
AR (n=5) 38.4 (30.3-47.2) 92.1 (83.4-96.5) 4.89 (2.02-11.8) 0.67 (0.56-0.80)
Table 1. Performance characteristics for the different tests as estimated by conventional
meta-analysis and tailored meta-analysis.
Note: LR = Likelihood ratio. All = all studies included in the analysis. AR = Applicable
region – only those studies in the applicable region are in the analysis.
95% confidence intervals in brackets.
Conventional meta-analysis Tailored meta-analysis
Criteria for study selection Qualitative Qualitative and probabilistic
Data from setting of interest Generally not used Yes, incorporates r and p from the
setting when selecting studies
Predicted location of test
performance for setting of interest
Prediction region Applicable region
Applicability of summary estimate
in setting of interest
May be implausible for setting in
some cases
Plausible for setting
Precision of summary estimate More precise Less precise. There may be too few
studies to aggregate in some cases
When should summary results be
applied to practice
When there is limited or no
heterogeneity
When there is heterogeneity and r
and p are available for the setting
Table 2. Comparison of conventional meta-analysis and tailored meta-analysis

Appendix 1 Tailored meta-analysis model
All studies that meet the inclusion criteria of the review are considered for selection for
tailored meta-analysis by first deriving an applicable region for the test in the setting and
comparing the observed estimate reported in each study with the applicable region. This is
outlined below.
a) Defining an applicable region based on the test positive rate, r
Using data collected from the practice setting we may derive an interval estimate for the test
positive rate r, such that we assume rlcl μr rucl where μr is the parameter for r, rlcl and rucl
are the lower and upper confidence limits. This constrains the feasible values the sensitivity, s
and false positive rate, f may take in the practice setting, since
if f s then it follows that f r and s ≥ r (1)
Combining this logical relation with the uncertainty of the interval estimate produces an
applicable region (shaded) such as the one in illustration 1 below.
Illustration 1.
Sensi
tivity
False positive rate
rlcl
rucl
f = s
rlcl
AppendixClick here to download Appendix: Appendix 1.docx

b) Defining an applicable region based on the test positive rate, r and prevalence, p
Including information on the prevalence, p in addition to the test positive rate, r allows us to
refine the applicable region further by exploiting both (1) and the following relation
s r
p(1 p) f
p (2)
Using interval estimates we again assume that rlcl μr rucl and plcl μp pucl where μp is the
parameter for p, plcl and pucl are the lower and upper confidence limits respectively.
Combining (1) and (2) with the uncertainty of the interval estimates produces illustration 2.
The two inner constraints (defined by [r = rucl ; p = pucl] and [r = rlcl ; p = plcl] respectively)
are surplus since when the outer constraints are ‘violated’ so are the inner constraints, but the
converse is not true.
The effect these have on the size and shape of the applicable region (shaded) is shown in
illustration 3.
Illustration 2
Sensi
tivity
False positive rate
2b

c) Selecting studies based on their compatibility with the applicable region
After deriving an applicable region for the test in the setting, for each primary study, we
consider what the estimate for the false positive rate and sensitivity parameter pair (μf,i , μs,i)
would be if it was constrained to lie in the applicable region.
Consistent with the meta-analysis model of Chu and Cole [5] we assume the sensitivity and
false positive rate for each study to have independent binomial distributions. We then derive
the maximum likelihood estimate (MLE) for (μf,i , μs,i) subject to it being constrained to lie in
the applicable region. This is made easier by noting that if the observed study estimate (fi , si)
lies outside of the applicable region the MLE for (μf,i , μs,i) must lie on the closest boundary
(see illustration 3).
A tail probability for the observed study estimate (fi, si) may be calculated given the MLE of
the parameter pair lying on the boundary and noting fi and si have independent binomial
distributions as described above. A study i is excluded if the tail probability is less than the
level of significance. The included studies are then aggregated using standard methods [5].
Illustration 3.
Sensi
tivity
False positive rate
(μf, i
, μs, i
)
(fi , s
i )

Appendix 2: Update of meta-analysis of Mammography.
The objective was to estimate the average sensitivity and specificity of mammography in the NHS
breast screening programme in the UK by updating an earlier meta-analysis.
Method
Medline, EMBASE, and CINAHL were searched for studies published after 1996. Studies published
prior to 1996 were retrieved from the results of a previous meta-analysis.1 Studies were included if:
the study was a primary study; it evaluated two-view x-ray mammography as a screening test in a
normal population cohort; a suitable reference standard was applied; a suitable threshold was applied;
sufficient data were reported to complete the 2 x 2 table on the programme performance of
mammography.
The methodology relies upon the threshold between the data collected from practice and the primary
studies being consistent. A suitable threshold for positive was a recommendation for further work-up‟
as in the UK or Breast Imaging Reporting and Data Systems (BIRADS) categories 0,3,4 and 5 as in
the US.2 An acceptable reference standard was considered to involve biopsy confirmation of positives
or linkage of patients to cancer registries. Negatives were confirmed by extended follow up such as 12
months or more. From each included study the following data items were recorded: study identifier,
the location of the study, details of the study population and when sampled, details of the technology
and reference standard, number of readers, screening interval, definitions of positive and negative
screens and 2 x 2 table data.
The sensitivity and false positive rate (FPR) were estimated using conventional and tailored meta-
analysis. In the latter study selection is tailored to include only those that have estimates which are
compatible with the NHS Breast screening programme (see main article). We intended to conduct
meta-regression analyses but this was not possible due to insufficient studies in the sample.
Results
There were 862 citations (23 retrieved from previous meta-analysis for screening) and 10 studies were
included for analysis. The set of included studies is given in Table A2a. Also shown in tables A2a and
A2b are the study characteristics and the reported accuracies with inclusions decisions after each
study has been compared with the applicable region for the NHS. The main risk of bias was in the
reference standard due to the possibility of reviewer bias. None of the studies reported applying the
reference standard blind to the index test, although, it was unclear due to inadequate reporting whether
blinding featured in the study design. Six studies used a follow up period of 12 months for negative
screens with the remaining studies following up over 24 months or more. There was also variation in
AppendixClick here to download Appendix: Appendix 2.docx

the length of follow up of negative screens with half. Although each study evaluated a screening
population cohort the age range and the screening interval varied which could potentially introduce
patient spectrum differences. The results of the conventional and tailored meta-analysis are given in
the main article.
Table A2a. Included studies
A2.1. Muir TM, Tresham J, Fritschi L, Wylie E. Screening for breast cancer post reduction mammoplasty.
Clin Radiol. 2010;65(3):198-205
A2.2. Vernet Mdel M, Checa MA, Macià F, Casamitjana M, Carreras R. Influence of hormone replacement
therapy on the accuracy of screening mammography. Breast J. 2006; 12(2):154-8.
A2.3a
Hofvind S, Wang H, Thoresen S, Do the results of the process indicators in the Norwegian Breast
Cancer Screening Program predict future mortality reduction from breast cancer? Acta
Oncol. 2004;43(5):467-73.
A2.3b
Skaane P, Hofvind S, Skjennald A. Randomized trial of screen-film versus full-field digital
mammography with soft-copy reading in population-based screening program: follow-up and final
results of Oslo II study. Radiology. 2007;244(3):708-17
A2.4
Banks E, Reeves G, Beral V, Bull D, Crossley B, Simmonds M, Hilton E, et al. Influence of personal
characteristics of individual women on sensitivity and specificity of mammography in the Million
Women Study: cohort study. BMJ 2004;329(7464):477
A2.5
Elmore JG, Carney PA, Abraham LA, Barlow WE, Egger JR, Fosse JS, Cutter GR, Hendrick
RE, D'Orsi CJ, Paliwal P, Taplin SH. The association between obesity and screening mammography
accuracy. Arch Intern Med. 2004;164(10):1140-7.
A2.6 Bulliard JL, De Landtsheer JP, Levi F. Results from the Swiss mammography screening pilot
programme. Eur J Cancer. 2003;39(12):1761-9
A2.7
Van Landeghem P, Bleyen L, De Backer G. Age-specific accuracy of initial versus subsequent
mammography screening: results from the Ghent breast cancer-screening programme. European
Journal of Cancer Prevention 2002;11:147–151
A2.8a
Rosenberg RD, Yankaskas BC, Hunt WC, Ballard-Barbash R, Urban N, Ernster VL et al. Effect of
variations in operational definitions on performance estimates for screening mammography. Acad
Radiol. 2000;7(12):1058-68
A2.8b. Rosenberg RD, Lando JF, Hunt WC, Darling RR, Williamson MR, Linver MN et al. Screening
mammography performance in Albuquerque, New Mexico, 1991 to 1993. Cancer 1996; 78:1731-9.
A2.9a
Duijm LEM, Louwman MWJ, Groenewoud JH, van de Poll-Franse LV, Fracheboud J, Coebergh JW.
Inter-observer variability in mammography screening and effect of type and number of readers on
screening outcome. British Journal of Cancer. 2009; 100: 901 – 907
A2.9b
Duijm LEM , Groenewoud JH, Fracheboud J, de Koning HJ. Additional Double Reading of Screening
Mammograms by Radiologic Technologists: Impact on Screening Performance Parameters. J Natl
Cancer Inst 2007;99: 1162 – 70
A2.10 Seigneurin A, Exbrayat C, Labare` J, Colonna M. Comparison of interval breast cancer rates for two-
versus single-view screening mammography: A population-based study. Breast 2009;18: 284–288.

Study id Population Study Design Readers Screening
interval
Follow up
(months)
A2.1 Women aged 49-69,
Western Australia
Retrospective cohort
Jan 1998-Dec 2007
2 2 years 12
A2.2 Screening population 50-69,
Barcelona, Spain
Prospective cohort
Jan 2000 - Dec 2002
2 2 years 24
A2.3a &
A2.3b
Women eligible for screening 45-49 and
50-69. Oslo, Norway
RCT on prospective cohort -
Nov 2000-Dec 2001
2 1 year for 45-49,
2 years for 50-69.
12
A2.4 Women invited for screening, between
50 -64, over 21 months. UK.
Prospective cohort
1996-1998
Unclear 3 years 12
A2.5 Women 40-79 eligible for screening.
Group Health Cooperative NW US
1996-2004 Unclear Unclear,
probably 2 years
12
A2.6 Screening cohort 50-69, Lausanne,
Switzerland
Prospective cohort
1993-1999
2 2 years 27
A2.7 All female residents 40-69 in city,
screened over 8 years, Ghent, Belgium
Prospective cohort
1992-1999
2 2 years 24
A2.8a &
A2.8b
Female residents 35-84. Elected
screening not invited. Albuquerque,
New Mexico
Prospective cohort
1991-1993
1 1 year 12
A2.9a &
A2.9 b
Women eligible for screening 50-75.
Netherlands
Retrospective cohort
2003-2006
1 and 2 2 years 24
A2.10 Women eligible for screening 50-69.
Isere, France
Retrospective cohort
1994-2004
2 2.5 years til 2002,
then 2 years.
12
Table A2b. Characteristics of the included studies. Readers = number of readers reading
mammogram; follow up = time given before confirming a negative.
Study id TP FN TN FP Sensitivity FPR p value Decision
A2.1 3961 381 686719 32736 0.91 0.046 0 Exclude
A2.2 92 12 22825 1331 0.88 0.055 0 Exclude
A2.3a & b 2295 110 375150 15905 0.95 0.041 10-4 Exclude
A2.4 629 97 117841 3885 0.87 0.032 1 Include
A2.5 617 85 86272 13648 0.86 0.137 0 Exclude
A2.6 68 28 9947 328 0.71 0.032 1 Include
A2.7 195 52 28026 671 0.79 0.023 1 Include
A2.8a & b 951 158 204870 25629 0.86 0.111 0 Exclude
A2.9a & b 528 242 104403 920 0.69 0.009 1 Include
A2.10 221 10 28881 2265 0.96 0.073 0 Exclude
Table A2c. Reported data and accuracy of included studies. „P value‟ shows the probability that the
study estimate for the FPR and sensitivity could have arisen from the parameters („true values‟) lying
in the applicable region for the NHS. The applicable region was defined based on 0.0388≤ r ≤ 0.0395
(see main article); „Decision‟ is the decision to include/exclude for tailored meta-analysis for a level
of significance of 0.025.
Appendix 2 References
1. Mushlin AI, Kouides RW, Shapiro DE, Estimating the Accuracy of Screening Mammography: A
Meta-analysis, Am J Prev Med 1998;14:143-153.
2. Smith-Bindman R, Chu PW, Miglioretti DI, Sickles EA, Blanks R, Ballard-Barbash R, Bobo
JK, Lee NC, Wallis MG, Patnick J, Kerlikowske K. Comparison of screening mammography in the
United States and the United Kingdom. JAMA 2003; 290:2129–2137

Appendix 3: Meta-analysis of the PHQ-9 questionnaire in General practice.
The objective was to estimate the average sensitivity and specificity of the PHQ-9 questionnaire in
diagnosing depression at a threshold of 10 in a general practice in the UK.
Method
Medline, EMBASE, and PsychInfo were searched for studies published after 1966 using a
combination of search terms which included “phq” , “patient health questionnaire”, “depression”,
“primary care”, “family practice”, “general practice”, “sensitivity”, “specificity”, “ROC curve” We
also used citations from 3 existing meta-analyses. Studies were included if: the study was a primary
study; it evaluated the PHQ-9 questionnaire in a general practice or family practice setting; the target
diagnosis was a major depressive disorder; the reference standard was a standardised interview
schedule based on the Diagnostic and Statistical manual of mental disorders (DSM IV) or the
International Classification of Diseases (ICD-10); sufficient data were reported to complete the 2 x 2
table at a test threshold of 10.
The methodology relies upon the threshold between the data collected and the primary studies being
consistent. In general when implementing the PHQ-9 tool the optimum threshold has been found to be
10, so this was used when calculating the test positive rate from the routine data collected from the
general practice setting. From each included study the following data items were recorded: study
identifier; the location of the study; details of the study population; sampling; language of PHQ-9
tool; reference standard; blinding between the test and reference standard; and 2 x 2 table data.
The sensitivity and false positive rate (FPR) were estimated using conventional and tailored meta-
analysis using a bivariate random effects model (BRM) and the intention was to extend this model for
meta-regression analyses to test for significant covariates if the sample of studies was adequate.
Results
The searches identified 139 unduplicated studies. After applying the inclusion criteria there were ten
studies which evaluated the PHQ-9 on what may be considered an unselected adult primary care
population (see table A3a). In seven studies the population was completely drawn from general or
family practice and included all adults and both sexes. For the remaining three studies: one study
selected 90% of the patients from general practice with the remainder drawn from hospital outpatients
[A3.9]; the second study was conducted in hospital but this was the primary care entry point for the
local population [A3.8]; the third selected only women from family practice but the selection was
neither based on age nor co-morbidity [A3.10]. The characteristics of individual studies are shown in
Table A3b. Meta-regression was not attempted owing to the small sample of studies (n = 10).

A3.1. Arroll B, Goodyear-Smith F, Crengle S, Gunn J, Kerse N, Fishman T, Falloon K, Hatcher S. Validation of PHQ-2 and PHQ-9 to screen for major depression in the primary care population. Ann Fam Med. 2010;8:348-53
A3.2. Ayalon L, Goldfracht M, Bech P. 'Do you think you suffer from depression?' Reevaluating the use of a single item question for the screening of depression in older primary care patients. Int J Geriatr Psychiatry. 2010;25(5):497-502.
A3.3 Azah N. Shah M, Juwita S, Bahri I, Rushidi W, Jamil Y. Validation of the Malay version brief Patient Health Questionnaire (PHQ-9) among adult attending family medicine clinics. Int Med J 2005;12:259-64.
A3.4 Cheng C, Cheng M. To validate the Chinese version of the 2Q and PHQ-9 questionnaires in Hong Kong Chinese patients. HK Pract 2007;29:381-390
A3.5 Zuithoff NP, Vergouwe Y, King M, Nazareth I, van Wezep MJ, Moons KG, Geerlings MI. The Patient Health Questionnaire-9 for detection of major depressive disorder in primary care: consequences of current thresholds in a crosssectional study. BMC Fam Pract. 2010 ;11:98.
A3.6 Gilbody S, Richards D, Barkham M. Diagnosing depression in primary care using self-completed instruments: UK validation of PHQ–9 and CORE–OM BJGP 2007; 57: 650–652.
A3.7 Lotrakul M, Sumrithe S, Saipanish R. Reliability and validity of the Thai version of the PHQ-9. BMC Psychiatry. 2008; 8:46.
A3.8 Inagaki M, Ohtsuki T, Yonemoto N, Kawashima Y, Saitoh A, Oikawa Y, Kurosawa M, Muramatsu K, Furukawa TA, Yamada M. Validity of the Patient Health Questionnaire (PHQ)-9 and PHQ-2 in general internal medicine primary care at a Japanese rural hospital: a cross-sectional study. Gen Hosp Psychiatry. 2013;35(6):592-7
A3.9 Liu SI, Yeh ZT, Huang HC, Sun FJ, Tjung JJ, Hwang LC, Shih YH, Yeh AW. Validation of Patient Health Questionnaire for depression screening among primary care patients in Taiwan. Compr Psychiatry. 2011 Jan-Feb;52(1):96-101
A3.10. Sherina MS, Arroll B, Goodyear-Smith F. Criterion Validity of the PHQ-9 (Malay Version) in a Primary Care Clinic in Malaysia. Med J Malaysia. 2012;67(3):309-15
Table A3a – The included studies
Study id Population Location Sampling Language Reference standard
Blinding
A3.1 Age > =16 in family practice in Auckland, New Zealand
Auckland, New Zealand
Consecutive English CIDI Yes
A3.2 Family practice Israel Unclear ?Hebrew SCID-I Unclear
A3.3 Adults in Family practice Kelantan, Malayasia Unclear Malay CIDI Yes
A3.4 Adults in Family practice Hong Kong Consecutive Chinese HADS Yes
A3.5 Age > =18 in family practice Utrecht, Netherlands
Consecutive recruits Dutch CIDI Yes
A3.6 General practice UK. Randomised English SCID-I Yes
A3.7 GP clinic in Hospital Bangkok, Thailand Systematic sampling Thai MINI,
HAM-D Yes
A3.8
Age > =19, outpatients in Hospital Tohoku, Japan Random sampling of consecutive patients
Japanese MINI Yes
A3.9 Age > =18 in family practice & 10% in hospital outpatients
Taipai, Taiwan Consecutive recruits Chinese SCAN Yes
A3.10 Adult women in primary care Urban, Malaysia Consecutive Malayan CIDI Yes
Table A3b – Characteristics of studies.
Note: CIDI – Composite International Diagnostic Interview; SCID – Structured Clinical Interview for DSM IV; HADS –
Hospital Anxiety and Depression Scale; MINI – Mini-International Psychiatry Interview; HAM-D – Hamilton rating scale
for Depression; SCAN – Schedule for Clinical Assessment in Neuropsychiatry.
Although in each of the studies the reference standard took the form of a standardised interview, there
were 6 different types used which could have implications for the definition of the target condition
(Major depressive disorder). Blinding between the reference standard and the test was consistently
reported across all but one of the studies.
The PHQ-9 instrument was applied in English in only two studies and seven of the studies were
conducted in the far-east. The sample size was too small to evaluate whether either of these factors
could potentially affect the way the test is executed or have patient spectrum effects particularly when
compared to a UK general practice setting.
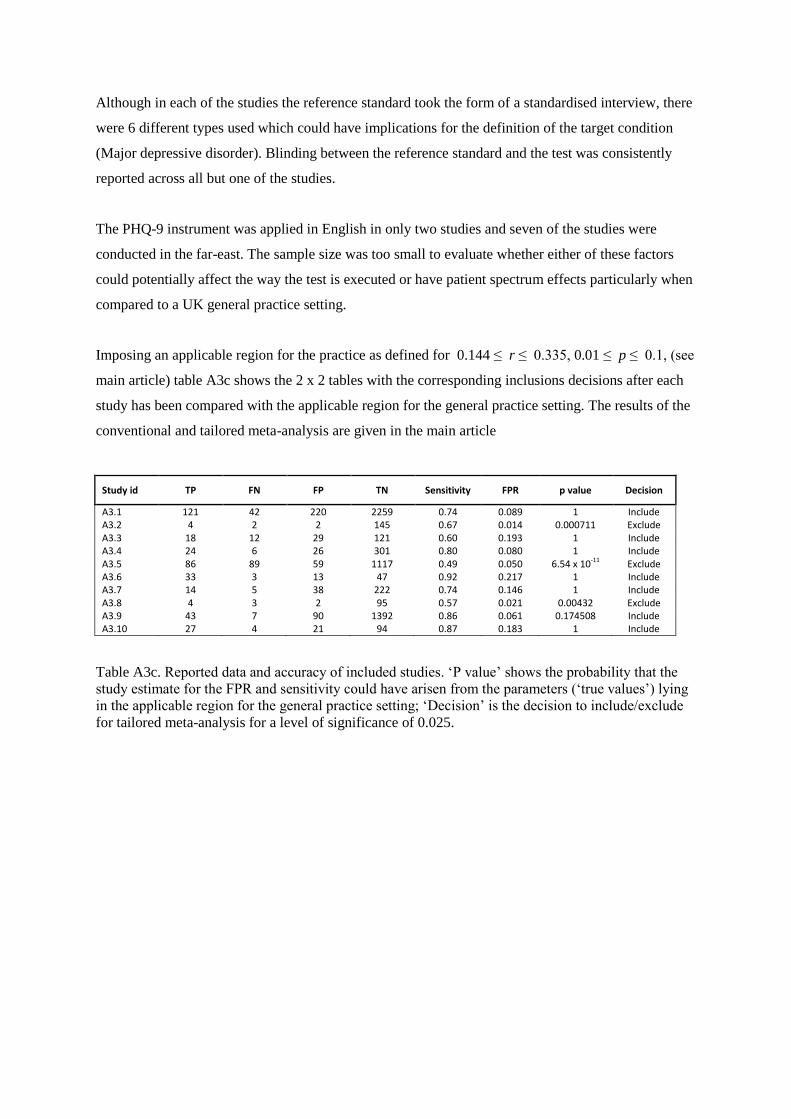
Imposing an applicable region for the practice as defined for 0.144 ≤ r ≤ 0.335, 0.01 ≤ p ≤ 0.1, (see
main article) table A3c shows the 2 x 2 tables with the corresponding inclusions decisions after each
study has been compared with the applicable region for the general practice setting. The results of the
conventional and tailored meta-analysis are given in the main article
Study id TP FN FP TN Sensitivity FPR p value Decision
A3.1 121 42 220 2259 0.74 0.089 1 Include A3.2 4 2 2 145 0.67 0.014 0.000711 Exclude A3.3 18 12 29 121 0.60 0.193 1 Include A3.4 24 6 26 301 0.80 0.080 1 Include A3.5 86 89 59 1117 0.49 0.050 6.54 x 10⁻¹¹ Exclude A3.6 33 3 13 47 0.92 0.217 1 Include A3.7 14 5 38 222 0.74 0.146 1 Include A3.8 4 3 2 95 0.57 0.021 0.00432 Exclude A3.9 43 7 90 1392 0.86 0.061 0.174508 Include A3.10 27 4 21 94 0.87 0.183 1 Include
Table A3c. Reported data and accuracy of included studies. „P value‟ shows the probability that the
study estimate for the FPR and sensitivity could have arisen from the parameters („true values‟) lying
in the applicable region for the general practice setting; „Decision‟ is the decision to include/exclude
for tailored meta-analysis for a level of significance of 0.025.

Appendix 4: Meta-analysis of Centor’s criteria for diagnosing Group A β haemolytic
streptococcus (GABHS) infection in general practice.
The objective was to estimate the accuracy of Centors‟ criteria at a threshold of 3 in diagnosing
GABHS infection in patients presenting with a sore throat in a general practice in the UK.
Method
Medline, EMBASE, and PsychInfo were searched for studies published after 1980 using a
combination of search terms which included “streptococcal Infections”, “streptococc$”, “pharyngitis”,
“sensitivity”, “specificity”, “ROC curve”, “predictive value of tests”. We also used citations from one
published meta-analysis.1 Studies were included if: the study was a primary study; it evaluated
Centor‟s criteria in an unselected general practice or family practice population; eligible subjects
included those presenting with a sore throat; the target diagnosis was GABHS; the reference standard
was by throat swab; sufficient data were reported to complete the 2 x 2 table at a test threshold of 3.
The usual threshold when applying Centor‟s criteria to patients with a sore throat is 3 and this was
used when calculating the test positive rate from data collected from the practice setting. For each
included study the following data items were recorded: study identifier; the location of the study;
details of the study population; sampling; reference standard; blinding between the test and reference
standard; and 2 x 2 table data. The sensitivity and false positive rate (FPR) were using conventional
and tailored meta-analysis and meta-regression analyses were planned if the sample of studies was
adequate.
Results
We identified 506 unduplicated studies and eleven of these met the inclusion criteria (see table A4a).
None of the studies was conducted in a UK setting. Although all studies selected subjects from a
general practice population or equivalent, the age groups analysed in the individual studies varied. In
four studies the study sample consisted of children only, in two studies the sampling was from an
adult population and in the remaining studies the age range included both children and adults.
There was also variation in the eligibility criteria for study subjects. In general patients were selected
if they had symptoms of a sore throat, acute pharyngitis or an upper respiratory tract infection
depending on the study. Such differences in entry criteria have the potential to affect the spectrum of
patients tested. Studies which used one or more of Centor‟s criteria as part of the eligibility criteria
were excluded. In six of the studies the mode of sampling was not clear and blinding between the test
and the reference standard was in general inadequately reported. The study characteristics are shown
in Table A4b and meta-regression was not performed owing to the small sample of studies (n = 11).

A4.1. Fine AM, Nizet V, Mandl KD. Large-Scale Validation of the Centor and McIsaac Scores to Predict Group A Streptococcal Pharyngitis. Arch Intern Med. 2012;172(11):847-852.
A4.2. Regueras De Lorenzo G, Santos Rodríguez PM, Villa Bajo L, Pérez Guirado A, Arbesú Fernández E, Barreiro Hurlé L, Nicieza García M. Utilidad de una técnica antigénica rápida en el diagnostic de faringoamigdalitis por Streptococcus pyogenes. An Pediatr (Barc). 2012;77:193-199.
A4.3 Canada JM, Serna AC, Cruz NG-E, de la Iglesia JG, Ortiz LB, Fernandez MNF. Is streptococcal pharyngitis diagnosis possible? Aten Primaria 2007, 39:361-365.
A4.4 Treebupachatsakul P, Tiengrim S, Thamlikitkul V. Upper respiratory tract infection in Thai adults: prevalence and prediction of bacterial causes, and effectiveness of using clinical practice guidelines. J Med Assoc Thai 2006; 89: 1178-1186.
A4.5 Atlas SJ, McDermott SM, Mannone C, Barry MJ. The role of point of care testing for patients with acute pharyngitis. J Gen Intern Med 2005;20:759-61.
A4.6 Dagnelie CF, Bartelink ML, van der Graaf Y, Goessens W, de Melker RA. Towards a better diagnosis of throat infections (with group A beta-haemolytic streptococcus) in general practice. Br J Gen Pract. 1998;48:959-62.
A4.7 Hall MC, Kieke B, Gonzales R, Belongia EA. Spectrum bias of a rapid antigen detection test for group A beta-hemolytic streptococcal pharyngitis in a pediatric population. Pediatrics. 2004;114:182-6.
A4.8 Seppälä H, Lahtonen R, Ziegler T, Meurman O, Hakkarainen K, Miettinen A, Arstila P, Eskola J, Saikku P, Huovinen P. Clinical Scoring System in the Evaluation of Adult Pharyngitis. Arch Otolaryngol Head Neck Surg. 1993;119:288-91.
A4.9 McIsaac WJ, White D, Tannenbaum D, Low DE. A clinical score to reduce unnecessary antibiotic use in patients with sore throat. CMAJ 1998;158:75-83.
A4.10 Alper Z, Uncu Y, Akalin H, Ercan I, Sinirtas M, Bilgel NG. Diagnosis of acute tonsillopharyngitis in primary care: a new approach for low-resource settings. J Chemother. 2013;25:148-55.
A4.11 Abu-Sabaah A H, Ghazi H O. Better diagnosis and treatment of throat infections caused by group A [beta]-haemolytic streptococci. Br J Biomed Sci; 2006; 63:155-58
A4.12 Schwartz K, Monsur J, Northrup J, West P, Neale AV. Pharyngitis clinical prediction rules: effect of interobserver
agreement: a MetroNet study. J Clin Epidemiol. 2004; 57(2):142-6
Table A4a – The included studies
Table A4c shows the 2 x 2 tables with the corresponding inclusions decisions after each study has
been compared with the applicable region for the general practice setting. Four of the eleven studies
were included in the tailored meta-analysis. The results of the conventional and tailored meta-analysis
are given in the main article

Study id
Population Location Selection criteria for study subjects
Sampling Blinding
A4.1 General population, age 3+ 500 clinics across US
Painful throat & received GABHS testing
Retrospective; unclear
Unclear
A4.2 Primary care, ages 2-14 Asturias, Spain
Acute pharyngitis, not defined
Prospective; consecutive
Yes
A4.3 Primary care centre, age 14+ Madrid, Spain Sore throat Unclear; unclear
Unclear
A4.4 Ambulatory care service of the social security program in OPD Hospital, age 15-65
Bangkok, Thailand
Symptoms of URTI: sore throat, rhinorrhoea
Unclear; unclear
Unclear
A4.5 Primary care patients, age 18+ Boston, USA Symptoms of acute pharyngitis
Prospective; consecutive
Unclear
A4.6 Primary care patients, ages 4-60
Rotterdam, Netherlands
Sore throat for < 15 days Prospective; unclear
Unclear
A4.7 Primary care setting, age 2-17 Wisconsin, USA
All undergoing RADT for suspected GABHS
Retrospective; consecutive
Unclear
A4.8 Primary care patients in private health, ages 15-62
Turku, Finland Sore throat Prospective; consecutive
Unclear
A4.9 Family medicine patients, age 3-14*
Toronto, Canada
Physician's opinion that they had an URTI
Prospective; unclear
Unclear
A4.10 Family practice, age >7 Emek, Turkey Sore throat and no antibiotics in previous 3 days
Prospective; unclear
Unclear
A4.11 General practice in public hospitals and private clinics
Makkah, Saudi Arabia
Symptoms of pharyngo-tonsillitis
Prospective; unclear
Unclear
A4.12 Primary care, adults Michigan, USA
Sore throat Prospective; consecutive
Unclear
Table A4b – Characteristics of studies.
Note: The responses for sampling were related to design (prospective/retrospective/ unclear) and patient recruitment
(consecutive/random/ systematic/unclear) respectively.
* Although the study sample included patients with age range of 3-76, there was only sufficient data to complete 2 x 2 table
for Centor‟s criteria in the age group 3-14.
Study id TP FN FP TN Sensitivity FPR p value Decision
A4.1 27299 28714 30218 120639 0.49 0.20 0 Exclude A4.2 40 34 73 45 0.54 0.62 0 Exclude A4.3 26 8 40 66 0.76 0.38 6.1 x 10⁻⁸ Exclude A4.4 7 16 9 260 0.30 0.03 1 Include A4.5 16 22 32 78 0.42 0.29 1.2 x 10⁻³ Exclude A4.6 116 67 131 244 0.63 0.35 4.5 x 10⁻¹⁶ Exclude A4.7 52 100 51 358 0.34 0.12 1 Include A4.8 4 1 17 84 0.80 0.17 1 Include A4.9 20 12 19 39 0.63 0.33 7.3 x 10⁻⁴ Exclude A4.10 13 19 38 212 0.41 0.15 1 Include A4.11 37 30 140 148 0.55 0.49 0 Exclude A4.12 6 2 1 71 0.75 0.01 1 Include
Table A4c. Reported data and accuracy of included studies. „P value‟ shows the probability that the
study estimate for the FPR and sensitivity could have arisen from the parameters („true values‟) lying
in the applicable region for the general practice setting; „Decision‟ is the decision to include/exclude
for tailored meta-analysis for a level of significance of 0.025.

Appendix 4 References
1. Aalbers J, O‟Brien KK, Chan WS, Falk G, Teljeur C, Dimitrov BD, Fahey T. Predicting streptococcal
pharyngitis in adults in primary Care: a systematic review of the diagnostic accuracy of symptoms and signs and
validation of the Centor Score. BMC Med. 2011 Jun 1;9:67.

0
0.1
0.2
0.3
0.4
0.5
0.6
0.7
0.8
0.9
1
0 0.1 0.2 0.3 0.4 0.5
Se
nsitiv
ity
false positive rate
Figure 1

0
0.1
0.2
0.3
0.4
0.5
0.6
0.7
0.8
0.9
1
0 0.1 0.2 0.3 0.4 0.5 0.6 0.7 0.8 0.9 1
Sensitiv
ity
false positive rate
Figure 2

0
0.1
0.2
0.3
0.4
0.5
0.6
0.7
0.8
0.9
1
0 0.1 0.2 0.3 0.4 0.5 0.6 0.7 0.8 0.9 1
Se
nsitiv
ity
false positive rate
Figure 3

Conflicts of interest: None
*Conflict of Interest/Financial Disclosure