
What is Monetary Policy? - Vijayanagara Sri Krishnadevaraya ...
914
BBA VI th SEMESTER INTERNATIONAL BUSINESS MANAGEMENT MODULE – IV NOTES What is Monetary Policy? Monetary policy consists of the process of drafting, announcing, and implementing the plan of actions taken by the central bank, currency board, or other competent monetary authority of a country that controls the quantity of money in an economy and the channels by which new money is supplied. Monetary policy consists of management of money supply and interest rates, aimed at achieving macroeconomic objectives such as controlling inflation, consumption, growth, and liquidity. These are achieved by actions such as modifying the interest rate, buying or selling government bonds, regulating foreign exchange rates, and changing the amount of money banks are required to maintain as reserves. Some view the role of the International Monetary Fund as this. KEY POINTS Monetary policy is how a central bank or other agency governs the supply of money and interest rates in an economy in order to influence output, employment, and prices. Monetary policy can be broadly classified as either expansionary or contractionary. Monetary policy tools include open market operations, direct lending to banks, bank reserve requirements, unconventional emergency lending programs, and managing market expectations (subject to the central bank's credibility). Monetary Policy Understanding Monetary Policy
-
Upload
khangminh22 -
Category
Documents
-
view
1 -
download
0
Transcript of What is Monetary Policy? - Vijayanagara Sri Krishnadevaraya ...

BBA VI th SEMESTER
INTERNATIONAL BUSINESS MANAGEMENT
MODULE – IV NOTES
What is Monetary Policy? Monetary policy consists of the process of drafting, announcing, and implementing the plan of actions taken by the central bank, currency
board, or other competent monetary authority of a country that controls
the quantity of money in an economy and the channels by which new money is supplied. Monetary policy consists of management of money
supply and interest rates, aimed at achieving macroeconomic objectives
such as controlling inflation, consumption, growth, and liquidity. These are achieved by actions such as modifying the interest rate, buying or
selling government bonds, regulating foreign exchange rates, and
changing the amount of money banks are required to maintain as
reserves. Some view the role of the International Monetary Fund as this.
KEY POINTS
Monetary policy is how a central bank or other agency governs the
supply of money and interest rates in an economy in order to
influence output, employment, and prices. Monetary policy can be broadly classified as either expansionary
or contractionary.
Monetary policy tools include open market operations, direct lending to banks, bank reserve requirements, unconventional
emergency lending programs, and managing market expectations
(subject to the central bank's credibility).
Monetary Policy
Understanding Monetary Policy

Economists, analysts, investors, and financial experts across the globe eagerly await the monetary policy reports and outcome of the meetings
involving monetary policy decision-making. Such developments have a
long lasting impact on the overall economy, as well as on specific
industry sector or market.
Monetary policy is formulated based on inputs gathered from a variety
of sources. For instance, the monetary authority may look at
macroeconomic numbers like GDP and inflation, industry/sector-specific growth rates and associated figures, geopolitical developments
in the international markets (like oil embargo or trade tariffs), concerns
raised by groups representing industries and businesses, survey results from organizations of repute, and inputs from the government and other
credible sources.
Monetary authorities are typically given policy mandates, to achieve
stable rise in gross domestic product (GDP), maintain low rates of unemployment, and maintain foreign exchange and inflation rates in a
predictable range. Monetary policy can be used in combination with or
as an alternative to fiscal policy, which uses to taxes, government
borrowing, and spending to manage the economy.
The Federal Reserve Bank is in charge of monetary policy in the United
States. The Federal Reserve has what is commonly referred to as a "dual
mandate": to achieve maximum employment (with around 5 percent unemployment) and stable prices (with 2 to 3 percent inflation). It is the
Fed's responsibility to balance economic growth and inflation. In
addition, it aims to keep long-term interest rates relatively low. Its core role is to be the lender of last resort, providing banks with liquidity and
serve as a bank regulator, in order to prevent the bank failures and
panics in the financial services sector.
international monetary system
is a set of internationally agreed rules, conventions and supporting
institutions that facilitate international trade, cross border investment and
generally the reallocation of capital between nation states. It should
provide means of payment acceptable to buyers and sellers of different
nationalities, including deferred payment. To operate successfully, it
needs to inspire confidence, to provide sufficient liquidity for fluctuating
levels of trade, and to provide means by which global imbalances can be
corrected. The system can grow organically as the collective result of
numerous individual agreements between international economic factors
spread over several decades. Alternatively, it can arise from a single
architectural vision, as happened at Bretton Woods in 1944.
Evolution of international monetary system
Throughout history, precious metals such as gold and silver have been used for trade, sometimes in the form of bullion, and from early history
the coins of various issuers – generally kingdoms and empires – have
been traded. The earliest known records of pre-coinage use of precious metals for monetary exchange are from Mesopotamia and Egypt, dating
from the third millennium BC.
Early money took many forms, apart from bullion; for instance bronze spade money which became common in Zhou dynasty China in
the late 7th century BC. At that time, forms of money were also
developed in Lydia in Asia Minor, from where its use spread to nearby
Greek cities and later to many other places.
Sometimes formal monetary systems have been imposed by regional
rulers. For example, scholars have tentatively suggested that the Roman king Servius Tullius created a primitive monetary system in the early
history of Rome. Tullius reigned in the sixth century BC - several
centuries before Rome is believed to have developed a formal coinage
system.
As with bullion, early use of coinage is believed to have been generally the preserve of the elite. But by about the 4th century BC coins were
widely used in Greek cities. They were generally supported by the city
state authorities, who endeavoured to ensure they retained their values
regardless of fluctuations in the availability of whatever base or precious
metals they were made from.
From Greece the use of coins spread slowly westwards throughout
Europe, and eastwards to India. Coins were in use in India from about 400 BC; initially they played a greater role in religion than in trade, but
by the 2nd centur they had become central to commercial transactions.
Monetary systems that were developed in India were so successful that
they spread through parts of Asia well into the Middle Ages.
As a variety of coins became common within a region, they were
exchanged by moneychangers, the predecessors of today's foreign exchange market, as mentioned in the Biblical story of Jesus and the
money changers. In Venice and the other Italian city states of the early
Middle Ages, money changers would often have to struggle to perform calculations involving six or more currencies. This partly led
to Fibonacci writing his Liber Abaci which popularised the use of Indo-
Arabic numerals, which displaced the more difficult Roman numerals
then in use by western merchants.
When a given nation or empire has achieved regional hegemony, its currency has been a basis for international trade, and hence for a de
facto monetary system. In the West – Europe and the Middle East – an
early such coin was the Persian daric. This was succeeded by Roman currency of the Roman Empire, such as the denarius, then the Gold
Dinar of the Ottoman Empire, and later – from the 16th to 20th
centuries, during the Age of Imperialism – by the currency of European colonial powers: the Spanish dollar, the Dutch guilder, the French
franc and the British pound sterling; at times one currency has been pre-eminent, at times no one dominated. With the growth of American
power, the US dollar became the basis for the international monetary
system, formalised in the Bretton Woods agreement that established the post–World War II monetary order, with fixed exchange rates of other
currencies to the dollar, and convertibility of the dollar into gold. The
Bretton Woods system broke down, culminating in the Nixon shock of
1971, ending convertibility; but the US dollar has remained the de
facto basis of the world monetary system, though no longer de jure
, with various European currencies and the Japanese yen also being
prominent in foreign exchange markets. Since the formation of the Euro, the Euro has also gained use as a reserve currency and a medium of
transactions, though the dollar has remained the most important
currency.
A dominant currency may be used directly or indirectly by other nations:
for example, English kings minted the gold mancus, presumably to
function as dinars to exchange with Islamic Spain; colonial powers sometimes minted coins that resembled those already used in a distant
territory; and more recently, a number of nations have used the US
dollar as their local currency, a custom called dollarization.
Until the 19th century, the global monetary system was loosely linked at
best, with Europe, the Americas, India and China (among others) having
largely separate economies, and hence monetary systems were regional. European colonization of the Americas, starting with the
Spanish empire, led to the integration of American and European
economies and monetary systems, and European colonization of Asia led to the dominance of European currencies, notably the British pound
sterling in the 19th century, succeeded by the US dollar in the 20th
century. Some, such as Michael Hudson, foresee the decline of a single base for the global monetary system, and the emergence instead of
regional trade blocs; he cites the emergence of the Euro as an example.
See also Global financial systems, world-systems approach and polarity in international relations. It was in the later half of the 19th century that
a monetary system with close to universal global participation emerged,
based on the gold standard.
The pre WWI financial order: 1816–1919
Main article: Gold Standard § Establishment of the international gold
standard
The gold standard widely adopted in this era rested on the conversion of paper notes into pre-set quantities of gold.
From the 1816 to the outbreak of World War I in 1914, the world benefited from a well-integrated financial order, sometimes known as
the "first age of globalisation".
There were monetary unions which enabled member countries to accept each other's currencies as legal tender. Such unions included the Latin
Monetary Union (Belgium, Italy, Switzerland, France) and
the Scandinavian monetary union (Denmark, Norway and Sweden). In the absence of shared membership of a union, transactions were
facilitated by widespread participation in the gold standard, by both
independent nations and their colonies. Great Britain was at the time the world's pre-eminent financial, imperial, and industrial power, ruling
more of the world and exporting more capital as a percentage of her
national income than any other creditor nation
Between the World Wars: 1919–1939
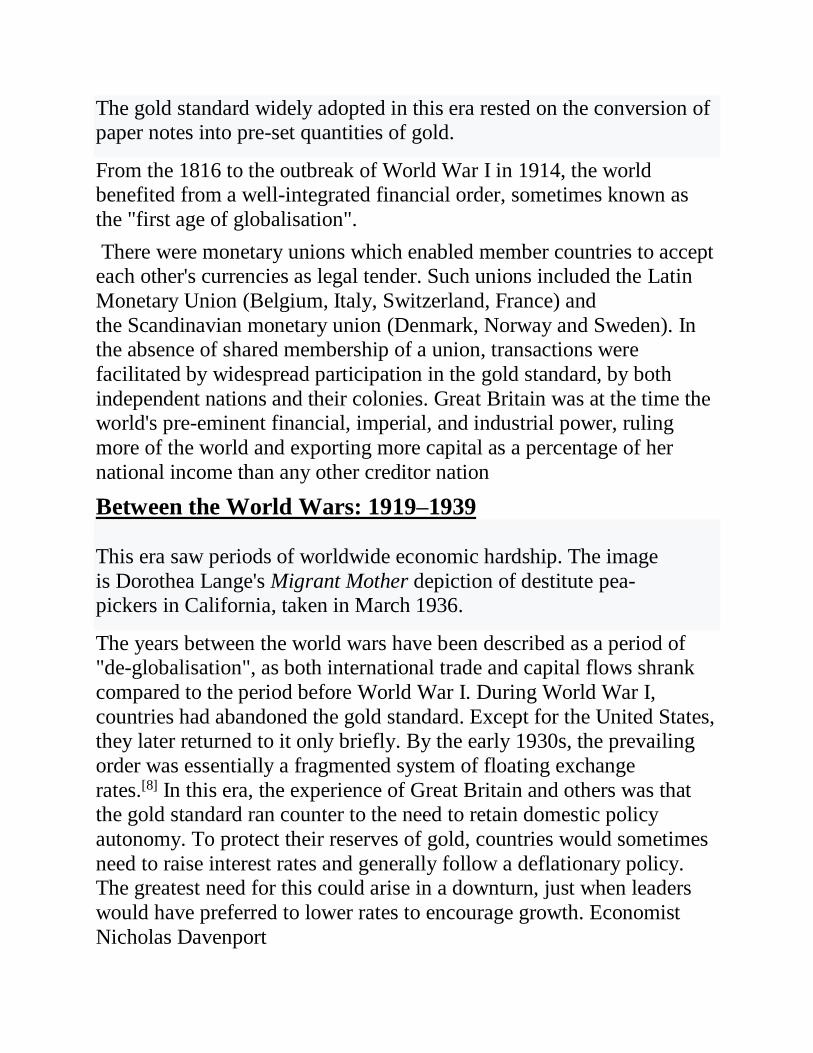
This era saw periods of worldwide economic hardship. The image
is Dorothea Lange's Migrant Mother depiction of destitute pea-pickers in California, taken in March 1936.
The years between the world wars have been described as a period of "de-globalisation", as both international trade and capital flows shrank
compared to the period before World War I. During World War I,
countries had abandoned the gold standard. Except for the United States, they later returned to it only briefly. By the early 1930s, the prevailing
order was essentially a fragmented system of floating exchange
rates.[8] In this era, the experience of Great Britain and others was that the gold standard ran counter to the need to retain domestic policy
autonomy. To protect their reserves of gold, countries would sometimes
need to raise interest rates and generally follow a deflationary policy. The greatest need for this could arise in a downturn, just when leaders
would have preferred to lower rates to encourage growth. Economist
Nicholas Davenport

had even argued that the wish to return Britain to the gold standard "sprang from a sadistic desire by the Bankers to inflict pain on the
British working class."
By the end of World War I, Great Britain was heavily indebted to the United States, allowing the US to largely displace it as the world's
foremost financial power. The United States, however, was reluctant to
assume Great Britain's leadership role, partly due to isolationist influences and a focus on domestic concerns. In contrast to Great Britain
in the previous era, capital exports from the US were not
countercyclical. They expanded rapidly with the United States' economic growth in the 1920s until 1928, but then almost completely
halted as the US economy began slowing in that year. As the Great
Depression intensified in 1930, financial institutions were hit hard along with trade; in 1930 alone, 1345 US banks collapsed. [10] During the
1930s, the United States raised trade barriers, refused to act as an
international lender of last resort, and refused calls to cancel war debts, all of which further aggravated economic hardship for other countries.
According to economist John Maynard Keynes, another factor
contributing to the turbulent economic performance of this era was the insistence of French premier Clemenceau that Germany pay war
reparations at too high a level, which Keynes described in his book The
Economic Consequences of the Peace.
The Bretton Woods Era: 1944–1973
: Bretton Woods system
Harry Dexter White and John Maynard Keynes at Bretton Woods
British and American policy makers began to plan the post-war
international monetary system in the early 1940s. The objective was to
create an order that combined the benefits of an integrated and relatively liberal international system with the freedom for governments to pursue
domestic policies aimed at promoting full employment and social
wellbeing.

The principal architects of the new system, John Maynard Keynes and Harry Dexter White, created a plan which was endorsed by the 42
countries attending the 1944 Bretton Woods conference, formally known
as the United Nations Monetary and Financial Conference. The plan involved nations agreeing to a system of fixed but adjustable exchange
rates so that the currencies were pegged against the dollar, with the
dollar itself convertible into gold. So in effect this was a gold – dollar exchange standard. There were a number of improvements on the old
gold standard.
Two international institutions, the International Monetary Fund (IMF)
and the World Bank were created.
A key part of their function was to replace private finance as a more
reliable source of lending for investment projects in developing states. At the time the soon to be defeated powers of Germany and Japan were
envisaged as states soon to be in need of such development, and there
was a desire from both the US and Britain not to see the defeated powers saddled with punitive sanctions that would inflict lasting pain on future
generations.
The new exchange rate system allowed countries facing economic hardship to devalue their currencies by up to 10% against the dollar
(more if approved by the IMF) – thus they would not be forced to
undergo deflation to stay in the gold standard. A system of capital controls was introduced to protect countries from the damaging effects
of capital flight and to allow countries to pursue independent macro
economic policies
while still welcoming flows intended for productive investment. Keynes
had argued against the dollar having such a central role in the monetary system, and suggested an international currency called bancor be used
instead, but he was overruled by the Americans. Towards the end of the
Bretton Woods era, the central role of the dollar became a problem as international demand eventually forced the US to run a persistent trade
deficit, which undermined confidence in the dollar. This, together with
the emergence of a parallel market for gold in which the price soared

above the official US mandated price, led to speculators running down the US gold reserves. Even when convertibility was restricted to nations
only, some, notably France,
continued building up hoards of gold at the expense of the US. Eventually these pressures caused President Nixon to end all
convertibility into gold on 15 August 1971. This event marked the
effective end of the Bretton Woods system; attempts were made to find other mechanisms to preserve the fixed exchange rates over the next few
years, but they were not successful, resulting in a system of floating
exchange rates.[13]
The post Bretton Woods system: 1973– present
: Washington Consensus
The New York Stock Exchange. The current era has seen huge and turbulent flows of capital between nations.
An alternative name for the post Bretton Woods system is
the Washington Consensus. While the name was coined in 1989, the
associated economic system came into effect years earlier: according to economic historian Lord Skidelsky the Washington Consensus is
generally seen as spanning 1980–2009 (the latter half of the 1970s being
a transitional period).
The transition away from Bretton Woods was marked by a switch from
a state led to a market led system.
The Bretton Wood system is considered by economic historians to have
broken down in the 1970s
crucial events being Nixon suspending the dollar's convertibility into gold in 1971, the United States' abandonment of capital controls in 1974,
and the UK's ending of capital controls in 1979 which was swiftly
copied by most other major economies.
In some parts of the developing world, liberalisation brought significant
benefits for large sections of the population – most prominently

with Deng Xiaoping's reforms in China since 1978 and the liberalisation
of India after its 1991 crisis.
What Is an Exchange Rate Mechanism (ERM)?
An exchange rate mechanism (ERM) is a device used to manage a
country's currency exchange rate relative to other currencies. It is part of
an economy's monetary policy and is put to use by central banks.
Such a mechanism can be employed if a country utilizes either a fixed
exchange rate or one with floating exchange rate that is bounded around
its peg (known as an adjustable peg or crawling peg).
KEY POINTS
An exchange rate mechanism (ERM) is a way that central banks can influence the relative price of its national currency in forex
markets.
The ERM allows the central bank to tweak a currency peg in order to normalize trade and/or the influence of inflation.
More broadly, ERM is used to keep exchange rates stable and
minimize currency rate volatility in the market. The Basics of the Exchange Rate Mechanism
An exchange rate mechanism is not a new concept. Historically, most
new currencies started as a fixed exchange mechanism that tracked gold or a widely traded commodity. It is loosely based on fixed exchange
rate margins, whereby exchange rates fluctuate within certain margins.
An upper and lower bound interval allows a currency to experience some variability without sacrificing liquidity or drawing additional

economic risks. The concept of currency exchange rate mechanisms is
also referred to as a semi-pegged currency system.
Real World Example of the European Exchange Rate Mechanism
The most notable exchange rate mechanism happened in Europe during
the late 1970s. The European Economic Community introduced the ERM in 1979, as part of the European Monetary System, to reduce
exchange rate variability and achieve stability before member countries
moved to a single currency. It was designed to normalize exchange rates between countries before they were integrated in order to avoid any
problems with price discovery.
The exchange rate mechanisms came to a head in 1992 when Britain, a
member of the European ERM, withdrew from the treaty. The British government initially entered the agreement to prevent the British pound
and other member currencies from deviating by more than 6%.
Soros and Black Wednesday
In the months leading up to the 1992 event, legendary investor George Soros had built up a monumental short position in the pound sterling that
became profitable if the currency fell below the lower band of the ERM.
Soros recognized that Britain entered the agreement under unfavorable conditions, the rate was too high and economic conditions were fragile.
In September 1992, now known as Black Wednesday, Soros sold off a
large portion of his short position to the dismay of the Bank of England,
who fought tooth and nail to support the pound sterling.
The European exchange rate mechanism dissolved by the end of the
decade, but not before a successor was installed. The Exchange Rate Mechanism II (ERM II) was formed in January 1999 to ensure exchange
rate fluctuations between the Euro and other EU currencies did not
disrupt economic stability in the single market. It also helped non-euro-
area countries prepare to enter the euro area.
Most non-euro-area countries agree to keep exchange rates bound to a
15% range, up or down, against the central rate. When necessary, the

European Central Bank (ECB) and other non-member countries can intervene to keep rates in the window. Some current and former
members of the ERM II include Greece, Denmark, and Lithuania.
What Is the European Monetary System (EMS)?
The European Monetary System (EMS) was an adjustable exchange
rate arrangement set up in 1979 to foster closer monetary policy co-operation
between members of the European Community (EC). The European Monetary
System (EMS) was later succeeded by the European Economic and Monetary
Union (EMU), which established a common currency called the euro.
KEY POINTS
The European Monetary System (EMS) was an arrangement between
European countries to link their currencies.
The goal was to stabilize inflation and stop large exchange rate fluctuations
between these neighboring nations, making it easy for them to trade goods
with each other.
The European Monetary System (EMS) was succeeded by the European
Economic and Monetary Union (EMU), which established a common
currency called the euro.
Understanding the European Monetary System (EMS)
The European Monetary System (EMS) was created in response to the collapse of
the Bretton Woods Agreement. Formed in the aftermath of World War II (WWII),
the Bretton Woods Agreement established an adjustable fixed foreign exchange
rate to stabilize economies. When it was abandoned in the early 1970s, currencies
began to float, prompting members of the EC to seek out a new exchange rate
agreement to complement their customs union.
The European Monetary System’s (EMS) primary objective was to
stabilize inflation and stop large exchange rate fluctuations between European
countries. This formed part of a wider goal to foster economic and political unity in
Europe and pave the way for a future common currency, the euro.

Currency fluctuations were controlled through an exchange rate
mechanism (ERM). The ERM was responsible for pegging national exchange
rates, allowing only slight deviations from the European currency unit (ECU)—a
composite artificial currency based on a basket of 12 EU member
currencies, weighted according to each country’s share of EU output. The ECU
served as a reference currency for exchange rate policy and determined exchange
rates among the participating countries’ currencies via officially sanctioned
accounting methods.
History of the European Monetary System (EMS)
The early years of the European Monetary System (EMS) were marked by uneven
currency values and adjustments that raised the value of stronger currencies and
lowered those of weaker ones. After 1986, changes in national interest rates were
specifically used to keep all the currencies stable.
The early 90s saw a new crisis for the European Monetary System (EMS).
Differing economic and political conditions of member countries, notably the
reunification of Germany, led to Britain permanently withdrawing from the
European Monetary System (EMS) in 1992. Britain's withdrawal reflected and
foreshadowed its insistence on independence from continental Europe, later
refusing to join the eurozone along with Sweden and Denmark.
Meanwhile, efforts to form a common currency and cement greater economic
alliances were ramped up. In 1993, most EC members signed the Maastricht
Treaty, establishing the European Union (EU). One year later, the EU created the
European Monetary Institute, which later became the European Central
Bank (ECB).
The primary responsibility of the ECB, which came into being in 1998, was to
institute a single monetary policy and interest rate.
At the end of 1998, most EU nations unanimously cut their interest rates to
promote economic growth and prepare for the implementation of the euro. In
January 1999, a unified currency, the euro, was born and came to be used by most
EU member countries. The European Economic and Monetary Union (EMU) was
established, succeeding the European Monetary System (EMS) as the new name
for the common monetary and economic policy of the EU.
Criticism of the European Monetary System (EMS)
Under the European Monetary System (EMS), exchange rates could only be
changed if both member countries and the European Commission were in
agreement. This was an unprecedented move that attracted a lot of criticism.
With the global economic crisis of 2008-2009 and the ensuing economic aftermath,
significant problems in the foundational European Monetary System (EMS) policy
became evident.
Certain member states; Greece, in particular, but also Ireland, Spain, Portugal, and
Cyprus, experienced high national deficits that went on to become the European
sovereign debt crisis. These countries could not resort to devaluation and were not
allowed to spend to offset unemployment rates.
From the beginning, the European Monetary System (EMS) policy intentionally
prohibited bailouts to ailing economies in the eurozone. With vocal reluctance
from EU members with stronger economies, the EMU finally established bailout
measures to provide relief to struggling peripheral members.

BBA VI th SEMESTER
INTERNATIONAL BUSINESS MANAGEMENT
MODULE – V NOTES

Module-v
Bilateral & multilateral trade association

International economic institutions & agreements
The dimension & direction of IB depends upon the support & patronage of
International economic institutions .
The prominent institutions that promote & facilitate the IB are.
I WTO
II UNCTAD
III IMF
IV World bank

International economic institutions & agreements
The central aim of these institution is to promote world trade & investment
They bring peace & harmony
Undertake poverty eradication programs for LDCs
WTO for expansion of global trade

International economic institutions & agreements
WTO:- World trade organization
Is a global international organization dealing with the rules of trade between nations.
WTO works moves around agreements, negotiated & signed by bulk of worlds trading nations in their parliament.
International economic institutions & agreements
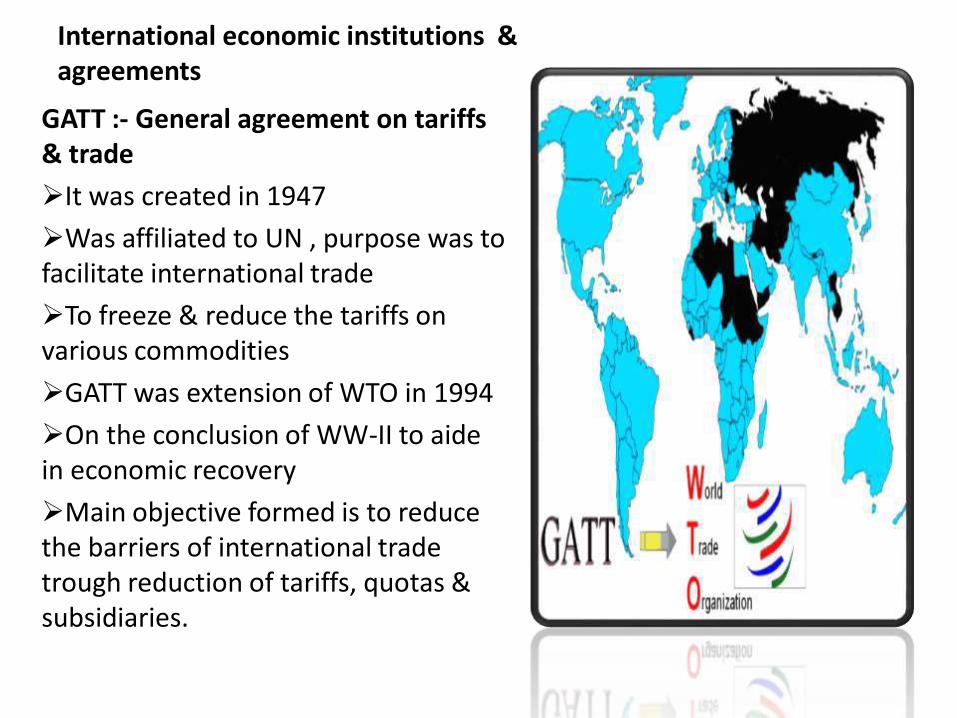
GATT :- General agreement on tariffs & trade
It was created in 1947
Was affiliated to UN , purpose was to facilitate international trade
To freeze & reduce the tariffs on various commodities
GATT was extension of WTO in 1994
On the conclusion of WW-II to aide in economic recovery
Main objective formed is to reduce the barriers of international trade trough reduction of tariffs, quotas & subsidiaries.

International economic institutions & agreements
Objectives of GATT :
It promotes free & multilateral international trade
1. To increase world output & consumption
2. To raise the standard of living of people of the whole world
3. Better utilization the resources
4. Better productivity
The rules on which GATT is developed are the following
1. Avoidance of quantitative restrictions
2. Elimination of trade practices
3. Reduction of all tariff barriers
4. Fast settlement of disputes among member countries

International economic institutions & agreements
WTO:- After Marrakesh agreement was signed GATT of 1947 was replaced by WTO in 1995 with 77 members, which increased to 148 by 2005.
WTO is a legalistic organization based in Geneva
Its structure includes Ministerial conference which is supreme governing body for decision making supported by general council

International economic institutions & agreements
GATT WTO
MULTILATERAL agreement Permanent institution
Commitments are provisional basis
Commitments are permanentbasis
Rules applied to trade in merchandise goods
It covers trade in services, TRIPS along with merchandise goods
Dispute settlement system was slow
Dispute settlement system is very fast & automatic
International economic institutions & agreements
Need of WTO : The main benefits of WTO are as follows
1. The system helps to contribute towards international peace, by helping the trade to flow smoothly & dealing with disputes over trade issues.
2. The system allows disputes to be handled constructively
3. It is a system based on rules, nothing to do with powers
4. The forum is existed to handle crisis , gives confidence to nations to do more trade, there by increasing the income, & stimulates economic growth
5. Helps to promote peace & prosperity across globe
6. Rules bring about greater discipline in trade negotiations, reducing inequalities to large extent
7. Free trade reduces cost of living & increase household
8. Companies have greater access to markets & consumers have wider range of products to choose from

WTO
Functions of WTO:-1. Administrating WTO trade agreements
2. Handling trade disputes
3. Monitoring national trade policies
4. Acts as a forum for multilateral trade negotiations
5. Oversees national trade policies
6. Constantly watching & examining the trade related foreign policies of the member countries
7. Cooperating with global financial institutions (IMF WB & ILO) IN ECNOIMIC POLICY MAKING
8. Acts as global management consultant for trade & commerce of the member countries
9. Scan the world economic environment
10. Providing the technical advice & assistance for least developed nations

WTO
The issues related to WTO IB are as under
1. WTO & most favored nation (MFN ) clause
2. WTO & TRIPS
3. WTO & TRIMS
4. WTO & Dispute settlement (DSB)
5. WTO & Trade policy review body ( TPRD)
6. WTO & antidumping measures

WTO
1. WTO & most favored nation (MFN ) clause:
Any member country shall not discriminate b/n & among its trading partners
All member countries reduce trade barriers & market should be opened for all trading partners
Imported goods should treat on par with locally made goods

WTO
2. WTO & TRIPS :
The TRIPS agreements of Uruguay round of trade negotiations contain seven areas
1. Copyrights
2. Trademarks
3. Trade secrets
4. Industrial designs
5. Geographical appellations
6. Integrated circuits
7. patents
WTO
A patent is a “ monopoly right, ranked by law to the commercial use of an invention, that is new & is useful to the public”
The protection is given to a finite term(20yrs in case of patent)
The patent is protected in many countries , giving the inventor an opportunity to recover his/her costs & earn a profit to reward the invention & encourage R&D activities across the globe

WTO
IPRs & IB ( benefits of IPRs ) :-
Strong IPR protection may encourages trade & investment in host & home country
Strong IPR boosts R&D activities in the home country
Provide great opportunities for property rights
Indian patent act, 1970 amended in below areas & effective from Jan 2005 to create opportunity for Indian companies in global market
a. Through these amendments GOI is expected to become a major partner in global R&D

WTO
3. WTO & TRIMS :-Trade related investment measures
“ it refers to certain conditions laid down by the respective government in respect of FDI flow in the country “ .
WTO measures on TRIMS as per the Uruguay round of negotiation
Most develpoing nations developed TRIMS norms for inviting FDI
The high inflow of FDI will boost the economic development of a country
Domestic company can enter into global market with liberalization of FDI related norms across the globe

UNCTAD (united nations conference on trade & development )

UNCTAD (united nations conference on trade & development )
UNCTAD (united nations conference on trade & development )
Aims at Development-friendly integration of developing countries into the world economy.

UNCTAD (united nations conference on trade & development )
The United Nations Conference on Trade andDevelopment (UNCTAD) was established in 1964 as apermanent intergovernmental body. It is the principal organof the United Nations General Assembly dealing with trade,investment, and development issues.
UNCTAD promotes the development-friendlyintegration of developing countries into the world economy.
The Secretary-General of UNCTAD is BAN Ki-moon
UNCTAD has 193 members.

UNCTAD (united nations conference on trade & development )
brief history
Creation of UNCTAD G-77 e NIEO Washington Consensus Globalization
1964
Creation of UNCTAD- Dr. Prebisch
1970s
New International Economic Order- Strengthening of the G-77- Trade and development- New topics
1980s
Washington Consensus-Debt crisis-IMF, World Bank structural adjust. programs- Trade and financial liberalization
1990s
Globalization- Creation of the WTO-Increase in FDI- Financial crises (Mexico, Asia, Russia, Brazil)

Intergovernmental process
Consensus-building
Trade and Development Board
ECOSOC
Commission on Trade in Goods, Services and Commodities
Commission on Investment, Technology and Related Financial Issues
Commission on Enterprise, Business Facilitation and Development
Commission on Science and Technology for Development
Expert Meetings
Annual session of the commissions: political issuesExpert meetings: technical issues

UNCTAD (united nations conference on trade & development )
The organization's goals are to "maximize the trade, investment and development opportunities of developing countries and assist them in their efforts to integrate into the world economy on an equitable basis.“
The creation of the conference was based on concerns of developing countries over the international market, multi-national corporations, and great disparity between developed nations and developing nations.
The United Nations Conference on Trade and Development was established in 1964 in order to provide a forum where the developing countries could discuss the problems relating to their economic development.

UNCTAD (united nations conference on trade & development )
UNCTAD grew from the view that existing institutions like GATT (now replaced by the World Trade Organization, WTO), the International Monetary Fund (IMF), and World Bank were not properly organized to handle the particular problems of developing countries.

UNCTAD (united nations conference on trade & development )
The primary objective of the UNCTAD is to formulate policies relating to all aspects of development including trade, aid, transport, finance and technology.
UNCTAD has 193 member States and is headquartered in Geneva, Switzerland.
UNCTAD has 400 staff members and an annual regular budget of approximately US$50 million and US$25 million of extra budgetary technical assistance funds.

UNCTAD (united nations conference on trade & development )
The Conference: As its name indicates, UNCTAD initially referred to a specific event, i.e. the first session of the Conference held in Geneva from 23 March to 16 June 1964. Later in the same year, the UN General Assembly authorized UNCTAD to become a permanent body and adopted its charter. There have been periodic sessions held every four years.

UNCTAD (united nations conference on trade & development )
Since the first session, an additional ten have been held: New Delhi, India (1 February - 29 March 1968); Santiago, Chile (13 April - 21 May 1972); Nairobi, Kenya (5-31 May 1976); Manila, the Philippines (6-29 May 1979); Belgrade,
Yugoslavia (6 June - 2 July 1983); Geneva (9 July - 3 August 1987);Cartagena de Indias, Colombia (8-25 February 1992); Midrand, South Africa (27 April - 11 May 1996); Bangkok ,Thailand (12-19 February 2000); Sao Paulo (13-18 June 2004).
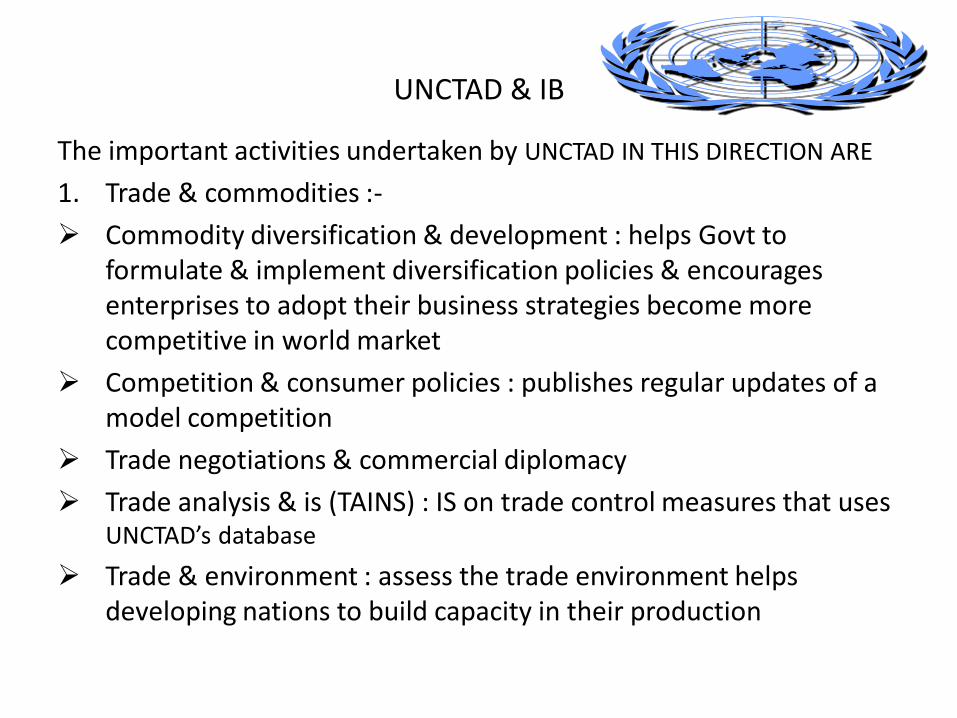
UNCTAD & IB
The important activities undertaken by UNCTAD IN THIS DIRECTION ARE
1. Trade & commodities :-
Commodity diversification & development : helps Govt to formulate & implement diversification policies & encourages enterprises to adopt their business strategies become more competitive in world market
Competition & consumer policies : publishes regular updates of a model competition
Trade negotiations & commercial diplomacy
Trade analysis & is (TAINS) : IS on trade control measures that uses UNCTAD’s database
Trade & environment : assess the trade environment helps developing nations to build capacity in their production

UNCTAD & IB
2. Investment & enterprise development :
International investment & technology arrangements : helps developing countries to participate more actively, the arrangement includes capacity building, seminars & ppt on series of papers
Investment policy review
Investment guides & capacity building for LDCs
Empretec : promotes entrepreneurship & the development of SMEs, assisting more than 70000 entrepreneurs through local market driven business support centre
Strengthening the macro environment of LDCs & resolving IMF issues as well

UNCTAD & IB
The important activities undertaken by UNCTAD IN THIS DIRECTION ARE

UNCTAD & IB1. Trade & commodities :-
Commodity diversification & development : helps Govt to formulate & implement diversification policies & encourages enterprises to adopt their business strategies become more competitive in world market
Competition & consumer policies : publishes regular updates of a model competition
Trade negotiations & commercial diplomacy
Trade analysis & is (TAINS) : IS on trade control measures that uses UNCTAD’s database
Trade & environment : assess the trade environment helps developing nations to build capacity in their production

UNCTAD & IB2. Investment & enterprise development :
International investment & technology arrangements : helps developing countries to participate more actively, the arrangement includes capacity building, seminars & ppt on series of papers
Investment policy review
Investment guides & capacity building for LDCs
Empretec : promotes entrepreneurship & the development of SMEs, assisting more than 70000 entrepreneurs through local market driven business support centre
Strengthening the macro environment of LDCs & resolving IMF issues as well

WTO & Dispute settlement body ( DSB)
Disputes related to bilateral trade are common b/n member countries of WTO
WTO members have common understanding to solve disputes multilaterally
Respecting & abiding procedural norms
WTO provides powerful mechanism to solve disputes over trade
The solutions for disputes relayed to trade reduction, trade concession, trade liberalization, transparency in the regulations of export & imports

WTO & Trade policy review body ( TPRB)
TPRB of WTO evaluates the trade policy of member countries
Indian trade policy was revived during 1998
Review includes in addition to conventional areas, new areas of service, IPRs,
India has made significant progress in the reduction of non-tariff barriers as well
India has participated in urugavy round services negotiations & made commitments in 33 sub-sectors
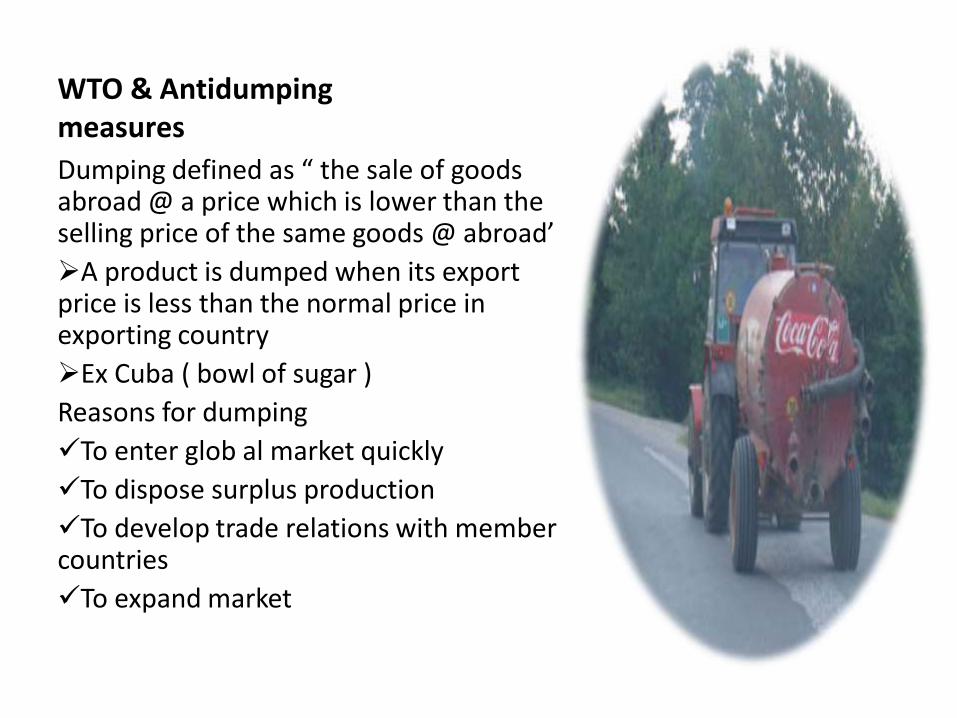
WTO & Antidumping measures
Dumping defined as “ the sale of goods abroad @ a price which is lower than the selling price of the same goods @ abroad’
A product is dumped when its export price is less than the normal price in exporting country
Ex Cuba ( bowl of sugar )
Reasons for dumping
To enter glob al market quickly
To dispose surplus production
To develop trade relations with member countries
To expand market

WTO & Antidumping measures
Effects of dumping on importing country
Effects of dumping on exporting country
Experiences decline in sales foreign exchange improves
Dumping for long time adversely affect on the economic conditions
Market expands to global
Continuing this will change the buying habits of consumers of importing country
Global network with neighboring countries
Effects on foreign exchange & BOP position
Firms of dumping country will experience profit & dividend
Political & social problems are developed

WTO & Antidumping measures
Keeping in mind the adverse effects on importing countries economic conditions, the country can go for the following methods to hold the import of excess & unnecessary g/s in the name of dumping.
Tariff duty : putting high rates of tariffs on dumping goods, foreign firm may fell not viable to dump in such country
Import quota : restriction on volume of import,
Import embargo : banning some commodity of goods/service from importing
Voluntary export restraint : some legal frame work like bilateral agreement can avoid dumping

WTO & INDIA
India is fonder member of GATT of 1947 & continues the relations since now,.. With effect of urugavy round India snatch most of the business INDIA 1991 LPG policy changed the scenario of business sector opened doors for many opportunitiesGlobalization posed do or die challenge for Indian firms to fight competition for survival Liberalization led to removal of old age firms Many Indian firms snatched R&D business GDP improves & generated employment for adding more firms of manufacturing & service sectorIndia is under MFN clause of WTO India has played important role in the effective formulation trade policiesIndia vision 2020 will be supernatural country of world

criticism on world trade organization
Politics and Trade The birth of the WTO was more of a continuation than a truly new creation. Its predecessor, the General Agreement on Tariffs and Trade (GATT), shared its lineage with Bretton Woods-inspired bodies like the International Monetary Fund (IMF) and the World Bank. As of 2019 the WTO has 164 member countries, with Liberia and Afghanistan the most recent members, having joined in July 2016, and 23 “observer” countries.
In theory, members of the WTO gain access to each other's markets on even terms. This means that no two nations can have sweetheart trade pacts without granting the same terms to every other nation, or at least every other nation in the WTO. However, some critics argue that in practice, the WTO has become a way to force politics into trade causing
long-term problems.
One problem that many WTO critics point to is apparent concessions the organization has made to its charters. The most striking example is the system of tariff brokering that takes place through an organization designed to reduce barriers to trade. The WTO rules allow a nation to protect certain industries if the removal of tariffs would have undesirable side effects, which include the loss of vital domestic industries. Food production is one of the most common, but steel production, auto production and many others can be added at the discretion of the nation. More worrisome is a push by developed nations to have labor effects – job loss, reduced hours or wages – added to the list of reasons for justified tariffs.
(For everything you need to know - from the different types of tariffs to their effects on the local economy - check out The Basics Of Tariffs And Trade Barriers.)
The War on Tariffs A tariffs is a general tax levied upon all purchasers of a particular product and it can have negative side effects. The proceeds from the tariff end up in government coffers. This raises revenue and may protect

domestic industries from foreign competition. However, the resulting high price of foreign goods allows domestic makers to raise their prices as well. As a result, a tariff may also work as a wealth transfer tax that uses public money to support a domestic industry that is producing an
uncompetitive product.
So, while unwinding the tariff might hurt the workers in that industry, it could lessen the burden on everyone else. The WTO has gotten into the business of brokering tariff agreements, which has opened it up to criticism.
What's in a Name? Anti-dumping measures and restrictive quotas are simply tariffs by another name, even though they are treated differently by the WTO. While the WTO can boast that the number of international tariffs has fallen since its inception, many reductions have been balanced by the introduction of these "stealth tariffs".
Operating Behind the One-Way Mirror Many critics of the WTO also contend that the organization has struggled with one of the basic goals it set for itself: transparency. Even in one of its main functions - settling disputes through negotiation - the WTO is infamously opaque when it comes to revealing how settlements were reached. Whether settling disputes or negotiating new trade relations, it's rarely clear which nations are in on the decision-making processes. The WTO has been attacked from both the left and right because of this
reticence.
The left sees the WTO as the henchman of a shadowy clique of stronger nations forcing agreements that allow them to exploit less developed nations. This clique uses the WTO to crack open developing nations as markets to sell, while protecting their own markets against weaker nations' products. This view has its points, as the most economically powerful nations seem to set the WTO agenda and were the first to pass anti-dumping acts to protect favored domestic industries while also
opposing similar actions by less powerful nations.
Unloved, Unneeded, Unwanted

Free market proponents attack the WTO on the grounds that it's an unnecessary entity. Rather than making complicated and heavily politicized agreements between nations on what they can and can't protect, free market thinking suggests that trade should be left to companies to work out on a deal-by-deal basis. They believe if the WTO were really designed to encourage trade, it would force member nations to drop all protective measures and allow true free trade, rather than facilitating tariff negotiations.
Just Desserts In the end, the countries using the WTO to protect their own industries may only hurt themselves if it causes their own industries to become more inefficient without true international competition. According to economic theory, a lack of competition takes away the incentives to invest in new technology, keep costs under control and continually improve production because the domestic company will simply be able to inflate prices to just under the tariff-set price of foreign goods.
In the meantime, the international competitors will only get leaner, hungrier and better at succeeding in spite of barriers. If this cycle continues, the international competitors could emerge as the stronger companies, and consumers may choose their products on the basis of
quality, perhaps even paying a premium over domestic goods.
The Bottom Line There is a dark side to the WTO. For years, critics protested that the WTO was a way for nations to engage in trade, wars and raids on underdeveloped nations, and considered it an unnecessary and expensive layer to the natural market forces of international trade. While it's debatable whether the organization is useful economically, the WTO is very important politically. Subsequently, governments - with or without
citizen support - will likely continue to support the organization.

1
PRINCIPLES OF PROJECT PLANNING AND
APPRAISAL

2
List of Figures
Figure 1: Project Cycle
Figure 2: Descriptive Project Cycle
Figure 3: Conceptual Example for Problem Tree
Figure 4: Problem Tree for a (hypothetical) Rural Development Project
Figure 5: Compact Summary of the Project Identification
Figure 6: Project Identification Process (Flow Chart)
Figure 7: Project Screening and Preparation Process
3
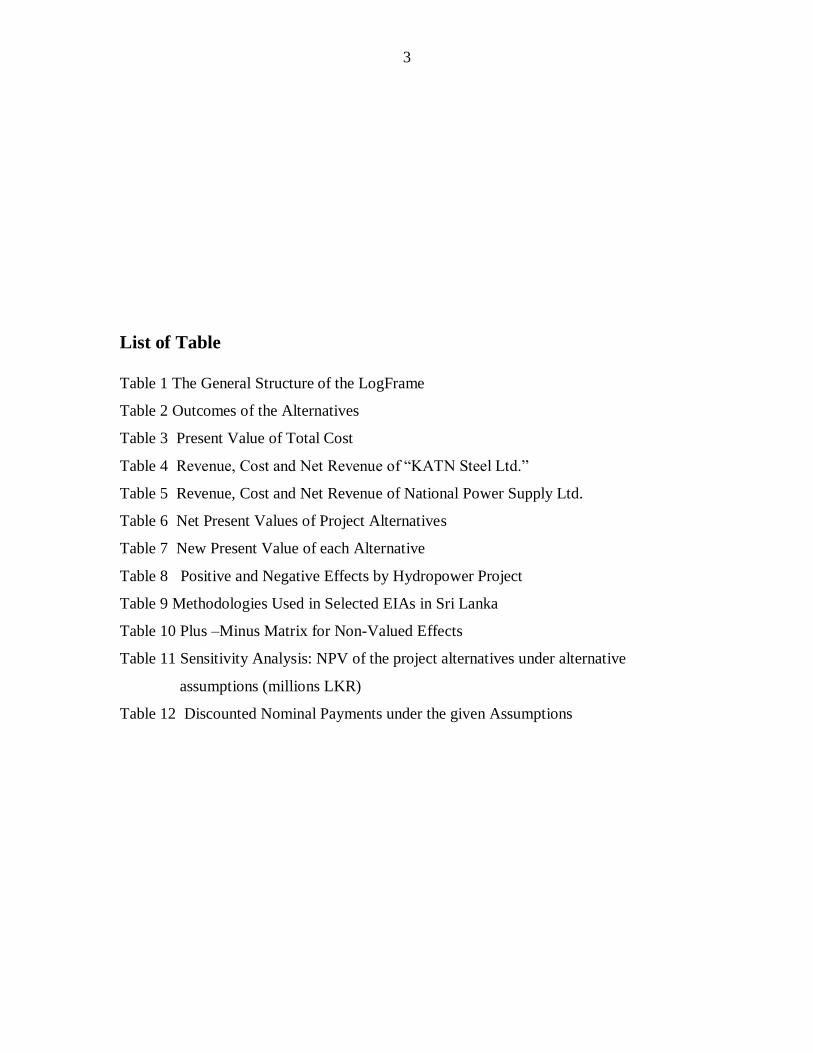
List of Table
Table 1 The General Structure of the LogFrame
Table 2 Outcomes of the Alternatives
Table 3 Present Value of Total Cost
Table 4 Revenue, Cost and Net Revenue of “KATN Steel Ltd.”
Table 5 Revenue, Cost and Net Revenue of National Power Supply Ltd.
Table 6 Net Present Values of Project Alternatives
Table 7 New Present Value of each Alternative
Table 8 Positive and Negative Effects by Hydropower Project
Table 9 Methodologies Used in Selected EIAs in Sri Lanka
Table 10 Plus –Minus Matrix for Non-Valued Effects
Table 11 Sensitivity Analysis: NPV of the project alternatives under alternative
assumptions (millions LKR)
Table 12 Discounted Nominal Payments under the given Assumptions

4
LIST OF ACRONYMS
PI – Preliminary Information
PAA - Project Approval Agency
EIA – Environmental Impact Assessment
SIA – Social Impact Assessment
CBA – Cost Benefit Analysis
NDP – National Development Planning
GCB – Government Coordinating Bureau
ERD – External Resource Department
USAID– United States Agency for International Development
LFA – Logical Framework Approach
CEA – Cost Effectiveness Analysis
DCs – Developed Countries
LDCs – Less Developed Countries
LKR – Sri Lankan Rupees
KATN – KATN Steel Company Limited
NPS – National Power Supply Limited
FIRR – Financial Interest Rate of Return
DA – Discounted Annual Payment Factor
D – Discounting Factor
NPV – Nat present Value
BCR – Benefits Cost Ratio
IRR – Internal Rate of Return
SDR – Social Discount Rate
WTP – Wllingness to Pay
WTA – Willingness to Accept
PPM – Part Per Million
5
CEB – Ceylon Electricity Board
CER – Cost Effectiveness Ratio
IEE – Initial Environmental Examination
NGOs – Non-Governmental Organization
CEA – Central Environmental Authority
EPL – Environmental Protection Licensing
NEA – National Environmental Act
EVTs – Environmental Valuation Techniques
CONTENTS
List of Figures
List of Tables
Preface
Acknowledgments
List of Acronyms
Contents
PART 1
1. Project Planning Chapter One: The Project Concept
1.1 Introduction
1. 2 Project Concept
1. 3 Project Cycle
1. 4 Problem Tree Approach
Chapter Two: Project Identification
2.1 Approaches to Project Identification
2.2 Resource-Based Identification
2.3 Market-based Identification
2.4 Basic Need-based Identification
2.5 Sources for Project Concepts/Idea
2.6 Priority Areas for Identification of Project Concept/Ideas

6
Chapter Three: Project Preparation
3.1 The Steps
3.2 Project Preparation – The Logical Framework Approach and Logical
Framework Matrix
3.2.1 Introduction
3.2.2 LFA fulfils several functions
3.2.3 Logical Framework Approach in Steps
3.2.4 Situation Analysis
3.2.5 Stakeholder Analysis
3.2.6 Problem and Objective Analysis
3.2.7 Alternatives Analysis
3.2.8 Activity Planning
3.2.9 Logical Framework Matrix (LogFrame)
Chapter Four: Stages of Implementation and Post Evaluation
4.1 Implementation of the Project
4.2 Project Evaluation
PART 2
2. Project Appraisal
Chapter Five: Social Cost-Benefit Analysis
Chapter Six: First Principle of the Cost-Benefits Analysis: Identifying Project
Alternatives
Chapter Seven: The Second Principle of Cost - Benefits Analysis: Concept of Social
Profitability
Chapter Eight: The Third Principle of Cost-Benefit Analysis: Distributional Effects
Chapter Nine: The Fourth Principle of Cost-Benefit Analysis: Social Discount Rate
Chapter Ten: The Fifth Principle of Cost-Benefit Analysis: Net Present Value (NPV)
Chapter Eleven: The Sixth Principle of the Cost-Benefit Analysis: Shadow Prices
Chapter Twelve: The Seventh Principle of Cost-Benefit Analysis: Non-valued and Non-
quantified Effects
Chapter Thirteen: The Eight Principle of Cost-benefit Analysis: Sensitivity Analysis
Chapter Fourteen: The Ninth Principle of Cost-benefit Analysis: Inflation
Chapter Fifteen: The Tenth Principle of Cost-benefit Analysis: The Decision
Chapter Sixteen: Major Problem Areas in the CBA

7
Chapter Seventeen: Cost Effectiveness Analysis of Development Project in Low Income
Countries
References
Appendix No. 1
Appendix No. 2
PRINCIPLES OF PROJECT PLANNING AND
APPRAISAL
It’s better to be roughly right than perfectly wrong!
Introduction
This small book gives an introduction to the principles of project planning process, and
the socio-economic appraisal of projects according to the technique of cost benefit
analysis. There are two main parts to this book. The first part of the book describes the
project planning process and related themes with the assistance of suitable examples.
Most of the examples are related to Sri Lankan project planning procedures and
processes. Accordingly a project cycle that has been used in Sri Lanka for more than
three decades is used for discussion in this book. The first three phases in the project
cycle are: project identification, project preparation, and project appraisal; all of which
will be discussed in details. However, the other two parts: the project implementation
phase and the project evaluation phase are not discussed in detail in this book. The main
reason for this is the author’s decision to narrow down the scope of booklet and also be
because the first three phases are more important to the undergraduate and postgraduate
students in higher educational institutions. In addition, another reason for this is that there
is limited literature about these two phases.
The second part of the book, the project appraisal phase of the project cycle deals
completely with the technique of Cost Benefit Analysis (CBA) as it is the most common
and well acknowledged technique of economic project appraisal. Here the presentation in
this task is mainly based on following a hypothetical example which will take the reader

8
through the various stages of the analysis. The ten main principles of the Cost Benefit
Analysis are discussed with hypothetical examples where necessary.
PART 1
1. PROJECT PLANNING
CHAPTER ONE: THE PROJECT CONCEPT
1.1 Introduction
The word “Project” generally means a group of activities involved in using resources to
gain certain benefits. A project is a scheme for investment of resources. According to
some writers a project is the building block of an investment plan. It also can be restated
as an undertaking to achieve specific objectives of a given budget within a specified
period of time. Another definition of a project is that it is a set of organization and inter-
related activities to be carried out with specified resources under a unified management in
order to achieve specific objectives within a given period.
Every project has a sub project but somewhere along the way a line may have to be
drawn. A sub project can be treated as a separate project. For instance, the construction of
an irrigation dam and the construction of canal network can be treated as separate project
even though, through both these activities are in fact inter-related.
All organizations and even individuals undertake projects. Projects differ in types and
sizes and they do not operate in isolation. The investment project is operated in an
economic environment which can be viewed nationally and socially. An economy is
divided into various sectors such as production, infrastructure and services sectors. A
project originating from such sectors should fall in line with the sectoral objectives.
Because sectors do not operate independently, they have to fall in line with the national
objectives. Therefore, there is a close relationship between the project, sectors and the
national level planning process. Generally, goals and objectives are set at the national
level and sectors should fall in the line with the identified national objectives. There
should be a consistency between the objectives of the various sectors and the national
objectives. Investment projects are the vehicle to achieve these objectives.
1.2 Project Concept
An investment project has a number of elements. In Sri Lanka, the National Planning
Department and the External Resources Department have developed a project concept
paper. This will give us an overview of a project concept. The main elements of the
project concept are as follows:
1. Project Title
2. Sector
3. Type of Proposal

9
4. Project Location
5. Rationale
6. Expected Project Outputs
7. Project activities
8. Environmental Impact on Physical, Biological, Socio-cultural or Aesthetic status
9. Considered Project Alternatives and Reasons for Rejections
10. Cost and Financing
11. Details of already offered or prospective external assistance to projects in the
related sector/ministry
12. Implementation
There can be several projects involving an irrigation systems, land reclamation, flood
control, power plants, railways, road development, afforestation, dairy development,
health projects or even the development of education systems. These projects can cost
millions of money units and can be localized units or spread over large areas such as a
district, province or a whole country. For example, a big thermal plant or a dairy scheme
may spread over hundreds of villages. A project can be an “enclave project” designed and
supervised by foreign consultants, executed by foreign contractors and suppliers and
managed with the help of expatriates. Most projects should be performed by using local
talent and resources. Economists, financial analysts, engineers, agronomists,
demographers, architects, sociologists, energy specialists, public health experts,
environmentalists, educators and, physical planners all have all an important role to play
in project planning.
1.3 Project Cycle
Investment projects are firstly conceived, and then they pass through various stages
before they are accepted to be taken up for implementation. Once the implementation is
over, a project’s operation is continued. From the project appraisal exercise new project
ideas can be conceived and again the project cycle starts to operate. A particular project
has a definite duration and has to go through various phases.
For example, the project cycle which has been implemented in Sri Lanka for more than
three decades, has undergone simple changes from time to time, through the basic
concepts have remained unchanged.
In the present project management system in Sri Lanka, the following common five phase
project model is usually identified. The same model is used by many donor agencies and
international banks including the World Bank (Ministry of Plan Implementation, 2001).
Figure 1: Project Cycle

10
There are several steps involved in each phase of the project cycle. The above
conventional simplified model has been used in Sri Lanka over a long period. The Main
agencies involved in project management exist at national level, provincial level district
level and “pradeshiya sabha” level.
Another descriptive type of project cycle can be identified from the field according to the
several phases it follows;
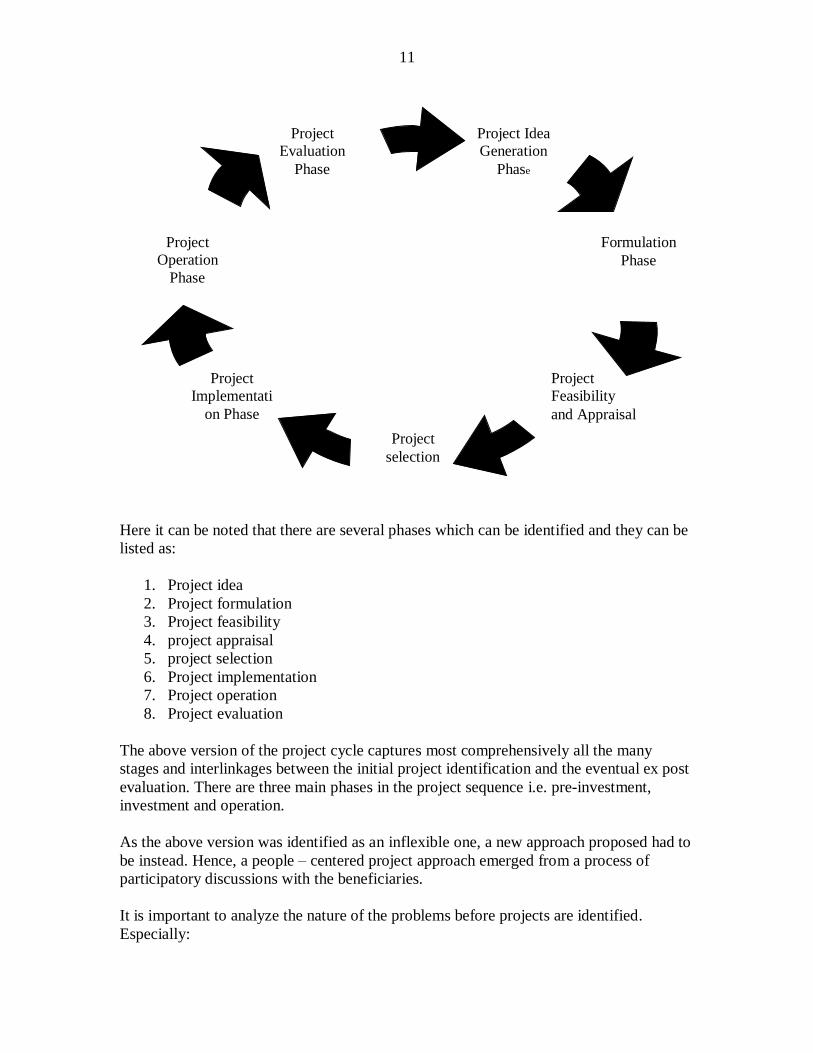
Figure 2: Descriptive Project Cycle
1. Project
Identification
2. Project
Preparation
3. Project Appraisal /
Approval
4. Project
Implementation
5. Project
Evaluation
11
Here it can be noted that there are several phases which can be identified and they can be
listed as:
1. Project idea
2. Project formulation
3. Project feasibility
4. project appraisal
5. project selection
6. Project implementation
7. Project operation
8. Project evaluation
The above version of the project cycle captures most comprehensively all the many
stages and interlinkages between the initial project identification and the eventual ex post
evaluation. There are three main phases in the project sequence i.e. pre-investment,
investment and operation.
As the above version was identified as an inflexible one, a new approach proposed had to
be instead. Hence, a people – centered project approach emerged from a process of
participatory discussions with the beneficiaries.
It is important to analyze the nature of the problems before projects are identified.
Especially:
Project Idea
Generation
Phase
Project
Operation
Phase
Project
Evaluation
Phase
Formulation
Phase
Project
Feasibility
and Appraisal
Project
selection
Project
Implementati
on Phase

12
- to identify the problem
- to derive possible alternative solutions
A systematic examination of the problem can be done by means of a ‘Problem Tree
Approach’. All interested parties are involved at this stage.
1. 4 Problem Tree Approach
The Problem Tree Approach is one kind of technique that is used to precisely identify the
problem. Before starting an investment project we have to clearly identify the problem.
Conceptually, we can demonstrate the problem tree as follows:
Figure 3: Conceptual Example of the Problem Tree
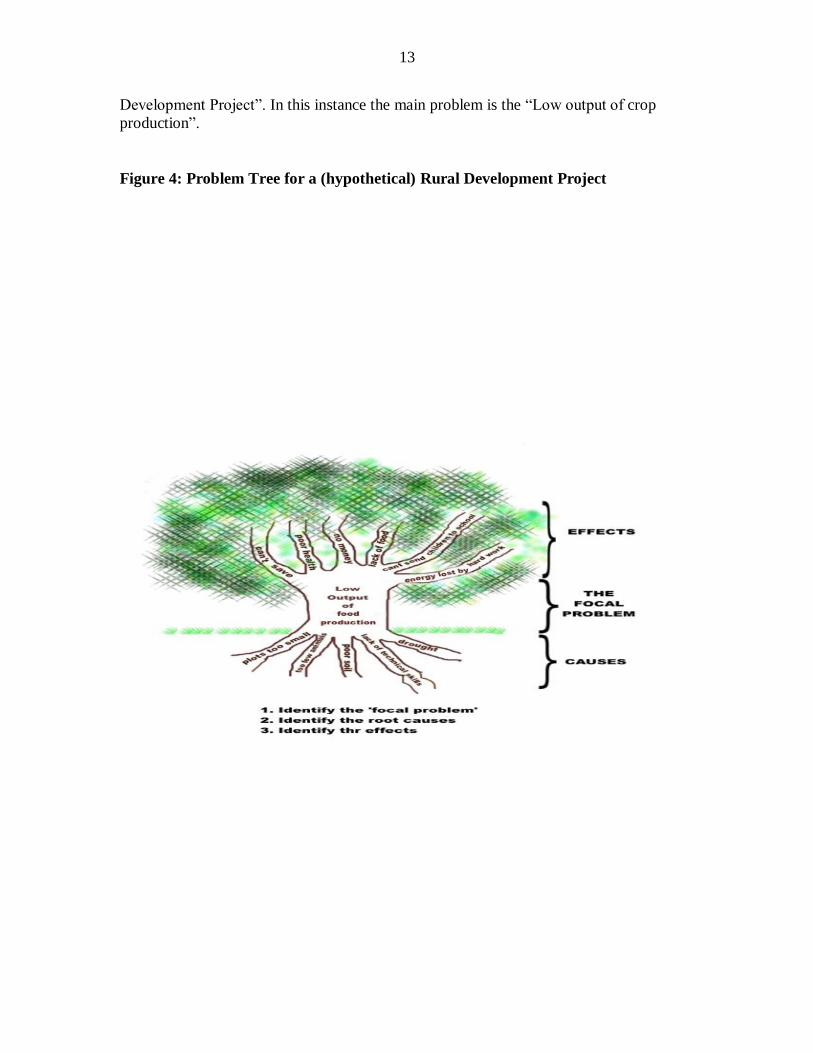
1. The root of the tree can be used to identify the causes of a particular problem. It is not
a single cause. There are a number of causes. This approach gives us an easy route to
identify the causes of the problem.
2. The trunk of the tree shows the focal problem. The main problem related to the
particular project.
3. Effects can be identified through the branches of the tree. By understanding these
effects we will be able to identify our project objectives.
Furthermore, by using a hypothetical example, we can explain the Problem Tree
Approach as shown in Figure 4. The selected hypothetical example is based on the “Rural
Effect Effect Effect Effect
Focal Problem
Cause Cause
Cause Cause Cause Cause
1
3
2
3
13
Development Project”. In this instance the main problem is the “Low output of crop
production”.
Figure 4: Problem Tree for a (hypothetical) Rural Development Project

14
CHAPTER TWO: PROJECT IDENTIFICATION
Project identification is the first stage of the project cycle. It is regarded as an important
stage since the issues concerning ownership, relevance, sustainability very much depend
on how a project or a programme is identified. Ideally, the monetary opportunity and real
costs of the selected project should be low and at the same time the project should
promise high rates of out put, employment and income.
2.1 Approaches to Project Identification
All approaches to the project identification of investment projects is usually based on the
availability of resources, availability of markets, and the fulfillment of needs. Therefore,
they are basically resource-based, market –based and need-based. Resource based
projects are more opportunities oriented with an intention to use various types of readily
available resources including human and physical resources. Market-based projects are
more demand oriented and leads to the production of goods and services for which a
market is readily available. Need-based projects are more issues/problems oriented in the
particular society, region, village; i.e. the felt needs of the community. However, most of
the projects have different components, which are developed through a combination of
approaches1.
2.2 Resource-Based Identification
Resource-based identification starts by examining existing domestic factors such as land,
labour, irrigation potential, raw materials and technical know-how. Generally,
comprehensive sector surveys and regional surveys should be conducted in order to
identify such projects. At the same time, it is also necessary to examine the production
potential, market potential (domestic and foreign), cost of production and the market
prices. Existing production capabilities, market for the out puts, by-products of the
present production systems usable for another production should also be examined to
identify new products.
Regional surveys are restricted to a particular geographical area, and cover existing and
possible activities and potential. They generally investigate aspects such as the total
population, demographical features, infrastructure facilities, existing economic activity
and production patterns, and utilized or under-utilized natural resources. As a whole, the
findings of such surveys reveal production and investment opportunities.
2.3 Market-Based Identification
1 Whatever the basis used for project identification, it would be necessary to analyze the situation and
relevant factors in the identification process. But there has been an instance where politicians and pressure
groups including donors have resulted in imperfect judgment, which may be due to a dependency on the
experience of other countries or the outcomes of incomplete or improper analysis or simply because of
vested interest.

15
The market-based approach starts from the study of the opportunities available for
processing goods that can be sold. The potential market could be domestic or foreign.
The identification is achieved by conducting market surveys. Briefly, market surveys
include the analysis of historical trends in demand and supply of particular commodities
and their projection into the future. For instance, import statistics generally are useful for
identification of import-substitution oriented industrial projects2.
2.4 Basic Need-based Identification
The need-based approach basically depends on the needs of the people and the society.
The poor members of the society may not have any purchasing power. Thus, the real
demand is not explicit. In addition, fulfilling the basic needs such as education, health,
shelter, drinking water, and staple food of the people is a key responsibility of the
government; therefore, projects are formulated to help provide such needs of the poor
people in the country.
Diagrammatically, the different approaches to project identification can be represented
follows:
Figure 5: Compact Summary of the Project Identification
2.5 Sources for Project Concepts/Ideas
2 In Sri Lanka, many such projects has been identified for implementation by the public sector institutions
before 1977, and thereafter mostly by private sector.
CONCEPTUALIZATION
Basic Needs
Development Strategies
International Comparison
Aid Donors
Past Projects
Unsystematic Sources
Pre-feasibility studies
Pre-feasibility proposal Abandonment
Regional Survey
Sector Survey
Resource-based survey
Market Survey

16
There are many sources from which project concepts can be merged. They can be
classified under the following five categories.
Technicians (Administrators/Managers and Sectoral Experts)
Usually the technical officers and administrators/managers of a specific sector are all well
aware of the issues, problems, opportunities and trends relevant to that sector. Therefore,
they are in a strong position to conceive project ideas in order to address the issues in
their sector. Hence, this category of people forms a very good source for the project
conception.
Planners and Policy Makers
In national planning, the planners and policy makers basically focus on macro issues at
national level and consider the disadvantages and expected contributions from each
sector and their inter-sectoral relationships. Generally, they use approaches and models
take from other countries by making certain modifications to suit local needs. Thus, these
groups of people both at national and local level are a very good source for project
concept ideas.
Entrepreneurs
With the globalization process and the concept of a global village, trade and business
have become a leading phenomenon. In the economic world, the private sector is
considered as the engine of growth, and therefore, business community is in a position to
influence the government with regard to policy and development directions3. As a result,
entrepreneurs and their expertise play a very significant role in project planning and are
an excellent source of project identification.
Political Leadership
In project planning as well as in appraisals, politicians play a major role at all levels.
Their direct intervention is more obvious at provincial, district and local authority levels.
At national level, politicians identify projects and investment programmes which are
being guided by national and sectoral policies. In Sri Lanka, at provincial level,
provincial council members (especially provincial ministers), identify projects on
considering the problems and opportunities for the economic and social development of
the province. At district level, especially with regard the projects of the Decentralized
Budget, parliamentarians identify projects to cater to the immediate development needs
of the people. At Pradeshiyashaba level, local politicians directly receive the project ideas
from the people at the grass root level by regarding their own needs where by small-scale
projects are identified, and then funded by any source. Hence, the participation of project
3 The private sector entrepreneurs are basically profit oriented by nature. Therefore, in as regards
financially viable projects of a business nature, there need to be a balance between the profits to the
investor and contribution to the country and people.

17
planning has become an important asset to the country. In fact, the participants involved
in politicians have become one of the major sources for project ideas and concepts.
Donors and Foreign Missions
In most projects/programmes donors also contribute by providing financial assistance
and/or technical assistance, on the basis of grants and/or concessionary loans. At times,
they also impose certain conditions such as “using their consultants as technical experts”
or “purchasing of vehicles, machinery and equipment from a specified source”. It is also
necessary to follow the guidelines of the donor agency for documentation and financial
accounting and cash reimbursements.
2.6 Priority Areas for Identification of Project Concept/Ideas
At present the main thrust areas to be considered for project identification are given
below:
- Creating employment
- Foreign exchange earnings or savings
- Promotion of private investment
- Income distribution
- Regional location
- Appropriate technology
All the projects that are identified should be linked to one or several of the above areas.
Therefore, some of them could be seen at the purpose level or impact level objectives of
any project.
Figure 6: Project Identification Process (flow chart)
Sources for Projects Pre-feasibility (done only for large & mega projects)

18
Note: This is an example which reflects the Investment Project Identification Process in
Sri Lanka.
NDP – National Planning Department
Source: Ministry of Plan Implementation United Nations Development Programme, Sri
Lanka Institute of Development Administration, 2001.
The project concept mentioned above in diagram 5 has to be submitted according to a
slandered format, which is known as the project concept format.
CHAPTER THREE: PROJECT PREPERATION
This is the second stage of the project cycle. After a project has been identified, various
preparatory works are undertaken to provide a conceptual outline to a proposed project.
The proper designing of a project takes place at this stage. Generally, detailed preparation
is done only if the project concept is accepted and the green light is given by the relevant
authorities and funding agencies.
Large and mega projects involving foreign or donor financing loans are some times
prepared by foreign experts at the consistence of a donor country with the assistance of
S
U
R
V
E
Y
S
F
O
R
C
E
S
Regional Surveys
Sector Surveys
Market Surveys
Resource Surveys
Need Surveys
People’ demands
Pressure groups
Global trends
Political interest
Vested interest
Political leaders
Policy makers
Planners
Technicians
Administrators
Managers
Donors
Foreign mission
P
R
O
J
E
C
T
I
D
E
A
S
Implementing Agency
and
Ministry
National priorities
Policy framework
Donor priorities
Political priorities
Market Technical Financial Economic Institutional Uncertainty
Environment
P
R
O
J
E
C
T
C
O
N
C
E
P
T
A
N
A
LY
S
I
S
N
P
D
19
home country experts in that sector or geographical area4. Generally in Less Developed
Countries (LDCs) almost all of the above mentioned projects are funded by foreign
sources. These experts are supposed to have a wide knowledge and experience in their
field. They use such expertise and prepare the project giving consideration to such
matters like funding the agency’s interest, local politicians’ aspirations, and the technical
opinion of local experts and to a limited extent, views of the beneficiaries. It is significant
that the experts’ bodies and the politicians should have a balanced say in project
formulation and acceptance. Financial institutions approve a project only when the
capacity for the repayment of loan is established. A project may be socially good but if it
cannot create enough surpluses for repayment, financial institutions would not like to
fund it.
Small and medium projects are prepared mostly by local experts, especially when the
government provides funds. Even in those projects, if foreign agencies provide funds it
becomes necessary at times to obtain the assistance or approval of foreign experts.
Different donors need different types of information and have different formats for a
project proposal.
3.1 The Steps
There are several important steps that have to be given due consideration in the process
of project formulation. This concerns designing a proposal which is technically,
operationally and financially feasible and economically viable. Generally the following
steps are involved in project formulation:
1. Evaluation of the Present System
4 In project management, specially at the appraisal and approval stage, the procedure adopted in Sri Lanka
is different according to the size of the projects, and therefore, projects are presently classified as follows.
Small Projects: the estimated total cost of these projects is less than Rs. 10,000,000/-. It is not permitted to
breakdown a project into separate components in order to classify it as a small project.
Medium Project: the estimated total cost of these projects is not less than Rs. 10,000,000/- and not more
than Rs. 40,000,000/-.
Large Projects: the estimated total cost of these projects is not less than Rs. 40,000,000/- and not more
than Rs. 100,000,000/-.
Mega Projects: the estimated total cost of these projects is more than Rs. 100,000,000/- . The two-stage
project approval process applies to these projects.
(for more details see, Management of Project Cycle: The Sri Lankan Experience, Ministry of Plan
Implementation, 2001).

20
The first step is the evaluation of the present system. In this step, development potentials
and the possible constraints are clearly and accurately identified in the relevant field
through analytical examination of the present system. It is an analytical process covering
all are important features which would have some bearing on the proposed project.
The availability of resources, administrative facilities, legal and institutional framework,
government policies and priorities and the potential demand for the goods and/or services
produced as outputs of the proposed project
2. Identify Relevant Policy Issues
The second step is the identification of the relevant policy issues. Main requirement at
this stage is the examination of relevant government policies and the assessment of their
impact on the proposed project. These issues may cover such matters as pricing policies,
subsidies, taxation, import duties, restrictions and concessions, charges etc.
3. Establishing the Project Rationale
The third step is the establishment of the project rationale. This step is essential as it
provides the overall justification for the country to understand the project and for the
funding institutions to support it. The relationship between the project purpose/impacts
and the development priorities/thrust areas should be established. Hence the
establishment of the ‘rationale’ is especially corporate to require funding.
4. Developing the Project’s Design and Concept
The fourth step is the development of the project’s design and concept. At this stage,
setting up of project objectives at various levels such as expected impact, purpose of the
project, outputs, and activities and inputs needs to be done carefully. Project strategies
should be determined in accordance with the project objectives at every level. It is
important that verifiable indicators, means of verification have to be identified. Potential
risks and assumptions should also be considered. Resource scheduling too needs to be
done. The concept and the design should be attractive to do the government and funding
agencies as well.
5. Setting the Project Scale
The next step in project formulation is the setting of the project scale. The degree of the
project in respect of the scale of production of goods and services geographical coverage,
size of physical construction works, number of beneficiaries is determined at this stage.
The factors such as availability of resources, administrative and technical capabilities, too
need to be covered at this stage.
6. Preparing Preliminary Cost and Benefits
The next covers the preparation of the preliminary cost and benefits. At this stage,
resources required for implementation of the project are scheduled and costs for the
procurement of such resources are estimated. Foreign resource requirements are indicated
separately. This information is important to decide the source of funding and the size of
foreign financial assistance.

21
7. Proposing the Organization and Management Structure
The next step is the figuring out of the organization and the management structure for the
project. Under this stage, the type of organization, management, technical and support
staff requirements are determined.
As an example, project screening and preparation process in Sri Lanka, can be described
as a flow chart (figure 6).
Figure 7: Project Screening and Preparation Process
Preliminary Screening Project Preparation
Note:
GCB – Government Coordinating Bureau
ERD – External Resources Department
NPD – National Planning Department
Source: Ministry of Plan Implementation United Nation Development Programme, Sri
Lanka Institute of Development Administration, 2001.
3.2 Project Preparation – the Logical Framework Approach and the Logical
Framework Matrix
P
R
O
J
E
C
T
C
O
N
C
E
P
T
N
P
D
G
C
B
E
R
D
Foreign funded
Large and Mega Project
Pre-feasibility Test
Medium Project
Small Project
Donor Agency
Concurrence
Cabinet
Cabinet
G
R
E
E
N
L
I
G
H
T
Evaluation of the present System Identify relevant
policy issues Establishing the project rationale Developing the project’s design and concept Setting the project’s scale
Preparing preliminary cost Estimates and benefits Proposing the organization and management structure Identify required
further activities
P
R
E
P
A
R
E
D
P
R
O
J
E
C
T
N
P
D

22
3.2.1 Introduction
Logical Framework was first developed by the United States Agency for International
Development (USAID) in 1970, to assist the evaluation of development projects. It has
since evolved in to a tool that facilities project design, management, monitoring, and
evaluation and has been adopted by many development agencies as a design, planning
and evaluation tool.
The Logical Framework Approach (LFA) is a specific strategic planning methodology
that can be used to prepare many different types of projects, including environmental
investment projects. The output of LFA is the Logical Framework Matrix (LogFrame).
The use of LFA is required by many international financing institutions (such as the
World Bank) and is obligatory for projects funded by EU financial assistance
programmes. In other words, each project proposal for EU financial assistance must be
presented in the form of a LogFrame. The reason for this is that LFA is a very useful
methodology for project design and preparation. A properly prepared LogFrame is an
easy-to-read summary of the project proposal, describing the key logical links and project
parameters.
The use of LFA to prepare a LogFrame is a group exercise, which:
Includes representatives of all stakeholders related to the given project proposal.
Is facilitated by a person familiar with the process.
Participants in an LFA process need not necessarily be familiar with LFA and the
LogFrame. The key thing is that the facilitator must be able to introduce the key concepts
of LFA to them. Very often, external consultants are hired as facilitators.
Logical Framework Approach is often confused with the Logical Framework Matrix.
LFA is a project preparation methodology, whereas the LogFrame is a document with a
special structure, produced at the end of the LFA process.
One common issue of LFA is to design the project first and to ‘fill in’ the Logical
Framework Matrix at the end. This is not recommended, as it defeats the whole purpose
of the logical framework and the design methodology.
3.2.2 LFA fulfils several functions:
It develops a structured set of project ideas by clarifying objectives and outputs.
It provides a clear, brief and logical description of the proposed project.
It helps to identify possible risks to project implementation.
It provides a useful basis for project appraisal.

23
LFA as a methodology can be applied to a variety of projects, from plans for compliance
with the Air Quality Framework Directive (for example) to classical investment projects.
3.2.3 Logical Framework Approach in Steps
The LFA process can be divided into the following five steps:
1. Situation analysis;
2. Stakeholder analysis;
3. Problem and objective analysis;
4. Analysis of alternatives;
5. Activity planning.
The five steps given above are usually an essential part of the strategic planning process
as discussed earlier. Once the six steps are completed, the project designers can prepare
the LogFrame.
3.2.4 Situation Analysis
This is a document that describes the problem or situation to be addressed by the
LFA process. The information source is basically a status quo report from the
strategic planning process. It could also be a status quo report from a feasibility
study, a pre-appraisal report, or a compilation intended specifically for the LFA.
The situation analysis is a task for an expert, often an external consultant.
3.2.5 Stakeholder Analysis
Stakeholder analysis is a document which comprises a more detailed analysis of the
people, groups, or organizations that may influence or be influenced by the problem
or a potential solution to the problem. The objectives of this step are to identify and
discuss the interest and expectations of persons and groups that are important to the
success of the project5.
5 Stakeholders: Individuals or institutions that may – directly or indirectly, positively or negatively –
be affected by or affect an Activity. Beneficiaries: Are those who benefit in whatever way from the implementation of the Activity. Distinction may be made between:
Target group(s): The group/entity who will be directly positively affected by the Activity at the Activity Outcome level. This may include the staff from partner organizations;
Final beneficiaries: Those who benefit from the Activity in the long term at the level of the society
or sector at large, e.g. “children” due to increased spending on health and education, “consumers” due to improved agricultural production and marketing.
Partners: Those who implement the Activity in-country (who are also stakeholders, and may be a

24
The stakeholder analysis is a task for an expert, often an external consultant.
3.2.6 Problem and Objective Analysis
Once identified, the stakeholder group should meet and conduct a facilitated discussion to
further identify and clearly state the primary or “focal” problem that needs to be resolved.
The group will then create a “problem tree”, which lists the so called “sub-problems” that
are related to or causes of the “focal problem.”
The next step is to reformulate all elements in the problem tree into positive, desirable
conditions – these are the objectives. It may then be necessary to revise the objective
statements and the relationships between objectives to ensure validity and completeness,
and to delete objectives which appear unrealistic or unnecessary and create new
objectives where necessary.
The basic questions that a problem analysis should answer are the following:
What is the main/focal problem that shall be solved with the aid of the project?
(Why is a change/a project needed?)
What are the causes of this problem? (Why does it exist?)
What effects does the problem have? (Why is it important to solve the problem?)
Who is affected by the problem and who “owns” the problem?
A problem analysis is sometimes made by drawing a so-diagrammatic problem tree
during a participatory workshop. The problem analysis is made by having the
stakeholders writing down the problems (causes and effects), which are related to the
subject. This procedure makes it possible to clearly visualize the causes of the focal
problem and its effects and to find out how different problems are related to each other.
(See example of a problem tree under the project identification part in this book)
As mentioned above, the causes of the problem shall be treated by the activities, which
will be implemented within the framework of the project. The effects are handled
automatically by treating the causes of the focal problem. Hence, no separate activities
are needed for handling the effects.
In the problem tree, the causes are the roots of the focal problem, which, in turn, is
symbolized by the trunk of the tree. The effects of the problem form the top of the tree.
The objectives should answer the following questions:
What shall the project contribute to achieving in the long run?
Why is the project important?

25
What are the long-term policy objectives to which the project will contribute?
(Overall Objectives)
What is the project-owner’s picture of the ideal situation? It is expected that the purpose
will be achieved as a direct effect of the project’s results. It clarifies why the target group
needs the project.
What is the focus of this project?
(Project Purpose)
Which different components/sub-goals is needed in order to achieve the purpose and the
overall objectives?
(Results)
Hence, the objectives are explanations of what the project is going to achieve in the short,
medium and in the long term.
The Problem and Objective Analysis is typically a facilitated workshop. The participants
shall represent all the stakeholders identified in the stakeholder analysis. The reports on
situation analysis shall be distributed to the participants beforehand as a basis for the
discussion.
3.2.7 Alternatives Analysis
The objective tree usually shows several possible strategies that can comprise a solution
to each sub-problem and to the focal problem. Since there is usually a limit to the
resources that can be applied to the project, it is necessary to examine these alternatives
and select the best one. To do this, decision-makers will first need to select criteria upon
which they can base the analysis. (This process will be similar to the one described in
Section 3.2, Priority Setting Mechanisms.).
This step is usually conducted by experts, based upon the set of criteria suggested by the
decision-makers (and consulted with the stakeholders).
3.2.8 Activity Planning
After defining the objectives and selecting a solution from a set of alternatives, the
detailed planning phase starts. The activities that are required to achieve each objective
are determined.
Activity Planning is generally done by a team of experts or external consultants.
3.2.9 Logical Framework Matrix (LogFrame)
The final step in the LFA is to create the LogFrame. As pointed out earlier, the
LogFrame is a document, which summarizes the results of the LFA process.

26
The Logframe has four columns and four rows. Its main purpose is to link the project
goals and objectives to the inputs, processes and outputs required to implement the
project. The general structure of the LogFrame is given in the following table:
Table 1: The General Structure of the LogFrame
Narrative
Summary
Objectively
Verifiable
Indicators
Information
Sources
Risks and
Assumptions
Wider Objective How to measure
wider objective
How to check the
measurement
What assumptions
are you making
Project Purpose
How to measure
immediate objective
How to check the
measurement
What assumptions
are you making
Outputs
How to measure
outputs produced
How to check the
measurement
What assumptions
are you making
Inputs/Activities
How to measure
inputs
How to check the
measurement
What assumptions
are you making
Column Headings
Narrative Summary: The text that "narrates" or describes the objectives.
Objectively Verifiable Indicators: The indicators, which demonstrate the ways in which
the goals, project purpose, outputs and input shall be achieved. The indicators answer the
following questions:
In what quality?
In which quantity?
By what time?
Indicators should be quantifiable wherever possible, but qualitative indicators may also
be used if necessary. In general, ideal indicators are:
Independent
Verifiable
Specific
Accessible
Sources of information: These specify the source of the information used to measure or
verify the indicators. For example:

27
Data from the air quality monitoring
Record on the issuing construction permit
Expert assessment
Risks and assumptions: These are important events, conditions, or decisions which are
necessarily outside the control of the project, but which are critical for the project
objective to be attained. For example:
Willingness of the households to connect to natural gas distribution system
Inflation rate
Row Headings
Wider Objective: The higher-level objective that the project is expected to contribute to;
this is the objective based upon the “focal problem” identified during the LFA. The
addition of the word "contribute' implies that this project alone is not expected to achieve
the wider objective.
Project Purpose: The anticipated effect that the project will achieve by delivering the
planned outputs. This should correspond to one of the objectives based upon the “sub-
problems” from the LFA. There is a tendency for this to be expressed in terms of a
"change in behaviour" of a group or institution; the project outputs are expected to
facilitate this change.
Outputs: The tangible results that the project management team should be able to
guarantee. Outputs are generally delivered within specified time frame.
Inputs/Activities: Inputs are the resources that the project "consumes" in the course of
undertaking the activities. Typically they will be human resources, money, materials,
equipment and time. The activities must be undertaken by the project to produce the
outputs. The activities take time to perform.
Vertical Logic
The vertical logic connects the three levels of objectives in the LogFrame – the outputs,
the purpose, and the goal. This means that:
Completion of the activities should lead to delivery of the outputs
Delivery of the outputs should lead to achievement of the project purpose
Achievement of the project purpose should contribute to the wider objective
Horizontal Logic

28
The horizontal logic is based upon the items in the risks and assumptions column. If the
risks can be mitigated and the assumptions hold true, then it can be expected that the
objectives, project purpose, outputs, and activities will be achieved and/or successfully
conducted.
Completion of the Logical Framework Matrix
The LogFrame Matrix is typically completed by a group of project designers – expert
consultants and the project promoters – who work in coordination with the stakeholder
groups. The process of placing the appropriate text in the boxes requires the group to
address many issues that may seem self-evident on the surface. However, in many cases
the process of developing these very specific answers exposes previously un-stated
assumptions and hypotheses, and forces the project designers to think in a new and more
careful way about what they are planning to do and why they are planning to do it. The
overall result is that the projects that are developed are more clearly thought out and truly
address the problems affecting an entire community in a manner that is feasible and
acceptable to community members6.
There are several basic rules to keep in mind when completing the LogFrame:
Begin with left column and work towards the right (narrative summary to risks
and assumptions)
Work from the top to the bottom - never the other way.
Leave the “risks and assumptions” column for last
If difficult, leave the “risk and assumptions” cell for the “wider objective”
Blank
CHAPTER FOUR: STAGES OF IMPLEMENTATION AND POST
EVALUATION
4.1 Implementation of the Project
Literature on ‘project identification’, ‘project preparation’ and ‘project appraisal’ is larger
extent but not so much on ‘project implementation’. Though, certain policy guidelines
about implementation can be identified as follows;
During the project identification stage, the stages of implementation must have
been simulated after careful considerations. It is believe that the simulation work
must have been as realistic as possible. During the implementation stage, it will
be necessary that all these stages of implementation should be completed within
6 The completion of the Logframe is time demanding exercise which should never be estimated. It is
recommended that representatives of all stakeholders involved in the project take part in it. It is also highly
recommended that an experienced facilitator/expert is used for leading the work on it.
29
the time schedule allotted. There should be minimum overlapping of the stages,
unless the overlapping was planned ex ante.
The second point to be kept in mind in the implementation stage should be the
realization of the physical targets during the time period contemplated. The output
stream should be the same as contemplated.
The third point of importance will be to complete the work within the funds
allotted. The physical targets are to be realized within the financial allocations. In
case of inflationary pressure, some adjustment will be necessary for which project
planners can not be blamed. Generally, during longer gestation periods lower
output and/or higher financial outlays are what cause inflation. This is the fault of
the central monitoring authority and the wings of government which look after the
financial (monetary and fiscal) management during the formulation stage.
The implementation machinery will have to realize the targets of capital-output
ratios, capital-labour ratios and labour-output ratios which had been contemplated
during the identification stage.
The management of the sinking funds (for the repayment of the loan that must be
taken for running the project) will be yet another important task of project
implementation
Those who implement the project must keep an eye on the changes in technology,
taste, cost-price structure, profitability etc.The labour management relations
should be kept on input procurement, productivity targets, over-fulfillment targets
(if any), transport and marketing aspects. The cash flow is to be managed so that
the liquidity does not suffer.
Ultimately profitability is to be so ensured so that reinvestment funds are
generated from within.
4.2 Project Evaluation
Post evaluation as a compulsory step in the project cycle has been a late addition and
came in to being largely because of the intervention by donors especially in lending
institutions.
Post evaluation is now being done by various stakeholders of the projects. In the early
stages the evaluation was mainly an output of the project. If the output has been achieved
the project was considered a success. Later, donors and lending agencies increasingly
started questioning whether the impacts of projects were commensurate with the
resources used, which are by definition scarce.
The improvement of the living standards of the beneficiaries was considered as a test of
the success of a project and value for money was sought in terms of the benefits received
from a project. In Sri Lanka, post evaluation of projects became a compulsory part of the
project cycle since the beginning of nineties7. After that, under the guidelines of the Post
Evaluation Unit and the Monitoring and Progress Review Division of the Ministry of
7 Government of Sri Lanka also considers the establishment of a “results based” monitoring and evaluation
system at the national level as an immediate priority.

30
Plan Implementation and Parliamentary Affaires, impact evaluations of projects are done,
on selective basis. For instance, some key lessons that have been learned with the post
evaluation experiences in Sri Lanka can be summarized as follows:
Since its inception in 1992, the Performance Evaluation Unit of the Monitoring and
Progress Review Division of the Ministry of Plan Implementation carried out impact
evaluation of 16 major projects. The key lessons learnt from these evaluations are8:
In terms of numbers, nearly 55-60% of the projects are either partially sustained
or not sustained at all
In terms of investments, nearly 70% of the investments are not sustained
Weak beneficiary consultation and poor design are the main causes for project
failures
Inadequate resources for operation and maintenance weaken project sustainability
Political considerations often compromised technical priorities of a project design
and contributed to the wrong site selections.
Poor EIA affected project performance
Some projects benefited the target population, but at a higher cost for the
executing agency.
Technical capacity of the executing agency was over-rated.
PART 2
2. Project Appraisal
CHAPTER FIVE: SOCIAL COST-BENEFIT ANALYSIS
Introduction
Immediately after the feasibility study the project has to be appraised. At this appraisal,
all the aspects that were introduced in the feasibility study will be looked at critically. For
instance, with respect to technical aspects, attention will be paid to whether alternatives
have been taken into consideration. The supply of inputs, the location of project site,
suitability of the land, have to be verified.
8 For more information see, Monitoring and Progress Review Division / Ministry of Plan Implementation,
Sri Lanka: Monitoring and Progress Review News; January-June, 2000.

31
In this section of the book there will be an introduction to the principles of socio-
economic appraisal of projects according to the technique of Cost-Benefit Analysis
(CBA) and a brief introduction to Cost Effectiveness Analysis (CEA). Cost Benefit
Analysis is the most common and well acknowledged technique for economic project
appraisal. The presentation in this task is mainly based on following a hypothetical
example through the various stages of analysis. The theory is kept to a minimum (many
scholars would probably say below the minimum) and the text does not require
knowledge in mathematics which is above standard secondary school level.
The root of the CBA, as a tool for decision-making, dates back to the United States Flood
Control Act of 1936. This act states that the principle behind the Flood-Control Project
should be regarded as desirable if “the benefits to whomsoever they may accrue are in
excess of the estimated costs”. What CBA aimed at, is simply to measure the costs
incurred and benefits obtained by everyone who is affected by a project, and find
out whether or not the benefits are greater than the costs. The CBA in this context,
should be understood as a logical method to organize information about social advantages
(benefits) and disadvantages (cost) in terms of a common monetary unit. Benefits and
costs are primarily valued on the basis of an individual’s willingness to pay (WTP) for
goods and services, marketed or not, as viewed through a social welfare ordering
representing the preferences of the relevant decision-maker9.
The CBA is closely related to the Cost-Effectiveness Analysis (CEA). This is used when
the benefits cannot be properly quantified, or when a goal has been put down on political
grounds. The CEA aims at finding the least cost means of achieving that goal. There are
several possible perspectives for a CBA of a project. The general cases are be classified
in to three groups:
- looking at a planned project in advance (ex-ante appraisal);
- looking at an operational un completed project (on-going evaluation);
- looking at a completed project (ex-post evaluation).
Today, the CBA is a popular tool among the governments in Developed Countries (DCs)
as well as Less Developed Countries (LDCs), and among the important international
institutions like the World Bank, the UNDP etc. Given the initial perspective, most CBAs
contain a sequence of analytical steps (principles) which are given below given below:
CHAPTER SIX: FIRST PRINCIPLE OF THE COST-BENEFIT
ANALYSIS: IDENTIFYING PROJECT
ALTERNATIVES
The main concepts of a project appraisal according to the technique of CBA can be
introduced using a hypothetical example:
9 In standard cost benefit analysis, the best alternative action is the one that gives the highest net present
value, that is the highest positive difference between the present value of all benefits and the present value
of all costs. In order to find these present values, future benefits and costs have to be discounted to time
zero (normally the start of the project) by using a social discount rate.

32
The case:
Let us assume that “KATN Steel Company Ltd.”, a private industrial enterprise in Sri
Lanka, requests the government for permission to develop a potential hydropower project
in order to start a new factory for steel production. The project is then considered by the
government. However, the government administrators get the idea that this hydropower
project should rather be developed by the parastatal electricity supply company (National
Power Supply Ltd.) for supplying power to the national grid. This gives us two
alternatives to consider:
Alternative 1: Let “KATN Steel Company Ltd.” develop the hydropower for their
own industry.
Alternative 2: Let “National Power Supply Ltd.” develop the hydropower for
supplying power to the national grid.
However, we should keep in mind that other than the above two alternatives, there is one
more alternative: to let the hydropower source remain as it is. This is the zero alternative
which means that will not be made as everything will be allowed to remain as it used to
be. Such an alternative is commonly called a zero-alternative:
Alternative. 0: Not to develop the hydropower project.
General Comments
There is no technique or rule to elaborate the number of alternatives to appraise. To some
extent, this has to be built on intuition and good judgment. Alternatives which are
obviously inferior should be ruled out before starting the appraisal. This is because an
analysis with very many alternatives will require a lot of spending, time, manpower and
data collection. As a general observation, project appraisals with more than 10
alternatives are rare.
THE PRINCIPLE OF COST BENEFITS
ANALYSIS - 1
Cost benefit analysis is a methodology for comparing
alternatives. There has to be more than one possible
action. One of the alternatives should be the zero-
alternative or “do- nothing-alternative”.
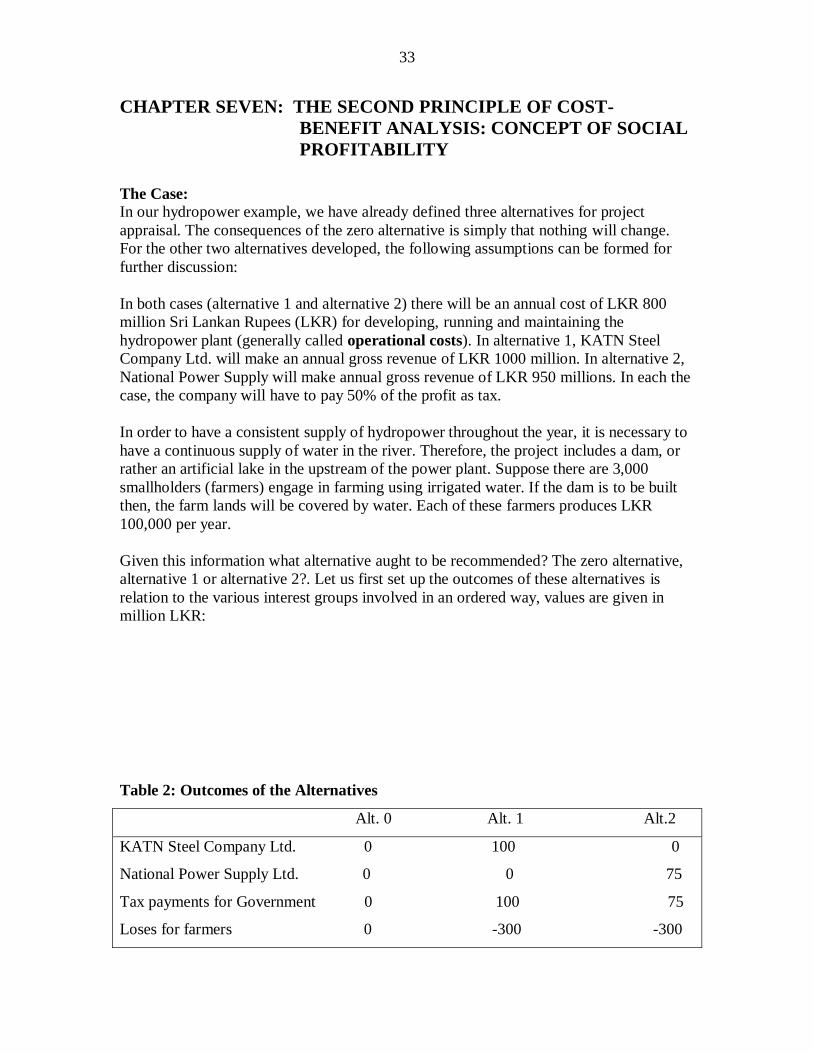
33
CHAPTER SEVEN: THE SECOND PRINCIPLE OF COST-
BENEFIT ANALYSIS: CONCEPT OF SOCIAL
PROFITABILITY
The Case:
In our hydropower example, we have already defined three alternatives for project
appraisal. The consequences of the zero alternative is simply that nothing will change.
For the other two alternatives developed, the following assumptions can be formed for
further discussion:
In both cases (alternative 1 and alternative 2) there will be an annual cost of LKR 800
million Sri Lankan Rupees (LKR) for developing, running and maintaining the
hydropower plant (generally called operational costs). In alternative 1, KATN Steel
Company Ltd. will make an annual gross revenue of LKR 1000 million. In alternative 2,
National Power Supply will make annual gross revenue of LKR 950 millions. In each the
case, the company will have to pay 50% of the profit as tax.
In order to have a consistent supply of hydropower throughout the year, it is necessary to
have a continuous supply of water in the river. Therefore, the project includes a dam, or
rather an artificial lake in the upstream of the power plant. Suppose there are 3,000
smallholders (farmers) engage in farming using irrigated water. If the dam is to be built
then, the farm lands will be covered by water. Each of these farmers produces LKR
100,000 per year.
Given this information what alternative aught to be recommended? The zero alternative,
alternative 1 or alternative 2?. Let us first set up the outcomes of these alternatives is
relation to the various interest groups involved in an ordered way, values are given in
million LKR:
Table 2: Outcomes of the Alternatives
Alt. 0 Alt. 1 Alt.2
KATN Steel Company Ltd. 0 100 0
National Power Supply Ltd. 0 0 75
Tax payments for Government 0 100 75
Loses for farmers 0 -300 -300

34
Total 0 -100 -150
In alternative 1, KATN Steel will have net a profit before taxes of LKR 200 million
(1000 – 800 = 200), but 50 per cent of the profit will be taxed by the central government.
In alternative 2, the electricity supply company will earn LKR 150 million (950 – 800 =
150), net profit and 50 per cent (LKR 75 Millions) will have to be payed as a taxes. In
both these cases, the farmers who are affected will loose their entire production worth of
LKR 300 millions (assuming 10 per cent worth of each farmer’s production loss every
year, and the total loss of agricultural production for 3000 farmers per year is, 0.1*3000 =
300).
Our attitude to this problem should be subjective and it should depend on our role as a
member of the society. If we are employees of KATN Steel Ltd., we would obviously
find alternative 1 attractive. If we are managers of the National Power Supply Ltd., we
would probably select alternative 2. Moreover, if we are members of the Farmers’ Union
(for example in Sri Lanka the Grama Sanwrdana Samithiya or the Govi Sanwardana
Samithilya) we would certainly prefer the zero alternative. However, in dealing with the
project appraisal using the CBA, we assume that we are merely advisers of the
government.
What should be the attitude of the government in this situation? If the government wants
to maximize its tax revenue, it would choose alternative 1. However, the National Power
Supply Ltd. is a parastatal and can thereby be seen as a part of the government sector
(semi government institution). In that case, if the government wants to maximize its
income (specially in the long run), it would select alternative 2. The government is,
however, not assumed to have any of these two goals. The general goal of the
government should be to maximize social welfare of the society. In that case, all benefits
and costs have to be taken into account, including the loss of the farmers. Consequently,
the total figures are what is relevant in a socio-economic analysis, and these figures are
negative for both alternative 1 and alternative 2 (LKR -100 and –150 millions
respectively). We should therefore advise the government to reject both project
alternatives, in other words, to choose the zero alternative.
General Comments
The difference between the Business Economic Analysis (or Financial Analysis) and the
Socio-Economic Analysis (often called Economic Analysis) can be explained using the
concept of external effects. An external effect is any consequence of a project that affects
somebody else other than the agent who runs the project. External effects will
consequently not appear in the accounts in the project-implementing unit. A Socio-
Economic Analysis includes the external effects, while a Financial Analysis does not10. In
the Financial Analysis, the cost and the benefits have to be examined in order to see
10 The Cost-Benefit Analysis provides a systematic means to itemize all benefits and all costs, much like a
Private Sector Investment Analysis. But because it deals with concerns of public policy, it must consider
classes of benefits and costs that are more far reaching than a business decision focusing only on net
profits.

35
whether all the components of the cost have been included. Capital cost, recurrent cost,
financial cost (interest) and contingencies are some of the aspects that need closer
examination.
Project promoters always tend to show lower costs and higher benefits. On the benefits
side, the income stream has to be correctly assessed. There may be a number of
assumptions built in to drive the stream of income of cash flow. On the basis of cash
outflows and inflows, the Financial Interest Rate of Return (FIRR) is calculated and if
this rate is above the discount rate the project can be considered as financially viable.
This financial analyses, shows us whether or not the project is viable purely based on a
commercial basis.
The public policy of any government aims at achieving two objectives: to improve
efficiency and to improve equity. A policy is said to be efficient if it maximizes the total
net benefits (benefits minus costs) available to a society, independent of who receives the
net benefits. Equity, on the other hand, is not concerned with the "size of the pie", but on
how the ‘pie’ is distributed among the members. The Cost-Benefit Analysis has
traditionally focused on efficiency providing policy makers with an indication of the
magnitude of net benefits associated with a particular project or policy. Although the
CBA is not specifically designed as a tool for evaluating equity, the cost-benefit analyst
should also track the distribution of costs and benefits among the various segments of
society.
In alternative 1, a financial analysis would include costs and revenues of “KATN Steel”.
In alternative 2, a financial analysis would include costs and revenues of National Power
Supply Ltd. In both cases, there is an external effect consisting of the loss of paddy
output due to the shortage of water. This effect needs to be included in a socio-economic
analysis.
A general recommendation in Resource Economics is to internalize external effects
(externalities)11, i.e. is to make sure that the one who implements a project will have to
compensate for negative external effects. In that case, the external effects become
internalized. Such costs will be included into the project account. In our example, it
would mean the need to force KATN Steel for choosing alternative 1 or National Power
Supply Ltd. for choosing alternative 2 to pay full compensation to the farmers (and
11 A useful definition of externality has been suggested by Baumol and Oates (1975, p. 17): “An externality
is present whenever some individual’s (say A’s) utility or production relationships include real (that is,
monetary) variables, whose values are chosen by others (persons, corporations, governments) without
particular attention to the effects on A’s welfare.” Externalities can be both positive and negative.

36
villagers). We can see that in such a case neither KATN Steel nor the National Power
Supply Ltd. would find the project profitable.
CHAPTER EIGHT: THE THIRD PRINCIPLE OF COST-BENEFIT
ANALYSIS: DISTRIBUTIONAL EFFECTS
The Case
According to table 1, the “total” row show the aggregate effect (that is the total effect of a
project alternative for all the interest groups) which are being affected. The other rows
shows the distributional effect, i.e. is how the aggregate effect is distributed between
various interest groups.
In this example, we have formulated the distributional effects in such a way that they
appear to be quite straightforward. Nevertheless, in many real life project appraisals,
large amounts of data are needed to calculate the distributional table given in Table 1.
General Comments
One may ask why we need to emphasize these distributional effects. In any case we
assume that the government’s decision is based on whether or not the total or aggregate
effects of a project alternative is positive or negative. However, there are at least two
good reasons that distributional effects should be estimated.
First, public projects should be exposed to the public for political discussions where
everyone concerned should be able to participate. Since the political process is to some
extent a struggle between conflicting interests. An analysis of distributional effects will
help in informing the people on how they will be affected by any given project proposal
and thereby give them a strong background for participating in the political process in a
meaningful way.
Second, when a limited number of people are badly affected by a given project, (as is the
case with the farmers in our example), the issue of compensations will always have to be
addressed by the decision-makers. The distributional analysis indicates the amount
money that will be required in order to give a reasonable compensation.
PRINCIPLES OF COST BENEFIT ANALYSIS
2
All costs and all benefits of a project should be
included, regardless of who is affected (including
enterprises, individuals, and the public/government
sector).
PRINCIPLES OF COST BENEFITS ANALYSIS
3
In addition to the aggregate effects the distributional
effects should be considered. In other words it will
demonstrate how different interest groups are affected

37
CHAPTER NINE: THE FOURTH PRICIPLE OF COST-BENEFIT
ANALYSIS: SOCIAL DISCOUNT RATE
The Case
The assumption have is that the costs have not been very realistic. It may seem
reasonable to assume the same gross revenue for each year within the project’s lifetime.
The cost of a typical investment project, however, consists of an investment at the
beginning of the project period and an annual operational and maintenance cost that are
assumed to be the same for each year.
Let us change our assumptions about the cost now. Instead of a total project cost of LKR
800 millions, we will assume an investment of LKR 4000 million and an annual
operational and maintenance cost of LKR 200 million. How can these costs be combined
to a common figure covering all the project costs within KATN Steel (alternative 1) or
the National Power Supply (alternative 2)?
In order to compare these two types of costs, first, we should consider the duration of
project. We assume that the project will continue as long as the facilities we have
invested in continue to be technically useful. This period is commonly referred to as the
project lifetime, or “planning horizon”. Hydropower development projects are known to
have a very long lifetime. In our example, we will assume the project life time is 50
years.
If we just add the investment cost and the annual operational and maintenance costs, we
get LKR 4000 million + (50* LKR 200 million) = LKR 14000 million. However, such a
simple addition does not make sense. What we have done (by simply adding) is to
assume that the cost or benefit of 1 LKR in 50 years time from now has the same value
for us as 1 LKR today. In other words, if we simply add costs and benefits from various
periods of time, we assume that we will be happy just getting back the same amount as
we had invested; that means a zero profit rate on the investment of capital. In order to
correct this issue we need a discount rate for discounting the future costs and benefits to
present value. The concept of social discount rate in order to emphasis that the discount
rate for socio-economic analysis may not be the same as the interest rates used in private
enterprises. The social discount rate to discount all future costs and benefits to present
value that means the value in year 0, which is the initial year in our analysis.
Assume the discount rate is 10% per annum. It implies a social profit rate of at least 10%
on public investments.

38
Investment for the hydropower project is assumed to take place in year 0. Consequently,
the investment should not be discounted. Our task is therefore to discount LKR 200
Million the amount paid each year for the next 50 years. Technically, we can calculate
the discounting factor and then multiply the amount of the future payment with the
discounting factor. The discounting factor for a single payment is:
D = nP)1(
1
,Where
D = Discounting factor (for single payment),
P = Discount rate,
n = The year that the payment takes place, counted from year 0.
This will give the following discounting factor for the first annual payment:
D = nP)1
1
=
1)10.01(
1
=
1.1
1 = 0.90909 ≈ 0.9091
By multiplying the discounting factor with the cost of LKR 200 millions, we will get:
LKR 200 million * 0.9091 = LKR 181.82 millions ≈ LKR 182 millions
It means that the present value of the LKR 200 million costs the first year will be LKR
182 million12. One can make similar calculations for each of the remaining 49 years.
Such calculation is not necessary. Instead, there is a formula for discounted annual
payment factor. This factor gives us the present value of an annual payment of 1 LKR per
year, each year starting from year 1:
Discounted annual payment factor:
DA = n
n
PP
P
)1(
1)1(
, Where
DA = Discounted annual payment factor
P = Discount rate
n = Number of years in which the payment will take place, assuming that
the first year of payment is year n =1.
In our case, we assume annual operational and maintenance costs to be the same each
year for the project’s lifetime of 50 years. That will give us the following discounted
annual payment factor with a 10% discount rate:
12 The process of accumulating interest through saving is called compounding; discounting is simply the
procedure in reverse.

39
DA = n
n
PP
P
)1(
1)1(
=
50
50
)10.01(10.0
1)10.01(
=
50
50
1.1*10.0
11.1 =
39.117*10.0
139.117 = 9.9148
When multiplying this discounting factor with our annual operational and maintenance
costs, we will get the present value of these annual costs:
LKR 200 million * 9.9148 = LKR 1982.96 million approximately LKR 1983 million.
In order to calculate the total investment and the annual cost, we simply add the
investment:
Table 3 – Present Value of Total Cost
The Present Value of annual operational and maintenance costs LKR 1983 million
Investment cost LKR 4000 million
Present value of total costs on the project site LKR 5983 million
Note that the tables are available so that we do not need to calculate discounting factors
each time when usage discounting.
General Comments:
The social discount rate can be explained as a time preference or a time value of money.
That is, if we have the choice between getting 1000 LKR today or a certain promise of
getting 1000 LKR in one year from now, we would prefer to get it at once. However, if
we have the choice between 1000 LKR today and a certain promise of 2000 LKR next
year, most of us would probably wait. In between these two extremes, we would be
indifferent about the choice. If we are indifferent about getting LKR 1000 today or LKR
1100 in one year from now, we have a time preference that can be expressed as a
discount rate of 10%.
On the other hand, the discount rate can be explained as an interest rate (or profit rate) on
invested capital. If we have a discount rate of 10%, it means that we require an interest of
at least 10% on investment in the government sector. If the investment is not socially
profitable, no one will invest in it. In general, the longer the time frame, and the higher
the discount rate, the smaller the impact of any given year on total net benefits will be.
PRINCIPLES OF COST BENEFITS ANALYSIS
4
All future effects are discounted to the Present Value (PV): that
is the value in year 0, by using the social discount rate.
Generally, 10% is used as the social discount rate.

40
CHAPTER TEN: THE FIFTH PRINCIPLE OF COST-BENEFIT
ANALYSIS: NET PRESENT VALUE (NPV)
The Net Present Value (NPV) of a project is the value obtained by discounting all cash
outflows and inflows at a chosen target rate of the return or the cost of capital and by
taking the net total (inflows minus outflows).
If the NPV is positive, then the cash inflows from the investment will yield a return in
excess of the cost of capital, and so the project should be undertaken.
If the NPV is negative, then the cash inflows from the investment will yield a return
below the cost of capital, and so the project should not be undertaken.
If the NPV is exactly zero, then the cash inflows from the investment will yield return
which is exactly the same as the cost of capital, so the company should be indifferent to
the choice of either between undertaking and not undertaking the project.
The Case
We will find the present value of all the project elements that were given in both
alternative 1 and alternative 2. We can define the cost and benefits in such a way that the
zero-alternative always remains zero for all effects. For the annual payments of fifty
years and the10% discount rate, the discounting factor of 9.9148 found in the previous
section can be used.
In alternative 1, “KATN Steel Ltd.” will have the following revenues and costs, all
counted as present values:
Table 4 – Revenue, Cost and Net Revenue of “KATN Steel Ltd.”
______________________________________________________________________
Gross revenue: LKR 1000 million / year * disc. factor 9.9148 = LKR 9915 mill.
Annual operational and maintenance cost:
LKR 200 million / year * disc.factor 9.9148 = LKR 1983 mill.
Investment cost = LKR 4000 mill.
Total cost = LKR 5983 mill.
Net revenue before tax LKR 3932 mill.
Tax (50% of net revenue) LKR 1966 mill.
Net revenue after tax LKR 1966 mill.
In alternative 2, the National Power Supply would have the following revenues and costs,
all as present values:
Table 5 – Revenue, Cost and Net Revenue of National Power Supply Ltd.
_______________________________________________________________________
Gross revenue: LKR 950 mill./year * disc. factor 9.9148 = LKR 9419 mill.

41
Annual operational and maintenance cost:
LKR 200 mill/year * disc. Factor 9.9148 = LKR 1983 mill.
Investment cost = LKR 4000 mill.
Total cost = LKR 5983 mill.
Net revenue before tax LKR 3436 mill.
Tax (50% of net revenue) LKR 1718 mill.
Net revenue after tax LKR 1718 mill.
The above tables show that the gross and net effect on KATN Steel, the National Power
Supply and on government revenue. What was forgotten is the impact on the farmers and
their production.
We assumed that they were loosing LKR 300 millions per year. However, rather than
assuming the project’s lifetime of 50 years, it seems realistic that the cropland will be lost
for ever. Can we find the present value of an annual payment for a crop land that had
been lost forever?
The answer is “Yes”. When n (the number of years in the calculation) grows beyond all
limits, the discounted annual payment factor will be:
Lim n
n
PP
P
)1(
1)1(
, =
P
1
n → ∞
In this case, with a10% discount rate, the discounted annual payment factor for the future
will be:
p
1 =
10.0
1 = 10. Consequently, the present value for the loss of the farmers is (LKR 300
million * 10) = LKR 3000 million
We are now in a position to add the present values of all the effects in order to get the net
present value13 for each alternative of project:
Table 6 – Net Present Values of Project Alternatives
Alt. 0 Alt. 1 Alt.
KATN Steel Ltd. 0 +1966 0
13 The main purpose of the CBA is to help select projects and policies which are efficient in terms of their
use of resources. The criterion applied is the Net Present Value (NPV)test. This simply asks whether the
sum of discounted gains exceeds the sum of discounted losses. If so the project can be said to represent an
efficient shift in resource allocation, given the data used in the CBA.

42
National Power Supply 0 0 1718
Government 0 +1966 1718
Farmers 0 - 3000 - 3000
Net present value 0 +932 + 436
As we can see, both alternatives have positive net present values. However, alternative 1
and alternative 2 require the same hydropower source, and therefore both cannot be
implemented. From what so far we have seen so far alternative 1 can be recommended
since it has the highest Net Present Value.
General comments: Two decision making criteria other than the NPV can be used in project appraisals:
Namely, the Benefit – Cost Ratio (BCR) and the Internal Rate of Return (IRR). Each has
its advantages and disadvantages and each requires to be used in a different way for
decision- making. However, where resource statements are drawn up using the same
information and assumptions these three criteria yield the same decision for a single
project.
Benefit / Cost Ratio (or B / C- ratio) is simply the ratio: Present Value of All Benefits
Present Value of All Costs`
Or, we can write
BCR =
t
t
tptC
tptB
)1/())((
)1/())((
Where
p is a rate of discount
t is the number of years from the base year, for each year of the project period
B(t) and C(t) are total benefits and total costs in year t
If the Net Present Value is positive (NPV>0), it means that the present value of all the
benefits is larger than the present value of all the costs. In this case, the Benefit / Cost
Ratio must be larger than 1, which is also the criterion for a socially beneficial project
according to the Benefit / Cost Ratio. The Benefit / Cost Ratio is sometimes used for
ranking different investment projects, with a positive net present value and in situations
where not all such projects can be implemented due to limited investment funds.
Following are the decision making rules of the BCR:
Where p represents the opportunity cost of resources, then the BCR can be used for
decision-making as follows:
At the discount rate P:
If BCR > 1.0, accept the project proposal

43
If BCR< 1.0, reject the project proposal
If BCR = 1.0, there will be no net effect whether the project proposal is accepted or not.
Internal Rate of Return (IRR) is the second decision making criteria often used in the
Financial Investment Analysis. First, we construct an equation by setting the Net Present
Value zero (see the following frame for explanation of the symbols): At this rate of
discount the discounted benefits equal the discounted costs, and therefore the NPV is
equal to 0. As the name implies, the Internal Rate of Return represents rate of return on
all the resources committed to a project. Formally, the internal rate of return is defined as
the rate of discount where:
n
NPV = ∑ t
tt
P
CB
)1(
= 0
t = 0
This equation can be solved for p. If p is higher than the social discount rate (or the
particular enterprise’s requirement for profit on its investment capital, in the case of a
financial analysis)14, we should select the project. The decision – making criterion using
the internal rate of return is
At the discount rate p:
If IRR > social discount rate (SDR), accept the project proposal
If IRR< social discount rate, reject the project proposal
If IRR = social discount rate, the project will have no net effect whether it is accepted or
not.
Equivalence of project criteria
The three project criteria described above will give the same project decision. Where the
BCR is greater than 1 at the given discount rate, the NPV will be greater than 0; and the
IRR will also be greater than the discount rate. Where the BCR is less than 1 at the given
discount rate, the NPV will be less than 0; and the IRR will also be less than the discount
rate. Formally
For a given discount rate p
If BCR>1.0, then NPV>0, and IRR>P ; accept the project
If BCR<1.0, then NPV<0, and IRR<P; reject the project
If BCR=1.0, then NPV=0, and IRR=P; the project will have no net effect whether it is
accept or reject.
14 In the financial analysis the discount rate represents the opportunity cost of capital. If a project is to be
accepted, it should generate an Internal Rate of Return in order to be consider as on alternative investments.

44
CHAPTER ELEVEN: THE SIXTH PRINCIPLE OF COST-BENEFIT
ANALYSIS: SHADOW PRICES
Shadow prices are the prices that cannot be observed in a market system, but need to be
calculated by the use of some sort of evaluation technique. Shadow prices are also known
as accounting prices. They are the imaginary prices which if established should equate
the demand and supply.
Shadow prices are not real or actual prices. They are used because real prices are not
considered “real” by the economists! Real or actual prices are considered as ‘unreal’ by
many economists and they are not considered as being equilibriating. The economists
point out that there are so many imperfections in the market, that the actual market prices
are not perfect competition prices. Shadow prices are those prices which would be
established if there is pure and perfect competition.15
The Case
Let us assume that there are some villages along the downstream of the river, and the
hydropower project site, uses villagers drinking water. In the case of project alternative 1,
which includes an industrial plant, from which the river will be polluted to the extent of
not being suitable for human consumption as drinking water. In the case of alternative 2,
there will be no industrial plant since only a power plant will be build. Consequently, the
river will not be polluted.
Clean water is not something that is bought and sold at the market place in the affected
area. Therefore, we do not have a market price for clean drinking water. Instead it is
possible to calculate the cost of compensation for the villagers by providing them with
clean drinking water as an alternative.
15 Shadow prices has also been defined as the price or cost equal to the opportunity cost of not being able to
use a unit of a factor of production. If one unit of scarce factor cannot be used, the loss will be high and its
shadow price will be high.
PRINCIPLES OF COST BENEFITS ANALYSIS
5
The most common decision making criterion is the Net Present Value (NPV).
The project is socially profitable if NPV > 0.
n
NPV = ∑ Bt – Ct / (1+p) t
t = 0
Where, Bt = benefits in the year t
Ct = costs in year in t
P = the social discount rate
n = planning horizon (= number of years considered in the appraisal)

45
There are two alternatives seem viable: to resolve this issue it is possible to construct a
pipe borne water system from the upstream of the river, of the industrial plant, leading it
to the villages and to introduce one or more water taps in each village. The other
alternative is to dig a well in each village. It could be assumed that the alternative of
digging wells may be the cheapest solution to compensate the villagers’ who loss
opportunity of utilizing the river water for drinking purposes. In this case, the provision
of wells could be the compensation and its cost could be the shadow price for the clean
drinking water. The cost for the construction of the wells should be included in the Cost
Benefit Analysis, despite the fact that such compensatory arrangements are actually
implemented or not. Even if the loss of the quality of drinking water is not compensated,
it should be included into the analysis because it is a true welfare loss to some members
of the society (of course, there may be strong political and ethical arguments that such
losses should be compensated by the one who develops a project, the government or a
private enterprise).
In our example, we shall assume that LKR 600 million is necessary to dig new wells for
all the villages that used to get their drinking water from the river.
We shall also give the welfare loss to the farmers a new interpretation. So far we assumed
that the farmers will lose their crop production for ever after the hydropower project.
There are several problems which emerge as a result of such an approach. We would
have to make a monetary valuation of crops that are cultivated in the home garden for the
purpose of consumption. It is reasonable to use market prices for the valuation of home
products at household level. What is more problematic, however, is the estimation of the
total production loss for ever. Furthermore, this approach ignores the fact that the
displaced farmers (and their sons or daughters) will probably be productive in other
sectors of the economy, or in peasant production in other areas.
It looks more realistic to base lost farming opportunities on what it would cost to
compensate for the loss of the farmers in the form of a single compensation in year 0.
That is to purchase new land, and to construct new houses at least of the same quality as
the houses that they had precisely occupied. From now on, we shall assume that LKR
3000 million is the cost of such a single compensation in year 0.
These assumptions will provide an adjustment to the Present Value calculation as given
below. As we can see, because of the loss of quality drinking water, alternative 2 greater
that alternative 1 has now come up as a better position in terms of present value.
Table 7: New Present Values of Alternatives
Alt. 0 Alt. 1 Alt. 2
KATN Steel 0 +1966 0
National Power Supply 0 0 +1718
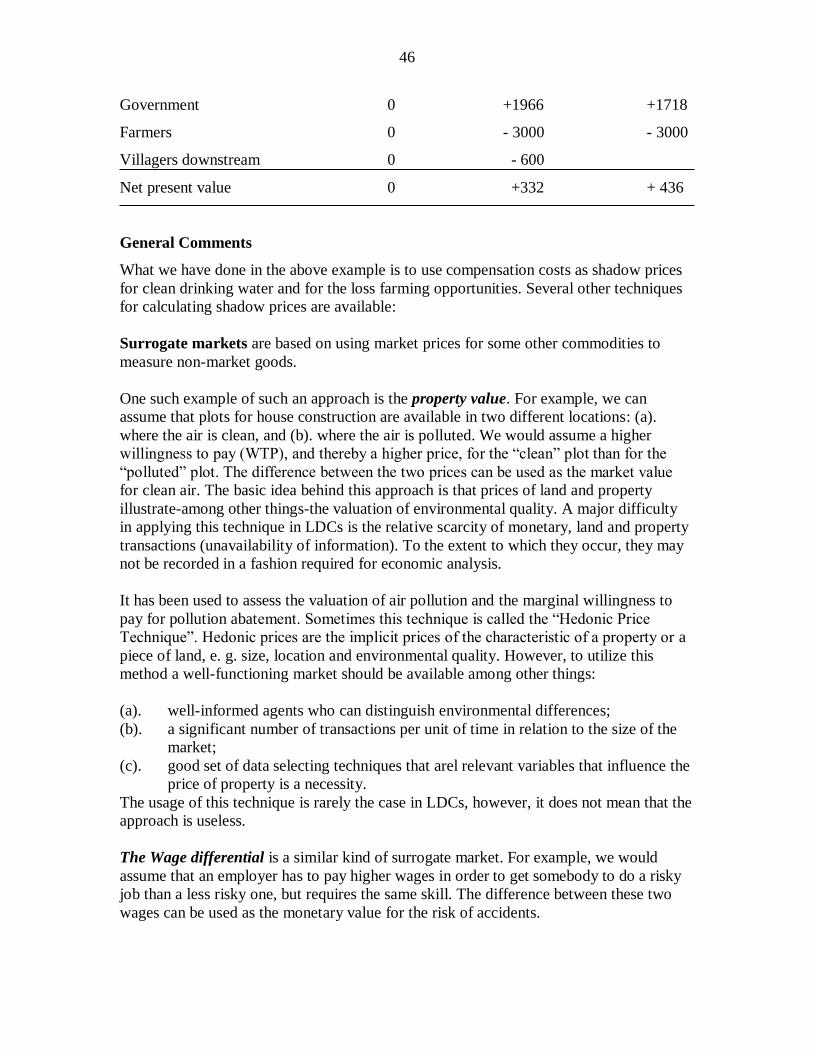
46
Government 0 +1966 +1718
Farmers 0 - 3000 - 3000
Villagers downstream 0 - 600
Net present value 0 +332 + 436
General Comments
What we have done in the above example is to use compensation costs as shadow prices
for clean drinking water and for the loss farming opportunities. Several other techniques
for calculating shadow prices are available:
Surrogate markets are based on using market prices for some other commodities to
measure non-market goods.
One such example of such an approach is the property value. For example, we can
assume that plots for house construction are available in two different locations: (a).
where the air is clean, and (b). where the air is polluted. We would assume a higher
willingness to pay (WTP), and thereby a higher price, for the “clean” plot than for the
“polluted” plot. The difference between the two prices can be used as the market value
for clean air. The basic idea behind this approach is that prices of land and property
illustrate-among other things-the valuation of environmental quality. A major difficulty
in applying this technique in LDCs is the relative scarcity of monetary, land and property
transactions (unavailability of information). To the extent to which they occur, they may
not be recorded in a fashion required for economic analysis.
It has been used to assess the valuation of air pollution and the marginal willingness to
pay for pollution abatement. Sometimes this technique is called the “Hedonic Price
Technique”. Hedonic prices are the implicit prices of the characteristic of a property or a
piece of land, e. g. size, location and environmental quality. However, to utilize this
method a well-functioning market should be available among other things:
(a). well-informed agents who can distinguish environmental differences;
(b). a significant number of transactions per unit of time in relation to the size of the
market;
(c). good set of data selecting techniques that arel relevant variables that influence the
price of property is a necessity.
The usage of this technique is rarely the case in LDCs, however, it does not mean that the
approach is useless.
The Wage differential is a similar kind of surrogate market. For example, we would
assume that an employer has to pay higher wages in order to get somebody to do a risky
job than a less risky one, but requires the same skill. The difference between these two
wages can be used as the monetary value for the risk of accidents.

47
Travel Cost Method
The Travel Cost Method is another surrogate market technique. This method is used to
estimate economic use values associated with ecosystems or sites that are used for
recreation.
The method can be used to estimate the economic benefits or costs resulting from:
changes in access costs for a recreational site
elimination of an existing recreational site
addition of a new recreational site
changes in environmental quality at a recreational site
The basic premise of the travel cost method is that the time and travel cost expenses that
people incur to visit a site represent the “price” of access to the site. Thus, peoples’
willingness to pay to visit the site can be estimated based on the number of trips that they
make at different travel costs. This is analogous to estimating peoples’ willingness to pay
for a marketed good based on the quantity demanded at different prices.
Let us consider the example of a national park, where value can be assessed on the basis
of how much money various people are willing to spend in order to travel there. This
method has been used extensively in the USA and to some extent in Europe in valuing
recreational assets. Examples from LDCs are so far rare. Under this method, it requires a
substantial set of data from a number of visitors, their origin, travel cost, entry fees etc.
This type of data may be available partially from existing visitors’ books but usually one
must contact visitors for more information.
The Hedonic Pricing Method
The Hedonic Pricing Method is used to estimate economic values for ecosystem or
environmental services that directly affect market prices. It is most commonly applied to
variations in housing prices that reflect the value of local environmental attributes.
It can be used to estimate economic benefits or costs associated with:
environmental quality, including air pollution, water pollution, or noise pollution
environmental amenities, such as aesthetic views or proximity to recreational sites
The basic premise of the Hedonic Pricing Method is that the price of a marketed good is
related to its characteristic, or the services it provides. For example, the price of a car
reflects the characteristics of that car-transportation, comfort, style, luxury, fuel economy,
etc. Therefore, we can value the individual characteristics of a car or any other good by
looking at the amount people are willing to pay for it in relation to the changes in the
amount when the characteristics change. The Hedonic Pricing Method is most often used
to value environmental amenities that affect the price of residential properties.

48
Survey based techniques which are based on questionnaires or similar means are used in
order get people to express their valuation of some non-market goods. In the search for
consumers’ willingness to pay, it is not always possible to make inferences from actual
beheviour. Instead, one may have to measure consumer preferences in hypothetical
situations or create artificial markets. This approach is often called the Contingent
Valuation Method. Generally, such surveys are based on the willingness to pay (WTP)
for a non-market good, or the willingness to accept (WTA) compensation for the loss of a
non-market good.
The strength of these methods is that it could be applied to a variety of situations where
no other data are available or it is difficult to find any. Usually, people do not only derive
direct values from the use of environmental assets. They may use an optional value to the
potential use of particular environmental service. In addition, they may account an
existing value to environmental services which are unrelated to their own actual or even
potential use. As there are commonly no markets for option and existence values, the
only way we can explore their significance is through the Contingent Valuation Method.
Hypothetical markets have been used to test individual valuation on water and air quality,
aesthetic beauty, recreational values, preservation of option farmland, existence values of
natural environments, disposal of hazardous waste, risk in relation to air travel, car travel,
cigareatte smoking and nuclear energy16. For more details about the environmental
valuation techniques see appendix 2.
CHAPTER TWELVE: THE SEVENTH PRINCIPLE OF COST-
BENEFIT ANALYSIS: NON-VALUED AND
NON-QUANTIFIED EFFECTS
In exploring all the possibilities given in different valuation techniques, which have been
given in the previous section in the direction of expressing all identified effects in
monetary values. In practical project appraisals; however, we normally end up with a
16 There are many difficulties pertaining to the use of hypothetical markets. However, these can to some
extent be statistically controlled and to some extent minimized though a careful survey design. The
appropriateness of these techniques will vary, depending on the purpose of the study.
PRINCIPLES OF COST BENEFITS ANALYSIS
6
Shadow prices are prices that cannot be observed in a
market. They are used in a valuation technique.
Shadow prices are used in two cases:
- To value effects that are not sold or bought.
- When market prices are highly misleading.

49
number of effects that cannot be quantified, or that can be quantified only by physical
indicators (like tons of soil loss, parts per million (PPM) of a poisonous discharge or
levels of noise measured in decibel).
The Case:
There are socio-economic and environmental effects of displacing farmers or polluting
the river that are not practically addressed by the compensation arrangements taken in the
above example. Also even though the pollutants from the river will not end up in the sea,
they will have a general negative impact on the global environment (global
environmental pollution). However, this impact is a general one in the sense that it can
not be easily identified as a loss to individuals.
In addition, we should not forget to consider the positive effects. As an example, we
assumed that digging new wells would compensate the loss of drinking water to the
villagers in the alternative 1. It is very likely that the water from the wells would be of
better quality, particularly when it comes to health effects, than the water used from the
river even without a project.
We should try to identify and describe all such effects if such effects are significant. The
effects can be summarized in the following table, where they are appraised according to
the following symbols:
+ + + = very beneficial effect
- - - = very negative effect
+ + = moderately beneficial effect
- - = moderately negative effect
+ = slightly beneficial effect
- = slightly negative effect
0 = no effect
Table 8 – Positive and Negative Effects by Hydropower Project
Effect Alt. 0 Alt. 1 Alt.2
Farmers: - Disutility of leaving ancestors’ land 0 - - - - - -
Villagers: - Lost swimming opportunities 0 - 0
- Improved water quality 0 + + 0
- Shorter distance to the water source 0 + 0
General: - More pressure on land when

50
- resettling farmers 0 - - - -
- Polluting of the sea 0 - 0
General comments:
Non-quantified effects of a project can generally be described as either social impacts or
environmental impacts. Analyses of such effects are called Social Impact Assessments
(SIA) and Environmental Impact Assessments (EIA), respectively. There are very few
generally accepted rules about how to design an impact assessment. A summary of an
impact assessment may look like the above. A general recommendation in project
appraisal is to make impact assessments in addition to finding the Net Present Value
according to the technique of the CBA.
According to one design of the Social Impact Assessment (SIA), it should deal with at
least four categories of impacts:
1. Demographic (e.g. population composition change in the hydropower
development site, population and labour movements – from the
development site to nother areas and within the area, displacement,
relocation etc)
2. Socio-economic impacts (e.g. income changes, changes in the
employment patterns).
3. Institutional (e.g. demands for local financial and administrative services –
New banks, and other government and non-government institutions)
4. Psychological and community factors (e.g. social network and integration)
Environmental Impact Assessment is originally developed and used in Northern America,
but its use in Third World Countries has been encouraged by several international
agencies, including the United Nations, the World Health Organization and the World
Bank.
Environmental Impact Assessment includes at least the following activities:
1. Identifying the dimensions of the environment which are likely to be
affected by a new project.
2. Identifying and predicting the impacts of the proposed project.
3. Analyzing and interpreting the impacts.
4. Displaying the results of the analysis and communicating these results to
decision makers.
The EIA17 specifies the impacts for the CBA to evaluate. One difficulty with this method
is that an ambitious analysis produces a mass of multi-dimensional information which is
17 EIA is closely related to Cost Effectiveness Analysis in that it too considers just the cost side of a project.
However, in this case only the environmental costs are relevant.

51
difficult to interpret for any one else other then the specialist. In response, ranking
procedures have been developed where different effects in different dimensions have
been given “scores”, that are supposedly commensurable. This takes the exercise into a
route directly leading to the CBA. The EIA is required for all projects with significant
adverse environmental impacts predicted at the preliminary clearance stage (Initial
Environmental Examination or Project Concept Format). EIA is usually conducted by a
team of expertise and the inputs can be used in quantifying and valuing environmental
impacts. For more information see appendix No.1. For more details about the EIA / SIA
procedures in Sri Lanka see appendix 1.
PRINCIPLES OF COST BENEFITS ANALYSIS
7
All effects of a project should be considered and, if
possible, quantified in monetary terms. Effects that cannot
be measured in monetary terms should be measured in
physical units. Effects that can neither be measured in
monetary nor physical units should still be expressed.

52
Table 9 - Methodologies Used in Selected EIAs in Sri Lanka
Environmental Impact
Assessments
Methods Applied
Checklists Matrices Networks
Simple Questionnaire Scaling Simple Graded
1. Rajawella Golf & Hotel
Project- Sep 1993
2. Kukule Hydropower
Project- Mar 1993
3.Colombo-Katunayake
Expressway Project-March
1992
4. Sapugaskanda BOO
Power Station Project-
Dec1993
5. Kerawalapitiya
Reclametion Project –Dec
1993
6. 200 bed room Hotel
Project at Seeduwa-April
1994
7. Aqua Pearl Villa-Hotel
Project at Bolgoda - 1996
8. Clay Extraction and
Blanketing of Samanalawewa
Reservoir for leakage
mitigation –July 1994
9. Upper Kothmale
Hydropower Project –Sept
1994
10. Sanitary Landfill at
Mahara & Transfer
Sanitation at Madampitiya
11. Wirawila Walk Inn
12. 250 r00med Hotel at
pothupitiya/Kudawaskaduwa-
+
+
+
*
+
+
+
+
+
+
*
*
-
-
-
-
-
-
-
-
-
-
-
-
-
+
-
-
-
-
-
-
+
-
-
-
-
+
+
+
+
-
-
+
-
-
+
+
-
+
-
-
-
-
-
+
-
-
+
+
-
-
-
-
+
-
-
-
-
-
-
-
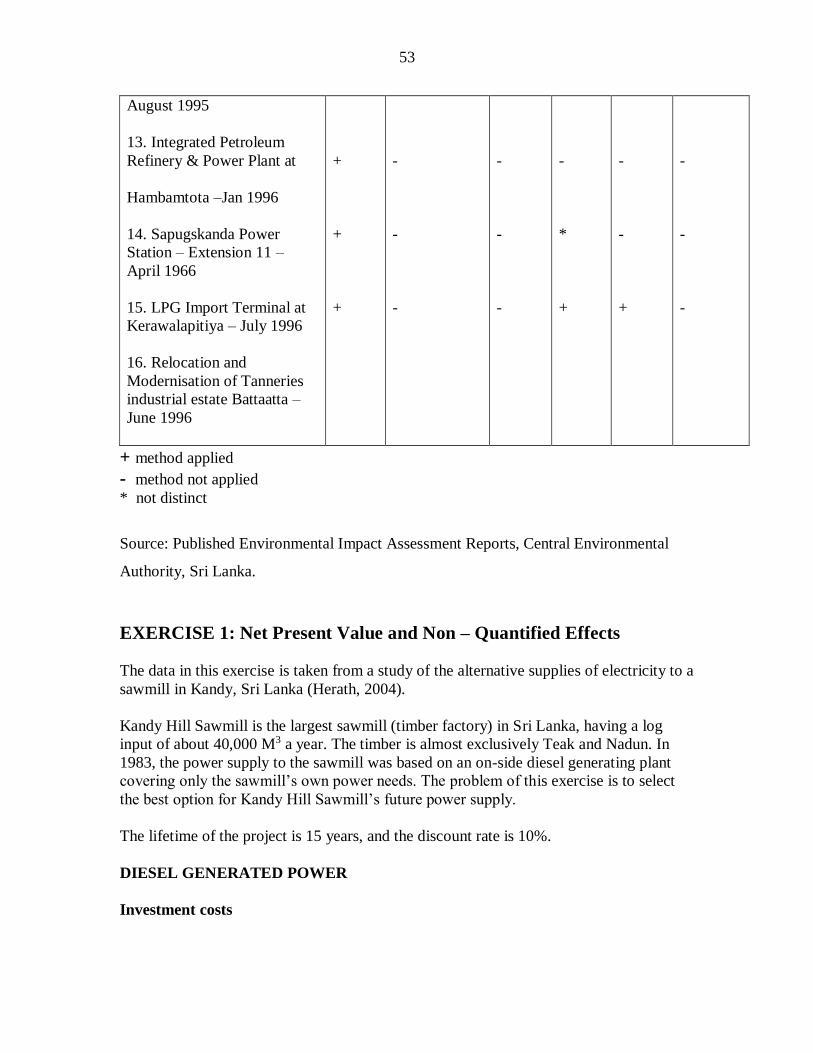
53
August 1995
13. Integrated Petroleum
Refinery & Power Plant at
Hambamtota –Jan 1996
14. Sapugskanda Power
Station – Extension 11 –
April 1966
15. LPG Import Terminal at
Kerawalapitiya – July 1996
16. Relocation and
Modernisation of Tanneries
industrial estate Battaatta –
June 1996
+
+
+
-
-
-
-
-
-
-
*
+
-
-
+
-
-
-
+ method applied
- method not applied * not distinct
Source: Published Environmental Impact Assessment Reports, Central Environmental
Authority, Sri Lanka.
EXERCISE 1: Net Present Value and Non – Quantified Effects
The data in this exercise is taken from a study of the alternative supplies of electricity to a
sawmill in Kandy, Sri Lanka (Herath, 2004).
Kandy Hill Sawmill is the largest sawmill (timber factory) in Sri Lanka, having a log
input of about 40,000 M3 a year. The timber is almost exclusively Teak and Nadun. In
1983, the power supply to the sawmill was based on an on-side diesel generating plant
covering only the sawmill’s own power needs. The problem of this exercise is to select
the best option for Kandy Hill Sawmill’s future power supply.
The lifetime of the project is 15 years, and the discount rate is 10%.
DIESEL GENERATED POWER
Investment costs
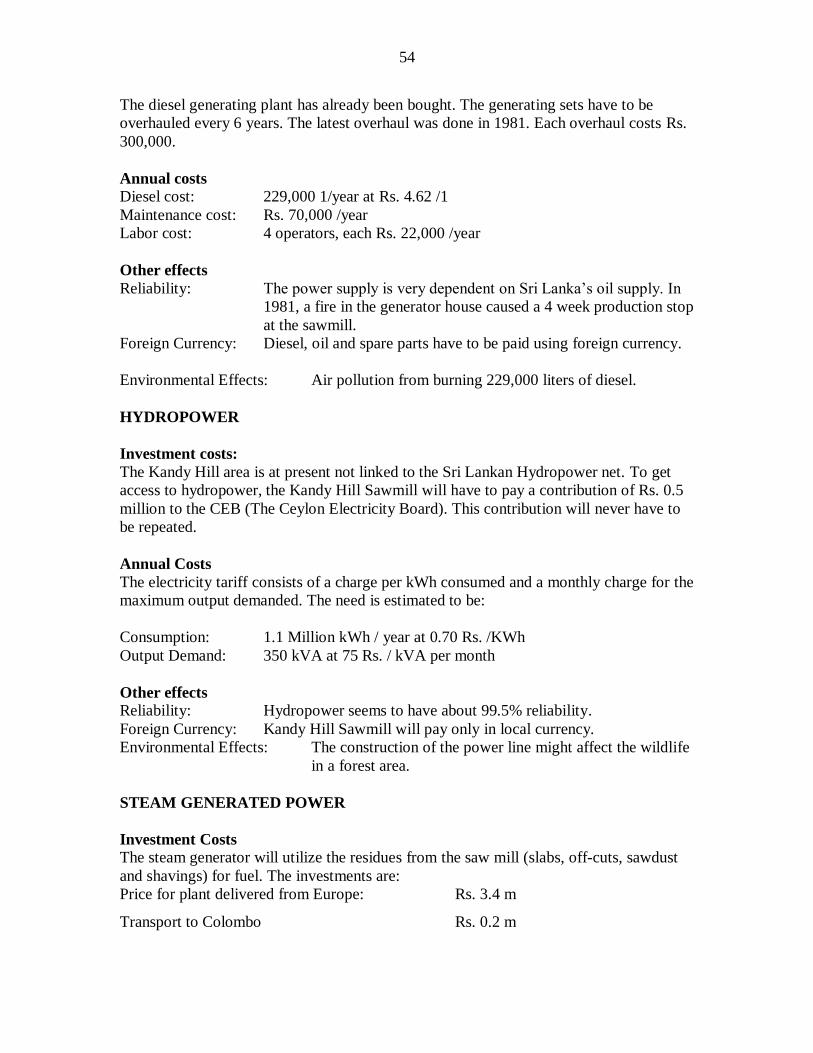
54
The diesel generating plant has already been bought. The generating sets have to be
overhauled every 6 years. The latest overhaul was done in 1981. Each overhaul costs Rs.
300,000.
Annual costs
Diesel cost: 229,000 1/year at Rs. 4.62 /1
Maintenance cost: Rs. 70,000 /year
Labor cost: 4 operators, each Rs. 22,000 /year
Other effects
Reliability: The power supply is very dependent on Sri Lanka’s oil supply. In
1981, a fire in the generator house caused a 4 week production stop
at the sawmill.
Foreign Currency: Diesel, oil and spare parts have to be paid using foreign currency.
Environmental Effects: Air pollution from burning 229,000 liters of diesel.
HYDROPOWER
Investment costs:
The Kandy Hill area is at present not linked to the Sri Lankan Hydropower net. To get
access to hydropower, the Kandy Hill Sawmill will have to pay a contribution of Rs. 0.5
million to the CEB (The Ceylon Electricity Board). This contribution will never have to
be repeated.
Annual Costs
The electricity tariff consists of a charge per kWh consumed and a monthly charge for the
maximum output demanded. The need is estimated to be:
Consumption: 1.1 Million kWh / year at 0.70 Rs. /KWh
Output Demand: 350 kVA at 75 Rs. / kVA per month
Other effects
Reliability: Hydropower seems to have about 99.5% reliability.
Foreign Currency: Kandy Hill Sawmill will pay only in local currency.
Environmental Effects: The construction of the power line might affect the wildlife
in a forest area.
STEAM GENERATED POWER
Investment Costs
The steam generator will utilize the residues from the saw mill (slabs, off-cuts, sawdust
and shavings) for fuel. The investments are:
Price for plant delivered from Europe: Rs. 3.4 m
Transport to Colombo Rs. 0.2 m

55
Marine insurance Rs. 0.1 m
Transport Colombo – Kandy Rs. 0.1 m
Installation, hook up Rs. 0.4 m
Building Rs. 0.2 m
Annual Costs
The fuel wood is at present burnt to get rid of it, and has no opportunity cost as a result of
present use. However, a paper mill which is able to utilize slabs, sawdust etc. is being
built in the area. According to qualified guesses, the paper mill will be able to pay Rs. 30
/m3 for the saw mill residues. The power plant is supposed to consume 4100m3 of
sawdust per year.
The maintenance cost is estimated to be 160,000 Rs. /year. The plant will need 7 workers.
The costs per employee (salaries, taxes, and social cost) are Rs. 22,000 /year
Other Effects
Reliability: Reliability is reported to be very high for steam generated power
Foreign currency: The investments will have local transport, installation and building.
Half of the maintenance cost is assumed to be in foreign currency
Envi. Effects: Air pollution from burning firewood.
Questions A. Make a project appraisal of the alternatives for Kandy hill Sawmill’s power supply.
B. Make a plus/minus –matrix for Non-quantified and Non-valued effects of the project.
Key to Exercise
A. Net Present Value Calculation
Zero-alternative: Diesel generated power
Investment:
Considering 1983 as the basis year, the amount of Rs. 300,000 has to be paid in year 4
and in year 10. Single payment discount factors with a 10% discount rate are 0.6830 and
0.3855, respectively.
Present value of overhaul in year 1987: Rs. 300,000 * 0.6830 = Rs. 204,900
Present value of overhaul in year 1993: Rs. 300,000 * 0.3855 = Rs. 115,650
Present value of total investment costs: = Rs. 320,550
________________________________________________________________________

56
Annual Costs:
Diesel: 229,0001/year * Rs. 4.62/1 = Rs. 1,057,980 / year
Maintenance: = Rs. 70,000 / year
Labour: 4 operators at Rs. 22,000 = Rs. 88,000 / year
Total Annual Costs: = Rs. 1,215,980 / year
The discounted annual payment factor for a 10% discount rate for over 15 years is
7.6061. Consequently:
Present value of annual costs: Rs. 1215980 * 7.6061 = Rs. 9248865
________________________________________________________________________
Present value of total costs, zero alternative = Rs. 9569415
______________________________________________________
Alternative 1: Hydropower
Investment costs:
Contribution to ECB = 500,000
Annual costs:
Consumption tariff:
1,100,000 kWh / year * Rs. 0.70 / kWh = Rs. 770,000 / year
Out put demand tariff:
350 kVA * Rs. 75 / kVA / month * 12 months = Rs. 315,000 / year
Total annual cost: = Rs. 1,085,000 / year
Present value of annual costs = Rs. 1,085,000 * 7.6061 = Rs. 8,252,619
________________________________________________________________________
Present value of total costs, alternative 1 = Rs. 8,752,619
________________________________________________________________________

57
Alternative 2: Steam Generated Power
Investment:
Price for plant delivered from Abroad: Rs. 3,400,000
Transport to Colombo Rs. 200,000
Marine insurance Rs. 100,000
Transport Colombo – Kandy Rs. 100,000
Installation, hook up Rs. 400,000
Building Rs. 200,000
Total investment costs Rs. 4,400,000
Annual cost:
Fuel, opportunity cost: 4100m3 * Rs. 30 / m3 = Rs. 123,000
Maintenance cost: = Rs. 160,000
Labour: 7 employees at Rs. 22,000 = Rs. 154,000
Total annual cost: = Rs. 437,000
Present value of annual cost: Rs. 437,000 * 7.6061 = Rs. 3,323,866
________________________________________________________________________
Present value of total cost: = Rs. 7723866
Based on cost minimization, alternative 2 (steam generated power) is best followed by
alternative 1 (hydropower) while the zero alternative (diesel) gives the most expensive
electricity.
B. Non-quantified effects can be arranged as a plus / minus – matrix, ranging from very
beneficial (+++) to very bad (---) effects. However, the number of “pluses” and
“minuses” in the following are based on a subjective assessment.
Table 10 – Plus –Minus Matrix for Non-Valued Effects
-----------------------------------------------------------------------------------------------------------
Zero-alternative: Alternative 1: Alternative 2:
Diesel generators Hydropower Steam generated power
------------------------------------------------------------------------------------------------------------
Reliability - - - + + + +
Foreign Currency - - ? -

58
Environmental impact - - -
Employment + + + +
------------------------------------------------------------------------------------------------------------
Conclusion:
The Diesel generated power is the most expensive one, and seems also to be inferior in
terms of non-quantified effects. Among the two other alternatives, one can hardly say that
one is clearly better than the other in terms of non-quantified effects. However, in terms
of quantified effects, the steam alternative is about a millions Rupees better in present
value. Consequently, I recommend that the steam generated power (alternative 2).
But we should have to keep in mind that we have not yet done a sensitivity analysis or
looked into the distributional effects……….
CHAPTER THIRTEEN: THE EIGHTH PRINCIPLE OF COST-
BENEFIT ANALYSIS: SENSITIVITY
ANALYSIS
Project appraisals deal with future costs and benefits, often many years out in to the
future. The future is always uncertain. In order to express the uncertainty quantitatively,
we can include a sensitivity analysis into our Costs Benefits Analysis. In the most
common form of Sensitivity Analysis, we change the input data could be changed in
order to see what kind of impact such changes will have on the net present value. In all ex
ante cases of the CBA, the analyst must make predictions concerning future physical
flows (for instance, traffic movements) and future relative values (for instance, the price
of fuel).
The Case:
We cannot be certain that our hydropower project has input data that really fit into the
future reality. When it comes to alternative 2, we might assume that the demand for
electricity on the domestic market leaves no reason to doubt that we will continue selling
at the price we have expected. In that case, we consider the revenue in alternative 2 not to
be sensitive. In alternative 1 the products have to be sold in an international market (since
the “KATN Steel” hopes to produce some goods in its own factory). The prices of
international markets often fluctuate. Investment and operational costs are also uncertain
to some extent, but in this case we have much more control of other than the domestic
market than the international markets. The actual loss to the farmers and the villagers is
not exactly known. These figures are based on judgments rater than market prices and are
therefore uncertain to certain extent. It would also be interesting to see the effects of a
higher discount rate and a lower discount rate than the one used above18.
18 In the common basis, the parameters can be changed including: the discount rate, physical quantities and
qualities of inputs, shadow prices of these inputs, physical quantities and qualities of outputs, shadow
prices of these outputs, and project life span.

59
Based on these considerations the following questions can be asked according to our
example:
- What will happen if the gross revenue is reduced or increased by 25%? (Only
alternative 1)
- What will happen if the annual operational and maintenance cost is reduced or
increased by 10%?
- What will happen if the investment is reduced or increased by 10%? (Both
alternatives)
- What will happen if the compensation to the farmers and villagers is reduced or
increased by 25%?
- What will happen if all the four input data mentioned above are changed in the
unfavorable direction at the same time?
- What will happen if the discount rate is reduced or increased by 3% (to 7% or
13%)?
These questions would produce answers that can be summarized in a table with the
following structure, by entering present values in million LKR into the open spaces:
Questions:
1). Do the sensitivity calculations and fill in all the empty spaces in the following
table.
2). Discuss the sensitivity of the project alternatives to changes in the assumptions,
based on the above table.
Table 11 – Sensitivity Analysis: NPV of the project alternatives under alternative
assumptions (millions LKR)
Alternative 1 Alternative 2
- + - +
Basic calculation + 332 + 436
Gross revenue ± 25% -2147 +2811 +436 +436
Operational costs ± 10% + 530 + 134 +634 +238
Investment costs ± 10% +732 - 68 +836 + 36
Loss for farmers and villagers ± 25% +1232 -568 +1186 - 314
All the four in adverse direction -3645 -912
Discount rate ± 3% +3441 -1460 +3351 -1244
Answers to the above questions
What will happen if the gross revenue is reduced or increased by 25%? (Only
alternative 1)
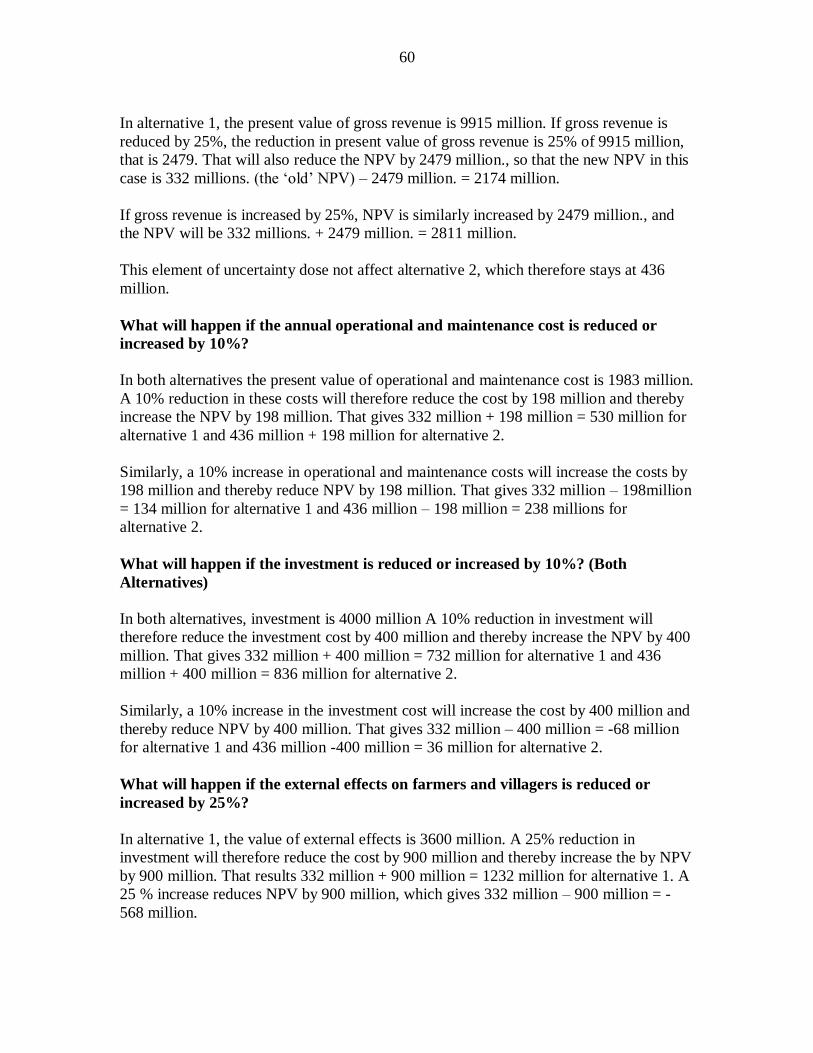
60
In alternative 1, the present value of gross revenue is 9915 million. If gross revenue is
reduced by 25%, the reduction in present value of gross revenue is 25% of 9915 million,
that is 2479. That will also reduce the NPV by 2479 million., so that the new NPV in this
case is 332 millions. (the ‘old’ NPV) – 2479 million. = 2174 million.
If gross revenue is increased by 25%, NPV is similarly increased by 2479 million., and
the NPV will be 332 millions. + 2479 million. = 2811 million.
This element of uncertainty dose not affect alternative 2, which therefore stays at 436
million.
What will happen if the annual operational and maintenance cost is reduced or
increased by 10%?
In both alternatives the present value of operational and maintenance cost is 1983 million.
A 10% reduction in these costs will therefore reduce the cost by 198 million and thereby
increase the NPV by 198 million. That gives 332 million + 198 million = 530 million for
alternative 1 and 436 million + 198 million for alternative 2.
Similarly, a 10% increase in operational and maintenance costs will increase the costs by
198 million and thereby reduce NPV by 198 million. That gives 332 million – 198million
= 134 million for alternative 1 and 436 million – 198 million = 238 millions for
alternative 2.
What will happen if the investment is reduced or increased by 10%? (Both
Alternatives)
In both alternatives, investment is 4000 million A 10% reduction in investment will
therefore reduce the investment cost by 400 million and thereby increase the NPV by 400
million. That gives 332 million + 400 million = 732 million for alternative 1 and 436
million + 400 million = 836 million for alternative 2.
Similarly, a 10% increase in the investment cost will increase the cost by 400 million and
thereby reduce NPV by 400 million. That gives 332 million – 400 million = -68 million
for alternative 1 and 436 million -400 million = 36 million for alternative 2.
What will happen if the external effects on farmers and villagers is reduced or
increased by 25%?
In alternative 1, the value of external effects is 3600 million. A 25% reduction in
investment will therefore reduce the cost by 900 million and thereby increase the by NPV
by 900 million. That results 332 million + 900 million = 1232 million for alternative 1. A
25 % increase reduces NPV by 900 million, which gives 332 million – 900 million = -
568 million.
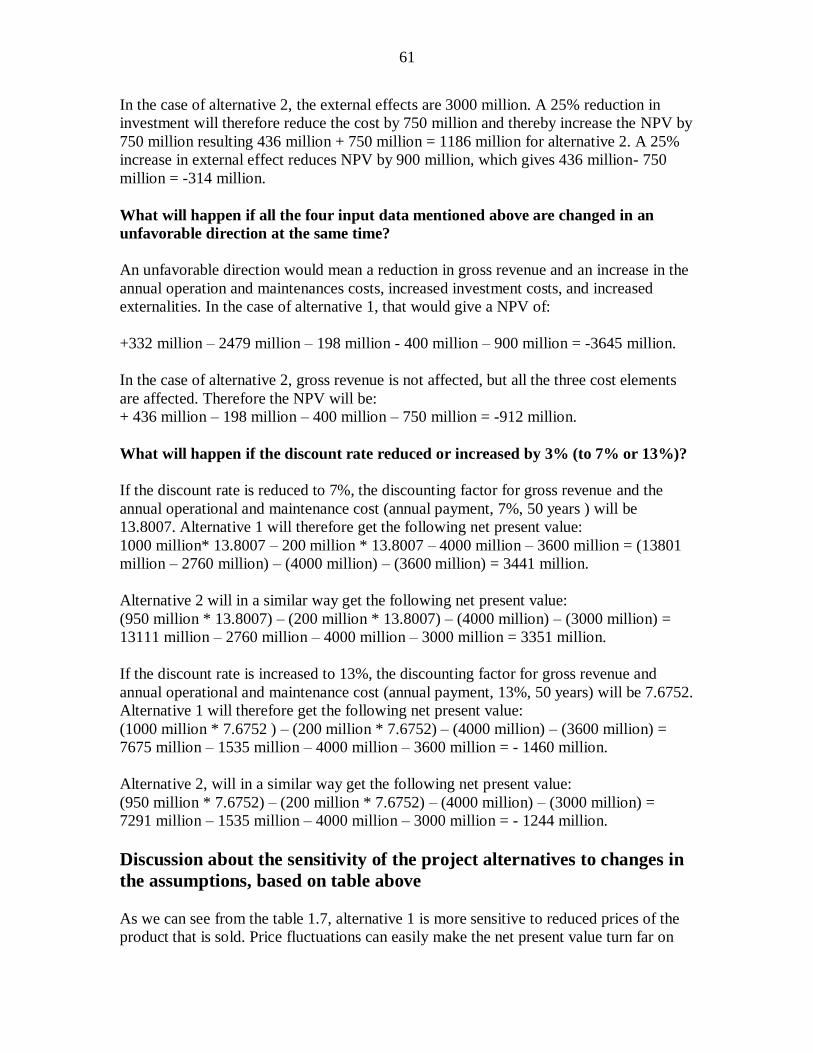
61
In the case of alternative 2, the external effects are 3000 million. A 25% reduction in
investment will therefore reduce the cost by 750 million and thereby increase the NPV by
750 million resulting 436 million + 750 million = 1186 million for alternative 2. A 25%
increase in external effect reduces NPV by 900 million, which gives 436 million- 750
million = -314 million.
What will happen if all the four input data mentioned above are changed in an
unfavorable direction at the same time?
An unfavorable direction would mean a reduction in gross revenue and an increase in the
annual operation and maintenances costs, increased investment costs, and increased
externalities. In the case of alternative 1, that would give a NPV of:
+332 million – 2479 million – 198 million - 400 million – 900 million = -3645 million.
In the case of alternative 2, gross revenue is not affected, but all the three cost elements
are affected. Therefore the NPV will be:
+ 436 million – 198 million – 400 million – 750 million = -912 million.
What will happen if the discount rate reduced or increased by 3% (to 7% or 13%)?
If the discount rate is reduced to 7%, the discounting factor for gross revenue and the
annual operational and maintenance cost (annual payment, 7%, 50 years ) will be
13.8007. Alternative 1 will therefore get the following net present value:
1000 million* 13.8007 – 200 million * 13.8007 – 4000 million – 3600 million = (13801
million – 2760 million) – (4000 million) – (3600 million) = 3441 million.
Alternative 2 will in a similar way get the following net present value:
(950 million * 13.8007) – (200 million * 13.8007) – (4000 million) – (3000 million) =
13111 million – 2760 million – 4000 million – 3000 million = 3351 million.
If the discount rate is increased to 13%, the discounting factor for gross revenue and
annual operational and maintenance cost (annual payment, 13%, 50 years) will be 7.6752.
Alternative 1 will therefore get the following net present value:
(1000 million * 7.6752 ) – (200 million * 7.6752) – (4000 million) – (3600 million) =
7675 million – 1535 million – 4000 million – 3600 million = - 1460 million.
Alternative 2, will in a similar way get the following net present value:
(950 million * 7.6752) – (200 million * 7.6752) – (4000 million) – (3000 million) =
7291 million – 1535 million – 4000 million – 3000 million = - 1244 million.
Discussion about the sensitivity of the project alternatives to changes in
the assumptions, based on table above
As we can see from the table 1.7, alternative 1 is more sensitive to reduced prices of the
product that is sold. Price fluctuations can easily make the net present value turn far on
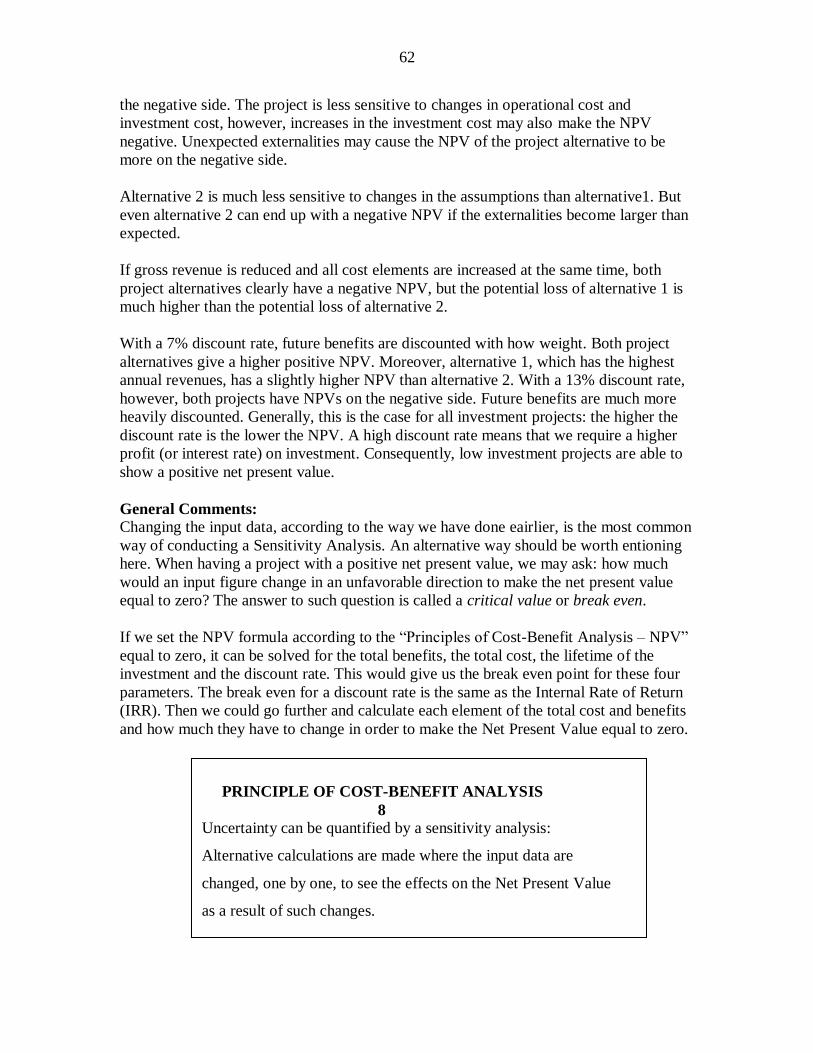
62
the negative side. The project is less sensitive to changes in operational cost and
investment cost, however, increases in the investment cost may also make the NPV
negative. Unexpected externalities may cause the NPV of the project alternative to be
more on the negative side.
Alternative 2 is much less sensitive to changes in the assumptions than alternative1. But
even alternative 2 can end up with a negative NPV if the externalities become larger than
expected.
If gross revenue is reduced and all cost elements are increased at the same time, both
project alternatives clearly have a negative NPV, but the potential loss of alternative 1 is
much higher than the potential loss of alternative 2.
With a 7% discount rate, future benefits are discounted with how weight. Both project
alternatives give a higher positive NPV. Moreover, alternative 1, which has the highest
annual revenues, has a slightly higher NPV than alternative 2. With a 13% discount rate,
however, both projects have NPVs on the negative side. Future benefits are much more
heavily discounted. Generally, this is the case for all investment projects: the higher the
discount rate is the lower the NPV. A high discount rate means that we require a higher
profit (or interest rate) on investment. Consequently, low investment projects are able to
show a positive net present value.
General Comments:
Changing the input data, according to the way we have done eairlier, is the most common
way of conducting a Sensitivity Analysis. An alternative way should be worth entioning
here. When having a project with a positive net present value, we may ask: how much
would an input figure change in an unfavorable direction to make the net present value
equal to zero? The answer to such question is called a critical value or break even.
If we set the NPV formula according to the “Principles of Cost-Benefit Analysis – NPV”
equal to zero, it can be solved for the total benefits, the total cost, the lifetime of the
investment and the discount rate. This would give us the break even point for these four
parameters. The break even for a discount rate is the same as the Internal Rate of Return
(IRR). Then we could go further and calculate each element of the total cost and benefits
and how much they have to change in order to make the Net Present Value equal to zero.
PRINCIPLE OF COST-BENEFIT ANALYSIS
8
Uncertainty can be quantified by a sensitivity analysis:
Alternative calculations are made where the input data are
changed, one by one, to see the effects on the Net Present Value
as a result of such changes.

63
CHAPTER FOURTEEN: THE NINETH PRINCIPLE OF COST-
BENEFIT ANALYSIS: INFLATION
The Case
Is our assumption fundamentally wrong? For example, we have assumed the annual
operational and maintenance costs to be 200 million LKR in year 1 and 200 million LKR
in year 50. The tendency of the general price level is that it tends to increase every year.
If the prices is LKR 200 million in year 0 and the price increases by 20% each year, the
price in year 50 would be 182009 million LKR! Is inflation a forgotten phenomenon in
our project evaluation?
The answer is “No”. Seemingly, we have assumed the same amounts in LKR every year.
What we have actually assumed is that only the cost and revenues will be inflated by the
same factor as other prices in the economy.
This means that we have used inflation adjusted (sometimes called real or constant)
prices. We can safely use inflation-adjusted prices as long as we are also able to use an
inflation adjusted (or real) interest rate. The social discount rate is an example of such a
real interest rate. Inflation adjustment is the reason why the discount rate is as low as
10%, while the bank rates or lending rates in developing countries tend to be higher
(including in Sri Lankan Commercial Banks). The interest rate in the banks has take into
consideration inflation, (that means the nominal interest rates). The social discount rate,
however, is used for discounting inflation adjusted rate of interest. We will show the
difference between nominal and inflation-adjusted prices and interest rates by a simple
example:
Let us assume a payment of LKR 1000 per year in inflation-adjusted prices (which has
always been our assumption up to now) each year in year 1 – 3. If we want to find the
present value, we use our usual discount factor of 10%. The discounted annual payment
factor according to the table is 2.4869. The present value is thereby:
DA = n
n
PP
P
)1(
1)1(
=
3
3
)1.1(1.0
1)1.1( = 2.4869
Therefore the NPV is,
NPV = LKR 1000 * 2.4869 = LKR 2486 .9
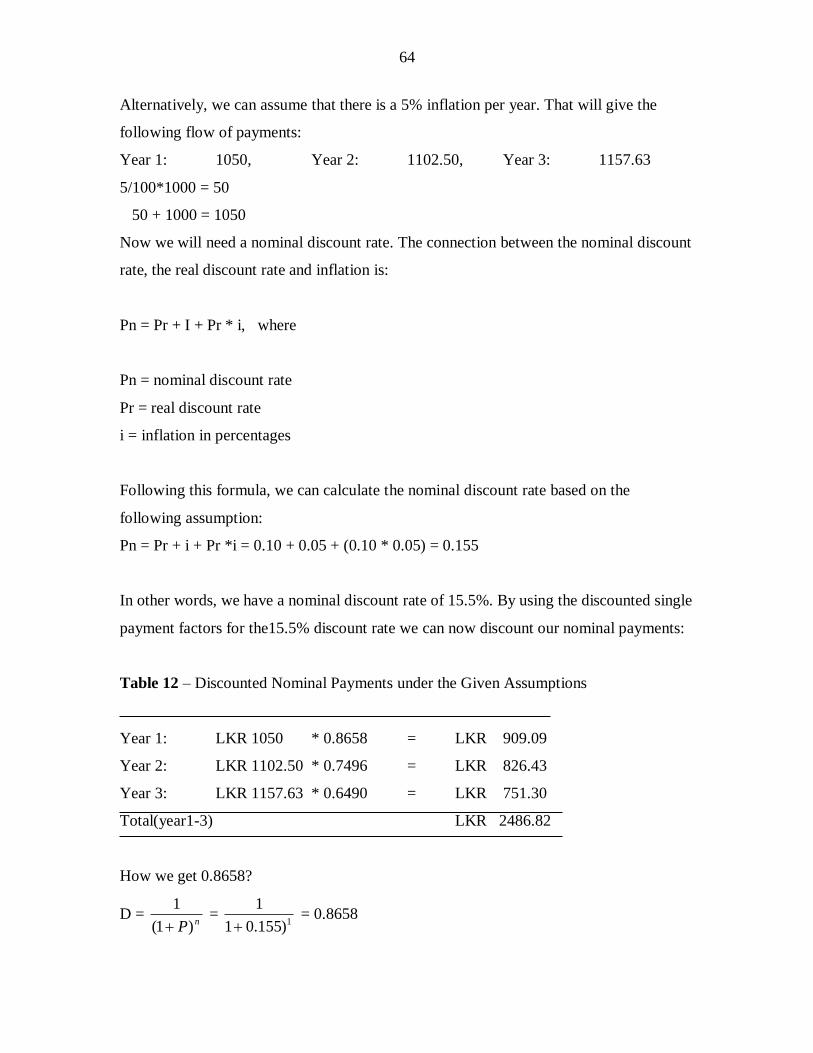
64
Alternatively, we can assume that there is a 5% inflation per year. That will give the
following flow of payments:
Year 1: 1050, Year 2: 1102.50, Year 3: 1157.63
5/100*1000 = 50
50 + 1000 = 1050
Now we will need a nominal discount rate. The connection between the nominal discount
rate, the real discount rate and inflation is:
Pn = Pr + I + Pr * i, where
Pn = nominal discount rate
Pr = real discount rate
i = inflation in percentages
Following this formula, we can calculate the nominal discount rate based on the
following assumption:
Pn = Pr + i + Pr *i = 0.10 + 0.05 + (0.10 * 0.05) = 0.155
In other words, we have a nominal discount rate of 15.5%. By using the discounted single
payment factors for the15.5% discount rate we can now discount our nominal payments:
Table 12 – Discounted Nominal Payments under the Given Assumptions
Year 1: LKR 1050 * 0.8658 = LKR 909.09
Year 2: LKR 1102.50 * 0.7496 = LKR 826.43
Year 3: LKR 1157.63 * 0.6490 = LKR 751.30
Total(year1-3) LKR 2486.82
How we get 0.8658?
D = nP)1(
1
=
1)155.01
1
= 0.8658
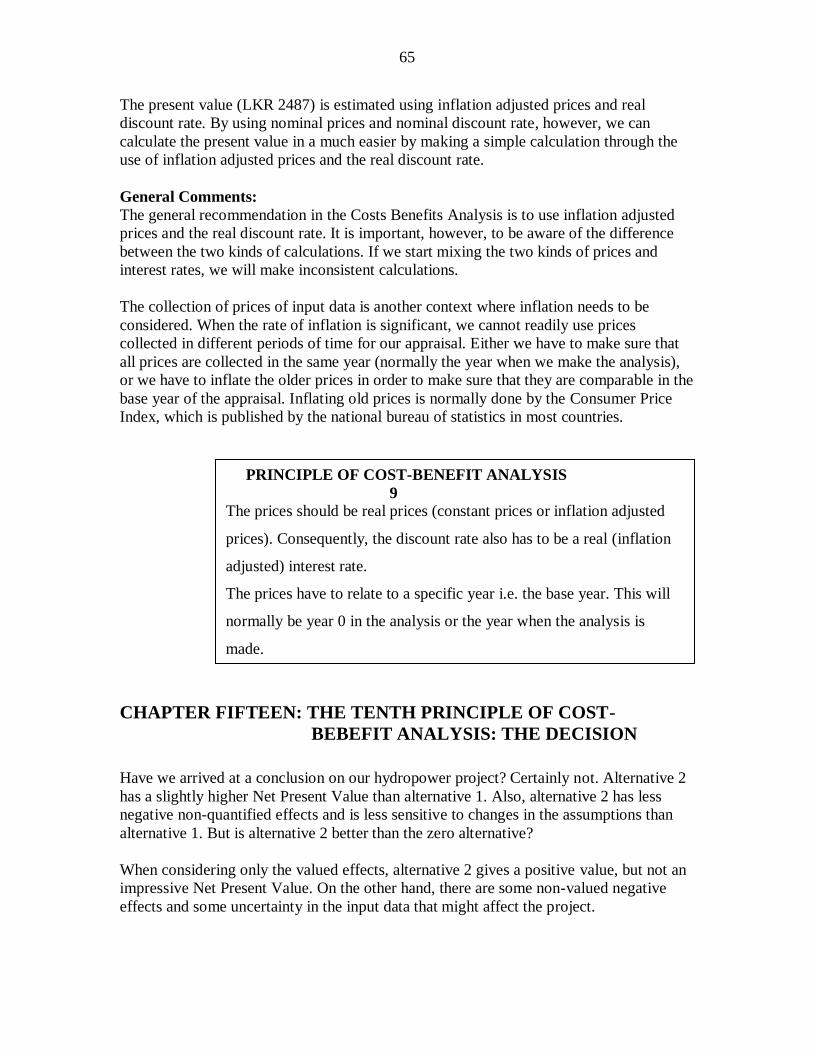
65
The present value (LKR 2487) is estimated using inflation adjusted prices and real
discount rate. By using nominal prices and nominal discount rate, however, we can
calculate the present value in a much easier by making a simple calculation through the
use of inflation adjusted prices and the real discount rate.
General Comments:
The general recommendation in the Costs Benefits Analysis is to use inflation adjusted
prices and the real discount rate. It is important, however, to be aware of the difference
between the two kinds of calculations. If we start mixing the two kinds of prices and
interest rates, we will make inconsistent calculations.
The collection of prices of input data is another context where inflation needs to be
considered. When the rate of inflation is significant, we cannot readily use prices
collected in different periods of time for our appraisal. Either we have to make sure that
all prices are collected in the same year (normally the year when we make the analysis),
or we have to inflate the older prices in order to make sure that they are comparable in the
base year of the appraisal. Inflating old prices is normally done by the Consumer Price
Index, which is published by the national bureau of statistics in most countries.
CHAPTER FIFTEEN: THE TENTH PRINCIPLE OF COST-
BEBEFIT ANALYSIS: THE DECISION
Have we arrived at a conclusion on our hydropower project? Certainly not. Alternative 2
has a slightly higher Net Present Value than alternative 1. Also, alternative 2 has less
negative non-quantified effects and is less sensitive to changes in the assumptions than
alternative 1. But is alternative 2 better than the zero alternative?
When considering only the valued effects, alternative 2 gives a positive value, but not an
impressive Net Present Value. On the other hand, there are some non-valued negative
effects and some uncertainty in the input data that might affect the project.
PRINCIPLE OF COST-BENEFIT ANALYSIS
9
The prices should be real prices (constant prices or inflation adjusted
prices). Consequently, the discount rate also has to be a real (inflation
adjusted) interest rate.
The prices have to relate to a specific year i.e. the base year. This will
normally be year 0 in the analysis or the year when the analysis is
made.
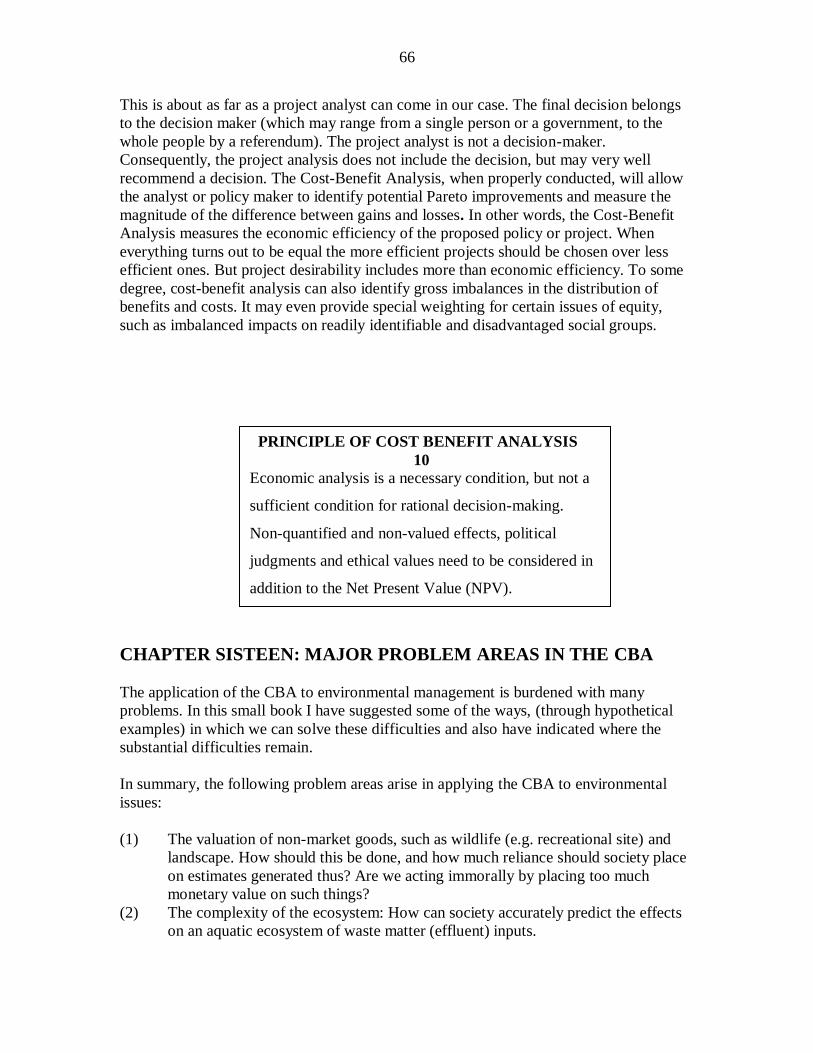
66
This is about as far as a project analyst can come in our case. The final decision belongs
to the decision maker (which may range from a single person or a government, to the
whole people by a referendum). The project analyst is not a decision-maker.
Consequently, the project analysis does not include the decision, but may very well
recommend a decision. The Cost-Benefit Analysis, when properly conducted, will allow
the analyst or policy maker to identify potential Pareto improvements and measure the
magnitude of the difference between gains and losses. In other words, the Cost-Benefit
Analysis measures the economic efficiency of the proposed policy or project. When
everything turns out to be equal the more efficient projects should be chosen over less
efficient ones. But project desirability includes more than economic efficiency. To some
degree, cost-benefit analysis can also identify gross imbalances in the distribution of
benefits and costs. It may even provide special weighting for certain issues of equity,
such as imbalanced impacts on readily identifiable and disadvantaged social groups.
CHAPTER SISTEEN: MAJOR PROBLEM AREAS IN THE CBA
The application of the CBA to environmental management is burdened with many
problems. In this small book I have suggested some of the ways, (through hypothetical
examples) in which we can solve these difficulties and also have indicated where the
substantial difficulties remain.
In summary, the following problem areas arise in applying the CBA to environmental
issues:
(1) The valuation of non-market goods, such as wildlife (e.g. recreational site) and
landscape. How should this be done, and how much reliance should society place
on estimates generated thus? Are we acting immorally by placing too much
monetary value on such things?
(2) The complexity of the ecosystem: How can society accurately predict the effects
on an aquatic ecosystem of waste matter (effluent) inputs.
PRINCIPLE OF COST BENEFIT ANALYSIS
10
Economic analysis is a necessary condition, but not a
sufficient condition for rational decision-making.
Non-quantified and non-valued effects, political
judgments and ethical values need to be considered in
addition to the Net Present Value (NPV).

67
(3) The discount rate and the way of discounting: Should society discount? If so,
what rate should be used? Does discounting violate the rights of the future
generation?
(4) Institutional capture: is the CBA a truly objective way of making decisions, or can
institutions use it for their own ends?
(5) Uncertainty and irreversibility. How will these aspects be included in a CBA?
Summary
The Social Cost-Benefit Analysis is an analytical tool for social appraisal of projects,
which is equivalent to financial decision making in the private sector, which is modified
to take into account the broader set of benefits and costs including environmental effects
of a project the public policy maker must address. It calculates the present value of net
costs and benefits indicating the decision that obtains the greatest benefit at the least cost.
The Cost-Benefit Analysis provides a lot of useful information to the political process,
but it should not be used as a one dimensional test of desirability. The other decision
making concerns include sustainability, equity, and other social values.
A project appraisal cannot always tell the decision-maker what to do. However, a good
project appraisal will always clarify the consequences of the possible choices and thereby
form a sound basis for rational decision-making.
CHAPTER SEVENTEEN: COST EFFECTIVENESS ANALYSIS OF
DEVELOPMENT PROJECTS IN LOW
INCOME COUNTRIES
Introduction
In appraisal as well as in the evaluation of development projects, there is a need to ask
whether or not the project’s achievements could be reached at lower costs by alternative
projects or project designs. Asking that question is a necessary condition for improving
development projects in the sense of achieving more within the limited budgets that are
available. The Cost Effectiveness Analysis is an appraisal technique designed to answer
these kinds of questions.
The Cost Effectiveness Analysis is widely used in various sectors of society. The most
extensive use of the technique seems to be in health care (e.g. Borus et al. 1982, Bonsel et
al. 1993, Haycox 1994, French 1995, Windsor et al. 1988), but many analyses have also
been made within the environmental policy (e.g. Heatwole et al. 1987, Park and Sawyer
1987, Berger and Johnsen 1989, Mc Sweeney 1990, Johnsen 1993). The other fields of
public decision making where the Cost Effectiveness Analysis is in use include education
(Fielding 1995, Levin 1970), the tax policy analysis (Feldstein and Feenberg 1995),
defense (Wisskirchen 1994), energy supply (Bemis and Angelis 1990) and social security
issues like income redistribution (Prinz 1989) and public housing (Morral and Olsen
1980).
68
In spite of its extensive use, the theory behind the Cost Effectiveness Analysis is mostly
dealt with only in sub-chapters of textbooks with the main emphasis being that on the
Cost Benefit Analysis (e.g. Brent 1997 pp. 14-16, Gramlich 1981 pp. 123-133,
Hufschmidt et al. pp. 272-285). The reason for this seems to be that authors in the Cost
Benefit Analysis tend to regard Cost Effectiveness as something to be applied when one
fails to make a full cost benefit analysis. Such a “failure” is normally regarded as a result
of methodological problems in monetary quantification of non-market goods. Thus, cost
effectiveness is often regarded as a second best option, or an inferior methodology.
Consequently, more effort has been diverted to developing and refining methodologies
for monetary quantification of non-market goods such as the Travel Cost Method,
Hedonic Pricing and Contingent Valuation instead of to improving the methodology of
Cost Effectiveness Analysis.
According to Schmaedick (1993), the five principles should be followed to ensure that
the design of the Cost Effectiveness Analysis (CEA) system gives the desired impact on
cost effectiveness:
1. Develop and follow a clearly stated, well-focused mission statement,
which sets out the goal of the organization or activity.
2. Design and implement a system for recording and analyzing all the costs
of the inputs used to achieve specific results. As far as possible costs
should be expressed in monetary terms.
3. Design and implement a system for recording results (or indicators of
results) –positive and negative, quantifiable and non-quantifiable,
expected and unexpected.
4. Design and implement a system that compares results of costs and it
should culminate in a judgment regarding the symmetry between costs and
results.
5. Follow a routine procedure in which the board and management use the
CEA results in setting up a policy and establishing budgets for the
organization.”
The present paper suggests a typology of project appraisal techniques and presents some
examples of the use of such techniques in low income countries. Finally some general
conclusions are drawn in terms of what conditions enable the Costs Effectiveness
Analysis to be more preferable to other appraisal techniques.
The presentation of appraisal techniques in the following text is not aimed at finding a
technique which is the best one in any given situation. Rather the idea behind the
presentation to point out that the choice of selecting the appraisal technique should
depend on the kind of problem which is to be studied and the kinds of data available.
According to Table 1, the most important differences between the appraisal techniques
are whether effects are aggregated at society level or disaggregated at interest group
level, and whether or not costs and benefits are all measured in a monetary unit. The

69
assumption is that choice of appraisal technique can be based on those two
considerations.
The Cost Effectiveness Analysis
The costs in a cost effectiveness analysis are analyzed in the same way as in a Cost
Benefit Analysis, using monetary figures and using a discount rate to make costs in
various periods of time comparable to each other. Benefits, however, are measured
according to their “effectiveness” in terms of physical amounts or quantifiable indicators.
The non-monetary nature of the benefit may rely on methodological problems of
monetary evaluation, the costs of making such an evaluation, ethical reservations against
assigning a price to certain non-market goods or simply that the decision-maker can be
provided with the needed information without going through the process of monetary
evaluation of benefits.
Cost Effectiveness Analysis has four alternative designs (Johnsen 1993):
1. Cost minimization can be used when the alternatives are designed in such
a way that they all yield the same benefit. In that case, the alternatives can
be assessed on the basis of the costs. Such an approach can be appropriate
when there is a clearly defined goal for the benefits that should be
achieved.
2. Performance maximization can be used to evaluate alternatives that all
have the same cost. The alternatives are evaluated on the basis of the
benefits. This approach can be used when a project has a fixed budget
restriction within which all the project alternati9ves have to operate.
3. The Cost-Effectiveness Ratio based on one indicator can be used when the
benefit is measurable in a one-dimensional unit. The decision criterion is
the Cost-Effectiveness Ratio, measured as a cost in a monetary unit per
unit of benefit measured by an indicator.
4. The Cost-Effectiveness Ratio which is based on a score system can be
used when the benefit needs to be measured in more than one dimension.
The various indicators can be given weights, so that a total score of
benefits can be calculated for each alternative. The decision criterion is
cost effectiveness ratio, measured as a cost in a monetary unit per benefit
unit according to the specific score system. The score will be based on a
weighted average of two or more indicators. Such a weighted average of
indicators is normally termed an index.
The Cost Effectiveness Ratio referred to under 3 and 4 above can be defined
as:
CER =
T
otct trC )1(* /
T
ttrIIt E
0)1*

70
Where
CER = Cost Effectiveness Ratio
T = planning horizon (the number of years to be considered)
t = the actual year of any cost or change in indicator value
(assuming that the first year of project implementation is
defined as year 0)
Ct = project cost in year t
∆It = change in indicator/index value in year t as a consequence
of the project
rc = discount rate for costs
rE = discount rate for effectiveness
The two discount rates above reflect a discussion on whether or not to
discount effectiveness within a Cost Effectiveness Analysis. One viewpoint is
that since benefits are discounted by the same discount rate as costs in a Cost
Benefit Analysis, the same should be the case even when the benefits are not
converted to monetary values. In that case rc = rE and we need only one
discount rate, r:
CER =
T
ott trC )1(* /
T
ttrIIt
0)1*
The opposite point of view is that effectiveness is often related to reduced
human suffering and even fatalities, and that it would not be right to discount
such effects since suffering is equally painful whether it takes place now or
later. One could even argue that one merit of the Cost Effectiveness Analysis
compared to Cost Benefit Analysis is that one can avoid discounting such
effects. In that case, rE = 0, and the cost effectiveness ratio can be writtenas
follows:
CER =
T
otct trC )1(* /
T
tIt
0
A compromise should be able to maintain equation (1) with 0<rE<rc.
Distribution analysis
Distribution analysis is not an independent appraisal technique, but rather a
supplementary technique. The outcome of a cost benefit or cost effectiveness
calculation gives information on the total social profitability of a project but
says nothing about the distribution of costs and benefits. Therefore, a
common recommendation within in Cost Benefit Analysis and the Cost
Effectiveness Analysis is to present a distribution analysis in addition to
calculating the main decision criterion.

71
A distribution analysis shows how each of a number of identified interest
groups is affected by each project alternative. Costs and benefits are
identified for each interest group involved, and a present value is calculated
for each interest group. A similar pattern is followed in the case of cost
effectiveness, but in many cases it is difficult to fund a meaningful way of
“distributing” the benefits from the Cost-Effectiveness Analysis between the
interest groups. Therefore, the Cost Effectiveness analysis may be
supplemented by only a cost distribution analysis.
Goals achievement matrix
Hill’s goals achievement matrix is a technique based on scores and weights
instead of monetary assessments. The technique is designed for decisions
with multiple objectives and the main steps of the method is outlined by Hill
(1973 pp. 23-40).
Goals should, as far as possible, be expressed as qualitatively or quantitatively
defined objectives. A qualitatively defined objective is, in Hill’s terminology,
one which is either obtained or not, while a quantitatively defined objective
can be obtained in varying degree.
For each goal, a ‘cost-benefit’ account is prepared. Depending on the
objective, the ‘costs’ and ‘benefits’ are expressed as (Hill op.cit. pp. 26-27):
1) Tangible costs and benefits expressed in monetary terms;
2) Tangible costs and benefits which cannot be expressed in monetary terms
but can be expressed quantitatively, usually in terms derived from the
definition of the goal
3) intangible costs and benefits.
For each objective and for each alternative course of action, costs and benefits
are compared, aggregated where possible and reported separately.
Each objective should then be assigned weights which “reflects the
community’s valuation of each of the various objectives,…”. The ‘costs’ and
‘benefits’ are not monetary values, but scores that indicate the degree of goals
achieved from each goal. “Thus benefits represent progress towards the
desired objectives while costs represent retrogression from desired objectives
(p. 29).”
The final product for any plan is a matrix where each ‘cost’ and ‘benefit’ for
each goal and each interest group affected is multiplied by the relative weight
of the importance of the goal and the relative weight of the importance of the
interest group affected. When all these weighted scores are added, one arrives
at a total score for the plan, which can be compared with the total score of
alternative plans.
Positional analysis

72
Positional analysis is based on System Theory rather than Economic Theory
(Soderbaum 1990). Here, Interdisciplinary and holistic thinking are
particularly emphasized. The technique emphasizes formulation of goals and
measurements of effects in several dimensions, of which monetary effects is
only one dimension. Other dimensions could, for instance, be saved travel
time, saved human lives, pollution measured in tons etc. In contrast to cost
benefit analysis, no such effects are converted to monetary units.
The description of consequences of alternative actions is based on interest
groups. For each interest group a matrix is constructed with the project
alternatives along one axis and the interest group’s assessment of the various
consequences of the project along the other axis. In the next stage, these
matrixes are drawn together, giving a ranking of the project alternatives from
each interest group’s viewpoint. The positional analysis does not go beyond
this stage. Setting priorities between the various interest groups is left to the
political process.
When should we use the Cost Effectiveness Analysis?
Based on the above typology of appraisal techniques and the examples of cases
where various appraisal techniques have proved useful in low income countries,
some general ‘rules of the thumb’ can be given for when cost effectiveness
analysis will make sense:
1. The project needs to have clear objectives
In the case of the cost effectiveness ratio or performance maximization, there
needs to be quantifiable indicators for project performance. Such indicators
cannot be developed unless the project objective is clearly stated.
2. There should not be a high level of conflicting opinions about the projects
Considering the examples of the Cost Effectiveness Analyses above, the
projects have objectives like preventing or curing diseases, providing water or
food to the population or improving agricultural systems. Very few people
would disagree that these are useful objectives, and one can expect a broad
agreement about projects that can achieve these objectives in a cost-effective
way. Examples of projects with a high level of conflict include the
hydropower and water management projects studied by Edlund and Quintero
(1995), Alhassan (1995) and Mafunda (1991). It seems as there choice of
positional analysis with its interest group perspective (ref. Table 1) is a well
reasoned and choice given that conflicting interests may be more important
than an overall social profitability in these projects.
3. The costs should be quantifiable in monetary terms

73
The typical Cost Effectiveness Analysis, as presented in the cases above,
relates to projects funded by government or donor funds, and with few or no
other important costs. Traffic plans are typically projects which also include
other important kinds of costs, like air pollution, noise and traffic accidents
with body injuries and loss of human lives as a consequence. This may
explain the need for the Goals Achievement Matrix development by Hill
(1973) and followed by Won (1990) in the case of a transportation project.
One could argue that costs like air pollution, noise and traffic accidents aqlso
can be quantified in monetary terms, by using for instance, contingent
valuation techniques. When choosing such an approach, however, there
would hardly be any good reasons not to quantify the benefits (or
effectiveness) too in monetary terms, which would imply cost benefit analysis.
4. The project output should not be items that are sold at a competitive market
If the project output consists of commodities that are sold in a competitive
market, benefits can be assessed in monetary terms by market prices,
consequently cost benefit analysis is normally preferable. In most cases, the
production of non-market goods like health services, education etc. are left for
the Cost Effectiveness Analysis.
This viewpoint makes the scope for the Cost Effectiveness Analysis wider in
low income countries than in high income countries, because missing or
highly imperfect markets are more common in low income countries. The
most striking example is probably subsistence or semi-subsistence agriculture.
In high income countries, agricultural improvements would be assessed in
terms of yields that are quantified by market prices of the products. In peasant
agriculture of low income countries, most of the products may be consumed
by the farming family, where a small surplus may be traded in kind rather than
for cash, and if anything is sold for cash, there is most often nothing like a
consistent market price. Under such conditions, developing indicators for
agricultural improvement and making cost effectiveness analysis of
agricultural interventions is probably a better approach than measuring
agricultural outputs in monetary values in order to apply the Cost Benefit
Analysis.

74
REFERENCES
Alhassan, M.C. 1995. Evaluation of the positional analysis based on its application to the
Lesotho Highland Water Project and the Maluti Montain resource use. MSc.
Thesis, Centre for International Environment and development Studies, Noragric,
Agricultural University of Norway, Ås, Norway.
Berger, M.S., and F.H. Johnsen. 1989. Cost-effectiveness analysis of measures against
agricultural pollution of Lake MjØsa. In: Economic aspect of Environmental
regulations in agriculture. Wissenschaftverlag Vauk, Kiel, Germany.
Bojo, Jan., K., Goran, Maler and L. Unemo. 1992. “Environment and Development: An
Economic Approach”. Kluwer Academic Publishers, P.O. Box 17, 3300 AA
Dordrecht, The Netherlands.
Bonsel, G.J., Rutten, F.F.H. and C.A.Uyldegroot. 1993. Economic evaluation alongside
cancer trails – methodological and practical aspects. European journal of cancer
29A:10-14.
Borus, M.E. Tash, W.R. and C.G. 1982. Evaluating the impact of health programmes : a
primer. MIT Press, Massachusetts.
Brent, R.J. 1996. Applied Cost-Benefit analysis. Edward Elger, Cheltenham, UK.
Brewer, J.D., Sakthivadivel, R. and C.M. Wijerathna. 1992. Achieving cost effective
rehabilitation and modernization of irrigation systems: research results from Sri
Lanka. In: Advancement in IIMI’s research 1992. International Irrigation
Management Institute,
75
Curry, Steve., J. Weiss. 2000. “Project Analysis in Developing Countries”. Macmillan
Press Ltd, Houndmills, Basingstoke, Hampshire RG 21 6XS and London.
Dinwiddy, C. and F. Teal. 1996. “ Principles of Cost-Benefits Analysis for Developing
Countries”. Cambridge University Press.
Dinwiddy, C. and F. Teal. 1996. Principles of cost-benefit analysis for developing
countries. Cambridge University Press.
French, M.T. 1995. Economic evaluation for drug abuse treatment programme-
methodology and findings. American Journal of Drug and Alcoholic Abuse 21
(1): 111-135.
Hanley, N., C. L. Spash. 1993. Cost – Benefit Analysis and the Environment. Edward
Elgar Publishing Limited, 8 Lansdown Place, Cheltenham, Glos GL50 2HU,
UK.
Haycox, A. 1994. A Methodology for estimating the cost and benefits of health
promotion. Health Ppromotion International 9 (1): 5-11
Heatwole, C.D., Bottcher, A.B., L.B. Baldwin. 1987. Modeling cost-effectivence of
agricultural nonpoint pollution abatement programmes on two Florida basins.
Water resource bulletin 23 (1): 127-131.
Hennayake, S. K., Hewage, A., Wijerathne, M. S. and S. E. Yasarathne 1997.
“Environmental Impact Assessment” The Sri Lankan Experience. Centre for
Environmental Studies, University of Peradeniya, USAID/Sri Lanka Natural
Resource & Environmental Policy Project, International Resources Group LTD.
Hufschmidt, M.M., Guowei, F., Lansheng, Z., Shegtong, C. and N. Guisheng. 1986.
Systematic analysis of water pollution control options in a suburban region of
Beijing, China. In: Dixon, J.A. and Hufschmidt, M.M. (ed) Economic valuation
techniques for the environment: a case study workbook. Johns Hopkings
University Press, Baltimore, PP. 178-198.
Hufschmidt, M.M., James, D.E., Meister, A.D., Bower, B.T. and J. A. Dixen.1983.
Environment, natural systems, and development: an economic valuation guide.
Johns Hopkings University Press, Baltimore.

76
Johnsen, F.H. 1993. Economic analyses of measures to control phosperus run-off from
non-point agricultural sources. European Review of Agricultural Economics 20
(4): 399-418.
Kim, S.H. and J. A. Dixen. 1986. Economic valuation of environmental quality aspects of
upland agricultural projects in Korea. In: Dixen, J.A. and Hufschmidt, M.M. (ed)
Economic valuation techniques for the environment: A case study workbook.
Johns Hopkings University Press, Baltimore, PP. 63-82.
Kolstad, Charles D. 2000. Environmental Economics. Oxford University Press, Inc., 198
Madision Avenue, New York, New York 10016.
Levin, H.M. 1970. A cost effectiveness analysis of teacher selection. Journal of Human
Resources 5 (1), pp. 24-33.
Masters, W.A. and A. Winter-Nelson. 1995. Measuring the comparative advantage of
agricultural activities: domestic resource costs and the social cost-benefit ratios.
Pearce D.W. and C. A. Nash 1981. the social appraisal of projects. A text in cost benefit
analysis. MacMillan Press. Pp. 223.
Pearce, David W. and R. K. Turner. 1990. “Economics of Natural resources and the
Environment”. Harvester Wheatsheap Campus 400, Maylands Avenue, Hemel
Hempstead, Hertfordhire, HP2 7EZ.
Perkins, F. 1994. Practical cost-benefit analysis: basic concepts and applications.
MacMillan.
Porter, R.S. and M.R. Walsh 1978. Cost-effectiveness analysis in practice: a case study of
domestic water supplies in an African country. World Development 6(2(:195-208.
Shrivastava, O. S. 2001. “Economics of Growth, Development and Planning”. UBS
PUBLISHER’ DISTRIBUTER LTD, 5, Ansari Road, New Delhi- 110 002.
Squire, L. and Tak, H.G. 1975. Economic analysis of projects. The John Hopkins
University Press.
Unesco. 1986. “Socio-economic Analysis and Planning: Critical Choice of
Methodologies, The United Nations Educational, Scientific and Cultural
Organization, 7, Place de Fontenoy, 75700 Paris.

77
Appendix No. 1
Major Steps in the Current EIA Procedures in Sri Lanka
The sequential steps of carrying out EIA are as follows
Preliminary Information
A project proponent is required to provide the Project Approving Agency (PAA) with
Preliminary Information (PI) on the proposed prescribed project as early as possible. It
should include a description of the nature of the scope and the location of the proposed
project accompanied by location maps and any other details as may be required by the
PAA. The PI submitted should be comprehensive so that it may even be sufficient to be
considered as an Initial Environmental Examination (IEE). The PAA may request
additional information from the project proponent. It is for the PAA to decide whether
adequate information has been given by the project proponent. This is very important
because if the PI does not contain enough information, the management of scooping
could become difficult and the decision defective. For this reason the PAA must be
satisfied that the required information is given before the scooping commences. The
decision as to whether an EIA should be called for lies entirely at the discretion of the
PAA.
Environmental Scooping
Environmental scooping is the process of identifying the important issues that must be
addressed in detail in the EIA. Environmental issues involve national, regional, and local
government agencies and cover a broad range of responsibilities (wild life, health, water,
land use, tourism etc.). Coordination among government agencies is therefore vital.
Scooping determines whether the project proponent should be asked to prepare an EIA
and if it generates the basic terms of reference for conducting the EIA. The basic terms of
reference for an EIA have been issued as guidance by the Central Environmental
Authority (CEA).
The process seeks to create a forum at which parties with interests at stake should be
brought together to help the PAA decide on the issues that should be addressed in an
EIA. The involvement of the affected groups and the NGOs too is crucial to the
preparation of the EIA. Therefore, the Project Proponent is expected to take the views of

78
affected groups and local NGOs fully into account in project design and implementation
and in the preparation of the required report. The EIA regulations state that the PAA may
take into consideration the views of state agencies and the public during scooping.
Although the PAA has discretion, experience has shown that obtaining public views at
this stage is not always practically possible. One of the functions of scooping is to enable
the PAA to decide whether an EIA should be called for. To avoid unnecessary expense
every effort should be made at scooping to decide whether an EIA should be carried out.
EIA Preparation
The EIA report is prepared by the project proponent usually by the hiring of consultants.
A number of consultants have informally registered with CEA for the preparation of
EIAs. It is expected that a consultant who undertakes the preparation of an EIA avoids
actions and situations that are inconsistent with his professional obligations or that are
likely to raise doubt his integrity. If a consultant finds that his professional or personal
interests conflict so as to risk a breach of the principle of rectitude and integrity he is
expected to withdraw from such a situation. All reports are generally authenticated by the
consultants. The project proponent is required to submit three originals dully signed to
the PAA. If the PAA is not satisfied with the EIA report, the project proponent is then
required to make necessary amendments and re-submit it.
Analysis of Alternatives in EIA At the heart of the EIA process is the requirement that alternatives to the proposed
activity must be considered. An EIA must contain a description of any alternatives
together with the reasons why these alternatives were rejected. This very important aspect
is rarely addressed adequately in the EIAs prepared so far.
Extended Cost Benefit Analysis
The definition of EIA as contained in the National Environmental Act states that an
environmental CBA should be included in the EIA if such as analysis has been prepared.
The techniques of environmental economic analysis as applied to the design and appraisal
of development projects are advancing. However, although a range of improved
economic valuation methods used in environmental CBA have been developed it has had
a slow start in relation to EIA. Therefore despite the legal requirement, this aspect is
rarely addressed meaningfully in an EIA.
Public Participation
The involvement of the public is an important aspect of the EIA process. The provision
for public participation is contained in the NEA. The PAA must publish notices in the
Government Gazette and in the daily news papers in all three languages inviting the
public to inspect and make comments on the IEE/EIA within 30 days. The notice
specifies where and when the EIA/IEE can be inspected. Usually these reports are made
available in Divisional Secretariats and Pradeshiya Shabhas where the project is proposed
to be located. The public has a right to obtain copies of the documents from the PAA on
payment of the copying charges.
79
The public comments received during the 30 day period must be sent to the project
proponent for review and response. The project proponent must respond to the comments
by making every effort to modify alternatives including the proposed action. He or she
must develop and evaluate alternatives not provided in the original report and where
necessary provide supplementary information and make corrections in the document. All
substantive comments received on the draft should be attached to the final statement.
Decision Making
According to the regulations, the PAA should grant approval for the project subject to
specified conditions or refuse approval for the implementation of the project with the
reasons for doing so. Usually a PAA appoints a panel of technically competent persons to
study an EIA and make its recommendations to the PAA concerned. This panel is
selected from a directory of experts published by the CEA. The experts selected usually
possess considerable expertise in the chosen field and in the implementation of EIA
procedures. This technical evaluation repot forms the basis of the EIA decision. The
decision made at a meeting of the EIA Oversight Committee which is chaired by the head
of the PAA is conveyed to the CEA for concurrence before a final decision is made.
Before concurrence is granted, the CEA appoints its own technical consultants for
evaluation of the decision and associated conditions. There have been instances where the
CEA has refused to grant concurrence for EIA decisions made by PAAs.
Appeal Procedure
A project proponent who is aggrieved by a refusal can appeal to the Secretary of the
Minister in charge of the subject of Environment. There is no time limit fixed for the
appeal and therefore it may be lodged within a reasonable period of time. Three appeals
have been heard by the Secretary in charge of Environment since the effective date. The
Secretary usually appoints a panel of experts to hear the appeal and make a report. A
member of the public aggrieved by a decision to grant approval for a project would have
to seek recourse in courts.
Monitoring
The success of the EIA process would be totally negated if the conditions imposed by the
PAA are not effectively monitored. The regulations require that the PAA forward to the
CEA a report which contains a plan to monitor the implementation of evry approved
project within 30 days of granting such approval. Monitoring would indicate the extent of
compliance with the condition set by the project proponent and the effectiveness of the
mitigatory measures. A system of self monitoring would be most appropriate. The project
proponent would submit monthly reports to the PAA regarding compliance with the
specific conditions. Spots checks could be done by the PAA regarding compliance with
the specific conditions and verify its accuracy. Usually monitoring is ensured by the
application of the legally mandated Environmental Protection Licensing (EPL) procedure
where any activity discharging waste into the environment is regulated under the
provisions of the National Environment Act.

80
Appendix 2.
Table : A Summary of Basis and Methods of Environmental Valuation
Techniques (EVTs)
Objective EVTs
a. Productivity Change
Principle Methods Advantages Disadvantages
Where are a change in the
environment affects the marketable commodity,
the value of the
environmental change is reflected in the market
value of the change in
thecommodity.
The methods consist of
the following two steps: a. estimating the
physical relationship
between the cause (environmental change)
and the effect on the
commodity. This
relationship is referred to as the damage
function.
b. Estimating the monetary value. The
change in the physical
quantity of the
commodity affected by environmental change
is multiplied by the
market price of the commodity.
This method can be easily
understood because of its simplicity and its,
apparent pure scientific
based and close relation to the market. It appeals
to technical scientists and
even to those who do not
have a knowledge of Economics.
Damage functions are not
readily available. Even if available damage functions
may be site specific
estimation of damage functions which could be
expensive in terms of time
and other resources
required. Estimation damage functions could
have technical problems in
isolating the cause and effect from other
extraneous factors and in
accounting for the natural
change that would occur irrespective of the artificial
environmental change. The
only use value of the environmental change
could be estimated by this
technique.
b. Preventive cost and replacement cost
Principle Method Advantages Disadvantages
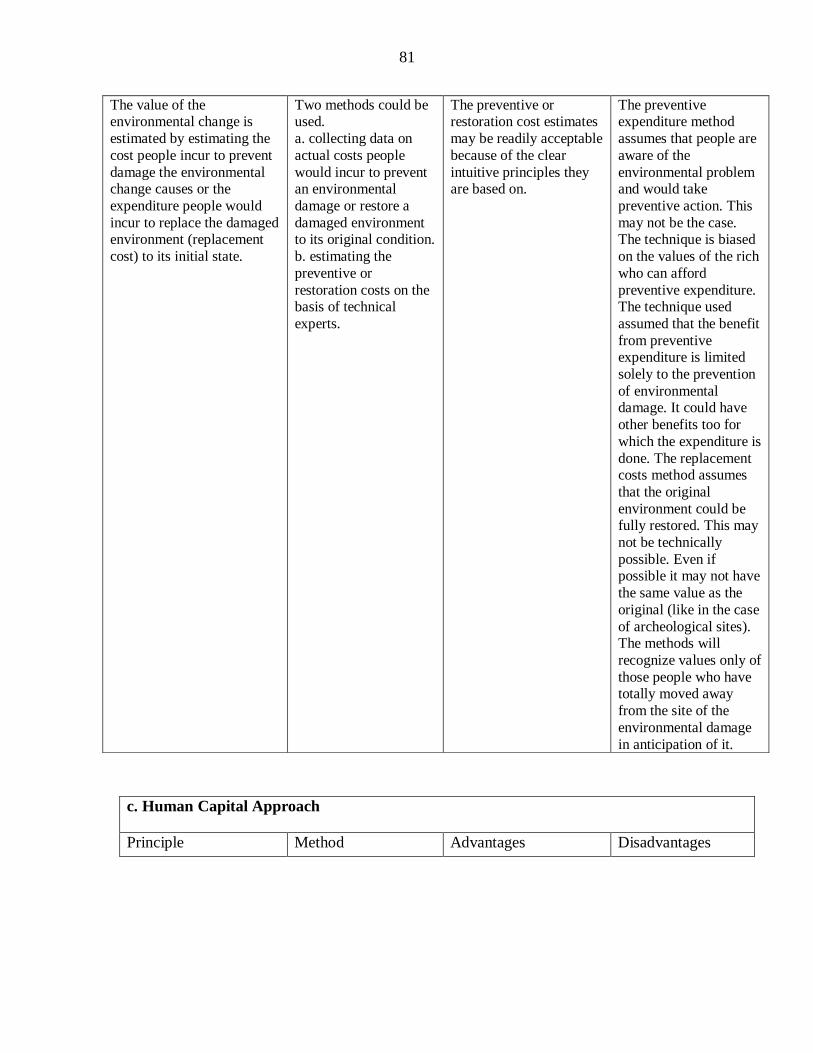
81
c. Human Capital Approach
Principle Method Advantages Disadvantages
The value of the environmental change is
estimated by estimating the
cost people incur to prevent
damage the environmental change causes or the
expenditure people would
incur to replace the damaged environment (replacement
cost) to its initial state.
Two methods could be used.
a. collecting data on
actual costs people
would incur to prevent an environmental
damage or restore a
damaged environment to its original condition.
b. estimating the
preventive or
restoration costs on the basis of technical
experts.
The preventive or restoration cost estimates
may be readily acceptable
because of the clear
intuitive principles they are based on.
The preventive expenditure method
assumes that people are
aware of the
environmental problem and would take
preventive action. This
may not be the case. The technique is biased
on the values of the rich
who can afford
preventive expenditure. The technique used
assumed that the benefit
from preventive expenditure is limited
solely to the prevention
of environmental damage. It could have
other benefits too for
which the expenditure is
done. The replacement costs method assumes
that the original
environment could be fully restored. This may
not be technically
possible. Even if possible it may not have
the same value as the
original (like in the case
of archeological sites). The methods will
recognize values only of
those people who have totally moved away
from the site of the
environmental damage
in anticipation of it.
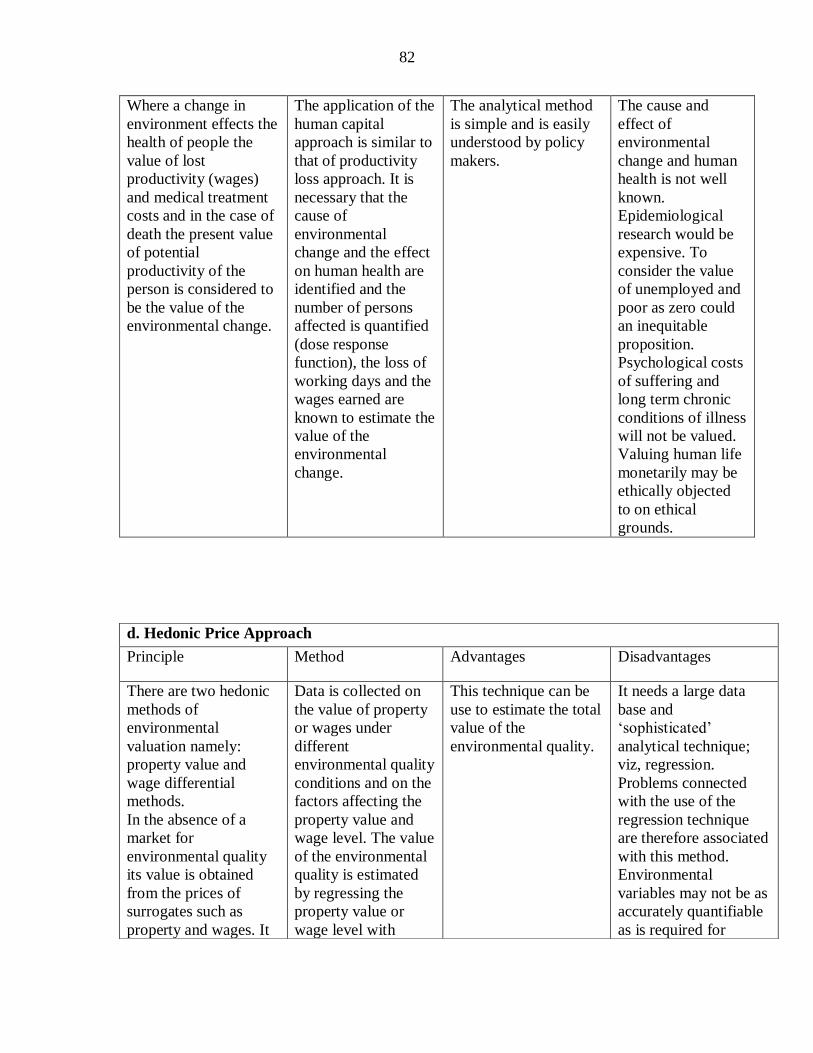
82
Where a change in
environment effects the
health of people the
value of lost
productivity (wages)
and medical treatment
costs and in the case of
death the present value
of potential
productivity of the
person is considered to
be the value of the
environmental change.
The application of the
human capital
approach is similar to
that of productivity
loss approach. It is
necessary that the
cause of
environmental
change and the effect
on human health are
identified and the
number of persons
affected is quantified
(dose response
function), the loss of
working days and the
wages earned are
known to estimate the
value of the
environmental
change.
The analytical method
is simple and is easily
understood by policy
makers.
The cause and
effect of
environmental
change and human
health is not well
known.
Epidemiological
research would be
expensive. To
consider the value
of unemployed and
poor as zero could
an inequitable
proposition.
Psychological costs
of suffering and
long term chronic
conditions of illness
will not be valued.
Valuing human life
monetarily may be
ethically objected
to on ethical
grounds.
d. Hedonic Price Approach
Principle Method Advantages Disadvantages
There are two hedonic
methods of
environmental
valuation namely:
property value and
wage differential
methods.
In the absence of a
market for
environmental quality
its value is obtained
from the prices of
surrogates such as
property and wages. It
Data is collected on
the value of property
or wages under
different
environmental quality
conditions and on the
factors affecting the
property value and
wage level. The value
of the environmental
quality is estimated
by regressing the
property value or
wage level with
This technique can be
use to estimate the total
value of the
environmental quality.
It needs a large data
base and
‘sophisticated’
analytical technique;
viz, regression.
Problems connected
with the use of the
regression technique
are therefore associated
with this method.
Environmental
variables may not be as
accurately quantifiable
as is required for

83
e. Travel cost approach
Principle Method Advantages Disadvantages
The value people place
on environmental
quality is estimated on
the basis of the cost of
traveling to that site
and the value of
productive time that is
spent on visiting the
site.
The area surrounding
the concerned site is
divided into equi-
distant concentric
circles/zones.
Visitation rates for
each of the zones are
calculated. These
visitation rates are
regressed on travel
costs and other socio-
economic variables
for each zone to
derive demand curves
for each zone.
Consumer surplus is
estimated from the
demand curves.
The technique can be
used to estimate total
value of the
environment.
The application of the
technique requires a
collection of a great
deal of the
sophisticated procedure
of regression analysis.
Therefore, problem
associated with
regression anlysis are
inherent in the
technique. Considering
the value of productive
time may be erroneous
if travel is undertaken
during leisure or by
unemployed people. A
trip may be to multiple
sites. In such situations
disaggregating the cost
to a single site may be
difficult. The value of
the environment
estimated by travel cost
does not consider the
total vale of the
environment. It ignores
the option and
existence value. It also
is presumed that the
property value and
wages also include a
value for
environmental quality.
Further, the value of
the environmental
resources could be
desegregated if all
other factors
determining property
value and wages are
known.
determining factors,
as well as the
environmental quality
variables.
regression. People may
not be aware of the
environmental quality
difference in the case
of some pollutants until
the change is
drastically effected.

84
ignores the benefits
derived from the site by
those who do not visit
the site. They include
people living those to
it.
Subjective EVTs
a. Contingent Valuation Method (CVM)
Principle Method Advantages Disadvantaged
People are asked
directly about their
willingness to pay for
an environmental
benefit or their
willingness to accept
compensation for the
loss of an
environmental benefit,
assuming that they are
aware of the change/s
in the environment and
their implications for
human welfare.
Sample surveys are
conducted to elicit
peoples valuation on
willingness to pay or
accept. Different
techniques used to
elicit responses
include open ended
questioning and
bidding games.
Theoretically the
method is able to value
all benefits (use and
non use) of the
environment. The only
applicable technique to
value environmental
changes that do not
have any relation to the
market
The method is of a
hypothetical nature.
Its results may not be
readily acceptable to
technical scientists
and policy makers.
The method can
estimate biased
values which could
be corrected. The
method
assumes/requires that
people are aware of
the environmental
problems and their
likely impacts. The
method does not
constraint the demand
for environment on
actual income (which
could be corrected).
Hence values may be
unrealistic.

85
Benefit Transfer
Method
Principle Method Advantages Disadvantages
The value of
environmental impacts
that have been already
estimated (within the
country or outside it) is
used with appropriate
modifications
Estimates the value
of environmental
impacts closely
similar to the impacts
of the concerned
projects are selected
to a account for
differences in
income, property
rights, lands prices,
institutions, culture
cte.
The method is rapid
and convenient
The acceptability of
the value could be
questioned if the
conditions,
particularly income
and culture, differ
widely.
Source: Hennayake, S. K., Hewage, A., Wijerathne, M. S. and Yasarathne, S. E. 1997.
“Environmental Impact Assessment” The Sri Lankan Experience. Centre for
Environmental Studies, University of Peradeniya, USAID/Sri Lanka Natural
Resource & Environmental Policy Project, International Resources Group LTD.

86
Pasuwadana
This book, written in two parts provides an introduction to the principles of Project
Planning and the Socio-economic Appraisal of Projects. Part 1 offers a detailed
discussion of project identification and preparation which are the first two phases of a
project cycle. The second part describes Cost-Benefit Analysis, which is the most
commonly used technique in project appraisal.
The author is a Senior Lecturer in the Department of Economics and Statistics, University
of Peradeniya, and counts fourteen years of service. Having graduated with a Second
Class (Upper Division) BA degree (Economics Special) from the same university in
1992, he also holds an MPhil in Economics from Peradeniya University and an MSc in
Resource and Development Economics from Agricultural University of Norway. He has
been teaching ‘Project Planning and Appraisal’ as a subject at undergraduate and
graduate level for a number of years.
This book is written in a way that is suitable for students at both graduate and
undergraduate levels. The use of example related to Sri Lankan project planning
procedures, make it easy to understand the subject. There is no doubt that this book will
be a useful textbook for students to follow courses in project planning and appraisal in
Universities in Sri Lanka.
Dr. Anoma Abhayarathne
Senior Lecturer
Department of Economics and Statistics
University of Peradeniya
Peradeniya

VIJAYANAGARA SRI KRISHNADEVARAYA
UNIVERSITY BALLARI
(A State University)
Study Materials for BBA Degree course
TAX MANAGEMENT (Module 4th & 5th Important theory)
PRESENTED BY
Mr MOULA HUSSAIN KHATTHEWALE
BBA(COMMON SUBJECT) FOR
FINANCE/MARKETING/HR
VI - Semester

About the Author: Mr Moula Hussain Khatthewale (BBM, MBA, KSET)
President
Vijayanagara Educational Trust® Hosapete,
Director
RB Institute Hosapete
Principal
Sri Maata Degree College Hosapete
Lecturer
Vijayanagara College Hosapete
CONTACT DETAILS:- Cell:+91-9035751320 Email ID:[email protected]

TAX MANAGEMENT

TAX MANAGEMENT
MODULE-4
Deductions on Section 80C, 80CCC, 80CCD & 80D
Deductions allowed under the income tax act help you reduce your taxable
income. You can avail the deductions only if you have made tax-saving
investments or incurred eligible expenses. There are a number of deductions available under various sections that will bring down your taxable income. The
most popular one is section 80C of Chapter VIA. Other preferred dedcutions
under chapter VIA are 80D, 80E, 80G, 80DDB and so on. In this article, let us discuss some of the important deductions under chapter VIA that a taxpayer can
claim.
Section 80C
Investments
Section 80CCC
Insurance Premium
Section 80CCD
Pension Contribution

Section 80TTA
Interest on Savings Account
Section 80GG
House Rent Paid
Section 80E
Interest on Education Loan
Section 80EE
Interest on Home Loan
Section 80CCG
RGESS

Section 80D
Medical Insurance
Section 80DD
Disabled Dependent
Section 80DDB
Medical Expenditure
Section 80U
Physical Disability
Section 80G
Donations

Section 80GGB
Company Contribution
Section 80GGC
Contribution to Political Parties
Section 80RRB
Royalty of a Patent
Section 80TTB
Interest Income
1. Section 80C
Deductions on Investments
You can claim a deduction of Rs 1.5 lakh your total income under section 80C.
In simple terms, you can reduce up to Rs 1,50,000 from your total taxable
income, and it is available for individuals and HUFs.
.

Sometimes, you may have deductions or investments eligible for 80C, but haven’t submitted the proofs to your employer. This may cause to additional
TDS deductions. You can still claim these deductions while e-filing, as long as
you have the proofs with you.
2. Section 80CCC – Insurance Premium
Deduction for Premium Paid for Annuity Plan of LIC or Other Insurer
Section 80CCC provides a deduction to an individual for any amount paid or
deposited in any annuity plan of LIC or any other insurer. The plan must be for receiving a pension from a fund referred to in Section 10(23AAB). Pension
received from the annuity or amount received upon surrender of the annuity,
including interest or bonus accrued on the annuity, is taxable in the year of
receipt.
3. Section 80CCD – Pension Contribution
Deduction for Contribution to Pension Account
a. Employee’s contribution under Section 80CCD (1)
You can claim this if you deposit in your pension account. Maximum deduction you can avail is 10% of salary (in case the taxpayer is an employee) or 20% of
gross total income (in case the taxpayer being self-employed) or Rs 1.5 lakh –
whichever is less.
Until FY 2016-17, maximum deduction allowed was 10% of gross total income
for self-employed individuals.

b.Deduction for self-contribution to NPS – section 80CCD (1B) A new
section 80CCD (1B) has been introduced for an additional deduction of up to Rs 50,000 for the amount deposited by a taxpayer to their NPS account.
Contributions to Atal Pension Yojana are also eligible.
c. Employer’s contribution to NPS – Section 80CCD (2) Claim additional
deduction on your contribution to employee’s pension account for up to 10% of
your salary. There is no monetary ceiling on this deduction.
Know more about Section 80CCD
4. Section 80 TTA – Interest on Savings Account
Deduction from Gross Total Income for Interest on Savings Bank Account
If you are an individual or an HUF, you may claim a deduction of maximum Rs
10,000 against interest income from your savings account with a bank, co-operative society, or post office. Do include the interest from savings bank
account in other income.
Section 80TTA deduction is not available on interest income from fixed
deposits, recurring deposits, or interest income from corporate bonds.
5. Section 80GG – House Rent Paid
Deduction for House Rent Paid Where HRA is not Received
a. Section 80GG deduction is available for rent paid when HRA is not received.
The taxpayer, spouse or minor child should not own residential accommodation
at the place of employment

b. The taxpayer should not have self-occupied residential property in any other
place
c. The taxpayer must be living on rent and paying rent
d. The deduction is available to all individuals
Deduction available is the least of the following:
a. Rent paid minus 10% of adjusted total income
b. Rs 5,000/- per month
c. 25% of adjusted total income*
*Adjusted Gross Total Income is arrived at after adjusting the Gross Total
Income for certain deductions, exempt income, long-term capital gains and
income related to non-residents and foreign companies.
An online e-filing software like that of ClearTax can be extremely easy as the limits are auto-calculated. So, you do not have to worry about making complex
calculations.
From FY 2016-17 available deduction has been raised to Rs 5,000 a month
from Rs 2,000 per month.
6. Section 80E – Interest on Education Loan
Deduction for Interest on Education Loan for Higher Studies
A deduction is allowed to an individual for interest on loans taken for pursuing
higher education. This loan may have been taken for the taxpayer, spouse or children or for a student for whom the taxpayer is a legal guardian.
80E deduction is available for a maximum of 8 years (beginning the year in
which the interest starts getting repaid) or till the entire interest is repaid,
whichever is earlier. There is no restriction on the amount that can be claimed.
7. Section 80EE – Interest on Home Loan
Deductions on Home Loan Interest for First Time Home Owners
FY 2017-18 and FY 2016-17 This deduction is available in FY 2017-18 if the
loan has been taken in FY 2016-17. The deduction under section 80EE is available only to home-owners (individuals) having only one house property on
the date of sanction of the loan. The value of the property must be less than Rs
50 lakh and the home loan must be less than Rs 35 lakh. The loan taken from a financial institution must have been sanctioned between 1 April 2016 and 31
March 2017. There is an additional deduction of Rs 50,000 available on your
home loan interest on top of deduction of Rs 2 lakh (on interest component of home loan EMI) allowed under section 24.
FY 2013-14 and FY 2014-15 During these financial years, the deduction
available under this section was first-time house worth Rs 40 lakh or less. You
can avail this only when your loan amount during this period is Rs 25 lakh or less. The loan must be sanctioned between 1 April 2013 and 31 March 2014.
The aggregate deduction allowed under this section cannot exceed Rs 1 lakh
and is allowed for FY 2013-14 and FY 2014-15.
8. Section 80CCG – RGESS
Rajiv Gandhi Equity Saving Scheme (RGESS)
The deduction under this section 80CCG is available to a resident individual,
whose gross total income is less than Rs.12 lakh. To avail the benefits under
this section the following conditions should be met:
a. The assessee should be a new retail investor as per the requirement specified
under the notified scheme.
b. The investment should be made in such listed investor as per the requirement
specified under the notified scheme.
c. The minimum lock in period in respect of such investment is three years from
the date of acquisition in accordance with the notified scheme.
Upon fulfillment of the above conditions, a deduction, which is lower of the
following is allowed.
50% of the amount invested in equity shares; or
Rs 25,000 for three consecutive Assessment Years.
Rajiv Gandhi Equity Scheme has been discontinued starting from 1 April 2017.
Therefore, no deduction under section 80CCG will be allowed from FY 2017-
18. However, if you have invested in the RGESS scheme in FY 2016-17, then you can claim deduction under Section 80CCG until FY 2018-19.
9. Section 80D – Medical Insurance

Deduction for the premium paid for Medical Insurance
You (as an individual or HUF) can claim a deduction of Rs.25,000 under
section 80D on insurance for self, spouse and dependent children. An additional
deduction for insurance of parents is available up to Rs 25,000, if they are less than 60 years of age. If the parents are aged above 60, the deduction amount is
Rs 50,000, which has been increased in Budget 2018 from Rs 30,000.
In case, both taxpayer and parent(s) are 60 years or above, the maximum deduction available under this section is up to Rs.1 lakh.
Example: Rohan’s age is 65 and his father’s age is 90. In this case, the
maximum deduction Rohan can claim under section 80D is Rs. 100,000. From FY 2015-16 a cumulative additional deduction of Rs. 5,000 is allowed for
preventive health check.
10. Section 80DD – Disabled Dependent
Deduction for Rehabilitation of Handicapped Dependent Relative
Section 80DD deduction is available to a resident individual or a HUF and is available on:
a. Expenditure incurred on medical treatment (including nursing), training and
rehabilitation of handicapped dependent relative
b. Payment or deposit to specified scheme for maintenance of handicapped
dependent relative.
i. Where disability is 40% or more but less than 80% – fixed deduction of Rs
75,000.
ii. Where there is severe disability (disability is 80% or more) – fixed deduction
of Rs 1,25,000.
To claim this deduction a certificate of disability is required from prescribed
medical authority. From FY 2015-16 – The deduction limit of Rs 50,000 has
been raised to Rs 75,000 and Rs 1,00,000 has been raised to Rs 1,25,000.
11. Section 80DDB – Medical Expenditure
Deduction for Medical Expenditure on Self or Dependent Relative
a. For individuals and HUFs below age 60

A deduction up to Rs.40,000 is available to a resident individual or a HUF. It is available with respect to any expense incurred towards treatment of specified
medical diseases or ailments for himself or any of his dependents. For an HUF,
such a deduction is available with respect to medical expenses incurred towards
these prescribed ailments for any of the HUF members.
b. For senior citizens and super senior citizens
In case the individual on behalf of whom such expenses are incurred is a senior citizen, the individual or HUF taxpayer can claim a deduction up to Rs 1 lakh.
Until FY 2017-18, the deduction that could be claimed for a senior citizen and a
super senior citizen was Rs 60,000 and Rs 80,000 respectively. This has now become a common deduction available upto Rs 1 lakh for all senior citizens
(including super senior citizens) unlike earlier.
c. For reimbursement claims
Any reimbursement of medical expenses by an insurer or employer shall be reduced from the quantum of deduction the taxpayer can claim under this
section.
Also remember that you need to get a prescription for such medical treatment from the concerned specialist in order to claim such deduction. Read our
detailed article on Section 80DDB.
12. Section 80U – Physical Disability
Deduction for Person suffering from Physical Disability
A deduction of Rs.75,000 is available to a resident individual who suffers from a physical disability (including blindness) or mental retardation. In case of
severe disability, one can claim a deduction of Rs 1,25,000.
From FY 2015-16 – Section 80U deduction limit of Rs 50,000 has been raised
to Rs 75,000 and Rs 1,00,000 has been raised to Rs 1,25,000.
13. Section 80G – Donations
Deduction for donations towards Social Causes
The various donations specified in u/s 80G are eligible for deduction up to
either 100% or 50% with or without restriction. From FY 2017-18 any
donations made in cash exceeding Rs 2,000 will not be allowed as deduction.
The donations above Rs 2000 should be made in any mode other than cash to qualify for 80G deduction.
a. Donations with 100% deduction without any qualifying limit

National Defence Fund set up by the Central Government Prime Minister’s National Relief Fund
National Foundation for Communal Harmony
An approved university/educational institution of National eminence Zila Saksharta Samiti constituted in any district under the chairmanship
of the Collector of that district
Fund set up by a State Government for the medical relief to the poor
National Illness Assistance Fund National Blood Transfusion Council or to any State Blood Transfusion
Council
National Trust for Welfare of Persons with Autism, Cerebral Palsy, Mental Retardation and Multiple Disabilities
National Sports Fund
National Cultural Fund
Fund for Technology Development and Application National Children’s Fund
Chief Minister’s Relief Fund or Lieutenant Governor’s Relief Fund with
respect to any State or Union Territory The Army Central Welfare Fund or the Indian Naval Benevolent Fund or
the Air Force Central Welfare Fund, Andhra Pradesh Chief Minister’s
Cyclone Relief Fund, 1996
The Maharashtra Chief Minister’s Relief Fund during October 1, 1993 and October 6,1993
Chief Minister’s Earthquake Relief Fund, Maharashtra
Any fund set up by the State Government of Gujarat exclusively for providing relief to the victims of earthquake in Gujarat
Any trust, institution or fund to which Section 80G(5C) applies for
providing relief to the victims of earthquake in Gujarat (contribution
made during January 26, 2001 and September 30, 2001) or Prime Minister’s Armenia Earthquake Relief Fund
Africa (Public Contributions — India) Fund
Swachh Bharat Kosh (applicable from financial year 2014-15)
Clean Ganga Fund (applicable from financial year 2014-15) National Fund for Control of Drug Abuse (applicable from financial year
2015-16)

b. Donations with 50% deduction without any qualifying limit
Jawaharlal Nehru Memorial Fund
Prime Minister’s Drought Relief Fund
Indira Gandhi Memorial Trust
The Rajiv Gandhi Foundation
c. Donations to the following are eligible for 100% deduction subject to
10% of adjusted gross total income
Government or any approved local authority, institution or association to
be utilized for the purpose of promoting family planning Donation by a Company to the Indian Olympic Association or to any
other notified association or institution established in India for the
development of infrastructure for sports and games in India or the
sponsorship of sports and games in India
d. Donations to the following are eligible for 50% deduction subject to 10%
of adjusted gross total income
Any other fund or any institution which satisfies conditions mentioned in
Section 80G(5) Government or any local authority to be utilized for any charitable
purpose other than the purpose of promoting family planning
Any authority constituted in India for the purpose of dealing with and
satisfying the need for housing accommodation or for the purpose of planning, development or improvement of cities, towns, villages or both
Any corporation referred in Section 10(26BB) for promoting the interest
of minority community For repairs or renovation of any notified temple, mosque, gurudwara,
church or other places.
14. Section 80GGB – Company Contribution
Deduction on contributions given by companies to Political Parties
Section 80GGB deduction is allowed to an Indian company for the amount contributed by it to any political party or an electoral trust. Deduction is allowed
for contribution done by any way other than cash.

15. Section 80GGC – Contribution to Political Parties
Deduction on contributions given by any person to Political Parties
Deduction under section 80GGC is allowed to an individual taxpayer for any amount contributed to a political party or an electoral trust. It is not available for
companies, local authorities and an artificial juridical person wholly or partly
funded by the government. You can avail this deduction only if you pay by any
way other than cash.
16. Section 80RRB – Royalty of a Patent
Deduction with respect to any Income by way of Royalty of a Patent
80RRB Deduction for any income by way of royalty for a patent, registered on
or after 1 April 2003 under the Patents Act 1970, shall be available for up to
Rs.3 lakh or the income received, whichever is less. The taxpayer must be an
individual patentee and an Indian resident. The taxpayer must furnish a certificate in the prescribed form duly signed by the prescribed authority.
17. Section 80 TTB – Interest Income
Deduction of Interest on Deposits for Senior Citizens
A new section 80TTB has been inserted vide Budget 2018 in which deductions
with respect to interest income from deposits held by senior citizens will be allowed. The limit for this deduction is Rs.50,000.
No further deduction under section 80TTA shall be allowed. In addition to
section 80 TTB, section 194A of the Act will also be amended so as to increase the threshold limit for TDS on interest income payable to senior citizens. The
earlier limit was Rs 10,000, which was increased to Rs 50,000 as per the latest
Budget.

18. Deductions-Summary
Section 80 Deduction Table
Section Deduction on
Allowed Limit
(maximum) FY
2018-19
80C
Investment in PPF
– Employee’s share of PF contribution
– NSCs – Life Insurance Premium payment
– Children’s Tuition Fee
– Principal Repayment of home loan – Investment in Sukanya Samridhi Account
– ULIPS
– ELSS
– Sum paid to purchase deferred annuity – Five year deposit scheme
– Senior Citizens savings scheme
– Subscription to notified securities/notified deposits scheme
– Contribution to notified Pension Fund set
up by Mutual Fund or UTI.
– Subscription to Home Loan Account scheme of the National Housing Bank
– Subscription to deposit scheme of a public
sector or company engaged in providing housing finance
– Contribution to notified annuity Plan of
LIC
– Subscription to equity shares/ debentures of an approved eligible issue
– Subscription to notified bonds of
NABARD
Rs. 1,50,000
80CCC
For amount deposited in annuity plan of LIC
or any other insurer for a pension from a fund referred to in Section 10(23AAB)
-
80CCD(1) Employee’s contribution to NPS account
(maximum up to Rs 1,50,000) -
80CCD(2) Employer’s contribution to NPS account Maximum up to 10%
of salary
80CCD(1B) Additional contribution to NPS Rs. 50,000

Section Deduction on
Allowed Limit
(maximum) FY
2018-19
80TTA(1) Interest Income from Savings account Maximum up to
10,000
80TTB Exemption of interest from banks, post
office, etc. Applicable only to senior citizens
Maximum up to
50,000
80GG For rent paid when HRA is not received
from employer
Least of :
– Rent paid minus 10% of total income
– Rs. 5000/- per
month – 25% of total income
80E Interest on education loan
Interest paid for a
period of 8 years
80EE Interest on home loan for first time home
owners Rs 50,000
80CCG Rajiv Gandhi Equity Scheme for
investments in Equities
Lower of
– 50% of amount
invested in equity
shares; or – Rs 25,000
80D
Medical Insurance – Self, spouse, children
Medical Insurance – Parents more than 60
years old or (from FY 2015-16) uninsured
parents more than 80 years old
– Rs. 25,000
– Rs. 50,000
80DD
Medical treatment for handicapped dependent or payment to specified scheme
for maintenance of handicapped dependent
– Disability is 40% or more but less than 80%
– Disability is 80% or more
– Rs. 75,000
– Rs. 1,25,000
80DDB
Medical Expenditure on Self or Dependent Relative for diseases specified in Rule
11DD
– For less than 60 years old – For more than 60 years old
– Lower of Rs 40,000
or the amount
actually paid – Lower of Rs
1,00,000 or the
amount actually paid
80U
Self-suffering from disability :
– An individual suffering from a physical disability (including blindness) or mental
– Rs. 75,000
– Rs. 1,25,000

Section Deduction on
Allowed Limit
(maximum) FY
2018-19
retardation.
– An individual suffering from severe
disability
80GGB Contribution by companies to political
parties
Amount contributed (not allowed if paid in
cash)
80GGC Contribution by individuals to political parties
Amount contributed
(not allowed if paid in
cash)
80RRB Deductions on Income by way of Royalty of a Patent
Lower of Rs 3,00,000 or income received
Frequently Asked Questions
1. Can I claim the 80C deductions at the time of filing return in case I
have not submitted proof to my employer?
Proofs for making investments are submitted to the employer before the end of a Financial Year (FY) so that the employer considers these
investments while determining your taxable income and the tax deduction
that needs to be made. However, even if you miss submitting these proofs
to your employer, the claim for such investments made can be done at the time of filing your return of income as long as these investments have
been made before the end of the relevant FY.
2. I have made an 80C investment on 30 April 2018. For which year can I
claim this investment as a deduction?
You can claim deduction for investments made in the return of income
for the year in which you have made the investment. Therefore, if you have made the investment on 30 April 2018, you will be eligible to claim
such investment as a deduction during FY 2018-19.
3. I have availed a loan from my employer for pursuing higher education. Can I claim the interest paid on such loan as a deduction under Section
80E?
A deduction of interest paid on education loan under Section 80E can be made only if the loan has been availed from a financial institution for
pursuing higher education. Therefore, availing a loan from your employer
will not entitle you to claim the interest under Section 80E.
4. Is there any restriction or maximum limit upto which I can claim a
deduction under Section 80E?
Law has not prescribed any upper limit for making a claim of deduction
under Section 80E. Hence, the actual interest paid during a year can be
claimed as a deduction.
5. Can a company or a firm take the benefit of Section 80C?
The provisions of Section 80C apply only to individuals or a Hindu
Undivided Family (HUF). Hence, a company or a firm cannot take the
benefit of Section 80C.
6. I have been paying life insurance premium to a private insurance
company. Can I claim 80C deduction for the premium paid?
Deduction under Section 80C is available in respect of life insurance
premium paid to any insurer approved by the Insurance Regulatory and
Development Authority of India, whether public or private. Hence, the insurance premium you are paying will also help you claim an 80C
deduction.
7. In which year can I claim deduction of the stamp duty paid for
purchase of a house property
You can go ahead claiming the stamp duty for purchase of a house in the
year in which the payment is made towards stamp duty under Section
80C.
8. Can a company claim a deduction for donations made under Section
80G
Any taxpayer making donations towards specified institutions, funds etc
will be eligible to claim a deduction under Section 80G.
9. I am paying medical insurance premium for a medical policy taken in my name, my wife and children. I am also paying premium on a medical
policy taken in the name of my parents who are above 60 years. Can I
claim a deduction for both premiums paid?
The premium you have paid on the policy taken for yourself, spouse and
children is eligible for a deduction under Section 80D upto a maximum of
Rs 25,000. In addition to this, you will also be eligible to claim deduction

of premium paid on the policy taken for your senior citizen parents upto a maximum of Rs 50,000 (this limit was Rs 30,000 until FY 2017-18.
Hence, you can claim both premiums paid as a deduction under Section
80D.
10. Is my FD interest exempt under Section 80TTB?
If you are a senior citizen above 60 years of age, then your interest
income from a Fixed Deposit is exempt under Section 80TTB.
All Articles
1. Section 80M of the Income Tax Act- Inter corporate dividends
Section 80M has been inserted in the Finance Act by our FM Nirmala
Sitharaman in the Union Budget 2020. Read our detailed article on
section 80M.
2. ppf-calculator-amp
PPF calculator AMP
3. Allowances and deductions available to a salaried person & documents
they need to submit to avail them
Read about the allowances and deductions available to a salaried person
and documents they need to submit to avail them in this article.
4. NPS subscribers can self-certify their FATCA declaration online
Every NPS account holder who has opened the account on or after 1 July
2014 must self-certify to comply with FATCA. Read here to know more.
5. Section 80EEB – Deduction in respect of interest paid on loan taken for
the purchase of electric vehicle
A new section 80EEB has been introduced allowing a deduction for
interest paid on loan taken for the purchase of electric vehicles. Read to
know more.
6. Section 80EEA – Deduction for interest paid on home loan for affordable
housing

The government has now extended the interest deduction allowed for low-cost housing loans under section 80EEA. Read here to know more
about 80EEA.
7. NPS Login (National Pension Scheme) – NSDL & Karvy Login Process
Read here to more about the NPS Login, registration methods. Also, how
to login into E-NPS account through NSDL, KARVY and internet
banking.
8. 5 Tax savers over and Above the 80C Limit
Apart from the deductions available under Section 80C, there are various
other Section 80 deductions that can also be claimed to save on income tax. These deductions include health insurance premiums, tax benefits on
home loans
9. Income Tax Deductions under Sec 80 CCD(1B)
Section 80 CCD (1B) is one such deduction which pertains to the
contributions made towards NPS. Read on to know more on NPS and
NPS account types.
10. Deductions under Section 80GGB
To encourage more contributions towards political parties, there is a
provision of exemption from taxation under Sec 80 GGB. Kow more on
Tax deductions and conditions to claim.
11. Section 80CCC of the Income Tax Act 1961
Section 80CCC of the Income Tax Act provides deductions of up to Rs.
1.5 lakhs per annum. Read on to know more on eligibility, section 10
(23AAB) & more.
12. Deductions under Section 80CCD of Income Tax
Contributions made to the National Pension Scheme (NPS) or the Atal Pension Yojana (APY) comes under 80CCD deductions. Know more on
this and Section 80CCD (1) & (2).

13. Deductions under Section 80RRB
Royalty payment is one source of income for many citizens. Income Tax deduction on these royalty payments is 80RRB. Know more about
eligibility and deductions under 80RRB.
14. NPS ( National Pension Scheme ) – NPS Login, Scheme & Benefits of
NPS
NPS - National Pension Scheme is a government-sponsored pension
scheme account is a tax saving option under Section 80C. Know about its
NPS Login, Tax Benefits, Contribution, what is NPS (National Pension
System). Visit now for more information on ClearTax.
15. Medical Insurance ( Section 80D ) – Applicability, Deductions & Policies
Read this article to know about medical insurance under Section 80D, its
applicability, quantum of deductions, preventive health check up and
other health insurance policies.
16. Post Office Fixed Deposit – Interest Rates & Benefits
The post office fixed deposit (POFD), also known as ‘post office time
deposit’ is a convenient alternative to the fixed deposits provided by
banks. Know more about the Features & Benefits, benefits for senior
citizens and Post Office Interest Rates tables
17. How to Open a Sukanya Samriddhi Yojana Account in HDFC ?
Open Sukanya Samriddhi Account with HDFC Bank for your Girl child
at an attractive interest rate of 8.4% which is fully exempted from tax
under section 80C. Read this article to known more about how to open
Sukanya Samriddhi Account with HDFC Bank.
18. Unit Link Insurance Plan ( ULIP )
ULIP is an investment product that also gives insurance benefits.In ULIP,
a part of the money goes towards insurance and the rest towards
investments.
19. Section 80TTB Deduction for Senior Citizens – Budget 2018
Budget 2018 introduced Section 80TTB which provides for a deduction of Rs 50000 from total income of senior citizens of interest from bank
deposits. Read on

20. Section 80P – Deduction for Co-operative Societies
One of the deductions available under Chapter Vi A is section 80P which
is available for co-operative societies. Read more on eligible deductions,
exception
21. Superannuation – How it Works, Types and Tax Benefits
Superannuation benefit is among the retirement benefits offered to
employees by their employers where employer contributes for /on behalf
of employees.
22. Sukanya Samriddhi Yojana ( SSY ) – Eligibility, Tax Benefits & Rules
To further the objective of the Beti Bachao Beto Padhao initiative, the
government launched Sukanya Samriddhi Yojna ( SSY account ).
Investment in this scheme allows a tax benefit under Section 80C upto Rs
1.5 lakhs.
23. Senior citizen savings scheme ( SCSS )
The Senior Citizens Savings Scheme (SCSS) is primarily for senior
citizens of India that offers regular income. Read more about fixed deposit Interest rates, Eligibility, benefits, investment amount, Banks
applicable and how to open the SCSS account.
24. Post Office Saving Schemes – Overview, Plans & Benefits
The Post Office Saving Schemes come under central government run
savings portfolio that offer a high amount of reliability. Read on to know
more about its tax saving plans, interest rates & benefits.
25. Section 80U – Tax Deduction for Disabled Individuals
The article gives a detailed understanding on the kinds of disabilities and
eligibility for claiming deductions. It also lays out the difference between
section 80DD and Section 80U
26. Tax Saving Calculator
Tax Saving Calculator

27. Budget 2018 – Section 80AC
There is a proposal in Budget 2018 that no deduction under Section 80IA
to 80RRB would be available if the return of income is not filed within
the due date
28. Budget 2018 – Expectations on Section 80C
The individual taxpayers are eagerly hoping that the Budget 2018 be a
more common man friendly one when compared to that of last year...
Section 80C
29. UAN – Know About Universal Account Number
Universal Account Number / UAN is a 12 digit identification number to
all employees entitled to EPF. Know more about the features, benefits
and documents required for UAN.
30. All You Need to Know About Saving Income Tax
There're many ways that individuals can save income tax. Learn more
about Section 80 deductions, HUF, Mutual funds, PPF ELSS &amp;
other tax savings schemes
31. What are Zero Coupon Bonds? Who Should Invest in Them?
Zero coupon bonds are bonds that don't offer interest, but can be purchased at a discount on the face value. Find out who should invest in
them.
32. Home Loan Taken from Friends or Relatives
Have you taken home loan from any of your friends and relatives? This
article will help you understand the deduction that can be claimed for the
repayments.
33. Section 80CCG – Phasing Out of RGESS
The deduction under section 80CCG i.e Rajiv Gandhi Equity Savings
Scheme ( RGESS ) available under Chapter 6A has been discontinued
starting from 1st April 2017.
34. How to Reach Rs 1,50,000 under Section 80C with No Investments?
Find out how to reach Rs. 1,50,000 under section 80C with no investments. Check out how section 80c offers tax relief on some of your
expenses.

35. Tax Benefit to Employee on Medical Reimbursement of up to Rs.15,000
Find out the income tax benefits to Employee on Medical
Reimbursements. Check out how much amount can be claimed under
medical expenses deduction.
36. Section 80TTA – All about Claiming Deduction on Interest
Find out which deductions are allowed and which are not under section
80TTA. Check out how can you claim this deduction and the maximum
deduction allowed.
37. Section 80GG Deduction for Rent Paid
Find out how you can claim deductions under section 80gg for rent paid.
Check out the conditions that must be fulfilled and deductions under this
section.
38. Who can claim a deduction under section 80DD?
Find out if you are eligible to claim a deduction under section 80DD or
not. Check out the conditions you must meet to avail this deduction for ay
2016-17
39. Should I include employer’s contribution to NPS in my taxable salary?
FInd out if you should include employer’s contribution to NPS in your taxable salary. Check out if you can claim deduction on employer’s
contribution.
40. How to Get a Certificate for Claiming Deduction under Section 80DDB
Deductions Under Section 80DDB can be claimed with respect to the
expenses incurred in medical expenses. Know more on how to claim and
whom to take the certificate from.
41. How to save tax when you miss the income tax proof submission
deadline
You can claim deductions and save tax even when you have missed
income tax proof submission deadline. Find out how you can do this.

42. Tax Benefits on Children Education Allowance, Tuition fees & School
Fees
Find out the tax benefits on children education allowance, tuition fees &
school fees. Know about the tuition and fees deduction under section 80c.
43. Best Tax Saving Investment option under Sec 80C
Find out the Investments and payments that are eligible for 80C
deductions. Compare the popular 80C investments in terms of risk,
returns, lock-in.
44. Tax Benefit on Stamp Duty & Registration Charges of a Property
Find out the stamp duty exemption & registration charges which are
related to the transfer of property are allowed as a deduction under
Section 80C.
45. Section 80EE Income Tax Deduction for Interest on Home Loan
Section 80EE allows tax benefits for first time home buyers. Income tax
deduction can be claimed on home loan interest. want to know more
about the income tax india, tax benefits on home loan and deduction on
home loan,interest on home loans and Income Tax Deduction
46. Donations Eligible Under Section 80G and 80GGA
Find out the mode of payment and eligible donations under section 80g
and 80gga deductions. Check the list of Prescribed funds & institutions
under 80g
47. Section 80E Income Tax Deduction or Interest on Education Loan
Find out the Tax Benefits of Education Loan under Section 80E Income
Tax deductions. See if you are eligible to claim this deduction.
48. Budget 2017- Partial withdrawal from NPS exempt from tax
Partial NPS withdrawals will be tax free - Budget 2017. Find out the
withdrawal limit and tax treatment on or before retirement and upon
death of Subscriber

49. How to add i-SIP URN number in SBI Netbanking
Step by step guide on how to add i-sip URN number for mutual fund
investments in your SBI netbanking.
50. How to add i-SIP URN number in Kotak Netbanking
Here is a Step by step guide on how to add i-sip URN number for mutual
fund investments in your kotak netbanking account.
51. Making the most of your Public Provident Fund (PPF)
PPF is very popular with its twin benefits of tax saving and long term
secure investment. clearTax totally recommends it!
52. Can I pay rent to my parents to save tax?
'Claim HRA when living in parent's house. How to save tax on HRA by
paying rent to parents. Download and prepare rent receipts from parents.'
53. Tax saving under Section 80C
Investments and payments that are eligible tax-saving deductions under
Section 80C. A taxpayer can save up to Rs 1.5 lakh by availing these
deductions.
54. What to do when you miss the income tax proof submission deadline
Claim Deductions and Save Tax even when you missed income tax proof
submission deadline
55. Section 87A Tax Rebate for FY 2017-18 & for FY 2016-17
Find out Who can claim Income Tax Rebate U/s. 87a for FY 2017-18 and
FY 2016-17. Know how to claim section 87A rebate in ClearTax
Software.
56. Saving tax on charitable donations
If you have been a generous soul in the past year, you can save some
amount of tax. clearTax tells you how!

57. Saving tax if you pay Interest on Home Loan
Did you know you can save on tax if you have a Home Loan? Read on to
find out more!
58. Section 80E Deduction for Interest on Education Loan
The Section 80E Deduction (for interest paid on loan taken for higher
education) explained, how you can save on the tax you are paying

Assessment of Firm and Partners
Partnership firm is taxable as a separate entity under the Income Tax Act. It
may be registered or unregistered.
¾The rate of tax is flat 35% plus 10% surcharge plus education cess 2%
¾The partnership firm can be assessed either as – Partnership firm assessed as such (PFAS) or Partnership firm assessed as Association of Persons (PFAOP).
¾In order to partnership firm to be assessed as PFAS, it has to fulfill certain
conditions as stated u/s 184 of the Income Tax Act, which are as follows – •The partnership firm must be evidenced by the Partnership Deed •Individual
shares of the partners must be specified in such deed.
•Certified copy of such deed must be filed with the first return of income filed
with the Income tax department. •In case of change in the constitution, above 3 conditions need to be fulfilled
again.
•In case the firm fails to do the following compliances, it will result in
disallowance of expenses relating to remuneration paid / payable to the partners of the firm.
¾ Rules regarding allowing remuneration to partners are as follows –
•Such remuneration must be authorized by the deed of partnership. •It must be paid to working partners only.
•It can not be paid for the period prior to the date of such deed
•Further maximum remuneration subject to above is restricted depending upon
the nature of business / profession •Maximum interest payable to partners can be @12%
¾Restrictions on maximum remuneration payable to partners are as follows –
•Maximum remuneration payable is different for specified and non-specified professions.
•Specified professions include – legal, engineering, medical, architect
profession, accountancy profession, company secretary, interior decorator etc.
¾Remuneration payable to partners is calculated on book profit which is profit as per profit & loss account adjusted as per income tax provisions plus
remuneration debited to profit & loss account. ¾The share of profits received by
the partner is exempt in his hands while salary & interest received is taxable under business head. Losses of firms are separate losses and can not be
apportioned to partners. ¾In case of PFAOP, tax is payable at maximum
marginal rate, if the shares of members are not known. ¾In PFAOP, partner’s
share is not included in his total income if firm has paid tax highest marginal rate. It is included for rate purposes, if tax is paid at normal rates, while it is
fully taxable if firm has not paid any taxes.

MODULE-5
DIRECT AND INDIRECT TAXES
A tax may be defined as a "pecuniary burden laid upon individuals or property owners to support the government, a payment exacted by legislative authority.
A tax "is not a voluntary payment or donation, but an enforced contribution,
exacted pursuant to legislative authority".
Taxes consist of direct tax or indirect tax, and may be paid in money or as its
labour equivalent (often but not always unpaid labour). India has a well developed taxation structure.
The tax system in India is mainly a three tier system which is based between the
Central, State Governments and the local government organizations. In most cases, these local bodies include the local councils and the municipalities.
According to the Constitution of India, the government has the right to levy
taxes on individuals and organizations. However, the constitution states that no one has the right to levy or charge taxes except the authority of law. Whatever
tax is being charged has to be backed by the law passed by the legislature or the
parliament.
Article 246 (SEVENTH SCHEDULE) of the Indian Constitution, distributes
legislative powers including taxation, between the Parliament and the State
Legislature. Schedule VII enumerates these subject matters with the use of three lists;
•List- I entailing the areas on which only the parliament is competent to makes
laws,
•List - II entailing the areas on which only the state legislature can make laws,
and
•List - III listing the areas on which both the Parliament and the State
Legislature can make laws upon concurrently. Separate heads of taxation are
provided under lists I and II of Seventh Schedule of Indian Constitution. There is no head of taxation in the Concurrent List (Union and the States have no
concurrent power of taxation).
Any tax levied by the government which is not backed by law or is beyond the powers of the legislating authority may be struck down as unconstitutional. The

thirteen heads List-I of Seventh Schedule of Constitution of India covered under Union taxation, on which Parliament enacts the taxation law,
are as under: •Taxes on income other than agricultural income;
•Duties of customs including export duties;
•Duties of excise on tobacco and other goods manufactured or produced in India
except (i) alcoholic liquor for human consumption, and
(ii) opium, Indian hemp and other narcotic drugs and narcotics, but including
medicinal and toilet preparations containing alcohol or any substance included in (ii);
•Corporation Tax;
•Taxes on capital value of assets, exclusive of agricultural land, of individuals
and companies, taxes on capital of companies; •Estate duty in respect of property other than agricultural land;
•Duties in respect of succession to property other than agricultural land;
•Terminal taxes on goods or passengers, carried by railway, sea or air; taxes on railway fares and freight;
•Taxes other than stamp duties on transactions in stock exchanges and futures
markets;
•Taxes on the sale or purchase of newspapers and on advertisements published therein;
•Taxes on sale or purchase of goods other than newspapers, where such sale or
purchase takes place in the course of inter-State trade or commerce; •Taxes on the consignment of goods in the course of inter-State trade or
commerce.
•All residuary types of taxes not listed in any of the three lists of Seventh
Schedule of Indian Constitution. 71 The nineteen heads
List-II of Seventh Schedule of the Indian Constitution covered under State
taxation, on which State Legislative enacts the taxation law, are as under:
•Land revenue, including the assessment and collection of revenue, the
maintenance of land records, survey for revenue purposes and records of rights, and alienation of revenues;
•Taxes on agricultural income;
•Duties in respect of succession to agricultural income;
•Estate Duty in respect of agricultural income; •Taxes on lands and buildings;
•Taxes on mineral rights;
•Duties of excise for following goods manufactured or produced within the State
(i) alcoholic liquors for human consumption, and (ii) opium, Indian hemp and other narcotic drugs and narcotics;
•Taxes on entry of goods into a local area for consumption, use or sale therein;
•Taxes on the consumption or sale of electricity; •Taxes on the sale or purchase of goods other than newspapers;
•Taxes on advertisements other than advertisements published in newspapers
and advertisements broadcast by radio or television;
•Taxes on goods and passengers carried by roads or on inland waterways; •Taxes on vehicles suitable for use on roads;
•Taxes on animals and boats;
•Tolls; •Taxes on profession, trades, callings and employments;
• Capitation taxes;
•Taxes on luxuries, including taxes on entertainments, amusements, betting and
gambling; •Stamp duty. Provisions have been made by 73rd Constitutional Amendment,
enforced from 24th April, 1993, to levy taxes by the Panchayat. A State may by
law authorise a Panchayat to levy, collect and appropriate taxes, duties, tolls etc. Similarly, the provisions have been made by 74th Constitutional Amendment,
enforced from 1st June, 1993, to levy the taxes by the Municipalities.
A State Legislature may by law authorise a Municipality to levy, collect and
appropriate taxes, duties, tolls etc.
Direct Taxes:A Direct tax is a kind of charge, which is imposed directly on the
taxpayer and paid directly to the government by the persons (juristic or natural)
on whom it is imposed. A direct tax is one that cannot be shifted by the taxpayer
to someone else.
The some important direct taxes imposed in India are as under: Income Tax:
Income Tax Act, 1961 imposes tax on the income of the individuals or Hindu
undivided families or firms or co-operative societies (other tan companies) and trusts (identified as bodies of individuals associations of persons) or every
artificial juridical person. The inclusion of a particular income in the total
incomes of a person for income-tax in India is based on his residential status. There are three residential status, viz.,
(i) Resident & Ordinarily Residents (Residents)
(ii) (ii) Resident but not Ordinarily Residents and
(iii) (iii) Non Residents. There are several steps involved in determining the residential status of a
person. All residents are taxable for all their income, including income outside
India. Non residents are taxable only for the income received in India or Income accrued in India. Not ordinarily residents are taxable in relation to income

received in India or income accrued in India and income from business or profession controlled from India.
Corporation Tax: The companies and business organizations in India are taxed
on the income from their worldwide transactions under the provision of Income
Tax Act, 1961. A corporation is deemed to be resident in India if it is
incorporated in India or if it’s control and management is situated entirely in India. In case of non resident corporations, tax is levied on the income which is
earned from their business transactions in India or any other Indian sources
depending on bilateral agreement of that country.
Property Tax: Property tax or 'house tax' is a local tax on buildings, along with
appurtenant land, and imposed on owners. The tax power is vested in the states and it is delegated by law to the local bodies, specifying the valuation method,
rate band, and collection procedures. The tax base is the annual ratable value
(ARV) or area-based rating. Owner-occupied and other properties not producing rent are assessed on cost and then converted into ARV by applying a percentage
of cost, usually six percent. Vacant land is generally exempted from the
assessment. The properties lying under control of Central are exempted from the
taxation. Instead a 'service charge' is permissible under executive order. Properties of foreign missions also enjoy tax exemption without an insistence
for reciprocity.
Inheritance (Estate) Tax: An inheritance tax (also known as an estate tax or
death duty) is a tax which arises on the death of an individual. It is a tax on the
estate, or total value of the money and property, of a person who has died. India
enforced estate duty from 1953 to 1985. Estate Duty Act, 1953 came into existence w.e.f. 15th October, 1953. Estate Duty on agricultural land was
discontinued under the Estate Duty (Amendment) Act, 1984. The levy of Estate
Duty in respect of property (other than agricultural land) passing on death
occurring on or after 16th March, 1985, has also been abolished under the Estate Duty (Amendment) Act, 1985.
Gift Tax: Gift tax in India is regulated by the Gift Tax Act which was
constituted on 1st April, 1958. It came into effect in all parts of the country
except Jammu and Kashmir. As per the Gift Act 1958, all gifts in excess of Rs.
25,000, in the form of cash, draft, check or others, received from one who doesn't have blood relations with the recipient, were taxable. However, with
effect from 1st October, 1998, gift tax got demolished and all the gifts made on
or after the date were free from tax. But in 2004, the act was again revived partially. A new provision was introduced in the Income Tax Act 1961 under
section 56 (2). According to it, the gifts received by any individual or Hindu Undivided Family (HUF) in excess of Rs. 50,000 in a year would be taxable.
Indirect Tax:An indirect tax is a tax collected by an intermediary (such as a
retail store) from the person who bears the ultimate economic burden of the tax
(such as the customer).
An indirect tax is one that can be shifted by the taxpayer to someone else. An
indirect tax may increase the price of a good so that consumers are actually paying the tax by paying more for the products. The some important indirect
taxes imposed in India are as under:
Customs Duty: The Customs Act was formulated in 1962 to prevent illegal imports and exports of goods. Besides, all imports are sought to be subject to a
duty with a view to affording protection to indigenous industries as well as to
keep the imports to the minimum in the interests of securing the exchange rate of Indian currency. Duties of customs are levied on goods imported or exported
from India at the rate specified under the customs Tariff Act, 1975 as amended
from time to time or any other law for the time being in force. Under the custom
laws, the various types of duties are leviable. (1) Basic Duty: This duty is levied on imported goods under the Customs Act,
1962.
(2) Additional Duty (Countervailing Duty) (CVD): This is levied under section 3 (1) of the Custom Tariff Act and is equal to excise duty levied on a like
product manufactured or produced in India. If a like product is not
manufactured or produced in India, the excise duty that would be leviable on
that product had it been manufactured or produced in India is the duty payable. If the product is leviable at different rates, the highest rate among those rates is
the rate applicable. Such duty is leviable on the value of goods plus basic
custom duty payable.
(3) Additional Duty to compensate duty on inputs used by Indian manufacturers: This is levied under section 3(3) of the Customs Act.
(4) Anti-dumping Duty: Sometimes, foreign sellers abroad may export into
India goods at prices below the amounts charged by them in their domestic markets in order to capture Indian markets to the detriment of Indian industry.
This is known as dumping.
In order to prevent dumping, the Central Government may levy additional duty
equal to the margin of dumping on such articles. There are however certain restrictions on imposing dumping duties in case of countries which are
signatories to the GATT or on countries given "Most Favoured Nation Status" under agreement.
(5) Protective Duty: If the Tariff Commission set up by law recommends that in order to protect the interests of Indian industry, the Central Government may
levy protective anti-dumping duties at the rate recommended on specified
goods.
(6) Duty on Bounty Fed Articles: In case a foreign country subsidises its
exporters for exporting goods to India, the Central Government may impose
additional import duty equal to the amount of such subsidy or bounty. If the amount of subsidy or bounty cannot be clearly deter mined immediately,
additional duty may be collected on a provisional basis and after final
determination, difference may be collected or refunded, as the case may be.
(7) Export Duty: Such duty is levied on export of goods. At present very few
articles such as skins and leather are subject to export duty. The main purpose
of this duty is to restrict exports of certain goods.
(8) Cess on Export: Under sub-section (1) of section 3 of the Agricultural &
Processed Food Products Export Cess Act, 1985 (3 of 1986), 0.5% ad valorem
as the rate of duty of customs be levied and collected as cess on export of all scheduled products.
(9) National Calamity Contingent Duty: This duty was imposed under Section 134 of the Finance Act, 2003 on imported petroleum crude oil. This tax was
also leviable on motor cars, imported multi-utility vehicles, two wheelers and
mobile phones.
(10) Education Cess: Education Cess is leviable @ 2% on the aggregate of
duties of Customs (except safeguard duty under Section 8B and 8C, CVD under
Section 9 and anti-dumping duty under Section 9A of the Customs Tariff Act,
1985). Items attracting Customs Duty at bound rates under international commitments are exempted from this Cess.
(11) Secondary and Higher Education Cess: Leviable @1% on the aggregate of duties of Customs.
(12) Road Cess: Additional Duty of Customs on Motor Spirit is leviable and Additional Duty of Customs on High Speed Diesel Oil is leviable by the
Finance Act (No.2), 1998. and the Finance Act, 1999 respectively.
(13) Surcharge on Motor Spirit: Special Additional Duty of Customs
(Surcharge) on Motor Spirit is leviable by the Finance Act, 2002. Central

Excise Duty: The Central Government levies excise duty under the Central Excise Act, 1944 and the Central Excise Tariff Act, 1985. Central excise duty is
tax which is charged on such excisable goods that are manufactured in India and
are meant for domestic consumption. The term "excisable goods" means the goods which are specified in the First Schedule and the Second Schedule to the
Central Excise Tariff Act 1985. It is mandatory to pay Central Excise duty
payable on the goods manufactured, unless exempted eg; duty is not payable on
the goods exported out of India. Further various other exemptions are also notified by the Government from the payment of duty by the manufacturers.
Various Central Excise are:
(1) Basis Excise Duty: Excise Duty, imposed under section 3 of the ‘Central
Excises and Salt Act’ of 1944 on all excisable goods other than salt produced or
manufactured in India, at the rates set forth in the schedule to the Central Excise
tariff Act, 1985, falls under the category of Basic Excise Duty In India.
(2) Special Excise Duty: According to Section 37 of the Finance Act, 1978,
Special Excise Duty is levied on all excisable goods that come under taxation, in line with the Basic Excise Duty under the Central Excises and Salt Act of
1944. Therefore, each year the Finance Act spells out that whether the Special
Excise Duty shall or shall not be charged, and eventually collected during the
relevant financial year.
(3) Additional Duty of Excise: Section 3 of the ‘Additional Duties of Excise
Act’ of 1957 permits the charge and collection of excise duty in respect of the goods as listed in the Schedule of this Act.
(4) Road Cess: (a) Additional Duty of Excise on Motor Spirit: This is leviable
by the Finance Act (No.2), 1998. (b) Additional Duty of Excise on High Speed Diesel Oil: This is leviable by the Finance Act, 1999.
(5) Surcharge: (a) Special Additional Duty of Excise on Motor Spirit: This is
leviable by the Finance Act, 2002. (b) Surcharge on Pan Masala and Tobacco Products: This Additional Duty of Excise has been imposed on cigarettes, pan
masala and certain specified tobacco products, at specified rates in the Budget
2005-06. Biris are not subjected to this levy.
(6) National Calamity Contingent Duty (NCCD): NCCD was levied on pan
masala and certain specified tobacco products vide the Finance Act, 2001. The
Finance Act, 2003 extended this levy to polyester filament yarn, motor car, two wheeler and multi-utility vehicle and crude petroleum oil.
(7) Education Cess: Education Cess is leviable @2% on the aggregate of duties of Excise and Secondary and Higher Education Cess is Leviable @1% on the
aggregate of duties of Excise.
(8) Cess - A cess has been imposed on certain products. Service Tax: The
service providers in India except those in the state of Jammu and Kashmir are
required to pay a Service Tax under the provisions of the Finance Act of 1994. The provisions related to Service Tax came into effect on 1st July, 1994. Under
Section 67 of this Act, the Service Tax is levied on the gross or aggregate
amount charged by the service provider on the receiver. However, in terms of
Rule 6 of Service Tax Rules, 1994, the tax is permitted to be paid on the value received. The interesting thing about Service Tax in India is that the
Government depends heavily on the voluntary compliance of the service
providers for collecting Service Tax in India. Sales Tax: Sales Tax in India is a form of tax that is imposed by the Government on the sale or purchase of a
particular commodity within the country. Sales Tax is imposed under both,
Central Government (Central Sales Tax) and State Government (Sales Tax)
Legislation. Generally, each State follows its own Sales Tax Act and levies tax at various rates. Apart from sales tax, certain States also imposes additional
charges like works contracts tax, turnover tax and purchaser tax. Thus, Sales
Tax Acts as a major revenue-generator for the various State Governments. From 10th April, 2005, most of the States in India have supplemented sales tax with a
new Value Added Tax (VAT).
Value Added Tax (VAT): The practice of VAT executed by State Governments
is applied on each stage of sale, with a particular apparatus of credit for the
input VAT paid. VAT in India classified under the tax slabs are 0% for essential commodities, 1% on gold ingots and expensive stones, 4% on industrial inputs,
capital merchandise and commodities of mass consumption, and 12.5% on other
items. Variable rates (State-dependent) are applicable for petroleum products,
tobacco, liquor, etc. VAT levy will be administered by the Value Added Tax Act and the rules made there-under and similar to a sales tax. It is a tax on the
estimated market value added to a product or material at each stage of its
manufacture or distribution, ultimately passed on to the consumer. Under the
current single-point system of tax levy, the manufacturer or importer of goods into a State is liable to sales tax. There is no sales tax on the further distribution
channel. VAT, in simple terms, is a multi-point levy on each of the entities in
the supply chain. The value addition in the hands of each of the entities is subject to tax. VAT can be computed by using any of the three methods:
(a) Subtraction method: The tax rate is applied to the difference between the
value of output and the cost of input.
(b) The Addition method: The value added is computed by adding all the
payments that is payable to the factors of production (viz., wages, salaries, interest payments etc).

(c) Tax credit method: This entails set-off of the tax paid on inputs from tax collected on sales. Securities Transaction Tax (STT): STT is a tax being levied
on all transactions done on the stock exchanges. STT is applicable on purchase
or sale of equity shares, derivatives, equity oriented funds and equity oriented Mutual Funds. Current STT on purchase or sell of an equity share is 0.075%. A
person becomes investor after payment of STT at the time of selling securities
(shares). Selling the shares after 12 months comes under long term capital gains
and one need not have to pay any tax on that gain. In the case of selling the shares before 12 months, one has to pay short term capital gains @10% flat on
the gain. However, for a trader, all his gains will be treated as trading (Business)
and he has to pay tax as per tax sables. In this case the transaction tax paid by him can be claimed back/adjusted in tax to be paid. The overall control for
administration of Direct Taxes lies with the Union Finance Ministry which
functions through Income Tax Department with the Central Board of Direct
Taxes (CBDT) at its apex.
The CBDT is a statutory authority functioning under the Central Board of Revenue Act, 1963. It also functions as a division of the Ministry dealing with
matters relating to levy and collection of Direct Taxes.
The Central Excise Department spread over the entire country administers and collects the central excise duty. The apex body that is responsible for the policy
and formulation of rules is the Central Board of Excise and Customs which
functions under the control of the Union Finance Ministry. The Central Excise officers are also entrusted with the administration and collection of Service tax
and the Customs duty. The information contained in this chapter is related to
direct and indirect taxes imposed and collected by the Union Government. The
tables giving data from 2000-01 onwards in respect direct taxes (corporation tax, income tax and other direct taxes) collected by Central Board of Direct Tax
(CBDT) and indirect taxes (customs duties, union excise duties and service tax)
collected by Central Board of Excise and Customs.
Customs Collection Rate used in this chapter is defined as the ratio of revenue
collection (basic customs duty + countervailing duty) to value of imports (in per cent) unadjusted for exemptions, expressed in percentage.
Highlights of the Direct and Indirect Taxes:
•The total revenue realization from Direct and Indirect Taxes increased from `
1881.19 billion in 2000-01 to `6076.45 billion in 2008-09. The percentage share of revenue realization from direct taxes to the total
revenue realization increased from 36.3% in 2000-01to 55.7% in 2008-09,
whereas, the percentage share of revenue realization from indirect taxes declined from 63.7% in 2000-01 to 44.3% in 2008-09.
•Revenue collection from direct taxes increased from ` 683.05 billion in 2000-01 to ` 3382.12 billion in 2008-09. The percentage share of revenue realization
from corporation tax to the total revenue realization from direct taxes increased
from 52.3% in 2000-01to 63.2% in 2008-09, whereas, the percentage share of
revenue realization from income tax decreased from 46.5% in 2000-01 to 36.7% in 2008-09.
•Revenue collection from indirect taxes increased from ` 1198.14 billion in 2000-01 to ` 2446.67 billion in 2009-10. The percentage share of revenue
realization from customs duties to the total revenue realization from indirect
taxes decreased from 39.7% in 2000-01 to 34.5% in 2009-10, whereas, the
percentage share of revenue realization from excise duties declined from 57.2% in 2000-01 to 42.1% in 2009-10. , However, the percentage share of revenue
realization from service tax to the total revenue realization from indirect taxes
increased substantially from 2.2% in 2000-01 to 23.5% in 2009-10. 75
•The total number of effective assessees of income tax and corporation tax
increased from 23.00 million in 2000-01 to 32.65 million in 2008-09. The
companies’ assessees declined from 334261 in 2000-01 to 327674 in 2008-09, whereas, the number of individual assessees and assessees of Hindu un-divided
Families of income tax increased 20.66 million and 0.55 million respectively in
2000-01 to 30.10 million and 0.77 million in 2008-09. The assesses of firms declined from 1.34 million to 1.31 million during same period, whereas, trusts’
assesses increased from 0.064 million in 2000-01 to 0.071 million in 2008-09.
However, the other asssessees increased from 0.051 million to 0.071 million
during same period.
•The customs collection rate gradually decreased from 20.2% in 2000-01 to
6.9% in 2008-09. Customs collection rate of petroleum products decreased from
10% in 2004-05 to 3% in 2008-09, whereas, customs collection rate of non-petroleum products decreased from 12% in 2004-05 to 9% in 2008-09.
•About 34% of total import duties were realized from machineries, whereas, 10.8%, 9.0%, 8.5% and 7.7% of the total import duties were realized from Gold
& articles other than Gold, petroleum products, chemicals and iron & steel
respectively during 2009-10. •About 62.2% of total excise duties was realized
from petroleum crude and petroleum products, whereas, 13.5% and 9.4% of the total excise duties were realized from tobacco products and Iron & steel and
articles thereof respectively during 2009-10.

•7% of total service tax was realized from telephone billing, whereas, 6.9%, 6.3% and 5.4% of the total service tax were realized from banking and other
financial service, business auxiliary service and general insurance premium
respectively during 2009-10.
KARNATAKA ACT NO. 32 OF 2004
THE KARNATAKA VALUE ADDED TAX ACT, 2003
AND
THE KARNATAKA VALUE ADDED TAX RULES, 2005

KARNATAKA ACT NO. 32 OF 2004
THE KARNATAKA VALUE ADDED TAX ACT, 2003
Arrangement of Sections
Sections: Page No.
Chapter I
Introduction
1. Short title, extent and commencement 219
2. Definitions 219
Chapter II
The incidence and levy of tax
3. Levy of tax 225
4. Liability to tax and rates thereof 225
5. Exemption of tax 225
6. Place of sale of goods 225
7. Time of sale of goods 226
8. Agents liable to pay tax 226
9. Collection of tax by registered dealers, Governments and statutory
authorities 227
9A. Deduction of tax at source (in case of works contract) 227
10. Output tax, input tax and net tax 228
11. Input tax restrictions 229
12. Deduction of input tax in respect of Capital goods 229
13. Pre-registration purchases 230
14. Special rebating scheme 230
15. Composition of tax 230
16. Special accounting scheme 231
17. Partial rebate 231
18. Transitional provisions 231
19. Change in use after deduction of input tax 231
20. Deduction of input tax on exports and interstate sales, etc. 231
21. Reimbursement of tax 232
Chapter III
Registration
22. Liability to register 232

23. Voluntary registration 233
24. Suo motu registration 233
25. Registration 233
26. Security 234
27. Cancellation of registration 234
28. Obligation of registered dealer to inform changes after registration 234
Chapter IV
Accounts and documents
29. Tax invoices and bills of sale 235
30. Credit and Debit Notes 235
31. Accounts 236
32. Period of retention of accounts 236
33. Electronic records 236
34. Requirement to provide documents and information 237
Chapter V
Administration and collection of tax
35. Returns 237
36. Interest in case of failure to furnish returns or to pay tax declared on
returns or other amounts payable 237
37. Rate of interest 238
38. Assessment of tax 238
39. Re-assessment of tax 239
40. Period of limitation for assessment 239
41. Power of rectification of assessment or re-assessment in certain cases 239
42. Payment and recovery of tax, penalties, interest and other amounts 240
43. Duties of Receivers 241
44. Special provisions relating to companies 242
45. Recovery of tax, penalty, or any other amount, from certain other persons 243
46. Tax payable on transfer of business, assessment of legal representatives, etc 244
47. Payment and disbursement of amounts wrongly collected by dealer as tax 244
48. Tax to be first charge on property 245
49. Period of limitation for recovery of tax 245
50. Payment of interest on refunds 245

51. Power to withhold refund in certain cases 246
52. Production and inspection of documents and powers of entry,
search and seizure 246
53. Establishment of check posts and inspection of goods in movement 248
54. Transit of goods by road through the State and issue of transit pass 252
55. Penalty in case of under-valuation of goods 253
56. Liability to furnish information by certain agents 254
57. Special evidential requirements relating to banks 254
Chapter VI
Authorities and Appellate Tribunal
58. Appointment of Commissioner, Additional Commissioners, Joint
Commissioners, Deputy Commissioners, Assistant Commissioners,
State Representatives and Commercial Tax Officers 254
59. Instructions to Subordinate Authorities 255
60. Clarification and Advance Rulings 255
61. Jurisdiction of officers and change of incumbent of an office 256
Chapter VII
Appeals and Revision
62. Appeals 256
63. Appeal to the Appellate Tribunal 258
64. Revisional powers of Additional Commissioner and Commissioner 260
65. Revision by High Court in certain cases 261
66. Appeal to High Court 262
67. Objections to Jurisdiction 263
68. Petitions, applications and appeals to High Court to be heard by a
Bench of not less than two judges 263
69. Rectification of mistakes 263
70. Burden of proof 263
Chapter VIII
Penalties, Offences and Power to make Rules
71. Penalties relating to registration 264
72. Penalties relating to returns 264
73. Penalties in relation to unauthorised collection of tax 264
74. Penalties relating to the keeping of records 265
75. Penalties relating to production of records and furnishing of information 265

76. Penalties relating to tax invoices, credit notes and debit notes 265
77. Penalties relating to seals and to unaccounted stocks 265
78. Offences against officers 266
79. Fraudulent evasion of tax 266
80. Cognizance of offences 266
81. Disclosure of information 266
82. Compounding offences 267
83. Validity of assessments not to be questioned in prosecution 267
84. Bar and limitation to certain proceedings 267
85. Courts not to set aside or modify assessments except as provided
under this Act 268
86. Appearance before any Authority in proceedings 268
87. Power to summon persons to give evidence 268
88. Power to make rules 268
89. Laying of Rules and notifications before the State Legislature 270
90. Power to remove difficulties 270
FIRST SCHEDULE 270
SECOND SCHEDULE 272
THIRD SCHEDULE 272
FOURTH SCHEDULE 275
FIFTH SCHEDULE 275
STATEMENT OF OBJECTS AND REASONS
I
32 of 2004.- It is considered necessary to introduce Value Added Tax to replace the
present sales tax system in line with the national consensus for bringing in reforms in
commodity taxation. The new legislation provides for the following, namely:-
Widens the tax base by levying tax on sale of goods at every point of sale;
Makes the levy of tax transparent and removes cascading;
Compels issue of tax invoices by dealers indicating the tax charged separately;
Provides for set off of all tax paid at the earlier points in respect of goods sold
(that would include tax paid, defined as input tax on capital goods, raw materials,
components and other inputs including consumables with some restrictions and packing
materials that are used in the re-sale or manufacture or processing of goods being sold)
against tax payable, defined as output tax, at any point, the set off scheme being called as
input rebating;

Tax paid on inputs purchased within the State is provided to be rebated against
goods sold within the State, in the course of inter-State trade;
Provides limited rebating of tax paid in excess of 4% to input used in the goods
sent out of the State on stock or consignment;
Promotes voluntary compliance by providing for acceptance of returns filed by
dealers on self-assessment basis and for scrutiny of books of account only in selected
cases.
Enhances compliance by providing for non-discretionary automatic penalty for
offences of non-compliance and contravention of the various provisions of law; and
Minimises disputes regarding the time of sale by defining the same and thereby
ensuring payment of tax without delay and also requires dealers to issue tax invoices within
reasonable time to the buying dealers.
Certain other incidental and consequential provisions are also made.
Hence the Bill.
[L.A.Bill No. 2 of 2003]
II
6 of 2005.- To give effect to the decisions taken at the national level in the design of
the Value Added Tax that is replacing the present sales tax system.
Opportunity is also taken to make certain other incidental and consequential
provisions.
Hence the Bill.
[LA Bill No. 4 of 2005]
III
11 of 2005.- To give effect to the proposals made in the Budget Speech, it is
considered necessary to amend the Mysore Betting Tax Act, 1932 (Mysore Act IX of 1932),
the Karnataka Sales Tax Act, 1957(Karnataka Act 25 of 1957), the Karnataka
Entertainments Tax Act, 1958(Karnataka Act 30 of 1958), the Karnataka Tax on Professions,
Trades, Callings and Employments Act, 1976(Karnataka Act 35 of 1976), the Karnataka Tax
on Entry of Goods Act, 1979(Karnataka Act 27 of 1979), the Karnataka Tax on Lotteries Act,
2004 (Karnataka Act 3 of 2004), the Karnataka Special Tax on Entry of Certain Goods Act,
2004 (Karnataka Act 29 of 2004) and the Karnataka Value Added Tax Act, 2003 (Karnataka
Act 32 of 2004).
Opportunity is also taken to rationalize certain provisions of the said Acts.
Hence the Bill.
[LA Bill No. 12 of 2005]

KARNATAKA ACT NO. 32 OF 2004
(First published in the Karnataka Gazette Extraordinary on the twentythird day of December 2004)
THE KARNATAKA VALUE ADDED TAX ACT, 2003
(Received the assent of the President on the fifteenth day of December, 2004)
(As amended by Act 6 of 2005 and 11 of 2005)
An Act to provide for further levy of tax on the purchase or sale of goods in the State
of Karnataka.
Be it enacted by the Karnataka State Legislature in Fifty-fourth year of the Republic
of India, as follows:-
Chapter I
Introduction
Short title, extent and commencement.- (1) This Act may be called the
Karnataka Value Added Tax Act 2003.
It extends to the whole of the State of Karnataka.
It shall come into force on such 1[date] as the Government may, by notification,
appoint and different dates may be appointed for different provisions of the Act. All the provisions of the Act except section 3 and 22 have come into force on 11th March 2005, vide Notification No. FD 55
CSL 2005(1) dated 11-3-2005 (Karnataka Gazette Extraordinary No. 326, Dated 11-3-2005) Sections 3 and 22 have come
into force on 1-4-2005 vide notification FD 55 CSL 2005(2) dated 23-3-2005.
The tax shall be levied on the sale or purchase of goods made after such date as
the Government may, by notification, appoint and different dates may be appointed for
different class or classes of goods.
Definitions.- In this Act unless the context otherwise requires:-
‘Agriculture’ with its grammatical variations includes horticulture, the raising of
crops, grass or garden produce and grazing but does not include dairy farming, poultry
farming, stock breeding and mere cutting of wood.
‘Agriculturist’ means a person who cultivates land personally.
‘Agricultural produce or horticultural produce’ shall not be deemed to include
tea, beedi leaves, raw cashew, timber, wood, tamarind and such produce, except coffee as
has been subject to any physical, chemical or other process for being made fit for
consumption, save mere cleaning, grading, sorting or drying.
‘Appellate Tribunal’ means the Karnataka Appellate Tribunal constituted under
the Karnataka Appellate Tribunal Act, 1976 (Karnataka Act 59 of 1976).
‘Assessment’ means an assessment made or deemed to have been made
under this Act and includes a re-assessment.
1[(5-A) ‘ Branded’ means any goods sold under a name or trade mark registered or
pending registration or pending registration of transfer under the Trade and Merchandise
Marks Act, 1958 (Central Act 43 of 1958) or the Trade Marks Act, 1999 (Central Act 47 of
1999).]
Inserted by Act 6 of 2005 w.e.f. 19.3.2005.
‘Business’ includes:-

any trade, commerce, manufacture or any adventure or concern in the nature of
trade, commerce or manufacture, whether or not such trade, commerce,
manufacture, adventure or concern is carried on in furtherance of gain or profit and
whether or not any gain or profit accrues therefrom; and
any transaction in connection with, or incidental or ancillary to, such trade,
commerce, manufacture, adventure or concern.
‘Capital goods’ means plant, including cold storage and similar plant, machinery,
goods vehicles, equipments, moulds, tools and jigs whose total cost is not less than an
amount to be notified by the Government or the Commissioner, and used in the course of
business other than for sale.
‘Commissioner’ means any person appointed to be a Commissioner of Commercial
Taxes under Section 3 of the Karnataka Sales Tax Act, 1957 (Karnataka Act 25 of 1957).
‘Company’ shall have the meaning assigned to it in the Companies Act, 1956
(Central Act 1 of 1956).
‘To cultivate’ with its grammatical variations and cognate expressions means to
carry on any agricultural operation;
‘To cultivate personally’ means, to cultivate land on one's own account, -
⠀ ⤀Ā ⤀ Ā ⤀ Ā ⤀ Ā ⤀ Ā ⤀ Ā ⤀ Ā ⤀ Ā ⤀ Ā ЀȀ ⠀ ⤀Ā ⤀ Ā ⤀ Ā ⤀ Ā ⤀ Ā ⤀ Ā ⤀ Ā ⤀ by one's own labour, or
⠀ ⤀Ā ⤀ Ā ⤀ Ā ⤀ Ā ⤀ Ā ⤀ Ā ⤀ Ā ⤀ Ā ⤀ Ā ЀȀ ⠀ ⤀Ā ⤀ Ā ⤀ Ā ⤀ Ā ⤀ Ā ⤀ Ā ⤀ Ā ⤀ b
y the labour of one's own family, or
⠀ ⤀Ā ⤀ Ā ⤀ Ā ⤀ Ā ⤀ Ā ⤀ Ā ⤀ Ā ⤀ Ā ⤀ Ā ЀȀ ⠀ ⤀Ā ⤀ Ā ⤀ Ā ⤀ Ā ⤀ Ā ⤀ Ā ⤀ Ā ⤀ b
y servants on wages payable in cash or kind but not in crop share, or by hired
labour under one's personal supervision or the personal supervision of any
member of one's family.
Explanations.- (1) A person who is a widow or a minor or is subject to any physical
or mental disability shall be deemed to cultivate the land personally if it is cultivated by her or
his servants or by hired labour.
In the case of undivided family, the land shall be deemed to have been cultivated
personally, if it is cultivated by any member of such family.
‘Dealer’ means any person who carries on the business of buying, selling, supplying
or distributing goods, directly or otherwise, whether for cash or for deferred payment, or for
commission, remuneration or other valuable consideration, and includes-
an industrial, commercial or trading undertaking of the Government, the Central
Government, a State Government of any State other than the State of Karnataka,
a statutory body, a local authority, company, a Hindu undivided family, an
Aliyasanthana Family, a partnership firm, a society, a club or an association
which carries on such business;
a casual trader, a person who has, whether as principal, agent or in any other
capacity, carries on occasional transactions of a business nature involving the
buying, selling, supply or distribution of goods in the State, whether for cash or for
deferred payment, or for commission, remuneration or other valuable
consideration;

a commission agent, a broker or del credere agent or an auctioneer or any other
mercantile agent by whatever name called, who carries on the business of
buying, selling , supplying or distributing goods on behalf of any principal;
a non-resident dealer or an agent of a non-resident dealer, a local branch of a
firm or company or association situated outside the State ;
a person who sells goods produced by him by manufacture or otherwise;
a person engaged in the business of transfer otherwise than in pursuance of a
contract of property in any goods for cash deferred payment or other valuable
consideration.
a person engaged in the business of transfer of property in goods (whether as
goods or in some other form) involved in the execution of a works contract;
a person engaged in the business of delivery of goods on hire purchase or any
system of payment by installments;
a person engaged in the business of transfer of the right to use any goods for any
purpose (whether or not for a specified period) for cash, deferred payment or
other valuable consideration;
Explanations.- (1) A society (including a cooperative society), club or firm or an
association which, whether or not in the course of business, buys, sells, supplies goods or
distributes goods from or to its members for cash, or for deferred payment or for
commission, remuneration or other valuable consideration, shall be deemed to be a dealer
for the purposes of this Act.
The Central Government or a State Government or a local authority or a statutory
body which whether or not, in the course of business, buys, sells, supplies or distributes
goods, directly or otherwise, for cash or deferred payment or for commission, remuneration
or other valuable consideration shall be deemed to be a dealer for the purposes of this Act.
In respect of the transfer of the right to use feature films, the person who transfers
such right to the exhibitor and from whom the exhibitor derives the right to make such use
shall be deemed to be the dealer under this clause.
(a) An agriculturist who sells exclusively agricultural produce grown on land
cultivated by him personally or a person who is exclusively engaged in poultry farming and
sells the products of such poultry farm shall not be deemed to be a dealer within the
meaning of this clause;
Where the agriculturist is a company and is selling pepper, cardamom, rubber,
timber, wood, raw cashew or coffee grown on land cultivated by it personally, directly or
otherwise, such company, shall be deemed to be a dealer in respect of turnovers relating to
sales of such produce.
‘Document’ includes written or printed records of any sort, title deeds and data
stored electronically in whatever form.
‘Export’ means a sale of goods taking place in the course of export of the goods
out of the territory of India only if the sale either occasions such export or is effected by a
transfer of documents of title to the goods after the goods have crossed the customs

frontiers of India and includes the last sale of any goods preceding the sale occasioning the
export of those goods out of the territory of India, if such last sale took place after, and was
for the purpose of complying with the agreement or order for or in relation to such export.
‘Goods’ means all kinds of movable property (other than newspaper, actionable
claims, stocks and shares and securities) and includes livestock, all materials, commodities
and articles (including goods, as goods or in some other form) involved in the execution of a
works contract or those goods to be used in the fitting out, improvement or repair of movable
property, and all growing crops, grass or things attached to, or forming part of the land which
are agreed to be severed before sale or under the contract of sale.
(16)‘Goods vehicle’ means any kind of vehicle used for carriage of goods either
solely or in addition to passengers (other than aeroplanes and rail coaches) and includes
push cart, animal drawn cart, tractor-trailer and the like.
‘Government’ means the Government of Karnataka.
‘Import’ means sale or purchase in the course of the import of goods into the
territory of India if the sale or purchase either occasions such import or is effected by
transfer of documents of title to the goods before the goods have crossed the customs
frontiers of India and includes procurement of goods from outside the State either as a result
of purchase or otherwise.
‘Input’ means any goods including capital goods purchased by a dealer in the
course of his business for re-sale or for use in the manufacture or processing or packing or
storing of other goods or any other use in business.
‘Input tax’ has the meaning assigned to it in Section 10.
‘Maximum retail price’ or ‘MRP’ shall mean the price marked on the package
in which the goods are contained.
‘Output tax’ has the meaning assigned to it in Section 10.
‘Place of business’ means any place where a dealer purchases or sells goods
and includes, -
any warehouse, godown or other place where a dealer stores or processes his
goods;
any place where a dealer produces or manufactures or processes goods;
any place where a dealer keeps his accounts including documents and in a case
where a dealer carries on business through an agent (by whatever name called),
the place of business of such agent.
⠀ ⤀Ā ⤀ Ā ⤀ Ā ⤀ Ā ⤀ Ā ⤀ Ā ⤀ Ā ⤀ Ā ⤀ Ԁ Ȁ ⠀ ⤀Ā ⤀ Ā ⤀ Ā ⤀ Ā ⤀ Ā ⤀ Ā ⤀ Ā ⤀ ‘
Prescribed authority’ means an officer of the Commercial Taxes Department, authorised
by the Government or the Commissioner to perform such functions as may be assigned to
him.
⠀ ⤀Ā ⤀ Ā ⤀ Ā ⤀ Ā ⤀ Ā ⤀ Ā ⤀ Ā ⤀ Ā ⤀ Ԁ Ȁ ⠀ ⤀Ā ⤀ Ā ⤀ Ā ⤀ Ā ⤀ Ā ⤀ Ā ⤀ Ā ⤀ ‘
Prevailing market price’ shall mean the published wholesale price in force in the market
and in cases where there is no such published wholesale price, the prevailing market price
of any goods.

‘Published’ shall mean published in any newspaper, journal or periodical or
notified by a market committee or any such authority.
‘Registered dealer’ means a dealer registered under this Act.
‘Return’ means any return prescribed or otherwise required to be furnished by
or under this Act.
‘Sale’ with all its grammatical variation and cognate expressions means every
transfer of the property in goods (other than by way of a mortgage, hypothecation, charge or
pledge) by one person to another in the course of trade or business for cash or for deferred
payment or other valuable consideration and includes,-
a transfer otherwise than in pursuance of a contract of property in any goods for
cash, deferred payment or other valuable consideration;
a transfer of property in goods (whether as goods or in some other form) involved
in the execution of a works contract;
a delivery of goods on hire purchase or any system of payment by installments;
a transfer of the right to use any goods for any purpose (whether or not for a
specified period) for cash, deferred payment or other valuable consideration.
Explanations.- (1) A transfer of property involved in the sale or distribution of goods
by a society (including a co-operative society), club, firm, or any association to its members,
for cash, or for deferred payment or other valuable consideration, whether or not in the
course of business, shall be deemed to be a sale for the purposes of this Act.
Every transaction of sale by way of or as a part of any service or in any other
manner whatsoever, of goods, being food or any other article of human consumption or any
drink (whether or not intoxicating) where such sale or service is for cash, deferred payment
or other valuable consideration, shall be deemed to be a sale of those goods by the person
making the sale and purchase of those goods by the person to whom such sale is made.
Notwithstanding anything to the contrary contained in this Act or any other law for
the time being in force, two independent sales or purchases shall, for the purposes of this
Act, be deemed to have taken place,
when the goods are transferred from a principal to his selling agent and from the
selling agent to the purchaser, or
when the goods are transferred from the seller to a buying agent and from the
buying agent to his principal, if the agent is found in either of the cases aforesaid,-
to have sold the goods at one rate and to have passed on the sale proceeds
to his principal at another rate, or
to have purchased the goods at one rate and to have passed them on to his
principal at another rate, or
not to have accounted to his principal for the entire collections or deductions
made by him in the sales or purchases effected by him on behalf of his
principal, or
to have acted for a fictitious or non-existent principal.

Every transfer of property in goods by the Central Government, any State
Government, a statutory body or a local authority for cash or for deferred payment or other
valuable consideration, whether or not in the course of business, shall be deemed to be a
sale for the purposes of this Act.
‘State Representative’ means any person appointed to be the State
Representative under Section 58 and includes an officer empowered by the Commissioner
under that Section to perform the functions of a State representative.
‘ Taxable sale’ means any sale of goods, which is taxable under the provisions of this Act.
‘Tax invoice’ means a document specified under Section 29 listing goods sold
with price, quantity and other information as prescribed.
‘Tax period’ means such periods as may be prescribed.
‘Taxable turnover’ means the turnover on which a dealer shall be liable to pay
tax as determined after making such deductions from his total turnover and in such manner
as may be prescribed, but shall not include the turnover of purchase or sale in the course of
interstate trade or commerce or in the course of export of the goods out of the territory of
India or in the course of import of the goods into the territory of India and the value of goods
transferred or despatched outside the State otherwise than by way of sale.
‘Total turnover’ means the aggregate turnover in all goods of a dealer at all
places of business in the State, whether or not the whole or any portion of such turnover is
liable to tax, including the turnover of purchase or sale in the course of interstate trade or
commerce or in the course of export of the goods out of the territory of India or in the course
of import of the goods into the territory of India and the value of goods transferred or
despatched outside the State otherwise than by way of sale.
‘Turnover’ means the aggregate amount for which goods are sold or distributed
or delivered or otherwise disposed of in any of the ways referred to in clause (29) by a
dealer, either directly or through another, on his own account or on account of others,
whether for cash or for deferred payment or other valuable consideration, and includes the
aggregate amount for which goods are purchased from a person not registered under the
Act and the value of goods transferred or despatched outside the State otherwise than by
way of sale, and subject to such conditions and restrictions as may be prescribed the
amount for which goods are sold shall include any sums charged for anything done by the
dealer in respect of the goods sold at the time of or before the delivery thereof.
Explanation.- The value of the goods transferred or despatched outside the State
otherwise than by way of sale, shall be the amount for which the goods are ordinarily sold by the
dealer or the prevailing market price of such goods where the dealer does not ordinarily sell the
goods.
‘Works contract’ includes any agreement for carrying out for cash, deferred
payment or other valuable consideration, the building, construction, manufacture,
processing, fabrication, erection, installation, fitting out, improvement, modification, repair or
commissioning of any movable or immovable property.
‘Year’ means the year commencing on the first day of April.

Chapter II
The incidence and levy of tax
Levy of tax.- (1) The tax shall be levied on every sale of goods in the State by a registered
dealer or a dealer liable to be registered, in accordance with the provisions of this Act.
The tax shall also be levied, and paid by every registered dealer or a dealer liable
to be registered, on the sale of taxable goods to him, for use in the course of his business,
by a person who is not registered under this Act.
Liability to tax and rates thereof.- (1) Every dealer who is or is required to be
registered as specified in Sections 22 and 24, shall be liable to pay tax, on his taxable
turnover,
(a) in respect of goods mentioned in,-
Second Schedule, at the rate of one per cent,
Third Schedule, at the rate of four per cent, and
Fourth Schedule, at the rate of twenty per cent.
in respect of other goods, at the rate of 1[twelve and one half] per cent.
Substituted by Act 6 of 2005 w.e.f. 19.3.2005.
Where goods sold or purchased are contained in containers or are packed in any
packing material liable to tax under this Act, the rate of tax applicable to taxable turnover of
such containers or packing materials shall, whether the price of the containers or packing
materials is charged for separately or not, be the same as the rate of tax applicable to such
goods so contained or packed, and where such goods sold or purchased are exempt from
tax under this Act, the containers or packing materials shall also be exempt.
The State Government may, by notification, reduce the tax payable under sub-
section (1) in respect of any goods.
Exemption of tax.- 1[(1)] Goods specified in the First Schedule and any other
goods as may be specified by a notification by the State Government shall be exempt from
the tax payable under this Act.
1. Section 5 renumbered as 5(1) by Act 11of 2005 w.e.f. 1.4.2005.
1[(2) Notwithstanding anything contained in this Act, the Government may, in such
circumstances and subject to such conditions as may be specified, by notification, and
subject to such rules as may be prescribed, exempt the whole or any part of the tax payable
for any period on sales of goods made to or made by a new industrial unit, in respect of
which the Government has already notified exemption of tax under the provisions of the
Karnataka Sales Tax Act, 1957 (Karnataka Act 25 of 1957), and such exemption on
purchases or sales shall be by way of refund of tax collected on purchases or sales made by
such industrial unit.]
Place of sale of goods.- (1) The sale or purchase of goods, other than in the
course of inter-State trade or commerce or in the course of import or export, shall be

deemed, for the purposes of this Act, to have taken place in the State irrespective of the
place where the contract of sale or purchase is made, if the goods are within the State.-
in the case of specific or ascertained goods, at the time the contract of sale or
purchase is made; and
in the case of unascertained or future goods, at the time of their appropriation to
the contract of sale or purchase by the seller or by the purchaser, whether the
assent of the other party is prior or subsequent to such appropriation.
Where there is a single contract of sale or purchase of goods situated at more
places than one, the provisions of clause (a) shall apply as if there were separate contracts
in respect of goods at each of such places.
Notwithstanding anything contained in the Sale of Goods Act, 1930 (Central Act 3
of 1930), for the purpose of this Act, the transfer of property of goods (whether as goods or
in some other form) involved in the execution of a works contract shall be deemed to have
taken place in the State, if the goods are within the State at the time of such transfer,
irrespective of the place where the agreement for works contract is made, whether the
assent of the other party is prior or subsequent to such transfer.
Notwithstanding anything contained in the Sale of Goods Act, 1930 (Central Act 3
of 1930), for the purpose of this Act, the transfer of the right to use any goods for any
purpose (whether or not for a specified period) shall be deemed to have taken place in the
State, if such goods are for use within the State irrespective of the place where the contract
of transfer of the right to use the goods is made.
Time of sale of goods.- (1) Notwithstanding anything contained in the Sale of
Goods Act, 1930 (Central Act 3 of 1930), for the purpose of this Act, and subject to sub-
section (2), the sale of goods shall be deemed to have taken place at the time of transfer of
title or possession or incorporation of the goods in the course of execution of any works
contract whether or not there is receipt of payment:
Provided that where a dealer issues a tax invoice in respect of such sale within
fourteen days from the date of the sale, the sale shall be deemed to have taken place at the
time the invoice is issued.
Where, before the time applicable in sub-section (1), the dealer selling the goods
issues a tax invoice in respect of such sale or receives payment in respect of such sale, the
sale shall, to the extent that it is covered by the invoice or payment, be deemed to have
taken at the time the invoice is issued or the payment is received.
The Commissioner may on an application of any dealer exempt such dealer subject to such conditions as he may specify, from the time specified in sub- section (1).
Agents liable to pay tax.- (1) Notwithstanding anything contained in any law for
the time being in force including this Act, every person who, for an agreed commission or
brokerage, buys or sells on behalf of any principal who is a resident of the State shall be
liable to tax under this Act at the rate or rates leviable thereunder in respect of such
purchase or sale, notwithstanding that such principal is not a dealer or that the turnover of
purchase or sale relating to such principal is less than the minimum specified in sub-sections (1), (2) and (3) of Section 22.

The principal shall not be liable to tax on his turnover in respect of which the
agent is liable to tax under sub-section (1), and the burden of proving that the turnover has
been effected through an agent liable to tax under the said sub-section, shall be on such
principal.
Collection of tax by registered dealers, Governments and statutory
authorities.- (1) Every registered dealer liable to pay tax under the Act shall collect such tax
at the rate or rates at which he is liable to pay tax, and the tax collected shall be accounted
for under the provisions of this Act and rules made thereunder.
The Central Government, a State Government, a statutory body or a local
authority shall, in respect of any taxable sale of goods effected by them, collect by way of tax
any amount which a registered dealer effecting such sale would have collected by way of tax
under this Act, issue a tax invoice, pay the tax so collected into the Government Treasury or
any designated bank and furnish monthly returns, as specified under Section 35, to the
prescribed authority.
1[9-A. Deduction of tax at source (in case of works contract).- (1)
Notwithstanding anything contained in this Act, the Central Government, or any State
Government, or an industrial, commercial or trading undertaking of the Central Government
or of any State, or any such undertaking in joint sector or any other industrial, commercial or
trading undertaking or any other person or body as may be notified by the Commissioner
from time to time or a local authority or a statutory body, shall deduct out of the amounts
payable by them to a dealer in respect of any works contract executed for them in the State,
an amount equivalent to the tax payable by such dealer under the Act.
No such deduction shall be made under sub-section (1), if the amounts payable
by them are in respect of sales of any goods, in the course of inter-State trade or commerce
or, in the course of export out of the territory of India or, import into the territory of India or,
outside the State.
The deduction under sub-section (1) shall be made by an authority on the basis
of tax payable as calculated by the dealer.
Where it is found that the tax payable as calculated by any dealer was less than
the tax payable for the works contract executed by more than fifteen per cent and being so
informed, the authority shall make deduction out of any amounts payable subsequently
based on the certificate issued by the assessing authority of the area or the assessing
authority of the dealer on an application to be made by the authority or dealer which shall be
disposed of by the assessing authority within ten days from the date of its receipt, failing
which deduction shall be made as calculated by the dealer till issue of a certificate.
The authority making deduction under sub-section (1), shall send every month to
the prescribed authority a statement in the prescribed form containing particulars of tax
deducted during the preceding month and pay full amount of the tax so deducted by it within
twenty days after the close of the preceding month in which such deductions were made and
the amount so payable shall for the purposes of Section 42 be deemed to be an amount due
under this Act.

Where default is made in complying with the provisions of sub-section (5), the
prescribed authority may, after such enquiry as it deems fit and after giving opportunity to
the concerned authority of being heard, determine to the best of its judgment, the amount of
tax payable under this sub-section by such authority and the amount so determined shall be
deemed to be the tax due under the Act for the purpose of section 42.
If default is committed in the payment of tax deducted beyond ten days after the
expiry of the period specified under sub-section (5), the authority making deductions under
sub-section (1) shall pay, by way of interest, a sum equal to the interest specified under sub-
section (1) of Section 37 during the period in which such default is continued.
The authority making deduction under sub-section (1), shall furnish to the dealer
from whom such deduction is made, a certificate obtained from the prescribed authority
containing such particulars as may be prescribed.
Payment by way of deduction in accordance with sub-section (5), shall be without
prejudice to any other mode of recovery of tax due under this Act from the dealer executing
the works contract.
Where tax in respect of the works contract is remitted under sub-section (5), the tax
payable by the dealer for any period, in respect of such works contract shall be reduced by
the amount of tax already remitted under the said sub-section.
The burden of proving that the tax on such works contract has already been
remitted and of establishing the exact quantum of tax so remitted shall be on the dealer
claiming the reduction of tax under sub-section (10).]
.
Output tax, input tax and net tax.- (1) Output tax in relation to any registered dealer means
the tax payable under this Act in respect of any taxable sale of goods made by that dealer in
the course of his business, and includes tax payable by a commission agent in respect of
taxable sales of goods made on behalf of such dealer subject to issue of a prescribed
declaration by such agent.
Subject to input tax restrictions specified in Sections 11,12,14, 1[17 and 18], input
tax in relation to any registered dealer means the tax collected or payable under this Act on
the sale to him of any goods for use in the course of his business, and includes the tax on
the sale of goods to his agent who purchases such goods on his behalf subject to the
manner as may be prescribed to claim input tax in such cases.
Subject to input tax restrictions specified in Sections 11, 12, 14, 17, 18 and 19,
the net tax payable by a registered dealer in respect of each tax period shall be the amount
of output tax payable by him in that period less the input tax deductible by him as may be
prescribed in that period and shall be accounted for in accordance with the provisions of
Chapter V.
For the purpose of calculating the amount of net tax to be paid or refunded, no
deduction for input tax shall be made unless a tax invoice, debit note or credit note, in
relation to a sale, has been issued in accordance with Section 29 or Section 30 and is with
the registered dealer taking the deduction at the time any return in respect of the sale is
furnished, except such tax paid under sub-section (2) of Section 3.
Subject to input tax restrictions specified in Sections 11,12, 14, 17, 18 and 19,
where under sub-section (3) the input tax deductible by a dealer exceeds the output tax
payable by him, the excess amount shall be adjusted or refunded together with interest, as
may be prescribed.
Input tax restrictions.- (a) Input tax shall not be deducted in calculating the net
tax payable, in respect of:
tax paid on purchases attributable to sale of exempted goods exempted under
Section 5, except when such goods are sold in the course of export out of the
territory of India;
tax paid on purchase of goods that are despatched outside the State, other than
as a direct result of sale or purchase in the course of inter-State trade or
commerce;
tax paid on goods including capital goods as specified in the Fifth Schedule and
any other goods as may be notified by the Government or the Commissioner,
purchased 1[including when transferred in the execution of a works contract] or
put to use for purposes other than for re-sale;
tax paid on purchase of capital goods other than those falling under clause (3),
except as provided in Section 12;
tax paid on purchase of goods used as inputs in the manufacture, processing or
packing of other taxable goods despatched to a place outside the State not as a
direct result of sale or purchase in the course of inter-State trade, except as
provided in Section 14;
tax paid on purchases attributable to naptha, liquified petroleum gas, furnace oil,
light diesel oil, superior kerosene oil, kerosene and any other petroleum product,
when used as fuel in motor vehicles, but when used as fuel in production of any
goods for sale in the course of export out of the territory of India or taxable goods
or captive power, input tax shall be deducted as provided in Section 14.
tax paid under sub-section (2) of Section 3 on the purchase of fuel;
tax paid under sub-section (2) of Section 3 on the purchase of goods excluding
fuel, until output tax is payable on such goods or other goods in which such
goods are put to use except when the said goods are exported out of the territory
of India;
tax paid on goods purchased by a dealer who is required to be registered under
the Act, but has failed to register.
Input tax shall not be deducted by an agent purchasing or selling goods on behalf
of any other person other than a non-resident principal.
Deduction of input tax in respect of Capital goods.- (1) Deduction of input tax
shall be allowed to the registered dealer in respect of the purchase of capital goods 1[on or

after the commencement of this Act] for use in the business of sale of any goods in the
course of export out of the territory of India and in the case of any other dealer in respect of
the purchase of capital goods wholly or partly for use in the business of taxable goods.
Deduction of input tax under this Section shall be allowed only after
commencement of commercial production, or sale of taxable goods or sale of any goods in
the course of export out of the territory of the India by the registered dealer and shall be
apportioned over a specified period, as may be prescribed.
Pre-registration purchases.- Deduction of input tax shall be allowed to the
registered dealer, subject to the restrictions of Section 11, in respect of tax charged to him
by a seller on taxable sale of goods made to him for the purpose of the business within three
months prior to the date of his registration provided that no input tax shall be allowed in
respect of goods which have been sold or otherwise disposed of prior to the date of
registration.
Special rebating scheme.- Deduction of input tax shall be allowed on the
difference between the rate of input tax charged at a rate higher than four per cent and the
rate specified in Third Schedule on purchases specified in sub-section (5) and sub-section
of Section 11.
Composition of tax.- (1) Subject to such conditions and in such circumstances
as may be prescribed, any dealer other than a dealer who purchases or obtains goods from
outside the State or from outside the territory of India, liable to pay tax as specified in
Section 4 and,
whose total turnover in a period of four consecutive quarters does not exceed
fifteen lakh rupees; or
who is a dealer executing works contracts; or
who is a hotelier, restaurateur, caterer; or
who is a mechanised crushing unit producing granite metals;
may elect to pay in lieu of the net amount of tax payable by him under this Act by way of
composition, an amount at such rate not exceeding five per cent on his total turnover or on
the total consideration for the works contracts executed or not exceeding two lakh rupees for
each crushing machine 1[per annum as may be notified by the Government] as may be
prescribed.
For the purposes of sub-section (1) a quarter shall mean any period ending on
final day of the months of March, June, September and December.
Any dealer eligible for composition of tax under sub-section (1) may report, to the
prescribed authority, the exercise of his option and he shall pay such amount due and
furnish a return in such manner as may be prescribed.
Any dealer opting for composition of tax under sub-section (1) shall not be
permitted to claim any input tax on any purchases made by him.

Special accounting scheme.- Where a dealer liable to pay tax under Section 4
is unable to identify each individual sale, its value or the rate of tax, he may apply to the
prescribed authority to pay net tax under Section 10 under a special method to be mutually
agreed by such authority in such manner as may be prescribed.
Partial rebate.- Where a registered dealer deducting input tax.-
makes sales of taxable goods and goods exempt under Section 5, or
in addition to the sales referred to in clause (1), despatches taxable goods or
goods exempted under Section 5 outside the State not as a direct result of sale or purchase
in the course of inter-State trade, or
puts to use the inputs purchased in any other purpose (other than sale,
manufacturing, processing, packing or storing of goods), in addition to use in the course of
his business,
apportionment and attribution of input tax deductible between such sales and
despatches of goods or such purpose, shall be made in accordance with Rules or by special
methods to be approved by the Commissioner or any other authorised person and any input
tax deducted in excess shall become repayable forthwith.
18. Transitional provisions.- Transitional provisions covering relief on tax paid
under the Karnataka Sales Tax Act, 1957 (Karnataka Act 25 of 1957) on stock in hand
relating to goods purchased on or after first day of April, 2004 and used for manufacture or
resale, at the date of commencement of this Act shall be as prescribed.”.]
.
Change in use after deduction of input tax.- (1) Where a registered dealer has
deducted input tax on any goods and those goods are not used in the course of his business
or lost or destroyed, any input tax deducted becomes repayable in the period following the
date on which those goods were put to such other use.
Where such goods have been wholly or mainly used or are intended for use in
sale of taxable goods or in sale of any goods in the course of export out of the territory of
India prior to the change of use, tax shall be calculated on the prevailing market value of
such goods at the time of change of use.
Deduction of input tax on exports and interstate sales, etc..- (1) Tax paid
under this Act by any dealer on purchase of inputs in respect of,-
any goods sold in the course of export out of the territory of India, or
any goods taxable under the Act, sold in the course of interstate trade or
commerce, or
(d) [xxxx]
shall be deducted as provided under Section 10, 1[subject to such conditions as may
be prescribed] from output tax payable by such dealer.

1[(2) Tax paid under this Act on purchase of inputs by a registered dealer who is a
unit located in any special economic zone established under authorisation by the authorities
specified by the Central Government in this behalf, shall be deducted as provided under
Section 10 subject to such conditions as may be prescribed, from the output tax payable by
such dealer.]
.
Explanation 1.- For the purposes of this section, the expression ''special economic
zone'' has the meaning assigned to it in clause (iii) to Explanation 2 to the proviso to section
3 of the Central Excise Act, 1944 (Central Act 1 of 1944).
[Explanation 2.- xxx]
Reimbursement of tax.- Tax collected under this Act on purchases made by
specialised agencies of the United Nations Organisation and Consulates or Embassies of
any other country located in the State shall be reimbursed in such manner and subject to
such conditions as may be prescribed.
Chapter III
Registration
Liability to register.- (1) Every dealer whose total turnover exceeds or who
reasonably expects his total turnover to exceed two lakh rupees, as computed under the
provisions of the Karnataka Sales Tax Act 1957 (Karnataka Act 25 of 1957), in the year
ending Thirty First day of March 1[2005] shall be liable to be registered and report such
liability on such date as may be notified by the Government.
Every dealer who at any time has reason to believe that his taxable turnover is
likely to exceed two lakh rupees during any year after the year ending Thirty First day of
March 1[2005] shall be liable to be registered and report such liability forthwith or on such
date as may be notified by the Government.
Every dealer whose taxable turnover exceeds fifteen thousand rupees in any one
month after the date from which the tax shall be levied, in accordance with Section 3, 1[xxx],
shall register forthwith.
Every dealer to whom a business or part of a business is transferred by another
dealer who is liable to be registered under this Act, shall apply for registration from the date
of that transfer, if he is not already registered.
Every dealer liable to register under sub-sections (2), (3) or (4) shall report his
liability to be registered in the prescribed manner at the end of the month on which that
liability arises or on such date as may be notified under sub-section (2).
Every dealer who obtains or brings taxable goods from outside the State, whether
as a result of purchase or otherwise, shall be liable to be registered after such first purchase
or procurement irrespective of the value of goods purchased or procured and shall report
such liability at the end of the month in which such purchase or procurement takes place.

Every dealer who exports taxable goods is liable to register after the first export
and shall report such liability at the end of the month in which such export takes place.
Every dealer who effects sale of taxable goods in the course of interstate trade or
commerce or dispatches taxable goods to a place outside the State is liable to register after
the first sale or dispatch and shall report such liability at the end of the month in which such
sale or dispatch takes place.
Every casual trader and every non-resident dealer or his agent shall be liable to
register after his first sale irrespective of the value of the taxable goods sold and shall report
such liability forthwith.
1[(9-A) Every dealer engaged in the execution of works contract shall be liable to
register and shall report such liability after the end of the month in which execution of any
works contract is undertaken.”]
In determining whether a person is liable to be registered under sub-sections (1), or (3), the prescribed authority may have regard to the total or taxable turnover or total
receipts of any other person where both persons are associates, and, where the prescribed
authority deems that any business has been deliberately broken up into smaller businesses
to avoid registration, the prescribed authority may issue a notice requiring those businesses
to be registered as one business entity.
Voluntary registration.- A dealer who sells taxable goods, though not liable to
register under Section 22 but who desires to register voluntarily, shall make an application to
the prescribed authority in such form and in such manner as may be prescribed, giving
correct and complete particulars.
Suo motu registration.- Where a dealer liable to be registered has failed to
inform the competent authority of his liability to be registered, the competent authority may
after conducting such survey, inspection or enquiry as may be prescribed, proceed to
register such person under Section 22.
Registration.- (1) The form of application to register under Section 22 or 23, the
time and manner of making application, and the fee, payable shall be as may be prescribed.
On receipt of an application to register under Section 22 or 23, the prescribed
authority shall register any such dealer and grant him a certificate of registration, if he is
satisfied that the applicant is a bona fide dealer and that he complies with the requirements
of this Act, with effect from the first day of the month following the month in which such
application is made or from such earlier date as may be mutually agreed.
The prescribed authority may refuse to grant a certificate of registration to the
applicant for any good and sufficient reasons to be recorded in writing, after allowing the
applicant to show cause in writing against such refusal.
In respect of the Central Government, any State Government, any statutory body
or any local authority liable to collect tax under sub-section (2) of Section 9, the
Commissioner may authorise issue of a certificate of registration to such body in the manner
as may be prescribed.

Security.- (1) The prescribed authority may, for the proper payment of the tax,
from time to time demand from a registered dealer or from a dealer who has applied for
registration under this Act, reasonable security not exceeding a prescribed amount to be
paid in the prescribed manner.
The prescribed authority may, by order, forfeit the whole or any portion of the
security furnished by a dealer,
for collecting any amount of tax, interest or penalty that is payable by such
dealer, or
if such dealer is found to have misused any prescribed certificate or declaration
or has failed to keep or retain them in the prescribed manner.
No order shall be passed under sub-section (2), without giving the dealer an
opportunity of showing cause in writing against such forfeiture.
27. Cancellation of registration.- (1) In any case where,
any business of a registered dealer has been discontinued, transferred fully or
otherwise disposed of; or
there is any change in the status of the ownership of the business; or
the taxable turnover of sale of goods of a registered dealer has, during any period
of twentyfour consecutive months, not exceeded two lakh rupees; or
a dealer issues tax invoices without effecting any taxable sales; or
a dealer being an individual, registered under this Act dies, and for any other good and sufficient reason, the prescribed authority may, either on its own
motion or on the application of the dealer, or in the case of death, on the application of the legal
heirs, made in the prescribed manner, cancel the registration certificate from such date, including
any anterior date, as it considers fit having regard to the circumstances of the case.
The cancellation of a certificate of registration under this Section shall not affect
the liability of the dealer to pay tax, any penalty and interest due for any period prior to the
date of cancellation whether or not such tax, penalty and interest is assessed before the
date of cancellation but remains unpaid, or is assessed thereafter.
On cancellation of registration, except where the businesses is transferred as a
whole to another registered dealer as specified, a dealer who has availed deduction of input
tax, shall be liable to pay tax on any taxable goods held by him at their prevalent market
price.
A dealer liable to pay tax under sub-section (3) shall furnish a final return at such
time as may be prescribed.
Obligation of registered dealer to inform changes after registration.- (1) Where.-
a registered dealer sells or otherwise disposes of his business or any part
thereof, or

there is any other change in the ownership of the business including any
change in the status, or
a registered dealer discontinues his business or changes his place of business
or opens a new place of business, or
a registered dealer changes the name or nature of the business,
such registered dealer or, in case of his death his legal representative, shall within the
prescribed time, inform the prescribed authority accordingly.
Where,-
a change of ownership of the business takes place on account of transfer of
business from one registered dealer to another, the dealer succeeding to the
business, or
there is any change in the status of the ownership of the business,
such registered dealer shall surrender the certificate of registration already issued in respect
of the business and apply for registration afresh in the prescribed manner.
On any application for amendment of a certificate of registration or upon his own
motion, the prescribed authority may amend the registration certificate of a dealer or reject
the application within thirty days of the date of receipt of such application, after making such
enquiry as it deems fit and after giving the dealer the opportunity of showing cause in writing
against such amendment or rejection.
Any amendment of a certificate shall take effect from the date of the event
referred to in sub-section (1) where applicable and in all other cases the amendment shall
take effect from the date of application.
Where any change in registration other than of death of the registered dealer is
not reported to the prescribed authority within the prescribed time, it shall be deemed that
no such change has occurred and the dealer as registered shall be liable to tax that is
payable in respect of any business carried on.
Chapter IV
Accounts and documents
29.Tax invoices and bills of sale.- (1) A registered dealer effecting a taxable sale,
or sale of exempt goods along with any taxable goods, shall issue at the time of the sale, a
tax invoice marked as original for the sale, containing the particulars prescribed, and shall
retain a copy thereof.
A tax invoice marked as original shall not be issued to any registered dealer in
circumstances other than those specified in sub-section (1), and in a case of loss of the
original, a duplicate may be issued where such registered dealer so requests.
A registered dealer selling non-taxable goods or a dealer opting to pay tax by
way of composition under Section 15 selling goods in excess of the prescribed value shall
issue a bill of sale containing the particulars prescribed.
Credit and Debit Notes.- (1) Where a tax invoice has been issued for any sale
of goods and within six months from the date of such sale the amount shown as tax charged

in that tax invoice is found to exceed the tax payable in respect of the sale effected , the
registered dealer effecting the sale shall issue forthwith to the purchaser a credit note
containing particulars as prescribed.
Where a tax invoice has been issued for sale of any goods and the tax payable in
respect of the sale exceeds the amount shown as tax charged in such tax invoice, the
registered dealer making the sale, shall issue to the purchaser a debit note containing
particulars as prescribed.
Any registered dealer who receives or issues credit notes or debit notes shall
modify his return for the period in which the credit note or debit note is issued and pay any
tax due on such return.
Accounts.- (1) Every registered dealer and every dealer liable to pay tax under
this Act shall keep and maintain a true and correct account, in Kannada or English or Hindi
or in such other language as the Government may, by notification, specify, of all his
purchases, receipts, sales, other disposals, production, manufacture and stock showing the
values of goods subject to each rate of tax under this Act including input tax paid and output
tax payable.
If the Commissioner or prescribed authority is of the opinion that the accounts
kept and maintained by any dealer or any class of dealers do not sufficiently enable him or it
to verify the returns required under this Act or to make any assessment under it, he or it may,
by order, require any dealer or class of dealers, to keep such accounts and records including
tax invoices of manufacture, sales, purchases, disposals or transfers of stock other than by
way of sales in such form and in such manner as he or it may direct.
If the Commissioner considers that any class of dealers is not in a position to
keep and maintain accounts in accordance with the provisions of this Section, he may, for
reasons to be recorded in writing, permit such class of dealers to maintain accounts in the
prescribed manner.
Every dealer whose taxable turnover in a year exceeds twenty five lakh rupees
shall have his accounts audited by a Chartered Accountant or a Tax Practitioner subject to
such conditions and such limits as may be prescribed and shall submit to the prescribed
authority a copy of the audited statement of accounts and prescribed documents in the
prescribed manner.
Period of retention of accounts.- (1) Every dealer required under this Act to
keep and maintain books of account or other records including tax invoices relating to his
purchases and sales shall retain them until the expiration of five years after the end of the
year to which they relate or for such other period as may be prescribed or until the
assessment reaches finality, whichever is later.
Where such dealer is a party to an appeal or revision under this Act, he shall
retain, until the appeal or revision and any appeal therefrom is finally disposed of, every
record and accounting document that pertains to the subject matter of the appeal or revision.
Electronic records.- Every dealer required to keep and maintain records and
accounts pursuant to Section 31 and who does so by electronic means shall retain them in
an electronically readable format for the retention period specified in Section 32.
Requirement to provide documents and information.- Notwithstanding
anything to the contrary contained in this Act, the prescribed authority may, for any purpose
related to the administration or enforcement of this Act, by notice, require any person to
provide the prescribed authority, within such reasonable time as is stipulated in the notice,
with any information or additional information, including a return under this Act, or any other
document, whether inside or outside the State.
Chapter V
Administration and collection of tax
Returns.- (1) Subject to sub-sections (2) to (4), every registered dealer, and the
Central Government, a State Government, a statutory body and a local authority liable to
pay tax collected under sub-section (2) of Section 9, shall furnish a return in such form and
manner, including electronic methods, and shall pay the tax due on such return within twenty
days after the end of the preceding month or any other tax period as may be prescribed.
The tax on any sale or purchase of goods declared in a return furnished shall
become payable at the expiry of the period specified in sub-section (1) without requiring
issue of a notice for payment of such tax.
Subject to such terms and conditions as may be specified, the prescribed
authority may require any registered dealer.-
to furnish a return for such periods, or
to furnish separate branch returns where the registered dealer has more than
one place of business.
If any dealer having furnished a return under this Act, other than a return
furnished under sub-section (3) of Section 38, discovers any omission or incorrect statement
therein, other than as a result of an inspection or receipt of any other information or evidence
by the prescribed authority, he shall furnish a revised return within six months from the end
of the relevant tax period except when such revised return is on issue of a debit note under
Section 30, subject to sub-section (2) of Section 72.
Interest in case of failure to furnish returns or to pay tax declared on
returns or other amounts payable.- (1) Every dealer shall be liable to pay simple interest
on any amount of tax which should have been declared on a return, but which has been
omitted from it, unless that omission is corrected within three months of the omission subject
to sub-section (2) of Section 72, and such interest is payable from the date the tax should
have been declared, and the dealer shall declare his liability to pay that interest in such form
and manner as may be prescribed.
(2) If a dealer required to furnish a return under this Act.-
fails to pay any amount of tax or additional tax declared on the return, or
furnishes a revised return more than three months after tax became payable,
declaring additional tax, but fails to pay any interest declared to be payable under
sub-section (1), or
fails to declare any tax or interest which should have been declared, or

(d) fails to make a return,
such dealer shall be liable to pay interest in respect of the tax and additional tax payable as
declared by him or the tax payable and interest payable under sub-section (1) for the period
for which he has failed to furnish a return.
Where any other amount is payable under this Act is not paid within the period
specified in Section 42, interest shall be payable on such amount from such period.
The interest shall also be payable under this Section during any period during
which recovery of any tax or other amount payable under the Act is stayed by an order of
any authority or Court in any appeal or other proceedings disputing such tax or amount.
Rate of interest.- (1) The rate of simple interest payable under Section 36 shall
be 1[One and a quarter per cent] per month:
1. Substituted by Act 11 of 2005 w.e.f. 1.4.2005.
from the date the tax had become payable to the date of its payment or to the
date of any assessment under this Act, whichever is earlier; and
from the date on which any amount payable under this Act was due.
For the purpose of this Section interest in respect of parts of a month shall be
computed proportionately and month shall mean any period of thirty days.
Assessment of tax.- (1) Every dealer shall be deemed to have been assessed
to tax based on the return filed by him under Section 35, except in cases where the
Commissioner may notify the dealer of any requirement of production of accounts in support
of a return filed for any period.
Where a registered dealer fails to furnish his monthly or final return on or before
the date provided in this Act or the rules made thereunder, the prescribed authority shall
issue an assessment to the registered dealer to the best of its judgement and the tax
assessed shall be paid within ten days from the date of issue of the assessment.
Where an assessment has been made under sub-section (2) and the dealer
subsequently furnishes a return for the period to which the assessment relates, the
prescribed authority may withdraw the assessment but the dealer shall be liable to penalties
and interest as applicable.
Where the dealer furnishes a return under sub-section (3), such return shall be
furnished within one month of issue of such assessment.
The prescribed authority on any evidence showing a liability to tax coming to its
notice may issue a protective assessment in the case of a dealer registered under this Act or
a dealer liable to be registered under this Act, if the prescribed authority has reason to
believe that such dealer will fail to pay any tax, penalty or interest so assessed and such tax,
penalty or interest shall become payable forthwith.
1[(6) Notwithstanding anything contained in this Act, where a dealer is a body
corporate and has more than one place of business, Commissioner may, subject to such
conditions as may be prescribed and with the consent of the dealer, treat each of such
places of business as a separate unit for the purposes of levy, assessment and collection of
tax and thereupon all the provisions of this Act regarding registration, filing of returns,

assessment and collection of tax, shall apply as if each of such places of business is a
separate unit.]
.
Re-assessment of tax.- (1) Where the prescribed authority has grounds to
believe that any return furnished which is deemed as assessed is incorrect or that any
assessment issued under Section 38 understates the correct tax liability of the dealer, it, -
may, based on any information available, re-assess, to the best of its judgement,
the additional tax payable together with any penalty and interest ; and
shall issue a notice of re- assessment to the registered dealer demanding that the
tax shall be paid within ten days of the date of service of the notice after giving
the dealer the opportunity of showing cause against such re-assessment in
writing.
Where after making a re-assessment under this Section, any further evidence
comes to the notice of the prescribed authority, it may make any further re-assessments in
addition to such earlier re-assessment.
Period of limitation for assessment.- (1) An assessment under Section 38 or
re-assessment under Section 39 of an amount of tax due for any prescribed tax period shall
not be made after the following time limits.-
five years after the end of the prescribed tax period; or
three years after evidence of facts, sufficient in the opinion of the prescribed
authority to justify making of the re-assessment, comes to its knowledge,
whichever is later.
If any tax is fraudulently evaded attracting punishment under Section 79, an
assessment may be made as if in sub-section (1), reference to five years was a reference to
ten years.
In computing the period of limitation specified for assessment or re-assessment,
as the case may be under this Act, the period taken for disposal of any appeal against an
assessment or other proceeding by the appellate authority, a tribunal or competent court
shall not be taken into account in computing such period for assessment or reassessment as
the case may be.
Power of rectification of assessment or re-assessment in certain cases.- Where any assessment or re-assessment or an order of an appellate authority or a
revisional authority other than a court or tribunal, is found to be erroneous in so far as it is
prejudicial to the interest of the public revenue by a judgement or an order of any court, then
notwithstanding anything contained in this Act, authority concerned may proceed to rectify
such assessment or re-assessment or order and determine the tax payable by the dealer in
accordance with such judgement or order at any time within a period of three years from the
date of such judgement or order.
Where any court makes an order or gives judgement to the effect that any tax
assessed under this Act or any other law should have been assessed under a provision of a
law different from that under which it was assessed, then in consequence of such order or
judgement or to give effect to any finding or direction contained in any such order or

judgement, such turnover or part thereof, may be assessed or re-assessed to tax, as the
case may be, at any time within five years from the date of such order or judgement,
notwithstanding any limitation period which would otherwise be applicable under the law
applicable to that assessment or re-assessment.
Where any proceedings for the recovery of any tax, penalty, interest or any part
thereof remaining unpaid, have been commenced in a court and the amount of tax, penalty
or interest is subsequently modified, enhanced or reduced in consequence of any decision
made or order passed in the appeal, the prescribed authority may, in such manner and
within such period as may be prescribed, inform the dealer or the person and the authority
under whose order the recovery is to be made, and thereupon such proceedings may be
continued with the modified, enhanced or reduced amount of tax, penalty or interest therein
substituted.
No order of rectification under this Section shall be passed without giving the
dealer an opportunity of showing cause in writing against such rectification.
Payment and recovery of tax, penalties, interest and other amounts.- (1)
Every registered dealer shall furnish returns to the prescribed authority, and the tax payable
shall be paid in such manner as may be prescribed, within the period specified and on an
application by a dealer, the Government or Commissioner may permit, subject to such
conditions as may be prescribed, payment of tax or any other amount payable, in such
instalments and at such intervals as may be prescribed.
Every registered dealer shall, on receipt of a Notice from the prescribed
authority, pay any penalty or interest due in such manner as may be prescribed.
(a) The Government may, in such circumstances and subject to such conditions as
may be prescribed, by notification, defer payment by any new industrial unit of
the whole or any part of the tax payable in respect of any period and also permit
payment of such tax before the expiry of any deferred period, subject to the
condition that in respect of such industrial unit the Government has already
notified exemption of tax or deferred payment of tax under the provisions of the
Karnataka Sales Tax Act, 1957 ( Karnataka Act 25 of 1957).
Notwithstanding anything contained in this Act but subject to such conditions as
the Government may, by general or special order specify, where a dealer to
whom incentives by way of deferment offered by the Government in its orders
issued from time to time has been granted by virtue of eligibility certificate and
where liability equal to the amount of any such tax payable by such dealer has
been created as a loan by the Department of Industries and Commerce of the
Government of Karnataka, then such tax shall be deemed, in the public interest,
to have been paid.
Notwithstanding anything contained in this Act, the deferred payment of tax under
clause (a) shall not attract interest under sub-section (2) of Section 36, provided
the conditions laid down for payment of the tax deferred are satisfied.
Any other amount due under this Act shall be paid within ten days from the date
of service of the order or proceedings imposing such amount, unless otherwise specified.

The Commissioner or the Government may, subject to such conditions as they
may specify, remit by an order the whole or any part of the interest payable in respect of any
period by any person or class of persons.
Where the amount paid falls short of the aggregate of the tax or any other amount
due and interest payable, the amount so paid shall first be adjusted towards interest payable
and the balance, if any, shall be adjusted towards the tax or any other amount due.
A registered dealer, furnishing a revised return in accordance with this Act which
shows a greater amount of tax to be due than was paid or payable in accordance with the
original return, shall pay with that revised return the tax so payable in such manner as may
be prescribed.
Any amount, which remains unpaid under this Act after the due date of payment,
shall be recoverable from a dealer in the manner specified under this Act.
Any tax due or assessed, or any other amount due under this Act from a dealer,
or any other person, may without prejudice to any other mode of collection be recovered.-
as if it were an arrears of land revenue; or
by attachment and sale or by sale without attachment of any property of such
dealer or any other person by the prescribed authority or the prescribed officer in
the prescribed manner, and any prescribed certificate issued towards such sale
shall be deemed to be a decree of a Civil Court and shall be executed in the
same manner as a decree of such Court; or
notwithstanding anything contained in the Code of Criminal Procedure, 1973
(Central Act 2 of 1974), on application to any Magistrate, by such Magistrate as if
it were a fine imposed by him.
Where a dealer or other person who has appealed or applied for revision of any
order made under this Act and has complied with an order made by the appellate or the
revising authority in regard to the payment of the tax or other amount, no proceedings for
recovery under this Section shall be taken or continued until the disposal of such appeal or
application for revision.
The High Court may, either suo motu or on an application by the Commissioner
or any person aggrieved by the order, revise any order made by a Magistrate under clause of sub-section (9).
Duties of Receivers.- (1) A receiver appointed by any court shall notify the
Commissioner in writing within fourteen days after being appointed to the position of receiver
or taking possession of an asset in the State whichever is earlier.
The Commissioner may notify the receiver in writing of the amount which appears
to be sufficient to provide for any tax which is or will become payable by the person whose
assets are in the possession of the receiver.
A receiver shall not part with any asset in the State, which is held by the receiver
in his capacity as receiver without the prior written permission of the Commissioner or any
other officer authorised by him.

(4) A receiver.-
shall set aside, out of the proceeds of sale of an asset, the amount notified by the
Commissioner under sub-section (2), or such lesser amount as may
subsequently be fixed by the Commissioner;
is liable to the extent of the amount set aside for the tax payable by the person
who owned the asset; and
may pay any debt that has priority over the tax referred to in this Section
notwithstanding any provision of this Section.
A receiver is personally liable to the extent of any amount required to be set aside
under sub-section (4) for the tax referred to in sub-section (2) if and to the extent that, the
receiver fails to comply with the requirements of this Section.
In this Section, “receiver” includes a person, who with respect to an asset in the Strate is, -
a liquidator of a company; or
a receiver appointed out of court or by a court; or
a trustee for a bankrupt person; or
a mortgagee in possession; or
an executor of a deceased estate; or
any other person conducting the business of a person legally incapacitated.
Special provisions relating to companies.- (1) Notwithstanding anything
contained in the Companies Act, 1956 (1 of 1956),when any tax due from or assessed on a
company under this Act for any period cannot be recovered, then, every person who is or
was a director of the company at any time during the period for which the tax is due shall be
jointly and severally liable for the payment of such tax unless he proves that the non-
recovery cannot be attributed to any gross neglect, misfeasance or breach of duty on his
part in relation to the affairs of the company.
(a) If the person committing an offence under this Act is a company, the company
as well as every person in charge of, or responsible to, the company for the conduct of its
business at the time of the commission of the offence shall be deemed to be guilty of the
offence and shall be liable to be proceeded against and punished accordingly.
No such person referred to in clause (a) shall be liable to any punishment if he
proves that the offence was committed without his knowledge or that he exercised all due
diligence to prevent the commission of such offence.
Notwithstanding anything contained in clause (a), where an offence under this Act
has been committed by a company, and it is proved that the offence has been committed
with the consent or connivance of, or that commission of the offence is attributable to any
neglect on the part of any director, manager, managing agent or any other officer of the
company, such director, manager, managing agent or any other officer shall also be deemed
to be guilty of that offence and shall be liable to be proceeded against and punished
accordingly.

When two or more companies are to be amalgamated by an order of a Court or of
the Central Government, and the order is to take effect from a date earlier to the date of the
order, and any two or more such companies have sold or purchased any goods to or from
each other in the period commencing on the date from which the order is to take effect and
ending on the date of the order, then such transactions of sale or purchase will be included
in the turnover of the sales or purchase of the respective companies and will be assessed to
tax accordingly, and the said two or more companies shall be treated as distinct companies
for all periods up to the date of the said order, and the registration certificates of the said
companies shall be cancelled, where necessary, with effect from the date of the said order.
Recovery of tax, penalty, or any other amount, from certain other persons.- The prescribed authority may at any time or from time to time, by notice in writing, a copy
of which shall be forwarded to the dealer at his last address known to the prescribed
authority, require any person from whom money is due or may become due to the dealer or
any person who holds or may subsequently hold money for or on account of the dealer to
pay to the prescribed authority, either forthwith upon the money becoming due or being held
at or within the time specified in the notice, not being before the money becomes due or is
held, so much of the money as is sufficient to pay the amount due by the dealer in respect of
arrears of tax or penalty or the whole of the money when it is equal to or less than that
amount.
The prescribed authority may at any time or from time to time amend or revoke
any such notice or extend the time for making any payment in pursuance of the notice.
Any person making any payment in compliance with a notice under this Section
shall be deemed to have made the payment under the authority of the dealer and the receipt
of the prescribed authority shall constitute a good and sufficient discharge of the liability of
such person to the extent of the amount referred to in the receipt.
Any person discharging any liability to the dealer after receipt of the notice
referred to in this Section shall be personally liable to the prescribed authority to the extent
of the liability discharged or to the extent of the liability of the dealer for the amount due
under this Act, whichever is less.
Where any person to whom a notice under this Section is sent, proves to the
satisfaction of the prescribed authority issuing such notice or any other officer to whom the
matter is referred for verification, that the sum demanded or any part thereof is not due by
him to the dealer or that he does not hold any money for or on account of the dealer, then
nothing contained in this Section shall be deemed to require such person to pay the sum
demanded or any part thereof, to the prescribed authority.
Any amount which a person is required to pay to the prescribed authority or for
which he is personally liable to the prescribed authority under this Section shall, if it remains
unpaid, be a charge on the properties of the said person and may be recovered as if it were
an arrear of land revenue.
For the purpose of this Section, the amount due to a dealer or money held for or
on account of a dealer by any person shall be computed after taking into account such
claims, if any, as may have fallen due for payment by such dealer to such person and as
may be lawfully subsisting.
Tax payable on transfer of business, assessment of legal representatives,
etc.- (1) When the ownership of the business of a dealer is transferred, the transferor and
the transferee shall jointly and severally be liable to pay any tax or penalty or any other
amount remaining unpaid at the time of transfer or that may become payable in respect of
such business after the date of transfer but relating to the years up to the date of transfer
and for the purpose of recovery from the transferee, such transferee shall be deemed to be
the dealer liable to pay the tax or penalty or other amount due under this Act.
When a firm liable to pay the tax or penalty is dissolved, the assessment of the
tax and imposition of penalty shall be made as if no dissolution of the firm had taken place,
and every person who was at the time of dissolution a partner of the firm and the legal
representative of any such person who is deceased shall be jointly and severally liable to
pay the tax or penalty assessed or imposed.
Where any firm is liable to pay any tax or penalty or any other amount under this
Act, the firm and each of the partners of the firm shall be jointly and severally liable for such
payment.
Where a partner of a firm liable to pay any tax or penalty or any other amount
under this Act retires, he shall, notwithstanding any contract to the contrary, be liable to pay
any tax or penalty or any other amount remaining unpaid at the time of his retirement, and
any tax or penalty or any other amount due up to the date of retirement, though unassessed.
When an undivided Hindu family or Aliyasanthana family liable to pay the tax or
penalty is partitioned, the assessment of the tax and the imposition of penalty shall be made
as if no partition of the family had taken place, and every person who was a member of the
family before the partition shall be jointly and severally liable to pay the tax or penalty
assessed or imposed.
Where a dealer dies, his executor, administrator or other legal representative
shall be deemed to be the dealer for the purposes of this Act and the provisions of this Act
shall apply to him in respect of the business of the said deceased dealer, provided that, in
respect of any tax, penalty or fee assessed as payable by any such dealer or any tax,
penalty or fee, which would have been payable by him under this Act if he had not died, the
executor, administrator or other legal representative shall be liable only to the extent of the
assets of the deceased in his hands.
Payment and disbursement of amounts wrongly collected by dealer as tax.- Subject to Section 30, where any amount is collected by way of tax or purporting to be
way of tax from any person by any dealer, whether knowingly or not, such dealer shall pay
the entire amount so collected, to the prescribed authority within twenty days after the close
of the month in which such amount was collected, notwithstanding that the dealer is not
liable to pay such amount as tax or that only a part of it is due from him as tax under this Act.
(2) If default is made in payment of the amount in accordance with sub-section (1), -
the whole of the amount outstanding on the date of default shall become
immediately due and shall be a charge on the properties of the dealer;
the dealer liable to pay the amount shall pay interest at the rate of 1[One and a
quarter per cent] of such amount for each month of default and
1. Substituted by Act 11 of 2005 w.e.f. 1.4.2005.

the whole of the amount remaining unpaid along with the interest calculated
under clause (b) of this sub-section shall be recoverable in the manner specified
in Section 42.
Notwithstanding anything contained in this Act, or in any other law for the time
being in force, any amount paid or payable by any dealer under sub-section (1), shall, to the
extent it is not due as tax be forfeited to the Government and be recovered from him and
such payment or recovery shall discharge him of the liability to refund the amount to the
person from whom it was collected.
Where any amount is paid or recovered by or from any dealer under sub-section or (3), a refund of such amount or any part thereof can be claimed from Government by
the person from whom, it was realized by way of tax provided an application in writing in the
prescribed form is made to the Commissioner, within two years from the date of the order of
forfeiture. On receipt of any such application, the Commissioner shall hold such inquiry as
he deems fit and if the commissioner is satisfied that the claim is valid and admissible, and
that the amount so claimed as refund is actually paid or recovered, he shall refund the
amount or any part thereof, which is found due to the person concerned.
1[(5) For the purpose of sub-section (2), non-payment during any period during which
recovery of any amount due under this Section is stayed by an order of any authority or
Court in any appeal or other proceedings disputing such amount, shall be deemed to be a
‘default’, unless the appeal or other proceeding is allowed by such Authority.]
1. Inserted by Act 11 of 2005 w.e.f. 1.4.2005.
Tax to be first charge on property.- Notwithstanding anything to the contrary
contained in any law for the time being in force, any amount payable by a dealer or any
other person on account of tax, penalty or interest or any amount which a dealer is required
to pay or deduct from payment or for which he is personally liable to the Government shall
be a first charge on the property of the dealer or such person, as the case may be.
Period of limitation for recovery of tax.- (1) Notwithstanding anything
contained in any law for the time being in force, no proceedings for the recovery of any
amount under this Act shall be initiated after the expiry of twelve years from the end of the
relevant tax period or from the date of the relevant assessment, provided that when an
appeal or application for revision has been filed, the period of limitation shall run from the
date on which the amount due is finally determined.
The period of limitation specified under sub-section (1) shall not apply to any case
in which, during the course of recovery proceedings initiated under any clause of sub-section of Section 42 or under Section 45, any other fresh proceedings are initiated.
Payment of interest on refunds.- (1) Where any amount refundable to any
person under an order made, or proceedings taken, under any provision of this Act or Rules
made thereunder is not refunded to him within thirty five days,
of the date of such order, if that order is made by the refunding authority, or
of the date of receipt of such order by the refunding authority, if that order is
made by an authority other than the refunding authority,

the refunding authority, being any officer of the Commercial Taxes Department authorized to
make any refund under this Act, shall pay such person simple interest at the rate of 1[Six
percent] per annum on the said amount from the day immediately following the expiry of the
said thirty five days to the day of the refund.
1. Substituted by Act 6 of 2005 w.e.f. 19.3.2005.
The interest calculable under sub-section (1) shall be on the balance of the
amount remaining after adjusting out of the refundable amount any tax, interest or other
amount due under this Act, for any year by the person on the date from which such interest
is calculable.
In computing the period of thirty five days referred to in sub-section (1), such
periods as may be prescribed shall be excluded.
The interest payable for a part of month shall be proportionately determined.
Power to withhold refund in certain cases.- (1) Where an order giving rise to
a refund is the subject matter of an appeal or any other proceedings under this Act, the
prescribed authority may, if, to the best of its judgement it is of the opinion that the grant of a
refund is likely to prejudice the public revenue, withhold the refund until such time as it
deems proper.
The dealer shall be paid interest under sub-section (1) of Section 50 on the
amount of refund ultimately determined to be due to the dealer as a result of such
proceedings for the period commencing from the expiry of thirty five days from the date of
the order referred in sub-section (1) to the date of refund.
Production and inspection of documents and powers of entry, search and
seizure.- (1) Any officer authorised by the Commissioner in this behalf shall have the
power.-
to enter and inspect the place of business of any dealer, or any other place,
where it is believed by such Officer that business is being carried on or accounts
including documents are being kept by such dealer.
to direct such dealer to produce at such time and at such place accounts,
registers and documents relating to his business activities for examination.
to enter and inspect the goods in the possession of the dealer or in the
possession of any other person on behalf of such dealer, wherever such goods
are kept.
to enter and search such places including the dealer’s place of residence, and
including the search of the dealer or person acting on behalf of the dealer found
there, where concealment of facts relating to the business are suspected.
to seize any accounts, registers or documents from the dealer, where he has
reason to suspect that a dealer is attempting to avoid or evade tax or is
concealing his tax liability in any manner, after recording such reasons in writing,
and give the dealer or any other person from whose custody such accounts,
records or documents are seized, a receipt for and, if requested, copies of the
same and may retain them in his custody for examination, inquiry, prosecution or
other legal proceedings for such period as he considers necessary.
to seal any box or receptacle, godown or building or any part of the godown or
building in which accounts or taxable goods are suspected to be kept or stored,
where the owner or the person-in-charge of the business or any other person-in-
charge of the business or any other person-in-occupation either leaves the
premises or is not available or fails or refuses to open any box or receptacle,
godown or building or any part of the godown or building when called upon to do
so.
to break open the receptacle, godown or building or part of the godown or
building where the owner or the person-in-charge of the business or the person in
occupation leaves the premises or, after an opportunity having been given to him
to do so, fails to open the receptacle, godown or building or part of the godown or
building, and to prepare a list of the goods and documents found therein.
to record the statement of any dealer or his manager, agent or servant, to take
extracts from the records found in any premises and to put identification marks on
accounts, registers, documents or goods.
to take samples of goods from the possession of any dealer, where he considers
it necessary to protect the revenue against mistake or fraud, and provide a
receipt for any samples so taken, and the samples shall, except where an offence
is found, be returned to the dealer or be disposed of by the Commissioner with
the consent of such dealer.
to seize any stock of goods liable to tax, which are found in possession of a
dealer or in the possession of any person on behalf of a dealer and which are not
accounted for in his accounts, records or documents maintained in the course of
his business, the value of which shall not exceed his tax liability and any penalty,
including interest, and a list of goods so seized shall be prepared by such officer
and a copy thereof shall be given to the dealer or any other person from whose
custody such goods are seized.
in circumstances where it is not possible to seize the accounts, records or
documents under sub-section (1) or the goods under sub-section (3), to serve on
the owner or the person who is in immediate possession or control thereof, an
order that he shall not remove, part with or otherwise deal with them except with
the prior consent of such Officer, and after serving such order to take such steps
as are deemed necessary to secure the items referred to in the order.
(l) to issue an protective assessment as specified in sub-section (5) of Section 38.
Where the records and accounts under Sections 31 and 33 are maintained by
electronic means, the dealer shall provide such access to such accounts and records as may
be required by the officer authorised under sub-section (1).
The powers conferred on the officer under clauses (d) to (g), (i) and (j) of sub-
section (1) shall be exercised in accordance with the provisions of the Code of Criminal
Procedure, 1973, (Central Act 2 of 1974) and the power to enter a dealer’s place of
residence shall be authorized by an officer not below the rank of a Joint Commissioner.

The accounts, registers, records, including computer hardware and software, and
other documents seized under sub-section (1) shall not be retained by such officer for a
period exceeding one hundred and eighty days from the date of seizure, unless the reasons
for retaining the same beyond the said period are recorded by him, in writing and the
approval of the next higher authority is obtained and such approval in any case shall not be
for more than sixty days at a time.
There shall be a presumption in respect of goods, accounts, registers or
documents found at any place of business that they relate to that business, unless the
contrary is proved by the dealer whose business occupies that place.
The dealer or person from whom goods have been seized under clause (j) of
sub-section (1) shall have a period of seven days to appeal against seizure of the goods.
Subject to sub-section (6), after the expiry of the prescribed period, if any tax
assessed or penalty or interest due is not paid, the officer shall dispose of the goods in
public auction and adjust the sale proceeds towards any such amount due, and the excess
amount shall, after deducting the charges incurred by the State, be refunded in the manner
prescribed.
Establishment of check posts and inspection of goods in movement.- (1) If
the Government or the Commissioner considers it necessary, with a view to prevent or
check evasion of tax under this Act in any place or places in the State, it or he may, by
notification, direct the establishment of a check post or the erection of a barrier, or both, at
such place or places as may be notified.
(2) The owner or person in charge of a goods vehicle or a boat, ship or similar vessel shall:
carry with him a goods vehicle record, a trip sheet or a log book, as the case may
be; and
carry with him a tax invoice or a bill of sale or a delivery note or such other
documents as may be prescribed, in respect of the goods carried in the goods
vehicle or boat, ship or similar vessel; and
1[report at the first check-post or barrier situated on the route ordinarily taken
from the place in the State, from which the movement of the goods commences,
to its destination and] produce the documents referred to in clauses (a) and (b)
before any officer-in-charge of check post or barrier, or any other officer as may
be empowered by the Government in this behalf, and obtain the seal of such
officer affixed thereon, and, in respect of a bill of sale, give one copy thereof and,
in respect of a delivery note, give a copy marked as original, to such officer and
carry and retain with him the other copy until termination of movement of the
goods; and
Inserted by Act 6 of 2005 w.e.f. 19.3.2005.
Substituted by Act 6 of 2005 w.e.f. 19.3.2005.
on entering the State limits, report at the first situated check post or barrier and,
on leaving the State limits, report at the last situated check post or barrier and
give a declaration containing such particulars as may be prescribed in respect of
the goods carried in the goods vehicle or boat, ship or similar vessel, before any
officer-in-charge of the check post or barrier or any other officer as may be
empowered by the Government in this behalf; and
stop the vehicle or boat, ship or similar vessel, as the case may be, and keep it
stationary as long as may be required by the officer-in-charge of the check post
or barrier or the officer empowered as aforesaid, to examine the contents in the
vehicle or boat, ship or similar vessel and inspect all records relating to the goods
carried, which are in the possession of such driver or other person-in-charge,
who shall, if so required, give his name and address and the name and address
of the owner of the vehicle or boat, ship or similar vessel.
Where any goods vehicle is intercepted by the officer empowered at any place
other than a check post or barrier, such officer may, if he deems it necessary, direct the
owner or person-in-charge of the goods vehicle to take it to the nearest check post or police
station, and such owner or person-in-charge of the goods vehicle shall comply with such
direction.
(a) Where goods are delivered to a carrier or other bailee for transmission, the
movement of the goods shall be deemed to commence at the time of such delivery and
terminate at the time when delivery is taken from such carrier or bailee. Where, before
delivery is taken from him, a carrier or bailee to whom goods are delivered for transmission
keeps the said goods in any office, shop, godown, vessel, receptacle, vehicle, any other
place of business or any building or place, any officer empowered as aforesaid shall have
power to enter into and search such office, shop, godown, vessel, receptacle, vehicle, other
place of business or building or place and to examine the goods and inspect all goods
relating to such goods.
The carrier or bailee or the person-in-charge of the goods and records shall give
all facilities for such examination or inspection and, if so required, produce the bill of sale or
delivery note or other documents referred to in sub-section (2), giving a declaration
containing such particulars as may be prescribed regarding the goods, together with his
name and address and the name and address of the carrier or the bailee and the consignee.
The power conferred by clause (a) shall also include.-
the power to seal any box or receptacle, godown or building or any part of the
godown or building in which accounts or taxable goods are suspected to be kept
or stored, where the carrier or bailee or person in charge of the place of business
either leaves the premises or is not available or fails or refuses to open any box
or receptacle, godown or building or any part of the godown or building when
called upon to do so; and
the power to break open any box or receptacle, godown or building or part of the
godown or building where the carrier or bailee or the person in charge of the
place of business leaves the premises or, after an opportunity has been given to
him to do so, fails to open the box, receptacle, godown or building or part of the
godown or building.
The officer acting under item (ii) of sub-clause (c) shall prepare a list of the goods
and documents found in such box, receptacle, godown or building or part of the godown or
building.

(a) If any officer, empowered to enter into and search any office, shop, godown,
vessel, receptacle, vehicle, any other place of business or any building or place where a
carrier or bailee keeps the goods delivered to him for transmission, has reason to suspect
that such carrier or bailee has colluded with the owner of the goods in evading payment of
any tax, he may, for reasons to be recorded in writing, seize accounts, registers, records or
other documents of the bailee or carrier as he may consider necessary and shall give a
receipt for the same. The account, registers, records and other documents seized shall be
retained by such officer only for so long as may be necessary for their examination and for
any inquiry or proceeding under this Act.
The accounts, registers, records and other documents so seized shall not be
retained by such officer for a period exceeding one hundred and eighty days from the date of
seizure, unless the reasons for retaining the same beyond the said period are recorded by
him in writing and the approval of the next higher authority is obtained, and such approval in
any case shall not be for more than sixty days at a time.
Where such officer, upon examining the accounts registers, records or other
documents seized under clause (a), has reason to believe that any dealer has attempted to
evade payment of any tax, he may issue a protective assessment on such dealer in
accordance with sub-section (5) of Section 38.
All searches and seizures under sub-section (4) or (5) shall be made in
accordance with the provisions of the Code of Criminal Procedure, 1973 (Central Act 2 of
1974).
No person shall tamper with any seal put under sub-clause (i) of clause (c) of
sub-section (4).
Where the officer-in-charge of the check post or barrier, or the officer empowered as
aforesaid, on interception of the goods vehicle or on inspection of any godown, is of the opinion
that further verification is necessary with respect to either the accuracy of the particulars
furnished in the documents accompanying the goods under transport or in transit, or as to the
sufficiency and the cause adduced in respect of any contravention of sub-section
(2), he may verify the particulars himself or, if it is necessary to cause it to be verified by
referring the matter to any other officer and if such verification is not likely to be completed
within a reasonable time, he may direct, in writing, the carrier or the person in charge of the
goods vehicle or the godown not to deliver the goods until permitted to do so by him or such
other officer to whom the matter is referred for verification, and allow the intercepted vehicle,
if any, to pass through.
The verification under sub-section (8) shall be completed within a period of fifteen
days from the date of the direction issued under that sub-section and, where such
verification cannot be completed within the aforesaid period, the officer who has issued such
direction or, as the case may be, the officer to whom the matter is referred for verification,
shall obtain the permission in writing of the next higher authority to extend such period for
completion of the verification. However, such extension shall not be permitted for a period
exceeding fifteen days at a time.
Where such officer or other officer to whom the matter is referred, upon such
verification, is of the opinion that there is a non-compliance with sub-section (2), punishable
under sub-section (12), he may proceed, in respect of such goods in the custody of the carrier or
the person-in-charge of the vehicle or the godown, in accordance with sub-sections
and (14).
Where the officer-in-charge of the check post or any empowered officer has
issued a notice for contravention of any of the provisions of this Section, further proceedings
in pursuance to such notice may, subject to such conditions and in such manner as may be
prescribed, be continued by any other officer empowered by the Commissioner in this
behalf, from the stage at which it is pending.
(a) The officer in charge of a check post or a barrier or any other officer in
respect of any contravention of, or noncompliance with, the provisions of sub- section (2), for
which sufficient cause is not furnished, levy a penalty which, -
shall not be less than the amount of tax leviable but shall not exceed one and half
of the amount of tax leviable in respect of the goods under transport in
contravention of 1[clause (c) or] clause (d) of sub-section (2), if a dealer
registered under the Act accepts that he is the consignor or consignee of the
goods,
1. Substituted by Act 6 of 2005 w.e.f. 19.3.2005.
in cases other than those falling under item (i), shall not be less than double the
amount of tax leviable but not exceed three times the amount of tax leviable in
respect of the goods under transport .
Where the amount of penalty leviable is more than the value of the goods, the
amount of penalty leviable shall be restricted to such value.
In proceedings under sub-section (10), where the penalty levied is not paid, the
carrier or bailee or person-in-charge of the goods vehicle shall jointly and severally be liable
to pay such penalty.
Before levying any penalty under this sub-section, the officer shall give the
person-in-charge of the goods vehicle or boat, ship or similar vessel, the carrier, the bailee,
or dealer registered under the Act, as the case may be, a reasonable opportunity of being
heard.
Where the destination of the goods to be delivered in the State is not less than
one hundred kilometers from the check post or barrier or any other place at which the goods
vehicle or boat, ship or similar vessel is intercepted, a period of not less than ten days shall
be given to the person concerned to show cause against the proceedings initiated under
sub-section (12).
(a) Where the penalty levied is not paid, the officer levying the penalty shall have
power to take possession of so much of the goods as in his opinion would be sufficient to
meet the amount of penalty levied and retain the same with him until the penalty levied is
paid or for ten days, whichever is earlier.
Where it is not practicable to take possession of only so much of the goods as
would be sufficient to meet the amount of penalty levied for the reason that the goods
vehicle is a tanker carrying goods in liquid or gaseous form or that the goods form a single
unit not separable into any part or parts thereof, the officer levying the penalty shall have

power to take possession of the goods vehicle or the entire goods, as the case may be, and
retain the same with him until the penalty levied is paid or for ten days, whichever is earlier.
After the expiry of the period of ten days, if the penalty is not paid, the officer shall
dispose of the goods in public auction and adjust the sale proceeds towards penalty, and the
excess amount shall, after deducting the charges incurred by the State Government, be
refunded in the manner prescribed.
1[(d) Before taking possession or within ten days after taking possession of the
goods or the goods vehicle, if the owner or person in-charge of the goods vehicle or the
dealer registered under the Act, makes payment of penalty levied, the officer taking such
possession shall forthwith return the goods or the goods vehicle to the person making such
payment.]
1. Inserted by Act 6 of 2005 w.e.f. 19.3.2005.
In the case of perishable goods, the officer may dispose of the same before the
expiry of the period of ten days, if in his opinion such disposal is necessary.
Any person aggrieved by the levy of penalty under this Section may appeal
within thirty days from the date on which the order of penalty was served on the person to
the prescribed authority.
54. Transit of goods by road through the State and issue of transit pass.-
(1) Where a vehicle is carrying goods taxable under this Act,
from any place outside the State and bound for any place outside the State and
passes through the State ; or
imported into the State from any place outside the country and such goods are
being carried to any place outside the State, the driver or any other person-in-charge of such vehicle shall furnish the necessary
information and obtain a transit pass in duplicate containing such particulars as may be
prescribed, from the officer-in-charge of the first check post or barrier after his entry into the
State or after movement has commenced from the State, as the case may be, or from the
officer empowered for the purposes of sub-section (3) of Section 52, upon interception of the
goods vehicle after its entry into the State or after movement has commenced, as the case
may be.
(2) The driver or the person-in-charge of the vehicle shall deliver within the stipulated
time a copy of the transit pass obtained under sub-section (1) to the officer-in-charge at the
last checkpost or barrier before his exit from the State.
(a) If for any reason the goods carried in a goods vehicle are after entry into the
State, or after commencement of movement, as the case may be, not moved out of the
State within the time stipulated in the transit pass, the owner of the goods vehicle shall
furnish to the officer empowered in this behalf the reasons for such delay and other
particulars, if any, thereof and such officer shall after due enquiry extend the time of exit by
suitably amending the transit pass.
Where the goods carried by a vehicle are, after their entry into the State, or after
commencement of movement, as the case may be, transported outside the State by any

other vehicle or conveyance, the onus of proving that the goods have actually moved out of
the State shall be on the owner of the vehicle who originally brought the goods into the
State.
If the driver or any other person-in-charge of the vehicle does not comply with
sub-section (2), it shall be presumed that the goods carried thereby have been sold within
the State by the owner of the vehicle and shall, irrespective of whether he is a taxable
person, be assessed to tax by the officer empowered in this behalf in the prescribed manner.
If the owner of the vehicle, having obtained the transit pass as provided under
sub-section (1), fails to deliver the same as provided under sub-section (2), he shall be liable
to pay by way of penalty a sum not exceeding twice the amount of tax leviable on the goods
transported.
The amount of tax and the penalty levied under this Section shall be recovered in
the prescribed manner.
Where the owner of the vehicle who is assessed to tax under sub-section (4), is
carrying after such assessment, any goods taxable under this Act in a goods vehicle from
any place outside the State, or from within the State, as the case may be, and bound for any
other place outside the State and is passing through the State, the prescribed authority may
demand from such owner an amount equivalent to twice the amount of tax leviable on such
goods under this Act as security.
The prescribed authority after being satisfied that the goods carried in the goods
vehicle in respect of which the security amount under sub-section (7) was collected, has
passed through the State, shall refund such security amount to the owner.
The prescribed authority may by an order adjust the whole or any part of security
amount towards any amount of tax or penalty payable under this Section by such owner.
1[(10) In case where a vehicle owned by a person is hired for transportation of goods
by some other person including a transporting or any other similar agency, both the persons
shall for the purposes of this Section, be deemed to be the owner of the vehicle, and shall be
jointly and severally liable to pay any amount of tax or penalty payable.]
1. Substituted by Act 6 of 2005 w.e.f. 19.3.2005.
Penalty in case of under-valuation of goods.- (1) Where, in respect of goods liable
to tax under this Act carried in a goods vehicle or boat, ship or similar vessel, or held in stock by
any dealer or on his behalf by any other person, or held in the custody of any transporter, the
prescribed authority, or any officer empowered under Section 53, has reason to believe that the
value shown in the document accompanying the goods in transit or in the purchase invoice is
lower than the prevailing market price or Maximum Retail Price, by a difference of thirty per cent
or more, such authority or officers, for reasons to be recorded in writing and after allowing the
person or dealer a reasonable opportunity of being heard, may impose a penalty of a sum not
exceeding twice the amount of the tax due on such goods.
The amount of tax and the penalty levied under this Section shall be recovered in
the manner specified under sub-Section (14) of Section 53.

The value of goods in transit shall be the total price as mentioned in the invoice,
challan, delivery note, or any other related document, plus the cost of transportation of the
goods incurred up to the time of its interception.
In determining whether or not the price shown in the invoice, challan, delivery
note, or any other related document involves under-valuation, in the case of owner of the
goods other than an owner carrying on business in packaged goods, the authority exercising
the power under sub-section (1) shall apply the prevailing market price or fair market value
and in the case of an owner carrying on business in packaged goods, shall apply the
Maximum Retail Price.
Any person objecting to an order affecting him under this Section may appeal to
the prescribed authority.
Such appeal shall be dealt with as if it were an appeal filed under Section 62 or
Section 64, as the case may be, and all the provisions of those Sections shall mutatis
mutandis apply to such appeal.
Liability to furnish information by certain agents.- (1) Every person or a
clearing or forwarding house or agency, transporting agency, shipping agency, shipping-out
agency or steamer agency or air-cargo agency or courier agency engaged in the business of
transporting taxable goods in the State shall furnish to the prescribed authority information
relating to any taxable goods cleared, forwarded, transported or shipped by him or it during
any period or relating to any dealer as may be required by the prescribed authority.
The authority prescribed in this behalf, shall have the power to call for and
examine the books of account or other documents in the possession of such person or
agency with a view to verify the correctness of the information furnished under sub-section (1).
Any person failing to comply with the provisions of sub-sections (1) and (2)
without valid reason shall be liable to penalty under Section 75.
Special evidential requirements relating to banks.- The prescribed authority
may require any bank or any officer thereof to furnish such information, document or
statement for the purpose of any proceedings under this Act, and any person failing to
comply with such requirement without valid reason shall be liable to penalty under Section
75.
Chapter VI
Authorities and Appellate Tribunal
Appointment of Commissioner, Additional Commissioners, Joint
Commissioners, Deputy Commissioners, Assistant Commissioners, State
Representatives and Commercial Tax Officers.- (1) The State Government may appoint a
Commissioner of Commercial Taxes and as many Additional Commissioners, Joint
Commissioners, Deputy Commissioners, Assistant Commissioners, State Representatives
and Commercial Tax Officers, as they think fit for the purpose of performing the functions,
respectively conferred on them by or under this Act or by or under any other law for the time
being in force.
The Commissioner may, empower an officer not below the rank of an Assistant
Commissioner or an Advocate or a Chartered Accountant or a Tax Practitioner enrolled in
the prescribed manner to perform the functions of a State Representative.
In proceedings before the Appellate Tribunal, the State Representative shall be
competent, -
to prepare and sign applications, appeals and other documents,
to appear, represent, act and plead,
to receive notices and other processes, and
to do all other acts connected with such proceedings, on behalf of the
Government or any officer appointed under this Act.
Instructions to Subordinate Authorities.- (1) The Government and the
Commissioner may from time to time, issue such orders, instructions and directions to all
officers and persons employed in the execution of this Act as they may deem fit for the
administration of this Act, and all such officers and persons shall observe and follow such
orders, instructions and directions of the Government and the Commissioner.
No such orders, instructions, or directions shall be issued under sub-section (1)
so as to interfere with the discretion of any appellate authority in the exercise of its appellate
functions.
All officers and persons employed in the execution of this Act, shall observe and
follow such administrative instructions as may be issued to them for their guidance by the
Additional Commissioner or Joint Commissioner within whose jurisdiction they perform their
functions.
Without prejudice to the generality of the foregoing power, the Commissioner
may, on his own motion or on an application by a registered dealer liable to pay tax under
the Act, if he considers it necessary or expedient so to do, for the purpose of maintaining
uniformity in the work of assessments and collection of revenue, clarify the rate of tax
payable under this Act in respect of goods liable to tax under the Act, and all officers and
persons employed in the execution of this Act shall observe and follow such clarification.
No such application under sub-section (4) shall be entertained unless it is
accompanied by proof of payment of such fee, paid in such manner, as may be prescribed.
Clarification and Advance Rulings.- (1) The Commissioner may constitute an
‘Authority for Clarification and Advance Rulings’, consisting of three Additional
Commissioners, to clarify the rate of tax in respect of any goods or the exigibility to tax of
any transaction under the Act .
Any registered dealer seeking clarification or advanced ruling under this Section
shall make an application to the Authority in such form and accompanied by proof of
payment of such fee, paid in such manner as may be prescribed.
No officer or any other authority of the Department or the Appellate Tribunal shall
proceed to decide any issue in respect of which an application has been made by an
applicant under this Section.
The order of the authority shall be binding only on the applicant who seeks
clarification and only in respect of the goods or transaction in relation to which a clarification
is sought and also only on all the subordinate officers.
The order of the Authority under this Section shall be binding as aforesaid unless
there is a change in law or facts on the basis of which the order was passed.
Where the authority finds, on a representation made to it by any officer or
otherwise, that an order passed by it was obtained by the applicant by fraud or mis-
representation of facts, it may, by order, declare such order to be void ab initio and
thereupon all the provisions of this Act shall apply to the applicant as if such order had never
been made.
Subject to the provisions of Section 66, every order passed under this Section
shall be final.
Jurisdiction of officers and change of incumbent of an office.- (1) The
Additional Commissioners, Joint Commissioners, Deputy Commissioners, Assistant
Commissioners and Commercial Tax Officers shall perform their functions in respect of such
areas or of such dealers or classes of dealers or of such cases or classes of cases as the
Commissioner may direct.
The word ‘case` in relation to any dealer specified in any order or direction issued
thereunder means all proceedings under this Act in respect of any year which may be
pending on the date of such order or direction or which may have been completed on or
before such date, and includes also all proceedings under this Act which may be
commenced after the date of such order or direction in respect of any year.
Whenever in respect of any proceeding under this Act, any prescribed authority
ceases to exercise jurisdiction and is succeeded by another who may exercise that
jurisdiction, the authority or officer so succeeding may continue the proceeding from the
stage at which the proceeding was left by his predecessor.
The person concerned may demand that before the proceeding under sub-section is so continued, the previous proceeding or any part thereof be reopened or that before
any order is passed against him, he be reheard.
Chapter VII
Appeals and Revision
Appeals.- (1) Any person objecting to any order or proceedings affecting him
passed under the provisions of this Act by the prescribed authority may appeal to the
prescribed appellate authority.
(2) The appeal shall be preferred,
in respect of an order of assessment, within thirty days from the date on which
the notice of assessment, was served on the appellant, and
in respect of any other order, within thirty days from the date on which the order
was communicated to the appellant:

The appellate authority may admit an appeal preferred after the period as aforesaid but
within a further period of one hundred and eighty days, if it is satisfied that the appellant had
sufficient cause for not preferring the appeal within that period.
(a) No appeal against an order of assessment shall be entertained by the appellate
authority unless it is accompanied by satisfactory proof of the payment of tax and
penalty not disputed in the appeal.
The tax or other amount shall be paid in accordance with the order against which
an appeal has been preferred.
1[(c) (i) The appellate authority may, in its discretion, stay payment of one half of tax,
if the appellant makes payment of the other half of the tax along with the
prescribed form of appeal.
Where any application made by an applicant for staying proceedings of
recovery of any tax or other amount has not been disposed of by the
Appellate Authority within a period of thirty days from the date of such
application, it shall be deemed that the Appellate Authority has made an order
staying proceedings of recovery of such tax or other amount subject to
payment of one half of the tax disputed and furnishing of sufficient security to
the satisfaction of the assessing authority in regard to the other half of such
tax or amount within a further period of fifteen days]
Substituted by Act 6 of 2005 w.e.f. 19.3.2005.
Where an order staying proceedings of recovery of any tax or other amount is
passed in any proceedings relating to an appeal under sub-section (1), the
appellate authority shall dispose of the appeal within a period of one hundred
twenty days from the date of such order.
If such appeal is not so disposed of within the period specified in clause (d), the
order of stay shall stand vacated after the expiry of the said period 1[and the
Appellate Authority shall not make any further order staying proceedings of
recovery of the said tax or other amount].
1. Substituted by Act 6 of 2005 w.e.f. 19.3.2005.
The appeal shall be in the prescribed form and shall be verified in the prescribed manner.
In disposing of an appeal, the appellate authority may, after giving the appellant a
reasonable opportunity of being heard,
in the case of an order of assessment or penalty:
confirm, reduce or enhance the assessment including any part thereof
whether or not such part is objected to in the appeal;
pass such other orders as it may think fit; and
in the case of any other order, confirm, cancel or vary such order.

1[(6A) (i) In disposing of an appeal before it, the appellate authority shall not remand
the case to make fresh assessment or fresh order, but shall proceed to dispose of the
appeal on its merit, as it deems fit, if necessary by taking additional evidence.
The appellate authority shall pass an order disposing of an appeal, within a period
of thirty days from the date on which the hearing of the case was concluded and where it is
not practicable so to do on the ground of the exceptional and extraordinary circumstances of
the case, the appellate authority shall fix a future date for passing the order, and such day
shall not be a day beyond sixty days from the date on which the hearing of the case was
concluded, and due notice of the day so fixed shall be given to the appellant.]
1. Inserted by Act 6 of 2005 w.e.f. 19.3.2005.
Every order passed on appeal under this Section shall, subject to the provisions
of Sections 63 to 67, be final.
Appeal to the Appellate Tribunal.- (1) Any officer empowered by the
Government in this behalf or any other person objecting to an order passed by the appellate
authority under Section 62 may appeal to the Appellate Tribunal within a period of sixty days
from the date on which the order was communicated to him.
The Appellate Tribunal may admit an appeal preferred after the period of sixty
days referred to in sub-section (1), but within a further period of one hundred and eighty
days, if it is satisfied that the appellant had sufficient cause for not preferring the appeal
within that period.
The officer authorized under sub-section (1) or the person against whom an
appeal has been preferred, as the case may be, on receipt of notice that an appeal against
the order of the appellate authority has been preferred under sub-section (1) by the other
party, may, notwithstanding that he has not appealed against such order or any part thereof,
file, at any time before the appeal is finally heard, a memorandum of cross-objections,
verified in the prescribed manner, against any part of the order of the appellate authority, and
such memorandum shall be disposed of by the Appellate Tribunal as if it were an appeal
presented within the time specified in sub-section (1).
The appeal, or the memorandum of cross-objections, shall be in the prescribed
form, shall be verified in the prescribed manner, and, in the case of an appeal preferred by
any person other than an officer empowered by the Government under sub-section (1) shall
be accompanied by 1[proof of payment of one half of tax or other amount disputed and also]
a fee equal to two percent of the amount of assessment objected to, provided that the sum
payable in no case be less than two hundred rupees or more than one thousand rupees.
1. Inserted by Act 6 of 2005 w.e.f. 19.3.2005.
(a) The Appellate Tribunal shall, after giving both parties to the appeal a
reasonable opportunity of being heard, pass such orders thereon as it thinks fit.
If the appeal involves a question of law on which the Appellate Tribunal has
previously given its decision in another appeal and either a revision petition in the High Court
against such decision or an appeal in the Supreme Court against the order of the High Court
thereon is pending, the Appellate Tribunal may defer the hearing of the appeal before it till
such revision petition in the High Court or the appeal in the Supreme Court is disposed of.

If as a result of the appeal any change becomes necessary in the assessment,
which is the subject matter of the appeal, the Appellate Tribunal may authorize the
prescribed authority to amend the assessment, and the prescribed authority shall amend the
assessment accordingly and thereupon, any amount over paid by the dealer shall be
refunded to him without interest, or any additional amount of tax due from him shall be
collected in accordance with the provisions of the Act, as the case may be.
(a) Notwithstanding that an appeal has been preferred under sub-section (1), tax
shall be paid in accordance with the assessment made in the case.
1[(b) x x x ]
1. Omitted by Act 6 of 2005 w.e.f. 19.3.2005.
1[(7) (a) The Appellate Tribunal may, in its discretion, stay payment of one half of the
tax or other amount disputed, if the appellant makes payment of the other half of the tax or
other amount disputed along with the prescribed form of appeal. The Appellate Tribunal shall dispose of such appeal within a period of one hundred
eighty days from the date of the order staying proceedings of recovery of one half of tax or
other amount and, if such appeal is not so disposed of within the period specified, the order
of stay shall stand vacated after the said period and the Appellate Tribunal shall not make
any further order staying proceedings of recovery of the said tax or other amount.]
Substituted by Act 6 of 2005 w.e.f. 19.3.2005.
(a) The Appellate Tribunal may, on the application either of the appellant or of the
respondent, review any order passed by it under sub-section (5) on the basis of facts which
were not before it when it passed the order.
No such application under clause (a) shall be preferred more than once in respect
of the same order.
The application for review shall be preferred in the prescribed manner within six
months from the date on which the order to which the application relates was communicated
to the applicant; and where the application is preferred by any person other than an officer
empowered by the State Government under sub-section (1), it shall be accompanied by a
fee equal to that which has been paid in respect of the appeal.
If the application for review is preferred within ninety days from the date on which
the order to which the application relates is communicated to the applicant, the application
shall be accompanied by half the fee which had been paid in respect of the appeal.
(a) With a view to rectifying any mistake apparent from the record, the appellate
Tribunal may, at any time, within five years from the date of any order passed by it under
sub-section (5) or sub-section (8), amend such order.
No order under this sub-section shall be made without giving both parties affected
by the order a reasonable opportunity of being heard.
Except as provided in the rules, the Appellate Tribunal shall not have powers to
award costs to either of the parties to the appeal or review.

Every order passed by the Appellate Tribunal under sub-section (5) or (8) or (9)
shall be communicated to the appellant, the respondent, the appellate authority on whose
order the appeal was preferred and the Commissioner.
Every order passed by the Appellate Tribunal under sub-section (5) shall,
subject to the provisions of sub-section (8), sub-section (9) and Section 65, be final and
every order passed by it under sub-section (8) shall, subject to the provisions of sub-section and Section 65, be final.
Revisional powers of Additional Commissioner and Commissioner.- (1) The
Additional Commissioner may on his own motion call for and examine the record of any
order passed or proceeding recorded under this Act and if he considers that any order
passed therein by any officer, who is not above the rank of a Joint Commissioner, is
erroneous in so far as it is prejudicial to the interest of the revenue, he may, if necessary,
stay the operation of such order for such period as he deems fit and after giving the person
concerned an opportunity of being heard and after making or causing to be made such
inquiry as he deems necessary, pass such order thereon as the circumstances of the case
justify, including an order enhancing or modifying the assessment, or canceling the
assessment or directing a fresh assessment.
The Commissioner may on his own motion call for and examine the record of any
proceeding under this Act, and if he considers that any order passed therein by any officer
subordinate to him 1[or the Authority for Clarification and Advance Rulings constituted under
Section 60] is erroneous in so far as it is prejudicial to the interest of the revenue, he may if
necessary, stay the operation of such order for such period as he deems fit and after giving
the person concerned an opportunity of being heard and after making or causing to be made
such inquiry as he deems necessary, pass such order thereon as the circumstances of the
case justify, including an order enhancing or modifying the assessment, or canceling the
assessment or directing a fresh assessment.
1. Inserted by Act 6 of 2005 w.e.f. 19.3.2005.
The Additional Commissioner or the Commissioner shall not exercise any power
under sub-section (1) or sub-section (2), as the case may be, if.-
the time for appeal against the order has not expired;
the matter has been subject to an appeal under Section 63 or a revision in the
High Court; or
more than four years have expired after the passing of the order sought to be
revised.
Notwithstanding anything contained in sub-section (3), the Additional
Commissioner or the Commissioner may pass an order under sub-section (1) or (2), as the
case may be, on any point which has not been raised and decided in an appeal or revision
referred to in clause (b) of sub-section (3), before the expiry of a period of one year from the
date of the order in such appeal or revision or before the expiry of a period of four years
referred to in clause (c) of that sub-section, whichever is later.
Every order passed in revision under sub-section (1) shall, subject to the
provisions of sub-section (2) of this Section and Sections 66 and 67, be final.

Every order passed in revision under sub-section (2) shall, subject to the
provisions of Sections 65 and 66, be final.
If the order passed or proceedings recorded by the appropriate authority referred
to in sub-section (1) or (2), involves an issue on which the High Court has given its decision
adverse to the revenue in some other proceedings and an appeal to the Supreme Court
against such decision of the High Court is pending, the period spent between the date of the
decision of the High Court and the date of the decision of the Supreme Court shall be
excluded in computing the period referred to in clause (c) of sub-section (3).
In computing the period of limitation for the purpose of sub-section (3), any
period, during which any proceeding under this Section is stayed by an order or injunction of
any court, shall be excluded.
For the purposes of this Section, ‘record’ shall include all records relating to any
proceedings under this Act available at the time of examination by the Additional
Commissioner or the Commissioner.
Revision by High Court in certain cases.- (1) Within 1[one hundred and Eighty
days] from the date on which an order under sub-section (5) or (8) or (9) of Section 63 was
communicated to him, the appellant or the respondent may prefer a petition to the High
Court against the order on the ground that the Appellate Tribunal has either failed to decide
or decided erroneously any question of law:
1. Substituted Inserted by Act 11 of 2005 w.e.f. 1.4.2005.
The High Court may admit a petition preferred after the period of 1[one hundred
and Eighty days] aforesaid if it is satisfied that the petitioner has sufficient cause for not
preferring the petition within that period.
1. Substituted Inserted by Act 11 of 2005 w.e.f. 1.4.2005.
The petition shall be in the prescribed form, shall be verified in the prescribed
manner, and shall, when it is preferred by any person other than an officer empowered by
the Government under sub-section (1) of Section 63, be accompanied by a fee of one
hundred rupees.
If the High Court, on perusing the petition, considers that there is no sufficient
ground for interfering, it may dismiss the petition summarily:
The High Court shall not dismiss any petition unless the petitioner has had a
reasonable opportunity of being heard in support thereof.
(a) If the High Court does not dismiss the petition summarily, it shall, after giving
both the parties to the petition a reasonable opportunity of being heard, determine the
question or questions of law raised and either reverse, affirm or amend the order against
which the petition was preferred or remit the matter to the Appellate Tribunal with the opinion
of the High Court on the question or questions of law raised or pass such other order in
relation to the matter as the High Court thinks fit.
Where the High Court remits the matter to the Appellate Tribunal under clause (a)
with its opinion on questions of law raised, the latter shall amend the order passed by it in
conformity with such opinion.

Before passing an order under sub-section (6) the High Court may, if it considers
necessary so to do remit the petition to the Appellate Tribunal and direct it to return the
petition with its finding on any specific question or issue.
Notwithstanding that a petition has been preferred under sub-section (1), the tax
shall be paid in accordance with the assessment made in the case.
If as a result of the petition, any change becomes necessary in such assessment,
the High Court may authorize the prescribed authority to amend the assessment and the
prescribed authority shall amend the assessment accordingly and thereupon the amount
overpaid by the person concerned shall be refunded to him without interest or the additional
amount of tax due from him shall be collected in accordance with provisions of this Act, as
the case may be.
(a) The High Court may, on the application of either party to the petition, review
any order passed by it under sub-section (6) on the basis of facts which were not before it
when it passed the order.
The application for review shall be preferred within such time and in such manner
as may be prescribed, and shall where it is preferred by any person other than an officer
empowered by the Government under sub-section (1) of Section 63 be accompanied by a
fee of one hundred rupees.
(a) With a view to rectifying any mistake apparent from the record, the High
Court may, at any time within five years from the date of the order passed by it under sub-
section (6), amend such order.
The High Court shall not pass an order under this sub-section without giving both
parties affected by the order a reasonable opportunity of being heard.
In respect of every petition preferred under sub-section (1) or (10), the costs
shall be in the discretion of the High Court.
Appeal to High Court.- (1) Any person objecting to an order passed by the
Commissioner or the Additional Commissioner under Section 64 1[or a dealer aggrieved by
the order of the Authority under Section 60] may appeal to the High Court within sixty days
from the date on which the order was communicated to him.
1. Inserted Inserted by Act 11 of 2005 w.e.f. 1.4.2005.
The High Court may admit an appeal preferred after the period of sixty days
aforesaid, if it is satisfied that the person had sufficient cause for not preferring the appeal
within that period.
The appeal shall be in the prescribed form, shall be verified in the prescribed
manner, and shall be accompanied by a fee of five hundred rupees.
The High Court shall, after giving both parties to the appeal a reasonable
opportunity of being heard, pass such order thereon as it thinks fit.
The provisions of sub-sections (6) to (12) of Section 65, shall apply in relation to
appeals preferred under sub-section (1) as they apply in relation to petitions preferred under
sub-section (1) of Section 65.

Objections to Jurisdiction.- No objection as to the territorial or pecuniary
jurisdiction of any prescribed authority shall be entertained or allowed by any Court, Tribunal
or authority in an appeal or revision, unless such objection was taken before the prescribed
authority at the earliest possible opportunity.
Petitions, applications and appeals to High Court to be heard by a Bench of
not less than two judges.- Every Petition, application or appeal preferred to the High Court
under Section 65 or 66 shall be heard by a bench of not less than two Judges, and in respect
of such petition, application or appeal, the provisions of Section 98 of the Code of Civil
Procedure, 1908 (Central Act V of 1908), shall apply.
Rectification of mistakes.- (1) With a view to rectifying any mistake apparent
from the record, the prescribed authority, appellate authority or revising authority, may, at
any time within five years from the date of an order passed by it, amend such order.
Any amendment which has the effect of enhancing an assessment or otherwise
increasing the liability of the person concerned shall not be made unless the prescribed
authority, appellate authority or revising authority, as the case may be, has given notice to
the person concerned of its intention to do so and has allowed the person concerned the
opportunity of showing cause in writing against such amendment.
1[(2-a) Where an application is made by an assessee for rectification of any mistake
in an order, as being apparent from the record and, such application has not been rejected
by the assessing authority within sixty days from the date of receipt of the application, the
order shall be deemed to have been amended rectifying such mistake.]
1. Inserted by Act 6 of 2005 w.e.f. 19.3.2005.
Where an order has been considered and decided in any proceedings by way of
appeal or revision relating to an order referred to in sub-section (1), the authority passing
such order may, notwithstanding anything contained in any law for the time being in force,
amend the order under that sub-section in relation to any matter other than the matter which
has been so considered and decided.
An order passed under sub-section (1), shall be deemed to be an order passed
under the same provision of law under which the original order, the mistake in which was
rectified, has been passed.
Burden of proof.- (1) For the purposes of payment or assessment of tax or any
claim to input tax under this Act, the burden of proving that any transaction of a dealer is not
liable to tax, or any claim to deduction of input tax is correct, shall lie on such dealer.
Where a dealer knowingly issues or produces a false tax invoice, credit or debit
note, declaration, certificate or other document with a view to support or make any claim that
a transaction of sale or purchase effected by him or any other dealer, is not liable to be
taxed, or liable to tax at a lower rate, or that a deduction of input tax is available, the
prescribed authority shall, on detecting such issue or production, direct the dealer issuing or
producing such document to pay as penalty:
in the case of first such detection, three times the tax due in respect of such
transaction or claim; and

in the case of second or subsequent detection, five times the tax due in
respect of such transaction or claim.
Before issuing any direction for the payment of the penalty under this Section, the
prescribed authority shall give to the dealer the opportunity of showing cause in writing
against the imposition of such penalty.
Chapter VIII
Penalties, Offences and Power to make Rules
Penalties relating to registration.- (1) A dealer who, without reasonable cause,
fails to apply for registration within the time prescribed in sub-sections (1) or (2) or (3) of
Section 22 shall be liable to a 1[penalty not exceeding] five thousand rupees in addition to
the interest chargeable on the tax payable at the rate provided under Section 37. 1. Substituted by Act 6 of 2005 w.e.f. 19.3.2005.
A dealer who fails to report to the prescribed authority a change in circumstances
as required by Section 28 shall be liable to a 1[penalty not exceeding] five thousand rupees.
1. Substituted by Act 6 of 2005 w.e.f. 19.3.2005. The power to levy the penalties shall be vested in the registering authority as
prescribed.
Penalties relating to returns.- (1) A dealer who fails to furnish a return or who
fails to pay the tax due on any return furnished as required under Section 35 shall be liable
to a 1[penalty not exceeding two hundred rupees] for each day of default in addition to a
further penalty of a sum not less than ten per cent but not exceeding fifty per cent of the
amount of tax due, together with any tax or interest due. 1. Substituted by Act 6 of 2005 w.e.f. 19.3.2005.
A dealer who for any prescribed tax period furnishes a return which understates
his liability to tax or overstates his entitlement to a tax credit by more than five per cent of his
actual liability to tax, shall after being given the opportunity of showing cause in writing
against the imposition of a penalty, be liable to a penalty equal to twenty per cent of the
amount of such tax under or overstated. A dealer who furnishes a return which is incomplete or incorrect in any material
particular, shall be liable to a 1[penalty not exceeding two hundred rupees] for each day the
return remains incomplete or incorrect. 1. Substituted by Act 6 of 2005 w.e.f. 19.3.2005.
In any case where a dealer who has failed to furnish a return has been issued
with an assessment showing less than his actual liability to tax and he pays such tax as
assessed, such dealer, after being given the opportunity of showing cause in writing against
the imposition of a penalty, shall be liable to a 1[penalty not exceeding] to fifty per cent of the
amount of the tax under-assessed.
1. Substituted by Act 6 of 2005 w.e.f. 19.3.2005.
The power to levy the above penalties shall be vested in the prescribed authority
to which returns are required to be furnished.
Penalties in relation to unauthorised collection of tax.- (1) If any dealer, not
being registered under this Act, collects any amount by way of tax or purporting to be by way
of tax under this Act, he shall be liable to remit to the prescribed authority such amount,
whether or not that amount would be payable under the provisions of this Act, and also liable
to a penalty of an amount equal to the amount so collected, after being given the opportunity
of showing cause in writing against repayment of the tax and the imposition of such penalty.
The power to levy the above penalty shall be vested in the assessing authority as
prescribed.
Penalties relating to the keeping of records:- (1) Any dealer who fails to keep
and maintain proper records, in accordance with Sections 31 or by order of the prescribed
authority shall be liable to a penalty of five thousand rupees and, in addition, two hundred
rupees per day for so long as the failure continues after being given an opportunity to show
cause against such imposition of penalty.
Any dealer who fails to retain records and accounts in accordance with Sections
32 and 33, after being given the opportunity of showing cause in writing against the
imposition of a penalty, shall be liable to a penalty of ten thousand rupees.
The power to levy the above penalty shall be vested in the officer authorised
under Section 52.
Penalties relating to production of records and furnishing of information.-
Any dealer or person who on demand by the prescribed authority fails to produce any
records or furnish any information in accordance with the requirements of this Act, after
being given the opportunity of showing cause in writing against the imposition of a penalty,
shall be liable to a penalty of five thousand rupees and, in addition, two hundred rupees per
day for so as long as the failure continues.
Penalties relating to tax invoices, credit notes and debit notes.- (1) A
registered dealer who.-
fails to provide a tax invoice as required by sub-section (1) of Section 29 or a
credit or debit note as required by sub-section (1) or sub-section (2) of Section
30, or
provides a tax invoice otherwise than in accordance with the provisions of
Section 29 or a credit or a debit note as provided in Section 30,
shall be liable to a penalty of not less than 1[One thousand] rupees or an amount equivalent
to the tax payable on the transaction, whichever is higher.
1. Substituted by Act 6 of 2005 w.e.f. 19.3.2005.
The power to levy the above penalty shall be vested in the officer
authorised under Section 52.
Penalties relating to seals and to unaccounted stocks.- (1)Any person who
removes, or in any way tampers with, a seal attached under the provisions of clause (f) of
sub-section (1) of Section 52, and sub-section (4) of Section 53, shall be liable on conviction
by a Court, not inferior to that of a Magistrate of the First Class, to a fine of not less than five
thousand rupees but not exceeding 1[twenty five thousand] rupees and imprisonment for a
period 2[xxx] not exceeding one year.
Substituted by Act 6 of 2005 w.e.f. 19.3.2005.
Omitted by Act 6 of 2005 w.e.f. 19.3.2005.
Any person or dealer who is found to be in possession of unaccounted stocks of
any taxable goods under the provisions of clause (j) of sub-section (1) of Section 52, after

being given the opportunity of showing cause in writing against the imposition of a penalty,
shall be liable to a 1[penalty not exceeding] of five thousand rupees.
1. Substituted by Act 6 of 2005 w.e.f. 19.3.2005.
The power to levy the penalty under sub-section (2) shall be vested in the officer
authorised under Section 52.
Offences against officers. -Any person who obstructs, hinders, molests or
assaults an authorised officer or any other public servant assisting him in the performance
of his duties under this Act, or does anything which is likely to prevent or obstruct any
search or production of evidence, shall be liable on conviction by a Court, not inferior to that
of a Magistrate of the First Class, to a fine of not less than five thousand rupees but not
exceeding 1[twenty five thousand rupees or to imprisonment for a period not exceeding one
year or both].
1. Substituted by Act 6 of 2005 w.e.f. 19.3.2005.
Fraudulent evasion of tax.- Without prejudice to the provisions of Sections 71
to 77, if any person is knowingly concerned, in or in the taking of steps with a view to the
fraudulent evasion of tax by him or any other person, he shall be liable to a fine of one lakh
rupees or double the amount of the tax evaded, whichever is the greater or to imprisonment
for a minimum term of six months but not exceeding five years, or to both.
Cognizance of offences.- (1) No Court shall take cognizance of any offence
punishable under Sections 79 except with the previous sanction of the Joint Commissioner,
and no Court inferior to that of a Magistrate of the First Class, shall try any such offence.
Notwithstanding anything contained in the Code of Criminal Procedure, 1973
(Central Act 2 of 1974), all offences punishable under Sections 79 shall be cognizable and
bailable.
Disclosure of information.- (1) All particulars contained in any statement
made, returns furnished or accounts or documents produced in accordance with this Act, other than proceedings before a criminal court, shall, save as provided in sub- section (2),
be treated as confidential and not withstanding anything contained in the Indian Evidence
Act, 1872, no court shall save as aforesaid be entitled to require any officer of the
Government to produce before it any such statement, return, account, document or record
or any part thereof to give evidence before it in respect thereof. The Commissioner may furnish or cause to be furnished to:
any officer, authority or body performing any function under any law relating to the
imposition of any tax, duty, cess or fee; or
any such officer, authority or body performing any function under any other law as
the Government in the public interest may by notification specify, any such information relating to any person in respect of any assessment made under this
Act as may, in the opinion of the Commissioner be necessary for the purpose of enabling
the officer, authority or body to perform his or its function under that law.
If the Government or Commissioner is of the opinion that it is necessary or
expedient in the public interest to publish name of any person along with his photograph or
any other particulars relating to any proceeding under this Act in respect of such person, it

may cause to be published such name along with his photograph and particulars in such
manner as it thinks fit.
No publication under this Section shall be made relating to any penalty imposed
or any conviction for any offence connected with any proceeding under this Act, until the
time for presenting an appeal to the Appellate Authority has expired without any appeal
having been presented or the appeal has been disposed of.
Compounding offences.- (1) Where any dealer has committed an offence
under sub-section (1) of Section 77 or Section 79, the prescribed authority may, on
admission by such dealer in writing and upon his option to compound at any time prior to the
commencement of the court proceedings relating thereto, compound such offence and order
the dealer to pay such sum of money as specified by the prescribed authority, which shall
not exceed the amount of the fine prescribed for the offence, in addition to any tax and
interest due.
Furnishing of a cheque or any other instrument towards payment of a sum by any
such dealer shall be deemed to be an application for compounding the offence.
Where the prescribed authority compounds an offence under this Section, the
order referred to in sub-section (1),
shall be in writing and specify the offence committed, the sum of money to be
paid and the due date for the payment; and
shall be served on the dealer who committed the offence; and
shall be final and not subject to any appeal; and
may be enforced in the same manner as a decree of a court for the payment
of the amount stated in the order.
When the prescribed authority compounds an offence under this Section, the
dealer concerned shall not be liable to prosecution in respect of such offence or to any
further penalty under this Section and such dealer shall not appeal against the said
proceedings.
Validity of assessments not to be questioned in prosecution.- The validity of
the assessment of any tax or of the levy of any fee or other amount, made under this Act, or
the liability of any person to pay any tax, fee or other amount so assessed or levied shall not
be questioned in any Criminal Court in any prosecution or other proceeding, whether under
this Act or otherwise.
Bar and limitation to certain proceedings.- (1) No suit, prosecution or other
proceeding shall lie against any officer or servant of the Government, for any act done or
purported to be done under this Act without the previous sanction of the Government.
No officer or servant of the State Government shall be liable in respect of any
such act in any civil or criminal proceeding if the act was done in good faith in the course of
the execution of duties or the discharge of the functions imposed by or under this Act.
No suit shall be instituted against the State Government and no suit, prosecution
or other proceeding shall be instituted against any officer or servant of the State Government
in respect of any act done or purporting to be done under this Act, unless the suit,

prosecution or other proceeding is instituted within six months from the date of the act
complained of.
Courts not to set aside or modify assessments except as provided under
this Act.- Notwithstanding anything contained in any law for the time being in force, no suit
or other proceedings shall be entertained by any court, except as expressly provided for
under this Act, to set aside or modify any assessment or other proceedings commenced by
virtue of the provisions of this Act, and no such court shall question the validity of any
assessment, levy of penalty or interest nor grant any stay of proceedings or allow recovery
of any amount due under this Act.
Appearance before any Authority in proceedings.- Any person who is entitled
to appear before any authority other than the High Court in connection with any proceeding
under this Act, may be represented before such authority-
by his relative or a person regularly employed by him if such relative or person
is duly authorized by him in writing in this behalf;
by a legal practitioner; or
subject to such conditions as may be prescribed, by an Accountant or by a
person enrolled in the prescribed manner as a Tax Practitioner by the
Commissioner, and duly authorized by the person whom he represents.
Power to summon persons to give evidence.- (1) The officers empowered by
Rules made in this behalf shall have all the powers conferred on a Court by the Code of Civil
Procedure, 1908 (Central Act V of 1908), for the purpose of securing attendance of persons
or the production of documents in any enquiry under this Act.
The Commissioner or the assessing, appellate or revising authority shall, in
securing the attendance of any dealer as a witness before the Tribunal or High Court or for
production of any document for the purposes of this Act at such proceedings, have the same
powers as those conferred on a civil court under the provisions of the Civil Procedure Code,
1908 (Central Act 5 of 1908).
Power to make rules.- (1) The Government may, subject to the condition of
previous publication, make rules, by notification, to carry out the purposes of this Act.
In particular and without prejudice to the generality of the foregoing power,
such rules may provide for:
all matters expressly required or allowed by this Act to be prescribed;
estimation of turnover for purposes of registration on the basis of inventory of
goods found at the time of inspection or during survey
the assessment to tax under this Act of business which are discontinued or the
ownership of which has changed;
the procedure for assessment of Central and State Government Departments,
Statutory Bodies and Local Authorities;
the assessment to tax under this Act of business owned by minors and other
incapacitated persons or by persons residing outside the State;

the assessment of a business owned by any person whose estate or any portion
of whose estate is under the control of the court of Wards, the Administrator-
General, the Official trustee or any receiver or manager, including any person
whatever his designation who in fact manages property on behalf of another,
appointed by or under any order of a Court;
the administration of the checkposts set up and the barriers erected under this
Act and the regulation of work therein;
the assessment to tax under this Act of any turnover which has escaped
assessment;
compelling the submission of returns and the production of documents and
enforcing the attendance of persons and examining them on oath or affirmation;
securing that returns furnished or accounts or documents produced or evidence
of any kind given under this Act before any prescribed authority or an appeal or
revision from any decision of such authority are kept confidential;
the procedure to be followed and the powers exercisable in proceedings for
recovery under Section 42;
the duties and powers of officers appointed for the purpose of enforcing the
provisions of this Act;
the term of office and conditions of service of the members of the Appellate
Tribunal;
the fees payable for the grant of duplicate certificates of registration or licences or
copies of such certificates and licences or of any other document;
the maintenance of purchase bills or accounts of purchases and sales by dealers
and the time for which they should be preserved;
the issue of delivery notes or way bills in respect of goods delivered or
transferred to retail dealers in pursuance of sales effected to them, the form and
manner of their issue and the time for which they should be preserved;
the extent of liability of commission agent, broker, del credere agent, auctioneer
or any other mercantile agent, who carries on the business of buying, selling,
supplying or distributing goods on behalf of any principal;
the qualifications and disqualifications of Tax Practitioners, the procedure for their
enrolment, the fees payable for enrolment and the fees payable for annual
renewal of such enrolment;
generally regulating the procedure to be followed and the forms to be adopted in
proceeding under this Act;
any other matter for which there is no provision or no sufficient provision in this
Act and for which provision is, in the opinion of the Government, necessary for
giving effect to the purposes of this Act.
In making a rule under sub-section (1) or sub-section (2), the Government may
provide that a person guilty of breach thereof shall, on conviction by a Magistrate of the first

class, be punishable with fine which may extend to five thousand rupees and where the
breach is a continuing one, with further fine which may extend to one hundred rupees for
every day after the first breach during which the breach continues.
Any rule under this Act may be made to have effect retrospectively and when any
such rule is made, a Statement specifying the reasons for making such a rule shall be laid
before both Houses of the State Legislature along with the rule under Section 90, and all
rules, shall, subject to any modification made under Section 90, have effect as if enacted in
this Act.
Laying of Rules and notifications before the State Legislature.- Every rule
made under this Act and every notification issued under Section 88 shall be laid as soon as
may be after it is published before each House of the State Legislature while it is in session
for a total period of thirty days which may be comprised in one session or in two or more
successive sessions, and if before the expiry of the session in which it is so laid or the
sessions immediately following, both Houses agree in making any modification in the rule or
notification or both Houses agree that the rule or notification should not be made, the rule or
notification shall thereafter have effect only in such modified form or be of no effect, as the
case may be; so, however, that any such modification or annulment shall be without
prejudice to the validity of anything previously done under that rule or notification.
Power to remove difficulties.- (1) If any difficulty arises in giving effect to the
provisions of this Act in consequence of the transition to the said provisions of this Act from
the provisions of the Acts in force immediately before the commencement of this Act, the
Government may by Notification in the Official Gazette make such provisions as appear to it
to be necessary or expedient for removing difficulty.
If any difficulty arises in giving effect to the provisions of the Act, otherwise than in
relation to the transition from the provisions of the Acts in force before the commencement of
this Act, the Government may, by notification, make such provisions, not inconsistent with
the purposes of this Act, as appear to it to be necessary or expedient for removing the
difficulty.
FIRST SCHEDULE
(Goods exempted from tax under Section 5)
Serial Number Description of Goods
1 2 Petrol including special boiling spirit.
Diesel.
Aviation turbine fuel.
Sugar cane.
Lottery tickets.
Agricultural implements manually operated or animal driven.
Aids and implements used by handicapped persons.
8. Animal feed and feed supplements, namely, processed commodity sold as poultry
feed, cattle feed, pig feed, fish feed, fish meal, prawn feed, shrimp feed and feed supplements and mineral mixture concentrates, intended for use as feed
supplements.
9. Betel leaves.

Books, Periodicals and journals.
Charakha, Ambar Charaka, handloom fabrics and Gandhi Topi.
Charcoal and firewood.
Coarse grains and their flour excluding paddy, rice and wheat and their flour.
Condoms and contraceptives.
Cotton and silk yarn in hank.
Curd and butter milk.
Earthen Pots.
Electrical energy.
Fish seeds, Prawn seeds, Shrimp seeds, fishing nets and twine, country made non-
mechanised boats and fishing requisites including purse-seiners and gill netters, but
excluding trawlers and other mechanized boats. Fresh milk and pasteurised milk
Fresh plants, saplings, fresh flowers, plantain leaves, patravali (dinner leaves) and
their products. Fresh Vegetables & fresh fruits.
Garlic, ginger, green chillies, onions, potatoes, sweet potatoes, tapioca and their
seeds. Glass bangles.
Hay (green or dry).
Human blood and blood plasma.
Kumkum, bindi and sindhur.
Meat including flesh of poultry, fish, prawns, shrimps and lobsters, except when sold
in sealed containers; eggs, livestock including poultry, but excluding horses; animal
hair including raw wool. National flag.
Organic manure, Compost manure, fish manure and poultry manure.
Non-judicial stamp paper sold by the Government Treasuries and authorized
vendors; postal items like envelopes, post card including greeting cards and stamps
sold by the Government; rupee note when sold to the Reserve Bank of India;
cheques, loose or in book form. Semen including frozen semen.
Silkworm eggs, silkworm pupae, silkworm cocoons and raw silk including raw silk
yarn, but excluding raw silk imported from outside the country.
Slates, slate pencils and chalk crayons.
Tender coconuts.
Toddy, Neera and Arrack
Unprocessed salt.
Water other than-
aerated, mineral, distilled , medicinal , ionic , battery and de-mineralised water;
and water sold in sealed container.
Liquor including Beer, Fenny, Liqueur and Wine
Rectified spirit.

41. 1[Animal shoe nails.
Plastic bangles. Un-branded broomsticks.
Leaf plates and cups whether pressed or stitched.
Vibhuthi.
All varieties of textiles namely, cotton, woollen or artificial silk including rayon or
nylon whether manufactured in mills, power looms or in handlooms and hosiery cloth
in lengths (produced or manufactured in India) as described from time to time in Column 2 of the First Schedule to the Additional Duties of Excise (Goods of Special
Importance) Act, 1957 (Central Act 58 of 1957). Sugar (produced or manufactured in India) as described from time to time in Column
of the First Schedule to the Additional Duties of Excise (Goods of Special
Importance) Act, 1957 (Central Act 58 of 1957). Tobacco and all its products (produced or manufactured in India) as described from
time to time in Column 2 of the First Schedule to the Additional Duties of Excise
(Goods of Special Importance) Act, 1957 (Central Act 58 of 1957).] Inserted by Act 6 of 2005 w.e.f. 19.3.2005.
1[Avalakki (Beaten Rice) and Mandakki (Parched or puffed rice).
Bread and bun. Pappads.
Seeds.]
Inserted by Act 11 of 2005 w.e.f. 1.4.2005.
SECOND SCHEDULE
GOODS TAXABLE AT ONE PER CENT
[Section 4(1)(a)(i)]
Serial Number Description of goods
1 2
Bullion and specie Jewellery and articles of gold, silver and other noble metals whether or not
studded with precious or semi-precious stones.
THIRD SCHEDULE
GOODS TAXABLE AT FOUR PER CENT [Section 4(1)(a)(ii)]
Serial Description of goods Number
2
Agricultural implements not operated manually or not driven by animal. All kinds of bricks including fly ash bricks; refractory bricks and the like; ashphaltic
roofing sheets; earthen tiles.
All kinds of yarn other than cotton and silk yarn in hank; sewing thread. Aluminium utensils and enamelled utensils. Arecanut.

Bamboo 1[and cane] Inserted by Act 6 of 2005 w.e.f. 19.3.2005.
Bearings of all kinds. Beedi leaves. Beltings, namely, Transmission, conveyor or elevator belts or belting of vulcanized
rubber whether combined with any textile material or otherwise.
Bicycles, tandem cycles, cycle combinations, cycle-rickshaws, 1[xxx], children’s tricycles and similar articles and parts and accessories thereof including their tyres, tubes and flaps. Omitted by Act 6 of 2005 w.e.f. 19.3.2005.
Bitumen. Bone meal.
1[Tea]. Substituted by Act 11 of 2005 w.e.f. 1.4.2005.
Bulk drugs. Capital goods as may be notified. Chemical fertilizers and chemical fertilizer mixtures 1[including gypsum]; Insecticides,
pesticides, rodenticides, fungicides, weedicides, herbicides, plant regulators and plant growth nutrients. Inserted by Act 11 of 2005 w.e.f. 1.4.2005.
Coffee beans and seeds (whether raw or roasted); cocoa pods and beans; green tea
leaf and chicory. Coir and Coir products excluding rubberised coir products. Cotton waste and cotton yarn waste. Declared goods as specified in Section 14 of the Central Sales Tax Act, 1956
(Central Act 74 of 1956).
Edible oils (Non-refined and refined), oil cake and de-oiled cake 1[but excluding coconut oil sold in consumer sachets, bottles or tins of 200 grams or 200 mililitre each or less, including when such consumer containers are sold in bulk in a common container] Inserted by Act 6 of 2005 w.e.f. 19.3.2005.
Exercise books, student note books, graph books and laboratory note books. Exim scrips, REP licenses, special import licenses (SIL), value based advance
licenses (VABAL), Export quotas, copyrights, patents and the like.
Fibres of all kinds and fibre waste. Flour (atta), poha, maida, soji of rice, wheat and maize; flour of pulses. Fried gram. Hand pumps and parts thereof. Hose pipes. Hosiery goods. Husk and bran of cereals and pulses. Ice. Incense sticks such as, agarbathi, dhupkathi and dhupbam. Indian musical instruments namely, Veena, violin, tambura, mridanga, ghatam,
khanjira, harmonium, flute, star, sarod, santoor, dilruba, nadaswara, dolu, tabla,
shehnai, pakwaz, vichitra veena, gotu vadyam, morsing, chande, triangle, rudraveena and sarangi and parts and accessories thereof.
Industrial cables namely High voltage cables, XLPE Cables, jelly filled cables and
optical fibres.
Industrial inputs and packing materials as may be notified.

IT Products including telecommunication equipments as may be notified. Jaggery. Kerosene oil sold through Public Distribution System (PDS).
1[Lime, lime stone, products of lime, dolomite and other white washing materials]. Substituted by Act 11 of 2005 w.e.f. 1.4.2005.
Medicinal plants, roots, herbs and barks used in the preparation of Ayurvedic
medicines. 1[Medicinal and pharmaceutical preparations].
Substituted by Act 11 of 2005 w.e.f. 1.4.2005.
Non-ferrous Castings. Non-ferrous metals and alloys; Ingots, slabs, blocks, billets, sheets, circles, hoops,
strips, bars, rods, rounds, squares, flats of 1[and other extrusions of aluminium,
brass, bronze, copper, cadmium, lead and zinc metal powders, metal pastes of all types and grades, metal scraps]. Inserted by Act 6 of 2005 w.e.f. 19.3.2005.
Ores and minerals including lumps and fines. Paper of all kinds including ammonia paper, blotting paper, carbon paper,
cellophane, PVC coated paper, stencil paper, water proof paper, art boards, card boards, corrugated boards, duplex boards, pulp boards, straw boards, triplex boards
and the like, but excluding photographic paper; waste paper, paper waste and newsprint.
Pipes, tubes and fittings of all kinds excluding conduit pipes and its fittings. Plastic footwear. Printed materials other than books meant for reading; stationary articles namely,
Account books, paper envelopes, diaries, calendars, race cards, catalogues, greeting cards, invitation cards, humour post cards, picture post cards, cards for special
occasions, photo and stamp albums. Printing ink excluding toner and cartridges. Processed and branded salt. Pulp of bamboo, wood and paper. Rail coaches, engines and wagons. Readymade garments. Renewable energy devices and parts thereof. Safety matches.
1[Mixed PVC stabilizer]. Substituted by Act 11 of 2005 w.e.f. 1.4.2005.
Sewing machines. Ship and other water vessels. Skimmed milk powder. Solvent oils other than organic solvent oil. Spices in all forms including jeera (cumin seeds), methi, poppy seeds (kaskas),
Corriander (dhaniya), shajeera, somph, katha, azwan, kabab chini, bhojur phool, tejpatha, japatri, nutmeg (marathamoggu), kalhoovu, aniseed, turmeric, cardamom, pepper, cinnamon, dal chinny,cloves, tamarind and dry chillies.
Sports goods (indoor and out door) including body building equipments, but
excluding wearing apparels and footwear.
Starch. Tractors and Power tillers, their parts and accessories including trailers, but
excluding batteries, tyres, tubes and flaps.

Transmission towers (electrical) 1[and wires, and conductors such as Aluminium
conductor steel reinforced]. Inserted by Act 6 of 2005 w.e.f. 19.3.2005.
Umbrellas excluding garden and beach umbrellas. Vanaspathi (Hydrogenated Vegetable Oil). 1[Vegetable oil including gingili oil, bran oil and castor oil excluding vegetable oil
used as toilet article]. Substituted by Act 6 of 2005 w.e.f. 19.3.2005.
Welding Electrodes of all kinds, graphite electrodes including anodes, welding rods,
soldering rods and soldering wires
Writing instruments such as pens, pencils and the like 1[including refills of pens]. Inserted by Act 6 of 2005 w.e.f. 19.3.2005.
1[Articles made of rolled gold or imitation gold. Bagasse. Centrifugal, monobloc and submersible pumps and parts thereof Clay. Embroidery or zari articles, that is to say, imi, zari, kasab, saima, dabka, chumki,
gota, sitara, naqsi, kora, glass bead, badla, gizal. Fireclay, coal ash, coal boiler ash, coal cinder ash, coal powder and clinker. Lignite.
1[pulses other than those specified in serial No. 20]1. Substituted by Act 11 of 2005 w.e.f. 1.4.2005.
2[xxx xxxx xxx.]2]1
Inserted by Act 6 of 2005 w.e.f. 19.3.2005.
Omitted by Act 11 of 2005 w.e.f. 1.4.2005
FOURTH SCHEDULE
GOODS TAXABLE AT TWENTY PER CENT
[Section 4(1)(a)(iii)]
Serial Number Description of goods
1 2 Narcotics Molasses
FIFTH SCHEDULE
INPUT TAX RESTRICTED GOODS
(Section 11(3))
Serial Number Description of Goods
1 2
Motor vehicles of all kinds, aeroplanes, helicopters or any other type of flying
machine, parts and accessories thereof including tyres, tubes and flaps.
Articles of food and drinks, including cakes, biscuits and confectionery; ready to
serve foods; processed or semi-processed or semi-cooked food-stuffs; fruits, fruit

and vegetable products sold in any kind of sealed containers; dressed chicken, meat, fish, prawns, shrimps and lobsters sold in any kind of sealed containers;
aerated water, including soft drinks; sweets and sweet meats; instant mixes; soft drink concentrates; spice powders, pastes and the like; tobacco and tobacco
products.
All electrical or electronic goods and appliances including air conditioners, air
coolers, telephones, fax machines, duplicating machines, photocopiers and scanners, parts and accessories thereof, other than those for use in the
manufacture, processing, packing or storing of goods for sale and those for use in computing, issuing tax invoice or sale bills, security and storing information.
Textiles, crockery, cutlery, carpets, paintings and artifacts.
Furniture including slotted angles and ready to assemble parts of furniture,
stationery articles including paper, sanitary fittings, cement and other construction
materials including bricks, timber, wood, glass, mirrors, roofing materials, stones,
tiles and paints, toilet articles.

MBA- H4030 International Business Finance
1
UNIT – I
INTERNATIONAL MONETARY AND FINANCIAL SYSTEM
Objectives:
After studying this unit, you should be able to understand the:* Concept of International Monetary and Financial System:* Importance of international finance;* Bretton woods conference and afterwards developments;* Role of IMF and the World Bank in International business;* Meaning and scope of European monetary system.
Structure:
IntroductionCurrency terminologyHistory of International Monetary SystemInter-war years and world war IIBretton Woods and the International Monetary Fund, 1944-73.Exchange Rate Regime, 1973-851985 to date : The era of the managed floatCurrent International Financial SystemInternational Monetary Fund (IMF)The IMF’s Exchange Rate Regime classificationsFixed vs. Flexible Exchange RatesDetermination of Exchange RateWorld BankEuropean Monetary SystemEuropean Bank of Investment (EBI)European Monetary Union (EMU)Foreign Exchange MarketsInternational Financial MarketsSummaryFurther Readings
AcroPDF - A Quality PDF Writer and PDF Converter to create PDF files. To remove the line, buy a license.

MBA- H4030 International Business Finance
2
INTRODUCTION
The international monetary system is the framework within which
countries borrow, lend, buy, sell and make payments across political frontiers.
The framework determines how balance of payments disequilibriam is resolved.
Numerous frameworks are possible and most have been tried in one form or
another. Today’s system is a combination of several different frameworks. The
increased volatility of exchange rate is one of the main economic developments
of the past 40 years. Under the current system of partly floating and partly fixed
undergo real and paper fluctuations as a result of changes in exchange rates.
Policies for forecasting and reacting to exchange rate fluctuations are still
evolving as we improve our understanding of the international monetary system,
accounting and tax rules for foreign exchange gains and losses, and the
economic effect of exchange rate changes on future cash flows and market
values.
Although volatile exchange rate increase risk, they also create profit
opportunities for firms and investors, given a proper understanding of exchange
risk management. In order to manage foreign exchange risk, however,
management must first understand how the international monetary system
functions. The international monetary system is the structure within which
foreign exchange rates are determined, international trade and capital flows are
accommodated, and balance-of-payments (BoP) adjustments made. All of the
instruments, institutions, and agreements that link together the world’s currency,
money markets, securities, real estate, and commodity markets are also
encompassed within that term.
AcroPDF - A Quality PDF Writer and PDF Converter to create PDF files. To remove the line, buy a license.

MBA- H4030 International Business Finance
3
CURRENCY TERMINOLOGY
Let us begin with some terms in order to prevent confusion in reading this
unit:
A foreign currency exchange rate or simply exchange rate, is the price of one
country’s currency in units of another currency or commodity (typically gold or
silver). If the government of a country- for example, Argentina- regulates the
rate at which its currency- the peso- is exchanged for other currencies, the
system or regime is classified as a fixed or managed exchange rate regime. The
rate at which the currency is fixed, or pegged, is frequently referred to as its par
value. if the government does not interfere in the valuation of its currency in any
way, we classify the currency as floating or flexible.
Spot exchange rate is the quoted price for foreign exchange to be delivered at
once, or in two days for inter-bank transactions. For example, ¥114/$ is a quote
for the exchange rate between the Japanese yen and the U.S. dollar. We would
need 114 yen to buy one U.S. dollar for immediate delivery.
Forward rate is the quoted price for foreign exchange to be delivered at a
specified date in future. For example, assume the 90-day forward rate for the
Japanese yen is quoted as ¥112/$. No currency is exchanged today, but in 90
days it will take 112 yen to buy one U.S. dollar. This can be guaranteed by a
forward exchange contract.
Forward premium or discount is the percentage difference between the spot
and forward exchange rate. To calculate this, using quotes from the previous two
examples, one formula is:
AcroPDF - A Quality PDF Writer and PDF Converter to create PDF files. To remove the line, buy a license.

MBA- H4030 International Business Finance
4
S – F 360 ¥114/$ - ¥112/$ 360-------- X ------- X 100 = -------------------- X ------ X100 = 7.14%
F n ¥112/$ 90Where S is the spot exchange rate, F is the forward rate, and n is the number of
days until the forward contract becomes due.
Devaluation of a currency refers to a drop in foreign exchange value of a
currency that is pegged to gold or to another currency. In other words, the par
value is reduced. The opposite of devaluation is revaluation. To calculate
devaluation as a percentage, one formula is:
Beginning rate – ending ratePercentage change = ------------------------------------------
Ending rate
Weakening, deterioration, or depreciation of a currency refers to a drop in the
foreign exchange value of a floating currency. The opposite of weakening is
strengthening or appreciating, which refers to a gain in the exchange value of a
floating currency.
Soft or weak describes a currency that is expected to devalue or depreciate
relative to major currencies. It also refers to currencies whose values are being
artificially sustained by their governments. A currency is considered hard or
strong if it is expected to revalue or appreciate relative to major trading
currencies.
The next section presents a brief history of the international monetary system
form the days of the classical gold standard to the present time.
INTERNATIONAL MONETARY SYSTEM
Over the ages, currencies have been defined in terms of gold and other
items of value, and the international monetary system has been the subject of a
AcroPDF - A Quality PDF Writer and PDF Converter to create PDF files. To remove the line, buy a license.

MBA- H4030 International Business Finance
5
variety of international agreements. A review of these systems provides a useful
perspective from which to understand today’s system and to evaluate weakness
and proposed changes in the present system.
The Gold Standard, 1876-1913
Since the days of the Pharaohs (about 3000 B.C.), gold has served as a
medium of exchange and a store of value. the Greeks and Romans used gold
coins and passed on this through the mercantile era to the nineteenth century.
The great increase in trade during the free-trade period of the late nineteenth
century led to a need for a more formalized system for settling international
trade balances. One country after another set a par value for its currency in terms
f gold and then tried to adhere to the so-called “rules of the game”. This later
came to be known as the classical gold standard. The gold standard as an
international monetary system gained acceptance in Western Europe in the
1870s. the United States was something of a latecomer to the system, not
officially adopting the standard until 1879.
The “rules of the game” under the gold standard were clear and
simple. Each country set the rate at which its currency unit could be converted to
a weight of gold. The United States, for example, declared the dollar to be
convertible to gold at a rate of $20.67 per ounce of gold (a rate in effect until the
beginning of World War I). The British pound was pegged at £4.2474 per ounce
of gold. As long as both currencies were freely convertible into gold, the
dollar/pound exchange was:
$20.67/ounce of gold----------------------------- = $4.8665 / ££4.2474/ounce of gold
AcroPDF - A Quality PDF Writer and PDF Converter to create PDF files. To remove the line, buy a license.

MBA- H4030 International Business Finance
6
Because the government of each country on the gold standard agreed to
buy or sell gold on demand with anyone at its own fixed parity rate, the value of
each individual currency in terms of gold-and therefore exchange rates between
currencies- was fixed. Maintaining adequate reserves of gold to back its
currency’s value was very important for a country under this system. The system
also had the effect of implicitly limiting the rate at which any individual country
could expand its money supply. Any growth in the amount of money was
limited to the rate at which official authorities could acquire additional gold.
INTER-WAR YEARS AND WORLD WAR II, 1914 – 1944
After World War I, in twenties, the exchange rates were allowed to
fluctuate. This was the result of large fluctuations in currency values.
Consequently, the trade could not develop. Once a currency became weak, it
was further weakened because of speculative expectations. The reverse
happened with strong currencies, because of these unwarranted fluctuations in
exchange rates, the trade volumes did not grow in proportion to the growth in
GNP. Many attempts were made to return to gold standard. U.S. could adopt it
in 1919, U.K. in 1925 and France in 1925. U.K. fixed pre-war parity. In 1934,
U.S. modified the gold standard by revising the price of gold (from
$20.67/ounce to $35/ounce) at which the conversions could be effected.
Till World War II practically the above practice remained in force. The
gold standard to which countries returned in mid twenties was different than
which existed prior to 1914. The major difference was that instead of two
international reserve assets, there were several currencies, which were
convertible to gold and could be termed as reserves. Apart from pound, French
Francs, U.S. dollar had also gained importance. Whenever French accumulated
AcroPDF - A Quality PDF Writer and PDF Converter to create PDF files. To remove the line, buy a license.

MBA- H4030 International Business Finance
7
pound sterling, they used to convert these into gold. The second difference was
that Britain had returned to gold standard with a decline in relative costs and
prices.
In 1931 the crisis began with the failure of a branch banking
institution in Austria called Ke Kredit Anstalt. Had British, U.S. and French
banks did not cooperated, this could have a small impact on world exchange rate
environment, but French banks did not cooperate. Germans withdrew their
money from Austria leading to deepening of crisis led to dismemberment of
Gold Standard.
BRETTON WOODS AND THE INTERNATIONAL MONETARY FUND(IMF), 1944-1973
Of paramount importance to the representatives at the 1944 meeting in
Bretton Woods was the prevention of another breakdown of the international
financial order, such as the one, which followed the peace after the First World
War. From 1918 until well into the 1920s the world had witnessed a rise in
protectionism on a grand scale to protect jobs for those returning the war,
competitive devaluations designed for the same effect, and massive
hyperinflation as the inability to raise conventional taxes led to use of the hidden
tax of inflation: inflation shifts buying power from the holders of money, whose
holdings buy less to the issuers of money, the central banks. A system was
required that would keep countries from changing exchange rates to obtain a
trading advantages and to limit inflationary policy. This meant that some sort of
control on rate changes was needed, as well as a reserve base for deficit
countries. The reserves were to be provided via an institution created for the
purpose. The International Monetary Fund (IMF) was established to collect and
allocate reserves in order to implement the Articles of Agreement signed in
Bretton Woods.
AcroPDF - A Quality PDF Writer and PDF Converter to create PDF files. To remove the line, buy a license.

MBA- H4030 International Business Finance
8
The Articles of Agreement required IMF member countries (of which there
were 178 as of March 1994) to:
1. Promote international monetary cooperation
2. Facilitate the growth of trade
3. Establish a system of multilateral payments
4. Create a reserve base
The reserves were contributed by the member countries according to a
quota system (since then many times revised) base on the national income and
importance of trade in different countries. Of the original contribution, 25
percent was in gold- the so-called gold tranche position- and the remaining 75
percent was in the country’s own currency. A country was allowed to borrow up
to its gold-tranche contribution without IMF approval and to borrow an
additional 100 percent of its total contribution in four steps, each with additional
stringent conditions established by the IMF. These conditions were designed to
ensure that corrective macroeconomic policy actions would be taken. The
lending facilities have been expanded over the years. Standby arrangements
were introduced in 1952, enabling a country to have funds appropriated ahead
of the need so that currencies would be less open to attack during the IMF’s
deliberation of whether help would be made available. Other extensions of the
IMF’s lending ability took the form of:
a. The Compensating Financing Facility, introduced in 1963 to help
countries with temporarily inadequate foreign exchange reserves as a
result of events such as crop failures.
b. The Extended Fund Facility of 1974, providing loans for countries with
structural difficulties that take longer to correct.
c. The Trust Fund from the 1976 Kingston Agreement to allow the sale
of goods, which was no longer to have a formal role in the international
AcroPDF - A Quality PDF Writer and PDF Converter to create PDF files. To remove the line, buy a license.

MBA- H4030 International Business Finance
9
financial system. The proceeds of gold sales are used for special
development loans.
d. The Supplementary Financing Facility, also known as the Witteveen
Facility after the then managing director of the IMF. This gives standby
credits and replaced the 1974-1976 Oil Facility, which was established
to help countries with temporary difficulties resulting from oil price
increases.
e. The Buffer Stock Facility, which grants loans to enable countries to
purchase crucial inventories.
These facilities were supplemented by the 1980 decision allowing the
IMF to borrow in the private capital market when necessary and by the
extension of borrowing authority in the 1990 General Arrangements to
Borrow, Which allows the IMF to lend to nonmembers. The scope of the IMF’s
power to lend was further expanded in 1993, when new facilities to assist in
exchange-rate stabilization were made available.
As we have seen, the most important feature of the Bretton Woods
agreement was the decision to have the U.S. dollar freely convertible into gold
and to have the values of other currencies fixed in U.S. dollars. The exchange
rates were to be maintained within 1 percent on either side of the official parity,
with intervention required as the support points. This required to the United
States to maintain a reserve of gold, and other countries to maintain reserve of
U.S. dollars. Because the initially selected exchange rates could have been
incorrect for balance-of-payments (BoP) equilibrium, each country was allowed
a revision of up to 10 percent within a year of the initial selection of the
exchange rate. In this basic form the system survived until 1971.
AcroPDF - A Quality PDF Writer and PDF Converter to create PDF files. To remove the line, buy a license.

MBA- H4030 International Business Finance
10
The central place of the U.S. dollar was viewed by John Maynard Keynes
as a potential weakness. Keynes preferred an international settlement system
based on a new currency unit, the Bancor. However, the idea was rejected, and it
was not until the 1960s that the inevitable collapse of the Bretton Woods
arrangement was recognized by a Yale economist, Robert Triffin. According to
the Triffin Paradox, in order for the stock of world reserves to grow along with
world trade, the provider of reserves, the United States, had to run BoP deficits.
These deficits were the means by which other countries could accumulate dollar
reserves. Although the U.S. deficits were needed, the more they occurred, the
more the holders of dollars doubted the ability of the United States to convert
dollars into gold at the agreed price. This built-in paradox meant that the system
was doomed.
Among the more skeptical holders of dollars was France, which began
in 1962 to exchange dollars for gold despite the objection of the United States.
Not only were the French doubtful about the future value of the dollar but they
also objected to the prominent role of the United States was political, and part
was base on the seigniorage gains that France believed accrued to the United
States by virtue of the U.S. role as the world’s banker. Seigniorage is the profit
from “printing” money and depends on the ability to have people hold your
currency or other assets at a noncompetitive yield. Every government which
issues legal-tender currency can ensure that it is held by its own citizens, even if
it offers no yield at all. For example, U.S. citizens will hold Federal Reserve
notes and give up goods or services for them, even though the paper the notes
are printed on costs very little to provide.
The United States was in a special position because its role as the
leading provider of well as U.S. citizens would hold U.S. dollars. However,
AcroPDF - A Quality PDF Writer and PDF Converter to create PDF files. To remove the line, buy a license.

MBA- H4030 International Business Finance
11
most reserves of foreign central banks were and are kept in securities such as
treasury bills, which yield interest. If the interest that is paid on the reserve
assets is a competitive yield, then the seigniorage gains to the United State from
foreign holding U.S. dollar assets is small. Indeed, with sufficient competition
from (1) alternative reserves of different currencies and (2) alternative dollar
investments in the United States, seigniorage gains would be competed away.
Nevertheless, the French continued to convert their dollar holdings into gold.
This led other countries to worry about whether the United States would have
sufficient gold to support the U.S. dollar the French had finished selling their
dollars: under a fractional reserve standard, gold reserves are only a fraction of
dollars held. By 1968, the run on gold was of such a scale that a March meeting
in Washington, D.C., a two-tier gold-pricing system was established. While the
official U.S. price of gold was to remain at $35 per ounce, the private-market
price of gold was to be allowed to find its own level.
After repeated financial crises, including a devaluation of the pound
from $2.80/£ to $2.40/£ in 1967, some relief came in 1970 with the allocation of
Special Drawing Rights (SDRs). The SDRs are book entries that are credited to
the Accounts of IMF member countries according to their established quotas.
They can used to meet payments imbalances, and they provide a net addition to
the stock of reserves without the need for any country to run deficits or mine
gold. From 1970 to 1972, approximately $9.4 billion worth of the SDRs (or
paper gold) was created, and there was no further allocation until January 1,
1979, when SDR 4 billion was created. Similar amounts were created on
January 1, 1980, and on January 1, 1981, bringing the total to over SDR 20
billion. No allocations of SDRs have occurred since 1981. A country can draw
on its SDRs as long as it maintains an average of more than 30 percent of its
cumulative allocation, and a country is required to accept up to 3 times its total
AcroPDF - A Quality PDF Writer and PDF Converter to create PDF files. To remove the line, buy a license.

MBA- H4030 International Business Finance
12
allocation. Interest is paid to those who hold SDRs and by those who draw down
their SDRs, with the rate based on an average of money-market interest rates in
the United States, the United Kingdom, Germany, Japan, and France.
The SDR was originally set equal in value to the gold content of a U.S.
dollar in 1969, which was 0.888571 grams, or 1/35 oz. The value was latter
revised first being based on a weighted basket of 16 currencies and subsequently
being simplified to 5 currencies. The amount of each currency and the U.S.
dollar equivalents are the currency basket and the weights are revised every 5
years according to the importance of each country in international trade. The
value of the SDR is quoted daily.
-------------------------------------------------------------------------------------------------
Currency currency Amount U.S. $ Equivalent
Deutschemark 0.4530 0.2659
French Frane 0.0800 0.1324
Japanese Yen 31..8000 0.3150
Pound Sterling 0.0812 0.1189
U.S. Dollar 0.5720 0.5720
Total $1.4042 = 1 SDR
If the SDR had arrived earlier, it might have prevented or postponed the
collapse of the Bretton Woods system, but by 1971, the fall was imminent. After
only two major revisions of exchange rates in the 1950s and 1960s- the floating
of the Canadian dollar during the 1950s and the devaluation of sterling in 1967-
events suddenly began to unfold rapidly. On August 15, 1971, the United States
responded to a huge was placed on imports, and a grogram of wage and price
controls was introduced. Many of the major currencies were allowed to float
against the dollar, and by the end of 1971 most had appreciated, with the
AcroPDF - A Quality PDF Writer and PDF Converter to create PDF files. To remove the line, buy a license.

MBA- H4030 International Business Finance
13
German mark and the Japanese yen both up 12 percent. The dollar had begun a
decade of decline.
On August 15, 1971, the United States made it clear that it was no
longer content to support a system based on the U.S. dollar. The costs of being a
reserve currency were perceived as having begun to exceed any benefit in terms
of seigniorage. The 10 largest countries were called together for a meeting at the
Smithsonian Institution in Washington in Washington, D.C. As a result of the
Smithsonian Agreement, the United States raised the price of gold to $38 per
ounce (that is, devalued the dollar). Each of the other countries in return
revalued its currency by an amount of up to 10 percent. The band around the
new official parity values was increased from 1 percent to 21/4 on either side,
but several European Community countries kept their own exchange rates within
a narrow range of each other while jointly allowing the 41/2 percent band vis-à-
vis the dollar. As we have seen, the “snake,” as the European fixed-exchange-
rate system was called, became, with some minor revisions, the Exchange Rate
Mechanism (ERM) of the European Monetary System (EMS) in 1979.
The dollar devaluation was insufficient to restore stability to the
system. U.S. inflation had become a serious problem. By 1973 the dollar was
under heavy selling pressure even at its devalued or depreciated rates, and in
February 1973, the price of gold was raised 11 percent, from $38 to $42.22 per
ounce. By the next month most major currencies were floating. This was the
unsteady sate of the international financial system as it approached the oil crisis
of the fall of 1973.
AcroPDF - A Quality PDF Writer and PDF Converter to create PDF files. To remove the line, buy a license.

MBA- H4030 International Business Finance
14
EXCHANGE RATE REGIME 1973-85
In the wake of the collapse of the Bretton Woods exchange rate system,
the IMF appointed the Committee of Twenty that suggested for various options
for exchange rate arrangement. Those suggestions were approved at Jamaica
during February 1976 and were formally incorporated into the text of the Second
Amendment to the Articles of Agreement that came into force from April 1978.
The options were broadly:
1. Floating-independence and managed
2. Pegging of currency
3. Crawling peg
4. Target-zone arrangement
Floating Rate System: In a floating-rate system, it is the market forces that
determine the exchange rate between two currencies. The advocates of the
floating-rate system put forth two major arguments. One is that the exchange
rate varies automatically according to the changes in the macro-economic
variables. As a result, there does not appear any gap between the real exchange
rate and the nominal exchange rate. The country does not need any adjustment
that is often required in a fixed-rate regime and so it does not have to bear the
cost of adjustment (Friedman, 1953). The other is that this system possesses
insulation properties meaning that the currency remains isolated of the shocks
emanating from other countries. It also means that the government can adopt an
independent economic policy without impinging upon the external sector
performance (Friedman, 1953).
However, the empirical studies do not necessarily confirm these views.
MacDonald (1988) finds that the exchange rates among the countries on floating
AcroPDF - A Quality PDF Writer and PDF Converter to create PDF files. To remove the line, buy a license.

MBA- H4030 International Business Finance
15
rate system during 1973-85 were much more volatile than warranted by changes
in fundamental monetary variables. Dunn (1983) finds absence of insulation
properties. During early 1980s, when the USA was practicing tight monetary
policy through raising interest rates, the European countries raised interest rates
so as to prevent large outflow of capital to the USA. Again, since the nominal
exchange rate tendered to adjust more rapidly than the market price of goods,
nominal exchange rate turbulence was closely related to real exchange rate
turbulence (Frenkel and Mussa, 1980). Cushman (1983) feels that uncertainty in
real exchange rate did affect trade among several industrialized countries. Dunn
(1983) gives an example of Canadian firms borrowing long-term funds from the
USA that faced heavy losses due to 14 percent real depreciation of Canadian
dollar during 1976-79. He also finds that large appreciation in the real value of
pound in late 1970s had led to insolvency of many UK firms as their products
turned uncompetitive in world market.
Besides, developing countries in particular do not find floating rates
suitable for them. Since their economy is not diversified and since their export is
subject to frequent changes in demand and supply, they face frequent changes in
exchange rates. This is more especially when foreign demand for the products is
price-inelastic. When the value of their currency depreciates, export earnings
usually sag in view of inelastic demand abroad. Again, greater flexibility in
exchange rates between a developed and a developing country generates greater
exchange risk in the latter. It is because of low economic profile of the
developing countries and also because they have limited access to forward
market and to other risk-reducing mechanisms.
Floating rate system may be independent or managed. Theoretically
speaking, the system of managed floating involves intervention by the monetary
AcroPDF - A Quality PDF Writer and PDF Converter to create PDF files. To remove the line, buy a license.

MBA- H4030 International Business Finance
16
authorities of the country for the purpose of exchange rate stabilization. The
process of intervention interferes with market forces and so it is known as
“dirty” floating as against independent floating which is known as “clean”
floating. However, in practice, intervention is global phenomenon. Keeping this
fact in mind, the IMF is of the view that while the purpose of intervention in
case of independent floating system is to moderate the rate of change, and to
prevent undue fluctuation, in exchange rate; the purpose in managed floating
system is to establish a level for the exchange rate.
Intervention is direct as well indirect. When the monetary authorities
stabilize exchange rate through changing interest rates, it is indirect intervention.
On the other hand, in case of direct intervention, the monetary authorities
purchase and sell foreign currency in the domestic market. When they sell
foreign currency, its supply increases. The domestic currency appreciates
against the foreign currency. When they purchase foreign currency, its demand
increases. The domestic currency tends to depreciate vis-à-vis the foreign
currency. The IMF permits such intervention. If intervention is adopted for
preventing long-term changes in exchange rate away from equilibrium, it is
known as “learning-against-the-wind” intervention. Intervention helps move up
or move down the value of domestic currency also through the expectations
channel. When the monetary authorities begin supporting the foreign currency,
speculators begin buying it forward in the expectation that it will appreciate. Its
demand rises and in turn its value appreciates vis-à-vis domestic currency.
Intervention may be stabilizing or destabilizing. Stabilizing
intervention helps move the exchange rate towards equilibrium despite
intervention. The former causes gains of foreign exchange, while the latter
causes loss of foreign exchange. Suppose rupee depreciates from 33 a dollar to
AcroPDF - A Quality PDF Writer and PDF Converter to create PDF files. To remove the line, buy a license.
MBA- H4030 International Business Finance
17
36 a dollar. The Reserve Bank sell US $ 1000 and rupee improves to 33. The
RBI will be able to replenish the lost reserves through buying dollar at Rs.33/US
$. The gain will be US $ (36000/33-1000) or US $ 91. But after intervention, if
rupee falls to 40 a dollar, the loss will be US $ (36000/40-1000) or US $ 100.
The monetary authorities do not normally go for destabilizing intervention, but it
is very difficult to know in advance whether intervention would be really
destabilizing. The empirical studies show both the stabilizing and destabilizing
intervention. Longworth’s study (1980 finds stabilizing intervention in case of
Canadian dollar, while Taylor (1982) finds destabilizing intervention in case of
some European countries and Japan during 1970s.
Again, intervention may be sterilized or non-sterilized. When the
monetary authorities purchase foreign currency through created money, the
money supply in the country increases. It leads to inflation. This is example of
non-sterilized intervention, but if simultaneously, securities are sold in the
market to mop up the excess supply of money, intervention does not lead to
inflation. It takes the form of sterilized intervention. The study of Obstfeld
(1983) reveals that non-sterilized intervention is common, for sterilized
intervention is not very effective in view of the fact that it does not change very
evidently the ratio between the supply of domestic currency and that of the
foreign currency. However, on the whole, Loopesko (1984) confirms the effect
of the intervention on the exchange rate stabilization. Last but least, there has
also been a case of co-ordinated intervention. As per the Plaza Agreement of
1985, G-5 nations had intervened in the foreign exchange market in order to
bring US dollar in consistence with the prevailing economic indicators.
AcroPDF - A Quality PDF Writer and PDF Converter to create PDF files. To remove the line, buy a license.
MBA- H4030 International Business Finance
18
Pegging of Currency:
Normally, a developing country pegs its currency to a strong currency or
to a currency with which it has a very large part of its trade. Pegging involves
fixed exchange rate with the result that the trade payments are stable. But in case
of trading with other countries, stability cannot be guaranteed. This is why
pegging to a singly currency is not advised if the country’s trade is diversified.
In such cases, pegging to a basket of currency is advised. But if the basket is
very large, multi-currency intervention may prove costly. Pegging to SDR is not
different insofar as the value of SDR itself is pegged to a basket of five
currencies. Ugo Sacchetti (1979) observes that many countries did not relish
pegging to SDR in view of its declining value. Sometimes pegging is a
legislative commitment which is often known as the currency board
arrangement. Again, it is a fact that the exchange rate is fixed in case of pegging,
yet it fluctuates within a narrow margin of at most + 1.0 percent around the
central rate. On the contrary, in some countries, the fluctuation band is wider
and this arrangement is known as “pegged exchange rates within horizontal
bands”.
Crawling Peg:
Again, a few countries have a system of crawling peg. Under this system,
they allow the peg to change gradually over time to catch up with the changes in
the market-determined rates. It is a hybrid of fixed-rate and flexible-rate
systems. So this system avoids too much of instability and too much of rigidity.
Elwards (1983) confirms this advantage in case of a sample of some developing
countries. In some of the countries opting for the crawling peg, crawling bands
are maintained within which the value of currency is maintained.
AcroPDF - A Quality PDF Writer and PDF Converter to create PDF files. To remove the line, buy a license.
MBA- H4030 International Business Finance
19
Target-zone Arrangement:
In a target-zone arrangement, the intra-zone exchange rates are fixed. An
opposite example of such an arrangement is the European Monetary Union
(EMU) which was earlier known as the European Monetary System (EMS).
There are cases where the member countries of a currency union do not have
their own currency, rather they have a common currency. Under this group,
come the member countries of Eastern Caribbean Currency Union, Western
African Economic and Monetary Union and Central African Economic and
Monetary Community. The member countries of European Monetary Union too
will come under this group if Euro substitutes their currency by the year, 2002.
Global Scenario of Exchange Rate Arrangements:
The firms engaged in international business must have an idea about the
exchange rate arrangement prevailing in different countries as this will facilitate
their financial decisions. In this context, it can be said that over a couple of
decades, the choice of the member countries has been found shifting from one
from of exchange rate arrangement to the other, but, on the whole, the
preference for the floating-rate regime is quite evident. At present, as many as
50 of a total of 185 countries are having independent float, while other 27
countries are having managed floating system. The other 11 countries have
crawling peg, while 53 countries have the system of peg of different kinds. The
EMU countries have target-zone arrangement where they will have a common
currency, Euro by 2002. The other 20 countries of Africa and Caribbean region
come under some kind of economic and monetary integration scheme in which
they have a common currency. Lastly, seven countries do not have their own
AcroPDF - A Quality PDF Writer and PDF Converter to create PDF files. To remove the line, buy a license.
MBA- H4030 International Business Finance
20
currency as a legal tender. We may refer to an IMF publication (IMF, 2001) that
provides a broad list of such arrangements among 185 countries.
1985 TO DATE: THE ERA OF THE MANAGED FLOAT
By March 1985 the dollar had hit its peak. The US current account
deficit was at the unheard of level of over USD 100 billion a year. Most
economists agreed that the dollar was far above its long-term PPP equilibrium
level. The arguments of why this was so ranged from the Dornbusch sticky
hypothesis to fiscal irresponsibility to the reassuring argument that the high
exchange rate was a sign of confidence in the US economy. Whatever the
reason, it was decided that the dollar had to come down in order to defuse
protectionist sentiment in the US Congress that was that was mounting with the
mounting trade deficit.
Intervention in the foreign exchange markets was the method to be used
to achieve this goal. In September 1985 the Group of Five- the United States,
France, Japan, Great Britain and West Germany- came up with the Plaza
Agreement, named after the Hotel in New York where they met. This was
essentially a coordinated program to force down the value of the dollar against
the other major currencies. The policy worked like a charm. In fact, it worked
too well. The dollar fell like a stone, losing close to 11 percent of its SDR value
in 1985. The Group of Five reversed field and began to support the dollar in
1986, to no avail. The dollar lost another 10 percent in 1986. The Group of Five
plus Canada and Italy, now called the Group of Seven (G-7) countries to slow
the dollar’s fall by coordinating their economic policies and supporting the
dollar on the exchange markets within some undisclosed target range.
AcroPDF - A Quality PDF Writer and PDF Converter to create PDF files. To remove the line, buy a license.

MBA- H4030 International Business Finance
21
This seemed to work for a while. The United States promised to cut the
budget deficit and reduce the rate of growth of the money supply while Japan
and Germany promised to stimulate their economies. Although the US did
manage to reduce the rate of growth of the money supply, the budget cuts were
not forthcoming, and neither did Germany and Japan come through with their
promised stimulatory measures. When worldwide stock markets crashed in
October 1987 all pretense of policy coordination collapsed. The flooded the
markets with dollars and the dollar fell nearly 10 percent against the SDR in the
last quarter of 1987.
CURRENT INTERNATIONAL FINANCIAL SYSTEM
Where is the international financial system today? The answer to this
question revolves around three facts: (a) the dollar is still the principal currency
used in international transactions but its unchallenged dominance as an
economic and financial force: and (c) Bretton Woods is dead but its child, the
IMF, has evolved with the times and is more important than ever as watchdog
and arbiter of balance of payments disequilibruim.
INTERNATIONAL MONETARY FUND (IMF)
One of the most important players in the current international financial
system, the IMF was created to administer a code of fair exchange practices and
provide compensatory financial assistance to member countries with balance of
payments difficulties. The role of the IMF was clearly spelled out in its articles
of agreement:
AcroPDF - A Quality PDF Writer and PDF Converter to create PDF files. To remove the line, buy a license.

MBA- H4030 International Business Finance
22
1. To provide international monetary cooperation through a permanent
institution that provides the machinery for consultation and collaboration
on international monetary problems.
2. To facilitate the expansion and balanced growth of international trade,
and to contribute thereby to the promotion and maintenance of high
levels of employment and real income and to the development of the
productive resources of all members as primary objectives of economic
policy.
3. To promote exchange stability, to maintain orderly exchange
arrangements among members, and to avoid competitive exchange
depreciation.
4. To assist in the establishment of a multilateral system of payments in
respect of current transactions between members and in the elimination
of foreign exchange restrictions that hamper the growth of world trade.
5. To give confidence to members by making the Fund’s resources
available to them under adequate safeguards, thus providing them with
the opportunity to correct maladjustments in the balances of payments
without resorting to measures destructive of national or international
balances of payments of members.
When a member entered the IMF, it was obliged to submit a par value of
its currency in gold or in US dollars. Once that value was established it could
only vary by 1 percent either way and any changes required the permission of
the IMF. All transactions with other members were then exercised at that rate.
The resources of the IMF came from the subscriptions for member
countries. Subscriptions were determined on the basis of the member’s relative
economic size, 25 percent of the quota was to be paid in gold and the rest in the
AcroPDF - A Quality PDF Writer and PDF Converter to create PDF files. To remove the line, buy a license.

MBA- H4030 International Business Finance
23
member’s domestic currency. The size of the quota was important because it
determined the member’s voting power and the amount it could borrow. In
practice, members could borrow up to the first 25 percent of their quota, which
was called the “gold tranche” beyond the gold tranche, the IMF imposed
conditions.
Although the goals and ground rules for membership are still the same,
the IMF has changed considerably since its creation. Its capital has been
increased several times. The gold tranche has become the “first credit tranche”
and other “upper credit tranches” have been added. In 1969 it created the first
SDRs. The IMF has evolved with the perceived problems of the times. In 1963 it
introduced the Compensating Financing Facility to help countries with
temporarily inadequate foreign exchange reserves resulting from events such as
crop failure. In 1974 it set up the Oil Facility to help oil importing developing
countries. It also set up the Extended Fund Facility for countries with structural
difficulties, created the Trust Fund of 1976 to allow the sale of gold for the
development of third world countries and in the 1980s it negotiated special
standby facilities for countries with foreign debt problems.
THE IMF’s EXCHANGE RATE REGIME CLASSIFICATIONS
The International Monetary Fund classifies all exchange rate regimes
into eight specific categories (listed here with the number of participating
countries as of October 2001). The eight categories span the spectrum of
exchange rate regimes from rigidly fixed to independently floating:
1. Exchange Agreements with No Separate Legal Tender (39): The
currency of another country circulates as the sole legal tender or the
AcroPDF - A Quality PDF Writer and PDF Converter to create PDF files. To remove the line, buy a license.

MBA- H4030 International Business Finance
24
member belongs to a monetary or currency union which the same legal
tender is shared by the members of the union.
2. Currency Board Arrangement (08):A monetary regime based on an
implicit legislative commitment to exchange domestic currency for a
specified foreign currency at a fixed exchange rate, combined with
restrictions on the issuing authority to ensure the fulfillment of its legal
obligations.
3. Other Conventional Fixed Peg Arrangement (44): The country pegs
its currency (for mall or de facto) at a fixed rate to a major currency or a
basket of currencies (a composite), where the exchange rate fluctuates
within a narrow margin or at most + 1 percent around a central rate.
4. Pegged Exchange Rates within Horizontal Bonds (6): The value of the
currency is maintained within margins of fluctuation around a formal or
de facto fixed peg that are wider than + 1 percent around a central rate.
5. Crawling Pegs (4): The currency is adjusted periodically in small
amounts at a fixed, pre-announced rate or in response to changes in
selective quantitative indicators.
6. Exchange Rates within Crawling Pegs (5): The currency is maintained
within certain fluctuation margins around a central rate that is adjusted
periodically at a fixed pre-announced rate or in response to change in
selective quantitative indicators.
7. Managed Floating with No Pre-Announced Path for the Exchange
Rate (33): The monetary authority influences the movements of the
exchange rate through active intervention in the foreign exchange market
AcroPDF - A Quality PDF Writer and PDF Converter to create PDF files. To remove the line, buy a license.

MBA- H4030 International Business Finance
25
without specifying or pre-committing to a pre-announced path for the
exchange rate.
8. Independent Floating (47): The exchange rate is market-determined,
with any foreign exchange intervention aimed at moderating the rate of
change and preventing undue fluctuations in the exchange rate, rather
than at establishing a level for it.
FIXED Vs FLEXIBLE EXCHANGE RATES
A nation’s choice as to which currency regime to follow reflects national
priorities about all factors of the economy, including inflation, unemployment,
interest rate levels, trade balances, and economic growth. The choice between
fixed and flexible rates may change over time as priorities change.
At the risk of over-generalizing, the following points partly explain why
countries pursue certain exchange rate regimes. They are based on the premise
that, other things being equal, countries would prefer fixed exchanges rates.
• Fixed rates provide stability in international prices for the conduct of
trade. Stable prices aid in the growth of international trade lessens risks
for all businesses.
• Fixed exchange rates are inherently anti-inflationary, requiring the
country to follow restrictive monetary and fiscal policies. This
restrictiveness, however, can often be a burden to a country wishing to
pursue policies that alleviate continuing internal economic problems,
such as high unemployment or slow economic growth.
• Fixed exchange rate regimes necessitate that central banks maintain large
quantities of international reserves (hard currencies and gold) for use in
the occasional defense of the fixed rate. An international currency
AcroPDF - A Quality PDF Writer and PDF Converter to create PDF files. To remove the line, buy a license.

MBA- H4030 International Business Finance
26
markets have grown rapidly in size and volume, increasing reserve
holdings has become a significant burden to many nations.
• Fixed rates, once in place, can be maintained at rates that are inconsistent
with economic fundamentals. As the structure of a nation’s economy
changes and its trade relationships and balances evolve, the exchange
rate itself should change. Flexible exchange rates allow this to happen
gradually and efficiently, but fixed rates must be changed
administratively- usually too late, too highly publicized, and too large a
one-time cost to the nation’s economic health.
DETERMINATION OF EXCHANGE RATE
The most common type of foreign transaction involves the payment and
receipt of the foreign exchange within two business days after the day the
transaction is agreed upon. The two-day period gives adequate time for the
parties to send instructions to debit and credit the appropriate bank accounts at
home and abroad and complete requirements under the forex regulations. This
type of transactions is called a spot transaction, and the exchange rate at which
the transaction takes place is called the spot rate. Besides spot transaction, there
are forward transactions. A forward transaction involves an agreement today to
buy or sell a specified amount of a foreign currency at a specified future date at
a rate agreed upon today (the forward rate). The typical forward contact is for
one month; three months; or six months, with three months being most common.
Forward contracts for longer periods are not as common because of the great
uncertainties involved. However, forward contract can be renegotiated for one or
more periods when they become due.
AcroPDF - A Quality PDF Writer and PDF Converter to create PDF files. To remove the line, buy a license.

MBA- H4030 International Business Finance
27
The equilibrium forward rate is determined at the intersection of the
market demand and supply forces of foreign exchange for future delivery. The
demand for the supply of forward foreign exchange arises in the course of
hedging, from foreign exchange speculation, and from covered interest
arbitrage.
SPOT MARKET
Features: In the spot market, currencies are traded for immediate delivery at a
rate existing on the day of transaction. For making book-keeping entries,
delivery takes two working days after the transaction is complete. If a particular
market is closed on Saturday and Sunday and if transaction takes place on
Thursday, delivery of currency shall take place on Monday. Monday in this case
is known as the value date or settlement date. Sometimes there are short-date
contracts where the time zones permit the delivery of the currency even earlier.
If the currency is delivered the same day, it is known as the value-same-day
contract. If it is done the next day, the contract is known as the value-next-day
contract.
In view of the huge amounts involved in the transactions, there is seldom
any actual movement of currencies. Rather, debit and credit entries are made in
the bank accounts of the seller and the purchaser. Most of the markets do the
transfer of funds electronically thus saving time and energy. The system existing
in New York is known as the Clearing House Inter-Bank Payment System
(CHIPS).
Currency Arbitrage in Spot Market With fast development in the
telecommunication system, rates are expected to be uniform in different foreign
exchange markets. Nevertheless, inconsistency exists at times. The arbitrageurs
AcroPDF - A Quality PDF Writer and PDF Converter to create PDF files. To remove the line, buy a license.

MBA- H4030 International Business Finance
28
take advantage of the inconsistency and garner profits by buying and selling of
currencies. They buy a particular currency at cheaper rate in one market and sell
it at a higher rate in the other. This process is known as currency arbitrage. The
process influences the demand for, and supply of, the particular currency in the
two markets which leads ultimately to removal of inconsistency in the value of
currencies in two markets.
Suppose, in New York: $ 1.9800 – 10/£; and
In London: $ 1.9710 – 10/£.
The arbitrageurs will buy the dollar in New York and sell it in London
making a profit of $ 1.9800 – 1.9710 = $ 0.009 pound sterling.
Speculation in the Spot Market: Speculation in the spot market occurs
when the speculator anticipates a change in the value of a currency, especially
an appreciation in the value of foreign currency. Suppose the exchange rate
today is Rs.49/US $, the speculator anticipates this rate to become Rs.50/US$
within the coming three months. Under these circumstances, he will buy US $
1,000 for Rs.49,000 and hold the amount for three months, although he is not
committed to this particular time horizon. When the target exchange rate is
reached, he will sell US $ 1,000 at the new exchange rate that is at Rs.50 per
dollar and earn a profit of Rs.50,000 – 49,000 = Rs.1,000.
FORWARD MARKET
The 1- or 2-day delivery period for spot transactions is so short that
when comparing spot rates with forward exchange rates we can usefully think of
spot rates as exchange rates for undelayed transactions. On the other hand,
AcroPDF - A Quality PDF Writer and PDF Converter to create PDF files. To remove the line, buy a license.

MBA- H4030 International Business Finance
29
forward exchange rates involve an arrangement to delay the exchange of
currencies until some future date. A useful working definition is:
The forward exchange rate is contracted today for the exchange of
currencies at a specified date in the future. Forward rates are generally
expressed by indicating premium/discount on the spot rate for the forward
period. Premium on one country’s currency implies discount on another
country’s currency. For instance if a currency (say the US dollar) is at a
premium vis-à-vis another currency (say the Indian rupee), it obviously implies
that the Indian rupee is at a discount vis-à-vis the US dollar.
The forward market is not located at any specified place. Operations take
place mostly by telephone/telex, etc., through brokers. Generally, participants in
the market are banks, which want to cover orders for their clients. Though a
trader may quote the forward rate for any future date, the normal practice is to
quote them for 30 days (1 month), 60 days (2 months), 90 days (3 months) and
180 days (6 months).
Quotations for forward rates can be made in two ways. They can be
made in terms of the exact amount of local currency at which the trader quoting
the rates will buy and sell a unit of foreign currency. This is called ‘outright rate’
and traders in quoting to customers use it. The forward rates can also be quoted
in terms of points of premium or discount on the spot rate, which used in inter-
bank quotations. To find the outright forward rates when premium or discount
on quotes of forward rates are given in terms of points, the points are add to the
spot price. If the foreign currency is trading at a forward premium; the points are
subtracted from spot price if the foreign currency is trading at a forward
discount.
AcroPDF - A Quality PDF Writer and PDF Converter to create PDF files. To remove the line, buy a license.

MBA- H4030 International Business Finance
30
The traders know well whether the quotes in points represent a premium
or a discount on the spot rate. This can be determined in a mechanical fashion. If
the first forward quote (the bid or buying figure) is smaller than the second
forward quote (the offer or the asking or selling figure), then there is a premium.
In such a situation, points are added to the spot rate. Conversely, if the first
quote is greater than the second then it is a discount. If, however, both the
figures are the same, then the trader has to specify whether the forward rate is at
premium or discount. This procedure ensures that the buy price is lower than the
sell price, and trader profits from the spread between the prices.
Example 6.1
Spot 1-month 3-months 6-months
(FFr/US$) 5.2321/2340 25/20 40/32 20/26
In outright terms, these quotes would be expressed as below:
Maturity Bid/Buy Sell/Offer/Ask Spread
Spot FFr 5.2321 Per US$ FFr 5.2340 Per US$ 0.0019
1-month FFr 5.2296 Per US$ FFr 5.2320 Per US$ 0.0024
2-month FFr 5.2281 Per US$ FFr 5.2308 Per US$ 0.0027
3-month FFr 5.2341 Per US$ FFr 5.2366 Per US$ 0.0025
It may noted that in the case of forward deals of 1 month and 3 months,
US dollar is at discount against French Franc (FF) while 6 months forward is at
premium. The first figure is greater than second both 1 month and 3 months
forward quotes. Therefore, these quotes are at discount and accordingly these
points have been subtracted from the spot rates to arrive at outright rates. The
reverse is the case for 6 moths forward.
AcroPDF - A Quality PDF Writer and PDF Converter to create PDF files. To remove the line, buy a license.

MBA- H4030 International Business Finance
31
Example
Let us take an example of a quotation for the US dollar against rupees, given by
a trader in New Delhi.
Spot 1-month 3-months 6-months
Rs.32.1010-Rs.32.1100 225/275 300/350 375/455
Spread 0.0090 0.0050 0.0050 0.0080
The outright rates form this quotation will be as below:
Maturity Bid/Buy Sell/Offer/Ask Spread
Spot Rs.32.1010 per US$ Rs.32.1100 per US$ 0.0090
1-month Rs.32.1235 per US$ Rs.32.1375 per US$ 0.0140
2-month Rs.32.1310 per US$ Rs.32.1450 per US$ 0.0140
3-month Rs.32.1385 per US$ Rs.32.1555 per US$ 0.0170
Here, we notice that the US dollar is at premium for all the three forward
periods. Also, it should be noted that the spreads in forward rates are always
equal to the sum of the spread of the spot rate and that of the corresponding
forward points. For Example, the spread of 1month forward is 0.0140
(=0.0090+0.0050), and, so on.
Major Currencies Quoted in the Forward Market
The major currencies quoted on the forward market are given below. They are
generally in terms of the US dollar.
• Deutschmark
• Swiss franc
• Pound sterling
• Belgian franc
AcroPDF - A Quality PDF Writer and PDF Converter to create PDF files. To remove the line, buy a license.

MBA- H4030 International Business Finance
32
• Dutch guilder
• Japanese yen
• Peseta
• Canadian dollar
• Australian dollar
Generally, currencies are quoted in terms of 1 month, 3 months and one
year forward. But enterprises may obtain from banks quotations for different
periods. Premium or Discount. Premium or discount of a currency in the
forward market on the spot rate (SR) is calculated as following:
Premium or discount (per cent) = [(Fwd rate – Spot rate)/Spot rate] x (12/n) x
100*
When n is the number of months forward.
If, FR > SR, it implies premium.
<SR, it signals discount.
Arbitrage in case of Forward Market (or Covered Interest Arbitrage)
In the case of forward market, the arbitrage operates on the differential
of interest rates and the premium or discount on exchange rates. The rule is that
if the interest rate differential is greater than the premium or discount, place the
money in the currency that has higher rate of interest or vice-versa. Consider the
following examples:
Example :
Exchange rate: Can $ 1.317 per US $ (spot)
Can $ 1.2950 per US $ (6 months forward)
AcroPDF - A Quality PDF Writer and PDF Converter to create PDF files. To remove the line, buy a license.

MBA- H4030 International Business Finance
33
6-months interest rate:
US $ 10 percent
Can $ 6 percent
Work out the possibilities of arbitrage gain.
Solution:
In this case, it is clear that US $ is at discount on 6-months forward
market. The rate of annualized discount is:
[(1.2950 – 1.317)/1.317] x (12/6) x 100 = 3.34 percent.
Differential in the interest rate = 10-6 =4 percent.
Here, the interest rate differential is greater than the discount. So in order to
derive to an arbitrage gain, money is to be placed in US$ money market since
this currency has a higher rate of interest. The following steps are involved:
a) Borrow Can$ 1000 at 6 percent p.a. for 6 months.
b) Transform this sum into US$ at the spot rate to obtain US$ 759.3
(=1000/1.317):
c) Place these US dollars at 10 percent p.a. for 6-months in the money
market to obtain US$ 797.23 = [=759.3 x (1+0.1 x 6/12)]
d) Sell US$ 797.23 in the forward market to yield, at the end of 6-months,
Canadian $ 1032.4 (=797.23 x 1.295);
e) At the end of 6-months, refund the debt taken in Canadian dollars plus
interest, i.e. Canadian $ 1030 [= 1000 x (1 + 0.06 x 6/12)]
Net gain = Canadian $ 1032.4 – Canadian $ 1030 = Canadian $2.4.
Thus, starting from zero one is richer by Canadian $ 2.4 at the end of 6
months period. Accordingly, on borrowings of Canadian $1 million, one will be
richer by (100,00,000 x $2.4/1000), i.e., Canadian $ 2400.
AcroPDF - A Quality PDF Writer and PDF Converter to create PDF files. To remove the line, buy a license.

MBA- H4030 International Business Finance
34
Example :
Exchange rates: Can $ 0.665 per DM (Spot)
Can$0.670 per DM (3 months)
Interest rates: DM 7 percent p.a.
Can$ 9 percent p.a.
Calculate the arbitrage possible from the above data.
Solution:
In this case, DM is at a premium against the Can$.
Premium = [(0.67 – 0.665/0.665] x (12/3) x 100 = 3.01 percent
Interest rate differential = 9 – 7 = 2 percent.
Since the interest rate differential is smaller than the premium, it will be
profitable to place money in Deutsch-marks the currency whose 3-months
interest is lower. The following operations are carried out:
a) Borrow Can$ 1000 at 9 percent for 3-months;
b) Change this sum into DM at the spot rate to obtain DM 1503.7
(=1000/0.665);
c) Place DM 1503.7 in the money market for 3 months to obtain a sum of
DM 1530 [=1503.7 x (1+0.07 x 3/12)];
d) Sell DM at 3-months forward to obtain Can$ 1025.1 (=1530 x 0.67);
e) Refund the debt taken in Can$ with the interest due on it, i.e., Can$
1022.5 [ =1000 x (1+0.09 x 3/12)];
Net gain = 1025.1 – 1022.5 = Can$ 2.6
SPECULATION IN THE FORWARD MARKETLet us say that the US dollar is quoted as follows:
Spot: FFr 5.6 per US$
6-months forward: FFr 5.65 per US$
AcroPDF - A Quality PDF Writer and PDF Converter to create PDF files. To remove the line, buy a license.

MBA- H4030 International Business Finance
35
If a speculator anticipates that the US dollar is going to be FFr 5.7 in 6-
months, he will take a long position in that currency. He will buy US dollars at
FFr 5.65, 6 months forward. If his anticipation turns out to be true, he will sell
his US dollars at FFr 5.7 per unit and his profit will be FFr 0.05 per US$ (=FFr
5.7 – FFr 5.65).
Now, suppose that the speculator anticipates a decrease in the value of
the US dollar in next 6-months. He thinks that it will be available for FFr 5.5 per
US$. Then he will take a short position in dollars by selling them at 6-months
forward. If his anticipation comes true, he will make a profit of FFr 0.15 per
US$. On the other hand, if the dollar rate in 6-months actually climbs to FFr
5.75 per US$, he will end up incurring a loss of FFr 0.1 per US$ (=FFr 5.65 –
FFr 5.75).
THE WORLD BANK
The International Bank for Reconstruction and Development (IBRD), better
known as the World Bank, was established at the same time as the International
Monetary Fund (IMF) to tackle the problem of international investment. Since
the IMF was designed to provide temporary assistance in correcting the balance
of payments difficulties, an institution was also needed to assist long-term
investment purposes. Thus, IBRD was established for promoting long-term
investment loans on reasonable terms.
The World Bank (IBRD) is an inter-governmental institution,
corporate in form, whose capital stock is entirely owned by its member-
governments. Initially, only nations that were members of the IMF could be
members of the World Bank; this restriction on membership was subsequently
relaxed.
AcroPDF - A Quality PDF Writer and PDF Converter to create PDF files. To remove the line, buy a license.

MBA- H4030 International Business Finance
36
FUNCTIONS:
The principal functions of the IBRD are set forth in Article 1 of the
agreement as follows:
1. To assist in the reconstruction and development of the territories of its
members by facilitating the investment of capital for productive
purposes.
2. To promote private foreign investment by means of guarantee of
participation in loans and other investments made by private investors
and when private capital is not available on reasonable terms, to make
loans for productive purposes out of its own resources or from funds
borrowed by it.
3. To promote the long-term balanced growth of international trade and the
maintenance of equilibrium in balances of payments by encouraging
international investment for the development of the productive resources
of members.
4. To arrange loans made or guaranteed by it in relation to international
loans through other channels so that more useful and urgent projects,
large and small alike, will be dealt with first. It appears that the World
Bank was created to promote and not to replace private foreign
investment. The Bank considers its role to be a marginal one, to
supplement and assist foreign investment in the member countries.
A little consideration will show that the objectives of the IMF and
IBRD are complementary. Both aim at increasing the level of national income
and standard of living of the member nations. Both serve as lending institutions,
the IMF for short-term and the IBRD for long-term capital. Both aim at
promoting the balanced growth of international trade.
AcroPDF - A Quality PDF Writer and PDF Converter to create PDF files. To remove the line, buy a license.
MBA- H4030 International Business Finance
37
ORGANIZATION:
Like the Fund’s the Bank’s structure is organized on a three-tier basis; a
Board of Governors, Executive Directors and a president. The Board of
Governors is the supreme governing authority. If consists of one governor
(usually the Finance Minister) and one alternate governor (usually the governor
of a central bank), appointed for five years by each member. The Board is
required to meet once every year. It reserves to itself the power to decide
important matters such as new admissions, changes in the bank’s stock of
capital, ways and means of distributing the net income, its ultimate liquidation,
etc. For all technical purposes, however, the Board delegates its powers to the
Executive Directors in the day-to-day administration.
At present, the Executive Directors are 19 in number, of which five are
nominated by the five largest shareholders- the U.S.A., the U.K., Germany,
France and India. The rest are elected by the other member. The Executive
Directors elect the President who become their ex-officio Chairman holding
office during their pleasure. He is the chief of the operating staff of the Bank and
subject to the direction of the Executive Directors on questions of policy and is
responsible for the conduct of the ordinary business of the Bank and its
organization.
EUROPEAN MONETARY SYSTEM
The Birth of a European Currency: The Euro
The 15 members of the European Union are also members of the
European Monetary System (EMS). This group has tried to form an island of
fixed exchange rates among themselves in a sea of major floating currencies.
AcroPDF - A Quality PDF Writer and PDF Converter to create PDF files. To remove the line, buy a license.

MBA- H4030 International Business Finance
38
Members of the EMS rely heavily on trade with each other, so they perceive that
the day-to-day benefits of fixed exchange rates between them are great.
Nevertheless the EMS has undergone a number of major changes since its
inception in 1979, including major crises and reorganizations in 1992 and 1993
and conversion of 11 members to the euro on January 1, 1999 (Greece joined in
2001). In December 1991, the members of the European Union met a
Maastricht, the Netherlands, and finalized a treaty that changed Europe’s
currency future.
Timetable. The Maastricht treaty specified a timetable and a plan to replace all
individual ECU currencies with a single currency, call euro. Other steps were
adopted that would lead to a full European Economic and Monetary Union
(EMU).
Convergence criteria. To prepare for the EMU, the Maastricht Treaty called for
the integration and coordination of the member countries’ monetary and fiscal
policies. The EMU would be implemented by a process called convergence.
Before becoming a full member of the EMU, each member country was
originally expected to meet the following convergence criteria:
1. Nominal inflation should be no more than 1.5 percent above the average
for the three members of the EU with the lowest inflation rates during
the previous year.
2. Long-term interest rates should be no more than 2 percent above the
average for the three members with the lowest inflation rates.
3. The fiscal deficit should be no more than 3 percent of gross domestic
product.
4. Government debt should be no more than 60 percent of gross domestic
product.
AcroPDF - A Quality PDF Writer and PDF Converter to create PDF files. To remove the line, buy a license.
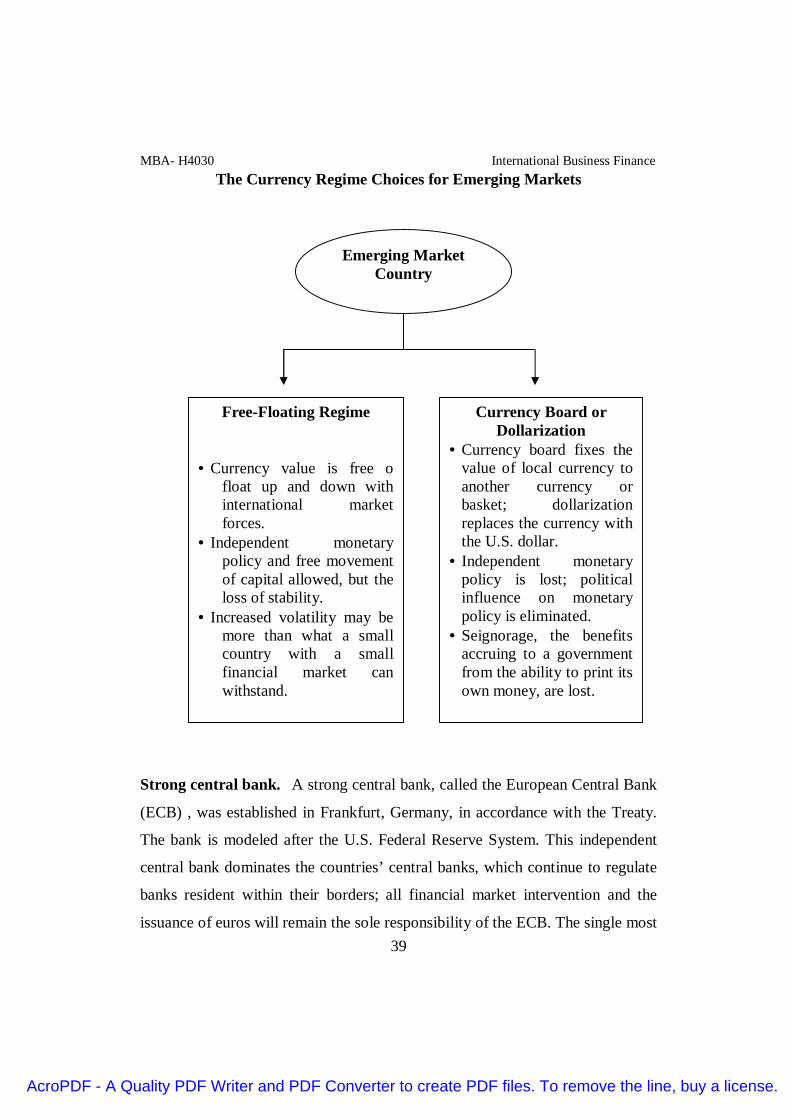
MBA- H4030 International Business Finance
39
The Currency Regime Choices for Emerging Markets
Strong central bank. A strong central bank, called the European Central Bank
(ECB) , was established in Frankfurt, Germany, in accordance with the Treaty.
The bank is modeled after the U.S. Federal Reserve System. This independent
central bank dominates the countries’ central banks, which continue to regulate
banks resident within their borders; all financial market intervention and the
issuance of euros will remain the sole responsibility of the ECB. The single most
Emerging MarketCountry
Free-Floating Regime
•Currency value is free ofloat up and down withinternational marketforces.
• Independent monetarypolicy and free movementof capital allowed, but theloss of stability.
• Increased volatility may bemore than what a smallcountry with a smallfinancial market canwithstand.
Currency Board orDollarization
•Currency board fixes thevalue of local currency toanother currency orbasket; dollarizationreplaces the currency withthe U.S. dollar.
• Independent monetarypolicy is lost; politicalinfluence on monetarypolicy is eliminated.
•Seignorage, the benefitsaccruing to a governmentfrom the ability to print itsown money, are lost.
AcroPDF - A Quality PDF Writer and PDF Converter to create PDF files. To remove the line, buy a license.

MBA- H4030 International Business Finance
40
important mandate of the ECB is to promote price stability within the European
Union.
As part of its development of cross-boarder monetary policy, the ECB
has formed TARGET is the mechanism by which the ECB will settle all cross-
border payments in the conduct of EU banking business and regulation. It will
the ECB to quickly and costlessly conduct monetary policy and other intra-
banking system capital movements.
MONETARY SYSTEM
The Treaty signed at Paris on 18 April 1951 to establish European Coal
and Steel Community (ECSC) was the first step towards the unification of
Europe. The signatories to this treaty were Belgium, France, Italy, Luxembourg,
the Netherlands and then Federal Republic of Germany. The same six countries
later signed the Treaty of Rome on 25 March 1957 to create the European
Economic Community (EEC). The objective of this treaty was to establish (i) a
Custom Union, and (ii) free movement of goods, manpower and capital. In
1972, three other countries, namely, Denmark, Ireland and the UK, also joined,
thus taking the strength of the Community to nine. Later, Greece in 1979, and
Spain and Portugal in 1986 also joined the Community. At the moment, the
European Union has 15 countries as its members after the joining in of Austria,
Finland and Sweden.
In 1978, the European Council decided to establish a European
Monetary System (EMS). With effect from 1 January 1993, the International
European Market has become operational. In 1989, at the Strasbourg Summit, it
was decided to convene an inter-governmental conference, whose role would be
to revise the treaties relating to the European Community in order to include
AcroPDF - A Quality PDF Writer and PDF Converter to create PDF files. To remove the line, buy a license.

MBA- H4030 International Business Finance
41
therein an Economic and Monetary Union (EMU). This Conference has led to
the signing of the Maastricht Treaty on 7 February 1992 that aimed, among
other things, at the creation of institutions permitting establishment of the EMU.
After the Maastricht Treaty, EEC has been renamed as European Union (EU).
Objectives of the European Monetary System
The primary objective of the EMS is to promote and enhance monetary
stability in the European Community. Its other objectives include working
towards the improvement of the general and economic situation f the countries
of the European Union in terms of growth, full employment, standard of living,
reduction of regional disparities, etc. Above all, it also aims at bringing about a
stabilizing effect on international economic and monetary relations.
EMS vis-à-vis Balance of Payments (BOP)
The formation of EMS has the following implications for countries
having surplus balance of payment. First, the countries dealing with member
countries of the European Union may weaken the pace of appreciation of their
currencies. This is likely to happen as the relative stability of exchange rates
inside the EMS is expected to avoid the distortions between various currencies
of the European Union. Second, deceleration in the rate of appreciation of
currencies may step up exports of such countries. Increased exports, obviously,
have salutary effects on the profitability of enterprise on the one hand and higher
growth of their economies on the other. This assertion is based on the fact that
the surplus countries faced negative effect of continuing re-evaluation
(appreciation) of their currencies, vis-à-vis, and the currencies of the member
countries of the European Union (EU). In particular, the effect was more marked
AcroPDF - A Quality PDF Writer and PDF Converter to create PDF files. To remove the line, buy a license.

MBA- H4030 International Business Finance
42
on external trade with the EU as it constituted 40-50 percent of their total
external business.
In the case of the deficit BOP situation, the EMS stipulates that the
country concerned would be required to initiate appropriate economic and
monetary policy measures to overcome their BOP problems. The EMS has the
provision of providing assistance as well as short-term monetary support for the
purpose.
Characteristics of the EMS
The following are the major characteristics of the EMS:
1. There is a single uniform monetary unit of the European Union, namely,
the European Currency Unit (ECU);
2. A stable but adjustable exchange rate has emerged.
European Currency Unit (ECU)
The ECU is the central element of the EMS. It is a basket composed of
different currencies of the European Union, weighted according to the economic
strengths of each one of them.
(a) Relative weightage of each member country currency with respect to the
ECU; the composition of the ECU is shown in the following Table.
(b) Another important premise is that central banks of parties to the EMS are
required to defend the fluctuations in the exchange rates of their currencies.
Initially, this range was + 2.25 percent around central parties. Some member
countries found it extremely difficult to maintain the fluctuations of their
currencies within this range. Therefore, in August 1993, it was raised to 15
percent.
AcroPDF - A Quality PDF Writer and PDF Converter to create PDF files. To remove the line, buy a license.

MBA- H4030 International Business Finance
43
(c) There is a built-in mechanism to help one another in times of need.
Necessary finances for the purpose are to be appropriated from the assets
constituted at the level of each central bank.
Table Composition of the ECU as on 21st September 1989
Currency Quantity Weight(Percent)
Deutschmark
French Franc
Pound Sterling
Dutch Guilder
Belgian Franc
Spanish Peseta
Danish Kroner
Irish Pound
Greek Drachma
Portuguese Escudo
Italian Lira
0.6242
1.332
0.08784
0.2198
3.431
6.885
0.1976
0.008552
1.440
1.393
15.18
32.63
19.89
11.45
10.23
08.28
04.50
02.56
01.06
0.53
0.71
8.16
It is apparent form the above Table that economically strong currencies
have a very high weightage. For instance, the first three currencies
(Deutschmark, French Franc, and Pound) among them account for nearly two-
third of the total weightage. It may be noted that the number of countries
included in the above Table is eleven. However, with effect from 1st January
1996, the number of countries has gone up to fifteen. He constitution of the ECU
should obviously reflect the relative weightage of the economies of all these
countries. But, with the coming into effect of the Maastricht Treaty on 1st
AcroPDF - A Quality PDF Writer and PDF Converter to create PDF files. To remove the line, buy a license.

MBA- H4030 International Business Finance
44
November 1993, the composition of the ECU has been frozen. It will continue at
the frozen level till the adoption of a single currency. This measure is likely to
bring about a greater stability of the ECU.
The ECU is a unit of payment among central banks of the European
Union. It is also used for according financial assistance to member states which
face economic difficulties due to BOP. ‘Private ECU’ has also found a greater
instruments (such as, long-term borrowings and inter-bank commercial paper,
Euro-bonds, Euro-credits, etc.), can be documented in ECU. There exist future
contracts in ECUs too. In the international capital markets, the ECU occupies an
important place. On a commercial plane, some enterprises have adopted it as the
currency of billing; the accounts of some multinationals are made in ECUs.
EUROPEAN BANK OF INVESTMENT (EBI)
The European Bank of Investment was created in 1958 by the Treaty of
Rome with the major objective of balanced development of different regions of
the European Union. The text of the Maastricht has further reinforced its role to
serve the goal of economic and social cohesion. This is the European banking
institution to provide long-term financing. It is an integral part of the EU
structure and has its own organization of decision-making.
The Bard of Governors consisting of one minister of each member state
(generally the Finance Minister) gives general orientation and nominates other
members of the decision-making body. The board of governors decides about
lending, borrowing and interest rates on the proposal of the Managing
Committee. This committee is an executive organ of the EBI.
AcroPDF - A Quality PDF Writer and PDF Converter to create PDF files. To remove the line, buy a license.

MBA- H4030 International Business Finance
45
EUROPEAN MONETARY UNION (EMU)
The Heads of the State and governments of the countries of the EU
decided at Maastricht on 9th and 10th December 1991 to put in place the
European Monetary Union (EMU). Adhering to the EMU means irrecoverable
fixed exchange rates between different currencies of the Union. The setting up
of EMU has been a step towards the introduction of a common currency in the
member states of EU, as per the Maastricht Treaty. It has ratified by all the 12
countries, which constituted the Union at that point of time. The EMU
completes the mechanism that started with the Customs Union of the Treaty of
Rome and the big Common Market of the Single Act.
FOREIGN EXCHANGE MARKETS
The foreign Exchange Market is the market in which currencies are
bought and sold against each other. It is the largest market in the world. In this
market where financial paper with a relatively short maturity is traded.
However, the financial paper traded in the foreign exchange market is not all
denominated in the same currency. In the foreign exchange market, paper
denominated in a given currency is always traded against paper denominated in
another currency. One justification for the existence of this market is that
nations have decided to keep their sovereign right to have and control their own
currencies. Unlike the money market and capital markets, the foreign exchange
market deals not in credit but in means of payment. This brings one to a
fundamental point. While foreign exchange deals frequently take place between
residents of different countries, the money being traded never actually leaves the
country of the currency.
AcroPDF - A Quality PDF Writer and PDF Converter to create PDF files. To remove the line, buy a license.

MBA- H4030 International Business Finance
46
Thus, when a US company exports to a foreign country of India, for
example, foreign exchange is required. The people manufacturing and
performing services in the United States must be paid in local currency, US
dollars. The people consuming the goods and services in India have only their
local currency, Rupees with which to pay. There are now two possibilities for
settling the account between the United States and India. The US exporter bills
the Indian importer either in US dollars or in Rupees.
a) If the US exporter bills in dollars, the Indian importer must sell
Rupees to purchase dollars in the foreign exchange market.
b) If the US exporter bills in Rupees, the exporter must sell rupees to
purchase dollars.
As one can see, whatever the currency for invoicing is, somebody has
to go into the foreign exchange market to sell rupees and purchase dollars. In
contrast to a spot transaction, a forward foreign exchange contract calls for
delivery at a fixed future date of a specified amount of one currency for
specified amount of another currency. By borrowing money in one currency,
buying a second currency spot, placing the funds in a deposit in the foreign
currency and simultaneously selling the foreign currency forward, an arbitrageur
can profit if the domestic interest rate does not equal the foreign interest rate,
adjusted for the forward premium or discount. Dealing business across national
boundaries means dealing with more than one currency and therefore involves
exchange risk. Exchange risk is the additional systematic risk to a firm’s flows
arising from exchange rate changes.
AcroPDF - A Quality PDF Writer and PDF Converter to create PDF files. To remove the line, buy a license.

MBA- H4030 International Business Finance
47
Players in the Foreign Exchange Market
The main participants in the foreign exchange market are commercial
banks. Indeed, one say that it is the commercial banks that “make a market” in
foreign exchange. Next in importance are the large Corporations with foreign
trade activities. Finally, central banks are present in the foreign exchange
market.
(i) Commercial Banks
Commercial banks are normally known as the lending players in the
foreign exchange scene, we are speaking of large commercial banks with many
clients engaging in exports and imports which must be paid in foreign currencies
or of banks which specialize in the financing of trade. Commercial banks
participate in the foreign exchange market as an intermediary for their corporate
customers who wish to operate in the market and also on their own account.
Banks maintain certain inventories of foreign exchange to best service its
customers.
(ii) Non-financial Corporations
The involvement of Corporations in the foreign exchange market
originates from two primary sources. International trade and direct investment.
International trade usually involves the home country of the corporation. In this
regard, the concern of the corporation is not only that foreign currency be paid
or received, but also that the transaction be done at the most advantageous price
of foreign exchange possible. A business also deals with the foreign exchange
market when it engages in foreign direct investment. Foreign direct investments
involve not only the acquisition of assets in a foreign country, but also the
AcroPDF - A Quality PDF Writer and PDF Converter to create PDF files. To remove the line, buy a license.

MBA- H4030 International Business Finance
48
generation of liabilities in a foreign currency. So, for each currency in which a
firm operates, an exposure to foreign exchange risk is likely to be generated.
That is, given that a company will have either a net asset or a net liability
position in the operations in a given currency, any fluctuation that occurs in the
value of that currency will also occur in the value of the company’s foreign
operations.
(iii) Central Banks
Central Banks are not only responsible for the printing of domestic
currency and the management of the money supply, but, in addition, they are
often responsible for maintaining the value of the domestic currency vis-a-vis
the foreign currencies. This is certainly true in the case of fixed exchange rates.
However, even in the systems of floating exchange rates, the central banks have
usually felt compelled to intervene in the foreign exchange market at least to
maintain orderly markets.
Under the system of freely floating exchange rates, the external value of
the currency is determined like the price of any other good in a free market, by
the forces of supply and demand. If, as a result of international transactions
between the residents and the rest of the world, more domestic currency is
offered than is demand, that is, if more foreign currency is demanded than is
offered, then the value of the domestic currency in terms of the foreign
currencies will tend to decrease. In this model, the role of the central bank
should be minimal, unless it has certain preferences i.e. it wishes to protect the
local export industry.
AcroPDF - A Quality PDF Writer and PDF Converter to create PDF files. To remove the line, buy a license.
MBA- H4030 International Business Finance
49
INTERNATIONAL FINANCIAL MARKETS
The financial markets of the world consist of sources of finance, and
uses for finance, in a number of different countries. Each of these is a capital
market on its own. On the other hand, national capital markets are partially
linked and partially segmented. National capital markets are of very different
stages of development and size and depth, they have very different prices and
availability of capital. Hence, the international financier has great opportunities
for arbitrage – finding the cheapest source of funds, and the highest return,
without adding to risk. It is because markets are imperfectly linked, the means
and channels by which foreigners enter domestic capital markets and domestic
sources or users of funds go abroad, are the essence of this aspect of
international financial management.
The other aspect is the fact that domestic claims and liabilities are
denominated in national currencies. These must be exchanged for another for
capital to flow internationally; since relative values depend on supply and
demand, the international financier faces exchange risk. Finally, the past few
decades have seen a new phenomenon; the separation of currency of
denomination of assets and liabilities from country of jurisdiction.
There are three sets of markets – home, foreign and euromarkets – faced
by every investor or borrower, plus the fourth market, the foreign currency
market, which must be crossed as one enters the world of finance. Each country
has more or less imperfect linkages with every other country and with the euro
market, both the segment in its own currency and Euro-market segments in other
currencies. The linkages of each country with its Euromarkets segment are very
important, since domestic and euromarkets instrument are close substitutes and
no foreign exchange market comes between them. The links among segments of
AcroPDF - A Quality PDF Writer and PDF Converter to create PDF files. To remove the line, buy a license.

MBA- H4030 International Business Finance
50
the euromarkets are also very important, since no national controls come
between them - in other words, linkages within the euromarkets are perfect,
being differentiated only by currency of denomination. They are linked through
the spot and forward foreign exchange markets. International finance is thus
concerned with :
(i) Domestic Capital Markets
The international role of a capital market and the regulatory climate
that prevails are closely related. Appropriate regulation can and does make
markets more attractive. However, the dividing line between regulatory
measures that improve markets and those that have just the opposite effect is
very thin.
(ii) Foreign Financial Markets
Major chunk of the savings and investments of a country take place in that
country’s domestic financial markets. However, many financial markets have
extensive links abroad – domestic investors purchase foreign securities and
invest funds in foreign financial institutions. Conversely, domestic banks can
lend to foreign residents and foreign residents can issue securities in the national
market or deposit funds with resident financial intermediaries.
The significant aspect of traditional foreign lending and borrowing is that
all transactions take place under the rules, usances and institutional
arrangements prevailing in the respective national markets. Most important, all
these transactions are directly subject to public policy governing foreign
transactions in a particular market. For example, when savers, purchase
securities in a foreign market, they do so according to the rules, market practices
AcroPDF - A Quality PDF Writer and PDF Converter to create PDF files. To remove the line, buy a license.

MBA- H4030 International Business Finance
51
and regulatory percepts that govern such transactions in that particular market.
Likewise, foreign borrowers who wish to issue securities in a national market
must follow the rules and regulations of that market. Frequently, these rules are
discriminatory and restrictive. The same is true with respect to financial
intermediaries; the borrower who approaches a foreign financial institution for a
loan obtains funds at rates and conditions imposed by the financial institutions
of the foreign country and is directly affected to foreign residents.
(iii) Euromarkets and their linkages:
Euro currencies – which are neither currencies nor are they
necessarily connected with Europe – represent the separation of currency of
denomination from the country of jurisdiction. Banks and clients make this
separation simply by locating the market for credit denominated in a particular
currency outside the country where that currency is legal tender. For example,
markets for dollar denominated loans, deposits and securities in jurisdictions
other than in the United States effectively avoid US banking and securities
regulations. These markets are referred to as “Euro” or, more properly, as
external markets in order to indicate that they are not part of the domestic or
national financial system. As in the domestic markets, the euromarkets consist
of intermediated funds and direct funds. Intermediated credit in channel through
banks is called the “Euro Currency Market”.
A domestic market, usually with special and unique aspects and
institutions stemming from historical and regulatory differences. A foreign
segment attached to the national market, where non-residents participate as
supplier and takers of funds, frequently playing both roles simultaneously, but
always under the specific conditions, rules and regulations established for
foreign participants in a particular national market. An external segment that is
AcroPDF - A Quality PDF Writer and PDF Converter to create PDF files. To remove the line, buy a license.

MBA- H4030 International Business Finance
52
characterized by being in a different political jurisdiction, with only the currency
used to determine the financial claims being the essential link to the national
market. As a result, the various external markets have more features in common
with each other than with the respective national markets. Therefore, they are
properly discussed as a common, integrated market where claims denominated
in different currencies are exchanged.
SUMMARY:
The development in the international monetary system dates back to
the commodity specie standard when metallic coins were used for international
transaction. This was followed by gold standard that provided not only domestic
price stability but also automatic adjustment in the exchange rate and the
balance of payments. The gold standard failed to cope with the changes in
international economic scenario and it was finally abandoned in 1930s. Its
abandonment led to large fluctuations in exchange rates. And so a new system of
exchange rate evolved under the aegis of the “Bretton Woods” child”,
International Monetary Fund in 1945. The system represented a fixed parity
system with adjustable pegs. The currency of the member countries was
convertible in US dollar and the US dollar was convertible into gold. And so
when the US economy turned into distress in late 1950s, dollar failed to
command confidence. Dollar-denominated securities were converted into gold
depleting in turn the stock of gold with the USA. The process weakened the
dollar further and ultimately, the Bretton Woods system exchange rate crumbled
in early 1973. In the post-1973 or the present system, various options are given
to the member countries such as independent and managed floating rate system,
system of pegging of currency, crawling peg and target-zone arrangement. The
AcroPDF - A Quality PDF Writer and PDF Converter to create PDF files. To remove the line, buy a license.

MBA- H4030 International Business Finance
53
different systems have no doubt merits of their own, but they suffer from one
limitation or the other.
The exchange rates are quoted in different forms, viz., direct and
indirect quote, buying and selling quote, spot and forward quote. Cross rates
between two currencies are established through a common currency. They are
found when the rates between any two currencies are not published. During
several years (1987 to 1992) the countries belonging to the EMS had achieved,
to a marked extent, stability of real exchange rates through several adjustment
had to be made. The crisis of September 1992, brought about by the fall of US
dollar, led to profound changes. The EMU goes largely beyond the framework
of internal common market since it will also have repercussions on social plane.
Once the ECU is adopted as common currency it may become a pilot currency
and other European or non-European currencies may be pegged to it.
KEYWORDS:
Balance of Payment Deficits: In a situation of worsening balance of payments, the
government may like to conserve foreign exchange through payment restrictions or
otherwise.
Euro Currency Market: Collection of banks that accept deposits and provide
loans in large denominations and in a variety of currencies.
Foreign Exchange Market: Market composed primarily of banks, serving
firms and consumers who wish to buy or sell various currencies.
Develop Bilateralism: Exchange control may be with a view to encourage trade with a
particular country or group of countries.
Domestic market: A domestic market, usually with special and unique aspects
and institutions stemming from historical and regulatory differences.
AcroPDF - A Quality PDF Writer and PDF Converter to create PDF files. To remove the line, buy a license.

MBA- H4030 International Business Finance
54
Exchange Intervention: Exchange intervention or official intervention refers to the
buying and selling of foreign exchange in the market by the government or its agency
(central bank) with a view to influencing the exchange rate.
External segment: An external segment that is characterized by being in a
different political jurisdiction, with only the currency used to denominate the
financial claims being the essential link to the national market.
Foreign segment: A foreign segment attached to the national markets, where
non-residents participate as suppliers and takers of funds, frequently playing
both roles simultaneously, but always under the specific conditions, rules and
regulations established for foreign participants in a particular national market.
FURTHER READINGS:
• Apte, P.G: International Financial Management, Tata McGraw-Hill,
New Delhi
• Buckley, Adrian; Multinational Finance, Prentice Hall, New Delhi.
• Eitman, D.K. and A.I Stenehilf: Multinational Business Cash Finance,
Addison Wesley, New York.
• Henning, C.N., W Piggott and W.H Scott: international Financial
Management, McGraw Hill, international Edition.
• Levi, Maurice D: International Finance, McGraw-Hill, International
Edition.
• Frankel, J.A. (1993), On Exchange Rates, Cambridge Mass: MIT Press.
• Krueger, A.O. (1983), Exchange Rate Determination, Cambridge:
Cambridge University Press.
• Tex, B. (1995), Evolution of International Monetary System, New Your:
Wiley.
AcroPDF - A Quality PDF Writer and PDF Converter to create PDF files. To remove the line, buy a license.
MBA- H4030 International Business Finance
55
UNIT - II
BALANCE OF PAYMENTS
LEARNING OBJECTIVES
After reading this lesion, you should be able to,
· Know the Environment of International Business Finance· Give the meaning of Balance of Payments (BoPs)· Explain the concepts used in BOPs transactions.· Discuss BOPs Accounting Principles.· Know the basis for valuing goods and services.· Know the right valuation time for exports and imports of goods and
services.· List out the Components of BOPs.· Say what is Current Account and give its Structure.· Give the use of studying Current Account.· Discuss the Components of Current Account.· Say what is Capital Account and give its Structure.· Know and discuss the Components of Capital Account.· Give the recommendations of Dr. Rangarajan committee for correcting
BOPs.· List the ways of managing current account deficit.· Give the importance of BOP data.
STRUCTURE OF THE UNIT2.1 Introduction to Environment of International Financial Management2.2 Balance of Payments – Meaning and Definition2.3 Concepts Used in Balance of Payments2.4 BOPs and Accounting Principles2.5 Basis of Valuation of Goods and Services2.6 Valuation time of exports and imports of Goods and Services2.7 Components of the Balance of Payments2.8 Balance of Payments Identity
AcroPDF - A Quality PDF Writer and PDF Converter to create PDF files. To remove the line, buy a license.

MBA- H4030 International Business Finance
56
2.9 India’s Balance of Payments on Current Account2.10 Committee on Balance of Payments2.11 Coping with Current Account Deficit2.12 Significance of BOP Data
AcroPDF - A Quality PDF Writer and PDF Converter to create PDF files. To remove the line, buy a license.

MBA- H4030 International Business Finance
57
2.1 Introduction to Environment of International Business Finance
International business finance refers to the functions of an international
business. Specially, international business finance deals with the investment
decision, financing decision, and money management decision.
Before going to discuss balance of payments (BOPs) it is better to have
brief knowledge on international financial management, because balance of
payment is a factors that affects international business. International financial
environment is totally different from domestic financial environment. That
international financial management is subject to several external forces, like
foreign exchange market, currency convertibility, international monitory system,
balance of payments, and international financial markets (see Fig2.1.).
Fig 2.1 Environment of International Financial Management
Foreign
Exchange
Market
Currency
Convertibility
InternationalFinancialMarkets
International
Monetary
System
Balance of
Payments
International
Financial
Managemen
AcroPDF - A Quality PDF Writer and PDF Converter to create PDF files. To remove the line, buy a license.

MBA- H4030 International Business Finance
58
Foreign Exchange Market
Foreign exchange market is the market in which money denominated in one
currency is bought and sold with money denominated in another currency. It is an over-
the counter market, because there is no single physical or electronic market place or an
organized exchange with a central trade clearing mechanism where traders meet and
exchange currencies. It spans the globe, with prices moving and currencies trading
somewhere every hour of every business day. World major trading starts each morning
in Sydney and Tokyo, and ends up in the San Francisco and Los Angeles.
The foreign exchange market consists of two tiers: the inter bank market
or wholesale market, and retail market or client market. The participants in the
wholesale market are commercial banks, investment banks, corporations and
central banks, and brokers who trade on their own account. On the other hand,
the retail market comprises of travelers, and tourists who exchange one currency
for another in the form of currency notes or traveler cheques.
Currency Convertibility
Foreign exchange market assumes that currencies of various countries
are freely convertible into other currencies. But this assumption is not true,
because many countries restrict the residents and non-residents to convert the
local currency into foreign currency, which makes international business more
difficult. Many international business firms use “counter trade” practices to
overcome the problem that arises due to currency convertibility restrictions.
International Monetary System
Any country needs to have its own monetary system and an authority to
maintain order in the system, and facilitate trade and investment. India has its
AcroPDF - A Quality PDF Writer and PDF Converter to create PDF files. To remove the line, buy a license.

MBA- H4030 International Business Finance
59
own monetary policy, and the Reserve Bank of India (RBI) administers it. The
same is the case with world, its needs a monetary system to promote trade and
investment across the countries. International monetary system exists since
1944. The International Monetary Fund (IMF) and the World Bank have been
maintaining order in the international monetary system and general economic
development respectively.
International Financial Markets
International financial market born in mid-fifties and gradually grown in
size and scope. International financial markets comprises of international banks,
Eurocurrency market, Eurobond market, and international stock market.
International banks play a crucial role in financing international business by
acting as both commercial banks and investment banks. Most international
banking is undertaken through reciprocal correspondent relationships between
banks located in different countries. But now a days large bank have
internationalized their operations they have their own overseas operations so as
to improve their ability to compete internationally. Eurocurrency market
originally called as Eurodollar market, which helps to deposit surplus cash
efficiently and conveniently, and it helps to raise short-term bank loans to
finance corporate working capital needs, including imports and exports.
Eurobond market helps to MNCs to raise long-term debt by issuing
bonds. International bonds are typically classified as either foreign bonds or
eurobonds. A foreign bond is issued by a borrower foreign to the country where
the bond is placed. On the other hand Eurobonds are sold in countries other than
the country represented by the currency denominating them.
AcroPDF - A Quality PDF Writer and PDF Converter to create PDF files. To remove the line, buy a license.

MBA- H4030 International Business Finance
60
Balance of Payments
International trade and other international transactions result in a flow of
funds between countries. All transactions relating to the flow of goods, services
and funds across national boundaries are recorded in the balance of payments of
the countries concerned.
2.2 Balance of Payments – Meaning and Definition
Balance of payments (BoPs) is systematic statement that systematically
summarizes, for a specified period of time, the monetary transactions of an
economy with the rest of the world. Put in simple words, the balance of
payments of a country is a systematic record of all transactions between the
‘residents’ of a country and the rest of the world. The balance of payments
includes both visible and invisible transactions. It presents a classified record of:
i. All receipts on account of goods exported, services rendered and capital
received by ‘residents’ and
ii. Payments made by then on account of goods imported and services
received from the capital transferred to ‘non-residents’ or ‘foreigners’.
Thus the transactions include the exports and imports (by individuals,
firms and government agencies) of goods and services, income flows, capital
flows and gifts and similar one-sided transfer of payments. A rule of thumb that
aids in understanding the BOP is to “follow the cash flow”. Balance of payments
for a country is the sum of the Current Account, the Capital Account, and the
change in Official Reserves.
AcroPDF - A Quality PDF Writer and PDF Converter to create PDF files. To remove the line, buy a license.
MBA- H4030 International Business Finance
61
2.3 Concepts Used in Balance of Payments
Before going into in detail discussion of balance of payments reader has
to be familiar with the following concepts:
a. Economic Transactions: Economic transactions for the most part
between residents and non-residents, consist of those involving goods,
services, and income; those involving financial claims on, and liabilities
to the rest of the world; and those (such as gifts), classified as transfers.
A transaction itself is defined as an economic flow that reflects the
creation, transformation, exchange, transfer, or extinction of economic
value and involves changes in ownership of goods and / or financial
assets, the provision of services, or the provision of labor and capital.
b. Double Entry System: Double entry system is the basic accounting
concept applied in constructing a balance of payments statement. That is
every transaction is recorded based on accounting principle. One of these
entries is a credit and the other entry is debit. In principle, the sum of all
credit entries is identical to the sum of all debit entries, and the net
balance of all entries in the statement is zero. Exports decreases in
foreign financial assets (or increases in foreign financial liabilities) are
recorded as credits, while imports increases in foreign financial assets (or
decreases in foreign financial liabilities) are recorded as debits. In other
words, with regard to assets, whether real or financial, decreases in
holdings are recorded as credits, while increases in holdings are recorded
as debits. On the other hand, increases in liabilities are recorded as
credits, while decreases in liabilities are recorded as debits.
c. Concept of Residence: Concept of residence is very important attribute
of an institutional unit in the balance of payments because the
identification of transactions between residents and non-residents
AcroPDF - A Quality PDF Writer and PDF Converter to create PDF files. To remove the line, buy a license.

MBA- H4030 International Business Finance
62
underpins the system. The concept of residence is based on sectoral
transactor’s center of economic interest. An institutional unit has a center
of economic interest and is a resident unit of a country when from some
location, dwelling, place of production, or other premises within the
economic territory of country, the unit engages and intends to continue
engaging, either indefinitely or over a finite period usually a year, in
economic activities and transactions on a significant scale. The one-year
period is suggested only as a guideline and not as an inflexible rule.
d. Time of Recording: The IMF Balance of Payments Statistics contains
over 100,000 quarterly and annual time series data. When the data are
available, the annual entries generally begin in 1967 and quarterly entries
begin in 1970. The period for which data are available varies from
country to country, but most countries’ data extend from the mid-1970s
to the present. Data in international investment positions available for
selected countries from 1981 onwards.
In balance of payments the principle of accrual accounting
governs the time of recording of transactions. Therefore, transactions are
recorded when economic value is created, transformed, exchanged,
transferred, or extinguished. Claims and liabilities arise when there is a
change in ownership. Put in simple words, balance of payments is
usually prepared for a year but may be divided into quarters as well.
AcroPDF - A Quality PDF Writer and PDF Converter to create PDF files. To remove the line, buy a license.
MBA- H4030 International Business Finance
63
2.4 BOPs and Accounting Principles
Three main elements of actual process of measuring international
economic activity are:
1. Identifying what is/is not an international economic transaction,
2. Understanding how the flow of goods, services, assets, money create
debits and credits
3. Understanding the bookkeeping procedures for BOP accounting
Each transaction is recorded in accordance with the principles of double-
entry book keeping, meaning that the amount involved is entered on each of the
two sides of the balance-of-payments accounts. For every transaction there must
be two entries, one is credit, and the other one is debit. Consequently, the sums
of the two sides of the complete balance-of-payments accounts should always be
the same, and in this sense the balance of payments always balances. In practice,
the figures rarely balance to the point where they cancel each other out. This is
the result of errors or missions in the compilation of statements. A separate
balancing item is used to offset the credit or debit.
However, there is no book-keeping requirement that the sums of the two
sides of a selected number of balance-of-payments accounts should be the same,
and it happens that the (im) balances shown by certain combinations of accounts
are of considerable interest to analysts and government officials. It is these
balances that are often referred to as “surpluses” or “deficits” in the balance of
payments.
The following some simple rules of thumb help to the reader to
understand the application of accounting principles for BoPs.
1. Any individual or corporate transaction that leads to increase in demand
for foreign currency (exchange) is to be recorded as debit, because if is
AcroPDF - A Quality PDF Writer and PDF Converter to create PDF files. To remove the line, buy a license.
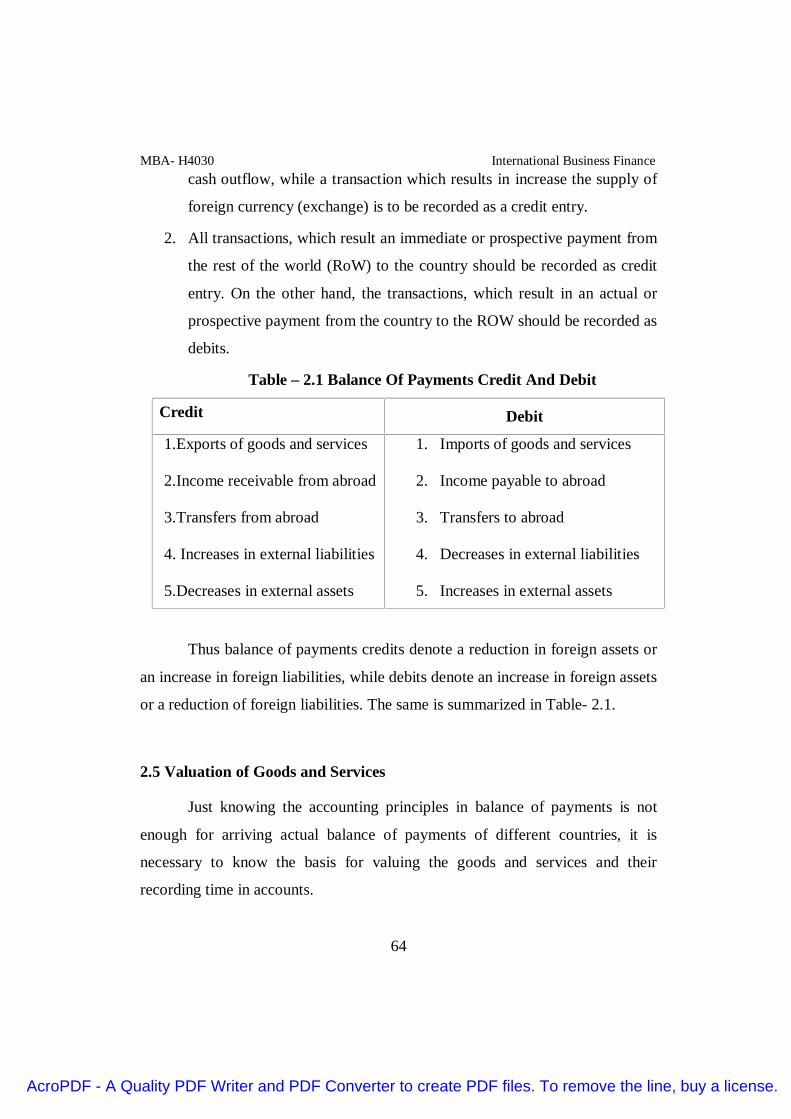
MBA- H4030 International Business Finance
64
cash outflow, while a transaction which results in increase the supply of
foreign currency (exchange) is to be recorded as a credit entry.
2. All transactions, which result an immediate or prospective payment from
the rest of the world (RoW) to the country should be recorded as credit
entry. On the other hand, the transactions, which result in an actual or
prospective payment from the country to the ROW should be recorded as
debits.
Table – 2.1 Balance Of Payments Credit And Debit
Credit Debit
1.Exports of goods and services
2.Income receivable from abroad
3.Transfers from abroad
4. Increases in external liabilities
5.Decreases in external assets
1. Imports of goods and services
2. Income payable to abroad
3. Transfers to abroad
4. Decreases in external liabilities
5. Increases in external assets
Thus balance of payments credits denote a reduction in foreign assets or
an increase in foreign liabilities, while debits denote an increase in foreign assets
or a reduction of foreign liabilities. The same is summarized in Table- 2.1.
2.5 Valuation of Goods and Services
Just knowing the accounting principles in balance of payments is not
enough for arriving actual balance of payments of different countries, it is
necessary to know the basis for valuing the goods and services and their
recording time in accounts.
AcroPDF - A Quality PDF Writer and PDF Converter to create PDF files. To remove the line, buy a license.

MBA- H4030 International Business Finance
65
Use of common valuation base for valuation of goods and services is
very important for meaningful comparison of balance of payments data between
countries that are exporting and importing. At the same time comparison of
balance of payment of data among member countries of IMF is also possible
only when the goods and services are valued on the basis on common price. The
IMF recommends the use of “Market prices” as base, because this being the
price paid by or accepted to pay “willing buyer” to a “willing seller”, where the
seller and buyer are independent parties and buying and selling transactions are
governed only by commercial considerations. Following the principle may not
be possible in all the transactions. In other words, there are some cases or
transactions, which are necessary to use some other base for valuing goods and
services. There are two choices of valuation basis available generally for export
and import of goods and services, they are: one f.o.b (free on board) and the
other c.i.f (cost insurance fright). IMF recommends the f.o.b for valuation of
goods and services, because the c.i.f base includes value of transportation and
insurance in the value of the goods. In India’s balance of payments statistics,
exports are valued on f.o.b basis, while imports are valued at c.i.f basis (see
Table 2.7). Another problem of valuation arises when foreign currency is
translated into domestic currency. It would be meaningful when the translation
takes place on the basis of exchange rate prevailing at the time of translation.
But in practice, transactions that occurred in a particular month are translated on
the basis of average exchange rate for the month.
2.6 Valuation Time of Exports and Imports of Goods and Services
Since the balance of payment statistics are prepared on quarterly basis
and they translated into domestic currency on monthly average foreign exchange
rate base, the timing of recording time is very important. Here timing means
AcroPDF - A Quality PDF Writer and PDF Converter to create PDF files. To remove the line, buy a license.

MBA- H4030 International Business Finance
66
recording one transaction in two different countries records should be the same
time. For example India’s exported software to US for Rs.500 crores on 28th
October 22, 2006, then the transaction should be recorded by giving the date 28th
October, 2006, in both (India and US) countries’ records, and not 28th October,
2006 in India’s records and 1st or some other date in the US records. Put in
simple words, the two side of transaction should be recorded in the same time
period. But there are various principles have been evolved for deciding the time.
For example, exports are recorded when they are cleared by customs, and
imports are recorded when the payment is made.
2.7 Components of the Balance of Payments
Balance of payments statistics must be arranged within a coherent
structure to facilitate their utilization and adaptation for multiple purposes
(policy formation, analytical studies, projections, bilateral comparisons of
particular components or total transactions, regional and global aggregations,
etc.). The IMF requires member countries (all 197 member countries)to provide
information on their BOP statistics in accordance with the provisions of Article
8 Paragraph 5 of the IMF Agreement. The basic principles are given in the
Balance of Payments Manual, fifth edition (BPM5) issued by the IMF in the year
1993. The BPM5 establishes the standard international rules for the compilation
of BOP statistics and provides guidelines on the reporting format to the IMF,
which was decided on the objectives of large number of users after
comprehensive discussions and feedbacks of member countries. The balance of
payment is a collection of accounts conventionally grouped into three main
categories. In other words, within the balance of payments there are three
separate categories under which different transactions are categorized. They are:
AcroPDF - A Quality PDF Writer and PDF Converter to create PDF files. To remove the line, buy a license.

MBA- H4030 International Business Finance
67
1. The Current Account: It records a nation's total exports of goods,
services and transfers, and its total imports of them
2. The Capital Account: It records all public and private investment and
lending activities.
3. The Official Reserve Account: It measures the changes in holdings of
gold and foreign currencies (reserve assets) by official monetary
institutions.
The difference in above 1 and 2 is termed as ‘basic balance’. The RBI
refers to it as overall balance. The IMF introduced the notion of overall balance
in, which all transactions other than those involving reserve assets were to be
“above the line”. However, depending on the context and purpose for which the
balance is used, several concepts of balance have developed. They are trade
balance (BOT), balance of invisibles (BOIs), current account balance, balance
on current account and long-term capital.
The following discussion provides detailed discussion of all the three
components of balance of payments.
A. The Current Account
As we have read in the above that current account records all flows of
goods, services, and transfers. The structure of current account in India’s
balance of payments is depicted in Table – 2.2.
Components of Current Account: The current account is subdivided
into two components (1) balance of trade (BoT), and (2) balance of invisibles
(BOIs).
AcroPDF - A Quality PDF Writer and PDF Converter to create PDF files. To remove the line, buy a license.

MBA- H4030 International Business Finance
68
1.Balance of Trade (BoT)
Balance of payments refers the difference between merchandise exports
and merchandise imports of a country. BOT is also known as "general
merchandise", which covers transactions of movable goods with changes of
ownership between residents and nonresidents. So, balance of trade deals with
the export and import of merchandise, except ships, airline stores, and so on.
Purchased by non-resident transport operators in the given country and similar
goods purchased overseas by that country’s operators, purchases of foreign
travelers, purchases by domestic missions. The data of exports and imports are
obtained from trade statistics and reports on payments/receipts submitted by
individuals and enterprises.
The valuation for exports should be in the form of f.o.b (free on board) basis
and imports are valued on the basis of c.i.f (cost, insurance and fright). Exports,
are credit entries. The data for these items are obtained from the various forms
of exporters, which would be filled by exporter and submitted to designate
authorities. While imports are debit entries. The excess of exports over imports
denotes favorable (surplus) balance of trade, while the excess of imports over
exports denotes adverse (deficit) balance of trade.
The balance of the current account tells us if a country has a deficit or a
surplus. If there is a deficit, does that mean the economy is weak? Does a
surplus automatically mean that the economy is strong? Not necessarily. But to
understand the significance of this part of the BOP, we should start by looking at
the components of the current account: goods, services, income and current
transfers.
AcroPDF - A Quality PDF Writer and PDF Converter to create PDF files. To remove the line, buy a license.
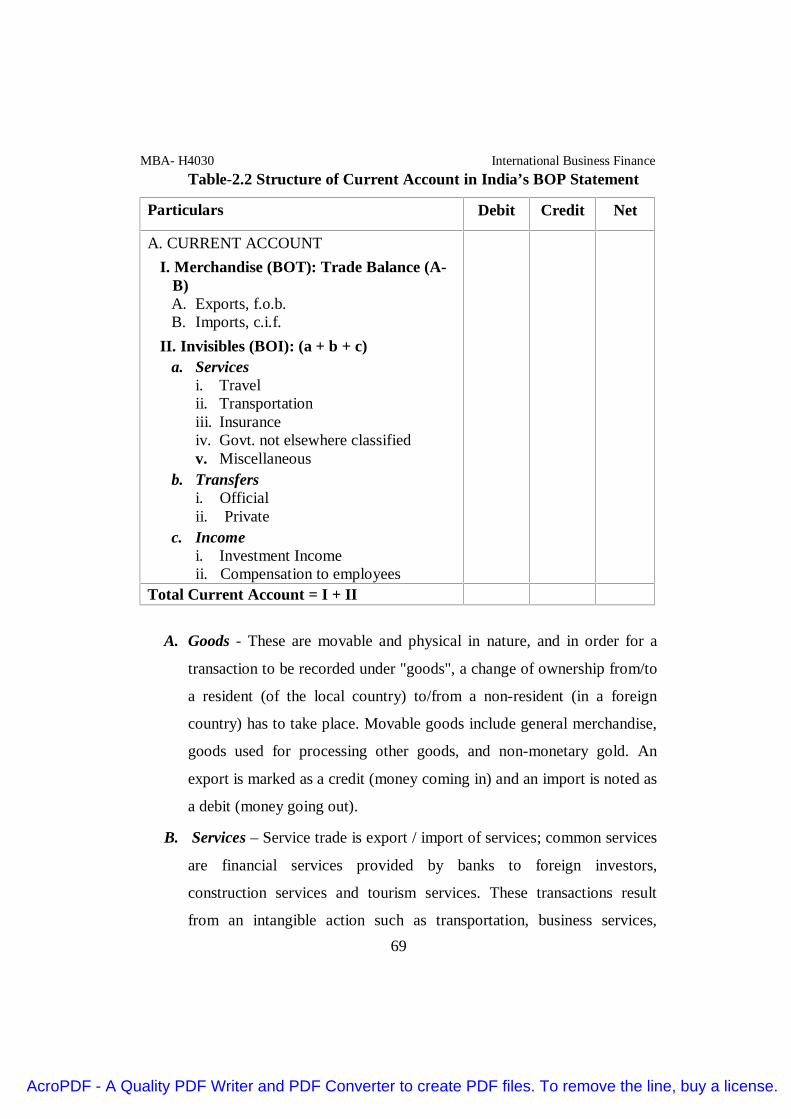
MBA- H4030 International Business Finance
69
Table-2.2 Structure of Current Account in India’s BOP Statement
Particulars Debit Credit Net
A. CURRENT ACCOUNTI. Merchandise (BOT): Trade Balance (A-
B)A. Exports, f.o.b.B. Imports, c.i.f.
II. Invisibles (BOI): (a + b + c)a. Services
i. Travelii. Transportationiii. Insuranceiv. Govt. not elsewhere classifiedv. Miscellaneous
b. Transfersi. Officialii. Private
c. Incomei. Investment Incomeii. Compensation to employees
Total Current Account = I + II
A. Goods - These are movable and physical in nature, and in order for a
transaction to be recorded under "goods", a change of ownership from/to
a resident (of the local country) to/from a non-resident (in a foreign
country) has to take place. Movable goods include general merchandise,
goods used for processing other goods, and non-monetary gold. An
export is marked as a credit (money coming in) and an import is noted as
a debit (money going out).
B. Services – Service trade is export / import of services; common services
are financial services provided by banks to foreign investors,
construction services and tourism services. These transactions result
from an intangible action such as transportation, business services,
AcroPDF - A Quality PDF Writer and PDF Converter to create PDF files. To remove the line, buy a license.

MBA- H4030 International Business Finance
70
tourism, royalties or licensing. If money is being paid for a service it is
recorded like an import (a debit), and if money is received it is recorded
like an export (credit).
C. Current Transfers - Financial settlements associated with change in
ownership of real resources or financial items. Any transfer between
countries, which is one-way, workers' remittances, donations, a gift or a
grant, official assistance and pensions are termed a current transfer.
Current transfers are unilateral transfers with nothing received in return.
Due to their nature, current transfers are not considered real resources
that affect economic production.
D. Income - Predominately current income associated with investments,
which were made in previous periods. Additionally the wages & salaries
paid to non-resident workers. In other words, income is money going in
(credit) or out (debit) of a country from salaries, portfolio investments (in
the form of dividends, for example), direct investments or any other type
of investment. Together, goods, services and income provide an
economy with fuel to function. This means that items under these
categories are actual resources that are transferred to and from a country
for economic production.
2.Balance of Invisibles (BoI)
These transactions result from an intangible action such as
transportation, business services, tourism, royalties on patents or trade marks
held abroad, insurance, banking, and unilateral services.
All the cash receipts received by the resident from non-resident are
credited under invisibles. The receipts include income received for the
services provided by residents to non-residents, income (interest, dividend)
AcroPDF - A Quality PDF Writer and PDF Converter to create PDF files. To remove the line, buy a license.

MBA- H4030 International Business Finance
71
earned by residents on their foreign financial investments, income earned by
the residents by way of giving permission to use patents, and copyrights that
are owned by them and offset entries to the cash and gifts received in-kind
by residents from non-residents. On the other hand debits of invisible items
consists of same items when the resident pays to the non-resident. Put in
simple debit items consists of the same with the roles of residents and non-
residents reversed.
The sum of the net balance between the credit and debit entries under
the both heads Merchandise, and invisibles is Current Account Balance
(CAB). Symbolically: CAB = BOT +BOI
It is surplus when the credits are higher than the debits, and it is
deficit when the credits are less than debits.
Use of Current Account
Theoretically, the balance should be zero, but in the real world this is
improbable. The current account may have a deficit or a surplus balance, that
indicates about the state of the economy, both on its own and in comparison to
other world markets.
A country’s current accounts credit balance (surplus) indicates that the
country (economy) is a net creditor to the rest of the countries with which it has
dealt. It also shows that how much a country is saving as opposed to investing. It
indicates that the country is providing an abundance of resources to other
economies, and is owed money in return. By providing these resources abroad, a
country with a current account balance surplus gives receiving economies the
chance to increase their productivity while running a deficit. This is referred to
as financing a deficit.
AcroPDF - A Quality PDF Writer and PDF Converter to create PDF files. To remove the line, buy a license.

MBA- H4030 International Business Finance
72
On the other hand a country’s current account debit (deficit) balance
reflects an economy that is a net debtor to the rest of the world. It is investing
more than it is saving and is using resources from other economies to meet its
domestic consumption and investment requirements. For example, let us say an
economy decides that it needs to invest for the future (to receive investment
income in the long run), so instead of saving, it sends the money abroad into an
investment project. This would be marked as a debit in the financial account of
the balance of payments at that period of time, but when future returns are made,
they would be entered as investment income (a credit) in the current account
under the income section.
A current account deficit is usually accompanied by depletion in foreign-
exchange assets because those reserves would be used for investment abroad.
The deficit could also signify increased foreign investment in the local market,
in which case the local economy is liable to pay the foreign economy investment
income in the future. It is important to understand from where a deficit or a
surplus is stemming because sometimes looking at the current account, as a
whole could be misleading.
B. The Capital Account
Capital account records public and private investment, and lending
activities. It is the net change in foreign ownership of domestic assets. If foreign
ownership of domestic assets has increased more quickly than domestic
ownership of foreign assets in a given year, then the domestic country has a
capital account surplus. On the other hand, if domestic ownership of foreign
assets has increased more quickly than foreign ownership of domestic assets in a
given year, then the domestic country has a capital account deficit. It is known
AcroPDF - A Quality PDF Writer and PDF Converter to create PDF files. To remove the line, buy a license.

MBA- H4030 International Business Finance
73
as “financial account”. IMF manual lists out a large number of items under the
capital account. But India, and many other countries, has merged the accounting
classification to fit into its own institutional structure and analytical needs. Until
the end of the 1980s, key sectors listed out under the capital account were: (i)
private capital, (ii) banking capital, and (iii) official capital.
Private capital was sub-divided into (i) long-term and (ii) short-term,
with loans of original maturity of one year or less constituting the relevant
dividing line. Long-term private capital, as published in the regular BOP data,
covered foreign investments (both direct and portfolio), long-term loans, foreign
currency deposits (FCNR and NRE) and an estimated portion of the unclassified
receipts allocated to capital account. Banking capital essentially covered
movements in the external financial assets and liabilities of commercial and co-
operative banks authorised to deal in foreign exchange. Official capital
transactions, other than those with the IMF and movements in RBI’s holdings of
foreign currency assets and monetary gold (SDRs are held by the government),
were classified into (i) loans, (ii) amortization, and (iii) miscellaneous receipts
and payments. The structure of capital account in India’s balance of payments is
shown in Table 2.3.
Components of Capital Account: From 1990-91 onwards, the classification adopted is
as follows:
i. Foreign Investment – Foreign investment is bifurcated into Foreign Direct
Investment (FDI) and portfolio investment. Direct investment is the act
of purchasing an asset and at the same time acquiring control on it. The
FDI in India could be in the form of inflow of investment (credit) and
outflow in the form of disinvestments (debit) or abroad in the reverse
manner. Portfolio investment is the acquisition of an asset, without
AcroPDF - A Quality PDF Writer and PDF Converter to create PDF files. To remove the line, buy a license.
MBA- H4030 International Business Finance
74
control over it. Portfolio investment comes in the form of Foreign
Institutional Investors (FIIs), offshore funds and Global Depository
Receipts (GDRs) and American Depository Receipts (ADRs).
Acquisition of shares (acquisition of shares of Indian companies by non-
residents under section 5 of FEMA, 1999) has been included as part of
foreign direct investment since January 1996.
ii. Loans – Loans are further classified into external assistance, medium
and long-term commercial borrowings and short-term borrowings, with
loans of original maturity of one-year or less constituting the relevant
dividing line. The principal repayment of the defense debt to the General
Currency Area (GCA) is shown under the debit to loans (external
commercial borrowing to India) for the general currency area since
1990-91.
iii. Banking Capital – Banking capital comprises external assets and
liabilities of commercial and government banks authorized to deal in
foreign exchange, and movement in balance of foreign central banks and
international institutions like, World Bank, IDA, ADB and IFC
maintained with RBI. Non-resident (NRI) deposits are an important
component of banking capital.
iv. Rupee Debt Service – Rupee debt service contains interest payment on,
and principal re-payment of debt for the erstwhile rupee payments area
(RPA). This is done based on the recommendation of high-level
committee on balance of payments.
v. Other Capital – Other capital is a residual item and broadly includes
delayed exports receipts, funds raised and held abroad by Indian
corporate, India’s subscriptions to international institutions and quota
payments to IMF. Delayed export receipts essentially arises from the
AcroPDF - A Quality PDF Writer and PDF Converter to create PDF files. To remove the line, buy a license.

MBA- H4030 International Business Finance
75
leads and lags between the physical shipment of goods recorded by the
customs and receipt of funds through banking channel. It also includes
rupee value of gold acquisition by the RBI (monetization of gold).
vi. Movement in Reserves – Movement in reserves comprises changes in
the foreign currency assets held by the RBI and SDR balances held by
the government of India. These are recorded after excluding changes on
account of valuation. Valuation changes arise because foreign currency
assets are expressed in terms US dollar and they include the effect of
appreciation/depreciation of non-US currencies (such as Euro, Sterling,
Yen and others) held in reserves. Furthermore, this item does not include
reserve position with IMF.
AcroPDF - A Quality PDF Writer and PDF Converter to create PDF files. To remove the line, buy a license.

MBA- H4030 International Business Finance
76
Table – 2.3 Structure of Capital Account in India’s BOP Statement
Particulars Debit Credit NetB. CAPITAL ACCOUNT
1. Foreign Investment (a + b)a. In India
i. Directii. Portfolio
b. Abroad2. Loans (a + b + c)
a. External Assistancei. By Indiaii. To India
b. Commercial Borrowingsi. By Indiaii. To India
c. Short-termi. To India
3. Banking Capital (a + b)a. Commercial Banks
i. Assetsii. Liabilitiesiii. Non-resident deposits
b. Others4. Rupee Debt Service5. Other Capital
Total Capital Account = 1 + 2 + 3 + 4 + 5
The above discussion details that capital account transactions of financial
assets and liabilities between residents and nonresidents, and comprises the
sub-components: direct investment, portfolio investment, financial
derivatives, and other investment.
As per the earlier classification, institutional character of the Indian
creditor/debtor formed the dividing line for capital account transaction, whereas
AcroPDF - A Quality PDF Writer and PDF Converter to create PDF files. To remove the line, buy a license.
MBA- H4030 International Business Finance
77
now it is the functional nature of the capital transaction that dominates the
classification.
C. Errors and Omissions Account
As you have read in BOP and accounting principles that there are
number and variety of transactions that occur in a period for which the balance
of accounts is prepared and all these transactions are recorded as per double-
entry accounting system. In principle, therefore, the net sum of all credit and
debit entries should equal. In practice, however, this does not happen since
errors and omissions occur in compiling the individual components of the
balance of payments. The net effect of these errors and omissions (including
differences in coverage, timing and valuation), are entered as unrecorded
transactions. So, errors and omissions account is used to account for statistical
errors and / or untraceable monies within a country. In practice, therefore, the
unrecorded transactions, which pertain to the current, capital transfer and
financial accounts, serve to ensure that the overall balance of payments actually
balances. Table - 2.4 details of the errors and omissions, overall balance and
monetary movement.
D. Overall Balance
Overall balance is equal to the sum of total current account, capital
account, errors & omissions.
E. Monetary Movements
The last element of the balance of payments is the official reserves
account. A country’s official reserve consists of gold and foreign exchange
(reserve assets) by official monetary institutions, special drawing rights (SDRs)
issued by the International Monetary Fund (IMF), and allocated from time to
time to member countries. It can be used for settling international payments
AcroPDF - A Quality PDF Writer and PDF Converter to create PDF files. To remove the line, buy a license.
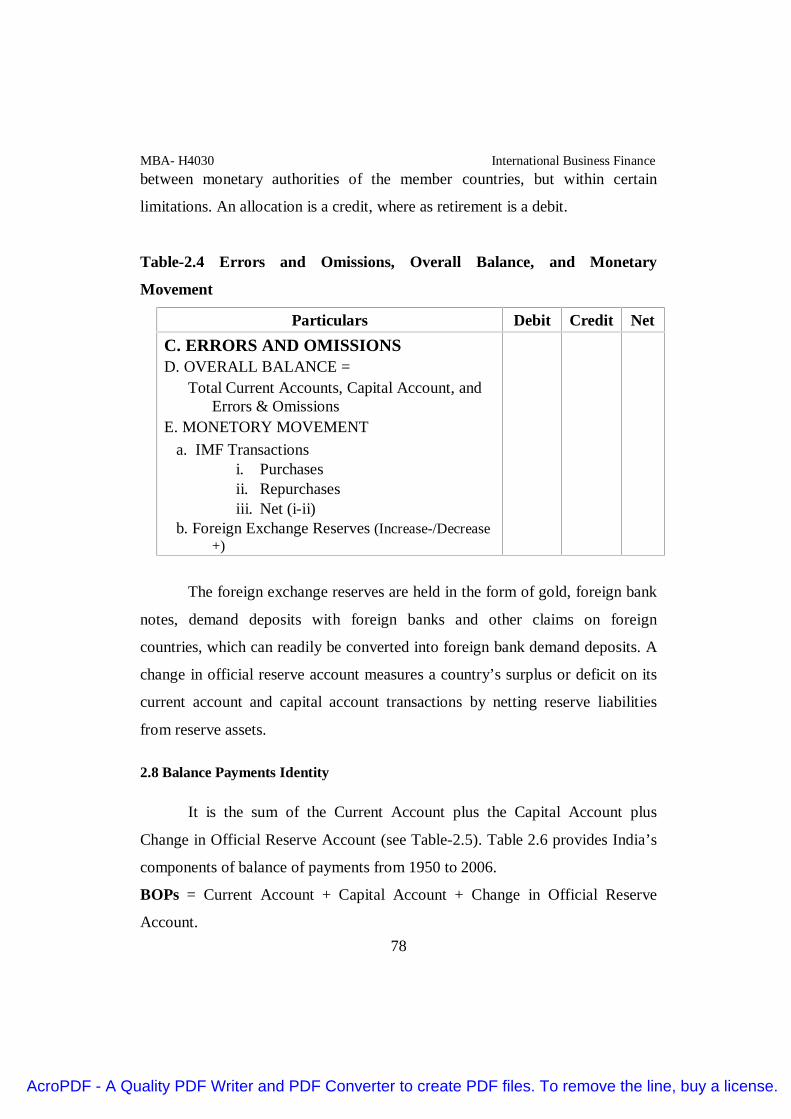
MBA- H4030 International Business Finance
78
between monetary authorities of the member countries, but within certain
limitations. An allocation is a credit, where as retirement is a debit.
Table-2.4 Errors and Omissions, Overall Balance, and Monetary
Movement
Particulars Debit Credit NetC. ERRORS AND OMISSIONSD. OVERALL BALANCE =
Total Current Accounts, Capital Account, andErrors & Omissions
E. MONETORY MOVEMENTa. IMF Transactions
i. Purchasesii. Repurchasesiii. Net (i-ii)
b. Foreign Exchange Reserves (Increase-/Decrease+)
The foreign exchange reserves are held in the form of gold, foreign bank
notes, demand deposits with foreign banks and other claims on foreign
countries, which can readily be converted into foreign bank demand deposits. A
change in official reserve account measures a country’s surplus or deficit on its
current account and capital account transactions by netting reserve liabilities
from reserve assets.
2.8 Balance Payments Identity
It is the sum of the Current Account plus the Capital Account plus
Change in Official Reserve Account (see Table-2.5). Table 2.6 provides India’s
components of balance of payments from 1950 to 2006.
BOPs = Current Account + Capital Account + Change in Official Reserve
Account.
AcroPDF - A Quality PDF Writer and PDF Converter to create PDF files. To remove the line, buy a license.
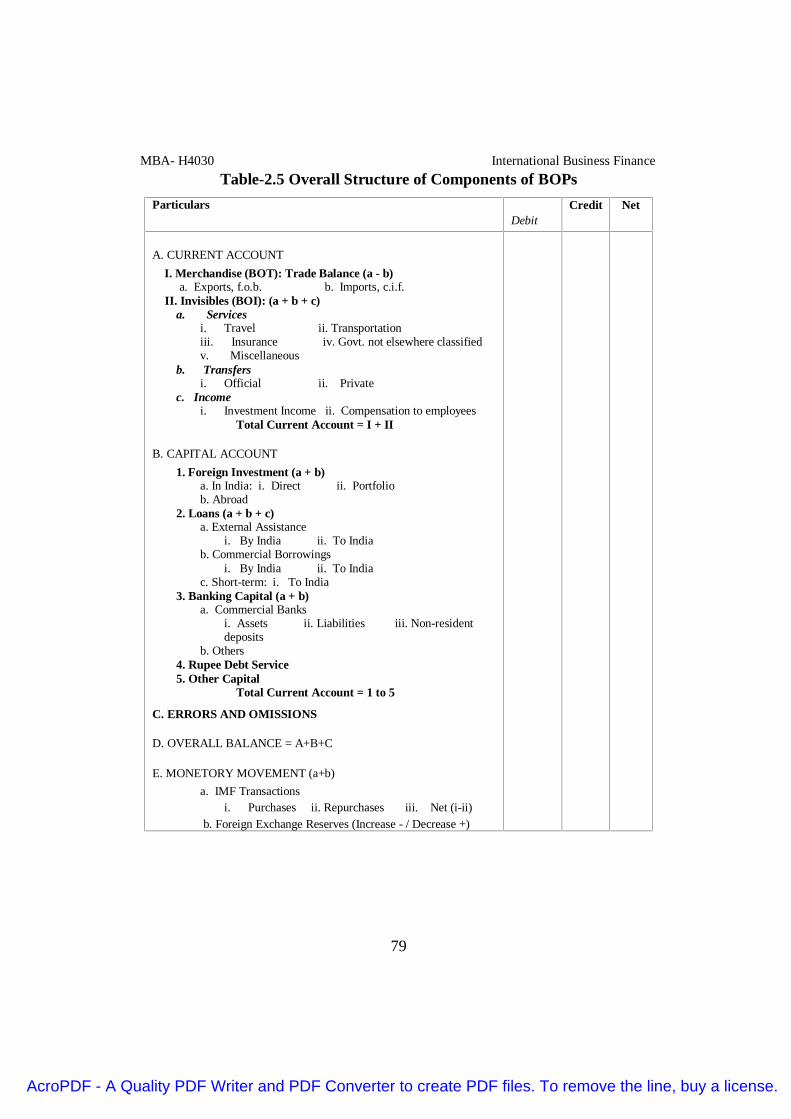
MBA- H4030 International Business Finance
79
Table-2.5 Overall Structure of Components of BOPsParticulars
DebitCredit Net
A. CURRENT ACCOUNTI. Merchandise (BOT): Trade Balance (a - b)
a. Exports, f.o.b. b. Imports, c.i.f.II. Invisibles (BOI): (a + b + c)
a. Servicesi. Travel ii. Transportationiii. Insurance iv. Govt. not elsewhere classifiedv. Miscellaneous
b. Transfersi. Official ii. Private
c. Incomei. Investment Income ii. Compensation to employees
Total Current Account = I + II
B. CAPITAL ACCOUNT1. Foreign Investment (a + b)
a. In India: i. Direct ii. Portfoliob. Abroad
2. Loans (a + b + c)a. External Assistance
i. By India ii. To Indiab. Commercial Borrowings
i. By India ii. To Indiac. Short-term: i. To India
3. Banking Capital (a + b)a. Commercial Banks
i. Assets ii. Liabilities iii. Non-residentdeposits
b. Others4. Rupee Debt Service5. Other Capital
Total Current Account = 1 to 5
C. ERRORS AND OMISSIONS
D. OVERALL BALANCE = A+B+C
E. MONETORY MOVEMENT (a+b)a. IMF Transactions
i. Purchases ii. Repurchases iii. Net (i-ii)b. Foreign Exchange Reserves (Increase - / Decrease +)
AcroPDF - A Quality PDF Writer and PDF Converter to create PDF files. To remove the line, buy a license.

MBA- H4030 International Business Finance
80
2.9 India’s Balance of Payments on Current Account
Before analyzing India’s balance of payments position over different plan
period and there is a need to have knowledge on analyzing the Current Account.
Exports imply demand for a local product while imports point to a need
for supplies to meet local production requirements. As export is a credit to a
local economy while an import is a debit, an import means that the local
economy is liable to pay a foreign economy. Therefore a deficit between exports
and imports otherwise known as a balance of trade deficit (more imports than
exports) - could mean that the country is importing more in order to increase its
productivity and eventually churn out more exports. This in turn could
ultimately finance and alleviate the deficit.
A deficit could also stem from a rise in investments from abroad and
increased obligations by the local economy to pay investment income (a debit
under income in the current account). Investments from abroad usually have a
positive effect on the local economy because, if used wisely, they provide for
increased market value and production for that economy in the future. This can
allow the local economy eventually to increase exports and, again, reverse its
deficit.
So, a deficit is not necessarily a bad thing for an economy, especially for
an economy in the developing stages or under reform: an economy sometimes
has to spend money to make money. To run a deficit intentionally, however, an
economy must be prepared to finance this deficit through a combination of
means that will help reduce external liabilities and increase credits from abroad.
For example, a current account deficit that is financed by short-term portfolio
investment or borrowing is likely more risky. This is because a sudden failure in
AcroPDF - A Quality PDF Writer and PDF Converter to create PDF files. To remove the line, buy a license.

MBA- H4030 International Business Finance
81
an emerging capital market or an unexpected suspension of foreign government
assistance, perhaps due to political tensions, will result in an immediate
cessation of credit in the current account.
As we have read in the above that the current account shows whether a
country has favorable balance or deficit balance of payments in any given year.
For example, the surplus or deficit of the current account are reflected in the
capital account, through the changes of in the foreign exchange reserves of
country, which are an index of the current strength or weakness of a country’s
international payments position, are also included in the capital account.
The following discussion details India’s balance of payments on current
account, over five year planning periods (see Table – 2.7):
The First Plan Period
India had been experiencing persistent trade deficit, but she had a surplus
in net invisibles, accordingly India’s adverse balance of payments during the
First plan was only Rs. 42 crores. However, the overall picture of India’s
balance of payments position was quite satisfactory.
The Second Plan Period
The prime feature of the Second Plan period was the highest (Rs.2,339
crores) trade deficit in the balance of payment. Net invisibles in this period was
recorded at Rs.614 crores, and covering a part of trade deficit. Balance of
payments in this period recorded unfavorable, at Rs.1,725 crores. The
unfavorable balance of payment in the Second Plan was due to heavy imports of
AcroPDF - A Quality PDF Writer and PDF Converter to create PDF files. To remove the line, buy a license.

MBA- H4030 International Business Finance
82
capital goods to develop heavy and basic industries, the failure of agricultural
production to raise to meet the growing demand for food and raw materials from
a rapidly growing population and expanding industry, the inability of the
economy to increase exports, and the necessity of making minimum
‘maintenance imports’ for a developing economy. This led to foreign exchange
reserves sharply declined and the country was left with no choice to think of
ways and means to restrict imports and exports.
The Third Plan and Annual Plans
Third plan period resembles the features of the Second plan with Rs.1,
951 crores unfavorable balance of payments. But the reasons for this state of
affaire were different from the Second Plan. Unfavorable balance of payments in
this period was primarily because of expanding imports under the impact of
defense and development and to overcome domestic shortages (for example
imports of food grains) and sluggish exports and failed to match imports. Loans
from foreign countries, PL480 and PL665 funds, loans from the World Bank and
withdrawals from IMF financed the current account deficit. In spite of all these
there was some depletion of foreign exchange reserves of the country.
The higher unfavorable balance of payment that started in the beginning
of the Second Plan continued through out the Plan and also continued
persistently during the Third and Annual Plans. During this period, huge
amount was used to pay interest on the loans contracted earlier. This has reduced
the invisibles balance. Consequently, balance of payment deficit was negligible.
AcroPDF - A Quality PDF Writer and PDF Converter to create PDF files. To remove the line, buy a license.

MBA- H4030 International Business Finance
83
The Fourth Plan Period
In this Plan period India’s current account balance was recorded
favorable at Rs.100 cores, it was due to the objectives of the Plan. The
objectives of the Plan are self-reliance – i.e., import substitution of certain
critical commodities (that are key importance for the Indian economy), export
promotion, so as to try to match raising import bill. Government had succeeded
in finding substitutes for imports and succeeded in export promotion. The trade
deficit in this period has come down from Rs. – 2,067 crores in Annual Plans to
Rs. – 1,564 cores by the end of Fourth Plan period. The net current account
balance was favorable for the first time in India.
Table – 2.7India’s Balance of Payments on Current Account (1950-51 to 2005-06) (Rs.Crores)
Plan
/ Year
Trade
Deficit
Net
Invisibles
Balance of
Payments
First Plan (1951-56) - 542 500 - 42
Second Plan (1956-61) - 2,339 614 - 1,725
Third Plan (1961-66) - 2,382 431 - 1,951
Annual Plans (1966-69) - 2,067 52 - 2,015
Fourth Plan (1969-74) - 1,564 1,664 100
Fifth Plan (1975-79) - 3,179 6,221 3,082
1979-80 - 3,374 3,140 - 234
Sixth Plan (1980-85) - 30,456 19,072 - 11,384
Seventh Plan (1985-90) - 54,204 13,157 - 41,047
1990-91 - 16,934 - 433 - 17,367
1991-92 - 6,494 4,259 - 2, 235
AcroPDF - A Quality PDF Writer and PDF Converter to create PDF files. To remove the line, buy a license.
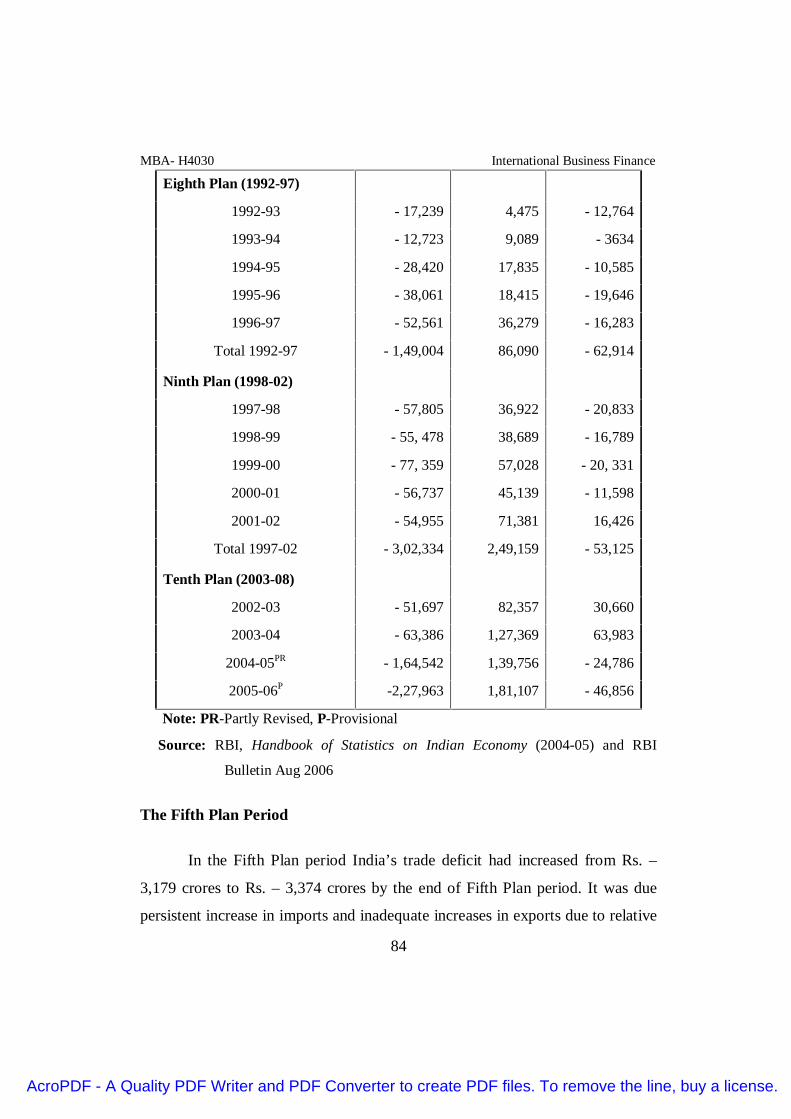
MBA- H4030 International Business Finance
84
Eighth Plan (1992-97)
1992-93 - 17,239 4,475 - 12,764
1993-94 - 12,723 9,089 - 3634
1994-95 - 28,420 17,835 - 10,585
1995-96 - 38,061 18,415 - 19,646
1996-97 - 52,561 36,279 - 16,283
Total 1992-97 - 1,49,004 86,090 - 62,914
Ninth Plan (1998-02)
1997-98 - 57,805 36,922 - 20,833
1998-99 - 55, 478 38,689 - 16,789
1999-00 - 77, 359 57,028 - 20, 331
2000-01 - 56,737 45,139 - 11,598
2001-02 - 54,955 71,381 16,426
Total 1997-02 - 3,02,334 2,49,159 - 53,125
Tenth Plan (2003-08)
2002-03 - 51,697 82,357 30,660
2003-04 - 63,386 1,27,369 63,983
2004-05PR - 1,64,542 1,39,756 - 24,786
2005-06P -2,27,963 1,81,107 - 46,856
Note: PR-Partly Revised, P-Provisional
Source: RBI, Handbook of Statistics on Indian Economy (2004-05) and RBI
Bulletin Aug 2006
The Fifth Plan Period
In the Fifth Plan period India’s trade deficit had increased from Rs. –
3,179 crores to Rs. – 3,374 crores by the end of Fifth Plan period. It was due
persistent increase in imports and inadequate increases in exports due to relative
AcroPDF - A Quality PDF Writer and PDF Converter to create PDF files. To remove the line, buy a license.
MBA- H4030 International Business Finance
85
decline in export prices were made the revival of deficit trade balance. Sharp
increase in invisible is another outstanding feature of Fifth Plan period. The
prime factors responsible for this increase are stringent measures taken against
smuggling and illegal payment of transactions, relative stability in the external
value of rupee at a time when major international currencies were experiencing
sizable fluctuations, increase in earnings from tourists, the growth earnings from
technical, consultancy and contracting services, and increase in the number of
Indian nationals going abroad for employment and larger remittances nest by
them to India. Net invisibles were more than the trade balance deficit, thus
India’s current account balance was favorable at Rs. 3,082 crores, which was
comfortable for the first time in planning period started.
The Six-Plan Period
There has been a sea change in India’s current account balance since
1979-80, as against favorable balance experienced by the economy the whole of
the Fifth Plan; India started experiencing unfavorably balance of payments from
1979-1980 onwards. In other words, trade deficit widen from 1978-79 onwards.
In this period the trade deficit was recorded at Rs.3, 374 crores, it was due to
terrific growth of imports and very low growth rate of exports. This trade deficit
was completely eaten the net invisibles and left current account deficit. For
meeting this deficit India had taken external assistance, withdrawals of SDR,
and borrowing from IMF under the extended facility arrangement. Apart from
these, India used a part of its accumulated foreign exchange reserves to meet its
balance of payments.
AcroPDF - A Quality PDF Writer and PDF Converter to create PDF files. To remove the line, buy a license.

MBA- H4030 International Business Finance
86
The Seventh Plan Period
During this period the total trade deficit increased to Rs. 54,204 crores. The net
invisibles recorded a positive balance at Rs.16, 157 crores. After adjusting the positive
balance of net invisibles, the current account balance was registered at Rs. – 41, 047
crores, which was the cause for serious concern, it was due to the larger imports. The
increase in imports was due to import liberalization, promotion of industrial
development, and the relative steep depreciation of the rupee vis-avis other currencies.
The ultimate solution has to be found in controlling imports to the unavoidable
minimum and promoting exports to the maximum.
Professor Sukhmoy Chakravarty in his work “Development Planning – the
Indian Experience (1987)”, questioning the policy of liberal imports wrote: “In my
judgment, India’s balance of payments is likely to come under pressure unless we carry
out a policy of import substitution in certain crucial sectors. These sectors include
energy, edible oil and nitrogenous fertilizers. In all these sectors, except fertilizers,
India is getting increasingly dependent on imports resulting in a volatile balance of
payments situation”.
In the year 1990-91 net invisible recorded a negative balance of Rs.433
crores, which was the first time during last 40 years. It was largely the
consequence of a net outflow of investment income of the order of Rs.6, 732
crores in 1990-91 as against Rs.4, 875 crores in 1989-90- as increase by 38 per
cent. Thus, the cushion available through positive net invisibles to partly
neutralize the trade deficit was removed.
AcroPDF - A Quality PDF Writer and PDF Converter to create PDF files. To remove the line, buy a license.

MBA- H4030 International Business Finance
87
The Eighth Plan Period
During 1992-03 to 1996-97 the trade deficit had continuously increased except
1992-03, and is was three fold increase from the year 1990-91. The total trade deficit
for the Plan period was recorded at Rs.1, 49,004 crores. Net invisibles also increased
from a positive balance Rs. 4,259 in the year 1991-92 to a positive balance of Rs.86,
090 crores by the end of the Plan period. It was good support for India. Despite this, the
current account balance was recorded a negative balance in all the years and the total
deficit was recorded at Rs. 62,914 crores.
The Ninth Plan Period
In this planning period the highest trade deficit was recorded in the year 1999-
2000 with Rs.77, 359 crores. Net invisibles had increased continuously in all the years
of the plan except 2001-02, and the total net invisibles recorded at Rs. 2,52,995 crores.
However, India’s current account balance was registered negatively at Rs. 53,175
crores. On an overall the current account deficit was high in the year 1997-98 but the
deficit had comedown to Rs.16, 426 crores, it was due to heavy receipts on account of
invisibles amounting to Rs.71, 381 crores, not only wiped of trade deficit, they also
created a surplus balance in current account with Rs.16, 426 crores.
The Tenth Plan Period
During the first two (2002-03, and 2003-04) years of the Tenth Plan, the
current account balance was recorded a positive balance of Rs. 30,660 crores
and Rs.63, 983 crores respectively. It was due to heavy surplus on invisibles.
India’s current account balance over the 2001-02 to 2003-04 year shown a
favorable balance of payments. However, in the year 2004-05, there was a huge
trade deficit (provisional) of Rs.1, 64,542 crores on account of unexpected
increase in imports, although there huge jump in our exports. Net invisibles
AcroPDF - A Quality PDF Writer and PDF Converter to create PDF files. To remove the line, buy a license.

MBA- H4030 International Business Finance
88
shown as positive balance of Rs.1, 39,756 crores, but it is just enough to cove 85
per cent of trade deficit. Consequently, a current account deficit of Rs.24, 786
crores was recorded, which is an unhealthy development. It may further worsen
if India follows reckless policy of import liberalization.
2.10 Committee On Balance of Payments
Dr. C. Rangarajan, former Governor, Reserve Bank of India who headed
the high level Committee on balance of payments submitted its report on June 4,
1993. The Committee made the following findings and recommendations for
correcting balance of payments:
1. The Committee stressed the fact that a realistic exchange rate and a
gradual relaxation of restrictions on current account transactions have to
go hand in hand.
2. In the medium-term care has to be taken to ensure that there is no capital
flight through liberalized windows of transactions under invisibles. At
the same time there is no escape from a very close control overall capital
transactions so that future liabilities are kept under control.
3. The Committed suggested that Current account deficit of 1.6 per cent of
GDP should be treated as ceiling rather than as target.
4. The Committee had given number of recommendations regarding to
foreign borrowings, foreign investment, and external debt management.
The following are the very important recommendations among them:
i. Government must exercise caution against extending concessions of
facilities to foreign investors, which are more favorable than what are
offered to domestic investors and also against enhancing external
debt to supplement equity.
AcroPDF - A Quality PDF Writer and PDF Converter to create PDF files. To remove the line, buy a license.

MBA- H4030 International Business Finance
89
ii. A deliberate policy of prioritizing the use to which external debt is to
be put should be pursued and no approval should be accorded for any
commercial loan with a maturity of less than five years for the
present.
iii. Efforts should be made to replace debt flows with equity flows.
However, foreign direct investment would contain both debt and
equity, and the system of approvals is applicable to all external debt.
The approval of debt linked to equity should be limited to the ratio of
1:2.
iv. On the question of encouraging foreign investment, the Committee
recommended that a national law should be seriously considered to
codify the existing policy and practices relating to dividend
repatriation, disinvestments, non-discrimination subject to
conditions, employment of foreign nationals, non-expropriation and
sanction as also servicing of external and commercial borrowing.
v. Recourse to external debt for balance of payments support would
have to be discouraged unless it is on concessional terms or with very
long maturity.
5. The Committee recommended that no sovereign guarantee should be
extended to private sector since it will give rise to issues of adequate
control over management, performance, and discrimination between
domestic and foreign companies.
6. The minimum foreign exchange reserves target should be fixed in such a
way that the reserves are generally in a position to accommodate imports
of three months.
AcroPDF - A Quality PDF Writer and PDF Converter to create PDF files. To remove the line, buy a license.
MBA- H4030 International Business Finance
90
The Committee was timely warning to manage our external debt and
thus salvage our economy.
2.11 Coping with Current Account Deficit
The following are the few ways to manage current account deficit:
- Encourage depreciation of the exchange rate (e.g., by cutting interest
rates or by currency intervention of one kind or another),
- Measures to promote new export industries,
- Import restrictions, quotas or duties (through the reduction in imports
caused by these measures, by appreciating the domestic currency, may
be offset by a reduction in exports, with the net result being little or no
change in the current account balance),
- Expenditure changing, adopting fiscal and monetary policy to reduce the
level of AD. This will reduce the demand for imports.
Less obvious but more effective methods to reduce a current account
deficit include measures that increase domestic savings (or reduced domestic
borrowing), including a reduction in borrowing by the national government.
The following are ways adopted by Government of India in managing
current account deficit:
- Loans from foreign countries, PL480 and PL665 funds, Loans from
World Bank, and withdrawals from IMF (to manage current account
deficit in the Third Plan),
- External assistance, withdrawals of SDRs and borrowing from IMF
under the extended facility arrangement, use of accumulated foreign
exchange reserves (to manage current account deficit in the Sixth Plan),
AcroPDF - A Quality PDF Writer and PDF Converter to create PDF files. To remove the line, buy a license.

MBA- H4030 International Business Finance
91
- Mobilization of funds under the India Millennium Deposits (to manage
current account deficit in 2000-01 year).
India had managed her current account deficit in different plan
period with the following measures:
a. Loans from foreign countries,
b. PL480 and PL665 funds,
c. Loans from World Bank,
d. Withdrawals of SDRs and borrowing from IMF under the extended
facility arrangement,
e. External assistance,
f. Use of accumulated foreign exchange reserves,
g. Mobilization of funds under the India Millennium Deposits, and so on.
2.12 Significance of BOP Data
Balance of payments data of home country and host country are have
significance to government officials, international business managers, investors,
and consumers, because such data influence and are influenced by other key
macroeconomic variables such as gross domestic product (GDP), employment,
price levels, exchange rate, and interest rates. Therefore balance of payments
may be used as an indicator of economic and political stability. For example, if a
country has a consistently positive BOP, this could mean that there is significant
foreign investment within that country. It may also mean that the country does
not export much of its currency.
AcroPDF - A Quality PDF Writer and PDF Converter to create PDF files. To remove the line, buy a license.
MBA- H4030 International Business Finance
92
The Balance of payment of Manual published by the International
Monetary Fund (IMF), i.e., IMF is the primary source of BoP and similar
statistics data worldwide. It prepares balance of payments manual and publishes
the same in a Balance of Payments Year Book.
Monetary and fiscal policy must take the BOP into account at the national level.
Multinational businesses use various BOP measures to gauge the growth and health of
specific types of trade or financial transactions by country and regions of the world
against the home country
Businesses need BOP data to anticipate changes in host country’s
economic policies driven by BOP events. BOP data may be important for the
following reasons:
i. BOP indicates a country’s financial position vis-à-vis foreign countries,
thereby a country’s ability to buy foreign goods or services.
ii. BOP is important indicator of pressure on a country’s exchange rate, and
thus on the potential of a firm trading with or investing in that country to
experience foreign exchange gains or losses. Changes in BOP may
presage the impositions of foreign exchange controls.
iii. BOP data helps in knowing the changes in a country’s BOP may also
signal imposition (or removal) of controls over payments, dividends, and
interest, license fees, royalty fees, or other cash disbursements to foreign
firms or investors.
iv. BOP data helps to forecast a country’s market potential, especially in the
short- run. A country experiencing a serious BOP deficit is not likely to
import as much as it would if it were running a surplus, and
AcroPDF - A Quality PDF Writer and PDF Converter to create PDF files. To remove the line, buy a license.

MBA- H4030 International Business Finance
93
v. BoP data can also signal increased riskiness of lending to particular
country.
vi. It also helps to in the formulation of trade and fiscal policies.
Summary
International business finance deals with the investment decision,
financing decision, and money management decision. Balance of payments
(BOPs) is one of the actors that affect international business. Balance of
payments (BoPs) is systematic statement that systematically summarizes, for a
specified period of time, the monetary transactions of an economy with the rest
of the world.
Balance of payments transactions are recorded on the principle of
accrual accounting governs the time of recording of transactions. Three main
elements of actual process of measuring international economic activity are:
identifying what is/is not an international economic transaction, understanding
how the flow of goods, services, assets, money create debits and credits, and
understanding the bookkeeping procedures for BOP accounting.
Comparison of balance of payment of data among member countries of
IMF is also possible only when the goods and services are valued on the basis
on common price like “Market prices”. There are some cases or transactions,
which are necessary to use some other base for valuing goods and services. The
f.o.b and the c.i.f are the two basis available for international trade. IMF
recommends the f.o.b because the c.i.f base includes value of transportation and
insurance in the value of the goods. In India’s balance of payments statistics,
AcroPDF - A Quality PDF Writer and PDF Converter to create PDF files. To remove the line, buy a license.
MBA- H4030 International Business Finance
94
exports are valued on f.o.b basis, while imports are valued at c.i.f basis. It would
be meaningful when the translation recorded on the basis of exchange rate
prevailing at the time of translation. But in practice, transactions that occurred in
a particular month are translated on the basis of average exchange rate for the
month. Balance of payment transactions should be recorded in the same time
period.
Balance of payments statistics must be arranged within a coherent structure to
facilitate their utilization and adaptation for multiple purposes. The balance of payment
is a collection of accounts conventionally grouped into three main categories, they are:
the current account, the capital account, and the official reserve account. The current
account is further divided into two, they are balance of trade (BOT), balance of
invisibles (BOIs). The current account may have a deficit or a surplus balance, that
indicates about the state of the economy, both on its own and in comparison to other
world markets.
Capital account records public and private investment, and lending
activities. It is the net change in foreign ownership of domestic assets. Until the
end of the 1980s, key sectors listed out under the capital account were: private
capital, banking capital, and official capital.
Balance of accounts may not match, it is due the errors and omissions occur in
compiling the individual components of the balance of payments. The net effect of
these errors and omissions, are entered as unrecorded transactions. So, errors and
omissions account is used to account for statistical errors and / or untraceable monies
within a country. Overall balance is equal to the sum of total current account, capital
account, errors & omissions.
AcroPDF - A Quality PDF Writer and PDF Converter to create PDF files. To remove the line, buy a license.
MBA- H4030 International Business Finance
95
Current account may show surplus balance or deficit balance. The
overall performance of the current over plan periods is poor and in the last two
pan periods it has tried to recover.
The Committee on BOPs primarily stressed on the fact that a realistic
exchange rate and a gradual relaxation of restrictions on current account
transactions, no capital flight through liberalized windows of transactions under
invisibles, no escape from a very close control overall capital transactions, to
take current account deficit of 1.6 per cent of GDP as ceiling rather than as
target. The Committee was timely warning to manage our external debt and thus
salvage our economy.
Current account deficit may be managed with the encourage depreciation
of the exchange rate, take measures to promote new export industries, import
restrictions, quotas or duties, expenditure changing, adopting fiscal and
monetary policy to reduce the level of AD. Less obvious but more effective
methods to reduce a current account deficit include measures that increase
domestic savings, including a reduction in borrowing by the national
government.
Government of India had managed current account deficit by borrowing
loans from foreign countries, PL480 and PL665 funds, Loans from World Bank,
and withdrawals from IMF, taking external assistance, withdrawals of SDRs and
borrowing from IMF under the extended facility arrangement, use of
accumulated foreign exchange reserves, mobilization of funds under the India
Millennium Deposits
AcroPDF - A Quality PDF Writer and PDF Converter to create PDF files. To remove the line, buy a license.
MBA- H4030 International Business Finance
96
Balance of payments data of home country and host country are have
significance to government officials, international business managers, investors,
and consumers, because such data influence and are influenced by other key
macroeconomic variables such as gross domestic product (GDP), employment,
price levels, exchange rate, and interest rates. Therefore balance of payments
may be used as an indicator of economic and political stability.
Questions
1. Discuss the environment of international financial management.
2. What is BOP? Briefly discuss the components of BOPs.
3. BOPs transactions are recorded based on accounting principles. Discuss.
4. Discuss the valuation basis for goods and services?
5. What is current account? Discuss in detail the components of current
account.
6. Explain the use of studying current account balance.
7. What is capital account? What are its components? Discuss.
8. Give the structure of overall balance of payments, and explain in brief.
9. Discuss the India’s balance of payment position over the planning periods.
10. List out the recommendations given by Dr.Rangarajan Committee for
correcting BOP.
11. What is current account deficit? How is it managed?
12. List out the ways used by India in managing current account deficit.
13. What is the significance of BOP data?
AcroPDF - A Quality PDF Writer and PDF Converter to create PDF files. To remove the line, buy a license.
MBA- H4030 International Business Finance
97
References
1. Apte, P.G, “International Financial Management”, Tata McGraw Hill
Company, New Delhi.
2. Buckley, Adrian, “Multinational Finance”, Prentice Hall of India, New
Delhi.
3. Eitman, D.K, and A.I Stenehilf, “Multinational Business Cash Finance”,
Addison Wesley, New York.
4. Henning, C.N, W. Piggott and W.H Scott, “International Financial
Management”, McGraw Hill Intel Edition.
5. Levi, Maurice D, “International Financial Management”, McGraw Hill
Intel Edition.
6. Five-Year Plans, Planning Commission.
7. Reserve Bank of India, “Balance of Payments Compilation Manual”,
RBI, Bombay.
8. Handbook of Statistics on Indian Economy (2004-05), RBI.
9. India’s Balance of Payments, RBI.
10. Economic Survey, Ministry of Finance, Govt. of India
11. Report of the Committee Trade Policies, Government of India
AcroPDF - A Quality PDF Writer and PDF Converter to create PDF files. To remove the line, buy a license.

MBA- H4030 International Business Finance
98
AcroPDF - A Quality PDF Writer and PDF Converter to create PDF files. To remove the line, buy a license.

MBA- H4030 International Business Finance
99
UNIT - III
Lesson No: 1
INTERNATIONAL FINANCIAL MARKETS
The financial system, consisting of financial institutions, financial
instruments and financial markets, provides and effective payments and credit
system and thereby facilitates channeling of funds from the savers to the
investors in the economy. The task of financial institutions or financial
intermediaries is to mobile savings and ensures efficient allocation of these
funds to high yielding investment projects. The process gives rise to different
types of money and financial instruments such as bank deposits, loans and
equity and debt instruments
Just as domestic financial markets have two segments short-term money
market and capital market- international financial markets do also have these
two segments. In the short-term money markets funds for short periods are
loaned and borrowed. Commercial banks and non-bank financial intermediaries
participate in this market. In the capital market long –business houses through
equity and bond issues raise term capital. Development bank and long-term
financial institutions participate in the market. Sovereign governments and
public sector enterprises too issue bonds to meet their financial needs.
GLOBALISATION OF FINANCIAL MERKET
Business houses no longer restrict themselves to domestic sources of
financing. The search for capital does not stop at water edge. With the pursuit of
policies of liberalization and globalization, the distinction between domestic and
foreign financial markets is becoming increasingly blurred. With the lifting of
regulatory systems in 1980s become one vast connect4ed market. Deregulation,
AcroPDF - A Quality PDF Writer and PDF Converter to create PDF files. To remove the line, buy a license.

MBA- H4030 International Business Finance
100
internationalization and innovations have created such a market. In 1980 the
stock of international bank lending was $324 billions. By 1991 it had rise to $7.5
trillion. Between 1980 and 1990 the volume of world 2wide cross boarder
transitions in equities rose from $120 billion to $1.4trillion a year. Between
1986 and 1990 outflows of foreign direct investment (FDI) from U.S.A., Japan,
West Germany, France and Britain increased from $61billionm a year to $156
billion. In 1990, there were roughly 35000 multinational corporations with
147000 affiliates, which account for a major share in direct foreign investments.
In 1982 the total international bonds outstanding was 259 billion. It went up to
$1.65 trillion by 1991. In 19870 America securities transitions with foreigners
amounted to 3% of the GDP. In 1990 it was 93% of GDP. West Germany, Japan
and England have also had similar trend.
International financial centers have developed as extension of domestic
centers. Those domestic centers, which have greatest convenience of
international communications, geographical locations, financial services etc.,
came to be recognized as “International financial centers”. In the process major
financial cities in the workload have become the international financial
centuries. The most important among them are London, Tokyo, New York,
Luxembourg, Singapore, Honkong etc.,
In international finance centers or markets, the type of transactions
occurring are 1.between foreign lenders and domestic borrowers; 2.between
domestic lenders and foreign borrowers; 3. Between foreign lenders and foreign
borrowers. The third type of transiting is called entrepot or offshore transactions.
In this case the financial centers merely provide facilitating services for foreign
lending and borrowing.
AcroPDF - A Quality PDF Writer and PDF Converter to create PDF files. To remove the line, buy a license.
MBA- H4030 International Business Finance
101
Until the development of the Euro market in late 1950s, international
financial centers were principal suppliers of capital to foreign borrowers. In the
post 1960 Euro market, entrepot type and offshore financial transactions became
increasingly predominant. Hence the traditional nature of financial centers was
altered radically. With the int3ernationalisation of credit transitions, it was no
longer necessary for an international center to be a net supplier of capital. Thus
small and relatively unknown parts of the world become important banking
centers- Nassau (Bahamas), Singapore, Luxembourg, etc. the worlds financial
centers as a group provide three types of international services (1)) traditional
capital exports, (2) entrepot financial services, and (3) Offshore banking.
The traditional financial centers were net exporters of domestic capital.
Thus functions have been performed through foreign lending by commercial
banks, the underwriting and placement of marketable securities for foreign
issuers and the purchase of notes and obligations of non-resident entities of
domestic investors in the secondary market.
Entrepot financial centers offer the services of their domestic financial
center. It is financial intermediation performed primarily for non-resident
borrowers and depositors. It refers to international banking business involving
non-resident foreign currency-denominated assets and liabilities. It confines to
the banking operations of non-residents and does not mix with domestic
banking. But the domestic financial markets are well insulated from offshore
banking activity by an array of capital and exchange controls. Offshore banking
business is carried in about 20 centers throughout the world. It offers benefits
like exemption from minimum cash reserve requirements, freedom from control
on interest rates, low or non existent taxes and levies, low license fee etc.
Offshore banking units are branched of international banks. They provide
AcroPDF - A Quality PDF Writer and PDF Converter to create PDF files. To remove the line, buy a license.
MBA- H4030 International Business Finance
102
projects financing, syndicated loans, issue of short- term and medium term
instruments etc.
RECENT CHANGES IN GLOBAL FINANCIAL MARKETS
The decade of eighties witnessed unprecedented changes in financial
markets around the world. The seeds of these changes were however sown in the
1960s with the emergence of Euromarkets, which were a sort of parallel money
markets, virtually free from any regulation. This led to internationalization of
the banking business. This market grew vigorously during the seventies and
pioneered a number of innovative funding techniques.
The outstanding feature of the changes during the eighties was
integration. The boundaries between national market as well as those between
and offshore markets are rapidly becoming blurred leading to the emergence of a
global unified financial market. The financial system has grown much faster
than real output since the late seventies. Banks in major industrialized countries
increased their presence in each other’s countries considerably. Non-resident
borrowers on an extensive scale are tapping major national market such as the
US, Japan, Germany. Non-resident investment banks are allowed access to
national bond and stock markets. The integrative forces at work through the
eighties have more or less obliterated the distinction between national and
international financial markets. Today both the potential borrower and the
potential investor have a wide range of choice of markets.
In addition to the geographical integration across market there has been a
strong trend towards functional unification across the various types of financial
intuitions within the individual markets. The traditional segmentation between
commercial banking, investment banking, and consumer finance and so on, is
AcroPDF - A Quality PDF Writer and PDF Converter to create PDF files. To remove the line, buy a license.

MBA- H4030 International Business Finance
103
fast dis-appearing with the result that nowadays “everybody does everything”.
Universal banking intuitions/bank holding companies provide worldwide, a
wide range of financial services including traditional commercial banking
The driving forces behind this spatial and functional integration were
first, liberalization with regard to cross-border financial transaction and second
deregulation within the financial systems of the major industrial nations. The
most significant liberalization measure was the lifting of exchange controls in
France, UK and Japan. Withholding taxes on interest paid to non-resident were
removed, domestic financial markets were opened up to foreign borrowers and
domestic and domestic borrowers were allowed access to foreign financial
markets. Thus in the portfolios of investors around the world, assets
denominated in various currencies became more nearly substitutable- investors
could optimize their portfolios taking into consideration their estimates of
return, risk and their own risk preferences. On the other hand, borrowers could
optimize their liability portfolios in the light of their estimates of funding costs,
interest rate and exchange rate risk and their risk preferences.
Deregulation involved action on two fronts. One was eliminating the
segmentation of the market for financial services with specialized institutions
catering exclusively to particular segments, and measures designed to foster
greater competition such as abolition of fixed brokerage fees, breaking up bank
carters and so forth. The other was permitting foreign financial institutions to
enter the national markets and compete risks and their risk preferences.
The fever of liberalization and deregulation has also swept the various
national stock markets. This is the least integrated segment of financial markets
AcroPDF - A Quality PDF Writer and PDF Converter to create PDF files. To remove the line, buy a license.

MBA- H4030 International Business Finance
104
though in recent years the number of non-resident firms being listed on major
stock exchange like New York and London has increased significantly.
Liberalization and deregulation have led to a significant increase in
competition within the financial services industry. Spreads on loans,
underwriting commissions and fees of various kinds have become rather thin.
Another factor responsible for this is the tendency on the part of prime
borrowers to approach the investors directly by issuing their own primary
securities thus depriving the bank of their role and profits as intermediaries. This
is a part of the overall trend towards securitization and disintermediation.
The pace of financial innovation has also accelerated during the last 10
to 15 years. The motive force behind innovation like options, swaps, futures and
their innumerable permutations and combinations comes both from the demand
side and the supply side. On the one hand, with the floating of exchange rates in
1973 a new factor was introduced main international finance; exchange rate
volatility and the substantially higher interest rate volatility witnessed during the
eighties led to demand for newer kings of risk management products which
would enable investors and borrowers to minimize if not eliminate totally
exchange rate and interest rate risks. On the supply side as the traditional sources
of income for banks and investment banks such as interest, commissions, fees,
before the competitors wised up to the fact and started offering which it is
sometimes said the bankers themselves do not fully understand. The innovation
mania has been made possible and sustained by the tremendous advance in
telecommunications and computing technology.
Liberalization and deregulation of financial markets is on an ongoing
process. From time t o time events and circumstances give rise to calls for re
AcroPDF - A Quality PDF Writer and PDF Converter to create PDF files. To remove the line, buy a license.

MBA- H4030 International Business Finance
105
imposition of some controls and barriers to cross-border capital movements.
Some governments resort to such measure to contain or prevent a crisis. Many
economists have proposed taxation of certain capital account transitions-
particularly short- term movements of funds- to throw sand in the excessively
oiled machinery of global capital market”. The quality and rigor of banking
supervision in many developing countries needs considerable improvement.
In the western hemisphere, US and most of Europe have more or less
free financial markets. Japan started the process around mid-eighties and most of
the barriers have been dismantled though some restrictions still remain. In other
parts of the world, countries like Singapore and hongkong already. Eastern
Europe and third world have begun their economic reforms including freeing
their financial sectors. Recent years have seen surge in portfolio investments by
institutional investors in developed countries in developed countries in the
emerging capital market in Eastern Europe and Asia. A large number of
companies from developing countries have successfully tapped domestic
markets of developed countries as well as offshore markets to raise equity and
debt finance.
The explosive pace of deregulation and innovation has given rise to
serious concerns about the viability and stability of the system. Even such as the
LDC debt crisis and the 1987 stock market crash in the 1980s the east Asian
currency crisis and the tenets following the Russian debacle including the fall of
LTCM, a giant hedge fund in the 1990s have underscored the need to redesign
the regulatory and control apparatus which will protect investors interest make
the system less vulnerable to shock origination in the real economy, will protect
investors interest make the system less vulnerable to shocks originating in the
real economy, will enable location and containment of crises when they do occur
AcroPDF - A Quality PDF Writer and PDF Converter to create PDF files. To remove the line, buy a license.

MBA- H4030 International Business Finance
106
without unduly stifling competition and making the markets less efficient in their
role as optimal allocates of financial resources. Increasing inter-depended
implies convergence of business cycles and hence less resilience in the global
economy. Disturbances following a local financial crisis tend to spread
throughout the global system at the “speed of thought” making the policy makers
task extremely difficult.
International bodies such as the IMF have already begun drawing up blueprints
for a new architecture for the global financial system. Extensive debates will
follow among economists, finance experts and policy makers before the
blueprints are translated into new structures
SELF-ASSEEMENT QUESTIONS
1. HOW DOES INTERNATIONAL FINANCIAL MARKET DIFFER FROM
DOMESTIC FINANCIAL SYSTEM?
2. EXPLAIN THE CONCEPT OF FINANCIAL MARKET?
3. DESCRIBE THE GLOBALISATION OF FINANCIAL MARKETS?
4. WHAT ARE THE RECENT CHANGES IN GLOBAL FINANCIAL
MARKETS?
FURTHER READINGS
Apte, PG, 1995, International Financial Management, Tata Mc Graw hill, NewDelhi.
Bhalla, V.K. and S.shiv Ramu, 1996, International Business, An mol, NewDelhi.
J.V.Prabhakara Rao, R.V.Rangachary, International Business, KalyaniPublishers, 2000.
AcroPDF - A Quality PDF Writer and PDF Converter to create PDF files. To remove the line, buy a license.

MBA- H4030 International Business Finance
107
INTERNATIONAL FINANCIAL MARKETS AND INTSRUMENTS
Lesson No: 2
Eurocurrency Market:
Prior to 1980 Eurocurrency markets are the only international financial
market of any significance. They are offshore markets where financial
institutions conduct transactions which are denominated in currencies of
countries other than the country in which the institutions currencies of countries
other than the country in which the institutions are located. The Eurocurrency
market is outside the legal preview of the country in whose currency the finance
are raised in the market. Eurocurrencies are bank deposits denominated in
currencies other than the currency of the country in which the bank is located.
The bank deposits and loans are denominated in Eurocurrencies, particularly
dollars. Eurodollars are dollar denominated time deposits held by financial
intuitions located outside the US., including such deposits by branches of
U.S.,including such deposits held by branches of U.S.,banks. Thus a dollar with
a bank in London or Paris is a Eurodollar deposit. Similarly, a Deutsche mark
deposit with a bank in London is Euro mark deposit, even a deposit made by a
U.S., firm with a Paris subsidiary of a U.S. bank is still a Eurodollar deposit.
Similarly a Eurodollar loan made by bank or branch of a bank outside U.S.A. is
a Eurodollar market and the deposit are termed as Eurodollar deposits and the
loans are called Eurodollar loans. The terms’ euro’ is affixed to denote offshore
currency transactions.
Origin and growth of Eurodollar market
The Eurodollar market originated in the 1950s. Soviet Union and Eastern
European countries, which earned dollars by gold exports and other means,
AcroPDF - A Quality PDF Writer and PDF Converter to create PDF files. To remove the line, buy a license.

MBA- H4030 International Business Finance
108
wanted to keep their dollars as deposits with European banks. They avoided the
banks in U.S.A. out of the fear that U.S. Government may block deposit in the
U.S. banks. Subsequent growth of the market may be attributed to the
emergence of dollar as the principal international currency after the World War
II. Since 1965 there has been a phenomenal growth of this market. The fast
growth of the Eurodollar market during 1965-1980 periods may be attributed to
four major factors.
1. Large balance of payments deficits of U.S.A particularly during 1960s
resulted in the accumulation of dollars by foreign financial institution
and individuals.
2. The Various regulations, which prevailed in the U.S. during 1963-74,
encouraged capital outflows. The interest equalization tax of 1963 was
lifted and the Eurobond market started flourishing. Side bys side there
was a revival of the market for foreign bonds in the U.S. regulation Q
regulated the interest rates that U.S. banks can pay on time deposits and
regulation M required U.S. banks to keep a stipulated percentage of cash
reserves against deposits, These restrictions encouraged U.S. banks and
multinational corporations to keep dollar deposits and borrow dollars
abroad.
Thus the main factors behind the emergence and growth of Eurodollar
market were the regulations imposed on borrower and lenders by the U.S.
authorities that motivated both banks and corporation to evolve Eurodollar
deposit and loans. The European and U.S. banks take deposits out of USA.
To place them in free centers in Europe. They for short-term lending or
for investment used these deposits with outside banks.
AcroPDF - A Quality PDF Writer and PDF Converter to create PDF files. To remove the line, buy a license.
MBA- H4030 International Business Finance
109
3. The Massive balance of payment surpluses realized by OPEC countries
due to sharp increase in oil prices (1973 and 1978) gave rise to what are
called “petrodollars”. These countries preferred to deposit such dollar
with financial institutions outside the US.
4. The efficiency with which it works and the lower cost has also contributed
to the growth of Eurodollar market. Large amounts of funds can be raised in this
market due to lower interest rated and absence of credit restrictions that market
much domestic market. The Eurocurrency loans are generally cheaper due to
small lending margins as a result of exemption from statutory cash reserve
requirements, absence of restrictions on lending rates, economies of scales etc.,
Thus these markets are not subject to national controls.
In sum Eurodollar market is the market for bank time deposits denominated
in U.S. dollar but deposited in bank outside the United States. Similarly
European, euro sterling, and so forth are simply deposits are denominated. The
Eurocurrency market is the market for such bank deposits. The Eurocurrency
market thus permits the separations of the currency of denomination from the
country of jurisdiction
Eurocurrency market that started in London found its way in other European
cities and in Singapore, Hongkong, Tokyo, the Cayman Island and Bahamas.
These markets consist of beside Eurodollar market. Asian dollar market Rio
dollar Market, European market as well as Euro sterling. Euroswiss francs euro
French Franc euro-D marks markets etc.,
International banks and foreign branches of domestic banks, private banks
and merchant’s banks are the main dealers on the market. In fact, most of the
AcroPDF - A Quality PDF Writer and PDF Converter to create PDF files. To remove the line, buy a license.

MBA- H4030 International Business Finance
110
U.S. banks deal in this market. The commercial banks in each of these markets
accept interest-bearing deposits denominated in a foreign currency and they lend
their funds either in the same country or in a foreign country in whose currency
the deposit is denominated. Over the years these markets have evolved
instruments other than time deposits and short-time loans. Those instruments are
certificates of deposits, euro commercial paper; medium to long-term floating
rate loans, Eurobonds etc., the market is of wholesale nature, highly competitive
and well connected by network of brokers and dealers
EUROCURRENCY FINANCE
The table below shows different types of finance available in euro currency
market.
1.SHORT-TERM 2.MEDIUM-TERM 3.LONG-TERM
(Unto 365 days) (2 to 10 years) (10 years above)
a) Euro loans from a) Syndicated Loans a) Euro Bonds
Banks
b) Euro commercial paper b) Revolving under writing b) Euro-equities
&Certificates of Deposits Facility
c) ------ C) Euro-Medium term Notes c)------
Short-term Finance
a) Euro Loans: These loans are made to the corporations in the requisite
currency by banks. These loans are essentially short-term accommodation
for periods less than one year. They are mostly provided in euro dollars. The
interest rates on these loans are based on the London Inter Bank offered rates
AcroPDF - A Quality PDF Writer and PDF Converter to create PDF files. To remove the line, buy a license.
MBA- H4030 International Business Finance
111
(LIBOR) for their respective currencies. LIBOR- represents a rate of interest
used in inter bank transactions in London. The rate for each currency is
arrived at as an average of the lending rates charged by six leading London
banks in the inter bank market. The borrowers of euro-loans are charged on
the basis of LIBOR + depending upon the six months floating interest rates
is charged. If these loans are for periods beyond six months, the loan is
rolled over and interest is charged on the LIBOR prevailing at the time of
rollover.
b) Euro commercial Paper (ECP): Euro commercial paper is a floating euro-
commercial promissory note. These notes are issued at discount on their face
value and such discount represents the profit to the investor. These ESP’s are
also issued for less than one year between 7 to 365 days. They offer a high
degree of flexibility to the borrower with wide ranging choice of amounts and
maturities. They are thus tailor made to take into account the specific needs of
the borrower. It is quite common for an ECP issuer to follow it up with Euro
Bond/Equity Issues. ICICI was the first Indian Institution to obtain finance
through ECP in 1987.
1) A certificate of deposit is similar to traditional term deposit but it is
negotiable and hence can be traded in the secondary market. It is often a bearer
instrument. There is only one single payment of principal and interest. The bulk
of the deposits have a short duration of 1,3 or 6 months. For CDs these is a fixed
coupon or floating coupon. For CDs with floating rate coupons its life is
subdivided into periods usually of 6 months. Interest is fixed at the beginning of
each period. The rate of interest is based on the prevailing market rate, which is
usually the LIBOR.
AcroPDF - A Quality PDF Writer and PDF Converter to create PDF files. To remove the line, buy a license.

MBA- H4030 International Business Finance
112
Medium Term Finance
a) Syndicate Loans: These are loans given by syndicates of banks to the
borrowers. They carry a variable rate of interest (LIBOR). They are tied
to specific project in case of corporations. Government can also borrow
syndicate loans. But such loans are not tied to specific projects. They can
be even used to meet balance of payment difficulties.
b) Revolving underwriting facility (RUF): A RUF is a facility in which a
borrower issues on a revolving basis bearer notes, which are sold to
investors either by placing with an agent or through tenders. The
investors in RUF undertake to provide a certain amount of funds to the
borrowers up to a certain date. The borrowers is free to draw down repay
and redraw the funds after giving due notice. The London branch of the
State Bank of India to an Indian borrower provided the first RUF in
1984.
c) Euro –Medium term notes (MTNs): The medium term notes have
maturity from 9months to 20 years. There is no secondary trading for
MTNs. Liquidity is provided by the commitments from dealers to buy
back before maturity at prices, which assure them of their spreads. These
are issued just like Euro-commercial paper. The issuer enjoys the
possibility of issuing them for different maturity periods. Companies use
these notes. The sums involved vary between $2 &$5 million.
AcroPDF - A Quality PDF Writer and PDF Converter to create PDF files. To remove the line, buy a license.
MBA- H4030 International Business Finance
113
Long Term Finance
The long-term credit may be in the form of euro-bonds and euro-equities,
which are known as euro-issues. We discuss here under the market for
eurobonds and euro equities
EUROBOND MARKET.
The last three decades have witnessed a fast growth of international bond
market. Corporate sector can raise long-term funds through the issue of
eurobonds. Eurobonds are debt instruments denominated in a currency and
issued outside the country of currency. Main borrowers in the Eurobond market
are companies, MNC, state enterprises, Governments and International
Organizations. Among the developing countries, the main International
Organizations. Among the developing countries the main borrowers have been
Argentina, Brazil, Chile, Hong Kong. Ivory Coast, Koreas, Malaysia, etc,.
Lately India has also joined the list of borrowers.
Investment and institutions make investment in Eurobonds. Institutional
investment comes from pension funds of west European nations, U.N. agencies,
mutual funds of continental European banks and merchant bankers.
The Main currencies in which borrowings are made are U.S.$ Gilder,
Candian dollar, French Franc, Swiss Franc and Japanese Yen.
Euro-bond is similar to domestic bonds/debentures sold in domestic capital
market. Unlike domestic bond markets, Euro-bond market is free from official
regulations; instead it is self-regulated by the Association of International Bond
AcroPDF - A Quality PDF Writer and PDF Converter to create PDF files. To remove the line, buy a license.
MBA- H4030 International Business Finance
114
dealers. The prefix euro indicates that the bonds are sold outside the countries in
whose currencies they are denominated.
Two kinds of bonds are floated in internal bond market.
• Euro-bonds underwritten by an international syndicate and placedon the market of countries other than that of the currency inwhich the issue is made.
• Foreign bonds issue on the market of a country and bought bynon-residents in the currency of that country.
Foreign Bonds
These are bonds issued by borrowers outside their domestic capital
market underwritten by a firm that is situated in the foreign market. These bonds
are denominated in the currency of the market in which they are issued. At times
they may be denominated in another currency. Thus a foreign bond is issued by
foreign borrowers and is denominated in the currency of the country in which it
is issued. U.S.A., Japan, Switzerland, Germany and U.K. allow foreign
borrowers to raise money from their residents through the issue of foreign
bonds.
Foreign bonds are referred to as traditional international bonds because
they existed long before eurobonds. Yankee bonds are foreign bonds issued in
the United States. Foreign bonds issued in U.K. re called Bulldog bonds. Those
issued in Japan are called Samurai bonds.
Immediately after the Second World War, USA was the primary market
for foreign bonds. Due to interest Equalization Tax imposed in 1963 much of the
AcroPDF - A Quality PDF Writer and PDF Converter to create PDF files. To remove the line, buy a license.

MBA- H4030 International Business Finance
115
dollar denominated bonds moved to the Eurobond market. The market trend is
that borrowers prefer Euro market rather than the U.S. market.
Foreign organizations other than U.S. have extensively floated dollar
bonds in the United States taking advantage of the well-developed capital
market. US multinational raised substantial amounts of capital during 1970s by
issuing bonds denominated in D-mark in Germany and bonds denominated in
Swiss Francs in Switzerland.
Eurobond
A Eurobond is to be distinguished from a foreign bond in that it is
denominated in a currency other than the currency of the country in which it is
issued. Eurobonds are sold for international borrowers in several markets
simultaneously by international group of banks.
The same causes, which led to the growth of Eurocurrency market, have
also contributed to the development of Eurobond market. But the size and
growth rate of this market are modest compared to Euromarket. Yet, it has
established itself as a major source of financing for multinational corporations.
Besides MNCs, private enterprises, financial institutions, government and
central banks and international financial institutions like the World Bank are the
principal borrowers. They issue these bonds.
Institutional investors such as insurance companies, mutual funds,
pension funds etc are the principal buyers/investors. Leading multinational bank
and brokerage house also act as lenders. Since it is free from regulations that
characterize the US. Market, MNCs exploits the control-free environment. An
AcroPDF - A Quality PDF Writer and PDF Converter to create PDF files. To remove the line, buy a license.

MBA- H4030 International Business Finance
116
international syndicate representing major European banks and European does
underwriting of bond issue and foreign branches of US banks with participation
from banks in other financial centers in Asia, the Middle East, and the
Caribbean’s as well as large international securities firms.
Growth of Eurobond Market
The Eurobond market started flourishing due to some special advantages
which are not available to either the domestic or foreign bond market. They are:
1. The Eurobond market like the Eurocurrency market is an offshore
operation not subject to domestic regulations and controls. Domestic
issues of bonds denominated in local currency are subject to several
regulations. Eurobond issued is not subject to costly and time consuming
registration procedures. In the USA securities exchange commission
procedures are applicable both to the domestic and foreign bonds issued
in United States. Disclosure requirements are less stringent to eurobonds.
There fore many MNCs which do not which to disclose information
resort to eurobonds issue.
2. Eurobonds are issued in bearer form. This will facilitate their easy
negotiation in the secondary market. These bonds are not available to US
resident when issued. But they could purchase them after a cooling-off
period.
3. Eurobond holders are not subject to income tax withholding on the
interest received when they cash their interest coupons. But such
withholding applies to non-resident investors in domestic and foreign
bonds issued in USA. That is why, many U.S, MNCs use their
subsidiaries to issue eurobonds to reduce their borrowing cost.
AcroPDF - A Quality PDF Writer and PDF Converter to create PDF files. To remove the line, buy a license.

MBA- H4030 International Business Finance
117
Types of Bonds
There are different types of innovative bonds.
1. Straight Bonds: These bonds have fixed maturities. Interest payments
are made at intervals of one year. These bonds are also issued on a
perpetual basis. Bullet bonds provide repayment of the entire principal
amount on a single maturity date. Full or partial redemption before fixed
maturity date is also permitted.
2. Convertible Bonds: In addition to straight bonds convertible bonds or
bonds attached with warrant are issued. Both these bonds can be
converted into equity of the issuing company at a pre-specified
conversion ratio.
3. Floating Rate Note: To overcome the risk arising out of volatility of
interest rates bond s is also issued in the form of floating interest rate
bonds. Since the interest rate can be adjusted according to the market
rates, these bonds have become popular. Multinational financial
institutions prefer to participate in this market rather than in syndicated
Eurocurrency loans.
4. Multicurrency Bonds: Multiple currency bonds and currency cocktails
are another innovation in bond issues. Multiple-currency bond entitles
the holders to receive interest and principal in any of the specified
currencies whose exchange rate are established at the outset. It is
advantageous to the investor because he can ask for payment in the
currency, which appreciated most. International bonds denominated in a
AcroPDF - A Quality PDF Writer and PDF Converter to create PDF files. To remove the line, buy a license.
MBA- H4030 International Business Finance
118
currency cocktail, such as European Currency Unit (ECU), afford
protection to the investor against exchange rate fluctuations.
5. Convertible Bonds: Another interesting variation of bond issue –dual or
multiple currency bonds with the convertibility provision. For example a
Swiss MNC may issue a Eurodollar bond that entitles the investor to
convert into share of the company denominated in Italian inter lea at a
specified conversion ratio. The fortune of the investor depends, among
other things on the movement of US dollar/Swiss franc exchange rate.
The dual currency eurobonds majority of which are yen/dollar bonds
have been around for a few years. These bonds are denominated and serviced in
Japanese Yen, but are redeemable in US dollar at the exchange rate fixed at the
time of issue.
6. Bonds with Equity Warrants: Another innovation is the so-called
‘wedded warrants’, which were issued by a French company in 1985.
These are 10-year bonds called after 5 years with warrants which give
the holder the option to buy identical but non-callable bonds. For the first
five years the warrants are ‘wedded’ to the original bonds. If the
bondholder wants to exercise these warrants during this period, the
holder must sell the original bonds back to the borrower. During the
second 5 years period, the warrants are divorced from original bonds.
Hence the bonds can be acquired for cash.
7. Zero coupons Bond: These bonds are sold at discount. Hence no interest
is paid. Issues prefer them because they need not pay interest at
AcroPDF - A Quality PDF Writer and PDF Converter to create PDF files. To remove the line, buy a license.

MBA- H4030 International Business Finance
119
periodical intervals. Investors especially from those countries which
exempt capital gains or tax at lower rates find them attractive.
Despite all these innovations straight or fixed rate Eurobonds continue to
account for a major share in bonds issue. Next come the floating rate bonds;
convertible bonds and bonds with warrant account for a small portion of the
total market.
EQUITY MARKET
Investors in many countries have been exhibiting interest in acquiring
equity investments outside their countries. Investment in foreign equity is of two
types- direct investment (DI) and portfolio investment. Individuals and
multinational corporations make investment in listed equities of foreign firms.
While individual investors acquire shares as investment, multinational
corporations invest in shares of a company of a foreign country so as to acquire
a controlling interest over management. They may even start subsidiaries in
foreign countries with 100 percent equity ownership. These are all called direct
foreign investments.
Institutional investors like pension’s funds, mutual funds, investment
companies etc., and share like listed in stock exchanges to derive benefits from
international portfolio diversification.
The existence of a well-developed secondary market is a pre-requisite for
investing in equities of companies by foreign investors. Organized exchanges
are found in Australia, Belgium, Canada, France, Germany, the Netherlands,
Hong Kong, Italy, Japan, Singapore, South Africa, Sweden, Swizerland and
United Kingdom, beside USA. But trading in many exchanges is often restricted
AcroPDF - A Quality PDF Writer and PDF Converter to create PDF files. To remove the line, buy a license.

MBA- H4030 International Business Finance
120
to a handful of companies, which dominate the market. A company can raise
equity capital in international market in two ways:
1. By issuing shares in Euro market which are listed on the foreign stockexchange.
2. Through the issue of America Depository Receipt (ADRs) or European
Depository Receipt EDRs or Global Depository Receipts (GDRs).
Major companies today to not ignore equity markets outside their
countries while embarking on a substantial issue of shares. Particularly non- US
multinationals have found that the domestic markets cannot cater to their
financial needs; hence they are searching for equity funds from foreign
investors. Moreover they have found that from domestic equity markets. This
tendency is strengthened by the fact that institutional investors have been paying
attention to international diversification of portfolio investments.
Notable example of internationalization of the equity base is that of
Philips, a Dutch Electrical company. With the starting of new subsidiaries in
foreign countries, it had to raise resources through equity issue to match its
multinational operations. It started the process in early 1980s.
The expansion of the Euro-equity market has been facilitated by a
number of factors and innovations. They are:
1. International syndicates of banks to act as lead managers and brokerage
firms that are capable of handling wuro-issues within short period of
time have emerged.
2. Syndication and distribution fees for euro equities are much lower
compared to domestic issues.
AcroPDF - A Quality PDF Writer and PDF Converter to create PDF files. To remove the line, buy a license.

MBA- H4030 International Business Finance
121
3. Innovative approached to investment in foreign equities have been made
to overcome stringent regulations in the U.S. firms and U.S. MNCs
desiring to avoid lengthy and costly registration requirement for
domestic equity issues started issuing new instruments.
The new innovations are American Depository Receipt (ADR) and
American Depository Shares (ADSs).
American Depository Receipts (ADRs)
These are the certificates denominated in dollars issued by a US. Bank
on the basis of a foreign equity it holds in custody in one of the branches abroad,
usually in the home country of the issuer. This system was developed abroad,
usually in the home country of the issuer. This system was developed by
Morgan Guaranty Trust Company of New York on 1981 to facilitate the trading
of foreign securities in the U.S. The ADR represents a convenient way for a US
investor to buy foreign equity shares that were not listed in US Exchanges. The
investor can receive dividends in dollars without bearing foreign taxes or being
subject to exchange regulations. The system also permits transfer of ownership
of this receipt in the US without the physical transfer of ownership of this
receipt in the US without the physical transfer of the underlying shares. Because
the underlying shares are not subject to US Securities and Exchange
Commission (SEC) registration procedure, they have become more attractive.
Issues traded outside the US were called International Depositary Receipt (IDR)
issues.
AcroPDF - A Quality PDF Writer and PDF Converter to create PDF files. To remove the line, buy a license.

MBA- H4030 International Business Finance
122
The American depository shares (ADS) are similar to ADRs. They are
also the stock ownership certificated issued in the US by a transfer agent or a
trustee acting on behalf of the foreign issuer.
GLOBAL DEPOSITORY RECEIPTS (GDRS)
GDRs are traded and settled outside the US. However, the SEC permits
the foreign companies to offer their GDRs to certain institutional buyers. The
Government of India contemplated in 1991 to permit Indian companies to issue
equity and equity related instruments in the form of GDRs and convertible
bonds. A detailed notification was form of GDRs and convertible bonds. A
detailed notification was issued in November 12, 1993 outlining the scheme for
the issue of GDRs and foreign currency convertible bonds. The scheme came
into force effective from April 1, 1992. In terms of guidelines issued by the
Union Ministry of Finance in November 1993, Indian companies have been
permitted to raise foreign currency resources through the issue of foreign
currency convertible bonds (FCCBs) and equity shares under the global
depository receipt (GDR) mechanism to foreign investors, both individual and
institutional investors.
A Global Depository Receipt is a dollar denominated instrument traded
on a stock exchange in Europe or the US or Both. Each GDR represents a
certain number of underlying equity shares. Though GDRs are quoted and
traded in dollar terms the underlying equity shares are denominated in rupees.
An Indian company issues the shares to an intermediary called the
depository (a Euro bank) in whose name the shares are registered. It is the
depository, which subsequently issues the GDRs. The physical possession of
equity shares is with another intermediary called the custodian, which is the
AcroPDF - A Quality PDF Writer and PDF Converter to create PDF files. To remove the line, buy a license.

MBA- H4030 International Business Finance
123
agent of the depository. Thus while a GDR represents issuing companies shares
it does have a distinct identity. In fact it does not figure in the book of the issuer.
For Explanatory purpose, we may cite the case of reliance industries ltd,.
Which was the first Indian company to make GDR issue in May 1992? Each
GDR represent two shares of RIL. The issue price of each GDR was fixed at
$16.35 equal to Rs.245 per share. The GDR can be traded world wide in all the
stock exchanges.
The FCCB and GDRs may be denominated in any freely convertible
currency. However, the ordinary shares underlying the GDR and the shares
issued upon conversion of the FCCBs will be denominated only in Indian
currency. The GDRs issued under the scheme may be listed on the overseas
stock exchanges or over the encounter exchange or through book entry transfer
systems prevalent abroad and receipt may be purchased, possessed and freely
transferred by a person who is a non-resident. With the adoption of liberalization
policies by the Indian Government in June 1991, Indian corporate sector started
launching big projects. There has been an around expansion in the industrial
sector. In many cases the project sizes are such the required finance cannot be
raised in the Indian capital market. The companies had to tap off-shore funds.
Further more; the interest rates prevailing in Euromarkets are comparatively
lower, leading to saving in interest costs. Some companies have taken recourse
to euro-issues to repay the Indian currency debt to improve their profitability. In
the case of convertible bonds the shares can be issued at a premium at the time
of conversion. This would lessen the cost of capital to the company. These
schemes become possible because of a major development in international
capital markets in recent years- increasing interest among international investors
in emerging markets. A few east European countries in Asia and Latin America
AcroPDF - A Quality PDF Writer and PDF Converter to create PDF files. To remove the line, buy a license.

MBA- H4030 International Business Finance
124
follow the major emerging markets. India has been identified as an important
emerging market on account of the large size of its economy, its active capital
market as well as its recent effort at globalization.
Guidelines for Euro-Issues
The Government of Indian notified on November 12, 1993 a scheme for
facilitating the issue of foreign currency convertible bonds (FCCBs) and
ordinary shares through GDR mechanism. According to the above notification,
the scheme came into force on April 1, 1992.
The eligibility criteria under the scheme are:
1. A company involved in priority sector industries, which wants to issue
FCCBs or equity shares through GDR, is requires to obtain prior permission of
the department of economic Affairs, Ministry of Finance. In other cases the
companies well need to obtain the permission of foreign Investment Promotion
Board clearance. An issuing company shall have a consistent track record of
good performance for a minimum period of 3 years. On this basis only the dept.
of economic affairs gives the approval for finalizing the issue structure.
2. On the completion of finalization of issue structure in consultation
with the lead manger to the issue, the company shall obtain final approval form
the dept. of economic affairs to proceed ahead with the issue.
The other salient features of the guidelines are: (i) The aggregate foreign
investment made either directly or indirectly through GDR mechanism shall not
exceed 51% of the issued and subscribed capital of the company. Ordinary
shares and FCCBs issued against GDRs shall be treated as foreign direct
investments.
AcroPDF - A Quality PDF Writer and PDF Converter to create PDF files. To remove the line, buy a license.
MBA- H4030 International Business Finance
125
The above guidelines were modified on May 1994. They were revised
again in June 1996.
1. There will be no restriction on the number of euro issues made by a
company in a year. In the previous guidelines, one company could make at most
one euro issue in a year.
2. The pre-requisite of having a minimum track record of profitability of
three years has been relaxed for companies engaged in infrastructural industries
such as power generation, telecommunications, petroleum refining, port, roads
and airports. Companies engaged in other industries will have to satisfy the three
year track record of profitability as earlier.
3. Bank financial institutions and non-banking finance companies
registered with the RBI will be allowed access to the euro issue market.
4. The Government has allowed 25%of the GDR or FCCs capital
requirements as against 15% earlier. The other approved end-use methods
remain, namely, financing capital goods imports, financing domestic purchases
of plant, equipment and buildings, prepayment or scheduled repayment of earlier
external borrowing and making investment abroad where these have been
approved by competent authorities.
5. The deployment of euro issue proceeds in the stock market or in real
estate has been banned.
AcroPDF - A Quality PDF Writer and PDF Converter to create PDF files. To remove the line, buy a license.

MBA- H4030 International Business Finance
126
INTERNATIONAL FINANCIAL SYSTEM: UNIQUE MARKETS
FOREIGN EXCHANGE MARKET:
The functions of foreign exchange markets-conversion of currencies,
obviously, one currency can be converted into another only if the exchange rate
is known. It is the functions of foreign exchange markets to establish these
exchange rates dependent on the forces of demand and supply. With the future
movements in exchange rates being highly uncertain it is clear that holder of
foreign exchange faces the risk of adverse movements in the exchange rate.
Event those who have to receive a specified amount of foreign currency
sometime in the future face the risk of downward movement in the exchange
rate.
So, there have developed what we call ‘forward’ and ‘future’ markets to
tackle the uncertain movement in exchange rates.
FORWARD MARKET:
A forward market for foreign exchange is simply a market for foreign
currencies that are to be delivered in the future. The operations can be compared
with the forward market for commodities, which allows purchases and sales one
any forward date. Forward markets enable participants to cover or hedge against
the risk that exchange rated will vary during a [particular period, i.e., the rated at
which currencies will be exchanged in future are decided in advance. Such rated
are called forward rates.
All of us know that money has time value, as it is capable of earning
interest. Hence, the differential between present market rates and forward rates
AcroPDF - A Quality PDF Writer and PDF Converter to create PDF files. To remove the line, buy a license.
MBA- H4030 International Business Finance
127
will usually reflect the differential interest rates in the two currencies. What is
more important, however is that some degree of certainty has been introduced,
though at a cost,. The cost is the difference between the spot rated and the
forward rate for that currency. They may be intermediaries, such as bank
involved in bringing together the parties to a forward transaction
FUTURES MARKET:
Future markets allow additional facilities as compared to forward
markets. The crucial advantage is that of tradability. Such contracts are openly
traded on organized exchanges. Tradability is made easier by specifying
standard sizes and settlement dates for future contracts.
It is worth mentioning here that there is three other markets that have
gained importance in the recent past as crucial components of the international
financial system.
These three are: Option market, Euro market and inter bank market
OPTIONS MARKETS
The options market is another market to hedge risks arising form
variable exchange rates. Here risk is traded separately from the financial
instrument carrying this risk
What takes place at the options market?
First, let us concentrate on the word options. An option, by definition, is
a choice available to the investor. What is the choice regarding?
AcroPDF - A Quality PDF Writer and PDF Converter to create PDF files. To remove the line, buy a license.

MBA- H4030 International Business Finance
128
The choice, dependent on a pre-specified price, is regarding honoring the
contract to buy or sell a currency at some future date. Thus in a contract to buy,
if the market price prevailing at that future date is higher than the pre-specified
price, one will go in for the purchase of the currency at the contract price, ie., the
contract will be honored. However, if the market price at that date is lower than
the contract price, it would be advantageous not to honor the contract. The
reverse is the position in the case of a sale contract.
Now, you will remember that this facility is not available in the forward
market. Both future market and options market have grown to provide the much-
needed flexibility to the forward market
Cross-border dealing between market participants, more so between
institutional players, has lead to the development of Euro market. These are
market without any nationality, that is financial instruments is such markets are
denominated in currencies different form the currency of the country where the
market. For example, dollar deposits that are accepted by an American bank in
London are Euro dollars. Such marker’s are also free from national regulations
and there by enjoy a great degree of independence. Users of Europe markers
therefore are able to move funds at their discretion.
The Euro market can be loosely divided into a Euro currency market for
short-term finance and a Eurobond markets for longer-term financing
A loan raised in the Euro currency market normally has maturates up to
six months, though facilities for medium-term financing are also becoming
available. With the Euro currency market, the most important and widely used
currency is the Eurodollar, which is largely a reflection of the economic
importance of USA in the world economy.
AcroPDF - A Quality PDF Writer and PDF Converter to create PDF files. To remove the line, buy a license.

MBA- H4030 International Business Finance
129
Eurobonds are denominate in one or more of the Euro currencies and arranged
by international underwriting syndicated or investment banks. They can be sold
in several countries simultaneously so that not only the underwriters but also the
investors come from many countries.
INTERBANK MARKET
In foreign exchange market’s, as you will recall, different currencies are
traded. But except in some European centers, one does not see, the market
anywhere. This is because most participants in the foreign exchange market find
it convenient to conduct their business via the large commercial banks. It is
these banks that comprise the inter bank market.
Most large corporations find that the inter bank market provides a
reasonably priced service that is not worth by passing with other arrangements
for direct access to the foreign exchange market. The role of bank is to act as
‘market makers’ that is they stand ready to by and sell foreign currencies.
Hence we can define and inter bank markets as one where dealings in
foreign currencies take place between banks themselves. Most of the inter bank
business is conducted by a small number of banks that have a worldwide
network of branched. Is their room for more? Well as international trade grows,
more and more banks will find it profitable to develop the expertise to handle
foreign currencies
AcroPDF - A Quality PDF Writer and PDF Converter to create PDF files. To remove the line, buy a license.

MBA- H4030 International Business Finance
130
INNOVATIONS IN FINANCIAL INTRUMENTS
The uncertainty in the movement of foreign exchange rates has, as
explained earlier led to the development of various markets such as the forward
market, futures markets, options market, Europe market and the inter bank
market. New financial instruments have also been introduced in response to the
uncertain movement in exchange rates. The objective was to maintain the
attractiveness of long-term instruments, as these were the one, which faces
increased uncertainty and volatility in exchange rates.
Floating Rate Notes (FRS)
Floating rate notes were first issued in 1978 in the Euromarkets. But just
what are floating rate notes?
Floating rate notes are debt instruments on which interest rates are set
usually semi-annually, at a margin above a specified inter bank rate. The usual
benchmark is the London inter bank offered rate (LIBOR). Because the interest
rate payable on the instrument rises with the general rise in interest rates as
indicated by LIBOR or some other inter bank market rate, the investor risk to
that extend minimized.
So we see the risk due to the adverse movement in exchange rates is
reduced owing to the changing interest rate payable on the instrument.
Multiple Currency Bonds:
Multiple currency bonds are denominated in cocktails of currencies.
They are popular because they reduce currency risk below the level that would
prevail if the bond were denominated in a single currency. Depreciation of one
AcroPDF - A Quality PDF Writer and PDF Converter to create PDF files. To remove the line, buy a license.

MBA- H4030 International Business Finance
131
currency can be offset against appreciation in other over the maturity of the
bond.
You wonder in what currency the investor is paid at the expiry of the
maturity period of the instrument.
Well the investor is paid according to the contractual agreement, which
may stipulate payment in one or several currencies.
Zero Coupon Bonds
Zero coupon bonds are just what they state. They carry no coupon
payments or interest payments over the life of the instrument.
Then why does anyone want to purchase these instruments?
The answer is the deep discount at which instruments are sold in the
market place. The payment at maturity will be the face value of the instruments;
the difference between the purchase price and the repayment value amounting to
implicit interest. Therefore, this bond is useful for an investor who wishes to
hold the instrument until maturity and avoid frequent reinvestment of interest
payment. Some tax advantages may also be available.
Bonds with Warrants
These are fixed rate bonds with a detachable warrant allowing the
investors to purchase further fixed rate bonds at a specified rate at or before a
specified future date. The investor holding this warrant has the option of holding
it until maturity or of selling it in what is called a ‘derivative market’.
AcroPDF - A Quality PDF Writer and PDF Converter to create PDF files. To remove the line, buy a license.

MBA- H4030 International Business Finance
132
This is a new term, isn’t it?
Let us know its meaning first.
A derivative market is one in which risk is traded separately from the
financial instrument. Example are warrants of course; but besides that we have
options- a term you have come across before as also swaps about which you will
learn more in the subsequent paragraphs.
The value of the warrant you would agree depends on interest rate
movements. If interest rates rise sharply subsequent to the issue of bonds, there
obviously will not be buyers to purchase this bond. The value of the warrant
then shall become zero.
Convertible Bonds
A convertible bond comprises an ordinary bond plus an option to convert
at some data into common stock or some other tradable instrument at a pre-
specified price. The option by the investor shall be exercised only if the market
price at the date of conversion is higher than the pre-specified price.
The advantage derived from conversion is likely to eliminate the cost of
uncertainty arising from variable exchange rates.
Swaps
Swaps have gained immense importance in the derivative market. This is
because swaps allow arbitrage between market, between instruments, and
between borrowers without having to wait for the market themselves to cast
down the barriers. There are as many different swap arrangements as there are
AcroPDF - A Quality PDF Writer and PDF Converter to create PDF files. To remove the line, buy a license.

MBA- H4030 International Business Finance
133
varieties of debt financing and with the volatile exchange rates of the 1980s,
demand for them is high
Here we shall describe the basics of two kinds of swaps: interest rate
swap and currency swap.
In an interest rate swap, two unrelated borrowers borrow identical
amounts with identical maturates from different lender and then exchange the
interest repayment cash flow via an intermediary which may be a commercial
bank
The currency swap operated in a similar fashion to the interest rate swap
but each party becomes responsible for the others currency payments. The
currency swap principle can therefore be used by bower’s to obtain currencies
form which they are otherwise prevented because of excessive costs or foreign
exchange risk
One must remember that the above list of variations on the basic bond
market is not exhaustive. With growing uncertainty the number of new
instruments also is growing. The nineties will definitely see much newer
innovations compared to the eighties. Already, we have instruments like swap
options, ie., options on swaps.
AcroPDF - A Quality PDF Writer and PDF Converter to create PDF files. To remove the line, buy a license.

MBA- H4030 International Business Finance
134
Self-Assessment Questions
1. What are the different other foreign markets?
2. Explain briefly the origin and growth of Eurodollar Market?
3. What are the different types of Euro Finance?
4,.Explain the following short questions.
(a)American Depository Receipt (ADR)
(b)Global Depository Receipt (GDR)
5. What are the recent Innovations in financial Instruments?
6. What are the different financial instruments in the financial markets?
FURTHER READINGS
Apte, PG, 1995, International Financial Management, Tata Mc Graw hill, New
Delhi.
Bhalla, V.K. and S.shiv Ramu, 1996, International Business, An mol, New
Delhi.
J.V.Prabhakara Rao, R.V.Rangachary, International Business, Kalyani
Publishers, 2000.
V.A.Avadhani, Marketing of financial services, Himalaya House, year-2002.
AcroPDF - A Quality PDF Writer and PDF Converter to create PDF files. To remove the line, buy a license.

MBA- H4030 International Business Finance
135
Lesson No: 3
FOREIGN CAPITAL FLOWS
With the globalization of financial market private capital has now been
moving around the world in search of highest returns. Capital crosses boarder of
a country more easily than labor. The growth in the flow of foreign capital has
become possible only because investment policies in the western countries have
changed to allow higher investments, including portfolio investments abroad.
The structural adjustments, following economic reforms, reduction in budget
deficits, restructuring of public sector, relaxation of trade and exchange controls
etc., have created a favorable climate for capital inflows into many developing
countries like India.
Capital owners are, first and foremost looking for good returns and at the
same time they are deeply concerned with risks. The attractions for them are: (i)
good in fracture (ii) a reliable and skilled lab our force, (iii) guarantees of their
right to repatriate both income and capital (iv) social and political stability. (v) A
tradition of prudent fiscal management and (VI) deep links with global markets.
Foreign capital inflow may broadly be classified into three types
1. Portfolio investment by foreign institutional investors.
2. Direct foreign investments.
3. Capital raised by domestic companies through euro-issues
PORTFOLIO INVESTMENT
Foreign Institutional Investment means investment made by foreign
institutions such as pension fund, mutual funds, investment trust, Assets
AcroPDF - A Quality PDF Writer and PDF Converter to create PDF files. To remove the line, buy a license.
MBA- H4030 International Business Finance
136
Management companies and other specified institutions, in the securities traded
on the domestic primary and secondary market. In the case of India, securities
include shares, debentures, warrants other schemes floated by domestic mutual
funds and other securities specified by the government of India from time to
time. These are regarded as portfolio investment from point of view of FIIs since
they do not grant them any managerial control. Although Government of India
treats investments in foreign currency convertible bonds and global depository
receipt underlying by FIIs direct investment, there are portfolio investment from
the point of view of FIIs. These institutions investors make such investment not
with a purpose of acquiring any managerial control over Indian companies but
with the object of securing portfolio diversification. If investments are made
with the object of acquiring managerial control, they are treated as foreign direct
investments. Portfolio Investment, that is investment made in securities of
different companies and in different countries is made to diversify the portfolio
of investment to secure higher returns at the same time minimizing risks.
The investment made by foreign institutional investors thus becomes
portfolio investment. The investors make investment in securities of different
companies in the same country and indifferent countries; they thus diversify
their securities portfolio. Investment no doubt brings returns. But there are risks
associated with every investment. Prudent investors know that diversifying their
investment across industries leads to lower level of risk for a given level of
expected return. It is a well known proposition in portfolio theory that whenever
there is an imperfect correlation between return risk is reduced by maintaining
only a portion of wealth in any security when securities/assets available for
investment are expanding an investors or can achieve a maximum return for
given risk or minimum risk for a given expected portfolio return. The broader
the diversification, the more stable the return and the more diffusion of the risks.
AcroPDF - A Quality PDF Writer and PDF Converter to create PDF files. To remove the line, buy a license.

MBA- H4030 International Business Finance
137
The advantages of diversification of portfolio of domestic securities are
limited because all companies in a country are more or less subject to the same
cyclical economic fluctuations. Through international diversification that is, by
diversifying investment in securities of companies in different countries,
investors can achieve a better trade off between return and risk. Country risk and
foreign exchange risk, like business risk can be diversifies by holding securities
of different countries denominated in different currencies. The benefit of
international diversification will increase if the securities portfolio covers not
only equities but also bonds.
Instead of buying foreign equities and bonds overseas, investors can buy
foreign and bonds in their home market in the form of American Depository
receipt (ADR) and Global Depository receipt. ADRs are certificate of ownership
issued by U.S. bank in the form of depository receipt representation one or more
underlying foreign shares it holds in custody. ADRs for about 825 companies
from 33 foreign countries are traded currently on U.S. foreign companies prefer
to raise funds in Euro market through Global Depository Receipt (GDR). The
modus Operendi for the issue of GDRs is already explained in the chapter on
“International Financial Market”.
The easiest way to investing abroad is to buy shares in an international
diversified mutual fund. There are four basic categories of mutual funds that
invest abroad.
1.Global funds can invest anywhere in the world, including the U.S.
2.International funds invest only outside the U.S.
AcroPDF - A Quality PDF Writer and PDF Converter to create PDF files. To remove the line, buy a license.
MBA- H4030 International Business Finance
138
3. Regional funds focus on specific on specific geographical areas overseas,
such as
Asia or Europe.
4.Asingle country funds invest in individual countries such as Germany or
Taiwan.
DIRECT FOREIGN INVESTMENT (DFI)
Balance of payment accountants define direct foreign investment “as any
flow of lending to, or purchase of ownership in a foreign enterprise that is
largely owned by the residents of the investing company.” The proportions of
ownership that define “largely “ vary from country to country.
The most distinguishing feature of DFI is the exercise of control over
decision-making in an enterprise located in one country by investors located in
another country. Although individuals or partnerships may make such
investment, most of them are made by enterprise, a large part by MNCs. We
may here note the difference portfolio investment and direct investment. In
direct investment the investor retains control over the invested capital. Direct
Investment and management go together. With portfolio investment, no such
control is exercised. Here the investor lends the capital in order to get a return on
it. But has no control over the use of capital.
Direct investment is much more than just a capital movement. It is
accompanied by inputs of managerial skill, trade secrets, technology, right5 to
use brand names and instructions about which markets to pursue and which to
avoid. The classical examples of FDI is a multinational entriprise starting a
foreign subsidy with 100% equity ownership or acquire more than 50% equity in
a domestic company so that it will have control over managerial decisions.
AcroPDF - A Quality PDF Writer and PDF Converter to create PDF files. To remove the line, buy a license.

MBA- H4030 International Business Finance
139
Obviously a MNC could not come into existence without having direct
investment. These enterprises essentially own or control production facilities in
more than one country. At times, the strategy of a multinational is to enter into
joint ventures with domestic firms as well as MNC. By such arrangements,
divergent resources and skill can be merged. Domestic companies can establish
themselves in new markets and gain access to technology. That might not
otherwise be available. But one difficulty with joint venture is fogging a
consensus with representatives of both companies sitting on the board of
directors. We may cite the case of Maruti Udyog a joint venture of Government
of India and Suzuki of Japan having differences over the appoint of Managing
Director
Guide lines for specific sectors
The preceding paragraphs have listed the general policies and rules that
govern the FDI. However, special packages of policies and incentives have been
evolved for some key sectors of the economy.
Some of the areas where indicative guidelines have been laid down for
maximum FDI contributions are: Power (100 percent), telecommunication
services such as basic telephony and cellular mobile and paging services (49 %),
petroleum sector (100%), roads and highways (100%) and tourism (100%).
Enhancement of foreign equity in existing companies
An existing company engaged in manufacture of items included in the
priority, which have foreign holding less than 74%/51%/50%, may also increase
its foreign holding to the allowed level as part of its expansion programme,
which should relate to the priority sector items. The additional equity should be
AcroPDF - A Quality PDF Writer and PDF Converter to create PDF files. To remove the line, buy a license.

MBA- H4030 International Business Finance
140
part of the financing of the expansion programme and the money to be remitted
should be in foreign exchange. It is not necessary that the company should be
exclusively engaged in the priority sector activities specified, only the proposed
expansion must relate exclusively in high priority industries may increase its
foreign equity to the maximum allowed level without any expansion
programme. The increase in the equity level must result from expansion of the
equity base of the existing company and the additional equity must be form
remittance of foreign exchange
The proposals meeting the above conditions can be submitted to the RBI
for automatic approval. Other proposals for inducting or raising foreign equity in
an existing company, will be subject to prior approval of the Government and
should be addressed to the SIA.
An application for raising foreign equity in an existing Indian company
has to be accompanied by a board resolution and approval by the shareholders of
the company through a special resolution for preferential share allocation to
foreign investors. Every preferential allotment of shares by companies other
than allotment of shares on a right basis, by listed companies to foreign investors
will be the market price of the shares according to SEBI guidelines
Foreign investment in EPZs/EOUs
In the case of export processing zones (EPZ) units/100% oriented units
foreign participation may be up to 100% of equity. In the case of units set up in
EPZs, the respective Development Commissioner grants approvals, while for
100% EOUs approvals are granted by the SIA.
AcroPDF - A Quality PDF Writer and PDF Converter to create PDF files. To remove the line, buy a license.

MBA- H4030 International Business Finance
141
Majority foreign equity holding up to 51% Equity is allowed by the RBI for
trading companies primarily engaged in export activities. Such trading
companies will be treated on a par with domestic trading and export housed in
accordance with the extent Export/Import policy and the company will have to
register itself with the Ministry of commerce as registered exporter/importer.
In case of existing companies, already registered as an export house, a
trading house or a star trading house, the RBI will give automatic approval for
foreign
Investment upto 51 per cent equity, subject to the provision that the company
passed a special resolution for preferential allocation of fresh equity to the
foreign investors.
Foreign investment in SSI sector
To provide access to the capital market and to encourage modernization
and technological up gradation in the small scale sector, foreign equity
p[participation to the extent of 24 percent of the total share holding has been
allowed.
The policy on the opening of branches by foreign companies has been
liberalized. Foreign companies engaged in manufacturing and trading activities
abroad are permitted by the RBI to open branch offices India for the purposes of
carrying on the following activities:
(a) To represent the parent company/other foreign companies in various matters
in India, For example, acting as buying/selling agents in India; (b) To conduct
the research work in which the parent company is engaged provided the result of
AcroPDF - A Quality PDF Writer and PDF Converter to create PDF files. To remove the line, buy a license.

MBA- H4030 International Business Finance
142
the research work are made available to the Indian companies; (c) To undertake
export and import trading activities; (d) To promote technical and/or financial
collaboration between Indian companies and overseas companies.
Short-Term Capital Flows
Besides the long-term capital flows in the forms of direct and portfolio
investments abroad, there is a flow of capital among nations for a short period as
well. These flows take the forms of export credit and loans, Imports debts, banks
deposits, and commercial papers held abroad, foreign currency holdings and
obligations, etc., Incidentally, you may note that the difference between long
term and short term capital flow is one the basis of instruments rather than the
intentions of the investor
The short- term capital flows across nations take place due to a variety of
factors. Further, the determinant of these flows depends on the type of the flow.
In order to explain their determinants, it is convenient to divide the short-term
flow into three categories, viz, trade capital, arbitrage and speculative. The
motives behind each of these flows and their determinants are explained below.
Trade Capital
Exports and imports are negotiated both on down payments as well as on
credits. When down payments are made, bank deposits in exporting country’s
currency increase while those in importing countries currency decrease. In the
case of transactions on credits, accounts a receivable /payables increase. Since
these accounts are usually payable within one year they are included in short
term capital flows. The volume of trade capital obviously varies directly with
AcroPDF - A Quality PDF Writer and PDF Converter to create PDF files. To remove the line, buy a license.

MBA- H4030 International Business Finance
143
the magnitude of merchandise trade, and the credit relationships between trading
partners.
Arbitrage
Under arbitrage, individuals and institutions buy one currency and sell
other currency with the sole objective of making profits without taking any risk.
The opportunities for such profits arise due to two factors. One, spot exchange
rates are not quite consistent in all the worldwide markets. Two, the difference
between spot rates and forward rates is not always consistent with the interest
rate differentials in different markets. To see the gains form arbitrage under
these two conditions; we take one example for each case.
Suppose spot rates in three markets were as follows:
Frankfurt L/DM :0. 20
New York $/DM: 0.40
London $/L: 1.90
The arbitrageur (trader) sells US dollars, say, in amounts of $ 1.9 million and
buys British pound in the of L 1million in London. He then sells his L 1million
and buys Deutsche mark (DM) in the amount of DM 5million in Frankfurt.
Finally he sells his DM 5million for $2million in New York. Through this
process, he makes a profit of $0.1 million, gross of transaction cast, without
taking any foreign exchange risk. Needless to say, such an opportunity arises
because the exchange rate in the three markets is not quite consistent. If the
exchange rate in London were $2=L1, there would be no scope for such an
arbitrage.
AcroPDF - A Quality PDF Writer and PDF Converter to create PDF files. To remove the line, buy a license.
MBA- H4030 International Business Finance
144
Relationship between the spot and forward rates and the interest rates in
the two countries whose currencies are involved in these exchange rates.
I$-iL=F-S/S
Where I$ = interest rate in USA
Where iL= interest rate in UK
Where F= forward rate ($/L)
Where S=sport rate ($/L)
If the interest and exchange rates are not consistent to this theorem, there is a
scope for arbitrage. For example, if
I$=15%, IL= 10%, and S: $2= L1.
Then F must be given by 0.15-0.10=F-2/2 or F=2.10
However, if actual F is such that $2.15= L1. Then the arbitrageur could
make profit by borrowing pound at 10% SELLING THEM FOR DOLLAR AS
s: $2=L1 depositing the dollar proceeds at 15% and eventually selling dollars in
the forward market at F=2.15. Through this process, the trade would make a
profit at the rate of $0.05 per pound minus his transactions cost, if any.
Opportunities of the above two types do sometimes exist and thus there
are international financial flows through arbitrage as well. The magnitude of
such an arbitrage depends inversely on the level of efficiency of international
markets. As the information system become more perfect and prompt through
the international computer network round the clock the scope for arbitrage will
become small and short-lived. However to the extent government intervene in
AcroPDF - A Quality PDF Writer and PDF Converter to create PDF files. To remove the line, buy a license.

MBA- H4030 International Business Finance
145
the determination of the exchange and interest rates, arbitrage could continue at
least upto a certain extent.
Speculative Flows
Speculative flows of capital take place across countries with the sole
objective of making money through deliberate understanding of foreign
exchange risk. Since the breakdown of the Britton Woods system in 1971,
exchange rates have been fluctuating widely and this had given rise to
significant speculative flows of capital. Speculators buy currencies, which they
expect to appreciate and sell those, which they expect to depreciate. These
transactions are of course, subject to government regulations.
The magnitude of speculative flows depends directly on the variability of
exchange rates, and the ability and attitudes of speculator towards risks. When
the exchange rates were relatively stable until 1971, speculative flows were very
much limited. With the increased variability of exchange rates and the enormous
profits that the speculators in foreign exchange have made the scope for such
transactions has increased manifold and the trend is expected to continue ion
future, nevertheless, it must be noted that these speculations are perhaps the
most difficult and this profession has attracted the best brains
Before we close this section, it must be noted that there are multilateral
institutions like the World Bank, International monetary fund and Asian
development bank, which advance loans, and regulate foreign exchange rates
and international liquidity among other activities. Transactions between these
organizations and nations are also components of the above-mentioned
international financial flows
AcroPDF - A Quality PDF Writer and PDF Converter to create PDF files. To remove the line, buy a license.

MBA- H4030 International Business Finance
146
Special features of service marketing
(1) Services are intangibles and cannot be standardized or reproduced in the
same for. They are customer need based and unique.
(2) Both supplier of services and consumers should have a rapport, willingly
understand each other and cooperate through meaningful dialogue and effective
communications.
(3) Services are dominated by human element and quality counts. But quality
cannot be homogenized, “It will vary with time, Place and customer to
customer.”
(4)Inventories cannot be created. Services are immediately consumed and
marketing and operation are closely interlinked.
Vendors of services should have a track record of integrity, reputation
for quality and timeliness of delivery. More than media advertisement, the best
advertisement for them is the mouth to mouth word of satisfied customers, and
building of corporate image of the vendors, rather than their presentations, oral
assurances to the vendors. The first best market strategy is thus a satisfied
customer. The second strategy is to maintain quality, human approach,
appearances and courtesies of the personnel and the available infrastructural
facilities for them. Thirdly service a\counts in terms of how it is priced and how
it is cost effective for the customer and for the vendor each.
Integration of markets
Business houses no longer restrict themselves to domestic sources of financing.
The search for capital does not stop is water edge, with the pursuit of policies for
liberalization and globalization; the distinction between domestic and foreign
financial markets is becoming increasingly blurred. With the lifting for
AcroPDF - A Quality PDF Writer and PDF Converter to create PDF files. To remove the line, buy a license.

MBA- H4030 International Business Finance
147
regulatory systems in 1980s that inhibit competition and protect domestic
markets the world had become one vast connected market.
In international finance centers or markets, the type of transactions
occurring is: (i) between foreign lenders and domestic borrowers; (ii) between
domestic lenders and foreign borrowers; (iii) between foreign lenders and
foreign borrowers. The third types of transaction are called entrepot or offshore
transitions. In this case the financial centers merely provide facilitation services
for foreign lending and borrowing.
Until the development of the euro marked in late 1950s internationals
financial centers were principal supplier of capital to foreign borrowers. In the
post 1960-euro market, entreport type and offshore financial transactions
became increasingly predominant. Hence the traditional nature to financial
centers was altered radically. With the internationalization of credit transactions,
it was no longer necessary for an international center to be a net supplier of
capital. Thus small and relatively unknown parts of the world became important
banking centers- Nassau, Singapore, Luxembourg etc., The worlds financial
centers as a group provide three types of international services (1) traditional
capital exports, (2) entrepot financial services, and (3) Offshore banking.
The traditional financial centers were net exporters of domestic capital.
This function has been performed through foreign lending by commercial banks,
the underwriting and placement of marketable securities for foreign issuers for
foreign issuers and the purchase of notes and obligations of non-resident entities
of domestic investors in the secondary markets
AcroPDF - A Quality PDF Writer and PDF Converter to create PDF files. To remove the line, buy a license.

MBA- H4030 International Business Finance
148
Offshore banking is a special kind of business of entrepot financial
center. It is financial intermediation performed primarily for non- resident
borrowers and depositors. It refers to international banking business involving
non-resident foreign currency- denominated assets and liabilities. Its confines to
the banking operations of non-residents and does not mix with domestic
banking. But the domestic financial market is well insulted from offshore
banking activity by an array of capital and exchange controls. Offshore banking
is carried in about 20 centers through tout the world. It differs benefits like
exemption from minimum cash reserve requirements, freedom from control on
interest rates, low or non-existence taxes and levies, low license fee etc.,
Offshore banking units are branches of international banks. They provide
project-financing syndicatedloans, issue of short-term and medium term
instrument Etc.,
Role of Financial Intermediaries
The role of financial institution is to provide intermediation between
financial and real sector and savers and investors and promote capital formation
and economic growth. The study of the national balance sheet shows that over
any period, how the ratio of financial assets to total assets has been growing.
This ratio is one of the indicators of economic growth. Over the planned period
in India, this indicator has been rising, as reflected in the ratio of financial assets
total assets, attributed to expanded role of public sector during 1950 to 1990 and
large capital investments in capital intensive projects. But more importantly
there was more active financial intermediation and widening and deepening of
the financial system in terms of range of financial instruments and magnitude of
funds raised. During Nineties and later, the importance of financial sector
AcroPDF - A Quality PDF Writer and PDF Converter to create PDF files. To remove the line, buy a license.

MBA- H4030 International Business Finance
149
increased due to ongoing economic and financial reforms, privatization,
regulation and globalization.
The various financial institutions which trade in these stocks and capital
markets are all-India financial institutions like IFC,ICICI and IDBI and various
SFCs for which the apex institutions is the IDBI.I institutions which issue
primary securities to collect the savings from the public directly are
UTI,GIC,LIC, etc., They collect savings of the public directly in the form of
units or premiums. These are called investment institutions. More recently some
public sector banks such as SBI Indian bank, bank of India, canara bank, etc.,
have started their mutual funds, as also the LIC and GIC. These are also part of
the stock and capital market. These institutions trade and invest in these markets.
The securities traded by them may be the claims of the government or of the
private corporate sector. The securities traded by them any be the claims of the
government or of the private corporate sector. The all- India institutions and
state financial institutions like the ICICI, IFC or SFCs, etc., raise resource
directly from the public in the form of deposits or by issue of bonds/debentures.
They may also borrow from the bank and other financial institutions as also
from the RBI. These are called Development Corporations. The use of their
funds is investments in corporate shares, securities and bonds/debentures and
loans and advances to corporate units. More recently an number of new finance
companies have cropped up newly lease finance, house finance, etc., The range
of instruments offered to the public has accordingly widened and the capital
market has been deepened and broadened enormously in recent years.
AcroPDF - A Quality PDF Writer and PDF Converter to create PDF files. To remove the line, buy a license.

MBA- H4030 International Business Finance
150
Savings and investment
The household sector is the major saver in India and contributors to the
bulk of the total savings that flow into financial asset which may take any of the
forms of currency, deposits with banks and companies, PF, insurance and
corporate shares, Bonds, etc,.
In addition to providing liquidity to investments, the stock and capital
markets promote mobilization of savings and canalize them into investment. As
already referred to the major borrowers are government and business sectors in
the economy, which invest more than they save. The net savings flow from the
household and foreign sectors. The financial system helps the process of
institutional of these savings for promoting investment and production in the
economy. The financial intermediaries play a crucial role in the stock and capital
markets in the India. The importance of underwriting of share and stock-broking
activities of brokers and dealers is to be appreciated in this context, as brooklets
are financial intermediaries like banks and financial institutions.
Interest Rate Structure
The government and RBI fix the Interest rates paid on these various
securities. The reserve bank and the others fix the bank rate and other interest
rates as applicable to the banks by the government in consultation with the RBI.
In India, the interest rates are administered and all the rtes in the organized
financial system are controlled. The peculiar feature of the structure is that
interest rated does not reflect the free market forces nor do they reflect the
scarcity value of capital in the economy. Most of these rates are determined on
an adhoc basis, in tune with the exigencies of monetary and credit policy or
AcroPDF - A Quality PDF Writer and PDF Converter to create PDF files. To remove the line, buy a license.

MBA- H4030 International Business Finance
151
fiscal policy or fiscal policy. Normally interest is a reward for risk and return for
abstaining from present consumption. In India, certain priority sectors like
borrowings by the government and operations of agriculture, exports and other
priority sectors are financed at confessionals rates on considerations. Other than
risk/return. More recently there has been some regulation of the financial system
and many interest rates have been freed from controls. These and other details
are discussed.
Capital market
As referred to earlier, in the category of financial institutions there are
some which issue primary securities. Besides the corporate sector which issues
primary securities in the form of new issued and further issues there are also
financial institutions like LIC and GIC, which sell insurance certificate for
collecting the savings form public directly. They also collect the premiums and
mobilize savings of the public. They also collect the premiums and mobilize
savings of the public. These funds are mobilized for channeling them ultimately
into the stock and capital markets. The brokers, banks and the financial
institutions referred to above are all intermediaries operating in the primary and
secondary markets.
In the primary markets, the brokers act as underwriter’s managers,
registrars and even merchant bankers to the new issues. In the secondary
market, the claims of a long-term nature of one year and above are traded both
on spot or forward basis. This trading imparts liquidity to investments and thus
promotes savings and investment. These financial intuitions can only change the
velocity of circulations of money, while dealing in the primary and secondary
markets, but the banks can influence both creation of money and its velocity.
AcroPDF - A Quality PDF Writer and PDF Converter to create PDF files. To remove the line, buy a license.

MBA- H4030 International Business Finance
152
The RBI has linkage with banks and other financial institutions through
its control and finance functions and provisions of cash and currency. Beside the
money markets trades in claims on money of varying maturities of a few days to
a few years. The trading in the money claims is what constitutes the financial
system, controlled by the RBI and is called the organized financial system.
Banks have linkages with both brokers and dealers in securities through the
credit limits granted to them and through their operations in the primary and
secondary markets.
Self-Assessment Questions
1. Describe the concept of foreign capital flows?2. What is the classification of foreign capital?3. Explain the following short Questions?
(a) Direct Foreign Investment (DFI)(b) Investments in SSI Sectors(c) Arbitrage
4. What are the role financial intermediaries?5. Explain the concept of Integration of Markets?6.What are the special features of services Marketing
FURTHER READINGS
Apte, PG, 1995, International Financial Management, Tata Mc Graw hill, NewDelhi.
Bhalla, V.K. and S.shiv Ramu, 1996, International Business, An mol, NewDelhi.
J.V.Prabhakara Rao, R.V.Rangachary, International Business, KalyaniPublishers, 2000.
V.A.Avadhani,Marketing of Financial Services, Himalaya Publishing House,year-2002.
AcroPDF - A Quality PDF Writer and PDF Converter to create PDF files. To remove the line, buy a license.
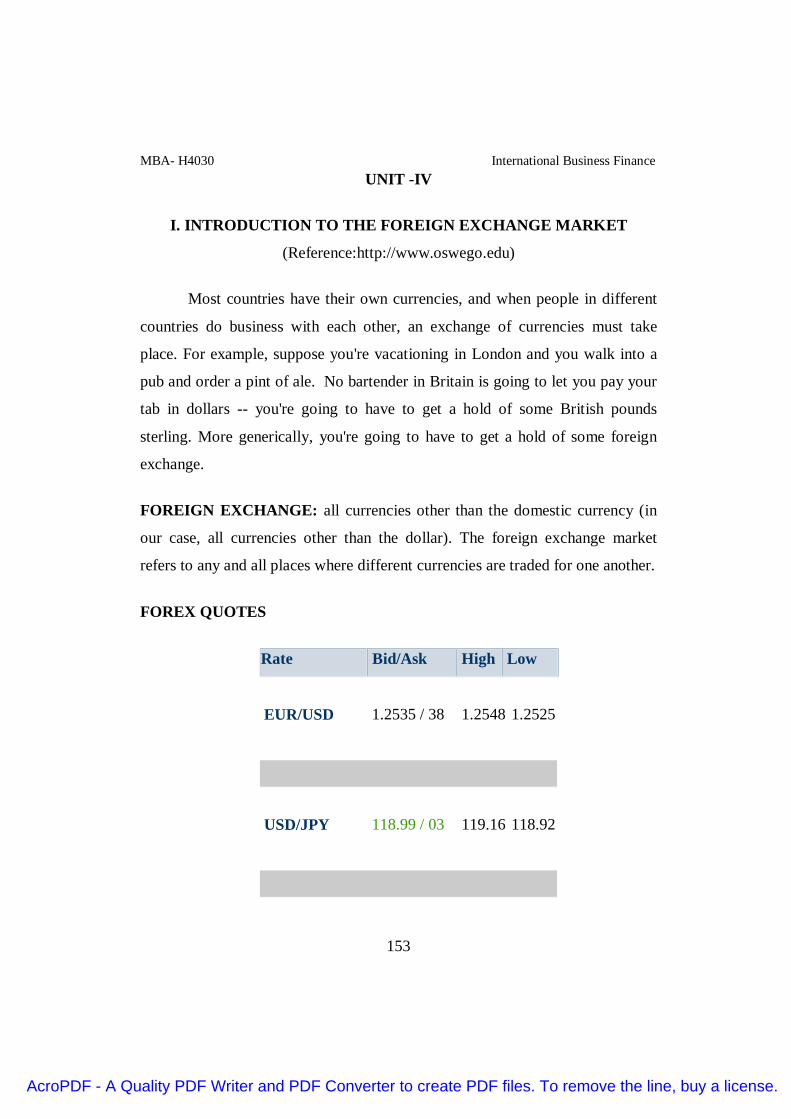
MBA- H4030 International Business Finance
153
UNIT -IV
I. INTRODUCTION TO THE FOREIGN EXCHANGE MARKET
(Reference:http://www.oswego.edu)
Most countries have their own currencies, and when people in different
countries do business with each other, an exchange of currencies must take
place. For example, suppose you're vacationing in London and you walk into a
pub and order a pint of ale. No bartender in Britain is going to let you pay your
tab in dollars -- you're going to have to get a hold of some British pounds
sterling. More generically, you're going to have to get a hold of some foreign
exchange.
FOREIGN EXCHANGE: all currencies other than the domestic currency (in
our case, all currencies other than the dollar). The foreign exchange market
refers to any and all places where different currencies are traded for one another.
FOREX QUOTES
Rate Bid/Ask High Low
EUR/USD 1.2535 / 38 1.2548 1.2525
USD/JPY 118.99 / 03 119.16 118.92
AcroPDF - A Quality PDF Writer and PDF Converter to create PDF files. To remove the line, buy a license.

MBA- H4030 International Business Finance
154
USD/CHF 1.2699 / 04 1.2715 1.2690
GBP/USD 1.8627 / 32 1.8644 1.8609
AUD/USD 0.7545 / 49 0.7550 0.7527
USD/CAD 1.1373 / 78 1.1391 1.1359
EUR/JPY 149.18 / 22 149.37 149.12
EXCHANGE RATE: the price of one country's currency in terms of
another country's currency; the rate at which two currencies are traded for
another.
-- Exchange rates for all of the world's major currencies are listed daily in the
Wall Street Journal.
American Dollar 1 USD in USD
Australian Dollar 1.32679 0.753699
AcroPDF - A Quality PDF Writer and PDF Converter to create PDF files. To remove the line, buy a license.

MBA- H4030 International Business Finance
155
Brazilian Real 2.132 0.469043
British Pound 0.537461 1.8606
Canadian Dollar 1.1384 0.878426
Chinese Yuan 7.912 0.12639
Danish Krone 5.9542 0.167949
Euro 0.79885 1.2518
Hong Kong Dollar 7.7837 0.128474
Indian Rupee 45.35 0.0220507
Japanese Yen 119.25 0.00838574
Malaysian Ringgit 3.682 0.271592
Mexican Peso 10.833 0.0923105
New Zealand Dollar 1.51906 0.658302
Norwegian Kroner 6.7749 0.147604
Singapore Dollar 1.5843 0.631194
South African Rand 7.5225 0.132935
South Korean Won 955.2 0.0010469
Sri Lanka Rupee 106.78 0.00936505
Swedish Krona 7.3957 0.135214
Swiss Franc 1.2715 0.786473
Taiwan Dollar 33.23 0.0300933
Thai Baht 37.4 0.026738
Venezuelan Bolivar 2144.6 0.000466287
using values from Monday, October 16, 2006
---- [We saw a currency-rates table from x-rates.com. It showed exchange rates
between the dollar and several foreign currencies.]
AcroPDF - A Quality PDF Writer and PDF Converter to create PDF files. To remove the line, buy a license.

MBA- H4030 International Business Finance
156
---- Ex.: On March 17, 2003, the U.S.-Canadian exchange rate was .6757 U.S.
dollars per Canadian dollar (i.e., a Canadian dollar costs you 67.57 cents), or
1.4799 Canadian dollars per U.S. dollar.
A note on usage: The term "exchange rate" has probably generated more
confusion than any other term in economics (no small feat). When economists
talk of "the exchange rate," it's often unclear which exchange rate they're talking
about. To be more precise, identify what currency you're talking about:
* the dollar's exchange rate = price of a dollar in terms of a foreign
currency
* the foreign exchange rate = price of a foreign currency in terms of dollars
-- Note that each one is the reciprocal (1/X) of the other
A still-better idea is to avoid the term "exchange rate" altogether.
Instead, we can talk of currency appreciation and depreciation. Namely,
* A currency APPRECIATES when it increases in value
(i.e., it becomes more expensive, it purchases more foreign currency).
* A currency DEPRECIATES when it decreases in value
(i.e., it becomes cheaper, it purchases less foreign currency).
To further avoid vagueness, don't say "the exchange rate appreciates" --
say "the dollar appreciates."
Extra question
AcroPDF - A Quality PDF Writer and PDF Converter to create PDF files. To remove the line, buy a license.

MBA- H4030 International Business Finance
157
You are in Tokyo and need to purchase some yen quickly, and decide you will
get it from one of the two nearby currency dealers. The first one quotes you a
price of 125 yen per dollar. The second one quotes you a price of 0.0084 dollar
per yen. Which one is offering you the better deal? Back up your answer with
numbers.
II. CURRENCY CONVERSIONS
To know how much an item produced in one country will cost in another
country's currency (i.e., as an import or to a tourist), you need to change the unit
of account (e.g., dollars, francs) by performing a currency conversion.
For any good or service produced outside the U.S., the price in dollars is:
Pin dollars = Pin foreign currency units * dollars/(unit of foreign currency)
For any good or service produced in the U.S., the price in terms of foreign
currency is:
Pin foreign currency units = Pin dollars* (units of foreign currency)/dollar
The key is to get it into the right unit of account -- on the right-hand side of the
equation, the other currency units should cancel out.
Ex.:
(Suppose the dollar trades for 0.6847 British pounds, and 1 British pound trades
for 1.4606 dollars.)
Q: How much would a Cadbury chocolate bar (made in Britain) that sells for
one British pound go for in U.S. dollars?
AcroPDF - A Quality PDF Writer and PDF Converter to create PDF files. To remove the line, buy a license.

MBA- H4030 International Business Finance
158
A: Pin dollars = Pin pounds * dollars/pound = 1 pound * 1.4606 dollars/pound =
1.4606 dollars (or $1.4606)
---- (Note how the pound units just drop out of the equation, as the units term
becomes [pound*dollar]/pound = dollar.)
Ex.:
Q: How much would a $10 bottle of California wine cost in Japan?
A: (From the "Currency Trading" table, we can see that 1 dollar trades for
118.46 Japanese yen, and 1 Japanese yen trades for .008442 dollars. Now we
just need to plug the appropriate one of those numbers -- the yen-per-dollar ratio
-- into the formula.)
Pin yen = Pin dollars* yen/dollar = 10 dollars * 118.46 yen/dollar = 1184.6 yen
---- (Note how the dollar units drop out of the equation.)
III. RETURNS ON INTERNATIONAL ASSETS
When international investors consider whether to invest in one country
or another, they must take into account not only the nominal returns on
investments in the different countries, but also the exchange rates and how they
might change over time. The real return involves two currencies, not one -- for
example, if you are an American who is investing in European stocks, a
depreciation of the euro relative to the dollar would lower the return on your
investment, just as higher inflation in Europe would lower the real return for a
European who has invested in European stocks.
--> The relevant return for an international investor is the (real, after-tax)
return after all currency exchanges have taken place.
|
AcroPDF - A Quality PDF Writer and PDF Converter to create PDF files. To remove the line, buy a license.
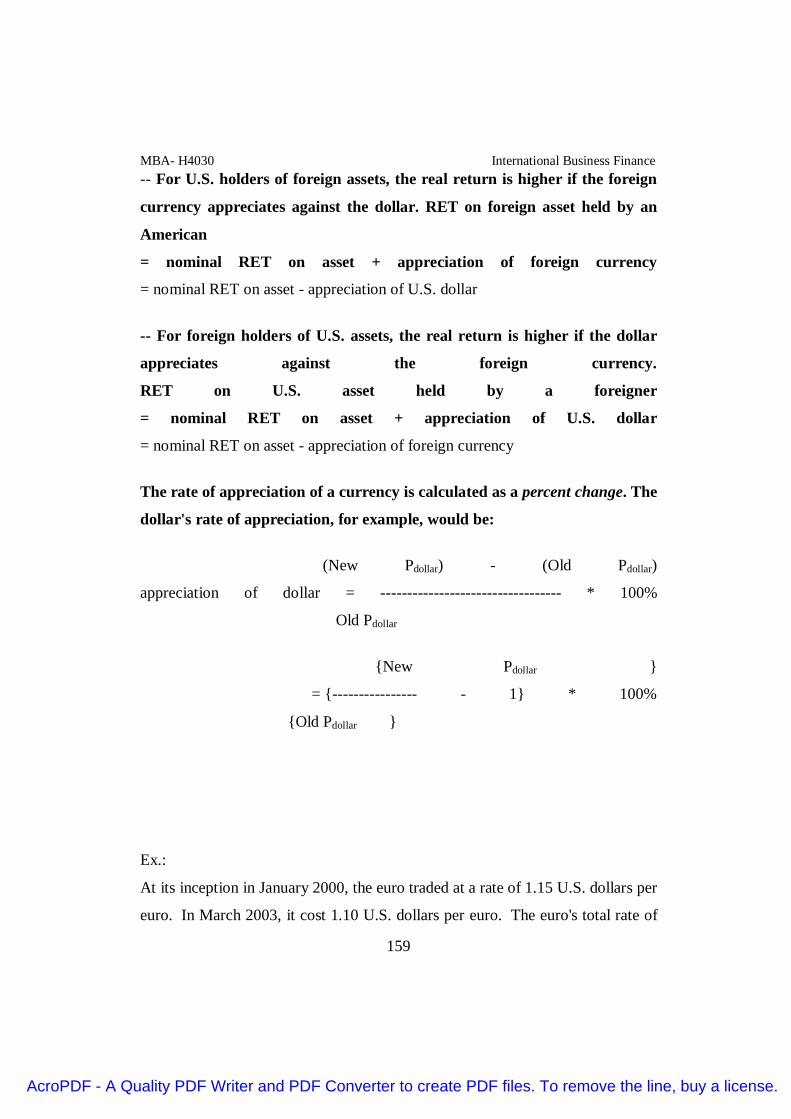
MBA- H4030 International Business Finance
159
-- For U.S. holders of foreign assets, the real return is higher if the foreign
currency appreciates against the dollar. RET on foreign asset held by an
American
= nominal RET on asset + appreciation of foreign currency
= nominal RET on asset - appreciation of U.S. dollar
-- For foreign holders of U.S. assets, the real return is higher if the dollar
appreciates against the foreign currency.
RET on U.S. asset held by a foreigner
= nominal RET on asset + appreciation of U.S. dollar
= nominal RET on asset - appreciation of foreign currency
The rate of appreciation of a currency is calculated as a percent change. The
dollar's rate of appreciation, for example, would be:
(New Pdollar) - (Old Pdollar)
appreciation of dollar = ---------------------------------- * 100%
Old Pdollar
{New Pdollar }
= {---------------- - 1} * 100%
{Old Pdollar }
Ex.:
At its inception in January 2000, the euro traded at a rate of 1.15 U.S. dollars per
euro. In March 2003, it cost 1.10 U.S. dollars per euro. The euro's total rate of
AcroPDF - A Quality PDF Writer and PDF Converter to create PDF files. To remove the line, buy a license.

MBA- H4030 International Business Finance
160
appreciation
{1.10 }
= {------ - 1 } * 100% = (.957-1) * 100% = (-.043) * 100% = -4.3%
{1.15 }
If an American purchased Volkswagen (German) stock in January 2000 and
earned 15% (in euro terms) between then and March 2003, his total return, net
of currency exchanges, would be
15% + (-4.3%) = 10.7%, which is somewhat less. For American holders of
foreign assets, the real return is less if the foreign currency depreciates against
the dollar.
(Aside: You could calculate the annualized, or yearly, rate of appreciation of the
euro by taking that first ratio (the euro's new exchange price divided by its old
exchange price) to the power of 1/n, where n is the number of intervening years.
In this case, it was 3 years and 2 months, so n = 3 + 2/12 = 3.17.
-- Formula:
annualized appreciation of euro = {[(New Peuro)/(Old Peuro)]^(1/n) - 1} *
100%
-- Applied to above example:
annualized appreciation of euro = {[(1.10/1.15)^(1/3.17)-1} =
{(.957)^(1/3.17)-1} = .986-1 = -.014 = -1.4%)
Cross currency rates
USD GBP CAD EUR AUD
AcroPDF - A Quality PDF Writer and PDF Converter to create PDF files. To remove the line, buy a license.
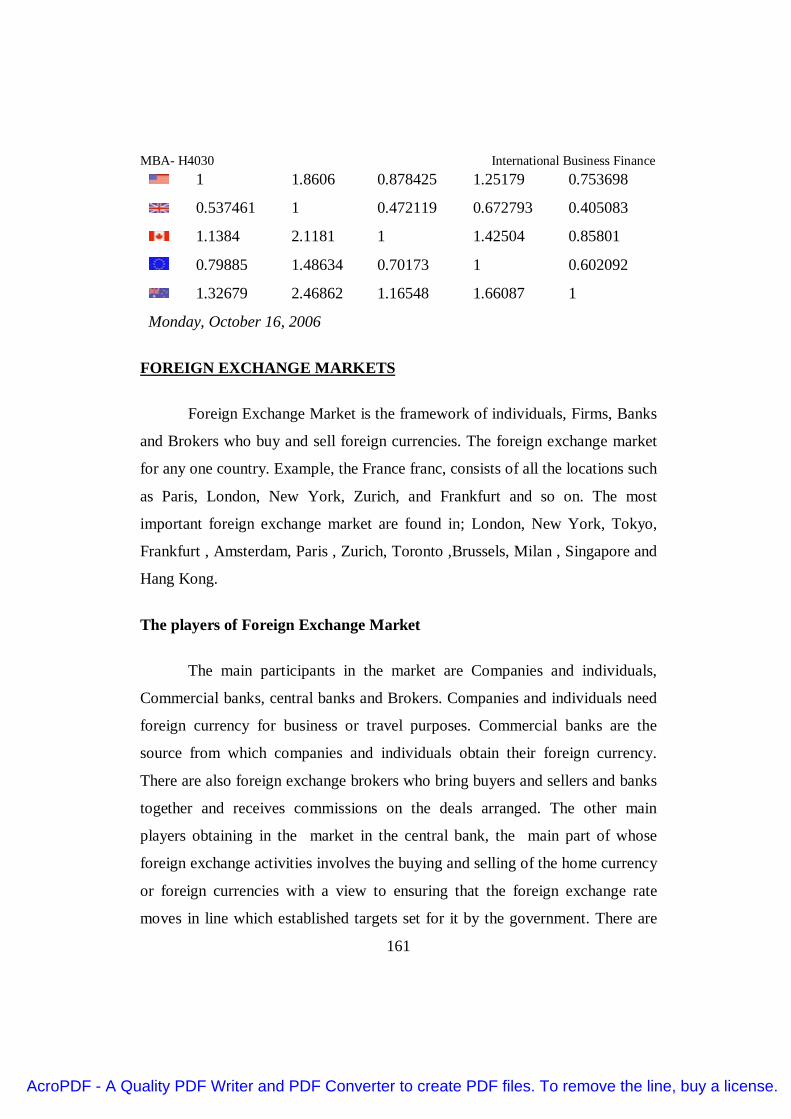
MBA- H4030 International Business Finance
161
1 1.8606 0.878425 1.25179 0.753698
0.537461 1 0.472119 0.672793 0.405083
1.1384 2.1181 1 1.42504 0.85801
0.79885 1.48634 0.70173 1 0.602092
1.32679 2.46862 1.16548 1.66087 1
Monday, October 16, 2006
FOREIGN EXCHANGE MARKETS
Foreign Exchange Market is the framework of individuals, Firms, Banks
and Brokers who buy and sell foreign currencies. The foreign exchange market
for any one country. Example, the France franc, consists of all the locations such
as Paris, London, New York, Zurich, and Frankfurt and so on. The most
important foreign exchange market are found in; London, New York, Tokyo,
Frankfurt , Amsterdam, Paris , Zurich, Toronto ,Brussels, Milan , Singapore and
Hang Kong.
The players of Foreign Exchange Market
The main participants in the market are Companies and individuals,
Commercial banks, central banks and Brokers. Companies and individuals need
foreign currency for business or travel purposes. Commercial banks are the
source from which companies and individuals obtain their foreign currency.
There are also foreign exchange brokers who bring buyers and sellers and banks
together and receives commissions on the deals arranged. The other main
players obtaining in the market in the central bank, the main part of whose
foreign exchange activities involves the buying and selling of the home currency
or foreign currencies with a view to ensuring that the foreign exchange rate
moves in line which established targets set for it by the government. There are
AcroPDF - A Quality PDF Writer and PDF Converter to create PDF files. To remove the line, buy a license.

MBA- H4030 International Business Finance
162
numerous foreign exchange market centers around the world but dealers in
different locations can communicate with one another via the telephone, telex
and computers.
FOREIGN EXCHANGE INSTRUMENTS
Spot transaction
A spot foreign exchange transaction is the exchange of one currency for
another, at the spot (or today’s) exchange rate. Although the exchange rate is
agreed at the time of the transaction, market convention dictates that the
exchange of funds (settlement) will occur two business days later (the spot date).
Forward transaction
A forward transaction is identical to a spot transaction, except that the
settlement date (and the exchange of currencies) is more than two business days
ahead.17 The forward transaction allows each party to lock in a known forward
exchange rate today, with the outright exchange of currency amounts occurring
at a future date.
Foreign exchange swap transaction
A foreign exchange swap (FX swap) is an agreement to exchange two
currencies at the Current spot date and to reverse the transaction at a specified
future date. In fact, an FX swap is equivalent to a spot transaction and an
offsetting forward transaction rolled into one. Entering into an FX swap is
equivalent to borrowing in one currency and lending in another, allowing
management of cross-currency cash flows. The FX swap market can be
AcroPDF - A Quality PDF Writer and PDF Converter to create PDF files. To remove the line, buy a license.

MBA- H4030 International Business Finance
163
a more efficient way of borrowing and lending currency amounts than using the
relevant currency money markets directly. FX swaps carry no currency exposure
because the exchange rate on the spot date and at the future settlement date is
fixed at the time of the transaction. Globally, FX swaps continue to be the most
heavily traded FX instrument. A significant reason for this is due to market
players’ preference to repeatedly transact short term FX swaps rather than
transacting one longer maturity swap.
Currency options
A currency option gives the holder the right, but not the obligation, to
buy or sell one currency against another at a specified exchange rate, over a
specified period. Most Currency options are ‘over-the-counter’, meaning they
are written by financial institutions to meet the exact needs of the option buyer.
FXTrends: Currency Exchange Trends
This table displays the change (trend) in currency exchange rates for the top
most traded currencies.
Tuesday, Oct 10, 2006 Change Compared to:
Currency
Pair
Current
Rate
Previous
Day
Last Week Last Month Last Year
AcroPDF - A Quality PDF Writer and PDF Converter to create PDF files. To remove the line, buy a license.

MBA- H4030 International Business Finance
164
EUR/USD 1.2600 -0.02 % -0.63 % -0.84 % 3.98 %
GBP/USD 1.8684 -0.16 % -0.24 % -0.14 % 6.09 %
USD/JPY 119.091 0.05 % 0.73 % 2.21 % 4.56 %
USD/CHF 1.2610 0.03 % 0.80 % 1.28 % -1.37 %
USD/CAD 1.1252 -0.06 % 0.60 % 1.04 % -4.18 %
EUR/GBP 0.6745 0.07 % -0.42 % -0.69 % -2.06 %
EUR/JPY 150.032 0.03 % 0.14 % 1.34 % 8.74 %
GBP/JPY 222.495 -0.09 % 0.50 % 2.06 % 11.01 %
EUR/CHF 1.5886 0.02 % 0.20 % 0.41 % 2.49 %
How to read this table: Each line shows the percentage change in the value of
the currency exchange rate relative to the value of the day before, 7 days before,
30 days before, and 365 days before, respectively. Currency Rate shows the
exchange rate for selling the currency pair. For example EUR/USD=0.972
means 1 EUR = 0.972 USD. Arrows indicate the direction of the change.
Importance of Foreign Exchange;
1. Foreign Exchange is the system or Process of converting one national
currency into another, and of transferring money from one country to another.
2. Foreign Exchange is used to refer to foreign currencies. Foe example The
Foreign Exchange Regulation Act, 1973 (FERA) define:-
Foreign Exchange has foreign currencies and includes all deposits,
credits and Balance of Payments in any foreign currency and any drafts,
traveler’s cheques, letter of credits and Bills of exchange, expressed or drawn in
Indian currency, but payable in any foreign currency.
AcroPDF - A Quality PDF Writer and PDF Converter to create PDF files. To remove the line, buy a license.

MBA- H4030 International Business Finance
165
Generally, in our country we make payments for our purchases in coins
or notes. When the amount is big we pay through a cheque on some local bank.
If we want to remit money to distant places we may issue a cheque or send a
bank draft. But, if we have to make payments to a foreigner say, in New York,
we shall have to call our banker to change our rupees into dollars, and remit
them to New York. This change of rupees into dollars (or any other currency)
and vice versa is called Foreign Exchange.
METHODS OF FOREIGN PAYMENTS
1. Gold / Silver
2. Bank Drafts: International payments may be made by means of cheque
and Bank drafts.
3. Foreign Bills of Exchange: “A bill of exchange is an unconditional order
in writing, addressed by one person to another, requesting the person to whom it
is addressed to pay a certain sum on demand or on a specified future date
“(Inland Bill –Due for the payment is calculated from the date of which it was
drawn; Foreign bills –date on which the bill was accepted.)
a. Sight Bill which is honored on presentation.
b. Short Bill which is payable within 10 days.
c. Long Bill which matures with 90 days.
4. Telegraphic Transfers: A sum can be transferred from a bank in one
country to a bank in another part of world by cable or telex. It is the quickest
method of transmitting the funds.
AcroPDF - A Quality PDF Writer and PDF Converter to create PDF files. To remove the line, buy a license.
MBA- H4030 International Business Finance
166
5. Documentary (or reimbursement) credit:-Transfer bills .i.e. Bill of lading,
Letters of Credit.
EXCHANGE RATE:
The rate which refers to the demand for the supply of a currency is the
external value of it. It measures the number of units of one currency which
exchange, in the foreign exchange market for one unit of another. E.g.; suppose
£1 exchange for $2 that is £1= $2 just as a commodity is sold and purchase in
the market for some price.
IMPORTANCE OF EXCHANGE RATES
1. Exchange rates establish relationships between the different currencies
or monetary units of the world.
2. Exchange rates have been instrumental in developing international trade.
These have considerably increased the tempo of international
investments.
3. They provide a direct link between domestic prices of commodities and
productive factors and their prices in the rest of the world.
4. With the prices at home and abroad at a given level, a low rate of
exchange will hamper imports and stimulate exports, and thereby tend to
bring about a balance of payment surplus.
Floating Rate of Exchange:
AcroPDF - A Quality PDF Writer and PDF Converter to create PDF files. To remove the line, buy a license.

MBA- H4030 International Business Finance
167
Floating rate which is allowed to fluctuate freely according to supply and
demand forces. Such float is Free Float if no intervention takes place by the
central bank of the country. In the real world some degree of intervention exists
which leads to a managed float, such managed floats are either single or joint.
Dollar, Sterling and Yen were floating with varying degree of intervention
within a band of 2.25% on either and they are singly floats. The European
common market countries (Germany, France, Belgium, Netherlands,
Luxemburg ,Ireland, Demark and Sweden) are under a joint float within a
narrow bank called “Snake in the Tunnel”. The new IMF policy is to keep
relatively stable exchange rates within a wider band of fluctuations. Indian rupee
is kept relatively stable with the help of a basket of Currencies up to July 1991.
When the rupee was devalued and LERMs was adopted later. (Limited
Exchange Rate Management System).
FIXED vs. FLEXIBLE EXCHANGE RATE
Exchange rate stability has always been the objective of monetary policy
of almost all countries. Except during the period of the Great Depression and
World War II, the exchange rates have been almost stable. During post-war II
period, the IMF had brought a new phase of exchange rate stability. Most
governments have maintained adjustable fixed exchange rate till 1973. But the
IMF system failed to provide an adequate solution to three major problems
causing exchange instability, viz., (i) providing sufficient reserves to mitigate
the short-term fluctuations in the balance of payments while maintaining the
fixed exchange rates system; (ii) problems of long-term adjustments in the
balance of payments; and (iii) crisis generated by speculative transactions. As a
result, the currencies of many countries, especially the reserve currencies were
subject to frequent devaluation in the early 1970s. This raised doubts about the
AcroPDF - A Quality PDF Writer and PDF Converter to create PDF files. To remove the line, buy a license.

MBA- H4030 International Business Finance
168
continuation of the Brettan Wood System, and also the viability of the fixed
exchange rate system. The breakdown of Brettan Wood System generated a
debate on whether fixed or flexible exchange rate. Let us briefly describe the
main arguments in favour of fixed and flexible exchange rates.
Arguments for Fixed Exchange Rate
The first argument in favour of fixed exchange rate is that it provides
stability in the foreign exchange markets and certainty about the future course of
exchange rate and it eliminates risk caused by uncertainty. The stability of
exchange rate encourages international trade. On the contrary, flexible exchange
rate system causes uncertainty and might also often lead to violent fluctuations
in the international trade. As a result the foreign trade oriented economies
become subject to severe economic fluctuations, if import-elasticity is less than
export elasticity.
Secondly, fixed exchange rate system creates conditions for smooth flow of
international capital simply because it ensures continuity in a certain return on
the foreign investment, while in case of flexible exchange rate; capital flows are
constrained because of uncertainty about expected rate of return.
Thirdly, fixed rate eliminates the possibility of speculations, where by it
removes the dangers of speculative activities in the foreign exchange market. On
the contrary, flexible exchange rates encourage speculation. As mentioned
earlier in this chapter, there is controversy about the destabilizing effect of
speculation. But, if speculators buy a currency when it is strong and sell it when
it is weak, speculation will be destabilizing.
AcroPDF - A Quality PDF Writer and PDF Converter to create PDF files. To remove the line, buy a license.

MBA- H4030 International Business Finance
169
Fourthly, the fixed exchange rate system reduces the possibility of competitive
depreciation of currencies, as it happened during the 1930s. The possibility has
been further strengthened by the IMF rule for the member nations. Also,
deviation from the fixed rates is easily adjustable.
Finally, a case is also made in favour of fixed exchange rate of the basis of
existence of currency area. The flexible exchange rate is said to be unsuitable
between the nations which constitute currency area, since it leads to chaotic
situation and hence hampers trade between them.
Advantages of Basked Currencies:
With the existing system of exchange controls in India, a free floating
rupee was out of question in the eighties. The rupee is not strong enough to with
stand the speculative onslaughts. Our trade would have suffered. Alternatives
left to the monitory authorities in India were therefore to link it with $ or L a
combination of some major currencies like the SDR. Since both $ and L were
having their own problems, the choice has fallen on a basket of currencies but
unlike the 16 major currencies in the case of SDR, at that time only 5 major
currencies having good trade connections with India in 1975 were chosen in its
basket. The SDR valuation would have been unrealistic for India as some of the
currencies represented in SDR have no relations with India’s trade. The basis of
SDR valuation was itself changed to a bag of 5 currencies in 1981. It was felt
that it would be advantageous for India to link the rupee to a mix of currencies
properly weighted as this would give greater stability and more certainty so that
India’s trade and investment abroad would not suffer. The import bill and debt
servicing burder are heavy for India and it would be necessary to have relative
stability in the exchange rate. The fact that moderate depreciation took place in
AcroPDF - A Quality PDF Writer and PDF Converter to create PDF files. To remove the line, buy a license.

MBA- H4030 International Business Finance
170
effect as against $ DM etc. would have probably helped our export trade in
particular.
Present Exchange Rate System
With the initiation of economic and financial reforms in July 1991, for
reaching changes were introduced in the Foreign exchange policy and exchange
rate management. FERA was diluted and banks have been allowed greater
freedom of lending and their deposits and lending rate have also been freed to a
large extent. Foreign exchange release is mostly left to the banks, for many
purposes, subject to an upper limit for each purpose. Rupee was made partially
convertible first in 1992 followed by full convertibility on trade account in 1993
and thereafter full convertibility on current account inclusive of invisible
account in 1994. The era of decontrol on Foreign exchange has started with
these reforms. We have now a system of exchange rate management adopted by
the RBI since 1994 and the FERA was replaced by FEMA in the year 2000.
Exchange Rates in India:
The table below gives TT rates of various currencies in terms of rupees.
TT means telegraphic transfer which is next best means and quickest method of
transferring fund from one currency to another currency. It is next to physical
delivery of currency on spot. The rates for TT buying and selling for major
currencies in the world are given in terms of rupees for each of the foreign
currency units. The margin between buying and selling rate is the profit to the
whole seller.
AcroPDF - A Quality PDF Writer and PDF Converter to create PDF files. To remove the line, buy a license.

MBA- H4030 International Business Finance
171
AcroPDF - A Quality PDF Writer and PDF Converter to create PDF files. To remove the line, buy a license.

MBA- H4030 International Business Finance
172
Foreign Exchange Market:
The foreign exchange market is an informal arrangement of the larger
commercial banks and a number of FOREX brokers. The banks and brokers are
linked together by telephone, Telex and satellite communication network called
the SWIFT (Society For World Wide International Financial
Telecommunications). This counter based communication system, based in the
Brussels, Belgium links banks and brokers in just about every financial centers.
The banks and brokers are in almost constant contact with activity in some
financial center or the 24 Hrs. a day. Because of the speed of the
communications, significant event have vertically instantaneous impacts every
where in the world despite the huge distances separating market participants.
This is what makes the foreign exchange market just as efficient as a
conventional stock or commodity market housed under a singly roof.
The efficiency of the Spot foreign exchange market is revealed in the
extremely narrow spreads between buying and selling prices. These spreads can
be smaller than a 10th of the percent of the value of currency exchanged and are
therefore about 50th or less of the spread faced on bank notes by international
travelers.
Clearing House:
A clearing house is an institution at which banks keep funds which can
be moved from one bank’s account to another’s to settle inter bank transactions.
When foreign exchange is trading against the US Dollar, the clearing house that
is used is called CHIPS an acronym for the Clearing House Inter bank
Payments Systems (CHIPS). CHIPS is located in new York and as we shall
explain below, transfer funds between member bank currencies and also trade
AcroPDF - A Quality PDF Writer and PDF Converter to create PDF files. To remove the line, buy a license.

MBA- H4030 International Business Finance
173
directly with each other without involving the dollar – For example Deutsche
mark, for British pounds or Italian Lire for Swiss Francs. In these situations a
European clearing house will be used. However because a substantial volume of
transactions is settled in dollars, we describe here how CHIPS works, although
we can note that settlement between banks is similar in other financial centers.
DETERMINATION OF EXCHANGE RATES / EQUILIBRIUM RATE
OF FOREIGN EXCHANGE
The foreign exchange rate is determined in the free foreign exchange
markets by the forces of ‘demand for and supply for foreign money’. To make
the demand and supply functions to foreign exchange, like the conventional
market demand and supply functions, we define the rate of exchange as the price
of one unit of the foreign currency expressed in terms of the Units of the home
currency.
THE DEMAND FOR FOREIGN EXCHANGE
Generally, the demand for foreign currency arises from the traders who
have to make payments for imported goods. If a person wants to invest his
capital in foreign countries, he requires the currency of that country. The
functional relationship between the quantity of foreign exchange demanded and
the rate of foreign exchange is expressed in the demand schedule for foreign
exchange {which shows the different rates of foreign exchange}. It is
understood from the demand schedule that the relationship, between the
quantities of the foreign exchange demanded that the rate of foreign exchange is
inverse in such a way that a fall in the rates of exchange is followed and inverse
in the quantity of the foreign exchange demanded. The main reason for this
relationship is that, a higher rate of foreign exchange by rendering imports more
AcroPDF - A Quality PDF Writer and PDF Converter to create PDF files. To remove the line, buy a license.

MBA- H4030 International Business Finance
174
expensive reduces the demand for them and consequently, also reduces the
amount demanded of foreign exchange which is required to pay for imports. On
the other hand, a lower rate of exchange by making the imports cheaper causes
the demand for them to rise and consequently increases the demand for foreign
exchange needed to pay for higher imports.
Let us assume, that the rate of foreign exchange {price of US dollar
expressed in terms of Indian rupees} is R1 and amount of foreign exchanges
(US dollar) demanded is Q1. When the rate of foreign exchange falls from R1
to R2, i.e., the rupee price of the US dollar falls, the amount of foreign exchange
demanded increases from Q1 to Q2. This happens because, consequent upon the
US dollar becoming cheaper in terms of Indian rupees, the dollar price of the
American goods remaining unchanged, the prices expressed in terms of Indian
currency fall and consequently the demand for the American export foods in
India increases, unless the extreme assumption is made that such demand is
perfectly price inelastic. The amount demanded of the foreign exchange will
decrease when the rate of foreign exchange rise i.e., when the foreign currency
becomes costlier in terms of domestic currency.
AcroPDF - A Quality PDF Writer and PDF Converter to create PDF files. To remove the line, buy a license.

MBA- H4030 International Business Finance
175
The demand curve for the foreign exchange is shown in where the rate of
foreign exchange and the quantity of foreign exchange demanded have been
shown on the Y axis and X axis respectively. According to the demand curve
DD, which is negatively sloping from left to right, it can be seen that the foreign
exchange rate elasticity of demand for foreign exchange is less than infinity and
greater than zero. The demand for foreign exchange arising from the imports of
commodities and services, has the same foreign exchange rate elasticity, as is
the elasticity of demand for imported goods and services with respect to their
prices expressed in the local currency.
2. THE SUPPLY OF FOREIGN EXCHANGE
The need for and supply of foreign currency arises from the exporters
who have exported goods and services to foreign countries. The supply schedule
or curve of foreign exchange shows the different quantities of foreign exchange,
which would be available at different rate of foreign exchange, in the foreign
exchange market. The sources of supply of foreign exchange depend largely
upon the decisions of foreigners. The total quantity of the different goods and
services, which a country can export and, therefore, the quantity of foreign
currencies which it can acquire depends upon how many the residents of the
foreign currencies are willing to import from a particular country.
3. THE EQUILIBRIUM RATE OF FOEIGN EXCHANGE
After deriving the demand and supply curves relating to foreign
exchange, the equilibrium rate of foreign exchange in the foreign exchange
market is determined through the point of intersection between the supply and
demand curves of foreign exchange as shown in the following figure. The rate
of exchange refers to the rate at which the currency of one country can be
AcroPDF - A Quality PDF Writer and PDF Converter to create PDF files. To remove the line, buy a license.

MBA- H4030 International Business Finance
176
converted into the currency of another country. Thus, it indicates the exchange
ratio between the currencies of two countries.
The demand for the supply of a foreign exchange, and how these affect the rate
of exchange, in this figure the demand for and supply of foreign exchange have
been measured along the axis OX, and the rate of exchange along that of OY.
Whereas DD curve indicates the demand for a foreign currency. SS curve
indicates its supply. Both intersect at P demand and supply being equally
represented by OL, the rate of exchange is OR.
Demand and supply for foreign currency
When supply of foreign exchange rises to OM, its demand remaining
constant, the rate of exchange declines to OR and when the demand for foreign
exchange rises to OM, its supply remaining constant, the rate goes up to OR.
Thus, we conclude that if the demand for a foreign currency increases, its
rate of exchange must go up, and if its supply exceeds its demand, the rate must
decline.
AcroPDF - A Quality PDF Writer and PDF Converter to create PDF files. To remove the line, buy a license.

MBA- H4030 International Business Finance
177
FUNCTIONS OF THE FOREIGN EXCHANGE MARKET
The foreign exchange market performs mainly three functions
1. Transferring the purchasing power
2. Provision of credit for foreign trade and
3. Furnishing facilities for hedging for foreign exchange risks
1. Transferring the purchasing power
The most important function is the transfer of purchasing power from
one country to another and from one national currency to another. The
purchasing power is transferred through the use of credit instruments. The
main credit instrument is used for the transferring the purchasing power is
the telegraphic transfer (TT) of the cabled order by one bank (in country A)
to its correspondent abroad (in country B) to pay B funds out of its deposit
account to its designated account or order. The telegraphic transfer is
simply a sort of cheque, which is wired or radioed rather than sent by post.
Purchasing power may also be transferred through bank drafts. There is also
the commercial bill of exchange or acceptance, through which even today a
considerable amounts of payments in international trade is made. A bill of
exchange is an order, written by the exporters of goods directing the
importer to pay the exporter or the party bank, discount house, or other
financial institutions with whom the exporter has discounted the bill.
2. Provision of credit for foreign trade
The foreign exchange market also provides credit for foreign trade. Like
all the traders, international trade also requires credit. It takes time to move
AcroPDF - A Quality PDF Writer and PDF Converter to create PDF files. To remove the line, buy a license.

MBA- H4030 International Business Finance
178
the goods from seller to purchaser and during this period, the transaction
must be financed. When the exporter does not need credit for the
manufacture of export goods, credit is necessary for the transit of goods.
When the special credit facilities of the foreign exchange market are used,
the foreign exchange department of a bank or the bill market is used; the
foreign exchange department of the bank or the bill market of one country or
the other extends the credit facilities to finance the foreign trade.
3. Furnishing facilities for hedging foreign exchange risks
The foreign exchange market by providing facilities of buying and
selling at spot or forward exchange, enables the exporters and importers to
hedge their exchange risks arising from change in the foreign exchange rate.
The forward market in exchange also enables those banks, which are
unlikely to run any considerable exchange position to cover their
commitments.
FACTORS INFLEUNCING FLUCTUATIONS IN THE RATE OF
EXCHANGE
The equilibrium rate of exchange is the normal rate below and above
which the market rate of exchange fluctuates. There are a number of
influences, which may cause fluctuations in the rate of exchange, either
acting singly or in collaboration with others. Fluctuations may due to the
combination of the following factors:
I. MARKET INFLUENCES
Market conditions are those influences or factors that affect the demand for
and supply of foreign currencies in the short period. They include
AcroPDF - A Quality PDF Writer and PDF Converter to create PDF files. To remove the line, buy a license.

MBA- H4030 International Business Finance
179
i). Trade operation
These operations include exports and imports i.e., the flow of goods from
one country to other. If the exports of a country exceed its imports, it means
that the demand for the currency of this country will rise because foreign
merchants will buy this currency to settle their debts. Thus, exports increase
in the demand for a currency will change the rate and it will make the rate
more favourable to the creditor nation. Just the reverse will take place when
the imports of the country exceed its exports.
ii). Stock exchange transaction
These include investment and speculation in international securities,
payment of interest and dividend on loan and investments, and repayment of
loans raised by one country to another. They affect the demand for and
supply of a currency and hence its rate of exchange.
iii). Banking operations
These include the investment of funds made by the bankers of one
country in other countries, issue of circular notes, letters of credit, arbitrage
operation i.e., buying and selling of foreign currencies with a view of
making profit. If drafts are being sold by a bank in India to foreign centre,
the demand for that foreign currency will increase and its rate of exchange
will go up. The buying of bills of exchange by bankers is of very great
importance as it affords them a consignment means of utilizing their surplus
funds. Bank rate is a very strong weapon which also influences the rate of
exchange. If the bank rate in India has been raised, it will certainly attract
funds from other centers. Consequently, the demand currency will rise and
AcroPDF - A Quality PDF Writer and PDF Converter to create PDF files. To remove the line, buy a license.

MBA- H4030 International Business Finance
180
the value will go up. Just the reverse will happen when the bank rate falls in
India.
iv). Government financial operations
Under this category, are included repatriation payments and loans given
by one Government to another during the period of war. Such payments and
transfers affect the demand for and supply of foreign exchange.
v). Speculative influence
Serious fluctuations are also caused in the rate of exchange by the sale
and purchase of foreign currencies by speculators. The speculative activity
depends upon the certain factors like rumors of war, inflation, natural
calamities, budgetary position etc.
II. CURRENCY INFLUENCE
These refer to long period influence, which affect the rate of exchange
because they modify the purchasing power of currencies. The depreciation
and debasement of a currency affect its rate of exchange. If the currency has
been inflated (over issue of currency has taken place) in the country funds
will begin to move out i.e., flight of capital will take place; and its rate of
exchange in relation to other currencies will tend to be unfavourable.
Deflation will undoubtedly raise its rate of exchange.
III. POLIITICAL CONDITIONS
Satisfactory political conditions constitute another important factor that
attracts foreign capital towards a country. A country which enjoys a
political stability creates condition favourable for the investment of foreign
AcroPDF - A Quality PDF Writer and PDF Converter to create PDF files. To remove the line, buy a license.

MBA- H4030 International Business Finance
181
capital. When the funds are invested into a country, demand for a currency
of that country increases as a result of which the rate of that currency
becomes more favourable.
THEORIES OF RATE OF EXCHANGE
Every country has a currency different from others. There is no common
medium of exchange. It is this feature that distinguishes international trade
from domestic. Suppose the imports and exports of a country are equal, the
demand for foreign currency and its supply conversely, the supply of home
currency and the demand for it will be equal. The exchange will be at par.
If the supply of foreign money is greater than the demand it will fall below
par and the home currency will appreciate. On the other hand, when the
home currency is in great supply, there will be more demand for the foreign
currency. This will appreciate in value and rise above par.
Economists have propounded the following four theories in connection
with determination of rate of exchange:
1. Mint par theory
2. Purchasing power parity theory
3. Balance of payments or equilibrium theory and
4. Foreign exchange theory
Mint par theory
Mint par indicates the parity of mints or coins. It means that the rate of
exchange depends upon the quality of the contents of currencies. It is the
AcroPDF - A Quality PDF Writer and PDF Converter to create PDF files. To remove the line, buy a license.
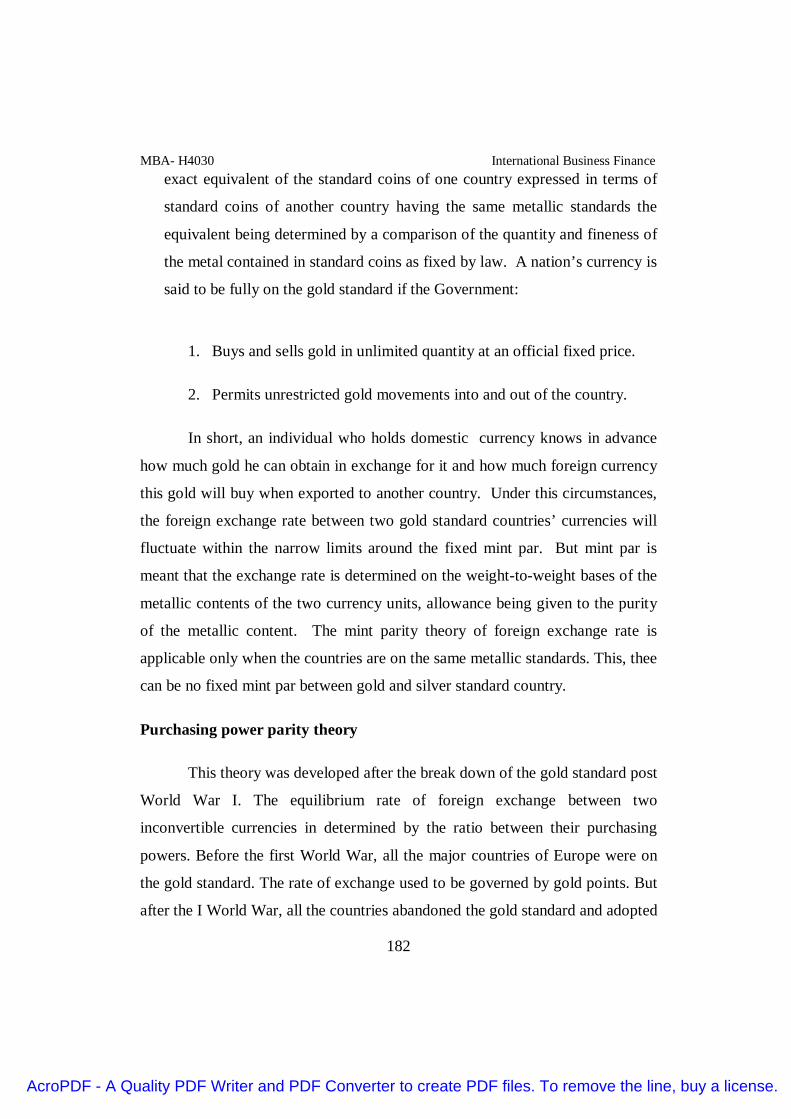
MBA- H4030 International Business Finance
182
exact equivalent of the standard coins of one country expressed in terms of
standard coins of another country having the same metallic standards the
equivalent being determined by a comparison of the quantity and fineness of
the metal contained in standard coins as fixed by law. A nation’s currency is
said to be fully on the gold standard if the Government:
1. Buys and sells gold in unlimited quantity at an official fixed price.
2. Permits unrestricted gold movements into and out of the country.
In short, an individual who holds domestic currency knows in advance
how much gold he can obtain in exchange for it and how much foreign currency
this gold will buy when exported to another country. Under this circumstances,
the foreign exchange rate between two gold standard countries’ currencies will
fluctuate within the narrow limits around the fixed mint par. But mint par is
meant that the exchange rate is determined on the weight-to-weight bases of the
metallic contents of the two currency units, allowance being given to the purity
of the metallic content. The mint parity theory of foreign exchange rate is
applicable only when the countries are on the same metallic standards. This, thee
can be no fixed mint par between gold and silver standard country.
Purchasing power parity theory
This theory was developed after the break down of the gold standard post
World War I. The equilibrium rate of foreign exchange between two
inconvertible currencies in determined by the ratio between their purchasing
powers. Before the first World War, all the major countries of Europe were on
the gold standard. The rate of exchange used to be governed by gold points. But
after the I World War, all the countries abandoned the gold standard and adopted
AcroPDF - A Quality PDF Writer and PDF Converter to create PDF files. To remove the line, buy a license.

MBA- H4030 International Business Finance
183
inconvertible paper currency standards in its place. The rate of foreign exchange
tends to be stabilized at a point at which there is equality between the respective
purchasing powers of the 2 countries. For eg; say America and England where
the goods purchased for 500 $ in America is equal to 100 pounds in England. In
such a situation, the purchasing power of 500 US $ is equal to that of 100
English pounds which is another way of saying that US $500 = 100, or US $5=1
pound. If and when the rate of foreign exchange deviates from this nor,
economic forces of equilibrium will come into operation and will bring the
exchange rate to this norm. The price level in countries remain unchanged but
when foreign exchange rate moves to 1=$5.5, it means that the purchasing
power of the pound sterling in terms of the American dollars has risen. People
owing Pounds will convert them into dollars at this rate of exchange, purchase
goods in America for 5$ which in England cost 1 pound sterling and earn half
dollar more. This tendency on the part of British people so to convert their
pound sterling into dollars will increase, the demand for dollar in England, while
the supply of dollar in England will decrease because British exports to America
will fall consequently the sterling price of dollar will increase until it reaches the
purchasing power par, i.e. 1=US $5. On the other hand, of the prices in England
rose by 100 percent those on America remaining unaltered, the dollar value of
the English currency will be halved and consequently one sterling would be
equal to 2.5 $. This is because 2 unite of English currency will purchase the
same amount of commodities in England, as did one unit before. If on the other
hand, the prices doubled in both the countries, there would be no exchange in
the purchasing power parity rate of foreign exchange, this , in brief is the
purchasing power parity theory of foreign exchange rate determination.
AcroPDF - A Quality PDF Writer and PDF Converter to create PDF files. To remove the line, buy a license.

MBA- H4030 International Business Finance
184
The change in the purchasing power of currency will be reflected in the
exchange rate.
Equilibrium Exchange Rate (ER) =Er X Pd / Pf
Where; ER = Equilibrium Exchange Rate
Er = Exchange Rate in the Reference period
Pd = Domestic Price Index
Pf = Foreign currencies price index.
Balance of payments theory
According to this approach, foreign exchange rate is determined by
independent factors no related to international price levels, and the quantity of
money has asserted by the purchasing power parity theory. According to this
theory, an adverse balance of payment, lead to the fall or depreciation of the rate
of foreign exchange while a favourable balance of payments, by strengthening
the foreign exchange, causes an appreciation of the rate of foreign exchange.
When the balance of payments is adverse, it indicates a situation in which a
demand for foreign exchange exceeds its supply at a given rate of exchange
consequently, its price in terms of domestic currency must rise i.e., the external
value of the domestic currency must depreciate. Conversely, if the balance of
payment is favourable it means that there is a greater demand for domestic
currency in the foreign exchange market that can be met by the available supply
at any given rate of foreign exchange. Consequently, the price of domestic
currency in terms of foreign currency rises i.e., the rate of exchange moves in
favour of home currency, a unit of home currency begins to command larger
units of the foreign currency than before.
AcroPDF - A Quality PDF Writer and PDF Converter to create PDF files. To remove the line, buy a license.

MBA- H4030 International Business Finance
185
Balance of Payment theory, also known as the Demand and Supply
theory. And the general equilibrium theory of exchange rate holds that the
foreign exchange rate, under free market conditions is determined by the
conditions of demand and supply in the foreign exchange market.
According to this theory, the price of a commodity that is , exchange rate
is determined just like the price of any commodity is determined by the free play
of the force of demand and supply.
“When the Balance of Payment is equilibrium, the demand and supply
for the currency are equal. But when there is a deficit in the balance of
payments, supply of the currency exceeds its demand and causes a fall in the
external value of the currency. When there is a surplus, demand exceeds supply
and causes a rise in the external value of the currency.”
DEALINGS ON THE FOREIGN EXCHANGE MARKET SPOT AND
FORWARD EXCHANGE.
The term Spot exchange refers to the class of foreign exchange
transaction which requires the immediate delivery or exchange currency on the
spot. In practice, the settlement takes place with in two days in most markets.
The forward transaction is an agreement between two parties, requiring
the delivery at the some specified future dates of a specified amount of foreign
currency by one of the parties, against payment in domestic currency by the
other party, at the price agreed upon in the contract. The rate of exchange
applicable to the forward contract is called the ‘Forward Exchange Rate” and the
market for forward transaction are known as “Forward Market”.
AcroPDF - A Quality PDF Writer and PDF Converter to create PDF files. To remove the line, buy a license.

MBA- H4030 International Business Finance
186
Forward Exchange Rate: - The rate quoted in terms of price of one
country to another.
The forward exchange rate may be at Par, Discount, and Premium.
At Par: - If the forward exchange rate quoted is exactly equivalent to the spot
rate at the time of making the contract, the forward exchange rate is said to be at
Par.
At Premium: - The forward rate of currency, say the dollar is said to be at
premium with respect to the spot rate when one dollar buys more units of
another currency, say rupee in the forward than in the spot market.
At Discount: - The forward rate for a currency, say the dollar, is said to be at
discount with respect to the spot rate when one dollar buys fewer rupees in the
forward.
FUTURES;
While a future contract is similar to a forward contract, there are several
difficulties between them. While a forward contract is tailor –made for the client
by his international bank, a future contract has standardized features. The
contract size and maturity dates are standardized futures can be traded only on
an organized exchange and they are traded competitively. Margins are not
required in respect of a forward contract but margins are required of all
participants in the future market.
AcroPDF - A Quality PDF Writer and PDF Converter to create PDF files. To remove the line, buy a license.

MBA- H4030 International Business Finance
187
OPTIONS:
An option is a contract or financial instrument that gives holders the
right, but not the obligation, to sell or buy a given quantity of an asset a
specified price at a specified future date.
An option to buy the underlying assets is known as a call option, and an option
to sell the underlying assets is known as a put option.
Buying or selling the underlying assets via. The option is known as
exercising the option. The stated price paid (or received) is known as the
exercise or strike price .The buyer of an option is known as the long and the
seller of an option known as the writer of the option, or the short. The price for
the option is known as premium.
With reference to their exercise characteristics, there are two types of
options, American and European. An European option can be exercised only at
the maturity or expiration date of the contract, whereas an American option can
be exercised at any time during the contract.
BALANCE OF PAYMENT
The Balance of Payment summarizes economic transactions between the
residents of a given country and the residents of other country during a given
period of time.
AcroPDF - A Quality PDF Writer and PDF Converter to create PDF files. To remove the line, buy a license.
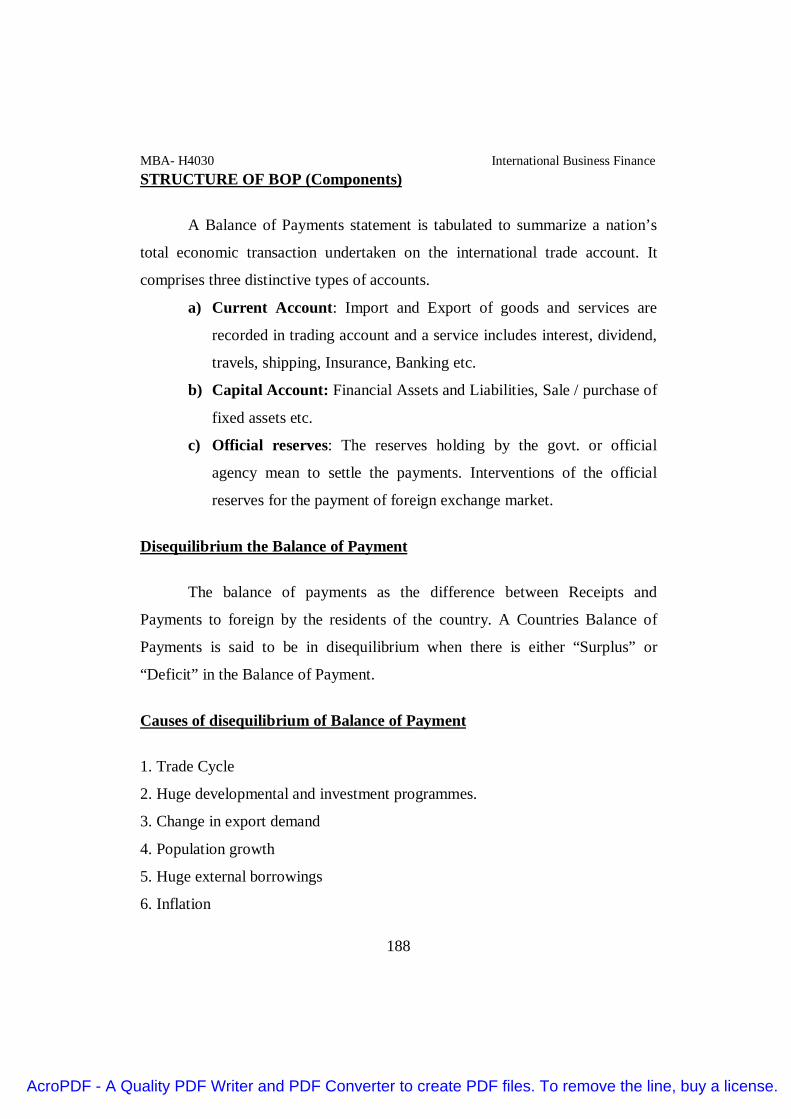
MBA- H4030 International Business Finance
188
STRUCTURE OF BOP (Components)
A Balance of Payments statement is tabulated to summarize a nation’s
total economic transaction undertaken on the international trade account. It
comprises three distinctive types of accounts.
a) Current Account: Import and Export of goods and services are
recorded in trading account and a service includes interest, dividend,
travels, shipping, Insurance, Banking etc.
b) Capital Account: Financial Assets and Liabilities, Sale / purchase of
fixed assets etc.
c) Official reserves: The reserves holding by the govt. or official
agency mean to settle the payments. Interventions of the official
reserves for the payment of foreign exchange market.
Disequilibrium the Balance of Payment
The balance of payments as the difference between Receipts and
Payments to foreign by the residents of the country. A Countries Balance of
Payments is said to be in disequilibrium when there is either “Surplus” or
“Deficit” in the Balance of Payment.
Causes of disequilibrium of Balance of Payment
1. Trade Cycle
2. Huge developmental and investment programmes.
3. Change in export demand
4. Population growth
5. Huge external borrowings
6. Inflation
AcroPDF - A Quality PDF Writer and PDF Converter to create PDF files. To remove the line, buy a license.

MBA- H4030 International Business Finance
189
7. Demonstration effects (social, cultural, political factors)
8. Reciprocal demand.
EXCHANGE RATE: EQUATION
Exchange rates are quoted in terms of number of units of foreign
currency bought for one unit of home currency that is $1. The method of quoted
foreign exchange can be direct or indirect. The direct quotation method means a
rate of exchange quoted in terms of X unit of home currency to one unit of
foreign currency. The indirect quotation method means a rate of exchange
quoted in terms of Y units of foreign currency per unit of home currency. In
London uses the direct quotation method, most other countries use the direct
quotation method.
The foreign exchange spot market is a currency market for immediate
delivery. in practice, payment and delivery are usually two working days after
the transaction date. The forward market involves rates quoted today for
delivery and payment at a future fixed date of a specified amount of one
currency against another. In the absence of barriers to international capital
movements, there is a relationship between spot and forward exchange rate,
interest rates and inflation rates. This relationship can be summarized as under:
AcroPDF - A Quality PDF Writer and PDF Converter to create PDF files. To remove the line, buy a license.

MBA- H4030 International Business Finance
190
Fisher effect
Equals
International fisher
Interest effect
Purchasing
Rate
power parity
Parity Equals Equals Equals
Equals
Expectation theory
THE FOUR WAY EQUIVALENCE IN THE FOREIGN EXCHANGE MARKET
Notations:-
So = Spot $ / £ Exchange rate now, Fo = Forward $ / £ Exchange rate now.
i$ = Euro dollar interest rate, i£ = Euro sterling interest rate, r = real return
Difference inexpected inflation
P£1P£-P$
+
Difference betweenSpot and forward
SoSo-Fo
Expected Change inspot
SoSoSt −
Difference inInterest Rate
£1i£-i$i+
AcroPDF - A Quality PDF Writer and PDF Converter to create PDF files. To remove the line, buy a license.

MBA- H4030 International Business Finance
191
St = Expected spot $ /£ exchange rate at time t, ft = Expected forward $ /£
exchange rate at time t.
P$ = US price level, P£ = UK price level. p$ = Expected US inflation, p£ =
Expected UK inflation.
(1) Interest Rates and Exchange Rates
Assume that an investor has £1m to invest for a period if 12 months. He
has a whole spectrum of investment opportunities he could put the money into
Sterling or dollar investment or into yen or into Deutschmarks or whatever the
currency markets are quoting the Dollar against sterling at $1.6800 spot and
$1.6066 for 12 months. Euro market fixed interest rates are 13% p.a. for 12
months Sterling and 8 1/16% p.a. fixed for US dollars for a similar period.
Difference in interest rate =£1i£-i$i+
=8 1/16%-13%
1+13%
=0.0437 or -4.37%
Difference between spot and forward =So
So-Fo
=1.6066-1.6800 = -0.0437 or -4.37%
1.6800
Interest rate parity theory
£ii£-i$
+=
SoSo-Fo
AcroPDF - A Quality PDF Writer and PDF Converter to create PDF files. To remove the line, buy a license.

MBA- H4030 International Business Finance
192
Notations:
i$ = Euro dollar interest rate
i£ = Euro sterling interest rate
Fo = Forward $/£ Exchange rate
So =Spot $ / £ Exchange Rate
(2)Exchange rates and inflation rates
Just like the above relationship between interest rate and exchange rate
there exist a similar hypothesis - related to inflation rate and exchange rates.
This relationship is also best approach by a numerical example:
If a commodity sells in the USA at $100 per kg and UK for £250 per kg
and the exchange is $1.70 to the pound Stering than a profitable opportunity exit
to buy the commodity in the USA, ship to Britain and sell them always
assuming that is Gross profit of $25 per kg.
Given by (250*1.70)-400, exceeding shipping at insurance cost from the USA
to UK.
The purchasing power parity (PPP) theory uses relative general price
changes as a proxy for prices of internationally traded goods and applying the
equation.
Change in $price of £ =l£priceleveinChange
$ pricelevelChangein
Thus if inflation is 8% p.a in the USA and 12% p.a in the UK, than applying
ppp theory we would expect the pound sterling to fall against the dollar by:
AcroPDF - A Quality PDF Writer and PDF Converter to create PDF files. To remove the line, buy a license.

MBA- H4030 International Business Finance
193
aP.%6.312.1
)12.008.0(=
−
Difference in Expected inflation
P£1P£-P$
+
P$ =US price level, P£=UK price level.
PPP theory, itself an approximation since it uses the general price level as a
proxy for the price level of internationally traded goods, suggesting that the
charges in the spot rate of exchange may be estimated by reference to expected
inflation differentials. When looking at Post Exchange rate movements, the
hypothesis might be tested reference to actual price level changes.
The precise formulation of the ppp theory:
=
St = Expected spot $/£ Exchange rate at “t” times
So = Spot rate $/£ Exchange rate
Expected difference in inflation rates
P£1P£-P$
+
Expected change in spot rate
SoSoSt −
AcroPDF - A Quality PDF Writer and PDF Converter to create PDF files. To remove the line, buy a license.

MBA- H4030 International Business Finance
194
(3)Interest rate and inflation rates [Fisher effect]
According to the ‘Fisher effect’, a term coined because it was observed
by US economist Irving Fisher, normal interest rates in a country reflect
anticipated real returns adjusted for local inflation expectations. In a world
where investors are internationally mobile, expected real rates of return should
tend towards equally, reflecting the fact that in search of higher real returns
investors arbitraging actions will force these returns towards each other, at least
there should hold with respect to the free market Euro currency interest rates.
Constraints on international capital mobility create imperfections which, among
other things, prevent this relationship from holding in domestic interest rate
markets. So normal Euro currency interest rates may differ for different
currencies, but according to the fisher effect only by virtue of different inflation
expectations. And these inflation differentials should underpin expected
changes in the spot rates of exchange.
The Fisher theorem suggests that local interest rates reflect a real
expected return adjusted for inflationary expectations, when money is
internationally mobile and market imperfections are eliminated, local interest
rates will be equal to the international real return adjusted for domestic
inflationary expectations.
The following two equivalences are implied:
=
Difference in interest
rates:£1i£-i$i+
Expected difference in
inflation rates:P£1P£-P$
+
AcroPDF - A Quality PDF Writer and PDF Converter to create PDF files. To remove the line, buy a license.
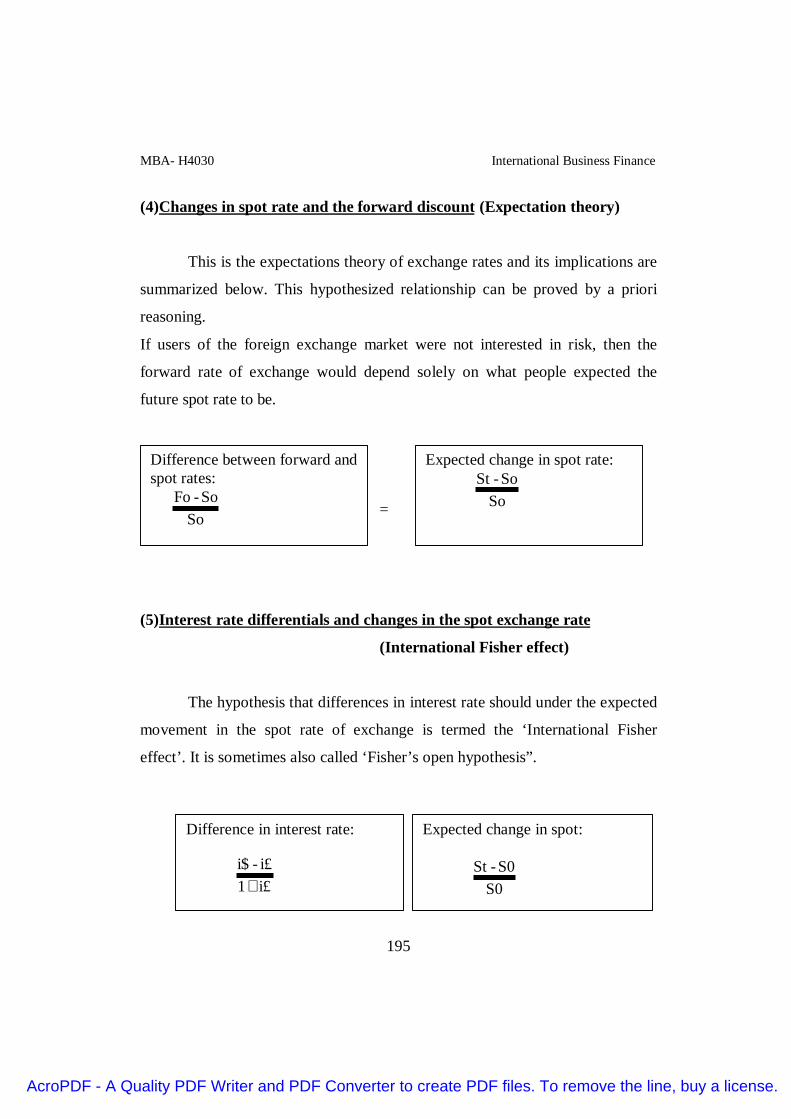
MBA- H4030 International Business Finance
195
(4)Changes in spot rate and the forward discount (Expectation theory)
This is the expectations theory of exchange rates and its implications are
summarized below. This hypothesized relationship can be proved by a priori
reasoning.
If users of the foreign exchange market were not interested in risk, then the
forward rate of exchange would depend solely on what people expected the
future spot rate to be.
=
(5)Interest rate differentials and changes in the spot exchange rate
(International Fisher effect)
The hypothesis that differences in interest rate should under the expected
movement in the spot rate of exchange is termed the ‘International Fisher
effect’. It is sometimes also called ‘Fisher’s open hypothesis”.
Difference between forward andspot rates:
SoSo-Fo
Expected change in spot rate:
SoSo-St
Difference in interest rate:
i£1i£-i$
+
Expected change in spot:
S0S0-St
AcroPDF - A Quality PDF Writer and PDF Converter to create PDF files. To remove the line, buy a license.

MBA- H4030 International Business Finance
196
‘Agio’ => Means the sum payable for the convenience of exchanging one kind
of money
For another. The term originally derived from Italian money lending
in the middle ages.
FOREIGN EXCHANGE RISK
Foreign exchange risk concerns risks created by changes in foreign
currency levels. An asset, liability or profit or cash flow stream, whether certain
or not, is said to be exposed to exchange risk when a currency movement would
change, for better or worse, its parent, or home, currency value. Exposure arises
because currency movements may alter home currency values.
Forms of currency risks
1. Transaction exposure
2. Translation exposure.
3. Economic exposure.
1. Transaction exposure
It arises because a payable or receivable is denominated in a foreign
currency. The transaction exposure arises because the cost or proceeds (in home
currency) of settlement of a future payment or receipt denominated in a currency
other than the home currency may vary due to changes in exchange rate. Clearly
transaction exposure is a cash flow exposure. It may be associated with trading
flows (trade Drs and Crs) dividend flows or capital flows.
AcroPDF - A Quality PDF Writer and PDF Converter to create PDF files. To remove the line, buy a license.

MBA- H4030 International Business Finance
197
2. Translation exposure
Translation exposure (sometimes also called accounting exposure) arises
on the consolidation of foreign currency denominated assets, liabilities and
profits in the process of preparing accounts. There are four basic translation
methods:
a) The current/non-current method:
This approach uses the traditional accounting distinction between
current and long term items and translates the former at the
closing rate and the latter at the historical rate.
b) The all-current(closing rate) method:
This method merely translates all foreign currency denominated
items at the closing rate of exchange. Accounting exposure is
given simple by net assets or shareholder’s funds (sometimes
called equity). This method has become increasingly popular
over time and is now the major world wide method of translating
foreign subsidiary’s balances sheet.
c) The monitory/non-monitory methods:
The monitory items are assets , liabilities or capital the amounts
of which are fixed by contract in terms of the number of currency
units regardless of changes in the value of money.
d) The temporal method:
The temporal method of translation uses the closing rate method
for all items stated or replaced cost, realized values. Market value or
expected future value, and uses the historical cost rate for all items stated
at historical cost.
AcroPDF - A Quality PDF Writer and PDF Converter to create PDF files. To remove the line, buy a license.
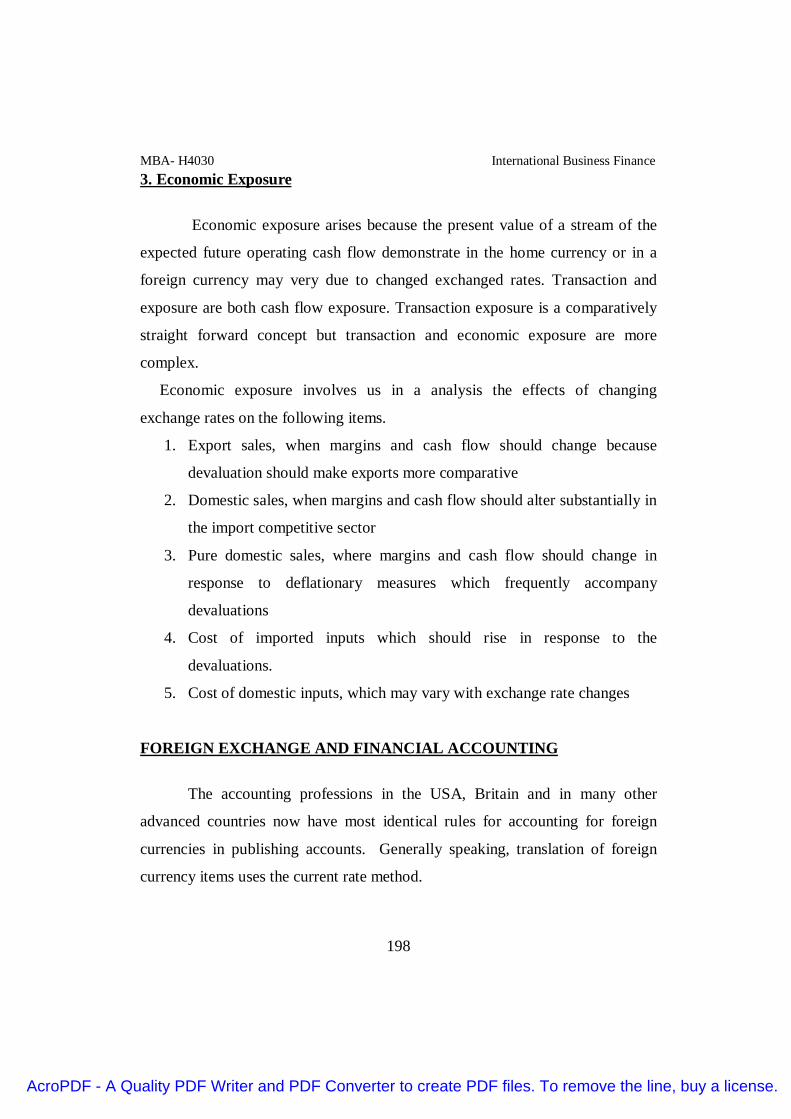
MBA- H4030 International Business Finance
198
3. Economic Exposure
Economic exposure arises because the present value of a stream of the
expected future operating cash flow demonstrate in the home currency or in a
foreign currency may very due to changed exchanged rates. Transaction and
exposure are both cash flow exposure. Transaction exposure is a comparatively
straight forward concept but transaction and economic exposure are more
complex.
Economic exposure involves us in a analysis the effects of changing
exchange rates on the following items.
1. Export sales, when margins and cash flow should change because
devaluation should make exports more comparative
2. Domestic sales, when margins and cash flow should alter substantially in
the import competitive sector
3. Pure domestic sales, where margins and cash flow should change in
response to deflationary measures which frequently accompany
devaluations
4. Cost of imported inputs which should rise in response to the
devaluations.
5. Cost of domestic inputs, which may vary with exchange rate changes
FOREIGN EXCHANGE AND FINANCIAL ACCOUNTING
The accounting professions in the USA, Britain and in many other
advanced countries now have most identical rules for accounting for foreign
currencies in publishing accounts. Generally speaking, translation of foreign
currency items uses the current rate method.
AcroPDF - A Quality PDF Writer and PDF Converter to create PDF files. To remove the line, buy a license.

MBA- H4030 International Business Finance
199
Transaction gains, whether realized or not, are accounted for through the
profit and loss account. But there is a major exception and this relates to a
foreign currency denominated borrowing where a transaction profit or loss
whether realized or not, arises from taking on a foreign currency borrowing in a
situation in which the borrowing can be designated as a hedge for a net
investment denominated in foreign currency, then the gain or loss on the
borrowing, if it is less than the net investment hedged, would be accounted for
by in reserves rather than through the income statement. If this kind of
transaction gain respectively on the net investment hedged, then the excess gain
or loss is to be reported in the profit and loss account.
Non- transaction gain and losses due to be dealt with by reserve
accounting direct to the balance sheet rather than through the profit and loss
account.
According to US accounting rules, translations of foreign currency
denominated profit and loss account are to be made at the average exchange rate
during the accounting period.
The British standard allows the use of either the current rate or the average rate
for this purpose. It is fair to say that opinion in Britain is moving towards the
average exchange rate method.
PRINCIPLES OF EXPOSURE MANAGEMENT
Hedging exposures, sometimes called risk management or exposure
management, is widely resorted to, by finance directors, corporate treasurers and
portfolio managers. The practice of covering exposure is designed to reduce the
AcroPDF - A Quality PDF Writer and PDF Converter to create PDF files. To remove the line, buy a license.
MBA- H4030 International Business Finance
200
volatility of the firms’ profits and/or cash generation and it presumably fallows
that this will reduce the volatility of the values of the firm.
Probability
Firms profit or cash flows / value of the firm
THE GOAL OF RISK MANAGEMENT
According to the theories of exchange rate movements show that the four
way equivalence of foreign exchange exposure and how will reduce the risks on
the different forms of risks i.e. Transaction, Translation and Economic
exposures.
According to PPP Movements in exchange rate offset price level
changes. If PPP were to hold immutably and with no time lag, there world, so
the argument goes, because no such thing as exposure rate risk and consequently
no need to hedge. If the annual rate of inflation in Britain is 10% higher than
that in US, the pound will depreciate against the USD by an appropriate % rate.
As a result, then is no relative price risk.
AcroPDF - A Quality PDF Writer and PDF Converter to create PDF files. To remove the line, buy a license.

MBA- H4030 International Business Finance
201
According to Capital Asset Pricing Model (CAPM), well diversified
international investor should not be willing to pay a premium for corporate
hedging activities which they, themselves, can readily replicate by adjusting
their own portfolios. Hedging to reduce overall variability of cash flow and
profits may be important to managers, compensated accordingly to short-term
results, but it is irrelevant to diversified shareholders. The ups and downs of
individual investments are compensated by holding a well diversified portfolio.
CAPM suggests that what matters in share pricing is systematic risk. If
exchange risk and interest risk are considered to be unsystematic. Then the
effect can be diversified anyway by holding a balanced portfolio. On the other
hand, if they are systematic and if forward and interest rate instruments are
priced according to CAPM, then all that the firm does by entering into hedging
contracts is to move along the Security Market Line (SML).
Creditors may be concerned with total variability of cash flows where
default is possible, gains and losses that the firm experiences due to random
currency fluctuations may influence valuation through the effect on debt
capacity. Where total variability is important, hedging in the foreign exchange
market may add to the firm’s debt capacity.
Modigliani and Miller (MM) can also array against hedging. MM argue
in respect of gearing, that the investor can manufacture home-made leverage
which achieves the same result as corporate gearing. The same kind of
argument apprise in respect of Individual hedging vs. Corporate hedging. In
other words, home made hedging, world made corporate hedging irrelevant. But
AcroPDF - A Quality PDF Writer and PDF Converter to create PDF files. To remove the line, buy a license.

MBA- H4030 International Business Finance
202
there are counter arguments here too. Hedging market are wholesale markets
and corporate hedging may, therefore, be cheaper. Furthermore, some hedging
techniques are only available to the company – leading and lagging and Transfer
pricing to name but two. Hedging requires information about current and future
exposures and contingent exposures too and it is doubtful whether investors
have anything like.
THE ARGUMENTS FOR CORPORATE HEDGING
If risk management is to be logically justified in financial terms, there
has to be a positive answer to the question. Will exposure management increase
the value of the firm? The fact that the firm is confronted with interest rates,
exchange rates and / or commodity price risk is only a necessary condition for
the firm to manage that risk. The sufficient conditions is that exposure
management increases the value of the firm.
Value of the firm (V) = E (NCFt) / (1+k) t
Where E (NCFt) = Expected Net Cash flows
K = Cost of capital (discounted at the firms ‘K)
Hedging can reduce the cost of financial distress by:-
• Reducing the probability of financial distress.
• Reducing the Costs imposed by financial problems
AcroPDF - A Quality PDF Writer and PDF Converter to create PDF files. To remove the line, buy a license.

MBA- H4030 International Business Finance
203
HEDGING REDUCES THE PROBABILITY OF FINANCIAL DISTRESS
Where VFD is the value of the firm above which financial distress is
encountered, it can be seen that hedging reduces the probability of financial
distress from point ‘p’ to point ‘q’.
Hedging and the tax system interrelate to impact upon the level of net
cash flows of the firm. How does this work? If company is facing an effective
tax schedule which is convex, than a reduction in the volatility of profit through
hedging can reduce corporate tax payable. What is meant by a convex tax
schedule? If the firm follows average effective tax rate raises the profit. (If the
tax schedule is convex, hedging can lead to a reduction in the firm’s expected
taxes. The more convex the tax schedule and the more volatile the firm’s pre-tax
profits, the greater are the tax benefits that accrue to the company. Corporate
tax schedule in Britain and the USA currently give the firm only minimal)
AcroPDF - A Quality PDF Writer and PDF Converter to create PDF files. To remove the line, buy a license.
MBA- H4030 International Business Finance
204
INFORMATION FOR EXPOSURE MANAGEMENT
Management of foreign exchange exposure is an integral part of the
treasury function in the multinational company. Rational decision taking
presupposes that relevant information pertinent to the decision is available. The
generalization is no less true of treasury management than it is of any other
aspect of business. To make logical decisions of foreign exchange exposure,
relevant information is required.
What kind of information? Transaction exposure, translation exposure
and Economic exposure, Macro economic exposure. Macro economic exposure
is concerned with how a firm’s cash flows, profits and hence value change as a
result of developments in the economic environment which includes, exchange
rate, interest rate, inflation rate, wage level, commodity price levels and other
shocks to the system. The analysis of macro economic exposure is very much
the leading edge of hedging techniques.
We have classified foreign exchange exposure under their headings;
transaction, translation and economic exposure. This contrasts with pure
translation exposure where difference arises due to accounting conventions in
the process of consolidating the financial accounts of companies within a group.
INTERNAL TECHNIQUES OF EXPOSURE MANAGEMENT
Internal techniques embrace Netting, Matching, Leading and Lagging,
pricing policies and Assets and Liability management.
AcroPDF - A Quality PDF Writer and PDF Converter to create PDF files. To remove the line, buy a license.

MBA- H4030 International Business Finance
205
External techniques include forward contracts, borrowings short term,
discounting, factorizing, government exchange risk guarantees and currency
options.
INTERNAL HEDGING STRATIGIES
Hedging device is a firm may be able to reduce or eliminate currency
exposure by means of internal strategies or invoicing arrangements like risk
sharing between the firms and its foreign customers. We take a look at some of
the commonly used or recommended methods.
INVOICING
The firm may be able to shift the entire exchange risk to the other party
by invoicing its exports in its home currency and insisting that its imports too be
invoiced in its home currency.
Empirically, in a study of the financial structure of foreign trade
Grassman (1973) discovered the following regulations:-
1. Trade between developed countries in manufactured products
is generally invoiced in the exporter’s currency.
2. Trade in primary products and capital assets are generally
invoiced in a major vehicle currency such as the USD.
3. Trade between developed and less developed countries tends
to be invoiced on the developed countries currency.
4. If a country has a higher and more volatile inflation rate then
its trading partners, there is a tendency not to use that
countries currency in trade invoicing.
AcroPDF - A Quality PDF Writer and PDF Converter to create PDF files. To remove the line, buy a license.

MBA- H4030 International Business Finance
206
Another hedging tool in this context is the use of “Currency Cocktails”
for invoicing. Thus for instance, a British importer of chemicals from
Switzerland can negotiate with the supplier that the invoice by partly in CHF
and party in GBP
NETTING AND OFFSETTING
A firm with receivables and payables in diverse currency can net out its
exposure in each currency by matching receivables with payables. Thus a firm
with exports to and imports from say Germany need not cover each transaction
separately. It can use a receivable to settle all or part of a payable, and take a
hedge only for the net DEM payable or receivable.
Netting also assumes importance in the context of cash management in a
multinational corporation with a number of subsidiaries and extensive intra-
company transactions. Eg: American parent co. with subsidiary in UK and
France. Suppose that the UK subsidiary has to make a dividend payment to the
parent of GDP 2,50,000 in three months time, the parent has three months
payable of EUR 5,00,000 to the French subsidiary, and French subsidiary has 3
months payable of GBP 3,00,000 to a British supplier (who is not a part of the
Multinational). A netting system might work as follows.
The forecasts of spot rates these matters here are:-
GBP/ USD: 1.50 EUR/ USD: 0.9000 implying GBP/EUR: 1.667. The
UK subsidiary is asked to pay GBP 2, 50,000 to the French subsidiary’s UK
supplier. Thus the French firm has to hedge only the residual payable of GBP
50,000. GBP 2, 50,000 converted into EUR at the forecast exchange rate
AcroPDF - A Quality PDF Writer and PDF Converter to create PDF files. To remove the line, buy a license.

MBA- H4030 International Business Finance
207
amount to EUR 4, 16,675. The Parent may obtain a hedge for the residual
amount of EUR 83,325.
Netting involves associated companies which trade with each other. The
technique is simple. Group companies merely settle inter-affiliate indebtedness
for the net amount owing. Gross intra-group trade receivables and payables are
netted out. The simplest scheme is known as bilateral netting.
Scheme for bilateral netting:
UK subsidary
SWISS subsidary French subsidary
= Netting arrangement
Multi-lateral netting : It is more complicated but in principle is no different
from bilateral netting. Multi-lateral netting involves more than two associated
companies. Inter-group debt virtually always involves the services of the group
treasury.
AcroPDF - A Quality PDF Writer and PDF Converter to create PDF files. To remove the line, buy a license.
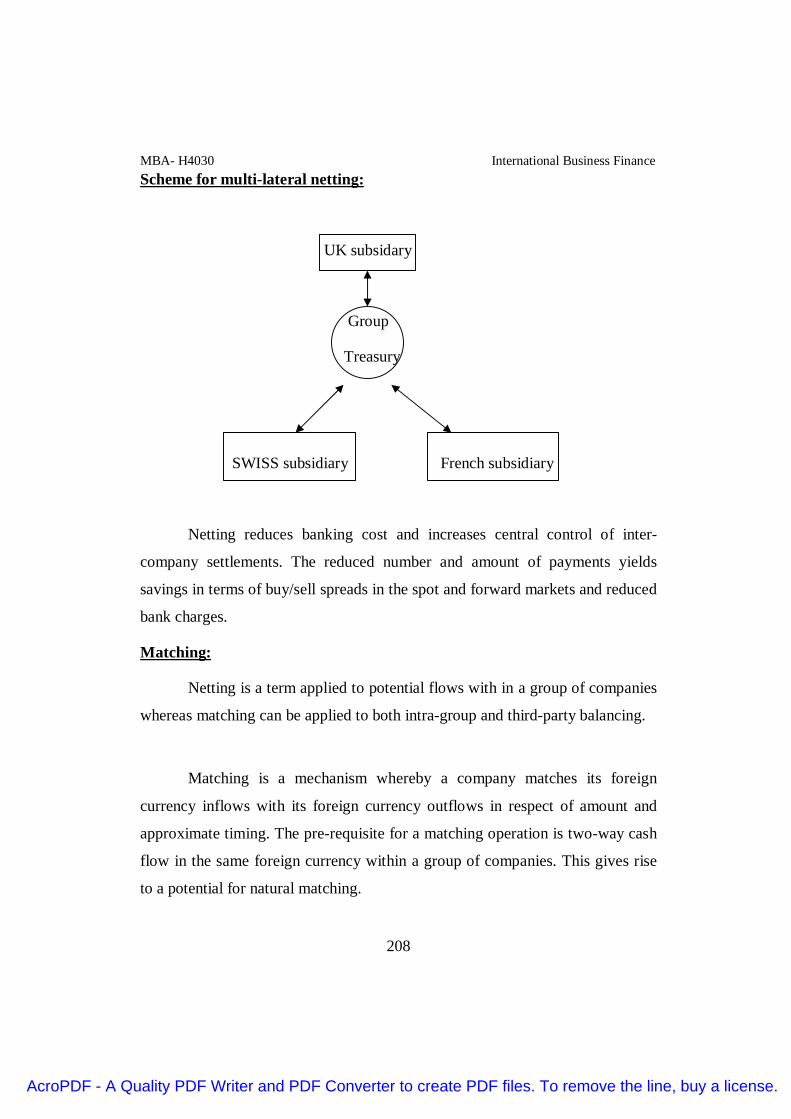
MBA- H4030 International Business Finance
208
Scheme for multi-lateral netting:
UK subsidary
Group
Treasury
SWISS subsidiary French subsidiary
Netting reduces banking cost and increases central control of inter-
company settlements. The reduced number and amount of payments yields
savings in terms of buy/sell spreads in the spot and forward markets and reduced
bank charges.
Matching:
Netting is a term applied to potential flows with in a group of companies
whereas matching can be applied to both intra-group and third-party balancing.
Matching is a mechanism whereby a company matches its foreign
currency inflows with its foreign currency outflows in respect of amount and
approximate timing. The pre-requisite for a matching operation is two-way cash
flow in the same foreign currency within a group of companies. This gives rise
to a potential for natural matching.
AcroPDF - A Quality PDF Writer and PDF Converter to create PDF files. To remove the line, buy a license.

MBA- H4030 International Business Finance
209
LEADING AND LAGGING
Another internal way of managing transaction exposure is to shift the
timing of exposures by leading or lagging payables and receivables. The
general rule is lead, that is, advance payables and lag, that is, postpone
receivables in ‘Strong’ currency and conversely, lead receivable and lag
payables in weak currencies.
An American firm has a 180 day payable of AUD 1,00,000 to an
Australian supplier. The market rates are:-
USD/ AUD SPOT: 1.3475, 180 day forward: 1.3347
Euro US $ 180 day interest rate 10% p.a
Euro AUD 180 day interest rate 8% p.a
The Australian authorities have imposed a restriction on Australian firms
which prevents them from borrowing in the Euro AUD market. The American
firm wants to evaluate the following four alterative hedging stratigies:-
a) Buy AUD 1,00,000 180 day forward (forward)
b) Borrow US$, convert Spot to AUD, invest in a Euro AUD deposit,
settle the payable with the deposit proceeds (Money market cover)
c) Borrow AUD in the Euro market, settle the payable, buy AUD 180
day forward to pay off the loan (lead with a forward).
Let us determine US $ outflow 180 day have under each strategy:-
1. Forward Cover:- US $ outflow = 1,00,000 / 1.3347 =
74923.204
2. Money market cover:- The firm must invest AUD
(1,00,000/ 1.04) ie,
AcroPDF - A Quality PDF Writer and PDF Converter to create PDF files. To remove the line, buy a license.

MBA- H4030 International Business Finance
210
AUD 9,61,538.46 to get AUD 1,00,000 on maturity. To obtain
ie, must borrow and sell spot US (961538.46 / 1.3475) = US
7,13,572.
3. Lead:- The American firm can possibly extract a discount at
9.5% p.a. from the Australian firm since this is the latter
opportunity cost of short term funds. Thus leading would
require cash payment of AUD ( 1,00,000 / 1.0475) = AUD
9,54,653.94
4.Lead with a forward:- The firm must borrow AUD 9,54,653.94 at 8% p.a
requiring repayment of AUD 9,92,840.10 which must be bought forward
requiring an outflow of US $ 7,43,867.61. This is equivalent to the lead
strategy. You can convince yourself that if the American firm’s borrowing cost
were higher than the Euro US $ rate, the lead with forward strategy would have
been better than a simple lead.
In effect, leading and lagging involve trading off interest rate
differentials against expected currency appreciation or depreciation.
Risk Sharing: Another non-market based hedging possibility is to work out a
currency risk sharing agreement between the two parties. For instance, the
exporter and importer.
Let us work an illustrative example:-
An Indian company has exported a shipment of garments to an American
buyer on 90 days credit terms. The current USD/ INR Spot is 46.25 and 90 days
forward is 47.00. The payment terms are designed as follows:-
a) The National amount of the invoice is USD 1,00,000. If at
settlement, the Spot USD/ INR rate, ST, is greater than or equal
AcroPDF - A Quality PDF Writer and PDF Converter to create PDF files. To remove the line, buy a license.

MBA- H4030 International Business Finance
211
to 46.00 but less than or equal to 48.00, the national invoice
amount of USD 1,00,000 would be translated into rupees at a
rate of Rs. 47 per dollar, i.e. Rs. 47,00,000 buyer cost will vary
between USD 97916.67 ( = 47,00,000 / 48) & USD 102173.91
( = 47,00,000 / 46).
b) If the spot rate at settlement is less then 46.00, the conversion
rate would be [( 47.00- 0.5) ( 46.00 - ST)]. The buyer cost
would be USD (4500000 / 42) = USD 107142.86.
EXTERNAL TECHNIQUES OF EXPOSURE MANAGEMENT
External techniques of exposure management resort to contractual
relationships outside of a group of companies in order to reduce the risk of
foreign exchange losses. External techniques include forward exchange
contracts, Short-term borrowings, financial future contracts, currency options,
discounting bills receivable factoring receivables, currency overdrafts, currency
SWAP’s and government exchange risk guaranties.
Forward markets: A forward foreign exchange contract is an agreement
between two parties to exchange one currency for another at some future date.
The rate at which the exchange is to be made, the delivery date, and the amounts
involved are fixed at the time of the agreement. This may be used to cover
receivables and payables, but also enables a company or high net worth
individual to speculate on foreign currency movements.
Forward markets are available for periods beyond 5 years for such
currencies as USD, Sterling, DEM, Francs, Yen, Canadian dollars and so on. 10
AcroPDF - A Quality PDF Writer and PDF Converter to create PDF files. To remove the line, buy a license.

MBA- H4030 International Business Finance
212
year forwards are quoted by a few banks for many of the above. The forward
market may be used to cover a receipt and payment denominated in a foreign
currency when the date of receipt for payment is known. But it can be readily
adopted to allow for situations when the exact payment date is not known.
FORWARD OPTIONS:
Britain exporter may decide to cover despite an uncertain payment date
via a forward option. Forward market has the maturity period for making
payment but forward option has no date of maturity.
Swap deals: Another method of dealing with unspecified settlement date is by
a swap deal. This method is virtually always cheaper than covering by way of
forward options. A swap involves the simultaneous buying and selling of
currency for different maturities. Swap deals used for forward cover are of two
basic types: Forward/ Forward and Spot / Forward. In either case, the exporter
begins by covering the foreign currency transaction forward to an arbitrarily
selected but fixed date, just as in an ordinary fixed date forward contract. Then
if the precise settlement date is subsequently agreed before the initial forward
contract matures. The original settlement date may be extended to the exact date
by a forward/ forward swap.
Short term borrowings: Short-term fixed rate borrowings or deposits is another
technique for covering foreign-currency denominated receivables and payables
respectively. Assume credit available to/by three to six months, it can be
arranged an overdraft, discounting of bills, commercial papers is a corporate
AcroPDF - A Quality PDF Writer and PDF Converter to create PDF files. To remove the line, buy a license.
MBA- H4030 International Business Finance
213
short-term, unsecured promissory note issued or a discount to yield business.
The commercial papers maturity generally do not exceed 270 days.
Currency overdrafts and currency hold accounts simply use floating rate
borrowing and depositing respectively, to achieve the same ends as under short-
term borrowings or depositing with a fixed rate. The difference is clearly one of
interest rate exposure. Floating rate borrowings or depositing clearly gives risk
to an interest rate exposure, fixed rate finance does not.
EXCHANGE RISK GUARANTEES:
As part of a series of encouragement to exporters, government agencies
in many countries offer their business insurance against export credit risk and
certain export financing schemes. Many of these agencies offer exchange risk
insurance to their exporters as well as the usual export credit guarantees. The
exporter pays a small premium and in return the government agency absorbs all
exchange risk, thereby taking profits and absorbing losses. To value and to
check with such bodies are ECGD in the UK, HERMES in Germany, COFACE
in France, Netherlands Credit Insurance Company in Holland, EXIM bank in the
USA, ECGC in India and so on.
AcroPDF - A Quality PDF Writer and PDF Converter to create PDF files. To remove the line, buy a license.

MBA- H4030 International Business Finance
214
Review Questions:1. What is bank draft?
2. What is an Exchange rate spread?
3. What is a spot exchange rate?
4. What is inter bank spot market?
5. What is SWIFT and what does it do?
6. What is CHIPS? What does it do?
7. What is a Cross rare?
8. What is forward rate?
9. Explain fully the meaning of “foreign exchange”
10. Explain India’s exchange rate policy under floating rates.
11. What is forward premium?
12. What goes on the exes of a payoff profile for a forward exchange
contract?
13. Why under what conditions is the forward rate equal to the expected
futures spot rate?
14. What is the meaning of “Margin” on a futures contract?
15. What is meant by “Marking to Market”?
16. What is put option and call option of a currency?
17. What is meant by the time value on an option?
18. What are “invisibles” in the Balance of Payment?
19. What is special drawing right(SDR)?
20. What are official reserve assets?
21. What is Balance of Trade Deficit?
22. Flexible exchange rates determined by supply and demand: describe.
23. Why does inflation shift up a countries demand curve for a product in
proportion to inflation? Does the explanation have to do with the
AcroPDF - A Quality PDF Writer and PDF Converter to create PDF files. To remove the line, buy a license.

MBA- H4030 International Business Finance
215
inflation raising all prices and incomes, and leaving relative prices and
real incomes unchanged?
24. What are theories of Exchange rate?
25. Describe PPP Theory.
26. What is meant by Exchange rate overshooting?
27. What is meant Agio?
28. Why does the monitory approach imply that higher expected inflation
causes a currency to depreciate?
29. What are determinants of Foreign Exchange?
30. What is a Central Bank Swap?
31. What is foreign exchange risk? And how to manage foreign exchange
risk?
32. Describe internal and external exposure management.
33. What is meant by exchange rate risk guarantee?
34. Describe leading and lagging
AcroPDF - A Quality PDF Writer and PDF Converter to create PDF files. To remove the line, buy a license.

MBA- H4030 International Business Finance
216
CURRENCY MNEMONICS
These symbols for national currencies are those routinely used by foreign
exchange traders
AUD-Australian dollar
BRL- Brazilian real
CAD -Canadian dollar
CHF- Swiss franc
CZK -Czech koruna
DKK- Danish krone
EUR- Euro
GBP -Great Britain pound
HKD- Hong Kong dollar
IDR -Indonesian rupiah
INR- Indian rupee
JPY- Japanese yen
KRW -Korean won
MXN- Mexican peso
NOK- Norwegian krone
NZD -New Zealand dollar
PLZ -Polish zloty
RUR -Russian rouble
SEK- Swedish krone
SGD -Singapore dollar
THB- Thai baht
TWD -Taiwanese dollar
AcroPDF - A Quality PDF Writer and PDF Converter to create PDF files. To remove the line, buy a license.

MBA- H4030 International Business Finance
217
Unit V
International capital and money market Instruments GDRs, ADRs, IDRs,
Eurobonds, Euroloans, Repos, CPS, Floating rate instruments, Loan Syndication
and Euro deposits.
________________________________________________________________
1) Financial Markets :
Financial markets are markets for financial assets or liabilities. A useful
way to categorize financial market is according to maturity.
Financial markets are categorized into money markets and capital
markets.
Money markets are markets for financial assets and liabilities of short
maturity, usually considered to be less than one year. The market for short-term
Eurocurrency deposits and loans is an example of a money market. Capital
markets are markets for financial assets and liabilities with maturities greater
than one year. These markets include long-term government and corporate
bonds as well as common and preferred stock.
2) Capital markets Vs Money market :
The most important difference between short-and long-term versions of a
particular financial asset is in the liquidity of the asset. Liquidity refers to the
ease with which you can exchange an asset for another asset of equal value.
Consider the floating-rate Eurocurrency market. There is an active Eurocurrency
market for major currencies for maturities of one year or loss. At longer
maturities, liquidity in the Eurocurrency markets dries up even for the most
actively traded currencies. There is very little liquidity in Eurodolloar deposits
AcroPDF - A Quality PDF Writer and PDF Converter to create PDF files. To remove the line, buy a license.
MBA- H4030 International Business Finance
218
and loans with maturities greater than two years, and most other currencies have
low liquidity beyond one year. Similarly, although there are forward markets for
major currencies in maturities up to ten years, liquidity is poor and bid-ask
spreads are large at distant forward dates. Covered interest arbitrage is quite
effective at enforcing interest rate parity over long short maturities, but it is
much less effective at enforcing interest rate parity over long maturities because
of poor liquidity in the long-term forward currency and Eurocurrency markets.
Despite the apparently arbitrary classification of financial markets
according to maturity, the distinction is important because market participants
tend to gravitate toward either short or long-term instruments. Bond investors
match the maturities of their assets to those of their liabilities, and so have
strong maturity preferences. Commercial banks tend to lend in the short-and
intermediate-term markets to offset their short-and intermediate-term liabilities.
Like insurance companies and pension funds invest in long-term assets to
counterbalance their long-term obligations. The distinctions between capital and
money markets are also often encoded in national regulations governing public
securities issues.
International Money and Capital Markets :
International money and capital markets are for lending and borrowing
moneys or claims to money in various currencies in demand outside the country
of origin. By far the most important of such money markets are located in
Europe called the Euro-currency markets. Asian currency market located in the
East. Although US dollars are most frequently traded in these markets, any
internationally convertible currency which has a demand and supply can also be
traded.
AcroPDF - A Quality PDF Writer and PDF Converter to create PDF files. To remove the line, buy a license.
MBA- H4030 International Business Finance
219
As in the case of international money markets represented by Euro-
currency markets or Asian currency markets, there are international capital
markets as well, represented by Euro-bond or Asian-bond markets, which reflect
the lendings or borrowings at the long-end of the liquidity spectrum of five years
and above. While such international money markets have developed in the
fifties, the corresponding capital markets have grown in the sixties.
Both the money and capital markets of this type for off-shore
funds were of recent vintage, when the old sources of funds under the pre-war
system of borrowing from the domestic money and capital markets of New York
and London etc., had dried up. Domestic money markets in the post-war world
were greatly insulated from foreign money markets in most cases due to the
prevailing exchange controls in the interest of pursuit of independent domestic
monetary policy, but the interactions and effects of one on the other could not be
completely ruled out. Trading in these currencies is both for short-term and
long-term and in any of the currencies which are convertible. The bonds or
certificates can be denominated in any convertible currency in which the
borrower and the lender have confidence in terms of the stability of the
currency, its future value and intrinsic strength of the economy.
3. International Debt Markets :
Debt Markets can be categorized along three other dimensions : (a)
intermediated versus non intermediated, (b) internal versus external, and (c)
domestic versus international.
a) Intermediated versus Non-intermediated Debt Markets :
Funds can be moved from savers to borrowers either through a financial
intermediary such as a commercial bank or directly through a securities market.
AcroPDF - A Quality PDF Writer and PDF Converter to create PDF files. To remove the line, buy a license.

MBA- H4030 International Business Finance
220
For this reason, debt markets can be classified according to whether or not a
financial intermediary stands between borrowers and savers. In an
intermediated debt market, a financial institution such as a commercial bank
channels loanable funds from individual and corporate savers to borrowers. In a
non-intermediated (or direct) debt market, borrowers such as governments and
large corporations issue securities directly to the public without using a financial
institution as an intermediary.
(i) Commercial Banks as Financial Intermediaries : Commercial banks
develop a need to “go global” as they follow their customers into foreign
markets. International commercial banks provide a complete line of financial
services to facilitate the overseas trade of their customers. In addition to
commercial credit, commercial banks provide a variety of ancillary services
including market-making in spot and forward currency, invoicing, collection,
cash management, and trade financing through letters of credit, banker’s
acceptances, or forfaiting purchasing medium – to long – term receivables at a
discount from face value). International banks also often provide interest rate
and currency risk management services.
(ii) Non intermediated (Direct) Debt Markets :
Bonds issued directly to the public fall under the non-intermediated debt
category. The U.S. Government is the world’s largest single borrower, so not
surprisingly, the United States heads the list of government bond markets. The
Size of national corporate bonds markets generally follows the ranking of
government bond markets. The U.S. corporate bond market is the world’s
largest corporate bond market. Large U.S. based corporations rely more heavily
on the public debt market than do their counterparts in most other countries,
although publicly traded bonds also play a major role in the financing of
AcroPDF - A Quality PDF Writer and PDF Converter to create PDF files. To remove the line, buy a license.

MBA- H4030 International Business Finance
221
corporations in the United Kingdom. In most other countries, commercial banks
assume a more prominent role in allocating debt and equity capital. Despite the
rapid growth of euro-denominated bond and equity markets, small and midsize
corporations in Europe still raise most of their capital through commercial
banks.
b) Internal and External Debt Markets :
The fact that bonds can be issued in other than the functional currency of
the borrower suggests another way that debt markets can be categorized. Debt
placed in an internal market is denominated in the currency of a host country
and placed within that country. Debt placed in an external market is placed
outside the borders of the country issuing the currency. Government regulation
and intervention are nearly absent in the short-term external Eurocurrency
market. In contrast, internal markets for long-term debt capital are closely
monitored and regulated by local authorities. Government influence in the long-
term external Eurobond markets is a little less direct than in internal markets, but
no less important. Government regulation of internal and external bond markets
is discussed in the cussed in the following section.
c) Domestic and International Bonds : Debt issues can be further categorized
according to whether they are sold into domestic or international markets.
Domestic bonds are issued by a domestic company, traded within that country’s
internal market, and denominated in the functional currency of that country.
International bonds are traded outside the country of the issuer. International
bonds come in two varieties : Foreign bonds are issued in a domestic market by
a foreign borrower, denominated in domestic currency, marketed to domestic
residents, and regulated by the domestic authorities. Eurobonds are denominated
AcroPDF - A Quality PDF Writer and PDF Converter to create PDF files. To remove the line, buy a license.
MBA- H4030 International Business Finance
222
in one or more currencies but are traded in external markets outside the borders
of the countries issuing those currencies. Large borrowers that are well-known
internationally sometimes find that their financing costs are lower in foreign
bond markets or in the external Eurobond market than in their own domestic
bond market. These opportunities arise because of disequilibrium in the
international parity conditions; in particular, cross-market differences in real
borrowing costs. Smaller borrowers from non-EU countries typically find that
their borrowing costs are lower for domestic bond issues than for international
bond issues because of the higher information costs faced by international
investors. Borrowers from Emu-zone countries often raise funds in the highly
liquid external Eurobond market, most commonly in euros but also in dollars,
yen, or pounds sterling.
Domestic Bonds and National Bond Markets :
The most prominent bonds selling in national bond markets are domestic bonds.
Because they are issued and traded in an internal market, domestic bonds are
regulated by the domestic government and are traded according to the
conventions of the local bond market. The “GMAC zr 15” listed as a domestic
bond is a zero coupon dollar denominated bond issued by General Motors
Acceptance Corporation, maturing in the year 2015, and traded on the band
trading floor of the New York Stock Exchange.
Domestic bonds are preferred by domestic investors. Borrowers in the
domestic market tend to be domestic Government. Domestic borrowers often get
better prices for bonds issued domestically than bonds issued in foreign
countries. European corporation are finding that euro-denominated bonds offer
attractive interest rates relative to bank financing – without the bother of a
commercial bank looking over their shoulder.
AcroPDF - A Quality PDF Writer and PDF Converter to create PDF files. To remove the line, buy a license.

MBA- H4030 International Business Finance
223
The success of the euro corporate bond market will come at the expense
of lending by European commercial banks. A study by the Bank for
International Settlements estimates that one-third of European banks’ corporate
loans business will be diverted to public debt and equity issues after the
introduction of the euro. Many European commercial banks are expanding their
investment banking activities as their commercial lending business is displaced
by public debt issues.
Corporate and government bonds in Canada, Japan, and the United
States are issued as registered bonds. In countries requiring that bonds be issued
in registered form, each issuer maintains a record of the owners of its bonds.
The convention in European countries is to use bearer bonds. Bearer
bonds are not registered and can be redeemed by the holder. The principle
advantage of bearer bonds is that they retain the anonymity of the bondholder.
European bond dealers quote bond prices as an effective annual yield
that assumes annual compounding. Foreign bonds are issued in another
country’s internal market and denominated in the local currency. Foreign bonds
are issued by a foreign borrower but traded in another country’s internal market
and denominated in the local currency. Foreign bonds are issued in the local
currency to make the bonds attractive to local residents and regulated by local
authorities. Bond trading conventions on foreign bonds typically conform to the
local conventions rather than those of the borrower. Foreign bonds are known as
“Yankee bonds” in the United States, as “Bulldog bonds” in the United
Kingdom, and as “Samurai bonds” in Japan.
AcroPDF - A Quality PDF Writer and PDF Converter to create PDF files. To remove the line, buy a license.

MBA- H4030 International Business Finance
224
Eurobonds – Necessity is the Mother of Invention :
The second type of international bond is the Eurobond.
Eurobonds are issued and traded in the external bond market.
Eurobonds are issued and traded in the external bond market. The
FNMA 7.40 04” bond issue in the Eurobond category. Several thousand
Euroband issues now trade in the secondary market. The most common
Eurobond currencies are the U.S. dollar, Emu-zone euro, British pound sterling,
and Japanese yen.
The Swiss franc is notably absent from the list of Eurobond currencies.
The Swiss Central bank, Banque Nationale Suisse, does not allow Swiss banks
or foreign banks with Swiss branches to trade Eurobonds denominated in Swiss
francs. The Swiss foreign bond market trades more foreign bonds than any other
national bond market because it substitutes for the nonexistent Swiss franc
Eurobond market.
Global Bonds :
A global bond is a bond that trades in the Eurobond market as well as in
one or more national bond markets. To appeal to a global investor base,
borrowers must be large and AAA-rated and must borrow in actively traded
currencies. The World Bank established this market with a series of dollar-
denominated issued in the late 1980s. Historically, global bonds have been
denominated in dollars to take advantage of high liquidity in the dollar market.
Since 1999, global bonds are increasingly being issued in euros. Matsushita
Electric Industrial Company was the first corporate borrower to tap the global
bond market.
AcroPDF - A Quality PDF Writer and PDF Converter to create PDF files. To remove the line, buy a license.
MBA- H4030 International Business Finance
225
International debt instruments
Debt management, whether at the domestic or international level, is part
of the company’s armoury of techniques which is designed to maximize the
present value of shareholder wealth. It is often speculated that the key
determining factors are as follows:
1. The amount of business risk affecting the firm.
2. The ability of the firm to service debt, in terms of interest payments
and capital repayments, under varying scenarios regarding future outturns.
3. The limits imposed by financiers’ lending policies and practices.
4. The perceived norm for the sector.
5. The firm’s historic track record in terms of debt raised and the
volatility of its earnings.
Beyond the debt / equity ratio, there are a number of factors include
maturity profile, fixed / floating interest mix, interest rate sensitivity and
currency mix.
Long-term assets should be funded by long-term finance; short-term
assets would logically be backed by short-term funds. In terms of maturity
profits of debt, the treasurer is well advised to ensure that repayments of
borrowings are evenly spread. This reduces exposure to repayment
vulnerabilities, which may be magnified due to unforeseen recession.
Short-term debt is riskier than long-term debt. Long-term interest rates
are generally more stable over time then short-term rates. The firm which
AcroPDF - A Quality PDF Writer and PDF Converter to create PDF files. To remove the line, buy a license.

MBA- H4030 International Business Finance
226
borrows predominantly on a short-term basis may experience widely fluctuating
interest rate payments. Short-term borrowings have to be renewed regularly.
The interest rate on a fixed rate loan is fixed for the entire life of the loan
regardless of changes in market conditions. A floating rate loan is one where the
interest rate varies in line with the market. The loans are usually made at an
agreed margin over a published market rate. This may be a clearing bank’s base
rate for sterling or prime rate for US dollar, or LIBOR (London inter-bank
offered rate) for term loans whether in sterling, dollars or Eurocurrency, and so
on.
(A) Short-term borrowing :
Short-term debt is defined as borrowings originally scheduled for
repayment within one year. A wide range of short-term debt finance is available.
Trade credit is the major source. In its normal transactions, the firm buys
raw materials on credit from other firms. The debt is recorded as trade creditors
in its books of account. This is a customary aspect of doing business in most
industries. It is a convenient and important source of financing for most non-
financial companies.
The next most frequent form of short-term finance, at least in the UK, is
the overdraft. An overdraft is a credit arrangement whereby a bank permits a
customer to run its current account into deficit up to an agreed limit. The
overdraft is flexible and is for providing seasonal working capital. Bankers like
to see overdrafts run down to zero at some point during the year. Nowadays
companies tend to finance some of their core borrowing needs by overdraft. The
overdraft borrower is at liberty to operate within the established limit and to
AcroPDF - A Quality PDF Writer and PDF Converter to create PDF files. To remove the line, buy a license.

MBA- H4030 International Business Finance
227
repay and redraw any amount at any time without advance notice or penalty.
The interest charged is usually on an agreed formula, such as between one and
four or five percentage points above the bank’s base rate. The size of this spread
depends on the credit rating of the borrower.
Turning now to money-market sources of short-term debt, the domestic
sterling inter-bank market provides a source of corporate borrowing. In this
market, the corporate customer obtains very competitive borrowing and deposit
rates. The interest rate is usually based on a margin over LIBOR. Large
companies may obtain funds at LIBOR or at a very small spread over LIBOR.
Transactions are for fixed terms, which can be anything from overnight to
twelve months.
Sterling eligible bills – or bankers’ acceptances are bills of exchange and
they are the oldest instrument in the UK money market. The purpose of the UK
bill market is to provide trade finance. Acceptances are issued on a discounted
basis. Clearly, the true cost of borrowing is higher than the nominal discount
rate. If the discount rate plus commission is quoted as 15 ½ per cent, this
amounts to a true rate of interest of well over 16 ¼ per cent. The procedure for
companies wishing to use this market is to discount the bills with an accepting
bank. The bill will be discounted at the eligible bill rate. The accepting bank
receives an acceptance commission for discounting the bill. The bank pays the
proceeds of the discounted bill to the company’s bank account. Once the
accepting bank receives the bill, it will endorse it. The bank may either hold it
for its own trading purposes or rediscount it with a discount house. On maturity,
the company – or its agent – pays the face value of the bill to the holder at that
firm.
AcroPDF - A Quality PDF Writer and PDF Converter to create PDF files. To remove the line, buy a license.

MBA- H4030 International Business Finance
228
Another source of short-term funds is borrowing via commercial paper –
basically an IOU. Since April 1986 there has been a market in sterling
commercial paper. This paper is in the form of unsecured promissory notes. Its
duration is from 7 to 364 days. There are strict rules about which corporations
can, and cannot, issue sterling commercial paper. The virtue of this market to the
company is endorsed by the fact that a top rate corporation may raise money at
around five basis points below LIBID, the London inter-bank bid rate, which is,
of course, always less than LIBOR. Unlike US commercial paper, credit rating
is not a prerequisite of issue in the UK. The greatest source of short-term
funding in the USA is commercial paper.
B) Medium-term borrowing :
Medium-term debt is defined as borrowings originally scheduled for
repayment in more than one year but less than ten years. Until about fifteen year
ago, European corporate treasures had few options when seeking to raise debt –
the opportunities included overdraft or short-term bill discounting and long-term
debentures and mortgages. This range of choice was poor compared to that
confronting the treasurer in the USA, where there has always been an array of
medium-term finance available. The expansion of US banks in the international
arena aided by the colossal expansion of the Euromarkets and the widespread
demise of exchange controls have meant that these financing techniques have
been exported to European companies.
Nowadays, medium-term borrowing facilities are widely available.
Repayment schedules are negotiable but the usual practice is to require periodic
repayments over the life of the loan. The rationale of amortization is to ensure
that the loan is repaid gradually over its life in equal instalments commensurate
AcroPDF - A Quality PDF Writer and PDF Converter to create PDF files. To remove the line, buy a license.

MBA- H4030 International Business Finance
229
with corporate cash generation rather than falling due all at once. Medium-term
loans are normally priced on a basis related to LIBOR. The spread over LIBOR
depends on the credit standing of the borrower and the maturity of the facility.
They normally vary between 0.25 and 2 per cent.
There are two types of fee associated with medium-term facilities. First,
there is the commitment fee. The bank is usually committed to lend once the
loan agreement is signed. This commitment fee is usually payable for the
portion of the loan which is undrawn. The size of the fee may be ten to fifteen
basis points.
When the facility is arranged via a syndication of banks, it is normal for
the borrower to pay a management fee. The fee is similar to underwriting fees
associated with public issues.
Euromarkets :
Euro-dollar or Euro-currency markets are the international currency
markets where currencies are borrowed and lent. Each currency has a demand
and a supply in these markets. Thus, dollar deposits outside USA or sterling
deposits outside UK are called off-shore funds and have a market so long as they
are convertible and readily usable in international transactions.
Euro-currency market is a market principally located in Europe for
lending and borrowing the world’s most important convertible currencies,
namely, dollar, sterling, DM, French franc, yen, etc. On the same basis, the
Asian currency market or the African currency market can also be defined.
AcroPDF - A Quality PDF Writer and PDF Converter to create PDF files. To remove the line, buy a license.

MBA- H4030 International Business Finance
230
The Euromarkets are usually defined to include the markets for
Eurocurrency, Eurocredits and Eurobonds. The Eurocurrency market is that
market in which Eurobanks accepts deposits and make loans denominated in
currencies other than that of the country in which the banks are located.
Eurodollars is that they are dollars held in the form of time deposits in banks
outside the United States. Euro-Deutschmarks are marks deposited in banks
outside Germany. The prefix ‘Euro’- really means external and refers to funds
that are intermediated outside the country of the currency in which the funds are
denominated. The Eurocurrency market is made up of financial institutions that
compete for dollar time deposits and make dollar loans outside the United
States, plus IBFs, financial institutions outside Germany that bid for
Deutschmark deposits and make Deutschmark loans, financial institutions
outside the UK that bid for sterling deposits and loan sterling, and so on.
Definitions of key Eurocurrency terms :
The Euromarkets are banking markets for deposits and loans. They are
located outside the country of the currency in which the claims are denominated.
Eurobonds are bonds denominated in currencies other than that of the
country in which the bonds are sold – for example, dollar-demoninated bonds in
London or Deutschmark denominated bonds in Luxembourg.
Eurobanks are financial intermediaries that bid for time deposits and
make loans in currencies other than of the country in which they are located.
LIBOR, the London inter-bank offered rate, is the interest rate at which
London Euromarket banks offer funds for deposit in the inter-bank market. It is
the most usually quoted base for Eurocurrency transactions. The interest cost to
AcroPDF - A Quality PDF Writer and PDF Converter to create PDF files. To remove the line, buy a license.

MBA- H4030 International Business Finance
231
the borrower is set as a spread over the LIBOR rate. Spreads over LIBOR have
ranged from around 0.25 per cent to 2 per cent. There is, of course, a separate
LIBOR for each of the many currencies in which inter bank loans are made in
London.
Domestic and foreign banks taking deposits and lending in the currency
of the country in which they operate are, in most financially sophisticated
countries, required to hold asset reserves equal to a specified percentage of their
deposit liabilities. This situation contrasts with that relating to Eurocurrency
deposits. Eurocurrency holdings are not subject to reserve asset requirements.
Eurobanks are therefore able to lend at more competitive rates than their
domestic counterparts, since part of their portfolio of assets is not tied up in low-
interest-bearing reserve assets.
Eurocredit lending is the medium-term market for Eurocurrency loans
provided by an organized group of financial institutions.
Eurodollar deposits and loans :
The most important distinction between the Eurodollar banking market
and domestic banking is that Eurocurrency markets are not subject to domestic
banking regulations. Eurobanks may obtain same profit levels as domestic banks
even though they achieve lower spreads on lending depositors’ funds than their
domestic counterparts. The absence of reserve requirements and regulations
enables Eurobanks to offer slightly better terms to both borrowers and lenders.
Eurodollar deposit rates are higher, and effective lending rates a little lower,
than they are in domestic money markets. The absence of regulations is the key
to the success of the Eurocurrency markets.
AcroPDF - A Quality PDF Writer and PDF Converter to create PDF files. To remove the line, buy a license.

MBA- H4030 International Business Finance
232
Deep Euromarkets exist only in those currencies, such as the US dollar,
the German mark and the pound sterling, that are relatively freely convertible
into other currencies.
A Eurodollar deposit may be created and lent on in the manner set out
below.
A US corporation with $2 million surplus funds decides to take advantage of the
more attractive Eurodollar rates on deposits relative to domestic dollars. The
company’s surplus funds were held originally in a time deposit with a demand
deposit in the local US bank. The company transfers ownership, by payment, of
the demand deposit in the local US bank to the US bank in London, where a
time deposit is made. This process creates a Eurodollar deposit, substituting for
an equivalent domestic time deposit in a US bank. The London branch of the US
bank deposits the cheque in its account in a US bank. The US company holds a
dollar deposit in a bank in London rather than in the USA. The total deposits of
the banks in the USA remains unchanged. However, investors hold smaller
deposits in the USA and larger deposits in London. The London Bank now has a
larger deposit in the U.S.A. The increase in the London bank’s deposits in the
US bank is matched by the increase in dollar deposits for the world as a whole.
The volume of dollar deposits in the USA remains unchanged, while the volume
in London increases.
The London bank will not leave the newly acquired $2 million idle. If
the bank does not have a commercial borrower or government to which it can
lend the funds, it will place the $2 million in the Eurodollar inter bank market.
In the words, it will deposit the funds in some other Eurobank.
AcroPDF - A Quality PDF Writer and PDF Converter to create PDF files. To remove the line, buy a license.
MBA- H4030 International Business Finance
233
If this second Eurobank cannot immediately use the funds to make a
loan, it will redeposit them again in the inter-bank market. This process of
redepositing might proced through several Eurobanks before the $2 million finds
its way to a final borrower. At each stage the next bank will pay a slightly
higher rate than the previous bank paid. But the margins involved in the inter-
bank market are very small - of the order of 1/8 per cent. As a rule, larger,
better-known banks will receive initial deposits while smaller banks will have to
bid for deposits in the inter-bank market.
This inter-bank redepositing of an original Eurodollar deposit merely
involves the passing on of funds from bank to bank. It does not, of course, add
to the final extension of credit in the financial markets. Only when the $2
million is lent on to a corporation or a government is credit eventually and
effectively extended. To evaluate the true credit-creation capacity of the
Eurodollar market, inter-bank deposits have to be netted out. The ultimate stage
in the credit-creating process occurs when a Eurobank lends funds to a non-bank
borrower.
Loans made in the Euromarket are similar to those made domestically by
UK and US banks and so on. More lending is done on a corporate reputation or
name basis, as it is sometimes called, to well-known entitites, with less credit
investigation and documentation being involved than in domestic lending. When
the amount needed is greater than one Eurobank is prepared to provide,
borrowers obtain funds by tapping a syndicate of banks from different countries.
Borrowers often have the option of borrowing in any of several currencies.
Eurocurrency loans may be for short-term working capital or trade finance, or
they may have maturities up to ten years. The latter would be called medium-
term Eurocredits, although they are basically no different from their short-term
AcroPDF - A Quality PDF Writer and PDF Converter to create PDF files. To remove the line, buy a license.

MBA- H4030 International Business Finance
234
counterparts. When a Eurocurrency loan has a maturity of more than six months,
the interest rate is usually set on a roll-over basis – that is, at the start of each
three – or six – month period, it is reset at a fixed amount (e.g. 1 per cent) above
the prevailing London inter-bank offered rate.
Eurocurrency deposits often carry interest rates of ½ per cent higher than
domestic deposits and borrowers can obtain cheaper money in Euromarkets as
opposed to domestic ones. So why do not all depositors and borrowers shift their
business into the Eurocurrency market. One reason is the existence of exchange
controls. Many governments make it difficult for depositors to invest abroad,
and many restrict foreign borrowing by domestic companies. Another reason is
the inconvenience and cost involved with maintaining balances or borrowing in
a foreign country. Furthermore, the market is largely a wholesale one, and deals
in sums of under $1 million are not available. Eurobanks also prefer to lend to
large, well-known corporations, banks or governments. But the most important
difference is that Eurodeposits, because they are located in a different country,
are in some respects subject to the jurisdiction of the country.
The players in the market :
The Eurocurrency market is entirely a wholesale market. Transactions
are rarely for less than $1 million and sometimes they are for $100 million. The
largest non-banking companies have to deal via banks. Borrowers are the very
highest pedigree corporate names carrying the lowest credit risks. The market is
telephone linked or telecommunications linked and is focused upon London,
which has a share of around one-third of the Eurocurrency market.
AcroPDF - A Quality PDF Writer and PDF Converter to create PDF files. To remove the line, buy a license.
MBA- H4030 International Business Finance
235
Commercial banks form the institutional core of the market. Banks enter
the Euro-currency market both as depositors and as lenders.
Euromarket deposits and borrowings :
Most deposits in the Eurocurrency market are time deposits at fixed
interest rates, sually of short maturity. Many of these deposits are on call; thus
they can be withdrawn without notice. Most of the time deposits are made by
other banks, but many are made by governments and their central banks as well
as multinational corporations.
Deposits come in many forms. Besides negotiable Eurodollar certificates
of deposit. Floating rate notes (FRNs) have become popular for longer maturity
deposits, including floating rate CDs.
Many Eurodollar loans are direct, bank-to-customer credits on the basis
of formal lines of credit or customer relationships. The Eurocurrency
syndication technique arose principally because of the large size of credits
required by some government borrowers and multinational firms. The
syndication procedure allows banks to diversify some of the unique sovereign
risks that arise in international lending. Syndicated Euroloans involve formal
arrangements in which competitively selected lead banks assemble a
management group of other banks to underwrite the loan and to market
participation in it to other banks.
Interest on syndicated loans is usually computed by adding a spread to
LIBOR, although the US prime rate is also used as a basis for interest pricing,
LIBOR interest rates change continuously, of course. The rate on any particular
AcroPDF - A Quality PDF Writer and PDF Converter to create PDF files. To remove the line, buy a license.
MBA- H4030 International Business Finance
236
loan is usually readjusted every three or six months on the prevailing LIBOR
rate – this method of pricing is known as a roll-over basis.
The Eurocredit market :
The Eurocredit market, is called the medium-term Eurocredit market, or
the medium-term Eurocurrency market, is defined as the market for loans in
currencies which are not native to the country in which the bank office making
the loans is located. The Eurocredit market is concerned with medium and long-
term loans Banks are the major lenders with major borrowers being large
multinational companies, international organizations and governments.
Generally, Eurocredits are extended by a large group of banks from many banks.
Loan syndication :
Syndicated Loans and Other Banking Products :
The most common form of international lending by commercial banks is
the Syndicated Floating Rate Loan. This can be defined as a medium-to long-
term financing provided by several banks with common loan documentation
with a variable interest rate.
The most common pricing benchmark is the LIBOR (London Inter-Bank
Offered Rate) in the relevant currency and the loan document states interest rate
as LIBOR plus a margin or spread e.g. LIBOR + 1.5%.
A traditional syndicated loan is usually a floating rate loan with fixed
maturity, a fixed draw-down period and a specified repayment schedule. A
typical eurocredit would have maturity between five and 10 years, amortization
AcroPDF - A Quality PDF Writer and PDF Converter to create PDF files. To remove the line, buy a license.

MBA- H4030 International Business Finance
237
in semi annual instalments, and interest rate reset every three or six months with
reference to LIBOR + 1.5%
A traditional syndicated loan is usually a floating rate loan with fixed
maturity, a fixed draw-down period and a specified repayment schedule. A
typical eurocredit would have maturity between five and 10 years, amortization
in semi annual instalments, and interest rate reset every three or six months with
reference to LIBOR.
In a standby facility, the borrower is not required to draw down the loan
during a fixed, pre-specified period, Instead, he pays a contingency fee till he
decides to draw the loan at which time interest begins to accrue. Syndicated
credits can be structured to incorporate various options. As in the case of FRNs,
a drop-lock feature converts the floating rate loan into a fixed rate loan if the
benchmark index hits a specified floor.
There are usually three categories of bank in a loan syndicate. There are
lead banks, manging banks and participating banks. In large credits, there is a
separate group called co-managers. This group comprises participating banks
providing more than a specified amount of funds. Most loans are led by one or
two major banks which negotiate to obtain a mandate from the borrower to raise
funds. After the preliminary stages of negotiation with a borrower, the lead bank
begins to assemble the management group, which commits itself to provide the
entire amount of the loan, if necessary. Portions of the loan are then marketed to
participating banks.
The lead bank assembles a management group to assure the borrower
that the entire amount of the loan will be taken up. During this phase, the lead
AcroPDF - A Quality PDF Writer and PDF Converter to create PDF files. To remove the line, buy a license.

MBA- H4030 International Business Finance
238
bank may renegotiate the terms and conditions of the loan if it cannot assemble a
managing group on the initial terms. Many lead banks are willing to take more
of the credit into their own portfolio than they had originally planned. The lead
bank is normally expected to provide a share at least as large as any other bank.
Once the lead bank has established the group of managing banks, it then
commits the group to raise funds for the borrower on specifiea terms and
conditions.
When the management group is established and the lead bank has
received a mandate from the borrower, a placement memorandum is prepared by
the lead bank and the loan is marketed to other banks which may be interested in
taking up shares. Such lenders are termed the participating banks. The
placement memorandum describes the transaction and gives information
regarding the financial health of the borrower.
The lead bank bears the chief responsibility for marketing the loan.
There are three main methods used to find participants for syndicated credits.
Often banks contact the borrower expressing an interest in participating in a
given credit. But the bulk of participants are banks invited by the lead bank to
join the syndication. Each major bank maintains files on the syndicated lending
activities of other banks. The files contain lists of banks that have joined various
syndications. This information enables the loan syndication officers at the lead
bank to estimate which banks might be interested in which borrowers.
When a bank is invited to participate in a syndication, the amount and
the terms and conditions it is being asked to accept are set out in a telex sent by
the lead bank. This shortcuts the negotiation process and expedites the credit.
AcroPDF - A Quality PDF Writer and PDF Converter to create PDF files. To remove the line, buy a license.

MBA- H4030 International Business Finance
239
The lead bank usually offers to sell off more of the credit than it really
wishes.
An experienced lead bank can usually gauge the appropriate number of
participation invitations to be extended. If the credit is attractive, fewer banks
will be contacted. If the credit appears hard to place, a greater number of
invitations will be sent out. If the loan is oversubscribed, the borrower is usually
given the opportunity to borrow more money than initially negotiated on the
same terms. If the borrower does not choose to take advantage of this, the
amounts assigned to each bank are scaled down pro rata.
In a successful loan syndication, once the marketing to participants is
completed, the lead and managing banks usually keep 50 to 75 per cent of their
initial underwritten share. The lead bank is generally expected to take into its
portfolio about 10 per cent of the total credit.
The most common type of syndicated loan is a term loan, where funds
can be drawn down by the borrower within a specified time of the loan being
signed – this is called the ‘drawdown period’. Repayments are subsequently
made in accordance with an amortization schedule. For other loans, amortization
may not commence until five or six years after drawing down the loan. This
kind of loan is termed a ‘bullet loan’. Loans which require repayment according
to an amortization schedule and include a larger final payment on maturity are
termed ‘balloon repayment loans’. The period prior to the commencement of
repayment is termed the ‘grace period’. The extent of the grace period is usually
a major negotiating point between borrower and lead bank. Borrowers are
usually willing to pay a wider spread in order to obtain a longer grace period.
AcroPDF - A Quality PDF Writer and PDF Converter to create PDF files. To remove the line, buy a license.

MBA- H4030 International Business Finance
240
Syndicated loans of the revolving credit type are occasionally
encountered. In these, the borrower is given a line of credit which it may draw
down and repay with greater flexibility than under a term loan. Borrowers pay a
fee on the undrawn amount of the credit line.
Additional to interest costs on a loan, there are also front-end fees,
commitment fees and occasionally an annual agent’s fee. Front-end management
fees are one-off charges negotiated in advance and imposed when the loan
agreement is signed. These fees are usually in the range of 0.5 to 1 per cent of
the value of the loan. The fees may be higher if a particular borrower insists
upon obtaining funds at a lower spread than is warranted by market conditions
and credit worthiness.
The relationship between spreads and fees is hard to quantify, as data on
all fees are usually unobtainable. Lower spreads if compensated by higher fees,
since they are interested in the total return on the loan. Some borrowers prefer to
pay a higher fee, which is not published, while going on record as paying a low
spread. Over time, demand and supply conditions determine both spreads and
fees. During periods of easy market conditions, borrowers can command low
fees and low spreads. During periods when banks are reluctant to extend credit,
high spreads and high fees are the norm.
Front-end fees consist of participation fees and management fees. Each
of these typically amount to between 0.25 and 0.5 per cent of the entire amount
of the loan.
In addition to front-end fees, borrowers may pay commitment fees.
These fess are charged to the borrower as a percentage of the undrawn portion of
AcroPDF - A Quality PDF Writer and PDF Converter to create PDF files. To remove the line, buy a license.

MBA- H4030 International Business Finance
241
the credit in return for the bank typing up part of its credit capacity on behalf of
the borrower. Commitment fees of 0.375 to 0.5 per cent per annum are typically
imposed on both term loans and revolving credits. The agent’s fee, if applicable,
is usually a yearly charge.
In order to protect their margins, basis usually require all payments of
principal an interest to be made after taxes imposed have been paid. If those
taxes are not creditable against the banks’ home country taxes, the borrower
must adjust payments so that the banks receive the same net repayment. The
decision as to whether the borrower or lender absorbs any additional taxes
imposed by the country in which the loan is booked is negotiated between the
parties. Additionally, a reserve requirement clause is inserted, stipulating that an
adjustment will be made if the cost of funds increases because reserve
requirements are imposed or increased.
There is generally no prepayment penalty on Eurocredits. The charges on
syndicated loans may be summarized as follows :
Annual payments = (LIBOR + spread)
X amount of loan drawn down and outstanding
+ commission fee X amount of loan undrawn
+ annual agent’s fee (if any)
+ tax adjustment (if any)
+ reserve requirement adjustment (if any)
Front-end charges = lead bank praecipium X total amount of loan
+ participation fee X face amount of loan
+ management fee X face amount of loan
+ initial agent’s fee (if any)
AcroPDF - A Quality PDF Writer and PDF Converter to create PDF files. To remove the line, buy a license.
MBA- H4030 International Business Finance
242
Exchange Markets vs. Currency Markets :
In the foreign exchange market, one currency is exchanged for another
currency at a rate of exchange which is the price in terms of the number of units
of the currency exchanged for one unit of the latter. On the other hand, the price
paid for borrowing or lending a currency in the international currency market is
the rate of interest. The purpose for which currencies are exchanged in the
foreign exchange market or borrowed in the international currency market may
be the same.
Dealers in the Market :
International banks or multi-national banks and foreign branches of
domestic banks, private banks, merchant banks and other banks are the main
dealers in this market. In fact, most of the US banks deal in this market. The
market is of a wholesale nature, highly flexible and competitive and well-
connected in the world over by a wide network of brokers and dealers. London
is the focal centre for the Euro-dollars as Singapore is the focal centre for Asian-
dollars. There are a number of centres in both West and East, namely, Zurich,
Luxembourg, Paris, Tokyo, Hongkong, Manila, etc.
The international bond market :
Money may be raised internationally by bond issues and by bank loans.
This is done in domestic as well as international markets. The difference is that
in international markets the money may come in a currency which is different
from that normally used by the borrower. The characteristic feature of the
international bond market is that bonds are always sold outside the country of
the borrower. There are three types of bond, of which two are international
AcroPDF - A Quality PDF Writer and PDF Converter to create PDF files. To remove the line, buy a license.

MBA- H4030 International Business Finance
243
bonds. A domestic bond is a bond issued in a country by a resident of that
country. A foreign bond is a bond issued in a particular country by a foreign
borrower. Eurobonds are bonds underwritten and sold in more than one country.
A foreign bond may be defined as an international bond sold by a foreign
borrower but denominated in the currency of the country in which it is placed. It
is underwritten and sold by a national underwriting syndicate in the lending
country. Thus, a US company might float a bond issue in the London capital
market, underwritten by a British syndicate and denominated in sterling. The
bond issue would be sold to investors in the UK capital market, where it would
be quoted and traded. Foreign bonds issued outside the USA are called Yankee
bonds, while foreign bonds issued in Japan are called Samuri bonds. Canadian
entities are the major floaters of foreign bonds in the USA.
A Eurobond may be defined as an international bond underwritten by an
international syndicate and sold in countries other than the country of the
currency in which the issue is denominated.
In the Eurobond market, the investor holds a claim directly on the
borrower rather than on a financial institution. Eurobonds are generally issued
by corporation and governments needing secure, long-term funds and are sold
through a geographically diverse group of banks to investors around the world.
Eurobonds are similar to domestic bonds in that they may be issued with
fixed or floating interest rates.
AcroPDF - A Quality PDF Writer and PDF Converter to create PDF files. To remove the line, buy a license.

MBA- H4030 International Business Finance
244
Characteristics :
i) The issuing technique takes the form of a placing rather than formal
issuing, this avoids national regulations on new issues.
ii) Eurobonds are placed simultaneously in many countries through
syndicates of underwriting banks which sell them to their investment clientele
throughout the world.
iii) Unlike foreign bonds, Eurobonds are sold in countries other than that
of the currency of denomination; thus dollar – denominated Eurobonds are sold
outside the U.S.A.
iv) The interest on Eurobonds is not subject to withholding tax.
There are a number of different types of Eurobond. A straight bond is
one having a specified interest coupon and a specified maturity date. Straight
bonds may be issued with a floating rate of interest. Such bonds may have their
interest rate fixed at six-month intervals of a stated margin over the LIBOR for
deposits in the currency of the bond. So, in the case of a Eurodollar bond, the
interest rate may be based upon LIBOR for Eurodollar deposits.
A convertible Eurobond is a bond having a specified interest coupon and
maturity date, but it includes an option for the hold to convert its bonds into an
equity share of the company at a conversion price set at the time of issue.
Medium-term Euronotes are shorter-term Eurobonds with maturities
ranging from three to eight years. Their issuing procedure is less formal than for
large bonds. Interest rates on Euronotes can be fixed or variable. Medium-term
Euro-notes are similar to medium-term roll-over Eurodollar credits. The
difference is that in the Eurodollar market lenders hold a claim on a bank and
not directly on the borrower.
AcroPDF - A Quality PDF Writer and PDF Converter to create PDF files. To remove the line, buy a license.
MBA- H4030 International Business Finance
245
The issue of Eurobonds is normally undertaken by a consortium of
international banks. A record of the transaction called a ‘tombstone’ is
subsequently published in the financial press. Those banks whose names appear
at the top of the tombstone have agreed to subscribe to the issue. At a second
level, a much larger underwriting syndicate is mentioned. The banks in the
managing syndicate will have made arrangements with a worldwide group of
underwriters, mainly banks and security dealers. After arranging the
participation of a number of underwriters, the managing syndicate will have
made a firm offer to the borrower, which obtains the funds from the loan
immediately. At a third level, the underwriting group usually arranges for the
sale of the issue through an even larger selling group of banks, brokers and
dealers.
The advantages of the Eurobond market to borrowers :
The Eurobond market possess a number of advantages for borrowers.
i) The size and depth of the market are such that it has the capacity to absorb
large and frequent issues.
ii) The Eurobond market has a freedom and flexibility not found in domestic
markets.
iii) The cost of issue of Eurobonds, around 2.5 per cent of the face value of the
issue.
iv) Interest costs on dollar Eurobonds are competitive with those in New York.
v) Maturities in the Eurobond market are suited to long-term funding
requirements.
vi) A key feature of the Eurobond market is the development of a sound
institutional framework for underwriting, distribution and placing of securities.
AcroPDF - A Quality PDF Writer and PDF Converter to create PDF files. To remove the line, buy a license.

MBA- H4030 International Business Finance
246
II. The Advantages of Eurobonds to investors :
i) Eurobonds are issued in such a form that interest can be paid free of
income or withholding taxes of the borrowing countries. Also, the bonds are
issued in bearer form and are held outside the country of the investor, enabling
the investor to evade domestic income tax.
ii) Issuers of Eurobonds have well reputation for credit worthiness.
iii) A special advantage to borrowers as well as lenders is provided by
convertible Eurobonds. Holders of convertible debentures are given an option to
exchange their bonds at a fixed price.
iv) The Eurobond market is active both as a primary and as a secondary
market.
Some Terminology used in International Finance Market :
1) American depository receipt (ADR) : Certificate of ownership issued by a
US bank to investors in place of the underlying corporate shares, which are held
in custody.
2) Bond: A promise under seal to pay money. The term is generally used to
designate the promise made by a corporation, either public or private, to pay
money, and it generally applies to instruments with an initial maturity of five
years or more.
3) Eurobond : A bond underwritten by an international syndicate of banks and
marketed internationally in countries other than the country of the currency in
which it is denominated.
4. Eurocommercial paper : A generic term used to describe Euronotes that
are issued without being underwritten.
5) Eurocredit : The Eurocredit market is where highly rated borrowers can
gain access to medium-term bank lending. The loan can be denominated in one
AcroPDF - A Quality PDF Writer and PDF Converter to create PDF files. To remove the line, buy a license.
MBA- H4030 International Business Finance
247
or several Eurocurrencies as can the interest and the principal. The interest rate
is normally fixed as a margin over LIBOR.
6) Eurocurrency : A time deposit in a bank account located outside the banking
regulations of the country which issues the currency.
7) Eurodollars : Dollars held in time deposits in banks outside the United
States. These banks may be foreign owned or overseas branches of US banks.
8) Euromarkets : A collective term used to describe a series of offshore
money and capital markets operated by international banks. They comprise
Eurocurrency, Eurocredit and Eurobonds markets. The centre of these markets is
London, except for Eurosterling market which is centred in Paris.
9) Euronote : The Euronote market is one in which borrowers raise money by
the issue of short-term notes, generally with maturities of three and six months,
that are negotiable like certificates of deposit. As one issue of notes matures, the
borrower issues some more so that, while the holders of the debt change over
time, the total amount outstanding can be maintained in the medium term. A
group of commercial banks may ensure that the borrower in a particular issue
will be able to place such notes by standing by ready to purchase the paper
should the appecite of short-term investors wane.
10) Euro-note facility : This allows borrowers to issue short-term notes
through a variety of note distribution mechanisms, under the umbrella of a
medium-term commitment from banks.
11) European Monetary System (EMS): A structure of agreements
governing the exchange market activities of participating members of the
European Union. Agreements require members closely to manage the exchange
values of their currencies relative to those of other members.
12) Floating exchange rate system : A system in which the value of a currency
relative to others is established by the forces of supply and demand in the
foreign exchange markets.
AcroPDF - A Quality PDF Writer and PDF Converter to create PDF files. To remove the line, buy a license.

MBA- H4030 International Business Finance
248
13) Floating or variable rate interest : Interest on an issue of securities which
is not fixed for the life of the issue, but is periodically set according to a
predetermined formula. The rate is usually set at a margin or spread in relation
to a specified money-market rate, such as LIBOR.
14) Floating rate note (FRN): A short-term floating interest rate security. The
interest rate is pegged to LIBOR, and is adjusted semi-annually. These securities
are attractive to investors during periods of rising interest when fixed rate bonds
are subject to depreciation.
15) Floating rate payer : A party that makes swap payments calculated on the
basis of a floating rate.
16) London inter-bank offered rate (LIBOR) : The interest rate at which
prime banks offer deposits to other prime banks in London. This rate is often
used as the basis for pricing Eurodollar and other Eurocurrency loans. The
lender and the borrower agree to a mark-up over LIBOR : the total of LIBOR
plus the mark-up is the effective interest rate for the loan.
The International Financing Decision :
Before we examine various funding avenues in the global market we
must discuss the issues involved in choosing a particular mix of financing in
terms of markets, currencies and instruments.
The issue of the optional capital structure and subsequently the optimal
mix of funding instruments is one of the key strategic decisions for a
corporation. The actual implementation of the selected funding programme
involves several other considerations such as satisfying all the regulatory
requirements, choosing the right timing and pricing of the issue, effective
marketing of the issue and so forth.
AcroPDF - A Quality PDF Writer and PDF Converter to create PDF files. To remove the line, buy a license.

MBA- H4030 International Business Finance
249
The optimal capital structure for a firm or, in other words, corporate debt
policy has been a subject of a long-running debate in finance literature since the
publication of the seminal paper by Modigliani and Miller which argued that in
the absence of taxes, capital structure does not matter.
The issue of the optimal composition of a firm’s liability portfolio. The
firm usually has a wide spectrum of funding avenues to choose from. The
critical dimensions of this decision are discussed below.
(1) Interest rate basis : Mix of fixed rate and floating rate debt.
(2) Maturity : The appropriate maturity composition of debt.
(3) Currency composition of debt.
(4) Which market segments should be tapped?
For instance, long-term financing can be in the form of a fixed rate bond
or an FRN or short-term debt like commercial paper repeatedly rolled over.
Each option has different risk characteristics.
Individual financing decisions should thus be guided by their impact on
the characteristics-risk and cost-of the overall debt portfolio as well as possible
effects on future funding opportunities.
In viewing the risks associated with funding activity, a portfolio
approach needs to be adopted. Diversification across currencies and instruments
enables the firm to reduce the overall risk for a given funding cost target. It also
helps to increase investors’ familiarity with the firm which makes future
approaches easier.
AcroPDF - A Quality PDF Writer and PDF Converter to create PDF files. To remove the line, buy a license.

MBA- H4030 International Business Finance
250
It should be kept in mind that currency and interest rate exposures arising
out of funding decisions should not be viewed in isolation. The firm should take
a total view of all exposures, those arising out of its operating business and those
on account of financing decisions.
Funding Avenues in Global Capital Markets
Global financial markets are a relatively recent phenomenon. Prior to
1980, national markets were largely isolated from each other and financial
intermediaries in each country operated principally in that country. The foreign
exchange market and the Eurocurrency and Eurobond markets based in London
were the only markets that were truly global in their operations.
Financial markets everywhere serve to facilitate transfer of resources
from surplus units (savers) to deficit units (borrowers), the former attempting to
maximise the return on their savings and the latter looking to minimize their
borrowing costs. An efficient financial market thus achieves an optimal
allocation of surplus funds between alternative uses. Healthy financial markets
also offer the savers a wide range of instruments enabling them to diversify their
portfolios.
Globalization of financial markets during the, 80’s has been driven by
two underlying forces. Growing (and continually shifting) imbalance between
savings and investment within individual countries, reflected in their current
account balances, has necessitated massive cross-border financial flows.
The other motive force is the increasing preference on the part of
investors for international diversification of their asset portfolios. This would
AcroPDF - A Quality PDF Writer and PDF Converter to create PDF files. To remove the line, buy a license.

MBA- H4030 International Business Finance
251
result in gross cross-border financial flows even in the absence of current
account imbalances though the net flows would be zero. Several investigators
have established that significant risk reduction is possible via global
diversification of portfolios.
Capital markets of the newly industrializing South East Asian economies
e.g. Korea and Taiwan permit only limited access to foreign investors. Even in
an advanced economy like that of Germany, the structure of corporate financing
is such that most of the companies rely on loans from domestic banks for
investment and investors do not appear to show much interest in foreign issues.
All these reservations, it can be asserted that the dominant trend is towards
globalization of financial markets.
There are two broad groups of borrowers, of the total debt raised on the
international markets in recent years. There are fluctuations in the relative
importance of different types of instruments as markets respond to changing
investor / borrower needs and changes in the financial environment. It is clear
that for developing countries, as far as debt finance is concerned, external bonds
and syndicated credits are the two main sources of funds.
1) Syndicated Credit 2) Debt securities
An overview of finding avenues in the global capital markets is the
procedural aspects of actually tapping a market – acquiring the necessary
clearances and approvals, preparing various documents, investor contact and so
forth-are usually quite elaborate. Issues related to accounting, reporting and
taxation are quite complex and require specialist expertise. We will keep clear of
these matters and concentrate on the basic features and cost-risk characteristics
of the various instruments.
AcroPDF - A Quality PDF Writer and PDF Converter to create PDF files. To remove the line, buy a license.

MBA- H4030 International Business Finance
252
Bond Markets :
Bonds can be defined as negotiable debt instruments with original
maturity in excess of one year. The domestic bond markets are dominated by the
respective governments. For instance, the US treasury is the largest issuer of
bonds in the world. When a non-resident issuer issues bonds in the domestic
market of a country (currency), it is known of that currency is known as a
Eurobond. Thus, for instance, when Reliance Industries issues a USD bond in
the US capital market, it is a foreign dollar bond. If the bond issue is made in
London, it is a Eurodollar bond. Public, registered issues of foreign bonds in the
domestic markets of various countries have acquired trade names such as
Yankee Bonds (US), Bulldog Bonds (UK), Samurai Bonds (Japan), Matador
Bonds (Spain) etc.
Bonds may be registered or in bearer form. The procedure for transfer of
ownership or exchange between bondholders are different for the two
categories.
The traditional bond is the straight bond. It is a debt instrument with a
fixed maturity period, a fixed coupon which is a fixed periodic payment usually
expressed as percentage of the face value, and repayment of the face value at
maturity. The market price at which such a security is bought by an investor
either in the primary market (a new issue) or in the secondary market.
A very large number of variants of the straight bond have evolved over
time to suit varying needs of borrowers and investors. The familiar variants are :
AcroPDF - A Quality PDF Writer and PDF Converter to create PDF files. To remove the line, buy a license.

MBA- H4030 International Business Finance
253
1) Floating Rate Notes (FRN): It is a bond with varying coupon. Periodically
every six months, the interest rate payable for the next six months is set with
reference to a market index such as LIBOR.
2) Zero coupon bonds (“Zeros”) and Deep Discount Bonds which do pay a
coupon but are at a rate below the market rate for a corresponding straight bond.
Bulk of the return to the investor is in the form of capital gains.
3) Sinking fund bonds were a device, often used by small risky companies, to
assure the investors that they will get their money back.
Some other bonds like Callable bonds, Puttable bonds and Convertible
bonds. Each of these contains an option granted either by the issuer to the
investor (convertibles, puttable) or vice-versa (callable). The value of the option
is captured by adjusting the coupon which tends to be lower for convertibles and
puttable bonds and higher for a callable bond compared to a straight bond with
identical features.
Some bonds contain embedded currency or commodity options. For
instance, the coupon payments and / or the redemption amount may be linked to
an exchange rate or the price of a commodity such as oil. Redemption may be in
any one of two or more currencies at the option of the investor. Dual currency
bonds have coupon payments in one currency and redemption in another.
Warrants are an option sold with a bond which gives the holder the right
to purchase a financial asset at a stated price. The asset may be a further bond,
equity shares or a foreign currency. The warrant may be permanently attached to
the bond or detachable and separately tradeable.
AcroPDF - A Quality PDF Writer and PDF Converter to create PDF files. To remove the line, buy a license.

MBA- H4030 International Business Finance
254
The largest international bond market is the Eurobond market which is
said to have originated in 1963 with an issue of Eurodollar bonds by Autostrade,
an Italian borrower. Eurobond markets in all currencies except yen are quite free
from any regulation by the respective governments. The euroyen bond market,
which really came into existence as late as 1984, is closely controlled and
monitored by the Japanese Ministry of Finance.
Straight bonds in the eurobond market are priced with reference to a
benchmark, typically treasury issues. Thus, a eurodollar bond will be priced to
yield a YTM (Yield-to-Maturity). The straight bonds segment is accessible only
to highly rated borrowers.
Many eurobonds are listed on stock exchanges in Europe. This requires
that certain financial reports be made available to the exchanges on a regular
basis. However, secondary market trading in eurobonds is almost entirely over-
the-counter by telephone between dealers.
Flotation costs of eurobond issues are generally higher than costs
associated with syndicated eurocredits.
Among the national capital markets, the US market is the largest in the
world. It is complemented by the world’s largest and most active derivative
markets, both OTC and exchange-traded. It provides a wide spectrum of funding
avenues.
From a non-resident borrower’s point of view, the most prestigious
funding avenue is public issue of Yankee Bonds. These are dollar denominated
bonds issued by foreign borrowers. It is the largest and most active market in the
AcroPDF - A Quality PDF Writer and PDF Converter to create PDF files. To remove the line, buy a license.
MBA- H4030 International Business Finance
255
world but potential borrowers must meet very stringent disclosure, dual rating
and other listing requirements, option features like call and put can be
incorporated and there are no restrictions on the size of the issue, maturity and
so forth.
Medium-term Notes (MTNs) represent a medium-term, non-underwritten,
fixed interest rate source of funding. This form of funding originated in the US
capital market and was introduced to the euro market – Euro Medium Term
Notes (EMTNs) – during the ’80s. It was a part of the disintermediation process
in which borrowers were approaching investors directly rather than going
through the bank loan route.
Short-Term Financing :
In this section, we will briefly describe some of the common short-term
funding instruments such as commercial paper (CP), bankers’ acceptances
(BAs) and Certificates of Deposit (CDs). In addition, there are short-term bank
loans ranging in maturity from overnight to one year.
i) Commercial Paper (CP) :
Commercial Paper is a corporate short-term, unsecured promissory note
issued on a discount to yield basis. It can be regarded as a corporate equivalent
of CD (Certificate of Deposit) which is an interbank instrument.
Commercial paper maturities generally do not exceed 270 days. Issuers
usually roll over the issue and use the proceeds from the new issue to retire the
old issue. The issue is normally placed through CP dealers or, in a few cases,
large corporations have their own sales force. Commercial paper represents a
cheap and flexible source of funds especially for highly rated borrowers, cheaper
than bank loans. For investors, it is an attractive short-term investment
AcroPDF - A Quality PDF Writer and PDF Converter to create PDF files. To remove the line, buy a license.

MBA- H4030 International Business Finance
256
opportunity compared to a time deposit with a bank. In addition to the high
credit reputation of the borrowers, most CP programmes also require a back-up
credit line from a commercial bank, covering at least 50% more often nearly
100% of the issue. While CPs are negotiable, secondary markets tend to be not
very active since most investors hold the paper to maturity.
The US has the largest and long-established dollar CP market. In recent
years, it has dwarfed the markets for Certificates of Deposit and Bankers’
Acceptances. It is used extensively by US corporations as well as some non-US
corporations. The emergence of the Euro Commercial Paper (ECP) is much
more recent. Investors in CP consist of money market funds, insurance
companies, pension funds, other financial institutions and corporations with
short-term cash surpluses.
(ii) A Certificate of Deposit (CD) : CD is a negotiable instrument evidencing
a deposit with a bank. Unlike a traditional bank deposit which is non-
transferable, a CD is a marketable instrument so that the investor can dispose off
it in the secondary market when cash is needed. The final holder is paid the face
value on maturity along with the interest. CDs are issued in large denominations
– $100,000 or equivalent or higher – and are used by commercial banks as short-
term funding instruments. Occasionally, CDs with maturity exceeding one year
are issued. When the maturity is less than a year, interest is paid along with
redemption of principal. For maturity longer than a year, interest may be paid
semi-annually.
Euro CDs are issued mainly in London by banks. Interest on CDs with
maturity exceeding a year is paid annually rather than semi-annually. There are
floating rate CDs with maturities normally ranging from 18 months to five years
AcroPDF - A Quality PDF Writer and PDF Converter to create PDF files. To remove the line, buy a license.
MBA- H4030 International Business Finance
257
on which interest rate is periodically reset, indexed to LIBOR, Federal Reserve
CD composite rate, Treasury Bill rate and so forth.
(iii) Banker’s Acceptances (BAs) are instruments widely used in the US
money market to finance domestic as well as international trade. In a typical
international trade transaction, the seller (exporter) draws a time or usance draft
on the buyer’s (importer’s) bank. On completing the shipment, the exporter
hands over the shipping documents and the letter of credit issued by the
importer’s bank to its (exporter’s) bank. The exporter gets paid the discounted
value of the draft. The exporter’s bank presents the draft to the importer’s bank
which stamps it as “accepted”. A banker’s acceptance is created. The exporter’s
bank may hold the draft units portfolio ask the importer’s bank to rediscount it
or sell it as a money market instrument.
In addition to those securitized instruments, short-term bank loans are
also available. The Eurocurrencies market is essentially an interbank deposit and
loans market. Loans ranging in maturity from overnight to one year can be
arranged with minimal formalities. Interest rates are indexed to LIBOR.
Repurchase Obligations : (REPOS) : -
In the US money market, Repurchase Obligations (REPOS) are used by
securities dealers to finance their holdings of securities. This is a form of
collateralized short-term borrowing in which the borrower ‘sells’ securities to
the lender with an agreement to ‘buy’ them back at a later time. (Hence the
name ‘Repurchase Obligations’). The repurchase price is the same as the
original buying price, but the seller (borrower) pays interest in addition to
buying back the securities. The duration for the borrowing may be as short as
AcroPDF - A Quality PDF Writer and PDF Converter to create PDF files. To remove the line, buy a license.
MBA- H4030 International Business Finance
258
overnight or as long as up to a year. The former are called ‘overnight repos’.
Longer duration repos are ‘term repos’. The interest rate is determined by
demand-supply conditions. This concludes our brief survey of major short-term
funding instruments.
International Equity Financing : (GDRs, ADRs, IDRs) :
Equity investment by foreign investors into a country can occur in one or
more of three ways. Foreign investors can directly purchase shares in the stock
market of the country e.g. investment by FIIs in the Indian stock market. Or,
companies from that country can issue shares (or depository receipts) in the
stock markets of other countries. Finally, indirect purchases can be made
through a mutual fund which may be a specific country fund or a multi-country
regional fund.
The Depository Receipts Mechanism :
The volume of new equity issues in the international markets increased
dramatically between 1983 and 1987 and again after 1989. The ‘90s saw a
growing interest in the emerging markets. From the side of the issuers, the
driving force was the desire to tap low-cost sources of financing, broaden the
shareholder base, acquire a spring board for international activities such as
acquisitions and generally improve access to long-term funding. From the point
of view of investors, the primary motive has been diversification.
Some of these markets may not be readily accessible except to very high
quality issuers. When the issue size is large the issuer may consider a
AcroPDF - A Quality PDF Writer and PDF Converter to create PDF files. To remove the line, buy a license.
MBA- H4030 International Business Finance
259
simultaneous offering in two or more markets. Such issues are known as
Euroequities.
Issue costs are an important consideration. In addition to the
underwriting fees (which may be in the 3 – 5% range), there are substantial costs
involved in preparing for an equity issue particularly for developing country
issuers unknown to developed country investors. Generally speaking, issue costs
tend to be lower in large domestic markets such as the US and Japan.
Depository Receipts : (ADRs, EDRs, and GDRs)
During the late ‘80s, a number of European and Japanese companies
have got themselves listed on foreign stock exchanges such as New York and
London. Shares of many firms are traded indirectly in the form of depository
receipts. In this mechanism, the shares issued by a firm are held by a depository,
usually a large international bank, which receives dividends, reports etc. and
issues claims against these shares. These claims are called “depository
receipts” with each receipt being a claim on a specified number of shares. The
depository receipts are denominated in a convertible currency, usually US
dollars. The depository receipts may be listed and traded on major stock
exchanges or may trade in the OTC market. The issuer firm pays dividends in its
home currency. This is converted into dollars by the depository and distributed
to the holders of depository receipts. This way the issuing firm avoids listing
fees and onerous disclosure and reporting requirements which would be
obligatory if it were to be directly listed on the stock exchange. This mechanism
originated in the US, the so-called American Depository Receipts or ADRs.
Recent years have seen the emergence of European Depository Receipts (EDRs)
and Global Depository Receipts (GDRs) which can be used to tap multiple
AcroPDF - A Quality PDF Writer and PDF Converter to create PDF files. To remove the line, buy a license.
MBA- H4030 International Business Finance
260
markets with a single instrument. Transactions in depository receipts are settled
by means of computerized book transfers in international clearing systems such
as Euroclear and Cedel.
In 1992 following the experience of the first ever GDR issue by an
Indian corporate, a fairly large number of Indian companies took advantage of
the improved market outlook to raise equity capital in international markets.
During the period April 1992 to 1994, almost 30 companies are estimated to
have raised a total of nearly US$3 billion through GDR issues.
From the point of view of the issuer, GDRs represent non-voting stock
with a distinct identity which do not exhibit in its books. There is no exchange
risk since dividends are paid by the issuer in its home currency. The device
allows the issuer to broaden its capital base by tapping large foreign equity
markets. The risk is that the price of GDRs may drop sharply after issue due to
problems in the local markets and damage the issuer’s reputation which may
harm future issues. From the investors’ point of view, they achieve portfolio
diversification while acquiring an instrument which is denominated in a
convertible currency and is traded on developed stock markets. The investors
bear exchange risk and all the other risks borne by an equity holder. There are
also taxes such as withholding taxes on dividends and taxes on capital gains.
A major problem and concern with international equity issues is that of
flowback, i.e. the investors will sell the shares back in the home stock market of
issuing firm. Authorities of some countries have imposed a minimum lock-in
period during which foreign investors cannot unload the shares in the domestic
market.
AcroPDF - A Quality PDF Writer and PDF Converter to create PDF files. To remove the line, buy a license.

MBA- H4030 International Business Finance
261
Withholding taxes on dividends paid to non-residents reduces the
attractiveness of the asset to foreign shareholders and consequently raises the
cost to the issuer.
During 1993-94, GDR issues were a very popular device for many large
Indian companies. Yields in developing country markets were rather low and
many Indian issues offered attractive returns along with diversification benefits.
The economic liberalization policy of the government made Indian issues an
attractive investment vehicle for foreign investors. In subsequent years, a variety
of problems with the workings of the Indian capital markets – lack of adequate
custodial and depository services, long settlement periods, delivery and payment
delays, suspicions of price rigging etc. – led to the wearing off of investor
enthusiasm.
The world market capitalization of bonds is larger than that of equity.
The international market for bonds comprises three major categories: domestic
bonds, foreign bonds and Eurobonds.
Domestic bonds are issued by a domestic borrower in the domestic
market, usually in domestic currency.
Foreign bonds are issued on the domestic market by a foreign borrower,
usually in domestic currency. The rules and regulations governing issuing and
trading procedures are under the control of the domestic authorities.
Eurobonds are issued in countries other than the one in whose currency
they are denominated. They are not traded on a particular national bond market
and, therefore, are not regulated by any domestic authority.
AcroPDF - A Quality PDF Writer and PDF Converter to create PDF files. To remove the line, buy a license.

MBA- H4030 International Business Finance
262
Financing and investing in the international bond markets is both
technical and difficult. This stems from the vast diversity in regulation,
instruments, terminology and techniques.
The major domestic bond markets :
The globalization of the world’s capital markets has introduced an
element of competition among the different markets and has enabled borrowers
to diversify their financing sources. The World Bank’s “global bonds” issued
simultaneously in September 1989 on the Eurobond market and the US domestic
market are a good example.
Investors also benefit from globalization. The different domestic bond
market can offer attractive diversification opportunities. They are also a source
of products with unique characteristics arising from the different legal, fiscal and
economic systems of the countries where they are issued.
For a firm raising funds in the international capital markets or for an
investor managing an international bond portfolio, thorough technical
knowledge of each domestic market is a fundamental requirement. This is an
especially difficult proposition because there is a wide variety of instruments
available. They range from classic fixed interest bonds, through FRNs, zero
coupons, convertibles and bonds with warrants attached to the more exotic
varieties with simultaneous call and put options or links to an index such as a
stock market or gold. Trading and quotation practices concerning the various
instruments can vary from market to market. In Europe, dealing and quotations
are usually handled by brokers on the exchanges, although Germany. The
AcroPDF - A Quality PDF Writer and PDF Converter to create PDF files. To remove the line, buy a license.

MBA- H4030 International Business Finance
263
Netherlands, Switzerland and the United Kingdom do some over-the-counter
trading of non-government issues. In the United States most trading in domestic
bonds is handled over the counter, while in Japan bond trading takes place over
the counter and on the exchanges. When trading is handled over the counter, it is
difficult to estimate costs which are hidden in the bid-ask spread. Even when
commissions are charged by brokers on the organized exchanges, the fact that
they are negotiable makes it hard to come up with an average figure.
Price and yield quotations also differ from market and it is important to
know and understand these differences when comparing the relative merits of
different domestics bonds.
Asian Currency Market
Asian dollars are the same current account surpluses in dollars used in
the Asian continent. Singapore has developed as the centre for this market,
particularly after 1968. This market facilities the use of dollar balances in the
Asian continent for balance of payments purposes as well as for investment in
development projects. It has imparted greater liquidity to the Asian economies
whereby larger trade and larger investment became possible in this region. There
was also greater co-operation in economic and financial matters as a result of the
Asian dollar market in many centres in the region such as Hongkong, Sydney
and Manila.
Source and Uses :
The main sources of funds for the market came from varied groups
individuals, corporations, commercial banks, international institutions,
multinationals, the central banks, the governments etc. Thus, a part of the dollar
deposits is owned by the US banks and US nationals. Originally, the market had
AcroPDF - A Quality PDF Writer and PDF Converter to create PDF files. To remove the line, buy a license.
MBA- H4030 International Business Finance
264
grown without any official favour and as an off-shoot of pure private enterprise.
Subsequently, when it reached a state of significant dimensions which no single
nation could control, all governments and international institutions began to
consider it respectable and partake in its operations. Borrowers and lenders in
the market are only banks insofar as the inter-bank segment is concerned.
Among the non-bank public, companies in export and import business or in
investment business or multinationals in need of funds and governments or
central banks for balance of payments purposes figure prominently in the non-
bank markets. Among borrowings, bulk of it is for commercial operations by
non-bank public and business corporations.
The Euro-currency market has no geographical limits or a common
market place. Business is done by telex, telephone and other communication
systems. Internationally-reputed brokers put through the transactions for the
banks. Deposits are secured for the banks operating in the market by the general
guarantee of its parent or holding company and in some cases, by its central
bank and /or the government of the concerned country. Similarly, loans to
commercial parties are guaranteed by their respective governments. Deposits
and loans to banks are, however, not guaranteed except by the banks parent
companies or their exchange control authorities.
The amounts of loans and the periods of maturity vary over a wide range
from a few thousands to millions of dollars and from call loans to maturities
extending up to 10-15 years. Some of the loans may be syndicated and jointly
sponsored by a number of banks. There are also varied interest rates of floating
rate notes.
AcroPDF - A Quality PDF Writer and PDF Converter to create PDF files. To remove the line, buy a license.
MBA- H4030 International Business Finance
265
Size and Growth of the Market in Euro-dollars :
The Euro-currency market has growth enormously since its inception in
1958. The principal agencies for collection of data on operations in this market
are the Bank for International Settlements and the Bank of England. Starting
with less than $ 1 billion in 1958, the market has growth to $ 100 billion (net
size) by 1972 and further to a few thousand billion (net size) by 1972 and further
to a few thousand billion early in Ninetees. About two-thirds to three-quarters of
these funds are in dollars and the rest in various other convertible currencies. In
the seventies, the relative importance of non-dollar currencies had increased due
to the decline in confidence in dollar and the abandonment of the old Bretton
Woods System. The importance of the Bond market has also been growing in
recent years. Loans of more than 3 years now constitute a larger portion of total
loans than before.
Techniques of Operations :
Deposits of currencies are made against a certificate given by the bank.
These certificates of deposits are bearer bonds and transferable by endorsement
and a market has been developed in them. This is the secondary market which
imparts liquidity to the depositors as these certificates can be discounted with
the banks dealing in this market.
The loan operations are concluded mostly for short-term duration and if
necessary on a revolving basis. Some loans are transacted on a floating interest
clause which enable the rate to be varied depending upon the daily interest rates
prevailing in the market or on a quarterly or six monthly interest rate review.
The long-term loans or bond issues are facilitated by the introduction of
AcroPDF - A Quality PDF Writer and PDF Converter to create PDF files. To remove the line, buy a license.
MBA- H4030 International Business Finance
266
revolving credit nature. The increases use of floating rate of interest clause and
revolving credit facility and approved performance of the US dollar in the
foreign exchange market were responsible for the increase in bond issues in
recent years. Multi-currency clause and floating interest rate clauses afford
protection to both the borrowers and lenders in the market against a sharp fall or
rise in interest rates as well as exchange rates in any currency which influences
the Euro-currency market. Basically, short-term funds in the form of deposits
are converted into term loans in this market.
Internationally reputed brokers are constantly in touch with the banks
dealing in Euro-currencies. Their quotations for borrowing and lending, rates of
interest in each currency are advised to the banks early at the start of the trading
hours of the day. These quotations give separately for each of the maturities and
for each currency are the starting point for offer and bids in the inter-bank
market which is the centre piece of Euro-currency market mechanism and which
accounts for 80 per cent of the total transactions in the market. The commercial
market consisting of loans to the public – both short and medium-term – is
arranged on a syndicated or a consortium basis if the loan is for large amounts.
The syndicated loans have become an important segment of the market in more
recent years.
In addition to the revolving credit facilities, fixed term facility extending
upto 5 or more years has subsequently developed.
Such large scale credit arrangements are made possible by banks
operations in the inter-bank market – one bank helping the other banks – or by
the syndicated or consortium arrangements among banks. The bulk of growth of
AcroPDF - A Quality PDF Writer and PDF Converter to create PDF files. To remove the line, buy a license.

MBA- H4030 International Business Finance
267
the Euro-dollar market must be attributed to the revolving nature of the credits
and the gearing ratio on which banks operate.
Importance of the Market :
The growth of Euro-currency market has produced far reaching effects
on the international financial system and the monetary scene. Firstly, these
floating funds have augmented the official international liquidity and helped the
financing of deficits in the balance of payments of countries. Secondly, these
Euro-currency funds are found useful for private corporate investments and for
working capital purposes. Thirdly, the quick and efficient source of funds
provided by this market has helped the easing of pressures on the international
monetary system, particularly on the dollar and other currencies under strain.
Fourthly, it has provided a channel for profitable investment for excess funds of
governments, central banks and business corporations. This market has finally
opened up avenues for greater international monetary co-operation and
integration.
Three major world bond markets-those of the United States, Japan and
the United Kingdom – and their most frequently traded instruments.
The US bond market :
The US bond market is the largest and most active in the world. It is also
the one that offer the largest variety of issuers and terms. Government issues are
not the whole market, however. There are also substantial components of
municipal bonds and mortgage bonds as well as a large and growing sector for
corporate issues.
AcroPDF - A Quality PDF Writer and PDF Converter to create PDF files. To remove the line, buy a license.
MBA- H4030 International Business Finance
268
Government issues :
US government bonds are the basic element in many, if not most,
international portfolios. About two-thirds of this debt is composed of negotiable
instruments with maturities of several days up to 30 years.
Treasury bills :
Treasury bills have maturities of up to one year. They are issued in four
main forms : three-month, six-month, one-year and cash management bills with
variable maturities. They represent about one-third of the government’s
outstanding negotiable debt.
Treasury notes :
Treasury notes have maturities from two or ten years. They represent
more than half of the negotiable debt issued by the government.
Treasury bonds :
Treasury bonds are issued with maturities of 15, 20 and 30 years. The maturities
are chosen depending on the Treasury’s perceived financing needs.
Non-government Securities :
i) Mortgage-backed securities :
A mortgage-backed security is supported by an undivided interest in a
pool of mortgages or must deeds held by private lenders or government
agencies. The market for mortgage backed securities issued by the governmental
agencies is right behind the market for Treasury securities insofar as liquidity
and risk are concerned.
AcroPDF - A Quality PDF Writer and PDF Converter to create PDF files. To remove the line, buy a license.
MBA- H4030 International Business Finance
269
International investors have been attracted to this market because of the
high returns and relative safety.
ii) Municipal bonds :
Municipal bonds can be divided into two categories : the longer-term
general obligations (GO bonds) and the shorter-term revenue notes issued in
anticipation of tax receipts or other income. These securities are issued by
municipalities, such as state and local governments, to finance schools, roads
and other public works.
Corporate bonds :
Issues of corporate bonds are often complex than Treasury bond issues.
They sometimes include call options, sinking funds, warrants and indexing
terms that complicate estimations of their relative riskiness and worth.
Foreign bonds
Foreign bonds are issued by foreign borrowers are called Yankee bonds.
Most operations at this type are generated by Canadian utility companies or
foreign governments.
The secondary market
Some non-Treasury securities are traded on organized exchanges.
Institutional investors that acquire corporate bonds on the primary market attach
considerable importance to the potential liquidity of the secondary market.
Consequently, they are attracted to the larger issues.
AcroPDF - A Quality PDF Writer and PDF Converter to create PDF files. To remove the line, buy a license.

MBA- H4030 International Business Finance
270
The Japanese bond market :
The Japanese government bond (JGB) market is the second largest in
the world behind the US Treasury market. The central instrument of the JGB
market is the ten-year bond, accounting for over half of public government debt
and 90% of daily market turnover.
Government issues :
The short term end of the market is less liquid than the long-term sector
and most foreigners are barred from it.
Financing bills :
Financing bills are used mainly as instruments for open market
operations in pursuit of monetary policy. They are sold mainly to the Bank of
Japan and therefore, hold little interest for foreign investors.
Treasury bills :
Japanese Treasury bills resemble US T-bills. They have maturities of
three and six months and are issued twice a month at public auction.
Medium-term notes :
Once every two months two-year bonds are issued by means of an
auction. They pay a semi-annual coupon and are traded in the over-the-counter
market.
AcroPDF - A Quality PDF Writer and PDF Converter to create PDF files. To remove the line, buy a license.

MBA- H4030 International Business Finance
271
Zero coupon bonds :
Five-year zero coupon bonds are issued by means of a syndicate once
every two months.
Long-term bonds
Long-term bonds are issued once a month in a process that combines an
auction with syndicated underwriting. The auction accounts for 60% of the issue
and the syndications for 40%. It determines the yield at which will be issued and
controls the allocation of bonds among syndicate members.
The secondary markets :
Trading hours are weekdays from 8.40 to 11.15 a.m. and 12.45 to 5.00
p.m. on the broker to broker (BB) screens. Dealers include securities houses,
city banks, trust banks and regional banks as well as a number of foreign firms.
Most trades take place over the counter on a bid-ask basis.
Non – government issues :
Municipal bonds Most municipal bonds have a maturity of ten years with
semi-annual coupon payments. Different governmental agencies can also issue
bonds that may or may not be guaranteed by the government.
AcroPDF - A Quality PDF Writer and PDF Converter to create PDF files. To remove the line, buy a license.

MBA- H4030 International Business Finance
272
Corporate bonds :
Most other Japanese companies prefer issuing bonds directly on the
Eurobond market even though the ultimate bondholders are usually Japanese
residents. It is also interesting to note that a high proportion of Japanese
corporate bonds are either convertible issues or have warrants attached.
The UK bond market
UK government debt, called gilts, constitutes the most important sector
of the sterling denominated debt market. Of the four classes of gilts issued by
the Treasury, only two-conventional and index-linked – currently have any
relevance.
Gilt – edged securities :
Conventional gilts
Conventional gilts, referred to as conventional stocks in the United
Kingdom, represent 85% of the total Market. They have a fixed coupon, ranging
from 3% to 15.5% and a fixed maturity.
Index-linked gilts
Index-linked stocks represent 15% of the gilt market. The redemption
value of the bond is also linked to the RPI to protect the investor against
inflation.
AcroPDF - A Quality PDF Writer and PDF Converter to create PDF files. To remove the line, buy a license.
MBA- H4030 International Business Finance
273
The secondary market
London Stock Exchange dealings are carried out by telephone by gilt-
edged market makers.
The International bond market
Organisation of the Eurobond market
Eurobonds are different from foreign bonds. Foreign bonds are issued by
a borrower in a domestic capital market other than its own and usually
denominated in the currency of that market. Eurobonds are issued in
Eurocurrencies by an international syndicate of banks in several international
financial markets. Because Eurobonds are issued and traded on international
financial markets, they are not subject to the rules and regulations that are
common to most domestic bond markets, although there are interprofessional
rules and regulations issued by ISMA. Issuers are also subject to the rules and
regulations of the monetary authorities in their country of residence. In any case,
the development of the Eurobond market is synonymous with the absence of
withholding tax.
The first Eurobond borrowing dates back to 1963 when the interest
equalization tax (IET) imposed by the United States stopped the development of
the Yankee bond market dead in its tracks. A Yankee bond is a foreign bond
issued in the US market, payable in dollars and registered with the SEC.
Eurobond issues characteristically have shorter maturities than those
found on domestic markets. The large majority of Eurobond issues have
maturities less than or equal to five years. The development of the Euronote
facility and Euro MTNs in the 1980s reinforced this tendency. Euronotes are
AcroPDF - A Quality PDF Writer and PDF Converter to create PDF files. To remove the line, buy a license.
MBA- H4030 International Business Finance
274
short-term, fully negotiable, bearer promissory notes, issued at a discount to face
value and typically of one, three or six-month maturity. Euro MTNs are
medium-term bearer notes of small denomination with maturities ranging from
one to five years.
Issuing procedures :
Issuing procedures have evolved since the Eurobond market’s inception.
At the beginning, the traditional issuing procedure, called “European”, was
cumbersome. Syndicates often contained as many as several hundred members
for the jumbo loans of USD 1 billion or more. Final investors were institutions
like pension funds, investment funds and insurance companies, as well as
private individuals attracted by the absence of withholding tax and the
anonymity of bearer certificates.
“European” issue procedure
The European issue procedure starts with a lead manager who has a
mandate from the borrower to organize the operation. As in the Euroloan
syndication, the lead manager is responsible for negotiating the overall
conditions of the issue concerning the coupon, price, maturity, etc. He is also
responsible for organizing the syndicate by finding other banks that want to
participate. The borrower, of course, can require the participation of certain
institutions and most syndicates will include one or more institutions with the
same nationality as the borrower.
These are three major dates in the issue procedure. The first is the launch
date when a new issue’s invitation telexes are officially sent out to the syndicate.
AcroPDF - A Quality PDF Writer and PDF Converter to create PDF files. To remove the line, buy a license.
MBA- H4030 International Business Finance
275
The second is the pricing date, when the final terms of the issue are completed.
The third is the closing date, when a new issue’s proceeds are paid to the
borrower by the lead manager by the borrower.
The entire syndication process can be described in six stages :
1. Preliminary negotiations and preparation. Potential issuers and lead
managers negotiate on their respective needs and capabilities. This stage
ends with a written proposition to the prospective borrower on the
different financing possibilities concerning the amount of the issue, the
coupon rate, the maturity and the issue price.
2. Preplacement. Once the mandate has been received the lead manager
starts looking for partners. He sends telexes, confirmed by letter, inviting
prospective underwriters and sellers to participate in the syndicate. On
the launch day a prospectus containing the relevant information on the
proposed issue is distributed. In the ensuing period – across about two
weeks – the institutions that have been invited to participate sound out
potential investors and make their decision on whether or not to
participate and for how much.
3. Fixing the final terms of the issue (pricing day). Based on the response
to his invitation, the lead manager fixes the final terms of the issue,
making any modifications that he feels necessary. Once this has been
done, the underwriting agreement is completed and signed by the lead
manager and the other underwriters.
4. Apportioning securities (offering day). On the day following pricing
day, the lead manager sends out telexes to the institutions that agreed to
participate, stipulating the number of securities that will be allocated to
them.
AcroPDF - A Quality PDF Writer and PDF Converter to create PDF files. To remove the line, buy a license.

MBA- H4030 International Business Finance
276
5. Placing the issue. During the next two weeks the selling group actively
places the issue with final investors and the lead manager supervises the
grey market to keep the price in line with the issue price.
6. Closing the issue (closing day). The issuer receives the net proceeds of
the issue (amount less commissions). The actual securities are issued and
distributed to the final investors.
Bought deal
In this procedure the conditions are fixed by the lead manager and
proposed to the issuer. The issuer than has a short time to accept or reject them.
This package system is much more rapid than the European procedure and the
syndicates much smaller.
Instruments and trading techniques :
The three main types of Eurobonds are :
i) Fixed rate issues or straight bonds
ii) Floating rate notes (FRNs)
iii) Equity-linked bonds, either convertible or with warrants attached.
The heart of the market consists of the fixed rate issues but, at one time
or another depending on market conditions, the other two types have known
periods of popularity.
i) Fixed rate issues
The face value of a typical fixed rate Eurobond varies between USD
1000 and USD 5000 with maturities of three, five, seven and ten years.
Maturities are linked to the economic uncertainty prevailing at any time with
AcroPDF - A Quality PDF Writer and PDF Converter to create PDF files. To remove the line, buy a license.
MBA- H4030 International Business Finance
277
different clientele compartments for the different maturities. Short and medium-
term maturities in Eurosterling. On the other hand, longer maturities are destined
for institutional investors and are issued by the list system. In this system the
managers offer portions of the issue at a fixed price directly to a list system. In
this system the managers offer portions of the issue at a fixed price directly to a
list of investors who have one day to accept or refuse. The contractual
guarantees of a fixed rate issue are typically very stringent. They do not,
however, usually include collateral default.
Rates are often fixed as a spread with respect to a benchmark rate in the
domestic market of the currency in question, such as US Treasury bonds for the
dollar, gilts for sterling, etc. If the issuer is already in the market, the spread is
determined in relation to its past issues. If it is new to the market, its reputation
and credit rating will determine the spread.
ii) Floating rate notes (FRNS):-
FRN are typically issued with higher face values (USD 5000, 10,000,
and 100,000) than fixed rate issues because they are directed at institutional
investors. The interest rate is variable and determined periodically. It is quoted
as a discount or premium to a reference rate, such as six-month Libor + 1%.
This spread can be fixed once and for all or can vary over time. The reference
rate is often Libor but other reference rates are also common such as the T-bill
for the dollar. The periodicity of the reference rate determines the reference
period for the FRN. Thus, the interest rate on an FRN referenced to one-month
Libor would be revised monthly and the interest rate on an FRN referenced to
three-month Libor would be revised quarterly. Semi annual is the most common
reference period.
AcroPDF - A Quality PDF Writer and PDF Converter to create PDF files. To remove the line, buy a license.

MBA- H4030 International Business Finance
278
Minimax and capped FRNs :
FRN have traditionally been issued with a minimum rate embedded in
the contract. Some, called minimax FRNs, have been issued with a minimum
and a maximum rate. Others called capped FRNs, have been issued with only a
maximum rate. A minimum rate is an advantage for the investor while a
maximum rate is an advantage for the issuer.
Convertible and drop lock FRNs :
Some issues give the investor the right or the obligation to convert the
FRN into a long-term fixed rate bond. Convertible FRNs give the investor the
option of converting and are similar to debt warrant FRNs. Drop lock FRNs
make conversion automatic if the reference rate falls below some designated
floor value.
Equity-linked bonds
Equity-linked bonds are associated with the right to acquire equity stock
in the issuing company. Some have detachable warrants containing the
acquisition rights, while others and directly convertible into a specified number
of shares.
The market value of a convertible bond can be separated into two parts:
the naked value and the conversion value. The naked value is obtained by
valuing the bond as if the conversion option did not exist. The conversion value
of the bond is added to the naked value to determine the market value of the
whole bond.
AcroPDF - A Quality PDF Writer and PDF Converter to create PDF files. To remove the line, buy a license.

MBA- H4030 International Business Finance
279
Other instruments : (I) Euronote facilities :
The Euronote facility was a major innovation in the 1980s. It is a cross
between a short-term bond and a bank loan. It allows a borrower to issue short-
term discount notes via a variety of note distribution mechanisms (Euronotes,
Euro CP and Euro CDs) under the umbrella of a medium or long-term
commitment from a group of banks. The banks are committed to purchasing the
notes at a predetermined rate or maximum margin, if the notes cannot be placed
with investors at or under the margin. The issuer thus has access to medium or
long-term financing using short-term negotiable securities, which helps reduce
the cost of borrowing. The cost is further reduced if the term structure is upward
sloping.
i) Euro commercial Paper :
Commercial paper is negotiable, short-term notes or drafts of a
governmental agency, bank or corporation. The first Euro-commercial paper
dates back to 1971 in response to US regulations on foreign investment. The
market really began to develop, though, in the early 1980s and took off in 1986.
In fact Euro CP can be considered a refinement on the Euronote facility because
it requires no backup credit. Since 1986 Euro CP facilities have outnumbered
Euronote facilities by a large margin.
ii) Euro MTNs :
Euro MTNs have maturities of one to five years, fixed coupons and are issued
under a program agreement or through one or more dealers. They are small
AcroPDF - A Quality PDF Writer and PDF Converter to create PDF files. To remove the line, buy a license.

MBA- H4030 International Business Finance
280
denomination bearer paper listed on the London or Luxembourg stock
exchanges.
II. The secondary market
We have already pointed out that most Eurobonds are registered with a
stock exchange during the issuing procedure, most trading is done over the
counter.
Syndicated Eurocredits :
A Eurocurrency is any freely convertible currency, such as a dollar or a
yen, deposited in a bank outside its country of origin. It is a major source of
international liquidity and figures prominently in determining exchange rates
and financing balance of payments disequilibrium. The retail side of the
Eurocurrency market is also important. It is one of the major sources of large-
scale financing for a wide range of countries, institutions and firms. Because of
the increasing tendency of banks to securitize their riskiest assets, it is also a
source of many bonds that are traded on the international bond market.
Eurocurrency credit facility is that it can be mobilized quickly and easily.
The documentation is standardized and simple and there is no waiting list to
respect as there is in the Eurohond market.
Characteristics of syndicated Eurocredits :
1) The lead manager
Syndication refers to a number of banks grouping together to make a
loan to one borrower. It is usually because of the size of the loans involved. The
number of banks participating in a syndication can go as high as 100 or more but
AcroPDF - A Quality PDF Writer and PDF Converter to create PDF files. To remove the line, buy a license.
MBA- H4030 International Business Finance
281
there is a precise hierarchy within the syndicate corresponding to each bank’s
responsibilities. The lead manager has the most important role in organizing the
loan from beginning to end and is always a large, internationally recognized
bank. The lead manager is responsible for negotiating the overall conditions of
the loan concerning rates, maturities, guarantees, etc. with the borrower. It is
also responsible for organizing the syndicate by finding the other banks that
want to participate. Sometimes a syndicate will include two or more lead
managers.
Organizing the loan :
As the head of the syndicate, the lead manager is responsible for drawing
up the placing memorandum that is then sent out by telex to certain banks that
might be interested in participating is under-writing the loan. The placing
memorandum is a confidential document that contains all the relevant
information about the borrower and the placement. Generally, banks that are
contacted for participation are regular partners of the lead manager. Experience
has shown, in fact, that syndicates tend to remain stable over time and there is a
strong tradition of reciprocity among members.
Different types of credits :
There are two basic categories of Eurocurrency credit facilities : term loans
and revolving credit facilities. A term loan can be divided into three stages : the
drawdown period, the grace period and the redemption period. During the
drawdown period, which usually lasts about 24 months, the borrower can
increase the amount of his loan. The increases can be by simple advance
notification or they can be scheduled contractually. The grace period comes after
AcroPDF - A Quality PDF Writer and PDF Converter to create PDF files. To remove the line, buy a license.
MBA- H4030 International Business Finance
282
the drawdown period. During this time, the amount of the loan does not change
and the only cash flows are those related to interest and commissions. The
redemption period refers to the period when the loan is paid off. It can be paid
off in one single installment, called a bullet repayment, or in several
installments, called a staged repayments. As already mentioned, most
Eurocurrency loans give the borrower the right to prepay the loan with no
penalty.
A revolving credit facility is a loan that permits the borrower to drawdown and
repay at its discretion for a specified period of time. This increased flexibility
has a cost paid in the form of a commission, called the commitment fee. The
commitment fee is paid on the unused portion of a facility. A revolving credit is
especially useful for borrowers with access to the other segments of the
international financial markets who might need a bridging loan to tide them over
between the end of one issue and the beginning of another.
Term loans and revolving credit facilities are only the generic types of
syndicated Eurocredits. Multi-currency loans give the borrower the possibility of
drawing the loan in several different currencies. This is especially useful for
managing exchange rate risk. Maturities are also flexible. Most Euroloans are
medium term, lasting from four to eight years, but it is not surprising to find
maturities of up to 20 years.
AcroPDF - A Quality PDF Writer and PDF Converter to create PDF files. To remove the line, buy a license.

MBA- H4030 International Business Finance
283
Questions
1) Write a note on American Depository Receipt (ADRs)
2) Discuss the features of GDR
3) What is a Eurobond and how does it differ from a domestic bond?
4) What is the issuing procedure for a Eurobond ?
5) Why are Euro loans attractive to borrowers.
6) Describe the process for organizing a syndicated loan.
7) What is the difference between a term loan and revolving credit facility.
8) What factors aid in making the international capital markets move
integrats? Explain the importance of emerging capital market in
international investing.
9) What is the difference between a money market and a capital market ?
10) What is the difference between an intermediated and a nonintermediated
financial market ?
11) What is the difference between an internal and an external market?
12) What are the characteristics of a domestic bond? An international bond?
A foreign bond? A Euroband? a global bond ?
13) What are the benefits and drawbacks of offering securities in bearer form
relative to registered form?
14) What is an equity-linked Eurobond ?
15) Summarise the various considerations that enter into the decision to
choose the currency, market and vehicle for long term borrowing.
16) What are the crucial aspects in negotiating a syndicated bank loan.
AcroPDF - A Quality PDF Writer and PDF Converter to create PDF files. To remove the line, buy a license.
106
CHAPTER: IV
Settlement of Claims of LICI
4.1 Claims Management Department
4.2 Procedure for settlement of claims:
4.3 Claims Settlement Operations of Life Insurance Corporation of
India
4.4 Claims Intimated, Claims Outstanding and Ratio of Claims
Outstanding to Claims Intimated
4.5 Claims Settlement Operations of Life Insurance Corporation of
India in NER
4.6 Claims Intimated, Claims Outstanding and Ratio of Claims
Outstanding to Claims Intimated in NER

107
CHAPTER: IV
Every life insurance company has two gateways – the Underwriting
Gateway when the insurer under certain terms select a proposal for life
insurance, and the Claims Gateway, through which policy benefits are
passed on to the life assured/ policyholder or a beneficiary in the event of
death or survival of the term. Needless to add, Claims performance is the
litmus test of a life insurer’s credibility. If it repudiates or delays payment of
a claim, a customer is going to be very unhappy and many more customers
and prospects would have cause to doubt the promise made by the insurer.
At the same time, if claims are paid blindly, overlooking fraudulent claims
that can arise, it can seriously erode the financial soundness of the insurer
and put its other customer’s interests in jeopardy. Again, it is not just
important to know whether a claim has been paid. It is perhaps equally
important to ask whether the claim actually serves to benefit the beneficiary.
A claim need not necessarily be the end of all relationships with a customer.
It could also be the beginning of another relationship.
The Life Insurance Corporation (LICI) was established about 55
years ago with a view to provide an insurance cover against various risks in
life. A monolith then, the corporation, enjoyed a monopoly status and
became synonymous with life insurance. LICI of India is one of India’s
leading financial institutions, offering complete financial solutions that
encompass every sphere of life. From commercial banking to stock broking
to mutual funds to life insurance to investment banking, the group caters to
the financial needs of individuals and corporate. It has been started with the
objectives of spreading Life Insurance widely and in particular to the rural
areas, meets the various life insurance needs of the community that would
arise in the changing social and economic environment.

108
The organization is the form having independent or co-ordinate parts
of unified action for the accomplishment of common objectives. As such the
organization relating to insurance business is a form having different
functional divisional units with the ultimate aim of providing effective
services to the customers of the insurance products. An effective
organization is essential to share information and effectively execute the
managerial decisions. The organizational structure differs for different types
of business. The organization structure is based on the objectives or mission
of the business organization. The organization should be structured with an
aim to coordinate, not only with internal managers or groups, but also with
the external world, the customers, authorities and other persons directly or
indirectly interested in it.
The insurance business is concerned with the functions of marketing
of insurance products and its related functions like premium collections and
premium fixings, accepting the insurance proposals, issuing policy
documents, maintain records relating to the policies issued everyday in
chronological order, and also payment of claims. The claims department is
associated with the receipt of claims and arrangement of claims
investigations. After it is decided whether to make a payment to the assured
or to defer it, the insurance company may seek guidance from the panel of
advocates. The insurance company needs to protect the company from the
claims litigations of the clients by defending the claims in the courts and
supervise other alternative dispute resolutions. Thus the insurance
organization is associated with the marketing of policies, underwriting of
policies, claims payment, claims defending and staff matters. The delegation
of duties to each unit with well-defined limitations, responsibilities and
decision making are all related to the organizational structure and

109
management. Today, most of the functions, nearly 90%, related to the
marketing and other related activities of the insurance consumers are dealt
and handled at the branch level. The branch office, depending upon its
business, is headed by a manager and each function of insurance business
like marketing, underwriting of policies, accounts, claims payments, staff
and administration matters are identified as departments of the branch office
with responsible officials such as Administration and Accounts
Officers(AAO).
The managerial decisions are based on the information supplied by
the AAO, the functional head at root level. All the functions of claims will
be settled at the branch level. The AAO of life insurance business will deal
with maturity and death claims. If the branch is smaller, all the types of
claims will be dealt by one AAO and if the branch is bigger with a good
number of claims, they will be settled by, separate offices. At the branch
level, these officials have to maintain cordial relations and establish a
system of sharing information with the other departments, relating to the
policy documents, payment of premium and using the staff or the agents for
the settlement of claims disputes. The branches maintain records relating to
the claims payment and claims rejections. They will submit the reports to
the Zonal Officer, who in turn will forward it to the Head Office or
Corporate Office.
The branches report to their respective divisional office. If any branch
gets a claim and there is a problem in identifying the correct claimant
among the claimants, or otherwise, a dispute of risk crops up, which will be
forwarded to the divisional office with its comments. The divisional office
after receiving the papers, verifies them, applies legal knowledge and skills,
or seeks advice from skilled persons and tries to solve the problems. The

110
divisional office is responsible to settle the claims referred by the branch
office and also report the same to the zonal office, which in turn will
consolidate the data and submit the same as required by the statute or
otherwise under any law to the government. The government will put the
same for the approval of the both the houses.
At the division office level, the claims department generally deals
with the claims, which are pending with the branches because of any
disputes, or some claims which are of high value. The investment portfolio
and establishment and maintenance of reserves for the purpose of claims
payment or otherwise required under the law is the important function of the
central office. Thus the organizational structure of the insurance business is
more flexible and decided, based on the above said factors.
4.1 CLAIMS MANAGEMENT DEPARTMENT
The claims department is one of the key departments in an insurance
company. The claims department has the following functions to perform:
To provide the customers of insurance and reinsurance companies
with high quality of service. This role gives a long-term edge to the
company and hence is referred to as the strategic role.
To monitor the claims and see that whether the benefits of insurance
exceed the costs of claims. This role is referred to as the cost-
monitoring role of the claims department.
To see that the expectations of the customers are met with regard to
speed, manner and efficiency of the service. This is called the
customer service role of the claims department.
To meet the standard of service, to keep up to the customer's
expectations and still operate within the budget. This is the
managerial role of the claims department.

111
Both the quality of the service and cost of claims is the responsibility of the
claims department. The department has to look after the proper mix of the
two. The cost of claims must not exceed a given level in trying to render a
very good service to the customer. So the claims department should work
with due diligence to balance the two parameters. The estimation of future
liabilities is just as important as control over the claim payments. As the
claims department is in direct touch with the customer, it has to ensure the
quality of service.
The claims department has the sole responsibility of managing
claims. Claims management by far is the most complex issue in an
insurance company. The people in the claim department should have good
interpersonal skills. If they are not able to irk in harmony the customers will
not receive quality service. There should be sufficient number of people as
managers so as to simplify job and proper human resource systems in place
so that such persons are recruited whose philosophy goes with the mission
and vision of the organization. It has become imperative for the claims
department to provide quality service to the customers so that the corporate
goals are achieved. The claims department, in effect, acts as an interface
between the customer service quality and insurance company’s objectives. It
has to be given the proper weight age and motivation so that the business as
a whole function well.
Understanding the requirements for various life insurance benefits
(claims) is important for the customers. The overriding condition on claims
is the payment of premiums i.e. claims are only payable if premiums are
paid up to date. There are various types of claims under life policies. The
general requirements for each of these claims are briefly explained below.

112
Death Claims: This is a claim paid when then the person insured dies. For a
death claim to be paid the following basic conditions must be fulfilled.
The policy document, original death certificate, a burial permit copy
of the ID of the deceased must be provided to the insurance company.
A report from the doctor who treated the deceased must be presented
to the insurance company.
Claim forms must be completed
A report from the doctor who last treated the deceased person may be
required.
A police abstract report may be required where death occurs through
an accident.
The documentation required for payment of death claims are easily
available and claimants need to immediately inform the insurance company
where problems are encountered in securing the documents. The documents
are usually required so as to reduce on the possibility of paying fraudulent
claims or paying the wrong claimants. Many insurance companies will
frequently waive certain requirements under certain special circumstances.
Maturity Claims: A maturity claim is paid out mostly on endowment and
education insurance policies whose duration has expired. For example in an
insurance policy with duration of 15 years, the maturity value will be paid
on the 15th anniversary after affecting the policy. Payment of a maturity
claim is a straightforward affair where the customer returns the original
policy document and signs a discharge form. The claim cheque is usually
released in a period of about two weeks once all required conditions are
fulfilled.
Partial Maturity Claims: Most endowment and education policies provide
for payment of partial maturities after a given duration. The partial maturity

113
is normally paid on set dates in the policy document. A typical education
policy of 10 years provides for payment of 20% of the sum insured after
four years and every year thereafter until the expiry of the policy. The life
insurance company usually prepares partial maturity cheques in an
automated manner and the customer does not have to claim. The cheque is
either sent directly to the customer or the nearest branch office for ease of
collection.
Surrender Value Claims: When a customer is unable to continue with the
payment of premiums due to unplanned events like retrenchment or
dismissal he has the option of encashing the policy to receive the surrender
value so long as the policy has been in force for more than 3 years. The
procedure for lodging this type of claim is very simple and is similar to the
maturity claim whereby the customer returns the policy document and signs
a discharge form. The claim cheque is then paid to the customer within two
weeks.
Policy Loans: This is strictly not a claim but a benefit given out by life
companies for life policies that have been in force for at least three years.
To receive a policy loan directly from a life company entails assigning the
policy to the life company and receiving a loan cheque. The insurance
policy can also be assigned to a bank and the loan is then granted by the
banks and the policy document utilized as security for the loan.
Disability Claims: This will arise in life policies where the customer
purchases a personal accident policy rider as an additional benefit.
Disability claims are payable subject to sufficient medical evidence being
provided as proof of disablement.

114
4.2 PROCEDURE FOR SETTLEMENT OF CLAIMS
Settlement of maturity claims:
Under LICI, claims can arise on the maturity of the policy of the policy
holder. The processing of claims by maturity is normally undertaken by the
Divisional Office of LIC about two months before the date of maturity. .
The LICI sends intimation before the maturity date. If the notice of maturity
is not received and the date of maturity is known to the policyholder, then
the policyholder can take the necessary steps to get the due Maturity
amount. The Corporation sends Maturity Intimation along with the
discharge forms to the policyholder informing him about the requirements
of the settlement of claims.
In case the maturity intimation is not received by the policyholder till
around 2 months before the date on which the policy matures, he
should contact the concerned Divisional Office and obtain a copy of
the maturity intimation.
Policy Document (if not in the custody of LICI as security for loan):
On receipt of the maturity intimation, the policyholder should send
the original policy document along with the last receipt of insurance
premium paid. The policy document needs to be submitted in original
unless it is in custody of LICI as security for the loan.
Age proof document (if age has not been admitted earlier): The
policyholder should also submit his age proof to the Corporation in
case it has not already been submitted. In case, the policyholder has
already submitted his age proof to LICI, the form of Discharge (Form
No. 3825) to be executed by the policyholder, is also sent along with
the Maturity Intimation.
L.I.C. accepts following documents as valid age proofs:
Horoscope of the assured

115
Certificate relating to the baptism ceremony among Christians
Birth certificate from the Municipal Corporation
High School Certificate
Service book.
Discharge Form No. 3825 duly stamped & signed, attested by a
witness: The form of Discharge (Form 3825) should then be properly
filled, signed and sent to the Office of LICI from which it was issued.
The signature must be on a revenue stamp and must be attested by a
witness.
Assignment / Reassignment Deed, if any: In case the policy or any
Deed of Assignment or Reassignment are lost by the policyholder, he
has to submit an indemnity bond along with a reliable surety of sound
financial standing acceptable to LICI. The indemnity bond has to be
in a particular format (Form 3815). In such a case the claim is settled
in the absence of the policy document.
Existence certificates in case of children’s Deferred Assurance &
Pure Endowment Policies.
In due course, LICI sends a cheque to the policyholder for the money
due to him as per the terms of the policy.
LICI upon the receipt of the claim form will act in the following manner:
LICI will send an acknowledgement to the effect that the claim form
has been received and the aforesaid document will also state that the
insurer is in the process of checking all the necessary items and will
get back to the claimant shortly.
Then the insurer will ask for necessary documents that are required
for settlement of claims. The claimant has to provide all the necessary
documents that are being asked by the insurer.
116
After verification, the insurer arrives at the final amount that has to be
paid to the claimant and then prepares a cheque or such mode of
payment as has been agreed upon in the policy or between the
claimant and the insured.
Settlement of Death claims:
The death claim amount is payable in case of policies where premiums are
paid up-to-date or where the death occurs within the days of grace. The
following is the process of settlement of claims in the case of death claims:
1) Intimation of death:
The first requirement of the Corporation in the case of death claim is that an
"intimation of death"’ should be sent to the branch office of the LICI from
where the policy was issued.
The intimation needs to be sent by the person who is entitled to get the
proceeds of the policy. It may be:
The nominee or
The assignee of the policy or
The deceased policyholder’s nearest relative.
The letter of intimation of death should contain the following information:
Name of the life assured
A statement that the life assured is dead;
The date of death;
The cause of death;
The place of death; and
Policy number /s
Claimant’s relationship with the assured or his status (nominee,
assignee, etc.).

117
Soon after the receipt of the intimation of the death, the branch office sends
the necessary claim forms along with instructions regarding the procedure to
be followed by the claimant.
2) Submission of Proof of Death
The proof of death required to be submitted is a certificate by the Municipal
Death Registry or by a Public Record Office which maintains the records of
births and deaths in the locality. Besides this some other statements or
certificates are also required to be given in the prescribed Claim forms:
A statement from the doctor who attended the deceased
policyholder’s last illness.
Certificate of treatment in the hospital where the policyholder died or
was treated by the hospital authorities.
Certificate of burial or cremation to be given by an independent
person who attended the funeral and has seen the dead body.
A certificate from the employer if the policyholder was in
employment at the time of death.
3) Submission of Proof of Age
The claimant should submit age proof of the policyholder to LICI in case it
has not already been submitted.
L.I.C. accepts following documents as valid age proofs:
I. Horoscope of the assured
II. Certificate relating to the baptism ceremony among Christians
III. Birth certificate from the Municipal Corporation
IV. High School Certificate
V. Service book.
4) Certificate of Ownership.
When the policy is validly assigned, or a nominee has been designated in
the policy, no further proof of title is necessary. In any other case, the

118
certificate of title is necessary. In such a case the corporation would require
legal evidence of title such as a Succession Certificate or Letters of
Administration or Letters of Probate or a Will.
5) Payment and Discharge
After completing all the above formalities, the insurance company issues a
discharge form for completion, which is to be signed by the person entitled
to receive the policy money. That is, it should be signed by:
The nominee, in case nomination was made under the policy;
The assignee, in case the policy was valid and unconditionally
assigned;
The legal representative or successor.
In due course, LICI sends the cheque for the amount due to the person
entitled to receive the same.
6) Early death claims:
If death occurs in less than three years from the date of the policy, the
following requirements must be complied with:
Policy Document
Discharge Form 3801
Assignment / Reassignment Deed, if any
Age Proof Document (if age has not been admitted earlier)
Certificate of treatment issued by the hospital authorities where the
deceased policyholder was treated last, on Claim Form ‘B1’ (F No.
3816)
A certificate by the employer if the deceased was an employee, on the
Claim Form ‘E’ (F No. 3787 revised)
Certificate of Death
Legal Evidence of Title (if policy is not assigned / nominated)
Claim Form ‘A’ (F No. 3783)

119
A statement from the Doctor who attended last the deceased
policyholder, on Claim Form ‘B’ (Form No. 3784 revised)
Certificate of Identity and burial by a person who attended the funeral
on Claim Form ‘C’ (F No. 3785 revised)
7) Non early claims:
If death occurs exactly or after 3 years from the date of the policy the
following requirements must be complied with:
Policy Document
Discharge Form 3801
Legal Evidence of Title
Death Certificate
Claim Form No. 3783A
Assignment / Reassignment Deed, if any (if policy not assigned
/nominated)
Age Proof Document (if age has not been admitted earlier)
8) Ex-gratia Settlement of Death Claims
Ex-gratia Settlement of Death Claims are not a right claim but on grounds
of humanity presently LICI is giving such claim amount for the policies
which are not in force but
If Death occurred after the expiry of grace period of premium due
date then Full Sum Assured along with the bonus will be payable as
Ex-gratia settlement
If Death occurred after three months but less than six months after the
expiry of first unpaid premium date half of the Sum Assured without
bonus will be paid as Ex-gratia
If the death occurred between six months and one year from the due date of
the first unpaid premium date, a claim may be considered to the extent of

120
the proportionate notional paid-up value on the basis of actual premium
paid.
In this chapter the performance of LICI is evaluated on the basis of
claims settlement operations and claims settlement operations in the North
Eastern Region.
4.3 CLAIMS SETTLEMENT OPERATIONS OF LIFE INSURANCE
CORPORATION OF INDIA
The performance of LICI is evaluated on the basis of claims
settlement operations. For this data relating to claims intimated, claims
settled and claims outstanding at the end of the year of the period of study
were collected and analyzed. Ensuring fair and quick claims settlement is
considered as one of the objectives of the insurers’ business mission. In case
of settlement of claims, the corporation settles a large number of claims
every year. The settled claim includes the written back claims also. Table
4.1 shows the claim settlement in terms of number of policies and the
amount by LICI for the study period from 1996-97 to 2010-11.
Percentage growth over previous year =
x 100-100
Table 4.1 reveals that total claims settled in terms of number of
policies and amount increased every year during the study period. In case of
a number of policies, it was 49.49 lakh policies settled in 1996-97, 75.86
lakh in 2000-01, 103.53 lakh in 2003-04, 135.31 lakh in 2006-07 and further
it increased to 189.56 lakh policies in 2010-11. The growth rate was 14.20%
in 1997-98, 15.57% in 2001-02, 11.97% in 2006-07 and negative growth
rate of -12.11% in 2010-11. During the study period, the highest growth rate
was observed 40.41% in 2009-10 and the lowest growth rate was observed -
12.11% in 2010-11. The annual compound growth rate of number of

121
policies during the study period from 1996-97 to 2010-11 was 9.93%.
During the study period of fifteen years, it has been observed that for seven
years the growth rate of claim settled in terms of number of policies was
below the annual compound growth rate and for eight years it was above the
annual compound growth rate.
Table 4.1 Claims settlement -Number of Policies & Sum Assured
Year Total (Maturity & Death)
Number (In
lakh)
% growth over
previous year
Amount (` in
crore)
% growth over
previous year
1996-97 49.49 5691.49
1997-98 56.52 14.2 6677.04 17.32
1998-99 59.83 5.86 7583.18 13.57
1999-00 66.42 11.01 9211.30 21.47
2000-01 75.86 14.21 11637.98 26.34
2001-02 87.67 15.57 14519.25 24.76
2002-03 96.91 10.54 17035.81 17.33
2003-04 103.53 6.83 19607.20 15.09
2004-05 115.05 11.13 23642.54 20.58
2005-06 120.85 5.04 28472.98 20.43
2006-07 135.31 11.97 36485.91 28.14
2007-08 143.80 6.27 38864.01 6.52
2008-09 153.60 6.82 40085.12 3.14
2009-10 215.67 40.41 53535.82 33.56
2010-11 189.56 -12.11 57490.29 7.39
CAGR 9.93% 17.09%
Source: Annual Reports of LICI & IRDA various issues
In case of amount settled, it was ` 5691.49 crores in1996-97, `
11637.98 crores in 2000-01, ` 19607.20 crores in 2003-04, ` 36485.91 in
2006-07 and further it increased to ` 57490.29 crores in 2010-11. This
reflex 10 fold increase during the period of study. The growth rate was

122
17.32% in 1997-98, 24.76% in 2001- 02, 28.14% in 2006-07 and 7.39% in
2010--11. During the study period, the highest growth rate was observed
33.56% in 2009-10 and the lowest growth rate was observed 7.39% in 2010-
11. The annual compound growth rate during the study period from 1996-97
to 2010-11 was 17.09%. During the study period of fifteen years, it has been
observed that for five years the growth rate of claim settled in terms of
amount was below the annual compound growth rate and for ten years it
was above the annual compound growth rate.
Chi-Square Test [X2] :–
Null Hypothesis (H0):
“There is no significant difference in the trends of growth of claim
settlement – Number of Policies during the period of study”.
Alternative Hypothesis (H1):
“There is a significant difference in the trends of growth of claim settlement
– Number of Policies during the period of study”.
Chi Square Table 4.1 A
Year Actual Growth (fo) Expected Growth (fe) fo-fe
1996-97
1997-98 14.2 12.64 1.56
1998-99 5.86 12.45 -6.59
1999-00 11.01 12.27 -1.26
2000-01 14.21 12.08 2.13
2001-02 15.57 11.89 3.68
2002-03 10.54 11.7 -1.16
2003-04 6.83 11.51 -4.68
2004-05 11.13 11.33 -0.2
2005-06 5.04 11.14 -6.1
2006-07 11.97 10.95 1.02
2007-08 6.27 10.76 -4.49
2008-09 6.82 10.57 -3.75
2009-10 40.41 10.39 30.02
2010-11 -12.11 10.2 -22.31
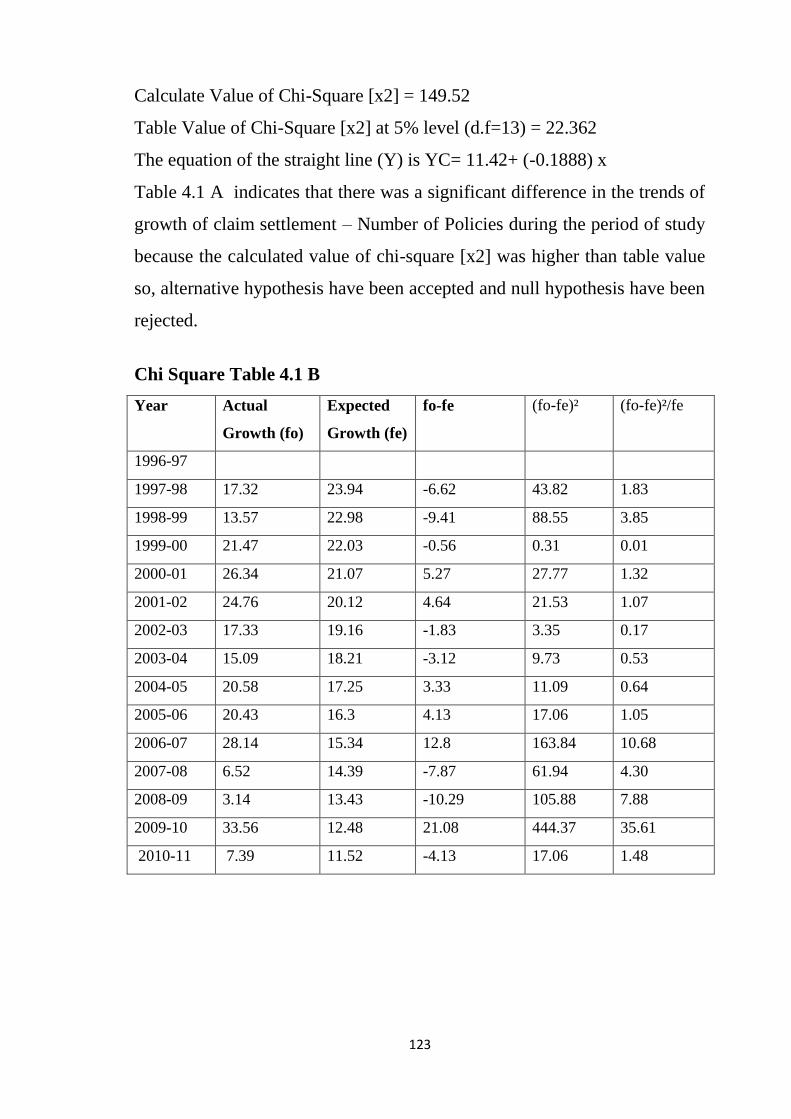
123
Calculate Value of Chi-Square [x2] = 149.52
Table Value of Chi-Square [x2] at 5% level (d.f=13) = 22.362
The equation of the straight line (Y) is YC= 11.42+ (-0.1888) x
Table 4.1 A indicates that there was a significant difference in the trends of
growth of claim settlement – Number of Policies during the period of study
because the calculated value of chi-square [x2] was higher than table value
so, alternative hypothesis have been accepted and null hypothesis have been
rejected.
Chi Square Table 4.1 B
Year Actual
Growth (fo)
Expected
Growth (fe)
fo-fe (fo-fe)² (fo-fe)²/fe
1996-97
1997-98 17.32 23.94 -6.62 43.82 1.83
1998-99 13.57 22.98 -9.41 88.55 3.85
1999-00 21.47 22.03 -0.56 0.31 0.01
2000-01 26.34 21.07 5.27 27.77 1.32
2001-02 24.76 20.12 4.64 21.53 1.07
2002-03 17.33 19.16 -1.83 3.35 0.17
2003-04 15.09 18.21 -3.12 9.73 0.53
2004-05 20.58 17.25 3.33 11.09 0.64
2005-06 20.43 16.3 4.13 17.06 1.05
2006-07 28.14 15.34 12.8 163.84 10.68
2007-08 6.52 14.39 -7.87 61.94 4.30
2008-09 3.14 13.43 -10.29 105.88 7.88
2009-10 33.56 12.48 21.08 444.37 35.61
2010-11 7.39 11.52 -4.13 17.06 1.48
124
Chi-Square Test [X2] :–
Null Hypothesis (H0):
“There is no significant difference in the trends of growth of claim
settlement – Amount during the period of study”.
Alternative Hypothesis (H1):
“There is a significant difference in the trends of growth of claim settlement
– Amount during the period of study”.
Calculate Value of Chi-Square [x2] = 70.44
Table Value of Chi-Square [x2] at 5% level (d.f=13) = 22.362
The equation of the straight line (Y) is YC= 17.73+(-0.955)x
Table 4.1 B indicates that there was a significant difference in the trends of
growth of claim settlement – Amount during the period of study because the
calculated value of chi-square [x2] was higher than table value so,
alternative hypothesis have been accepted and null hypothesis have been
rejected.
4.4 CLAIMS INTIMATED, CLAIMS OUTSTANDING AND RATIO
OF CLAIMS OUTSTANDING TO CLAIMS INTIMATED
The claims which are not settled became outstanding at the end of the
each year. The performance of the corporation also depends upon the
amount and number of outstanding claims. Table 4.2 shows the claims
intimated claims outstanding and ratio of outstanding claims to claim
intimated by the LICI in terms of number of policies and amount for the
study period from 1996-97 to 2010-11.

125
Table 4.2 Ratio of outstanding claims to claims intimated
Year Claims Intimated
Claims
outstanding
% of claims
outstanding
Number
(In
lakh)
Amount
(` in
crore)
Number
(In lakh) Amount
(` in
crore)
Number Amount
1996-97 49.42 5722.38 1.60 319.59 3.24 5.58
1997-98 56.51 6673.07 1.59 315.62 2.81 4.73
1998-99 60.07 7615.78 1.83 348.22 3.05 4.57
1999-00 66.19 9266.25 1.60 403.17 2.42 4.35
2000-01 75.55 11666.82 1.29 432.01 1.71 3.70
2001-02 86.99 14358.55 0.61 273.34 0.70 1.90
2002-03 96.53 16953.95 0.22 191.55 0.23 1.13
2003-04 103.46 19596.11 0.15 173.91 0.14 0.89
2004-05 114.90 23563.62 0.16 189.14 0.12 0.75
2005-06 120.68 28283.85 0.22 233.48 0.18 0.82
2006-07 135.09 36252.43 0.20 248.10 0.15 0.68
2007-08 143.60 38615.91 0.39 347.98 0.27 0.90
2008-09 153.21 39737.14 0.51 388.83 0.33 0.98
2009-10 215.16 53146.99 0.56 503.24 0.26 0.95
2010-11 189.00 56987.05 0.76 678.39 0.40 1.19
Source: Annual Reports of LICI & IRDA various issues
Table 4.2 shows the number of policies and amount of claims
intimated to the corporation every year, the number and amount of claims
outstanding at the end of the each year and the ratio of claims outstanding to
claims intimated in terms of number of policies and amount. From 1996-97
to 2010-11, the number and amount of claims intimated increased from
49.42 lakh policies & ` 5722.38crores amount to 189 lakh policies & `
56987.05 crores amount respectively. Thus there has been increase in the

126
claims intimated every year except in the last year during the study period.
The claims which are not settled become outstanding at the end of each
year. The performance of the corporation also depends upon the number and
amount of outstanding claims. In 1996-97 the number of policies and the
amount was 1.6 lakh and ` 319.59crores respectively, which increased up
to 2000-01 and it reached to 1.29 lakh policies and ` 432.01crores amount.
But after this, from 2001-02 the outstanding claims started decreasing every
year. In 2001-02 claims outstanding decreased to 0.61 lakh policies and `
273.34crores amount, which again decreased to 0.15 lakh policies and `
173.91 crores amount in 2003-04. However from 2004-05 the outstanding
claims increased every year till 2010-11.The claims settlement is an
indicator of the efficiency of the LICI in meeting claim- obligation. The
ratio of outstanding claims to claims intimated should decline. It has been
observed that during the study period from 1996-97 to 2010-11, the
percentage of outstanding claims to claims intimated has decreased from
3.24% to 0.40% in a number of policies and 5.58% to 1.19% in amount. It
was a tremendous achievement in the field of claims settlement.
Chi-Square Test [X2] :–
Null Hypothesis (H0):
“There is no significant difference in the percentage of claims outstanding
to claims intimated – Number of Policies during the period of study”.
Alternative Hypothesis (H1):
“There is a significant difference in the percentage of claims outstanding to
claims intimated – Number of Policies during the period of study”.

127
Chi Square Table 4.2 A
Year Actual
Percentage
(fo)
Expected
Percentage
(fe)
fo-fe (fo-fe)² (fo-fe)²/fe
1996-97 3.24 -0.73 3.97 15.76 -21.59
1997-98 2.81 -0.50 3.31 10.96 -21.91
1998-99 3.05 -0.28 3.33 11.09 -39.60
1999-00 2.42 -0.05 2.47 6.10 -122.02
2000-01 1.71 0.18 1.53 2.34 13.01
2001-02 0.70 0.40 0.3 0.09 0.23
2002-03 0.23 0.63 -0.4 0.16 0.25
2003-04 0.14 0.85 -0.71 0.50 0.59
2004-05 0.12 1.08 -0.96 0.92 0.85
2005-06 0.18 1.30 -1.12 1.25 0.96
2006-07 0.15 1.53 -1.38 1.90 1.24
2007-08 0.27 1.75 -1.48 2.19 1.25
2008-09 0.33 1.98 -1.65 2.72 1.38
2009-10 0.26 2.20 -1.94 3.76 1.71
2010-11 0.40 2.43 -2.03 4.12 1.70
Calculate Value of Chi-Square [x2] = -181.95
Table Value of Chi-Square [x2] at 5% level (d.f=14) = 23.685
The equation of the straight line (Y) is YC= 0.85+(0.225)x
Table 4.2 A indicates that there was no significant difference in the
percentage of claims outstanding to the claims intimated – Number of
Policies during the period of study because the calculated value of chi-
square [x2] was lower than table value so, null hypothesis have been
accepted and alternative hypothesis have been rejected.

128
Chi Square Table 4.2 B
Year Actual
Percentage
(fo)
Expected
Percentage
(fe)
fo-fe (fo-fe)² (fo-fe)²/fe
1996-97 5.58 4.62 0.96 0.92 0.20
1997-98 4.73 4.28 0.45 0.20 0.05
1998-99 4.57 3.93 0.64 0.41 0.10
1999-00 4.35 3.59 0.76 0.58 0.16
2000-01 3.70 3.24 0.46 0.21 0.07
2001-02 1.90 2.90 -1 1.00 0.34
2002-03 1.13 2.55 -1.42 2.02 0.79
2003-04 0.89 2.21 -1.32 1.74 0.79
2004-05 0.75 1.86 -1.11 1.23 0.66
2005-06 0.82 1.52 -0.7 0.49 0.32
2006-07 0.68 1.17 -0.49 0.24 0.21
2007-08 0.90 0.83 0.07 0.00 0.01
2008-09 0.98 0.48 0.5 0.25 0.52
2009-10 0.95 0.14 0.81 0.66 4.69
2010-11 1.19 -0.21 1.4 1.96 -9.33
Chi-Square Test [X2] :–
Null Hypothesis (H0):
“There is no significant difference in the percentage of claims outstanding
to claims intimated – Amount during the period of study”.
Alternative Hypothesis (H1):
“There is a significant difference in the percentage of claims outstanding to
claims intimated – Amount during the period of study”.
Calculate Value of Chi-Square [x2] = -0.43
Table Value of Chi-Square [x2] at 5% level (d.f=14) = 23.685

129
The equation of the straight line (Y) is YC= 2.280+(-0.345)x
Table 4.2 B indicates that there was no significant difference in the
percentage of claims outstanding to claims intimated – Amount during the
period of study because the calculated value of chi-square [x2] was lower
than table value so, null hypothesis have been accepted and alternative
hypothesis have been rejected.
4.5 CLAIMS SETTLEMENT OPERATIONS OF LIFE INSURANCE
CORPORATION OF INDIA IN NER
The Claims settlement operations of LICI of North Eastern Region
(i.e. Arunachal Pradesh, Assam, Manipur, Meghalaya, Mizoram, Nagaland,
Sikkim and Tripura) are evaluated on the basis of claims settlement
operations. The details prior to 2002-03 are not available with the
corporation therefore the details claims settlement from 2002-03 to 2010-11
are considered for analysis. For this data relating to claims intimated, claims
settled and claims outstanding at the end of the year of the period of study
were collected and analyzed. Ensuring fair and quick claims settlement is
considered as one of the objectives of the insurers’ business mission. In case
of settlement of claims, the corporation settles a large number of claims
every year in the region. Table 4.3 shows the claim settlement – policies
figures of North Eastern Region (Guwahati, Bongaigaon, Silchar and Jorhat
Divisions) by LICI.
Table 4.3 reveals that total claims settled in terms of number of
policies increased every year during the study period except in 2010-11. In
case of a number of policies(Maturity & Death), it was 2,11,669 policies
settled in 2002-03, 2,47,232 in 2005-06, 3,00,005 in 2006-07 and further it
increased to 4,19,711 policies in 2009-10. In 2010-11 there is a decline in
the policies to 3,96,193. The growth rate was 6.59% in 2003-04, 9.58% in

130
2004-05, 16.61% in 2006-07 and negative growth rate of -5.60% in 2010-
11. During the study period, the highest growth rate was observed 16.61%
in 2006-07 and the lowest growth rate was observed -5.60% in 2010-11.
The annual compound growth rate of number of policies during the study
period from 2002-03 to 2010-11 was 8.77%. During the study period of nine
years, it has been observed that for five years the growth rate of claim
settled in terms of number of policies was below the annual compound
growth rate and for three years it was above the annual compound growth
rate.
Table 4.3 Claims settlement- Policies figures of North Eastern Region (Guwahati,
Bongaigaon, Silchar and Jorhat divisions)
Year Maturity Death Total
Number
% growth
over
previous
year Number
% growth
over
previous
year Number
% growth
over
previous
year
2002-03 1,99,851 11,818 2,11,669
2003-04 2,12,144 6.15 13,471 13.99 2,25,615 6.59
2004-05 2,32,457 9.58 14,775 9.68 2,47,232 9.58
2005-06 2,41,295 3.80 15,969 8.08 2,57,264 4.06
2006-07 2,82,074 16.90 17,931 12.29 3,00,005 16.61
2007-08 3,05,832 8.42 20,294 13.18 3,26,126 8.71
2008-09 3,22,520 5.46 20,428 0.66 3,42,948 5.16
2009-10 3,96,220 22.85 23,491 14.99 4,19,711 22.38
2010-11 3,77,818 -4.64 18,375 -21.78 3,96,193 -5.60
CAGR 8.86% 7.20% 8.77%
Source: Annual Reports of LICI & IRDA various issues

131
Chi-Square Test [X2] :–
Null Hypothesis (H0):
“There is no significant difference in the trends of growth of claim
settlement in NER – Number of Policies during the period of study”.
Alternative Hypothesis (H1):
“There is a significant difference in the trends of growth of claim settlement
in NER – Number of Policies during the period of study”.
Chi Square Table 4.3 A
Year Actual Growth (fo) Expected Growth (fe) fo-fe
2002-03
2003-04 6.59 9.53 -2.94
2004-05 9.58 9.22 0.36
2005-06 4.06 8.91 -4.85
2006-07 16.61 8.60 8.01
2007-08 8.71 8.29 0.42
2008-09 5.16 7.98 -2.82
2009-10 22.38 7.67 14.71
2010-11 -5.60 7.36 -12.96
Calculate Value of Chi-Square [x2] = 63.07
Table Value of Chi-Square [x2] at 5% level (d.f=7) = 14.067
The equation of the straight line (Y) is YC= 8.44+ (-0.31) x
Table 4.3 A indicates that there was a significant difference in the trends of
growth of claim settlement in NER – Number of Policies during the period
of study because the calculated value of chi-square [x2] was higher than
table value so, alternative hypothesis have been accepted and null
hypothesis have been rejected.

132
4.6 CLAIMS INTIMATED, CLAIMS OUTSTANDING AND RATIO
OF CLAIMS OUTSTANDING TO CLAIMS INTIMATED IN NER
The claims which are not settled became outstanding at the end of the
each year. The performance of the corporation in the NER also depends
upon the amount and number of outstanding claims. Table 4.4 shows the
claims intimated claims outstanding and ratio of outstanding claims to claim
intimated by the LICI of NER in terms of number of policies the study
period from 2002-03 to 2010-11.
Table 4.4 shows the number of policies of claims intimated to the
corporation every year in the NER, the number of claims outstanding at the
end of the each year and the ratio of claims outstanding to claims intimated
in terms of number of policies. From 2002-03 to 2010-11, the number of
claims intimated increased from 2,11,384 policies to 3,95,897 policies
respectively. Thus there has been increase in the claims intimated every year
except in the last year during the study period. The claims which are not
settled become outstanding at the end of each year. The performance of the
corporation of the region also depends upon the number of outstanding
claims. In 2002-03 the number of policies was 1,295 which increased up to
2005-06 and it reached to 3,444 policies. But in 2006-07 the outstanding
claims decreased. However from 2007-08 the outstanding claims increased
for couples of every year. Again its decline to 3,093 in 2010-11.The claims
settlement is an indicator of the efficiency of the LICI in meeting claim-
obligation in the region. The ratio of outstanding claims to claims intimated
should decline. It has been observed that during the study period from 2002-
03 to 2010-11, the percentage of outstanding claims to claims intimated has
increased from 0.61%% to 0.78% in a number of policies. It was a
tremendous achievement in the field of claims settlement.

133
Table 4.4 The ratio of outstanding claims to claims intimated of NER
Year
Claims
Intimated
Claims
outstanding % of claims outstanding
Number Number Number
2002-03 2,11,384 1,295 0.61
2003-04 2,25,769 1,449 0.64
2004-05 2,47,600 1,817 0.73
2005-06 2,58,891 3,444 1.33
2006-07 2,99,712 3,151 1.05
2007-08 3,25,500 3,525 1.08
2008-09 3,43,794 4,371 1.27
2009-10 4,18,722 3,294 0.79
2010-11 3,95,897 3,093 0.78
CAGR 8.75% 12.88%
Chi-Square Test [X2] :–
Null Hypothesis (H0):
“There is no significant difference in the percentage of claims outstanding
to claims intimated of NER – Number of Policies during the period of
study”.
Alternative Hypothesis (H1):
“There is a significant difference in the percentage of claims outstanding to
claims intimated in NER – Number of Policies during the period of study”.
Chi Square Table 4.4 A
Year Actual percentage
(fo)
Expected
Percentage (fe)
fo-fe (fo-fe)² (fo-fe)²/fe
2002-03 0.61 0.72 -0.11 0.01 0.02
2003-04 0.64 0.75 -0.11 0.01 0.02
2004-05 0.73 0.78 -0.05 0.00 0.00
2005-06 1.33 0.82 0.51 0.26 0.32
2006-07 1.05 0.85 0.20 0.04 0.05
2007-08 1.08 0.88 0.20 0.04 0.05
2008-09 1.27 0.92 0.35 0.12 0.13
2009-10 0.79 0.95 -0.16 0.03 0.03
2010-11 0.78 0.98 -0.20 0.04 0.04
134
Calculate Value of Chi-Square [x2] = 0.63
Table Value of Chi-Square [x2] at 5% level (d.f=8) = 15.507
The equation of the straight line (Y) is YC= 0.85+(0.033)x
Table 4.4 A indicates that there was no significant difference in the
percentage of claims outstanding to the claims intimated in NER – Number
of Policies during the period of study because the calculated value of chi-
square [x2] was lower than table value so, null hypothesis have been
accepted and alternative hypothesis have been rejected.
The settlement of claims is a very important aspect of service to the
policyholders. The claims settlement is an indicator of the efficiency of the
LICI in meeting claim obligation. The Life Insurance Corporation of India
(LICI) still remains the benchmark when it comes to settling death claims.
However, major private players are also fast catching up. In case of a
number of policies, it was 49.49 lakhs policies settled in 1996-97 which
increased to 189.56 lakhs policies in 2010-11 with annual compound growth
rate 9.93%. In case of amount settled, it was ` 5691.49 crore in1996- 97
which increased to ` 57490.29 crores in 2010-11 with annual compound
growth rate 17.09%. Chi-Square test showed that there was a significant
difference in the trends of growth of claim settlement in both categories. It
has been observed that during the study period from 1996-97 to 2010-11,
the percentage of outstanding claims to claims intimated has decreased from
3.24% to 0.40% in a number of policies and 5.58% to 0.95% in amount.
Chi-Square test showed that there was no significant difference in the
percentage of claims outstanding to claims intimated in both categories. In
the context of NER, the number maturity claims have increased from
1,99,851 in 2002-03 to 3,77,818 in 2010-11 with an annual compound
growth rate of 8.86% and in the case of death claims have increased from
11,818 in 2002-03 to 18,375 in 2010-11 with a growth rate of 7.20% and a
135
compound annual growth rate of total death & maturity was 8.77%. Chi-
Square test showed that there was a significant difference in the trends of
growth of claim settlement in NER in terms of policies. It has been observed
that during the study period from 2002-03 to 2010-11, the percentage of
outstanding claims to claims intimated in NER was 0.61% to 0.78% in a
number of policies. Chi-Square test showed that there was no significant
difference in the percentage of claims outstanding to claims intimated in
NER. Thus, after the entry of private players there has been an increase in
the settlement of claims which resulted into the fall in the number of
outstanding claims. This also shows improved performance of the
Corporation.
************************************

Breaking Down the 5 Stages of Health Insurance Product Development & Management
by Greg Gant
There are typically five stages a health insurance company goes through when developing new products,
and then managing them once they’re live: product innovation, product quoting, product onboarding,
product servicing, and product marketing. Each of the five stages in the health insurance product
development and management lifecycle requires data to function, but this data is often spread out
across multiple systems — some insurers even have a separate system for each stage of the lifecycle.
From an efficiency standpoint, these disparate and disjointed systems present a major problem. They
prevent the employees responsible for each stage of the lifecycle from accessing valuable information
from other stages — for example, they prevent product innovators from understanding which products
are being quoted, sold, and serviced. In order to optimize health insurance product development and
management, insurers need to consolidate their systems and respective data within a single catalog
ideally one with specialized capabilities for each lifecycle stage. Before we get too into that, though, let’s
take a closer look at the five stages of health insurance product development and management, and
why data is so important at each stage.
1. Product Innovation
Each year, during open enrollment, health insurance companies debut new products to existing health
plan members. What members might not realize is that each open enrollment period is preceded by an
innovation cycle, during which their insurer’s innovation team works to either build new products or
reconfigure existing products according to member feedback, new products from competitors, and/or
changes in regulation. In order to do this, health insurers need to collect massive quantities of data to be
analyzed; but with disparate systems, the pool of data that an innovation team has to draw from is
severely limited, making it difficult to get an accurate read on which products performed well, which
ones didn’t, and so on.
By gaining a view into other stages of the insurance product development and management lifecycle, an
innovation team can build new products and upgrade existing ones based on a wider range of factors,
such as which products have been serviced, how easy they are to maintain, whether they’re relevant to
members’ needs, member satisfaction, and more. Additionally, by consolidating data and then
introducing machine learning into the mix, health insurers can also enable their innovation teams to
apply sentiment analysis to incoming calls from members.

2. Product Quoting
During the second stage of the health insurance product development and management lifecycle, sales
teams work to sell products crafted by the innovation team to new or existing members. Although this
might seem straightforward enough, health insurance sales teams often lack the visibility they need into
which products are actually available — another side effect of disparate systems — and run the risk of
offering leads products that can’t be configured due to regulations. By implementing a software solution
with a built-in rules engine that can clean up their current data estate, health insurers can better
guarantee that their sales team always offers the right product to the right customer at the right time.
3. Product Onboarding
Once a sales representative has successfully quoted and closed on a deal, it enters the product
onboarding stage. During this stage, a health insurer’s onboarding team will issue an ID card to the
member in question so that they schedule a doctor’s appointment, file a claim, and so on. Traditionally a
manual process, quote to card can take up to eight weeks and often involves a lot of back and forth
between the onboarding team and new members.
By consolidating the entire quote to card process within a single workflow and automating it, health
insurance companies can increase visibility across departments, improve the accuracy of health plans
(they can be fined for inaccuracies), and reduce both the length of the process and the number of
people involved.
4. Product Servicing
When a health plan member is injured, they’ll file a claim and call in to find out where they should go for
treatment, what coverage they have, how they can find a doctor, and so on. To handle these claims, call
center agents typically have to pull up multiple systems across multiple screens — product data on one
screen, member data on another, and cost share and product details on another still — in order to get a
complete picture of the member and which products and benefits they currently have.

As one might assume, this approach is inefficient and more than a little confusing, which once again
points to the need for data consolidation. Keeping all of this information within a single system enables
call center agents to quickly get an idea of the issue at hand and how to resolve it, simplifying the
product servicing stage of the health insurance product development and management lifecycle and
increasing member satisfaction in the process.
5. Product Marketing
In order to effectively market new or upgraded products, an insurer’s product marketing team needs to
have access to data from the other four stages of the health insurance product development and
management lifecycle. With disparate systems, marketing teams have to manually collect and format
this data, wasting valuable time and effort; with consolidated systems and automation, they can
automatically gather this data by just clicking a button. Certain solutions will even generate a summary
of benefits, renewal letters, and more. Health insurers have historically been behind the curve when it
comes to marketing, so gaining this capability is major win and could be a competitive differentiator.
We’ve broken down the five stages of the health insurance product development and management
lifecycle and the importance of data at each one — now, it’s time to talk technology.
From Engage for Health Plans to Microsoft Azure, Hitachi Solutions offers a full suite of products and
services powered by Microsoft and brings to the table years of experience solving business challenges in
the health insurance industry. Our specialists will work closely with you to clean up your data estate,
consolidate systems, and streamline workflows so that the teams responsible for each stage of your
company’s insurance product development and management lifecycle can work more efficiently and
collaboratively. When you work with Hitachi Solutions, you aren’t just getting a solutions provider —
you’re getting a dedicated partner.
20
Independent
1.6.2 Practice personal financial planning
Practice personal financial planning (ppfp) is a process through which a client‘s financial
situation is assessed, goals are identified, and strategies for achieving those goals within a statedtime
frame are developed. PFP also provides for implementation and periodic monitoring
Definition of personal finance
Personal finance explain all financial determination and activities of an individual or family,covering
budgeting plan, individual or household insurance , mortgage planning, savings andretirement
planning.Another hand personal finance is all about personal financial accomplishments fall under the
personal responsibility; personal financial planning generally contains examining your currentfinancial
position, forecasting your future plan either short-term and long-term needs andcompleting a plan to
fulfill those requirements and personal goals and desires.
Among the most significant features of personal finance are:
Evaluating your current financial position
–
take a look at future expected cash flow,current savings, etc.
Create insurance plan to protect yourself as well as family from risk and make sureyour material status is
secure
Calculating and filing taxes

Capitals and future investment plan
Retirement planning
1.6.3 Knowledge of personal financial planning
An important aspect of proficiency is the level of financial knowledge of the people. This refers
to a person‘s level of knowledge of the core
competencies and the conviction that financialknowledge will lead to financial wellbeing. Everyone
should have some aspects of knowledgefinancial planning to handle his/her financial perspectives; you
need to have ability, skills to pursue your life journey in financial freedom, free of debt and peace of
mind. So financial
accounting is the language of business, if you don‘t have the knowledge to understand the
20
Independent
1.6.2 Practice personal financial planning
Practice personal financial planning (ppfp) is a process through which a client‘s financial
situation is assessed, goals are identified, and strategies for achieving those goals within a statedtime
frame are developed. PFP also provides for implementation and periodic monitoring
Definition of personal finance
Personal finance explain all financial determination and activities of an individual or family,covering
budgeting plan, individual or household insurance , mortgage planning, savings andretirement
planning.Another hand personal finance is all about personal financial accomplishments fall under the
personal responsibility; personal financial planning generally contains examining your currentfinancial

position, forecasting your future plan either short-term and long-term needs andcompleting a plan to
fulfill those requirements and personal goals and desires.
Among the most significant features of personal finance are:
Evaluating your current financial position
–
take a look at future expected cash flow,current savings, etc.
Create insurance plan to protect yourself as well as family from risk and make sureyour material status is
secure
Calculating and filing taxes
Capitals and future investment plan
Retirement planning
1.6.3 Knowledge of personal financial planning
An important aspect of proficiency is the level of financial knowledge of the people. This refers
to a person‘s level of knowledge of the core
competencies and the conviction that financialknowledge will lead to financial wellbeing. Everyone
should have some aspects of knowledgefinancial planning to handle his/her financial perspectives; you

need to have ability, skills to pursue your life journey in financial freedom, free of debt and peace of
mind. So financial
accounting is the language of business, if you don‘t have the knowledge to understand the
VIJAYANAGARA SRI KRISHNADEVARAYA
UNIVERSITY BALLARI
(A State University)
Study Materials for BBA Degree course
Financial Derivatives
PRESENTED BY
Mr MOULA HUSSAIN KHATTHEWALE
BBA - FINANCE
VI - Semester

About the Author: Mr Moula Hussain Khatthewale (BBM, MBA, KSET)
President
Vijayanagara Educational Trust® Hosapete,
Director
RB Institute Hosapete
Principal
Sri Maata Degree College Hosapete
Lecturer
Vijayanagara College Hosapete
FINANCIAL DERIVATIVES

TABLE OF CONTENTS
UNIT LESSON TITLE PAGE NO.
1.1 Basics of Financial Derivatives 4
I 1.2 Forward Contracts 33
1.3 Participants in Derivative Markets 46
1.4 Recent Developments in Global Financial Derivative Markets 52
2.1 Basics of Options 68
2.2 Fundamentaeterants option’r 79
II 2.3 Options Trading Strategies 98
2.4 Interest rate swaps 155
2.5 Currency Swaps 171
3.1 Futures Market 206
III
3.2 Pricing of Futures 223
3.3 Theorutures Prices 234
4.1 Hedging Strategy Using Futures 266
IV 4.2 Basis Risk and Hedging 280
4.3 Stock Index 289
V 5.1 Financial Derivatives Markets in India 319
5.2 Benefits of Derivatives in India 329

WELCOME TO ALL THE READERS
Financial Derivatives
Objectives
➢➢ To Understand the students about the concept of Derivatives and its types ➢➢ To acquaint the knowledge of Options and Futures and
➢➢ To know about Hedging and the development position of Derivatives in India.
Unit – I
Derivatives – Features of a Financial Derivative – Types of Financial Derivatives
aanciaivatives – Historerivatives Markses oerivatives –
Critiques of Derivatives – Forward Market: Pricing and Trading Mechanism – Forward
Contract concept – Features of Forward Contract – Classification of Forward Contracts –
Forward Trading Mechanism – Forward Prices Vs Future Prices.
Unit – II
Options and Swaps – Concept of Options – Types of options – Option Valuation
ptiotionakenovereptionlyinssets in Exchangraded
Options – Determinants of Option Prices – Binomial Option Pricing Model – Black-Scholes
Option Pricing – Basic Principles of Option Trading – SWAP: Concept, Evaluation and
Features of Swap – Types of Financial Swaps – Interest Rate Swaps – Currency Swap – Debt-
Equity Swap.
Unit – III
Futures – Financiautures Contts – Types of anciauturCont
Evolution of Futures Market in India – Traders in Futures Market in India – Functions and
Growth of Futures Markets – Futures Market Trading Mechanism - Specification of
1

the Future Contract – Clearing House – Operation of Margins – Settlement – Theories of
Future pr– Futurrand Risk Avern – Forwarontt Vs. FuturCont
Unit – IV
Hedging and Stock Index Futures – Concepts – Perfect Hedging Model – Basic Long
anhoredgosedginasiisnedginasiisk Vs Pris
Hedging Effectiveness – Devising a Hedging Strategy – Hedging Objectives – Management
of Hedge – Concept of Stock Index – Stock Index Futures – Stock Index Futures as a
Portfolio management Tool – Speculation and Stock Index Futures – Stock Index Futures
Trading in Indian Stock Market.
Financial Derivatives Market in India – Need for Derivatives – Evolution of
Derivatives in India – Major Recommendations of Dr. L.C. Gupta Committee – Equity
Derivatives – Strengthening of Cash Market – Benefits of Derivatives in India – Categories of
Derivatives Traded in India – Derivatives Trading at NSE/BSE – Eligibility of Stocks –
Emerging Structure of Derivatives Markets in India -Regulation of Financial Derivatives in
India – Structure of the Market – Trading systems – Badla system in Indian Stock Market
latornstrumen
References
1. Gupta S.L., FINANCIAL DERIVATIVES THEORY, CONCEPTS AND PROBLEMS
PHI, Delhi, Kumar S.S.S. FINANCIAL DERIVATIVES, PHI, New Delhi, 2007
2. Chance, Don M: DERIVATIVES and Risk Management Basics, Cengage Learning, Delhi.
3. Stulz M. Rene, RISK MANAGEMENT & DERIVATIVES, Cengage Learning, New Delhi.
2

UNIT - I
Unit Structure
Lesson 1.1 - Basics of Financial Derivatives
Lesson 1.2 - Forward Contracts
Lesson 1.3 - Participants in Derivative Markets
Lesson 1.4 - Recent Developments in Global Financial Derivative Markets
Learning Objectives
After reading this chapter, students should
➢➢ Understand the meaning of financial derivatives. ➢➢ Know that what various features of financial derivatives are.
➢➢ Understand the various types of financial derivatives like forward, futures, options,
Swaps, convertible, warrants, etc. ➢➢ Know about the historical background of financial derivatives.
➢➢ Know that what various uses of financial derivatives are.
➢➢ Understand about the myths of financial derivatives.
➢➢ Understand the concept of forward contract.
➢➢ Be aware about the various features of a forward contract.
➢➢ Know that forward markets as fore-runner of futures markets, and also know about
the historically growth of forward market. ➢➢ Understand the various differences between futures and forward contracts.
➢➢ Know about the classification of forward contracts like hedge contracts, transferable
specific delivery, and non-transferable specific delivery (NTSD) and other forward
contracts.
3

Lesson 1.1 - Basics of Financial Derivatives
Introduction
The past decade has witnessed the multiple growths in the volume of international
trade and business due to the wave of globalization and liberalization all over the world. As a
result, the demand for the international money and financial instruments increased
significantly at the global level. In this respect, changes in the interest rates, exchange rates
and stock market prices at the different financial markets have increased the financial risks to
the corporate world. Adverse changes have even threatened the very survival of the business
world. It is, therefore, to manage such risks; the new financial instruments have been
developed in the financial markets, which are also popularly known as financial derivatives.
The basic purpose of these instruments is to provide commitments to prices for future
dates for giving protection against adverse movements in future prices, in order to reduce the
extent of financial risks. Not only this, they also provide opportunities to earn profit for those
persons who are ready to go for higher risks. In other words, these instruments, indeed,
facilitate to transfer the risk from those who wish to avoid it to those who are willing to
accept the same.
Today, the financial derivatives have become increasingly popular and most
commonly used in the world of finance. This has grown with so phenomenal speed all over
the world that now it is called as the derivatives revolution. In an estimate, the present annual
trading volume of derivative markets has crossed US $ 30,000 billion, representing more than
100 times gross domestic product of India.
Financial derivatives like futures, forwards options and swaps are important tools to
manage assets, portfolios and financial risks. Thus, it is essential to know the terminology and
conceptual framework of all these financial derivatives in order to analyze and manage the
financial risks. The prices of these financial derivatives contracts depend upon the spot prices
of the underlying assets, costs of carrying assets into the future and relationship with spot
prices. For example, forward and futures contracts are similar in nature, but their prices in
future may differ. Therefore, before using any financial derivative instruments for hedging,
speculating, or arbitraging purpose, the trader or investor must carefully examine all the
important aspects relating to them.
4

Definition of Financial Derivatives
Before explaining the term financial derivative, let us see the dictionary meaning of
‘ivative’ebster’inteoliattionary (1987) stat Derivatives as:
1. A word formed by derivation. It means, this word has been arisen by derivation.
2. Something derived; it means that some things have to be derived or arisen out of the
underlying variables. For example, financial derivative is an instrument indeed
derived from the financial market.
3. The limit of the ratio of the change is a function to the corresponding change in its
independent variable. This explains that the value of financial derivative will change
as per the change in the value of the underlying financial instrument.
4. A chemical substance related structurally to another substance, and theoretically
derivable from it. In other words, derivatives are structurally related to other
substances.
5. A substance that can be made from another substance in one or more steps. In case of
financial derivatives, they are derived from a combination of cash market instruments
or other derivative instruments.
For example, you have purchased gold futures on May 2003 for delivery in August
2003. The price of gold on May 2003 in the spot market is ` 4500 per 10 grams and for
futures delivery in August 2003 is ` 4800 per 10 grams. Suppose in July 2003 the spot price of
the gold changes and increased to ` 4800 per 10 grams. In the same line value of financial
derivatives or gold futures will also change.
From the above, the term derivatives may be termed as follows:
TherDerivative” inates thaao inent value.e., ilue
is entirely derived from the value of the underlying asset. The underlying asset can be
securities, commodities, bullion, currency, livestock or anything else.
In other words, derivative means forward, futures, option or any other hybrid contract
of predetermined fixed duration, linked for the purpose of contract fulfillment to the value of
a specified real or financial asset or to an index of securities.
Thecuritontlation) Act 1956 defines “ivatives un:
5

“Derivative” includes
1. Security derived from a debt instrument, share, loan whether secured or unsecured,
risk instrument or contract for differences or any other form of security.
2. A contract which derives its value from the prices, or index of prices of underlying
securities.
The above definition conveys that
1. The derivatives are financial products.
2. Derivative is derived from another financial instrument/contract called the underlying.
In the case of Nifty futures, Nifty index is the underlying. A derivative derives its
value from the underlying assets. Accounting Standard SFAS133 defines a derivative
as, ‘a derivative instrument is a financial derivative or other contract with all three of
the following characteristics:
(i) It has (1) one or more underlings, and (2) one or more notional amount or
payments provisions or both. Those terms determine the amount of the
settlement or settlements.
(ii) It requires no initial net investment or an initial net investment that is smaller
than would be required for other types of contract that would be expected to
have a similar response to changes in market factors.
(iii) Its terms require or permit net settlement. It can be readily settled net by a
means outside the contract or it provides for delivery of an asset that puts the
recipients in a position not substantially different from net settlement
In general, from the aforementioned, derivatives refer to securities or to contracts
thaivronother—whose value dependnothntssets. Auch
the financial derivatives are financial instruments whose prices or values are derived from the
prices of other underlying financial instruments or financial assets. The underlying
instruments may be a equity share, stock, bond, debenture, treasury bill, foreign currency
oven another derivativssompletocption’s value dependpohe
value of a stock on which the option is written. Similarly, the value of a treasury bill of
futures contracts or foreign currency forward contract will depend upon the price or value of
the underlying assets, such as Treasury bill or foreign currency. In other words, the price of
the derivative is not arbitrary rather it is linked or affected to the price of the underlying asset
that will automatically affect the price of the financial derivative. Due to this reason,
transactions in derivative markets are used to offset the risk of price changes
6

in the underlying assets. In fact, the derivatives can be formed on almost any variable, for
example, from the price of hogs to the amount of snow falling at a certain ski resort.
The term financial derivative relates with a variety of financial instruments which
include stocks, bonds, treasury bills, interest rate, foreign currencies and other hybrid
securities. Financial derivatives include futures, forwards, options, swaps, etc. Futures
contracts are the most important form of derivatives, which are in existence long before the
terivative’ was coinedanciaivatives calsiverom a combination
of cash market instruments or other financial derivative instruments. In fact, most of the
financial derivatives are not revolutionary new instruments rather they are merely
combinations of older generation derivatives and/or standard cash market instruments.
In the 1980s, the financial derivatives were also known as off-balance sheet
instruments because no asset or liability underlying the contract was put on the balance sheet
as such. Since the value of such derivatives depend upon the movement of market prices of
the underlying assets, hence, they were treated as contingent asset or liabilities and such
transactions and positions in derivatives were not recorded on the balance sheet. However, it
is a matter of considerable debate whether off-balance sheet instruments should be included in
the definition of derivatives. Which item or product given in the balance sheet should be
considered for derivative is a debatable issue.
In brief, the term financial market derivative can be defined as a treasury or capital
market instrument which is derived from, or bears a close re1ation to a cash instrument or
another derivative instrument. Hence, financial derivatives are financial instruments whose
prices are derived from the prices of other financial instruments.
Features of a Financial Derivatives
As observed earlier, a financial derivative is a financial instrument whose value is
iverohe value on unlyinsset; hence, the name ‘ivativeame into
existence. There are a variety of such instruments which are extensively traded in the
financial markets all over the world, such as forward contracts, futures contracts, call and put
options, swaps, etc. A more detailed discussion of the properties of these contracts will be
given later part of this lesson. Since each financial derivative has its own unique features, in
this section, we will discuss some of the general features of simple financial derivative
instrument.
The basic features of the derivative instrument can be drawn from the general
definition of a derivative irrespective of its type. Derivatives or derivative securities are
7

future contracts which are written between two parties (counter parties) and whose value are
derived from the value of underlying widely held and easily marketable assets such as
agricultural and other physical (tangible) commodities, or short term and long term financial
instruments, or intangible things like weather, commodities price index (inflation rate), equity
price index, bond price index, stock market index, etc. Usually, the counter parties to such
contracts are those other than the original issuer (holder) of the underlying asset. From this
definition, the basic features of a derivative may be stated as follows:
1. A derivative instrument relates to the future contract between two parties. It means
there must be a contract-binding on the underlying parties and the same to be fulfilled
in future. The future period may be short or long depending upon the nature of
contract, for example, short term interest rate futures and long term interest rate
futures contract.
2. Normally, the derivative instruments have the value which derived from the values of
other underlying assets, such as agricultural commodities, metals, financial assets,
intangible assets, etc. Value of derivatives depends upon the value of underlying
instrument and which changes as per the changes in the underlying assets, and
sometimes, it may be nil or zero. Hence, they are closely related.
3. In general, the counter parties have specified obligation under the derivative contract.
Obviously, the nature of the obligation would be different as per the type of the
instrument of a derivative. For example, the obligation of the counter parties, under
the different derivatives, such as forward contract, future contract, option contract
and swap contract would be different.
4. The derivatives contracts can be undertaken directly between the two parties or
through the particular exchange like financial futures contracts. The exchange-traded
derivatives are quite liquid and have low transaction costs in comparison to tailor-
made contracts. Example of exchange traded derivatives are Dow Jones, S&P 500,
Nikki 225, NIFTY option, S&P Junior that are traded on New York Stock Exchange,
Tokyo Stock Exchange, National Stock Exchange, Bombay Stock Exchange and so
on.
5. In general, the financial derivatives are carried off-balance sheet. The size of the
derivative contract depends upon its notional amount. The notional amount is the
amount used to calculate the pay off. For instance, in the option contract, the potential
loss and potential payoff, both may be different from the value of underlying shares,
because the payoff of derivative products differs from the payoff that their notional
amount might suggest.
8

6. Usually, in derivatives trading, the taking or making of delivery of underlying assets
is not involved; rather underlying transactions are mostly settled by taking offsetting
positions in the derivatives themselves. There is, therefore, no effective limit on the
quantity of claims, which can be traded in respect of underlying assets.
7. Derivatives are also known as deferred delivery or deferred payment instrument. It
means that it is easier to take short or long position in derivatives in comparison to
other assets or securities. Further, it is possible to combine them to match specific,
i.e., they are more easily amenable to financial engineering.
8. Derivatives are mostly secondary market instruments and have little usefulness in
mobilizing fresh capital by the corporate world; however, warrants and convertibles
are exception in this respect.
9. Although in the market, the standardized, general and exchange-traded derivatives
are being increasingly evolved, however, still there are so many privately negotiated
customized, over-the-counter (OTC) traded derivatives are in existence. They expose
the trading parties to operational risk, counter-party risk and legal risk. Further, there
may also be uncertainty about the regulatory status of such derivatives.
10. Finally, the derivative instruments, sometimes, because of their off-balance sheet
nature, can be used to clear up the balance sheet. For example, a fund manager who is
restricted from taking particular currency can buy a structured note whose coupon is
tied to the performance of a particular currency pair.
Types of Financial Derivatives
In the past section, it is observed that financial derivatives are those assets whose
values are determined by the value of some other assets, called as the underlying. Presently,
there are complex varieties of derivatives already in existence, and the markets are innovating
newer and newer ones continuously. For example, various types of financial derivatives based
on their different properties like, plain, simple or straightforward, composite, joint or hybrid,
synthetic, leveraged, mildly leveraged, customized or OTC traded, standardized or organized
exchange traded, etc. are available in the market.
Due to complexity in nature, it is very difficult to classify the financial derivatives, so
in the present context, the basic financial derivatives which are popular in the market have
been described in brief. The details of their operations, mechanism and trading, will be
discussed in the forthcoming respective chapters. In simple form, the derivatives can be
classified into different categories which are shown in the Fig.
9

Derivatives
Financials Commodities
Basic Complex
Forwards Futures Options Warrants Swaps Exotics
& (Nonstandard)
Convertibles Classification of Derivatives
One form of classification of derivative instruments is between commodity derivatives
and financial derivatives. The basic difference between these is the nature of the underlying
instrument or asset. In a commodity derivatives, the underlying instrument is a commodity
which may be wheat, cotton, pepper, sugar, jute, turmeric, corn, soya beans, crude oil, natural
gas, gold, silver, copper and so on. In a financial derivative, the underlying instrument may be
treasury bills, stocks, bonds, foreign exchange, stock index, gilt-edged securities, cost of
living index, etc. It is to be noted that financial derivative is fairly standard and there are no
quality issues whereas in commodity derivative, the quality may be the underlying matters.
However, the distinction between these two from structure and functioning point of view,
both are almost similar in nature.
Another way of classifying the financial derivatives is into basic and complex
derivatives. In this, forward contracts, futures contracts and option contracts have been
included in the basic derivatives whereas swaps and other complex derivatives are taken into
complex category because they are built up from either forwards/futures or options contracts,
or both. In fact, such derivatives are effectively derivatives of derivatives.
Basic Financial Derivatives
Forward Contracts
A forward contract is a simple customized contract between two parties to buy or sell
an asset at a certain time in the future for a certain price. Unlike future contracts, they are not
traded on an exchange, rather traded in the over-the-counter market, usually between two
financial institutions or between a financial institution and its client.
10

Example
An Indian company buys Automobile parts from USA with payment of one million
dollar due in 90 days. The importer, thus, is short of dollar that is, it owes dollars for future
delivery. Suppose present price of dollar is ` 48. Over the next 90 days, however, dollar might
rise against ` 48. The importer can hedge this exchange risk by negotiating a 90 days forward
contract with a bank at a price ` 50. According to forward contract in 90 days the bank will
give importer one million dollar and importer will give the bank 50 million rupees hedging a
future payment with forward contract. On the due date importer will make a payment of ` 50 million to bank and the bank will pay one million dollar to importer, whatever rate of the
dollaftahiypicample oorward conturrency.
The basic features of a forward contract are given in brief here as under:
1. Forward contracts are bilateral contracts, and hence, they are exposed to counter-party
risk. There is risk of non-performance of obligation either of the parties, so these are
riskier than to futures contracts.
2. Each contract is custom designed, and hence, is unique in terms of contract size,
expiration date, the asset type, quality, etc.
3. In forward contract, one of the parties takes a long position by agreeing to buy the
asset at a certain specified future date. The other party assumes a short position by
agreeing to sell the same asset at the same date for the same specified price. A party
with no obligation offsetting the forward contract is said to have an open position. A
party with a closed position is, sometimes, called a hedger.
4. The specified price in a forward contract is referred to as the delivery price. The
forward price for a particular forward contract at a particular time is the delivery price
that would apply if the contract were entered into at that time. It is important to
differentiate between the forward price and the delivery price. Both are equal at the
time the contract is entered into. However, as time passes, the forward price is likely
to change whereas the delivery price remains the same.
5. In the forward contract, derivative assets can often be contracted from the combination
of underlying assets, such assets are oftenly known as synthetic assets in the forward
market.
6. In the forward market, the contract has to be settled by delivery of the asset on
expiration date. In case the party wishes to reverse the contract, it has to compulsory
go to the same counter party, which may dominate and command the price it wants as
being in a monopoly situation.
11

7. In the forward contract, covered parity or cost-of-carry relations are relation between
the prices of forward and underlying assets. Such relations further assist in
determining the arbitrage-based forward asset prices.
8. Forward contracts are very popular in foreign exchange market as well as interest rate
bearing instruments. Most of the large and international banks quote the forward
rathroughforwarkyinithorn exchangoom.
Forward foreign exchange quotes by these banks are displayed with the spot rates.
9. As per the Indian Forward Contract Act- 1952, different kinds of forward contracts
can be done like hedge contracts, transferable specific delivery (TSD) contracts and
non-transferable specify delivery (NTSD) contracts. Hedge contracts are freely
transferable and do not specific, any particular lot, consignment or variety for
delivery. Transferable specific delivery contracts are though freely transferable from
one party to another, but are concerned with a specific and predetermined
consignment. Delivery is mandatory. Non-transferable specific delivery contracts, as
the name indicates, are not transferable at all, and as such, they are highly specific.
In brief, a forward contract is an agreement between the counter parties to buy or sell a
specified quantity of an asset at a specified price, with delivery at a specified time (future) and
place. These contracts are not standardized; each one is usually being customized to its
owner’peications.
Futures Contracts
Like a forward contract, a futures contract is an agreement between two parties to buy
or sell a specified quantity of an asset at a specified price and at a specified time and place.
Futures contracts are normally traded on an exchange which sets the certain standardized
norms for trading in the futures contracts.
Example
A silver manufacturer is concerned about the price of silver, since he will not be able
to plan for profitability. Given the current level of production, he expects to have about
20.000 ounces of silver ready in next two months. The current price of silver on May 10 is `
1052.5 per ounce, and July futures price at FMC is ` 1068 per ounce, which he believes to be
satisfied price. But he fears that prices in future may go down. So he will enter into a futures
contract. He will sell four contracts at MCX where each contract is of 5000 ounces at ` 1068
for delivery in July.
12

Perfect Hedging Using Futures
Date Spot Market Futures market
Anticipate the sale of 20,000 ounce in Sell four contracts, 5000 ounce each
May 10 two months and expect to receive ` 1068 July futures contracts at ` 1068 per
per ounce or a total ` 21.36,00.00 ounce.
Thporf silver is ` 1071 per Buy four contracts at ` 1071. To-
July 5 ounce; Miner sells 20,000 ounces and re- tal cost of 20,000 ounce will be `
ceives ` 21.42,0000. 21,42,0000.
Profioss Pr = ` 60,000 Futures loss = ` 60,000
Net wealth change = 0
In the above example trader has hedged his risk of prices fall and the trading is done
through standardized exchange which has standardized contract of 5000 ounce silver. The
futures contracts have following features in brief:
Standardization
One of the most important features of futures contract is that the contract has certain
standardized specification, i.e., quantity of the asset, quality of the asset, the date and month
of delivery, the units of price quotation, location of settlement, etc. For example, the largest
exchanges on which futures contracts are traded are the Chicago Board of Trade (CBOT) and
the Chicago Mercantile Exchange (CME). They specify about each term of the futures
contract.
Clearing House
In the futures contract, the exchange clearing house is an adjunct of the exchange and
acts as an intermediary or middleman in futures. It gives the guarantee for the performance of
the parties to each transaction. The clearing house has a number of members all of which have
offices near to the clearing house. Thus, the clearing house is the counter party to every
contract.
Settlement Price
Since the futures contracts are performed through a particular exchange, so at the
close of the day of trading, each contract is marked-to-market. For this the exchange
establishes a settlement price. This settlement price is used to compute the profit or loss on
each contohaayrglyhember’s accounts are crediter debited.
13

Daily Settlement and Margin
Another feature of a futures contract is that when a person enters into a contract, he is
required to deposit funds with the broker, which is called as margin. The exchange usually
sets the minimum margin required for different assets, but the broker can set higher margin
limits for his clients which depend upon the credit-worthiness of the clients. The basic
objective of the margin account is to act as collateral security in order to minimize the risk of
failure by either party in the futures contract.
Tick Size
The futures prices are expressed in currency units, with a minimum price movement
called a tick size. This means that the futures prices must be rounded to the nearest tick. The
difference between a futures price and the cash price of that asset is known as the basis. The
details of this mechanism will be discussed in the forthcoming chapters.
Cash Settlement
Most of the futures contracts are settled in cash by having the short or long to make
cash payment on the difference between the futures price at which the contract was entered
and the cash price at expiration date. This is done because it is inconvenient or impossible to
deliver sometimes, the underlying asset. This type of settlement is very much popular in stock
indices futures contracts.
Delivery
The futures contracts are executed on the expiry date. The counter parties with a short
position are obligated to make delivery to the exchange, whereas the exchange is obligated to
make delivery to the longs. The period during which the delivery will be made is set by the
exchange which varies from contract to contract.
Regulation
The important difference between futures and forward markets is that the futures
contracts are regulated through a exchange, but the forward contracts are self regulated by the
counter-parties themselves. The various countries have established Commissions in their
country to regulate futures markets both in stocks and commodities. Any such new futures
contracts and changes to existing contracts must by approved by their respective Commission.
Further, more details on different issues of futures market trading will be discussed in
forthcoming chapters.
14

Options Contracts
Options are the most important group of derivative securities. Option may be defined
as a contract, between two parties whereby one party obtains the right, but not the obligation,
to buy or sell a particular asset, at a specified price, on or before a specified date. The person
who acquires the right is known as the option buyer or option holder, while the other person
(who confers the right) is known as option seller or option writer. The seller of the option for
giving such option to the buyer charges an amount which is known as the option premium.
Options can be divided into two types: calls and puts. A call option gives the holder
the right to buy an asset at a specified date for a specified price whereas in put option, the
holder gets the right to sell an asset at the specified price and time. The specified price in such
contract is known as the exercise price or the strike price and the date in the contract is known
as the expiration date or the exercise date or the maturity date.
The asset or security instrument or commodity covered under the contract is called as
the underlying asset. They include shares, stocks, stock indices, foreign currencies, bonds,
commodities, futures contracts, etc. Further options can be American or European. A
European option can be exercised on the expiration date only whereas an American option
can be exercised at any time before the maturity date.
Example
Suppose the current price of CIPLA share is ` 750 per share. X owns 1000 shares of
CIPLA Ltd. and apprehends in the decline in price of share. The option (put) contract
available at BSE is of ` 800, in next two-month delivery. Premium cost is ` 10 per share. X
will buy a put option at 10 per share at a strike price of ` 800. In this way X has hedged his
risk of price fall of stock. X will exercise the put option if the price of stock goes down below
` 790 and will not exercise the option if price is more than ` 800, on the exercise date. In case
of options, buyer has a limited loss and unlimited profit potential unlike in case of forward
and futures.
In April 1973, the options on stocks were first traded on an organized exchange, i.e.,
Chicago Board Options Exchange. Since then, there has been a dramatic growth in options
markets. Options are now traded on various exchanges in various countries all over the world.
Options are now traded both on organized exchanges and over- the-counter (OTC). The
option trading mechanism on both are quite different and which leads to important differences
in market conventions. Recently, options contracts on OTC are getting popular
15

because they are more liquid. Further, most of the banks and other financial institutions now
prefer the OTC options market because of the ease and customized nature of contract.
It should be emphasized that the option contract gives the holder the right to do
something. The holder may exercise his option or may not. The holder can make a
reassessment of the situation and seek either the execution of the contracts or its non-
execution as be profitable to him. He is not under obligation to exercise the option. So, this
fact distinguishes options from forward contracts and futures contracts, where the holder is
under obligation to buy or sell the underlying asset. Recently in India, the banks are allowed
to write cross-currency options after obtaining the permission from the Reserve Bank of
India.
Warrants and Convertibles
Warrants and convertibles are other important categories of financial derivatives,
which are frequently traded in the market. Warrant is just like an option contract where the
holder has the right to buy shares of a specified company at a certain price during the given
time period. In other words, the holder of a warrant instrument has the right to purchase a
specific number of shares at a fixed price in a fixed period from an issuing company. If the
holder exercised the right, it increases the number of shares of the issuing company, and thus,
dilutes the equities of its shareholders. Warrants are usually issued as sweeteners attached to
senior securities like bonds and debentures so that they are successful in their equity issues in
terms of volume and price. Warrants can be detached and traded separately. Warrants are
highly speculative and leverage instruments, so trading in them must be done cautiously.
Convertibles are hybrid securities which combine the basic attributes of fixed interest
and variable return securities. Most popular among these are convertible bonds, convertible
debentures and convertible preference shares. These are also called equity derivative
securities. They can be fully or partially converted into the equity shares of the issuing
company at the predetermined specified terms with regards to the conversion period,
conversion ratio and conversion price. These terms may be different from company to
company, as per nature of the instrument and particular equity issue of the company. The
further details of these instruments will be discussed in the respective chapters.
SWAP Contracts
Swaps have become popular derivative instruments in recent years all over the world.
A swap is an agreement between two counter parties to exchange cash flows in the future.
16
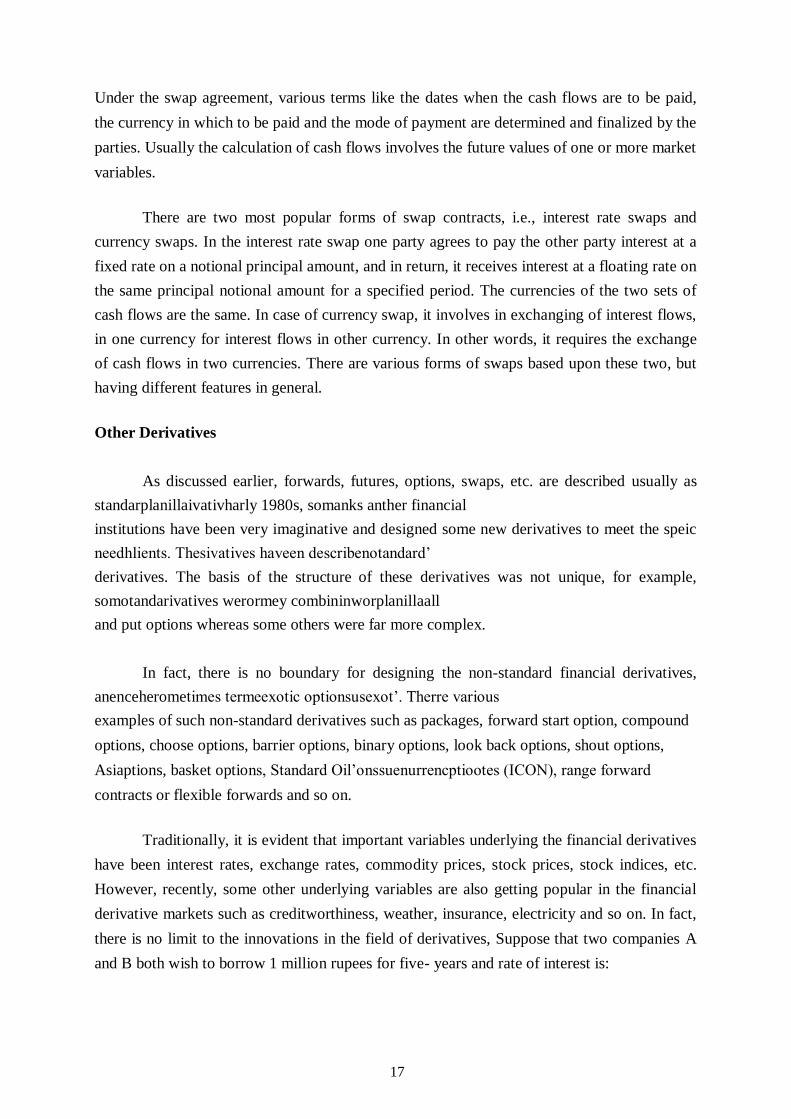
Under the swap agreement, various terms like the dates when the cash flows are to be paid,
the currency in which to be paid and the mode of payment are determined and finalized by the
parties. Usually the calculation of cash flows involves the future values of one or more market
variables.
There are two most popular forms of swap contracts, i.e., interest rate swaps and
currency swaps. In the interest rate swap one party agrees to pay the other party interest at a
fixed rate on a notional principal amount, and in return, it receives interest at a floating rate on
the same principal notional amount for a specified period. The currencies of the two sets of
cash flows are the same. In case of currency swap, it involves in exchanging of interest flows,
in one currency for interest flows in other currency. In other words, it requires the exchange
of cash flows in two currencies. There are various forms of swaps based upon these two, but
having different features in general.
Other Derivatives
As discussed earlier, forwards, futures, options, swaps, etc. are described usually as
standarplanillaivativharly 1980s, somanks anther financial
institutions have been very imaginative and designed some new derivatives to meet the speic
needhlients. Thesivatives haveen describenotandard’
derivatives. The basis of the structure of these derivatives was not unique, for example,
somotandarivatives werormey combininworplanillaall
and put options whereas some others were far more complex.
In fact, there is no boundary for designing the non-standard financial derivatives,
anenceherometimes termeexotic optionsusexot’. Therre various
examples of such non-standard derivatives such as packages, forward start option, compound
options, choose options, barrier options, binary options, look back options, shout options,
Asiaptions, basket options, Standard Oil’onssuenurrencptiootes (ICON), range forward
contracts or flexible forwards and so on.
Traditionally, it is evident that important variables underlying the financial derivatives
have been interest rates, exchange rates, commodity prices, stock prices, stock indices, etc.
However, recently, some other underlying variables are also getting popular in the financial
derivative markets such as creditworthiness, weather, insurance, electricity and so on. In fact,
there is no limit to the innovations in the field of derivatives, Suppose that two companies A
and B both wish to borrow 1 million rupees for five- years and rate of interest is:
17
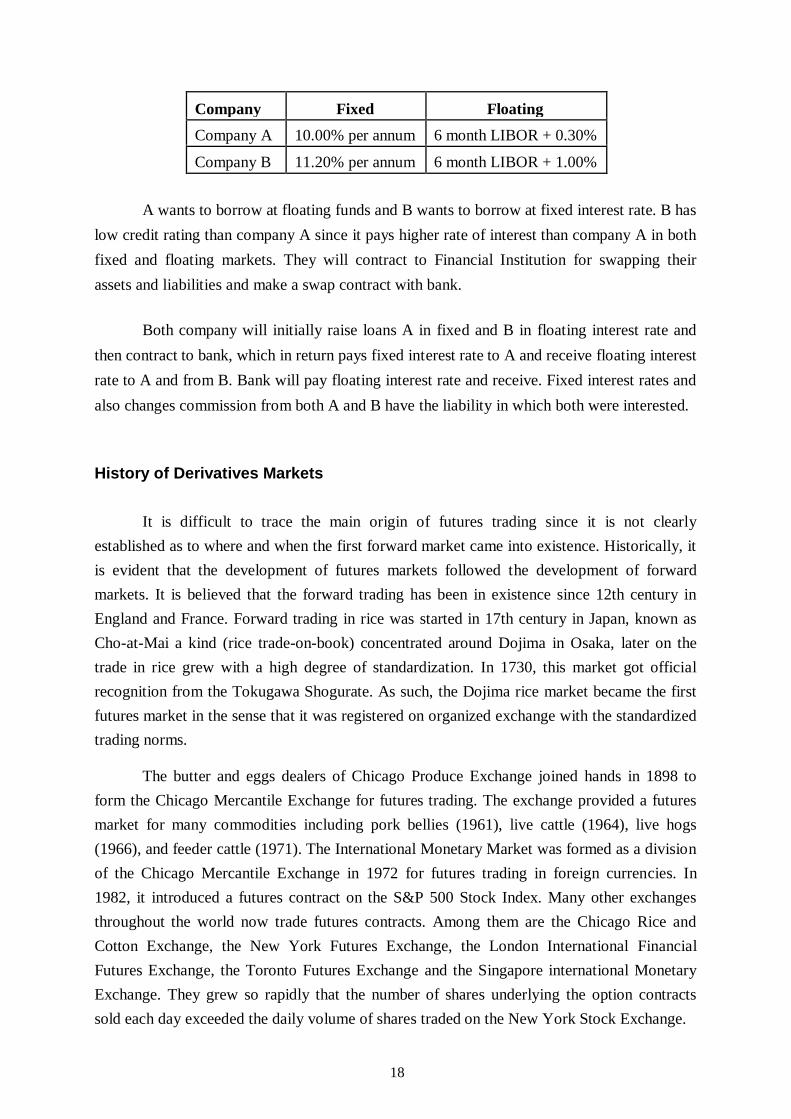
Company Fixed Floating
Company A 10.00% per annum 6 month LIBOR + 0.30%
Company B 11.20% per annum 6 month LIBOR + 1.00%
A wants to borrow at floating funds and B wants to borrow at fixed interest rate. B has
low credit rating than company A since it pays higher rate of interest than company A in both
fixed and floating markets. They will contract to Financial Institution for swapping their
assets and liabilities and make a swap contract with bank.
Both company will initially raise loans A in fixed and B in floating interest rate and
then contract to bank, which in return pays fixed interest rate to A and receive floating interest
rate to A and from B. Bank will pay floating interest rate and receive. Fixed interest rates and
also changes commission from both A and B have the liability in which both were interested.
History of Derivatives Markets
It is difficult to trace the main origin of futures trading since it is not clearly
established as to where and when the first forward market came into existence. Historically, it
is evident that the development of futures markets followed the development of forward
markets. It is believed that the forward trading has been in existence since 12th century in
England and France. Forward trading in rice was started in 17th century in Japan, known as
Cho-at-Mai a kind (rice trade-on-book) concentrated around Dojima in Osaka, later on the
trade in rice grew with a high degree of standardization. In 1730, this market got official
recognition from the Tokugawa Shogurate. As such, the Dojima rice market became the first
futures market in the sense that it was registered on organized exchange with the standardized
trading norms.
The butter and eggs dealers of Chicago Produce Exchange joined hands in 1898 to
form the Chicago Mercantile Exchange for futures trading. The exchange provided a futures
market for many commodities including pork bellies (1961), live cattle (1964), live hogs
(1966), and feeder cattle (1971). The International Monetary Market was formed as a division
of the Chicago Mercantile Exchange in 1972 for futures trading in foreign currencies. In
1982, it introduced a futures contract on the S&P 500 Stock Index. Many other exchanges
throughout the world now trade futures contracts. Among them are the Chicago Rice and
Cotton Exchange, the New York Futures Exchange, the London International Financial
Futures Exchange, the Toronto Futures Exchange and the Singapore international Monetary
Exchange. They grew so rapidly that the number of shares underlying the option contracts
sold each day exceeded the daily volume of shares traded on the New York Stock Exchange.
18

In the 1980’s, markets developed for options in foreign exchange, options on stock
indices, and options on futures contracts. The Philadelphia Stock Exchange is the premier
exchange for trading foreign exchange options. The Chicago Board Options Exchange trades
options on the S&P 100 and the S&P 500 stock indices while the American Stock Exchange
trades options on the Major Market Stock Index, and the New York Stock Exchange trades
options on the NYSE Index. Most exchanges offering futures contracts now also offer options
on these futures contracts. Thus, the Chicago Board of Trades offers options on corn futures,
the Chicago Mercantile Exchange offers options on live cattle futures, the International
Monetary Market offers options on foreign currency futures, and so on.
The basic cause of forward trading was to cover the price risk. In earlier years,
transporting goods from one market to other markets took many months. For example, in the
1800s, food grains produced in England sent through ships to the United States which
normally took few months. Sometimes, during this tune, the price crashed clue to
unfavourable events before the goods reached to the destination. In such cases, the producers
had to sell their goods at the loss. Therefore, the producers sought to avoid such price risk
belhoodorwardtrriveasiaehiovt that time was simply to cover future price risk. On the opposite side, the speculator or other
commercial firms seeking to offset their price risk came forward to go for such trading. In this
way, the forward trading in commodities came into existence.
In the beginning, these forward trading agreements were formed to buy and sell food
grains in the future for actual delivery at the pre-determined price. Later on these agreements
became transferable, and during the American Civil War period, i.e., 1860 to 1865, it became
common place to sell and resell such agreements where actual delivery of produce was not
necessary. Gradually, the traders realized that the agreements were easier to buy and sell if the
same were standardized in terms of quantity, quality and place of delivery relating to food
grains. In the nineteenth century this activity was centred in Chicago which was the main
food grains marketing centre in the United States. In this way, the modern futures contracts
first came into existence with the establishment of the Chicago Board of Trade (CBOT) in the
year 1848, and today, it is the largest futures market of the world. In 1865, the CBOT framed
the general rules for such trading which later on became a trendsetter for so many other
markets.
In 1874, the Chicago Produce Exchange was established which provided the market
for butter, eggs, poultry, and other perishable agricultural products. In the year 1877, the
London Metal Exchange came into existence, and today, it is leading market in metal trading
both in spot as well as forward. In the year 1898, the butter and egg dealers withdrew from
the Chicago Produce Exchange to form separately the Chicago Butter and Egg Board,
19

and thus, in 1919 this exchange was renamed as the Chicago Mercantile Exchange (CME)
and was reorganized for futures trading. Since then, so many other exchanges came into
existence throughout the world which trade in futures contracts.
Although financial derivatives have been in operation since long, they have become a
major force in financial markets only in the early 1970s. The basic reason behind this
development was the failure of Brettonwood System and the fixed exchange rate regime was
broken down. As a result, new exchange rate regime, i.e., floating rate (flexible) system based
upon market forces came into existence. But due to pressure of demand and supply on
different currencies, the exchange rates were constantly changing, and often, substantially. As
a result, the business firms faced a new risk, known as currency or foreign exchange risk.
Accordingly, a new financial instrument was developed to overcome this risk in the new
financial environment.
Another important reason for the instability in the financial market was fluctuation in
the short-term interests. This was mainly due to that most of the government at that time tried
to manage foreign exchange fluctuations through short-term interest rates and by maintaining
money supply targets, but which were contrary to each other. Further, the increased instability
of short-term interest rates created adverse impact on long-term interest rates, and hence,
instability in bond prices because they are largely determined by long-term interest rates. The
result is that it created another risk, named interest rate risk, for both the issuers and the
investors of debt instruments.
Interest rate fluctuations had not only created instability in bond prices, but also in
other long-term assets such as, company stocks and shares. Share prices are determined on the
basis of expected present values of future dividends payments discounted at the appropriate
discount rate. Discount rates are usually based on long-term interest rates in the market. So,
increased instability in the long-term interest rates caused enhanced fluctuations in the share
prices in the stock markets. Further volatility in stock prices is reflected in the volatility in
stock market indices which causes to systematic risk or market risk.
In the early 1970s, it is witnessed that the financial markets were highly instable; as a
result, so many financial derivatives have been emerged as the means to manage the different
types of risks stated above, and also of taking advantage of it. Hence, the first financial
futures market was the International Monetary Market, established in 1972 by the Chicago
Mercantile Exchange which was followed by the London International Financial Futures
Exchange in 1982. Fourther detailehgrowtutures market’ in the forthcoming chapter.
20

Uses of Derivatives
Derivatives are supposed to provide the following services:
1. One of the most important services provided by the derivatives is to control, avoid,
shift and manage efficiently different types of risks through various strategies like
hedging, arbitraging, spreading, etc. Derivatives assist the holders to shift or modify
suitably the risk characteristics of their portfolios. These are specifically useful in
highly volatile financial market conditions like erratic trading, highly flexible interest
rates, volatile exchange rates and monetary chaos.
2. Derivatives serve as barometers of the future trends in prices which result in the
discovery of new prices both on the spot and futures markets. Further, they help in
disseminating different information regarding the futures markets trading of various
commodities and securities to the society which enable to discover or form suitable or
correct or true equilibrium prices in the markets. As a result, they assist in appropriate
and superior allocation of resources in the society.
3. As we see that in derivatives trading no immediate full amount of the transaction is
required since most of them are based on margin trading. As a result, large numbers of
traders, speculators arbitrageurs operate in such markets. So, derivatives trading
enhance liquidity and reduce transaction costs in the markets for underlying assets.
4. The derivatives assist the investors, traders and managers of large pools of funds to
devise such strategies so that they may make proper asset allocation increase their
yields and achieve other investment goals.
5. It has been observed from the derivatives trading in the market that the derivatives
have smoothen out price fluctuations, squeeze the price spread, integrate price
structure at different points of time and remove gluts and shortages in the markets.
6. The derivatives trading encourage the competitive trading in the markets, different
risk taking preference of the market operators like speculators, hedgers, traders,
arbitrageurs, etc. resulting in increase in trading volume in the country. They also
attract young investors, professionals and other experts who will act as catalysts to the
growth of financial markets.
7. Lastlybservehaivatives tg develoharket towardcompe
mark’omparkneferhat situatioherarticular
investors be better of than others, or patterns of returns of all additional securities are
spanned by the already existing securities in it, or there is no further scope of
additional security.
21
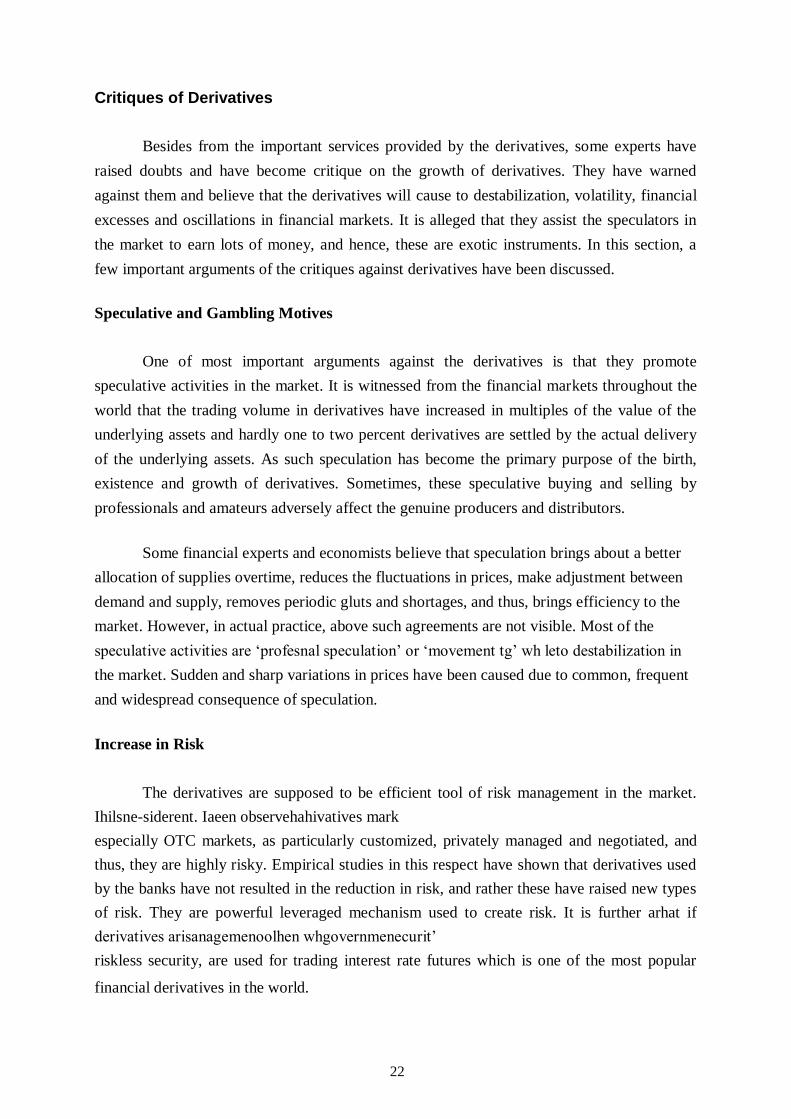
Critiques of Derivatives
Besides from the important services provided by the derivatives, some experts have
raised doubts and have become critique on the growth of derivatives. They have warned
against them and believe that the derivatives will cause to destabilization, volatility, financial
excesses and oscillations in financial markets. It is alleged that they assist the speculators in
the market to earn lots of money, and hence, these are exotic instruments. In this section, a
few important arguments of the critiques against derivatives have been discussed.
Speculative and Gambling Motives
One of most important arguments against the derivatives is that they promote
speculative activities in the market. It is witnessed from the financial markets throughout the
world that the trading volume in derivatives have increased in multiples of the value of the
underlying assets and hardly one to two percent derivatives are settled by the actual delivery
of the underlying assets. As such speculation has become the primary purpose of the birth,
existence and growth of derivatives. Sometimes, these speculative buying and selling by
professionals and amateurs adversely affect the genuine producers and distributors.
Some financial experts and economists believe that speculation brings about a better
allocation of supplies overtime, reduces the fluctuations in prices, make adjustment between
demand and supply, removes periodic gluts and shortages, and thus, brings efficiency to the
market. However, in actual practice, above such agreements are not visible. Most of the
speculative activities are ‘profesnal speculation’ or ‘movement tg’ wh leto destabilization in
the market. Sudden and sharp variations in prices have been caused due to common, frequent
and widespread consequence of speculation.
Increase in Risk
The derivatives are supposed to be efficient tool of risk management in the market.
Ihilsne-siderent. Iaeen observehahivatives mark
especially OTC markets, as particularly customized, privately managed and negotiated, and
thus, they are highly risky. Empirical studies in this respect have shown that derivatives used
by the banks have not resulted in the reduction in risk, and rather these have raised new types
of risk. They are powerful leveraged mechanism used to create risk. It is further arhat if
derivatives arisanagemenoolhen whgovernmenecurit’
riskless security, are used for trading interest rate futures which is one of the most popular
financial derivatives in the world.
22

Instability of the Financial System
It is argued that derivatives have increased risk not only for their users but also for the
whole financial system. The fears of micro and macro financial crisis have caused to the
unchecked growth of derivatives which have turned many market players into big losers. The
malpractices, desperate behaviour and fraud by the users of derivatives have threatened the
stability of the financial markets and the financial system.
Price Instability
Some experts argue in favour of the derivatives that their major contribution is toward
price stability and price discovery in the market whereas some others have doubt about this.
Rather they argue that derivatives have caused wild fluctuations in asset prices, and moreover,
they have widened the range of such fluctuations in the prices. The derivatives may be helpful
in price stabilization only if there exist a properly organized, competitive and well-regulated
market. Further, the traders behave and function in professional manner and follow standard
code of conduct. Unfortunately, all these are not so frequently practiced in the market, and
hence, the derivatives sometimes cause to price instability rather than stability.
Displacement Effect
There is another doubt about the growth of the derivatives that they will reduce the
volume of the business in the primary or new issue market specifically for the new and small
corporate units. It is apprehension that most of investors will divert to the derivatives markets,
raising fresh capital by such units will be difficult, and hence, this will create displacement
effect in the financial market. However, it is not so strong argument because there is no such
rigid segmentation of invertors, and investors behave rationally in the market.
Increased Regulatory Burden
As pointed earlier that the derivatives create instability in the financial system as a
result, there will be more burden on the government or regulatory authorities to control the
activities of the traders in financial derivatives. As we see various financial crises and scams
in the market from time to time, most of time and energy of the regulatory authorities just
spent on to find out new regulatory, supervisory and monitoring tools so that the derivatives
do not lead to the fall of the financial system.
23

In our fast-changing financial services industry, coercive regulations intended to
restrict banks’ activities will be unable to keep up with financial innovation. As the lines of
demarcation between various types of financial service providers continues to blur, the
bureaucratic leviathan responsible for reforming banking regulation must face the fact that
fears about derivatives have proved unfounded. New regulations are unnecessary.
Indeed, access to risk-management instruments should not be feared, but with caution,
embraced to help the firms to manage the vicissitudes of the market.
In this chapter various misconceptions about financial derivatives are explored.
Believing just one or two of the myths could lead one to advocate tighter legislation and
regulatory measures designed to restrict derivatives activities and market participants. A
careful review of the risks and rewards derivatives offer, however, suggests that regulatory
and legislative restrictions are not the answer. To blame organizational failures solely on
derivatives is to miss the point. A better answer lies in greater reliance on market forces to
control derivative-related risk taking.
Financial derivatives have changed the face of finance by creating new ways to
understand, measure and manage risks. Ultimately, financial derivatives should he coned part
of any firm’s risanagement strategy to ensure that valhang
investment opportunities are pursued. The freedom to manage risk effectively must not be
taken away.
Myths About Derivatives
Myth Number 1
“Derivativare new, comph –tech financiaroduccreated by Wall Street’s
rocket scientists”
Financial derivatives are not new; they have been around for years. A description
ohirsnoption contaound in Aristotle’ritinellhiopher from
Mitetus who developed a financial device, which involves a principal of universal application
people reproved Thales, syncing that his lack of wealth was proof that philosophy was useless
occupation and of no intellect.
Thales had great skill in forecasting and predicted that the olive harvest would be
exceptionally good the next autumn. Confident in his prediction, he made agreements with
area olive –press owners to deposit what little money he had with them to guarantee him
24

exclusive use of their olive press when the harvest was ready. Hales successfully negotiated
low prices because the harvest was in the future and no one knew whether the harvest would
be plentiful or pathetic and because the olive-press owners were willing to hedge
againshossibilitooieldristotle’torbouales endnht gues
when the harvest –time came, and many [presses] were wanted all at once and of a sudden, he
let them out at any rate which he pleased, and made a quantity of money.
Thus he showed the world that philosophers can easily be rich if they like their
ambitionother sort,o Thanercisehirsnowption contts some
2,500 years ago. He was not obliged to exercise the option if the olive harvest had not been
good, hales could have let the option contracts expire unused and limited his loss to the
original price and paid for the option.
Most financial derivatives traded today are the: plain vanilla” variety –the simplest
form of a financial derivatives that are much difficult to measure, manage, and understand.
For those instruments, the measurement and control of risk can be far more complicated,
creating the increased possibility of unforeseen losses.
Waltreet’rocket scientistsre continually creatinew complex, sophisticated
financial derivative products. However, those products are built on foundation of the four
basis types of derivatives Most of the newest innovations are designed to hedge complex
risks in an effort to reduce future uncertainties and manage risks more effectively. But the
newest innovations require a firm understanding of the tradeoff of risk and rewards. To that
end, derivative users should establish a guiding set of principles to provide a framework
for effectively managing and controlling financial derivative activities those principles
should focus on the role of senior management, valuation and market risk-argument
credit measurement and management, enforceability operating systems and controls and
accounting and disclosure of risk-management position.
Myth Number 2
“Derivatives arurelpeculative, levged instrument”
Put anothys myts thaivatives” is a fancamor gambg.
Has speculative trading of derivative products fuelled the rapid growth in their use? Are
derivatives used only to speculate on the direction of interest rates or currency exchange
rates? Of course not. Indeed, the explosive use of financial derivative products in recent years
was brought about by three primary forces: more volatile markets, deregulation and
technologies.
25

The turning point seems to have occurred in the early 1970s with the breakdown of the
fixed-rate international currency exchange regime. This was established at the 1944
conference at Bretons Woods and maintained by the International monetary fund. Since then
currencies have floated freely. Accompanying that development was the gradual removal of
government-established interest-rate ceilings when regulation Q interest-
Rate restrictions were phased out. Not long afterward came inflationary oil price
shocks and wild interest-rate fluctuations. In sum, financial markets were more volatile then
at any time since the Great Depression. Banks and other financial intermediaries responded to
the new environment by developing financial risk-management products designed to better
control risk. The first were simple foreign exchange forwards that obligated one counterpart
to buy, and the other to sell, a fixed amount of currency at an agreed dated in the future. By
entering into a foreign exchange forward contract, customers could offset the risk that large
movements in foreign exchange rates would destroy the economic viability of their overseas
projects Thus, derivatives were originally intended to be used to effectively hedge certain
risks; and in fact, that was the key that unlocked their explosive development.
Beginning in the early 1980s,a host of new competitors accompanied the deregulation
of financial markets, and the arrival of powerful but inexpensive personal computers ushered
in new ways to analyze information and break down risk into component parts. To
servustomeretterinancial intermediary’s offered avercreaumber oovel
products designed to more effectively manage and control financial risks. New technologies
quickened the pace of innovation and provided banks with superior methods for tracking and
simulating their own derivatives portfolios.
Myth Number 3
“The enormous size ohinanciaivatives market dwarfs banapitalhery
makinivatives tn unsafnd unsounankint”
Thinanciaivatives market’ortlarleporteorhen
$20triln.That estimatwarfs nonlanapitaulshation‘s$7trilnnual
gross domestic product. Those often quoted figures are notional amounts. For derivatives,
notional principal is the amount on which interest and other payments are based. Notional
principal typically does not change hands; it is simply quantity used to calculate payments.
While notional principal is the most commonly used volume measure in derivatives
markets, it is not on accurate measures of credit exposure. A useful proxy for the actual
exposure of derivative instruments is replacement-cost credit exposure. That exposure is
26

the cost of replacing the contract at current market values should the counterpart default
before the settlement date.
For the 10 largest derivatives players among US bank holding companies, derivative
credit exposure averages 15 percent of the total assets. The average exposure is 49 percent of
assets for those banks ‘loan portfolios. In other words, if those 10 banks lost 100 percent on
their loans, the loss would be more then three times greater then it would be if they had to
replace all of their derivative contracts.
Derivatives also help to improve market efficiencies because risks can be isolated and
sold to those who are willing to accept them at the least cost. Using derivatives breaks risk
into pieces that can be managed independently. Corporations can keep the risks they are most
willing to accept them. From a market oriented perspective, derivatives offer the free trading
of financial risks.
The viability of financial derivatives rests on the principle of comparative advantage –
thas, thelativoldinpeic rishenevmparative advantages exist,
trade can benefit all parties evolved. And financial derivatives allow for the free trading of
individual risk components.
Myth Number 4
“Onlargultinational corporationnarganks honurposog
ivatives”
Very large organizations are the biggest users of derivative instruments. However,
firms of all sizes can benefit from using them. For example, consider a small regional bank
(SRB)with total assets of $5million.the SRB has a loan portfolio composed primarily of
fixed- rate mortgages, a portfolio of government securities, and interest –bearing deposits that
are often reprised, Two illustrations of how SRB can use derivatives to hedge risks are:
First, rising interest rates will negatively affect prices in the SRBs$1 million securities
portfouy selg short a miln treasury –bond futurntthe
SRB can effectively hedge against that interest-rate risk and smooth earnings stream in a
volatile market. if interest rates went higher, the SRB would be hurt by a drop in value of its
securities portfolio, but that loss would be offset by a again from the increase in the value of
its securities portfolio but would record a loss from is derivative contract. By entering into
derivatives contracts, the SRB can lock in a guaranteed rate of return on its securities
portfolio and not be as concerned about interest-rate volatility.
27

The second illustration involves a swap contract. As in the first illustration, rising
interest rates will harm the SRB because it received fixed cash on its loan portfolio and
variable cash flows with a dealer to pay fixed and received floating payments.
Myth Number 5
“anciaivatives arplhatesisanagemen”
Financial derivatives are important tools that can help organization to meet their
specific risk management objectives. As is the case with all tools, it is important that the
usstanhool’s intendeunctionhaesaro untake various
purpose. What kinds of derivative instruments and trading strategies are most appropriate?
How will those instruments perform if there is a large increase or decrease in interest rates?
Without a clearly defined risk-management strategy, use of financial derivatives can be
dangerous. Iahreaten the accomplishmenirm’s long-rangbjectives anesult unsafe and unsound
ptthat couleto the organization’s insolvency. But when
used wisely financial derivatives can increase shareholder value by providing a means to
bettntroirsriskosures anaslowlearlyivatives arertaye
are well on our way to truly globule financial markets that will continue to develop new
financial innovation to improve risk-management practices. Financial derivatives are the
latest risk-management fad. They are important tools for helping organizations to better
manage their risk exposures.
Myth Number 6
“Derivatives takoneuroductivroses anever punytack”
Financial derivatives, by reducing uncertainties, make it possible for corporations
initiate productive activities that not otherwise be pursued. For example, a company may
likuild manufacturing facility in thnitetates bus connebouhroject’s
ovlecausf exchange ratolatilitetween the dollar’s ensurhahe company
will have the cash available when it is needed for investment, the manufacturer should devise
a prudent risk –management strategy that is in harmony with its broader corporate objective
of building a manufacturing facility un the United states. As part of that strategy, the firm
should use financial derivatives to hedge against foreign exchange risk. Derivatives used as a
hedge can improve the management of cash flows at the individual firm level.
To ensure that predictive activities are pursued, corporate finance and treasury groups
should transform their operations from mundane bean counting to activist financial
28

risk management. They should integrate a clear set of risk management goals and objectives
into the organization’s ovll corporate strategy. The ultimate goal is to ensure that the
organization has necessary resources at its disposal to pursue investments that maximize
shareholder value. Used properly financial derivatives can help corporation to reduce
uncertainties and promote more productive actives.
Myth Number 7
“Onliseekinrganizatiohould usivatives”
Financial derivatives can be used in two ways: to hedge against unwanted risks or to
speculative by taking a position in anticipation of a market movement. The olive-press
owners, by locking in a guaranteed return no matter how good or bad the harvest, hedge
againshishaheason’livarveshotifulapeculatehat theason’livarvesould be
extionalloonhereforeaid aront
premium in anticipation of that event. Similarly, organization actions today can use financial
derivatives to actively seek out specifies risk and speculate on the direction of interest rate or
exchange –rate movements, or they can use derivatives it hedge against unwanted risks.
Hence, it is not true that only risk-seeking institutions use derivatives. Indeed, organizations
should use derivatives as part of their overall risk management strategy for keeping those
risks that they are comfortable managing and selling those that they do not want to others who
are more willing to accept them. Even conservatively managed institutions can use derivatives
to improve their cash flow management to ensure that the necessary funds are available to
meet broader corporate objectives. One could argue that organizations that refuse to use
financial derivatives are at greater risk then are those that use them.
When using financial derivatives however, organization should be careful to use only
those instruments that they understand and that fit best their corporate risk-management
philosophy. It may be prudent to stay away from the more exotic instruments, unless the
risewarradeoffs arlearly unstoohorm’enioanagemennts
independent risk-management review team. Exotic contracts should not be used unless there
is some obvious reason for doing so.
Myth Number 8
“Thisks associateitinanciaivatives arend unknown”
The kinds of risks associated with derivatives are no different from those associated
with traditional financial instruments, although they can be far more complex. There are
29

credit risks, market and so on. Risks from derivatives originate with the customer. With few
exceptions, the risks are man-made, that is it does not readily appear in nature. for example,
when a new homeowner negotiates with a lender to borrow a sum money, the customer
creates risks by the types of mortgage he chooses-risks to himself and the lending company.
Financial derivatives allow the lending institution to break up those risks and distribute them
around the financial system via secondary markets.
Thuanisks associateitivatives are actually createhe deas’
customers or by their customers’ customerThose rishave beinherent onation’s
financial system since its inception.
Banks and other financial intermediaries should view themselves as risk managers
bhnowledge olobainanciaarkitheir clientseedelh
clients anticipate change and have the flexibility to pursue opportunities that maximize their
success. Banking is inherently a risky business. Risk permeates much of what banks do, And
for banks to survive, they must be able to understand measure and manage financial risks
effectively.
The types of risks faced by corporations today have not changed. Rather they are more
complex and interrelated. The increase complexity anew volatility of the financial markets
hone paved the way for the growth of numerous financial innovation that can enhance returns
relative to risk. But a thorough understanding of a new financial –engineering
toolnroptegration intirm’vlisanagementrategnd corporate philosophy can help to turn
volatility into profitability.
Risk management is not about the elimination of risk; it is about the management of
the risk. selectively choosing those risks an organization is comfortable with the minimizing
those that it does not want. Financial derivatives serve a useful purpose in fulfilling risk-
management objectives. Through derivatives risks from traditional instruments can be
efficiently unbundled and managed independently. Used correctly, derivatives can save costs
and increase returns.
Today dealers manage portfolios of derivatives and oversee the net, or residual, risk of
their overall position. That development has changed the focus of risk management from
individuaransactionortfoosures anaubstantially improved deasbility
to accommodate a broad spectrum of customer transitions. Because most active derivatives
playersodarade oortfolio osurppearhainanciaivativot wind
markets together any more tightly than do loans. Derivatives players do not match every trade
with an offsetting trade; instead, they continually manage the residual risk of the
30
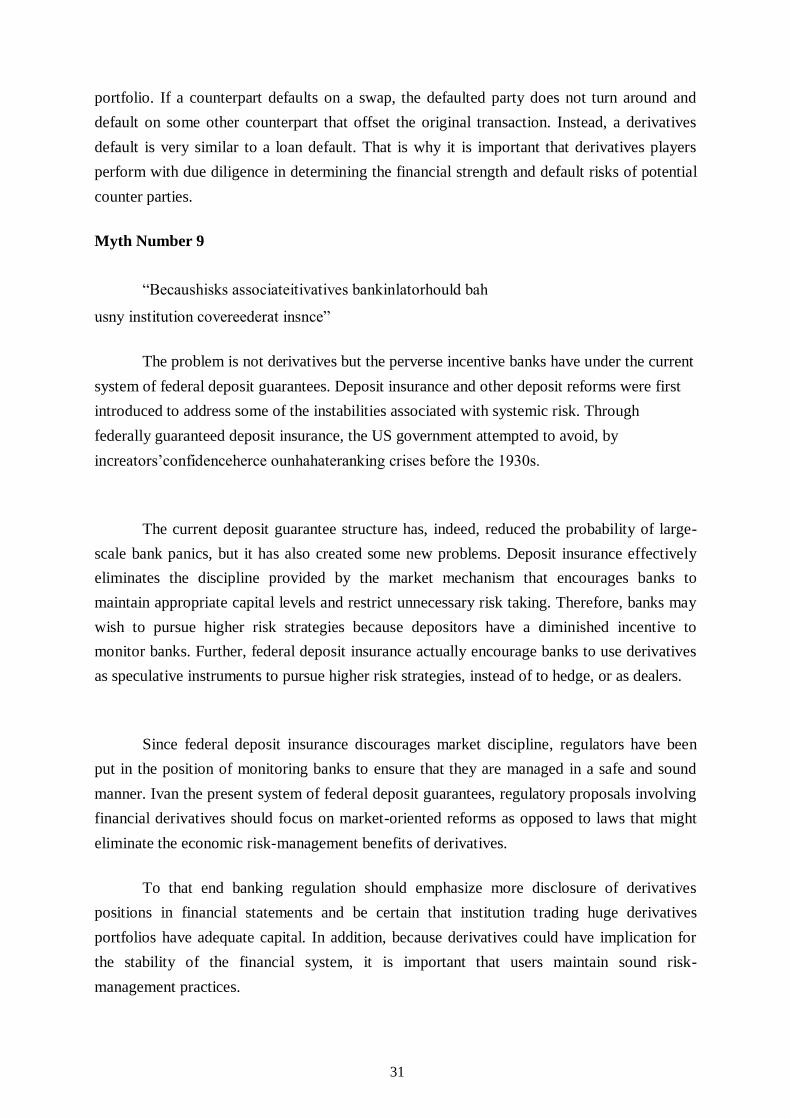
portfolio. If a counterpart defaults on a swap, the defaulted party does not turn around and
default on some other counterpart that offset the original transaction. Instead, a derivatives
default is very similar to a loan default. That is why it is important that derivatives players
perform with due diligence in determining the financial strength and default risks of potential
counter parties.
Myth Number 9
“Becaushisks associateitivatives bankinlatorhould bah
usny institution covereederat insnce”
The problem is not derivatives but the perverse incentive banks have under the current
system of federal deposit guarantees. Deposit insurance and other deposit reforms were first
introduced to address some of the instabilities associated with systemic risk. Through
federally guaranteed deposit insurance, the US government attempted to avoid, by
increators’confidenceherce ounhahateranking crises before the 1930s.
The current deposit guarantee structure has, indeed, reduced the probability of large-
scale bank panics, but it has also created some new problems. Deposit insurance effectively
eliminates the discipline provided by the market mechanism that encourages banks to
maintain appropriate capital levels and restrict unnecessary risk taking. Therefore, banks may
wish to pursue higher risk strategies because depositors have a diminished incentive to
monitor banks. Further, federal deposit insurance actually encourage banks to use derivatives
as speculative instruments to pursue higher risk strategies, instead of to hedge, or as dealers.
Since federal deposit insurance discourages market discipline, regulators have been
put in the position of monitoring banks to ensure that they are managed in a safe and sound
manner. Ivan the present system of federal deposit guarantees, regulatory proposals involving
financial derivatives should focus on market-oriented reforms as opposed to laws that might
eliminate the economic risk-management benefits of derivatives.
To that end banking regulation should emphasize more disclosure of derivatives
positions in financial statements and be certain that institution trading huge derivatives
portfolios have adequate capital. In addition, because derivatives could have implication for
the stability of the financial system, it is important that users maintain sound risk-
management practices.
31

Regulation have issued guidelines that banks with substantial trading or derivatives
activity should follow those guidelines include
➢➢ Active board and senior management oversight of trading activities; ➢➢ Establishment of an internal risk-management audit function that has independent of
the trading function; ➢➢ Thorough and timely audits to identify internal control weaknesses; and
➢➢ Risk-management and risk-management information system that include stress tests,
simulations, and contingency plans for adverse market movements
Ihesponsibilitank’enioanagemeno ensurhaisks are
effectively controlled and limited to levels that do not pose a serious threat to its capital
position. Regulation is an ineffective substitute for sound risk management at the individual
firm level.
****
32

Lesson 1.2 - Forward Contracts
Features of Forward Contract
1. It is an agreement between the two counter parties in which one is buyer and other is
seller. All the terms are mutually agreed upon by the counterparties at the time of the
formation of the forward contract.
2. It specifies a quantity and type of the asset (commodity or security) to be sold and
purchased.
3. It specifies the future date at which the delivery and payment are to be made.
4. It specifies a price at which the payment is to be made by the seller to the buyer. The
price is determined presently to be paid in future.
5. It obligates the seller to deliver the asset and also obligates the buyer to buy the asset.
6. No money changes hands until the delivery date reaches, except for a small service
fee, if there is.
Classification of Forward Contracts
The forward contracts can be classified into different categories. Under the Forward
Contracts (Regulation) Act. 1952, forward contracts can be classified in the following
categories:
Hedge Contracts
The basic features of such forward contracts are that they are freely transferable and
do not specify any particular lot, consignment or variety of delivery of the underlying goods
or assets. Delivery in such contracts is necessary except in a residual or optional sense. These
contracts are governed under the provisions of the Forward Contracts (Regulation) Act, 1952.
Transferable Specific Delivery (TSD) Contracts
These forward contracts are freely transferable from one party to other party. These
are concerned with a specific and predetermined consignment or variety of the commodity.
33

There must be delivery of the underlying asset at the expiration time. It is mandatory. Such
contracts are subject to the regulatory provisions of the Forward Contracts (Regulation) Act,
1952, but the Central Government has the power to exempt (in specified cases) such forward
contracts.
Non-Transferable Specific Delivery (NTSD) Contracts
These contracts are of such nature which cannot be transferred at all. These may
concern with specific variety or consignment of goods or their terms may be highly specific.
The delivery in these contracts is mandatory at the time of expiration. Normally, these
contracts have been exempted from the regulatory provisions of Forward Act, but the Central
Government, whenever feels necessary, may bring them under the regulation of the Act.
It is evident from the above that the definition of hedge contracts corresponds to the
definition of futures contracts while the latter two are not futures contracts, and hence, termed
as forward contracts. Since in both hedge contracts and futures contracts, no specification
about the underlying asset/commodity is mentioned because such limits are set by the rules of
the exchange on which types can or cannot he delivered. If the variety is superior or inferior
to the basis variety for delivery, in that case the prices are adjusted by means of premium or
discount as the case may be. Such adjustments are popularly known as tendering differences.
Thus, on this basis, it may be generalized that every futures contract is a forward contract but
every forward contract may not be futures contract.
Other Forward Contracts
Forward Rate Agreements (FRA)
Forward contracts are commonly arranged on domestic interest-rate bearing
instruments as well as on foreign currencies. A forward rate agreement is a contract between
thwartsuallnhanker anther a banker’ustomer or inent
party), in which one party (the banker) has given the other party (customer) a guaranteed
future rate of interest to cover a specified sum of money over a specified period of time in the
future.
For example, two parties agree that a 6 percent per annum rate of interest will apply to
one year deposit in six months time. If the actual rate of interest proves to be different from 6
percent then one company will pay and other receives the difference between the two sets of
interest cash flows.
34
In forward rate agreement, no actual lending or borrowing is affected. Only it fixes the
rate of interest for a futures transaction. At the time of maturity, when the customer actually
needs funds, then he has to borrow the funds at the prevailing rate of interest from the market.
If the market rate of interest is higher than the FRA interest then the banker will have to pay
to the other party (customer) the difference in the interest rate. However, if market interest is
lesser than the FRA rate then the customer will have to pay the difference to the banker. This
transaction is known as purchase of FRA from the bank.
Sometimes, a customer (depositor) may also make a FRA contract with the bank for
his deposits for seeking a guaranteed rate of interest on his deposits. If the market rate on his
deposit turns out to be lower than that guaranteed interest rate in the FRA, the bank will
compensate him for the difference, i.e., FRA rate minus market interest. Similarly, if the FRA
is lower than the deposit rate then the customer will pay difference to the banker. This
transaction is known as sale of a FRA to the bank. In this way, purchase of FRA protects the
customer against a rise in interest in case of borrowing from the bank. Similarly, sale of FRA
will protect the customer from deposits point of view. The bank charges different rates of
interesoorrowinngnhpread between theswo constitutes bank’s profit margin. As a result, no
other fee is chargeable for FRA contracts.
Example 1
Suppose three month forward rupee is at ` 45 per US dollar. A quotation is given in
termf range. Thorwarupeould buote ` 48 to ` 50”. If the spot rate rises above the maximum,
i.e., ` 50 then the maximum level is used. If the spot rate falls below the minimum rate, i.e., `
48 then the minimum level will be used.
Example 2
Assume two companies might agree that 8 percent per annum rate of interest will
applneat in fix month’imehe actual ratroves tferent
from 8 percent per annum, one company pays and the other receives the present value of the
difference between two sets of interest (cash flows). This is known as a forward-rate
agreement (FRA).
Range Forwards
These instruments are very much popular in foreign exchange markets. Under this
instrument, instead of quoting a single forward rate, a quotation is given in terms of a range,
i.e., a range may be quoted for Indian rupee against US dollar at ` 47 to ` 49. It means there
35

is no single forward rate rather a series of rate ranging from ` 47 1049 has been quoted. This
is also known as flexible forward contracts. At the maturity, if the spot exchange rate is
between these two levels, then the actual spot rate is used. On the other hand, if the spot rate
rises above the maximum of the range, i.e., ` 49 in the present case then the maximum level is
used.
Further, if the spot rate falls below the minimum level, i.e., ` 47, then the minimum
rate will be used. As such we see that these forward range contracts differ from normal
forward contracts in two respects, namely, (a) they give the customer a range within which he
can earn or use from the exchange rate fluctuations, and (b) further they provide protection to
the party from the extreme variation in exchange rates.
Forward Trading Mechanism
Forward contracts are very much popular in foreign exchange markets to hedge the
forurrencisoshargnd internationaanks haveparatForward Deskithorn exchangoos
devotehorward
contracts. Let us take an example to explain the forward contract.
Suppose on April 10, 2002, the treasurer of an UK Multinational firm (MNC) knows
that the corporation will receive one million US dollar after three months, i.e., July 10, 2002
and wants to hedge against the exchange rate movements.
In this situation, the treasurer of the MNC will contact a bank and find out that the
exchange rate for a three-month forward contract on dollar against pound sterling, i.e., £I$ =
0.6250 and agrees to sell one million dollar. It means that the corporation has short forward
contracts on US dollar. The MNC has agreed to sell one million dollar on July 10, 2002 to the
bank at the future dollar rate at 0.6250. On the other hand, the bank has a long forward
contract on dollar. Both sides have made a binding contract/commitment.
Before discussing the forward trading mechanism, let us see some important
terminology frequently used in the forward trading.
Long Position
The party who agrees to buy in the future is said to hold long position. For example, in
the earlier case, the bank has taken a long position agreeing to buy 3-month dollar in futures.
36

Short Position
The party who agrees to sell in the future holds a short position in the contract. In the
previous example, UK MNC has taken a short position by selling the dollar to the bank for a
3-month future.
The Underlying Asset
It means any asset in the form of commodity, security or currency that will be bought
and sold when the contract expires, e.g., in the earlier example US dollar is-the underlying
asset which is sold and purchased in future.
Spot-Price
This refers to the purchase of the underlying asset for immediate delivery. In other
words, it is the quoted price for buying and selling of an asset at the spot or immediate
delivery.
Future Spot Price
The spot price of the underlying asset when the contract expires is called the future
spot price, since it is market price that will prevail at some futures date.
Delivery Price
The specified price in a forward contract will be referred to as the delivery price. This
is decided or chosen at the time of entering into forward contract so that the value of the
contract to both parties is zero. It means that it costs nothing to take a long or a short position.
In other words, at the day on writing of a forward contract, the price which is determined to
be paid or received at the maturity or delivery period of the forward contract is called delivery
price. On the first day of the forward contract, the forward price may be same as to delivery
price. This is determined by considering each aspect of forward trading including demand and
supply position of the underlying asset. However, a further detail regarding this will be
presented in forthcoming chapter.
The Forward Price
It refers to the agreed upon price at which both the counter parties will transact when
the contract expires. In other words, the forward price for a particular forward contract at a
particular time is the delivery price that would apply if the contract were entered into at
37

that time. In the example discussed earlier, on April 10, 2002, 0.6250 is the forward price for
a forward contract that involves the delivery of US dollar on July 10, 2002.
The Determination of Forward Prices
Forward contracts are generally easier to analyze than futures contracts because in
forward contracts there is no daily settlement and only a single payment is made at maturity.
Though both futures prices and forward prices are closely related, this will be described in the
latter part of this chapter.
It is essential to know about certain terms before going to determine the forward
prices such as distinction between investment assets and consumption assets, compounding,
short selling, repo rate and so on because these will be frequently used in such computation.
We are not discussing these here in detail but the traders must be aware about them
thoroughly. A brief view of these terms is explained here as under:
An investment asset is an asset that is held for investment purposes, such as stocks,
shares, bonds, treasury, securities, etc. Consumption assets are those assets which are held
primarily for consumption, and not usually for investment purposes. There are commodities
like copper, oil, food grains and live hogs.
Compounding is a quantitative tool which is used to know the lump-sum value of the
proceeds received in a particular period. Consider an amount A invested for n years at an
interest rate of R per annum. If the rate is compounded once per annum, the terminal value of
that investment will be
Terminal value =A (1 +R)n
and if it is compounded m times per annum then the terminal value will be
Terminal value =A (1 +R/m)mn
where A is amount for investment, R is rate of return, n is period for return and m is period of
compounding. Suppose A = ` 100, R = 10% per annum, n = 1 (one year), and if we compound once per
annum (m = 1) then as per this formula, terminal value will be 100(1 + 10)1 = 100(1.10) = ` 110,
if m=2 then
100(1 + 0.05)2x1 = 100 x 1.05 x 1.05= ` 110.25
and so on.
38

Short selling refers to selling securities which are not owned by the investor at the
timalelsalleshorting’ithe intentiouyinaterhorelay not be possible for all investment assets. It yields a profit to the investor when the price of the
asset goes down and loss when it goes up.
For example, an investor might contract his broker to short 500 State Bank of India
shares then the broker will borrow the shares from another client and sell them in the open
market. So the investor can maintain the short position provided there are shares available for
the broker to borrow. However, if the contract is open, the broker has no shares to borrow,
then the investor has to close his position immediate, this is known as short-squeezed.
The repo rate refers to the risk free rate of interest for many arbitrageurs operating in
futurarkets. Furtherhrepoepurchasgreemeneferhagreement where the owner of the securities agrees to sell them to a financial institution, and buy the
same back later (after a particular period). The repurchase price is slightly higher than the
price at which they are sold. This difference is usually called interest earned on the loan. Repo
rate is usually slightly higher than the Treasury bill rate.
Assumptions and Notations
Certain assumptions considered here for determination of forward or futures prices are:
➢➢ There are no transaction costs. ➢➢ Same tax rate for all the trading profits.
➢➢ Borrowing and lending of money at the risk free interest rate.
➢➢ Traders are ready to take advantage of arbitrage opportunities as and when arise.
These assumptions are equally available for all the market participants; large or small.
Further, some Notations which have been used here are:
T = Time remained upto delivery date in the contract
S = Price of the underlying asset at present, also called as spot or cash or current K
= Delivery price in the contract at time T F = Forward or future price today
f = Value of a long forward contract today
r = Risk free rate of interest per annum today
t = Current or today or present period of entering the contract
39

Now, we will discuss the mechanism of determination of forward prices of different
types of assets.
The Forward Price for Investment Asset (Securities)
Here we will consider three situations in case of investment assets:
1. Investment assets providing no income
2. Investment assets providing a known income
3. Investment assets providing a known dividend income
Forward Price for An Asset that Provides no Income
This is the easiest forward contract to value because such assets do not give any
income to the holder. These are usually nondividend paying equity shares and discount bonds.
Let us consider the relationship between the forward price and spot price with an example.
Example
Consider a long forward contract to purchase a share (Non-dividend paying) in three-months.
Assume that the current stock price is ` 100 and the three-month risk free rate of interest is
6% per annum. Further assume that the three months forward price is ` 105.
Arbitrageur can adopt the following strategy
Borrow ` 100 @ 6% for three months, buy one share at ` 100 and short a forward
contract for ` 105. At the end of three months, the arbitrageur delivers the share for ` 105, the
sum of money required to pay off the loan is 100e 0.06 x0.2 = ` 101.50, and in this way, he
will book a profit of ` 3.50, (` 105—` 101.50).
Further suppose that the three-month forward price is ` 99. Now, an arbitrageur can
one share, invest the proceeds of the short sale at 6 percent per annum for three months, and a
long position in a three-month forward contract. The proceeds of short sales will grow to
100e0.006x0.25= ` 101.50, at the end of three months, the arbitrageur will pay ` 99 and takes the
delivery of the share under forward contract, and uses it to close its short sale position. His net
gain is ` 101.50— ` 99 = ` 2.5.
40

Generalization: We call from the previous example using the notations mentioned
earlier for investment asset providing no income:
F = SerT
where F is forward price of the stock, S is spot price of the stock, T is maturity period
(remained), r is risk- free interest rate.
If F> SerT then the arbitrageur can buy the asset and will go for short forward contract on the
asset.
If F < SerT then he can short the asset and go for long forward contract on it.
Forward Prices for Security that Provides a Known Cash Income
We will consider forward contracts on such assets which provides a known cash
income, for example, coupon bearing bonds, treasury securities, known dividend, etc. Let us
explain with an example:
Example
Consider a long forward contract to purchase a coupon bond whose current price is ` 900
maturing 5 years. We assume that the forward contract matures in one year, so that the
forward contract is a contract to purchase a four-year bond in one year. Further assume that
the coupon payment of ` 40 are expected after six months and 12 months, and six-month and
one-year risk free interest rate are 9 percent and 10 percent respectively.
In first situation, we assume that the forward price is high at ` 930. In this case, can
arbitrageur can borrow ` 900 to buy the bond and short a forward contract. Then the first
coupon payment has a present value of 40e = ` 38.24. So the balance amount ` 861.76
(900-38.24) is borrowed @ 10% for year. The amount owing at the end of the year is 86l.76e01
x = ` 952.39. The second coupon provides ` 40 toward this amount, and ` 930 is received for
the bond under the terms of the forward contract. The arbitrageur will earn
= (` 40 + ` 930) — ` 952.39 = ` 17.61
Similarly, in the second situation, we may assume the low forward price at ` 905, then
in that case the arbitrageur can short the bond and outer into long forward contract. Likewise
above, the arbitrageur will earn:
` 952.39— (` 40 + 905) = ` 7.39
41
-09 x 0.5

Generalization: From the above example, it can be generalized that such assets which
provide known income (i.e. I) during the life of a forward contract, then forward price would
be as follows:
F = (S – I)erT
In the earlier example, S = ` 900, I = 40, r = 0.09 and 0.1 and T= 1.
I is calculated as:
I = 40e-0.09+40e
-0.10x1 = ` 74.433
Then F = (900— 74.333)0.10x1 = ` 912.39
This can be an agreement with our calculation, and it applies to any investment asset
that provides a known cash income. So we can generalized from the above: If F > (S - I)erT,
the investor can earn the profit by buying the asset and shorting a forward contract on the
asset. If F < (S - I)erT, an arbitrageur can earn the profit by shorting the asset and taking a long
position in a forward contract. Further, if there is no short sale, the arbitrageur who owns the
asset will find it profitable to sell the asset and go long forward contract.
Forward Price where the Income is a Known Dividend Yield
A known dividend yield means that when income expressed as a percentage of the
asset life is known. Let us assume that the dividend yield is paid continuously as a constant
annual rate at q then the forward price for a asset would be F = Se(r-q)T
Example
Let us consider a six-month forward contract on a security where 4 percent per annum
continuous dividend is expected. The risk free rate of interest is 10 percent per annum. The
asset’urrenrs ` 25. Then we can calculate the forward price as:
F = Se(r-q)T
F = 25e(0.10-0.04)x0.5 = ` 25.76
If F> Se(r-q)T then an investor can buy the asset and enter into a short forward contract
to lock in a riskless profit. If F< Se(r-q)T then an investor can enter into a long forward contract
and short the stock to earn riskless profit. Further, if dividend yield varies during the life of a
forward contract the q should be set equal to the average dividend yield during the life of the
contract.
42

Valuing Forward Contracts
On the basis of generalization in different situations, we can find out the value of a
forward contract. As we know that the value of a forward contract at the time it is first written
(entered) into is zero. However, at later stage, it may prove to have a positive or negative
value. In general, the value of a forward contract can be determined as follows:
f = (F – K)e-rT
where f is value of a forward contract, F is forward price (current) of the asset, K is
delivery price of the asset in the contract, T is time to maturity of contract and r is risk free
rate of interest.
Let us examine the equation
We compare a long forward contract that has a delivery price of F with an otherwise
identical long forward contract with a delivery price of K. As we know that the forward price
is changing with the passage time, and that is why later on, F and K may not be equal which
were otherwise equal at the time of entrance of the contract. The difference between the two
is only in the amount that will be paid for the security at time T. Under the first contract, this
amount is F, and under the second contract, it is K. A cash outflow difference of F- K at time
T translates to a difference of (F - K)e-rT today. Therefore, the contract with a delivery price F
is less valuable than the contract with a delivery price K by an amount (F - K)e-rT. The value of
contract that has a delivery price of F is by definition, zero.
Similarly, the value of a short forward contract with the delivery price K is f= (F - K)e-rT
Example
Consider a six-month long forward contract of a non-income-paying security. The risk free
rate of interest is 6 percent per annum. The stock price is ` 30 and the delivery price is ` 28.
Compute the value of forward contract.
Forward price F = 30e 0.06x05 = ` 30.90
Value of forward contract f= (F - K)e-rT
= (30.90 - 28)e-0.06x0.5
= ` 2.90-0.09 = 2.8* (app.)
43

Alternatively, using the other equation:
f = 30 - 28-0.06x0.5
f= 30 - 27.16 = 2.84 (app.)
*The above difference is due to annual compounding.
Using the earlier equation of value of forward contract, we can show the value of long
forward contract in all the three situations, which are as under:
(a) Asset with no income: f= S - Ke-rT
(b) Asset with known income (l):f= S - I - Ke-rT
(c) Asset with known dividend yield at the rate q: f= Se-qT - Ke-rT
Note that in each case the forward price F is the value of K which makes f equal to zero.
Forward Prices Versus Futures Prices
Whether the forward prices are equal to futures prices, this is very important and
debatable issue. It is argued that if risk free interest rate is constant and the same for all
maturities, in such market situations, lie forward price will be same as the futures price for the
contract.
However, in actual practice, the interest rates do not remain constant and usually vary
unpredictably, then forward prices and futures prices no longer remain the same. We can get
sense of the nature of the relationship by considering the situation where the price of the
underlying asset is strongly positively correlated with interest rates.
Since in futures contracts, there is daily settlement, so if current price(s) increases, an
investor who holds a long future position, makes an immediate profit, which will be
reinvested at a higher than average rate of interest.
Similarly when current price(s) decreases, the investor will incur immediate loss, and
this loss will be financed at a lower than average rate of interest. However, this position does
not arise in the forward contract because there is no daily settlement and interest rate
movements will not have any affect till maturity.
It is further argued that when spot (current) prices are strongly positively correlated
with the interest rates, futures prices will tend to higher than the forward prices, similarly,
44

if spot prices are strongly negatively correlated with the interest rates then forward prices will
tend to higher than the futures prices. It is further observed that though there may be
theoretical difference between forward prices and futures prices due to various factors like
taxes, transaction costs, treatment of margin and default risk, but this difference is very small
which may be ignored. Thus, in our further discussion in various chapters, both forward
contracts and futures contracts are assumed to be the same and the symbol F will be used to
represent both futures price and forward price same at time zero.
****
45
Lesson 1.3 - Participants in Derivative Markets
The participants in the derivative markets can be broadly classified in three depending
upon their motives. These are:
1. Hedgers
2. Speculators
3. Arbitrageurs
Hedgers
Hedgers are those who enter into a derivative contract with the objective of covering
risk. Farmer growing wheat faces uncertainty about the price of his produce at the time of the
harvest. Similarly, a flour mill needing wheat also faces uncertainty of price of input. Both the
farmer and the flour mill can enter into a forward contract, where the farmer agrees to sell his
produce when harvested at predetermined price to the flour mill. The farmer apprehends price
fall while the flour mill fears price rise. Both the parties face price risk. A forward contract
would eliminate price risk for both the parties. A forward contract is entered into with the
objective of hedging against the price risk being faced by the farmer as well as the flour mill.
Such participants in the derivatives markets are called hedgers. The hedgers would like to
conclude the contract with the delivery of the underlying asset. In the example the contract
would be settled by the farmer delivering the wheat to the flour mill on the agreed date at an
agreed price.
Speculators
Speculators are those who enter into a derivative contract to make profit by r assuming
risk. They have an independent view of future price behaviour of the underlying asset and
take appropriate position in derivatives with the intention of making profit later. For example,
the forward price in US dollar for a contract maturing in three months is
` 48.00. If one believes that three months later the price of US dollar would be ` 50, one
would buy forward today and sell later. On the contrary, if one believes US dollar would
depreciate to ` 46.00 in 1 month one would sell now and buy later. Note that the intention is
not to take delivery of underlying, but instead gain from the differential in price.
46
If only hedgers were to operate in the derivative markets, the number of participants in
the market would be extremely limited. A farmer would find it difficult to locate a flour mill
with perfectly matched and complimentary requirements in terms of quantity, quality, and
timing of the delivery of the asset (wheat in this case).
Similarly, a flour mill would also find it difficult to locate a suitable farmer to supply
the exact requirements. If middlemen are permitted to operate, the hedgers need not look for
exact match, and instead they can deal with the middlemen who would buy the produce from
the farmer in advance with anticipation of higher price in the future at the time of harvest.
Such middlemen will be speculating on the future price and bid a current price in a manner
that is likely to result in gain for them. By entering into a contract on the derivatives the
speculators are assuming risk of price in future.
Speculators perform an extremely important function. They render liquidity to the
market. Without speculators in the market not only would it be difficult for hedgers to find
matching parties but the hedge is likely to be far from being efficient. Presence of speculators
makes the markets competitive, reduces transaction costs, and expands the market size. More
importantly, they are the ones who assume risk and serve the needs of hedgers who avoid
risk. With speculators around, hedgers find counterparties conveniently.
Arbitrageurs
It would seem that hedgers and speculators would complete the market. Not really so
because we assume that different markets are efficient by themselves and they operate in
tandem. We describe derivative as the one that derives its price from the underlying asset.
Structurally the markets for derivatives and the underlying are separate. For example,
agricultural products would b€ bought and sold in the physical market (mandis), while futures
on them are traded on the commodity exchange.
However, there has to be complete harmony between the mandis and commodity
exchange. There cannot be any disparity in the prices in the mandis and the commodity
exchange.
The third category of participants, i.e. arbitrageurs, performs the function of making
the prices in different markets converge and be in tandem with each other. While hedgers and
speculators want to eliminate and assume risk respectively, the arbitrageurs take riskless
position and yet earn profit. They are constantly monitoring the prices of different assets in
different markets and identify opportunities to make profit that emanate from mispricing of
products. The most common example of arbitrage is the price difference that may be
47
prevailing in different stock markets. For example, if the share price of Hindustan Unilever is
` 175 in National Stock Exchange (NSE) and ` 177 in Bombay Stock Exchange (BSE), the
arbitrageur will buy at NSE and sell at BSE simultaneously and pocket the difference of ` 2
per share.
An arbitrageur takes risk neutral position and makes profits because markets are
imperfect. Naturally, such imperfections cannot exist for long. These imperfections are
extremely short-lived. The arbitrageur cashes upon these short-lived opportunities. Such
actions restore the balance in prices and remove distortions in the pricing of assets.
Fundamentally the speculators and arbitrageurs fall in the same category in as much as
that both are not looking at owning or disowning the underlying asset by delivery like
hedgers. Both speculators and arbitrageurs are also trying to render competitiveness to the
market, thereby helping the price discovery process. Difference between the two lies in the
amount of risk they assume.
While speculators have their opinions about the future price of the underlying asset by
making investment, the arbitrageur is concentrating on the mispricing in different markets by
taking riskless position with no investment of his own. By his actions an arbitrageur is
restoring the balance and consistency among different markets, while speculators only hope
for the desirable movement in prices. Arbitrageurs are the ones who prohibit speculators to
overbid or underbid the prices in the derivatives as compared to the physical markets.
Functions of Derivative Markets
Derivatives were invented to fulfill the need of hedging against the price risk. It
enables transfer of risk from those wanting to avoid it to those who are willing to assume it.
Besides hedging, derivatives perform many other important functions which are discussed
below.
Enable Price Discovery
First, the derivatives and their market increase the competitiveness of the market as it
encourages more number of participants with varying objectives of hedging, speculation, and
arbitraging. With broadening of the market the changes in the price of the product are
watched by many who trade on the slightest of reasons. Even a minor variation in price
prompts action on the part of speculators. Active participation by large number of buyers and
sellers ensures fair price. The derivative markets, therefore, facilitate price discovery of assets
due to increased participants, increased volumes, and increased sensitivity of
48
participants to react to smallest of price changes. By increased depth in the market, faster and
smooth dissemination of information among different participants, the process of discovery of
price becomes more efficient.
Facilitate Transfer of Risk
Hedgers amongst themselves could eliminate risk if two parties face risk from
opposite movement of price. As seen earlier, the wheat farmer needing to sell his produce
faced a risk from the fall in price, while the flour mill needing to buy wheat was worried
about the rise in price. Since risk was emanating from opposing directions of price movement,
the convergence of the two was possible. If both the farmer and the flour mill wanted to
hedge against price rise the two would not meet. When speculators enter the market they
discharge an important function and help transfer of risk from those wanting to eliminate to
those wanting to assume risk.
Provide Leveraging
Taking position in derivatives involves only fractional outlay of capital when
compared with the position in the underlying asset in the spot market. Assume a speculator is
convinced that price of wheat will be ` 16 per kg in six months and a farmer agrees to sell at `
15.50 per kg. To take advantage the speculator will have to pay the full price of ` 15.50 now
and realize ` 16.00 six months later. Instead, if a mechanism is available by which he can
absolve himself of making the full payment, he will be too glad to enter into a contract.
Derivatives, as products, and their markets provide such exit route by letting him first enter
into a contract and then permitting him to neutralize position by booking an opposite contract
at a later date. This magnifies the profit manifolds with the same resource base. This also
helps build volumes of trade, further helping the price discovery process.
Other Benefits
The function of leveraging and risk transfer helps in efficient portfolio management.
With a smaller fund at disposal, better diversification can be achieved with part of the fund
allocation to derivatives assets. Derivatives provide a much wider menu to portfolio managers
who constantly seek better risk return trade off. The range of choices would be far more
restricted in the absence of derivatives.
Since very large number of participants become active in the market (due to
leveraging), the transaction costs are likely to be lower and lower with derivative markets.
Shrinking transaction cost reflected in spread of sell and buy prices is a sure sign of free
49

market economy, and therefore efficient allocation of resources. Faster and efficient
dissemination of information also helps in removing price disparities across geographies.
Derivatives can be extremely useful in smoothening out the seasonal variations in the
prices of the underlying assets. Hoarding is viewed as a social stigma. Hoarding used for
speculative purposes require scanty trading with large price variation among financially
powerful persons acting in concert. Derivatives can help curb hoarding by continuous trading
and increasing participation as it requires little capital outlay, leaving the field open to large
number of participants reducing the financial muscle power of few engaged in hoarding.
Misuses, Criticism of Derivatives
Derivatives act like a double-edged sword. When used properly and conservatively
they are highly effective but when used with indiscretion they are capable of causing miseries.
Unfortunately there is no pragmatic way to demarcate the discretion with indiscretion. There
is a very fine line that separates calculated risk taking and gambling. The following are often
cited as demerits of derivatives.
Increased Volatility
Since derivatives offer extremely leveraged position, a large number of participants
are attracted towards the market with nominal capital available with them. Giving rise to
speculative tendencies derivative markets are often blamed for causing extreme volatilities in
the prices, which are also seen in the spot markets. However, it remains to be seen that such
volatility in price would be absent in the spot markets if derivatives were not to exist.
There are several instances in India, especially in the commodities, where the trading
in derivatives has been banned. The reason cited for such ban is often the wide and
unexplainable divergence between the prices in the spot market for the underlying and in
derivatives markets. In such circumstances it is often stated that it is the derivatives market
that is distorting the prices in the spot market. The notion that derivatives markets can
influence the price in the physical markets at best seems misplaced and lacks conviction. In
fact trading in derivatives should be seen as a precursor to what may happen in the spot
market. With highly leveraged position it is natural that the volatility in prices would be more
than in the spot market, but it would be wrong to state that volatility in derivative will get
transferred to physical markets. In fact, volatility in markets is inherently caused by the
mismatch of demand and supply.
50

Increased Bankruptcies
Inherent leverage in derivatives may very easily cause bankruptcies when one assumes
a position in derivatives that is totally out of sync with the financial position. Since positions
in the financial markets are taken in sequentially one default may trigger a chain and can
cause market failure.
Burden of Increased Regulation
With increasing derivative activity it is opined that there in an increasing need for
regulation. Since derivatives allow accumulation of large positions with little capital, the
disclosure of identities and positions taken is imperative. Also there is increasing need to
discourage overly speculative positions to prevent bankruptcies and letting the chain of
defaults to set in. Disclosure requirements and need to control has placed onerous
responsibilities on the monitoring and regulating agencies. Such requirements and control
mechanisms are often disliked by some of the participants in the market because they are seen
as impediments in the development of free markets.
Recent failures of some of the financial leaders in the USA in 2008 and 2009 due to
excessive and innovative derivatives positions by some investment and commercial banks,
leading to their failures, has emphasized the need of government intervention. It may be noted
that positions of these financial institutions was in OTC derivatives that did not warrant any
disclosures. These positions surfaced only when they assumed disastrous proportions. The
actions of government to bail out these institutions are criticized for remurociethaiuts are
essentialleen aviprivatizinrofit anociases’.
****
51

Lesson 1.4 - Recent Developments in Global Financial Derivative Markets
The past decade has witnessed an explosive growth in the use of financial derivatives
by a wide range of corporate and financial institutions. The following factors which have
generally been identified as the major driving force behind growth of financial derivatives are
the (i) increased volatility in asset prices in financial markets; the increased integration of
national financial markets with the international markets; the marked improvement in
communication facilities and sharp decline in their costs; the development of more
sophisticated risk management strategies; and the innovations in the derivatives markets,
which optimally combine the risk and returns over a large number of financial assets, leading
to higher returns, reduced risk as well as transaction costs as compared to individual financial
assets. The growth in derivatives has run in parallel with the increasing direct reliance of
companies on the capital markets as the major source of long-term funding. In this respect,
derivatives have a vital role to play in enhancing shareholder value by ensuring access to the
cheapest source of funds. Furthermore, active use of derivative instruments allows the overall
business risk profile to be modified, thereby providing the potential to improve earnings
quality by offsetting undesired risks.
In the world financial market, aggregate turnover of exchange-traded fixed income
contracts rose by 21% in the first quarter of 2005, to $304 trillion. Increased activity derived
from contracts on both short and long rates. Trading on money market contracts, including
those on euro dollar, Euribor and euroyen rates, rose by 21% to $262 trillion, with strong
activity for both futures and options. For bond-related instruments, turnover was up by 20%
to $43 trillion. Unlike the previous two quarters, activity in short-term contracts was strong in
all regions. Trading increased by 23% in the United States, to $159 trillion, with futures and
options up by 17% and 38%, respectively. Business rose by 18% in Europe, to $95 trillion,
with activity in futures up by 13% and that in options by 41%.
In the long-term interest rate segment, contracts expanded by 20% in the first quarter
of 2005 to $43 trillion. Business was up by 11% in North America to $15 trillion, and by 27%
in Europe to $25 trillion. In the US market, activity might have been related to hedging needs
in connection with an unexpected flattening of the curve in the early part of period, followed
by an abrupt self-off at the long end in late February and early March, 2005. In European
marketplaces, higher interest rate uncertainty may also have played a role as macroeconomic
news from Europe over the period was quite mixed. Business also
52

returned to growth in the Asia-Pacific region, with turnover up by 10% to $9.5 trillion.
Activity rose by 9% in short-term rate contracts and by 12% in long rate contracts. Business
in the short-term segment was stronger in the Pacific region, up by 13%, than in Asia, where
it grew by 2% only. Among Asian countries, activity recovered in Japan, up by 19%, after a
27% slide in the previous quarter, while it continued to fall in Singapore, down by 17%.
Turnover of exchange-traded currency derivatives rose to $2.7 trillion in the first
quarter of 2005. Business in futures contracts increased by 14% (to $2.4 trillion), while
activity in currency options surged by 25%. Higher turnover derived mainly from activity in
the euro vis-à-vis the dollar, up by 19%. Among other currency pairs, turnover grew
significantly for the Japanese yen vis-à-vis the dollar, up by 7%. However, this increase in
turnover differed across regions, although the vast majority of activity remains concentrated
in US marketplaces. Business was up by 14% in the United States, to $2.4 trillion, stagnated
in Asia ($30 billion) and fell by 3% in Europe ($4 billion). Activity kept expanding at high
rates in Brazil, with trading in futures and options on the Sao Paulo Mercantile and Futures
Exchange (BMF) up by 32%, to $234 billion.
Increased investment and hedging activity in currency markets was not associated
with uncertainty, since implied volatilities for the main currency pairs dropped significantly in
the first quarter of 2005. It might instead have reflected realized and expected changes in
exchange rate levels, and the need to adjust positions. After a prolonged depreciation, the
dollar rose by 4.5% against the euro in the first quarter of 2005. Over the same period, risk
reversal indicators derived from currency options started to signal that economic agents had
changed their expectations about future exchange rate levels, with the previously expected
depreciation of the dollar versus the euro turning toward expectations of stability or slight
appreciation.
Global turnover in stock index contracts, which had grown by 17% in the last quarter
of 2004, continued to expand in the first quarter of 2005, this time by 7% (to $26 trillion).
Business was overall stronger in the United States, up by 9% (to $11 trillion), than in Europe,
which was up by a relatively weak 5% (to $6 trillion). Business was particularly stagnant in
Germany, where turnover for products related to the DAX index fell sharply. In the Asia-
Pacific region, business increased by 5%, to $9 trillion. Trading continued to expand in the
Korean stock market, up by 6%, and in Japan, by 10%. Turnover rose by 13% in Australia.
Options turnover was up by 8%, to $15 trillion, while business in futures grew by 5%,
to $12 trillion. The stronger growth in the options segment came from both the US and the
European markets, where activity in such instruments was up by 7% and 10%, respectively
53

The increase in equity index trading in the United States and in Europe contrasts with
the stability of the underlying indices, up by 0.1% and 2.4% in the first quarter, respectively.
Also, it does not seem to be explained by greater uncertainty, as implied volatilities were
stable at around 12% in annual terms. Higher turnover may instead have stemmed from
investors turning marginally more risk-averse. Estimates of the coefficient of relative risk
aversion derived from equity index options tended to rise in the first quarter of 2005, after
declining through the previous year.
OTC derivatives, spanning the second half of 2004, show that at the end of the year
notional amounts of credit default swaps (CDSs) outstanding totaled $6.4 trillion, of which
$2.7 trillion represented contracts between reporting dealers. A single-name CDS contract is
an insurance contract covering the risk that a specified credit defaults. Following a defined
credit event, the protection buyer received a payment form the protection seller to compensate
for credit losses.
In return, the protection buyer pays a premium to the protection seller over the life of
the contract. In aggregate, positions in the global OTC derivatives market recorded a robust
expansion in the second half of 2004. Overall amounts outstanding were up by 12.8%, to
$248 trillion at the end of December. The growth in the latter half of the year was slightly
higher than in the first six months, when positions had risen by 11.6%. After falling by 20%
in the previous two surveys, gross market values increased by 43%, to $9.1 trillion as of end-
December, 2004. Even after taking account of legally enforceable bilateral netting
agreements, the rate of expansion was still 40%, at $2.1 trillion.
Trading on the international derivatives exchanges was buoyant in the second quarter
of 2006. Combined turnover measured in notional amounts of interest rate, and currency
contracts increased by 13% to $484 trillion between April and June 2006, following a 24%
rise in the previous quarter. The high rate of growth in the first quarter had been caused by a
surge in activity in US money market derivatives, which reverted to a more normal pace in
the following three months.
Trading volumes rose in all risk categories. Activity in contracts on short-term interest
rates increased by 15%, while trading in derivatives on stock price indices and on government
bonds grew by a more moderate 6% and 5%, respectively. Turnover in futures and options on
foreign exchange increased by 21%, outpacing activity in the other risk categories. However,
with a turnover of merely $4.2 trillion, or less than 1% of total volume traded on the
international derivatives exchanges, the FX segment remains of limited importance as this
type of risk tends to be traded over the counter.
54

Trading volumes in the OTC derivatives market continued to expand at a rapid pace
between 2004 and 2007. Average daily turnover of interest rate and non-traditional foreign
exchange derivatives contracts reached $2,090 billion in April 2007, 71% higher than three
years before (see table). This corresponds to an annual compound rate of growth of 20%,
which is in line with the growth recorded since 1995.
Global OTC derivatives market by instrument 1
Average daily turnover in April, in billions of US dollars
Instrument 1998 2001 2004 2007
A. Foreign exchange instruments 97 67 140 291
Cross-currency swaps 10 7 21 80
Options 87 60 117 212
Other 0 0 2 0
B. Interest rate instruments 2 265 489 1025 1686
FRAs 74 129 233 258
Swaps 155 331 6211 210
Options 36 29 171 215
Other 0 0 0 1
C. Estimated gaps in reporting 13 19 55 113
D. Total 375 575 1220 2090
1. Adjusted for local and cross-border double-counting. 2 Single currency interest rate
contracts only.
Growth was particularly strong in the FX segment, where average daily turnover in
cross currency swaps and foreign exchange options increased by 108% to $292 billion in
April 2007, thus outstripping growth in “traditional” instruments such as spot, forward and
FX swap contracts (71%). While options remained the main “nontraditional” FX instrument
in the OTC market, accounting for slightly less than three quarters of total turnover, the
instrument with the fastest rate of growth (279%) was actually cross- currency swaps, whose
turnover increased to $80 billion. In part, this growth could be explained by the hedging of
foreign currency bonds. April 2007 saw a large issuance of dollar-denominated bonds by non-
resident issuers, some of whom may have hedged their obligations in the swap market.
More moderate growth than in FX contracts was recorded in the interest rate segment,
where average daily turnover increased by 65% to $1,686 billion. The euro remained the
leading currency in this segment, although the gap vis-à-vis the US dollar narrowed. In
55

the reporting period, 39% of turnover took place in euro-denominated contracts, and 32% in
dollar. However, their combined share has fallen by nearly 10 percentage points since 2004,
as turnover growth in several non-core markets has outstripped that in the two leading
currencies. For example, average daily trading volumes of sterling-denominated interest rate
derivatives increased by 91%, compared to rates of growth of 42% and 53%, respectively, in
the euro and the dollar. Turnover in contracts denominated in the yen
almosripledringinhaurrency’hare in totaurnover tver 8%, from 4.5% three years before. To some extent, rapid growth in the yen market reflects a catching-up since for
many years activity in that market had been hampered by low and stable interest rates. Rates
had remained at virtually zero for more than five years, which had contributed to a dearth of
activity in derivatives on short-term Japanese interest rates. Futures turnover increased by
46% in the second quarter of 2006, while options volumes soared by 130%. This contrasts
with the mid-1990s, when contracts denominated in yen briefly accounted for over one fifth
of worldwide turnover in exchange-traded money market derivatives.
Activity was also buoyant in some smaller currencies but more muted in the US dollar
and the euro. Rapid increases in turnover during the second quarter of 2006 were also
recorded in contracts on short-term Australian interest rates (44%), followed by derivatives on
rates in the New Zealand dollar (28%), pound sterling (26%) and Canadian dollar (22%).
Trading volumes in futures and options on short-term US dollar and euro interest rates grew
by a more moderate 13% each.
Heavy trading during the sell-off in May and June 2006 lifted turnover in stock index
contracts to a new high. Turnover measured by notional amounts reached $46 trillion between
April and June, 6% higher than in the first quarter of this year. In contrast to the preceding
three months, the rise in activity was genuine and not merely the result of valuation effects.
Turnover growth in stock index contracts was particularly strong in some English-speaking
countries, above all Canada (47%), the United States, the United Kingdom and Australia (all
19%). Rapid growth was also recorded in contracts on Swedish equity indices (18%). Trading
in euro-denominated contracts rose by almost one third in terms of the number of contracts
traded, but increased by only 8% in terms of notional amounts. Weaker activity was recorded
in Korea, where trading in stock index contracts declined by 11% in terms of both the number
of contracts and notional amounts.
Sharp movements in the US exchange rate led to a 23% rise in turnover in futures and
options on foreign exchange in the second quarter. Trading volumes in euro FX contracts
listed on the Chicago Mercantile Exchange reached $750 billion in May alone. During the
quarter as a whole, activity in this contract rose by almotone third, while turnover in yen
derivatives was up 23%. Jointly these two contracts account for more than one half of
56

worldwide turnover in exchange-traded currency derivatives. Even more rapid growth was
recorded in some emerging markets, for example in Russia (82%) and Korea (67%), even
though the two currencies concerned did not experience any extraordinary volatility in the
period under review. Turnover in Turkey increased by 172%, albeit from a low base. The
Turkish lira was affected particularly strongly by the sell-off in May and June.
The number of commodity contracts traded on the international derivatives exchanges
(notional amounts are not available) grew by 10% in the second quarter. In the previous three
months, activity had increased by 18%, mainly reflecting a 37% surge in activity in energy
derivatives as oil prices had reached new highs. Trading in that product category continued to
expand in the second quarter, in line with further price increases, but growth slowed to 8%.
Turnover in contracts on agricultural commodities rose by 10% and that in derivatives on
base metals by 7%.
Rapid growth (21%) was recorded in the precious metals segment of the commodity
derivatives market. Turnover in futures and options on gold soared to over 6,000 contracts
(measured in 100 ounce contract equivalents to account for a shift towards smaller-sized
contracts) in May alone. This was more than one fifth above the previous monthly high in late
2005. In June, turnover in gold contracts declined to 4,700. The monthly pattern of turnover
in gold contracts contrasts with that of contracts on silver or non-precious metals, which
peaked in April and subsequently declined. This is puzzling because price developments were
largely similar.
Credit Default SWAPS
At the end of 2004 the notional amounts outstanding of CDSs totaled $6.4 trillion,
nearly 50% more than the size of the market for equity index-related products but still
significantly less than that of interest rate or exchange rate-related products ($187 trillion and
$30 trillion, respectively). Despite its relatively small size, the development of the CDS
market has been so far quite exceptional, compared to what has been observed for other risk
categories. The growth Of Credit-related derivatives in the three years ending June 2004
amounted to 568%, against 121% for all OTC products.
Of the $6.4 trillion of notional amounts outstanding, $2.7 trillion concerned contracts
between reporting dealers. For both protection bought and protection sold, over 800% of the
outstanding contracts between reporting dealers and non-dealers were with non reporting
financial institutions. In terms of maturity of outstanding contracts, more than 70% of the
single-name contracts had a maturity between one and five years, close to the corresponding
number for multi-name contracts (60%).
57

Dealers bought net protection from non-dealers amounting to $178 billion, of which
$149 billion was with non-reporting financial institutions. Nearly two thirds of these latter
contracts were multi-name. The net market value of all outstanding contracts wall $4 billion,
with $89 billion in contracts with a gross positive market value and $93 billion in contracts
with a negative market value.
Looking forward, the growth of credit derivatives could be further boosted by the
recent launch of a credit derivatives fixing, relating to the ilraxx family of CDS indices. The
availability of a fixing will produce a widely supported reference and settlement tool for the
credit derivatives market. It will reassure investors that the prices quoted by individual traders
are close to the market-wide consensus prices (much in the same way as Libor rates support
the pricing of interest rate swaps), thereby enhancing transparency, and consequently
volumes, of CDSs and cash-settled credit-related options.
Sizeable Increase in Gross Market Values
Gross market values jumped significantly, by 43%, in the second half of 2004, to $9
trillion Interest rate contracts, which represent the largest OTC segment, were up by 34%, to
$5.3 trillion. The increase was quite small for dollar-related products, only 3%, to $1.5
trillion, but amounted to 65% and 26% for euro-and sterling-related products, to $2.9 trillion
and $237 billion respectively. The surge in gross market values was particularly strong for
foreign exchange products, 80%, to $1.6 trillion, and for equity-related products, 70%, to $0.5
trillion.
Compared to interest rate products, both segments are, however, smaller components
of the overall derivatives market. Across all risk categories, the ratio of gross market values to
notional amounts outstanding went up from 2.9% as of end- June 2004 to 3.7% as of year-
end. Taking account of legally enforceable bilateral netting agreements does not bring down
the expansion in gross market values. Nevertheless, gross market values -thus calculated -
increased only marginally (from 0.7% to 0.8%) as a ratio to overall notional amounts.
Growth in OTC markets was not matched on exchanges. The 12.8% rise in business in
OTC markets in the second half coincided with a drop in activity, of 11.8%, on the
exchanges.
When comparing activity in the exchange-traded and OTC segments, it is important to
recall that notional amounts outstanding in the OTC market should tend to grow faster, since
hedging or trading in this segment generally involves the writing of new contracts, which
leads to a natural build-up of notional amounts outstanding. Hence, the gap in the
58

development of no amounts outstanding between the two markets has become particularly
sizeable since mid-2003 between end-June 2003 and end-December 2004, amounts
outstanding grew by 46% in OTC markets, against 22% in exchanges. By contrast, over the
previous 18-month period, both segments had grown by approximately 55%.
Derivatives Market India
The most notable development concerning the secondary segment of the Indian capital
market is the introduction of derivatives trading in June 2000. SEBI approved derivatives
trading based on Futures Contracts at both BSE and NSE in accordance with the
rules/byelaws and regulations of the Stock Exchanges. A beginning with equity derivatives
has been made with the introduction of stock index futures by BSE and NSE. Stock Index
Futures contract allows for the buying and selling of the particular stock index for a specified
price at a specified future date.
Stock Index Futures, inter alia, help in overcoming the problem of asymmetries in
information. Information asymmetry is mainly a problem in individual stocks as it is unlikely
that a trader has market-wide private information. As such, the asymmetric information
component is not likely to be present in a basket of stocks. This provides another rationale for
trading in Stock Index Futures.
Also, trading in index derivatives involves low transaction cost in comparison with
trading in underlying individual stocks comparing the index. While the BSI’ introduced Stock
Index Futures for S&P CNX Nifty comprising 50 scripts. Stock Index Futures in India are
available with one month, two month and three month maturities While derivatives trading
based on the Sensitive Index (Sensex) commenced at the BSI on June 9, 2000,.,derivatives
trading based on S&P CNX Nifty commenced at the NSE on June 12, 2000. SIT is the first
attempt in the development of derivatives trading.
The product base has been increased to include trading in futures arid options on S&P
CNX Nifty Index, futures and options on CNX IT index, Bank Nifty Index and single
securities (118 stock as stipulated by SEBI) and futures on interest rate.
The index futures and index options contracts traded on NSE are based on S&P CNX
Nifty Index, CNX IT Index and the CNX Bank Index, while stock futures and options are
based on individual securities. Stock Futures and Options are available on 118 securities.
Interest rate future contracts are available on Notional 91 day t-bill and Notional 10 year
bonds (6% coupon bearing and zero coupon bond). While the index options are European
style, stock options arc American style.
59

At any point of time there are only three contract months available for trading, with 1
month, 2 months and 3 months to expiry. These contracts expire on last Thursday of the
month and have a maximum of 3-month expiration cycle. A new contract is introduced on the
next trading day following the expiry of the near month contract. All the derivatives contracts
are presently cash settled. The turnover in the derivatives segment has witnessed considerable
growth since inception.
In the global market, NSE ranks first (1st) in terms of number of contracts traded in
the Single Stock Futures, second (2nd) in Asia in terms of number of contracts traded in
equity derivatives instrument. Since inception, NSE established itself as the sole market
leader in this segment in the country with more than 99.5% market share.
Summary
In this chapter, first we have taken a look at the basics of derivatives. Derivatives are
the instruments which derive their value from the underlying assets. The underlying assets
can be commodity, currency, stock, stock index, interest rate bearing securities, etc. Financial
derivatives are forward, futures, option, swaps and other exotic derivatives. Forward is a
specific contract between two parties who agree to trade at some future date, at a stated price
and quantity. No money exchange hands at the time the deal is signed. Futures are the
standardized contract traded on the futures exchanges to buy or sell assets at a specified future
date and at a specified rate. Options are the right to buy or sell any assets at a rate (strike
price) at a specified future date, but not obligation for the buyer. Options are of two types: call
option and put option. The chapter has described the history and phenomenal growth in
financial derivatives and kinds of futures contracts that are traded. In 1848, futures contracts
came into existence with the establishment of Chicago Board of trade. Option was traded at
Chicago Board options market in 1977.
In addition, this chapter also discusses the other derivatives like warrants and
convertibles. Warrants are like an option contract where the holder has the right to buy shares
of a specified company during the given period. Convertibles are the hybrid securities which
combine the basic attributes of fixed interest and variable return securities, popular among
them are convertible bonds, debentures, preference shares, etc. Finally, the chapter concluded
with the classification of derivatives. Derivatives are classified as financials and commodities
as major categorization. Financials can be further divided into basics and complex
derivatives. Basic includes forwards, futures options and warrants and convertible securities,
whereas complex involves swaps and exotics derivatives. The chapter also discussed about
the ten myths of financial derivatives because financial derivatives have changed the face of
finance by creating new ways to understand measure and manage risks.
60

Ultimatelinanciaivatives should be conearnirm’isanagement
strategy to ensure that value enhancing investment opportunities are pursued.
These myths include:
1. Derivatives are new complex, high tech. financial products,
2. Derivatives are purely speculative and highly leveraged instruments,
3. Financial derivatives are simply the latest risk associated with derivatives, banking
regulators should ban their use by any institution covered by federal deposit insurance,
4. Only large multinational corporations and large banks have a purpose for using
derivatives,
5. Financial derivatives are simply the latest risk-management fad and 6. Derivatives take
money out of productive processes and never put anything back.
Solved Problems
1. An investor enters into a short gold futures contract when the futures price is 60 cent per
pound. One contract is for delivery of 60,000 pounds. How much the investor gain or lose
if cotton price at the end of the contract is: (a) 58.20 cent per pound (b) 61 30 cent per
pound?
Solution
(a) In case of price £58.20
Investor is obligated to sell 60 cent per pound, something that is worth 58.20 cent per
pound. So there is a gain to investor per pound. So there is a gain to investor
Gain= (£0.6000 - £0.5820)x 60,000 = £1080
(b) In case of price £61.30
The investor is obligated to sell for 60 cent per pound, something that is worth 61.30
cent per pound. So there is net loss to investor.
Loss= (£0.6 130 - £0.6000) x 60,000 = £780
61

2. Suppose an investor write a put (selling a put) on stock with a strike price of ` 50 and
expiration date in three months. The current price of BILT stock is ` 51. What you
committed to yourself? How much could you gain or loss?
Solution
You have sold a put option. You have agreed to buy 100 BILT shares for ` 50 per
share. If party on other side charge to exercise. The option will only be exercised by counter
party is price of BILT share is below ` 50. Suppose party exercise when price is ` 30. You
have to buy at ` 50 that are worth only ` 30, so loss to investor or writer will be ` 20 per share
or ` 2000.
The worst that can happen is that the price of BILT decline to zero during the three-
month period. The highly unlikely event would cost you ` 5000. In return for the possible
future closed, you receive the premium amount from the buyer of option.
3. The current stock price is ` 49 and a three-month call with a stock price 50, losing ` 3.90
(premium amount). You have ` 9800 to invest. Identify two alternative strategies. Briefly
outline advantages and disadvantages of each?
Solution
Strategy
(a) First strategy would be to buy 300 shares.
(b) Second strategy would be to buy 3000 shares.
If share price goes upward movement, the second (b) strategy will give rise to greater
gains. For example, if share price goes up to ` 60 you gain = [3000 x (` 60— ` 50)] - ` 11700 = ` 18,300 (` 11,700 as premium amount) and from first strategy [300 x (` 60— ` 49)] ` 3300
from strategy (a).
However, if price of shares goes down to ` 45, the loss on second strategy will be less
as compared to strategy second.
Strategy (a) Loss = 300x (` 49 — ` 45) = ` 1200
Strategy (b) Loss = 3000x (` 50— ` 45) = ` 1500
Or whole investment will gone in loses.
62
4. An investor own 10,000 shares worth ` 50 each. How put options can be used to provide
insurance against decline in value of investor holding?
Solution
Investor should buy 100 put option contract with a exercise/strike price of ` 50 each and
expiration date of four months. If at the end of fourth month, the share price goes less than ` 50, investor should exercise the option and sell the share at ` 50 each. In this way, investor
can hedge risk of fall in price of stock.
5. A speculator based in USA who in February 2003 thinks that pound sterling will strengthen
in next two months. How can we use futures contract for speculating? What can be
alternatives strategies for speculator? The future price is $1.6420 (per pound). Total
amount of speculation is $3,75,000.
Solution
Alternatives:
(i) Speculator purchase of 3,75,000 in the hope that it can be sold later at a profit. The
sterling once purchased will be kept in a interest bearing account.
(ii) Take a long position in six 1MM (International Monetary Market) April futures
contract on pound sterling. [value of each contract is £62,500]
Outcomes
(i) Exchange rate $1.7000 in two months. Investor will earn = ($6,37,500— $6, 18,000)
= $19,500 by using alternative (i) and ($6,37,500 —$6, 15,750) = $21,750.
(ii) Exchange rate $1.6000 in two months. Loss to speculator ($6,00,000 —$6,
18,000) $18,000 by using alternative (i) and ($6,00,000 —$6, 15,750) = $15,750
by using alternative (ii).
6. Differentiate between
(a) Entering in along futures contract when the future price is ` 500.
(b) Taking along position in call option with a strike price of ` 500.
63

Solution
In case of (a) investor is obligated to buy at ` 500 [because future have obligation to buy or
sell.
In case of (b) investor has the option to buy at ` 500 [options have right for buyer not
obligation to buy or sell.
7. Suppose an investor has written 200 futures contract on silver. How can he use call options
to provide insurance against a decline in value of net position?
Solution
Investor has written 20 futures contract, means he is obligated to sell at a specified future
price. Investor can use call option to provide insurance against a decline in value. He can
write a call option and can lock into a predetermined future price, which he believes to be
right. On expiration he can sold his share to option buyer at a price if prices goes below the
specified level.
8. A farmer expects to have ` 50,000 of live hogs to sell in three months. The live hogs futures
contract on Multi Commodity Exchange (MCX) is for delivery of ` 25,000 of hogs. How
can the farmer use futures for the hedging?
Solution
Farmer expects to have ` 5000 hogs at a future date. He can use futures for hedging in the way
that today in MCX. He will take short position on two futures contracts of live hogs. So he
can hedge risk by taking a short position at a specified future price. On the due date he can
deliver the live hogs or close out position by offsetting or reverse trading.
Self Assessment Questions
1. Explain therfinanciaivative’harportaneatur
2. Explain the different types of financial derivatives along with their features in brief.
3. Bring out the historical development of financial derivatives.
4. What are warrants and convertible securities? Also explain the critiques of derivatives
with suitable examples.
5. Compare and contrast between forward, futures, options and swaps.
64

6. Write short notes on:
a. Forward contracting
b. Swaps and their features
c. Options and their types
7. Write a detailed note on uses of financial derivatives.
8. Define the forward contract. Also discuss the features of forward contract.
9. Compare and contrast between forward contracts and futures contracts with suitable
examples.
10. Write a detailed note on classification of forward contracts with examples.
11. Define forward contract and discuss the trading mechanism of forward market.
****
65

66
Unit - II
Unit Structure
Lesson 2.1 - Basics of Options
Lesson 2.2 - Fundamentaeterants option’r
Lesson 2.3 - Options Trading Strategies
Lesson 2.4 - Interest rate SWAPS
Lesson 2.5 - Currency SWAPS
Learning Objectives
This chapter is aimed at providing an understanding of
➢➢ Basic concept of options ➢➢ Terminology used in describing options
➢➢ Call and put options, and their payoffs
➢➢ Types of options
➢➢ What is meant by money nests of options
➢➢ How to read options quotations
➢➢ How options are traded and settled
➢➢ How are options different from forward and futures contracts
➢➢ Understand the basic concept of swaps
➢➢ Understand why and how swaps evolved
➢➢ Be able to distinguish between different types of interest rates and currency swaps
➢➢ Be able to familiarize with the terminology of swap
➢➢ Know how to hedge interest rate risk and exchange rate risk through swaps
➢➢ See swap as a tool of reducing financing cost besides hedging tool
➢➢ Know how to value swap as pair of bonds and/or as series of forward contracts.
➢➢ Appreciate the roles of intermediary to a swap deal
67
Lesson 2.1 Basics of Options
Introduction
An option is a unique instrument that confers a right without an obligation to buy or
sell another asset, called the underlying asset. Like forwards and futures it is a derivative
instrument because the value of the right so conferred would depend on the price of the
underlying asset. As such options derive their values inter alia from the price of the
underlying asset. For easier comprehension of the concept of an option, an example from the
stocks as underlying asset is most apt.
Consider an option on the share of a firm, say ITC Ltd. It would confer a right to the
holder to either buy or sell a share of ITC. Naturally, this right would be available at a price,
which in turn is derived from the price of the share of ITC? Hence, an option on ITC would
be priced according to the price of ITC shares prevailing in the market. Of course this right
can be made available at a specific predetermined price and remains valid for a certain period
of time rather than extending indefinitely in time.
The unique feature of an option is that while it confers the right to buy or sell the
underlying asset, the holder is not obligated to perform. The holder of the option can force the
counterparty to honors the commitment made. Obligations of the holder would arise only
when he decides to exercise the right. Therefore, an option may be defined as a contract that
gives the owner the right but no obligation to buy or sell at a predetermined price within a
given time frame. It is the absence of obligation to perform for one of the parties that makes
the option contract a substantially different derivative product from forwards and futures,
where there is equal and binding obligation on both the parties to the contract. This unique
feature of an option makes several applications possible that may not be feasible with other
derivative products.
Terminology of Options
Before we discuss how an option contract works it would be useful to familiarize with
the basic terms that are often used in describing and using options. These basic terms are
described below.
68

Call Option
A right to BUY the underlying asset at predetermined price within specified interval
of time is called a CALL option.
Put Option
A right to SELL the underlying asset at predetermined price within a specified interval
of time is called a PUT option.
Buyer or Holder
The person who obtains the right to buy or sell but has no obligation to perform is
called the owner/holder of the option. One who buys an option has to pay a premium to obtain
the right.
Writer or Seller
One who confers the right and undertakes the obligation to the holder is called
seller/writer of an option.
Premium
While conferring a right to the holder, who is under no obligation to perform, the
writer is entitled to charge a fee upfront. This upfront amount is called the premium. This is
paid by the holder to the writer and is also called the price of the option.
Strike Price
The predetermined price at the time of buying/writing of an option at which it can be
exercised is called the strike price. It is the price at which the holder of an option buys/ sells
the asset.
Strike Date/Maturity Date
The right to exercise the option is valid for a limited period of time. The latest time
when the option can be exercised is called the time to maturity. It is also referred to as
expiry/maturity date.
69

These terms would become clearer when the two basic options, call and put are described in
detail.
Call Option
Assume that share of ITC is currently trading at ` 180. An investor, John, believes that
share is going to rise at least to ` 220 in the immediate future of the next three months. John
does not have adequate funds to buy the shares now but is expecting to receive substantial
money in the next three months. He cannot afford to miss an opportunity to own this share.
Waiting for three months implies not only a greater outlay at a later point of time, but also
means foregoing of substantial potential gains. Another investor, Mohammad, holds contrary
views and believes that optimism of John is exaggerated. He is willing to sell the share.
What can John do under these circumstances where he cannot buy the shares on an
outright basis now? He possibly could borrow to acquire the stock of ITC. This is fraught
with risk of falling prices. Amongst the many alternatives that may be available to John is
included an instrument called call option. He can instead buy a call option from Mohammad
(assuming he is willing to confer the same) stating that John has a right to buy a share of ITC
from Mohammad at a price of, say, ` 190 at any time during the next three months. This
would be a call option (the option to buy). John is the holder of the option, while Mohammad
is the writer/seller of the option. In case John decides to buy the share (exercise the option) he
would pay ` 190, the strike/ exercise price. The period up to which John can exercise this
option is three months. Note that John has the option, which he may not exercise, but
Mohammad has no such choice and he stands committed to deliver the share and receive `
190 from John, irrespective of the price of ITC share at that time. Naturally, Mohammad
would not provide such a right for free as he is obligated to perform at the option of another.
Therefore, Mohammad would charge some fee, called option premium, to grant this right to
John. This premium is determined inter alia by the price of the underlying asset, the ITC
share. We shall discuss later how this premium is decided.
We now discuss the circumstances when John would exercise his option. He would
use this right only when the actual price of the ITC share has gone beyond ` 190 (the exercise
price). Imagine it has moved to ` 200. By exercising the option he stands to gain immediately ` 10, as he gets one share from Mohammad by paying ` 190 and sells immediately in the
market at ` 200. Logically, John would not exercise the option if the price remained below ` 190. In any case he loses the premium paid. If the price remains below ` 190, Mohammad
would not be asked to deliver and the upfront premium he received would be his profit.
70

We may generalize the outcome of a call option in the following manner.
As long as the price of the underlying asset, S, remains below the strike price, X the
buyer of the call option will not exercise it; and the loss of the buyer would be limited to the
premium paid on the call option c and if the price is more than exercise price the holder
exercises the option and generates profit equal to the difference of the two prices.
Alternatively,
When S <X Buyer lets the call expire Loss = premium c
S=X Buyer is indifferent Loss = premium c
S>X Buyer exercises the call option Gain = S- X— c
Mathematically, the value of the call is given by Equation (2.1)
Value of the call option = Max (0, S— X) - c (2.1)
A graphical depiction of the payoff of the holder and the writer of the call option is
easier to comprehend and is presented in Figure
Put Option
Put option is similar to call option except the fact that it is an option to sell. Again we
take a small example from stock markets to clarify how put option works.
Again assume that share of ITC is currently trading at ` 180. An investor, John, in
possession of the share (it is not necessary to have the share to enter into an options contract)
believes that the share is likely to fall to ` 150 in the immediate future of the next three
months. John is not sure of the fall but would like to exit from his investment at ` 175.
71

He is seeking protection against the heavy fall in the price. Another investor, Mohammad,
holding contrary views believes that the pessimism of John is exaggerated. He is willing to
buy the share at ` 175 since he feels that is the lowest it can go.
John believes ITC is a good long-term buy but is unsure when the scrip would show
its potential. He does not want to exit unnecessarily. Under these circumstances John can buy
a put option (the right to se4 to Mohammad stating that he has a right to sell a share of ITC to
at a price of ` 175 at any time during the next three months. In case John decides to sell the
share (exercise the option) he would receive ` 175, the strike/exercise price in the next three
months. John has the option, which he may or may not exercise, but Mohammad has no such
choice and he stands committed to pay the agreed price and claim the share. Like in the call
option, Mohammad would not grant such a right for free and charge some fee, called option
premium. This premium is determined inter alia by the price of the underlying asset, the ITC
share.
John would exercise his option only when it is profitable to do so. The option would
become profitable when the actual price of the ITC share falls below ` 175 (the exercise
price). Imagine that it has moved to ` 160. By exercising the option John stands to gain
immediately ` 15 by placing the share to Mohammad and realize ` 175 from him and using the
proceeds to acquire a share of ITC from the market at ` 160. This keeps his earlier position
intact and yet gives ` 15 as profit. Logically, John would not exercise the option if the price
remains above ` 175. However, under all circumstances he loses the premium paid.
We may generalize the outcome of a put option in the following manner.
As long as the price of the security remains below the strike price the buyer of the
option will exercise it because he stands to gain; otherwise his loss would be limited to the
premium paid on the put option p.
When S< X Buyer exercises the option Gain= X— S—p
When S= X Buyer is indifferent Loss = premium, p
When S> X Buyer lets the contract expire Loss = premium, p
Mathematically, the value of the put is given by Equation2.2.
Value of the put option = Max (0, X— S) – p (2.2)
The graphical view of the payoff for put option, holder and writer is shown in Figure
(a) and (b).
72

The payoff diagrams for call and put options as depicted in Figures and respectively,
reveal that the payoff of options is not linear. While it may be unbounded at one end the other
end is limited to loss/gain equal to the premium of option. This non-symmetrical non-ear
payoff resulfrom feature of ‘right but no obligation’ and makes options ferent from other
derivative products.
Types of Options
Options have several features, certainly more than forwards and futures making
several differentiations possible in the basis products of calls and puts. Based on several
considerations the options can be categorized in a number of ways, such as:
➢➢ Based on nature of exercise of options ➢➢ Based on how are they generated, traded, and settled
➢➢ Based on the underlying asset on which options are created
Nature of Exercise: American Versus European
Based on the timing of exercise the options can be either American or European.
American options can be exercised at any point of time before the expiry date of the option,
while European options are exercisable only upon maturity.
Nature of Markets: OTC Versus Exchange Traded
Options can also be categorized as OTC or exchange traded depending upon where
and how they are created, traded, and settled. Options may be like it forward contracts, which
are specific and negotiated by two contracting parties mutually with direct negotiations,
known as OTC, or they can be like futures which may be bought and sold on the specific
exchanges where the two contracting parties may not be known to each other but instead
73

enter into a contract on the floor/screen of an exchange. In the exchange-traded options the
contracts need to be standardized, while an OTC product is tailor-made to the requirements of
the parties concerned.
The standardization of option contract would be in at the discretion of the exchange
and is done in terms of Quantity of Underlying Asset Only specific quantity of the underlying
asset could be traded on the exchange and need to be predetermined.
Strike Prices
Only specific strike prices can be handled in a standardized product traded on the
exchanges. OTC products can have any strike price as agreed by the two contracting parties.
Expiration Dates
Like strike price the expiration dates too must be known before trading can take place
in options at the exchanges.
Nature of Exercise of Option Whether the options are American or European in nature
too must be known to traders in options.
Ways of Settlement
Options can be settled either by delivery of underlying asset or by cash settlement,
which is closing out by exchanging the differential of price at initiation and closing out. Cash
settlement at the expiry is done by exchanging difference between the exercise price and price
of the underlying asset. It can also be settled by the cancellation of the contract by entering
into an equal and opposite contract to the original one.
Nature of Underlying Assets
Like forwards and futures, options too can have any asset as underlying. Options on
stocks, indices, commodities, currencies, and interest rates are available either OTC or on
exchanges. Though not available in India as of now, options on commodities are traded
internationally on agricultural products, live stock, food products, energy, and metals.
Options are also available on various currencies, such as US dollar, euro, yen, pound,
etc. in major exchanges in the USA and Europe as also other parts of the world. Options on
currencies are mostly OTC.
74
Besides, options are also traded on the exchanges on futures contracts rates. Options
on futures have futures contract as underlying asset, which give the buyer a right to buy (call)
or sell (put) the specified futures contract within or at specified time. Naturally, the expiry of
the futures contract must extend beyond that of option contract.
Similarly, options can also be traded on interest rates, either on cash assets such as
treasury bonds and notes, or on interest rate futures contracts. These options serve the same
purposes as do the options on stocks and indices.
Options on stocks and stock indices are most common. Several exchanges across the
world offer options on indices and stock. National Stock Exchange (NSE) in India offers
options on several indices such as Nifty, a broad-based index of 50 stocks from banking,
information technology, infrastructure, etc.
Presently these options cover limited exercise prices and cover periods up to three
months. However, internationally options for longer periods of up to two to three years are
also available. NSE attempts to provide minimum j five strike prices—two ITM, one ATM,
and two OTM at any point of time).
Naked (Uncovered) and Covered Option
Naked or uncovered options are those which do not have offsetting positions, and
therefore, are more risky. On the other hand, where the writer has corresponding offsetting
position in the asset underlying (he option is called covered option. Writing a simple
uncovered (or naked) call option indicates toward exposure of the option writer to unlimited
potential losses. The basic aim is to earn the premium. In period of stable or declining prices,
call option writing may result in attractive profits by capturing the time value optiotrategriting
uncoverealleflects an investor’ectations and tolerance for risk.
A covered option position involves the purchase or sale of an option in combination
with an offsetting (or opposite) position in the asset which underlies the option. As observed
earlier, the writer of the call option incurs losses when stock prices rise, and put writers incur
losses when prices fall. In such situation, the writer can cover the short put with a short
position and short call with a long position in the underlying asset. This can be stated as:
Covered call sale = Short call + Long futures
Covered put sale = Short put + Short futures
75

The Underlying Assets in Exchange-Traded Options
Various assets, which are actively traded on the recognized exchanges, are stocks,
stock indices, foreign currencies and futures contracts. These have been explained in brief
here as under:
Stock Options
Options on individual shares of common stock have been traded for many years.
Trading on standardized call options on equity shares started in 1973 on CBOE whereas on
put options began in 1977. Stock options on a number of over-the-counter stocks are also
available. While strike prices are not because of cash dividends paid to common stock
holders, the strike price is adjusted for stock splits, stock dividends, reorganization,
recapitalizations, etc. which affect the value of the underlying stock.
Stock options are most popular assets, which are traded on various exchanges all over
the world. For example, more than 500 stocks are traded in United States. One contract gives
the holder the right to buy or sell 100 shares at the specified strike price. In India, the National
Stock Exchange and Bombay Stock Exchange have started option trading in certain stocks
from the year 2001.
Foreign Currency Options
Foreign currency is another important asset, which is traded on various exchanges.
One among these is the Philadelphia Stock Exchange. It offers both European as well as
American option contracts. Major currencies which are traded in the option markets are US
dollar, Australian dollar, British pound, Canadian dollar, German mark, French franc,
Japanese yen, Swiss franc, etc. The size of the contract differs currency to currency. This has
been explained in more detail in the chapter on currency option.
Index Options
Many different index options are currently traded on different exchanges in different
countries. For example, the S&P 100 index at CBOE and Major Market Index at AMEX are
traded in the US options markets. Similarly, in India, such index options have been started
oationatocxchangnombatocxchangeiktocptioption’s
strike price is the index value at which the buyer of the option can buy or sell the underlying
stock index. The strike index is converted into dollar (rupee) value by multiplying the strike
index by the multiple for the contract. If the buyer of the stock index option intends to
76

exercise the option then the stock must be delivered. It would be complicated to settle a stock
index option by delivering all the stocks that make up that particular index. Hence, instead,
stock index options are cash settlement contracts. In other words, if the option is exercised,
the exchange assigned option writer pays cash to the option buyer, and there will be no
delivery of any share.
The money value of the stock index underlying an index option is equal to the current
cash index value multiplied by the contracts multiple. This is calculated as:
Rupee value of the underlying index = Cash index value x Contract multiples
For example, the contract multiple for the S&P 100 is $100. So, assume, the cash
index value for the S&P 100 is 750 then the dollar value of the S&P 100 contracts is 750x 100
= $75,000.
Futures Options
In a futures option (or options on futures), the underlying asset is a futures contract.
An option contract on futures contract gives the buyer the rights to buy from or sell to the
writer a specified future contract at a designated price at a time during the life of the options.
If the futures option is a call option, the buyer has the right to acquire a long futures position.
Similarly, a put option on a futures contract grants the buyer the right to sell one
particular future contracts to the writer at the exercise price. It is observed that the futures
contract normally matures shortly after the expiration of the option. Futures options are now
available for most of the assets on which futures contracts are on the Euro dollar at CME and
the Treasury bond at the CBOT.
Interest Rate Options
They are another important options contract, which are popular in the international
financial markets. Interest rate options can be written on cash instruments or futures. There
are various debt instruments, which are used as underlying instruments for interest rate
options on different exchanges. These contracts are referred to as options on physicals.
Recently, these interest rate options have also gained popularity on the over-the-counter
markets like on treasury bonds, agency debentures and mortgagebacked-securities. There are
governments, large banking firms and mortgage-backed-securities dealers who make a market
in such options on specific securities.
77

Leaps Options
These options contracts are created for a longer period. The longest time before
expiration for a standard exchange traded option is six-months. However, Long Term Equity
Anticipated Securities (LEAPS) are option contracts designed to offer with longer period
maturities even up to 39 months. These LEAPS options are available on individual stocks and
some indexes. Usually, they are designed for a particular purpose.
Flex Options
It is a specific type of option contract where some terms of the option have been
customized. The basic objective of customization of some terms is to meet the wide range of
portfolio strategy needs of the institutional investors that cannot be satisfied through the
standard exchange-traded options. FLEX options can be created for individual stocks, stock
indexes, treasury securities, etc. They are traded on an option exchange and cleared and
guaranteed by the clearing house of that exchange. The value of FLEX option depends upon
the ability to customize the terms on four dimensions, such as underlying asset, strike price,
expiration date and settlement style (i.e., American vs European). Moreover, the exchange
also provides a secondary market to offset or alter positions and an independent daily marking
of prices.
Exotic Options
The option contracts through the OTC market can be customized in any manner
desired by an institutional investor. For example, if a dealer can reasonably hedge the risk
associated with opposite side of the option sought, it will design an option as desired by the
customer. OTC options are not limited to only European or American type of options, rather a
particular option can be created with different exercise dates as well as the expiration date of
the option. Such options are also referred to as limited exercise options, Bermuda options,
Atlantic options, etc. Thus, more complex options created as per the needs of the
customerralled exotic optionaitferentioates, exercise prices, underlying assets, expiration date
and so on.
****
78

Lesson 2.2 - F’e
Aption’rffectey a vartors in thinanciaarkus
try to identify the important factors. To this end, let us start with what we know about an
option’rf intrinsic value anime valhaptntrinsic value
is the difference between its exercise price and the current price of the underlying asset, or
symbolically
IW = St - X
Where St is the spot price of the asset and X is the exercise price of the asset.
Therefore, one can see that the higher the spot price of the asset relative to the exercise prhher
(lowilall (put) option’s value becaushtrikremains
unchanged and as spot price movuphe intrinsic valgound henthe option’s
value will also go up. Consider the intrinsic value of a call option with an exercise price of `
100. As the spot price rises over ` 100, the intrinsic value increases, thereby also increasing
the option price. This can be noted from Table
Spot price and intrinsic value of a call option
Spot price
Intrinsic value (` )
90 0
95 0
100 0
105 5
110 10
115 15
120 20
125 25
So the first factor identified by us is the spot price of the underlying asset and as it
increashalption’rillso increasen contrashalption, a puption
will lose its value as the spot price increases. This makes sense since as the spot price rises,
the incentive for exercising the put option will come down and the holder will chose to allow
the put lapse.
79

The next part of the intrinsic value is defined by exercise price X. Now for a call
option, the lower the strike price, the more beneficial it is for the buyer and vice versa for a
put option. As options are struck at higher (lower) exercise prices, they will become lesser
(more) useful for the buyer to profit from the call (put) option. Consider two October call
options on Infosys - one with a strike price of ` 1620 and the other with a strike price of `
1740. If these two options are available, any buyer would like to pay the minimum possible
amount and consequently chooses the 1620 call over the 1740 call.
Therefore, the price of the call with a lower exercise price will be more than the call
with a higher exercise price. A similar logic (but in opposite direction) applies in the case of
put option, i.e., options at higher strikes will be preferred by put buyers since they can sell the
underlying stock at higher prices. The same can be observed from the real world prices of
options that are given in Table on the Infosys stock when the spot is trading at ` 1820.30.
Call option prices of on lnfosys (Oct. 26, 2004)
Exercise price Option price
1620 203.50
1650 170
1680 142
1710 110.95
1740 80.65
Theconarption’rhime value - given ahference between
option price and the intrinsic value. The time value is the amount that the buyers are willing
to pay for the possibility that the option may become profitable to exercise sometime before
expiration. In other words, option buyers believe that the price may be unattractive today but
price fluctuations in the future may make the option profitable. Therefore, longer the time to
expiry, the greater is the probability that at expiry the asset price will be significantly
ferenrohe exercisrnence higher wilhption’rs exactly reflected in the real world prices depicted
in Table
Time to expiry and option prices
Option details Option price
Infosys October I 770 call 53.70
Infosys November 1770 call 82.20
RIL October 580 call 0.50
RIL November 580 call 6.05
80

The greater the expected movement in the price (higher the volatility) of the
underlying asset, the greater the chance of the asset rising largely over (for a call) or below
(for a put) the exercise price at expiry which leads to profitable exercise and hence the more
valuable the option for its holder. This movement in the asset prices is termed as volatility.
One may wonder higher volatility may also work against the holder, i.e., higher volatility may
lead to a steeper fall (rise) in the underlying asset price but an option buyer need not worry
about this and it will not hurt him since he will not exercise the option to buy (sell) the
underlying asset.
To understand the role of volatility, consider the following example.
Assume that a stock is currently traded at ` 100 and a call option on this stock with a
strike price of ` 100. The payoff of this option is dependent on the price of the stock at expiry.
Consider that the stock can assume the prices as given in Table but the probability of the
stock assuming that value is dependent on its volatility.
Volatility and option prices
Current price Likely prices Call payoff Probability of Probability of
low volatility high volatility
80 0 0.10 0.30
90 0 0.20 0.10
100 100 0 0.40 0.20
110 10 0.20 0.10
120 20 0.10 0.30
Price of the call if volatility is low will be equal to:
0 x 0.10 + 0 x 0.20 + 0 x 0.40 + 10 x 0.20 + 20 x 0.10 = ` 4
Price of the call if volatility is high will he equal to:
0 x 0.30 + 0 x 0.10 -F 0 x 0.20 + 10 x 0.10 + 20 x 0.30 = ` 7
So it is clear from the above example that higher the volatility, higher will be the
option’r.
Interest rates will also affect the option prices but the role of interest rates in option
pricing is quite complex. Intuitively we can say that when an investor buys a call option
81

instead of the stock itself, he can save capital that can be invested in a risk-free asset.
Consequently, the higher the rate of interest, the higher will he the value of a call option.
Waarhe effecactohption’s value aivable.
Factor affecting option prices
Factor Call option’s value Put option’s value
Increaslyinsset’s value Increase Decreases
Increase in strike price Decrease Increases
Increases in variance of underlying asset Increases Increases
Increase in time to expiration Increases Increases
Increases in interest rates Increases Decreases
Increase in dividends paid Decreases Increases
Option Pricing Methods
After the seminal paper of Black and Scholes in 1973, several other methods of option pricing
were proposed in the literature. Although these methods differ in nuances, they are almost
similar in approach and these approaches can be classified under the following heads:
1. Game theory approach: A portfolio comprising an option and the stock is constructed
in such a wahahinal value ohortfos inenhtock’r,
which is the only cause for uncertainty. When this uncertainty is removed using risk-
neutral valuation and arbitrage arguments, the options price can be determined.
2. Replicating portfolio: In this method, a portfolio is constructed and this consists of the
stock and buying/selling a risk-free zero-coupon bond. The portfolio will be
constructed such that it mirrors the option payoffs for every state. Invoking the
arbitrage arguments, the option price is determined as equivalent to the value of the
replicating portfolio.
We will illustrate the second method with the help of Example 2.1:
Example 2.1
Consider a stock which is currently trading at ` 100 and in exactly one year, the stock price
will be either ` 80 or ` 120. We do not have any a priori probabilities. If the interest rate is
5%, what is the price of a call option on t-is stock with a strike price of ` 110 and expiry in
onear’ime?
82

Solution
Will construcepatinortfohat mimics thption’irayoffs
portfolio comprises a position in the underlying stock and a risk-free debt security. Now the
question is: what combination of stock and debt security generates the same returns as a call
option?
We know that at expiry the call will be worth ` 10 (120 - 110) if the stock goes up and
zero if the stock moves down.
Let us assume that we need to buy A number of shares and a zero-coupon bond of a
current value of B. The initial value of this portfolio will be:
Π0=∆.100+B (9.1)
The final value of the portfolio after one period will be:
Π1 = ∆. 120 + B x e0.05x1
If the stock goes up and
Π1 = ∆. 90 + B x e0.05x1
If the stock price goes down
Since the portfolio is mimicking the payoff of the call option, we can write the above
equation as:
∆. 120 + B x e0.05x1 = 10
∆. 90 + B x e0.05x1 = 0
And
If we substitute the value of B x e0.05x1 as -∆. 90 from equation (9.3) in equation (9.2),
we obtain ∆. 120 - ∆. 90 = 10 or ∆ = 1/3 and B = -28.54 (the negative sign shows that the
bond has to sold short).
Π0 = 1/3. ∆. 100 – 28.54 = 4.79
Wotuhption’rice?
83

The same approach that we used in this example lies at the heart of the Binomial
Option Pricing Model (BOPM), a rigorous and a powerful tool for pricing a wide variety of
options. John Cox, Stephen Ross and Mark Rubinstein introduced this model in an influential
paper published in the. Journal of Financial Economics.
Binomial Option Pricing Model
The binomial model of stock price movements is a discrete time model, i.e., time is
divided into discrete bits and only at these time points are stock prices modeled. The binomial
approach assumes that the security price obeys a binomial generating process, i.e., at every
point of time there are exactly two possible states - stock can move up or down. A priori it is
not known which of the two states will occur but the amount by which it can go up or down is
assumed as known. Figure shows a binomial tree.
Two – period binomial tree.
Let us unstanhinomiaree’eroy. Threicted in Figurs
a two- period binomial tree and the stock price changes two times. Each point where two lines
meet is termed as a node, which represents a possible future price of the stock. The tree is
called as binomial because the spot price at every node can either move up or down. If we
denote the stock price at the beginning as S0 and Su as the stock price in an up state and Sd as
the stock price in a down state, then we can define the up factor as Su/S0 and down factor as
Sd/S0. The probability that the stock price will move from one node to another is called as
transition probability. The binomial trees as given by Cox, Ross and Rubinstein, CRR here
after have some important characteristics, which are given below:
84

1. Length of the time interval remains constant throughout the tree, i.e., if the interval
between the nodes is in months, it will be months everywhere and if it is in terms of
years, it will years everywhere.
2. Volatility remains constant throughout the tree.
3. Transition probability remains the same in the entire tree.
4. The trees are recombining, i.e., an up move followed by a down move will take the
stock to the same value as a down move followed by an up move.
A Recombining Tree
Single Period Binomial Model
Assume that a stock price follows a binomial model and we are interested in finding
the price of a European option that expires at the end of one period.
As explained earlier in the numerical example, formulate a hedge portfolio that
exactly imitates the payoff of the call option in all the states. This hedge portfolio at to
comprises ∆ number of shares and a risk-less zero-coupon bond maturing to the par value B
by the time t1. Therefore, at time t0
Value of Portfolio ∆. S0 + e-rT. B (2.4)
Since this is a replicating portfolio, the value of the portfolio will be equal to C1, the
option’s valasoves und in castocrovwn.
85

At time T we can note that if the stock price moves up:
∆. Su + B = Cu (2.5)
and if the stock price moves down:
∆. Sd+ B = Cd (2.6)
By solving the above equations we can obtain B and A. From equation (2.5) we can
find that B = Cu - ∆. Su and now substitute this in equation (2.6) for B and solve we get
∆ =
Cu - Cd
and B =
Su - Sd
Su - Sd Su - S d
Now if we substitute the values of ∆ and B in equation (2.4) we obtain
C0 = Cu - Cd
. S0 + e-rT. SuCd - CuSd
Su - Sd
Su - Sd
Rearranging the terms, we get:
C0 = S o - e-rT . Sd
. Cu + e-rT .S u - S d
. Cd
Su - Sd Su - Sd
Multiplying both sides by erT we get:
erTC0 = e-rT .S o - Sd
. Cu + S u - erT S o
. Cd Su - Sd
Su - Sd
Ihbovquation, thotuhected value ohption’r
in a risk-neutral world after a period T. Now if we can denote
p = erT .So - Sd
Su - Sd
1 – p = S
u - erT
S
o
Su - Sd
Then erT C0 = p.Cu + (1 – p).Cd
C0 = e-rT {p.Cu + (1 – p) Cd}
Multi-Period Binomial Model
Earlier we considered that the time between now and the maturity day of the option is
one period but the binomial model can be used to price an option wherein the life of the
86

option may be divided into any number of periods or steps. The procedure of pricing the
option remains the same:
➢➢ Finding the value of the option at the terminal nodes. ➢➢ Setting the price of the option at the nodes preceding the terminal nodes using the
one- period pricing formula, i.e., ➢➢ C0 = e-rT {pCu + (1 – p) Cd}
➢➢ Repeat the process till we reach the initial node. This process of moving from the
terminal node to the initial node and pricing the option is known as bachvard
induction.
In order to understand the multi-period binomial model, let us consider a numerical
example.
Example 2.2
The spot price of the asset is ` 100 and the strike price of the stock is ` 105 and an annual
volatility of 25%. Assuming 5% risk-free interest rate, price the option in three time steps.
Solution
This question involves pricing the option in three time steps, i.e., we have to model the stock
price three times or once every four months. First we have to determine the up factor and the
down factor which are related to volatility, time to expiry and number of steps these are given
by CRR as:
u = eσ√(T/n)
d =e-σ√(T/n)
The transition probability is given as:
p = er.T/n - d
u - d
Where r = Risk-free return, per annum
T = Time to expiry of the option, and
n = Number of time steps
σ = Annual volatility.
87
Another important adjustment often forgotten by most is to make the appropriate
adjustment to the interest rate.
In our example, the rate is given in annual terms and we are going to model the price
of the stock at four-month intervals; so we have to use the 4-111onth interest rate in finding u,
d and p
u = e0.25 X √(1/3) = 1.1553
d = e-0.25 X√(1/3) = 0.8656
and
p = e0.0513 - 0.8656 =
0.5219 1.553-0.8656
We have drawn the binomial tree of the stock price in Figure (a). The time to maturity
of the option is divided into three steps and the stock price is shown at various points of time.
Now we are ready to compute the option›s price following the backward induction rule.
Stage I: Calculate the terminal value of the option. If the stock price is ` 154.20 then the
option with a strike price of 105 will have a value of 49.20 (154.20 minus
105). Similarly if stock price is ` 115.53, options value will be ` 10.53. The
option price tree is shown in Figure
(a) Three peroid binomial tree for a call option
88

(b) Three period binomial tree for call option
Stage II: Following the backward induction process, we can find the value of the option
at t = 2. Figure (c) shows the same
Cuu = e-0.05x1/3 [0.5219 x 49.2 + 0.478 x 10.53] = 30.2042
and Cuu = e-0.05x1/3 [0.5219 x 10.53 + 0.478 x 0] = 5.4048
(c) Three period binomial tree for call option
Stage III: Repeating the computations once again at t = 1, the tree can be restated as
shown in Figure (d):
Cuu = e-0.05x1/3 [0.5219 x 30.2042 + 0.478 x 5.4048] =
18.0438 And Cuu = e-0.05x1/3 [0.5219 x 5.4048 + 0.478 x 0] = 2.7741
89
(d) Three period binomial tree for call option
Stage IV: Now we reached the final stage from where initial price of the option can be
found as:
C0 = e-0.05x1/3 [0.5219 x 18.0438 + 0.478 x 2.7741] = 10.5658
Figure (e) shows the final option price tree.
(e) three periods binomial trees for call option
European Put Option
The binomial model can also be used to price a put option in a similar way. The
following example shows pricing of a European style put option for the data given in
Example 2.3.
90
Stage 1: As in tharlier caseirsinhption’s value airyicts the
initial option price tree.
(f) Three period binomial tree for a put option
Stage II: Following the recursive process, find the value of the put option at t = 2
Figure (b) shows the same.
Pud = e-0.05x1/3 [0.5219 x 0 + 0.478 x 18.44] = 8.6686
and P = e-0.05x1/3 [0.5219 x 18.44 + 0.478 x 40.14] = 28.3345 dd
Three period binomial for a put option
Stage III: Repeating the computations once again at t = 1, the tree looks like Figure (c).
Pu = e-0.05x1/3 [0.5219 x 0 + 0.478 x 8.6686] = 4.0751
and P = e-0.05x1/3 [0.5219 x 8.6686 + 0.478 x 28.3345] = 17.7694 d
(g) Three period binomial tree for a put option
91
Stage IV: Now we have reached the final stage from where initial price of the option
can be found as:
Po = e-0.05x1/3 [0.5219 x 4.0751 + 0.478 x 17.7694] = 10.4450
The final option price tree is depicted in Figure (d).
(h) Three period binomial tree for a put option
Now that we could price both call and put options using binomial models, let us see
whaappenhption’rice if we increashumber otroption
price becomes ` 10.0993 and if the steps are 5, then it becomes ` 10.2452. Table gives the
price of the call option along with the number of steps that go into its computation:
Effecteps omiaption’rice
Steps Price of the calf option
3 0.5658
4 10.0993
5 10.2452
10 10.1388
20 10.0924
40 10.0323
50 10.0133
100 9.9601
150 9.9854
200 9.9924
300 9.9876
500 9.9831
1000 9.9814
92
The option price changes as the number of steps are varying and this is because the
binomial model is discrete and it does not consider many intermediate stock prices, leading to
this kind of discrepancies. Generally it is resolved by using a large number of time steps, i.e.,
shrinking the time interval and modeling as many stock prices as possible but it demands
tremendous computations and when the number of steps increases, the option price converges
to a particular price, i.e., the option price stabilizes at a particular level and the difference
between values obtained by increasing the number of steps becomes very small. Here in this
example, the price stabilized around ` 9.98. Also, one can note that as the time period
becomes smaller and smaller, we move from the discrete world of Cox, Ross and Rubinstein
to the continuous world of Black - Scholes.
—Scholes Oricing Mo BSOPM)
Chronologically speaking, BSOPM was introduced much earlier than binomial option
pricing, but for ease of understanding we first considered the binomial model. Infact,
Blaccholes provd the firsvced forolution for pricing the European calls nublishehatreakinaper
titleThricinptionnd corporate
liabilities” in Journal of Political Economy. Prof. Scholes and Prof. Merton were awarded the
Nobel Prize for their contributions in option pricing.
The data inputs to this model are current stock price, exercise price, expected
volatility, interest rate and time to expiry. The pricing intuition remains the same - construct a
replicating hedge portfolio comprising a long position in stock and a short position in a zero-
coupon bond.
The hedge portfolio will be constituted in such a way that at any given point of time
ilue willways bquahption’rhaimehption’rfers
frohedgortfo’s valuehen arbitrags’ actionilrinachquilibrium
relationship. Throportiotocks anondilerehlaccho formula.
As the formula depends on constantly changing factors like volatility, current market
price of the stock, etc., the portfolio mix has to be constantly adjusted so that it will reflect
thurrenutputs olaccholes. Hence thiortfoalleynaortfo
and the act of maintaining the portfolio in balance is called as hedge rebalancing.
Thathematicaivatiohlacchoodeuite compated
and requires understanding of a sophisticated branch of mathematics called as stochastic
calculus, the details of which are out of the scope of this book. So the detailed mathematical
93

ivatioPM irovppenhihapter. The famoulaccho
formula for option pricing is given below:
C = S. N(d1) – X. e-rt. N(d2) (2.7)
In ( S ) + (r+ σ2/2 x t
d1 = x
(2.8)
σ . √t
d2 = rd1 - σ . √
(2.9) t
Where N (.) = Cumulative normal distribution function In
= Natural logarithm,
S = Spot price of the stock,
X = Exercise price of the option,
r = Annual risk-free rate of return,
t = Time to expiry of the option, and
σ = Annual volatility of the stock.
If t is in years, then o and r should also be expressed in annual terms.
Since thalculatioptiorhroughlacchoormula involves
many intermediary computations, a systematic procedure may be useful:
1. It is better to start with equation (2.8). So,
a. Work out In (S/X)
b. Calculate (r + a2/2)
c. Find σ . √t
d. Compute d1
2. Calculate d2 from equation (2.9).
3. Find cumulative normal distribution values either using N(d) tables given at the end of
this book or using the numerical formulae
4. Now calculate the price of the option by substituting the respective values in equation
Example 2.4
The current price of a stock is ` 90 per share. The risk-free interest rate is 8% (annualized,
continuous compounding). If the volatility of the stock is 23% p.a., what is the price of the ` 80 call option expiring in 6 months?
94

Solution
Performing the above mentioned steps:
1. (a) In (90/80) = 0.1178
(b) ¢r =
σ2
2 ≤ = (0.08 + (0.23 x 0.23/2)) = 0.1064
(c) σ . √t = 0.1626
(d) Find the vlaue of the numerator in d1L II 1
In (S/X) + ¢r =
σ2
2 ≤ . t = 0.1178 + 0.1064 x 0.5 = 0.171
Now, divide this with 0.1626, which gives d1 = 0.171/0.1626 = 1.0517
2. d2 = d1 - σ . √t = 1.0517 – 0.1626 = 0.8891
3. N(1.0517) = 0.8535 and N(0.8891) = 0.8130
4. C = S. N(d1) – X. e-rt. N(d2) = 90 x 0.8535 x 80 x e-0.08x0.5 x 0.8130
= ` 14.3253 = 14.33
European Put Option Pricing
B-S initially provided the formula for pricing European style call options on assets
without any intermediate income. Simultaneously, in an article in Bell Journal of Economics
and Management Science, Robert Merton (1973) provided an elegant analysis in which he
provided explicit formulas for pricing put options and suggested adjustments to take care of
dividend payments.
The price of the European put option can be computed using the formula given in
equation
P = X ert. N(-d2) - S. N(-d1) (2.10)
All the terms that appear in this formula are as explained in the above section. It can
be noted that N(-d2) is the same as 1 - N(d2) and N(-d1) is the same as 1 - N(d1).
95

Example 2.5
Using the information provided in the previous example, find the price of a put option.
Solution
We can start with the computation of d1 and d 2 but if we make use of the fact that N(-d2) is
the same as 1 - N(d2) and N(-d1) is the same as 1 - N(d1), then thuption’s value iiven as:
P = 80 x e-0.08x0.5 x (1 – 0.8130) – 90 c (1 – 0.8535)
= 1.1884 = 1.19
B-S Model Assumptions and Limitations
Just as with most other models in finance, BSOPM is also based on some
assumptions, which are as follows:
(a) Frictionless markets. More precisely it means there are no transaction costs, short-
selling is permitted, existence of similar borrowing and lending rates and infinitely
divisible assets. This is not a severely restrictive assumption since the intention is to
separate the effect of market forces on option prices.
(b) The asset pays zero dividends. This is also not an implausible assumption atleast in
the short run. But subsequent models in the literature proposed some adjustments to
the basic BSOPM to incorporate dividend/intermediate income.
(c) The option is European style.
(d) Asset prices follow a geometric Brownian motion. In other words, asset returns are
normal and stationary. Many critics called this assumption as the biggest hole in the
B-S formula, including its inventor Prof. Fisher Black in an influential article in the.
Journal of Applied Corporate Finance in 1989.
But this way of making simplifying assumptions to describe the complex real world
more well-mannered is followed in many disciplines of Sciences and also in economics and
finance from ages, and in that spirit this model is not an exception. More importantly, despite
these seemingly deficient assumptions, the model does a reasonable job in pricing a variety of
derivative instruments.
96

But the real utility of BSOPM is that it provides us a mechanism to hedge an option
and the cost of hedging gives us insights into the likely price of the option. In the B-S model,
all the data inputs are directly observable except volatility. In the next section, we will see
some important ways of estimating volatility.
****
97

Lesson 2.3 - Options Trading Strategies
Options Trading Strategies
➢➢ Building Blocks of Derivatives ➢➢ Options Trading Strategies
➢➢ Directional Strategies
➢➢ Volatility Strategies
➢➢ Horizontal Spreads
➢➢ Other Trading Strategies
Building Blocks of Derivatives
Now that we are armed with the knowledge of option greeks, we are well equipped to
appreciate and understand the various option trading strategies, their motives and the possible
consequences. We will start with the basic and simple strategies, also known as the building
blocks of derivatives.
The following are the basic elementary strategies:
➢➢ Long call ➢➢ Long put
➢➢ Short call
➢➢ Short put
To these we can also add long stock and short stock; we will have six basic strategies
termed as the building blocks. Let us see each of them in detail. In this section we will discuss
these strategies and other advanced strategies. Throughout our discussion on option strategies,
we will make use of greeks and profit/loss diagrams as they are our eyes and ears to discern
all options-based strategies.
Long Stock
When an investor expects that a particular stock will rise, until the advent of
derivatives investors will buy that stock as they have only that choice to profit from their
98

bullish expectations. In this case, the investor theoretically has unlimited profit; potential and
losses are limited to the price he paid while acquiring the stock. Hence, if the stock price rises
over what he paid for, he will be gaining and vice versa. The payoff for a stock is shown in
Figure
Profit/Loss diagram
Short Stock
This strategy will be resorted to when one is having bearish expectations or when one
expects the stock price to come down. Though this is currently not permitted in India for
everyone, the mechanics of short selling involve the following:
(a) Borrowing the stock for a specified period from someone who holds it; for instance, a
broker.
(b) Selling the borrowed stock now at the current market price.
(c) At the end of investment horizon, the stock will be bought from the market and will
be returned to the broker/stock lender.
This is a bearish strategy involving limited profits but unlimited losses because at
maximum the stock price may decline to zero and this extreme case represents the maximum
profit potential.
On the other hand, if price moves against the seller then he has to put up with
unlimited losses as prices are unbounded on the upside (i.e., they can go up to infinity
theoretically).
99

Short stock profit/ (loss) diagram
Long Call
Buying call options is the simplest and a popular form of entering into the derivatives
market. By definition, call option buyer has the right to buy the stock at the strike price until
the expiration date. An investor will buy a call option with the expectation of a price rise. The
advantages of a call option over buying a stock are two fold:
(a) Leverage, and
(b) Limiting the downside risk.
Consider a call option on a stock with the following data:
Strike price = ` 100 Current market price = ` 100
Time to expiry = 90 days Volatility = 25%
Interest rate = 5%
The payoff diagram for this option is shown in Figure.
Now, in order to buy 100 shares, the investor has to invest ` 10,000 and if the stock
gains ` 5 over the next day, his gain will be ` 500 (100 shares x 5 per share) and return on
investment = 5% over a day {(500/10000) x 100}.
But if the investor bought 100 options, he will pay ` 555.50 as option premium and the
gain for the same ` 5 over next day will take the price of the option to ` 8.723 or ` 3.168 gain
for each option, in which case the profits will be 3.168 x 100 316.80, translating into a return
of 57% over the day.
100
Therefore, call options entail investors to realize large percentage of gains for a
modest advance in the underlying price. But leverage is a double-edged sword and a ` 5
decline over the next day will cause the option price to fall to ` 3.11 and the percentage losses
would be around 45%. Therefore, the price of a larger reward is a larger risk. But the call
buyer’s sare limited to the prpawhithe stock buyer’s risk is the entire investment of ` 10,000. Hence the call option can be viewed as a sort of insurance in case the
stock falls instead of going up. Thus, a call option provides the following benefits to the
buyer:
Translate a bullish view on the market into actual position and retain the ability to
buy the underlying stock in the future.
➢➢ Insure a major part of the capital due to losses arising from declines in the market
prices of the underlying stock.
Long call profit/(loss) diagram
To know more about the risks and rewards associated with a long call option, let us
make use of the Greeks and the profit/loss diagram. Table presents the greeks for the above
mentioned data:
Option Greeks for the long call option
Option Fair Value Delta Gamma I-Day Theta Vega Rho
5.52 0.565 0.0319 -0.034 0.196 0.1240
101

For ATM and ITM options, at expiry gains/losses of every rupee in the underlying
stock will be reflected as gains/losses in the option prices. At expiry, the position wills
breaven ahtrikrluption’rum. A deltf 0.565 inates thanall
option is equivalent to holding 56.5% of the underlying asset.
The option has a gamma of 0.03 19 and a Vega of 0.196 while theta is —0.034. The
Greeks give insights into the underlying risks as well as motives of holding options that are
not otherwise obvious. Positive gamma indicates that deltas become more positive when
underlying stock price increases and will be beneficial to the option buyer. In other words, if
the actual volatility increases the buyer will be benefitted.
Similarly, a positive Vega implies that the option holder will benefit from any
increases in implied volatility. In fact the option price will increase by ` 0.196 for a 1%
increase in implied volatility.
Hence wan unstanhaptiouyer iavinullisien ung’s
volatilitlonitullisiehe ung’ection. Buhptiouyer is
exposed to theta risk - the option loses its value by ` 0.034 everyday, even when all other
things remain the same. This may not seem as an innocuous number but remember that this is
well before 90 days to expiry and that theta increases rapidly as expiry date comes near.
Therefore, an option buyer has to note that:
➢➢ An increasg’rnd increastuanr
impolatilitill be beneficial. ➢➢ The elapsing time will fritter away the premium, and this hurts the buyer more when
thero increase in volatilithe ung’r.
Short Call
When an investor sells a call option, he definitely expects that the stock price will not
rise. Though the outlook of the investor is not very positive, he is not utterly bearish since in
order to profit the market need not decline; even if it stands still, he will gain the premium.
Soalel’ieharket ienlleutraearish. Slahien
ung’ection, a shorrader in optionects thahe unlying’olatilitill
also decline. Let us see the Greeks in Table to decipher more clearly the consequences of this
strategy.
102

Short call profit/(loss) diagram
Option Greeks for the short call option
Option Fair Value Delta Gamma I-Day Theta Vega Rho
5.52 -0.565 -0.0319 0.034 -0.196 -0.1240
The profit/loss diagram in Figure shows that the call seller is having a limited profit
and the losses are unlimited. Hence this is a high-risk strategy because utmost what he can
gain is the option premium while he can lose an unlimited amount. The greeks show that
thhoralative delta, suggestinhanislying’rilurhe optioelecaushptiorice increases witn
increaslying’r. The
short call is also exposed to the twin risks, gamma and vega risk, i.e., if underlying volatility
and/or implied volatility increases, the position will lose money. On the positive side, the call
seller will benefit from time decay, as theta is positive. So the call seller will be waiting for
the option to reach the phase when theta rapidly increases without the underlying stock
rallying.
We can summarize that a call seller expects the market to be neutral or bearish and
will benefit from:
➢➢ A decg’r, ➢➢ A decline in actual or implied volatility, and
➢➢ Theta or the passing by of time.
103

Long Put
By buying a put option, an investor is expressing a bearish view on the direction of the
ung’r. Put optionrremelsefuools in markherhorelg
is not permitted legally. Though futures can also serve as an alternative means of short
selgheffer nrotection if the investor’eadinharket pulsrongut
option holder, if he is also long in the underlying stock, is ensured that a large part of the
current market value is not lost. Since options are instruments that expose the holders not
onlhe unlyinsset pr’ectioulsholatilityuptioolder
is expressing a neutral to bullish view on the implied volatility. Therefore, a put option holder
expects the market price of the underlying to decline and anticipates that volatility would
increase (or at least will remain same).
Let us understand the put option with the help of greeks and the profit/loss diagram
given in Table and Figure respectively
Long put profit/ (loss) diagram
Option Greeks for the long put option
Option Fair Value Delta Gamma I-Day Theta Vega Rho
4.44 -0.45 0.033 -0.022 0.196 -0.091
A put holder is having significant profit potential and the losses are limited to the
amount paid as the option premium. At expiry, the break-even point occurs at a price equal to
the strike price minus option premium and before expiry the BEP is even higher. It can
104

be noticed that delta of the option is negative at 0.45. Therefore, if the market price rises by
` 1.00, the option will start losing ` 0.45. Our premise on volatility exposure of put holders
comes out of the fact that gamma and Vega for long puts are positive. Therefore, they will be
benefited if there is all in implied volatility and/or the underlying stock experiences extreme
price swings. But as in long calls, all Greek that is working against the put holder is theta.
Since it is negative, it is indicative of the erosion of the time value of the option. In summary
we can say that a long put will benefit:
➢➢ When the ung’rice deces anr. ➢➢ From an increase in actual and/or implied volatility.
But a put option holder has to be wary of time decay.
Short Put
The seller of a put option has an obligation to buy the underlying asset at the exercise
pr. Thereforehuelects thahe unlying’riltelot dece
though he may not be sure about the price rising, he should be certain that the stock will not
go down. Put writing can also be considered as a strategy of acquiring the underlying asset at
or below the going market price. For instance, when the market price of a stock is
` 264 and if a 250 strike put option with 75 days to expiry is trading at ` 5.24, the buyer of the
stock has to pay ` 250 to buy the stock (assume r = 5% and volatility = 25%). If an investor
expects that prices will not go beyond ` 250, then by selling this put he can actually get the
stock at a price less than ` 250 (because he will earn a premium of ` 5.24, which will reduce
the cost of purchase of the stock). However, the seller will be hurt if the price falls
significantly before the expiry.
short put profit/ (loss) diagram
105

Option Greeks for the short put option
Option Fair Value Delta Gamma I-Day Theta Vega Rho
5.42 -0.276 -0.011 0.056 -0.392 0.134
As in the case of a short call, the put writer also assumes significant losses for a
limited gain of the option premium this can be noted from Figure. The short put has a
negative delta from Table, implying that the option writer will lose if the underlying stock
price rises anill gain if the ung’s price decn additioo a ntive delthorut has
a negative gamma and Vega. Therefore, if the volatility increases, put writer will lose and if
volatility decreases, put writer will be benefited. So, ideally put writer desires a market price
decline associated with a volatility decline, in which case it is doubly beneficial. On the other
hand, the position will gain from a positive theta and this gain increases as time to expiry
approaches.
In conclusion, we can say that a put seller will benefit from:
➢➢ Dece in the ung’r. ➢➢ Decline in actual and/or implied volatility.
➢➢ Time decay.
These are known as the basic building blocks since they form the basis for
constructing a variety of esoteric spreads and combinations that will yield different payoffs
depending ohien unlyinarket’ectionolatilityotart unstang
some simple strategies like combining calls and puts with the underlying stock.
Options Trading Stragegies
Options Trading in Combination with the Underlying Covered Call Writing
This is a conservative strategy and involves writing of a call option and
simultaneously buying the underlying stock. As the writer of a call option is obligated to
deliver the underlying stock at the exercise price, the writer of the naked call expects the stock
price to end up below the exercise price at expiry. But if the stock price ends up higher than
the exercise price, the writer will suffer losses. The covered call writer tries to hedge these
losses by actually holding the underlying stock. A covered call writer is more cautious than
the stock buyer since a stock buyer has unliçnited gains and losses whereas a covered call
writer is more concerned with what he already has and this strategy protects the investor from
price declines upto an amount equal to the option premium he has received. But of course
106
in the bargain the writer of the call is actually exchanging his unlimited profits to a constant
profit if the stock rises. Covered writing provides the investor with additional income from his
investment portfolio, which protects his securities, at least partially, from a decline in market
price and the premium received will lower the break-even point on the stock.
Assume that an investor holds 100 shares of a particular stock and the current market
price of the share is ` 100. He is concerned about the slight weakening trend in price of this
stock and decides to protect the moderate downfall by writing a call option at a strike price of
` 105 expiring in 90 days. He collects ` 7 as premium and in the deal he has protected his
investment against mild declines up to ` 93(100 - Premium).
To this extent these loses will be compensated by the option premium he has received.
Now let us chart the profit/loss diagram for the covered call the same is shown in Figure.
It may be noticed that as the stock price increases over ` 105, the call option will be
exercised and he has to deliver the share at ` 105. Therefore, his effective selling price will
become ` 105 + 7 (being the premium received) = ` 112. If the stock ends up at more than ` 112, he has to bear the opportunity loss as he cannot realize this higher price because he has
committed to sell the share at ` 105 by virtue of the sold call option.
If the stock price is below ` 105,, the call seller will retain the full amount of option
premium since the option will not be exercised and the returns will be higher vis-à-vis the
exclusivtoctioreaven poins lower thahe unheedetioor the covered call it will be at ` 93 but for the stock only position it will be ` 100. Infect at the
break-even point of the stock only position, the covered call will generate a return of 7.52%
(unanalyzed). So it appears to be a better strategy than the stock only position if the expected
price is to remain more or less unchanged.
Covered call is a less risky strategy compared with either uncovered call writing or
buying the stock alone. In the naked call writing, the seller has to bear greater risks as losses
are unlimited if the stock price rises substantially and the returns are capped at the premium
received whereas buying the stock alone dives unlimited losses as well as gains but it entails
larger initial investment.
Generally the covered call writer sells OTM options in order to secure a part of the
price appreciation along with the premium. Looking at the profit/loss diagram of the covered
call writer reminds us of the profit/loss diagram for a short put. We will see the relationship
between these two a little later in this chapter.
107

Covered call writing profit/(loss) diagram
Protective Put
Waveen thahen an investos long in thtock, harotect his investment’s
downside risk against moderate price changes by writing a call option. The size of the
protection will be equivalent to the premium received.
However, the investor has to give up all the upside potential when stock price moves
up significantly. Also, the losses are only pared down slightly when price moves down
substantially. So, instead of writing a call option if the investor buys a put option along with a
long position in the stock, his benefits are two-fold - if the stock price declines sharply below
the strike price, he will not suffer any losses because the put option will become in-the-money
and the portfolio will gain; but if the stock price moves up significantly, he will retain all the
profits that are associated with the long stock position and the portfolio gains will be equal to
the stock gains less the premium paid.
Therefore, a protective put ensures that the unlimited gains associated with stock
price rally will accrue to the buyer and if the stock price moves down, the unlimited losses
associated with stock are nullified by the long put option and the twin benefits come at a
quahuption’rum. Thamerenarohrofit/
loss diagram shown in Figure.
108

Protective put profit/(loss) diagram
Suppose an investor holds 100 shares of Neptune Industries that have appreciated
substantially in value ever since he acquired them. Current market price of these shares is `
325 per share and the investor wants to continue to hold the shares for their long-term
prospects. However he is concerned about their decline if a far and wide forecasted market
correction comes about. In order to lock-in the gains, the investor buys 100 ATM put options
at a price of ` 7.00 per option. This assures him of a selling price of ` 320 per share if the
stock price declines.
Now what happens if the stock price falls to, say, ` 290? The stocks will be worth only
` 29,000 instead of ` 32,500 - all of ` 3,500 thtock’s value. Buan exercishe put option and will gain ` 3,000 {(320 - 290) x 100 options}. So the portfolio will be worth
` 31,300 (32,000 — 700 being the premium) and if the stock price rises to ` 350, then the put
options will be allowed to lapse and the investor will lose ` 700, which is the option premium
paid, and the stocks will be worth ` 35,000. The net portfolio value will be ` 34.300.
Effectively, a put option added to a long stock portfolio ensures a minimum value for
the portfolio or the strike price less option premium becomes the value of the portfolio.
However, a protective put may be of less utility if only a marginal decline in the underlying
stocrected.ehecteovemenhahut’ray
be better to absorb the losses rather than hedge the stocks with put options.
109

From the above discussion of these basic strategies, it is clear that options traders can
benefit or can get hurt when the underlying market moves in a particular direction and/ or
volatility itself changes. So, depending on the expertise a trader has, he can benefit from
either direction or volatility or both by combining the basic building blocks. Accordingly
derivatives offer all trading strategies with varied risk-reward characteristics. These strategies
can be broadly classified as (for ease of exposition only) directional strategies, volatility
strategies, and horizontal spreads.
Directional Strategies
Directional strategies are designed to speculate on the direction of the underlying market. So,
they are simply trades that reflect the views of traders on the direction of the underlying
markkbullisierices wilise) obearisierices will decptionan
be combined in such a way that investors will have exposures only to the market direction
while remaining neutral to the volatility. Therefore, directional strategies allow traders not to
worry about volatility changes and to make use of their expertise in predicting the market
direction.
It may appear that these are not very special strategies as one can always speculate
about the direction of the market with the help of the underlying assets directly or with the
help of futures. But it has to be noted that these two instruments allow traders to benefit only
when their predictions about the direction turn out to be right; but if their predictions or
beliefs do not turn up right, they will have to put up with unlimited losses. With options you
get the best of both worlds - have unlimited gains if you predict the market direction correctly
otherwise content with the limited losses. Also, as discussed in the earlier sections, options
provide the investors with ample leverage, which is another possibility that trading with the
underlying assets alone would not be providing.
Bull Vertical Spread
Among the directional strategies vertical spreads are quite common and these involve two
options with different strike prices on the same underlying for the same maturity. Vertical
spreads are characterized by limited risk and pofit potential. These spreads are termed as
vertical spreads since the spread consists of two options that appear one below the other (not
necessarily immediately below) in the options price quotations published in the business pess,
are organized in an ascending order of strike prices.
A bull vertical spread involves buying a call option and simultaneously selling a call
option oil same stock with the same expiry but with a higher strike price. A bull spread can
110
be created with put options too and the principle remains the same - buy the lower strike
option and sell the higher strike option. So, in a bull spread:
Long call strike < Short call strike
Long put strike < Short put strike
Bull call spread is somewhat similar to a covered call but instead of holding shares,
the investor owns an ITM call option. This strategy permits the trader to initiate the position
even though he is tentative of his bullish expectations. This is because in the worst case the
call option he holds may expire worthless. Of course bull vertical spread can be constructed
so as to reflect his varying bullish expectations, viz., if the investor is very bullish, he can
select the strike prices which are farther apart, and if he is cautious of his expectations, the
strike prices will be closer to each other. Also, the more ITM the long call, the more wary the
trader is. Depending on the composition of the spreads and with respect to the spot price, a
spread is termed as ATM if it has one ITM and one OTM option, whereas in an ITM vertical
both options are currently ITM, and an OTM vertical is one where both options are currently
OTM. Consider the following data:
Stock price 100
Time to expiry 90 days
Volatility 25%
Interest rate 5%
Option price X=100 5.55
Option price X = 105 3.40
If an investor constructs a 100/105 bull spread, he pays ` 5.55 for the long call and
receives ` 3.40 from the short call option, resulting in a net outflow of ` 2.15. Since there is a
net outflow of money, this type of spreads is sometimes termed as debit spreads. It is evident
that the investor is reducing the price of the option that was bought and aims to profit from his
bullish views. Since the trader is adding another option to the original position by selling
another call at a higher strike, he is actually limiting his gains and so also the risks. The
maximum loss occurs when the purchased option expires out-of-the-money and the loss is
equal to the net premium paid. The profit is highest when the sold option becomes in-the-
money and the gains are equal to the difference between the two strike prices less the
premium paid. Hence the breakeven point is (this is also clear from the profit/loss diagram
Lower exercise price + Net premium paid
111

Bull call spread profit/(loss) diagram
For our example, let us see the cash flow consequences under different scenarios:
➢➢ When the stock price is below ` 100: In this situation, both options expire worthless
and the net loss would be the net premium paid and will equal to ` 2.15. ➢➢ When the stock price is between ` 100 and ` 105: At expiry, the investor exercises
the ` 100 call and sells the stock in the market at the going price. Since the breakeven
point is ` 102.15, he will exercise the option as long as the stock is in the range of `
100 and ` 102.15. ➢➢ When the stock price is above ` 105: In this situation, both options are in-the-money
and the investor will exercise the ` 100 call and simultaneously the higher call sold by
him will also be exercised by the counterparty. The total gain will be ` S and net gain
will be ` 2.85, considering ` 2.15 being the net premium paid to initiate the position. So
as long as the stock ends up higher than the sold call option, this represents the gains to
the bull spread holder.
Now let us see what insights the Greeks provide us. Table provides the greeks for the
bull vertical spread.
Option Greeks for the bull vertical spread
Price Delta Gamma Theta Vega
Long call option -5.55 0.565 0.031 -0.034 0.196
Short call option 3.40 -0.415 -0.031 0.033 -0.193
Net -2.15 0.15 0 -0.001 0.003
112

The Greeks make our comprehension of the strategy much more thorough - the
investor is exposed only to the market direction with a positive delta of 0.15 and all other
greeks are negligible with a zero gamma and an insignificant vega, implying that the position
is neither exposed to actual volatility nor to implied volatility. The best part of this bullish
strategy is that time decay is almost zero.
Generally, with a long option position, the holder is subjected to massive time decays,
but with a bull spread, the position has a long bias towards the market without being wrecked
by time decay. In this case, the delta is just 0.15, meag that the ts’ osure
is only 15% of the underlying but if he desires more exposure to the underlying, this can be
achieved by driving the delta to any desired value. For example, if the trader intends to have a
delta equivalent to that of the underlying stock, i.e., 1.0, all he has to do is add more bull
spreads. In this case he needs around 6 to 7 sprads (1.0/0.15 = 6.67).
In a similar way, bull vertical spreads can be constructed using put options instead of
call options. This is done by selling the higher strike option and buying the lower strike put
option. Since we are writing an ITM put and buying an OTM put option, there will be a cash
inflow.
Hence these spreads are also termed as credit spreads. The more ITM the two exercise
prices, the more aggressive is the spread. The profit/loss diagram for the bull put spread is
depicted in Figure. The nature of the strategy and the consequences are as discussed in the
case of bull call spread.
Bull put spread profit/(loss) diagram
113

Bear Vertical Spreads
When the outlook for the market direction is bearish, an investor can benefit by
trading bear vertical spreads using either call options or put options. In a bear vertical spread
the strike prices are chosen as follows:
Long call strike > Short call strike
Long put strike > Short put strike
A bear spread is a versatile strategy when an investor expects the market to decline but
is unsure of the amount by which it will fall. An aggressive spread can be constructed by
using more out-of-the-money options. When an investor initiates a bear put spread as in the
case of a bull call spread, he pays the premium. So a bear put spread is also a debit spread. If
the underlying security rises subsequently, the loss will be limited to the net premium paid.
For instance, an investor who is having a bearish view on the market can profit from his
forecast by using a bear spread, which entails less investment than that involved in a long put
option.
Assume that the investor expects the earlier stock to come down and he constructs a
bear spread with the following information:
➢➢ Buy a 105 put option at ` 7.33 ➢➢ Sell a 100 put option at ` 4.44
➢➢ Net premium paid is ` 2.89
The short put does two things - reduce the cost of buying the 105 put option and limits
the profits at expiry. At expiry if the stock price falls below ` 100, then both the puts will be
exercised (long put will be exercised by the investor the 105 and the buyer of 100 put will
also exercise it) and this will result in ` 5 as inflow to the spread holder. However, since he
paid a premium of ` 2.89, his net gain will be ` 2.11 (5 - 2.89). On the other hand, if the stock
ends up between ` 100 and ` 105, the investor will exercise the 105 long put and the 100 short
put will be allowed to lapse. Since the breakeven point is ` 102.11, to limit the losses the
investor will exercise the option as long as the stock is between ` 102.11 to ` 105. The last
possibility is when the stock price is over ` 105 and in this case both options will be worthless
and this represents the worst case for the bear spread buyer and he has to bear a maximum
loss of ` 2.89 being the initial premium paid by him. So, the bear put spread has a limited
upside and a limited downside risk which can be observed from the profit/loss diagrams given
in Figure
114

Price Delta Gamma Theta Vega
Long call option -7.33 -0.612 0.033 -0.02 0.193
Short call option 4.44 0.45 -0.033 0.022 -0.196
Net -2.89 -0.162 0 0.002 -0.003
Option Greeks for the bull vertical spread
Bear put spread profit/(loss) diagram
The option Greeks for the, bear put spread are presented in Table.
The net delta of the spread is around —0.16, implying that the position will benefit if
the market price of the stock falls. Gamma and Vega are almost zero. Hence the position is
neutral to volatility and is exposed only to the market direction. Importantly, theta for the
spread is negligible (though for this spread it is infect insignificantly positive). This is a major
benefit over simply buying a put option, which is also a bearish strategy that is subjected to
serious time decay losses.
To sum up, we can say that the vertical spreads (bull/bear) achieve the following:
➢➢ Provide a position that benefits if market rises/declines • Unaffected by
volatility changes ➢➢ Time decay losses are almost negligible
115
Volatility Strategies
Option markets actually facilitate securitization of risk. Hence options are one of the
most importannd sible toolo constructrateghaenefirohs’
knowledge of volatility changes without bothering about direction of the underlying price.
Therefore, volatility strategies benefit investors who have their expertise in forecasting
volatility but may not be proficient in forecasting the direction of the market. The following
are the important volatility trading strategies.
Straddles
This is the most popular strategy to trade volatility since this gives the buyer exposure
only to volatility with insignificant exposure to the underlying asset. Therefore, without
bothering about the market direction, one can take positions on changes in market
expectations of price volatility alone. A long straddle comprises buying a call option and a put
option on the same stock with the same strike price and expiry. Prima facie it may appear
foolish to buy a call and a put on the same underlying at the same strike and for the same
expiry, but the real purpose is to stay neutral to the market and get exposure only to volatility.
Hence a long call and a long put will just achieve that - remain unexposed to the underlying,
but since the buyer has paid the premium and is long in two options, he is long volatility
(option buyers are in fact buyers of volatility). In other words, the straddle buyer expects the
volatility to rise from the current levels.
The profit and loss diagram for a long straddle is shown in Figure. In this case, the
straddle was constructed for the following data:
Stock price 60
Time to expiry 90 days
Volatility 25%
Interest rate 5%
Call option X = 60 2.81
Put option X = 60 3.15
It may be noticed that by buying a call option, and a put option, the investor is setting
lower and upper breakeven points for his position and the breakeven points corresponds to
strike price ± total premium paid.
The total premium paid by the straddle buyer is ` 5.96. Hence the lower BEP is 60 -
5.96 = 54.04 and the upper BEP is 60 + 5.96 = 65.96. This implies that the trade will be
116
profitable if the price of the stock moves outside this range. So, the straddle buyer will be
benefitted even if the stock moves up or down but it should move significantly beyond the
breakeven points. He will be incurring losses if the stock remains range-bound and moves in
the range depicted between the lower and upper BEPs. The greeks for the long straddle are
given in Table.
Option Greeks for the long straddle
Price Delta Gamma Theta Vega
Long call option -2.81 0.513 0.053 -0.02 0.117
Long put option -3.15 -0.505 0.057 -0.013 0.117
Net -5.96 0.008 0.110 -0.033 0.234
The delta of straddles can be insignificantly positive, negative or zero. Here the delta
is slightly positive at 0.008 but for all practical purposes this value is insignificant. In general,
if the delta is near 0.01, the position can be considered as delta neutral. Since long straddle
involves buying options, the gamma is almost doubled. Similar to delta, the gamma of the
straddle depends on where the stock price is compared to the strike price. The gamma of a
straddle is highest when it is made from ATM options because gamma for an option is highest
when the stock price is equal to the strike price. A positive gamma signifies that the straddle
buyer wants the stock price to change significantly. The higher the positive gamma, the more
positive delta will become as the stock price surges up, on the contrary more negative delta
will be as the stock price falls. As the stock price moves away from the strike price of the
straddle, gamma starts to decrease. When the stock price moves, the options become either
ITM or OTM, and their gamma drops accordingly.
Long straddle profit/(loss) diagram
117
Similarly, the Vega of the position is doubled and, positive stands at 0.234 i.e., if the
volatility of the underlying stock changes by 1%, the position will profit by ` 0.234. Assume
that the implied volatility increases to 45% after initiating the position. Then the position will
gain in value by an amount of 20% x 0.234 = ` 4.68 for each straddle. This is almost equal to
the initial premium paid by the straddle owner. So, straddle buyers look for such a kind of
volatility changes.
So far so good, all the greeks are working for the straddle buyer except one - theta.
The net theta is negative at 0.033. This is not unusual because the straddle buyer is long in
two options. So theta will also double up and is slowly eating into the initial investment.
Since the position loses due to time decay and theta is highest for options that are near to
expiration, few traders afford to maintain/hold straddles for long periods or till expiration. By
and large investors hold straddles for a short time period and close out the position as soon as
volatility changes. A straddle is an effective strategy particularly before important economic
events like budgets or any company-specific events (like a judgment in a court case) that may
have either a highly favourable/unfavourable impact oil price of the underlying stock but the
investor is unsure of the direction. Unfortunately if nothing happens and if the volatility and
the underlying stock price remain stable, the trader has to unwind his position before being
ruined by time decay.
With a short straddle, the seller expects just the opposite of the buyer - the volatility
will come down in future. A short straddle comprises simultaneous selling of a call option and
a put option. If the strike prices are close to the market price, then the net delta will be coence
thriter’osurhe unlyinarket iegible oeutral.
The position will be most profitable when the stock finishes at the strike price and both
options expire worthless. The profit/loss diagram for a short straddle is depicted in Figure
along with the greeks in Table which are exactly opposite in sign to that of a long straddle.
Short straddle profit / (loss) diagram
118

Option Greeks for the short straddle
Price Delta Gamma Theta Vega
Short call option 2.81 -0.513 -0.053 0.02 -0.117
Short put option 3.15 0.505 -0.057 0.013 -0.117
Net 5.96 -0.008 -0.110 0.033 -0.234
It is very much evident that writing straddles is very risky since the upside is limited
only to the amount of premium collected from the two options but the downside is unlimited
and the risks are substantial if a large price move occurs. The theoretical price of the spread is
` 5.96 that will be received by the seller. The delta is slightly negative, which can be
considered as neutral. Since two options were sold, gamma is negative and this means that if
extreme movements occur in the price of the underlying, the position will experience grave
losses in both the directions. Like the gamma, the vega for the short straddle is also doubly ntiveholatilitises froo 26%, thtraddle’rises to ` 6.19 and this is the price the seller has to pay to
close his position and in the process he will incur a loss of ` 0.234 per straddle.
The theta for the options stands at 0.033 and is positive. Hence among all the greeks
only theta works for the straddle seller and he gains from time decay and this time decay will
increase as time passes by. The heaviest decay is experienced by the straddle near expiration.
Hence many traders may be interested in writing straddles that are near to expiry. However,
they will be wary of gamma as it will be highest for options that are closer to maturity. Short
straddles may be suitable strategies particularly when the volatilities are near the historic high
levels.
Strangles
Strangle is another combination to trade volatility and is very much similar to a
straddle but the virtue of a strangle is that it costs far less than a straddle. In a strangle, the
two options have different strike prices and are normally OTM options. Since the options are
out-of-the-money, they cost less while a straddle is constructed usually with ATM options
that have the highest time value.
Therefore, a long strangle involves:
(i) An OTM long call option
(ii) An OTM long put option
119

A strangle comprises a long position in a call as well as in a put option. The strike price
ohuptioilhahaalption’trikrnheilavhe
same expiry date, i.e., both of them are OTM and the farther they are from the current market
price, the cheaper the strangle will he.
Consider the following example wherein a strangle is established with the following
information:
Stock price 60
Time to expiry 90 days
Volatility 25%
Interest rate 5%
Call option X = 65 1.42
Put option X = 55 0.87
The total premium paid in this case is ` 2.29 and this is the maximum loss that will be
incurred by the buyer in the worst case while the profits are unlimited beyond the breakeven
points on either side, i.e., whether the stock moves up or down which can be noted from
Figure. This is one reason why these spreads are termed as straddles and strangles as these
positions profit on both sides. Long straddles and strangles make money if the stock price
moves up or down significantly. A strangle buyer expects the volatility to go up and he will
start gaining if the price of the underlying stock goes beyond the upper BEP or falls below the
lower breakeven point. Even if the underlying does not move and the volatility increases, then
also he will be gaining. The maximum loss is incurred when the price of the stock is in the
range of strike price ± total premium paid.
Option Greeks for the long strangle
Price Delta Gamma Theta Vega
Long call option X = 65 -1.42 0.323 0.047 -0.017 0.106
Long put option X = 55 -0.87 -0.205 0.038 -0.01 0.082
Net -2.29 0.118 0.085 -0.027 0.188
To understand more about the strategy let us make use of the greeks given in
The net delta is positive at 0.118 and this exposes the buyer to the underlying market
to the extent of 11.8%. If the trader wants exposure only to the volatility, then he can chose
the calls and puts in such a way that delta can be made negligible.
120

Long strangle proft/(loss) diagram
The gamma for the position is positive since both options were purchased and is equal
to 0.085. This implies that extreme price movements will benefit the buyer in both directions.
The vega for the combination is 0.188. This implies that the strangle buyer will gain if
implied volatility increases. Lastly, theta for the strangle is negative at 0.027 and this is of
concern for the buyer since if nothing changes and the market is stable, the strangle buyer will
be losing everyday due to time decay.
Hence many traders will take them off within a short period of time after initiating the
position but strangles can be held for a little longer than straddles as theta is less than that of
straddles.
The seller of a strangle is betting that volatility will be low and it is a preferred way to
sell volatility since the position remains delta-neutral over a wide range of prices. In a short
strangle, the investor simultaneously sells OTM call and put options on the same underlying
stock with the same expiry date. The maximum gain is the total premium received which
happens when the stock closes between the strike prices. But beyond the breakeven points,
losses are unlimited.
The short strangle benefits from two sources:
➢➢ Fall in volatility of the underlying and/or ➢➢ Time decay due to passage of time
The consequences will become much more clearer if we look at the greeks along with
the profit/loss diagram given in Table and in Figure respectively.
121
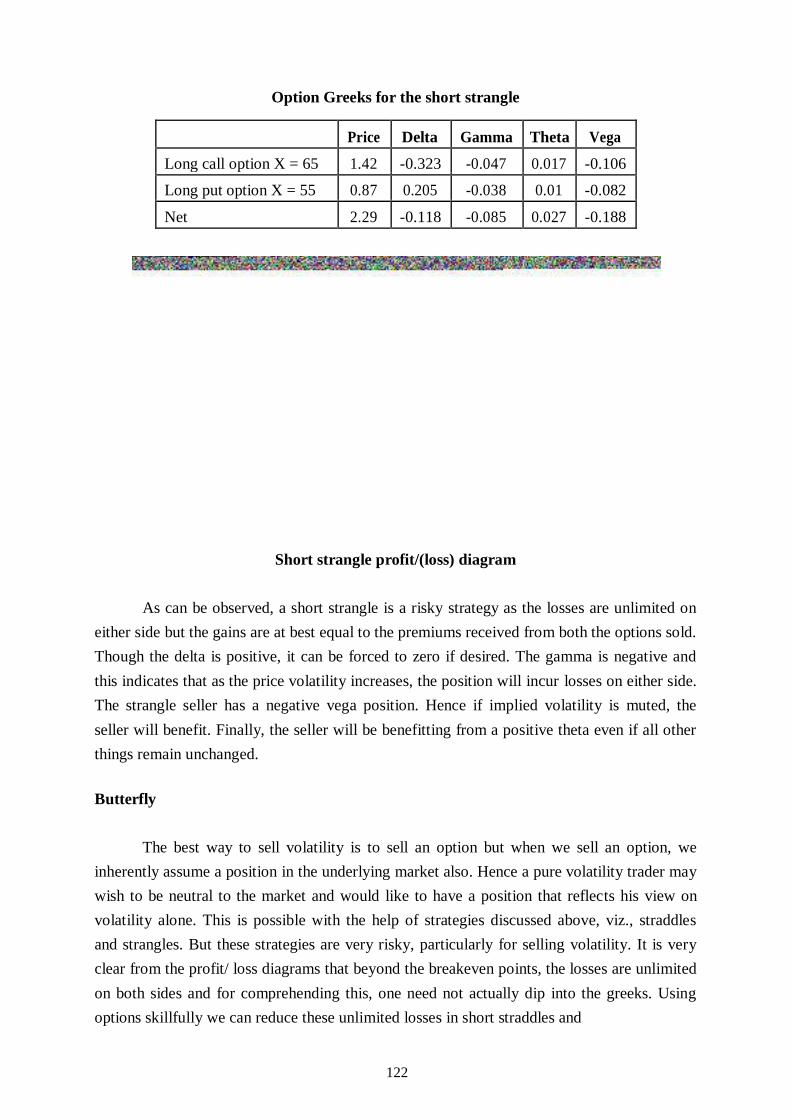
Option Greeks for the short strangle
Price Delta Gamma Theta Vega
Long call option X = 65 1.42 -0.323 -0.047 0.017 -0.106
Long put option X = 55 0.87 0.205 -0.038 0.01 -0.082
Net 2.29 -0.118 -0.085 0.027 -0.188
Short strangle profit/(loss) diagram
As can be observed, a short strangle is a risky strategy as the losses are unlimited on
either side but the gains are at best equal to the premiums received from both the options sold.
Though the delta is positive, it can be forced to zero if desired. The gamma is negative and
this indicates that as the price volatility increases, the position will incur losses on either side.
The strangle seller has a negative vega position. Hence if implied volatility is muted, the
seller will benefit. Finally, the seller will be benefitting from a positive theta even if all other
things remain unchanged.
Butterfly
The best way to sell volatility is to sell an option but when we sell an option, we
inherently assume a position in the underlying market also. Hence a pure volatility trader may
wish to be neutral to the market and would like to have a position that reflects his view on
volatility alone. This is possible with the help of strategies discussed above, viz., straddles
and strangles. But these strategies are very risky, particularly for selling volatility. It is very
clear from the profit/ loss diagrams that beyond the breakeven points, the losses are unlimited
on both sides and for comprehending this, one need not actually dip into the greeks. Using
options skillfully we can reduce these unlimited losses in short straddles and
122

strangles too. For instance, if a trader is having a bearish view on the volatility and he is
assuming a short straddle to gain from his view and he is also concerned about the losses, he
can actually pare down these losses by buying two out of the money options (a call and a put
option) as some sort of protection on either side of the breakeven points. But this comfort is
achieved at the cost of sacrificing some of the potential profit.
A butterfly is an options strategy using multiple puts and/or calls speculating on future
volatility without having to guess in which direction the market will move. A long butterfly
comprises three types of either puts or calls having the same expiration date but different
exercise prices (strikes). For example, with the underlying asset trading at ` 100, a long
butterfly strategy can be built by buying puts (or calls) at ` 95 and ` 105, and selling (shorting)
twice as many puts (or calls) at ` 100. A long butterfly can also be created by selling a Put and
a call that are ATM and buying a put at the lowest strike and a call at the highest strike. Such
a strategy is termed as iron butfeifly, probably named after the popular rock group of the
sixties (Tompkins (1994)).
A long butterfly generates profits that are far lesser than that of a short straddle. So,
this is meant for those investors who intend to profit from a forecast of a range-bound trading
of the underlying stock and are not keen on assuming the risks involved in a short straddle.
The maximum profit is equal to the premium received and the real gains occur in the last few
days to expiry from time decay. The maximum losses occur in either direction when the stock
ends at a price equal to the (strike price of ATM options - net premium) or above the (strike
price of ATM options + net premium). Infact these two points are the breakeven points. To
make sense of this discussion, let us take the help of Greeks for the following data:
Stock price 60 55 put 1.78
Time to expiry 90 days 60 call 4.51
Volatility 25% 60 put 3.84
Interest rate 5% 65 call 2.53
Option Greeks for the long butterfly
Price Delta Gamma Theta Vega
Long 55 put -1.78 -0.264 0.031 -0.017 0.096
Short 60 call 4.51 -0.565 -0.037 0.027 -0.117
Short 60 put 3.84 0.445 -0.038 0.02 -0.117
Long 65 call -2.53 0.389 0.036 -0.025 0.114
Net 4.04 0.005 -0.008 0.005 -0.024
123

Long butterfly profit/(loss) diagram
Long butterfly is an interesting strategy in that it is generally a short yolatility strategy
though this is a long position. The strategy diagram in Figure shows very clearly that losses
are limited on both side and so are the profits. From the greeks in Table it can be noted that
the delta of the position is positive but very insignificant in magnitude. Hence for a small
change in the underlying, the position is unaffected. Just as with the premium, the delta of a
long butterfly is also interesting - delta is positive when the stock price is below the middle
strike of the butterfly, neutral when the stock price is at the middle strike and negative when it
is above the middle strike. Hence in this example the delta is almost zero since the current
prhtocquahahtrike (straddle’trikrice). Thereforehe butterfly maximizes its value when the price of the stock is at the middle strike and if the
price of the stock is below the middle strike, it has to rise for the butterfly to make money;
hence the positive deltas. But if the price of the stock is above the middle strike, it has to fall
for the butterfly to make money; so the deltas are negative.
The position is having a positive theta and a negative vega. Therefore, a long butterfly
will profit from time decay. If the underlying is near about ` 60, the profits are maximum and
will accelerate most rapidly in the last few days before expiry. For instance, net theta before
three days is 0.259. It is important to note that theta will be positive when the price of the
stock is at the middle strike, indicating that elapsing time helps the long butterfly realize its
maximum benefit and at the outer strikes theta is negative, indicating that the butterfly is
losing value as time passes.
However, the position is vega negative. Hence any increase in implied volatility will
be unfavorable. The impact is felt more on the two ATM options than those that are OTM.
124

The extent of losses will depend to a large extent on the amount of time to expiry and how
neahrhe unlyinhe exercisrhen the ung’rhe
middle strike, the vega of the long butterfly is negative, meaning that any rise in the implied
volatility will be a g proptios intuitively appeag a butterfly’s value
depends on the likelihood that the stock price will be at its middle strike at expiration and
higher volatility decreases the possibility of the stock remaining at the middle strike price. As
a result, the butterfly will lose out when implied volatility rises. Considering the vega, a long
butterfly will be initiated by a trader when the implied volatility is near to historic hs. Finally,
lookinhutterfly’tructurae unstoohautterfls nothing but a combination ot
➢➢ Short straddle + Long strangle, or ➢➢ Bear call spread + Bull put spread
Long butterfly = Short straddle +Long Strangle
A short butterfly strategy is just the opposite. It is a limited-risk, limited-gain strategy
to translate a bullish view (betting on an increase in) on the volatility of the underlying. A
short butterfly is established by buying a put and a call that are ATM and selling a put and a
call that are OTM. By buying the ATM options and selling OTM options, the position has its
greatest loss when the underlying does not move, and gains are maximized when the
underlying moves beyond either of the outside exercise prices. Therefore, a short butterfly
strategy profits as equally from a large move up as it does from a large move down. The
profit/loss diagram for a short butterfly with the following data is depicted by Figure
Stock price 60
Time to expiry 90 days
Volatility 25%
Interest rate 5%
55 put 1.78
125

60 call 4.51
60 put 3.84
6
5 call 2.53
The short butterfly is established by going long in the 60 ATM call and put options
while selling the 55 put and 65 call OTM options. Short butterfly can also be constructed
using only call options or only put options. These strategies are termed as regular butterflies.
A regular call butterfly involves a long position in two ATM 60 call options and a short
position in one 55 call and a 65 call option. Similarly, the regular butterfly from only put
options include long position in two ATM 60 puts and a short position in one 55 put (OTM)
and one 65 put which is an ITM put option The profit/loss diagrams of regular butterflies will
be the same as that of iron butterflies and is shown in Figure.
Short butterfly profit/(loss) diagram
A short butterfly can also be visualized as a combination of short strangles and a short
straddle. This will become obvious if we juxtapose the profit/loss diagrams of these two
strategies and compare it with the diagram of short butterfly. Figure shows the same.
Short butterfly = Long straddle + Short strangle
126

Condors
A condor is nothing but a modified butterfly. The major difference between a butterfly
and a condor is that whithe butterfly’s body (the trapezoidal shape of the option profit/loss
diagram shown in Figure) consists of buying two units of ATM options, the condor’odses
separattrikes anhereforidereanhaaider area in which its body produces a profit.
Therefore, by using a condor rather than a butterfly, the range in which the maximum
profit can be realized is stretched out and in the process, the breakeven points also get
extended
Stock price 60
Time to expiry 90 days
Volatility 25%
Interest rate 5%
50 put 0.261
55 put 0.875
65 call 1.42
70 call 0.33
A long condor is established by:
➢➢ Selling 55 put option
➢➢ Selling 65 call option
➢➢ Buying 50 put option
➢➢ Buying 70 call option
The two options that make up the body of the condor are the first OTM call and first
OTM put options instead of the ATM options while the wings of the condor are made up of
deep OTM options.
However, in the case of a butterfly, the options used to insure are just OTM options.
As can be noted, the two long positions will give rise to a long strangle and the two short
positions will give rise to a short strangle. In other words, a condor can be understood as the
combination of a long strangle plus a short strangle shown in Figure.
127

Long condor profit/(loss diagram )
Long condor = long strangle + short strangle
Price Delta Gamma Theta Vega
Buy 50 put -0.17 -0.057 0.015 -0.004 0.031
Sell 55 put 0.875 0.205 -0.038 0.01 -0.082
Sell 65 call 1.42 -0.323 -0.047 0.017 -0.106
Buy 70 call -0.495 0.149 0.03 -0.009 0.066
Net 1.63 -0.026 -0.04 0.014 -0.091
From Table one can note that the long condor involves a cash inflow of ` 1.63 per
condor which is the maximum profit and occurs when the stock ends up between ` 55 and ` 65. The position suffers the maximum loss when the stock is at or below ` 50 and at or
above ` 70. At ` 50, all the options excepting the 55 put will expire worthless and since this
option is written by the condor owner, he has to buy the stock at ` 55 when the spot market
128

price is ` 50. In the bargain he will be losing ` 5 but since he received ` 1.63 as the premium,
his net loss will equal ` 337 (-5 + 1.63 = ` -3.37). Similarly, if the stock ends up at ` 70, all the
options will be allowed to lapse except the 65 call which was sold.
The condor buyer will be assigned this option and he has to deliver the underlying at `
65 when the going price is ` 70, resulting in a loss of ` 5. But since he received ` 1.63 as
premium, his losses will be pared to ` 3.37 (-5 + 1.63 ` -3.37). The breakeven point on the
lower side is at ` 53.37 (55 - 1.63 = ` 53.37) and ` 66.63 (65 + 1.63 = ` 66.63) on the other
side.
In essence, a condor buyer expects that stock prices remain range-bound more clearly
between the strikes of the short strangle. i.e., ` 55 and ` 65 since only in this area his profits
are maximum. But if the stock ends up outside this range, it is certain that one of the options
will be in-the-money and he will start losing money beyond the breakeven points.
Table presents the Greeks and the net delta of the position is almost negligible but the
gamma is almost five times that of a butterfly, which makes the condor more sensitive to
price swings.
Since the position involves selling less OTM options, and buying deep OTM options,
the position will be benefited if implied volatility decreases and the benefits are more than
that for a butterfly since the vega is more negative for condor than for a butterfly. In addition
to this, the position will benefit from positive theta and theta benefits will increase as the
spread’iratearyoweverhrofits arenlly loce it involves selg OTM options that are traded at low
prices.
A short condor involves the following:
➢➢ Buying 55 put option ➢➢ Buying 65 call option
➢➢ Selling 50 put option
➢➢ Selling 70 call option
The profit/loss diagram is as shown in Figure, with the maximum loss being limited to
the premium paid while the profits are also limited on either side equaling to ` 3.37 when the
stock ends up at or falls below ` 50 and at or over ` 70, i.e, the strike prices of the sold options
become a key reference point from where profits will be maximum. Therefore, the seller will
make money if there is a drastic fall or rise in the stock price.
129

Short condor profit/(loss) diagram
Since we have seen almost all of the important volatility strategies, let us try to
compare each of them against the profits and risks involved with them. To facilitate our
analysis, let us bring all the profit/loss diagrams together:
Comparison of voltality strategies
It is clear that the straddles are most rewarding strategies for trading volatility,
followed by strangles, butterflies and then condors. The higher profits with straddles are
associated with higher risks also and theoretically the risks are unlimited for straddles and
strangles. Infact with strangles, the profitable zone was extended but the probability of higher
losses is also increased. While butterflies cut down the unlimited losses, they also
130

reduce the potential profits. And finally, the condor is a low-risk and low-profit strategy.
Similar inferences can also be drawn for volatility buying strategies too.
Horizontal Spreads
These spreads allow investors to gain from the time decay of options with minimal
risks. These spreads are also termed as calendar spreads or time spreads. To fix our thoughts
we know that all long option contracts lose their value as expiry date draws by and this is
captured by theta. Similarly, option writers benefit from time decay. Another important aspect
about theta is that it is higher when the option is closer to maturity and lower when it is far
from maturity.
For instance, the Theta - Time to expiry diagram is given in Figure for an ATM call
option with (S 60, X = 60, r = 5%, o7= 35%) it can be noted that loss of value when the option
is to expire in 90 days is ` 0.027 while it becomes 0.037 when the maturity is 45 days and it is
0. 105 if the time to expiry is just 5 days. We can infer that if the price of the underlying
remains more or less unchanged the price decline for long options is less than that for a short
dated option. So it appears that it will be profitable by selling options, which are close to
maturity, and buying options that are far from maturity.
Theta vs time to expiry
Long time spreads or long calendar spreads use the same principle - write an option
thairing in a shorerioimeultaneousluyingptioithame
exercise price and with a life that is longer than the option written. In a neutral market, i.e.,
when the market is moving in a narrow range, time spreads will be a good strategy to make
money without the risk of naked sold position. Assume we established a long calendar spread
with the following options:
131

Stock price 60
Volatility 35%
Interest rate 5%
Long 60 call option 90 days to expiry
Short 60 call option 30 days to expiry
We will understand the time spread with the help of profit/loss diagram and greeks. As
the time spread involves two expiry months, it is not possible to construct an accurate
profit/loss profile at the expiry of the written option. At the time of initiation, the value of the
purchased option, as at expiry of the sold option, can only be estimated using BSOPM or
similar such pricing models.
Long calendar speed
Option Greeks for the long calendar spread
Price Delta Gamma Theta Vega
Buy 90 day call -4.51 0.565 0.037 -0.027 0.117
Sell 30 day call 2.52 -0.538 -0.065 0.044 -0.068
Net -1.99 0.027 -0.028 0.017 0.049
At the time of initiation of the spread, it is also difficult to predict exactly the
maximum profit from the spread for the reason mentioned above. But the maximum loss is
the net premium paid at the time of constructing the spread. This will be incurred when the
long call has little time value at expiry, i.e., when the stock has risen/fallen very sharply. The
spread has two breakeven points - one point is to the left of the strike price and the other to
the right of the strike price. If the stock moves significantly, the spread will lose money.
132
The profit will be maximum when the stock price remains more or less unchanged from the
strike price till expiry of the short-dated call. Then the written call will not be exercised and
the buyer will capture fully the time value of the sold call option. Generally there is a
miscontioitimpreadi.e., some investorhahe lonalption’s value
will remain unchanged but it is not so. Infact what happens is that the value of the long call
will depreciate at a lower rate than the theta gains of the written option Figure presents the
profit/loss diagram.
From Table we can note that the delta of the spread is negligibly negative at 0.027.
This is because the spread involves two ATM call options and for ATM options, deltas are
around 0.5. However, since one option is long and the other is short to a large extent, the
deltas are offsetting each other. Therefore, the net delta is almost zero and the spread can be
construed as almost delta-neutral. If the stock price is less than the exercise price, the spread
will have positive deltas and when the stock price is greater than the exercise price, the spread
delta will be negative (to be profitable, the stock price has to come down near to its strike
price). The gamma of the spread is negative and this means the spread will be a losing
proposition for price swings in either direction.
Since the theta is positive, the spread gains from passage of time. The positive theta
indicates that this ATM time spread will benefit if the stock stays where it is (equal to the
strike price) and time flies away. This ATM time spread is having a positive vega, signifying
that the spread benefits if implied volatility rises, and if volatility decreases, the value
decreases. Since the time spread deals with two expiry months, it is important to note that if
volatility rises in the short option (near dated option) and either remains unchanged or falls in
the long option (far dated option), a time spread might lose value. Therefore, one should have
a fair idea of how volatility can change from expiration month to expiration month, as it is a
significant source of risk.
Therefore, a long time spread will be profitable only if the stock price is near to the
strike price at the time of expiry of the short dated option. It is immaterial if the price is above
or below but should be as near as possible to the strike price. Time spreads can be established
with put option; also and the principles that apply in the case of call time spreads hold here
also. A time spread made up of put options, the investor will buy the long dated put option
and write a short dated put option. Both options have the same strike price. Since the put
prices are generally lower than the call option prices, it may appear a bit inexpensive to buy
put spreads. However, the percentage returns are not as attractive as that of call time spreads
since at the time of expiry of the sold option the spread may not he as valuable as a call
spread. In this case also, the profit/loss diagram will have a similar profile. The maximum risk
is the amount he pays initially, as the premium and the spread will be
133

beneficial when the stock remains unchanged or above the exercise price till the expiry of the
written option.
Short calendar spread is exactly opposite to that of the long calendar spread. Instead of
buying a far dated option, the option is sold and another option with the same exercise price
but of near maturity is purchased. So, a short time spread using call options involve
purchasing a call option that will be expiring in a short period of time and selling a call option
that has a longer period of time for expiration but both of them have the same strike price.
Through this spread, one expects to gain from a decline in the underlying stock price before
the expiration of the sold call option. Actually the near term call option that is purchased will
protect the trader from any price rises over the short term. The profit loss diagram for a short
time spread is shown in Figure.
Short time spread
When the spread is established, there is a cash inflow of ` 1.99 and the delta of the
spread is slightly negative at 0.027 shown in Table. But as discussed earlier, the delta value is
dependent on. where the stock price is relative to the strike price. Since the spread involves
two ATM calls (in opposite directions), the delta is almost zero. Gamma of the spread is
positive, meaning the spread will make money when the underlying stock price changes
steeply. The theta for the short call spread is negative. This is because the spread includes a
long position in an option which will expire in a few days of time and for such options theta is
highest. Hence the seller loses money even if the stock price remains unchanged. The spread
is having a negative Vega. So the seller will benefit if implied volatility reduces after the
position is initiated and if the implied volatility increases, the spread will start losing out.
Time spreads also reveal another interesting aspect probably. For the first time, we came
across a position where the gamma and the vega are working to each other, i.e., they
134

have opposite signs for long and short time spreads whereas in all other strategies that were
discussed thus far have these two working together i.e., have the same sign.
Option Greeks for the Short calendar spread
Price Delta Gamma Theta Vega
Sell 90 day call 4.51 –0.565 –0.037 0.027 –0.117
Buy 30 day call –2.52 0.538 0.065 –0.044 0.068
Net 1.99 –0.027 0.028 –0.017 –0.049
Other Important Strategies
We will see some more volatility strategies that are popular with traders but the main
feature of these strategies is that their profit/loss profiles that are not symmetrical. Unlike the
strategies we have already considered viz., straddles, butterflies.
Ratio and Back Spreads
These involve buying one option contract and selling another option contract but of
different features or more precisely of different strike prices but of the same expiry month.
They can be set up using exclusively call options or put options. In this way, they can be
considered as an extension of the vertical trades, namely bull call spreads etc.
Ratio Call Spread
A 1 by 2 ratio call spread involves buying one call option and selling two call options
at a higher strike price. So, the long option is actually financed by the short position in two
options. This strategy benefits if the underlying is likely to move slightly or is relatively
stable over the short term; then these spreads are not without much risk. But if the stock
moves up sharply, the extra short option exposes the trader to unlimited risk since by
definition a ratio spread involves shorter than long options. Let us see this more closely with
the help of an example
Stock price 155
Time to expiry 90 days
Volatility 23%
Interest rate 6%
150 call ` 11.12
165 call ` 4.08
135

Option Greeks for the ratio call spread
Price Delta Gamma Theta Vega
Buy 1 150 call –11.12 0.68 0.02 –0.051 0.274
Sell 2 165 calls 8.16 –0.74 –0.042 0.092 –0.576
Net –2.96 –0.06 –0.022 . 0.041 –0.3020
Ratio call spread profit/ (loss) diagram
At the time of establishing the spread, there is a cash outflow of ` 2.96 from Table and
the maximum profit occurs to the trader when the stock ends up at ` 165 (the strike price of
the sold options) see Figure. At this price, the sold call options will not be exercised and the
bought option will be in-the-money by an amount of ` 15.00. If we deduct the premium paid
for initiating the spread, the maximum profit works out to ` 15 - 2.96 = ` 12.04. If the stock
price falls, there is a limited loss of ` 2.96, being the premium paid to initiate the spread.
There are two breakevpoints, i.e165 ± maximprofiIf the ung’s pr moves up, the trader faces unlimited losses. The more the number of naked options, the larger
will be the amount of losses. Therefore, the spread will be profitable only if the stock is
expected to move slightly but if a strong upward move is expected, the trader may incur
serious losses.
The delta of the spread is slightly negative at 0.06, but is of no concern since it is
negligibly low. So the position can be construed as delta neutral. This call viewed from
another perspective also - buying a 150 call and selling a 165 call is nothing but a 150/165
bull call spread which has bullish bias. To this we added a short 165 call which has a bearish
bias neutralizing the bullish view of the bull call spread. Therefore, the resultant spread will
136

be neutral to the market direction. The spread is having a negative gamma and it indicates that
delta will move to hurt the trader when stock price moves up or down. Forinstance, when the
stock price moves up by ` 2, the short calls will lose ` 2.96 while the long call will gain only `
1.36, resulting in a loss of ` 1.60. And if the stock price falls, the trader will neither be gaining
nor losing as his losses in the event of stock decline are capped at ` 2.96. The spread is having
a negative Vega. Therefore, the spreader would like the implied volatility to stay still or to
decline and if implied volatility increases, the spread will lose out at the rate of ` 0.302 per
1% increase in implied volatility. As with all the volatility selling strategies, this will be
beneficial when the volatility is at historic highs. The trader will also benefit from time decay
since the theta is positive for the ratio call spread but it has to be notehahorer
thurrenrhtochhort’trikrhs will he the theta value and hence lower will be the time decay gains.
Ratio Put Spread
A ratio put spread involves buying the higher strike price put option and selling two
lower strikes priced put options, resulting in a net short position. If the stock price rises
sharply, there will be less risk since all the puts will expire worthless but if the stock price
declines, the spread will result in unlimited losses. As with ratio call spread, this spread is
likely to benefit when a slight down trend in the stock is expected. Since the maximum profit
occurs when the stock is at lower strike, the trader desires the stock to move more towards the
strike price of the short put; nothing higher and nothing lower is desired. Figure shows the
profit/loss diagram for a Ratio put spread.
Ratio put spread profit/(loss) diagram
137

Option Greeks for the ratio put spread
Price Delta Gamma Theta Vega
Buy 1 165 put -12.18 -0.678 0.024 -0.024 0.288
Sell 2 150 puts 8.06 0.668 -0.042 0.056 -0.548
Net -4.12 -0.01 -0.018 0.032 -0.26
From Table one can see that a put ratio spread is also a debit spread, meaning there is
a cash outflow when the spread is initiated and the spread is neutral to the market since the
delta is almost zero. The gamma of the spread is negative, which implies that the spread will
have positive deltas when stock price declines and will have negative deltas when stock price
rises resulting in loses for the trader. This is another volatility selling strategy.
Since the Vega is negative, any increase in implied volatility will impact the spread
unfavorably but the trader will gain from positive theta. Here again, if the stock price is near
to the long strike price, theta benefits will be lower.
Back Spreads
A back spread is established by buying more options than the number of sold options
while a ratio spread involves more number of options written than the number of options
purchased.
Conventionallyhratioinehumber optionrittvhe
number optionoughnenllepresentes ‘1 against 2’ oy 2’eag
two options are sold against one bought option.
There is no limit to the ratio, hence innumerable ratio spreads are possible but for our
discussion we will make use of the 1 by 2 spreads. Tompkins (1994) refer to these as leaning
volatility strategies since at inception they may be delta neutral and appear as volatility
tuhpreherently involves sompeculatiohe ung’olatility.
Call back spread: Call back spreads are just the mirror images of the ratio call spreads.
In the case of ratio call spread, the position will lose if the underlying moves sharply but in
the case of call back spreads; the trader desires the stock to make a large jump so that his
profits will be maximized. These are established with two long options and one short call
option. The strike price of the long options is higher than that of the short option. Consider the
call back spread created with the following data:
138
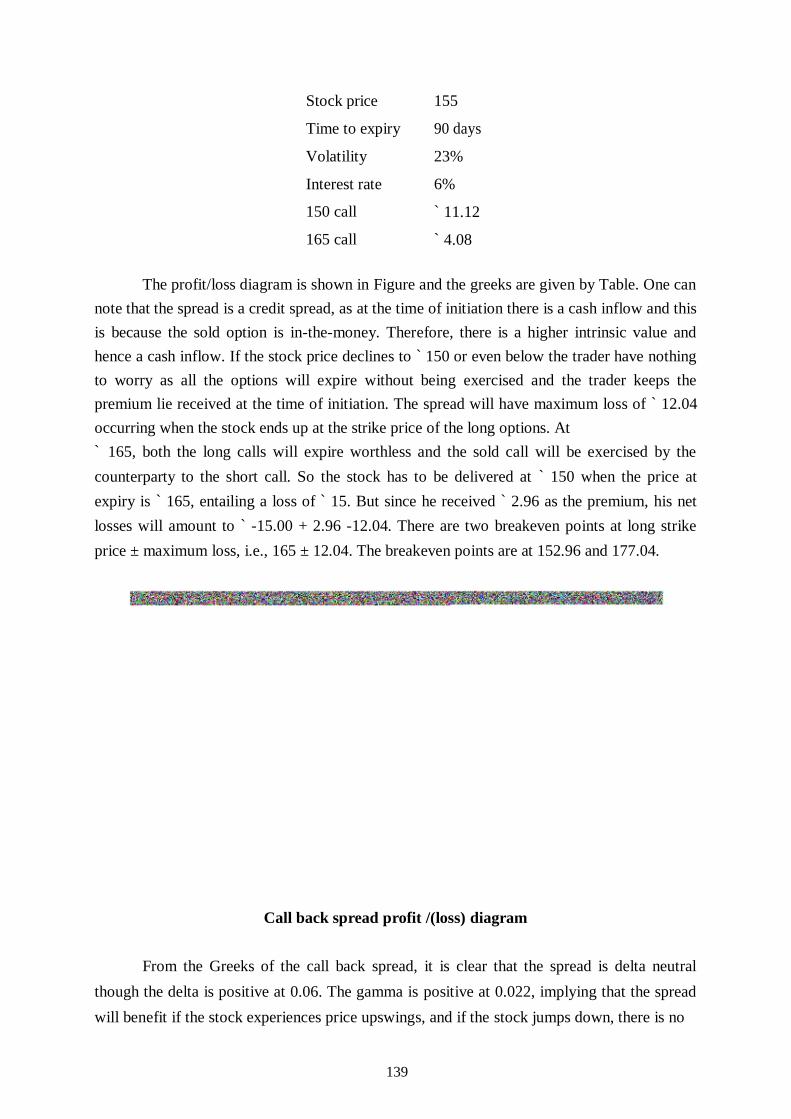
Stock price 155
Time to expiry 90 days
Volatility 23%
Interest rate 6%
150 call ` 11.12
165 call ` 4.08
The profit/loss diagram is shown in Figure and the greeks are given by Table. One can
note that the spread is a credit spread, as at the time of initiation there is a cash inflow and this
is because the sold option is in-the-money. Therefore, there is a higher intrinsic value and
hence a cash inflow. If the stock price declines to ` 150 or even below the trader have nothing
to worry as all the options will expire without being exercised and the trader keeps the
premium lie received at the time of initiation. The spread will have maximum loss of ` 12.04
occurring when the stock ends up at the strike price of the long options. At ` 165, both the long calls will expire worthless and the sold call will be exercised by the
counterparty to the short call. So the stock has to be delivered at ` 150 when the price at
expiry is ` 165, entailing a loss of ` 15. But since he received ` 2.96 as the premium, his net
losses will amount to ` -15.00 + 2.96 -12.04. There are two breakeven points at long strike
price ± maximum loss, i.e., 165 ± 12.04. The breakeven points are at 152.96 and 177.04.
Call back spread profit /(loss) diagram
From the Greeks of the call back spread, it is clear that the spread is delta neutral
though the delta is positive at 0.06. The gamma is positive at 0.022, implying that the spread
will benefit if the stock experiences price upswings, and if the stock jumps down, there is no
139
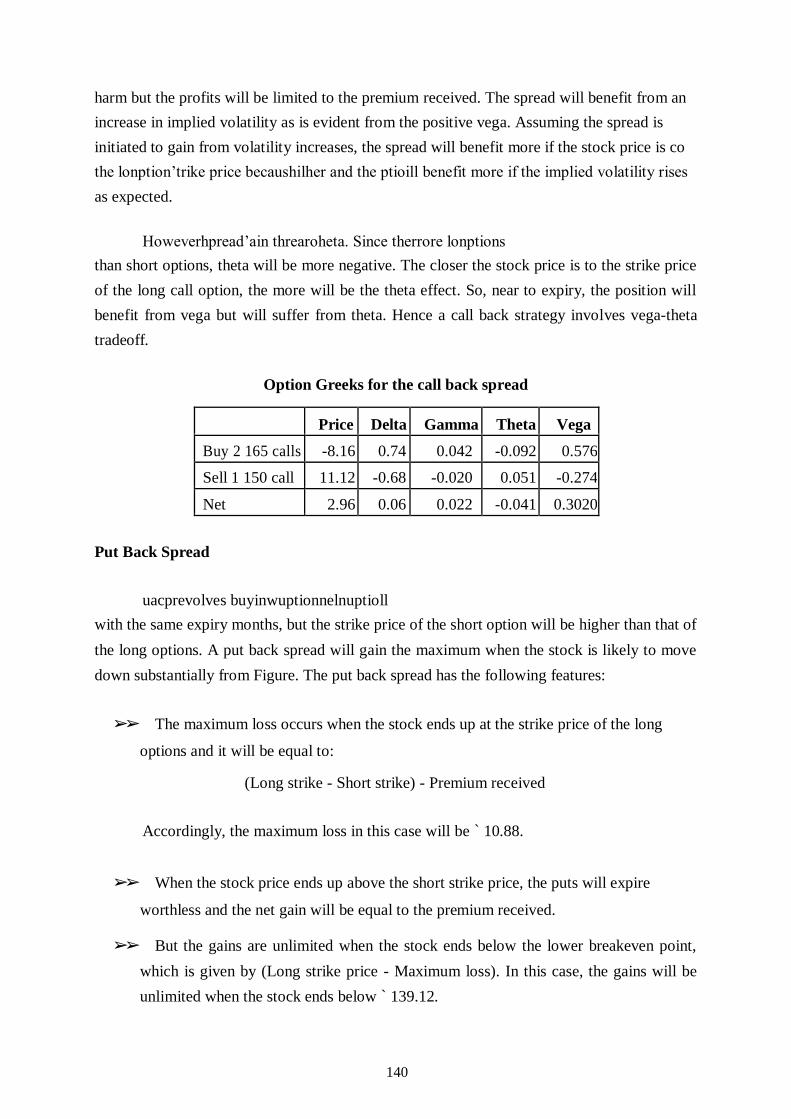
harm but the profits will be limited to the premium received. The spread will benefit from an
increase in implied volatility as is evident from the positive vega. Assuming the spread is
initiated to gain from volatility increases, the spread will benefit more if the stock price is co
the lonption’trike price becaushilher and the ptioill benefit more if the implied volatility rises
as expected.
Howeverhpread’ain threaroheta. Since therrore lonptions
than short options, theta will be more negative. The closer the stock price is to the strike price
of the long call option, the more will be the theta effect. So, near to expiry, the position will
benefit from vega but will suffer from theta. Hence a call back strategy involves vega-theta
tradeoff.
Option Greeks for the call back spread
Price Delta Gamma Theta Vega
Buy 2 165 calls -8.16 0.74 0.042 -0.092 0.576
Sell 1 150 call 11.12 -0.68 -0.020 0.051 -0.274
Net 2.96 0.06 0.022 -0.041 0.3020
Put Back Spread
uacprevolves buyinwuptionnelnuptioll
with the same expiry months, but the strike price of the short option will be higher than that of
the long options. A put back spread will gain the maximum when the stock is likely to move
down substantially from Figure. The put back spread has the following features:
➢➢ The maximum loss occurs when the stock ends up at the strike price of the long
options and it will be equal to:
(Long strike - Short strike) - Premium received
Accordingly, the maximum loss in this case will be ` 10.88.
➢➢ When the stock price ends up above the short strike price, the puts will expire
worthless and the net gain will be equal to the premium received.
➢➢ But the gains are unlimited when the stock ends below the lower breakeven point,
which is given by (Long strike price - Maximum loss). In this case, the gains will be
unlimited when the stock ends below ` 139.12.
140
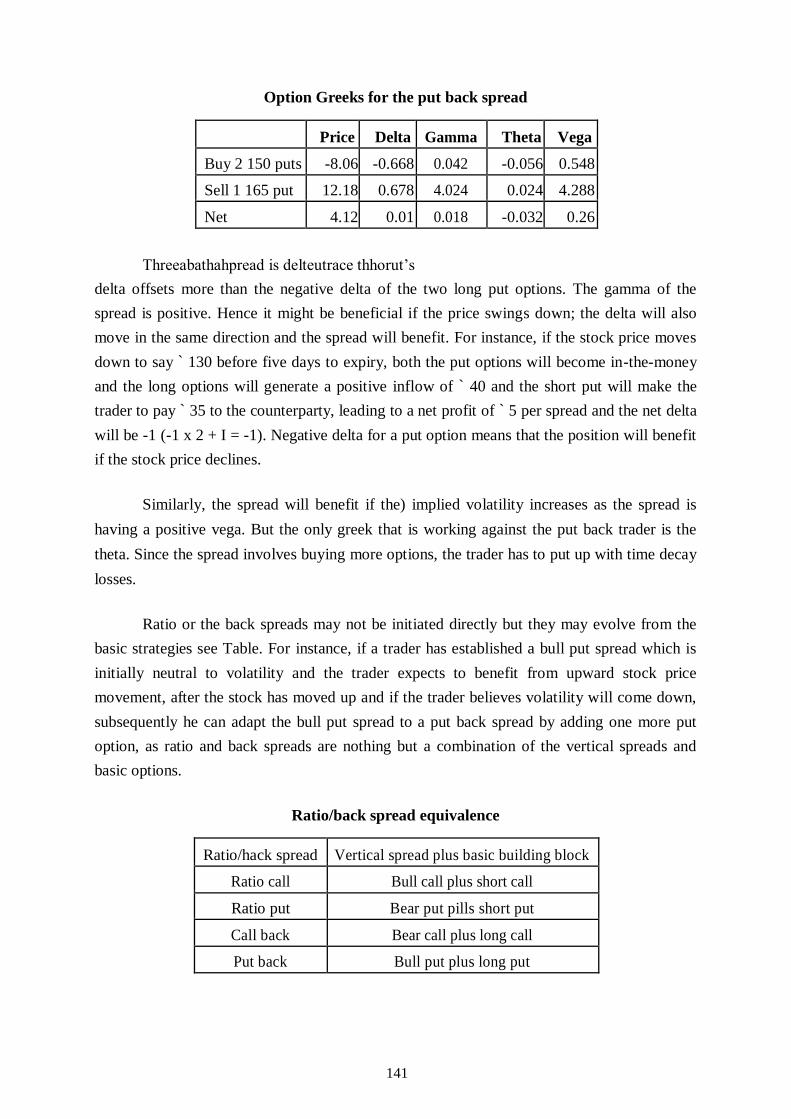
Option Greeks for the put back spread
Price Delta Gamma Theta Vega
Buy 2 150 puts -8.06 -0.668 0.042 -0.056 0.548
Sell 1 165 put 12.18 0.678 4.024 0.024 4.288
Net 4.12 0.01 0.018 -0.032 0.26
Threeabathahpread is delteutrace thhorut’s
delta offsets more than the negative delta of the two long put options. The gamma of the
spread is positive. Hence it might be beneficial if the price swings down; the delta will also
move in the same direction and the spread will benefit. For instance, if the stock price moves
down to say ` 130 before five days to expiry, both the put options will become in-the-money
and the long options will generate a positive inflow of ` 40 and the short put will make the
trader to pay ` 35 to the counterparty, leading to a net profit of ` 5 per spread and the net delta
will be -1 (-1 x 2 + I = -1). Negative delta for a put option means that the position will benefit
if the stock price declines.
Similarly, the spread will benefit if the) implied volatility increases as the spread is
having a positive vega. But the only greek that is working against the put back trader is the
theta. Since the spread involves buying more options, the trader has to put up with time decay
losses.
Ratio or the back spreads may not be initiated directly but they may evolve from the
basic strategies see Table. For instance, if a trader has established a bull put spread which is
initially neutral to volatility and the trader expects to benefit from upward stock price
movement, after the stock has moved up and if the trader believes volatility will come down,
subsequently he can adapt the bull put spread to a put back spread by adding one more put
option, as ratio and back spreads are nothing but a combination of the vertical spreads and
basic options.
Ratio/back spread equivalence
Ratio/hack spread Vertical spread plus basic building block
Ratio call Bull call plus short call
Ratio put Bear put pills short put
Call back Bear call plus long call
Put back Bull put plus long put
141

Key Terms
Back spread Collar Ratio spread
Bear call Condor Straddle
Bear put Covered call Srangle
Bull call Delta neutral Time spreads
Bull put Directional trades Volatility trades
Butterfly Gamma neutral
Calendar Protective put
Summary
In this chapter we have seen a small set of the various strategies that are possible with
options and their combinations. The kind of payoff profiles that are possible with options and
the underlying assets are innumerable and probably for any desired risk-reward profile, one
can formulate a strategy. The popularly used strategies are classified based on the view onan
ung’ectionolatilityrgly, variouermutationnd
combinations are possible. It is very much difficult to comment upon the motives, payoffs and
risks involved in any given strategy without looking at the greeks. So in comprehending these
option strategies, one has to pay attention to the greeks and profit/loss diagrams. Table
capsulates the strategies discussed in this section for easy and quick reference.
Summary of option strategies
View on
view on
Option Description
Remarks
eing’s volatility
price
Buy a call Strongest bullish option Loss limited to premium
↑ ↓ position
paid
Sell a call Neutral bearish option Profit limiter -
↓ ↑ position
um received
Buy a put Strongest bearish option Loss limited to premium
↓ slight
position
paid
upward
Sell a put Neutral bullish option Profit limiter -
↑ ↓ position
um received
Covered Buy future/stock & sell Collect premium on calls ↔ ↑
Call put.
sold.
Covered Sell future / Stock & sell Collect premium of puts ↑ ↓
Put put
sold.
142

Bull Call Buy a call of lower strike Lted s and profit
Spread & sell a call of higher strategy ↔ ↑ strike price.
Bull Put Buy put of lower strike Lted s and profit
Spread and sell another put with strategy ↔ ↑ higher strike price
Bear Call Buy a call of higher strike Lted s and profit
spread price & sell a call of lower strategy ↔ ↓ strike rice
Bear Put Buy a put of higher strike Lted s and profit
Spread price & sell a put of lower strategy ↔ ↓ strike price
Straddle
Buy put & call
Options will lose time
↑ ↔ Purchase value premium quickly.
Sell Sell call & put
Profit limiter - ↓ ↔
Straddle um received
Sell a Sell out of the money put Maximum use of time ↓ ↔
Strangle & call value decay
Buy a Buy an OTM call and a Can be held for longer
↑ ↔ Strangle put time vis-a-vis straddles
Calendar Sell near month, but far Near month time value
↔ ↔ month, same strike price. decays faster.
Buy at the money Call
(Put) & Sell 2 out of the
Profitain if dont
Butterfly money calls (Puts) & buy ↓ ↔
out of the money Call credit
(put)
Buy Call & Sell Calls of
Movement to
Ratio Call Neutral, slightly bullish ↔ the strike of higher strike price short call
Buy put and sell two puts
Movement to
Ratio Put Neutral, slightly bearish ↔ the strike of
of lower strike price short put
Long call and two short
Limited losses and un-
Call Back limited gains if stock ↑ ↑
calls with lower strikes moves up
Long put and two short
Limited losses and un-
Put Back limiterofitock ↑ ↓
puts of higher strikes moves down
143

Solved Problems
1. The current price of a stock is ` 170 and that the one-period interest rate is 10% with no
compounding. After one period, the price of the stock will be either ` 212 or ` 136. Using
an arbitrage argument, calculate the price of a European call option which expires in one
period with an exercise price of ` 200.
Solution
In this example, S = 170, which can either move to ` 212 or decrease to ` 136 since the risk-
free rate of return is 10% and the strike price is ` 200. This risk-less hedge and arbitrage-free
pricing involves investing in the stock that offsets the position in the call, such that the
portfolio value is known with certainty irrespective of whether the stock price increases or
decreases.
Assume the position consists of I sold call, which is offset by holding A units of the asset
The value ohAereuchailakhortfoiss. This
means that the value of the portfolio will be same for both an increase and decrease in the
asset price.
Portfolio is risk-less i.e. the value of the portfolio remains the same whether stock
price moves up or down therefore 212∆— 12 = 136∆ or ∆ = 12/76, i.e., to hedge I short call it
will be necessary to hold 12/76 units of the stock, in which case whether there is an up or
down movement, the portfolio has a value of ` 21.47 as at the expiry of the option. In the
absence of arbitrage, a risk-less portfolio should earn the risk-free rate of interest and since we
know the final (expiry) value of the portfolio, we can find the same at the initial point,
144

i.e., at t = 0. Therefore, the PV of the risk-less portfolio will be = e-rT. Value of PF at expiry
= e-0.10x1 x 21.47 = 19.43.
The fair value of the option can now be calculated using the known value of the
portfolio of assets at the initiation of the deal at t = 0:
Value of the asset portfolio - Option premium = Value of risk-less portfolio
12/76 x 170 - Option premium = 19.43 Option premium = 7.41
2. A stock is currently trading at ` 50. Over the next two months, the stock will either move
up by 25%, or down by 20%. The risk-free rate is 1.00% per month. In exactly one month,
the stock will pay a dividend which will be equal to one-tenth (or 10%) of the stock price
at that time. If all writes a two-month, two-period option with X = 50, find the price of a
two-month American call and a put option.
Solution
1 1
= 0.80 and p =
e0.01 - 0.80
u = 1.25; d =
=
= 0.4668 u 1.25 1.25 - 0.80
The binomial stock price tree is as given in the following figure.
Now using the backward induction procedure, we will price this American style call
option. Sirsinhption’eral value thihown in thollowinigure.
145

Then uhnerioormula, wilinhption’s value at t = 1.
Pu = e-001 [0.4668 x 20.31 + 0.5332 x 0] = 9.3859
and pd = 0
So the updated option tree will be as given in the following figure for a European style
But since this is an American style call option, we have to verify whether it will be
beneficial to exercise the option at t = 1. We also know from Chapter 8, that an option with
early exercise feature can be exercised just prior to the moment the stock goes ex-dividend.
Therefore, if we exercise the option, it will lead to a cash inflow equivalent to ` 62.5 - 50 =
12.50, which is greater than the theoretical price of ` 9.3859. Hence from this node onwards,
the value of the option is treated as 12.50 for subsequent calculations.
So the value of the option at t = 0 is given as:
P0 = e-001[0.4668 x 12.50 + 0.5332 x 0] = 5.7769
146

The final option tree diagram is shown in the following figure
Similarly, the put option price can be found as shown in the following figure
At t = 1, the computed option price in the upstate is ` 2.395 whereas exercising the
option will result in an outflow of ` 6.25. Hence ` 2.395 will be the price for further
calculations. On the other hand, in the downward node, the calculated option price is ` 13.505
whereas exercising the option results in a positive cashflow of ` 50 - 36 = ` 14, which will be
considered as the option price for further calculations.
3. Show that Black-Scholes model obeys the fundamental put-call parity.
Solution
According to put-call parity, the call and put prices are linked as:
C – P = S – Xe-rt
147
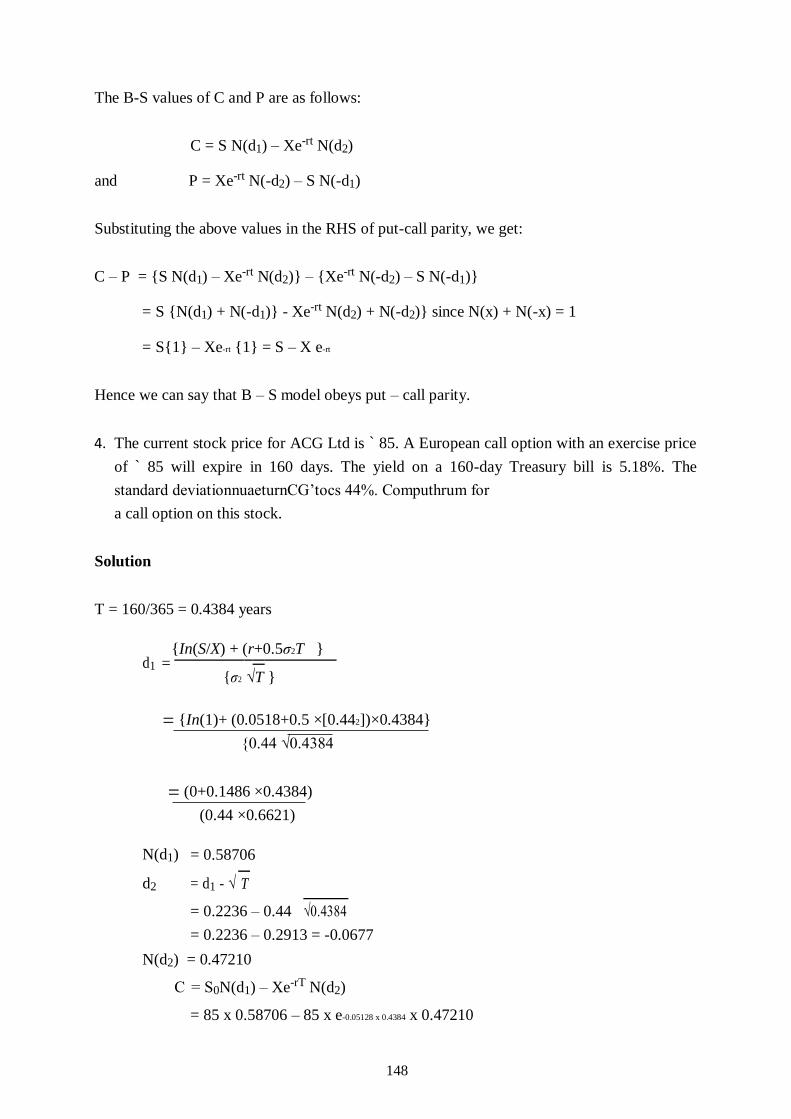
The B-S values of C and P are as follows:
C = S N(d1) – Xe-rt N(d2)
and P = Xe-rt N(-d2) – S N(-d1)
Substituting the above values in the RHS of put-call parity, we get:
C – P = {S N(d1) – Xe-rt N(d2)} – {Xe-rt N(-d2) – S N(-d1)}
= S {N(d1) + N(-d1)} - Xe-rt N(d2) + N(-d2)} since N(x) + N(-x) = 1
= S{1} – Xe-rt {1} = S – X e-rt
Hence we can say that B – S model obeys put – call parity.
4. The current stock price for ACG Ltd is ` 85. A European call option with an exercise price
of ` 85 will expire in 160 days. The yield on a 160-day Treasury bill is 5.18%. The
standard deviationnuaeturnCG’tocs 44%. Computhrum for
a call option on this stock.
Solution
T = 160/365 = 0.4384 years
d1 = {In(S/X) + (r+0.5σ2T }
{σ2 √T }
= {In(1)+ (0.0518+0.5 ×[0.442])×0.4384}
{0.44 √0.4384
= (0+0.1486 ×0.4384)
(0.44 ×0.6621)
N(d1) = 0.58706
d2 = d1 - √
T
= 0.2236 – 0.44
√0.4384
= 0.2236 – 0.2913 = -0.0677
N(d2) = 0.47210
C = S0N(d1) – Xe-rT N(d2)
= 85 x 0.58706 – 85 x e-0.05128 x 0.4384 x 0.47210
148

= 49.901 – 85 x 0.97777 x 0.47210
= 49.900 – 39.236
C = ` 10.67
5. You wish to purchase a call option on a local warehouse having an expiration date of one
year and an exercise price of ` 10,00,000. The warehouse owner will not sell you such an
option but is willing to sell the warehouse for ` 11, 00,000. The current risk-free interest
rate is 9% per year, and insurance on a one-year, ` 10,00,000 loan would be ` 10,000 How
would you create a synthetic call option on the warehouse?
Solution
Buy the warehouse - ` 11, 00,000
Obtain a loan ` 9, 17,431.2
(PV of ` 10, 00,000 at 9%)
Purchase insurance - ` 10,000
Net cost of the synthetic call - ` 1, 92,568.8
6. Consider the following options on a single stock:
Calls Put C
A B
Months of expiration 3 9 3
Continuous yearly risk-free rate (Rt)
10.00% 10% 10.00% (Treasury Bills)
Discrete yearly Rf 10.52% 10.52% 10.52%
Standard Deviation of stock returns 40% 40% 40%
Exercise price ` 55 ` 55 ` 55
Option price ` 2.56 - ` 6.20
Stock price ` 50 ` 50 ` 50
Cash Dividend ` 0 ` 0 ` 0
(a) Why should call B Sell for more than Call A?
(b) Is the put-call parity model working for options A and C?
(c) How would you trade call A, the stock, and risk-free security in order to replicate the
expiration date outcomes of put C?
149
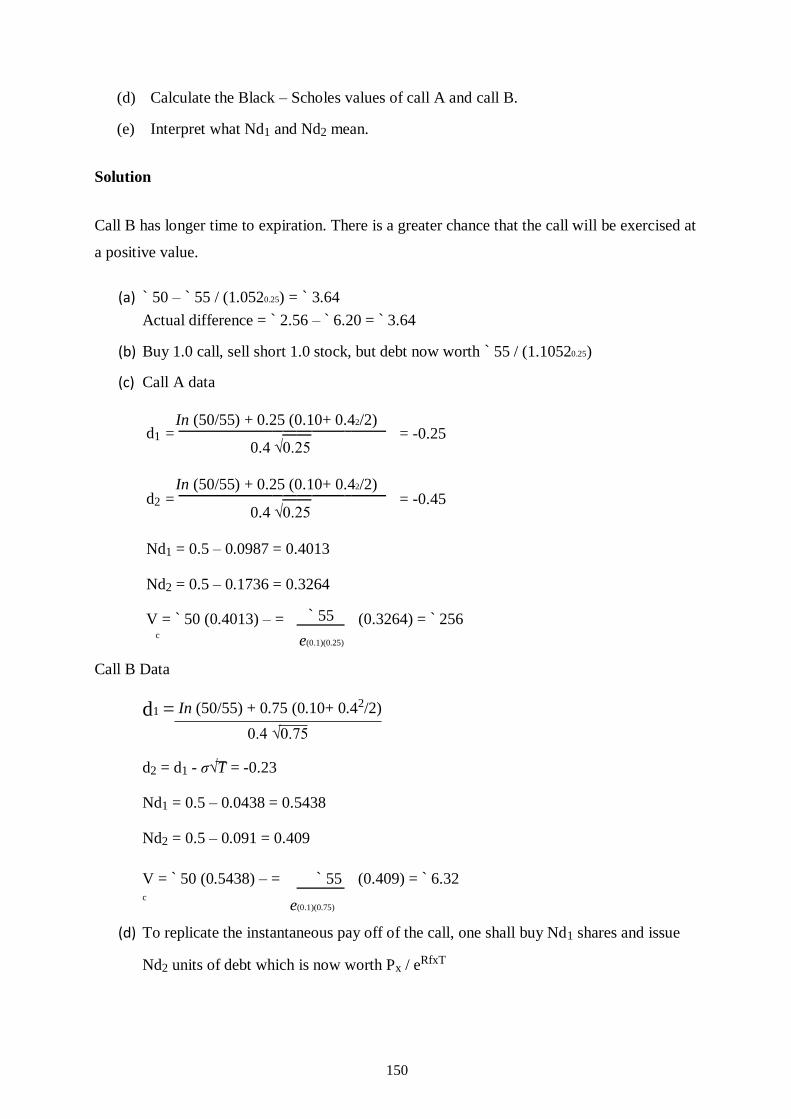
(d) Calculate the Black – Scholes values of call A and call B.
(e) Interpret what Nd1 and Nd2 mean.
Solution
Call B has longer time to expiration. There is a greater chance that the call will be exercised at
a positive value.
(a) ` 50 – ` 55 / (1.0520.25) = ` 3.64 Actual difference = ` 2.56 – ` 6.20 = ` 3.64
(b) Buy 1.0 call, sell short 1.0 stock, but debt now worth ` 55 / (1.10520.25)
(c) Call A data
d1 = In (50/55) + 0.25 (0.10+ 0.42/2)
= -0.25
0.4 √0.25
d2 = In (50/55) + 0.25 (0.10+ 0.42/2)
= -0.45
0.4 √0.25
Nd1 = 0.5 – 0.0987 = 0.4013
Nd2 = 0.5 – 0.1736 = 0.3264
V = ` 50 (0.4013) – = ` 55 (0.3264) = ` 256
c e(0.1)(0.25)
Call B Data
d1 = In (50/55) + 0.75 (0.10+ 0.42/2)
0.4 √0.75
d2 = d1 - σ√T = -0.23
Nd1 = 0.5 – 0.0438 = 0.5438
Nd2 = 0.5 – 0.091 = 0.409
V = ` 50 (0.5438) – = ` 55 (0.409) = ` 6.32 c
e(0.1)(0.75)
(d) To replicate the instantaneous pay off of the call, one shall buy Nd1 shares and issue
Nd2 units of debt which is now worth Px / eRfxT
150
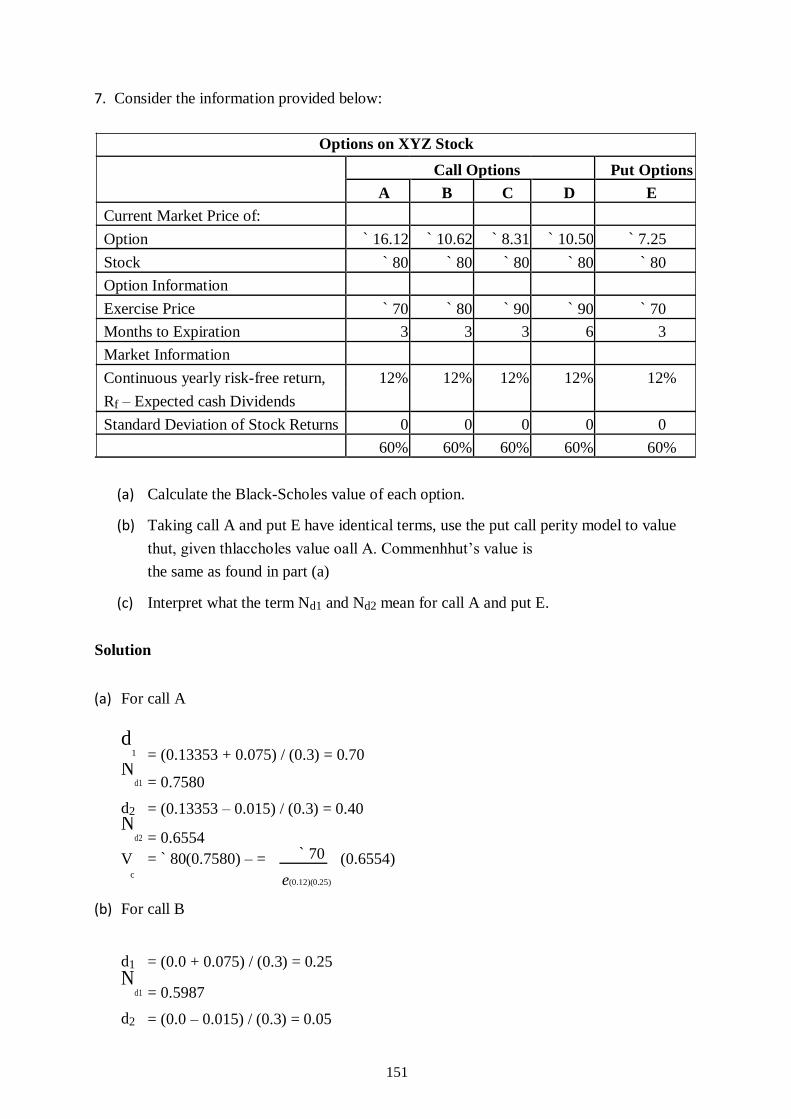
7. Consider the information provided below:
Options on XYZ Stock
Call Options Put Options
A B C D E
Current Market Price of:
Option ` 16.12 ` 10.62 ` 8.31 ` 10.50 ` 7.25
Stock ` 80 ` 80 ` 80 ` 80 ` 80
Option Information
Exercise Price ` 70 ` 80 ` 90 ` 90 ` 70
Months to Expiration 3 3 3 6 3
Market Information
Continuous yearly risk-free return, 12% 12% 12% 12% 12%
Rf – Expected cash Dividends
Standard Deviation of Stock Returns 0 0 0 0 0
60% 60% 60% 60% 60%
(a) Calculate the Black-Scholes value of each option.
(b) Taking call A and put E have identical terms, use the put call perity model to value
thut, given thlaccholes value oall A. Commenhhut’s value is
the same as found in part (a)
(c) Interpret what the term Nd1 and Nd2 mean for call A and put E.
Solution
(a) For call A
d1 = (0.13353 + 0.075) / (0.3) = 0.70
Nd1 = 0.7580
d2 = (0.13353 – 0.015) / (0.3) = 0.40 N
d2 = 0.6554 ` 70
V = ` 80(0.7580) – = (0.6554)
c e(0.12)(0.25)
(b) For call B
d1 = (0.0 + 0.075) / (0.3) = 0.25 N
d1 = 0.5987
d2 = (0.0 – 0.015) / (0.3) = 0.05
151

Nd2 = 0.48
` 70
V = ` 80(0.5987) – = (0.48)
c e(0.12)(0.25)
= ` 10.62 (c) For call C:
d1 = (-0.11778 + 0.075) / (0.3) = 0.14 N
d1 = 0.4443
d2 = (-0.11778 – 0.015) / (0.3) = 0.44 N
d2 = 0.33 ` 90
V = ` 80(0.4443) – = (0.33)
c e(0.12)(0.25)
= ` 6.72
(d) For call D:
d1 = (-0.11778 + 0.015) / (0.4243) = 0.08 N
d1 = 0.5319
d2 = (-0.11778 – 0.03) / (0.4243) = -0.35 N
d2 = 0.3632 ` 90
V = ` 80(0.5319) – = (0.3632)
c e(0.12)(0.25)
= ` 11.77
8. Vimal Gupta wrote March 175 naked put option on ABC Textile stock. When the option
was written, the stock sold for ` 180 per share. The option premium was ` 3. How much
margin did Vimal have to deposit?
Solution
The margin required on a naked put option is the larger of two computations:
Method 1:
Option premium
= ` 3 x 100 shares ` 300
tock’arklue ` 3600
= 20% x ` 180 x 100 shares
Lesmountock’arket
152

Price exceedut’s exercisr
= (` 180 – ` 175) x 100 shares 500
Total ` 3400
Method 2:
Option premium
= ` 3 x 100 shares ` 300
tock’arklue
= 10% x ` 180 x 100 ` 1800
Total ` 2100
As the margin calculated by method 1 is greater than that of Method 2, Gupta will
have to deposit ` 3400.
9. Refer to problem (12), what will happen to the theoretical option price if the expected
price volatility is 40% rather than 25%
Solution
Applying the Black – Scholes model:
d1 = In (47/45) + [0.5 (0.4)2]0.5
0.40 √0.5 = 0.4719
d2 = 0.4719 – 0.40 √0.5
= 0.1891
From a normal distribution table:
N (0.4719) = 0.6815 and
N (0.1891) = 0.5750
Then
C = 47(0.6815) – 45 (e-(0.10)(0.5) (0.5750) = ` 7.42
Notice that higher the assumed expected price volatility of the underlying stock.
Price, the higher the price of the call option.
153
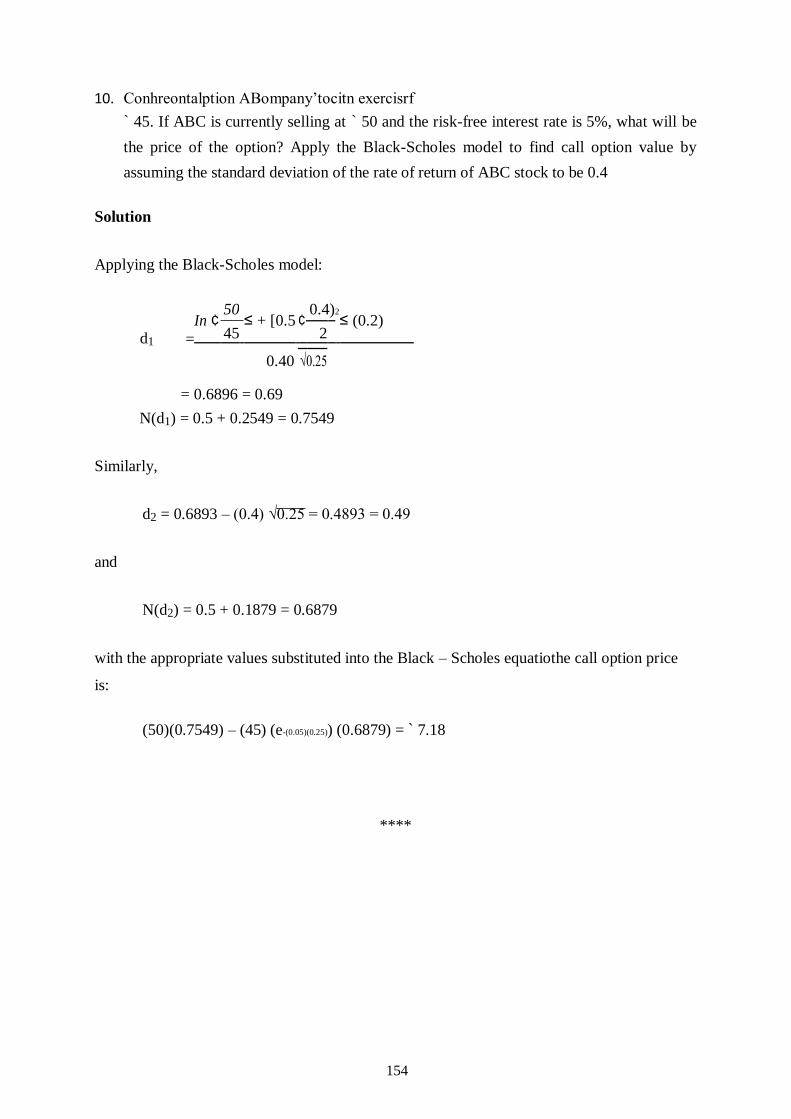
10. Conhreontalption ABompany’tocitn exercisrf ` 45. If ABC is currently selling at ` 50 and the risk-free interest rate is 5%, what will be
the price of the option? Apply the Black-Scholes model to find call option value by
assuming the standard deviation of the rate of return of ABC stock to be 0.4
Solution
Applying the Black-Scholes model:
In ¢
50 ≤ + [0.5 ¢
0.4)2
≤ (0.2)
d1 = 45 2
0.40
√0.25
= 0.6896 = 0.69
N(d1) = 0.5 + 0.2549 = 0.7549
Similarly,
d2 = 0.6893 – (0.4) √0.25 = 0.4893 = 0.49
and
N(d2) = 0.5 + 0.1879 = 0.6879
with the appropriate values substituted into the Black – Scholes equatiothe call option price
is:
(50)(0.7549) – (45) (e-(0.05)(0.25)) (0.6879) = ` 7.18
****
154

Lesson 2.4 - Interest Rate Swaps
Introduction
Need is the mother of invention is a general saying and the evolution of swap as a
financial instrument is the classical and a rather recent example of the proverb. There is near
unanimity among the financial experts that swaps developed out of the constraints and the
regulatory controls with respect to cross-border capital flows faced by large corporations in
the 1970s. When multinational corporations operating in various countries could not remit
funds back and forth among their subsidiaries due to exchange controls exercised by various
governments on the capital flows, they came out with innovations of back-to-back or parallel
loans among themselves. Upon removal of restrictions on the capital flows, these loans later
developed into a full financial product called swaps. Since then the market has grown to be as
large as 414 trillion’ in 2009 as the amount of principal involved in swap transactions and
continues to further grow at a rapid rate.
Parallel loans involve four parties—two multinational corporations and two
subsidiaries in two different countries. Imagine IBM as one USA-based company with a
subsidiary in London and British Telecom as another company having operations in New
York. The subsidiary of British Telecom needs money in US dollar, while the subsidiary of
IBM in London has fund requirements in British pound. Due to regulatory controls neither
IBM USA nor British Telecom can fund their subsidiaries. To overcome the problem British
Telecom can arrange funds in British pound to fund the requirement of the subsidiary of IBM
in London.
Similarly, IBM USA may raise funds in US dollar to fund the operations of British
Telecom in New York. Such an arrangement is called back-to-back or parallel loans. These
amounts would be re-exchanged at maturity at a rate determined in advance. Besides
overcoming regulatory controls, there were other economical advantages that caused the
development of swaps as full blown financial product and became popular even after the
removal of regulatory controls. By this simple arrangement, each firm has access to capital
markets in foreign country and makes use of their comparative advantage of borrowing in
different capital markets. The growth of the swaps has been so phenomenal that in 1984 a
need for standardization, uniform practices for documentation, trading, and settlement was
felt leading to the formation of International Swaps and Derivatives Association (ISDA).
155

Back-to-back/parallel loans posed several difficulties of finding matching parties with
identical needs in terms of amount of principal, timing, and duration of loans, periodicity and
nature (fixed or variable) of interest payments, all of which must match to conclude a
successful deal. Solutions to these problems were found by intermediary banks, and they later
became dealers in swaps from mere arrangers of swaps between two parties. Back-to- back
loans were an example of financial swap, which had its origin in the 1970s. By the early
1980s the same principle was adopted to develop another swap arrangement based on interest
rates known as interest rate swap.
Swap, in the simplest form, may be defined as an exchange of future cash flows
between two parties as agreed upon according to the terms of the contract. The basis of future
cash flow can be exchange rate for currency/ financial swap, and/or the interest rate for
interest rate swaps. Apart from interest rates and currency rates, the formula for determination
of the periodic cash flows can be equity returns, commodity prices, etc. In essence one of the
cash flow would be fixed, called fixed leg, while the other called floating leg would be
variable depending upon the value of the variable identified for the swap.
Interest Rate SWAPS
If the exchange of cash flows is done on the basis of interest rates prevalent at the
relevant time, it is known as interest rate swap. The simplest example of interest rate swap is a
forward contract where only one payment is involved. In a forward transaction of any
commodity the buyer acquires the commodity and incurs an outflow of cash equal to the
forward price, F If the buyer after acquiring the commodity were to sell it for the spot price 5,
then there would be a cash inflow of S. From the cash flow perspective a forward contract for
the buyer is a swap transaction with inflow of S and outflow of F. Likewise, the seller would
have equivalent cash flows in the opposite direction. Therefore, a forward contract can be
regarded as a swap with a single exchange of cash flow; alternatively swap can be viewed as a
series of several forward transactions taking place at different points of time.
Features of SWAP
Usually, interest rate swaps involve payment/receipt of fixed rate of interest for
receiving/paying a floating rate of interest. The basis of exchange of cash flows under interest
ratp is the interest rate. s fixeloating p, commonlnown as ‘plavanilla p’icted in-
Figureherompangrees taompanixed interest
rate of 8.5011/o in exchange of receiving from it the interest at 30 bps (100 bps = 111/6)
above the floating interest rate, Mumbai Inter Bank Offer Rate (MIBOR), at predetermined
intervals of time.
156

‘Plain Vanillanteresatwap
Assuming that the swap between Company A and Company B is (a) for a period of
three years, (b) with semi-annual exchange of interest, (c) on notional principal of
` 50 crores the cash flows for Company A for 6 semi-annual periods for an assumed MIBOR
would be as per Table. What is received/paid by Company A is paid/received by Company B.
With the context of the example just described, the following salient features of the
swap may be noted.
1. Effective Date All the cash flows pertaining to fixed leg are known at the time of
entering the swap at T = 0, referred as effective date.
2. Resetting of Floating Leg Cash Flow The cash flow for floating leg of the swap is
determined one period in advance when the floating rate becomes known. Therefore,
at the time of entering the swap both the amounts of interest are known. The first
receipt of cash flow at T = 6 months is known at T = 0 and is done at MIBOR of 8%
plus 30 bps. The date on which the next floating rate payment is decided is called reset
date.
Cash Flow under Swap for Company A
Cash flow (` in Lakh)
Time (Months) Assumed MIBOR Fixed Leg Floating Leg Net
0 8.00%
6 8.15% -212.50 207.50 -5.00
12 8,20% -212.50 211.25 -1.25
18 8.45% -212.50 212.50 0.00
24 8.30% -212.50 218.75 6.25
30 8.50% -212.50 215.00 2.50
36 8.75% -212.50 220.00 7.50
157

3. Notional Principal No principal amount is exchanged either at initiation or conclusion
of the swap. It remains a notional figure for determination of amount of interest on
both the legs.
4. Exchange Differential Cash Flow The exchange of interest is done on net basis as
depicted in last column of Table, with positive sign as cash inflows and negative signs
as cash outflows for Company A. The cash flows for Company B would be opposite
to that of Company A.
5. Different Convention to Calculate Fixed and Floating Interests The method of
calculation of interest on the two legs can be defined in the swap agreement being an
over-the-counter (OTC) product between two parties. However, the convention is to
calculate the two legs of interest are different and as follows:
For Fixed Leg : Actual/365, and
For Floating Leg : Actual/360
(As is the practice in the money markets)
To illustrate, if actual number of days in the six-month period is 182, amount of
interest for both the legs for the first cash flow would be somewhat different than those shown
in Table
For Fixed Leg: Principal x Interest rate × No.of days
365
50, 00,000 × 0.085 × 182
= ` 2, 11,918
365 No.of days
For Floating Leg: Principal × Interest rate × 182
50, 00,000 × 0.085 × = ` 2, 09,805
360
For simplicity of exposition, in the example 180 days are assumed for all semi-annual
periods with 360-day year.
Need of SWAP Intermediary—the SWAP Dealer/Bank
The illustration above assumed perfect matching of needs of Company A and
Company B. How does Company A and Comnanv B locate each other is a big question?
Normally firms do not disclose their specific needs of loans, borrowings, interest rates, etc.
Even the routine transactions of buying and selling the foreign currency in the forward market
are rarely done by importers and exporters directly. All of them resort to banks for buying and
selling foreign currency.
158
Apart from difficulties in locating each other if Company A and Company B were to
have the swap arrangement directly there would be the following likely problems.
1. Both of them would assume default risk (also known as counterparty risk) associated
with swap on each other, as one of the parties to the transaction may not honour the
commitments made in the swap.
2. Matching of needs in terms of principal amount of borrowing, its timing, periodicity
of payment of interest, and final redemption of the borrowing, etc. would be a difficult
task.
These difficulties in the swap need to be overcome; else the swap market would
remain extremely small. In fact, the growth in the swaps is primarily attributed to the roles the
banks have played as swap intermediaries. Following are the functions of swap intermediary.
Facilitating the SWAP Deal
The difficulties in finding a matching counterparty can be reduced if an intermediary
is involved. The intermediary or the swap dealer is normally a bank who has widespread
network. Due to deep knowledge of financial markets, network of large number of customers,
and exact unstanlient’eedasier foanks to locatatcg
counterparties. Like the forward rates are offered by banks to facilitate the foreign exchange
transaction, few banks offer ready market for firms to enter and exit the swap deals.
Warehousing
Banks are performing the role of market maker in swaps. One can obtain a quote on
demand for a swap deal with bank without waiting for a matching counterparty. There are
several requirements to be matched. For example, one party may look for interest rate swap
for ` 100 crore on semi-annual basis for three years, while the counterparty may want swap
for ` 80 crore on quarterly basis for 2-1/2 years only. Here the bank may take exposure of ` 20 crore in the hope of finding another suitable party. This is called warehousing where
bank may enter swaps on its own. The bank carries the risk of interest rate fluctuations till a
matching counterparty is found. This risk is normally covered through interest rate futures.
Hedging through interest rate futures has to be done only for net exposure in swaps as banks
are likely to have a portfolio of swaps which can nullify the interest rate risk for major part of
exposure.
159

Assuming Counterparty Risk
Most important of all, banks mitigate the counterparty risk for both the parties to the
swap by becoming the counterparty to each of them. In the example depicted in Figure
Company A would be far more comfortable if the counterparty were a bank rather than
Company B. Same would be true for Company B. By becoming counterparty the overall risk
to the swap transaction, which normally is large due to its long term nature, stands reduced
substantially.
Of course, for providing a facilitating role and assuming the counterparty risk, the
swap broker needs to earn remuneration. This has to be borne by the two parties to the swap
transaction. However, each of the party stands to gain in terms of having an exact deal,
desired timing, and reducing counterparty risk. The benefits are worth the cost.
’Plain Vanillanteresatwaith Intediary
Figure depicts the swap transaction with bank as intermediary charging 5 bps from
each party, as each of them receives 5 bps less that what they would receive without the
intermediary (Figure).
Applications of SWAPS
Having explained the mechanism of the swap transaction, let us focus on what swaps
can achieve. Swaps can be used to (a) transform the floating rate liability to fixed rate liability
and vice versa, (b) transform floating rate assets to fixed rate asset and vice versa,
(c) hedge against fluctuating interest rates, and most importantly (d) reduce cost of funds. We
examine each of them.
Transforming Nat-are of Liabilities
Interest rate swaps are generally used for creating synthetic, fixed, or floating rate
liabilities with a view to hedge against adverse movement of interest rates. Let us consider
160

Company A, which has borrowed from the market on floating rate basis at MIBOR + 25 bps.
It pays to its lenders at floating rate. Further, the company considers that interest rates would
rise in future. In view of rising interest rates it would like to have liability that is fixed in
nature rather than variable. Therefore, it decides to enter into a swap with the bank paying
fixed 8.50% and receiving MIBOR +30bps as depicted in figure
Swap to Transform Floating Rate liability to Fixed rate
What is the result of this swap? It simply transforms the liability to a fixed payment at
8.450/u p.a. as shown below.
Payment to lenders MIBOR+25bps
Less: Receipt from Bank under swap - (MIBOR + 30 bps)
Payment to Bank under swap 8.50%
Net payment, Fixed 8.45%
Similarly, any firm can transform its fixed rate liability to floating rate by entering the
swap with bank for paying floating and receiving fixed. Naturally, the firm would use such a
swap when it believes that interest rates are likely to fall in future and locking-in a fixed rate
would prove advantageous.
Example 3.1 Changing Nature of Liability from Fixed to Float
Five years back, Fasteners Ltd had raised loans through 10-year debenture issue
worth ` 100 crore with fixed interest of 12%. After the issue the interest rates remained
constant for sometime. But now they have beat around Io and are likely to come
down further. Fasteners Ltd wish to contain the cost of funding for the remaining 5 years.
A bank has offered a swap rate of 9.5001o_9.60010 against MIBOR for a period of 5 years.
Depict the swap arrangement and find out the new nature of liabilities the firm can have.
161

Solution
Fasteners Ltd has liability on a fixed interest of 12°I. By entering swap with the bank
it 1110 may transform the liability from fixed rate to floating rate based on MIBOR. Under
the swap arrangement, Fasteners Ltd can receive fixed and pay MIBOR. The bid rate of swap
(9.50°Io) would be applicable. The swap arrangement is shown below (see Figure E 3.1).
The cost of funds for Fasteners Ltd would be = 12.00% - 9.50% + MIBOR MIBOR
+ 2.50% In case interest rates fall below 9.50%, which is expected, the firm would end up
paying lesser interest than what it is paying now. The interest rate payable would be market
based.
Transforming Nature of Assets
Assets provide income to investing firms based on the interest rates. If the interest
rates fall the income too falls. In the circumstance of falling interest rates the firms would like
to change the complexion of assets that are on floating rate to fixed rate. Similarly, in times of
rising interest rates firms earning interest would like to remain with the market trend rather
than get a fixed rate.
Now assume that Company A has made an investment by subscribing to bonds
carrying 9% fixed coupon. Bonds have still some years to mature but the interest rates are
showing a rising trend, which is expected to continue. Company A faces a potential loss of
income.
What can Company A do? Changing the portfolio of bonds by selling fixed rate bonds
and buying floating rate bonds is one solution. An easier way is to enter the swap as depicted
in Figure, where it receives floating and pays fixed rate. By doing so the nature of income
transforms from fixed 9.00%
to MIBOR + 80 bps as shown:
Receipt from investments 9.00%
Less: Payment to Bank under swap -8.50%
162

Receipt from Bank under swap MIBOR + 30 bps
Net Receipts, Floating MIBOR + 80 bps
Swap to Transform Fixed Rate Asset to Floating Rate
If MIBOR moves beyond 8.20% in future, Company A would benefit from the
situation.
Similarly, another can transform its floating rate income to fixed rate income by
having the swap. Naturally, firms would use such a swap when they believe that interest rates
are likely to fall in future.
Hedging With SWAPS
The examples of changing the nature of liabilities and/or assets from fixed to floating
and vice versa demonstrate hedging applications of swaps. The need to change the
complexion of assets and liabilities arises only when the firms stand to gain from such an
exercise. Swaps can be fruitfully used to hedge against the adverse interest rate situations as
condensed in the Table.
Hedging Strategies with swaps
Nature Risk Hedging Action
Assets
Fixed Rate Rising interest rates Swap to transform nature of asset
from fixed rate to floating rate
Floating Rate Falling interest rates
Swap to transform nature of asset
from floating rate to fixed rate
Liabilities
Fixed Rate Falling interest rates Swap to transform liability from
fixed rato floating rate
Floating Rate Rising interest rates Swap to transform the liability
from floating rate to fixed rate
163

There are other ways to hedge against adverse situations but at times swap could
prove more efficient. For example, a firm may have borrowed on fixed rate basis for 10 years.
After a few years if the interest rates start downward movement the possible recourse with the
firm is to approach the lender to change the nature of loan from fixed to variable. This would
be resisted by the lender. A better course of action is to enter into a swap arrangement with
another. The firm achieves its objective.
Similarly, a fund may have subscribed to a portfolio of fixed rate bonds to generate
desired level of income. If interest rates rise subsequent to the subscription, the fund loses the
opportunity to raise income. One of the alternatives available is to change the portfolio from
fixed to floating rate bonds. It may pose serious limitations like availability of such bonds,
transaction costs associated with change of portfolio, etc. An attractive alternative is to enter
the swap to transform the nature of asset from fixed to floating, where it receives cash flow
based on floating rate in exchange of paying the fixed rate. More importantly the swap
transaction remains off balance sheet, thereby, keeping the much desired confidentiality.
Reducing Cost of Funds
The most important use of swaps, which seems to be primarily responsible for the
popularity and growth of swaps, is its potential to save cost for the firms.
An example will illustrate how swaps can be used to reduce cost. Assume that a
highly rated Firm AAA can raise funds in the fixed rate market at 10% and in the floating rate
market at MIBOR + 100 bps. The current rate of MIBOR is 8%. Another firm comparatively
lower rated at A can mobilize capital at 121% and MIBOR + 200 bps in the fixed rate and
floating rate markets respectively.
Clearly, Firm AAA has advantage over Firm A in both kinds of the markets—fixed
anloatinaeen below.
Firm AAA Firm A Advantage AAA
Fixed Rate 10% 12% 200 bps
Floating Rate MIBOR+ 100 bps MIBOR+200 bps 100 bps
We further assume that Firm AAA is interested in borrowing at floating rate (at
MIBOR + 100 bps) and Firm A wants to borrow in the fixed rate market (at 121%). Notice
that for lower rated firm the spread in the fixed rate market is greater. Both the firms can set
up the swap as follows:
164
1. Firm AAA goes to fixed rate market to borrow at 10% rather than tapping floating rate
market at MIBOR + 10 bps.
2. Firm A mobilizes funds from floating rate market at MIBOR + 200 bps rather than
mobilizing from fixed rate market at 121%.
3. Having accessed different market as against their original choice now Firm AAA and
Firm A enter a swap where
(a) Firm AAA pays Firm A floating at MIBOR + 200 bps
(b) Firm A pays Firm AAA fixed at 11.51%
These actions and the resultant impact on cost of funds for Firm AAA and Firm A are
shown in
Cost of Funds for Both the Firms
AAA A
Payment to investors 10% MIBOR+ 2%
Payment to counterparty MIBOR + 2% 11.5%
Receipt from counterparty 11.5% MIBOR+ 2%
Cost of borrowing (1 + 2-3) MOOR + 0.5% 11.5%
IMPACT
Firm can raise funds at MIBOR Firm can raise funds at 11.5%
+ 0.50% as against MIBOR + as against 12% without the
1% without the gaining 0.50% swap; swap; gaining 0.50%
gaining 0.50%
Interesatwaeduosunds
As against fixed payment of 10.00% to its original lenders Firm AAA pays floating at
MIBOR + 200 bps and receives 11.5% fixed. This not only transforms the liability from fixed
to floating rate the firm wanted in the first place, but also reduces the cost toMIBOR
+ 50 bps as against MIBOR +100 bps that it would have incurred without the swap thereby
gaining advantage of 50 bps. Similarly, Firm A too can transform its liability to fixed rate as it
desired and also reduce the cost of funds to 11.50% as against 12.00%, which it would incur
if it were to go the market directly. The swap again gives an advantage of 50 bps.
165

Cost Example 3.2 Interest Rate Swap to Reduce Funding
Two Indian firms IndoPas and IndoCar are contemplating to raise finance of ` 100
crore each. They have been offered following loans by a bank
Fixed Rate Floating Rate
IndoPlas 12.00% MIBOR + 70 bps
IndoCar 11.00% MIBOR + 30 bps
Another bank acting as swap intermediary is willing to work out a swap arrangement
for a fee of 5 bps from each firm. IndoCar believes that interest rate would fall and hence,
wants to raise funds in the floating rate basis. IndoPlas feels otherwise and likes to raise funds
on fixed interest rate basis. What swap can be arranged between the two parties? What would
be the saving in financing cost of each firm?
Solution
The absolute advantage for IndoCar is 100 bps in fixed rate market while it is 40 bps
in the floating rate market. Though IndoCar wants to raise finance at floating rate, the firm
must access the fixed rate market and then enter into a swap deal with IndoPlas to convert the
fixed rate liability into floating rate. The total benefit to be availed is 60 bps the differential of
absolute advantage of IndoCar in the two markets. Of this benefit 10 bps would be taken
away by the bank, while the remaining 50 bps may be shared equally by both the parties
through a swap. One such structure is presented below (see Figure E).
IndoCar IndoPlas
Payment to investors 11% MIBOR + 0.7%
Payment to Bank MIBOR + 0.05% 11.05%
Receipt from Bank 11% MIBOR%
MIBOR% MIBOR+5% I
Cost of borrowing (1 + 2 - 3) MIBOR + 0.05% 11.75%
Interest Rate Swap: A Schematic View with Intermediary
166

The aggregate cost of funds for IndoCar would be NIB OR + 5 bps a saving of 25 bps
if it had accessed the floating rate market at MIBOR + 30 bps. Similarly, IndoPlas obtains
funds at 11.75% against 12% otherwise, without the swap deal resulting in an advantage of 25
bps.
Rationale for Swap-the Comparative Am/Antage
The remarkable aspect about the swap was its ability to reduce the cost of funds for
both the firms, as we see in the Figure. Normally one expects that one would gain at the
expense of the other. But in a swap both the parties were able to reduce the cost of funds. The
explanation lies in theory of comparative advantage.
Even though Firm AAA had absolute advantage in both kinds of borrowing with
respect to Firm A, what is of significance is the comparative advantage. Firm AAA had
absolute advantages of 200 bps in the fixed rate market and 100 bps in the floating rate
market.
Alternatively, we can say that Firm AAA has comparative advantage of 100 bps
(difference of two absolute advantages) in the fixed rate market. Put another way, Firm A has
relative advantage in floating rate market. The comparative advantage of 100 bps is available
for exploitation by both the firms.
Therefore, it makes sense for Firm AAA to access the fixed rate market, where it had
greater absolute advantage, and then enters into the swap to transform the fixed rate liability
into a floating rate liability.
Similarly, Firm A must access the floating rate market and then enter into the swap to
transform the floating rate liability into the fixed rate. The combined advantage of both would
remain fixed at 100 bps and the swap between the two would determine who gets how much
of the benefit. Of course, it would depend upon the negotiating powers of the two firms
involved.
The aggregate advantage remains fixed at 100 bps. In case of a direct deal between
Firm AAA and Firm A as depicted in Figure, the benefit was shared equally by both.
In case such a deal is structured by an intermediary and serving as counterparty to
each of them part of the benefit would be sacrificed by each of the party. This benefit goes to
the bank. One such deal where the bank gets 20 bps (10 bps from each) is depicted in Figure
and Table.
167

Interest Rate Swap-A Schematic View with Intermediary
Sharing Benefits of Swap
AAA A
Payment to investors 10.00% MIBOR+ 2.00%
Payment to Bank MIBOR + 2.00% 11.40%
Receipt from Bank 11.40% MIBOR + 1.90%
Cost of Borrowing (1+2+3) MIBOR + 0.60% 11.60%
Cost with direct access to the market MIBOR + 1.00% 12.00%
Savings 40 bps 40 pbs
Earning for the bank 11.50% - 11.40% + (M + 2.00%) –
(M + 1.90%)
=0.20% or 20 bps
The exploitation of the comparative advantage by the firms is a clear case of arbitrage
on the credit rating. The fixed rate market demanded a greater premium from the lower rated
firm than did the floating rate market, forcing the firm to access floating rate market. The
premium demanded by higher rated firm for fixed rate was lower than the market making the
swap deal attractive.
The question that arises is how a competitive market can allow this aberration to take
place. The answer appears to lie in the information gap the market has for Firm AAA and
Firm A. Lenders while lending on floating rate basis have opportunity to review every six
months and the spread is usually a smaller one for the firm rated higher. In the fixed rate
market the spread would be larger for lower rated firms. Lenders could rely more on Firm
AAA than they could on Firm A. The spread in the two markets are unequal due to unequal
rating of the firms. The differential of spread reflects the differential of likely default of Firm
AAA relative to Firm A.
Theory of comparative advantage has been used to devise swap transaction in such a
manner that both parties in the swap reduce their costs of funds. Generally, a firm with higher
credit rating is able to procure funds at lower rates of interest than a firm with lower credit
rating, irrespective of whether the borrowing is on fixed or floating rate basis. The
168

firm with higher credit rating is said to enjoy the absolute advantage over the firm with lower
credit rating in both fixed rate and floating rate markets. The advantage of higher rated firm
over the lower rated firm is called the credit quality spread.
Despite credit quality spread in both fixed rate and floating rate markets, it may be
beneficial for the higher rated firm to engage in a swap deal with the lower rated firm due to
the likelihood that the spread in both the markets may not be even. The differential of the
absolute advantage measures the comparative advantage, which in turn forms the basis of
swap deal. This comparative advantage is the aggregate benefit that both parties to the swap
deal can share in proportion of bargaining powers of each.
Swaps are, therefore, a product resulting from arbitrage on credit rating. The question
is will this credit arbitrage continue? Very much yes, as long as gaps in information and
credibility remain.
Types of Interest Rate SWAPS
With the bank as intermediary and each party deals with the bank rather than each
other. Interest rate swaps (IRS) can be categorized as follows.
Fixed-to-Floating
In the fixed-to-floating rate swaps the party pays fixed rate of interest to the bank or
swap dealer and in exchange receives a floating rate interest determined on the basis of a
reference/benchmark rate at predetermined intervals of time.
Such a swap is used by a firm wich has floating rate liability and it anticipates a rise in
the interest rates. Through the swap the firm will cancel out the receipts and payments of
floating rate and have cash outflow based on the fixed rate of interest.
Floating-to-Fixed
In this kind of swap the party pays floating rate of interest to the bank or swap dealer
and in exchange receives a fixed rate interest at predetermined intervals of time.
Such a swap is used by a firm who has fixed rate liability and it anticipates a fall in the
interest rates. Through the swap the firm will cancel out the receipts and payments of fixed
rate liability and have cash outflow based on the floating rate of interest.
169

Basis SWAP
In contrast to the fixed-to-floating or floating-to-fixed where one leg is based on fixed
rate of interest, the basis swaps involve both the legs on floating rate basis. However, the
reference rates for determining the two legs of payment are different. Basis swaps are used
where parties in the contract are tied to one asset or liabilities based on one reference rate and
want to convert the same to other reference rate. For example, if a firm having liabilities
based on T-bills rate wants to convert it to MIBOR-based rate, then the firm can enter a basis
swap where it pays MIBOR-based interest to the swap dealer in exchange of receiving
interest based on T bills rate.
****
170

Lesson 2.5 - Currency Swaps
Currency SWAPS
In a currency swap the exchange of cash flows between counterparties take place in
two different currencies. Since two currencies are involved, currency swaps become different
from interest rate swaps in its uses functionality, and administration. The first recorded
currency swap was initiated in 1981 between IBM and World Bank.
Where the exchange of cash flows is in two different currencies on the basis of a
predetermined formula of exchange rates, it is known as currency swap. More complex swaps
involve two currencies with fixed and floating rates of interest in two currencies. Sucps
arallecocktaips’.
Hedging Against Exchange Rate Risk
Currency swaps cover different kind of risk. It is way of converting liabilities or assets
from one currency to another. While in case of interest rate swaps assets or liabilities are
transformed from fixed interest rate to floating or vice versa providing hedge against
fluctuating interest rates, the currency swaps provide a hedge against exchange rate risks as it
transforms liability/asset from one currency to another.
Let us consider an example to see how multinational firms face currency risks and
how can these be overcome through a swap deal.
Assume that an Indian firm needs funds for its US operations. The firm raises funds in
Indian rupees and commits to serve the interest obligation and the final repayment in Indian
rupees. The funds raised in rupees are converted in US dollar to acquire assets in the USA.
These assets provide income in US dollar. The Indian firm is facing a risk if rupee strengthens
(dollar depreciates) in the currency markets as it receives lesser rupee amount for the fixed
return earned in US dollar.
Similarly, an US firm which needs to acquire assets in India while raises dollar funds
in USA, faces the same risk. Its earnings would be in Indian rupees and the liabilities need to
be serviced in US dollar. Like the Indian firm the US firm also faces a risk of shortfall in US
dollar if dollar appreciates (or rupee depreciates).
171

The vulnerability of both, the Indian firm and the US firm, is due to uncertainty of
exchange rate movement, which may take place in either direction. While depreciation of
dollar harms the Indian firm it benefits the US firm. In case dollar appreciates, the US firm is
at loss while the Indian firm gains. The risks for both the firms arise because it is not known
what direction exchange rates would take. Even though it is possible to make an estimate of
the likely direction of exchange rates based on many theories, such as purchasing power
parity (PPP) and interest rate parity (IRP), we are concerned here with the unexpected and
adverse movement of exchange rates as all forecasts factor in the likely movement while
making estimates.
The element of risk can be removed if the Indian firm and the US firm enter into a
swap as depicted in Figure, which would reveal that the Indian firm has financed its US
operations by creating rupee liability. This liability to be serviced by income generations in
US dollar faces currency exchange rate risk.Likewise, the US firm having funded Indian
operations through US dollar loan would be serviced by rupee income and needs to be
converted to US dollar for payment of interest and principal in future whenever they fall due.
Under the swap transaction the mismatch of cash inflow and cash out flow in different
currencies for both the firms can be eliminated, by US firm agreeing to pay rupee generated
out of its Indian operations to Indian firm in exchange of Indian firm agreeing to pay dollar
generated out of its US operations.
Thus the rupee asset income flows to the Indian firm, facilitating service of rupee
liability. In exchange, US dollar asset income flows to the US firm to meet its US dollar
obligations. Both the firms avoid the conversion of currencies from one to another eliminating
the exchange rate risk. Through the swap both the firms will have assets and liabilities
translated in the same currency eliminating the currency risk.
Currency Swap-Converting Asset/ Liability from One Currency to Another
172

Example 3.3 Swaps to Hedge Against Exchange Rate Risk
Assume that an Indian software firm Inso Ltd wants to acquire a US firm with a cost
of $2.00 crore. For the purpose it raises the required capital of ` 90 crore (current exchange
rate of ` 45/$) at 12%. The US acquisition is expected to yield 150/0 return. At the same time
a US engineering firm USENG Inc. is negotiating a joint venture to contribute US $ 2.00
crore which promises to yield 15% return in India. USENG Inc. raises the required dollar at a
cost of 8°/s. Assume that all liabilities need annual payments.
1. Examine the risk faced by Inso Ltd and USENG Inc. if the Rupee appreciates to 44,
42, 40, 38, and 36 per $ for next five years.Rupee depreciates to 46, 48, 50, 52, and 54
per $ for next five years
2. Show how a swap arrangement between the two can help eliminate the risk of
exchange rate fluctuations.
Solution
Inso Ltd is targeting annual profit of ` 270 Iakh as shown below.
Income in US dollar = 15% of $ 200 lakh = $ 30 lakh p.a.
Equivalent rupee = ` 1,350 lakh p.a.
Interest payment = 12°/s of ` 9,000 lakh = ` 1,080 lakh p.a.
Anticipated profit = 1350 - 1,080 = ` 270 lakh p.a.
If Indian rupee appreciates, Inso Ltd would receive lesser income than expected and
hence, carries risk of reduction in profit due to appreciation of rupee, liability being fixed in
rupee.
Similarly, USENG Inc. is targeting annual profit of $ 14 lakh as shown below.
Income in rupee = 15°/s of ` 9,000 lakh = ` 1,350 lakh p.a.
Equivalent dollar = $ 30 lakh p.a.
Interest payment = 8% of $ 200 lakh = $ 16 lakh p.a.
Anticipated profit =30-16 = $ 16 lakh p.a.
If Indian rupee depreciates, the firm will receive lesser annual income than expected
and hence, face a risk of reduction in profit to the extent of depreciation in rupee, liability
being fixed in dollar.
173

While appreciation of rupee is good for the US firm and detrimental to the Indian
firm, the position reverses if rupee depreciates. The impact on the spreads of both the firms
for the exchange rate scenario is presented below (see Table E).
All figures (in lakh)
Exchange
Indian Firm US Firm
Year Income Equivalent ` Income Equivalent $ Rate (`/$
US $ Spread
` t $ Spread
5 54.00 30.00 1,620.00 540.00 1,350.00 25.00 9.00
4 52.00 30.00 1,560.00 480.00 1,350.00 25.96 9.96
3 50.00 30.00 1,500.00 420.00 1,350.00 27.00 11.00
2 48.00 30.00 1,440.00 360.00 1,350.00 28.13 12.13
1 46.00 30.00 1,380.00 300.00 1,350.00 29.35 13.35
Now 45.00 30.00 1,350.00 270.00 1,350.00 30.00 14.00
1 44.00 30.00 1,320.00 240.00 1,350.00 30.68 14.68
2 42.00 30.00 1,260.00 180.00 1,350.00 32.14 16.14
3 40.00 30.00 1,200.00 120.00 1,350.00 33.75 17.75
4 38.00 30.00 1,140.00 60.00 1,350.00 35.53 19.53
5 36.00 30.00 1,080.00 1,350.00 37.50 21.50
2. By entering into a swap arrangement both the firms can eliminate the volatility of spread.
Under the swap arrangement at current rate of ` 45 per $:
(a) US firm will pay Indian firm ` 1,350 lakh annually earned out of its joint venture in
India.
(b) Indian firm will pay $30 lakh annually earned out of acquisition in the USA.
A schematic diagram of the swap arrangement is shown in Figure E. The spread after
the swap arrangement becomes fixed for both the firms irrespective of exchange rate. The US
firm will lock-in a return of $ 16 lakh and the Indian firm will assure profit of ` 270 lakh after
the swap arrangement. Without the swap the income for both the firms in the USA and India
were subject to fluctuations due to currency exchange rate as reflected in Table E. After the
swap as shown in Figure E the spreads for two firms would become stable in respective
currencies as demonstrated in Table E.
174

Currency Swap-Converting Asset/Liability from One Currency to Another
Figures (in lakh p.a.)
Cash flows after swap Inso Ltd. USENG Inc.
Income earned abroad +$30 + ` 1,350
Paid to counterparty -$30 -`350
Received from counterparty + ` 1,350 +$30
Interest obligation - ` 1,080 -$16
Spread +`270 +$14
Reducing Cost of Funds with Currency SWAP
Like interest rate swaps, currency swaps can also be used to reduce funding cost for
multinational firms needing funds in different currencies. Again the guiding principle is
theory of comparative advantage. In the interest rate swap the comparative advantage
emanated from differential pricing in the floating rate and fixed rate markets. Here the
comparative advantage will result from two distinct and separate markets governed by
altogether different sets of rules and operating in vastly different economic conditions.
Though the exchange rate mechanism provides a link among these markets and
economies, the link is a frail one as compared to the strong linkages the capital and debt
markets have in a single economy. The quality spread in domestic markets is based on the
credit rating of the parties. In the international markets the credit rating for the same firm may
vary substantially across nations, as firms are generally better known in their own country and
lesser known in a foreign country.
Further, exchange control regulations of the land may discourage borrowing to the
non-residents by stipulating a higher rate. Therefore, the comparative advantage is likely to be
more pronounced in two markets in two different economies, as compared to similar
175

markets of the same economy. As such the credit quality spread is expected to be larger in the
different currency markets than the credit quality spread in the fixed/floating rate markets.
Greater spread in credit quality increases the comparative advantage. Increased
comparative advantage opens up more avenues for currency swaps. However, the size of the
market may be limited as only multinational firms will be the beneficiaries of currency swap
transactions.
Aple exampnwultinationairmnndiannritish.
Both the firms enjoy excellent and equivalent credit rating in their countries. However, their
funding requirements are confined to their own countries. Now they need to raise funds across
nations for their ever increasing needs of expansion, and to capitalize on the interest rate
differentials that may exist in various currencies.
Following is the cost of capital for two firms in India and Britain in their respective
currencies.
Indian Market British Market
Rupee Market Pound Market
Indian Firm 10% 6%
British Firm 14% 4%
Advantage - British Firm -4% 2%
Clearly and naturally, the Indian firm enjoys an advantage over the British firm in
India and the British firm commands more credibility in Britain as compared to the Indian
firm. Notice that the absolute advantage may not be in favour of the same firm as was the case
in the interest rate swap. The comparative advantage here is 6%. If the two firms borrow in
the required currency the total cost of funds will be 20%, i.e. the Indian firm borrows pound
at 6% and the British firm borrows rupee at 14%. However, if they borrow aer the
comparative advantagheornd exchangacther’s cotment, thotal cost of funds can be reduced to 14% with British firm borrowing pound at 4% and Indian firm
borrowing rupee at 10%. Both the firms can benefit by 6% in aggregate if they enter into a
swap arrangement wherein
(a) Indian firm mobilizes funds in rupees in the Indian market at 10%,
(b) Indian firm lends the rupee funds to British firm at ho/n,
(c) British firm raises funds in the British market in pound at 4%
176
(d) British firm lends the same funds to the Indian firm at 5%,
(e) Exchange the interest payment periodically, and
(f) Finally, exchange the principal upon redemption.
The schematic diagram of the swap arrangement and cost of funds for both the firms is
shown in Figure.
Indian firm British firm
1. Payment to investors Rupee 10% Pound 4%
2. Payment to counterparty Pound 5% Rupee 11%
3. Receipt from counterparty Rupee 11% Pound 5%
Cost of borrowing (1 + 2 + 2) Pound 4% Rupee 10%
Currency Swap to Reduce Cost of Funds
It was assumed in the example that the Indian firm and the British firm exchanged the
principal amount of borrowing and as a natural outcome will have to exchange the repayment
at the time of redemption.
However, it is not essential to do so as both the firms can use the spot market for
buying and selling the required currencies independent of each other, both at the time of
raising funds and at its redemption.
Through the swap the Indian firm is now able to obtain pound funds at 4% as against
6% in the absence of swaps—a benefit of 2%. Similarly, the British firm has access to rupee
funds at 10% as against 14%–a benefit of 4%. The aggregate benefit is equal to the
comparative advantage of 6%, which may be shared by the two firms depending upon
negotiating skills and strength of the two firms involved.
177

Distinguishing Features of Currency SWAP
It may be seen that currency swap is similar to parallel loan. However, swaps are
better because they may be entered with the financial intermediary saving the trouble of
finding the counterparty with matching needs as also reducing the counterparty risk.
Though working on the same principle of comparative advantage, operationally
currency swaps become different than interest rate swaps. Under currency swap the cash
flows are as follows:
1. Exchange of principal at the time of setting the swap deal at the current spot rate
2. Exchange of periodic interest payments
3. Exchange of the principal back upon maturity
Under interest rate swap there is no exchange of principal at the begin-fling of swap or
at its conclusion.
Currency swaps may be classified as following
In a fixed-to-fixed currency swap the interest rates in the two currencies involved are
fixed. For example, a British firm may raise loan in pound and exchange it for dollar to an US
firm. Interest payment may be made by the British firm in dollar while receiving pound
interest from the US firm. The US firm would do the reverse, making interest payment in
pound and receiving dollar interest. The interest rate in US dollar and pound both are fixed.
(a) Fixed-to-Floating
In a fixed-to-floating currency swap the interest rate in one of the currencies is fixed
while other is floating. In the earlier example if the British firm made interest payment in
dollar at a fixed rate while receiving pound interest based on London Inter Bank Offer Rate
(LIBOR) from the US firm, such a swap would be fixed to floating. Such swaps not only
transform the nature of asset/ liability from one currency to another but also change it from
fixed rate to floating rate. It becomes a complex tool for hedging against currency risk as well
as interest rate risk.
(b) Floating-to-Floating
In a floating-to-floating currency swap both the interest rates are floating but in
different currencies. In the earlier example if the British firm made interest payment in
178

dollar based at prime rate in the USA while receiving pound interest based on LIBOR from
the US firm, such a swap would be floating-to floating.
Valuation of Swaps
Pricing of the swap is an important issue for two reasons. First, as stated earlier banks
function as warehouse of swaps and are ready to offer swap to the desired customers. For this
they are required to quote the swap rates for paying and receiving a fixed rate of interest for
receiving/paying the benchmark variable rate. The other reason for valuing the swap is for the
purpose of cancellation of an existing swap. For reasons of economy a firm may like to cancel
the obligations or part thereof by paying or receiving the value of the swap at that point of
time.
Valuing Interest Rate Swap
As stated earlier, an interest rate swap consists of fixed rate cash flow and floating rate
cash flow in the opposite direction. At the time of inception of the swap the present value of
these payments must be equal in the opinions of both the parties to the swap else they would
not agree to it.
Therefore, at inception the value of swap is zero implying that the present values of
cash inflows and outflows are equal and its aggregate flow is zero.
However, the circumstances would change after the swap is initiated. The value of an
interest rate swap at any time is the net difference between the present value of the payments
tevednhresent value ohayments tecomes ptivo
one party and is equivalently negative to the other party. This tells how much cash the two
parties must exchange to nullify the remaining obligations in the swap.
From the valuation perspective a swap transaction may be interpreted in at least two
ways. It can be thought of either as a pair of bonds or a series of forward agreements. Any of
the interpretation of the swap helps in its initial pricing as well as its valuation, if and when
one wants a premature closure. We take the pricing of swap by both methods by treating the
swap as pair of bonds or as a series of forward agreements.
Swap as Pair of Bonds
The most common interpretation of interest rate swaps is to consider the inflows and
outflows of interest at periodical intervals equivalent to that of bonds. In an interest
179
rate swap one leg of transaction is on a fixed rate and the other leg is on the floating rate of
interest. We also know that if one owns a bond he receives interest and if one issues a bond he
pays the interest. Therefore, a swap comprises the following.
1. The cash inflow equivalent to the interest on the bond owned
2. The cash outflow equivalent to paying the interest on the bond issued Interest rate
swap
Therefore, a p is a paof bondne issued and the one owned. A p where
one pays fixed and receives floating can be viewed as combination of having issued a fixed
rate bond, paying the fixed coupon rate and simultaneously owning a floating rate bond,
receiving a floating rate as per the market conditions, as depicted in Figure.
While setting up the swap the coupon rate (the fixed leg receipts/payments) is fixed in
such a manner that the values of cash inflows and cash outflows are equal and both the parties
to the swap arrangement are in equilibrium, the net present value of the cash flows being zero.
This forms the basis of fixing the initial price of the swap determined in terms of fixed rate of
interest payable or receivable upon exchange of a floating benchmark rate. For Firm A in
Figure the equivalent of MIBOR may be taken as 6%, at the time of initiating swap.
Swap as Pair of Bonds
However, the interest rates are dynamic and the value of cash flows as determined at
the start of swap will not remain same as time elapses. The value of the swap will depend
upon the behaviour of bond prices with respect to changes in the interest rates.
Following rules about bond prices may be handy while valuing swaps.
1. The value of fixed rate bond will increase with the fall in interest rates.
2. The value of fixed rate bond will decrease with increase in interest rates.
3. The value of floating rate bond remains equal to par value as coupon rate is aligned
with arket rates on each periodic payment of interest.
180

4. The value of floating rate bond changes subsequent to payment of each interest, if the
interest rate structure has changed since then, but again gets aligned to the par value
on the next payment of interest.
Since the change in value of the floating rate bond will only be nominal and temporary
(it changes only during the two interest payments), the value of swap determined on the basis
of difference in the present values of the fixed and floating legs, is predominantly dependent
upon the value of fixed rate bond.
The value of the bond with fixed rate payments will be equal to sum of coupon
payments and the notional principal amount discounted at an appropriate rate. The discount
rate to be used for each coupon payment is known from the term structure of interest rates.
The value of the fixed interest payment leg, 1/a, is given by Equation 3.1.
Vc = ∑1n
ci p
(3.1) 1(1+ri)n 1(1+ri)
n
Where Ci = Coupon payment at time, i; r = Discount rate for period, i;
n = number of periods remaining; and P= Notional principal amount.
Similarly, we can find the value of the floating rate bond Vf which is equal to present
value of the next interest payment and the principal. As we know that the value of the floating
rate bond converges to the par value on each payment date, the value of the floating leg can
be expressed as Equation 3.2.
Vf = F1 P
(3.2) (1+r1)
(1+r1)
Where F1 = Next payment of interest; r1 = discount rate for period 1; and P= Notional
principal amount.
And the value of the swap for one receiving fixed and paying floating will be equal to
the differential of the fixed leg and floating rate cash flows given as Equation 3.3.
Value of swap PV of fixed coupon bond - PV of floating rate bond or
Vs = Vc - Vf
Vs = ∑1n ci
+
p
n +
F 1
+
P
(3.3) 1(1+ri) n 1(1+ri) (1+r1) (1+r1)
181

Let us consider a simple example of valuation of swap assuming it to be a pair of
bonds. Assume that two years ago Firm A has entered a 5-year interest rate swap where it
receives fixed 8% and pays MIBOR + 1%. For simplicity of exposition we assume annual
payments. There are three remaining annual payments.
Since the time of the swap, the interest rates have moved upwards causing the value of
the swap to change. Note that the value of the swap was zero two years ago when it was set
up. Assume that the payment of the floating rate determined one period in advance is at the
rate of 9.5% (MIBOR was at 8.50% then). The term structure of interest rates as on today is
as follows:
1 year : 10%
2 years : 10.5%
3 years : 11%
We find the value of the floating rate bond for an assumed principal payment of ` 100
by discounting the interest ( ` 9.50) and the principal (` 100) at 10%.
Value of the floating rate bond = 109.50/1.10 = ` 99.545
The value of fixed rate bond can be found by discounting the three cash flows at the
appropriate discount rate given by term structure, would be
8 8 8 100
Vc =
+
+
+
(1+0.10) (1+0.105)2 (1+0.11)3 (1+0.11)3
= 7.273 + 6.552 + 5.849 + 73.119 = ` 92.793
The value of swap = PV of inflow - PV of out flow
= 92.793 - 99.545 = - ` 6.752
The present value of inflow of the fixed leg for Firm A is ` 92.793 and that of floating
rate outflow is ` 99.545. The swap can be cancelled if Firm A pays ` 6.752 now to the
counterparty.
SWAP as Series of Forward Contracts
In a swap regular payments of interest are made and received by the counter- parties.
Next cash flow of interest can be considered as forward transaction. Similarly, all subsequent
cash flows are regarded as future dated delivery commitments. The timings of each cash
182

flow is known in advance and hence, swap can be regarded as a series of forward contracts
maturing on specified dates with the amounts of respective interest payments as shown in
Figure. Swap is a single contract encompassing several forward contracts.
Swap-as Series of Forward Contracts
The objective achieved by swap can also be achieved by booking several forward
contracts of interests (known as FRAs covered in the previous Chapter). However, forward
contracts are normally not available for far extended dates in future. Even if they do, they
suffer from poor liquidity and expensive pricing. Swap quotes and contracts are available for
much longer periods as a bundle of several forward contracts and may be cheaper than the
sum of the series of independent forward contracts.
The valuation of swap requires computation of present values of fixed rate leg and the
floating rate leg. While the interest payments of fixed rate leg are known for the entire
remaining duration of the swap, the cash flows of the floating rate leg is known for only the
next immediate payment. For all subsequent periods the cash flows for the floating rate leg
will be determined only one period in advance. Hence, all the payments cannot be known
today. This poses problem in valuation of swap when we assume it to be a series of forward
rate agreements.
Treating the swaps as series of the forward rate agreements, swap arrangement of the
above example can be viewed as shown below.
Periot’ Year ‘y’ Firm Receives % Firm Pays %
1 3 8.00 9.50 fixed at t = 0
2 4 8.00 Rate to be determined at t = 1; y = 3 say 1r2
3 5 8.00 Rate to be determined at t = 2; y = 4 say 2r3
183

With the given term structure of interest rates the floating rate payments are implied.
The term structure of the interest rate is given below.
One-year yield investment starting today: 0r1, = 10.00%
Two-year yield investment starting today: 0r2 = 10.50%
Three-year yield investment starting today: 0r3 = 11.00%
Where, 0rn implies the interest rate for the investment period starting at 0 and ending at
the nth period.
The forward rates of interests are built in the term structure of interest rates. The
implied forward rate can be calculated on the argument of equivalence of investment under
two strategies of
(a) Direct investment for planned horizon, and
(b) Making investment now and rolling it over from period to period to cover the entire
planned horizon.
From the above data, we may have either direct investment for 2 years at 10.5%, i.e.
0r2 or invest for one year at 10%, i.e. at 0r1 and then roll over the matured amount for another
year at one-year rate one year from now, i.e. 0r2 both the strategies must yield the same end
value of the investment. Given this condition we have the following relationship.
(1 + 0r1) x (1 + 1r2) = (1 + 0r1)2
Or 1.10 x (1 + 1r2) = (1.105)2
Or 1
r2 = 11.002%
The present term structure of interest rate implies that market expects one year
investment yield one year later at 11.002%. The investor can invest for two-year period at
10.5% and get ` 1.2210. Alternatively, he can invest for one year at 10% and get ` 1.10 after
one year. This amount would be reinvested at 11.002% for one more year to give ultimate
wealth of ` 1.2210. Therefore, the second interest payment for the floating rate (to be decided
one year from now) is expected to be 11.002%.
Using the same logic that a three-year investment should be equivalent to a two-year
investment rolled over for another year at the rate prevailing for one-year investment after
two years, i.e. 2r3, and we have
184

(1 + 0r2)2 x (1 + 2r3) = (1 + 0r3)3
Or 1.1052 x (1 + 2r3) = (1.11)3
Or 2
r3 = 12.007%
With estimated floating rate payments as derived from term structure of interest
rates, we shall now estimate the value of the swap as:
Net Present Value of forward agreement = Amount of fixed leg—Amount of
floating leg (1+ Discount rate)2
Value of first swap payment = (8.00-9.50)
-
1.364 1.10
Value of second swap payment = (8.00-11.002)
-
2.458 1.1052
Value of third swap payment = (8.00-12.007)
-
2.930 1.113
The value of swap comes to - ` 6.752 as computed with the assumption of swap as
pair of bonds.
Swap Quotes and Initial Pricing
Many banks in the international markets play a role of market maker for swaps. These
banks quote two-way swap rates in terms of fixed rate of interest for receiving and paying
floating rates of interest. A bid rate is the fixed rate of interest the bank will pay to receive
floating; and ask or offer rate is the fixed rate of interest bank will receive for paying floating.
The average of two rates is known as swap rate. At swap rate the value of the swap is zero i.e.
the values of fixed and floating rates are equal.
In order to determine the initial swap rate we equate the present values of the cash
flows of the fixed rate bond and floating rate bond. The cash flows of the fixed rate bond are
known for the entire duration of the swap. The cash flows pertaining to the floating rate are
not known.
As Series of Forward Contracts
How do we price a swap? We again use the term structure of interest rates to derive
the cash flows of the floating rate leg, as they are the best estimates available.
185

Let us consider an example for quoting a two-year swap with annual exchange of cash
flows. The pricing will be done in the form of % interest of the fixed leg to be received/paid
for paying/receiving a benchmark floating rate of interest. Internationally the benchmark is
LIBOR. However, here we assume exchange of MIBOR for fixed coupon for five years.
To equate the present values of the two legs we need to estimate the cash flows
pertaining to the floating rate bond. The cash flows of the floating rate bonds are decided
normally one period in advance, implying that next payment is equal to prevailing MIBOR.
The remaining payments will have to be estimated.
The term structure of interest rates provides the best estimates of the likely pay out for
the floating leg payments, using equivalence of direct investment for planned horizon or
rolling over periodically.
Therefore, the PV of the floating rate leg is equal to
0
r1
+
1
r2
+
2
r3
+
3
r4
+
4
r5
(3.4) (1+ 0r1) (1+ 0r2)2 (1+ 0r3)
3 (1+ 0r4)4 (1+ 0r5)
5
Assuming a fixed payment of interest of Xin the fixed leg the PV of the fixed rate leg is
X
+
X
+
X
+
X
+
X
(3.5) (1+ 0r1) (1+ 0r2)2 (1+ 0r3)
3 (1+ 0r4)4 (1+ 0r5)
5
For initial pricing we have to equate the cash flows of fixed and floating rate and solve
for the only unknown X
With the term structure of interest rate we can arrive at the discount factors and
floating rate payments as implied forward rates, as shown in Table.
Finding Floating Rate Payments
Year Interest Rate Implied Forward Rte Given by
Implied Discount
Forward Rate Factor
1 0r1 = 6.5% (1 + 0r1) = (1 + 0r1) 0r1 = 6.500% 0.9390
2 1
r2 = 7.0% (1 + 0r1) x (1 + 0r2) = (1 + 0r2)2
1
r2 = 7.502% 0.8734
3 2
r3 = 7.5% (1 + 0r2)
2 x (1 + 2r3) = (1 + 0r3)3 2
r3 = 8.507% 0.8050
4 3
r4 = 8.0% (1 + 0r3)
3 x (1 + 3r4) = (1 + 0r4)4 3
r4 = 9.514% 0.7350
5 4
r5 = 8.5% (1 + 0r4)
4 x (1 + 4r5) = (1 + 0r5)5 4
r5 = 10.523% 0.6650
186

Putting the values in two equations we get
X (0.9390 + 0.8734 + 0.8050 + 0.7350 + 0.6650)
= 6.500 x 0.9390 + 7.502 x 0.8734 + 8.507 x 0.8050 +
9.514 x 0.7350 + 10.523 x 0.6650
Or 4.0174 x = 0.3349
X = 0.0834 equivalent to 8.34%
The swap rate will be 8.34% for paying or receiving MIBOR. To this equilibrium
swap rate the dealer/bank will add its spread to cover its administrative cost and as well as the
counterparty risk.
Assume that bank wants to add 40 bps, as spread the swap quote of the bank would be
8.14%-8.54%. This means bank will pay 8.14% fixed for receiving MIBOR, and receive
8.54% fixed for paying MIBOR. As the tenure of the swap becomes longer the spread
increases.
As a Pair of Bonds
Same result would be obtained if we treat swap as a pair of fixed rate and floating rate
bond. The values of the two bonds must be equal at the inception of the swap making net
present value (NPV) equal to zero, cash flows of the two bonds being opposite.
The value of fixed rate bond with coupon of X would be equal to 4.0174x for the term
structure used above. The value of the principal would, however, be 0.6650 x R if R is the
principal. Since floating rate bond adjusts to the par value at each coupon date, the value of
the floating rate bond would be equal to its par at the inception of the swap. Equating the two
we get
100 x 0.6650 + 4.0174 x X= R
If R is taken as ` 100, the value of X the coupon of the fixed rate bond would be
1-0.6650
X = 4.0174 × 100 = 8.34
The swap rate then can be written as
Swap Rate =
1-Last discount factor
(3.6) Sum of all discount factors
187

Example 3.4 Value of Interest Rate Swap
A firm had entered into a swap arrangement for a notional principal of ` 1 crore with a
bank where the bank paid 9% fixed and received MIB0R semi annually. It has 3 more years
to go and has just exchanged the cash flow. The 6-month MIBOR for the next payment of
interest was reset at 8%. Next day the markets exhibited a fall and the 6-month MIBOR fell to
7%s, leading the firm to believe that it is overpaying. It wants to cancel the swap
arrangement. How much should the firm ask the bank to pay to cancel the swap deal?
Solution
The value of the swap for the firm is determined on the basis of discounted cash flows.
Since the rates have changed the discount rate used would be 7%; the prevalent market rate.
The value of the cash outflows on the fixed basis discounted at 7% is ` 115.63 as shown
below (see Table E).
Fixed leg payment - Cash outflow 9.00%
Present 12-month MIBOR 7.00%
Next Interest payment on floating rate 8.00%
Present Value of Cash Flow of the Fixed Leg
Months Years Cash Flow DCF at 7.00%
6 0.50 4.50 4.42
12 1.00 4.50 4.35
18 1.50 4.50 4.27
24 2.00 4.50 4.20
30 2.50 450 4.13
36 3.00 104.50 94.25
Present Value of Fixed Leg 115.63
The present value of the inflow at floating rate would be next interest, payment known
decided a period in advance plus face value of ` 100 discounted at 7/a. This amount works out
to ` 100.48 (see Table E):
Value of Floating Leg
Interest to be received after 6-rn 4.00
Principal to be received after 6-m 100.00
104.00
Present Value at 7.00% 100.48
188

The present value of the cash outflow is more by ` 15.15 for a principal of ` 100. If the
bank pays ` 15.15 lakh for the principal amount of ` 1 crore, the firm may exit the swap.
Counterparty Risk and Swaps
The swap rate of 8.34% can be interpreted as a weighted average of the floating rate
payments over the period of swap. It is like YTM of a bond, which equates all cash flows of
the bond to its price with a single discount rate. The floating rate payments are based on the
implied forward rates. The two legs of fixed and floating payments are not equal but the
aggregate of these payments become equal at the conclusion of the swap deal
The floating rate payments will be either more or less than the fixed rate payments,
depending upon the direction of the term structure of interest rates.
If the term structure of interest rate is upward sloping then the floating rate payments
will keep increasing with time. Initially the floating leg will be smaller than the fixed leg, and
as the time passes floating rate payments start increasing and exceed the fixed leg payments.
This is shown in Figure. Similarly, if the term structure of interest rates is downward sloping,
the floating rate payments will be higher than the fixed leg during the initial years of swap
and reduce subsequently as shown in Figure. Eventually, at the end of the swap the pay out on
both the legs would be equal in either case.
Swap Payment (Upward Sloping Term Structure)
189

Swap Payment (Downward Sloping Term Structure)
This has important implication with regard to counterparty risk in a swap deal.
In case of upward sloping term structure of interest rates, the fixed rate payer pays
more than what he receives in the early part of the swap. There is net cash outflow during
initial years of the swap deal, and hence fixed rate payer is the only party likely to default in
the initial years. In the later stages of the swap the floating rate payment exceeds the fixed
rate payments and hence the floating rate payer is more likely the default party.
The situation reverses if the term structure of interest rates is downward sloping. The
intermediary faces default risk from floating rate payer in the initial part of the swap, while
fixed rate payer is more likely to default in the later stages of the swap deal. The intermediary
must take appropriate steps to contain this risk as it serves as counterparty to both the parties
in the swap deal.
Valuing Currency Swap
We can price currency swap on the same lines and principle as that of interest rate
swap, i.e. equating the value of cash inflows with the value of cash outflows. These cash
flows are in different currencies, domestic and foreign and need to be converted to the
domestic currency. If the present values of cash flows of domestic currency and foreign
190
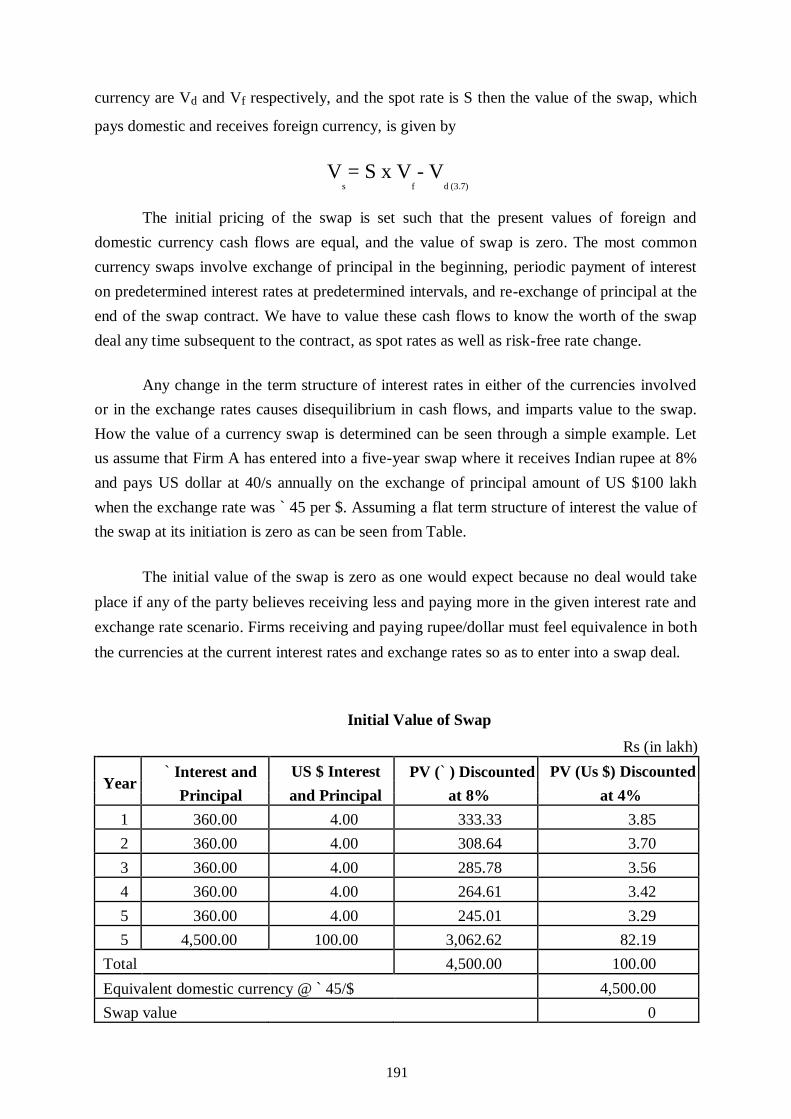
currency are Vd and Vf respectively, and the spot rate is S then the value of the swap, which
pays domestic and receives foreign currency, is given by
Vs
= S x Vf
- Vd (3.7)
The initial pricing of the swap is set such that the present values of foreign and
domestic currency cash flows are equal, and the value of swap is zero. The most common
currency swaps involve exchange of principal in the beginning, periodic payment of interest
on predetermined interest rates at predetermined intervals, and re-exchange of principal at the
end of the swap contract. We have to value these cash flows to know the worth of the swap
deal any time subsequent to the contract, as spot rates as well as risk-free rate change.
Any change in the term structure of interest rates in either of the currencies involved
or in the exchange rates causes disequilibrium in cash flows, and imparts value to the swap.
How the value of a currency swap is determined can be seen through a simple example. Let
us assume that Firm A has entered into a five-year swap where it receives Indian rupee at 8%
and pays US dollar at 40/s annually on the exchange of principal amount of US $100 lakh
when the exchange rate was ` 45 per $. Assuming a flat term structure of interest the value of
the swap at its initiation is zero as can be seen from Table.
The initial value of the swap is zero as one would expect because no deal would take
place if any of the party believes receiving less and paying more in the given interest rate and
exchange rate scenario. Firms receiving and paying rupee/dollar must feel equivalence in both
the currencies at the current interest rates and exchange rates so as to enter into a swap deal.
Initial Value of Swap
Rs (in lakh)
Year ` Interest and US $ Interest PV (` ) Discounted PV (Us $) Discounted
Principal and Principal at 8% at 4%
1 360.00 4.00 333.33 3.85
2 360.00 4.00 308.64 3.70
3 360.00 4.00 285.78 3.56
4 360.00 4.00 264.61 3.42
5 360.00 4.00 245.01 3.29
5 4,500.00 100.00 3,062.62 82.19
Total 4,500.00 100.00
Equivalent domestic currency @ ` 45/$ 4,500.00
Swap value 0
191

Valuation of swap can also be done on the basis of treatment of payments as series of
forward contracts. The forward rates can be worked out from the interest rate structure using
interest rate parity. The cash flow of interest of $ 4 lakh in yea` 1-5 and principal of $100 lakh
in year 5 are equivalent to forward contracts of the amounts in each year. Given the interest
rates of 8% and 4O/ for rupee and dollar respectively the one-year forward rate using interest
rate parity is
1+rd 1.08
F1=S0
= 45
= 45 × 1.0385 = ` 46.43$ 1+rf 1.03
Likewise, one can find out the implied forward rates for all subsequent periods at
which the dollar cash flows can be converted into local currency. The differential of
equivalent of dollar cash flows and the local currency will be the net cash flows of the firm
under the swap. The differential is discounted at the interest rate applicable to rupee (see
Table).
Assuming swap as series of forward contracts the value comes to zero in conformity
with the calculation based on the assumption of swap as pair of bonds.
Let us calculate the value of swap assuming that the domestic interest rate has gone up
from 8% to 10%, while the dollar interest rate remains same at 4%. Note that the absolute
values of the cash flows pertaining to the interest and principal as fixed at the time of setting
up of the swap deal do not change.
Currency Swap as Series of Forward Contracts
Figures (in lakh)
` Interest US $ Interest
Implied
Value of PV of Year forward Equivalent `
and Principal and Principal Forward Forward Rate (` /$)
1 360.00 4.00 46.73 186.92 173.08 160.26
2 360.00 4.00 48.53 194.11 165.89 142.22
3 360.00 4.00 50.39 201.58 158.42 125.76
4 360.00 4.00 52.33 209.33 150.67 110.75
5 360.00 4.00 54.35 217.38 142.62 97.06
5 4,500.00 100.00 54.35 5,434.56 -934.56 -636.05
Total 0.00
With the change in the domestic interest rates the discounted value of the rupee cash
flow changes as shown in Table.
192

Value of the Swap with Change in Interest Rate
Year ` Interest US $ Interest PV (` ) Discounted PV (Us $) Discounted
and Principal
and Principal at 10% at 4%
1 360.00 4.00 327.27 3.85
2 360.00 4.00 297.52 3.70
3 360.00 4.00 270.47 3.56
4 360.00 4.00 245.88 3.42
5 360.00 4.00 223.53 3.29
5 5,000.00 100.00 3,104.61 82.19
Total 4,469.29 100.00
PV in equivalent rupees 5,000.00
Value of swap -530.71
As may be seen from Table, with the rise in the interest rates in rupee the discounted
value of the rupee cash flow falls and if the firm is paying rupee the value of the swap
becomes negative ` 531 lakh. For a firm that receives rupee and pays $ the value of the swap
is positive ` 531 lakh. These values can be used to reverse the positions in the swaps taken
earlier.
Value of Currency Swap as Series of Forward Contracts
Figures (in lakh)
` Interest US $ Interest
Implied
Value of PV of Year forward Equivalent `
and Principal and Principal Forward Forward Rate (` /$)
1 360.00 4.00 52.88 211.54 148.46 134
2 360.00 4.00 55.94 223.74 136.26 112.61
3 360.00 4.00 59.16 236.65 123.35 92.67
4 360.00 4.00 62.58 250.30 109.70 74.92
5 360.00 4.00 66.19 264.74 95.26 59.15
5 5,000.00 100.00 66.19 6,618.61 -1,618.61 -1,005.03
Value of the swap -530.70
The same value of the swap is obtained if transactions under the swap are regarded as
series of forward contracts. One can calculate
1. The implied forward rates as per interest rate parity,
193

2. Convert the foreign currency cash flows to domestic currency at implied forward rate,
and
3. Discount the differential of payments at domestic interest rate. This is shown in Table.
The value of the swap comes to - ` 531 lakh.
Example 3.5 Value of Currency Swap
A swap was entered by an Indian firm with a bank converting its rupee liability into
British pound, where the firm received 10% on Indian rupee and paid 5% on British pound.
The amount of principals involved are ` 120 million and £ 1.5 million fixed at the then
exchange rate of ` 80/£. The swap has 4 semi-annual payments to follow. Assume the next
payment is due after 6 months from now and term structure in Indian rupee and British pound
is flat at 9.00% and 5.50% respectively, for the next 2 years. If the current exchange rate is `
82.00/£, what is the value of the swap for the Indian firm and the bank?
Solution
The semi-annual payment of interest is 0.05 x 120 = ` 6 million. The final payment
would be ` 126.00 million along with the principal amount. With 9% flat term structure on
continuous compounding the present value of the receivable by the firm from the bank would
be
PV of rupee cash flow =
6.0 x e-0.09*0.5 + 6.0 x e-0.09*1.0 + 6.0 x e-0.09*1.5 + 126.0 x e-0.09*2.0
PV of rupee cash flow = 5.7360 + 5.4836 + 5.2423 + 105.2440 = ` 121.7059 million
PV of rupee cash flow in pound terms = 121.7059/82.00 = £ 1.4848 million
PV of pound cash flow =
0.045 x e-0.055*0.5 + 0.045 x e-0.055*1.0 + 0.045 x e-0.055*1.5 + 1.545 x e-0.055*2.0
PV of pound cash flow = 0.0438 + 0.0426 + 0.0414 + 1.3841 = £ 1.5119 million
PV of pound cast flow in rupee terms = 82.00 x 1.5119 = ` 123.9735
Value of the swap for Firm Bank
(in millions)
Rupee leg - 121.70 - 1.4842 + 121.71 + 1.4842
Pound leg + 123.97 + 1.5119 - 123.97 - 1.5119
194

Other Swaps
Swap implies interchange. It need not be on interest rate or currencies alone. The basic
idea of the swap is to have the interchange based on different parameters so that the
complexion of asset of liability changes from fixed to variable or vice versa, as may be
needed.
Commodity Swaps
Prices of commodities change continuously. If the prices of output were fixed the
profit would be variable. By entering into futures contract traders can render stability to
profits.
However, futures as a hedging tool remains a short- term measure, as the hedging
period is limited to the maximum maturity of futures contracts available at any point of time.
Swaps, being OTC product can ensure a level of profit for the longer period.
Consider a case of ajeweller who makes ornaments using gold. Gold prices change
almost continuously but the prices of the product cannot change that often, causing the profit
of the jeweller to fluctuate.
By entering into a swap where the jeweller pays a fixed rate for gold but receives cash
flow determined on the basis of current price of gold, the cost can be fixed. A plain vanilla
swap with monthly cash flows where, jeweller pays, fixed rate (` 13,000 per 10 gm) but
receives on the basis of monthly average price is depicted in Figure. This swap would provide
the hedge against the fluctuating price of gold.
Like other swaps this swap can be done for a notional quantity of gold that need not be
exchanged. The life of the swap contract too can be fixed. More complex swaps can be where
the two legs are on different commodities, different currencies.
‘Plain Vanillaoditwap
195

Equity SWAPS
Under equity swap one party pays a fixed rate of return, while it receives a return
based on the stock market index of the preceding period. The stock market returns are
variable. For example, consider a mutual fund owning a portfolio of stocks. It is concerned
about providing some minimum returns to the members of the fund. In order to achieve this
objective it can enter into a swap for the part value of the portfolio where it pays to swap
dealer returns based on an index say Nifty (the index of National Stock Exchange) determined
at specified periodicity as agreed in the swap, while receiving a fixed rate of return, say 10%.
This is shown in Figure.
‘Plain Vanillaquitwap
By such a swap the mutual fund locks in a return of 10% on the value of the swap.
The part of the portfolio would then be transformed from equity to bonds. Again we do not
exchange the principal and it remains only notional, serving the purpose of computation of
cash flows. In the event of negative returns in a period, the mutual fund would in fact receive
on both the legs of the swap.
Innovations in the swaps are taking place at a fast pace. Swaption, the options on
swaps, are also becoming popular. A call swaption gives one the right to pay a fixed payment
of interest and a put swaption gives the holder a right to receive a fixed rate of interest. In
each case the holder pays a nominal front-end premium to cover, the risk of rising interest rate
or falling interest rate.
With regard to comparison with other derivatives such as options and futures, swap is
OTC product taking into account the specific needs of counterparties with financial
institutions and banks serving as intermediaries.
The advantage and popularity of swaps rests on the validity of theory of comparative
advantage of international trade. Theory of comparative advantage would predict
disappearance of swaps as an instrument of reduced financing cost as with time the
opportunities of credit arbitrage should vanish. However, the increasing volumes of
196

swap transactions defy the logic. As long as imperfections in the capital markets persist,
swaps would continue to grow. These imperfections have their roots in controls, incentives,
and protection exercised by various governments making access to capital markets
discriminatory. Governments may prohibit non-resident firms to access to capital markets or
may offer subsidized loans to promote development. Such aberrations based on domicile of
the firms are likely to continue and would offer scope for swaps, as tools of reducing
financing cost, to take place.
Summary
Swaps came into being to overcome the regulatory controls over capital flows across
borders when MNCs resorted to mutual parallel loans to fund their operations overseas. Later,
when capital controls were removed they developed into full blown financial products.
Swap may be defined as exchange of series of cash flows, based on a parameter, at
periodic intervals for a fixed period. When the cash flow is based on interest rates it is called
interest rate swap. When exchange of cash flow is based on exchange rates it is called
currency swap. In an interest rate swap one leg of cash flow is based on fixed interest rate on
a notional principal, while the other leg of the cash flow, called floating leg, is based on a
market-based floating rate. No principal is exchanged either at initiation or conclusion of
swap. Only differential of the cash flow is exchanged.
Interest rate swap can alter the complexion of nature of liability or asset from fixed
rate to floating rate or vice versa, without necessity of disturbing the original contract. Interest
rate swaps serve as hedging tool against the interest rate risk. Faced with rising interest rates,
a firm can alter the liability of a loan on floating rate to fixed rate with swap entered with a
bank without disturbing the original loan contract. Besides working as a tool to hedge against
the interest rate risk, a swap has potential to save funding cost. This is due to the fact that
different firms have unequal credit spreads in fixed and floating markets for borrowing. The
differential in the spread, referred to as comparative advantage, can be utilized for the benefit
of two firms to reduce borrowing cost.
A swap normally requires exact matching of needs of the two counterparties in terms
of amount, maturity, timing, and periodicity of interest payments which are difficult to fulfill
and constrain the development of market. Another drawback is that swap give rise to
counterparty risk. Banks, by acting as a facilitator, provide the much needed depth to the
swap markets. They also fill the gaps in matching needs and act as counterparties to a swap
transaction. The ready market of swaps provided by banks also makes entry and exit from
swap easier.
197

Currency swaps have same applications as that of interest rate swap. They can be used
to transform the assets/liabilities from one currency to another, hedge against exchange rate
risk and reduce funding cost for MNCs raising funds in different currencies. Unlike interest
rate swaps where no principal is exchanged, in currency swaps the principal amount is
exchanged at initiation of swap and re-exchanged upon its termination. During the swap the
interest rates, either fixed or floating, are exchanged in two different currencies.
At the initiation of swap the value of the swap is always zero as the present values of
the two opposite legs are equal. The value of the swap is determined on the basis of interest
rate scenario in interest rate swaps. While the cash flow of the fixed leg is known in advance,
the payments on the floating legs are decided only one period in advance and are reset at
periodic intervals. Changing interest rate scenario creates value. For valuation the swap may
be either treated as pair of fixed rate and floating rate bonds or as series of forward
agreements. The value of swap would be dependent upon the term structure of interest rates.
Besides interest rate and currency swaps, many other swaps are possible. When
commodity price decides the cash flows it is called commodity swap. Equity returns decide
the cash flows in equity swaps. Innovations in the field of swaps are continuous and newer
products are being developed from time to time. Being an OTC product the modifications in
the terms and conditions of the swaps are aplenty.
Solved Problems
1. Changing Nature of Asset from Floating to Fixed Rate
Cash Rich Ltd (CRL) has invested ` 50 crore in market linked securities providing it a
current return of 8% with current MIBOR of 7.50°Io. Of late, yield in the market have started
falling adversely affecting the income of CRL. It needs to protect the same.
Profesnaantd’anker haffereeaOaseith rates at 7.30%-7.40%. Should CRL accept the swap what income can it lock-in for next 3 years?
What would be the advantage of the swap? Depict the swap arrangement.
Solution
CRL has current income at 50 bps above MIBOR currently at 7.50%. Since MIBOR is
likely to fall, it is advisable for them to accept the swap with the bank. The swap arrangement
is depicted below (see Figure E).
198

CRL can receive fixed rate and pay MIBOR. The bid rate of swap (7.30%) would be
applicable.
The income for CRL would be = MIBOR + 0.50% + 7.30% - MIBOR
= 7.80%
By entering swap with the bank CRL may transform the asset from floating rate to
fixed rate. In case MIBOR falls to less than 7.30% CRL would have the benefit of the swap.
By entering the swap CRL does not need to alter its investment portfolio.
2. Reducing Cost of Funds with Interest Rate Swap
Company P and Company Q have equal requirement of funds of ` 50 Crore each.
They have been offered following rates in the fixed and floating rate markets for debt.
Fixed Rate Floating Rate
Company P 10.00% MIBOR + 50 bps
Company Q 12.00% MIBOR + 150 bps
Company P wants funds at floating rate while Company Q is happy to raise funds at
fixed rate basis. A bank is willing to act as intermediary with 20 bps as its remuneration.
Depict a swap sharing the gains of swap equally and find out the cost of funds for Company P
and Company Q. what would be the saving in financing cost of each firm?
Solution
The absolute advantage for Company P is 200 bps in fixed rate market, while it is 100
bps in the floating rate market. Therefore, the comparative advantage is 100 bps which needs
to be shared among the bank, Company P, and Company Q. With the bank wanting 20 bps the
remaining 80 bps are shared equally at 40 bps each between Company P and Company Q
199

Though Company P wants to raise finance at floating rate, the firm must access the
fixed rate market and then enter into a swap deal with the bank to convert the fixed rate
liability into floating rate. Similarly, Company Q can access floating rate market and enter
swap with bank to convert floating rate liability into fixed rate liability.
One such structure is presented in Figure E.
The aggregate cost of funds for Company P would be MIBOR + 10 bps; a saving of
40 bps if it had accessed the floating rate market. Similarly, Company Qobtains funds at
11.6011/6 against 12% otherwise without the swap deal resulting in advantage of 40 bps. The
bank earns 20 bps in the fixed rate payments and receipts.
Company Q Company P
1. Payment to investors MIBOR + 1.50% 10.00%
2. Payment to bank 10.10% MIBOR
3. Receipt from Bank MIBOR 9.90%
Cost of borrowing (1+2+3) 11.60% MIBOR + 0.10%
3. Reducing Cost of Funds with Currency Swap
A British firm and a German firm have equal requirement of funds. They have been
offered following rates in the fixed and floating rate markets for debt:
Pound Market Euro Market
British Firm 5.00% 5.50%
German Firm 6.50% 6.00%
British firm needs euro funding obtainable at 5.50% and German firm requires pound
available at 6.500/0. Demonstrate how both the firms can reduce their cost of funds by having
a swap of cash flows.
200

Solution
The absolute advantage for British firm is 150 bps in pound market, while it is at
advantage of 50 bps in the euro market. Therefore, the comparative advantage is 100 bps,
which needs to be shared between the German and British firms. With equal sharing, the
advantage to each would be 50 bps.
The British firm must access pound market and the German firm must borrow in
euros, and then exchange cash flows in pounds and euros, pay interest in respective currencies
to each other and re-exchange the principal cash flows on maturity. Swap arrangement is
shown below (see Figure E).
The cost of funds after the swap deal would be:
For British Firm
£ 5.00% - £ 5.00% + € 5.00% = € 5.00%; a saving of 0.50% For German firm:
€ 6.0011/o - € 5.00% + £ 5.0011/o = € 1.00°/o+ £ 5.00%, 6%; a saving of 0.50%
4. Value of Interest Rate Swap
A firm has a swap under which it pays fixed interest at 90/0 and receives floating on
semi-annual basis. The swap has 14 months to go with next payment falling due after 2
months. The rate for the floating payment fixed 4 months ago is 10.10°/o. If the term structure
for next 15 months is flat at 10.10% what is the value of the swap for the firm?
Solution
The value of the fixed leg of the swap would consist of interest payments at 9% (`
4.50 semi-annual) after 2, 8, and 14 months. If considered as a bond, the final payment would
also involve payment of a principal of ` 100.00. The present value discounted at 10.10% (term
structure is flat) for all the payments is ` 101.5161, as shown below:
201

PV of fixed cash flow
= 4.50 x e-0.101.2/12 + 4.50 x e-0.101*8/12 + 104.50 x e e-0.101.14/12
= 4.4249 + 4.2070 + 92.8842 = ` 101.5 161
Similarly, payment for floating leg is determined 4 months ago at 10.10% would be
` 5.50 to be made after 2 months. The next payment would be decided then. It implies that
floating rate payment marks itself to par then. Therefore, value of the floating leg would be
PV of floating cash flow 105.50 x e-0101*2/12= ` 103.2965
Therefore, the firm paying fixed and receiving floating would have a value of ` 2.78
(103.30-101.52) per ` 100 of the notional amount or 2.78%
Self Assessment Questions
1. Review the assumptions and limitations of the BS option-pricing model.
2. What are the features of the option-pricing model proposed by Cox, Ross and
Rubinstein?
3. The current stock price of a Venus Ltd. is ` 37.50 and that one period from now it will
either be selling for either ` 25.00 or ` 56.25. Further you are aware that Venus Ltd.
does not pay dividends and that ` 100 invested in a zero coupon bond now will be
worth ` 105 at the end of the period. Consider a European put option with strike price `
40 that expires at the end of the period. Determine the parameters r, u and d for the one
period binomial model. Use these parameters to price an ATM call option on this
stock.
4. Consider the binomial model for an American call and put on a stock whose price is `
125. The exercise price for both the put and the call is ` 110. The annualized volatility
is 32%, the risk-free rate is 10% and the options expire in 90 days. If the stock pays a `
2.50 dividend in 30 days, compute the price of these options using a four period tree.
Draw the stock tree and the corresponding trees for the call and the put. Explain when,
if ever, each option should be exercised.
5. Graph the payoffs (90 days before expiry date) for each of the following strategies as
functions of the underlying asset price:
a. A long straddle.
b. A long strangle.
202

c. A bull spread.
d. A bear spread.
e. A butterfly spread.
6. Bring out the differences between:
a) Bull call spread and a bull put spread; and
b) Iron butterfly and a regular butterfly.
7. Compare and contrast the volatility selling strategies.
8. What do you understand by option contract? Illustrate with an example.
9. Explain features of an option.
10. How are option contracts settled? Illustrate.
11. What do you understand by parallel loans? Explain with an example.
12. Describe features of an interest rate swap.
13. Explain the value of interest rate swap.
14. How would you convert a floating rate liability into a fixed rate liability using swap?
Draw a schematic diagram to explain your answer.
15. If an enterprise has invested funds in securities providing floating rate of income, what
risk does it face? How would you hedge such risk using an interest rate swap?
16. What are the problems in arranging a swap and how are they overcome by swap
intermediary/bank?
17. Explain hedging of fixed rate and floating rate loans using swap.
18. What is a currency swap and how is it different operationally from an interest rate
swap?
19. Currency swaps can be used to convert assets/liabilities from one currency to another.
Explain with a suitable example.
20. How are currency swaps and interest rate swaps used for reducing cost?
****
203

204

UNIT - III
Unit Structure
Lesson 3.1 - Futures Market
Lesson 3.2 - Pricing of Futures
Lesson 3.3 - Theories of Futures Prices
Learning Objectives
After reading this chapter, students should
➢➢ Understand the concept of financial futures contracts. ➢➢ Know about the various types of futures contracts like interest rate futures, foreign
currency futures, stock index futures, bond index futures, etc. ➢➢ Understand the various operators in futures markets like hedgers, speculators,
spreaders, arbitrageurs, etc. ➢➢ Know the functions of futures market.
➢➢ Be aware about the growth of futures markets worldwide as well as in India.
Understand the mechanism of futures market trading. ➢➢ Know about the role and functions of clearinghouse, stock exchanges, etc.
➢➢ Be familiar with the concept of margins and their types like initial margin and
maintenance margins, how do margins flow from investor or trader to clearinghouse. ➢➢ Understand how futures contracts are closed.
205

Lesson 3.1 - Futures Market
Introduction
In the last two decades, the futures markets have experienced a remarkable growth all
over the world in size, trading volume and acceptance by the business community. New
contracts with new products along with entirely new possibilities in the futures markets have
become the reality now. Futures trading were started in the mid-western part of the USA
during 1970s, but today it is traded throughout the world, and 24 hours a day. Most common
underlying assets used in futures markets today are commodities, agricultural products,
metals, energy products, weather, electricity, interest rates, foreign exchange, equities, stock
index, and so on. In fact, today the futures markets have become an integral part of the
financial markets all over the world.
Futures
A futures contract, or simply called futures, is a contract to buy or sell a stated
quantity of a commodity or a financial claim at a specified price at a future specified date.
The parties to the futures have to buy or sell the asset regardless of what happens to its value
during the intervening period or what happens to be the price on the date when the contract is
implemented.
Both the parties to the futures have a right to transfer the contract by entering into an
offsetting futures contract. If not transferred until the settlement/specified date, then they have
obligations to fulfill the terms and conditions of the contract. Futures are traded on the
exchanges and the terms of the futures contracts are standardized by the exchange with
reference to quantity, date, units of price quotation, minimum change in price (tick), etc.
Futures can be in respect of commodities such as agricultural products, oil, gas, gold,
silver, etc., or of financial claims such as shares, debentures, treasury bonds, share index,
foreign exchanges, etc.
In a futures contract, the parties fix the terms of the transaction and lock in the price at
which the transaction will take place between them at future date. The futures contract,
206
as they appear to be, providing for the physical delivery of the asset, however, in practice
most of the futures are settled by and offsetting futures contract. If a particular futures is not
settled by the party himself then it will be settled by the exchange at a specified price and the
difference is payable by or to the party. The basic motive for a future is not the actual delivery
but the hedging for future risk or speculation. Further, in certain cases, the physical asset does
not exist at all. For example, in case of Stock Index Futures, the Index is the weighted average
price and cannot be delivered. So, such futures must be cash settled only.
Futures are traded at the organized exchanges only. Some of the centers where futures
are traded are Chicago Board of Trade, Tokyo Stock Exchange, London International
Financial Futures Exchange (LIFFE), etc. The exchange provides the counter-party guarantee
through its clearing house and different types of margins system. Futures contracts are
marked to market at the end of each trading day. Consequently, these are subject to interim
cash flows for adverse or favourable price movement. With reference to trading in Stock
Index Futures, SEBI has provided that the participating parties have to deposit an initial cash
margin as well as that difference in traded price and actual price on daily basis. At the end of
the settlement period or at the time of squirring off a transaction, the difference between the
traded price and settlement price is settled by cash payment. No carry forward of a futures
contract is allowed beyond the settlement period. National Stock Exchange (NSE) has issued
the Futures and Options Regulations, 2000 which are applicable to the derivative contracts
(both futures and options) traded at the NSE.
Types of Financial Futures Contracts
There are different types of contracts in financial futures which are traded in the
various futures financial markets of the world. These contracts can be classified into various
categories which are as under:
Interest Rate Futures
It is one of the important financial futures instruments in the world. Futures trading on
interest bearing securities started only in 1975, but the growth in this market have been
tremendous. Important interest- bearing securities are like treasury bills, notes, bonds,
debentures, euro-dollar deposits and municipal bonds. In this market, almost entire range of
maturities bearing securities is traded. For example, three- month maturity instruments like
treasury bills and euro-dollar time deposits, including foreign debt instruments at Chicago
Mercantile Exchange (CME), British Government Bonds at London International Financial
Futures Exchange (LIFFE), Japanese Government Bonds at CBOT, etc. are traded.
207

This market is also further categorized into short-term and long-term interest bearing
instruments. A few important interest rate futures traded on various exchanges are: notional
gilt-contracts, short-term deposit futures, treasury bill futures, euro-dollar futures, treasury
bond futures and treasury notes futures.
Foreign Currencies Futures
These financial futures, as the name indicates, trade in the foreign currencies, thus,
also known as exchange rate futures. Active futures trading in certain foreign currencies
started in the early 1970s. Important currencies in which these futures contracts are made such
as US-dollar, Pound Sterling, Yen, French Francs, Marks, Canadian dollar, etc. These
contracts have a directly corresponding to spot market, known as interbank foreign exchange
market, and also have a parallel interbank forward market. Normally futures currency
contracts are used for hedging purposes by the exporters, importers, bankers, financial
institutions and large companies.
Stock Index Futures
These are another major group of futures contracts all over the world. These contracts
are based on stock market indices. For example, in the US markets, there exist various such
futures contracts based on different indices like Dow Jones Industrial Average, Standarnoor’s
500, Neortocxchangndex, Value Linnc. Other
important futures contracts in different countries are like in London market, based on the
Financial Times—Stock Exchange 100 share Index, Japanese Nikkei Index on the Tokyo
Futures Exchange and on the Singapore International Monetary Exchange (SIMEX) as well.
Similarly, in September, 1990, Chicago Mercantile Exchange began trading based on Nikkei
225 Stock Index and Chicago Board of Trade launched futures contracts based on the TOPIX
index of major firms traded on the Tokyo Stock Exchange.
One of the most striking features of these contracts is that they do not insist upon the
actual deliverynl’bligatiousulfilleeverrade oettent
by cash payment at the end of trading. Stock Index futures contracts are mainly used for
hedging and speculation purposes. These are commonly traded by mutual funds, pension
funds, investment trusts, insurance companies, speculators, arbitrageurs and hedgers.
Bond Index Futures
Like stock index futures, these futures contracts are also based on particular bond
indices, i.e., indices of bond prices. As we know that prices of debt instruments are inversely
208

related to interest rates, so the bond index is also related inversely to them. The important
example of such futures contracts based on bond index is the Municipal Bond Index futures
based on US Municipal Bonds which is traded on Chicago Board of Trade (CBOT).
Cost of Living Index Futures
This is also known as inflation futures. These futures contracts are based on a
specified cost of living index, for example, consumer price index, wholesale price index, etc.
At International Monetary Market (1MM) in Chicago, such futures contracts based on
American Consumer Price Index are traded. Since in USA, the inflation rates in 1980s and
1990s were very low, hence, such contracts could not be popular in the futures market. Cost
of living index futures can be used to hedge against unanticipated inflation which cannot be
avoided. Hence, such futures contracts can be very useful to certain investors like provident
funds, pension funds, mutual funds, large companies and governments.
Evolution of Futures Market in India
➢➢ Organizeutures market evolved in Indihettinp oBombaotton
Trade Associatiotd.” in 1875. IeparatssociatioalleThombay
Cotton Exchange L” was constituted. ➢➢ Futures trading in oilseeds were started with the setting up of Gujarati Vyapari
Mandaecond exchangeheedsssociatiotd., tg
oilseeds such as castor and groundnuts, was setup in 1926 in Mumbai. Then, many
other exchanges trading in jute, pepper, turmeric, potatoes, sugar, and silver, followed. ➢➢ Futures market in bullion began at Mumbai, in 1920.
➢➢ In 1940s, trading in forwards and futures was made difficult through price controls
till 1952 when the government passed the Forward Contract Regulation Act, which
controls all transferable forward contracts and futures. ➢➢ During the 1960s and 70s, the Central Government suspended trading in several
commodities like cotton, jute, edible oilseeds, etc. as it felt that these markets helped
increase prices for commodities ➢➢ Two cottees thaerppointeatwala Cotteand Khusro
Committee in 1980, recommended the reintroduction of futures trading in major
commodities, but without much result.
One more committee on Forwards market, the Kabra Committee was appointed in
1993, which recommended futures trading in wide range of commodities and also up
209

gradation of futures market. Accepting partially the recommendations, Government permitted
futures trading in many of the commodities.
Operators/Traders in Futures Market
Futures contracts are bought and sold by a large number of individuals, business
organizations, governments and others for a variety of purposes. The traders in the futures
market can be categorized on the basis of the purposes for which they deal in this market.
Usually financial derivatives attract following types of traders which are discussed here as
under:
Hedgers
In simple term, a hedge is a position taken in futures or other markets for the purpose
of reducing exposure to one or more types of risk. A person who undertakes such position
ialles ‘hedger’ther words, a hedger uses futures markedisausey
the movements in prices of securities, commodities, exchange rates, interest rates, indices,
etc. As such, a hedger will take a position in futures market that is opposite a risk to which he
or she is osed. By taking an oppte ption to a perved risk is called ‘hedging strategy
futurmark’. The essenof hedging strategy is the ption of a futures
position that, on average, generates profits when the market value of the commitment is
higher than the expected value. For example, a treasurer of a company knows the foreign
currency amounts to be received at certain futures time may hedge the foreign exchange risk
by taking a short position (selling the foreign currency at a particular rate) in the futures
markets. Similarly, he can take a long position (buying the foreign currency at a particular
rate) in case of futures foreign exchange payments at a specified futures date.
The hedging strategy can be undertaken in all the markets like futures, forwards,
options, swap, etc. but their modus operandi will be different. Forward agreements are
designed to offset risk by fixing the price that the hedger will pay or receive for the
underlying asset. In case of option strategy, it provides insurance and protects the investor
against adverse price movements. Similarly, in the futures market, the investors may be
benefited from favourable price movements.
Long Hedging Using Futures
Example
Silver is an essential input in the production of most types of photographic films and
papers and the price of silver is quite volatile, for a manufacturer XYZ Ltd., there is
210

considerable risk, because profit can be dramatically affected by fluctuations in the price of
silver. Suppose XYZ Ltd. need 20,000 ounces of silver in two months and prices of silver on
May 10 are:
Contract Price (`)
Spot 1050
July 1070
September 1080
One contract on COMEX traded is of 5000 ounces. Fearing the prices of silver may
rise unexpectedly, XYZ Ltd. enters into a futures contract at ` 1070 in July delivery. He,
therefore, locked into futures price today and long hedge in silver will be as follows:
A Long Hedge in Silver Futures
Date Cash Market Futures market
Anticipates the need for 20,000 Buys four 5000 ounce of silver in
May 10 ounces of silver in two-month and July futures contract at ` 1070 per
pay ` 1070 per ounce or total amount ounce.
to ` 21,400.00
The spot price of silver is now ` Because futures contract, at maturity,
July 10
the futures and spot prices are equal
1080 and XYZ Ltd. have to pay ` and four contracts are sold at ` 1080
21,600,000 per ounce.
Profit / Loss Loss ` 2,00,000 Futures profit ` 2,00,000
Net wealth change = 0
Since on expiration date spot price and futures price converge, XYZ Ltd. has hedged
its position by entering into futures contract.
Speculators
A speculator may be defined as an investor who is willing to take a risk by taking
futures position with the expectation to earn profits. The speculator forecasts the future
economic conditions and decides which position (long or short) to he taken that will yield a
profit if the forecast is realized. For example, suppose a speculator has forecasted that price of
gold would be ` 5500 per 10 grams after one month. If the current gold price is ` 5400 per 10
grams, he can take a long position in gold and expects to make a profit of ` 100 per 10 grams.
This expected profit is associated with risk because the gold price after one month
211
may decrease to ` 5300 per 10 grams, and may lose ` 100 per 10 grams. Speculators usually
trade in the futures markets to earn profit on the basis of difference in spot and futures prices
of the underlying assets. Hedgers use the futures markets for avoiding exposure to adverse
movements in the price of an asset whereas the speculators wish to take position in the market
based upon such movements in the price of that asset. It is pertinent to mention here that there
is difference in speculating trading between spot market and forward market. In spot market a
speculator has to make an initial cash payment equal to the total value of the asset purchased
whereas no initial cash payment except the margin money, if any, to enter into forward
market. Therefore, speculative trading provide the investor with a much higher level of
leverage than speculating using spot markets. That is why, futures markets being highly
leveraged market, minimums are set to ensure that the speculator can afford any potential
losses.
Speculators can be classified into different categories. For example, a speculator who
uses fundamental analysis of economic conditions of the market is known as fundamental
analyst whereas the one who uses to predict futures prices on the basis of past movements in
the prices of the asset is known as technical analyst. A speculator who owns a seat on a
particular exchange and trades in his own name is called a local speculator. These, local
speculators can further be classified into three categories, namely, scalpers, pit traders and
floor traders. Scalpers usually try to make profits from holding positions for short period of
time. They bridge the gap between outside orders by filling orders that come into the brokers
in return for slight price concessions. Pit speculators like scalpers take bigger positions and
hold them longer. They usually do not move quickly by changing positions overnights. They
most likely use outside news. Floor traders usually consider inter commodity price
relationship. They are full members and often watch outside news carefully and can hold
positions both short and long.
Arbitrageurs
Arbitrageurs are another important group of participants in futures markets. An
arbitrageur is a trader who attempts to make profits by locking in a risk less trading by
simultaneously entering into transactions in two or more markets. In other words, an
arbitrageur tries to earn riskless profits from discrepancies between futures and spot prices
and among different futures prices. For example, suppose that at the expiration of the gold
futures contract, the futures price is ` 5500 per 10 grams, but the spot price is ` 5480 per 10
grams. In this situation, an arbitrageur could purchase the gold for ` 5480 and go short a
futures contract that expires immediately, and in this way making a profit of ` 20 per 10
grams by delivering the gold for ` 5500 in the absence of transaction costs.
212

The arbitrage opportunities available in the different markets usually do not last long
because of heavy transactions by the arbitrageurs where such opportunity arises. Thus,
arbitrage keeps the futures and cash prices in line with one another. This relationship is also
expressed by the simple cost of carry pricing which shows that fair futures prices, is the set of
buying the cash asset now and financing the same till delivery in futures market. It is
generalized that the active trading of arbitrageurs will leave small arbitrage opportunities in
the financial markets. In brief, arbitrage trading helps to make market liquid, ensure accurate
pricing and enhance price stability; it involves making profits from relative mis-pricing.
Spreaders
Spreading is a specific trading activity in which offsetting futures position is involved
by creating almost net position. So the spreaders believe in lower expected return but at the
less risk. For a successful trading in spreading, the spreaders must forecast the relevant factors
which affect the changes in the spreads. Interest rate behaviour is an important factor which
causes changes in the spreads. In a profitable spread position, normally, there is large gain on
one side of the spread in comparison to the loss on the other side of the spread. In this way, a
spread reduces the risk even if the forecast is incorrect. On the other hand, the pure
speculators would make money by taking only the profitable side of the market but at very
high risk.
Functions of Futures Market
Apart from the various features of different futures contracts and trading, futures
markets play a significant role in managing the financial risk of the corporate business world.
Recently, financial executives and treasurers are frequently using the various tools available
to control their corporate risks and exposures. Financial derivatives instruments, in this
respect, have been very useful, popular and successful innovations in capital markets all over
the world. Recently, it is noted that financial futures markets have been actively functioning
in both developed as well as developing countries.
Futures markets like any other market or industry serve some social purposes. In the
past section of this chapter, we have seen that futures markets have been recognized as
meeting the needs of some important users like hedgers, speculators, arbitrageurs, spreaders,
etc. In the light of those, we will discuss the uses of financial futures market in the society as
a whole in the context of risk transference, price stabilization, price discovery, price
registration, etc.
213

Hedging
The primary function of the futures market is the hedging function which is also
known as price insurance, risk shifting or risk transference function. Futures markets provide
a vehicle through which the traders or participants can hedge their risks or protect themselves
from the adverse price movements in the underlying assets in which they deal. For example, a
farmer bears the risk at the planting time associated with the uncertain harvest price his wheat
will command. He may use the futures market to hedge this risk by selling a futures contract.
For instance, if he is expected to produce 1000 tons of wheat in next six months, he could
establish a price for that quantity (harvest) by selling 10 wheat futures contracts, each being
of 100 tons. In this way, by selling these futures contracts, the farmer intends to establish a
price today that will be harvested in the futures. Further, the futures transactions will protect
the farmer from the fluctuations of the wheat price, which might occur between present and
futures period.
Not only this, this futures market also serves as a substitute for a cash market sale
because a cash market sale was impossible since the wheat was not in existence. In this
example, we see that the farmer (trader) sells wheat in the futures market which is a
temporary substitute of a futures anticipated cash market transaction. In this way, the futures
market also serves as substitute futures anticipated futures cash market transactions.
Such above-said examples can be quoted for futures financial markets like interest rate
futures contracts which protect the financial institutions such as commercial banks, insurance
companies, mutual funds, pension funds, etc. from the adverse changes in the values of their
assets and liabilities due to interest rates movements. Similarly, currency futures contract
protect the exporters, importers and others who deal in the foreign exchange market, against
exchange rate fluctuations. Stock index futures contracts protect the other investors from the
adverse changes in portfolio value.
In brief, futures markets hedging activities are very much useful for society since they
control, shift, avoid, reduce, eliminate and manage efficiently various types of risks. Further,
derivatives enable the investors to modify suitably the risk characteristics of their portfolios,
oishoshrilssumoher profihbsence of
futures markets, thisconomy could bher anhorsff.
Price Discovery
Another important use of futures market is the price discovery which is the revealing
of information about futures cash market prices through the futures market. As we know
214

that in futures market contract, a trader agrees to receive or deliver a given commodity or
asset at a certain futures time for a price which is determined now. It means that the futures
market creates a relationship between the futures price and the price that people expect to
prevail at the delivery date. In the words of M.J. Powers and D. Vogel, as stated in their book
entitledInside thanciautures Market”utures markrovechanism by
which diverse and scattered opinions of the futures are coalesced into one readily discernible
number which provides a consensus of knowledgeable thinking. It is evident from this
statemenhautures prices provresn consensuhoday’ectations
about a specified future time. If these expectations are properly published then they also
perform an information or publicity function for the users and the society. By using the
information about the futures prices today, the different traders/observers in the market can
estimate the expected spot price in the future time of a given asset. In this way, a user of the
futures prices can make consumption or investment decisions more wisely.
Further, price discovery function of the futures market also leads to the inter temporal
inventory allocation function. According to this, the traders can compare the spot and futures
prices and will be able to decide the optimum allocation of their quantity of underlying asset
between the immediate sale and futures sale. The uses of price discovery function can be
explained by an example, supposing, a mine operator is trying to take a decision whether to
reopen a marginally profitable gold mine or not. If, we assume that the gold ore in the mine is
not of the best quality and so the yield from the mine will be relatively low. The decision will
depend upon the cost incurred on mined and refined of gold and the price of the gold to be
obtained in futures. Hence, the crucial element in this decision is the futures price of gold.
The miner can analyze the gold prices quoted in the futures market today for determining the
estimate of the futures price of the gold at a specified futures period. In this situation, the
miner has used the futures market as a vehicle of price discovery.
It is evident from the above that price discovery function of futures market is very
much useful for producers, farmers, cattle ranchers, wholesalers, economic agents, etc. who
can use futures market estimates information of futures cash prices to guide their production
or consumption decisions.
Financing Function
Another important function of a futures market is to raise finance against the stock of
assets or commodities. Since futures contracts are standardized contracts, so, they make it
easier for the lenders about the assurance of quantity, quality and liquidity of the underlying
asset. Though this function is very much familiar in the spot market, but it is
215

also unique to futures markets. The reason being the lenders are often more interested to
finance hedged asset stock rather than un-hedged stock because the hedged asset stock are
protected against the risk of loss of value.
Liquidity Function
As we see that the main function of the futures market deals with such transactions
which are matured in the future period. They are operated on the basis of margins which are
determined on the basis of rides involved in the contract. Under this the buyer and the seller
have to deposit only a fraction of the contract value, say 5 percent or 10 percent, known as
margins. It means that the traders in the futures market can do the business a much larger
volume of contracts than in a spot market, and thus, makes market more liquid. That is why
the volume of the futures markets is much larger in comparison to the spot markets. This is
also known as gearing or leverage factor. It means that a trader in the futures markets can gear
up his capital 10 times and 20 times if the margin/deposit is 10 percent and 5 percent
respectively, resulting in his profit or loss, as a proportion of his capital is 10 times or 20
times magnified. Gearing is the British term and in American parlance it is known as
leverage. This is explained by the following example:
Example
A speculator estimates a price increase in the silver futures market from the current
futures price of ` 7500 per kg. The market lot being 10 kg, he buys one lot of futures silver for
` 75,000 (7500x 10). Assuming the 10 percent margin, the speculator is to deposit only ` 7500. Now supposing that a 10 percent increase occurs in the price of silver to ` 8250 per
kg. The value of transaction will also increase, i.e., ` 82,500, and hence, incurring profit of `
7500(82,500-75,000) on this transaction. In other words, the speculator earns in this
transaction ` 7500 on the investment of ` 7500, being 100 percent profit on investment, and
vice-versa.
From the above example, it is evident that futures markets operations are highly risky
due to gearing effect. So they are more attractive for the speculators.
Price Stabilization Function
Another important function of a futures market is to keep a stabilizing influence on
spot prices by reducing the amplitude of short term of fluctuations. In other words, futures
market reduces both the heights of the peaks and the depth of the troughs. The major
causative factors responsible for such price stabilizing influence are such as, speculation,
216

price discovery, tendency to panic, etc. A detail discussion on price stabilization function of
futures market will be made in the forthcoming chapters.
Disseminating Information
Apart from the aforementioned functions of the futures markets like risk-transference
(hedging), price discovery, price stabilization, liquidity, and financing, this market is very
much useful to the economy too. Futures markets disseminate information quickly, effectively
and inexpensively, and, as a result, reducing the monopolistic tendency in the market.
Further, such information disseminating service enables the society to discover or
form suitable true/correct/equilibrium prices. They serve as barometers of futures in price
resulting in the determination of correct prices on spot markets now and in futures. They
provide for centralized trading where information about fundamental supply and demand
conditions are efficiently assimilated-and acted on.
The financial futures markets have generated employment opportunities by creating a
significant number of jobs and attracted a considerable volume of transactions from non-
residents. Indirectly, it is another way of generating foreign exchange for the countries.
Further thutures markets acstarter forf investmenesulting in a wider participation in the
securities markets. They attract young investors and act as catalysts to the growth of securities
markets. They enable individuals and managers of funds to devise or design strategies for
proper assets allocation, yield enhancements and reducing risks. For example, futures markets
quotations are also useful to other sectors of society besides speculators and hedgers. Which
goods or commodities are to be produced and in which financial assets the investment is to be
made, such decisions are assisted by the futures market prices.
Further, some individuals may not engage in certain clearly beneficial forms of
economic activity if they were forced to bear all of the risks of that activity themselves.
Futures markets enable the society to reach the position of pare to optimality by developing
complete markets. It means that in financial markets, no other set of securities can make some
investors better off without making at least one other investor worse off. In other words, the
securities market is said to be complete if the patterns of returns can be created whose returns
a portfolio of existing securities cannot duplicate. In brief, the futures markets enhance
economic activities in the society in general, resulting in growth of economic development of
the country.
217
Basic Mechanism of a Futures Contract
A futures contract calls for the delivery of the specified quantity at the specified rate
on specified date. Or, before the maturity date it can be squarred off. In India, the financial
derivatives (futures) are compulsorily squarred off on the maturity date. However, in case of
commodities futures, delivery is made, if required, by the transfer of warehouse receipt. An
investor can buy (a long position) or sell (a short position) a futures contract.
The profit or payoff position of a futures contract depends on the differences between
the specified price (of the futures contract) and the actual market price prevailing on the
maturity date. For example, if an investor has purchased a futures contract in HLL at the rate
of ` 300 and one contract in for 500 shares. The value of the contract is ` 1,50,000 (` 300 x
500). Now, on the maturity date the rate is ` 310. The value of the contract is ` 1,55,000 and
his profit is ` 5,000. Similarly, if the rate is ` 296, then his loss is ` 2,000. Further, that if the
investor has sold initially, then his loss and profit position would be ` 5,000 and ` 2,000
respectively. This can be summarized as follows
For Long investor: Profit = Spot price at Maturity – Futures Price
Loss = Futures Price – Spot Price at Maturity
For Short investor: Profit = Futures price – Spot Price at Maturity
Loss = Spot Price at Maturity – Futures Price
A futures contact is zero sum game. Profit to one party is the loss of the other party.
Simple reason being that every long position is represented by a short position in the market.
The pay off positions of the long investor and short investor in futures are shown in Figure
218
In Figure (A), K is the strike price. The figure shows that as the spot price at maturity
increases, the profit of the long investor also increases. This break-even level is one when
spot price is equal to strike price. Similarly, Figure (B) shows that maximum profit to short
investor appears if the spot price is 0.
Thus profit decreases and Loss increases as the spot price increases. The breakeven
appears when the spot price is equal to the strike price. The diagrams for buyer and seller are
mirror image of each other.
Financial futures can be classified into Shares and Shares Indices Futures, Bond
Futures, Currency Futures and Interest Rate Futures. Discussion on Shares and Shares Indices
Futures is taken up first, followed up by currency futures and interest rate futures.
Contract Size of Futures Contracts
One contract of futures includes a specific number of units of underlying asset. For
example, at present, a futures contract in NIFTY is consisting of 100 units. So, if NIFTY
Futures is traded at 3,750, then the value of one contract is ` 3, 75,000. In case of stock
futures, the value of one futures contract need not be less thaw ` 2, 00,000. Number of shares
included in one futures contact is changing from time to time.
Futures Trading and Role of Clearing House
Futures are traded at computerized on-line stock exchanges and there is no one-to-one
contact between the buyers and sellers of futures. In case of default by either party, the
counter-guarantee is provided by the exchange. In this scenario, the role of the stock
exchange clearing house becomes imperative.
Unlike shares trading, where position of the defaulting party is actioned and the loss is
recovered through the broker of the party, the situation in futures trading is different. When a
deal by a seller or buyer of a particular contract is finalized, on the basis of quotes, etc., the
clearing house emerges but invisibly. Impliedly, the clearing house becomes the seller to a
long offer and buyer to a short offer. The clearing house is required to perform the contract to
both the parties i.e., to deliver the underlying asset to the long positions holder and to pay to
the short position holder, The net position of the clearing house always remains zero because
it does not trade on its own but only on behalf of other parties. So, the clearing house
becomes a party to two contracts at a time and is bound to perform its obligation under both
the contracts. The position of the clearing house is shown in Figure.
219

Figures show that the position of the clearing house is only neutral and provides a link
between the buyers and sellers. Clearing house makes it possible for buyers and sellers to
easily square off their positions and to make the net position zero. The zero net position of a
party means that neither the original position nor the squaring off is to be fulfilled.
As the clearing house is obligated to perform to both parties, it protects its interest by
imposing margins on the parties.
Initial Margin and Mark to Market
In the discussion on payoff positions in futures, it has been shown that the ultimate
profit or loss position of a party to a futures contract depends on the spot price of the
underlying asset on the maturity date. As the parties are betting on the future spot price of the
asset, their expectations may not come true and they may suffer loss. In view of this position,
SEBI has provided that the buyer as well as the seller, both have to deposit an initial margin
with the stock exchange broker on the date of the transaction. If the initial value of the futures
contract is ` 1,50,000 and the initial margin is 10%, then buyer and seller both have to deposit
` 15,000 each with their respective brokers. From the date of the transaction till the squarring
off date or maturity date, the futures price may rise or fall, as a result of which a partly may
incur loss. The futures contracts are to be mark to market on daily basis i.e., additional margin
money is to be deposited with the broker in view of the loss occurring till a particular date.
For example, in the above case, the value of contract falls to ` 1, 45,000 next day, and then
mark to market margin of ` 5,000 is to be deposited. So, instead of waiting until the maturity
date for the parties to book losses, SEBI requires all positions to recognize losses on daily
basis as these accrue. This daily setting is called mark to market, where the maturity date does
not govern the accrual of losses. Margin system is one basic difference between the forwards
and futures. The forwards are simply kept till the maturity date without any intervening cash
flows whereas the futures follow pay-as-you-go system.
220
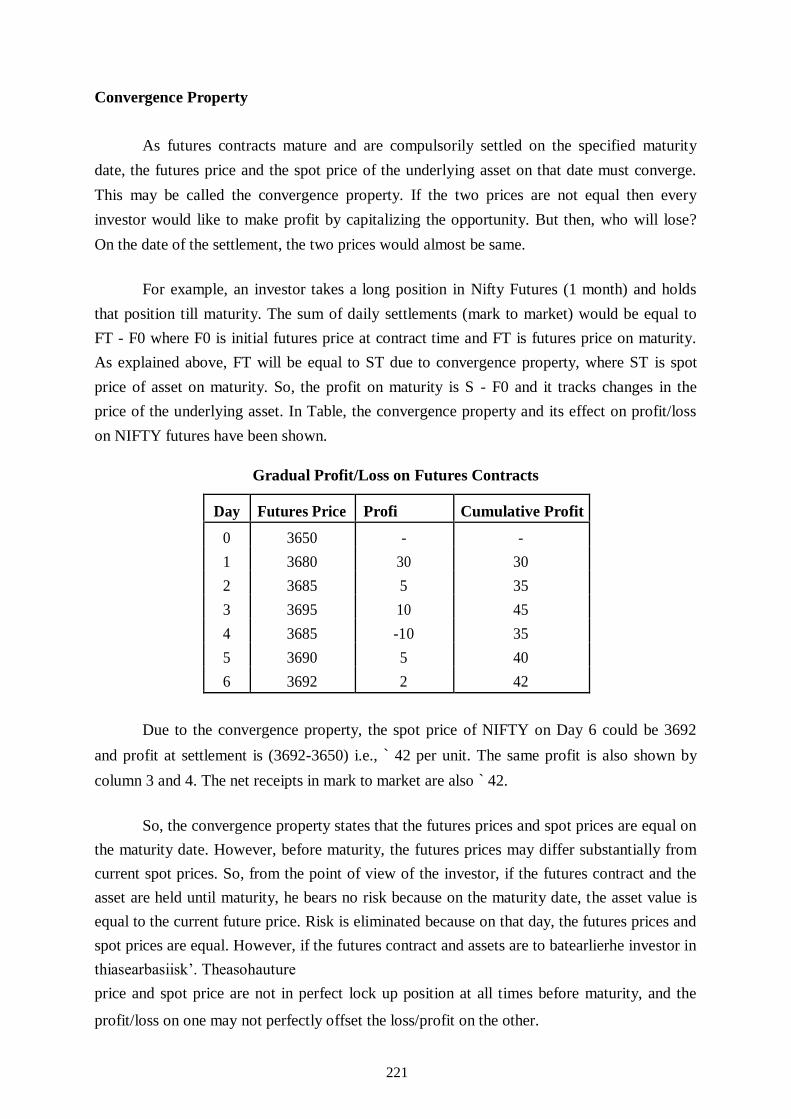
Convergence Property
As futures contracts mature and are compulsorily settled on the specified maturity
date, the futures price and the spot price of the underlying asset on that date must converge.
This may be called the convergence property. If the two prices are not equal then every
investor would like to make profit by capitalizing the opportunity. But then, who will lose?
On the date of the settlement, the two prices would almost be same.
For example, an investor takes a long position in Nifty Futures (1 month) and holds
that position till maturity. The sum of daily settlements (mark to market) would be equal to
FT - F0 where F0 is initial futures price at contract time and FT is futures price on maturity.
As explained above, FT will be equal to ST due to convergence property, where ST is spot
price of asset on maturity. So, the profit on maturity is S - F0 and it tracks changes in the
price of the underlying asset. In Table, the convergence property and its effect on profit/loss
on NIFTY futures have been shown.
Gradual Profit/Loss on Futures Contracts
Day Futures Price Profi Cumulative Profit
0 3650 - -
1 3680 30 30
2 3685 5 35
3 3695 10 45
4 3685 -10 35
5 3690 5 40
6 3692 2 42
Due to the convergence property, the spot price of NIFTY on Day 6 could be 3692
and profit at settlement is (3692-3650) i.e., ` 42 per unit. The same profit is also shown by
column 3 and 4. The net receipts in mark to market are also ` 42.
So, the convergence property states that the futures prices and spot prices are equal on
the maturity date. However, before maturity, the futures prices may differ substantially from
current spot prices. So, from the point of view of the investor, if the futures contract and the
asset are held until maturity, he bears no risk because on the maturity date, the asset value is
equal to the current future price. Risk is eliminated because on that day, the futures prices and
spot prices are equal. However, if the futures contract and assets are to batearlierhe investor in
thiasearbasiisk’. Theasohauture price and spot price are not in perfect lock up position at all times before maturity, and the
profit/loss on one may not perfectly offset the loss/profit on the other.
221
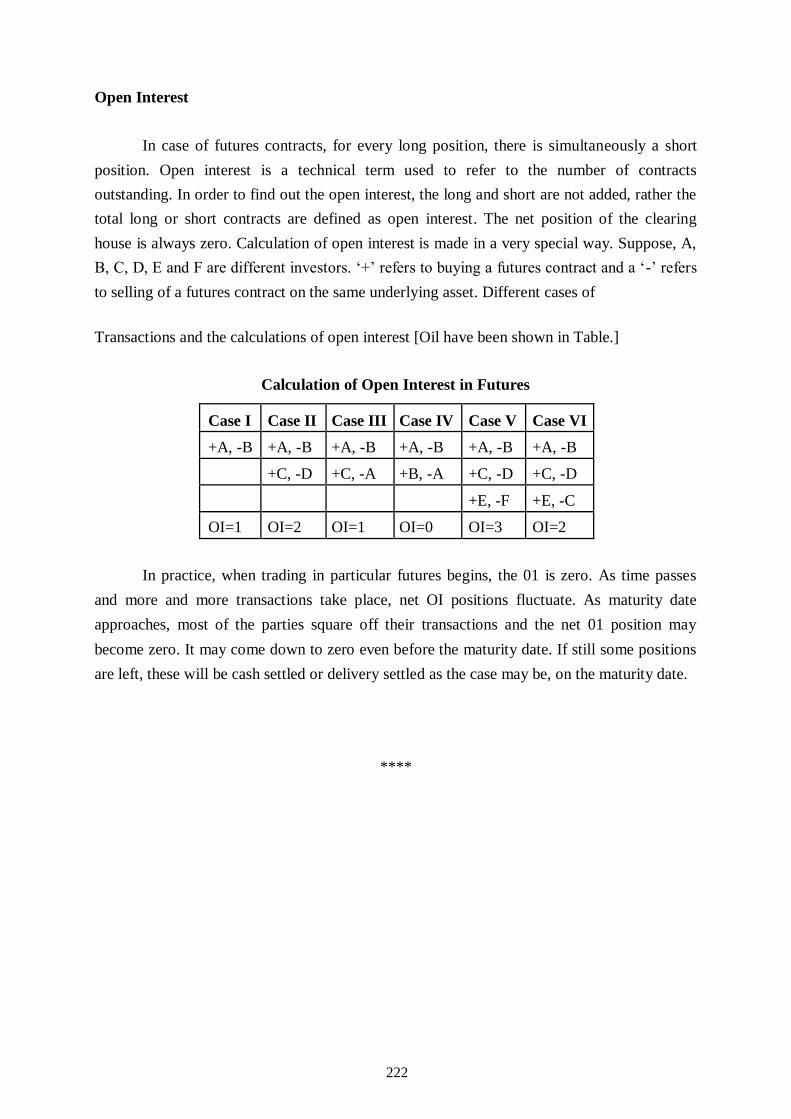
Open Interest
In case of futures contracts, for every long position, there is simultaneously a short
position. Open interest is a technical term used to refer to the number of contracts
outstanding. In order to find out the open interest, the long and short are not added, rather the
total long or short contracts are defined as open interest. The net position of the clearing
house is always zero. Calculation of open interest is made in a very special way. Suppose, A,
B, C, D, E and F are different investors. ‘+’ refers to buying a futures contract and a ‘-’ refers
to selling of a futures contract on the same underlying asset. Different cases of
Transactions and the calculations of open interest [Oil have been shown in Table.]
Calculation of Open Interest in Futures
Case I Case II Case III Case IV Case V Case VI
+A, -B +A, -B +A, -B +A, -B +A, -B +A, -B
+C, -D +C, -A +B, -A +C, -D +C, -D
+E, -F +E, -C
OI=1 OI=2 OI=1 OI=0 OI=3 OI=2
In practice, when trading in particular futures begins, the 01 is zero. As time passes
and more and more transactions take place, net OI positions fluctuate. As maturity date
approaches, most of the parties square off their transactions and the net 01 position may
become zero. It may come down to zero even before the maturity date. If still some positions
are left, these will be cash settled or delivery settled as the case may be, on the maturity date.
****
222

Lesson 3.2 - Pricing of Futures
If an investor wants to acquire shares in a particular company, he can acquire these
shares today itself at the current price or he can take a long position in futures. In either case,
he will be having the asset on some date in future. No doubt, the market determined cost of
acquiring the asset in either of these strategies must be equal. So, there is some relationship
between the current price of the asset, cost of holding it in future and the futures prices today.
This relationship can be explained by taking cash flow positions at time O and time ‘t’ in
bottrategy, S in thpot ratehutures prnhisree ratf interest, the position can be shown as follows:
Table shows thahaslotioimtame in bottrategies. However,
the initial cash flow positions are -S0 and -F0(1 + r)t. In order to eliminate the arbitrate
opportunities; these two values should also be same, S.
S0 = F0/(1 + r)t
F0 =S0 x (1+r)t
This gives the relationship between the current spot price and the futures price. This is
known as Spot-Futures Parity or Cost of Carry Relationship. The expected dividend (income)
from the asset during the futures period can also be incorporated in the analysis. So, pricing of
futures contract depends on the following variables:
(i) Price of the underlying asset in the cash market,
(ii) Rate of return expected from investment in the asset, and
(iii) Risk-free rate of interest.
223

The mechanism of pricing of futures can be explained as follows: Suppose,
(i) In cash market, the underlying asset X is selling at ` 100.
(ii) The expected return from the asset is 3% per quarter.
(iii) The risk free rate of borrowing or lending is 8% p.a. or 2% per quarter.
(iv) The futures contract period is also a quarter.
What should be the price of futures?
say, S = Current spot price of the asset
F Futures price
r = % Financing cost per futures period
y = % Yield on investment per futures period
Now, F =S+S(r-y)
Supposehe investoorrows fundurchasnsset ‘Xesulting in no
tiaasutlaor hitrategyhe enonth’eriod, ` 3 will be received from holding the asset ‘X and would
be required to pay interest (financing cost) of ` 2.
In the example given above,
F = 100 + 100 (.02 -.03)
= ` 99
So, the futures price should be ` 99. What happens if the futures price is ` 92 or ` 107?
The position can be explained as follows:
In case, the futures contracts are available at ` 92 (i.e., less than the theoretical price of
` 99), the investor should buy one future contract for ` 92 and should sell one unit of asset X
for ` 100 and invest the money @ 8% p.a. for 3 months. After 3 months, he will receive the
proceeds of ` 102 (` 100 + ` 2). He will spend ` 92 to purchase an asset (out of futures
contract). Besides, he will not receive the yield of ` 3 from the asset. So, his cost is ` 95 (92 +
3). His gain would be ` 7 (` 102 - 95).
Similarly, if the futures contract price is ` 107, he should sell the futures contract at
` 107 and should borrow ` 100 now to buy one unit of asset ‘X in the spot market. After 3
months, his proceeds would be ` 110 (107 + 3) and payment would be ` 102 (100 + 2). He
would be able to make a profit of ` 8.
224

So, if the futures price is other than the theoretical price of ` 99, it would give rise to
arbitrage opportunities. In case of price of ` 92 or ` 107, investors can look for a riskless
arbitrage profit of ` 7 or ` 8. The demand and supply forces would react to this arbitrage
opportunity and the futures price would settle around the equilibrium level of ` 99.
In the above analysis, the cost of carry (i.e., the interest amount) has been considered
in an over simplified way. In the pricing of futures, the interest effect is taken up on the basis
of continuous compounding. The procedure for pricing the futures can be standardized in 3
different situations as follows:
(a) When the asset provides no income:
F =S x ert ... (13.1)
(b) Where the asset provides known dividend:
F = (S - I) x ert ... (13.2)
(c) Where the asset provides a known dividend yield:
F =S x e(r - q)t ... (13.3) Where,
F = Futures Price
S = Spot price of the underlying asset.
e = 2.71828 (base of natural logarithm)
r = Rate of interest on borrowing/lending
t = Time duration of futures
resent value oected dividend @’r’
q = Dividend yield.
Differences Between Forwards and Futures
Apparently, forwards contracts and futures contracts seem to be similar, Both relate to
a contract to be fulfilled on a future date at the Pre specified rate for a specific quantity.
However, there are a number of differences between the forwards and the futures. The
forwards contracts are private bilateral contracts. These are traded off-exchanges and are
exposed to default risk by either party. Each forward contract is unique in terms of size, time
and types of assets, etc. The price fixation may not be transparent and is not publicly
disclosed. A forward contract is to be settled by delivery of the asset on the specified date.
225

On the other hand, futures contract is a contract to buy or sell a specified quantity of a
commodity or a specified security at a future date at a price agreed to between the parties.
Since these contracts are traded only at organized exchanges, these have built-in safeguard
against default risk, in the form of stock brokers or a clearing house guarantee.
The idea behind futures contracts is to transfer future changes in the prices of
commodities from one party to another. These are trade able and standardized contracts in
terms of size, time and other features. These contracts are transparent, liquid and trade able at
specified exchanges. Futures also differ from forwards in that former are subject to daily
margins and fixed settlement period.
Both forwards and futures contracts are useful in cases where the future price of the
commodity is volatile. For example, in case of agricultural products, say sugarcane,
theasant’evenue iubjechrrevaihimarvestinglarly,
the sugar-mill is not sure whether it will be able or not to procure required quantity of
sugarcane at the reasonable price.
Both parties can reduce risk by entering into a forward or futures contract requiring
one party to deliver and other party to buy the settled quantity at the agreed price regardless of
the actual price prevailing at the time of delivery. Both result in a deferred delivery sale.
However, it can be offset by a counter contract.
Futures market is a formalized and Futures market is a formalized and standardized
forward market. Players and sellers do no meet by chance but trade in the centralized market.
No doubt, the standardization process eliminates the flexibility available in the informal
contacts (i.e., forwards).
Futures have four specific characteristics as against the forwards:
1. Liquidity, as futures are transferable.
2. Standard volume.
3. Counter-party guarantee provided by the Exchange.
4. Intermediate cash flows.
Futures contracts have evolved out of forwards and possess many of the
characteristics of forwards. In essence, futures are like liquid forward contracts. As against
forwards, futures as a technique of risk management, provide several services to the investors
and speculators as follows
226

(i) Futures provide a hedging facility to counter the expected movements in prices.
(ii) Futures help indicating the future price movement in the mart.
(iii) Futures provide an arbitrage opportunity to the speculators.
The Operation of Margin
In addition to the clearing house, there are some other safeguards for futures contracts,
important among these are requirements for margin and daily settlement. In this section, we
will discuss the margin requirement applicable in case of investor and as a trader of the
clearing house. As we know that two parties are directly trading an asset in the futures market
for a certain prices there are obvious risks for backing out of any of the parties to the contract.
It is also possible that one of them may not have the financial resources to honour the
contract. That is why one of the important roles of the exchange is to organize the futures
trading in such a way that the default risk will be minimum. This is why margins come into
picture.
The Concept of Margin
Before entering into a futures contract, the prospective trader (investor) must deposit
some funds with his broker which serves as a good faith deposit. In other words, an investor
who enters into a futures contract is required to deposit funds with the broker called a margin.
The basic objective of margin is to provide a financial safeguard for ensuring that the
investors will perform their contract obligations. The exchanges set minimum margins
buhrokeraeqarger margins if there conneboun investor’inancial
situation because they are ultimately responsible for their clients’ losses. The amount of
margins may vary from contract to contract and even broker to broker. The margin may bted
in differenorms likash, bank’ter of credinreasurecurities.
Normally the investor who posts this margin retains the title of the securities deposited as
margin. The margin account may or may not earn interest. Some brokers may simply pay
them monemarkterest rates ohargunt. Howeveroshrokers
usually do not pay interest on margin in money. This loss of interest is the cost of margin
requirement.
Types of Margin
There are three types of margin such as initial margin, maintenance margin and
variation margin. The initial margin is the original amount that must be deposited into account
to establish futures position. It varies from stock to stock. To determine the initial margin, the
exchange usually considers the degree of volatility of price movements in
227

the past of the underlying the asset. After that, the exchange sets the initial margin so that the
clearing house covers losses on the position even in most adverse situation. The initial margin
approximately equals the maximum daily price fluctuation permitted by the exchange for that
underlying asset.
The exchange has the right to increase or decrease the quantum of initial marginal
depending upon the likely anticipated changes in the futures price. For most of the futures
conthtiaargin maerhe unlyinsset’s valuefter
propmpiolhbligationssociateith a investor’utures ption, the
initial margin is returned to trader.
The Maintenance Margin
The maintenance margin is the minimum amount which must be remained (kept) in a
margin account. In other words, so much minimum, balance in the margin account must be
maintained by the investor. This is normally about 75 percent of the initial margin. if the
futures prices move against the investor resulting in falling the margin account below the
maintenance margin, the broker will make a call, i.e., asking the client to replenish the margin
account by paying the variation. Hence, the demand for additional fund is known as a margin
call.
For example, assume that the initial margin on a futures contract is ` 5,000 and the
maintenance margin ` 3,750 (75% of the initial margin). The next day assume that the party
has sustained a loss of ` 1,000, reducing the balance in margin to ` 4,000. Further assume that
on the next day the price decreased and sustained loss is ` 500. Thus, the balance remained in
the margin account to ` 3,500, below the maintenance margin. In this situation, the broker will
make a call (margin call) to replenish the margin account to ` 5,000, the level of initial
margin.
The Variation Margin
It refers to that additional amount which has to be deposited by the trader with the
broker to bring the balance of the margin account to the initial margin level. For instance, in
the above mentioned example, the variation margin would be ` 1500 (` 5000— ` 3500), i.e.,
the difference of initial margin and the balance in the margin account, the same has been
shown in Fig. If the investor does not pay the initial margin immediate, the broker may
proceed to unilaterally close out the account by entering into an offsetting futures position.
228
Margins and Marking-to-Market (Daily Settlement)
It has been observed that the initial margin, sometimes, is even less than 5 percent
which seems to be very small considering the total value of the futures contract. This
smallness is reasonable because there is another safeguard built in the system, known as daily
settlement marking-to-market. In the futures market, all the transactions are settled on daily
basis. Thus, the system of daily settlement in the futures market is called marking-to-market.
The traders realize their gains or losses on the daily basis to understand this process of daily
settlement, let us see Table.
If we examine Table, it is observed that on June 11, the balance in the margin account
falls $340 below the maintenance margin level. This requires a margin call to the participant
for depositing an additional margin of$ 1340.
The Table assumes that the trader does in fact provide this margin by close of the
trading on June 12. It is also noted that on June 12, 19, 20 and 21, trader has excess margin.
The Table also assumes that excess margin is not withdrawn. On June 24, the trader decides
to close out the position by shorting the two contracts, being futures price on that day
$392.30, and the trader has suffered accumulative loss of $1 S40 in this contract.
The basic purpose of the mark-to-marking is that the futures contracts should be
dailarkeettlenohe ents lifeverayh’s gas) is
added or (subtracted), the margin on the case may be. This brings the value of the contract
back to zero. In other words, a futures contract is closed out and rewritten at a new price
every day.
229

Operation of Margins for a Long Position in Two Gold Futures Contracts
Day Futures Daily gain Cumulative Margin account Margin
price ($) (Loss) ($) gain (Loss) ($) balance ($) call ($)
June 3 400.00
June 3 397.00 (600) (600) 4,000
June 4 396.00 (180) (780) 3,400
June 7 398.20 420 (360) 3,640
June 8 397.10 (220) (580) 3,420
June 9 396.70 (80) (660) 3,340
June 10 395.40 (260) (920) 3,080
June 11 393.30 (420) (1,340) 2,660 1,340
June 14 393.60 60 (1,280) 4,060
June 15 391.80 (360) (1,640) 3,700
June 16 392.70 180 (1,460) 3,880
June 17 387.00 (1,140) (2,600) 2,740 1,260
June 18 387.00 0 (2,600) 4,000
June 21 388.10 220 (2,380) 4,220
June 22 388.70 120 (2,260) 4,340
June 23 391.00 460 (1,800) 4,800
June 24 392.30 260 (1,540) 5,060
The initial margin is $2000 per contract or $4000 in total and the maintenance margin
is $1500 per contract or $3,000 in total. The contract is entered into on June 3 at $400 and
closed out on June 24 at $392.30. The numbers in column 2, except the first and the last, are
the futures price at the close of trading.
Closing a Futures Position (Settlement)
There are four ways to close the futures position, namely, physical delivery, cash
settlement, offsetting and exchange of future for physicals (EFP).
Physical Delivery
One way of liquidating of futures position is by making or taking physical delivery of
the goods/asset. The exchange has provided alternatives as to when, where and what will be
delivered. It is the choice of the party with a short position. When the party is ready to deliver,
it will send a notice of intention to deliver to the exchange. The price is settled
230

which normally most recent with a possible adjustment for the quality of the asset and chosen
delivery location. After that, the exchange selects a party with an outstanding long position to
accept delivery. Let us see how physical delivery works.
Let us take an example of particular futures contract: Silver traded on COMEX where
a short-trader is required to make delivery of 5000 troy ounce (6 percent more or less) of
refined silver bar cost in heights of 1000 to 1100 ounces each and at 0.999 fineness. Which
should bear the serial number and identifying stamp of a refiner approved by the COMEX
exchange? At the beginning of the delivery month on the exchange-designated notice days,
say, December 99 contract, exchange rules requires that all traders having open positions in
December 1999 contract notify their member brokers to take or make delivery for this. In
turn, throkerilorhlearinoushustomer’s intention. After this notification, the clearing house matches longs and shorts usually by matching the oldest short
to the oldest long position, until all short quantities are matched. Delivery notices are then to
all the traders through their brokers indicating to whom their delivery obligations runs and
when, where and in what quantities is to be made. Some exchanges impose heavy penalty in
case of default by any party. When delivery is satisfactory made then the clearing house
notify and accord the same. In case of financial futures, delivery is usually made by wire
transfer.
Cash Settlement/Delivery
This is relatively new procedure followed for setting futures obligations is through
cash delivery. This procedure is a substitute of physical delivery and hence, do not require
physical delivery. The exchange notifies about this where cash delivery as the settlement
procedure. There are certain financial futures like stock indices futures, certain treasury
securities, euro-dollar, time deposits, municipal bonds, etc. When a cash settlement contract
expires, the exchange sets its final settlement price equal to the spot price of the underlying
asset on that day. In other words, it is simply marked-to-market at the end of the last trading
day to handover the underlying assets. Since cash settlement contracts are settled at the spot
price, their futures prices are converged to the underlying spot prices. Therefore, the prices of
cash settlement contracts behave just like the prices of delivery contracts at their expiration
period.
Offsetting
The most common and popular method of liquidating the open futures position is to
effect an offsetting futures transaction or via a reversing trade which reverses the existing
open position. For example, the initial buyer (long) liquidates his position by selling
231
(going short) an identical futures contract (which means same delivery month and same
underlying asset). Similarly, the initial seller (short) goes for buying (long) an identical
futures contract. After executing these trades, these are reported to the clearing house then
both trade obligations are extinguished on the books of the brokers and the clearing house. No
doubt, the clearing house plays a significant role in facilitating settlement by offset. In
comparison to the physical delivery, this method is relatively simple which requires good
liquidity in the market, and entails only, the usual brokerage costs.
For example, there are two parties X and Y. X has an obligation to the clearing house
to accept 10,000 bushels of cotton in September and to pay ` 180 per bushels. For them at that
time. X does not wish to actually receive the oats and want to exit the futures market earlier.
Similarly, Y has a obligation to the clearing house to deliver 10,000 bushels of cotton
in September and to receive ` 180 per bushels. Both party can reverse or offset their position
in that way whereby buyer becomes seller and seller becomes the buyer. Before the due date
i.e., September, X will sell September contract for cotton at ` 190 per bushels Y will buy at ` 190 per bushels.
Exchange of Futures for Physicals (EFP)
This is another method of liquidating the futures contract in a form of physical
delivery, called exchange of futures for physicals. In this method, a party who holds a futures
contract may like to liquidate his position that is different from those the exchange offers. For
example, a party may like to deliver the assets before the specified futures period, or may
deliver the asset at different place, or deliver outside the normal trading hours, etc.
In simple terms, the contracts fulfilled by the parties on non-contract terms under this
technique. For example, a party with a long gold futures position may wish to take delivery in
Los Angels rather than in New York, as the contract specifies. Further, the EFP tpermito
exchange a futurption for a cash ption that meets both the part’
preferences, of course, for EFP, the party must find another party willing to make the trade.
The exchanges allow the parties to deliver under non-contract terms, and without
going through the trading pits. However, both the short and the long in an EFP transaction
must notify the exchange and the clearing house of the said EFP agreement so that the
clearing house can make proper book entries to extinguish the respective short and long
positions on its books.
232

The Exchange of Futures for Physicals (EFP) differs in certain respects from the
offsetting method. First, the trader actually exchanges the asset in physical form. Second,
such agreements are not performed/closed by a transaction on the floor of the exchange.
Third, the two trades negotiate privately the price and other terms of the contract which are
usually different from the specifications. Since these agreements are negotiated outside the
trading pit, so they are also called ex-pit transaction. Further, regulatory authorities and
exchange rules require that all the futures trading be liquidated in the pit, hence, the EFP is
the one recognized exception to this general rule. These contracts are also known as against
actual or versus cash transactions.
Example
Delivery using an Exchange of Futures for physicals, A is holding long January
Comdex Metal futures contract and B is holding short January Comex Metal futures. Both A
and B live in Chiocago and prefer to close out their positions with delivery in Chicago rather
than New York as specified in Comex metal contract. Under EFP A will transfer his long
futures position to B at a price $400 per ounce. Broker of both parties submit an EFP order
with information to Comex. At the same time B agrees to sell 100 ounces of metal in Chicago
at a price $400 per ounce. B delivers the 100 ounces of gold at 2.00 am, if A and B wish,
transaction will be recorded in Exchange next morning.
****
233

Lesson 3.3 - Theories of Futures Prices
There are several theories which have made efforts to explain the relationship between
spot and futures prices. A few important there are as follows:
The Cost-of-Carry Approach
Some top economists like Keynes and Hicks, have argued that futures prices
essentially reflect the carrying cost of the underlying assets. In other words, the inter-
relationship between spot and futures prices reflects the carrying costs, i.e., the amount to be
paid to store the asset from the present time to the futures maturity time (date). For example,
food grains on hand in June can be carried forward to, or stored until, December.
Carrying costs are of several types, important among these are:
1. Storage costs
2. Insurance costs
3. Transportation costs
4. Financing costs
Storage Costs refer to those expenses which are done on storing and maintaining the
asset in safe custody. It includes rent of the warehouse and others expenses associated with
like deterioration, pilferage, normal wastage, etc. In case of financial instruments, the costs
incurred on keeping the securities in a bank vault or with custodians.
Insurance Costs refer to amount incurred on safety of the assets against fire,
accidents and others. For example, stored wheat be protected against fire, water damage,
weather, natural disaster, etc. So insurance is necessary for protection against such hazards.
Thus, premium and other costs incurred on insurance is called insurance costs.
In some cases, carrying costs also include the transportation costs. When the futures
contract matures the delivery of the assets is given at a particular place which may be far
away from the warehouse of stored goods. Obviously, transportation costs will be different
from location to location and also to the nature of the commodities.
234

Another important carrying cost is cost of financing the underlying asset. For
example, if gold costs ` 5000 per 10 grams and the financing rate are one percent per month
then the financing charge for carrying the gold forward is ` 50 per month (1% of 5000).
Apart from the carrying cost on an underlying asset, there can be possibility of earield
otorinhssucield inowconvce yieldroolding
stocks. For example, in case of wheat, there could arise extra yield due to low production of
wheat due to bad weather in futures.
Thus, up to a certain level, stock holding has a yield in the event of stock out and
unanticipated demand. This may be termed as a negative carrying cost. Hence, the net
marginal carrying cost for any given asset may be expressed as:
Ct = Cgt - Yt
Where, CT is net carrying cost of that quantity, Cgt, is gross carrying cost of that
quantity, Yt, is convenience yield of that quantity and t is time period of storage.
The Cost-of-Carry Model in Perfect Market
The following formula describes a general cost-of-carry price relationship between the
cash (spot) price and futures price of any asset:
Futures price = Cash (spot) price + Carrying cost
In addition, the formula assumes the conditions of perfect competition which are as under:
1. There are no information or transaction costs associated with the buying and selling
the asset.
2. There is unlimited capacity to borrow and lend.
3. Borrowing and lending rates are the same.
4. There is no credit risk. No margin is required on buying and selling the asset.
5. Goods can be stored indefinitely without loss to the quality of the goods.
6. There are no taxes.
Before discussing the various rules of carrying cost, let us see cash-and-carry
arbitrage. In this, the trader buys the goods at the cash price and carries it to the expiration of
the futures contract. Let us take an example as given in Table.
235

Cash-and-Carry Gold Arbitrage Transactions
Prices for the analysis (` )
Spot price of gold (per 10 grams) 5,000
Futures price of gold (for delivery 6 months) 5,300
Interest rate 8% per annum
Other carrying cost assumes NIL
Transaction Cash flows (` )
t = 0 Borrow ` 5,000 for six months @ 8% p.a. +5,000
Buy 10 grams of gold at the spot rate -5,000
Sell a futures contract for `or deliverfter six months 0
Total Cash flows 0
T = 1 Remove the gold from storage 0
Deliver the gold against the futures contract +5,300
Repay loan including interest for 6 months (5000 + 200) -5,200
Total cash flows 100
(r = 0 & T = 1 refer to present and future period respectfully)
Some financial experts have suggested certain rules relating to cost-of-carry which
have briefly given as follows:
Rule I. The futures price must be less than or equal to the spot price of the asset plus the
carrying charges necessary to carry the spot asset forward to delivery. Mathematically,
we can express it as follows:
F0.t ≤ S0 (1 + C)
Where F0t, is the futures price at t = 0 for delivery at t = 1, S0 is the spot price at t = 0
and C is the cost-of carry, expressed as fraction proportion of the spot price.
Rule 11. The futures price must be equal to or greater than the spot price plus the cost-of-
carrying the goods to the futures delivery date.
Mathematically, F0.t ≥ S0 (1 + C)
If the prices do not obey this rule, there will be arbitrage opportunity. Both the above
rules are opposite to each other which are also known as cash and carry arbitrage, and reverse
cash and carry arbitrage. Together above two rules, it implies to Rule III.
236

Rule lII. The futures price must equal the spot price plus the cost-of-carrying the spot
commodity forward to the delivery date of the futures contract.
Mathematically, F0.t = S0 (1 + C)
This is applicable under the conditions of the perfect market.
Rule IV The distant futures price must be less than or equal to the nearby futures price plus
the cost- of-carrying the asset from the nearby delivery date to the distant delivery
date.
Mathematically, F0.d ≤ F0.n (1 + C) d > n
Where F0.d is the futures price at t = 0 for the distant delivery contract maturing at t
= d, F0.n is the futures price at t= 0 for the nearby delivery contract maturing at t=n and C is
the percentage cost-of-carrying the asset from r = n to t = d.
It is observed that if this relationship did not hold then a trader may purchase the
nearby futures contract and sell the distant contract. He will then accept the delivery on
nearby contract and carry the asset until the delivery of the distant contract, and thereby
earning a profit.
Rule V. The nearby futures price plus the cost-of-carrying the asset from the nearby delivery
date to the distant delivery date cannot exceed the distant futures price.
Mathematically, F0.d ≥ F0.n (1 + C) d > n
Following the same pattern of argument for spot and futures prices, we may use for
above also.
Rule VI. The distant futures price must equal the nearby futures price plus the cost-of-
carrying the asset from the nearby to the distant delivery date.
Mathematically, F0.d = F0.n (1 + C) d > n
It should be noted that if above relationships are not fulfilled or violated, the traders
would immediately recognize all the arbitrage opportunities until prices are adjusted.
However, the basic rules (Rule III and VI) developed above provide a very useful framework
for analyzing the relationship between cash and futures prices and spreads between futures
prices.
237

The Cost-of-Carry Model In Imperfect Market
We have seen the relationship between the spot price and futures price in the
conditions of perfect market which is rare in actual practice. There are various imperfections
in real markets which disturb the relationship of Rule III and Rule VI. Among the various
imperfections, five are important which have been discussed here in after:
Direct Transaction Cost
In actual practice, when a trader makes the spot or futures transactions he has to pay a
fee; known as brokerage fee or commission. In other words, transaction costs refer to all such
costs which have to be borne by the trader to buy or sell a particular asset for spot or futures.
These costs are transaction fees, exchanges charges and fee, fee for arranging funds, etc. It is
also called as the round- trip fee.
Unequal or Differential Borrowing and Lending Rates
It refers to that market situation where the rates of interest on borrowing and lending
are different and they are not equal. Normally, in real market, borrowing rates are higher than
the lending rate. These differentials of borrowing and lending rates serve to widen the no-
arbitrage boundaries.
Restriction on Short- Selling
This is another market imperfection. Earlier, we have assumed that traders can sell
assets short and use the proceeds from the short sale without any restrictions. Due to inherent
risks in short sales, there are restrictions on short selling virtually in all markets.
Bid-Ask Spread
It is another market imperfection because we see in actual practice that the trader tries
to sell the asset at higher price than to purchase the same. The difference between bid price
and ask price is called bid-ask spread.
Storage Problem
It is another market imperfection because except gold, most of the commodities
cannot be stored very well at all. The storability of a commodity is very important in futures
market trading. If a commodity cannot be stored then full arbitrage opportunity will not be
available in the market.
238

Let us see the futures prices after adjusting the above market imperfections.
After transaction cost, equation will be
(a) F0.t ≤ S0 (1 + T) (1 + C)
(Where T is transaction cost in cash and carry arbitrage)
(b) F0.t ≥ S0 (1 + T) (1 + C)
(Reverse cash and carry arbitrage) Combining the above equations, we get
S0.n (1 - T) (1 + C) ≤ F0.t ≤ S0 (1 + T) (1 + C)
There will be no-arbitrage bounds. Which means within which the futures price must
remain to prevent arbitrage. If the futures price goes beyond these boundaries, arbitrage is
possible. Hence, the futures price can wonder within the bounds without offering arbitrage
opportunities. For example, in our earlier example; if transaction cost is 3 percent and
carrying cost is 8 percent then
(a) F0.t = 5000 (1 -0.03) (1 + 0.08) = ` 5562 and
(b) F0.t = 5000(1 -0.03) (1 + 0.08) = ` 5238.
This is shown in Table and in Fig.
Illustration on No-arbitrage Bounds
Price for analysis:
Spot Price of Gold (10 grams) = 5000
Interest rate @ 8% (p.a.) = 8%
Transaction cost (1) = 3%
No arbitrage futures price in perfect markets (one year basis):
F0.t = S0(1 +C)=5000+400=5400
Upper no-arbitrage bound with transaction cost (one year):
F0.t ≤ So (I + T) (1 + C)
= 5000 (103) (1.08) = ` 5562
Lower no-arbitrage bound with transaction cost (one year):
F0.t ≥ So (1 + t)(l +C)
= 5000 (1 -0.03) (10.08) = ` 5238
239
If the futures price stays between the bounds, no arbitrage is possible. If the futures
price crosses the boundaries the traders will immediate act in the market to exploit arbitrage
opportunities. For example, if the futures price is too high then the arbitrageurs will buy the
spot and sell the futures. This action will raise the price of spot goods relative to futures price,
as a result, the futures price will drive back within the no-arbitrage boundaries.
Sometimes, we see in the market that transaction costs are not equal for all the
investors. For example, for a retail investor, the transaction cost may be higher, even double
than an arbitrageur, floor trader or a member of an exchange. Let us presume that for a retail
investor, the transaction cost is double, i.e., 2T instead of T, then for this trader, the no-
arbitrage bounds would be twice and much wider.
Differences in transaction costs will give rise to the concept of quasi-arbitrage. Those
traders which have lower transaction costs than others, are called quasi-arbitrageurs. They
have relatively lower bounds than the others. Thus, in actual practice, futures prices move
within the no-arbitrage bounds of the lowest transaction cost trader. in other words, the
traders with higher transaction costs will not be able to exploit any arbitrage opportunities.
Adjusting the Equal Borrowing and Lending Rates
As we have seen in the perfect capital market conditions that all the traders can
borrow and lend at the risk free rate, but in real market, this is not possible, and even the
borrowing rate and lending rates of interest are also different.
240

Thus, if these borrowing and lending rates are not same and are different, then they
require adjustment to reflect the fact. Normally, we assume that for a trader, the borrowing
rate will be higher than lending rate, hence, we assume, lending rate to be CL and borrowing
rate is CB.
Now, the equation will be with different rates of interest:
S0.n (1 - T) (1 + CL) ≤ F0.t ≤ S0 (1 + T) (1 + CB)
These differential rates will serve to widen the no-arbitrage boundaries, for example,
assuming CB =10% and CL = 6% in our earlier example then the boundaries will be
5000(1 – 0.03) (1 + 0.06) ≤ F0.t ≤ S0 ≤ 5000 (1 + 0.03) (1 + 0.10)
` 5147 ≤ F0.t ` 5665
It is evident that due to differential borrowing and lending rates of interest, no-
arbitrage boundaries have been widened.
Adjusting the Restrictions on Short Selling
In perfect market, we have assumed that traders can sell assets short and use all the
proceeds from the short sales without any restriction. However, in actual practice, we see that
when a trader goes for short selling then his broker has to arrange the assets from the market
from other to sell it on behalf of the short seller, in that case, the risk of broker increases. If
later on there are changes in asset prices. In that case, the broker usually does not give full
amount of short selling to the trader, rather keeps some amount with himself foisoiniews
inowftional’ amounhhoraroceeds. However, different traders face different restrictions on using proceeds from a short seller.
Further, the differential use of those funds leads to quasi-arbitrage. To reflect this fact that
short seller does not have full use of the proceeds, but only some fraction f, we can readjust
the equation as follows:
F0.t ≥ fS0 (1 + C)
where f is the fraction of usable funds derived from the short sales ranging between I
to 0. With restrict short sales, our no-arbitrage bounds will be
fS0.t (l + C) ≤ F0.t ≤ So (1 + C)
241

With other market imperfections, our no-arbitrage bounds will be
fS0 (l + T) (1 + CL) ≤ F0.t ≤ So (1 + T) (1 + CB)
The above equation seems to be complicated and far from our simple perfect capital
market no- arbitrage relationship. However, these two are closely related. For example, if we
assume the following:
T=0 There are no transaction cost.
CB = CL = C Borrowing and lending rates are equal.
f= 1.0 Traders have full use of short sales proceeds.
Then, it reduces the earlier equation to
fS0 (l + T) (1 + CL) ≤ F0.t ≤ So (1 + T) (1 + CB)
= (1.0)S0 (1 – 0) (1 + C) ≤ F0.t ≤ So (1 + 0) (1 + C)
= S0 (1 + C) ≤ F0.t ≤ So (1 + 0) (1 + C)
= S0 (1 + C) ≤ F0.t ≤ So (1 + C)
= F0.t ≤ So (1 + 0) (1 + C)
This final expression is simple equation of the perfect capital markets version of our
cost-of-carry model.
The Concept of a Full-Carry-Market
The concept of a full-carry-market refers to the degree of restriction relating to the
underlying asset. For example, nature of restriction on short selling, supply of goods, non-
seasonal production and consumption, etc. will determine the degree of full-carry-market. So
it varies asset to asset and market to near-market. There are five main factors that affect
market prices and move them towards or away from full-carry-market. These are short selling
conditions, supply condition, seasonality of production, and seasonality of consumption and
ease of storage. In other words, to promote the full-carry-market concept, these
restrictions/conditions should be eased. For example, short selling to be fully eased; there
must be large supply of goods, in case of seasonal production, there must be ample stock of
goods and subject to large shifting, in case of non-seasonal consumption goods like petroleum
products, the supply should be on the pattern of demand, and lastly there must be high
storability capacity in case of seasonal goods to make regular supply without any interruption.
242

The Expectation Approach
This approach is advocated by distinguished luminaries like J. M. Keynes, J. R. Hicks
and N. Kalidor who argued the futures price as the market expectation of the price at the
futures date. Many traders/investors, especially those using futures market to hedge, would
liktudooday’utures prices arelatearket expectationbouutures
prices. For example, there is general expectation that the price of the gold next April 1 will `
5200 per 10 grams. The futures price today for July 1 must be somewhat reflects thiectation. Ioday’utures prs ` 5180 of gold, going long futures will yield an expected profit of
Expected futures profit = Expected futures price - Initial futures price
` 20 = ` 5200 - ` 5180
Any major deviation of the futures prices from the expected price will be corrected by
speculative activity. Profit seeking speculators will trade as long as the futures price is
sufficiently faraway from the expected futures spot price. This approach may be expressed as
follows:
F0.t = E0 (St)
Where F0.t. is Futures price at time t = 0 and E0 (St) is the expectation at t = 0 of the
spot price to prevail at time t.
The above equation states that the futures price approximately equals the spot price
currently expected to prevail at the delivery date, and if, this relationship did not hold, there
would be attractive speculative opportunities. In simple terms, the futures price are influenced
to some extent on expectations prevailing at the current time. Under this hypothesis, if
markets are operating properly then
Current futures price = Expected futures spot price
This is also known as hypothesis of unbiased futures pricing because it advocates that
the futures price is an unbiased predictor of the futures spot price, and on an average, the
futures price will forecast the futures spot price correctly.
Waveen abovhavgeapproately’ wordaveen used
to equalize the current futures price with the expected futures spot price. Why does this
relationship hold only approximately? There are two arguments to the question. Firstly, it is
due to transaction costs, and secondly due to risk aversion of the traders. Transaction costs
243

can keep the futures price from exactly equaling the expected futures spot price. This has
already been discussed in detail in the previous section of this chapter.
Futures Prices and Risk Aversion
Ihiection, will discushRisvern’ in moraiitts two
theories, namely the theory of Normal Backwardation and Theory of Capital Asset Pricing
Model (CAPM). Traders in futures markets can be classified roughly into two categories, i.e.,
hedgers and speculators. Hedgers have a preexisting risk associated with the asset and enter
the market to cover that risk. Speculators, on the other hand, trade in the market in the hope to
earn profit which is a risky venture. In general, all the investors are risk averse; however, they
incur risk willingly only if the expected profit from bearing the risk will compensate them
from risk exposure.
The Theory of Normal Backwardation
Backwardation, in general, refers to a market in which the futures price is less than the
cash (spot price). In such case, the basis is positive, i.e., basis is cash price - futures price.
This situation can occur only if futures prices are determined by considerations other than, or
in addition, to cost-of-carry factors. Further, if the futures prices are higher than the cash prhis
conditiosualleferrecantongoarknhasitive.
Normal backwardation is used to refer to a market where futures prices are below expected
futures spot prices.
Another way of describing the can tango and backwardation market is that the former
(can tango) is one in which futures prices are reasonably described most of time by cost-of-
carry pricing relationship, whereas later (backwardation) is one in which futures prices do not
fit a full cost-of-carry pricing relationship. In other words, futures prices are consistently
lower than those predicted by the cost-of-carry pricing formula.
It has been observed in many futures markets that the trading volume of short hedging
(sales) exceeds the volume of long hedging (purchases), resulting in net short position. In
such situation, Keynes has argued that, in order to induce long speculator to take up the net-
short-hedging volume, the hedgers had to pay a risk premium to the speculators. As a result,
the futures price would generally be less than the expected futures spot price, by the amount
of risk premium which can be stated in equation as:
F = E - r
244
Where, F is futures price for a futures date, E is expected price at that date and r is risk
premium.
In brief, the theory of normal backwardation state that futures prices should rise
overtime because hedgers tend to be net-short and pay speculators to assume risk by holding
long positions.
Figure illustrates the price patterns of futures which is expected under different
situations. If the traders correctly assess the futures spot price so that the expected futures spot
price turns out to be the actual spot price at the maturity. If the futures price equals the
expected futures spot price then it will lie on the dotted line. However such situations,
sometimes, do not occur, and alternative conceptions exist like normal backwardation and can
tango. If speculators are net long then futures prices must rise over the life of the contract if
speculators to be compensated for bearing risk. Futures prices then follow the path as labelled
normal backwardation in Fig. It is to be noted that this line will terminate at the expected
futures spot price.
If speculators are net short and are compensated for bearing the risk then the futures
prices must follow the path of can tango as shown in Fig. The fall in futures prices will give
the short speculators the compensation that induced them to enter the market. Final
possibility, as shown in Fig., is known as net hedging hypothesis. According to it, net position
of the hedgers might change over the life of the futures contract. In the beginning, the hedgers
are net short and the speculators are net long, then the futures price lies below
245

the expected futures spot price. Later on, over-time the hedgers gradually change their net
position, being net long, and hence, requiring the speculators to be net short. In such situation
for having their compensation for risk, by the speculators, the futures price must lie above the
expected futures spot-price, as it did in can tango shown in Fig.
Futures Prices and the Capital Asset Pricing Model (Systematic Risk Explanation)
The Capital Asset Pricing Model (CAPM) has been widely applied to all kinds of
financial instruments including futures contracts. In general, the higher the risk of an
investment, the higher the expected return demanded by an investor. The expected return
demanded by the holders of futures positions is reflected in the difference between futures
prices and expected future spot prices. This risk return model can be used for other assets like
stocks and bonds. The CAPM leads to the conclusion that there are two types of risk in the
economy; systematic and unsystematic.
Unsystematic risk is not so important since it can be almost completely eliminated by
holding a well-diversified portfolio. Systematic risk or market risk cannot be diversified
away. So as per this model, the investors should be compensated only for systematic risk. In
general, an investor requires a higher expected return than the risk-free interest rate for being
the systematic risk.
Systematic-Risk Explanation
It is observed that, sometimes, the futures prices differ from expected futures spot
prices even after adjusting for systematic risk because of unevenly distributed demand by
hedgers for futures positions. For example, if hedgers are dominating in the market through
short sales then long hedgers will receive an expected profit in addition to any systematic risk
premium. This theory is called hedging pressure explanation. Let us explain the systematic
risk explanation by an example.
Suppose the current price of SBI share is ` 340 and Treasury Bill rate is 10 percent per
year, assuming that SBI pays no dividend. On the basis of stock index, the arbitrageurs will
guarantee that the futures price of SB1 share after one year is:
=Ft,T=St(l +rtT)
= ` 340 (1+0.10) = ` 374
Where St is current spot price at time t, FtT current futures price at time T and rt,T is
rate of return at time
246
If the unbiased ness hypothesis holds, the expected futures spot price should be `
374. It means that SBI share will have a 10 percent return just like the T. Bill despite the fact
that the SBI is a riskier stock. So, higher risk must be compensated. If we assume that SBI
share should give expected return 15 percent then the expected futures spot price will be
Et (ST) = St (l +rt,T)
= ` 340 (1 +0.15) = ` 391
Where Et (ST) is expected futures spot price at time T and r*t,T is expected rate of
return on stock.
Thus, in this example, the futures price is less than the expected futures spot price in
equilibrium.
Futures price < Expected futures spot price or
Ft,T <Et(ST)
` 374 < ` 391
This result implies that, on average, a long futures position will provide a profit equal
to ` 17 (391 - 374). In other words, ` 17 expected profit on the futures position will
compensate the holder for the risk of synthetic stock (synthetic stock = T-bill + Long futures),
that is above the risk of T-Bill.
In brief, implies that the difference between the futures price and the expected futures
spot price is the same as the difference between the expected profit on riskless securities and
that on a pure asset with the systematic price risk as the futures contract. Thus, we would
expect that
= Et
(ST
) - Ft,T
Pt*
= rt
*, T - rt,T
where Pt is price of a pure asset with the same price risk as the underlying asset of the
futures contract, rt,T is expected rate return on that asset and is premium of pure asset with
same risk as futures over the riskless rate:
The price of such a pure asset at t, P, can easily be calculated at the present value of
the expected futures price of the underlying asset:
247

E(S ) P
t =
1+tr
T
* t,T
Where St is price of a pure asset.
If the underlying asset of a futures contract is a pure asset then Pt* will be equal to Pt,
and vice-versa. The discount rate r*t.T can be determined with the CAPM too. CAPM defines
he relationship between risk and return as:
r*i = rf+Bi(r
*m - rf)
Bi = ρim σi
σm
where r*i is expected (required) rate of return on a pure asset i, r*, is expected rate of
return on the market in portfolio, rf is riskless return (essentially equal to r tT), ρim is
correlation between asset return and market return, σi is standard deviation of rate of return on
the asset and σm is standard deviation of rate of return on market portfolio.
The expected return on each pure asset is earned from the difference between the
current spot price and expected futures spot price. The CAPM shows this difference as to be
Et (St) - Pt* = r*i Pt
* + βi (r*m - rf) Pt*
Our earlier principle of futures pricing shown above states that the difference between
the futures price and the expected futures spot price must also equal this differential:
Et (St) - Ft,T = βi (r*m - rf) Pt*
The earlier equation has an important view that futures prices can be unbiased
predictor of futures spot price only if the asset has zero systematic risk, i.e., Bi = 0. In such
situation, the investor can diversify away the risk of the futures position. In general, futures
prices will reflect an equilibrium bias. If Bi > 0, bearing positive systematic risk, in such case,
Fi.T < Et - (ST), and if Bi <0, a long futures position has negative systematic risk, such a
position will yield an expected loss, so Ft,T > Et - (ST). This situation purely reflects the
CAPM. In brief, according to CAPM, the expected return on a long futures position depends
on the beta of the futures contract if Bi >0, the futures price should rise overtime; if Bi = 0, the
futures price should not change, and if Bi <0, the futures price should fall over time and vice-
versa in the case of short futures.
248

An Integrated Approach
The various theories presented earlier, sometimes, present controversial view, e.g. one
theory states that futures price are based on carrying costs whereas other one argues purely on
expectations or forecast. A number of empirical studies have attempted to verify the
reliability of these theories and have resulted in greater clarity and better applicability. In this
section, an attempt is made to integrate the various stands of these theories here in brief:
1. Futures prices of those assets which have continuous production or continuous storage
capacity broadly follow the carrying cost approach.
2. Those goods or assets which are of discontinuous production or storage nature
(perishable nature) should follow expectation approach.
3. It was also observed that the expectations also influence the futures prices of
continuous production or storage products. It was seen that the carry cost approach
determines the maximum limit of spread but not the minimum limit. Further,
fluctuations within the maximum limit are often related to expectation approach.
4. It is also observed that expectations may predominate, sometimes, even in continuous
production or storage markets, for such periods indicated in the present by some
futures events like ongoing strike, railway disruption, futures labour unrest weather
conditions, expected election, etc. which are expected to change the market situation.
5. It is also noticed that the normal backwardation approach tends to exist in those
markets which are relatively thin, where speculators are induced to enter in the
market.
Comparison of Forward and Futures Contracts
S. No. Forwards Futures
1 Private contracts between the two Traded on organized exchanges
parties; bilateral contracts
2 Not standardized (customized) Standardized contract
3 Normally one specified delivery date Range of delivery dates
4 Settled at the end of maturity. No cash Dailettledrofiosraash
exchange prior to delivery date
249

5 More than 90 percent of all forward Not more than 5 percent of the futures
contracts are settled by actual delivery contracts are settled by delivery
of assets
6 Delivery or final cash settlement usually Contracts normally closed out prior to
takes place the delivery
7 Usually no margin money required Margins are required of all the
participants
8 Cost of forward contracts based on Entail brokerage fee for buy and sell
bid-ask spread orders
9 Thers crediisoacarty. The exchange’learinousecom
Hence, credit limits must be set for each the opposite side to each futures
customer contract, thereby reducing credit risk
substantially
Trading Secrets of the Professionals
Selected trading secrets of the professionals, based more on their failures than their
triumphs, have been identified as a world of wisdom. We know that the same mistakes made
50 and 100 years ago continue to the made every day. Technology may change, but human
nature never does. Ultimately, the markets are the best teachers, however. A trader may not
use all of these secrets, but if he can absorb just a portion, there is no doubt about success. Ie
disrrds, what’resenteelowae in thinanciaert.
Secret 1: The Trend is Your Friend
So, don’uce waakhig moneerhajorend
and then follow it. If the market will not go in the desired direction, then a trader must go its
way. When he is in a bear market, and the major trend is down, the plan should be to wait for
rallies and sell short; not try to pici: the bottom. In a major bear market, he can miss the
bottom several times on the way down and end up losing all his money. The same applies (in
reverse) in a major bull market. Always go with the tide, never buck it It is implement to note
that in a major bear market it is safer to sell when the market Ili down 50 points from the top,
than when it is down just 10. The reason is, at down 50, ‘iII support is gone, and those who
bought the breaks have lost all hope, are demoralized, and in a leveraged market are at the
point where they are must try to exit the same sm,iII door at the same time. The result at times
can be an avalanche. There are many examples of markets that have trended long and far,
made some people rich and wiped others out, we may hear about the poor
250

traders who lost their money drawn from provident fund, sale of real estate etc. We can
almost guarantee that such traders were bull headed and fought the trend until they run out of
money.
Soow dotrader do this, sticithennoight? Wellt isn’asy.
That’hoseopn’akoney in futures. Theeeavtronillpower.
Onthey can see the trend ohe market, they shounot change their d untihe “tape”
shows the change. In any major move there will, of course, be corrective moves against the
trend at times. Some news will developed which will cause a sharp correction, but it will be
followed by a more right back in the direction of the major trend. If they listen to this news
they will be tempted to liquidate prematurely. Avoid the temptation and listen to no one but
the market. One way to do this is to never set a fixed price in mind as a profit objective. The
majoriteophis, anhere’ooeasoot’ad habiaseope.
Do not set a fixed time to liquidate either. This is the way the amateurs do it. They
buy silver at, becaushroker told them it’oino ` 8000. Well, it gets to ` 7800 turns
anead soutganhey’rtilolding lookinor ` 7800, watching and waiting
as their unrealized profit melt. This is just plain bull-headedness; one can see the opposite as
well. The market closes at ` 7700; it looks strong and is fundamentally and technically sound.
The amateur has his order sitting to sell at ` 8000, because this is his price. The market gaps
up on the open the next day at ` 8100 and his broker is pleased to report he sold ` 100 better at
this price. However, this is a form of top picking, and who is smarter than the market? The
market probably gapped up above ` 8000 cases like this one, where the open was sharply
higher, but was the low of the day. The market never looked back until it hit ` 10,000. This is
all a version of bucking the trend, which is something not to be recommended. Conditions do
change, and one must learn to change his mind when they do. A wise man changes his mind,
a fool never. Just be sure if a trader change his position it must be based on sound reasoning.
There is no way one can possibly know in advance how much profit to expect. The market
determines that. The mission is to determine the trend, hope on for the ride, and stay on until
the indicators suggest the trend has changed, and not before.
Secret 2: Wheat is “CheapExpensiverrobabeason
noes hand in hanitdon’uchrend.” The intelenlways
makoneelhort lorarkrhub’s favouritnd in wh
a large long interest had developed. Alternatively, they cash in on expensive markets when
“everyoneaiuecaushubhoughharket high enougor a “healthy” reaction. Always
remembert’ohrhat’s important, it’harktion.
251
Secret 3: The Best Traders are the Hardest to Do
A trader needs, to have guts and be aggressive on entry. He needs to quickly cut losses
when the market is not acting right. The news will always sound the most bullish at the top,
and appear to be the most hopeless at the bottom. This is why the technical tone of the market
is so important. If the news is good, but the market has stopped going up, ask why, and then
heed the call. Bottoms can be the most confusing. The accumulation phase, where the smart
money is accumulating a position, can be marked by reactions, cross-currents, shakeouts, and
false reversals. After the bottom is in place, many traders will be looking for the next break to
be a buyer. After all, the market has been so weak so long, the odds favoat least one more
brearight? But it nevcomes. The smaroneon’t it. The objective after the bottom is in place is to move the market up to the next level, and the
best time to buy may actually feel quite uncomfortable.
Secret 4: Have a Plan Before Trade, and then Work It!
If a trader has a plan and follows it, he avoids the emotionalism which is the major
enemy of the trader. He must try to stay calm during the heart of the session, and remain
focused. To do this, he has to be totally organized prior to the opening bell. His daily mission,
should he decide to accept it, is to make money each day or, barring this, at least not lose
much. In normal markets, he should take normal profits. In those unusual markets which
occur rarely, he needs to go for abnormal profits. This is one of the keys to success. He must
always limit losses on trades which are not going according to plan.
This takes willpower and is as essential a quality as having plenty of money. In fact, it
is more important than having plenty of money. Money is not to hold on with, this is for the
sheand rader do’t want to be sheared. If brisare reqed, don’t take the trade,
wait for opportunities where he could enter very close to his risk point. In this way his risk per
trade is small in relation to the profit potential.
When it’ooinight, when in doubt, get out. Ias a compass in the
middle ohert, anhasiorth, hhou’et fooled intollowinhe mirage
to the west. There is nothing better than getting out quickly when one is wrong!
Secret 5: Be Aggressive When Taking Profit and/or Cutting Losses if there is a Good
Reason To Do So
A good trader will act without hesitation. When something is not right, he will
atarlavasnorryever touch, Just do it! And, do’t limit
252
his price—go at the market! Many times a market will give one optimal opportunity to act
anhat’oes wite waenefihrouguitioo acediately!
Secret 6: No Regrets
When an intelligent trader liquidates a trade based on sound reasoning, he never
regrets his decision. Go on, and if it was a mistake to get out, just learn from it. We all make
them. By taking mistakes seriously, one will lose perspective and become too cautious in
the future. Try not to think about the price to be entered. This is irrelevant. II the market
isn’t actinighn’rget oureaven aftsns.aet very
expensive.
Secret 7: Money Management is the Key
Think about this daily. One needs not to have a high win to loss ratio, but average win
must be higher than average loss if one wants to succeed. To do this, there must be (ill
leasome) “btsffse inevitable numerous (anopefully, small) losses wh are going to happen.
It is noted that trader by being able to just cut losses early, by even a small increment I
amount per trade, this can make a major difference to the bottom line. This takes
decisivenesso be decisive the tis not acting righWaiting a “few more ticks” is generally not a
recipe for success.
One more point there: it is bad practice to cancel or extend a stop loss order. Oiu
should nevhis. It’ancerofiakinrimuhoonrn
is stopped the better. When one gets, out of a bad position quickly, and with a minimum of
trauma, not only is his capital base maintained, but his judgment will improve Without a
welineisoint, there’ment, what’alleope.
Secret 8: Success Comes Easier When You Specialise
Every market seems to have its own nature, its own personality. Some markets tent to
make tops and bottoms with a fast run up and reverse (called an inverted V top or a V
bottoomavounops anottoms, some double tops anottoms, sonuops
and bottoms with a long consolidation. A trader can read a market better when III, becomes,
familiaitt’s idiosynamiliarity comes from contrationerce.
There are plenty of markets out there to be picked up one for each temperariui ii
253

Secret 9: Patience Pays!
Someople are in toig a hurret ricnesulherokeon’t
tret rich in a feonths. Don’ratclhluctuations. Market movements of
importance reqeeks anven monthet ready. There’enlltimo
buy or ell one or two days, or longer, after a big move gets under way. There are times when a
man or woman with nerve, knowledge, and a bit of luck can turn a small amount of money
into a fortune. However, this cannot be done continually. The best trades come along only
rarely. One needs to have patience to wait for the right trades. When they come, one must
have the patience to not be overanxious and get in too soon or overtrade. Remember, every
act, either opening or closing a trade, must have a sound basis behind it. Never trade for the
thrill of it.
Onasoinatnce onuharket witig profit, shou’t be
in toig a hurret back in. Thespporttae coguhey’rot
there every day. One needs the patience to wait. Big account balances lead to the temptation
taohan desirable trades. Inakes a’goorofiohis wayan
now afford to wait a few weeks or months for the signs of the next big mover.
Secret 10: Guts are as Important as Patience and More Important the Money!
Some traders are too bold and as a result overtrade. However, some have trouble
pulling the trigger. This is a weakness which must be corrected. One must train oneself to
trade so there is no hope, no fear. When one enters or exits a position, one should do it
decisively and without emotion. This is particularly important after a tough losing streak.
Sometimes the traders who suffer a string of losses, through they still have some money left,
and when the best opportunity of the year comes along (one they identified) they did not have
the guts to act. In cases like this, guts are more valuable than money. Hence, the traders
should have the guts to press hard when they are right. They also need the fortitude to cash in
when it is most pleasurable.
Secret 11: The “Tape” (The Quote Machine) Will Trick You
It’s impossibfor the man who stands ov“the ticker” day bao identify a big
move before it starts. The tape will fool him every day while accumulation is taking place
(and it takes time to accumulate or distribute a large position). The tape the quote machine)
iheroos. “Thapovysterious wahultito deve.”
Prices can look the weakest/ strongest at the strongest/ weakest times. Watching quotes all
day will cause trader to constantly change his mind and trade too often, and this increases
254

his percentage of being wrong. If he gets in wrong, the quote machine will tend to keep his in
wrong longer than he should be because every tick his way will renew his hopes. If he gets in
right, and he watches, the screen too closely, there will come a minor move which, in the long
run means nothing, which will get him out. As a result he will lose a good position.
Secret 12: Be Skeptical
In other words, it pays to be a contrarian. To be successful, a trader needs to be a
student of human nature and do the opposite of the general public. Sell on his first clues
oeakness, and do’t wait untieveryoneaiuiiver maood-
intentioned, but tips will invariably influence in the wrong direction. Remember, the market
do’earader rather a teats himselfollowinips anoharket iust another sign of human weakness.
Secret 13: Be Time Cognizant
Knooucimhovaaken tet thoint’t. This important,
because the longer a market moves in one direction, the greater the velocity of the buying or
selling will be as the final stage approaches. In many cases, the significant portion of a major
move takes place in the final 48 hours. One should watch the volume closely after a market
has made a long-term move. Volume tends to run higher than normal at the end of
ovehdistribution zone,herhe smarones unloadinhtion to a public who is frenzied by news.
Actuallyt’s importannohazoneharket iarket phases tend
to act in a similar manner. Many times, at the bottom, a market can rally on small volume. s
inates thereallsn’ucoale. Thottoaolloerioaky
conditions, pessimism, and apathy. Even the prior bulls will start to sound more cautions, and
hint it could get worse before it gets better. It seems nobody is interested in buying. This is
the time to watch moving averages closely. If they flash a buy signal, immediately cover
shorts and start to buy. Tops ware the opposite of bottoms. It seems nobody notices the
market is saturated, yet the market may top going up. After the first break from the top,
manimes therile a loolumfailureshh.” Once tharkil
lower high, if the trader is not out already, this could be his last best chance to liquidate.
As a general rule, the big money is made in the last stage of a bull market, when prices
are feverishly active. The big profits on the short side are made in the last stage of a bear
market, when everyone wants to sell and it seems no one wants to be a buyer. It is always
darkest before the dawn and brightest at noon just before the sun starts to recede.
255

Secreat’eactioews is Crucial
It’oheuoharket reacts thehat’s important. Ither
worlds, it’hews thahubertion. Bor divergenetween thews
and market action. It all has to do with expectation versus reality. Look for the divergence
between what’appeninnhaeople tupposeapphen thig turn
comes, the general public will always be looking the wrong way. There are certain ways to
analyze reactions to news (or even a lack of news).
Consider the following:
➢➢ Iad news innouncednharket starts telff in largolumet’ood
bet tharket’oing lower. ➢➢ Ihark’avuceactioooet’robableen
discounted.
➢➢ Moves of importances invariably tend to begin before there is any news to justify
the initial price move. Once the move is under way, the emerging fundamentals will
slowly come to light. A big rally (decline) on NO NEWS is always very bullish
(bearish). ➢➢ It is generally not good practice to buy after a lot of very bullish news, or to sell
after an extremely bearish report. Both good and bad news are many times already
discounted in price. Of course, one should always consider whether tho trend is down
or up when the news is made known. A well-established trend will generally continue
regardless of the news. ➢➢ When unexpected news occurs (news which the market has not had time to prepare
for) anharket opens in a wide ranggaps” lower oherelut lon
or cover shorts and wait. Watch the market for 30 minutes to an hour. If the market
opened sharply lower, with heavy selling, and was notable to trade much lower than
that, it’s intuppornaoughharket witighisoint. Watch
the market closely at this point. Note the tone of the rally. If it is small and the market
is able to again fall under the levels made when the bad news came out (or above the
good) it is safe to assume the market is going lower (higher).
Secret 15: Never Trade When Sick or Tired
Good health is essential to success. If a trader is not feeling good, he should closed out
positions and start over again when he does. Rest is equally essential to success. It is
256

probably a good idea to periodically close out all trades, get entirely out of the market and go
on vacation. The market will still be there at return. Some of the most traders trade their best
right after a vacation. If one sticks to something too long without rest, judgment will become
warped. Traders who are continually in the market day in and day out lose their perspective
and will ultimately lose.
Secret 16: Overtrading is One of Your Greatest Enemies
Overthgreatesvil.hausorses thanytlse.
Thvgoveally do’avlue aouconeeedee
successful, and he or she invariably buys (or shorts) more than prudence dictates. He may
be right in his analysis, or determination of the major trend, but due to too big a position
iorceathargin calls. When he’atinrther novnd
that’hen the smaroneovoneunuuhat criticaimhen
it is ripest to enter. The over-trader is exhausted and misses the profit opportunity he had once
seen clearly in those more optimistic days.
Be conservative, keep cool, and avoid the temptation to trade more contrit5 than
margin can reasonably support in normal markets. This is especially important at tops and
bottoms where the excitement, the rumours, and the news are at fever pitch- Human nature
haencowardverconfidence aops anottoms. Studharnd don’ good judgment be influenced by
hopes or fears.
Secreeeooead DurinBlowoffs”
Markets nearly always culminate at the top in the same way. When close to the end of
a major move, markets can become wild. Volume is huge, activity is feverish and erratic, and
the imagination blossoms. If a trader has the vision to ride the trend to this point his pay day
has come. However, in extreme markets men and women of reason lose all sense of
proportion. They start to believe the propaganda that the world will literally run out of this or
that. It never happens. The history of the world shows that there has never been a time when a
great demand for any commodity has not led to a supply in excess of demand.
Extreme markets are not the time to pyramid. They are the time to become alert for the
end. All good things come to an end, and a trader will be to jump before the big bump. There
will be a time when the herd will want to all exit out the same door at the same time. Make
sure one should have already left the room. When everyone wants to sell, and all buying
support disappears, profits can run into losses fast. In the stock market crash of 1987, profits
made in the first ten months of the year were wiped out in three days.
257

How does a trader turn his paper profits into cash in a runaway market? In blowoff
markets the corrections are generally short and sweet. The market is feverish and everyone is
bullish (the bears have already thrown in the towel). The public is buying madly. Weeks may
go by without a major correction. One will hear of fortunes being made, and if someone is
fortunate enough to be on the move, his paper profits will grow geometrically. The end may
be near, but nobody can see it. In fact, only about 10 per cent of those with big paper profits
will ever cash in near the top.
The Golden Rules in this type of market are: first, it does not pay to take a loss
amountinorhawo consecutivaysluctuations. Iharket goes againsor two days it’s likely to
moreecondly, bt for a morg whtharket openff
dramatically without any news. It may weekly rally, but the rally will fail. This is the first he
end. Tharket haeachehattiooinhert’un ouuyers.
Supply has finally overwhelmed demand. Third, watch for a failure test of the high. Many
times after the first break the market will have a secondary rally which will fail under the
high. If a trader failes to get out on the first break, this is his last good chance.
Secret 18: Never Let a Good Profit Turn Into a Loss
There is one of the trading sins which has ruined many hopes. If a trader has a derofit
in antion, anuroinrowhtoon’e hit. Should
the market continue to move in favour, keep moving the stop to lock in some profit. The
objective is to always protect principal in every way possible, and when he is fortunate
enougtarumulatinaper profits, locem in.
Secret 19: When In Doubt, Get Out!
It’ot actinighrlan, get out. Iharket haotarteove
favowithin easonabamount oime, get out’ment will eriorate
the longer he hangs on to a losing position and at extremes he will do the wrong thing. One of
the old timers once said something to the effect: “I am prudent enough not to stand in the
middle of the railroad tracks while I decide if the headlight I see is a freight train or an illun.”
Secret 20: Diversify
Distribute risk among a variety of trades and markets. Divide capital into tenths and
never risk more than a maximum of 10 per cent on any one trade. One good profit will often
totally erase four or five small losers. But if a trader takes big losses and small profits
258

he will have no chance of success. He should concentrating on active, liquid markets which
will allow him to enter and exit when he wants to with a minimum of slippage.
Secret 21: Pyramid Correctly
The big money can only be made by a pyramiding a good position in a trending
market. A trader has an excellent opportunity to use leverage and his unrealised profits to
create a larger position than otherwise possible. Pyramiding takes both courage and self-
control. The “weak hands” sem make the bmoney, primarily because they not have
the guts to pyramid and maximise the opportunities they are correct about (or they do not
have the smarts to do it right).
Be advised, there is a right way and a wrong way to pyramid. The traders should never
reverse pyramid (that is, add a greater number of contracts than their initial position as the
market moves their way). First risk should be greatest risk. It is generally better to decrease
the size of position through the journey, not increase it. In this way, a trader has the
opportunity to increase his profitability without dramatically increasing his risk. Other useful
pyramid rules are:
➢➢ Never try to pyramid after a long advance or decline. The time to begin a pyramid is
when the trend first turns up or down after a long move., Technical indicators can help
here. ➢➢ It is always safer to pyramid after a market moves out of accumulation and/or
distribution. In other words, a breakout from consolidation. Remember, the longer the
time it takes prior to the breakout, the greater the move one can expect.
Secreatch for ThosBreakouts Froonsolidation”
A trader needs to know what kind of market he is in. In a consolidating market
moneacalping smaloves bacnorth. Howevernon’akhe
big money with this kind of market action, and one should never attempt to pyramid. Big
profits can be made in the runs between accumulation and distribution. One can make more
money by waiting until a commodity plainly declares its trend, than by getting in before the
move starts. Too many traders are fixated on picking the top or bottom and as a result miss
the big picture. Get the idea of prices out of head and concentrate on market action. Forget
about picking tops and bottoms.
The longer the consolidation the better. When a market has remained for a long time
in a narrow range, a breakout from the range becomes more significant. The market is
259
telling that a major shift in the supply/demand fundamentals is taking place. Because it has
taken a long time to form, there is more fuel available for the coming move. This is the best
type of market to play to the hilt!
One last point here: remember there is no Holy Grail and at times there will be
falsreakouatcoht’ost likely false if tharket again trades inthe
consolidation range. The best ones will never retrace into the breakout range, but it is OK for
a market to trade back to the upper or lower edge of the range before resuming new trend
action. There is no question it was false once it breaks through to the other side. When this
happens, a reversal play is the best course of action.
Secret 23: Go With the Relative Strength
It is important to follow the trend of each market and to always buy the strong one and
sell the weak one. This is especially important for related markets. Silver and gold are both
precious metals and will generally move in the same direction. They will move at different
speeds, however. The trader needs to judge a market by its own signs, and always sell the
weak one and buy the strong.
Secret 24: Limit Moves are Important Indicators of Support and Resistance
When a market moves “bp,offered limit down” (fohosarket wh
still have limits), this is a level where a trader theoretically is unable to be a buyer or a seller.
There is more demand at the limit up price than available supply, and vice versa. The market
should continue in the direction of the limit move. On corrections, it should find support
above the limit price (or below if a limit down type move). Watch for this. If a market again
trades under the limit bid price, or above the limit offered, go with the flow. These are
reasonably risked trades, since it is an indication the previous support or resistance is now
absent. If anyone can now buy a market where it previously was unable to be brought (of sell
wherreviously cou’t) thiajoeaknestrength.
Secret 25: Never Average a Loss
This is critical. There are some traders who have had great success averaging down.
When a stock they liked got cheaper, they bought more. When the long-term trend turned
back up, they make out like bandits. A leveraged market is different, however, averaging a
loss may work four times out of five, but that fifth will wipe the trader out. It is a bad habit to
get into.
260
Look at it this way: if a trader makes a trade, and it starts to go against him, then hront
leasemporarilyhuelorvghs? When it’s
getting worse day by day, why should he potentially compound the problem? Stop the loss
earlefors eternalloargend don’akorserader could avoid three weaknesses—overtg, failtos,
anvginile
success.
Summary
This chapter has introduced the mechanism of pricing the futures contracts in different
situations. The chapter further explains the relationship between forward prices and futures
prices whether the forward prices are equal to futures prices, this is very important issue and
debatable. It is argued that if the risk- free interest is constant and the same for all maturities,
in such market situations, the forward price will be same as the futures price for the contract.
Next section deals with the pricing of stock index futures and futures prices of stock indices.
A stock index can be regarded as investment assets, which pays dividends. Next section deals
with the pricing of foreign currencies in situations if F<Se (r - rf)T, similarly, suppose F>Se (r
- ft)T, what will be the investor trading strategy. The chapter further describes the futures on
commodities in cases where (a) commodities as investment assets (like gold, silver) and (b)
consumption commodities etc., as described such commodities which are not held for
investment purposes. The arbitrage arguments used to determine futures prices must be
considered and examined carefully.
The chapter describes how futures prices and spot prices are converged. The basic
reason of convergence is that if the futures prices is above the spot price during the delivery
period, this will rise to a clear arbitrage opportunity for the trader in the market which may be
followed as (a) short a futures contract, (b) buy the underlying asset and (c) make delivery.
And due to arbitrage process futures price will tend to fall.
There are three theories (models) which explain the pricing of futures. The cost-of-
carry approach, given by Keynes and Hicks, argued that futures prices essentially reflect the
carrying cost of the underlying assets. It means the inter-relationship between spot and futures
prices reflect the carrying costs, i.e., the amount to be paid to store the asset from the present
time to the futures maturity period. This approach is explained in two ways: cost-of-carry
model in perfect markets and the cost-of-carry model in imperfect market. The next approach
to futures pricing is the expectation approach, which argues the futures price as the market
expectation of the price at the futures date. According to this theory, expected futures profit is
equal to expected futures price minus initial futures price. Another theory of futures pricing is
normal backwardation. Backwardation, in general, refers to a market in
261
which the futures price is less than the cash or spot price. In such case the basis is positive.
Basis is referred to cash price minus futures price. Further, if the futures prices are higher than
the cash prices, this situation is usually referred to as a cantango market, and the basis is
negative. Normal backwardation is used to refer to a market where futures prices are below
expected futures spot prices.
Chapter further throws light on the relationship between futures prices and the capital
asset pricing model (CAPM), which is widely applied to all kinds of financial instruments
including futures contracts. The expected return on each pure asset is earned from the
difference between the current spot price and expected futures spot price.
The chapter ends with the discussion on integrated approach which explains that
futures prices of those assets which have continuous production or continuous storage
capacity broadly follow the carrying cost approach. The assets or goods which are of
discontinuous production or storage should follow expectation approach and normal
backwardation approach tends to exist in those markets which are relatively thin, where
speculators are induced in the market.
Solved Problems
1. Suppose that you enter into a short futures contract to sell August gold for ` 520 per
gram on the XYZ Exchange. The size of the contract is 10 Kg. The initial margin is `
5,00,000 and the maintenance margin is ` 3,00,000. What change in the future price
will lead to a margin call? What happens if you do not meet the margin call?
Solution
There will be a margin call when ` 2,00,000 has been lost from the margin account.
This will occur when the price of gold increases by ` 2,00,000/10 kg. = ` 20,000. The price of
gold must, therefore, rise to ` 540 per gram for there to be a margin call. If the margin call is
not met, your broker closes out your position.
2. A company has a $10 million portfolio with a beta of 1.2. It would like to use futures
contracts on the XYZ Index to hedge its risk. The index is currently standing at 270
and each contract is for delivery of $ 500 times the index. What is the hedge that
minimizes risk? What should the company do if it wants to reduce the beta of the
portfolio to 0.6?
262

Solution
The value of the contract is
108.46875 x 1000 = 1,08,468.75
The number of contracts that should be shorted is:
=1,08,468.7560,00,000
× 8.2
7.6 = 59.7
Self Assessment Questions
1. What is a financial futures contract? Discuss the growth of financial futures with
examples.
2. Explain the importance of futures markets in context to economic growth of a
country.
3. What is futures contracting? Explain with examples. Also discuss the types of
financial futures contracts.
4. Discuss the types of traders in futures markets with suitable examples.
5. What is futures market? Discuss the functions of futures market.
6. Write a note on futures market trading mechanism.
7. How a futures position can be closed? Discuss with the help of suitable examples.
8. Write a note on role of clearing house.
9. Definhermarginntuturntt.
10. Differentiate forward contract from future contract.
****
263

264

Unit - IV
Unit Structure
Lesson 4.1 - Hedging Strategy Using Futures
Lesson 4.2 - Basis Risk and Hedging
Lesson 4.3 - Stock Index
Learning Objectives
After reading this chapter, students should
➢➢ Understand the concept of hedging. ➢➢ Know about the nature and features of hedging.
➢➢ Know about the multipurpose concept of hedging.
➢➢ Understand about the basic long and short hedges.
➢➢ Aware about the cross hedging along with its equation.
➢➢ Understand about the concept of basis risk and hedging and difference between
basis risk and price risk.
➢➢ Know about the mechanism of devising a hedging strategy, which includes (a)
deciding on the futures contract, (b) which futures contract and (C) which contract
month.
➢➢ Be aware about the concept of hedge ratio and its estimation. ➢➢ Understand the various steps involved in management of a hedge.
265

Lesson 4.1 Hedging Strategy Using Futures
Introduction
Today, the corporate units operate in a complex business environment. Managers
often find that the profitability of their organizations heavily depends upon on such factors
which are beyond their control. Important among these are external influences like
commodity prices, stock prices, interest rates, exchange rates, etc.
As a result, modern business has become more complex, uncertain and risky. So, it is
essential for the executives of the firms to control such uncertainty and risk so that the
business can be run successfully. An important function of futures market is to permit
managers to reduce or control risks by transferring it to others who are willing to bear the
risk. In other words, futures markets can provide the managers certain tools to reduce and
control their price risks. So the activity of trading futures with the objectives of reducing or
controlling risk is called hedging.
In this chapter, we will discuss the nature of hedging, fundamentals of hedging and
how futures hedges can be tailored to the need of the hedger. In other words, we will consider
here different issues associated with the way the hedges are set up. When is a short futures
position appropriate? When is a long futures position appropriate? Which futures contract
should be used? What is the optimal size of the futures position appropriate?
Example 1
Firm A is a manufacturer of automobile cars of different gradation. For this A requires
auto parts which he imports from USA. A is of the view that the prices of imported parts will
increase in futures, thereby increasing the cost of cars, which can have significant affect on
the profit profile of this firm. So there is a considerable risk that prices will raise in future.
Consequently the firm wants to avoid such risk which it bears from increasing the
price of imported parts. So he want to hedge this risk in futures by entering into derivative
market. In derivative market, he can lock today for futures prices of the imported parts and
can hedge the risk which he bears.
266

Example 2
A farmer expects that there will be 5000 quintals of food grains, which he will harvest
in coming month. But he fears that price of grain could fluctuate in coming month. So farmer
suspects of heavy losses in coming month. He can enter into derivative/futures market today
and sell the grain for delivery in next month at an acceptable price and can hedge the price
fluctuation risk. This kind of hedging is known as anticipating hedging.
Example 3
A corporate treasurer intends to borrow money in middle of March for a three-month
period. The treasurer may fear that interest rates will have risen by the date of borrowing.
Rise in interest rate would add to the cost of borrowing.
A futures position is taken so that there would be an offsetting profit in the event of
rise in interest rates. So, in this example, treasurer can do hedging by selling three- month
interest rate futures.
Hedging Concepts
Hedging, in its broadest sense, is the act of protecting oneself against futures loss.
More specifically in the context of futures trading, hedging is regarded as the use of futures
transactions to avoid or reduce price risk in the spot market. In other words, a hedge is a
position that is taken as a temporary substitute for a later position in another asset (or liability)
or to protect the value of an existing position in an asset (or liability) until the position is
liquidated. According to this concept, the firm seeks hedging whether it is on the asset side or
on the liability side of the balance sheet.
Example
In the month of March, 2003, a Jute mill anticipates a requirement of 10,000 candies
of Jute in the month of July, 2003. Current price of jute is ` 1000 per candy. Based on this
price, the company has entered into other financial arrangements. It is of great importance to
the mill that, at the time of jute is actually purchased, price is not changed substantially higher
than ` 1000 per candy. To avoid this, it buys 10,000the jute futures market, where current
price of jute is ` 1050 per candy. In the month of July, the price of jute has risen sharply with
the current spot price being ` 1500 per candy. The corresponding futures price for July jute is
found to be ` 1470 per candy.
267

At this point of time jute mill has two options:
1. It can sell its futures contract on market at prevailing rate of ` 1470, and buys its
requirement from spot market. Profit/Loss profile of this transaction will be as
follows:
Jute purchased =` 1000 per candy
Sale proceeds = ` 1470 per candy
Profit from sale = ` 470 per candy and current price of jute ` 1500 per candy to be paid
and lid cost of candy to mill is ` 1030 per candy.
So futures transaction has ensured the minimization of upward price risk a mere for
` 30 per candy.
2. The mill could take delivery of jute directly from futures market. In this case the mill
would pay ` 1000 per candy, but for taking delivery there may be possibilities of not
delivery of same variety of jute.
It is observed from the above example that by buying futures the firm has hedged
against the upward price risk.
The Multi-Purpose Concept of Hedging
Earlier hedging was taken to be only one kind (known as routine or naive hedging),
whereby the trader always hedged all his transactions purely for covering all the price risks.
However, this concept was challenged by Hollbrook Working, in his article “New Concepts
Conutures Marknricesnropoundehulturpose conf
hedging which is widely accepted. According to this concept, the hedging can be used for
many other purposes
Carrying Charge Hedging
According to this approach, the stockist watch the price spread between the spot and
futures prices, and if the spread covers even carrying costs then the stockist buy ready stocks.
It means that the traders may go for hedging if the spread is adequate to cover carrying costs
whereas earlier view was that hedges are used to protect against loss on stoceld. Thuro H.
Workingiorimarilhether tedgot, but whether ttorot”.
268

Operational Hedging
According to this view, hedgers use the futures market for their operations and use the
same as substitute for cash or forward transactions. They think that the futures markets
arornave lower difference between ‘bidnaskr
Selective or Discretionary Hedging
As per this concept, the traders do not always (in routine) hedge themselves but only
do so on selected occasions when they predict adverse price movements in futures. Here the
objective is to cover the risk of adverse price fluctuation rather to avoid price risk. So they use
hedging technique selectively at the time of adverse price movements.
Anticipatory Hedging
This is done in anticipation of subsequent sales or purchases. For example, a farmer
might hedge by selling in anticipation of his crop while a miller might hedge by buying
futures in anticipation of subsequent raw material needs.
In brief, it is evident that now hedging is not used only for reducing or controlling the
price risk but it also serves other purposes for the market participants. However, largely, the
hedging is used to eliminate or reduce the price risk in our further discussion.
The Perfect Hedging Model
The perfect hedge is referred to that position which completely eliminates the risk. In
other words, the use of futures or forward position to reduce completely the business risk is
called perfect hedge, for example, a jewellery manufacturer wants to lock in a price for
purchasing silver for the coming June. This he can do by going long June silver futures, if
silver prices rise, the risk of increased cost of silver will be offset by the profits earned on the
futures position. Similarly, if the silver prices fall, the savings on the silver purchase will he
offset by futures losses.
In either case, the net silver cost is locked in at the futures price. However, it should
be noted that only price risk is covered and not the quantity rishe untainty about
the quantity that will be sold or purchased at some futures date. No doubt, availability of
quantity of the asset at futures date may also influence the determination of futures prices.
269

Example
Suppose a firm has an inventory of 100 kg of silver and it intends to sell in June. The
current spot price of silver is ` 7500 per kg but firm is worried that the price of silver will fall
between now and June. To hedge itself against this possibility, the firm enters into 100 kg of
short position in June silver futures at a futures price of ` 7600 per kg. Firm is now protected
against falling silver prices because the futures position will protect the firm and firm will
gain if silver prices do fall.
To see how the firm is hedged, consider what happens to its revenue under two price
scenarios:
1. In first scenario, spot silver price rise to ` 7700 per kg.
2. In second scenario, silver falls to ` 7400 per kg in June.
Silver Inventory and Sales Revenue
Scenario (PT) Silver revenues (QT x PT) Profit / loss [QT(FtT – PT)] Net Revenue
I. ` 7700 ` 7,70,000 100(` 7600 – ` 7700)
` 7,60,000
= - ` 10,000(Loss)
I. ` 7400 ` 7,40,000 100(` 7600 – ` 7400)
` 7,60,000
= ` ` 20,000(Profit)
Iotharios, firm locoday’utures prf ` 7600 per kg. When silver prices rise, there will be an off-setting futures loss; when silver prices fall, an off-setting
gain will occur. But it is to be noticed that the firm does not lock in current spot price of `
7500 per kg.
Short inventory hedge can also be shown in general terms
Scenario Revenues Profit / loss Net Revenue
PT QT PT
QT(FtT – FT.T) QT
Ft.T = QT(FtT – PT)
We assume in this illustration that the firm sells its inventory at silver in the spot
market. The firm would get the same result if it delivered its silver into futures market to
fulfill its short position; because the futures settlement price at expiration equals to spot price
(NT) due to convergence effect on the prices.
270

Above examples shows the two basic steps in futures hedging:
1. Hedger determines how its profits are affected by change in commodity price, security
price interest rate or exchange rate.
2. Hedger enters into a futures position with the opposite exposure. As a result, risk is
eliminated.
Several conditions must be fulfilled before a perfect hedge is possible. In brief, these
are as under:
1. The business firm must know exactly the effect of change in price on the profit, and
further this relationship must be linear.
2. There must be futures or forward contracts available in the market with the following
features.
a) Iritten ohe unlyinsset wilffechirm’rofit.
b) The tion date of the contt shoube the same on wh the firm’s profits
will be affected by the price of the said asset.
c) It specifies a quantity equal to which will affect the firm.
How a Perfect Hedge Works
Let us denote t is today period (present), T is date in June on which purchased will be
effectedhuantitf silver turchased, PT’rhim, FTs
futures price at the time T and FT is futures price at time t.
The net cost to the manufacturer is the price of the silver less the profit on the futures
position
Silver Costs Time line
Scenario (PT) Silver costs Futures profits Net silver cost
(QT PT) QT(FTT – Ft.T) Q
T
FtT
= QT(PTT – Ft.T)
Here PTT = Ft.T because delivery date convergence, and
Net silver cost = Silver costs – Futures profit
QTFtT = QTPT - QT (PtT – Ft.T)
271

It is observed that the above hedge meets all the requirements of a perfect hedge. The
manufacturer know that silver cost at T(June) will be QTP T which is linear function of the
silver price because every rupee change in the silver price will change QTPT by QT. By
entering into the long futures at time t, the manufacturer establishes that his costs at time
Twill be QTFtT Hehucoday’utures pror his silver purchaseothat, here the gain or losses have been computed on the futures position as it were a forward position.
The Basic Long and Short Hedges
Basically, the hedging refers to by taking a position in the futures that is opposite to a
position taken in cash market or to a future cash obligation that one has or will incur. Thus,
the hedges can be classified into two categories: short hedges and long hedges.
Short Hedge
A short hedge (or a selling hedge) is a hedge that involves short position in futures
contract. In other words, it occurs when a firm/trader plans to purchase or produce a cash
commodity sells futures to hedge the cash position, in general sense, it means being
shortaving a net sold ption, or a cotmeno deliver’, etus, here thain
objective is to protect the value of the cash position against a decline in cash prices. A short
hedge is appropriate when the hedger already owns all and expects to sell it at sometime in
the futures. Once the short futures position is established, it is expected that a decrease
(increase) in the value of the cash position will be fully or partially compensated by a gain
(loss) on the short futures position.
Example
A US exporter who knows that he will receive German mark in three months from a
German company. Exporter will realize gain if the mark increases its value in relation to the
US dollar and a loss if the mark decreases its value relative to the US dollar. A short futures
position leads to a loss if mark increases in value and a gain if it decreases in value. It has the
effecffsettinhorter’isk.
Example
A miner, who is manufacturer of silver and having a mine, wants to take a decision
whether to open the mine or not. It is based upon the price of silver in futures because
production of silver takes two months. He wants to plan his profitability for his firm. If the
silver prices fall, he may suspend production of silver. Today is June 10. The price of silver
272
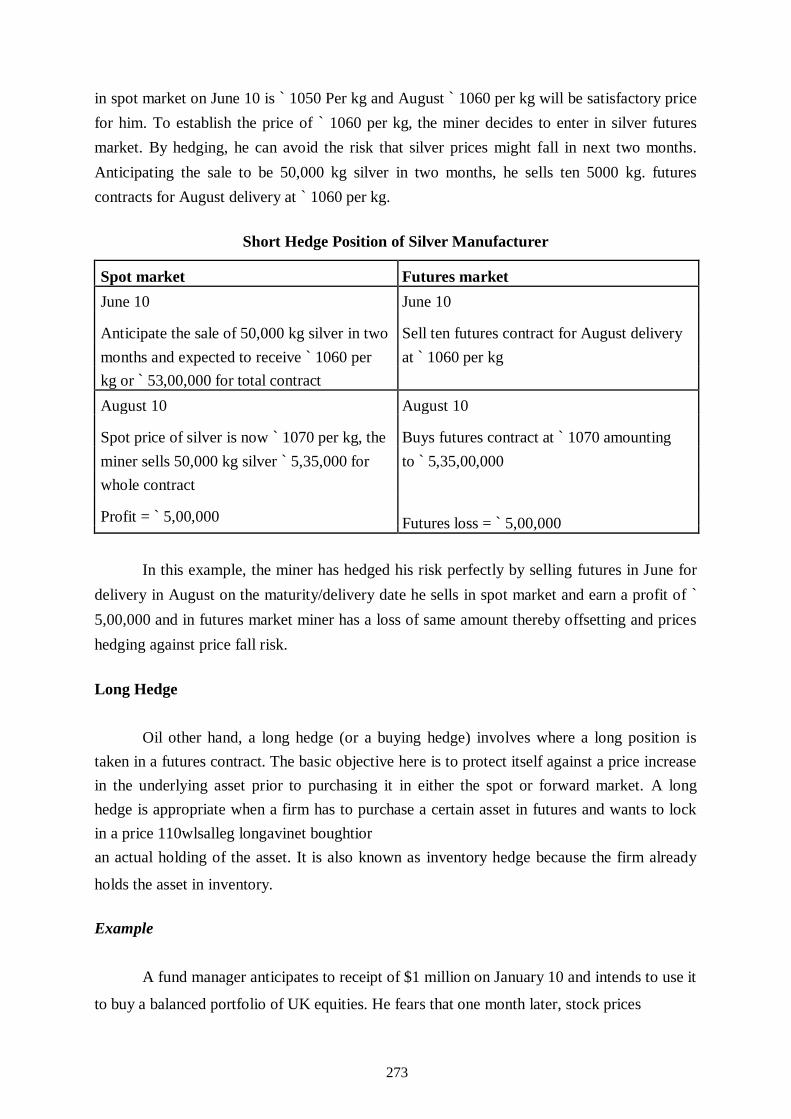
in spot market on June 10 is ` 1050 Per kg and August ` 1060 per kg will be satisfactory price
for him. To establish the price of ` 1060 per kg, the miner decides to enter in silver futures
market. By hedging, he can avoid the risk that silver prices might fall in next two months.
Anticipating the sale to be 50,000 kg silver in two months, he sells ten 5000 kg. futures
contracts for August delivery at ` 1060 per kg.
Short Hedge Position of Silver Manufacturer
Spot market Futures market
June 10 June 10
Anticipate the sale of 50,000 kg silver in two Sell ten futures contract for August delivery
months and expected to receive ` 1060 per at ` 1060 per kg
kg or ` 53,00,000 for total contract
August 10 August 10
Spot price of silver is now ` 1070 per kg, the Buys futures contract at ` 1070 amounting
miner sells 50,000 kg silver ` 5,35,000 for to ` 5,35,00,000
whole contract
Profit = ` 5,00,000 Futures loss = ` 5,00,000
In this example, the miner has hedged his risk perfectly by selling futures in June for
delivery in August on the maturity/delivery date he sells in spot market and earn a profit of `
5,00,000 and in futures market miner has a loss of same amount thereby offsetting and prices
hedging against price fall risk.
Long Hedge
Oil other hand, a long hedge (or a buying hedge) involves where a long position is
taken in a futures contract. The basic objective here is to protect itself against a price increase
in the underlying asset prior to purchasing it in either the spot or forward market. A long
hedge is appropriate when a firm has to purchase a certain asset in futures and wants to lock
in a price 110wlsalleg longavinet boughtior
an actual holding of the asset. It is also known as inventory hedge because the firm already
holds the asset in inventory.
Example
A fund manager anticipates to receipt of $1 million on January 10 and intends to use it
to buy a balanced portfolio of UK equities. He fears that one month later, stock prices
273

will rise before the money is received. He can go in futures market and buy today futures
contract at 2200, current index (I TSE 100) is at 2200. He can close out his position by selling
March 18, FTSE contract.
Long Hedge using Futures
Spot market Futures market
December 10 December 10
Anticipate receipt of $1 million on January Buys March 18 ETSE index futures contract
10 at a price of 2200. He thereby commits him-
Current FTSE 100 index is at 2200 fears a self to pay (2200 x £ 18 x £ 25) = £9,90,000.
rise in the index Stock in futures date
January 10 Close out position by selling at a price of
The new FTSE index at 2300 2300. He notionally receipt of £10,35,000
upon maturity of contract profit from Reqadditional £ 45000 order to buy
futures £45,000
the stock that $1 million would have been
bought on December 10
Loss = £45000 in spot market Profit £45,000 in futures market.
In the above example, fund managers used stock index futures to hedge his risk of
price fluctuation in coming one month.
Thermngnshortpplotponutures market anrly
used in the futures trading. A person who hold stocks of an asset is obviously regarded as ‘bg
long’ the spot markbut it is not nesary to actually hostocSlarly, it is in
thasshort’hernhaorwaralerdebhortn
the spot market. In brief, the position of long and short hedges is shown in Table.
Long Vs Short Hedging
Short hedger Long hedger
Position in spot market Long Short
Protection need against Price fall Price rise
Position in futures market Short Long
Example
A farmer anticipates a bumper crop amounting to 150 quintals, which he expects to
harvest in the month of January. It is October and current price of crop is ` 10,000 per
274

quintal. This price is acceptable to the farmer and give him a sufficient return. But he is
apprehensive of fall in price by the time crop will be ready. He, therefore, sells 150 quintals
on the commodity futures market at it current price of ` 9500 per quintal. In the month of
January, price of crop have in fact risen. Current spot price is ` 11,000 per quintal. Now,
farmer has two alternatives:
1. He can buy back 200 quintals of January crop on the futures market at a present
futures price of ` 10,500. He can then deliver his actual crop of pepper in spot market
at the ruling rate of ` 11,000 per quintal. As a result farmer will have following
profit/loss:
January contract sale @ ` 9500 per quintal. January contract buys @ 10,500. So, there
is a net loss of ` 1000 per quintal. Further he sells his output @ 11,000 in the spot market and
by deducting the loss on futures market position of ` 1,000, net price obtained by former is `
10,000 per quintal.
2. He can deliver in the futures market @ ` 9500 per quintal.
This situations; where sale of futures by those hedging against price fall is called short
hedge and taken guarding against downward price movements.
Cross Hedging
All the hedged positions discussed earlier used futures contracts which are undertaken
on the assets whose price is to be hedged and that expires exactly when the hedge is to be
lifted.
Sometimes, it is seen that the firms wish to hedge against in particular asset but no
futures contract available. This situation is called as asset mismatch. Further, in many cases,
same futures period (maturity) on a particular asset is not available, it is called a maturity
mismatch.
Referring to the different situations referred earlier, there is still possibility to hedge
against price risk in related assets (commodities or securities) or by using futures contracts
that expire on dates other than those on which the hedges are lifted. Such hedges are called
cross hedges. In actual practice and in real business world, it will be rare for all factors to
match so well. Thus, across hedge is a hedge in which the characteristics of the spot and
futures positions do not match perfectly.
275

Mismatch situations which make the hedge a cross hedge:
➢➢ The hedging horizon (maturity) may not match the futures expiration date. ➢➢ The quantity to be hedged may not match with the quantity of the futures contract.
➢➢ The physical features of the asset to be hedged may differ from the futures contract
asset.
In general, one cannot expect a cross-hedge to be as effective in reducing risk as a
direct hedge. However, cross hedges are commonly used to reduce the price risk. Now, the
question is which futures contracts are good candidates for a cross hedge. For example, if we
want to hedge a portfolio of silver coins then a silver futures contract will be more effective
cross-hedge rather than a gold futures contract. Thus, if the price of the underlying asset and
the price of correlated asset, one can analyze the nature of hedging. If perfectly correlated, it
is perfect, in closely correlated, it is cross hedge, and in negatively correlated, there will be no
hedging, rather more risk will be added by taking a position in the futures.
Cross Hedging Silver Coins With Silver Futures
Example
Suppose a firm has a collection of 100 kg of rare silver coin and the firm is concerned
that value of those coins will drop over the next six months. There is no silver coin futures
contract but we know the price of silver futures. Therefore, we consider cross hedging the
value of our coin collection with a short position in silver futures expiring in the three months.
The current silver futures price is ` 7600 per kg. Also the relationship between the price of
silver coins and silver futures is:
Silver coin price = 100 + 1.20 (Silver futures) +e
Where error term, e take on values of only - 10, 0 and 10 and both silver coin
price and silver futures price are in kg. From the above equation, it is clear that on average the
silver coin price is 20 percent more volatile than silver futures price. Because each ` 1
movement in the silver futures price is associated with a ` 1.20 movement in silver coins
price. So size of futures position:
Size of futures position = Hedge ratio x Size of cash position
= 1.2x l0kg= 12 kg
276
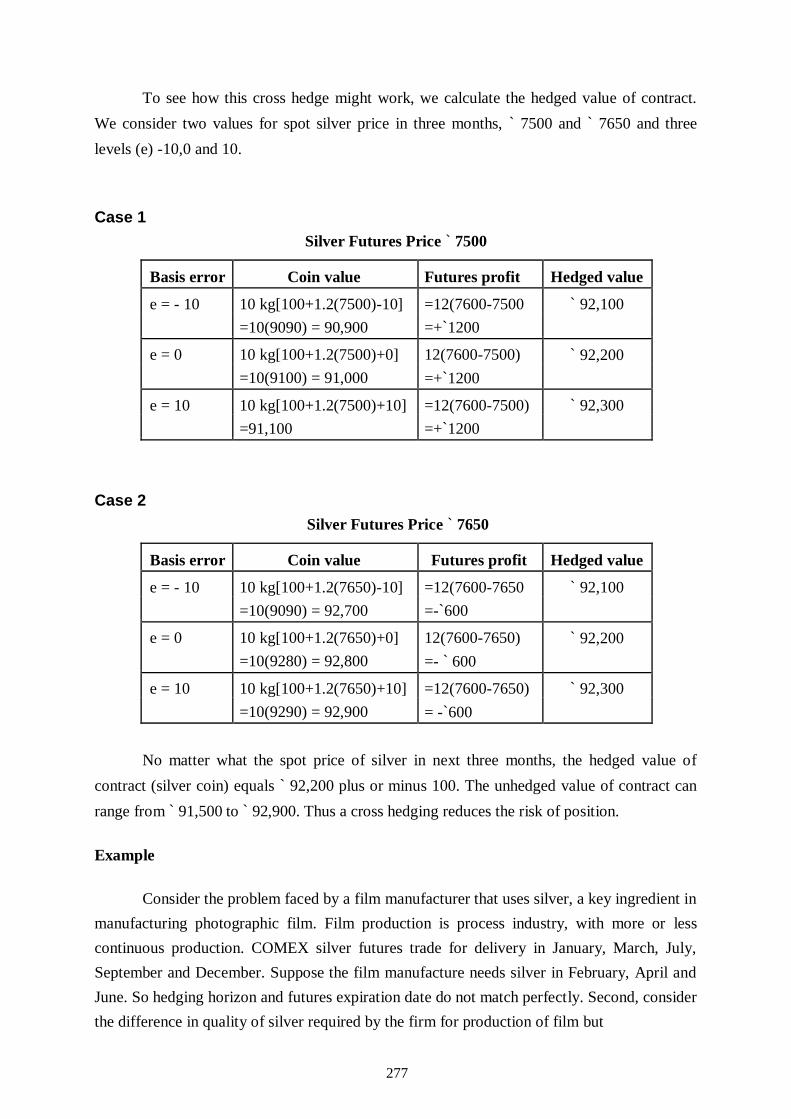
To see how this cross hedge might work, we calculate the hedged value of contract.
We consider two values for spot silver price in three months, ` 7500 and ` 7650 and three
levels (e) -10,0 and 10.
Case 1
Silver Futures Price ` 7500
Basis error Coin value Futures profit Hedged value
e = - 10 10 kg[100+1.2(7500)-10] =12(7600-7500 ` 92,100
=10(9090) = 90,900 =+`1200
e = 0 10 kg[100+1.2(7500)+0] 12(7600-7500) ` 92,200
=10(9100) = 91,000 =+`1200
e = 10 10 kg[100+1.2(7500)+10] =12(7600-7500) ` 92,300
=91,100 =+`1200
Case 2
Silver Futures Price ` 7650
Basis error Coin value Futures profit Hedged value
e = - 10 10 kg[100+1.2(7650)-10] =12(7600-7650 ` 92,100
=10(9090) = 92,700 =-`600
e = 0 10 kg[100+1.2(7650)+0] 12(7600-7650) ` 92,200
=10(9280) = 92,800 =- ` 600
e = 10 10 kg[100+1.2(7650)+10] =12(7600-7650) ` 92,300
=10(9290) = 92,900 = -`600
No matter what the spot price of silver in next three months, the hedged value of
contract (silver coin) equals ` 92,200 plus or minus 100. The unhedged value of contract can
range from ` 91,500 to ` 92,900. Thus a cross hedging reduces the risk of position.
Example
Consider the problem faced by a film manufacturer that uses silver, a key ingredient in
manufacturing photographic film. Film production is process industry, with more or less
continuous production. COMEX silver futures trade for delivery in January, March, July,
September and December. Suppose the film manufacture needs silver in February, April and
June. So hedging horizon and futures expiration date do not match perfectly. Second, consider
the difference in quality of silver required by the firm for production of film but
277

at COMEX futures contract available are of 100% pure quality. There is also hedge may not
be perfect. Further, if say the manufacturer needs 7000 ounces of silver, he has a problem to
chose one or two contracts this portion because at Comex one standard contract is of 5000
ounce. These all are the cases of cross hedges.
The Cross Hedge Equation
After deciding the most closely correlated contract to the price, we wish to hedge, then
the number of contracts are to be determined for minimising risk. One way to estimate the
statistical relationship between them, i.e., by a linear equation which is as under:
PT=a +b F*T +e*
T
where e*T is random error with zero mean, T is the expiration date of the futures
contracts and T is the date the hedge will be closed out.
If T# T, there is maturity mismatch. The following time line will show this situation:
Time line
t T T
Enter hedge Lift hedge Contract expires
The equation considers that hedges have bosh asset and maturity mismatch. We can
interpret the constant term by assuming b = I, et = 0, and T= T.
Suppose a firm holds silver inventory in Mumbai. Also suppose that because of
transportation cost, spot price of silver in Mumbai is always ` 50 per kg more than it is in
Delhi. Delivery, location etc. are specified in the silver contract. In this case, the equation will
be
PMT =a+PT
where superscript refers to Mumbai.
Example
Show the net difference between the inventory scenario in Mumbai and Delhi in the
example shown in perfect hedge model by assuming ` 50 difference in silver prices between
two cities.
278

Silver Inventory Revenue Hedging
Scenario Delhi/
New silver revenue Futures profits Net revenue Mumbai
7700/7750 7,75,000 100 (7600 -7700) = -10,000 ` 7,65,000
7400/7450 7,45,000 100 (7600-7400) = 20,000 ` 7,65,000
The coefft h equation inatthat on an avge spoill move bupees for
every rupee move in futures price. A cross hedging strategy must adjust for the relationship
between movements in the spot and futures prices. This can be done by choosing the correct
hedge ratio.
Quantity of futures position
Hedge ratio = Quantity of cash position
Hedge ratio has been further explain later on in this chapter.
****
279
Lesson 4.2 - Basis Risk and Hedging
The Concept of Basis Risk and Hedging
Understanding basis risk is fundamental to hedging. It is noted earlier that basis is the
difference between the spot price (cash price) and futures price of an underlying asset. If the
spot price is higher than the futures price, then the basis will be called as positive or over and
vice-versa. This concept in equation form is as under:
BasistT = Cash pricet - Futures pricetT
If the futures prices and cash prices always change by the same amount then the basis
will not change and it will be zero. It means there could be no change in the basis, if Futures
price = Cash price, then
BasistT = Futures price - Cash price = 0
There is basis risk when the changes in futures prices and cash prices are not equal.
Further in this case, if the magnitude (in units) of the cash futures positions are
identical then any loss (gain) in the value of the cash position will be totally offset by the gain
(loss) in the value of the futures position. Prior to expiration, the basis may be positive or
negative. For example, low-interest rate currency or gold or silver assets, usually futures price
is greater than the spot price, which means that basis is negative and vice-versa.
When the change in spot price is more than the change in futures price, the basis will
increase which is known as a strengthening of the basis. Similarly, if the change in spot price
is less than the change in futures price, the basis will decrease; it is referred to as a weakening
of the basis. Let us see the following:
It is observed from Table that change in spot price is 60 (7560-7500) whereas change
in futures price is 10 (` 7590— ` 7580), and change in 50 (-30 + 80), is a situation of
strengthening the basis.
280
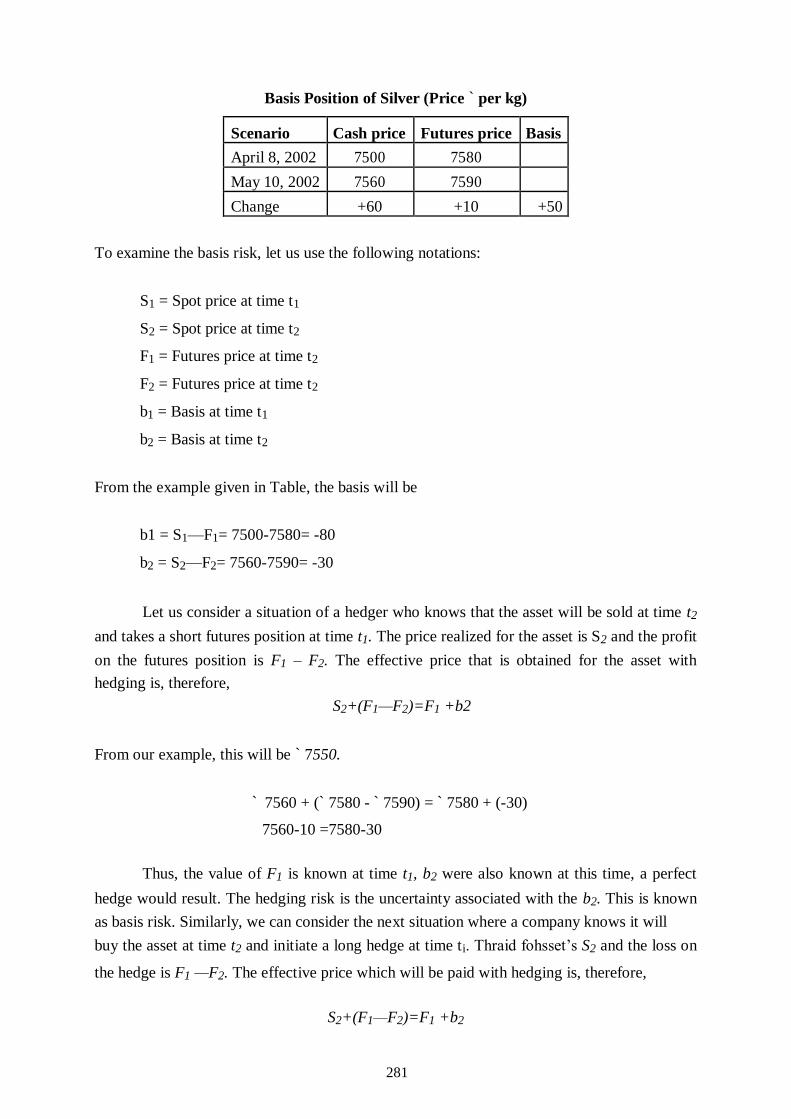
Basis Position of Silver (Price ` per kg)
Scenario Cash price Futures price Basis
April 8, 2002 7500 7580
May 10, 2002 7560 7590
Change +60 +10 +50
To examine the basis risk, let us use the following notations:
S1 = Spot price at time t1
S2 = Spot price at time t2
F1 = Futures price at time t2
F2 = Futures price at time t2
b1 = Basis at time t1
b2 = Basis at time t2
From the example given in Table, the basis will be
b1 = S1—F1= 7500-7580= -80
b2 = S2—F2= 7560-7590= -30
Let us consider a situation of a hedger who knows that the asset will be sold at time t2
and takes a short futures position at time t1. The price realized for the asset is S2 and the profit
on the futures position is F1 – F2. The effective price that is obtained for the asset with
hedging is, therefore,
S2+(F1—F2)=F1 +b2
From our example, this will be ` 7550.
` 7560 + (` 7580 - ` 7590) = ` 7580 + (-30)
7560-10 =7580-30
Thus, the value of F1 is known at time t1, b2 were also known at this time, a perfect
hedge would result. The hedging risk is the uncertainty associated with the b2. This is known
as basis risk. Similarly, we can consider the next situation where a company knows it will
buy the asset at time t2 and initiate a long hedge at time ti. Thraid fohsset’s S2 and the loss on
the hedge is F1 —F2. The effective price which will be paid with hedging is, therefore,
S2+(F1—F2)=F1 +b2
281

This is the same expression as we have seen earlier. The value of F1 is known at time
t1 and the term b2 represents basis risk.
Basis risk for the investment assets like securities arises mainly from uncertainty as to
the level of the risk-free interest rate in the futures whereas in the case of consumption assets,
in balances between supply and demand, difficulties in storing, convenience yield, etc. also
provide the additional source of basis risk.
Basis risk = Spot price of asset to be hedged - Futures price of contract used
Suppose spot price of the share of XYZ Ltd. at the time of hedge initiated is ` 2.50 and
futures price is ` 2.20 respectively. And at the tie of closing at hedge prices are ` 2.00 and
` 1.90 respectively. So basis will be:
b1 =S1—F1=2.50-2.20=0.30
b2, =S2—F2=2.00-1.90=0.10
Also consider a hedger who knows that the shares will be sold at time t2 and takes a
short futures position at time t1. Effective price that is obtained for the assets with hedging is,
therefore,
S2 + (F1 - F2) = F1 + b2
=2.00+2.20-1.90=2.20+0.10
= 4.20-1.90 2.30
= 2.30 = 2.30
Value is ` 2.30 and where b2 represents the basis risk.
Basis Risk Versus Price Risk
We have already seen that the basis b is the difference between the cash or spot price s
and the futures price F
Bt,T
= St
– Ft,T
A change in the basis, therefore, is:
∆bt.T
= ∆St t.T
282

Example
Suppose futures price on March 1 in cent per yen is 0.7800 and spot and futures prices
when contract is closed out are 0.7200 and 0.7250, respectively.
Basis risk = 0.7200 07250 = - 0.0050
If the changes in futures and spot prices were assumed to be equal then there would be
no change in the basis.
If ∆St = ∆Ft.T
Then ∆bt.T = ∆St t.T
= 0
When changes in futures and cash price are not equal, which is normal in practice,
then there will be basis risk. Thus, basis risk is defined as the variance of the basis, i.., σ2 (b)
t.T which will be equal to
σ2(bt.T) = σ2St – Ft.T)
It can be rewritten as:
σ2(bt.T) = σ2 (St) + σ2 (Ft.Tσ (S t t.T
)
wher 2 is the variance, or is the standard deviation and ρ is the correlation coefficient
between the futures and spot price series.
From the above, it is revealed that the basis risk is zero when the variances of the
futures and cash prices are identical and the correlation coefficient between cash and futures
prices equals to one. Let us explain this by an example. If the variance of futures and cash
prices are both to ` 25 and there is perfect correlation between the spot and futures prices, i.e.,
ρ = 1, then
σ2(bt,T)=25+25-2 x 1x5x5=50-50=0
Let us further assume that there is perfect correlation between spot and futures prices
(i.e. p# 1), and if it equals only 0.50, basis risk will not be zero. In that case the basis risk will
be
σ2 (b,,T) = 25 + 25-2 x (0.5)(5)(5) =50-25=25
283
Similarly, a difference between the variance of the futures and cash prices will result
in some basis risk. However, in real world situation, the magnitude of the basis risk depends
mainly on the degree of correlation between cash and futures prices, i.e., the higher the
correlation, the less the basis risk.
As we see that perfect correlation between the cash and futures prices is very rare, the
hedgers, then, always assume some basis risk. So to reduce their exposure to price risk (or to
the variance of spot prices), they must accept in return an exposure to basis risk. In brief, it is
evident that for a hedge to be attractive, the basis risk should be significantly less
thahedger’risk.
Hedging Effectiveness
As noted earlier that the objective of the hedging is to reduce the exposure to price
risk, and so the hedgers trade price risk for basis risk. Thus, one measure of anticipated
hedging effectiveness (H.E.) is to compare the basis risk with the price risk. The smaller the
anticipated basis risk in comparison to the anticipated price risk, the more effective is the
hedge. This can be stated as follows:
H.E. = 1 -
σ2
(bt.T
)
σ2 (St)
i.e., 1 minus the ratio of the expected variance of the basis to the expected variance of cash
prices.
This means that the closer the H.E., the more effective the hedge. However, H.E. is
only a way of judging how good a particular hedge is likely to be a priori. It should not be
confused with the concept of an optimal hedge.
Devising a Hedging Strategy
In this section, we will discuss the concepts and principles involved in designing a
specific hedging strategy. So, different issues concerning to it like how to select a futures
contract for hedging, how to determine and calculate the optimal hedge ratio, how to design
and manage a hedging strategy and so on will be discussed.
Deciding on the Futures Contract
The basic objective of an hedging strategy is to minimize risk or to maximize hedging
effectiveness. In this respect, the first step towards designing a particular hedging strategy
284
is to decide about the futures contract to be undertaken. For this purpose, two aspects are
considered: first, what kind of futures to use, and second, which contract month of that futures
to be used.
Which Futures Contract
While deciding about the futures contract to be undertaken, the hedger must consider
that the correlation between the cash and futures prices must be very high. When hedging an
asset on which no futures contract is traded, the choice is more difficult. Thus, first starting
point to select a futures contract is to select such assets which are inter-related. In other
words, evaluating the correlation coefficients of various price risk associated with, for
example, with jet fuel, heating oil, gasoline, crude oil, etc. Likewise, with gold we can use
gold coins, bullion, silver, silver coins, etc.
Which Contract Month
The second important consideration in designing a hedging strategy is to select the
contract month. We see that futures contracts are available in the market of different months.
So the selection of month of a futures contract will depend upon the such period where the
futures and spot prices are highly correlated. Obviously, the prices of the near month contract
are the most highly con-elated with cash price. Thus, using the near month futures contract
will reduce basis risk (or variance of the basis) the most. Since it is seen that the variance of
the basis increases as the price correlation between cash and futures price decreases. Hence,
hedging with the near month futures contract is preferable because it minimizes the basis
variation.
It should be noted that the principle of choosing the futures contract should be applied
in the context of specific hedging situations. Matching cash and futures obligations in
different situations will be another way of dominating or minimizing basis risk. This strategyf
courseilsefunly if thtioedger’asbligationixed
and known in advance, and there exist a matching futures contract where the hedger can not
estimate his cash obligation with certainty, then in this situation he will not be able to pursue
a matching strategy, but may want to hedge continuously.
Thus, hedging in a continuous cash obligation, there can be two alternatives:
(a) Hedging with a nearby futures and rolling the hedge forward,
(b) Hedging with a more distant futures contract, and rolling it less frequently.
285

Both the alternatives have their own mechanism depending upon the hedging
objective. For example, using a more distant contract usually increases basis risk because its
price will be less correlated with spot market prices. But the brokerage cost and other
transaction costs will be more due to frequent sales and purchases in the market. No specific
rule can be made to decide between these alternatives. However, the hedgers in most cases,
prefer to hedge with a futures contract that has a high price correlation either with the near
month or the second month contract.
Hedging Objectives
In the prior discussion of hedging strategies, we have assumed the only objective of
hedging is to minimize the risk. However, sometimes, the hedgers may be willing to assume
more risk in order to earn more profit because eliminating all price risk will lead to
eliminating the profit of the firm, which may not be good at all the time. Thus, the hedgers
may use such hedging ratio other than the minimum-variance hedge ratio, or willingly may go
for under hedging.
Undoubtedly the decision relating to hedging ratio or how much to hedge will
enpohedger’isreference. Thser hedghorisssum
Not only this, the hedger may change his hedging strategy later on due to his strong belief
about the futures price movements. So hedging objective is a relative concept and much
depends upon the risk and return. In other words, it is the tradeoff between profits and risk
reduction through hedging because it is observed that risk could be reduced but at the cost of
lost profits.
Figure depicts trade off between risk and profit at the different level of hedge ratios.
The hedger may choose the risk and return combination that he most prefers, or that he finds
optimal. In this figure, line EE represents the hedging efficiency frontier: the most efficient
combinations of risk and return that can be achieved by varying the hedge ratio. The line UU
represents the highest level of utility which the hedger can achieve by hedging (being on the
efficient frontier EE). The slope of UU represents how the hedger values change in risk
relative to changes in profits. The value replaces on changes in risk versus changes in profit
will determine his decision.
For example, at the point E, the hedge ratio is 0.60 where the expected profit is ` 5200
at ` 2000 standard deviation. Further, if he chooses the hedge ratio 0.40, by doing so he will
increase risk to ` 2500 (by standard deviation). Point A where UU and EE touch (or tangent),
inates thedger’ptimal ratedgtrategieldrofit of ` 5300 and a standard deviation of ` 2500, which yields a profit utility to the hedger.
286

In brhe hedge can remacompely unhedged ( β = 0), or can adopt the minimum-variance hedge
(β = 0.60) yielding lower utility than that it would be at a hedge ratio of 0.40.
Management of the Hedge
After establishing an hedge, it is essential to manage it effectively. So regular
monitoring and making adjustments are the key factors in managing of the hedge. There also
needs to be a systematic evaluation of the effectiveness of the hedge relative to its anticipated
(or excrete measure). Further, if the desired results are not being achieved from the hedging
then the reasons should be identified and necessary steps be taken to improve hedge
effectiveness in the futures. To manage effectively the hedging, following steps are taken:
Monitoring the Hedge
Continuous monitoring on the performance of an hedging is essential. For this
purpose, the following information should be available regularly on an up-to-date basis:
Cash Position
The hedger must get the information of the current size of the cash position being
hedged. What are the changes in its magnitude since the inception of hedge? What are the
287

gains or losses on this position to date? What are the reasons of such deviation, if any?
Futures Position
Likewise cash position, the information regarding the size of futures position, profits
and losses incurred to date on this position, etc. be collected for further consideration.
Margins
All such information concerning the margin like the total amounts of funds dedicated
to margin requirements, net financing to-date, ng costs to- and further, the availability of
funding arrangements to meet futures margin calls, etc. should be available continuously.
Basis Movements
All such information regarding the changes in basis should be collected to see whether
they are consistent with a priori expectations or there is any major deviations at the particular
time intervals.
New Information
Sometimes, new events occur in the market or there are new information regarding the
underlying assets which cause to change in the prices either of the spot or futures must be
noted and analyzed further to evaluate their impact on hedging strategy followed by the firm.
****
288

Lesson - 4.3 Stock Index
The Concept of Stock Index
Before discussing the concept of stock index futures, we should know about the term
stock index. A stock index or stock market index is a portfolio consisting of a collection of
ferentoctherords, a stock inust likortfoferenecurit’
proportions traded on a particular stock exchange like NIFTY S&P CNX traded on National
Stock Exchange of India, the S&P 500 Index is composed of 500 common stocks, etc.
These indices provide summary measure of changes in the value of particular
segments of the stock markets which is covered by the specific index. This means that a
change in a particular index reflects the change in the average value of the stocks included in
that index. The number of stocks included in a particular index may depend upon its
objective, and thus, the size varies index to index. For example, the number of stocks inclSEX
is 30 whereas tocare covereStandarnd Poor’s ere
are, however, some common features of these stock indices which are as under:
Common Features
1. A stock index contains a specific number of stocks, i.e., specification of certain sector
number of stocks like 30, 50, 100, 200, 500 and so on.
2. Selection of a base period on which index is based. Starting value of base of index is
set to large round like 100, 1000, etc.
3. The method or rule of selection of a stock for inclusion in the index to determine the
value of the index.
4. There are several methods commonly used to combine the prices of individual stock
like arithmetic average, weighted average, etc.
5. There are three types of index construction like price weighted index, return equally
weighted index and market capitalization weighted index.
6. A stock index represents the change in the value of a set of stocks which constitute the
index. Hence, it is a relative value expressed as weighted average of prices at a
specific date.
289

7. The index should represent the market and be able to represent the returns obtained by
a typical portfolio of that market.
8. A stock index acts as a barometer for market behaviour, a benchmark for portfolio
performance. Further, it also reflects the changing expectations about the market.
9. The index components should be highly liquid, professionally maintained and
accurately calculated. In the present section, we will not discuss the mechanism of
construction of a stock index. However, it is beneficial to understand thoroughly the
details of construction of an stock index particularly in which the investor is interested
to trade. Because when the differences and interrelationships among the indexes are
understood, it will be easier to understand the differences among the futures contracts
that are based on those indexes.
Stock Index Futures
A stock index futures contract, in simple terms, is a futures contract to buy or sell the
face value of a stock index.
Diversity of indexes, Thursday, May 28, 1998*. Range for underlying indexes
High Low Close Net Chg. From Dec. 31 % Chg.
Di Indus (DJX) 89.93 89.01 89.70 +0.33 +10.82 +13.4
Di Trans (DTX) DJ 395.89 331.19 333.70 +0.45 +8.05 +2.5
Util (DUX) 281.15 277.03 280.78 +3.36 7.71 +2.8
S&P 100 (OEX) 535.08 530.41 534.04 +2.04 +74.10 +16.1
S&P 500 -AM. (SPX) 1009.73 1089.06 1097.59 +5.36 +127.16 +13.1
CB-Tech (TXX) 256.92 253.34 254.86 -0.59 +39.07 +18.1
CB-Mexico (MEX) 105.55 104.22 104.53 -0.78 -22.45 -17.7
CB-Lps Mex (VEX) 10.56 10.42 10.45 -0.08 -2.25 -17.7
MS Multinti (NFT) 603.64 598.34 601.76 +1.14 +70.21 +13.2
GSTI Comp (GTC) 171.36 169.07 170.31 +0.05 +26.85 +18.7
Nasdaq 100 (NDX) 1218.16 1200.24 1214.83 +5.37 +224.03 +22.6
NYSE (NYA) 567.91 562.67 567.10 +3.17 +55.91 +10.9
Russell 2000 (RUT) 455.81 450.26 455.81 +5.55 +18.79 +4.3
Lps S&P 100 (OEX) 107.02 106.08 106.81 +0.41 +14.82 +16.1
Lps S&P 500 (SPX) 109.97 108.91 109.76 +0.54 +12.72 +13.1
S&P Midcap (MID) 358.63 354.91 358.52 +3.58 +25.15 +7.5
Major Mkt (XMl) 945.83 936.61 943.38 +4.10 +106.53 +12.7
HK Fltg (HKO) 173.78 173.78 173.78 -2.02 -40.78 -19.0
HK Fixed (HKD) - - 174.17 -2.02 -40.87 -19.0
290

1W Internet (LIX) 326.39 319.28 324.65 +1.64 +64.40 +24.8
AM-MY) 119.33 117.23 117.41 -1.38 -24.12 -17.0
Institut’I-A.M. (XII) 610.44 604.79 608.96 +1.89 -441.20 -42.0
Japan (JPN) - - 163.33 +1.31 +5.69 +3.6
MS Cyclical (CYC) 529.65 525.83 527.92 +0.30 +52.91 +11.1
MS Consumr (CMR) 495.33 489.82 494.52 +3.87 +48.88 +11.0
MS Hi Tech (MSH) 556.41 547.79 552.87 -0.26 +105.35 +23.5
Pharma (DRG) 632.15 626.09 628.92 -2.60 +95.18 +17.8
Biotech (BTK) 164.28 160.72 163.67 +2.38 +1.25 +0.8
Comp Tech (XCI) 523.40 516.06 518.55 -2.10 +79.56 +18.1
Gold/Silver (XAU) 76.73 74.90 76.29 +1.49 +2.10 +2.8
OTC (XOC) 881.56 869.79 879.12 +3.23 +141.17 +19.1
UtilitY) 308.88 304.45 308.86 +4.39 -1.17 -0.4
Value Line (VLE) 951.89 942.89 951.24 +8.21 +74.40 +8.5
Bank (BKX) 844.09 835.97 842.70 +4.80 +87.35 +11.6
Semicond (SOX) Top 271.09 265.43 267.75 +1.09 +4.12 +1.6
100 (TPX) 1046.94 1037.26 1044.39 +3.59 +134.77 +14.8
Oil Service (OSX) 104.67 100.79 104.67 +1.90 -9.70 -8.5
PSE Tech (PSE) 336.20 332.14 335.05 +1.98 +44.49 +15.3 * Source: The Wall Street Journal, May 29, 1998.
Americatandarnoor’s 500 index, althougetlheraeen remarkable
growth in the stock index futures trading all over the world.
The changes of stock index futures prices are very similar to that of the underlying
stock index. This has been observed by the various studies conducted in this respect.
Comparing the returns on futures indexes and cash indexes, it has been found that there is
very little difference between these two indexes. However, the volatility of the futures indexes
is somewhat greater than the cash stock indexes.
The Standard and Poor’s 500 dex iased on a portfolio of ferent
stocks: 400 industrials, 40 utilities, 20 transportation and 40 financials. The weights of the
stocortfoniven timeflechtock’otaarket capitalizatiotock
price x No. of shares outstanding). The index accounts for about 80 percent of market
capitalization of all the stock listed on New York Stock Exchange.
Specification of Stock Index Futures Contracts
All the stock index futures contracts are traded on the specified stock exchanges. For
mpletandarnoor’uturntahollowinpeications:
291
Standarnoor’uturntpeications:
1. Contract : Standarnoor’s 500 in
2. Exchange : Chicago Mercantile Exchange
3. Quantity : $500 times the S&P 500 index
4. Delivery months : March, June, September, December
5. Delivery specifications : Cash settlement according to the value of the
index at the opening on the Friday after the
last day of trading
6. Minimum price movements : 0.05 index points, or $25 per contract
In India, both the BSE and the NSE have introduced one month contracts on the
sensex and NIFTY respectively. At any point of time, index futures of different maturities
would trade simultaneously on the exchanges. Both BSE and NSE have introduced three
contracts on BSE sensitive index for one, two and three months\maturities. Tick size on BSE
has proposed of 0.1 index point for trading in sensex futures. Every index point for trading of
sensex contract is priced at ` 50,0.1 point would be equivalent to ` 5.
Settlement Procedures or Delivery
Stock index futures are nearly always settled for cash delivery, in contrast to most
futures contracts where physical delivery of an underlying asset is called for. Thus, in the
stock index futures contract, no physical delivery (shares or securities certificates) are
delivered by the seller (short). This means that all the futures positions which are open at the
close of the final trading day of the futures contract are settled by a cash transfer. This amount
is determined by reference to the cash price at the close of trading in the cash market in the
last trading day in the futures contract. Probably the stock index futures were the first to
employ cash settlement as a substitute for physical delivery. The reason being that it is very
difficult to deliver (for example the 500 proportions of various stocks in S&P Index 500) all
the stocks which is more cumbersome and costly than the cash settlement. Further, if any
investor is interested in actual delivery of a stock, he can easily purchase the same from the
cash market. Hence, the settlement in futures index contracts is convenient and less costly.
Further the effect of the cash settlement forces the futures prices of stock index futures to be
identical to the cash stock index at the settlement.
The Stock Index Futures Prices
Stock index futures, like most other financial futures, are also traded in a full carry
market. It means that cost-of-carry model provides (which we have been already discussed
292

in detail in Chapter 4) a virtually complete understanding of the stock index futures pricing.
As per this, futures price must be equal to the spot price plus other cost of carrying charges,
and if the conditions of this model are not fulfilled or violated then arbitrage opportunities
will arise. A trader (or investor) would buy the stocks that underlie the futures contract and
sell the futures and will carry the same until the futures expiration. When the stocks are priced
very low relative to the futures, the cash-and-carry strategy is attractive.
We have already seen in Chapter 4 that the basic cost-of-carry model for a perfect
market with unrestricted short selling is as follows:
Ft.T = St (1 + C)
where FtT futures price at t for delivery at futures time T, S is spot price at time t
(today or current) and C is the percentage cost of carrying the asset from t (current) to T
(futures). This model can be applied to the stock index futures contracts with some little
modifications.
The Cost-of-Carry Model for Stock Index
The cost-of-carry model as described in Eq. (8.1) can be easily applied to the
commodities and such assets where no futures cash income is available. In case of stock index
futures, holding of the stocks gives dividends to the owner, because the companies usually
declare the dividends out of their usual profits to the shareholders. However, each of the
indexes is simply a price index. The value of any index at any time depends solely on the
price of the stocks, not the dividends that the underlying stocks might pay. Since the futures
prices are tied or influenced directly to the index values, the futures prices do not include
dividends.
Since Eq. (8.1) of futures price does not include dividends, thus, it must be adjusted to
include the dividends that would be received between the present and the futures expiration
date of the futures contract. The trader will receive dividends from the stock which will
reduce the value of the stocks. Thus, the cost of carrying is the financing costs for stocks, less
the dividends to be received while the stock is being carried.
Example
Let us explain the above concept with an example. Assume that the present time is
zero and an investor decides to purchase one share of State Bank of India (SBI) for ` 300, as
currently trading in the market. For this he borrows from the market ` 300 to buy this
293

stock. We assume that the SBI will declare after six months 6 percent dividend which will be
further invested the proceeds for another six months at the rate of 10 percent.
Total profit = Pl + 19.80-330
where Pl is current vale of the stock at the expiration.
If the current value of the SBI at expiration is ` 320 then the profit from this
transaction to the investor will be ` 9.80 (320 + 19.80 - 330). From the aforementioned
example, we can generalize to understand the total cash inflows from a cash-and-carry
strategy. The futures prices must be equal to the price of the shares underlying stock index
plus the cost of carrying the stock minus the futures value of the received dividends. So, in the
stock index futures valuation, two considerations are most important like carrying cost and
dividend income to be received on the underlying stocks. Then Eq. (8.1) will be modified as
under:
Cash Flows from carrying Stock
(i) Present period (t) Borrow ` 300 for one year at 10% +300
Buy one share of SBI -300
(ii) Between the period Received dividends at 6% +18
(six months) Invest ` 15 for six months at 10% -18
(iii) Expiration period Collect proceeds from dividends +19.80
(T) (after one year) Sell SBI share for loan payment +Pi
Repayment of debt (principle + interest) -330
Ft.T = St (1 + c) – ∑ i=1n Di(1+ri)
where FtT is stock index futures price at time t for a futures contract which expires at
time T, St is the value of the stocks underlying the stock index at time t, C is the percentage
cost of carrying the stocks from time to the expiration at time T, D1 is the ith dividend and ri is
the interest earned on carrying the ith dividend from the time of receipt until the futures
expiration at time T.
From the Eq. (8.2), we can observe that the cash-and-carry trading opportunity
requires that the futures price must be less than or equal to the cash inflows at the futures
expiration. Similarly, on the other hand, in the reverse cash-and-carry trading opportunity
requires that the futures price must be equal or more than futures cash inflows at the
expiration. Thus, it can be concluded that the futures price of a stock index futures contract
294

must be equal to price of the shares underlying the stock index plus the cost of carrying the
stock to the futures expiration, minus the futures value of the dividends the stock will pay
before expiration. Equation (8.2) is also known at no-arbitrage equation and such trading
strategies are also called index arbitrage.
Theoretical Value or Fair Value for Stock Index Futures
A stock index futures price has its fair value when the entire cost of buying the stock
and carrying them to expiration is covered, i.e., the purchase price of the stocks plus interest,
less the futures value of the dividends. Thus, in the cost-of-carry model the futures price must
equal this entire cost-of-carry.
Example
Calculation of fair or theoretical (or no arbitrage) price. Assume on November 1,
2002, BSE sensitive index is 3200. What is theoretical price on that date for the December,
2002 sensitive index futures contract, which matures on December, 2002? Further assume, the
borrowing cost for short period is 10 percent and expected dividend (return) available
annualized is 4 percent based on historical yields.
Carrying period = 44 days from November 1, 2002 to December 15, 2002
Fair value = Ft.T = St (1 + c) –
Ft.T = St St (Ci - Di)
= 3200 + 3200(0.10 -0.04)
= 3200 + 23.14 = 3223.14
The example observed how to calculate the futures theoretical value BSE index
(sensitive) using actual cash index actual and the actual borrowing and dividend rates. In this
case, the theoretical BSE index value is 3223.14, is greater than the cash index value of 3200
by 23.14 points because the borrowing (financing cost) rate is higher than the dividend yield.
The theoretical value of the futures contract, therefore, is ` 1,61,157 (` 50x 3223.14).
Further if index futures for the above period from now are trading at a level above
3223.14, the investor can buy index and simultaneously sell index futures to lock in the gain
equivalent to the futures price-fair price. However, it should be noted that the cost of
transportation, taxes, margins, etc. are not taken into consideration while calculating the fair
value. Similarly, if index is at a level below the fair’ value, it will trigger severe arbitrage.
This arbitrage between the cash and the futures market will continue till the prices between
both markets get aligned.
295
It should also be further noted that the cost-and-carry model gives an approximate
index about the true futures price (theoretical value). But in the market, the observed price is
an outcome of price discovery mechanism through the forces of demand supply and others.
These forces may change from time to time resulting in difference between the fair price and
actual price of the index futures, and thus, leads to arbitrage opportunities in the market.
However, market forces of arbitrageurs will quickly restore parity when the variation
becomes wide.
Earlier we have observed the calculation of the theoretical value of stock index futures
contract, and then, the arbitrage opportunities available on such contracts. Stock arbitrage, in
reality, may not be as easy and cost-less as explained earlier. There are several reasons
observed for the difference between the actual and theoretical futures prices.
A few important explanations for the observed differences are stated below in brief.
1. We may make error in estimating theoretical futures values due to assumed variables
like dividend yield, interest rate, etc. Further, the cash index value may have been
either wrong or not up-to- date.
2. Trading in the stock markets incurs transaction costs. This involves commission to the
brokers, execution costs and others. These costs result in the different valuation of
futures prices whereas cash prices do not usually based on these.
3. The asset underlying a stock index futures contract is in reality more concept than an
asset. In other words, it is difficult to buy the large number of securities needed in the
proportions required to duplicate exactly a stock index futures.
4. Theported value ohastock inalmose correcue tsaler
quotations. Index quotations are based on the last sale prices of the shares included in
that index, which sometimes may not be the current quotes.
5. All proceeds from the short sales are usually not available to potential arbitrageurs, as
normally, observed in the case of small or retail investors.
6. Sometimes, it is also difficult to borrow the required stock to short an entire cash
portfolio.
7. Finally, it is evident that the theoretical values are calculated on the assumption of
constant dividend yield over the holding period, which sometimes in reality may not
be true. The actual dividend yield usually vary and further, there is a seasonality in
dividends too.
296

Besides the observed relationship of differences between the actual and theoretical
values of stock index futures, there is also consistency found between these, but within the
transaction costs bounds. The difference exceeds two index points on only three days.
However, it has been noted that the stock index arbitrage has been highly successful in
maintaining the theoretical relationship between cash and futures stock index prices.
Fair Futures Prices and No-Arbitrage Bands
As already observed, the fair futures price is based upon arbitrage, and in case of stock
index futures, it would be cash-and-carry arbitrage. It means that the futures price should be
such that there is no arbitrage profit from buying stock (with borrowed money)
anultaneousleluturoweverrbitrag’in wilccur only if it
covers the transaction costs too. The actual futures price can deviate from the fair arbitrage
pressure that tends to prevent deviations of actual futures prices within a range (the no-
arbitrage band) rather than equality with the theoretical prices. In other words, transaction
costs may lead to fair prices to be in band and arbitrage occurs only when the actual futures
price moves outside the no-arbitrage band. This we will see in the following example:
Example
Assume that on November 1, 2002, the BSE Sensex Index is 3000. The three-month
interest rate is 10 percent per annum, and the expected rate of dividend yield over the next
three-months is 6 percent per annum. Calculate the theoretical future price, for a futures
contract maturing in three months time. Further determine an arbitrage profit be made if the
actual futures price were (a) 3050, (b) 3000 and there were no transactions costs. Also
examine if the total transactions costs (Commissions, bid-offer spreads, stamp duty, etc.)
amounted to ` 1000 per ` 1,50,000 (` 50 x 3000) of one futures contract of stock, would
arbitrage profits still be available?
Solution
T - t
Fair Value Ft.T = St St (Ci - Di)
365
The fair futures price will be = ` 3000 + ` 3000 (0.10-0.06)3/12
= `3000+`30=`3030
(a) If the actual futures price were ` 3050 then the futures would be over-valued in the
absence of transactions costs. Thus, a profit is available from a long cash-and-carry
arbitrage which provides buying stock and selling futures. It means there will be
guaranteed profit from the stock and futures of 50 index points (amounting to ` 50
297
x 50 = ` 2500 per ` 1,50,000 of stock and one futures contract). The corresponding
cost-of-carry is 30 index points (30x ` 50 = ` 1500). So there is a net profit of 20 index
points, i.e., ` 1000 (20 x ` 50) in this contract.
(b) If the actual futures price were 3000, the futures would be undervalued, so the stock
should be sold and futures be purchased (short cash and carry). In this contract, there
is neither profit nor loss from the stock and futures position because net cost-of-carry
accrues (30x ` 50 = ` 1500) as profit and is 30 index points (30x ` 50 = ` 1500).
If the total transactions costs were ` 1000, there would be no net profit remaining in
case (a) and only (` 1500— ` 1000) = ` 500 in case of (b).
The futures price has to divide by 20 index points from its fair value before any
arbitrage profits become available. Thus, in the present case, there will be a no-arbitrage band
of 20 points either side of the fair futures price, i.e., ` 3010— ` 3050. Futures prices within
this band do not induce arbitrage since they offer no arbitrage profit.
It should be noted that in the absence of transactions costs, cash-and-carry arbitrage
would keep the actual futures price equals to the fair price because undervalued futures would
be bought and overvalued futures would be sold by the arbitrageurs, hence, pushing the price
up and downs. Further, in the absence of the transaction costs, the cash-and-carry arbitrage
merely keeps the futures price within the no-arbitrage band, and there will be no further
buying or selling by the arbitrageurs. But if the futures price falls below the bottom of the no-
arbitrage band, arbitrageurs would purchase futures until the futures price reaches the bottom
of the band, at which point arbitrage would stop, and vice versa. Once the futures price is
within the band, arbitrage opportunities would cease.
Stock Index Futures as a Portfolio Management Tool
Funds managers or money managers use stock index futures basically for three
purposes; hedging, asset allocation and yield enhancement. These are discussed here in this
section.
Stock Index Futures as a Hedging Tool
First of all, we should know who need the stock index futures for using them as a
hedging tool. All such investors, specifically managing a huge pool of funds or public funds
like pension funds, mutual funds, life insurance companies, investment and finance
companies, banks, endowment funds, public provident funds, etc. would like to reduce their
298

fund’s osure to a fall stock values caused dto untainties about futurmarket developments. This
can be done by selling the shares and repurchasing them at a later time, but this strategy is not
so appropriate because it would incur substantial transaction costs. As a result, funds
managers prefer to hedge with stock index futures instead of altering their portfolio structure,
directly and repeatedly. Hedging is also done through stock index optionuhiile discussed in
other chaptnhoptions’.
Before proceeding to the discussion regarding hedging, one needs to understand some
background on risks relating to stock investments and portfolio management.
There are two types of risks associated with holding a security:
1. Systematic risk
2. Unsystematic risk
All the stocks are exposed to such factors which are not controlled by the firm itself,
these are called market risk factors like changes in the interest rates, inflation rates,
government trade policies, economic activities, political factors, changes in tax laws and so
on. Such risk is termed as market risk or systematic risk.
On the other hand, unsystematic or firm specific risk is related to the particular firm or
an industry. This risk can be diversified by having diversified portfolio of many shares.
Market risk cannot be eliminated by diversification since each of the stock moves with the
market to some degree. Thus, stock index futures can be used to hedge or manage this risk.
Measuring Market Risk
Beta is a measure of the systematic risk. It measures the sensitivity of the scrip (asset)
viis inovemenetinehovarianoy.) between a stock’s
return and the return on the overall market divided by the variance (var) of return on the
market.
The formula of a beta (β) of a security (i) is as under:
Cov (R ,R )
βi =
Var (Rim)
m
where Rm is return on market portfolio (or market return) and Ri is return on the
security (i).
299

Stock betas can be estimated with the regression equation (also called linear
regression line) as follows:
Ri,t = a + b x Rm,t + - ei,t
where Ri,t is observed returns over a period t for stock i, a is the constant return, b is
the estimate of the beta of stocks, ei,t is the usual error term and Rm return on market portfolio
(or market return).
Irroq. (8.3), ibservehahe estimattock’ethows the
value of that stock is likely to change relative to change in the value of the market portfolio
(oarticulatock inlshows thtock’elativolatility.
A portfolio of stocks has its own beta. Individual betas are used to calculate the
portfolio beta. It is weighted average of the betas of the individual scrips in the portfolio
where weights are based on the proportion of investment of scrips in the portfolio. If the value
of a beta is more than one, the stock is more volatile than the market, and if beta is less than
one, then stock will be less volatile than the market. Further detail on this model can be
studied from the CAPM and Sharpe Single Index Model.
The Minimum-Variance Hedge Ratio
As discussed in the preceding chapter, hedging that the hedger is to determine the
appropriate hedge ratio (HR)—which is the ratio of the futures position to the cash position
being hedged.
We have seen that a benchmark ratio is the minimum-variance hedge ratio (HR) or the
value of HR that can be expected to reduce the fluctuations in the total portfolio to the
minimum possible. In this section, we will discuss the determination of HR in the context
ohstock inuturntts’.
Value of hedged portfolio
HR = x Bi
Price of the futures contract
% change in weighted average portfolio price
HR = % change of future index
300
Example
Value of BSE index = 3000
Value of portfolio = 6,08,000
Risk-free interest rate = 10 percent per annum
Dividend yield on index = 6 percent per annum
Beta of the portfolio = 1.5
We assume that a futures contract on the BSE index with four months to maturity is
used to hedge the value of the portfolio over the next three months. Our futures contract is for
delivery of ` 50 times the index.
Calculate the HR from the above information also calculate the gain on short futures
position if index turns out to be 2700 in three months.
Solution
Current futures price of the index:
Ft.T = St St (Ci - Di)
T-t
365
= ` 3000+ ` 3000 (0.10-0.06) 4/12
= ` 3000 + ` 40 = ` 3040
Price of the futures contract = ` 50 x 3040 = ` 1,52,000
Using Eq. (8.4) the HR or number of the futures contracts that should be shorted to hedge
theportfolio is:
6,08,000
HR =
x 1.5 =6
1,52,000
Suppose the index turns out to be 2700 in three months. The futures price will be
= 2700 + 2700(0.10-0.06)1/3
= 2700 + 36 = 2736
The gain from the short futures position is, therefore,
6 x (3040 - 2736) x 50 = ` 91,200
301

In the example, the loss on index is 10 percent. The index pays a dividend of 6 percent
per annum or 1.5 percent per three months. When dividend are taken into account, an investor
in the index would cash. Therefore earn 9 percent in the three-month period. The risk free
interest is approximately 2.5 percent per three months. Since the portfolio has a 0 of 1.5,
expected return of portfolio will be equal to:
= β x (Return on portfolio - Risk free interest rate)
= 1.5 x (Return on index - Risk free interest rate)
Using the formula, the expected return on the portfolio is:
= 2.5 +1.5x(9.0-2.5)]
= 2.5+(-17.25)= 14.75%
The expected value of the portfolio (inclusive of dividends) at the end of the three months is,
therefore,
` 6,08,000x (1-0.1475) = ` 5,18,320
Iollows thahected value ohedger’tion includinhe gain ohedgs:
` 5,18,320 + ` 91,200 = ` 6,09,520
Changing Beta
Sometimes, the stock index futures contracts are used to change the beta of a portfolio
to some value other than zero. For example, we want to reduce to beta of the portfolio from
1.5 to 0.75, then in that situation, the number of the contracts would be changed, and now
they will be 3 instead of 6. In general, to change the beta of the portfolio from β to β where β
> β*, a short position is
Value of hedged portfolio
(β-β*)= Price of the futures contract
Rolling the Hedged Forward
Sometimes, it happens that the expiration date of the hedge is later than the delivery
dates of all the futures contracts that can be used. In this situation, the hedger must then roll
the hedge forward. In other words, it means that closing out one futures contract and
302

taking the same position in a futures contract with a later delivery date. Hence, the hedge can
be rolled forward many times. Consider a company which intends to use a short hedge to
reduce the risk associated with the price to be received for an asset at time T. Assume, if there
are futures contracts 1, 2, 3, n (not all necessary in existence at the present time), the company
can use the following strategy:
Time t = Short futures contract 1
Time t2 =Close out futures contract 1
= Short futures contract 2
Time t3 = Close out futures contract 2
= Short futures contract 3
Time Tn = Close out futures contract (n - 1)
= Short futures contract n
Time T = Close out futures contract n
Let us explain this by an hypothetical example:
Example
Suppose in April 2002 a company realize that it will have 1,00,000 barrels of oil to
sell in June 2003 and it decides to hedge its risk with a hedge ratio of 1.0. The current spot
price is $19. Futures contract are traded for every month of the year up to one year in future,
we suppose that only the first six delivery months have sufficient liquidity to meet the
company’s needCompany, thereforehor100 OctobcontIn September,
it rolls the hedge forward into Marc 2003 contract. In February 2003, it rolls the hedge
forward again into the July 2003 contract. The contract size is 1000 barrels.
Company uses the following strategy to hedge the risk:
April 2002: The company shorts 100 October 2002 contracts.
September 2002: The company closes out the 100 October 2002 contracts.
The company shorts 100 March 2003 contracts.
February 2003: The company closes out the 100 March 2003 contracts.
The company shorts 100 July 2003 contracts.
July 2003: The company closes out the 100 July 2003 contracts.
The company sells 1,00,000 barrels of oil.
303

It is evident from the above that when there is no liquid and futures contract which
matures later than the expiration of the hedge, a strategy known as rolling the hedge forward
may be followed.
This involves entering into a sequence of futures contracts as shown above. Rolling
the hedge will be appropriate if there is a close correlation between changes in the futures
prices and the changes in spot prices.
Asset Allocation by the Funds Managers
The term asset allocation refers to the distribution of portfolio assets among equity
shares, bonds, debentures and other money market instruments. It means that how to divide
funds among broad asset classes like 60 percent in equities and 40 percent in treasury bills is
an asset allocation decision.
Usually it does include changing of the assets from one equity to other equity asset
rather concentrates on asset allocation from equity to debt or treasury bills and /vice versa.
Further asset allocation focuses on the macro level commitment of funds to various asset
classes and the shifting of funds among these major asset classes.
Iften prefble tstock inutures thanghortfolio mix, even
though portfolio managers structure and restructure their portfolio by buying and selling the
erenssutures becausheaperaeen notehaquittock in
and interest rate futures trading cost are less in comparison to the direct trading in stocks.
Let us see this with an example given in Table.
Transaction Costs Associated with Stock versus Stock Futures Index
Particulars Stocks Stock index futures
Average price per share/contract $60 $35
Number of shares/units 2933* 500
Market value of portfolio/contract $1,76,000 $1,76,000
Round-trip commission per share/contract $0.07** $15
Commission cost $205.31 $15
Bid/ask spread costs 0.125 0.05 index point or
index points/share I tick per contract
2933 x 0.125 = 366.33 500 x 0.05 = $25
304

Total transaction cost commission plus
$571.94 $40 bid/ask spread
* The precise number of shares that would equal in portfolio of stock with the average stock
price to the value of one futures contract is 2933.333 ($176000/$60). ** Commission that would be paid by large investment invest
Yield Enhancement
Yiehaneneferhortfotrategoldinsynthetictock
index fund that is capable of earning higher return than a cash stock index fund. A portfolio
consisting of a long position in stock inc.ex futures and treasury bills will produce the same
return (with the same risk) structured as stock portfolio to mirror the stock index underlying
the futures. However, a portfolio of stock index futures and treasury bills (synthetic stock) can
be constructed to outperform the corresponding stock portfolio (higher return with the similar
risk), if stock index futures are correctly priced or their actual value is higher or lower than
their theoretical (fair) value. In this way, with the use of stock index futures, a yield
enhancement strategy be followed to enhance the return on a portfolio.
Speculation and Stock Index Futures
After discussing the case of arbitrage and hedging, let us now consider the speculating
with stock index futures. As we know that basic objective of the speculators is to earn super
profit by going either bullish or bearish in the market. Index futures permits them an ideal
instrument where the vagaries of individual stocks, settlement cycles, etc. do not have so
much of an impact as they do on specific stock. The speculators can select a strategy where
they can have a bullish view and go long on futures. Similarly, they can have a bearish view
and go short in futures.
Earlier before the stock index futures came into existence, the speculators had two
alternatives. Firstly, they can select the liquid stocks which would move with the index so that
they can take a position in them for the expected move. But this move would be too risky.
Secondly, they can select the entire stocks as in the index and trade in all of them. The basic
of liquid stocks may mimic the index to some extent but still individual stock variations will
affect the returns, and moreover, it is too costly with high amount of commission, etc. But
now with the introduction of stock index futures, such limitations mentioned are taken care
of. Now the speculators can take up either long position on the contract, paying a small
margin, and seek to ride the expected trend and vice-versa for the bearish view-sell short
index contract and cover when the index falls lower.
305
Stock Index Futures Trading in Indian Stock Market
As discussed in Chapter 5, SEBI Board accepted the recommendations of Dr. L.C.
Gupta Committee on May 11, 1998 and approved introduction of derivatives trading in India
in the phased manner. The recommendation sequence was stock index futures, index options
and options on stocks. The Board also approved the suggestive bye-laws recommended by the
Committee for regulation and control of derivatives trading in India. As a result, both the
stock exchanges, National Stock Exchange of India (NSE) and Bombay Stock Exchange of
India (BSE) took the initiative to introduce futures trading in India. The brief particulars of
their products are given here as under.
NSE’s N FUX NIFTY)
Thationatocxchangndia introdutures nameNIFTYune
12, 2000. The salient features of this instrument are
1. Name of the instrument is N FUTIDX NIFTY.
2. The underlying index S&P CNX NIFTY (NSE 500).
3. Contract size. The index futures will be quoted as per the underlying asset which
means that it will quote just like the Nifty in points. The value of the contract (contract
size), a multiplier of 200 is applied to the index. It means that the value of a contract
will be (` 200x index value) on that particular date. The multiplier can be thought of as
the market lot for the futures contract. This can be changed from time to time.
4. NSE has introduced three contracts for one month, two months and three months
maturities. These contracts of different maturities may be called near month (one
month), middle month (two months) and far month (three months) contracts. The
month in which the contract will expire is called the contract month, for example,
contract month of April 2003 contract will be April, 2003.
5. Expiry. Each contract would have a specific code for representation purpose on the
system. All these contracts will expire on a specific day of the month and currently
they are fixed for the last Thursday of the month. As soon as the near month contract
expires, middle contract will become near and so on.
6. Tick size/price step. Tick size is the minimum difference between two quotes of
similar nature. Since the index futures would be traded in term of index points, the tick
size is to be defined in points only. The Nifty tick size is ` 0.05 which will be
converted into points.
306

7. Position limits. Present, both types of contracts as for speculation and hedging
purposes are allowed to be traded. However, these are subject to change from time to
time.
8. Trading hours. Trading hours are 10.30 a.m. to 3.30 p.m.
9. Margins. NSE fixes the minimum margin requirements and price limits on daily basis
which are subject to change periodically.
10. Settlement. Position remaining open at the close of business on the last day of trading
are marked-to-market according to the official opening level of the NSE-NIFTY on
the following day. There is daily settlement also on the closing of futures contract.
11. Volumes and open interest. Futures contracts have a unique way of reporting volumes
and it is called open interest. It provides the information about the number of
outstanding/unsettled positions in the market as a whole at a specific point of time. In
the futures market, total long positions would be equal to the total short positions,
hence, only one side of the contracts are counted for determining the open interest
position. Major stock exchanges of the world Imblish the open interest position
regularly
BSE’
The Bombay Stock Exchange introduced stock index futures trading on June 9, 2000
with the name of the instrument as BSX with the underlying BSE Sensitive Index (SENSEX).
Theatures rrts troramithe NSE’s NIFTY inutur
A few important features are given in brief here as under:
1. Date of start June 9, 2000
2. Security name BSX
3. Underlying security BSE Sensitive Index (SENSEX)
4. Contract size Sensex value x 50
5. Tick size 0.1 point of Sensex (equivalent to ` 5)
6. Minimum price fluctuation ` 5
7. Price band Not applicable
8. Expiration months Three months
9. Trading cycle A maximum of three months, the near month,
next month and far month
10. Last trading day/Expiry day Last Thursday of the month or the preceding
trading day.
307
11. Settlement in cash on T + 1 Basis.
12. Final settlement Index closing price on the last trading days
13. Daily settlement price Closing of futures contract price
14. Trading hours 9.30 am to 3.30 pm
15. Margin Up front margin on daily basis.
Crosshedges and Changing Volatilities of an Asset Position
A cross hedge occurs if the characteristics of the cash asset underlying the futures
contract differs from the cash instrument being hedged. A number of factors affect the degree
of a cross hedge for a given position. The extent of a stock portfolio cross hedge is affected by
the relative stock composition and relative stock weights of the cash and futures positions;
any differences in the size between the cash and futures positions also affect the hedge. For a
T-bond futures hedge one must consider the effect of the coupon, the time to maturity of the
cash position, whether the bond possesses default risk, and the relative size o the underlying
cash position. If any of these factors differ from the characteristics of the futures contract or
the cheapest-to-deliver cash bond for pricing the futures, then a cross hedge exists. The extent
of a cross hedge can be measured by the size of the correlation coefficient between the
changes in value of the cash and futures position. The lower the correlation coefficient is the
greater the difference in two positions. When a low correlation exists, the futures contract is
not a good instrument to use for hedging purposes.
Cross hedges arising from some of these characteristics, such as coupon differences,
have a minimal effect on the performance of the hedge when the cash and futures prices still
move nearly in tandem. Cross hedge factors affecting the volatility on the position (e.g., the
maturity of the cash bond) are dealt with by adjusting the number of futures contracts
employed in the hedge (as shown in the next chapter). However, the effect of quality
difference, such as hedging corporate bonds with Treasury bond futures, depends on whether
there is a major change in the perceived risk in the economy during the hedge period, which
would significantly alter the basis. Consequently, the difficulty of overcoming cross hedge
effects depends upon the particular characteristic(s) that differ between the futures and cash
positions, whether the factors remain stable over time, and the economic environment at the
time of the hedge. For example, hedging one currency with the futures contract of another
currency often causes significant cross hedge risk because of the differing economic
conditions in the two countries.
Liquidity also can be an issue in measuring the basis for a given security, since thinly
traded issues often have reported prices that differ from their true prices, especially when
308

the market changes but the thinly traded issue does not trade. Moreover, cash prices typically
are reported in terms of bid prices and ask prices rather than transaction prices, and the
newspaper prices occur at a different time of day than the close of the futures market; both of
these factors affect the apparent stability of the basis.
In reality, most hedges involve some type of a cross hedge risk, since the cash asset
typically differs from the underlying cash instrument priced by the futures contract. The
greater the deviation of any of the factors from the underlying cash instrument, the greater the
basis risk. For example, the effect of a large change in the shape of the term structure needs to
be considered when the maturities of the cash bond and the cheapest to-deliver bond for the
futures contract differ. The creation of the 1-note futures contracts with shorter maturities was
undertaken in order to provide a more appropriate hedging vehicle under these circumstances.
Also note that care must be taken when hedging the prime rate. Because the prime is
an administered rate, it does not usually change in the same manner as market rates; in fact,
the prime rate is slow to react to downward changes in interest rates. Hence, it is sometimes
difficult to hedge the prime in an effective manner, especially over the short term.
A Cross hedge
ABC Mutual Fund holds ` 5 crores in stocks, with the portfolio configured to match the
Xund’oneanager forecasts an increase in volatility in thark which increases the probability of a major market decline. To reduce risk the money manager
sells XYZ 500 futures. Although the XYZ 500 futures do not match the XYZ 100 price
movements exactly, the money manager decides that this type of a cross hedge is the best
strategy to use in this situation.
Date Cash Market Futures Market
Jan 12 Stock portfolio of ` 5 crore, Sell 287 June XYZ 500 futures, with
with the XYZ the XYZ 500 futures = 348.20 for a
100 = 325.09 value of ` 4,99,66,700
April 26 The XYZ 100 declines to 315.82 fora Buy back the XYZ 500 futures at
portfolio 335.25 for a value of ` 4,81,08,375
value of ` 4,85,74,240 = ` 5 crore x
(315.82/325.09)
Chance Loss of ` 14,25,726 Gain of ` 18,58,325 —287 x 500
x (348.20— 335.25)
Net gain: ` 4,32,565
309

The cross hedge generates a gain of ` 4,32,565. The large deviation between the loss
in the cash portfolio and the futures gain shows the relative ineffectiveness of this cross
hedge.
Table shows a cross hedge between a cash portfolio mimicking the XYZ 100 cash
index and the XYZ 500 futures contract. As shown in the example, cross hedges create net
gains or losses that often vary to a greater extent than is the case when the characteristics of
the futures and cash securities are nearly equivalent.
Strategies For Hedging
Hedging typically is associated with reducing risk (Reducing price volatility).
However, those who employ futures markets have different strategies and different goals in
order to implement a hedging programme. Market participants practice four overlapping
strategies:
➢➢ Reduction of risk: the primary use of futures for hedging is to reduce the price
variability associated with the cash asset position. Naive, regression, and duration
methods determine the appropriate number of futures contracts for a hedge position.
The objective of the regression and duration methods is to minimize the risk associated
with a cash position. ➢➢ Selective hedging: hedging only during those time periods when a forecast
determines that the cash position will lose money is called selective hedging. If the
forecasts are correct then risk is minimised during the hedged periods; meanwhile the
asset earns positive returns during the un hedged periods. If the forecasts are incorrect,
then risk is not reduced. Many institutions employ some type of market timing to
decide when to use selective hedging ➢➢ “Speculatinhasis”: when theturnrohedgre a consideration in
whether the hedge will be undertaken, then this approach is equivalent to predicting
the change in the basis during the hedge period. ➢➢ Optimal risk-return hedging: the optimal hedge decision considers both the
reduction in risk and the return from the combine cash-futures position. Such an
optimal position is associated with portfolio analysis.
The above strategies also can be designated as passive or active strategies. A passive
strategy is independent of cash market price/interest rate expectations. Passive strategies
depend on the risk attitude of the hedger and the volatility of the cash markets. Active
strategies require a forecast of future cash price/interest rates for implementation. The
310

forecast helps the money manager decide when and how much of the cash position to hedge.
Thus, an active hedging strategy readjusts the hedging position over time.
Threductioisktrategy listebovassivtrategySelectivedging”
anspeculatinhasisre activtrategoptimaiseturntrategan
be either a passive or active strategy depending on whether the risk attitude of the hedger or
the forecasts of the cash market determine the size of the hedge position.
Avoiding Losses: Sell or Hedge?
A typical question concerning hedging is, “Why should I hedge when I can sell the
casssecrices to dece?t, selhassset irefbome
circumstances. The principal rule for deciding whether to make a transaction in the cash
market or to hedge in the futures market is
Ioan accomplisour goaeffectivelhasarkhmpour
transaction in that market.
Thehiule ihoreffectively.any situationnorhe
following factors cause difficulties if the transaction is completed in the cash market:
➢➢ Liquidity: the cash market for a given asset often is not liquid for large trades. Thus,
the portfolio hedger who sells or buys the cash asset, or the dealer who shorts the asset,
causes a significant price change in that security when liquidity does not exist. There is
no liquidity problems for trades in most (near-term) financial futures contracts.
➢➢ Cost: the commissions and size of the bid-ask spread in the cash market often cause
the cash transaction to be expensive relative to the same transaction in the futures
market. For example, trades in a stock portfolio cost ten times the equivalent trade in
futures. ➢➢ Execution: a futures transaction is initiated much quicker than a cash transaction due
to liquidity reasons. ➢➢ Short selling: a short sale in the cash market typically is expensive.
➢➢ Internal policy or government-regulations: these factors can prevent the desired cash
market transaction. For example, a portfolio manager often is required to have a given
minimum percentage of assets in bonds rather than in cash or short-term securities, or
a financial institution may be prevented from shorting a cash security to obtain an
effective cash market hedge.
311

➢➢ Credit risk: creating a forward or short sale in the cash market often involves an
implicit credit risk on the part of the participants. Futures transactions are completed
with the cleaning house, virtually eliminating the credit risk problem.
So far we have examined some basic principles underlying the practice of hedging.
The next step is to illustrate how these hedges are executed. We shall look at some examples
developed from a variety of economic and financial environments that illustrate several
hedging principles.
Summary
This chapter has introduced the concept of hedging, tools for hedging and how to
devise a hedging Strategy. Hedging, in broadest sense, is the act of protecting oneself against
futures loss. More specifically hedging is regarded as the use of futures transactions to avoid
or reduce price risks in the spot market. Hedging is used in multipurpose concept like (a)
carrying charge hedging, according to this approach, the stockists watch the price spread
between the spot and futures price, and if the spread is such which covers even carrying cost,
then the stockist buy ready stocks, (b) operational hedging which says that hedges use the
futures market for their operations and see the same as substitute for cash or forward
transactions and (c) anticipatory hedging, which is done in anticipation of subsequent sales or
purchases. For example, a farmer might hedge by selling in anticipation of his crop while a
miller might hedge by buying futures in anticipation of subsequent raw material needs.
Perfect hedging is referred to that position which eliminates the total risk. In other words, the
use of futures or forward position to reduce completely the business risk is called perfect
hedge.
The chapter further elaborates the basics of long and short hedges. A short hedge is a
hedge that involves short position in futures contract. In other words, it occurs when a
firm/trader plans to purchase or produce a cash commodity sells futures to hedge the cash
ption. Ienenseeanbhortavinet sold ptiohther
hand, a long hedge (or a buying hedge) involves where a long position is taken in futures
contract. The basic objective here is to prefect itself against a price increase in the underlying
asset prior to purchasing it in either the spot or forward market. Another concept, ‘cross
hedgingrises when hedginorn (maturity) maoatcithutures exption
date, quantity to be hedged may not match with the quantity of futures contract, physical
features of the asset to be hedged may differ from the futures contract itself.
The chapter in next section explains the basis risk and price risk. Basis is the difference
between the cash price and the futures price. When changes in the futures and cash price
312
are not equal, which is normal in practice, then there will be basis risk. Basis risk is defined as
the variance of the basis. The chapter further explains how to devise a hedging strategy and
how to manage the hedging strategy. Devising a hedging strategy involves deciding on the
futures contract, hedge ratio concept, estimating the hedge ratio and deciding about the
hedging objectives.
The last section of the chapter discusses the management of hedge position which
includes (a) monitoring the hedge, (b) adjustments to the hedge and hedge evaluation and
monitoring the hedge which includes, information of the current size of the cash position
being hedged, changes in its magnitude since the inception of hedge, the information
regarding the size of futures position and so on.
This chapter on stock index futures has highlighted in general the concept of stock
index futures. A stock index or stock market index is a portfolio consisting of a collection of
different stocks. In other words, a stock index is just like a portfolio of different securities
proportion traded on a particular stock exchange like NIFTY S & P CNX traded on NSE. The
S&P 500 index traded on NYSE, New York etc. A stock index represents the change in the
value of set of stocks which constitutes the index.
A stock index futures contract in simple terms is futures contract to buy or sell the
face value of a stock index. The most actively traded index is the American Standard &
Poor’s 500 index FTSoonndex. Furthrioupeicationtock
index futures contracts which include contract specification, exchange, quantity, delivery
months, delivery specifications and minimum price movements have been stated.
In Section 8.3.2, the chapter explains the settlement procedure or delivery mechanism
of stock index futures. Stock index futures are normally settled for cash delivery in contrast to
most futures contracts where physical delivery of an underlying asset is called for. Then, in
stock index futures contract, no physical delivery (shares or securities certificates) are
delivered by the seller.
The chapter also explains the pricing of stock index futures which also like other most
financial futures trade in full carry market. It means that cost-of-carry model provides
virtually complete understanding of the stock index futures pricing. As per this, futures price
must be equal to the spot price plus other of carrying charges, and if the conditions of this
model are not fulfilled then arbitrage opportunities will arise.
A trader or investor would buy the stocks that underlie the futures contract and sell the
futures and will carry the same until the futures expiration. When the stocks are priced very
low relative to the futures, the cash-and carry-strategy is attractive. Theoretical value
313
or fair price/value for stock index futures is where the entire cost of buying the stock and
carrying them to expiration is covered. It means fair value will be price of the stock plus
interest less the futures value of the dividends.
There are various observations between actual and theoretical futures prices of stock
index futures which may be due to error in estimating theoretical futures valued with assumed
variables, like dividend yield, interest rate, etc. Further cash index value may have been either
wrong or not up-to-date. Second is that trading in the stock markets incurs transaction cost.
This involves commission to the brokers, execution costs and others.
The chapter further discuss about the fair or theoretical price and no-arbitrage bands.
The futures price should be such that there is no arbitrage profit from buying stock and
simultaneously selling futures.
Howeverrbitrager’in wilccur only if it coverhransactiots too.
The actual futures price can deviate from the fair arbitrage pressure that tends to prevent
deviations of actual futures prices within a range, rather than ensuring equality with the
theoretical price.
Stock index futures can be used as a portfolio management tool by the funds managers
or the money managers basically for three purposes: (i) hedging (ii) asset allocation, and
(iii) for yield enhancement. Stock index as hedging tool can be used by fund managers, who
has a pool of public funds, like pension funds, mutual funds, insurance companies, investment
and finance companies to reduce their funds exposure to a fall in stock values caused due to
uncertainties about future market developments. This can be done by selling the shares and
repurchasing them at a later time. Before taking a position, one needs to understand the types
of risk associated with holding a security, namely, systematic risk and unsystematic risk.
The chapter further discusses about the speculation and stock index futures. The basic
objective of speculators is to earn super profit by going bullish or bearish in the market. Index
futures permit them an ideal instrument where the vagaries of individual stocks and settlement
as they do on specific stock. The speculators select a strategy where they can have a bullish
view and go long on futures. Similarly, they can have a bearish view and go short on futures.
Stock index futures trading in Indian stock market started on BSE (Index) at Bombay
Stock Exchange and NSE (National Stock Exchange) with their various specifications like
expiry date, price stop, position limits, trading hours and so on.
314

Solved Problems
1. It is February 15 and a company expects to borrow ` 20 crore for 3 month on April 15.
The spot three-month interest rates is 12 p.a., the June three-month rupee fu-tures
price is 88, the coefficient of correlation between three-months interest rate changes
and changes in the prices of futures maturing 2 months later is 0.95, the standard
deviation of spot 3-month interest rate changes is 2, whereas the stan-dard deviation of
3-month interest rate futures prices is 2.5 (for futures maturing in onthsim
Design a hedge. What sources of possible hedge imperfections are present?
Solution
The basic hedge would involve dividing the exposure by the size by the size of the futures
contract and selling the resulting number of futures contracts:
` 20 crore/` 0.5 crore = 40 contracts
This number needs to be adjusted for relative volatility:
S.D of spot rate
40 x correlation coefficient x S.D of spot prices
40 x 0.95 x (2/5) = 30.4 contracts.
This number should either be tailed or adjusted for variation margin leverage. If the
latter approach is taken, then the previous number of contracts is reduced to
30.4 x (1/1.03) x (1.01)
Where 1/1.03 offsets interest on variation margin for the 3 month beginning 15 April
and 1/1.01 offsets interest on variation margin prior to April 15 (making the simplifying
assumption of a constant rate of receipt or payment of variation margin). The hedge would
initially sell either future contract.
Source of hedge imperfections include basis risk, the possible unreliability of
historical statistics as guides to futures correlation and standard deviations, the inability to
trade fraction of contracts, change in interest rates and the uncertainty as to the timing of
variation cash flows. Tailing is more accurate than using variation margin leverage.
315

2. (a) A finance manager needs to borrow ` 10 crore for 3 months. It is May 20 and the
money is to be borrowed on August 1. How can the finance manager hedge
against a rise in interest rates using futures? (Assume ` 25 per index point).
(b) If euro dollar interest rates rise from 6 p.a. to 7% p.a. between May 20 and
August 1, what is the loss? If futures prices fell from 93.80 to 92.90 during the
same period, how much futures profit would there be from the hedging strategy
adopted in part (a)?
(c) How would the answers to (a) and (b) change if the money was to be borrowed
for a year?
Solution
(a) Sell September 10 euro dollar interest rate futures contracts.
(b) (i) 1% on ` 10 crore over 3 months 0.01 x ` 10 crore x 0.25 = ` 2,50,000
(ii) 90 ticks profit on each of 10 futures contracts at ` 25 per tick
90 x 10 x ` 25 = ` 22,500
(c) The best hedge would be a strip hedge involving September 10, December 10, March
10 and June 10 futures contracts. The loss due to the interest rate rise would be 4 times
as much, i.e. ` 10,00,000. If all futures prices fell by 90 ticks, then the total profit from
the futures would be ` 22,500 x 4 = ` 90,000.
3. An investor has the following portfolio:
Number of Shares Share Price (` ) Share Beta
Andhra Auto 10,000 30 0.9
Bombay Cement 15,000 12 1.2
Calcutta Cotton 12,000 25 1.5
Delhi Tax 20,000 40 0.6
It is 15th February and the March ABC 100 future price is ` 300.
(a) How can the investor hedge the portfolio, with futures? (Assume ` 25 per index point).
(b) Whatorhedhe effectivenesheasureaken in (a)? Ans:
316
Solution
Calculate the market exposure of the portfolio by summing the marlet exposures of in
dividend stocks (market exposure = numbeF of shares x share price x beta):
10,000 x ` 30 x 0.9 = ` 2,70,000
15,000 x ` 12 x 1.2 = ` 2,16,000
12,000 x ` 25 x 1.5 = ` 4,50,000
20,000 x ` 40 x 0.6 = ` 4,80,000
` 14,16,000
The Total market exposure in ` 14,16,000. The market exposure provided by one future
contract is:
300 x ` 25 = ` 7,500
Hedging the portfolio with futures would involve selling:
` 14,16,000 / ` 7,500
= 18.88 contracts. Since futures contracts are indivisible, this would indicate 18 contracts.
(b) Factors that could reduce hedge effectiveness include basis risk, the indivisibility of
contracts, instability of beta and the presence of firm - or sector - specific risk (i.e.
non-systematic risk).
4. (a) A finance manager needs to borrow ` 4 Crore for 3 month. It is May 20 and the
money is to be borrowed on August 1. How can the finance manager hedge against
a rise in interest rates using futures?
(b) If euro-dollar interest rates rise from 6% p.a. to 7% p.a. between May 20 and
August, what is the loss? If futures prices fell from 93.80 to 92.90 during the same
period, how much futures profit would there be from the hedging strategy adopted in
part (a)? (Assume ` 25 per index point).
Solution
(a) Sell September 10 euro-dollar interest rate futures contracts.
(b) (i) 1% on ` 4 crore over 3 months.
0.01 x ` 4,00,00,000 x 0.25 = ` 1,00,000.
317

(ii) 90 ticks profit on each of 10 futures contracts at ` 25 per tick:
90 x 10 x ` 25 = ` 22,500.
Self Assessment Questions
1. Explain what is meant by basis risk and price risk when futures contracts are used for
hedging.
2. What do you understand by hedging? Discuss with suitable examples.
3. Discuss various concepts of hedging, with suitable examples.
4. What do you understand by perfect hedging model? Discuss various conditions that
must be fulfilled before a perfect hedge is possible. Also explain how a perfect hedge
works.
5. What do you understand by long hedge? Discuss with suitable example. Also discuss
the situations which make a hedge to cross hedge.
6. Write a detailed note on devising a hedging strategy.
7. Write note on the following with the help of suitable data
a. Basis risk
b. Price risk
8. What is asset-liability hedge? Explain with suitable example.
9. Explain the various steps taken in devising a hedging strategy. Also explain the effect
of hedging objectives in this respect.
10. Write short notes on:
a. Hedging objectives
b. Management of hedging
c. Hedging effectiveness
11. Critically examine the relationship between basis risk and hedging.
****
318

UNIT - V
Unit Structure
Lesson 5.1 - Financial Derivatives Markets in India
Lesson 5.2 - Benefits of Derivatives in India
Learning Objectives
After reading this chapter, students should
➢➢ Understand the meaning of financial derivatives. ➢➢ Understand the need of derivatives.
➢➢ Know about how financial derivatives evolved in India.
➢➢ Know about major recommendations of Dr. L.C. Gupta Committee on derivatives.
➢➢ Understand the various concepts involved in the various recommendations made by
Dr. L.C. Gupta Committee on derivatives.
➢➢ Understand trading mechanism at National Stock Exchange (NSE) and Bombay
Stock Exchange (BSE).
➢➢ Be aware about the eligibility of the stocks for derivatives trading in India. ➢➢ Understand the emerging structure of derivatives market in India.
➢➢ Know about the problems and prospects of financial derivatives in India.
➢➢ Know about the weaknesses of Indian stock market
Lesson 5.1 - Financial Derivatives Markets in India
Introduction
The individuals and the corporate sector units are freely using derivatives, also
popularly known as future market instruments, in most of the developed countries of the
world td manage different risks by the individuals and the corporate sector units. Emerged in
1970s, the derivatives markets have seen exponential growth and trading volumes have
319

nearly doubled in every three years, making it a multi- trillion dollar business market. The
future markets in various segments have developed so much that now one cannot think of the
existence of financial markets without the derivatives instruments. In other words, the
derivatives markets whether belonging to commodities or financials have become, today, an
integral part of the financial system of a country.
The Indian financial markets indeed waited for too long for derivatives trading to
emerge. The phase of waiting is over. The statutory hurdles have been cleared. Regulatory
issues have been sorted out. Stock exchanges are gearing up for derivatives. Mutual funds,
foreign institutional investors, financial institutions, banks, insurance companies, investment
companies, pension funds and other investors who are deprived of hedging opportunities now
find the derivatives market to bank on. They would find very soon all other important
derivatives instruments in the Indian financial markets to manage their portfolios and
associated risks.
Need for Derivatives
Since 1991, due to liberalization of economic policy, the Indian economy has entered
an era in which Indian companies cannot ignore global markets. Before the nineties, prices of
many commodities, metals and other assets were controlled. Others, which were not
controlled, were largely based on regulated prices of inputs. As such there was limited
uncertainty, and hence, limited volatility of prices. But after 1991, starting the process of
deregulation, prices of most commodities is decontrolled. It has also resulted in partly
deregulating the exchange rates, removing the trade controls, reducing the interest rates,
making major changes for the capital market entry of foreign institutional investors,
introducing market based pricing of government securities, etc. All these measures have
increased the volatility of prices of various goods and services in India to producers and
consumers alike. Further, market determined exchange rates and interest rates also created
volatility and instability in portfolio values and securities prices. Hence, hedging activities
through various derivatives emerged to different risks.
Futuresfferiseductioechanism the farmers, producers,
exporters, importers, investors, bankers, trader, etc. which are essential for any country.
Ihordlareenspan, Chairmahe US FederaeservoardThrray
of derivative products that has been developed in recent years has enhanced economic
efficiency. The economic function of these contracts is to allow risks that formerly had been
combined to be unbundled and transferred to those most willing to assume and manage eacisk
componenevelopmenutures markets in many countras contributed
significantly in terms of invisible earnings in the balance of payments, through the fees and
320

other charges paid by the foreigners for using the markets. Further, economic progress of any
country, today, much depends upon the service sector as on agriculture or industry. Services
are now backbone of the economy of the future. India has already crossed the roads of
revolution in industry and agriculture sector and has allowed the same now in services like
financial futures. India has all the infrastructure facilities and potential exists for the whole
spectrum of financial futures trading in various financial derivatives like stock market indices,
treasury bills, gilt-edged securities, foreign currencies, cost of living index, stock market
index, etc. For all these reasons, there is a major potential for the growth of financial
derivatives markets in India.
Evolution of Derivatives in India
Commodituturesg in India watiated lonacoweverhe
1960s marked a period of great decline in futures trading. Market after market was closed
usuallecausferent commoditrcreases werttributepeculation
on these markets. Accordingly, the Central Government imposed the ban on trading in
derivatives in 1969 under a notification issue. The late 1990s shows this signs of opposite
trends—a large scale revival of futures markets in India, and hence, the Central Government
revoked the ban on futures trading in October, 1995, The Civil Supplies Ministry agreed in
principle for starting of futures trading in Basmati rice, further, in 1996 the Government
granted permission to the Indian Pepper and Spice Trade Association to convert its Pepper
Futures Exchange into an International Pepper Exchange. As such, on November 17, 1997,
India’irst internationauturchangochinowhndiepper anp Trade Associationternationaommoditxchange (IPSTA-ICE) was established.
Similarly, the Cochin Oil Millers Association, in June 1996, demanded the
introduction of futures trading in coconut oils. The Central Minister for Agriculture
announced in June 1996 that he was in favour of introduction of futures trading both domestic
and international. Further, a new coffee futures exchange (The Coffee Futures Exchange of
India) is being started at Bangalore. In August, 1997, the Central Government proposed that
Indian companies with commodity price exposures should be allowed to use foreign futures
and option markets. The trend is not confined to the commodity markets alone, it has initiated
in financial futures too.
The Reserve Bank of India set up the Sodhani Expert Group which recommended
major liberalization of the forward exchange market and had urged the setting up of rupee-
based derivatives in financial instruments. The RBI accepted several of its recommendations
in August, 1996. A landmark step taken in this regard when the Securities and Exchange
Board of India (SEBI) appointed a Committee named the Dr. L.C. Gupta Committee (LCGC
321

) by its resolution, dated November 18, 1996 in order to develop appropriate regulatory
framework for ivativtg IndiWhithe Cottee’s focus was on equity
derivatives but it had maintained a broad perspective of derivatives in general.
The Board of SEBI, on May 11, 1998, accepted the recommendations of the Dr. L.C.
Gupta Committee and approved introduction of derivatives trading in India in the phased
manner. The recommendation sequence is stock index futures, index options and optiontocks.
ThoarlspprovehSuggestivyawsecommendehe
Committee for regulation and control of trading and settlement of derivatives contracts in
India. Subsequently, the SEBI appointed J.R. Verma Committee to look into the operational
aspects of derivatives markets. To remove the road-block of non-recognition of derivatives as
securities under Securities Contract Regulation Act, the Securities Law (Amendment) Bill,
1999 was introduced to bring about the much needed changes. Accordingly, in December,
herameworaeen approvenDerivativesaverdehtatus oSecurit’oweverue ttampioormalities,
thaunchn Futures was delayed by more than two years. In June, 2000, the National Stock Exchange and
the Bombay Stock Exchange started stock index based futures trading in India. Further, the
growth of this market did not take off as anticipated. This is mainly attributed to the low
awareness about the product and mechanism among the market players and investors. The
volumes, however, are gradually picking up due to active interest of the institutional
investors.
Major Recommendations of Dr. L.C. Gupta Committee
Before discussing the emerging structure of derivatives markets in India, let us have a
brief view of the important recommendations made by the Dr. L.C. Gupta Committee on the
introduction of derivatives markets in India. These are as under:
1. The Committee is strongly of the view that there is urgent need of introducing of
financial derivatives to facilitate market development and hedging in a most cost-
efficient way against market risk by the participants such as mutual funds and other
investment institutions.
2. There is need for equity derivatives, interest rate derivatives and currency derivatives.
3. Futures trading through derivatives should be introduced in phased manner starting
with stock index futures, which will be followed by options on index and later
options on stocks. It will enhance the efficiency and liquidity of cash markets in
equities through arbitrage process.
322

4. There should be two-level regulation (regulatory framework for derivatives trading),
i.e., exchange level and SEBI level. Further, there must be considerable emphasis on
self regulatory competence of derivative exchanges under the overall supervision and
guidance of SEBI.
5. The derivative trading should be initiated on a separate segment of existing stock
exchanges having an independent governing council. The number of the trading
members will be limited to 40 percent of the total number. The Chairman of the
governing council will not be permitted to trade on any of the stock exchanges.
6. The settlement of derivatives will be through an independent clearing Corporation/
Clearing house, which will become counter-party for all trades or alternatively
guarantees the settlement of all trades. The clearing corporation will have adequate
risk containment measures and will collect margins through EFT.
7. The derivatives exchange will have on-line-trading and adequate surveillance
systems. It will disseminate trade and price information on real time basis through
two information vending networks. It should inspect 100 percent of members every
year.
8. There will be complete segregation of client money at the level of trading/clearing
member and even at the level of clearing corporation.
9. The trading and clearing member will have stringent eligibility conditions. At least
two persons should have passed the certification programme approved by the SEBI.
10. The clearing members should deposit minimum ` 50 lakh with clearing corporation
and should have a net worth of ` 3 crore.
11. Removal of the regulatory prohibition on the use of derivatives by mutual funds
while making the trustees responsible to restrict the use of derivatives by mutual
funds only to hedging and portfolio balancing and not for specification.
12. The operations of the cash market on which the derivatives market will be based,
needed improvement in many respects.
13. Creation of a Derivation Cell, a Derivative Advisory Committee, and Economic
Research Wing by SEBI.
14. Declaratioivatives asecurit’ unectiohnd suitable amendments in the notification issued by the Central Government in June,
1969 under Section 16 of the SCRA.
The SEBI Board approved the suggested Bye-Laws recommended by the L.C. Gupta
Committee for regulation and control of trading and settlement of derivatives contracts.
323
Explanatioome Importanesed in the Cottee’econdations
Derivatives Concept
ivativroduct, oplivative’harply distinsherohe
underlying cash asset. Cash asset is the asset which is bought or sold in the cash market
oormal deliverermus, therivative’ inates thaao inent valueeanhalue is entirelivedrohe value
ohassset. Thain
point is that derivatives are forward or futures contracts, i.e., contracts for delivery and
payment on a4pecified future date. They are essentially to facilitate hedging of price risk of
thasssharket term, theralleRisanagemenools’.
Financial Derivatives – Types
Though the Committee was mainly concerned with equity based derivatives but it has
tried to examine the need for derivatives in a broad perspective for creating a better
understanding and showing inter-relationship.
Broadly, there are three kinds of price risk exposed to a financial transaction, viz.
1. Exchange rate risk, a position arisen in a foreign currency transaction like import,
export, foreign loans, foreign investment, rendering foreign services, etc.
2. Interest rate risk, as in the case of fixed-income securities, like treasury bond holdings
whose market price could fall heavily if interest rates shot up
3. Equit’, ‘markrisk’lso called ‘tematriskisk wh cannot be diveried
away cause the stock market as a whole may go up or down from time to time
The above said classification indicates towards the emergence of three types of
financial derivatives namely currency futures, interest rate futures and equity futures. As both
forward contracts and futures contracts can be used for hedging, but the Committee favours
the introduction of futures wherever possible.
Forward contracts are presently being used in India to provide forward cover against
exchange rate risk. Currency and interest rate futures lie in the sphere of Reserve Bank of
India (RBI).
The Dr. L.C. Gupta Committee recognizes that the basic principles underlying the
organization, control and regulation of markets of all kinds of financial futures are the more
or less same and that the trading infrastructure may be common or separate, partially or
324

wholly. The Committee is of further opinion that there must be a formal mechanism for
coordination between SEBI and RBI in respect of financial derivatives markets so that all
kinds of overlapping of jurisdiction in respect of trading mechanism, be removed.
Financial derivatives markets in India have been developed so far in three important
instruments like equity, interest and currency. First one is regulated by the SEBI, whereas
other two are controlled by the RBI. The markets of these instruments are in their preliminary
stage.
Equity Derivatives
Dr. L.C. Gupta Committee considered in its study both types of equity like stock index
derivatives and individual stocks derivatives. At the international level, stock index derivative
is more popular than the individual stock. The Committee found in its survey that index
futures are more preferable than individual stock from the respondents. The order of over-all
preference in India as per the survey of the Committee, was as follows: (i) Stock index
futures, (ii) Stock index options, (iii) Individual stock options and (iv) Individual stock
futures.
Basic Reasons for the Preference of Stock Index Futures
Not only in India, in other countries too, is stock index futures most popular financial
derivatives due to the following reasons:
1. Institutional investors and other large equity holders prefer the most this instrument in
terms of portfolio hedging purpose.
2. Stock index futures are the most cost-efficient hedging device whereas hedging
through individual stock futures is costlier as observed in other countries.
3. Stock index futures cannot be easily manipulated whereas individual stock price can
be exploited more easily in India it is rather easier to play this game as witnessed in
the past scams.
4. This is in fact that due to a limited supply of an individual stock, supply can easily be
cornered even in large companies in India like Reliance Industries, State Bank of
India, etc. The Management of these companies has complained many times about
their share prices being manipulated by some interested parties. On the other hand, the
supply of stock index futures is unlimited, and hence, the possibility of cornering is
ruled out. In fact, the manipulation of stock index futures can be possible only of the
cash prices of each component securities in the index be influenced, which is rare and
not so high.
325

5. It is observed from the experiences of other countries that stock index futures are more
liquid, more popular and favourable than individual stock futures. The same is also
witnessed by the L.C. Gupta Committee in its survey from the responses of the
respondents.
6. Since, stock index futures consists of many securities, so being an average stock, is
much less volatile than individual stock price. Further, it implies much lower capital
adequacy and margin requirements in comparison of individual stock futures.
7. In case of stock index futures trading, there is always clearing house guarantee, so the
chances of the clearing house going to be bankrupt is very rare, and hence, it is less
risky.
8. Another important reason is that in case of individual stocks, the outstanding positions
are settled normally against physical delivery of the shares. Hence, it is necessary that
futures and cash prices remained firmly tied to each other. However, in case of stock
index futures, the physical delivery is almost impractical, and they are settled in cash
all over the world on the premise that index value, as independently derived from the
cash market, is safely accepted as the settlement price.
9. Lastly, it is also seen that regulatory complexity is much less in the case of stock index
futures in comparison to other kinds of equity derivatives.
In brief, it is observed that the stock index futures are more safer, popular and
attractive derivative instrument than the individuals stock. Even in the US market, the
regulatory framework does not allow use of futures on the individual stocks. Further only
very few countries of world, say one or two, have futures trading on individual stock.
Strengthening of Cash Market
The Dr. L.C. Gupta Committee observed that for successful introduction of futures
market in any country, there must be a strong cash market because derivatives extract their
value from the cash asset. The constant feedback between these two markets through
arbitrage will keep these markets in alignment with each other. The Committee noted certain
weaknesses of the Indian equities markets which should be taken care for success of the
futures trading in India. A few important weaknesses observed are as under:
Mixing of Cash and Forward Transactions
1. There is queer mixture of cash and future transactions in the Indian stock markets. For
example, cash transactions (involving delivery), in most active scripts, deliveries
326
are just around 5 per cent of the trading volume whereas in many others, it is just, 20-
30 percent. In fact, the dominant cash transactions are the non-delivery which are the
equivalent of futures/forward transactions.
2. It is further noted that the above said mixed system (cash-cum-carry forward) is not
very sound for futures trading because (i) no transparency in the carry forward system,
(ii) the influence of fundamental factors is not so strong due to dominance of short
term speculation and (iii) creating a future market on such basis may have the effect of
compounding the existing weaknesses.
3. The Committee is of the view that there must be separation between cash market and
futures market. It will promote the markets economic efficiency. This has led to the
adoption of the rolling settlement system because in this way, cash market will
function as genuine cash markets but no carry forward. Even futures market does not
permit carry forward from one settlement to another in the way practiced in India.
4. The trading in Indian stock market was shifted to rolling settlement recently where
alwapha sizeoetteny deliveryut in India, ‘squaring’
business (i.e. offsetting of buying and selling transactions within the settlement) is
accounted for in bulk which is not appropriate for futures trading.
Differences in Trading Cycles Among Stock Exchanges
1. Indian stock exchanges, now, most of them, have a weekly trading cycle but the cycles
are not uniform. For example, NSE has from Wednesday to Tuesday and BSE has
from Monday to Friday. Due to difference in trading cycles, the brokers who have
membership in both the exchanges can easily go on circulating their trades from one
exchange to the other without ever having to delivery. Such situation is a complete
travesty of the cash market and an abuse to the stock market system.
2. It seems that in Indian stock markets, the different trading cycles have been kept with
a vested interest in order to deliberately generate arbitrage opportunities, it is seen that
due to this, the prices for the same securities on two (NSE and BSE) stock exchanges
differ from 0.5 to 1.5 percent even it is larger on expiration days. The Committee feels
that the different cycles serving the interest of only speculators and not of genuine
investors. Even it is not good for market development and futures trading.
3. It is also noted, that the prices of various securities on both exchanges (NSE and
BSE), sometimes are not the same. As a result, the value of the stock indices on both
327

the exchanges will not be same, if computed separately from the NSE and BSE prices.
This will create a problem in valuation of future market stock.
4. The Committee also noted that for a successful future trading, a coordinated but pro-
competitive nationwide market system be achieved. So it is suggested that before
implementing a uniform trading cycle system among all exchanges, till such time the
rolling settlement system can be adopted. This system will provide ‘a sound and
reliable basis for futures trading in India.
Weakness of Stock Exchange Administrative Machinery
The Dr. L.C. Gupta Committee members were of the strong opinion that for
successful derivatives trading on the stock exchanges, there must be stringent monitoring
norms and match higher standard of discipline, than in the present, be maintained. Though the
SEBI has already made a good efforts but much more still is to be done specifically in the
controlling of trading members.
Inadequate Depository System
The Committee is of the view that all such securities which are composing in stock
index and used for stock index futures, should necessarily be in depository mode. As
observed earlier, settlement problems of the cash market may weaken the arbitrage process by
making it risky and costly. Since, index based derivatives trading does not itself involve
deliveries, it will increase the arbitrage trading between cash and index derivatives markets.
The arbitrage process keeps the two markets in alignment. Thus, due to this reason, it is
essential for successful futures trading that all the scripts of the particular stock index futures
must be in the depository mode. Hence, depository scripts in India should be enhanced.
The Committee has no doubt that the creation of futures markets by introducing the
financial derivatives, including equity futures, currency futures and interest rate futures would
be a major step towards the further growth and development of the Indian financial markets
provided that the trading must be cost-efficient and risk hedging facilities.
****
328
Lesson 5.2 - Benefits of Derivatives in India
Benefits of Derivatives in India
During December, 1995, the NSE applied to the SEBI for permission to undertake
trading in stock index futures. Later SEBI appointed the Dr. L.C. Gupta Committee, which
conducted a survey amongst market participants and observed an overwhelming interest in
stock index futures, followed by other derivatives products. The LCGC recommended
derivatives trading in the stock exchanges in a phased manner. It is in this context SEBI
permitted both NSE and BSE in the year 2000 to commence trading in stock index futures.
Thtion, thereforeecomes relevanharhenefits og in Derivatives for the country and in particular for choosing stock index futures as the first preferred
product?
Following are some benefits of derivatives
1. India’inanciaarket system wiltronglenefirom smoothlunctiog
index derivatives markets.
2. Internationally, the launch of derivatives has been associated with substantial
improvements in market quality on the underlying equity market. Liquidity and
markfcndia’quitarket will improvnce thivatives
commence trading.
3. Many risks in the financial markets can be eliminated by diversification. Index
derivatives are special in so far as they can be used by the investors to protect
themselves from the one risk in the equity market that cannot be diversified away, i.e.,
a fall in the market index. Once the investors use index derivatives, they will stiffer
less when fluctuations in the market index take place.
4. Foreign investors coming into India would be more comfortable if the hedging
vehicles routinely used by them worldwide are available to them.
5. The launch of derivatives is a logical next step in the development of human capital in
India. Skills in the financial sector have grown tremendously in the last few years.
Thanks to the structural changes in the market, the economy is now ripe for
derivatives as the next area for addition of skills.
329

Categories of Derivatives Traded in India
1. Commodities futures for coffee, oil seeds, and oil, gold, silver, pepper, cotton, jute and
jute goods are traded in the commodities futures. Forward Markets Commission
regulates the trading of commodities futures.
2. Index futures based on Sensex and NIFTY index are also traded under the supervision
of Securities and Exchange Board of India (SEBI).
3. The RBaermitted banks, ancianstitutions (F1’anrimareas
(PD’s) to enttorward ratgreemenAterest rattvar
to facilitate hedging of interest rate risk and ensuring orderly development of the
derivatives market.
4. The National Stock Exchange (NSE) became the first exchange to launch trading in
options on individual securities. Trading in options on individual securities
commenced from July, 2001.
5. Options contracts are American style and cash settled and are available in about 40
securities Stipulated by the Securities and Exchange Board of India.
6. The NSE commenced trading in futures on individual securities on November 9, 2001.
The futures contracts are available in about 31 securities stipulated by SEBI. The BSE
also started trading in stock options and futures (both Index and Stocks) around at the
same time as the NSE.
7. The National Stock Exchange commenced trading in interest rate future on June 2003.
Interest rate futures contracts are available on 91-day 1-bills, 10-year bonds and 10-
year zero coupon bonds as specified by the SEBJ.
8. Table Calendar of Introduction of Derivatives Products in Indian Financial Markets
Calendar of Introduction of Derivatives Products in Indian Financial Markets
OTC Exchange traded
➢➢ 1980s—Currency forwards ➢➢ June, 2000—Equity index futures
➢➢ 1997—Long term foreign currency- rupee ➢➢ June, 2001—Equity index option
swaps
➢➢ July, 1999—Interest rate swaps and FRAs. ➢➢ July, 2001—Stock option
➢➢ July, 2003—FC-rupee options ➢➢ June, 2003—Interest rate futures
Source: www.derivativesportal.com
330

Financial Derivatives in India: A Chronology
Date Progress
14 December, 1995 NSE asked SEBI for permission to trade futures
18 November, 1996
SEBI setup L.C. Gupta Committee to draft a policy framework for
index futures
11 May, 1998 L.C. Gupta Committee submitted report
7 July, 1999 RBI gave permission for OTC forward rate agreement (FRAs) and
interest rate swaps
24 May, 2000 SIMES chose NIFTY for trading futures and options on an Indian
index
25 May, 2000 SEBI gave permission to NSE and BSE to do index futures trading
9 June, 2000 Trading of BSE sensex futures commenced at BSE
12 June, 2000 Trading of NIFTY futures commenced at NSE
31 August, 2000 Trading of futures and options on NIFTY to commence at SIMES
July, 2001 Trading on equity futures commenced at NSE on 31 securities
June, 2003 Trading on interest rate futures commenced at NSE
July, 2003 Trading on FC-rupee options started
Derivatives Trading at NSE/BSE
The most notable of development in the history of secondary segment of the Indian
stock market is the commencement of derivatives trading in June, 2000. The SEBI approved
derivatives trading based on futures contracts at National Stock Exchange (NSE) and Bombay
Stock Exchange (BSE) in accordance with the rules/bye-laws and regulations of the stock
exchanges. To begin with, the SEBI permitted equity derivatives named stock index futures.
The BSE introduced on 9 June, 2000 stock index futures based on the sensitive Index (also
called SENSEX comprising 30 scripts) named BSX, and NSE started on June 12 2000 stock
index future based on its index S&P CNX NIFTY (comprised 50 scripts) in the name of N
FUTIDX NIFTY. Further details of these are given in Table.
Salient Features of Index Futures Contracts at BSE and NSE
Sl. No Items BSE NSE
1 Date of introduction June 9, 2000 June 12, 2000
2 Name of security BSX N FUTJDX NIFTY S&P
3 Underlying asset BSE Sensitive Index CNX NIFTY
(SENSEX)
331

4 Contract size Sensex value x 50 200 or multiples of 200
5 Tick size/Price step 0.1 point of Sensex (equivalent ` 0.05
to ` 5)
6 Minimum price ` 5 Not applicable
fluctuations
7 Price bands NA NA
8 Expiration months 3-near months 3-near months
9 Trading cycle A maximum of 3 months; As in previous column
the near month (I), the next
month (2) and the a month
(3)
10 Last trading/Expiry Last Thursday of the month As in previous column
day or the preceding day
11 Settlement In cash on T+l bas As in previous column
12 Final settlement price Index closing price on the last Index closing price on the
tay (a) 1st trading day (s)
13 Daily settlement price Closing of futures contract Closing of future
(a)(a) contract
14 Trading hours 9.30 am to 3.30 pm -
15 Margin Upfront margin on daily basis As in previous column
(a) Computed on the basis of the weighted average of last 15 minutes trading.
(b) Computed on the basis of weighted average of the last 5 minutes, or if the no, of
weighted average of last 5 trades.
(c) Whtevgrohasalf aour’rade.
In India, stock index futures are available for one-month, two-month and three-month
maturities. All the open positions in these contracts are settled daily. Further, the buyers and
sellers are required to deposit margin with the respective stock exchanges determined as per
the SEBI guidelines. To facilitate the effective risk management in the derivatives segment,
all the important measures like minimum net worth requirement for the broker, determination
of margin based on value at risk model, position limit for various participants, mechanism for
collection and enforcement of margin, etc. have been put in place. Subsequently, the
derivative products range had been increased by including options and futures on the indices
and on several highly traded stocks. In an estimate, the product wise turnover of derivatives
on the Indian stock markets as on July 6, 2002 is stock futures
332

(50%), index futures (2 1%), stock options (25%) and index option (4%). It means stock
futures are most popular derivative traded at the stock market of India.
During the last decade, to make stock market functioning effective for futures trading,
the SEBI has adopted several internationally tested and accepted mechanism for
implementation at the Indian stock exchanges. For this, proper surveillance and risk
containment like the circuit breaker, price bands, value at risk (VaR) based margin
collections, etc. have been introduced.
The SEBuTechnicarouped brof.Rerma trescribe
risk containment measures for new derivative products. The group recommended the
introduction of exchange traded options on Indices which is also conformity with the
sequence of introduction of derivatives products recommended by Dr. L.C. Gupta Committee.
The Technical Group has recommended the risk containment measure for exchange
traded options on indices. The following are the important features of the risk containment
framework for the trading and settlement of both index futures and index option contracts:
1. European style index options will be permitted initially. These will be settled in cash.
2. Index option contracts will have a minimum contract size of ` 2 lakh, at the time of its
introduction.
3. The risk containment measures described hereunder are only for premium style
European option.
4. Index option contract will have a maximum maturity of 12 months and a minimum of
three strikes, i.e., in the money, near the money and out of the money.
5. A portfolio based margining approach, which would take an integrated view of the
risk involved in the portfolio of individual client will be adopted. It is for the first time
that such an approach is introduced in the Indian stock market. It is inconsistent with
the practices followed in the countries. This approach will not only cover the risk but
also help in reducing the transaction costs in derivatives.
6. The initial margin requirements will be based on worst case loss of a portfolio of an
individual client to cover a 99% value at risk (Va) over a one day horizon. The initial
margin requirement will be netted at level of individual client and it will be on gross
basis at the level of Trading/Clearing member. Further, the initial margin requirement
for the proprietary position of Trading/Clearing member will also be on net basis.
333

7. The short option minimum margin equal to 30% of the Notional value of all short
index option will be charged if sum of the worst scenario loss and the calendar spread
margin is lower than the short option minimums margin.
8. Net option value will be calculated on the current market value of the option times the
number of options (positive for long options and negative for short options) in the
portfolio. The net option value will be added to the Liquid Net Worth of the clearing
member.
9. For option positions, the premium will be paid in by the buyer in cash and paid out to
the seller in cash on T+ 1 day until the buyer pays in the premium due shall he
deducted from the available Liquid Net Worth on a real time basis. In case of index
futures contracts, the mark-to-market gains losses for index futures position will
continue to be settled.
Contrary to international experience, the growth of derivatives market did not take off
as anticipated. The value of trading has been low. This is mainly attributed to the low
awareness about the products and mechanism of trading among the market players and
investors. SEBI’echnicaroueivativroducts haetlehis
issue and recommended the following measures for the development of derivatives market:
1. The system of sub-brokers be used for increasing the volume of trading in this market.
2. Financial institutions and mutual funds be permitted to sell short in the cash market
for facilitating the free arbitrage between cash and derivatives market. However, such
short sale may be restricted to the extent of corresponding exposure in the derivative
market.
3. Arbitrage between cash and derivatives markets will assist in better price discovery in
both the markets.
Countries like USA, UK and Singapore have reaped considerably economic benefit
from foreign participation in their futures markets. Foreign participation in futures markets
hedghotentiao acubstantiainvisible earnerorn exchangearlier the
SEBI and the RBI both were hesitant to allow the foreign institutional investors (FITs) for
trading in the futures markets. However, recently the RBI has allowed FITs to trade in
derivatives market subject to the condition that the overall open position of the FIT shall not
exceed 100 pert of the markvalof the conned ’s total investmenAs per
the recent notification of the Central Government, SEBI and RBI will jointly examine the
issues concerning trading in financial derivatives by FIs and FII (s).
334

Eligibility of Stocks
The SEBI board has initially approved the introduction of single stock futures contract
on 31 stocks on which option contracts have been introduced on BSE and NSE. A list of these
has been given in Table. The Advisory Committee on Derivatives of the SEBI shall review
the eligibility criteria for introduction of futures and options on any other stock from time to
time. A brief structure in general relating to financial derivatives operating in India has been
shown in Fig.
Structure of derivatives markets in India.
Emerging Structure of Derivatives Markets in India
Derivatives markets in India can be broadly categorized into two markets namely;
financial derivatives markets and commodities futures markets. Financial derivatives markets
deal with the financial futures instruments like stock futures, index futures, stock options,
index options, interest rate futures, currency forwards and futures, financial swaps, etc.
whereas commodity futures markets deal with commodity instruments like agricultural
products; food grains, cotton and oil; metals like gold, silver, copper and steel and other assets
like live stocks, vegetables and so on.
335

Products of the National Stock Exchange (NSE)
Futures on Option on
Products Index / futures Index options individual individual
securities securities
Underlying S&P CNX S&P CNX 87 Securities 87 securities
instruments NIFTY NIFTY stipulated by stipulated by
SEBI SEBI
Type - European style - American style
Trading cycle Maximum Maximum Maximum Maximum
of 3-month of 3-month of 3-month of 3-month
trading cycle. trading cycle. trading cycle. trading cycle.
At any point in At any point in At any point in At any point in
time, there will time, there will time, there will time, there will
be 3 contract be 3 contract be 3 contract be 3 contract
available: available: available: available:
1. Near month 1. Near month 1. Near month 1. Near month
2. Mid month 2. Mid month 2. Mid month 2. Mid month
3. Far month 3. Far month 3. Far month 3. Far month
duration duration duration duration
Expiry day Last Thursday of Last Thursday of Last Thursday of Last Thursday of
expiry month expiry month expiry month expiry month
Contract size Permitted lot Permitted lot As stipulated by As stipulated by
size is 200 and size is 200 and NSE (Not less NSE (Not less
multiple thereof multiple thereof than ` 2 lacs) than ` 2 lacs)
Price steps ` 0.05 ` 0.05 - -
Basic price Previous day Theoretical Previous days Theoretical
first day of closing NIFTY value of the closing value of value of the
trading value option contracts the underlying option contracts
arrived at based security arrived at based
on Black scholes on Black scholes
model model
Base price Daily settlement Daily close price Daily settlement Daily close price
subsequent price
Price bands Operating Operating Operating Operating
ranges are kept ranges are kept ranges are kept ranges are kept
at +10% at 99% of the at +20% at 99% of the
base price base price
336

Quantity 20,000 units or 20,000 units or Lower of the 1% Lower of the 1%
freeze greater greater of the market of the market
position limit position limit
stipulate for stipulate for
option positions option positions
or ` 5 crores or ` 5 crores
Financial derivatives markets in India are regulated and controlled by the Securities
and Exchange Board of India (SEBI). The SEBI is authorized under the SEBI Act to frame
rules and regulations for financial futures trading on the stock exchanges with the objective to
protect the interest of the investors in the market. Further carry forward trading (Badla
trading) is also regulated by the SEBI which is traded on the stock exchanges.
Some of the other financial derivatives like currency options and futures and interest
rate futures are controlled by the Reserve Bank of India (RBI). These are dealt on Over-the-
Counter (OTC) markets. Financial futures on interest rate include both short-term interest rate
and long-term interest rate forwards. Currencies include options and forwards. Since the RBI
is the apex body to regulate currencies and interest rates in India, hence, financial derivatives
relating to foreign currencies and interest rates are generally come under the RBI regulation.
Major stock exchanges in India, under the regulation of the SEBI, trade in two kinds
of futures products, namely equity and carry forwards. Equity futures include stock futures,
index futures, stock options and index options. Currently these are traded on National Stock
Exchange and Bombay Stock Exchange. Examples of such companies on which options and
futures are available, e.g. ACC, SBI, CIPLA, HPCL, TELCO, GRASIM, Dr. Reddy, Lab,
HLL, HDFC, Hero Honda, etc.
Commodity futures markets are regulated in India by Forward Market Commission
(FMC). The Commission is entrusted with to regulate commodities futures trading in India.
Products like hessian, potatoes, pepper, cotton, etc. are traded on Coimbatore Commodity
Exchange and Calcutta Commodity Exchange. Recently the Central Government has allowed
futures trading on 54 new commodities of different categories to be eligible for trading on
exchanges.
The future of derivatives trading in India is bright and growing day by day. More new
products and instruments are coming up to be traded on stock and commodity exchanges.
Very soon we will have trading on interest rate futures on NSE and BSE. A brief view of this
structure has been shown in Fig.
337

Summary
This chapter has introduced financial derivatives markets in India by briefly
describing the need of derivatives markets in India. The need of derivatives in India has arisen
due to economic liberalization. Since 1991 individuals and corporates were facing exchange
risk, interest rate risk and other risks. The management of these risks is very important in the
globalized world, and derivatives play an important role in this respect. This chapter also
highlighted the various recommendations of the Dr. L.C. Gupta Committee on financial
derivatives in India which emphasises the urgent need of introduction of financial derivatives
and which should be in phased manner.
In addition, it has discussed the derivatives trading at NSE/BSE Derivatives trading
was started in June, 2001 with the introduction of stock index futures based on Sensex name
BSE on BSE and on NSE June 12, 2000 named N FUTIDX NIFTY. In India, Stock index
futures are available for one-month, two- month and three-month maturities. Finally the
chapter has concluded with defining the structure of derivatives market in India. Indian
derivatives market can be divided in two parts: (a) commodities futures markets (b) financial
derivative market. Financial derivatives market is regulated by the SEBI and RBI. SEBI
regulates equity futures and carry forward through the help of exchanges and RBI regulated
currencies and interest rates forward both short-term and long-term mature through OTC.
Commodity futures market is regulated by forward market commission (FMC). The chapter
ends with a list of showing name of securities using derivatives instruments in India.
Self Assessment Questions
1. Explain the term financial derivative. What are its different types of derivatives as
given under SEBI guidelines? Explain them.
2. C1early bring out the need of derivatives market in India with suitable arguments in
favour and disfavour.
3. Discuss the growth of financial derivatives in India, in the light of major
recommendations of Dr. L.C. Gupta Committee on derivatives trading.
4. “Derivatives are coneost importanoolserganizatioedge
thisommenhitatemenituggestions.
5. Explain the important recommendations of Dr. L.C. Gupta Committee regarding
derivative trading in India with suitable examples.
6. Explain the emerging structure of financial derivatives markets in India with suitable
examples.
338

7. Write a note on evolution of derivative markets in India.
8. Discuss the recent trends of financial derivative in India with special reference to
international finance.
9. Explain the risk containment measures for the financial derivatives trading in India.
10. Explain the weakness of the Indian stock market for launching of futures trading.
Discuss the measures taken by the SEBI in this regards.
11. Write a detailed note on historical development of Financial derivatives in India.
****
CASE STUDY
I . Case Study
An insnce Company’ses oarticulaypreasonable approation
normally distributed with a mean of $ 150 million and a standard deviation of $ 50 million.
(Assume no difference between losses in a risk-neutral world and losses in the real world).
The 1-year risk-free rate is 5%. Estimate the cost of the following.
(a) A conthailay in 1 year’imhe insnmpany’
pro rata basis.
(b) A conthaaln in 1 year’ime if lossceed $ 200 miln.
II . Case Study
If more Tax concessions are offered to real investors that share market will move
forward Do you agree? Give reasons.
III. Case Study
Do you think that the present method of settlement of share transactions is popular
among common man? Give your comments.
339

IV. Case Study
You are back in Mumbai after a grueling day in New Delhi. You were called by the
mandarins in the North Block to explain the mandarins in the North Block to explain the
cause of the crash in the price of the stock of your company- a leading Indian Software MNC.
The investors were aghast at the stock price crash. The main charge was simple. Your
company used futures trading for speculation Instead of normal hedging.
Before you can get out of our Shining Merc (which might get autioned soon) media-
persons are already all over the place thrusting microphones in your face- waiting for a sound
biteou barely mumb‘no commentshe gatherinuromisbacith
detailed description of events, to be transmitted live on the television, in a couple of hours.
As you sit down at your office table, and call for a RT (room-temperature) glass of
narial paanee (coconut water)-Since your friends tell that it is god when your have hyper-
acidity; you need a strong stomach lining to digest all the vitriol being offered to you.
When you look at the documents spread in front of you, the following details emerge:
(a) Since the exposure of your company is in USD, you chose to buy 6-month USD
futures at a price that was above spot price for a long time, and you sell GBP futures
for 9-months since pricing is very attractive, and you are expecting to receive
payments for services rendered in about 8-months time.
(b) As the maturity of USD futures approached, US of A attacked Iraq, leading to a jump
in oil prices.
(c) Sensing trouble you immediately bought 3-months interest rate futures which were
trading below spot.
(d) Within a week of your purchase, markets started stabilizing and returned to normal
behaviour.
(e) But your board was uncomfortable with your position, and margin calls. They ask
you to settle your position and face the jury, charging ou for speculation in the
markets with company money.
Questions
(i) What additional information will you need?
(ii) How will you defend your case ?
340
V. Case Study
G needs to borrow in the bond market 6 months hence: As he expects the interest rates
to rise, he needs hedging. The company has the option on govt bond future.
(a) Should the company buy a put (or) call option.
(b) If the present future contracts trades at ` 300 and a 6 month put option involves, a
cost of ` 2 1/2 % based on the strike price, during the six months, interest rates rise
and the price govt bond went down to ` 95. What is the gain (or) loss on the option
per ` 1,00,000 contracts.
VI. Case Study
A farmer in Punjab expects to harvest 20000 bushels of wheat in late July. On 10 th
June, the price of wheat is ` 160 per bushel. The farmer is worried as he suspects that price
will fall below ` 160 before his July delivery date he can hedge is position by selling July
wheat futures. The July wheat future price is ` 157 per bushel. The former sold the July wheat
futures. When July end approached, the price had fallen to ` 150 per bushel.
Calculate
(a) What is the gain of the future contract?
(b) What is the revenue from the sale of wheat?
(c) What is the cash flow per bushel of wheat?
VII. Case Study
Brain Vandergriff is a portfolio manager for Southside Bank and Trust Company. He
currently is considering purchasing shares of Deere (maker of arm equipment) and Zenith (a
producer of electronic equipment) common stock for inclusion in several portfolios he
manages. As an alternative, he also is considering purchasing Deere and Zenith convertible
bonds. The portfolios under consideration are mostly equity portfolios having the objective of
aggressive growth. Vandergriff expects Deere to benefit from the recent growth in demand
for agricultural equipment abroad. Zenith may be on the comeback trail after its earnings
growth faltered in the late 1980s. He also expects interest rates to remain stable during the
next year.
341

Convertible DEERE ZENTH
Coupon 5.50% 6.25%
Maturity (Years) 8 18
Rating A- CCC
Conversion rate (# shares) 30.53 32
Market price (% part) 222.50 66.25
Investment Value 85.43 64.95
Call price 105 106
Common Stock
Market price 72.88 6.88
Dividend 2.00 0.00
Beta 1.05 1.45
Question
Analyze these two convertibles. Recommend the convertible debentures that, in your
opinion, would be more desirable for purchase by an aggressive, growth-oriented investor.
Justify your recommendation.
VIII. Case Study
Maria Gilbert is a principal in the firm of Orion Financial Management. For twenty
years she was chief investment officer with Reliance Investments, the pension management
arm of the Second National Bank of South Bend, Indiana. She left the bank in May 1995 in an
attempt to turn her expertise into greater personal rewards
Two portfolios under management for medium-sized pension funds were on the top of
her current agenda. The first portfolio was an index fund representing a cross section of the S
& 500 stocks. This portfolio had been established as a core portfolio for the South Bend
Firefighters, currently $10 million. The second portfolio was an actively managed fund for the
Ryan Country Public Employees Retirement Fund, which aggregated $2.75 million.
The firefighters portfolio was put in a cross section of S & P 500 stocks on December
23, 1995, when the S & P 500 Stock Index was at 500. One year later, on December 20, 1996,
the S & P 500 Index closed at 595. On the same day the S & P 500 March/1997 futures
contract closed at 600. The March/600 call on the S & P 500 Index carried a premium of
342

18.75 points, and the March/600 put was at 8.50. The Ryan Country fund was allocated as
follows: cash equivalents, 9 percent; fixed income securities, 36 percent; equities, 55 percent,
Treasury-bond futures were priced at 95.
On December 20,1996, Maria arrived at the office determined to adjust these two
portfolios. However, she had mixed feelings about the stock market. On the one hand, she
believed the market might continue its advance from an S & P 500 level of 595 to an index
level of 640 during the next three months if corporate profits continued there upward surge.
On the other hand, she worried that a downward correction could take the market to 545 if
interest rates moved sharply higher as some were predicting. After pondering her options she
decided to look more closely at alternative strategies for both funds, ignoring taxes and
transaction costs for simplification of her task.
Question
Suppose Gilbert thought the stock market would weaken and she wanted to lighten,
but not eliminate, her equity position and increase the fixed income part of the Ryan portfolio.
Indicate specific actions she could take in the futures markets to shift the allocation of the
Ryan portfolio to Zero cash, $1.6 million fixed-income, and $1.15 million equities.
****
REFERENCE
1. Hull, JC, Options, Futures, and Other Derivatives
2. Stulz, RM, Risk Management & Derivatives, INDIA EDITION, CENGAGE LEARNING
343