What explains vast differences in jumping power within a ...
11
Functional Ecology. 2020;34:1053–1063. wileyonlinelibrary.com/journal/fec | 1053 © 2020 British Ecological Society Received: 5 October 2019 | Accepted: 2 February 2020 DOI: 10.1111/1365-2435.13545 RESEARCH ARTICLE What explains vast differences in jumping power within a clade? Diversity, ecology and evolution of anuran jumping power Elizabeth Mendoza 1,2 | Emanuel Azizi 1 | Daniel S. Moen 2 1 Department of Ecology and Evolutionary Biology, University of California, Irvine, CA, USA 2 Department of Integrative Biology, Oklahoma State University, Stillwater, OK, USA Correspondence Elizabeth Mendoza Email: [email protected] Funding information Oklahoma State University; National Science Foundation, Grant/Award Number: DEB-1655812 Handling Editor: Kris Crandell Abstract 1. Anuran (frog and toad) jumping power varies greatly across species, yet muscle power does not. Given that the jumping power of some species is up to five times higher than typical muscle power, power amplification by elastic elements is sug- gested to explain this discrepancy. However, the ecological reasons for this vari- ation in jumping power remain unclear. One hypothesis is that small jumpers are limited by the time available to accelerate their body during take-off, leading to small species needing greater power production than larger species to achieve similar jumping performance. Another (non-mutually exclusive) hypothesis is that the microhabitat species inhabit may drive variation through trade-offs with per - formance in microhabitat-specific, non-jumping behaviours. 2. We compared jumping power across 68 anuran species that were diverse in evo- lutionary relationships, microhabitat use and body mass. We used phylogenetic comparative methods to compare the role of microhabitat and body mass in ex- plaining variation in jumping power across species. 3. We found the strongest support for a model that included two factors and their interaction. First, as body mass increased, jumping power decreased. Second, spe- cies that burrowed showed lower jumping power than species that did not burrow. Third, the interaction between body mass and burrowing behaviour showed that jumping power declines more rapidly with body mass in burrowing species than non-burrowing species. 4. The effect of body mass suggests that interspecific variation in jumping power might be partly explained by scaling relationships. Anurans with small body mass may be able to achieve similar locomotor performance (e.g. takeoff velocity) as those with larger body mass, by more effectively amplifying muscle power. Additionally, the effect of burrowing behaviour suggests that species that use hindlimbs to burrow may experience a reduction in their ability to generate jump- ing power. This may indicate a functional trade-off between jumping and burrow- ing performance. KEYWORDS body mass, burrowing, comparative biology, frogs, microhabitat, power amplification, trade-offs
-
Upload
khangminh22 -
Category
Documents
-
view
5 -
download
0
Transcript of What explains vast differences in jumping power within a ...
Functional Ecology. 2020;34:1053–1063. wileyonlinelibrary.com/journal/fec | 1053© 2020 British Ecological Society
Received: 5 October 2019 | Accepted: 2 February 2020
DOI: 10.1111/1365-2435.13545
R E S E A R C H A R T I C L E
What explains vast differences in jumping power within a clade? Diversity, ecology and evolution of anuran jumping power
Elizabeth Mendoza1,2 | Emanuel Azizi1 | Daniel S. Moen2
1Department of Ecology and Evolutionary Biology, University of California, Irvine, CA, USA2Department of Integrative Biology, Oklahoma State University, Stillwater, OK, USA
CorrespondenceElizabeth MendozaEmail: [email protected]
Funding informationOklahoma State University; National Science Foundation, Grant/Award Number: DEB-1655812
Handling Editor: Kris Crandell
Abstract1. Anuran (frog and toad) jumping power varies greatly across species, yet muscle
power does not. Given that the jumping power of some species is up to five times higher than typical muscle power, power amplification by elastic elements is sug-gested to explain this discrepancy. However, the ecological reasons for this vari-ation in jumping power remain unclear. One hypothesis is that small jumpers are limited by the time available to accelerate their body during take-off, leading to small species needing greater power production than larger species to achieve similar jumping performance. Another (non-mutually exclusive) hypothesis is that the microhabitat species inhabit may drive variation through trade-offs with per-formance in microhabitat-specific, non-jumping behaviours.
2. We compared jumping power across 68 anuran species that were diverse in evo-lutionary relationships, microhabitat use and body mass. We used phylogenetic comparative methods to compare the role of microhabitat and body mass in ex-plaining variation in jumping power across species.
3. We found the strongest support for a model that included two factors and their interaction. First, as body mass increased, jumping power decreased. Second, spe-cies that burrowed showed lower jumping power than species that did not burrow. Third, the interaction between body mass and burrowing behaviour showed that jumping power declines more rapidly with body mass in burrowing species than non-burrowing species.
4. The effect of body mass suggests that interspecific variation in jumping power might be partly explained by scaling relationships. Anurans with small body mass may be able to achieve similar locomotor performance (e.g. takeoff velocity) as those with larger body mass, by more effectively amplifying muscle power. Additionally, the effect of burrowing behaviour suggests that species that use hindlimbs to burrow may experience a reduction in their ability to generate jump-ing power. This may indicate a functional trade-off between jumping and burrow-ing performance.
K E Y W O R D S
body mass, burrowing, comparative biology, frogs, microhabitat, power amplification, trade-offs

1054 | Functional Ecology MENDOZA Et Al.
1 | INTRODUC TION
In animals, movements that require power outputs that are beyond the capacity of muscles must use mechanisms that amplify power. This mechanism relies on the temporary storage of muscle work into elastic structures (e.g. tendon; Alexander, 1988) prior to any significant joint movement and the subsequent release of this work at faster rates. Such amplification occurs in several behaviours, including jumping (Anderson & Deban, 2010; Higham & Irschick, 2013; Patek, Dudek, & Rosario, 2011; Roberts & Azizi, 2011). Although a broad literature exists on the use of elastic mechanisms to amplify power in jumping animals (reviewed in Higham & Irschick, 2013; Ilton et al., 2018; Patek et al., 2011; Roberts & Azizi, 2011), it remains unclear why some animals need more power than their muscles can supply and whether trade-offs with other behaviours shapes the distribution of power amplification.
Given the importance of allometric growth on mechanics (e.g. Biewener, 2005), overall body size may influence the muscle force and power required for a given movement. In a broad analysis, Ilton et al. (2018) modelled how energy storage and release in a power-amplified system were affected by modifying the system's components, includ-ing mass. In systems that aim to maximize takeoff velocity, they found that energy storage resulted in high power outputs and a broader range of takeoff velocities for projectiles of small mass, whereas those with larger masses performed better with direct motor (e.g. muscle) actuation. These results suggest that the benefits of mechanisms used to amplify power may be size-dependent in biological systems. In jumping organisms (where the ‘projectile’ is the organism's body), this size-dependence could relate to the scaling of limb dimensions. If the time available for take-off is proportional to hindlimb length, then larger jumpers will have more time than smaller jumpers to gen-erate force to accelerate their body (Biewener & Patek, 2018). This increased force should result in higher acceleration and thus higher takeoff velocity and jumping distance (Marsh, 1994). Moreover, small organisms need to move their limbs faster than large organisms to achieve a given centre-of-mass velocity, but the higher muscle con-traction velocity necessary for faster movement will reduce muscle force (Bobbert, 2013). Thus, if small jumpers need to jump as far as larger species (e.g. to escape predators; Emerson, 1978; James, Navas, & Herrel, 2007), small jumpers may need to compensate for their size using mechanisms that increase power output (Aerts, 1998; Ilton et al., 2018; James et al., 2007).
Ecology and associated trade-offs among different behaviours may also drive variation in jumping power. For example some species of anurans (frogs and toads) dig burrows with their hindlimbs (Emerson, 1976), which are also used for jumping. In such species the use of elas-tic mechanisms could result in some loss of appendage control and less force transferred to the feet during digging (Higham & Irschick, 2013; Richards & Sawicki, 2012). In contrast, living in some microhabitats may favour increased jumping power. For instance arboreal organisms (e.g. lizards, frogs, bush babies) often jump from one branch to another, and such jumps may require substantial power. Additionally, jumping from compliant perches (i.e. leaves or twigs) may require that animals generate more power to compensate for losing propulsive energy to a
deforming substrate (Astley, Haruta, & Roberts, 2015; Reynaga, Eaton, Strong, & Azizi, 2019).
Despite these two explanations (body size and microhabitat) for variation in jumping power, few studies have investigated poten-tial causes of this variation across a taxonomic group (Astley, 2016). Here, we study variation in jumping power and the correlates of such variation across anurans. We study anurans because their jumps are characterized as fast accelerative movements that require substan-tial muscle power (Lutz & Rome, 1994; Olson & Marsh, 1998). Large variation in muscle-mass-specific jumping power occurs across anuran species despite similar in-vitro muscle power in the plantaris longus and the semi-membranosus (Astley, 2016; Roberts, Abbott, & Azizi, 2011). These results suggest that variation in jumping power reflects variation in power amplification, not just muscle power (Astley, 2016; Astley & Roberts, 2012, 2014; Marsh, 1994; Roberts et al., 2011). Additionally, anurans are diverse in size (e.g. from 8 to 394 mm body length in males; de Lisle & Rowe, 2013) and inhabit diverse microhab-itats (Moen, Irschick, & Wiens, 2013; Moen, Morlon, & Wiens, 2016; Moen & Wiens, 2017), and such microhabitats demand different be-haviours. Despite this diversity, anurans have a conserved body form of unique features important for jumping (Jenkins & Shubin, 1998; Zug, 1978). With few exceptions, nearly all frogs use jumping as a pri-mary mode of locomotion after metamorphosis, demonstrating the importance of this trait for survival (e.g. prey capture and predator avoidance; Emerson, 1978; James et al., 2007; Marsh, 1994).
In this study, we aimed to understand the factors that influ-ence variation in anuran jumping power. We measured jumping power across 68 anuran species that show diversity in microhabi-tat use, body mass and phylogenetic history. Then, we used ances-tral-state estimation to map the evolution of anuran jumping power in our 68-species dataset. Finally, we used phylogenetic comparative methods to test the role of microhabitat use and body mass in ex-plaining variation in jumping power across species.
2 | MATERIAL S AND METHODS
2.1 | Sampling
We pooled data for this study from four sources: (a) wild-caught animals, (b) pet-trade animals, (c) data from a previous study (Moen et al., 2013) and (d) (D.S. Moen) unpublished data from Rhinella marina. First, we collected data from 20 ecologically diverse species of frogs from five families (Bufonidae, Hylidae, Microhylidae, Ranidae and Scaphiopodidae) in Oklahoma and Arkansas in the United States. We collected adult, mostly male frogs (78% of all individuals were male) during the breeding season. Second, we purchased individuals of three species from the pet trade. In total we collected novel data from 23 species (wild-caught and store-bought). Sample size across species averaged 5.09 individuals (range 2–10; Table 1). We main-tained frogs on a 12 hr L:D cycle at ambient temperatures (~20°C) and at approximately 40% humidity. The frogs were fed crickets or flightless fruit flies ad libitum three times weekly. All animal care

| 1055Functional EcologyMENDOZA Et Al.
procedures followed Oklahoma State University IACUC protocol AS-15-17.
Third, we included jumping and preserved specimen morpholog-ical data from Moen et al. (2013) in this study to add more phyloge-netic and microhabitat diversity. Briefly, Moen et al. (2013) examined diversity in jumping performance across 44 species from Australia, China and Colombia. They calculated body-mass-specific power and showed that it was variable across species, but they did not focus on understanding the variation in and the evolution of power per se, nor did they calculate muscle-mass-specific power. The latter stan-dardization by muscle mass is the most relevant measurement for comparing power production across species (Astley, 2016; Longo et al., 2019; Roberts et al., 2011). Fourth, we added data for R. marina (n = 5), previously collected (as in Moen et al., 2013) but (D.S. Moen) unpublished data.
2.2 | Microhabitat and behaviour
We categorized the 23 species with novel data for this study and R. marina into one of eight microhabitat categories following
Moen and Wiens (2017; see Figure 1), who explicitly categorized thousands of frog species according to behaviours and time spent in microhabitats outside of the breeding season (i.e. many species lay eggs in water, but are not aquatic). We only assigned microhabi-tats to these 24 species because Moen et al. (2013) assigned states to the 44 species of that study and such states were consistent with Moen and Wiens (2017). We refer readers to Moen and Wiens (2017) for detailed discussion and justification of microhabitat cat-egories, but we briefly describe them here: aquatic (living almost entirely in water), arboreal (climbing trees or other vegetation), semi-aquatic (sharing time between water and land), semi-arboreal (climbing, but spending appreciable time on the ground), terrestrial (living on the ground) and torrential (climbing vegetation and wet rocks along fast-flowing streams). For burrowing, we distinguish between species that burrow backwards with their hind legs and species that burrow with their head or forelimbs (Emerson, 1976), and only species that burrow with their hindlimbs are categorized here as burrowing (Emerson, 1976; Moen et al., 2013; Moen & Wiens, 2017). Semi-burrowing species were those that are mostly terrestrial, but also burrow. We modified the microhabitat state of three taxa to facilitate statistical analysis (e.g. some analyses did
TA B L E 1 Summary of morphological and performance data for the 23 species for which novel jumping data were collected in this study
Species n Body mass (g)
Takeoff velocity (m/s)
Muscle-mass-specific-power (W/kgmuscle-mass) Microhabitat
Acris blanchardi 7 1.21 ± 0.21 2.35 ± 0.33 657.89 ± 150.60 Terrestrial
Anaxyrus americanus 6 26.18 ± 8.04 1.08 ± 0.24 122.75 ± 59.99 Semi-burrowing
Anaxyrus cognatus 5 70.17 ± 20.36 1.18 ± 0.15 104.52 ± 33.41 Semi-burrowing
Anaxyrus woodhousii 3 37.22 ± 15.17 1.16 ± 0.11 102.40 ± 23.21 Semi-burrowing
Bombina orientalisa 3 9.30 ± 1.28 1.39 ± 0.06 259.67 ± 10.59 Semi-aquatic
Gastrophryne carolinensis 4 2.19 ± 0.24 1.34 ± 0.14 530.33 ± 178.98 Terrestrial
Gastrophryne olivacea 4 1.89 ± 0.74 1.18 ± 0.15 395.00 ± 101.33 Terrestrial
Hyla avivoca 9 2.61 ± 0.41 2.15 ± 0.14 723.86 ± 183.14 Arboreal
Hyla chrysoscelis 5 8.07 ± 1.10 2.26 ± 0.21 608.76 ± 116.17 Arboreal
Hyla cinerea 9 8.05 ± 1.59 2.53 ± 0.23 581.30 ± 159.95 Arboreal
Kaloula pulchraa 2 20.29 ± 2.86 0.99 ± 0.19 208.60 ± 35.50 Arboreal
Phlyctimantis maculatusa 3 12.61 ± 3.59 1.94 ± 0.17 406.37 ± 59.69 Arboreal
Pseudacris clarkii 10 0.94 ± 0.18 1.71 ± 0.12 418.84 ± 95.10 Terrestrial
Pseudacris crucifer 7 0.99 ± 0.34 2.77 ± 0.35 1551.66 ± 316.35 Terrestrial
Pseudacris fouquettei 6 1.27 ± 0.25 2.03 ± 0.20 670.40 ± 134.08 Terrestrial
Pseudacris streckeri 4 5.44 ± 0.58 1.60 ± 0.04 288.80 ± 36.48 Terrestrial
Rana blairi 5 43.25 ± 7.96 2.16 ± 0.48 180.02 ± 110.83 Semi-aquatic
Rana catesbeiana 4 244.44 ± 146.41 2.81 ± 0.07 308.58 ± 61.91 Semi-aquatic
Rana clamitans 6 20.96 ± 3.06 2.39 ± 0.30 346.53 ± 92.68 Semi-aquatic
Rana palustris 2 5.69 ± 1.27 2.05 ± 0.04 298.50 ± 25.31 Semi-aquatic
Rana sphenocephala 5 25.63 ± 6.05 2.73 ± 0.20 374.54 ± 88.55 Semi-aquatic
Scaphiopus hurterii 4 16.31 ± 3.32 1.47 ± 0.06 256.80 ± 42.75 Burrowing
Spea bombifrons 4 9.22 ± 1.39 1.24 ± 0.11 199.13 ± 38.84 Burrowing
aSpecies that were purchased in the pet trade. All continuous data are reported as species’ M ± 1 SD.

1056 | Functional Ecology MENDOZA Et Al.
not allow microhabitats with only one species to be included) and to increase statistical power to distinguish models. All changes were to similar states, and we detail these modifications and our justifications for them in the Supporting Information. Overall, since
our results most strongly favour a contrast between burrowing and non-burrowing species (see below) and those states were unaf-fected by our changes, we expect our results to be robust to most decisions about microhabitat classification.
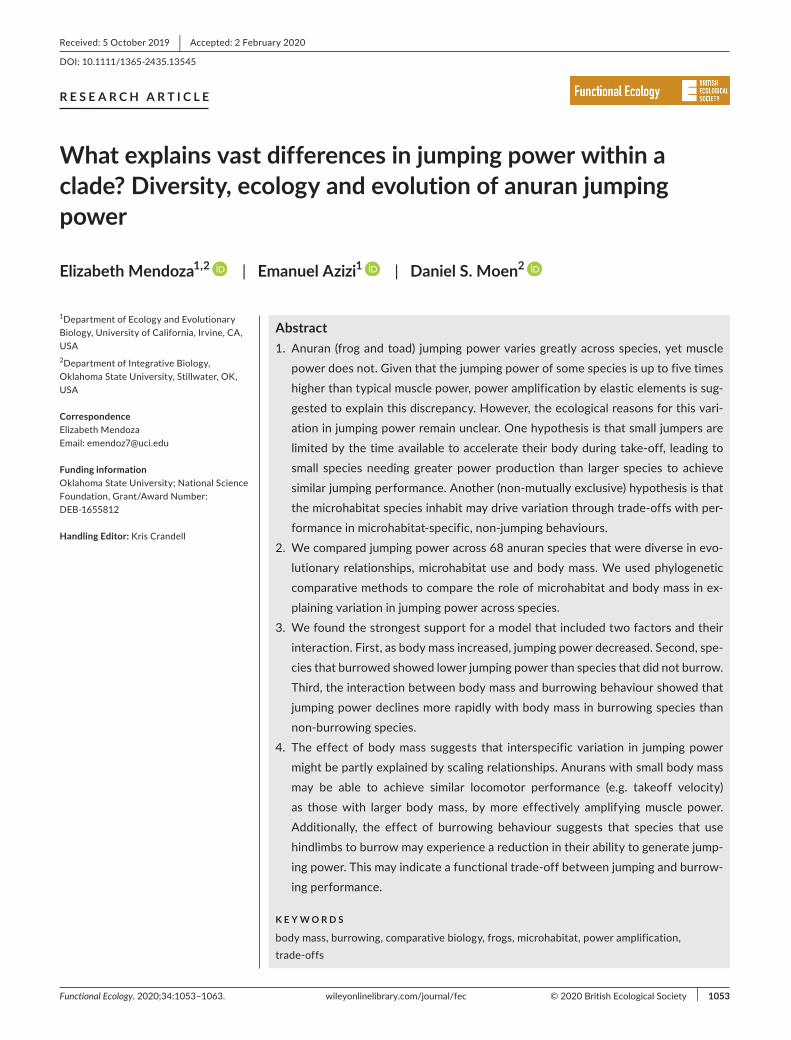
F I G U R E 1 Phylogeny illustrating the evolution of jumping power in 68 species of anurans, the families to which they belong, and microhabitat assignment. Asterisks indicate the species from which we collected novel data for this study. The topology and branch lengths are from Pyron (2014), and branch lengths are in millions of years. Node colours refer to muscle-mass-specific power (W/kgmuscle mass) estimated by maximum-likelihood methods (Schluter et al., 1997) in r with the package ApE. Plotting of branch colours was done with phytOOls in r (Revell, 2012, 2013), which smoothly interpolates changes between nodes. Colours of muscle-mass-specific jumping power were assigned on a log scale. Moreover, species with the two extremes of jumping power described in the text are indicated in bold. Family membership reflects current taxonomy on AmphibiaWeb (2019). Families with single species are not represented by brackets: Bombinatoridae Bombina orientalis, Dicroglossidae Nanorana yunnanensis, Hyperoliidae Phlyctimantis maculatus and Strabomantidae Oreobates quixensis. Jumping power greater than what is physiologically possible for anuran muscle (approximately 483 W/kgmuscle mass; Astley, 2016) likely evolved at the base of the anuran phylogeny. The threshold colour of this muscular limit is indicated in the scale bar to better visualize changes to power amplification
Bombina orientalis*Scaphiopus hurterii*Spea bombifrons*Phlyctimantis maculatus*Chiasmocleis bassleriHamptophryne bolivianaGastrophryne carolinensis*Gastrophryne olivacea*Kaloula pulchra*Calluella yunnanensisMicrohyla fissipesNanorana yunnanensisAmolops tuberodepressusBabina pleuradenOdorrana grahamiRana catesbeiana*Rana clamitans*Rana palustris*Rana sphenocephala*Rana blairi*Chiromantis doriaeRhacophorus rhodopusRhacophorus dugriteiPlatyplectrum ornatumLimnodynastes convexiusculusUperoleia lithomodaOreobates quixensisLitoria bicolorLitoria tornieriLitoria nasutaLitoria inermisLitoria pallidaLitoria rothiiLitoria rubellaLitoria caeruleaLitoria dahliiLitoria australisLitoria longipesHypsiboas hobbsiHypsiboas lanciformisHypsiboas punctatusSphaenorhynchus lacteusScinax ruberDendropsophus sarayacuensisDendropsophus triangulumDendropsophus rhodopeplusOsteocephalus planicepsAcris blanchardi*Pseudacris streckeri*Pseudacris crucifer*Pseudacris fouquettei*Pseudacris clarkii*Hyla annectansHyla cinerea*Hyla chrysoscelis*Hyla avivoca*Adenomera hylaedactylaLeptodactylus leptodactyloidesLeptodactylus rhodomystaxAllobates femoralisAmeerega trivittataRhinella proboscideaRhinella marinaRhinella margaritiferaAnaxyrus cognatus*Anaxyrus woodhousii*Anaxyrus americanus*Duttaphrynus melanostictus
102.3 1,807.2Muscle-mass-specific power (W/kg)
30210 180 150 120 90 60 0Million years ago
266.5 694.0
Microhabitat states
Scaphiopodidae
Myobatrachidae
Rhacophoridae
Ranidae
Bufonidae
Hylidae
Microhylidae
LeptodactylidaeDendrobatidae
Arboreal
TorrentialTerrestrialSemi-burrowingSemi-aquaticBurrowing
483.0

| 1057Functional EcologyMENDOZA Et Al.
2.3 | Phylogeny
We used Pyron's (2014) ultrametric phylogenetic tree, which is based on extensive taxon sampling (2,875 species) and multiple genes (~4 genes/species), to obtain phylogenies and their branch lengths for the analyses in this study. First, we pruned Pyron's phylogenetic tree to contain only the 23 species used to estimate the relationship between preserved and unpreserved muscle-mass to body-mass ratios (see below). Second, we pruned the complete tree to contain the 68 species used for all other analyses of this study. While other recent anuran phylogenies (e.g. Feng et al., 2017) show some incongruence with that of Pyron (2014), we used the latter because it was the most comprehensive anuran tree at the time of our analyses, allowing us to avoid making taxon substitutions.
2.4 | Jumping performance
To measure variation in jumping power across species, we con-structed a 635 × 914.4 mm jump performance arena made of alu-minium rods and plexiglass. We used a FASTEC TS5 high-speed video camera to record jumps at 500 frames per second and an exposure time of 1 ms per frame. We stimulated the frogs to jump by quickly lunging towards the frogs or by tapping them on the back with a paintbrush. For each animal we conducted three jumping sessions. In a given session, we ran jumping tri-als until animals refused to jump or until we recorded at least three strong efforts (defined as long distance for that species), whichever came first. Between each jump, we gave the frog ap-proximately 5 min to rest. Jumps were collected at ambient tem-peratures (~20°C) and after each jump we measured body mass. In the Supporting Information, we discuss potential effects of variation in temperature and in timing of jumping performance (e.g. morning vs. night).
We analysed the motion in videos to ultimately calculate the power of jumps. We only recorded the take-off of each jump be-cause, as a ballistic motion, all key aspects of jump performance (e.g. velocity, distance) are set during the take-off (Marsh, 1994). We digitized videos from first motion until three frames after take-off, using ImageJ (ver. 1.50i, Wayne Rasband, National Institutes of Health) to digitize the tip of the snout in each video. We imported these profiles into Igor Pro (ver. 6.37 Wavemetrics) and fit a quintic spline to the displacement profile (Walker, 1998) to reduce error asso-ciated with digitization. Then we calculated velocity and acceleration profiles from the smoothed displacement profiles using derivatives (McElroy & McBrayer, 2010). We calculated the body-mass-specific power profile by multiplying the velocity and acceleration profiles. We kept only peak muscle-mass-specific power values per individ-ual across all digitized jumping trials. We calculated peak muscle- mass-specific power by dividing peak body-mass-specific power in watts per kilogram body mass by the muscle-mass to body-mass ratio (Roberts et al., 2011; see below for calculation of muscle-mass
to body-mass ratio). We then calculated species means for statistical analysis.
2.5 | Muscle-mass data
Upon completion of jumping trials, we euthanized frogs with MS–222, followed by double pithing. We recorded wet mass and dissected the hindlimb muscles from the right leg. Then we gently blotted the muscles dry on a paper towel, measured mass of the lower and upper hindlimb muscles, and summed the wet mass of those muscles to calculate total hindlimb muscle mass for one leg. We assumed leg symmetry and multiplied the muscle mass for one leg by two to calculate total hindlimb muscle mass. We then divided this mass by wet body mass to obtain the wet muscle-mass to body-mass ratio.
Additionally, to make the data comparable between Moen et al. (2013) and this study, we converted Moen et al.'s (2013) body- mass-specific power (W/kg) data into muscle-mass-specific power (W/kg) by dividing the body-mass-specific power by the muscle-mass to body-mass ratio. Because Moen et al.'s (2013) muscle masses were calculated from muscles preserved in formalin, this ratio was for preserved muscle mass to preserved body mass. Thus, we esti-mated the equivalent wet ratio by regressing wet ratio on preserved ratio in the 23 species unique to this study and using the results to estimate the wet ratios for the taxa from Moen et al. (2013) and for R. marina. We provide a detailed explanation of this procedure in the Supporting Information.
2.6 | Ancestral-state estimation
Previous studies have suggested that some anuran species amplify mechanical power during jumping, whereas others do not (Astley, 2016; Marsh & John-Alder, 1994; Peplowski & Marsh, 1997; Roberts et al., 2011). However, it remains unknown whether power amplifica-tion has arisen multiple times in the evolutionary history of anurans. To address this possibility, we used maximum-likelihood methods (Schluter, Price, Mooers, & Ludwig, 1997) to estimate ancestral mus-cle-mass-specific power outputs in the anuran phylogeny. For this analysis we used the function ace in the r package ApE (version 5.0; Paradis & Schliep, 2019). We used log-transformed data to model proportional, rather than absolute, change (i.e. the likelihood of doubling power does not depend on the initial value; O'Meara, Ané, Sanderson, & Wainwright, 2006). This reconstruction does not di-rectly indicate the presence of power amplification, because muscle power remains unknown for most of these taxa. However, Astley's (2016) in vitro data show that the highest muscle power recorded for anurans is 483 W/kgmuscle; thus species with jumping power out-puts above 483 W/kgmuscle are candidates for power amplification. Finally, given the high species diversity of Anura (>7,000 species; AmphibiaWeb, 2019), we emphasize that this analysis of 68 species is preliminary, though we do not expect our results to substantially

1058 | Functional Ecology MENDOZA Et Al.
change with additional sampling (see Supporting Information for additional justification).
2.7 | The ecological drivers of variation in jumping power
We tested two key factors that may explain the variation in muscle-mass-specific jumping power across anurans. First, we investigated the relationship between jumping muscle-mass-specific power and body mass. Second, we examined how inhabiting different micro-habitats may affect jumping muscle-mass-specific power. We tested microhabitat in three ways. First, we tested the effect of micro-habitat in general (i.e. all microhabitat specialists have different jumping power). Second, we tested whether species that showed back-burrowing behaviours exert lower muscle-mass-specific power outputs than all other species. Specifically, because elastic elements deform to store energy from muscle work, there could be a trade-off between storing potential energy in elastic elements versus transmitting force and limb control during behaviours such as burrowing (Higham & Irschick, 2013; Richards & Sawicki, 2012). Thus, we created a second categorization where we placed all bur-rowing and semi-burrowing species under the class ‘burrowing’ and all other microhabitat specialists were classified as ‘other’. We refer to this model as ‘burrowing versus non-burrowing’. Third, we tested whether species that inhabit arboreal environments show higher
muscle-mass-specific power (and amplify more power) than all other species. We considered this a possibility because some of the best anuran jumpers described to date are arboreal (Astley, 2016; Marsh & John-Alder, 1994; Peplowski & Marsh, 1997; Roberts et al., 2011). In this third categorization we placed all arboreal species under the class ‘arboreal’ and all other microhabitat specialists were classified as ‘other’. We refer to this model as ‘arboreal versus non-arboreal’.
We tested these hypotheses with phylogenetic generalized least-squares regression (PGLS; Martins & Hansen, 1997), using the pgls function in the package cApEr (version 0.2) in r (Orme et al., 2013). For these analyses we allowed lambda to takes its maxi-mum-likelihood value (Revell, 2010). All models had log-transformed species mean muscle-mass-specific jumping power as the response variable. We compared 11 models, which we describe here but also list in Table 2. The first model was a null model. Models two through five investigated the importance of (logged) body mass, microhabi-tat, back-burrowing and arboreality individually. Models six through eight combined body mass with one of the three habitat categories, and the final three models were similar to models six through eight but included an interaction term between the two predictor vari-ables. We compared these 11 models using AICc scores, which allow one to simultaneously compare a set of related models (Burnham & Anderson, 2002). We also calculated AICc weights (wAIC), which can be interpreted as the proportional support of each model out of all those considered. Moreover, by summing the AICc weights of all models in which each individual variable occurred, we were able
Model R2 AICc ΔAICc Weight
Null — −0.62 12.79 0.00
Body mass .15 −11.00 2.40 0.13
Microhabitat .02 3.40 16.81 0.00
Burrowing versus non-burrowing .02 −2.64 10.76 0.00
Arboreal versus non-arboreal .00 −0.93 12.47 0.00
Body mass + Microhabitat .24 −6.97 6.44 0.02
Body mass + Burrowing versus non-burrowing
.21 −12.60 0.80 0.30
Body mass + Arboreal versus non-arboreal
.16 −9.92 3.48 0.08
Body mass * Microhabitat .38 −3.28 10.13 0.00
Body mass * Burrowing versus non-burrowing
.26 −13.40 0.00 0.45
Body mass * Arboreal versus non-arboreal
.15 −7.65 5.76 0.02
Note: The results include 11 regression models (from top to bottom): (1) a null model, (2) body mass only, (3) microhabitat only, and (4) burrowing versus non-burrowing only, (5) arboreal versus non-arboreal, (6) body mass and microhabitat (no interaction), (7) body mass and burrowing versus non-burrowing (no interaction), (8) body mass and arboreal versus non-arboreal (no interaction), (9) body mass and microhabitat and their interaction, and (10) body mass and burrow versus non-burrowing and their interaction and (11) body mass and arboreal versus non-arboreal and their interaction. Bold lines indicate the two models with the strongest statistical support, both of which include body mass and the burrowing factor.Abbreviations: ΔAICc, change in AICc; AICc, corrected Akaike information criterion; R2, adjusted R-squared; weights, AICc weight of each model.
TA B L E 2 Relationship between mean muscle-mass-specific jumping power (response variable) and different predictor variables

| 1059Functional EcologyMENDOZA Et Al.
to estimate each variable's importance across models (Johnson & Omland, 2004; Posada & Buckley, 2004).
3 | RESULTS
3.1 | Variation and evolution of jumping power in Anura
Jumping muscle-mass-specific power varied greatly among spe-cies. Mean muscle-mass-specific power across all species was 705.16 W/kgmuscle-mass, and it ranged from a species mean of 102.73 W/kgmuscle-mass in Anaxyrus woodhousii (a large, semi-burrowing species) to 1806.16 W/kgmuscle-mass in Dendropsophus sarayacuensis (a small, arboreal species). Jumping power outputs beyond the physi-ological limit of anuran muscle (max measured 483 W/kgmuscle-mass; Astley, 2016) appear to have evolved once at the base of the anuran tree, which has a reconstructed state value of 380.12 W/kgmuscle-mass but whose 95% confidence interval goes beyond 483 (95% CI = [227.54, 635.00] W/kgmuscle-mass; Figure 1). Additionally, this analysis suggested that the ability to exert high jumping power outputs might have been lost at least once in frogs. Reduced muscle-mass-specific power outputs occurred within Bufonidae, and Anaxyrus in particu-lar showed a reconstructed value of 143.63 W/kgmuscle-mass and a confidence interval that excluded typical muscle power for anurans (95% CI = [120.23, 171.58] W/kgmuscle-mass; Figure 1). This inter-val also excludes the lowest measured muscle power for bufonids (183 W/kgmuscle-mass; Astley, 2016), further reducing the likelihood of amplification in this taxon. On the other hand, muscle-mass-specific jumping power outputs far greater than measured for anuran mus-cle appears at the base of Hylidae with a reconstructed state of 717.45 W/kgmuscle-mass (95% CI = [609.91, 843.94] W/kgmuscle-mass; Figure 1).
3.2 | The ecological drivers of variation in jumping power
Of the 11 models we considered, the most strongly supported model included body mass, burrowing versus non-burrowing, and their in-teraction (Table 2), with an wAIC of 0.45. This model explained 26% of the interspecific variation in muscle-mass-specific jumping power. The second most-supported model included body mass and burrow-ing versus non-burrowing with no interaction term (wAIC = 0.30). The remaining models had a combined weight of 0.25 (Table 2). The summed AICc weight of the seven models with body mass as a fac-tor was 1.00. The summed weight of models that included burrow-ing versus non-burrowing was 0.75, whereas the summed weight of models that included all microhabitats was 0.02 and 0.10 for those that included arboreal versus non-arboreal. Thus, across all models, both body mass and burrowing are important in explaining variation in muscle-mass-specific jumping power (Figure 2), while general mi-crohabitat differences and being arboreal are not.
4 | DISCUSSION
In this study, we investigated factors that influence variation in jumping power (and power amplification) across 68 anuran species that are diverse in microhabitat use, that vary substantially in body mass, and that represent distantly related clades. We found that some anurans generate muscle-mass-specific power outputs that are over three times higher than muscle power alone, while others jump with almost 20 times less power (than those peak species values). In explaining this variation, our results showed support for effects of body mass, burrowing versus non-burrowing, and their interaction. Additionally, we found that in anurans, high muscle-mass-specific jumping power may have arisen once at the base of the anuran phy-logeny and the ability to exert high muscle-mass-specific power may have been secondarily lost or reduced at least once.
The use of elastic mechanisms to generate movements where the maximum power output exceeds the power capacity of mus-cles has been documented in a number of systems (Higham & Irschick, 2013; Ilton et al., 2018; Longo et al., 2019; Patek et al., 2011; Roberts & Azizi, 2011). Given that muscle power varies lit-tle across anurans (Astley, 2016; Roberts et al., 2011), much of the variation we observed in jumping power is likely attributed to vari-ation in the effectiveness of using elastic mechanisms. However, this interpretation assumes that either muscle power is invariant across microhabitat states and body masses (the explanatory vari-ables we investigated), or more generally that the body masses and microhabitat states that we found to have high jumping power do not have high muscle power. We tested these possibilities using
F I G U R E 2 Scatterplot illustrating the relationships between microhabitat, body mass and jumping power for 68 species of anurans. Variables are shown on a log scale in original units. The lines represent phylogenetic generalized least-squares regression lines. The dashed line corresponds to the effect of body mass on non-burrowing species and the solid line corresponds to the effect of body mass on burrowing species. Jumping power decreases with an increase in body mass, and it declines at a faster rate with body mass in burrowing than non-burrowing species
Arboreal
TorrentialTerrestrialSemi-burrowingSemi-aquaticBurrowing
Mea
n m
uscl
e−m
ass−
spec
ific
pow
er (W
/kg)
Body mass (g)1.0 3.5 10.0 35.0 100.0 350.0
100
200
400
800
1,60
0

1060 | Functional Ecology MENDOZA Et Al.
Astley's (2016) muscle-power dataset, using the same methods as above to analyse variation in muscle power of the plantaris longus and semi- membranosus across body masses and microhabitats (see Supporting Information for full details). We found that mass-specific power for both muscles increased with an increase in body mass, in contrast to our pattern of decreased jumping power with increased body mass (Figure 2; Tables S3 and S4; Figure S1). Moreover, power in neither muscle showed a consistent relationship with microhabitat state. These analyses suggest the high jumping power we see here is due to elastic mechanisms used to amplify muscle power. Moreover, the finding that large species seem to have higher muscle power (Astley, 2016; Figure S1) yet lower jumping power (Figure 2) may be indic-ative of the fact that direct muscle actuation relies on high muscle power outputs whereas the use of elastic elements may relax selec-tion on muscle power since muscles can operate at very slow veloc-ities when loading (Longo et al., 2019).
4.1 | Microhabitat
Anurans are diverse in microhabitat use and ecology (Duellman & Trueb, 1986; Wells, 2007) and show distinctive ecomorphology (Moen et al., 2013, 2016). This morphological distinctiveness could result in potential trade-offs between jumping and microhabitat-specific behaviours (e.g. burrowing; Gomes, Rezende, Grizante, & Navas, 2009; Moen, 2019; Zug, 1978), lowering jumping performance. Alternatively, some environments may demand exceptional jumping ability, perhaps beyond what muscles can power alone. In this study, we found that burrowing was associated with overall lower jumping power and a faster decline in power as body mass increased (Table 2; Figure 2), highlighting the imprint of ecology on performance. As mus-cle power does not seem to change with microhabitat state (see above), the lower jumping performance of burrowing species suggests lower power amplification in this group. This pattern could result from a reduction in the amount of elastic structures or an increase in their stiffness. Since burrowing demands the generation and transmission of high forces (Emerson, 1976), a reduction in compliance of elastic structures may be beneficial. In terms of force production, the stretch of a compliant tendon can shift the operating length of a muscle to a lower-force region of the force–length curve (Holt & Williams, 2018). Similarly, a muscle shortening against the stretch of an elastic element might contract faster and thus generate less force follow-ing the force-velocity relationship (Griffiths, 1991). Future work on elastic structures in anurans will allow for direct mechanistic testing of these hypotheses. Moreover, additional studies should compare the demands of combining high-force behaviours like burrowing with high-power behaviours like jumping, given that optimal power does not generally optimize force (Griffiths, 1991; Marsh, 1994).
Reduced amplification may not be the only reason why burrow-ing species show lower jumping power for their body size. Some anu-ran species that burrow with their hindlimbs move by bounding more than long jumping (Reilly et al., 2015). Bounding is characterized as bouts of short hops that rely more on endurance than a single,
powerful movement (Reilly et al., 2015; Wilson, James, Kohlsdorf, & Cox, 2004), reducing the need for high jumping power. Moreover, muscle fibre composition in such cases may favour endurance over power output (Bonine, Gleeson, & Garland, 2001), though thus far there is little support for differing fibre-type composition in anurans (Wilson et al., 2004). It is also unclear that all burrowing species use bounding as a form of locomotion. Regardless, use of a different mode of jumping may be a solution to the potential trade-off con-ferred by burrowing backwards.
Beyond burrowing, we found no significant effects of other microhabitat states on jumping power. We predicted that arboreal species would be more adept at amplifying power, but we found that the microhabitat model (with body mass) had only an AICc weight of 0.02, and that the arboreality model (with mass) had no weight (Table 2). This finding is surprising, given that arboreal spe-cies often show higher power outputs than species from other mi-crohabitats (Astley, 2016; Roberts et al., 2011). However, arboreal species tended to be smaller than other ecomorphs (Figure 2), which may sufficiently account for their high power. Additionally, jumping power in arboreal species may be similar to frogs in other microhab-itats because jumping may not show trade-offs with other micro-habitat-specific behaviours. For example elastic elements may not compromise swimming performance (e.g. through loss of control of movement during stretching), because the fluid properties of water reduce spring loading during swimming (Richards & Sawicki, 2012). Overall, however, we emphasize that despite the poor performance of general microhabitat models (Table 2), further sampling of species may support additional differences between ecomorphs in power at a given mass (i.e. different intercepts) or effect of mass on power (i.e. different slopes). More generally, future studies on other organ-isms that both show high variation in power and diverse ecology will help explore the relationships among ecology, trade-offs and loco-motor performance.
4.2 | Body size
Ecological opportunities may favour smaller body masses to exploit certain habitats or resources. However, to effectively escape preda-tors, smaller species may need comparable jumping performance to bigger species (Emerson, 1978; James et al., 2007; Marsh, 1994). We assessed this possibility by testing how takeoff velocity (which is strongly correlated with jump distance; Marsh, 1994; Marsh & John-Alder, 1994) related to body mass in our dataset. PGLS regression showed a significant positive relationship between takeoff velocity and log-transformed body mass (R2
adj. = .057, F1,60 = 4.697, p = .034). However, the small R2
adj. means that the line explains very little of the data, and small species effectively jump at similar velocities as large species. If smaller species are using elastic mechanisms to cir-cumvent the power limits of their muscles to achieve these similar velocities, they may be using slow, forceful contractions to load elastic elements. This interpretation is consistent with available interspecific data showing that muscle power increases with body

| 1061Functional EcologyMENDOZA Et Al.
mass (Astley, 2016; James, Vanhooydonck, Tallis, & Herrel, 2015; Figure S1).
More generally, Ilton et al. (2018) investigated the conditions under which power-amplifying mechanisms could outperform muscle-powered movements (and vice versa) across a diversity of biological and engineered systems. They found that during fast accelerative movements like jumping, a larger body mass may not gain the same benefits from the use of elastic elements as a smaller mass, since performance may be limited by the inertia of the body, regardless of how quickly elastic elements recoil. As mass increased, the performance of elastically powered systems decreased, such that movements powered by direct transfer of muscle power performed better. This higher reliance on elastic mechanisms at low versus high mass is generally consistent with our results. A subsequent study (Sutton et al., 2019) showed that in terms of maximizing jump height, the range of body mass in an-urans spans the transition point where one mechanism becomes favoured over another. However, the mass at this transition point (2.5g) is almost an order of magnitude lower than the mass at which we see a majority of species whose jumping power is equiv-alent to muscle power (i.e. where species are less likely to amplify power; Figure 2). Future studies could parameterize these models (Ilton et al., 2018; Sutton et al., 2019) with data on anuran muscle physiology to better understand the shift from elastic-powered to muscle-powered jumping with increased body mass.
4.3 | Remaining variation in jumping power
We found that body mass and burrowing behaviour were both important in explaining the variation in jumping muscle-mass-specific power across anuran species. However, the model with the highest statistical support only explained 26% of the total variation in jumping power. What explains the residual variation in power? One possibility is that the elastic elements (i.e. tendon or aponeurosis; Alexander, 1988) may differ in elastic storage ca-pacity across species. Matson, Konow, Miller, Konow, and Roberts (2012) measured the material properties of tendons from different muscle groups in the turkey hindlimb and found that they varied in their elastic modulus (or normalized stiffness), suggesting that their elastic storage capacity may vary. Moreover, beyond material properties, the morphology (e.g. thickness, length) of elastic ele-ments may differ among species, leading to variation in ability to amplify muscle power.
Alternatively, given the large number of upper hindlimb mus-cles that contribute to locomotion in anurans (Prikryl, Aerts, Havelkova, Herrel, & Rocek, 2009), muscle power still might vary greatly among species and contribute to variation in jumping power. While possible, we consider this improbable for three reasons. First, Olson and Marsh (1998) showed in Rana catesbeiana that the semi-membranosus was the most important upper hindlimb mus-cle for generating jumping power, yet Astley (2016) found that the semi-membranosus did not generate significantly more power than
the plantaris longus, the key lower hindlimb muscle for jumping. Second, some species in our study generated power almost two times higher than the highest muscle power ever recorded in ver-tebrates (Askew, Marsh, & Ellington, 2001). Third, as in previously published studies (Astley, 2016; Roberts et al., 2011), we used total hindlimb muscle mass to calculate muscle-mass-specific power. This assumes all muscles generate work and power in jumping, a conservative assumption that will underestimate jumping power (Olson & Marsh, 1998; Reynaga et al., 2019), meaning the discrep-ancy between muscle and jumping power may be even larger than we infer here. However, to directly address this possibility, future studies should measure the power-generating capacity of all mus-cles involved in jumping.
5 | CONCLUSIONS
We tested whether microhabitat, body mass, both, or neither ex-plained the variation in muscle-mass-specific jumping power across a diversity of anurans. We found that body mass and burrowing are both important in explaining variation in jumping power in anu-rans, and our results illustrate the effects that behaviours associ-ated with specific microhabitats can have on locomotion. In order to further understand what drives variation in muscle-mass-specific jumping power, future studies should consider testing the mate-rial properties of potential elastic elements to examine whether the capacity to utilize elastic energy varies among species of varying body sizes and ecologies. Additionally, future studies should examine how temperature affects energy storage capa-bilities of elastic elements and if using this mechanism results in jumping performance that is robust to changes in temperature (see Supporting Information).
ACKNOWLEDG EMENTSWe thank the Oklahoma Department of Wildlife Conservation and the Arkansas Game and Fish Commission for providing us with am-phibian collecting permits. Additionally, we thank Korey Roberts and J.D. Willson for help with fieldwork in Arkansas, as well as Patrick Cussacs, Kendall Scarlett, Elisa Cabrera-Guzman, Dalton Hanson and Allison Hanna for helping collect frogs in Oklahoma. We would also like to thank Marianne Caron for help during jumping data collection and the Azizi lab members for help with data pro-cessing. Finally, we thank Arvind Santhanakrishnan and Matthew B. Lovern for their critical comments that helped improve this man-uscript. This work was supported by Oklahoma State University and the National Science Foundation (DEB-1655812 to DSM).
AUTHORS' CONTRIBUTIONSD.S.M. and E.M. conceived the idea and designed the methodol-ogy; E.M. and D.S.M. collected the data; E.M. and D.S.M. analysed the data; E.M., E.A. and D.S.M. led the writing of the manuscript. All authors contributed critically to the drafts and gave final approval for publication.

1062 | Functional Ecology MENDOZA Et Al.
DATA AVAIL ABILIT Y S TATEMENTData available from the Dryad Digital Repository https://doi.org/ 10.7280/D1295X (Mendoza, Azizi, & Moen, 2020).
ORCIDElizabeth Mendoza https://orcid.org/0000-0002-8903-1465 Emanuel Azizi https://orcid.org/0000-0001-7338-8673 Daniel S. Moen https://orcid.org/0000-0003-1120-0043
R E FE R E N C E SAerts, P. (1998). Vertical jumping in Galago senegalensis: The quest for
an obligate mechanical power amplifier. Philosophical Transactions of the Royal Society of London B: Biological Sciences, 353, 1607–1620. https://doi.org/10.1098/rstb.1998.0313
Alexander, R. M. (1988). Elastic mechanisms in animal movement. Cambridge, UK: Cambridge University Press.
AmphibiaWeb. (2019). Berkeley, CA: University of California. Retrieved from https://amphi biaweb.org
Anderson, C. V., & Deban, S. M. (2010). Ballistic tongue projection in cha-meleons maintains high performance at low temperature. Proceedings of the National Academy Sciences of the United States of America, 107, 5495–5499. https://doi.org/10.1073/pnas.09107 78107
Askew, G. N., Marsh, R. L., & Ellington, C. P. (2001). The mechanical power output of the flight muscles of blue-breasted quail (Coturnix chinensis) during take-off. Journal of Experimental Biology, 204, 3601–3619.
Astley, H. C. (2016). The diversity and evolution of locomotor muscle properties in anurans. Journal of Experimental Biology, 219, 3163–3173. https://doi.org/10.1242/jeb.142315
Astley, H. C., Haruta, A., & Roberts, T. J. (2015). Robust jumping perfor-mance and elastic energy recovery from compliant perches in tree frogs. Journal of Experimental Biology, 218, 3360–3363. https://doi.org/10.1242/jeb.121715
Astley, H. C., & Roberts, T. J. (2012). Evidence for a vertebrate catapult: Elastic energy storage in the plantaris tendon during frog jumping. Biology Letters, 8, 386–389. https://doi.org/10.1098/rsbl.2011.0982
Astley, H. C., & Roberts, T. J. (2014). The mechanics of elastic loading and recoil in anuran jumping. Journal of Experimental Biology, 217, 4372–4378. https://doi.org/10.1242/jeb.110296
Biewener, A. A. (2005). Biomechanical consequences of scaling. Journal of Experimental Biology, 208, 1665–1676. https://doi.org/10.1242/jeb.01520
Biewener, A., & Patek, S. (2018). Animal locomotion. Oxford, UK: Oxford University Press.
Bobbert, M. F. (2013). Effects of isometric scaling on vertical jumping performance. PLoS ONE, 8, e71209. https://doi.org/10.1371/journ al. pone.0071209
Bonine, K. E., Gleeson, T. T., & Garland, T. Jr. (2001). Comparative anal-ysis of fiber-type composition in the iliofibularis muscle of phryno-somatid lizards (Squamata). Journal of Morphology, 250, 265–280. https://doi.org/10.1002/jmor.1069
Burnham, K. P., & Anderson, D. R. (2002). Model selection and multimodel inference: A practical information-theoretic approach. New York, NY: Springer.
de Lisle, S. P., & Rowe, L. (2013). Correlated evolution of allometry and sexual dimorphism across higher taxa. American Naturalist, 182, 630–639. https://doi.org/10.1086/673282
Duellman, W. E., & Trueb, L. (1986). Biology of amphibians. Baltimore, MD: Johns Hopkins University Press.
Emerson, S. B. (1976). Burrowing in frogs. Journal of Morphology, 149, 437–458. https://doi.org/10.1002/jmor.10514 90402
Emerson, S. B. (1978). Allometry and jumping in frogs: Helping the twain to meet. Evolution, 32, 551–564. https://doi.org/10.1111/j.1558-5646. 1978.tb045 98.x
Feng, Y. J., Blackburn, D. C., Liang, D., Hillis, D. M., Wake, D. B., Cannatella, D. C., & Zhang, P. (2017). Phylogenomics reveals rapid, simultaneous diversification of three major clades of Gondwanan frogs at the Cretaceous-Paleogene boundary. Proceedings of the National Academy of Sciences of the United States of America, 114, E5864–E5870. https://doi.org/10.1073/pnas.17046 32114
Gomes, F. R., Rezende, E. L., Grizante, M. B., & Navas, C. A. (2009). The evolution of jumping performance in anurans: Morphological cor-relates and ecological implications. Journal of Evolutionary Biology, 22, 1088–1097. https://doi.org/10.1111/j.1420-9101.2009.01718.x
Griffiths, R. I. (1991). Shortening of muscle fibres during stretch of the active cat medial gastrocnemius muscle: The role of tendon compli-ance. Journal of Physiology, 436, 219–236. https://doi.org/10.1113/jphys iol.1991.sp018547
Higham, T. E., & Irschick, D. J. (2013). Springs, steroids, and slingshots: The roles of enhancers and constraints in animal movement. Journal of Comparative Physiology B, 183, 583–595. https://doi.org/10.1007/s00360-012-0734-z
Holt, N. C., & Williams, C. D. (2018). Can strain-dependent inhibition of cross-bridge binding explain shifts in optimum muscle length? Integrative and Comparative Biology, 58, 174–185. https://doi.org/ 10.1093/ic/icy050
Ilton, M., Bhamla, M. S., Ma, X., Cox, S. M., Fitchett, L. L., Kim, Y., … Patek, S. N. (2018). The principles of cascading power limits in small, fast biological and engineered systems. Science, 360, eaao1082. https://doi.org/10.1126/scien ce.aa01082
James, R. S., Navas, C. A., & Herrel, A. (2007). How important are skeletal muscle mechanics in setting limits on jumping performance? Journal of Experimental Biology, 210, 923–933. https://doi.org/10.1242/jeb. 02731
James, R. S., Vanhooydonck, B., Tallis, J. A., & Herrel, A. (2015). Larger lacertid lizard species produce higher than expected iliotibialis mus-cle power output: The evolution of muscle contractile mechanics with body size. Journal of Experimental Biology, 218, 3589–3595. https://doi.org/10.1242/jeb.124974
Jenkins, F. A. Jr, & Shubin, N. H. (1998). Prosalirus bitis and the anuran caudopelvic mechanism. Journal of Vertebrate Paleontology, 18, 495–510. https://doi.org/10.1080/02724 634.1998.10011077
Johnson, J. B., & Omland, K. S. (2004). Model selection in ecology and evolution. Trends in Ecology and Evolution, 19, 101–108. https://doi.org/10.1016/j.tree.2003.10.013
Longo, S. J., Cox, S. M., Azizi, E., Ilton, M., Olberding, J. P., St Pierre, R., & Patek, S. N. (2019). Beyond power amplification: Latch-mediated spring actuation is an emerging framework for the study of diverse elastic systems. Journal of Experimental Biology, 222, jeb197889. https://doi.org/10.1242/jeb.197889
Lutz, G. J., & Rome, L. C. (1994). Built for jumping: The design of the frog muscular system. Science, 263, 370–372. https://doi.org/10.1126/scien ce.8278808
Marsh, R. L. (1994). Jumping ability of anuran amphibians. In J. H. Jones (Ed.), Comparative vertebrate exercise physiology (pp. 51–111). San Diego: Academic Press Inc.
Marsh, R. L., & John-Alder, H. B. (1994). Jumping performance of hylid frogs measured with high-speed cine film. Journal of Experimental Biology, 188, 131–141.
Martins, E. P., & Hansen, T. F. (1997). Phylogenies and the comparative method: A general approach to incorporating phylogenetic informa-tion into the analysis of interspecific data. The American Naturalist, 149, 646–667. https://doi.org/10.1086/286013
Matson, A., Konow, N., Miller, S., Konow, P. P., & Roberts, T. J. (2012). Tendon material properties vary and are interdependent among turkey hindlimb muscles. Journal of Experimental Biology, 215, 3552–3558. https://doi.org/10.1242/jeb.072728
McElroy, E. J., & McBrayer, L. D. (2010). Getting up to speed: Acceleration strategies in the Florida scrub lizard, Sceloporus woodi.

| 1063Functional EcologyMENDOZA Et Al.
Physiological and Biochemical Zoology, 83, 643–653. https://doi.org/10.1086/653476
Mendoza, E., Azizi, E., & Moen, D. S. (2020). Data from: What explains vast differences in jumping power within a clade? Diversity, ecology, and evolution of anuran jumping power. Dryad Digital Repository, https://doi.org/10.7280/D1295X
Moen, D. S. (2019). What determines the distinct morphology of species with a particular ecology? The roles of many-to-one mapping and trade-offs in the evolution of frog ecomorphology and performance. American Naturalist, 194, E81–E95. https://doi.org/10.1086/704736
Moen, D. S., Irschick, D. J., & Wiens, J. J. (2013). Evolutionary conser-vatism and convergence both lead to striking similarity in ecology, morphology and performance across continents in frogs. Proceedings of the Royal Society B: Biological Sciences, 280, 2013–2156. https://doi.org/10.1098/rspb.2013.2156
Moen, D. S., Morlon, H., & Wiens, J. J. (2016). Testing convergence versus history: Convergence dominates phenotypic evolution for over 150 million years in frogs. Systematic Biology, 65, 146–160. https://doi.org/10.1093/sysbi o/syv073
Moen, D. S., & Wiens, J. J. (2017). Microhabitat and climatic niche change explain patterns of diversification among frog families. The American Naturalist, 190, 29–44. https://doi.org/10.1086/692065
Olson, J. M., & Marsh, R. L. (1998). Activation patterns and length changes in hindlimb muscles of the bullfrog Rana catesbeiana during jumping. Journal of Experimental Biology, 201, 2763–2777.
O'Meara, B. C., Ané, C., Sanderson, M. J., & Wainwright, P. C. (2006). Testing for different rates of continuous trait evolution using likelihood. Evolution, 60, 922–933. https://doi.org/10.111/j.0014-3820.2006.tb011 71.x
Orme, C. D. L., Freckleton, R. P., Thomas, G. H., Petzoldt, T., Fritz, S. A., Isaac, N., & Pearse, W. (2013). Caper: comparative analyses of phylo-genetics and evolution using R, version 0.5.2. Retrieved from http://cran.r-proje ct.org/packa gepcaper
Paradis, E., & Schliep, K. (2019). ape 5.0: An environment for modern phylogenetics and evolutionary analyses in R. Bioinformatics, 35, 526–528. https://doi.org/10.1093/bioin forma tics/bty633
Patek, S. N., Dudek, D. M., & Rosario, M. V. (2011). From bouncy legs to poisoned arrows: Elastic movements in invertebrates. Journal of Experimental Biology, 214, 1973–1980. https://doi.org/10.1242/jeb.038596
Peplowski, M. M., & Marsh, R. L. (1997). Work and power output in the hindlimb muscles of Cuban tree frogs Osteopilus septentrionalis during jumping. Journal of Experimental Biology, 200, 2861–2870.
Posada, D., & Buckley, T. R. (2004). Model selection and model averaging in phylogenetics: Advantages of Akaike information criterion and Bayesian approaches over likelihood ratio tests. Systematic Biology, 53, 793–808. https://doi.org/10.1080/10635 15049 0522304
Prikryl, T., Aerts, P., Havelkova, P., Herrel, A., & Rocek, Z. (2009). Pelvic and thigh musculature in frogs (Anura) and origin of anuran jump-ing locomotion. Journal of Anatomy, 214, 100–139. https://doi.org/10.1111/j.1469-7580.2008.01006.x
Pyron, R. A. (2014). Biogeographic analysis reveals ancient continental vicariance and recent oceanic dispersal in amphibians. Systematic Biology, 63, 779–797. https://doi.org/10.1093/sysbi o/syu042
Reilly, S. M., Montuelle, S. J., Schmidt, A., Naylor, E., Jorgensen, M. E., Halsey, L. G., & Essner, R. L. (2015). Conquering the world in leaps and bounds: Hopping locomotion in toads is actually bounding. Functional Ecology, 29, 1308–1316. https://doi.org/10.1111/1365- 2435.12414
Revell, L. J. (2010). Phylogenetic signal and linear regression on spe-cies data. Methods in Ecology and Evolution, 1, 319–329. https://doi.org/10.1111/j.2041-210X.2010.00044.x
Revell, L. J. (2012). phytools: An R package for phylogenetic compara-tive biology (and other things). Methods in Ecology and Evolution, 3, 217–223. https://doi.org/10.1111/j.2041-210X.2011.00169.x
Revell, L. J. (2013). Two new graphical methods for mapping trait evo-lution on phylogenies. Methods in Ecology and Evolution, 4, 754–759. https://doi.org/10.1111/2041-210X.12066
Reynaga, C. M., Eaton, C. E., Strong, G. A., & Azizi, E. (2019). Compliant substrates disrupt elastic energy storage in jumping tree frogs. Integrative and Comparative Biology, 59(6), 1535–1545. https://doi.org/10.1093/icb/icz069
Richards, C. T., & Sawicki, G. S. (2012). Elastic recoil can either amplify or attenuate muscle–tendon power, depending on inertial vs. fluid dynamic loading. Journal of Theoretical Biology, 313, 68–78. https://doi.org/10.1016/j.jtbi.2012.07.033
Roberts, T. J., Abbott, E. M., & Azizi, E. (2011). The weak link: Do muscle properties determine locomotor performance in frogs? Philosophical Transactions of the Royal Society B: Biological Sciences, 366, 1488–1495. https://doi.org/10.1098/rstb.2010.0326
Roberts, T. J., & Azizi, E. (2011). Flexible mechanisms: The diverse roles of biological springs in vertebrate movement. Journal of Experimental Biology, 214, 353–361. https://doi.org/10.1242/jeb.038588
Schluter, D., Price, T., Mooers, A. Ø., & Ludwig, D. (1997). Likelihood of ancestor states in adaptive radiation. Evolution, 51, 1699–1711. https://doi.org/10.1111/j.1558-5646.1997.tb050 95.x
Sutton, G. P., Mendoza, E., Azizi, E., Longo, S. J., Olberding, J. P., Ilton, M., & Patek, S. N. (2019). Why do large animals never actuate their jumps with latch-mediated springs? Because they can jump higher without them. Integrative and Comparative Biology, 59(6), 1609–1618. https://doi.org/10.1093/icb/icz145
Walker, J. A. (1998). Estimating velocities and accelerations of animal lo-comotion: A simulation experiment comparing numerical differentia-tion algorithms. Journal of Experimental Biology, 201, 981–995.
Wells, K. D. (2007). The ecology and behavior of amphibians. Chicago, IL: University of Chicago Press.
Wilson, R. S., James, R. S., Kohlsdorf, T., & Cox, V. M. (2004). Interindividual variation of isolated muscle performance and fibre-type composition in the toad Bufo viridus. Journal of Comparative Physiology B, 174, 453–459. https://doi.org/10.1007/s00360-004-0431-7
Zug, G. R. (1978). Anuran locomotion–structure and function, 2: Jumping performance of semiaquatic, terrestrial, and arboreal frogs. Smithsonian Contributions to Zoology, 276, 1–32.
SUPPORTING INFORMATIONAdditional supporting information may be found online in the Supporting Information section.
How to cite this article: Mendoza E, Azizi E, Moen DS. What explains vast differences in jumping power within a clade? Diversity, ecology and evolution of anuran jumping power. Funct Ecol. 2020;34:1053–1063. https://doi.org/10.1111/1365-2435.13545