"What Does the Intra-Industry Trade Data on EAC tells us?"
18
International Journal of Academic Research in Economics and Management Sciences September 2012, Vol. 1, No. 5 ISSN: 2226-3624 174 What Does the Intra-Industry Trade Data on EAC tells us? Johansein Rutaihwa Policy Research for Development (REPOA), Tanzania Neema Rutatina, Policy Research for Development (REPOA), Tanzania Abstract The objective of this study is to analyse the effects of EAC regional integration on intra industry trade. In achieving the objective of this study secondary research approach (also known as desk research) integrated in the world economy of which previous research reports, newspaper, magazine, journal content, EAC website, National Bureau of Statistics (NBS) and economic surveys were used. The intra-trade (IIT) is calculated using Grube-Lloyd indicator (1975), where the Intra industries vary between 0 and 1. Higher values indicate a higher level of IIT between countries, showing that a country is more integrated. The scope of the study is limited to 1990- 2010. The pattern of trade in the period between 1990-2000 shows EAC intra-regional trade flows were very low compared to the period between 2004 and 2010 however coming into effect of the East African Customs in January 2005 we see an improvement of the intra trade patterns of the EAC partner states; though it is not immediate. This clearly shows that signing a treaty among the EAC member states has had an effect on the partner states in divergent ways. From this findings this study recommends, the agreement by partner states under Article 13 of the Customs Union Protocol to remove all existing non-tariff barriers to trade and not to impose any new should be adhered and implemented by all member states; member states to abide the Article 81 of the Treaty Establishing the Community that requires member states to recognise the importance of standardization, quality assurance, metrology and testing for the promotion of trade and investment and consumer protection, among other things; Low flow of intra –regional trade in EAC countries is also driven by cultural perspective among their citizen, Thus more public knowledge is required on educate the public on the importance of intra- trade. This goes in hand with having a mechanism of changing members’ mentality to praise what EAC countries produce; policy makers to understand the importance of having good infrastructure and maintaining them; finally other researchers may explore on specific products and the industrial capability in terms of technology and infrastructure on how they can affect intra- regional trade Keywords: Regional Integration, Intra-Industry Trade, EAC, WTO and GATT
-
Upload
independent -
Category
Documents
-
view
1 -
download
0
Transcript of "What Does the Intra-Industry Trade Data on EAC tells us?"

International Journal of Academic Research in Economics and Management Sciences
September 2012, Vol. 1, No. 5 ISSN: 2226-3624
174
What Does the Intra-Industry Trade Data on EAC tells us?
Johansein Rutaihwa Policy Research for Development (REPOA), Tanzania
Neema Rutatina, Policy Research for Development (REPOA), Tanzania
Abstract The objective of this study is to analyse the effects of EAC regional integration on intra industry trade. In achieving the objective of this study secondary research approach (also known as desk research) integrated in the world economy of which previous research reports, newspaper, magazine, journal content, EAC website, National Bureau of Statistics (NBS) and economic surveys were used. The intra-trade (IIT) is calculated using Grube-Lloyd indicator (1975), where the Intra industries vary between 0 and 1. Higher values indicate a higher level of IIT between countries, showing that a country is more integrated. The scope of the study is limited to 1990-2010. The pattern of trade in the period between 1990-2000 shows EAC intra-regional trade flows were very low compared to the period between 2004 and 2010 however coming into effect of the East African Customs in January 2005 we see an improvement of the intra trade patterns of the EAC partner states; though it is not immediate. This clearly shows that signing a treaty among the EAC member states has had an effect on the partner states in divergent ways. From this findings this study recommends, the agreement by partner states under Article 13 of the Customs Union Protocol to remove all existing non-tariff barriers to trade and not to impose any new should be adhered and implemented by all member states; member states to abide the Article 81 of the Treaty Establishing the Community that requires member states to recognise the importance of standardization, quality assurance, metrology and testing for the promotion of trade and investment and consumer protection, among other things; Low flow of intra –regional trade in EAC countries is also driven by cultural perspective among their citizen, Thus more public knowledge is required on educate the public on the importance of intra-trade. This goes in hand with having a mechanism of changing members’ mentality to praise what EAC countries produce; policy makers to understand the importance of having good infrastructure and maintaining them; finally other researchers may explore on specific products and the industrial capability in terms of technology and infrastructure on how they can affect intra- regional trade Keywords: Regional Integration, Intra-Industry Trade, EAC, WTO and GATT

International Journal of Academic Research in Economics and Management Sciences
September 2012, Vol. 1, No. 5 ISSN: 2226-3624
175
Introduction Regional integration is one of the widespread occurrences that have gripped the globe (S. Wagala, 2009). Today regional blocs exist in all parts of the world, despite the existence of the World Trade Organization (WTO) which ensures that there is fair market access that makes the global trading system fully fair to all. The EAC (East African Community), comprising Kenya, Uganda, Tanzania, Rwanda, and Burundi, is one of the most dynamic and evolving regional economic communities in Africa. It has been attracting interest from policymakers and researchers as a result of its steady implementation of an ambitious regional integration agenda since its reintroduction in 1996. The Treaty for the Establishment of the East African Community was signed on 30th November, 1999, with the EAC officially inaugurated in January, 2001. By forming a regional bloc, the expectation is that this will aid the acceleration of the socio-economic transformation of East Africa. To achieve these goals, the plan is to establish a customs union, a common market, subsequently a monetary union, and ultimately a political federation of the East African states. Plans for the formation of a custom union and common market were achieved in 2005 and 2010 consequently and full economic integration is expected by 2013. The EAC aims at achieving its goals and objectives through promotion of sustainable growth and equitable development of the region, including rational utilization of the region's natural resources and protection of the environment; Strengthening and consolidation of the longstanding political, economic, social, cultural and traditional ties and associations between the peoples of the region in promoting a people-centered mutual development: enhancement and strengthening of participation of the private sector and civil society. The EAC’s movement to sign the Common Market Protocol entails easing travel restrictions, harmonizing tariffs, increasing co-operation among security forces, free movement of labor to selected sector, improving communications, sharing electrical power and addressing Lake Victoria issues. According to the EABC report 2008, the overall goal of the EAC regional bloc is to deepen the integration process through liberalization and promotion of intra-regional trade. To date, little is known about the effect of regional integration on intra-trade of the EAC member states, and yet one of the major believed advantages of regional integration is that it creates a bigger market for member states due to the fact that members of a regional bloc reduce or eliminate trade barriers against each other. According to International Trade Statistics Report of 2009, intra Africa’s merchandise trade makes up only 9.6 percent of total merchandise trade in 2008; meaning that 81.4 percent of Africa’s merchandise trade is carried out of the continent. This situation raises the following question to be answered by this study: what are the effects of EAC regional integration on intra industry trade?

International Journal of Academic Research in Economics and Management Sciences
September 2012, Vol. 1, No. 5 ISSN: 2226-3624
176
Literature Review Regional integration can be defined as the cooperation between two or more sovereign states for the purpose of mutual advancement of trade and other economic and increasingly non-economic fields (M.A Consulting Group Report, 2007 pp.9). According to AFNDD Report pp.1 (2008), regional integration can be broadly understood as the unification of states working within a framework to promote free movement of goods, services and factors of production with the intention of improving welfare, reducing poverty and promoting economic development. The most common forms of regional integration are Preferential Trade Agreements (PTA), Free Trade Areas (FTA), Customs Unions, Common Markets and Economic Unions (Ng’ang’a. 2006 pp. 21-22; M.A Consulting Group, 2007 pp.10 and Krugman et al, 2006) Khorana, S. et al., (2007) clarify that regional trade arrangements have become a popular vehicle for the promotion of trade and growth consequently it is recognized by World Trade Organization (WTO) under The Most Favoured Nation (MFN) Clause. This is complimented by deviation allowed under GATT through article XXIV, which incorporates the possibility of regional trading arrangements. According to GATT Article XXIV, a group of countries may form a Free Trade Area and Customs Union, dropping the barriers among themselves subject to some requirements countries in the regional trade arrangement should open up substantially all trade, should integrate within a reasonable length of time and should not increase the general incidence of duties and other regulations of commerce as regards to third countries. One way of measuring economic benefit is by finding out the effect of regional integration on export performance of the member states within the region and total exports by the bloc as a share of world exports. Thus the previously outdated East Africa Community has been resurrecting to improve trade between Kenya, Tanzania, Uganda, Rwanda and Burundi. To facilitate the development of the East African Community, transitional arrangements have been put in place to liberalize inter and intra- regional trade. Khorana, S., uses a partial equilibrium model, and examines the implications of the transitional measures for products sensitive from the Ugandan perspective. The simulation results questioned the underlying rationale for those arrangements. Despite of all these efforts, the question remains whether regional trading blocs create more trade than they divert. On one hand, the lowering of trade barriers among members may lead to greater competition and open up larger markets for producers in member countries. Indeed, a well-crafted trade bloc can increase competition in domestic industries and spur productive efficiency gains which improve the quality and quantity of inputs and goods available to the economy (Dollar, 1992). The greater market size created through the regional trade agreement (RTA) expands opportunities for exports and employment growth. On the other hand, RTAs may augment intra-bloc trade by diverting trade away from non-member countries. The second-best nature of trade liberalization under preferential trade agreements makes it very difficult to

International Journal of Academic Research in Economics and Management Sciences
September 2012, Vol. 1, No. 5 ISSN: 2226-3624
177
assess a priority whether trade effects will be positive such that trade creation will outweigh trade diversion (Clausing 2001). The formation of the new EAC raises the important question of whether this regionally based trading agreement is of economic merit to its members. The success of the EAC will ultimately depend on its ability to promote intra-regional trade. Thus, lowering of tariffs and removal of non-tariff barriers, trade costs will be lower and economic welfare in member countries will rise by facilitating consumer choice and increasing competition among producers. On paper, regional integration appears to be strong and moving towards deeper integration with the implementation of the EAC Customs Union and EAC common market from 2005 and 2010 respectively. Since the new EAC is in its 11th year of operation, it is an opportune time to examine the pace of intra-trade. In analysing the message from EAC-intra trade the following theories are adopted; - Comparative advantage theory, explains how trade is beneficial to all the parties involved (countries, region and individuals) as long as they produce the goods with different relative costs. It supplemented Adam Smith’s Absolute advantage theory, which suggested that if a country can provide a commodity at a cheaper price then it should be bought instead of producing it locally. This theory which is attributed to the classical economist, David Ricardo, shows that what matters is the opportunity cost of production and international trade is not under the umbrella of absolute advantages price but instead it is through comparative advantage. Second, Hecksher-Ohlin Theorem, is the long run model which builds on Ricardo’s theory of comparative advantage, it elaborates factor endowerment theory and it is based on 2x 2 x 2 (two nations, two product and two factors of production). The Theory relies on the eight assumptions namely no barriers to trade, no transport cost, ignore demand side, no specialization to mention just a few. The Heckscher-Ohlin theory presents the issue that international and interregional differences in production costs occur because of the differences in the supply of production factors (Ball, McCulloch, 1999). Those goods that require a large amount of the abundant, thus less costly factor will have lower production costs, enabling them to be sold for less in international markets (Salvatore, 1995). Stopler- Samuelson theorem, It was developed to explain how tariffs would affect the incomes of workers and capitalist within a country. It argues that the “opening of trade in a labor abundant country will increase the relative price of (labor-intensive) export goods, expanding export sectors and the demand for factors used intensively in (labor-intensive) export production”. Suppose that there are constant returns to scale in both sectors and no factor intensity reversal. In this case an increase in relative price of good increases the real return to the factor that is used intensively in the production of that good and decreases the real return to the other factors.

International Journal of Academic Research in Economics and Management Sciences
September 2012, Vol. 1, No. 5 ISSN: 2226-3624
178
Rybzynski theorem, it explains the relationship between changes in national factor endowment and changes in the final outputs of the final goods within the context of Hecksher- Ohlin model. This implies that an increase in ta national`s endowment of a factor will led to an increase in the output of the good that uses that factor intensively and decrease in the output of the other good. This is very much applicable to most of LDCs as it good in explaining investment and population growth which are mostly characterise most African countries The Specific factor Model (Jones, 1971; Samuelson, 1971) adjusted the Stolper-Samuelson theory by relaxing the restrictive assumption of perfect factor mobility across domestic sectors. When a country liberalize its trade, the price of the goods in the export industries will rise, and the price of goods in the import competing industries will fall due to the competing imports. The value of the marginal product in the export industry will rise above the current wage and this will induce the firms to hire more workers. The firm will just raise the wages so as to attract more workers and expand output. This will result in the movement of workers from import- competing industries to the export industries. The discussion above for both empirical studies and theoretical reviews shows there is a knowledge gap that needs to be addressed by researchers. One being the over generalization of regional integration, the notion found here indicates that most of the studies took the approach of analyzing the regional integration as whole and try to generalize the benefit accrued from being members. The second, being a concentration on Non-Tariff barriers (NTB) elimination and trade facilitation studies. Different from other studies, this study concentrates on intra-trade indicator only to understand the nature of EAC integration and leaves the part of identifying specific products that are being trade within the members to other researchers. Methodology This paper has employed secondary research approach (also known as desk research) to depict the message from EAC Intra-industry trade by using qualitative and quantitative data mostly previous research reports, newspaper, magazine and journal content. Other sources are EAC website, NBS and economic surveys. The scope of the study is limited to 1990-2010. Sometimes secondary research is required in the preliminary stages of research to determine what is known already and what new data are required, or to inform research design (Johansein et al, 2011). A key performance area in secondary research is the full citation of original sources, usually in the form of a complete listing Findings and Discussion. The most common trade indictor used to describe and monitor developments in international trade flows from various aspects intra-industry trade (IIT) is calculated using Grube-Lloyd indicator (1975), where the Intra industries vary between 0 and 1. Higher values indicate a higher level of IIT between countries, showing that a country is more integrated in the world economy. Furthermore the conceptual framework designed by author is adopted (figure 1 below). In the conceptual

International Journal of Academic Research in Economics and Management Sciences
September 2012, Vol. 1, No. 5 ISSN: 2226-3624
179
framework regional integration is an independent variable and intra- industry is a dependent variable.
Figure1: Conceptual Framework
Source: Author
Findings, Discussion and Policy Recommendations The pattern of trade in the period between 1990-2000 shows, EAC intra-regional trade flows were very low compared to the period between 2004 and 2010. Looking at table 2 below, the results shows from 1990-2000 Burundi had very low exports to the region, and although there was a slight increase in imports, they were still very low; Kenya’s value of exports and imports was declining in this period despite the increase witnessed in 1996/97; Rwanda’s exports and imports were declining in value in this period; Tanzania exports to the region, although increasing in value were very low and Uganda had a declining value of exports and a stagnant
Regional Integrations
Reduction and
elimination of tariffs on
goods and services
traded within the EAC
Reduction and
elimination of non-tariff
barriers on goods and
services traded within
the EAC
Integration of various
policies (trade,
monetary, legal, etc)
Elimination of
trade barriers
(tariffs and
non-tariff
barriers)
Improvement in export performance as indicated by intra-industry trade

International Journal of Academic Research in Economics and Management Sciences
September 2012, Vol. 1, No. 5 ISSN: 2226-3624
180
value of imports. This results has two implications, first from 1990-2000`s Burundi and Rwanda were not members of EAC and the operation of EAC came into force in January 2001 hence this kind of trend is justifiable; second, the results does imply that, the Kenya, Tanzania and Ugandan markets can be of great use for all three countries if are well managed. After the signing of the protocol establishing the East African Customs Union in March 2004 and its coming into effect in January 2005 we see an improvement of the intra trade patterns of the EAC partner states; however it is not immediate (table 2). Data shows the Tanzania intra trade is still in favor of the rest of EAC as it was in the first phase of 2004 to 2010 (table 1). By 2007 exports of all member states had increased greatly in comparison to 1996, and imports from the EAC also increased, with the exception of Uganda. This implies that that signing a treaty among the EAC member states has had an effect on the partner states in divergent ways. Similarly, in 2008, the percentage of intra-export between EAC members’ states shows that Kenya’s exports to the EAC region are evenly distributed in Uganda, Tanzania and Rwanda, estimated at 26% of the total exports. Kenya is also a significant destination of Tanzania’s exports, estimated at 44%. Her exports to Uganda are much lower, estimated at 28% of exports. Uganda’s main export destination is Rwanda, which is almost 36%, followed by Burundi at 31% and Tanzania at 25%. Tanzania’s exports to Rwanda and Burundi are even at 14%. The findings further show that Burundi’s exports within the EAC region is skewed towards Rwanda at 58%. Her exports to Kenya, Uganda and Tanzania are evenly distributed at 14 %. Rwanda her main export destination in the region is Kenya at 56%, with the rest of the countries receiving 11% each. On the other hand, in the same period imports within EAC are predominantly imported from the rest of the world, such that the share of imports from this category ranges between 43% in Burundi to 75% in Tanzania. But even with the slight increase in exports and imports within the region, according to statistics trade between EAC and the rest of the world (table 1&2) are still far more than trade within the EAC. Table 2 shows that in 2003 – 2010 exports from EAC to the rest of the world have been growing steadily. This is could be due to the fact that the EAC regional bloc is still not fully integrated and various barriers to trade still exist, which hamper the intra-regional trade flow. The fact that EAC member states trade in similar products which are similarly priced further discourages trade. These findings are supported by Kimenyi, Lewis, & Routman, (2012), who found that despite increase of intra- regional trade, EAC member countries trade much with the rest of the EAC because they are trading the same products with few product to exchange from each other From this findings the study recommends, as the EAC continues to integrate should continue implement Article 13 of the Customs Union Protocol of continue eliminating non-tariff barriers like rules of origin, quality conditions imposed by the importing country on the exporting countries, sanitary and phyto-sanitary conditions, restrictive licenses, corrupt and/or lengthy

International Journal of Academic Research in Economics and Management Sciences
September 2012, Vol. 1, No. 5 ISSN: 2226-3624
181
customs procedures, bribery and corruption as these kind of restrictions are costly nationally and regionally. Despite the fact that, these barriers benefit the domestic producers they are losses associated with excessive production and restricted consumption of protected goods. In addition, the affected countries will always retaliate with similar barriers which end in unwarranted protection which is catastrophic to a regional bloc. EAC partner states most especially the newly acceded members that still depend on fewer exports need to diversify their export base. EAC member states should diversify both horizontally (into completely new export sectors) and vertically (out of primary into manufactured exports that is, support industrialization and add value to their export commodities) this will undoubtedly boost their export performance within the region thus, aid EAC integration into the global economy. Low flow of intra –regional trade in EAC countries is also driven by cultural perspective among their citizen. For instance Tanzania and Uganda were taken as source of raw materials and Kenya were known as industrial area since the colonial era. This makes difficult for some of the products within the member states to penetrate to each other’s market. Thus this study proposes more public knowledge is required on educate the public on the importance of intra-trade. This goes in hand with having a mechanism of changing members’ mentality to praise what EAC countries produce. Also regional integration should be radar for the producer to produce commodities with good quality, of high standard at reasonable price to attract trade within the regional EAC partner states should put in place safety nets in cases where the regional bloc has catastrophic effects on their domestic producers. In addition, partner states should make the necessary reforms like put in place complimentary policies and to the integration. Furthermore, member states to abide the Article 81 of the Treaty Establishing the Community that requires member states to recognise the importance of standardization, quality assurance, metrology and testing for the promotion of trade and investment and consumer protection, among other things. Finally need to work on trade facilitation agreement. Having regional integration is the blessing to EAC countries as the population grows the demand for commodities increase hence creation of bigger market. However, the exploitation of this opportunity is still a challenge to EAC countries due to infrastructure problems. Therefore we recommend policy makers should understand the importance of having good infrastructure and maintaining them. Furthermore, the private sector should be engaged more on addressing the issue of infrastructure through Public – Private partnership approach in different stages of projects. The study has portrayed the intra- regional trade of export and import without digging the specific product we trade to each other. Next study will deal with what we trade to each other in order to inform all stakeholders on which product have great demand for Tanzania and EAC in general.

International Journal of Academic Research in Economics and Management Sciences
September 2012, Vol. 1, No. 5 ISSN: 2226-3624
182
This study points out that despite the minimal increase in the exports within the region, the EAC will benefit its members in various ways in the long run. Therefore it recommends that since limited intra- regional trade is due to limited trade flow resulted from EAC countries having similar export structure with comparative advantage on resource based products which led to export competition than complementarity. Other researchers may explore on specific products and the industrial capability in terms of technology and infrastructure on how they can affect intra- regional trade References Ball, McCulloch, 1999, International Business: the Challenge of Global Competition, Text Only, 7th, Hc, Bohanes, J. 2002. “Multiple Memberships in Regional Trading Arrangements: Reflections on Tanzania and in General.” Trade Brief. Trade Law Centre for Southern Africa, Stellenbosch. Brenton, P., and H. Imagawa, 2004. “Rules of Origin, Trade and Customs.” In De Wulf, L., and Jones, 1971; Samuelson, 1971 Review of international trade theory. Jones, R. 2007a: “Key international trade theorems and large shocks”: Forthcoming, International Review of Economics and Finance J. Sokol (editors), Customs Modernization Handbook. Washington, DC World Bank, Castro, L., C. Kraus and M. de la Rocha, 2004. Regional Trade Integration in East Africa: Trade and Revenue Impacts of the Planned East African Community Customs Union. Africa Region Working Paper Series No. 72. World Bank, Washington, DC. Dominic Salvatore, 1999, International Economics, Wiley De la Rocha, M., 2003. The Cotonou Agreement and its Implications for the Regional Trade Agenda in Eastern and Southern Africa. World Bank Policy Research Working Paper No. 3090. World Bank, Washington, DC. Ethier, W. 1974; “Some of the theorems of international trade with many goods and Factors”: Journal of International Economics, Volume 4; 199–206. Hinkle, L.E., and M. Schiff, 2004. “Economic Partnership Agreements Between Sub-Saharan Africa and the EU: A Development Perspective.” World Economy 27(9): 1321-1333. Hope, D., V. Bhowon, and F. Ruhindi, 2003. “Study to Develop a Legal, Institutional and Administrative Structure for the Customs Union.” Report prepared for the East African

International Journal of Academic Research in Economics and Management Sciences
September 2012, Vol. 1, No. 5 ISSN: 2226-3624
183
Community Secretariat and the European Commission. Imani Development Consultants, Pretoria. Johansein Rutaihwa and Amina Mkwawa 2011, Empirical Analysis of China-Africa Economic and Trade Cooperation; for Good or Bad?: A Case of Tanzania , International Journal of Academic Research in Business and Social Sciences Vol.1, No.3. Kimenyi, M. S., Lewis, Z. A., & Routman, B. (2012). Intra- African Trade in Context. In B. A. Initiative, Accelerating Growth Through Improved Intra- African Trade (pp. 1-5). Brookings Africa Growth Initiative. Kritzinger-van Niekerk, L., and E. Moreira, 2002. “Regional Integration in Southern Africa: Overview of Recent Developments.” Discussion Paper, World Bank, Washington, DC. Krugman, Paul, and Maurice Obstfeld (2007), International Economics: Theory and Policy, 7th ed. Boston, MA: Addison Wesley. ISBN: 0321278844 Kweka, J., and P. Mboya, 2004. “Regional Integration and Poverty: A Case Study of Tanzania.” Working Paper. Economic and Social Research Foundation, Dar es Salaam. Matambalya, F., 2004. “The Implications of Tanzania‟s Withdrawal from COMESA: Qualitative Overview of Implications and Reflections on the Way Forward.” Discussion Paper. University of Dar es Salaam, Dar es Salaam. Schiff, M, and L.A. Winters, 2003. Regional Integration and Development. Oxford University Press, New York. Staicy Wagala (2009), Regional integration and export performance: a case of the East African community: Unpulished thesis. Stahl, M, 2005. Overlapping membership in COMESA, EAC, SACU and SADC: Trade Policy Options to Overcome the Problem of Multiple Memberships. Arusha: Deutsche Gesellschaft für Technische Zusammenarbeit (GTZ). United Republic of Tanzania, 2003. National Trade Policy: Trade Policy for a Competitive Economy and Export-Led Growth. Ministry of Industry and Trade, Dar es Salaam. Van Beers, C. P. and H. Linneman. 1988. “Commodity composition of trade in manufacturing and South-South trade potential.” Research memorandum, Free University, Faculty of Economics and Econometrics, Amsterdam, The Netherland

International Journal of Academic Research in Economics and Management Sciences
September 2012, Vol. 1, No. 5 ISSN: 2226-3624
184
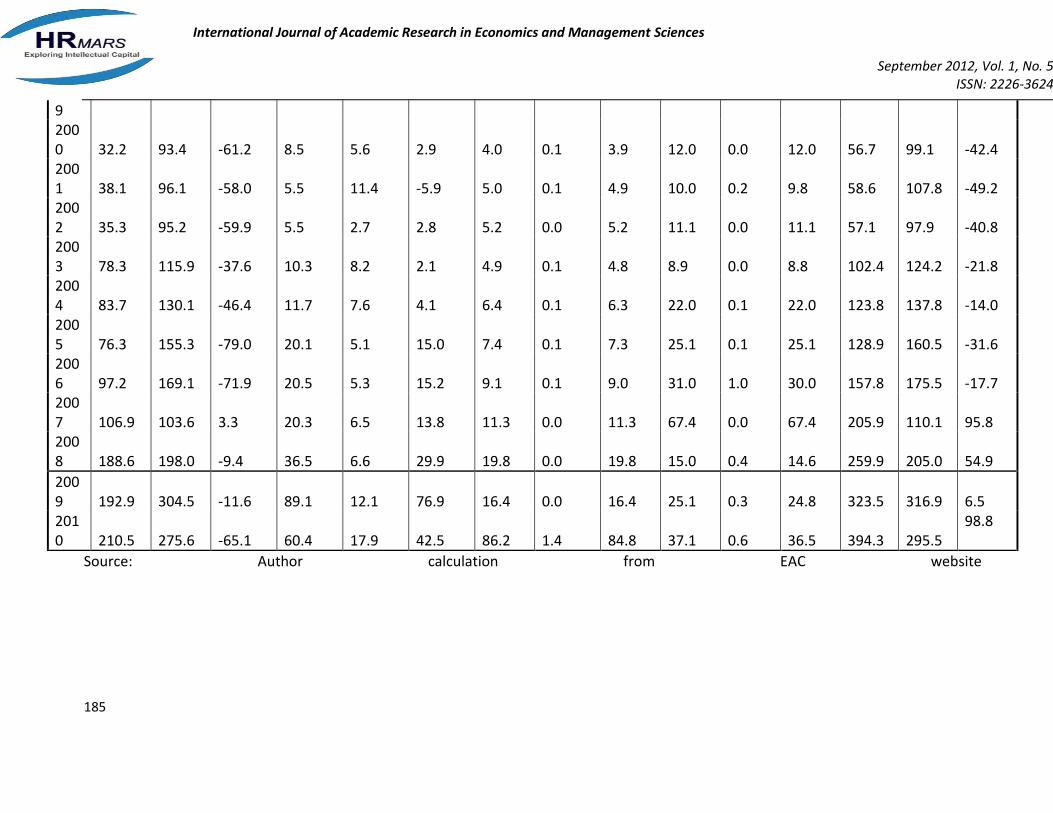
Table 1 : Tanzania Intra - EAC Trade (Million USD)
Year
Tanzania to Kenya
Tanzania from Kenya
Balance Tanzania to/from Kenya
Tanzania to Uganda
Tanzania from Uganda
Balance Tanzania to/from Uganda
Tanzania to Rwanda
Tanzania from Rwanda
Balance Tanzania to/from Rwanda
Tanzania to Burundi
Tanzania from Burundi
Balance Tanzania to/from Burundi
Tanzania to rest of EAC
Tanzania from rest of EAC
Balance Tanzania to/from rest of EAC
1990 12.1 24.7 -12.6 9.5 0.6 8.9 0.0 0.0 0.0 1.0 0.0 1.0 22.6 25.3 -2.7 1991 8.0 33.5 -25.5 13.2 0.9 12.3 11.0 0.0 11.0 4.0 0.0 4.0 36.2 34.4 1.8 1992 8.8 43.4 -34.6 16.9 0.9 16.0 21.0 0.0 21.0 17.0 1.0 16.0 63.7 45.3 18.4 1993 7.8 90.9 -83.1 9.0 0.9 8.1 25.0 0.0 25.0 11.0 1.0 10.0 52.8 92.8 -40.0 1994 10.0 111.0 -101.0 23.8 1.0 22.8 30.0 0.0 30.0 5.0 2.0 3.0 68.8 114.0 -45.2 1995 12.5 137.0 -124.5 11.6 4.6 7.0 36.0 0.0 36.0 6.0 5.0 1.0 66.1 146.6 -80.5 1996 14.2 281.9 -267.7 8.4 8.9 -0.5 43.0 0.0 43.0 4.0 4.0 0.0 69.6 294.8 -225.2 1997 12.8 95.7 -82.9 11.6 1.9 9.7 6.0 1.0 5.0 3.0 0.0 3.0 33.4 98.6 -65.2 1998 26.1 105.8 -79.7 6.5 2.3 4.3 4.0 0.1 3.9 3.0 0.1 2.9 39.6 108.2 -68.6 199 21.0 95.1 -74.1 4.7 6.0 -1.3 3.0 0.0 3.0 6.0 0.0 6.0 34.7 101.1 -66.4
International Journal of Academic Research in Economics and Management Sciences
September 2012, Vol. 1, No. 5 ISSN: 2226-3624
185
Source: Author calculation from EAC website
9 2000 32.2 93.4 -61.2 8.5 5.6 2.9 4.0 0.1 3.9 12.0 0.0 12.0 56.7 99.1 -42.4 2001 38.1 96.1 -58.0 5.5 11.4 -5.9 5.0 0.1 4.9 10.0 0.2 9.8 58.6 107.8 -49.2 2002 35.3 95.2 -59.9 5.5 2.7 2.8 5.2 0.0 5.2 11.1 0.0 11.1 57.1 97.9 -40.8 2003 78.3 115.9 -37.6 10.3 8.2 2.1 4.9 0.1 4.8 8.9 0.0 8.8 102.4 124.2 -21.8 2004 83.7 130.1 -46.4 11.7 7.6 4.1 6.4 0.1 6.3 22.0 0.1 22.0 123.8 137.8 -14.0 2005 76.3 155.3 -79.0 20.1 5.1 15.0 7.4 0.1 7.3 25.1 0.1 25.1 128.9 160.5 -31.6 2006 97.2 169.1 -71.9 20.5 5.3 15.2 9.1 0.1 9.0 31.0 1.0 30.0 157.8 175.5 -17.7 2007 106.9 103.6 3.3 20.3 6.5 13.8 11.3 0.0 11.3 67.4 0.0 67.4 205.9 110.1 95.8 2008 188.6 198.0 -9.4 36.5 6.6 29.9 19.8 0.0 19.8 15.0 0.4 14.6 259.9 205.0 54.9
2009 192.9 304.5 -11.6 89.1 12.1 76.9 16.4 0.0 16.4 25.1 0.3 24.8 323.5 316.9 6.5 2010 210.5 275.6 -65.1 60.4 17.9 42.5 86.2 1.4 84.8 37.1 0.6 36.5 394.3 295.5
98.8

International Journal of Academic Research in Economics and Management Sciences
September 2012, Vol. 1, No. 5 ISSN: 2226-3624
186
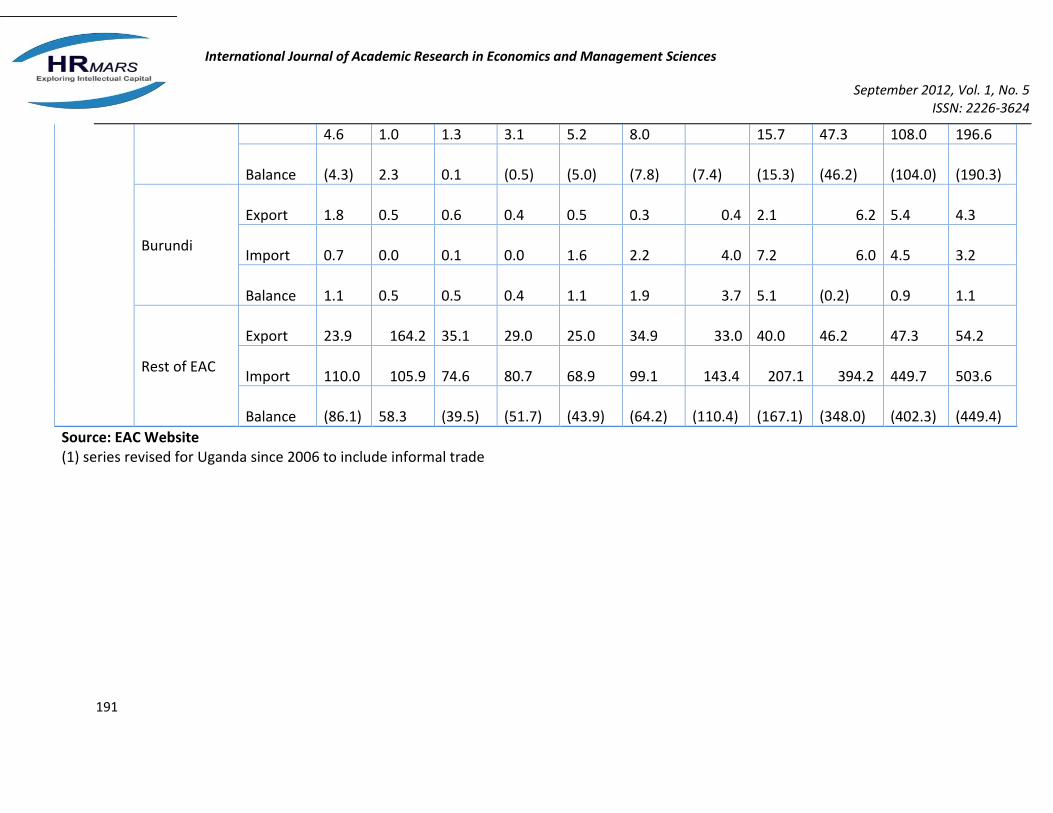
Table 2: Intra - EAC Trade (Million USD)
Country Partner Flow 2000 2001 2002 2003 2004 2005 2006 2007 2008 2009 2010
Burundi
Kenya
Export 0.4
0.4 1.2
2.2 1.5
0.4
1.5
Import 27.5
34.0 35.4
29.4
30.3
23.3
31.0
Balance (27.1)
(33.6)
(34.3)
(27.3)
(28.8)
(22.9)
(29.5)
Uganda
Export 0.7
0.9 1.2
1.0 1.6
1.9
2.2
Import 11.0
11.4 16.9
38.7
34.5
69.1
28.9
Balance (10.3)
(10.4)
(15.7)
(37.7)
(32.9)
(67.2)
(26.7)
Tanzania
Export 0.2 - -
0.1 0.0
0.6
0.3
Import 14.9
12.8 7.6
9.8
16.8
34.1
27.0
Balance (14.7)
(12.8)
(7.6)
(9.7)
(16.8)
(33.5)
(26.7)
Rwanda
Export 4.2
2.7 3.1
2.2 3.5
3.1
8.6
Import 0.7
0.9 1.0
1.7 3.1
2.6
2.5
Balance 2.1 0.4

International Journal of Academic Research in Economics and Management Sciences
September 2012, Vol. 1, No. 5 ISSN: 2226-3624
187
3.5 1.8 0.5 0.5 6.1
Rest of EAC
Export 5.4
4.0 5.5
5.3 6.6
6.0
12.6
Import 54.1
59.1 60.9
79.5
84.7
129.2
89.4
Balance (48.7)
(55.0)
(55.5)
(74.2)
(78.1)
(123.2)
(76.8)
Tanzania
Kenya
Export 38.1
35.3
78.3
83.7
76.3 97.2 106.9 188.6
192.9 210.5
Import 96.1
95.2 115.9 130.1 155.3 169.1 103.6 198.0
304.5 275.6
Balance (58.0)
(59.9)
(37.6)
(46.4)
(79.0)
(71.9)
3.3
(9.4)
(111.6) -65.1
Uganda
Export 5.5
5.5
10.3
11.7
20.1 20.5
20.3
36.5
89.1 60.4
Import 11.4
2.7
8.2
7.6
5.1 5.3
6.5 6.6
12.1 17.9
Balance (5.9)
2.8
2.1
4.1
15.0 15.2
13.8
29.9
76.9 42.5
Rwanda
Export 5.0
5.2
4.9
6.4
7.4 9.1
11.3
19.8
16.4 86.2
Import 0.1 -
0.1
0.1
0.1 0.1 - -
0.0 1.4
Balance 4.9
5.2
4.8
6.3
7.3 9.0
11.3
19.8
16.4 84.8
Burundi Export 10.0
11.1
8.9
22.0
25.1 31.0
67.4
15.0
25.1 37.1
Import - 1.0 - 0.4 0.6

International Journal of Academic Research in Economics and Management Sciences
September 2012, Vol. 1, No. 5 ISSN: 2226-3624
188
0.2 0.0 0.1 0.1 0.3
Balance 9.8
11.1
8.8
22.0
25.1 30.0
67.4
14.6
24.8 36.5
Rest of EAC
Export 58.6
57.1 102.4 123.8 128.9 157.8 205.9 259.9
323.5 394.3
Import 107.8 97.9 124.2 137.8 160.5 175.5 110.1 205.0
316.9 295.5
Balance (49.2)
(40.8)
(21.8)
(14.0)
(31.6)
(17.7)
95.8
54.9
6.5 98.8
Uganda
Kenya
Export 59.1
61.0
78.0
77.0
72.4 184.9 204.2 271.9
276.7
284.4
Import 281.5 405.5 403.3 399.2 520.7 464.9 522.7 552.0 545.9
549.1
Balance (222.4)
(344.5)
(325.3)
(322.2)
(448.3)
(280.0)
(318.5)
(280.1)
(269.2)
(264.7)
Tanzania
Export 6.7
5.8
5.8
12.2
15.4 35.3 107.6 145.3
155.6
90.9
Import 6.7
7.5
10.8
15.8
30.1 33.0
33.7
61.4
46.4
61.6
Balance - (1.7)
(5.0)
(3.6)
(14.7) 2.3
73.9
83.9
109.2
29.3
Rwanda
Export 16.6
12.9
20.8
24.7
36.1 55.6 122.4 192.1
170.2
182.2
Import 0.4
1.4
0.5
0.6
0.5 1.2
4.2 4.0
5.0
8.9
Balance 16.2
11.5
20.3
24.1
35.6 54.4 118.2 188.1
165.2
173.4
Burundi Export 20.6

International Journal of Academic Research in Economics and Management Sciences
September 2012, Vol. 1, No. 5 ISSN: 2226-3624
189
4.8 6.3 10.1 18.1 20.8 42.7 45.4 63.6 59.3
Import 0.0
0.6
0.3
0.7
0.2 - - - - -
Balance 4.8
5.7
9.8
17.4
20.6 20.4
41.9
44.5
63.6
59.3
Rest of EAC
Export 87.2
86.0 114.7 132.0 144.7 296.3 476.9 654.7
666.2
616.9
Import 288.6 415.0 414.9 416.3 551.5 499.0 560.6 617.4 597.4
619.5
Balance (201.4)
(329.0)
(300.2)
(284.3)
(406.8)
(202.7)
(83.7)
37.3
68.8
(2.7)
Kenya
Uganda
Export 307.5 382.2 405.5 403.3 468.1 564.9 385.7 498.5 611.2
596.6
657.1
Import 6.6
8.7
8.6
13.6
12.8
18.5 13.9
88.8
75.5
57.1
116.4
Balance 300.9 373.5 396.9 389.7 455.3 546.4 371.8 409.7 535.8
539.5
540.7
Tanzania
Export 141.1 172.0 184.1 191.8 226.3 264.1 253.6 331.5 422.4
388.2
418.8
Import 11.9
7.4
10.4
18.0
25.4
41.0 62.6
99.2 105.0
100.8
133.0
Balance 129.2 164.5 173.7 173.8 200.9 223.1 191.0 232.3 317.4
287.4
285.8
Rwanda
Export - 44.8
54.8
79.2
78.2
96.3 66.1
86.2 129.4
123.0
132.9
Import - 0.0
0.1
0.1
0.2
1.5 2.9
1.3 0.4
3.1
5.4
Balance - 63.2 129.1

International Journal of Academic Research in Economics and Management Sciences
September 2012, Vol. 1, No. 5 ISSN: 2226-3624
190
44.7 54.7 79.1 78.0 94.8 84.9 119.9 127.4
Burundi
Export - 23.5
22.8
36.2
27.5
34.0 35.4
29.4
30.3
59.3
68.8
Import - 0.9
0.0
0.0
0.4
0.4 1.2
2.2 1.5
1.2
1.8
Balance - 22.6
22.8
36.2
27.1
33.6 34.2
27.2
28.8
58.1
67.0
Rest of EAC
Export 448.6 622.5 667.2 710.5 810.1 974.3 735.8 952.2 1,213.4
1,167.2
1,277.6
Import 18.5
17.0
19.1
31.7
38.4
61.5 84.1 191.6 182.0
162.2
256.6
Balance 430.1 605.4 648.2 678.8 771.7 912.8 651.6 760.6 1,031.4
1,005.1
1,021.0
Rwanda
Kenya
Export 24.3
20.0
16.5
19.1
23.7
32.6 29.9
34.4
32.0
32.4
39.4
Import 18.6
9.6
10.6
7.4
38.9
49.9 69.4
85.7 173.0
176.4
169.4
Balance 5.7
10.4
5.9
11.7
(15.1)
(17.3)
(39.5)
(51.3)
(141.0)
(144.0)
(130.0)
Tanzania
Export 7.9
5.3
1.5
0.8
0.6
1.8 1.9
3.2 6.9
5.6
4.2
Import 4.2
0.3
0.8
1.1
23.4
39.0 61.6
98.5 167.9
160.7
134.5
Balance 3.7
5.0
0.6
(0.3)
(22.7)
(37.2)
(59.8)
(95.4)
(161.0)
(155.1)
(130.3)
Uganda Export 0.2
3.3
1.4
2.5
0.1
0.2 0.9
0.4 1.1
4.0
6.3
Import 8.3
International Journal of Academic Research in Economics and Management Sciences
September 2012, Vol. 1, No. 5 ISSN: 2226-3624
191
4.6 1.0 1.3 3.1 5.2 8.0 15.7 47.3 108.0 196.6
Balance (4.3)
2.3
0.1
(0.5)
(5.0)
(7.8)
(7.4)
(15.3)
(46.2)
(104.0)
(190.3)
Burundi
Export 1.8
0.5
0.6
0.4
0.5
0.3 0.4
2.1 6.2
5.4
4.3
Import 0.7
0.0
0.1
0.0
1.6
2.2 4.0
7.2 6.0
4.5
3.2
Balance 1.1
0.5
0.5
0.4
1.1
1.9 3.7
5.1
(0.2)
0.9
1.1
Rest of EAC
Export 23.9 164.2
35.1
29.0
25.0
34.9 33.0
40.0
46.2
47.3
54.2
Import 110.0 105.9
74.6
80.7
68.9
99.1 143.4 207.1 394.2
449.7
503.6
Balance (86.1)
58.3
(39.5)
(51.7)
(43.9)
(64.2)
(110.4)
(167.1)
(348.0)
(402.3)
(449.4)
Source: EAC Website (1) series revised for Uganda since 2006 to include informal trade