What can gene flow and recruitment dynamics tell us about connectivity between European hake stocks...
12
Research papers What can gene flow and recruitment dynamics tell us about connectivity between European hake stocks in the Eastern North Atlantic? Alfonso Pita a , Montse Pe ´ rez a,n , Santiago Cervin ˜o b , Pablo Presa a a University of Vigo, Faculty of Marine Sciences—ECIMAT Marine Station, 36310 Vigo, Spain b Instituto Espan˜ol de Oceanografı ´a, Centro Oceanogra ´fico de Vigo, 36200 Vigo, Spain article info Article history: Received 15 January 2010 Received in revised form 9 September 2010 Accepted 21 September 2010 Available online 29 September 2010 Keywords: Merluccius merluccius European hake stocks Gene flow Fish connectivity Fishery genetics Assessment data abstract Systematic genetic analyses of fish populations allow the testing of temporal stability in their genetic structures and better understanding their pattern of connectivity. In this study the pattern of gene flow between the two Atlantic stocks of the European hake has been examined for the period 2000–2002. Present analyses indicate that a large genetic homogeneity existed among all Atlantic populations in that period, and that a systematic grouping occurred between Porcupine Bank samples and Cantabric ones. This scenario is congruent with an inter-annual gene flow from central grounds of the northern stock (Porcupine and Great Sole) to Iberian grounds inhabited by the southern stock. Additionally, estimated migration figures were in agreement with the good recruitments observed in the southern stock after 2003 despite the spawning biomass was at its historical minimum. Altogether these results highlight the central role of Porcupine bank and Great Sole in making sustainable both stocks and advocate the integrative management of this hake fishery by means of a multidisciplinary assessment. & 2010 Elsevier Ltd. All rights reserved. 1. Introduction A great problem caused by overfishing is the constant reduction in the size of fish populations over several generations (Hutchings, 2005). Such reduction brings about the erosion of their effective population size with the consequent increase of inbreeding and the reduction of their adaptive potential due to the loss of rare alleles (Crozier, 1997). Therefore, fishery manage- ment should prevent the erosion of population sizes in order to avoid irreversible collapses. The correct identification of fishery management units is a prerequisite to achieve a long-term sustainability of fisheries. The definition of management units based on geographical boundaries, political regulations or phenotypic characteristics of the species not always matches the ideal of stock as a reproductively isolated production unit, basically because of life-cycle dependent migrations, sex-biased dispersal, unstable barriers to gene flow, habitat selection or the recent impact of global environmental change on marine habitats (Reiss et al., 2009). A growing concern exists nowadays among geneticists and managers to define stocks that combine both disciplines at reaching better informed management decisions (Waples et al., 2008). Stock definition should be directly related to the connectivity pattern of the species. Therefore, knowledge on demographic connectivity between populations is relevant to foresee their exploitation risk. Information on connectivity can help to identify relevant areas or stocks upon their capacity to both, self-seeding and biomass exportation towards minor or depleted neighbouring grounds. The genetic analysis proves to be a useful tool to define stock boundaries because connectivity can be measured through gene flow estimations (Seeb et al., 1999). Genetic studies of marine and estuarine fishes have typically shown a negative correlation between dispersion capacity and population differentiation (Waples, 1987) and have served at deciphering the genetic status of many species, stocks, and subpopulations. For instance, the analysis of allozyme polymorphisms in Sardina pilchardus and Engraulis encrasicolus from the Mediterranean Sea has shown a partial reproductive isolation between subpopulations of the Aegean Sea and the Ionic Sea (Spanakis et al., 1989). Also, the use of microsatellite variation has allowed depicting significant differences among populations of Gadus morhua from the North- west Atlantic during stock-separated periods with an apparent temporally stable genetic structuring (Ruzzante et al., 2000). More recently, mitochondrial DNA analyses on populations of Larabicus quadrilineatus from the Red Sea allowed recommendation for their independent management as different stocks in order to make its fisheries sustainable (Froukh and Kochzius, 2007). The European hake Merluccius merluccius is a demersal species of major concern in Europe regarding its economic impact and its sustainable exploitation (ICES, 2009a, 2009b). The northern hake stock is distributed from the western coast of Norway (621N) to Contents lists available at ScienceDirect journal homepage: www.elsevier.com/locate/csr Continental Shelf Research 0278-4343/$ - see front matter & 2010 Elsevier Ltd. All rights reserved. doi:10.1016/j.csr.2010.09.010 n Corresponding author. Tel./fax: +34 986812567. E-mail addresses: [email protected] (A. Pita), [email protected] (M. Pe ´ rez), [email protected] (S. Cervin ˜ o), [email protected] (P. Presa). Continental Shelf Research 31 (2011) 376–387
Transcript of What can gene flow and recruitment dynamics tell us about connectivity between European hake stocks...
Continental Shelf Research 31 (2011) 376–387
Contents lists available at ScienceDirect
Continental Shelf Research
0278-43
doi:10.1
n Corr
E-m
santiago
journal homepage: www.elsevier.com/locate/csr
Research papers
What can gene flow and recruitment dynamics tell us about connectivitybetween European hake stocks in the Eastern North Atlantic?
Alfonso Pita a, Montse Perez a,n, Santiago Cervino b, Pablo Presa a
a University of Vigo, Faculty of Marine Sciences—ECIMAT Marine Station, 36310 Vigo, Spainb Instituto Espanol de Oceanografıa, Centro Oceanografico de Vigo, 36200 Vigo, Spain
a r t i c l e i n f o
Article history:
Received 15 January 2010
Received in revised form
9 September 2010
Accepted 21 September 2010Available online 29 September 2010
Keywords:
Merluccius merluccius
European hake stocks
Gene flow
Fish connectivity
Fishery genetics
Assessment data
43/$ - see front matter & 2010 Elsevier Ltd. A
016/j.csr.2010.09.010
esponding author. Tel./fax: +34 986812567.
ail addresses: [email protected] (A. Pita), mon@
[email protected] (S. Cervino), pressa@uvigo
a b s t r a c t
Systematic genetic analyses of fish populations allow the testing of temporal stability in their genetic
structures and better understanding their pattern of connectivity. In this study the pattern of gene flow
between the two Atlantic stocks of the European hake has been examined for the period 2000–2002.
Present analyses indicate that a large genetic homogeneity existed among all Atlantic populations in
that period, and that a systematic grouping occurred between Porcupine Bank samples and Cantabric
ones. This scenario is congruent with an inter-annual gene flow from central grounds of the northern
stock (Porcupine and Great Sole) to Iberian grounds inhabited by the southern stock. Additionally,
estimated migration figures were in agreement with the good recruitments observed in the southern
stock after 2003 despite the spawning biomass was at its historical minimum. Altogether these results
highlight the central role of Porcupine bank and Great Sole in making sustainable both stocks and
advocate the integrative management of this hake fishery by means of a multidisciplinary assessment.
& 2010 Elsevier Ltd. All rights reserved.
1. Introduction
A great problem caused by overfishing is the constantreduction in the size of fish populations over several generations(Hutchings, 2005). Such reduction brings about the erosion oftheir effective population size with the consequent increase ofinbreeding and the reduction of their adaptive potential due tothe loss of rare alleles (Crozier, 1997). Therefore, fishery manage-ment should prevent the erosion of population sizes in order toavoid irreversible collapses. The correct identification of fisherymanagement units is a prerequisite to achieve a long-termsustainability of fisheries. The definition of management unitsbased on geographical boundaries, political regulations orphenotypic characteristics of the species not always matchesthe ideal of stock as a reproductively isolated production unit,basically because of life-cycle dependent migrations, sex-biaseddispersal, unstable barriers to gene flow, habitat selection or therecent impact of global environmental change on marine habitats(Reiss et al., 2009). A growing concern exists nowadays amonggeneticists and managers to define stocks that combine bothdisciplines at reaching better informed management decisions(Waples et al., 2008). Stock definition should be directly related tothe connectivity pattern of the species. Therefore, knowledge on
ll rights reserved.
uvigo.es (M. Perez),
.es (P. Presa).
demographic connectivity between populations is relevant toforesee their exploitation risk. Information on connectivity canhelp to identify relevant areas or stocks upon their capacity toboth, self-seeding and biomass exportation towards minor ordepleted neighbouring grounds.
The genetic analysis proves to be a useful tool to define stockboundaries because connectivity can be measured through geneflow estimations (Seeb et al., 1999). Genetic studies of marine andestuarine fishes have typically shown a negative correlationbetween dispersion capacity and population differentiation(Waples, 1987) and have served at deciphering the genetic statusof many species, stocks, and subpopulations. For instance, theanalysis of allozyme polymorphisms in Sardina pilchardus andEngraulis encrasicolus from the Mediterranean Sea has shown apartial reproductive isolation between subpopulations of theAegean Sea and the Ionic Sea (Spanakis et al., 1989). Also, the useof microsatellite variation has allowed depicting significantdifferences among populations of Gadus morhua from the North-west Atlantic during stock-separated periods with an apparenttemporally stable genetic structuring (Ruzzante et al., 2000). Morerecently, mitochondrial DNA analyses on populations of Larabicus
quadrilineatus from the Red Sea allowed recommendation for theirindependent management as different stocks in order to make itsfisheries sustainable (Froukh and Kochzius, 2007).
The European hake Merluccius merluccius is a demersal speciesof major concern in Europe regarding its economic impact and itssustainable exploitation (ICES, 2009a, 2009b). The northern hakestock is distributed from the western coast of Norway (621N) to
A. Pita et al. / Continental Shelf Research 31 (2011) 376–387 377
north Cape Breton, a deep canyon in the Bay of Biscay spanningnorthwest along the French continental shelf (ICES Division IIIa,Sub-areas IV, VI, and VII, and Division VIIIa, b, and d). In terms ofCommunitarian regulation the southern hake stock spans fromsouthern Bay of Biscay to the Gulf of Cadiz (ICES Divisions VIIIcand IXa) (ICES, 2005), although the species extends along North-African coasts to the Western Saharan Fishery (e.g., Lloris et al.,2003). The northern stock is more relevant than the southern oneregarding biomass volume and economic impact in Europe(Villasante et al., 2008), and ICES considers them independentlyfor assessment and management purposes. Recent scientificadvice from the International Council for the Exploration of theSea has indicated that the southern hake stock in ICES DivisionsVIIIc and IXa has been subjected to high mortality by fishing. Suchmortality has eroded the quantities of mature individuals in thesea to the extent that this stock might not be able to replenish byreproduction, and as result is threatened with collapse (EC, 2005).After the implementation of the northern hake management planto cope with such a potential collapse (ICES, 2001) fishingmortality has been kept close to the precautionary limit andnowadays the Northern stock seems to be in its full reproductivecapacity and sustainably exploited. However, the southern stockis considered overfished and although a recovery plan wasimplemented in 2006 its fishing mortality has not decreased(ICES, 2009a, 2009b).
Despite the apparent optimal trend of the recovery plansimplemented, several concerns remain elusive such as theputative separation between both stocks or the good recruitments(R) of the southern stock after 2003, when the population size wasat its minimum level. Recent genetic information (Pita et al.,unpublished data) indicates that the assumed separation betweenstocks, traditionally believed to be influenced by the Cape BretonCanyon (Casey and Pereiro, 1995), by the shape and width of thecontinental shelf, and by seasonally dependent water currentsdynamics (Valdes et al., 1996), might not be the best managementscenario for this species. Several genetic studies performed in thelast decade have suggested a more complex population structureof hake in the Atlantic North than the existence of a single discretepopulation. For instance, significant genetic differences werereported between Norwegian and Celtic samples using micro-satellites (Lundy et al., 1999) or between Irish and French samplesusing allozymes (Roldan et al., 1998). However, other traditionalstudies found unimodal morphometric characteristics in thisstock (Jones and Mackie, 1970) and a lack of allozyme differentia-tion between samples ranging from Norway to the Bay of Biscay(Mangaly and Jamieson, 1978). More recently, neither spatial nortemporal stability patterns of population structure were observedwith microsatellites in some samples from southern Bay ofBiscay (e.g., Lundy et al., 2000), therefore advising a revisionof the between-stocks division. The genetic homogeneity of theEuropean hake suggested by the aforementioned studies is inagreement with recent works performed in the Bay of Biscay onpopulation dynamics of eggs and larvae (Alvarez et al., 2004)and with a migration between stocks mediated by the passivedrift of larvae and pre-recruits (e.g., Bartsch et al., 1996).However, the controversy between genetic data and populationdynamics remains alive because of the uncertain existence of alife-stage dependent migration due to the stability of nurseryareas in the Bay of Biscay in time, size and location (Gil andSanchez, 1996).
A first source of uncertainty related with studies attempting todecipher genetic structures is the distinct genetic informationafforded from each genetic marker. In marine fishes typicallyshowing low levels of population genetic differentiation, it hasbeen suggested that large sample sizes and various typesof markers should be used to resolve stock structure issues
(Ward, 2000). For instance, using mitochondrial DNA it has beenshown that Australian populations of the fish Acanthopagrus
butcheri were genetically differentiated between estuaries whilemicrosatellites were able to distinguish a larger number ofpopulations and allozymic variation exhibited minimal spatialstructuring (Burridge and Versace, 2007). A second source ofuncertainty regarding the connectivity pattern of the Europeanhake is the difficulty to define a sound sampling design toproperly test the persistence of genetic structures. This problem isrelated to the analysis of very few sampled sites (from one tothree except in Mangaly and Jamieson, 1978) not geographicallyor temporally structured (but see Lundy et al., 2000) andconsisting either of juveniles, pre-spawning adults, mixed age-classes, or pooled sampling sites. Therefore, crucial informationon population genetic dynamics between these Atlantic stocks ofhake remains elusive until proper sampling designs are enforced.
Microsatellite markers used to depict fine-scale geneticdifferences in this species (Lundy et al., 2000) have been appliedin this study to make feasible the comparison with previousgenetic datasets. The inter-annual stability of the genetic relation-ships between populations of both stocks has been tested on awider sampling effort than previously enforced and using asimultaneous range sampling on spawning adults. Migration ratesbetween six Atlantic hake grounds have been estimated usinginformation from the rare alleles scored in the genetic dataset.Finally, an interpretation of the pattern of genetic connectivityamong grounds has been done in the light of historical recruit-ment dataset from both Atlantic stocks.
2. Material and methods
2.1. Sampling and DNA extraction
Fifty-two samples comprising 1123 mature adults (fork-length435 cm) were taken in the main six hake grounds of theEuropean Atlantic in autumn of years 2000, 2001, and 2002.Sampling was performed in local fishing vessels and in researchvessels used for biological surveys by the Spanish IEO in theIberian shelf and in the Porcupine Bank. The sample setconsidered ranged from north Bay of Biscay to Rockall and theNorth Sea (northern hake stock) and from south Bay of Biscay tothe southern Galician coast (southern hake stock) (Table 1).Samples consisted of collecting a piece of gill tissue from each20–30 individuals per site, immersing them in absolute ethanol,and registering their global positioning system (GPS) coordinatesonboard. A piece of E25 mg of gill tissue was washed in miliQwater and air-dried for 10 min to remove excess ethanol.Methodology used for DNA extraction and purification consistedof a combination of the salting-out method (Miller et al., 1988)and the standard phenol:chloroform method (Sambrook et al.,1989).
2.2. Microsatellite genotyping
Individuals were genotyped with five microsatellite markerspreviously described for this species (Moran et al., 1999).Microsatellites termed Mmer-hk3b, Mmer-hk9b, and Mmer-hk20b
were multiplexed in the PCR reaction admixture using 5 pmol ofeach primer, 1.5 mM MgCl2, and co-amplified at 55 1C ofannealing temperature. The other two loci termed Mmer-hk29b
and Mmer-hk34b were independently PCR-amplified at 55 1C,using 10 pmol per primer, and 1.0 or 1.7 mM MgCl2, respectively.The amplification admixture of 15 ml consisted of 50 ng DNAtemplate, 200 mM of each dNTPs, 1�BSA, 0.75 U Taq DNA
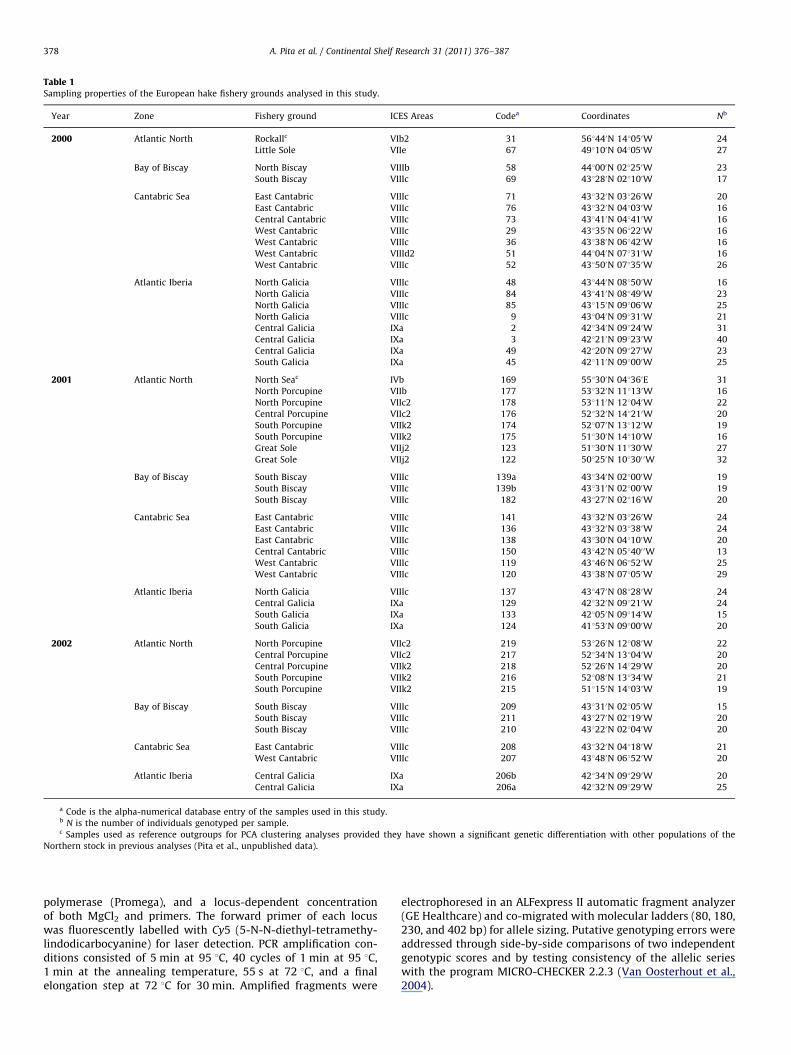
Table 1Sampling properties of the European hake fishery grounds analysed in this study.
Year Zone Fishery ground ICES Areas Codea Coordinates Nb
2000 Atlantic North Rockallc VIb2 31 561440N 141050W 24
Little Sole VIIe 67 491100N 041050W 27
Bay of Biscay North Biscay VIIIb 58 441000N 021250W 23
South Biscay VIIIc 69 431280N 021100W 17
Cantabric Sea East Cantabric VIIIc 71 431320N 031260W 20
East Cantabric VIIIc 76 431320N 041030W 16
Central Cantabric VIIIc 73 431410N 041410W 16
West Cantabric VIIIc 29 431350N 061220W 16
West Cantabric VIIIc 36 431380N 061420W 16
West Cantabric VIIId2 51 441040N 071310W 16
West Cantabric VIIIc 52 431500N 071350W 26
Atlantic Iberia North Galicia VIIIc 48 431440N 081500W 16
North Galicia VIIIc 84 431410N 081490W 23
North Galicia VIIIc 85 431150N 091060W 25
North Galicia VIIIc 9 431040N 091310W 21
Central Galicia IXa 2 421340N 091240W 31
Central Galicia IXa 3 421210N 091230W 40
Central Galicia IXa 49 421200N 091270W 23
South Galicia IXa 45 421110N 091000W 25
2001 Atlantic North North Seac IVb 169 551300N 041360E 31
North Porcupine VIIb 177 531320N 111130W 16
North Porcupine VIIc2 178 531110N 121040W 22
Central Porcupine VIIc2 176 521320N 141210W 20
South Porcupine VIIk2 174 521070N 131120W 19
South Porcupine VIIk2 175 511300N 141100W 16
Great Sole VIIj2 123 511300N 111300W 27
Great Sole VIIj2 122 501250N 101300 0W 32
Bay of Biscay South Biscay VIIIc 139a 431340N 021000W 19
South Biscay VIIIc 139b 431310N 021000W 19
South Biscay VIIIc 182 431270N 021160W 20
Cantabric Sea East Cantabric VIIIc 141 431320N 031260W 24
East Cantabric VIIIc 136 431320N 031380W 24
East Cantabric VIIIc 138 431300N 041100W 20
Central Cantabric VIIIc 150 431420N 051400 0W 13
West Cantabric VIIIc 119 431460N 061520W 25
West Cantabric VIIIc 120 431380N 071050W 29
Atlantic Iberia North Galicia VIIIc 137 431470N 081280W 24
Central Galicia IXa 129 421320N 091210W 24
South Galicia IXa 133 421050N 091140W 15
South Galicia IXa 124 411530N 091000W 20
2002 Atlantic North North Porcupine VIIc2 219 531260N 121080W 22
Central Porcupine VIIc2 217 521340N 131040W 20
Central Porcupine VIIk2 218 521260N 141290W 20
South Porcupine VIIk2 216 521080N 131340W 21
South Porcupine VIIk2 215 511150N 141030W 19
Bay of Biscay South Biscay VIIIc 209 431310N 021050W 15
South Biscay VIIIc 211 431270N 021190W 20
South Biscay VIIIc 210 431220N 021040W 20
Cantabric Sea East Cantabric VIIIc 208 431320N 041180W 21
West Cantabric VIIIc 207 431480N 061520W 20
Atlantic Iberia Central Galicia IXa 206b 421340N 091290W 20
Central Galicia IXa 206a 421320N 091290W 25
a Code is the alpha-numerical database entry of the samples used in this study.b N is the number of individuals genotyped per sample.c Samples used as reference outgroups for PCA clustering analyses provided they have shown a significant genetic differentiation with other populations of the
Northern stock in previous analyses (Pita et al., unpublished data).
A. Pita et al. / Continental Shelf Research 31 (2011) 376–387378
polymerase (Promega), and a locus-dependent concentrationof both MgCl2 and primers. The forward primer of each locuswas fluorescently labelled with Cy5 (5-N-N-diethyl-tetramethy-lindodicarbocyanine) for laser detection. PCR amplification con-ditions consisted of 5 min at 95 1C, 40 cycles of 1 min at 95 1C,1 min at the annealing temperature, 55 s at 72 1C, and a finalelongation step at 72 1C for 30 min. Amplified fragments were
electrophoresed in an ALFexpress II automatic fragment analyzer(GE Healthcare) and co-migrated with molecular ladders (80, 180,230, and 402 bp) for allele sizing. Putative genotyping errors wereaddressed through side-by-side comparisons of two independentgenotypic scores and by testing consistency of the allelic serieswith the program MICRO-CHECKER 2.2.3 (Van Oosterhout et al.,2004).
A. Pita et al. / Continental Shelf Research 31 (2011) 376–387 379
2.3. Data analyses
Allele frequencies, observed and expected heterozygosities,and Hardy–Weinberg equilibrium tests were carried out withGenepop 4.0 (Raymond and Rousset, 1995). Genetic parameterssuch as number of alleles, allelic richness, and fixation indiceswithin samples (FIS), between samples (FST), and between hakegrounds (FCT) were calculated with Fstat 2.9.3.2 (Goudet, 1995).Differences in genetic parameters (HO, HE, RS, FIS, and FST) betweensamples were assessed by comparing their average valuesthrough 1000 permutation tests of samples among hake groundsusing Fstat. The model of isolation by distance (IBD) is defined as adecrease in the genetic similarity among populations as thegeographic distance between them increases (Wright, 1943). Thismodel was tested using ISOLDE as implemented in Genepop 4.0,which explores the regression between pair-wise values ofthe logarithm of geographic distance and the genetic distance[FST/(1�FST)] between populations (Rousset, 1997). The geneticvariance was partitioned among hake grounds and/or amongyears, as well as among samples within grounds or within year,using an analysis of molecular variance (AMOVA) as implementedin Arlequin 3.11 (Excoffier et al., 2005), i.e., an analysis of variancethat tests the differential distribution of the molecular varianceamong hierarchical levels. Significance tests for the fixationcoefficient between grounds (FCT, a measure of the geneticdistance between given groups) were obtained through 1023permutations of multilocus genotypes among samples, and theassociated probability (P) was estimated as the proportion ofF-values from randomised datasets that were larger or equal tothat observed. Principal component analyses (PCA) were com-puted to explore the relationship between grounds or amongsamples, using a correlation matrix of allele frequencies and thestatistical package SPSS 17.0. The effective number of migrants(Nem) exchanged among populations per generation was calcu-lated using the private alleles observed in the sample system(Slatkin, 1985) and the closest regression line (Barton and Slatkin,1986). Parameter Nem is based on the effective population size(Ne, the minimum number of breeders explaining the geneticvariance observed in the population) and the gene flow (m), andprivate alleles are those gene variants specific of a givenpopulation. The basic rationale underlying Slatkin’s (1985)method is that under high gene flow, private alleles would be atvery low frequency because they are new mutations not yetdispersed among populations. Temporal datasets used in hakefishery assessment were affordable from ICES database (1982–2007). Serial data collected corresponded to the Spawning StockBiomass (SSB) and to the Recruitment Biomass (R) of both hakestocks, northern and southern. SSB and R data were obtained byVirtual Population Analysis calibration in the northern stock, andthrough Bayesian models on the southern stock (ICES, 2009b). TheSSB of the northern stock was calculated using a constantmaturity at age, meanwhile an annual maturity was used forthe southern stock. Multiple regressions of SSB and R data werecalculated across years and stocks, and differences betweenvariances of the R/SSB rate per stock were explored with anF-test using SPSS 17.0.
3. Results
3.1. Intrapopulation variation
Genetic parameters such as number of alleles (A), genediversity (He), and allele richness (Rs) did not differ betweenyears (2000, 2001, and 2002) or between the six main groundsof the European hake (Table 2). Multimodal allele series were
mainly observed in Atlantic Iberia, especially in some yearsamples (e.g., 2002). Three markers showed systematic deviationsto Hardy–Weinberg expectations in all samples (locus Mmer-
hk29b, average FIS7SD¼0.43370.125; locus Mmer-hk34b,average FIS7SD¼0.28570.091; locus Mmer-hk9b, averageFIS7SD¼0.21870.148).
3.2. Genetic differentiation
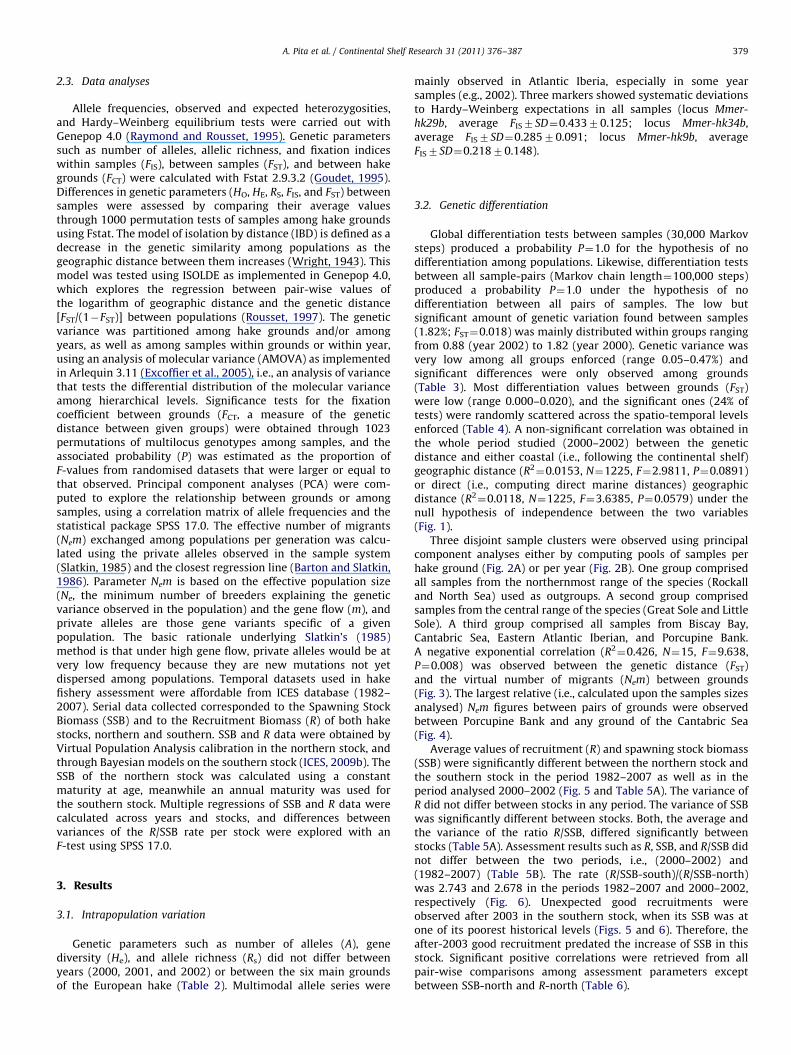
Global differentiation tests between samples (30,000 Markovsteps) produced a probability P¼1.0 for the hypothesis of nodifferentiation among populations. Likewise, differentiation testsbetween all sample-pairs (Markov chain length¼100,000 steps)produced a probability P¼1.0 under the hypothesis of nodifferentiation between all pairs of samples. The low butsignificant amount of genetic variation found between samples(1.82%; FST¼0.018) was mainly distributed within groups rangingfrom 0.88 (year 2002) to 1.82 (year 2000). Genetic variance wasvery low among all groups enforced (range 0.05–0.47%) andsignificant differences were only observed among grounds(Table 3). Most differentiation values between grounds (FST)were low (range 0.000–0.020), and the significant ones (24% oftests) were randomly scattered across the spatio-temporal levelsenforced (Table 4). A non-significant correlation was obtained inthe whole period studied (2000–2002) between the geneticdistance and either coastal (i.e., following the continental shelf)geographic distance (R2
¼0.0153, N¼1225, F¼2.9811, P¼0.0891)or direct (i.e., computing direct marine distances) geographicdistance (R2
¼0.0118, N¼1225, F¼3.6385, P¼0.0579) under thenull hypothesis of independence between the two variables(Fig. 1).
Three disjoint sample clusters were observed using principalcomponent analyses either by computing pools of samples perhake ground (Fig. 2A) or per year (Fig. 2B). One group comprisedall samples from the northernmost range of the species (Rockalland North Sea) used as outgroups. A second group comprisedsamples from the central range of the species (Great Sole and LittleSole). A third group comprised all samples from Biscay Bay,Cantabric Sea, Eastern Atlantic Iberian, and Porcupine Bank.A negative exponential correlation (R2
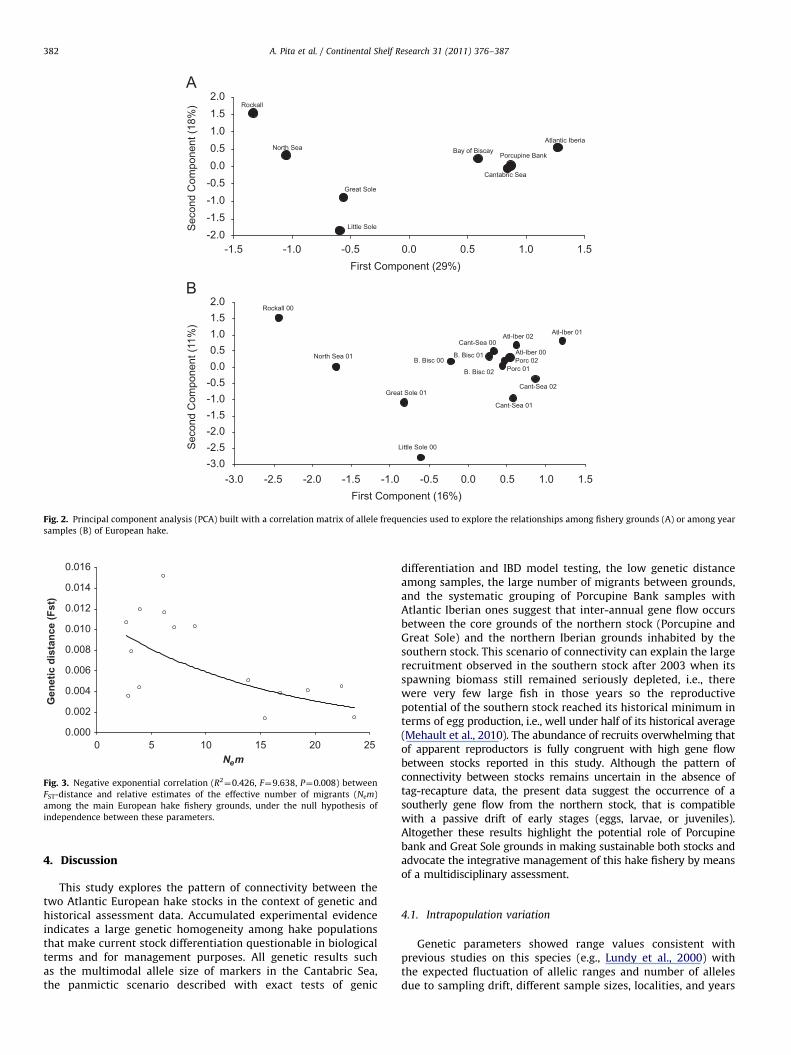
¼0.426, N¼15, F¼9.638,P¼0.008) was observed between the genetic distance (FST)and the virtual number of migrants (Nem) between grounds(Fig. 3). The largest relative (i.e., calculated upon the samples sizesanalysed) Nem figures between pairs of grounds were observedbetween Porcupine Bank and any ground of the Cantabric Sea(Fig. 4).
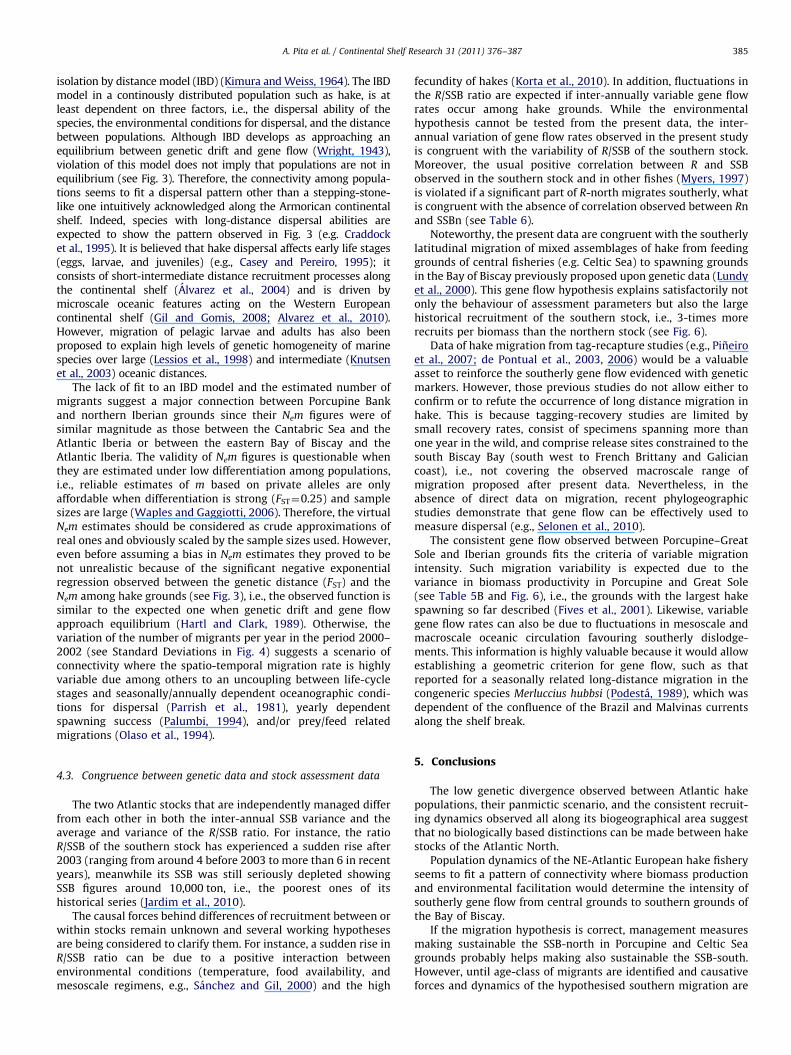
Average values of recruitment (R) and spawning stock biomass(SSB) were significantly different between the northern stock andthe southern stock in the period 1982–2007 as well as in theperiod analysed 2000–2002 (Fig. 5 and Table 5A). The variance ofR did not differ between stocks in any period. The variance of SSBwas significantly different between stocks. Both, the average andthe variance of the ratio R/SSB, differed significantly betweenstocks (Table 5A). Assessment results such as R, SSB, and R/SSB didnot differ between the two periods, i.e., (2000–2002) and(1982–2007) (Table 5B). The rate (R/SSB-south)/(R/SSB-north)was 2.743 and 2.678 in the periods 1982–2007 and 2000–2002,respectively (Fig. 6). Unexpected good recruitments wereobserved after 2003 in the southern stock, when its SSB was atone of its poorest historical levels (Figs. 5 and 6). Therefore, theafter-2003 good recruitment predated the increase of SSB in thisstock. Significant positive correlations were retrieved from allpair-wise comparisons among assessment parameters exceptbetween SSB-north and R-north (Table 6).
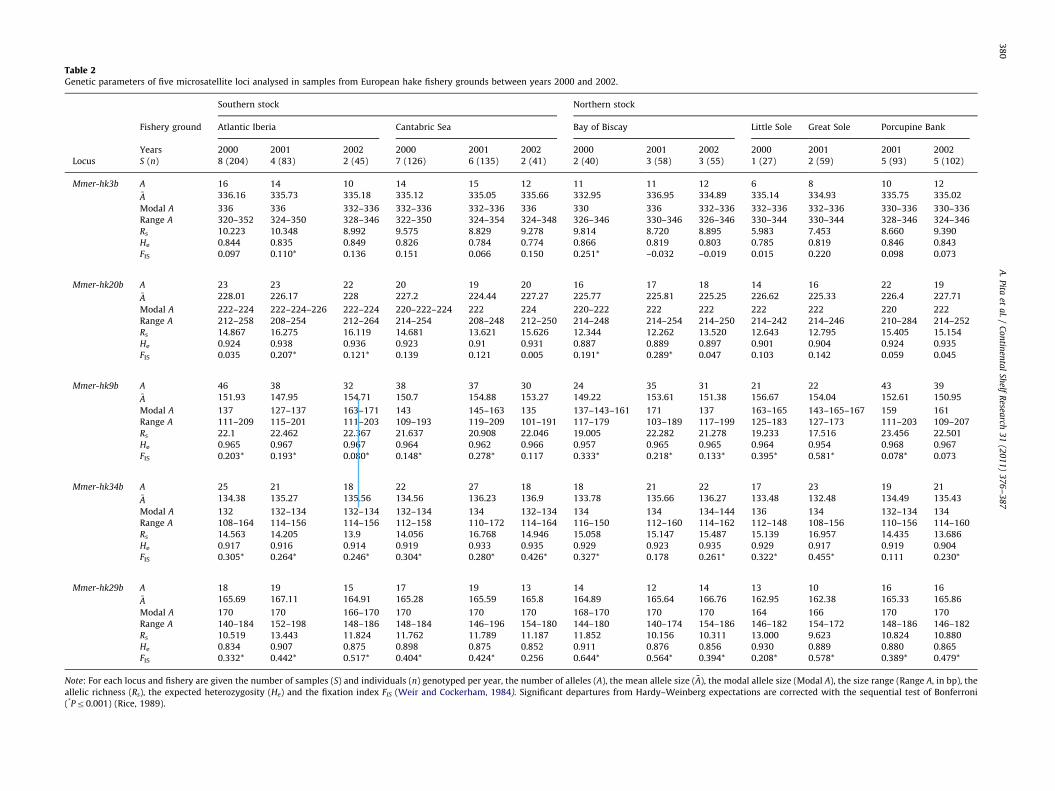
Table 2Genetic parameters of five microsatellite loci analysed in samples from European hake fishery grounds between years 2000 and 2002.
Southern stock Northern stock
Fishery ground Atlantic Iberia Cantabric Sea Bay of Biscay Little Sole Great Sole Porcupine Bank
Years 2000 2001 2002 2000 2001 2002 2000 2001 2002 2000 2001 2001 2002
Locus S (n) 8 (204) 4 (83) 2 (45) 7 (126) 6 (135) 2 (41) 2 (40) 3 (58) 3 (55) 1 (27) 2 (59) 5 (93) 5 (102)
Mmer-hk3b A 16 14 10 14 15 12 11 11 12 6 8 10 12�A 336.16 335.73 335.18 335.12 335.05 335.66 332.95 336.95 334.89 335.14 334.93 335.75 335.02
Modal A 336 336 332–336 332–336 332–336 336 330 336 332–336 332–336 332–336 330–336 330–336
Range A 320–352 324–350 328–346 322–350 324–354 324–348 326–346 330–346 326–346 330–344 330–344 328–346 324–346
Rs 10.223 10.348 8.992 9.575 8.829 9.278 9.814 8.720 8.895 5.983 7.453 8.660 9.390
He 0.844 0.835 0.849 0.826 0.784 0.774 0.866 0.819 0.803 0.785 0.819 0.846 0.843
FIS 0.097 0.110* 0.136 0.151 0.066 0.150 0.251* –0.032 –0.019 0.015 0.220 0.098 0.073
Mmer-hk20b A 23 23 22 20 19 20 16 17 18 14 16 22 19�A 228.01 226.17 228 227.2 224.44 227.27 225.77 225.81 225.25 226.62 225.33 226.4 227.71
Modal A 222–224 222–224–226 222–224 220–222–224 222 224 220–222 222 222 222 222 220 222
Range A 212–258 208–254 212–264 214–254 208–248 212–250 214–248 214–254 214–250 214–242 214–246 210–284 214–252
Rs 14.867 16.275 16.119 14.681 13.621 15.626 12.344 12.262 13.520 12.643 12.795 15.405 15.154
He 0.924 0.938 0.936 0.923 0.91 0.931 0.887 0.889 0.897 0.901 0.904 0.924 0.935
FIS 0.035 0.207* 0.121* 0.139 0.121 0.005 0.191* 0.289* 0.047 0.103 0.142 0.059 0.045
Mmer-hk9b A 46 38 32 38 37 30 24 35 31 21 22 43 39�A 151.93 147.95 154.71 150.7 154.88 153.27 149.22 153.61 151.38 156.67 154.04 152.61 150.95
Modal A 137 127–137 163–171 143 145–163 135 137–143–161 171 137 163–165 143–165–167 159 161
Range A 111–209 115–201 111–203 109–193 119–209 101–191 117–179 103–189 117–199 125–183 127–173 111–203 109–207
Rs 22.1 22.462 22.367 21.637 20.908 22.046 19.005 22.282 21.278 19.233 17.516 23.456 22.501
He 0.965 0.967 0.967 0.964 0.962 0.966 0.957 0.965 0.965 0.964 0.954 0.968 0.967
FIS 0.203* 0.193* 0.080* 0.148* 0.278* 0.117 0.333* 0.218* 0.133* 0.395* 0.581* 0.078* 0.073
Mmer-hk34b A 25 21 18 22 27 18 18 21 22 17 23 19 21�A 134.38 135.27 135.56 134.56 136.23 136.9 133.78 135.66 136.27 133.48 132.48 134.49 135.43
Modal A 132 132–134 132–134 132–134 134 132–134 134 134 134–144 136 134 132–134 134
Range A 108–164 114–156 114–156 112–158 110–172 114–164 116–150 112–160 114–162 112–148 108–156 110–156 114–160
Rs 14.563 14.205 13.9 14.056 16.768 14.946 15.058 15.147 15.487 15.139 16.957 14.435 13.686
He 0.917 0.916 0.914 0.919 0.933 0.935 0.929 0.923 0.935 0.929 0.917 0.919 0.904
FIS 0.305* 0.264* 0.246* 0.304* 0.280* 0.426* 0.327* 0.178 0.261* 0.322* 0.455* 0.111 0.230*
Mmer-hk29b A 18 19 15 17 19 13 14 12 14 13 10 16 16�A 165.69 167.11 164.91 165.28 165.59 165.8 164.89 165.64 166.76 162.95 162.38 165.33 165.86
Modal A 170 170 166–170 170 170 170 168–170 170 170 164 166 170 170
Range A 140–184 152–198 148–186 148–184 146–196 154–180 144–180 140–174 154–186 146–182 154–172 148–186 146–182
Rs 10.519 13.443 11.824 11.762 11.789 11.187 11.852 10.156 10.311 13.000 9.623 10.824 10.880
He 0.834 0.907 0.875 0.898 0.875 0.852 0.911 0.876 0.856 0.930 0.889 0.880 0.865
FIS 0.332* 0.442* 0.517* 0.404* 0.424* 0.256 0.644* 0.564* 0.394* 0.208* 0.578* 0.389* 0.479*
Note: For each locus and fishery are given the number of samples (S) and individuals (n) genotyped per year, the number of alleles (A), the mean allele size ( �A), the modal allele size (Modal A), the size range (Range A, in bp), the
allelic richness (Rs), the expected heterozygosity (He) and the fixation index FIS (Weir and Cockerham, 1984). Significant departures from Hardy–Weinberg expectations are corrected with the sequential test of Bonferroni
(*Pr0.001) (Rice, 1989).
A.
Pita
eta
l./
Co
ntin
enta
lSh
elfR
esearch
31
(20
11
)3
76
–3
87
38
0
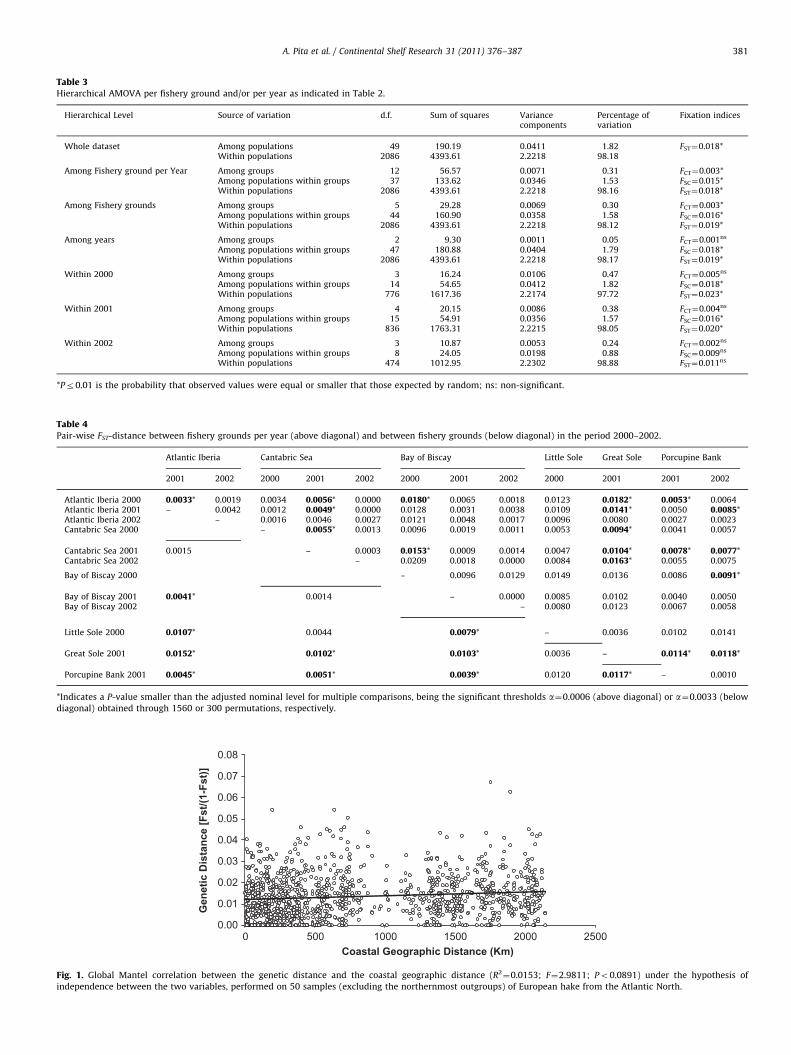
Table 3Hierarchical AMOVA per fishery ground and/or per year as indicated in Table 2.
Hierarchical Level Source of variation d.f. Sum of squares Variancecomponents
Percentage ofvariation
Fixation indices
Whole dataset Among populations 49 190.19 0.0411 1.82 FST¼0.018*Within populations 2086 4393.61 2.2218 98.18
Among Fishery ground per Year Among groups 12 56.57 0.0071 0.31 FCT¼0.003*Among populations within groups 37 133.62 0.0346 1.53 FSC¼0.015*Within populations 2086 4393.61 2.2218 98.16 FST¼0.018*
Among Fishery grounds Among groups 5 29.28 0.0069 0.30 FCT¼0.003*Among populations within groups 44 160.90 0.0358 1.58 FSC¼0.016*Within populations 2086 4393.61 2.2218 98.12 FST¼0.019*
Among years Among groups 2 9.30 0.0011 0.05 FCT¼0.001ns
Among populations within groups 47 180.88 0.0404 1.79 FSC¼0.018*Within populations 2086 4393.61 2.2218 98.17 FST¼0.019*
Within 2000 Among groups 3 16.24 0.0106 0.47 FCT¼0.005ns
Among populations within groups 14 54.65 0.0412 1.82 FSC¼0.018*Within populations 776 1617.36 2.2174 97.72 FST¼0.023*
Within 2001 Among groups 4 20.15 0.0086 0.38 FCT¼0.004ns
Among populations within groups 15 54.91 0.0356 1.57 FSC¼0.016*Within populations 836 1763.31 2.2215 98.05 FST¼0.020*
Within 2002 Among groups 3 10.87 0.0053 0.24 FCT¼0.002ns
Among populations within groups 8 24.05 0.0198 0.88 FSC¼0.009ns
Within populations 474 1012.95 2.2302 98.88 FST¼0.011ns
*Pr0.01 is the probability that observed values were equal or smaller that those expected by random; ns: non-significant.
Table 4Pair-wise FST-distance between fishery grounds per year (above diagonal) and between fishery grounds (below diagonal) in the period 2000–2002.
Atlantic Iberia Cantabric Sea Bay of Biscay Little Sole Great Sole Porcupine Bank
2001 2002 2000 2001 2002 2000 2001 2002 2000 2001 2001 2002
Atlantic Iberia 2000 0.0033* 0.0019 0.0034 0.0056* 0.0000 0.0180* 0.0065 0.0018 0.0123 0.0182* 0.0053* 0.0064Atlantic Iberia 2001 – 0.0042 0.0012 0.0049* 0.0000 0.0128 0.0031 0.0038 0.0109 0.0141* 0.0050 0.0085*Atlantic Iberia 2002 – 0.0016 0.0046 0.0027 0.0121 0.0048 0.0017 0.0096 0.0080 0.0027 0.0023Cantabric Sea 2000 – 0.0055* 0.0013 0.0096 0.0019 0.0011 0.0053 0.0094* 0.0041 0.0057
Cantabric Sea 2001 0.0015 – 0.0003 0.0153* 0.0009 0.0014 0.0047 0.0104* 0.0078* 0.0077*Cantabric Sea 2002 – 0.0209 0.0018 0.0000 0.0084 0.0163* 0.0055 0.0075
Bay of Biscay 2000 – 0.0096 0.0129 0.0149 0.0136 0.0086 0.0091*
Bay of Biscay 2001 0.0041* 0.0014 – 0.0000 0.0085 0.0102 0.0040 0.0050Bay of Biscay 2002 – 0.0080 0.0123 0.0067 0.0058
Little Sole 2000 0.0107* 0.0044 0.0079* – 0.0036 0.0102 0.0141
Great Sole 2001 0.0152* 0.0102* 0.0103* 0.0036 – 0.0114* 0.0118*
Porcupine Bank 2001 0.0045* 0.0051* 0.0039* 0.0120 0.0117* – 0.0010
*Indicates a P-value smaller than the adjusted nominal level for multiple comparisons, being the significant thresholds a¼0.0006 (above diagonal) or a¼0.0033 (below
diagonal) obtained through 1560 or 300 permutations, respectively.
0.00
0.01
0.02
0.03
0.04
0.05
0.06
0.07
0.08
0Coastal Geographic Distance (Km)
Gen
etic
Dis
tanc
e [F
st/(1
-Fst
)]
500 1000 1500 2000 2500
Fig. 1. Global Mantel correlation between the genetic distance and the coastal geographic distance (R2¼0.0153; F¼2.9811; Po0.0891) under the hypothesis of
independence between the two variables, performed on 50 samples (excluding the northernmost outgroups) of European hake from the Atlantic North.
A. Pita et al. / Continental Shelf Research 31 (2011) 376–387 381
Rockall
North Sea
Great Sole
Little Sole
Bay of BiscayAtlantic Iberia
Cantabric Sea
Porcupine Bank
-2.0-1.5-1.0-0.50.00.51.01.52.0
-1.5First Component (29%)
Sec
ond
Com
pone
nt (1
8%)
Porc 02Atl-Iber 00
B. Bisc 02
Rockall 00
North Sea 01
Great Sole 01
Little Sole 00
B. Bisc 00
Atl-Iber 01
Cant-Sea 02
Cant-Sea 01
Cant-Sea 00Atl-Iber 02
Porc 01
B. Bisc 01
-3.0-2.5-2.0-1.5-1.0-0.50.00.51.01.52.0
-3.0First Component (16%)
Sec
ond
Com
pone
nt (1
1%)
-1.0 -0.5 0.0 0.5 1.0 1.5
-2.5 -2.0 -1.5 -1.0 -0.5 0.0 0.5 1.0 1.5
Fig. 2. Principal component analysis (PCA) built with a correlation matrix of allele frequencies used to explore the relationships among fishery grounds (A) or among year
samples (B) of European hake.
0.000
0.002
0.004
0.006
0.008
0.010
0.012
0.014
0.016
0
Gen
etic
dis
tanc
e (F
st)
5 10 15 20 25Nem
Fig. 3. Negative exponential correlation (R2¼0.426, F¼9.638, P¼0.008) between
FST-distance and relative estimates of the effective number of migrants (Nem)
among the main European hake fishery grounds, under the null hypothesis of
independence between these parameters.
A. Pita et al. / Continental Shelf Research 31 (2011) 376–387382
4. Discussion
This study explores the pattern of connectivity between thetwo Atlantic European hake stocks in the context of genetic andhistorical assessment data. Accumulated experimental evidenceindicates a large genetic homogeneity among hake populationsthat make current stock differentiation questionable in biologicalterms and for management purposes. All genetic results suchas the multimodal allele size of markers in the Cantabric Sea,the panmictic scenario described with exact tests of genic
differentiation and IBD model testing, the low genetic distanceamong samples, the large number of migrants between grounds,and the systematic grouping of Porcupine Bank samples withAtlantic Iberian ones suggest that inter-annual gene flow occursbetween the core grounds of the northern stock (Porcupine andGreat Sole) and the northern Iberian grounds inhabited by thesouthern stock. This scenario of connectivity can explain the largerecruitment observed in the southern stock after 2003 when itsspawning biomass still remained seriously depleted, i.e., therewere very few large fish in those years so the reproductivepotential of the southern stock reached its historical minimum interms of egg production, i.e., well under half of its historical average(Mehault et al., 2010). The abundance of recruits overwhelming thatof apparent reproductors is fully congruent with high gene flowbetween stocks reported in this study. Although the pattern ofconnectivity between stocks remains uncertain in the absence oftag-recapture data, the present data suggest the occurrence of asoutherly gene flow from the northern stock, that is compatiblewith a passive drift of early stages (eggs, larvae, or juveniles).Altogether these results highlight the potential role of Porcupinebank and Great Sole grounds in making sustainable both stocks andadvocate the integrative management of this hake fishery by meansof a multidisciplinary assessment.
4.1. Intrapopulation variation
Genetic parameters showed range values consistent withprevious studies on this species (e.g., Lundy et al., 2000) withthe expected fluctuation of allelic ranges and number of allelesdue to sampling drift, different sample sizes, localities, and years
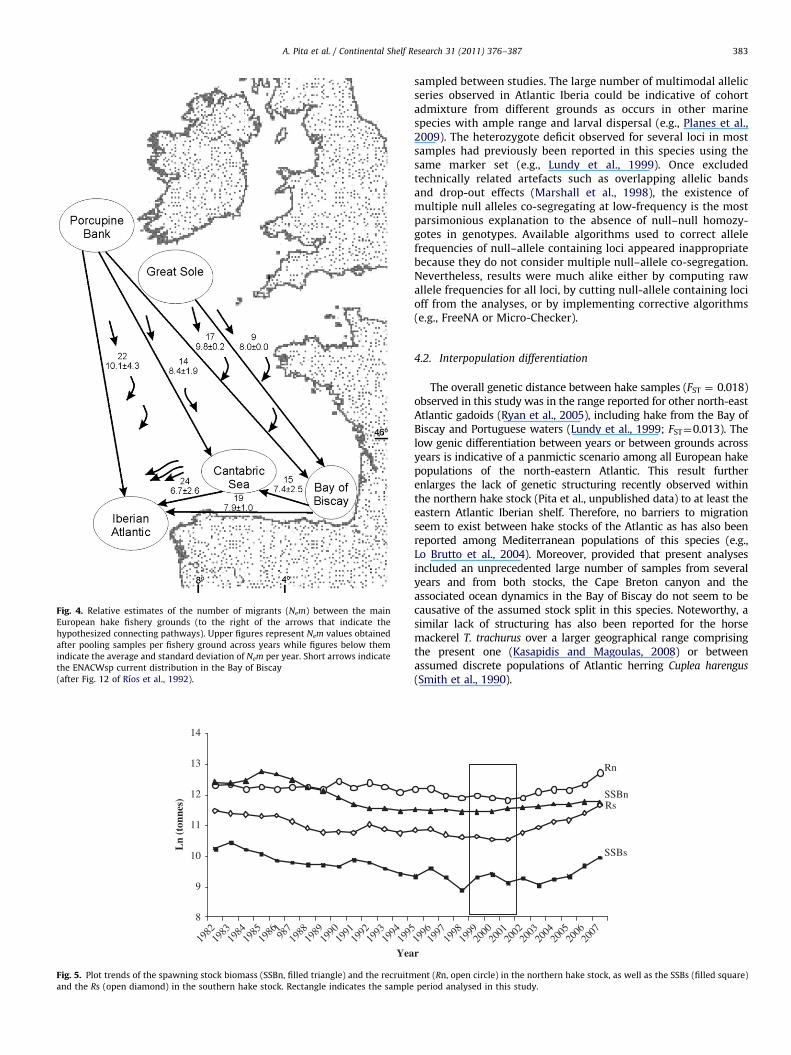
Fig. 4. Relative estimates of the number of migrants (Nem) between the main
European hake fishery grounds (to the right of the arrows that indicate the
hypothesized connecting pathways). Upper figures represent Nem values obtained
after pooling samples per fishery ground across years while figures below them
indicate the average and standard deviation of Nem per year. Short arrows indicate
the ENACWsp current distribution in the Bay of Biscay
(after Fig. 12 of Rıos et al., 1992).
8
9
10
11
12
13
14
1982
1983
1984
1985
19861
98719
8819
8919
9019
9119
9219
9319
9419
9
Yea
Ln
(ton
nes)
Fig. 5. Plot trends of the spawning stock biomass (SSBn, filled triangle) and the recruitm
and the Rs (open diamond) in the southern hake stock. Rectangle indicates the sample
A. Pita et al. / Continental Shelf Research 31 (2011) 376–387 383
sampled between studies. The large number of multimodal allelicseries observed in Atlantic Iberia could be indicative of cohortadmixture from different grounds as occurs in other marinespecies with ample range and larval dispersal (e.g., Planes et al.,2009). The heterozygote deficit observed for several loci in mostsamples had previously been reported in this species using thesame marker set (e.g., Lundy et al., 1999). Once excludedtechnically related artefacts such as overlapping allelic bandsand drop-out effects (Marshall et al., 1998), the existence ofmultiple null alleles co-segregating at low-frequency is the mostparsimonious explanation to the absence of null–null homozy-gotes in genotypes. Available algorithms used to correct allelefrequencies of null–allele containing loci appeared inappropriatebecause they do not consider multiple null–allele co-segregation.Nevertheless, results were much alike either by computing rawallele frequencies for all loci, by cutting null-allele containing locioff from the analyses, or by implementing corrective algorithms(e.g., FreeNA or Micro-Checker).
4.2. Interpopulation differentiation
The overall genetic distance between hake samples (FST ¼ 0.018)observed in this study was in the range reported for other north-eastAtlantic gadoids (Ryan et al., 2005), including hake from the Bay ofBiscay and Portuguese waters (Lundy et al., 1999; FST¼0.013). Thelow genic differentiation between years or between grounds acrossyears is indicative of a panmictic scenario among all European hakepopulations of the north-eastern Atlantic. This result furtherenlarges the lack of genetic structuring recently observed withinthe northern hake stock (Pita et al., unpublished data) to at least theeastern Atlantic Iberian shelf. Therefore, no barriers to migrationseem to exist between hake stocks of the Atlantic as has also beenreported among Mediterranean populations of this species (e.g.,Lo Brutto et al., 2004). Moreover, provided that present analysesincluded an unprecedented large number of samples from severalyears and from both stocks, the Cape Breton canyon and theassociated ocean dynamics in the Bay of Biscay do not seem to becausative of the assumed stock split in this species. Noteworthy, asimilar lack of structuring has also been reported for the horsemackerel T. trachurus over a larger geographical range comprisingthe present one (Kasapidis and Magoulas, 2008) or betweenassumed discrete populations of Atlantic herring Cuplea harengus
(Smith et al., 1990).
519
9619
9719
9819
9920
0020
0120
0220
0320
0420
0520
0620
07
r
SSBs
SSBn
Rn
Rs
ent (Rn, open circle) in the northern hake stock, as well as the SSBs (filled square)
period analysed in this study.
Table 5Statistical comparison of assessment results between the northern stock and the southern stock of the European hake in the periods (1982–2007) and (2000–2002).
AWithin periods Recruitment-north SSB-north R/SSB-North
Recruitment-south SSB-south R/SSB-South
1982–2007 Average7SD 199,846740,562 155,119777,153 1.49770.52962,289721,037 16,13676582 4.10671.208
t-Student/P 15.350/0.000 9.152/0.000 �10.086/0.000d.f 50 50 50F(Levene)/P 2.667/0.109 51.316/0.000 12.466/0.001
2000–2002 Average7SD 145,66776658 101,96776701 1.43470.13440,89875370 10,78071505 3.84070.673
t-Student/P 21.214/0.000 22.997/0.001 �6.076/0.004d.f 4 4 4F(Levene)/P 0.343/0.590 4.824/0.093 7.044/0.057
BRecruitment SSB R/SSB
Between periodswithin stocks
North South North South North South
t-Student/P 2.274/0.031 1.728/0.095 1.174/0.251 1.384/0.178 0.203/0.840 0.370/0.714d.f 27 27 27 27 27 27F(Levene)/P 1.705/0.203 4.194/0.050 5.800/0.023 2.552/0.122 3.273/0.082 1.169/0.289
0.00
1.00
2.00
3.00
4.00
5.00
6.00
7.00
1982
1984
1986
1988
1990
1992
1994
1996
1998
2000
2002
2004
2006
Year
R/S
SB
NHS
SHS
Fig. 6. Plot trends of the ratio recruitment/spawning stock biomass (R/SSB) for the northern hake stock (NHS, filled diamond) and the southern hake stock (SHS, open
square). Rectangle indicates the sample period analysed in this study.
Table 6Observed correlation between some parameters used to assess inter-annual hake stock performance. Theoretically expected correlations for two migration models are also
provided for comparison.
Expected positive correlation under: Observedcorrelation
Low or no
systematic migration
High and
systematic migration
(R2/P)
Recruitment-north–Recruitment-south No Yes 0.536/o0.001SSB-north–SSB-south Maybe Yes 0.489/o0.001Recruitment-north–SSB-north Yes No 0.066/0.204
Recruitment-north–SSB-south No Yes 0.313/0.003Recruitment-south–SSB-south Yes Yes 0.491/0.000Recruitment-south–SSB-north No Yes 0.312/0.003
A. Pita et al. / Continental Shelf Research 31 (2011) 376–387384
The small amount of genetic variation among samples (1.82%)is congruent with that reported between the two main biogeo-graphical regions of this species, i.e., the Atlantic and theMediterranean, using microsatellites (2.9%, Lundy et al., 1999)or allozymes (3.08%, Roldan et al., 1998). The low but significantvariation between grounds (0.30%) in the period 2000–2002indicates a weak spatial divergence in the Atlantic. However, adetailed inspection of pair-wise FST-distances (Table 3) shows thatsuch divergence is neither consistent across years nor correlated
with geographical distances, suggesting a between-years randomdeviation due to temporal cohort-based structures (e.g., Lundy et al.,2000), such as that between Cantabric 2000 and Cantabric 2001(FST¼0.0055; Po0.001). The lack of significance of FST-distancesbetween stocks is illustrated in the geometry of the PCA groupingthat links all year samples from Porcupine Bank with the AtlanticIberian sample cluster. Moreover, the absence of correlationbetween the genetic distance and the coastal distance indicatesthat the connectivity pattern among Atlantic grounds does not fit an
A. Pita et al. / Continental Shelf Research 31 (2011) 376–387 385
isolation by distance model (IBD) (Kimura and Weiss, 1964). The IBDmodel in a continously distributed population such as hake, is atleast dependent on three factors, i.e., the dispersal ability of thespecies, the environmental conditions for dispersal, and the distancebetween populations. Although IBD develops as approaching anequilibrium between genetic drift and gene flow (Wright, 1943),violation of this model does not imply that populations are not inequilibrium (see Fig. 3). Therefore, the connectivity among popula-tions seems to fit a dispersal pattern other than a stepping-stone-like one intuitively acknowledged along the Armorican continentalshelf. Indeed, species with long-distance dispersal abilities areexpected to show the pattern observed in Fig. 3 (e.g. Craddocket al., 1995). It is believed that hake dispersal affects early life stages(eggs, larvae, and juveniles) (e.g., Casey and Pereiro, 1995); itconsists of short-intermediate distance recruitment processes alongthe continental shelf (Alvarez et al., 2004) and is driven bymicroscale oceanic features acting on the Western Europeancontinental shelf (Gil and Gomis, 2008; Alvarez et al., 2010).However, migration of pelagic larvae and adults has also beenproposed to explain high levels of genetic homogeneity of marinespecies over large (Lessios et al., 1998) and intermediate (Knutsenet al., 2003) oceanic distances.
The lack of fit to an IBD model and the estimated number ofmigrants suggest a major connection between Porcupine Bankand northern Iberian grounds since their Nem figures were ofsimilar magnitude as those between the Cantabric Sea and theAtlantic Iberia or between the eastern Bay of Biscay and theAtlantic Iberia. The validity of Nem figures is questionable whenthey are estimated under low differentiation among populations,i.e., reliable estimates of m based on private alleles are onlyaffordable when differentiation is strong (FST¼0.25) and samplesizes are large (Waples and Gaggiotti, 2006). Therefore, the virtualNem estimates should be considered as crude approximations ofreal ones and obviously scaled by the sample sizes used. However,even before assuming a bias in Nem estimates they proved to benot unrealistic because of the significant negative exponentialregression observed between the genetic distance (FST) and theNem among hake grounds (see Fig. 3), i.e., the observed function issimilar to the expected one when genetic drift and gene flowapproach equilibrium (Hartl and Clark, 1989). Otherwise, thevariation of the number of migrants per year in the period 2000–2002 (see Standard Deviations in Fig. 4) suggests a scenario ofconnectivity where the spatio-temporal migration rate is highlyvariable due among others to an uncoupling between life-cyclestages and seasonally/annually dependent oceanographic condi-tions for dispersal (Parrish et al., 1981), yearly dependentspawning success (Palumbi, 1994), and/or prey/feed relatedmigrations (Olaso et al., 1994).
4.3. Congruence between genetic data and stock assessment data
The two Atlantic stocks that are independently managed differfrom each other in both the inter-annual SSB variance and theaverage and variance of the R/SSB ratio. For instance, the ratioR/SSB of the southern stock has experienced a sudden rise after2003 (ranging from around 4 before 2003 to more than 6 in recentyears), meanwhile its SSB was still seriously depleted showingSSB figures around 10,000 ton, i.e., the poorest ones of itshistorical series (Jardim et al., 2010).
The causal forces behind differences of recruitment between orwithin stocks remain unknown and several working hypothesesare being considered to clarify them. For instance, a sudden rise inR/SSB ratio can be due to a positive interaction betweenenvironmental conditions (temperature, food availability, andmesoscale regimens, e.g., Sanchez and Gil, 2000) and the high
fecundity of hakes (Korta et al., 2010). In addition, fluctuations inthe R/SSB ratio are expected if inter-annually variable gene flowrates occur among hake grounds. While the environmentalhypothesis cannot be tested from the present data, the inter-annual variation of gene flow rates observed in the present studyis congruent with the variability of R/SSB of the southern stock.Moreover, the usual positive correlation between R and SSBobserved in the southern stock and in other fishes (Myers, 1997)is violated if a significant part of R-north migrates southerly, whatis congruent with the absence of correlation observed between Rnand SSBn (see Table 6).
Noteworthy, the present data are congruent with the southerlylatitudinal migration of mixed assemblages of hake from feedinggrounds of central fisheries (e.g. Celtic Sea) to spawning groundsin the Bay of Biscay previously proposed upon genetic data (Lundyet al., 2000). This gene flow hypothesis explains satisfactorily notonly the behaviour of assessment parameters but also the largehistorical recruitment of the southern stock, i.e., 3-times morerecruits per biomass than the northern stock (see Fig. 6).
Data of hake migration from tag-recapture studies (e.g., Pineiroet al., 2007; de Pontual et al., 2003, 2006) would be a valuableasset to reinforce the southerly gene flow evidenced with geneticmarkers. However, those previous studies do not allow either toconfirm or to refute the occurrence of long distance migration inhake. This is because tagging-recovery studies are limited bysmall recovery rates, consist of specimens spanning more thanone year in the wild, and comprise release sites constrained to thesouth Biscay Bay (south west to French Brittany and Galiciancoast), i.e., not covering the observed macroscale range ofmigration proposed after present data. Nevertheless, in theabsence of direct data on migration, recent phylogeographicstudies demonstrate that gene flow can be effectively used tomeasure dispersal (e.g., Selonen et al., 2010).
The consistent gene flow observed between Porcupine–GreatSole and Iberian grounds fits the criteria of variable migrationintensity. Such migration variability is expected due to thevariance in biomass productivity in Porcupine and Great Sole(see Table 5B and Fig. 6), i.e., the grounds with the largest hakespawning so far described (Fives et al., 2001). Likewise, variablegene flow rates can also be due to fluctuations in mesoscale andmacroscale oceanic circulation favouring southerly dislodge-ments. This information is highly valuable because it would allowestablishing a geometric criterion for gene flow, such as thatreported for a seasonally related long-distance migration in thecongeneric species Merluccius hubbsi (Podesta, 1989), which wasdependent of the confluence of the Brazil and Malvinas currentsalong the shelf break.
5. Conclusions
The low genetic divergence observed between Atlantic hakepopulations, their panmictic scenario, and the consistent recruit-ing dynamics observed all along its biogeographical area suggestthat no biologically based distinctions can be made between hakestocks of the Atlantic North.
Population dynamics of the NE-Atlantic European hake fisheryseems to fit a pattern of connectivity where biomass productionand environmental facilitation would determine the intensity ofsoutherly gene flow from central grounds to southern grounds ofthe Bay of Biscay.
If the migration hypothesis is correct, management measuresmaking sustainable the SSB-north in Porcupine and Celtic Seagrounds probably helps making also sustainable the SSB-south.However, until age-class of migrants are identified and causativeforces and dynamics of the hypothesised southern migration are
A. Pita et al. / Continental Shelf Research 31 (2011) 376–387386
unveiled, a preventive management approach would betterbalance the fishing pressure among all age-classes, with a specialprotection of spawning grounds and old hakes, provided they holdthe actual reproductive potential of the species.
Acknowledging that the more the complete assessmentmodels on hake stocks are, the more the exploitation patternwould be improved (Van Hoof et al., 2008); an integrative effort tobring together assessment methodologies, ecological insights, andpopulation genetic data should be a priority in stock assessmentwithin the framework of a long-term Communitarian manage-ment policy for this species.
Acknowledgments
This research has been funded by Xunta de Galicia throughgrant MERCAGAL–PGIDIT06RMA007001CT to CETMAR Founda-tion as well as through financial help to consolidate the authorsresearch team (INCITE09E2R310105ES), M Perez is currentlyfunded by an Isidro Parga Pondal research fellowship from Xuntade Galicia (Spain). Authors are indebted to the Spanish Institute ofOceanography (IEO) for providing samples and expertise on stockassessment procedures, and to Gabriel Roson (University of Vigo)for his guiding discussions on marine circulation patterns in theBay of Biscay.
References
Alvarez, P., Fives, J., Motos, L., Santos, M., 2004. Distribution and abundance ofEuropean hake Merluccius merluccius (L.), eggs and larvae in the North EastAtlantic waters in 1995 and 1998 in relation to hydrographic conditions. J.Plankton Res 26, 811–826.
Alvarez, I., Gomez-Gesteira, M., de Castro, M., Gomez-Gesteira, J.L., Dias, J.M., 2010.Summer upwelling frequency along the western Cantabrian coast from 1967to 2007. J. Mar. Syst. 79, 218–226.
Barton, N.H., Slatkin, M., 1986. A quasi-equilibrium theory of the distribution ofrare alleles in a subdivided population. Heredity 56, 409–416.
Bartsch, J., Lavin, A., Motos, L., 1996. A numerical model system of the regionaround the Iberian Peninsula: model validation and application to hake larvaedrift in the Bay of Biscay. ICES CM 1996/S:7.
Burridge, C.P., Versace, V.L., 2007. Population genetic structuring in Acanthopagrusbutcheri (Pisces: Sparidae): does low gene flow among estuaries apply to bothsexes? Mar. Biotechnol 9 (1) 33–44.
Casey, J., Pereiro, J., 1995. European hake (M. merluccius) in the North-East Atlantic.In: Alheit, J., Pitcher, T. (Eds.), Hake: Biology, Fisheries and Markets. Chapmanand Hall, London, pp. 125–147.
Craddock, C., Hoeh, W.R., Lutz, R.A., Vrijenhoek, R.C., 1995. Extensive gene flow inthe deep-sea hydrothermal vent mytilid Bathymodiolus thermophilus. Mar.Biol. 124, 137–146.
Crozier, R.H., 1997. Preserving the information content of species: geneticdiversity, phylogeny, and conservation worth. Annual Review of Ecology andSystematics 28, 243–268.
de Pontual, H., Bertignac, M., Battaglia, A., Bavouzet, G., Moguedet, P., Groison, A.L.,2003. A pilot tagging experiment on European hake (Merluccius merluccius):methodology and preliminary results. ICES J. Mar. Sci. 60, 1318–1327.
de Pontual, H., Groison, A.L., Pineiro, C., Bertignac, M., 2006. Evidence ofunderestimation of European hake growth in the Bay of Biscay, and itsrelationship with bias in the agreed method of age estimation. ICES J. Mar. Sci63, 1674–1681.
EC, 2005. Council Regulation No 2166/2005 of 20 December 2005 establishingmeasures for the recovery of the southern hake and Norway lobster stocks inthe Cantabrian Sea and Western Iberian peninsula and amending Regulation(EC) No 850/98 for the conservation of fishery resources through technicalmeasures for the protection of juveniles of marine organisms. The OfficialJournal of the European Union Legislation 345, 5–10.
Excoffier, L., Laval, G., Schneider, S., 2005. Arlequin ver. 3.0: an integrated softwarepackage for population genetics data analysis. Evol. Bioinform. Online 1, 47–50.
Fives, J., Acevedo, S., Lloves, M., Whitaker, A., Robinson, M., King, P.A., 2001. Thedistribution and abundance of larval mackerel, Scomber scombrus L., horsemackerel, Trachurus trachurus (L.), Merluccius merluccius (L.), and blue whiting,Micromesistius poutassou (Risso, 1826) in the Celtic Sea and West of Irelandduring years, 1986, ’89 and ’92. Fish. Res. 50, 17–26.
Froukh, T., Kochzius, M., 2007. Genetic population structure of the endemicfourline wrasse (Larabicus quadrilineatus) suggests limited larval dispersaldistances in the Red Sea. Mol. Ecol 16 (7), 1359–1367.
Gil, J., Gomis, D., 2008. The secondary ageostrophic circulation in the IberianPoleward Current along the Cantabrian Sea (Bay of Biscay). J. Mar. Syst 74,60–73.
Gil, J., Sanchez, F., 1996. Incidence of the poleward current and vertical motion inhake recruitment. ICES C.M; S:12.
Goudet, J., 1995. Fstat (vers. 2.9.3): a computer program to calculate F-statistics.J. Hered. 86, 485–486.
Hartl, D.L., Clark, A.G., 1989. Principles of Population Genetics, Sunderlard seconded. Sinauer.
Hutchings, J.A., 2005. Life history consequences of overexploitation to populationrecovery in Northwest Atlantic cod (Gadus morhua). Evol. Bioinform. Online 62(4), 824–832.
ICES 2001. Report of Working Group on Assessment of Southern Shelf DemersalStocks. ICES C.M 2001/ACFM: 05.
ICES, 2005. Report of the working group on the assessment of Southern Shelfstocks of hake, monk and megrim. May 2005. ICES CM 2005/ACFM:01.
ICES, 2009a. Book 9.9.4 Widely Distributed and Migratory Stocks. 9.4.1. Hake inDivision IIIa, subareas IV, VI, and Divisions VIIIa, b, d) (Northern Stock).
ICES, 2009b. Report of Working Group on the Assessment of Southern Shelf Stocksof Hake, Monk and Megrim (WGHMM), 5–11 May 2009, ICES Headquarters,Copenhagen, D. Lindemann.
Jardim, E., Cervino, S., Azevedo, M., 2010. Evaluating management strategies toimplement the recovery plan for Iberian hake (Merluccius merluccius); theimpact of censored catch information. ICES J. Mar. Sci 67 (2), 258–269.
Jones, B.W., Mackie, I.M., 1970. An application of electrophoretic analyses ofmuscle myogens to taxonomic studies in the genus Merluccius. Comp.Biochem. Physiol 32, 267–273.
Kasapidis, P., Magoulas, A., 2008. Development and application of microsatellitemarkers to address the population structure of the horse mackerel Trachurustrachurus. Fish. Res 89, 132–135.
Kimura, M., Weiss, G.H., 1964. The stepping-stone model of population structureand the decrease of genetic correlation with distance. Genetics 49, 561–576.
Knutsen, H., Jorde, P.E., Andre, C., Stenseth, N.C.H.R., 2003. Fine-scaled geographicalpopulation structuring in a highly mobile marine species: the Atlantic cod.Mol. Ecol. 12, 385–394.
Korta, M., Domınguez-Petit, M., Murua, H., Saborido-Rey, F., 2010. Regionalvariability in reproductive traits of European hake (Merluccius merluccius L).populations. Fish. Res. 104, 64–72.
Lessios, H.A., Kessing, B.D., Robertson, D.R., 1998. Massive gene flow across theworld most potent marine biogeographic barrier. Proc. Royal Soc. Lond. B 265,583–588.
Lloris, D., Matallanas, J., Oliver, P., 2003. Merluzas del Mundo (FamiliaMerlucciidae). Catalogo Comentado e Ilustrado de las Merluzas Conocidas.,vol. 2. FAO Catalogo de especies para los fines de la pesca, Roma, Italypp. 1–57.
Lo Brutto, S., Arcuelo, M., Parrinello, N., 2004. Congruence in genetic markers usedto describe Mediterranean and Atlantic populations of European hake(Merluccius merluccius L. 1758). J. Appl. Ichthyol 20, 81–86.
Lundy, C.J., Moran, P., Rico, C., Milner, R.S., Hewitt, G.M., 1999. Macrogeographicalpopulation differentiation in oceanic environments: a case study of Europeanhake (Merluccius merluccius), a commercially important fish. Mol. Ecol. 8,1889–1898.
Lundy, C.J., Rico, C., Hewitt, G.M., 2000. Temporal and spatial genetic variation inspawning grounds of European hake (Merluccius merluccius) in the Bay ofBiscay. Mol. Ecol. 9, 2067–2079.
Mangaly, G., Jamieson, A., 1978. Genetic tags applied to the European hake,Merluccius merluccius (L.). Anim. Blood Grps. Biochem. Genet. 9, 39–48.
Marshall, T.C., Slate, J., Kruuk, L.E.B., Pemberton, J.M., 1998. Statistical confidencefor likelihood-based paternity inference in natural populations. Mol. Ecol. 7,639–655.
Mehault, S., Dominguez-Petit, R., Cervino, S., Saborido-Rey, F., 2010. Variability intotal egg production and implications for management of the southern stock ofEuropean hake. Fish. Res., 10.1016/j.fishres.2010.03.019.
Miller, S.A., Dykes, D.D., Polesky, H.F., 1988. A simple salting-out procedure forextracting DNA from human nucleated cells. Nucl. Acids Res 16, 1215.
Moran, P., Lundy, C., Rico, C., Hewitt, G.M., 1999. Isolation and characterization ofmicrosatellite loci in European hake, Merluccius merluccius (Merlucidae,Teleostei). Mol. Ecol. 8, 1357–1358.
Myers, R.A., 1997. Comment and reanalysis: paradigms for recruitment studies.Can. J. Fish. Aquat. Sci. 54, 978–981.
Olaso, I., Sanchez, F., Pineiro, C.G., 1994. Influence of anchovy and blue whiting inthe feeding of Northern Spain hake. ICES CM P:9.
Palumbi, S.R., 1994. Genetic divergence, reproductive isolation and marinespeciation. Ann. Rev. Ecol. Syst 25, 547–572.
Parrish, R.H., Nelson, C.S., Bakun, A., 1981. Transport mechanisms and reproductivesuccess of fishes in the California current. Biol. Oceanogr 1, 175–203.
Pineiro, C., Rey, J., de Pontual, H., Goni, R., 2007. Tag and recapture of Europeanhake (Merluccius merluccius L.) off the Northwest Iberian Peninsula: firstresults support fast growth hypothesis. Fish. Res. 88, 150–154.
Planes, S., Jones, G.P., Thorrold, S.R., 2009. Larval dispersal connects fishpopulations in a network of marine protected areas. Proc. Natl. Acad. Sci.106, 5693–5697.
Podesta, G.P., 1989. Migratory pattern of argentine hake Merluccius hubbsi and oceanicprocesses in the Southwestern Atlantic Ocean. Fish. Bull. U.S 88, 167–177.
Raymond, M., Rousset, F., 1995. GENEPOP (version 1.2): population geneticssoftware for exact tests and ecumenicism. J. Hered. 86, 248–249.
A. Pita et al. / Continental Shelf Research 31 (2011) 376–387 387
Reiss, C.S., Hewes, C.D., Holm-Hansen, O., 2009. Influence of atmosphericteleconnections and upper circumpolar deep water on phytoplanktonbiomass around Elephant Island, Antarctica. Mar. Ecol. Progr. Ser. 377,51–62.
Roldan, M.I., Garcıa, J.L., Utter, F.M., Pla, C., 1998. Population genetic structure ofEuropean hake, Merluccius merluccius. Heredity 81, 327–334.
Rıos, A.F., Perez, F.F., Fraga, F., 1992. Water masses in the upper and middle NorthAtlantic Ocean East of the Azores. Deep Sea Res. 39, 645–658.
Rousset, F., 1997. Genetic differentiation and estimation of gene flow fromF-statistics under isolation by distance. Genetics 145, 1219–1228.
Ruzzante, D.E., Taggart, C.T., Lang, S., Cook, D., 2000. Mixed-stock analysis ofAtlantic cod near the gulf of St. Lawrence based on microsatellite DNA. Ecol.Appl. 10 (4), 1090–1109.
Ryan, A.W., Mattiangeli, V., Mork, J., 2005. Genetic differentiation of the bluewhiting (Micromesistius poutassou) populations at the extremes of the speciesrange and at the Hebrides–Porcupine Bank spawning grounds. ICES J. Mar. Sci62, 948–955.
Sambrook, J., Fritsch, E., Maniatis, T., 1989. Molecular Cloning, A LaboratoryManual second ed. Cold Spring Harbor Laboratory Press, New York.
Sanchez, F., Gil, J., 2000. Hydrographic mesoscale structures and Poleward Currentas a determinant of hake (Merluccius merluccius) recruitment in southern Bayof Biscay. ICES J. Mar. Sci 57, 152–170.
Seeb, J.E., Habicht, C., Templin, W.D., Seeb, L.W., Shaklee, J.B., Utter, F.M., 1999.Allozyme and mitochondrial DNA variation describe ecologically importantgenetic structure of even-year pink salmon inhabiting Prince William Sound,Alaska. Ecol. Freshw. Fish, 8 (3), 122–140.
Selonen, V., Hanski, I.K., Painter, J.N., 2010. Gene flow and natal dispersal in theSiberian flying squirrel based on direct and indirect data. Conserv. Genet 11(4), 1257–1264.
Slatkin, M., 1985. Rare alleles as indicators of gene flow. Evolution 39, 63–65.
Smith, W.G., Jamieson, A., Birley, A.J., 1990. Electrophoretic studies and the stockconcept in marine teleosts. J. Conserv. Int. Expl. Sea 47, 231–245.
Spanakis, E., Tsimenides, N., Zouros, E., 1989. Genetic differences betweenpopulations of sardine, Sardina pilchardus, and anchovy, Engraulis encrasicolus,in the Aegean and Ionian seas. J. Fish Biol. 35 (3), 417–437.
Valdes, L., de Lago Lanzos, A., Sola, A., Sanchez, P., Alvarez, P., 1996. Hake, mackerel,and horse mackerel distribution of eggs and larvae in relation to geostrophiccirculation in the Bay of Biscay. ICES C.M, S:19.
Van Hoof, L., Prellezo, R., Frost, H., Daures, F., Garza Gil, D., Calvo Santos, C.,Bertignac, M., da Rocha, J.M., Garcia, D., Rodgers, P., Holker, F., 2008. Report ofWorking Group on balance between resources and their exploitation (SGBRE).Northern hake long-term management plan impact assessment (SGBRE-07-05). EUR—Scientific and Technical Research series 10.2788/40449.
Van Oosterhout, C., Hutchinson, W.F., Wills, D.P.M., Shipley, P., 2004. Micro-Checker: software for identifying and correcting genotyping errors inmicrosatellite data. Mol. Ecol. Notes 4, 535–538.
Villasante, C.S., Gonzalez Laxe, F., Garcıa-Negro, M.C., 2008. Evaluacion del exito dela aplicacion de los TAC en la polıtica pesquera comunitaria. In: Gonzalez Laxe,F. (Ed.), Lecciones de Economıa Pesquera. Netbiblio, A Coruna, pp. 189–226.
Waples, R.S., 1987. A multispecies approach to the analysis of gene flow in marineshore fishes. Evolution 41 (2), 385–400.
Waples, R.S., Gaggiotti, O., 2006. What is a population? An empirical evaluation ofsome genetic methods for identifying the number of gene pools and theirdegree of connectivity. Mol. Ecol. 15, 1419–1439.
Waples, R.S., Punt, A.E., Cope, J.M., 2008. Integrating genetic data into managementof marine resources: how can we do it better? Fish Fish 9 (4), 423–449.
Ward, R.D., 2000. Genetics in fisheries management. Hydrobiologia 420, 191–2001.Weir, B.S., Cockerham, C.C., 1984. Estimating F-statistics for the analysis of
population structure. Evolution 38, 1358–1370.Wright, S., 1943. Isolation by distance. Genetics 28, 114–138.