Western Flank Update
16
Western Flank Update ENERGY RESOURCES DIVISION ROUNDTABLE FOR OIL AND GAS IN SA
-
Upload
khangminh22 -
Category
Documents
-
view
3 -
download
0
Transcript of Western Flank Update

Western Flank Update
E N E R G Y R E S O U R C E S D I V I S I O N R O U N D T A B L E
F O R O I L A N D G A S I N S A

2
Compliance statements
Disclaimer
This presentation contains forward looking statements that are subject to risk factors associated
with oil, gas and related businesses. It is believed that the expectations reflected in these
statements are reasonable but they may be affected by a variety of variables and changes in
underlying assumptions which could cause actual results or trends to differ materially, including,
but not limited to: price fluctuations, actual demand, currency fluctuations, drilling and production
results, reserve estimates, loss of market, industry competition, environmental risks, physical risks,
legislative, fiscal and regulatory developments, economic and financial market conditions in various
countries and regions, political risks, project delays or advancements, approvals and cost estimates.
Underlying EBITDAX (earnings before interest, tax, depreciation, amortisation, evaluation,
exploration expenses and impairment adjustments), underlying EBITDA (earnings before interest,
tax, depreciation, amortisation, evaluation and impairment adjustments), underlying EBIT (earnings
before interest, tax, and impairment adjustments) and underlying profit are non-IFRS measures
that are presented to provide an understanding of the performance of Beach’s operations. They
have not been subject to audit by Beach’s external auditors but have been extracted from audited
financial statements. Underlying profit excludes the impacts of asset disposals and impairments, as
well as items that are subject to significant variability from one period to the next. The non-IFRS
financial information is unaudited however the numbers have been extracted from the audited
financial statements.
All references to dollars, cents or $ in this presentation are to Australian currency, unless otherwise
stated. References to “Beach” may be references to Beach Energy Limited or its applicable
subsidiaries. Unless otherwise noted, all references to reserves and resources figures are as at 30
June 2018 and represent Beach’s share. Certain FY19 planned activities are subject to joint venture
approvals. References to planned activities beyond FY19 are subject to finalisation of work
programs, joint venture approvals and Board approvals.
Reserves disclosure
Petroleum Resources Management System (PRMS) published by the Society of Petroleum
Engineers. The reserves and contingent resources presented in this report were originally disclosed
to the market in ASX release #034/18 from 2 July 2018. Beach confirms that it is not aware of any
new information or data that materially affects the information included in the aforesaid market
announcement and that all the material assumptions and technical parameters underpinning the
estimates in the aforesaid market announcement continue to apply and have not materially
changed.
Conversion factors used to evaluate oil equivalent quantities are sales gas and ethane: 5.816 TJ per
kboe, LPG: 1.389 bbl per boe, condensate: 1.069 bbl per boe and oil: 1 bbl per boe. The reference
point for reserves determination is the custody transfer point for the products. Reserves are stated
net of fuel and third party royalties.

3
Beach Energy portfolio
29.4
MMboe
326
MMboe
FY19 2P reserves
Western
Flank
Cooper
Basin
Perth
Basin
Otway
Basin
Bass
Basin
Taranaki
Basin
FY19 production
Western
Flank
Cooper
Basin
Perth
Basin
Otway
Basin
Bass
Basin
Taranaki
Basin

4
Asset summary
AssetBeach
InterestOperator?
FY19 production1
(MMboe)
FY19 2P reserves2
(MMboe)
FY20 capex3
range ($million)Key FY20 proposed activities
Western Flank Oil 40 – 100% Op/Non-op 5.2 42 200 – 225 Drill up to 77 wells
Western Flank Gas 100% Op 1.9 16 40 – 60 Drill up to 7 wells
Cooper Basin JV Various Non-op 8.3 84 200 – 220 Drill ~100 wells
SA Otway 70 - 100% Op - 1 30 – 35 Drill 2 wells. Gas facility construction
Vic Otway 60% Op 8.4 62 205 – 225 Commence 10 well drilling campaign
BassGas 53.75%4 Op 1.7 20 10 – 25 Trefoil concept select
Kupe (New Zealand) 50% Op 3.2 27 15 – 20 Compression project FID
Perth Basin 50%5 Op/Non-op 0.7 73 30 – 35 Drill 1 well. Waitsia Stage 2 FID
Frontier Exploration Various Op/Non-op - - 15 – 15 Preparation for FY21 drilling
TOTAL 29.4 326 750 – 850
1. Refer to Q4 FY19 quarterly report ref: #020/19 dated 24th July 2019 for further details
2. Refer to FY19 annual report for further details
3. Based on data contained within slide 13
4. Beach interest in producing permits. 50.25% interest in retention licenses.
5. Note that Perth Basin, Beharra Springs interest of 50% is subject to completion of sale of 17% interest to Mitsui E&P Australia

5
Cooper Basin OverviewKey assets include Western Flank (operated and non-operated) and CBJV (non-operated)
• Cooper Basin has been explored over the past 60
years
• Few operators active in the Basin over this period
• Western Flank play was discovered following
large acreage relinquishment in 1999. Its full
potential has only been recently unlocked
following a change in appraisal strategy
• Infrastructure ownership (Western Flank oil/gas
and Moomba gas plant) provides secure access
to markets
• Cooper Basin Joint Venture operator Santos is
targeting a 10-23% increase in output from 2018
to 2025
Beach’s Cooper Basin interests span more than 8 million acres with surface infrastructure

6
Western Flank OilSuccessful year of appraisal and development
FY19 2P reserves
Western
Flank Oil
Rest of
Beach
FY19 production
29.4
MMboe
Western
Flank Oil
Rest of
Beach
326
MMboe
FY19 Highlights:
✓ 10% increase in production on FY18, 2P
reserves now 42MMbbl, +7 MMbbl over FY18
✓ Increased drilling activities. 34 Western Flank
oil wells drilled, +127% over FY18, at a higher
success rate
✓ Included eight horizontal wells; six operated
✓ Successful oil appraisal programs in Bauer and
Hanson fields, field limits increased vs prior 2P
reserves mapping
5.2 MMboe
42 MMbbl,

7
Western Flank OilRecord year of investment and drilling activity planned in FY20
FY20 proposed activities
• ~$200 million to be invested in Western Flank oil, a record for Beach
• Up to 77 oil wells to be drilled in FY20, including:
• 36 exploration and appraisal wells
• 41 development wells (including up to 17 horizontal wells)
• ~15% of FY20 growth investment for infrastructure expansion and debottlenecking to
unlock Western Flank potential
• Continued roll out of the Bauer appraisal strategy across fields as well as follow-up
appraisal drilling at Bauer, Hanson and Kalladeina-Congony complex

8
Western Flank OilBauer (Beach 100% interest) – keeps on getting bigger
Success of the Bauer appraisal strategy
• Flat structural relief means seismic is of limited value in
defining field extent
• In FY19 Beach appraised “through the drill bit”
• Four step-out appraisal wells in Bauer discovered an
easterly extension to the field
• Further appraisal is required at Bauer to define the field
structure, remaining oil potential and full field development
• In FY20 Beach plans on drilling 8 appraisal wells at Bauer
and 15 development wells, including 7 horizontal wells
• Further recent appraisal success at Bauer North West-2 and
Bauer North-2, coming in 6 metres and 8 metres high to
prognosis respectively.
• Field remapping to follow completion of appraisal
campaign and reserves updated at the end of FY20
Top reservoir map
(pre-2018 appraisal campaign)Top reservoir map
(pre-2019 appraisal campaign)
Bauer
NW-2
Bauer N-2

9
Western Flank Oil
Improvement in drilling/connection times
• In FY18 Beach’s first ever operated horizontal well, Bauer-26, achieved 12.7
days from spud-to-total depth (TD) and 31 days from spud to online
• In FY19, the first four operated horizontal wells averaged spud-to-TD of 8.5
days and spud to online time of 23.5 days
• Improved spud-to-TD times means cheaper wells and more wells drilled
per year per rig
• The 24% improvement in spud-to-online time means oil production is
accelerated
Bauer Field development
Horizontal vs vertical wells
• Beach has increased the application of horizontal well technology,
targeting the lower permeability McKinlay and Birkhead reservoirs
• Three horizontal wells drilled in all of FY18
• Five operated horizontal wells drilled in H1 FY19
• Horizontal wells drilled in H1 FY19 show an 8.2x average well
productivity improvement over vertical wells for 1.5x the cost
• Forecast aggregate 30-day initial production rate of ~7,000 bopd on
pump from horizontal wells Bauer-29,-30,-31,-32
Total measured
depth
Spud-to-TD Spud-to-
online
Bauer-26 2,260 metres 12.7 days 31 days
Bauer-29 -30 -31 and -32 2,660 metres 8.5 days 23.5 days
Vertical
McKinlay
Producers
Horizontal
McKinlay
producers
Horizontal
vs vertical
wells
Average well cost1 $2.8 million $4.3 million 1.5x
Well productivity index2 0.4 3.3 8.2x
1. Average well cost includes drill, complete, connect and artificial lift costs.
2. Well productivity index (PI) calculated as bbl/day/psi.
Seven additional horizontal development wells currently planned in Bauer Field for FY20

10
Western Flank OilBauer Field activity
Bauer Field with four
active rigs (3 drilling,
1 workover)
September 2019

11
Western Flank Gasex PEL 106, ex PEL 107 and ex PEL 91, Beach 100% and operator
FY19 2P reserves
Western
Flank Gas
Rest of
Beach
FY19 production
29.4
MMboe
Western
Flank Gas
Rest of
Beach
326
MMboe
FY19 Highlights:
✓ 35% increase in production on FY18, 2P
reserves now 16MMboe, +8 MMboe over FY18
✓ Successful gas exploration/appraisal programs
in Lowry and Udacha South fields extended
field limits vs prior 2P reserves mapping
✓ Lowry field is a high liquids content gas field
(50 bbl/mmscf)
FY20 Focus:
• Potential further appraisal drilling at Lowry and
Middleton
• Drill 3-5 prospects delineated by Spondylus 3D
seismic survey to extend proven stratigraphic
play and test new exploration plays
• Aim is to increase reserves to extend plateau
at Middleton and/or expand capacity
1.9 MMboe
16 MMboe

12
Stratigraphic Overview- Key Patchawarra Intervals
Western Flank Gas
Type Logs from
Composite of Wells, Gas zones
EA
RLY
PER
MIA
N
APP321
APP223
APP221
APP21
Palynology
zone
Sak
mari
an
290.1
295.0
Artin
skian
Age Ma
Seismic Package
markers
Vs18
Vs30
Vs45
Vs50A
Vs50
Vs80ALowry
Vs80A
Seismic Package
name
Canunda
Vs45
Brownlow
Vs50A
Middleton
Vs50
Coolawang
Vs80B
Wells with Hydrocarbon Pools
Soft events
0 GR 200 140 DT 40 Den /neut.Tirrawarra
Murteree
Litho-
stratigraphy
Patc
haw
arr
a F
orm
ati
on
50
m Vs30
Vs18
Vs80B
Canunda 1,2,3; Raven 1, 2ST, 3
Raven 4, Lowry 1, Smegsy 1, Nulla 1
Brownlow 1, Udacha 1, Crawford 1, Largs DW1, Coalinga
1DW1, Udacha S2, Smegsy 1, Aratna 1
Haslam 1, Ralgnal 1, Coolawang 1
Middleton 1, Middleton East 1 , Crockery 1 , Largs DW1, Naiko
1, Webb 1, Ralgnal 1, Ralgnal East 1, Crockery West 1,
Coolawang 1, Raven 4, Raven 1, Smegsy 1, Mokami 1, Aratna 1
Moonanga 1*, Jack Lake 1*, Raven 4
Lowry 1, 2, 3, 4, 5; Udacha South 1, 2; Mokami 1, Smegsy 1,
Admella 1, Aratna 1, Carrickalinga 1, Southend 1
Upper, Middle,
and Lower
Brownlow Sands
Coolawang 1, Canunda 2, Canunda 3, Maupertuis 1
*Moonanga & Jack Lake are stacked plays east of PEL106 – producing gas from all intervals – included here in upper section (Vs30) to indicate shallow reservoirs possible

13
Patchawarra stratigraphic play concept
Western Flank Gas
14
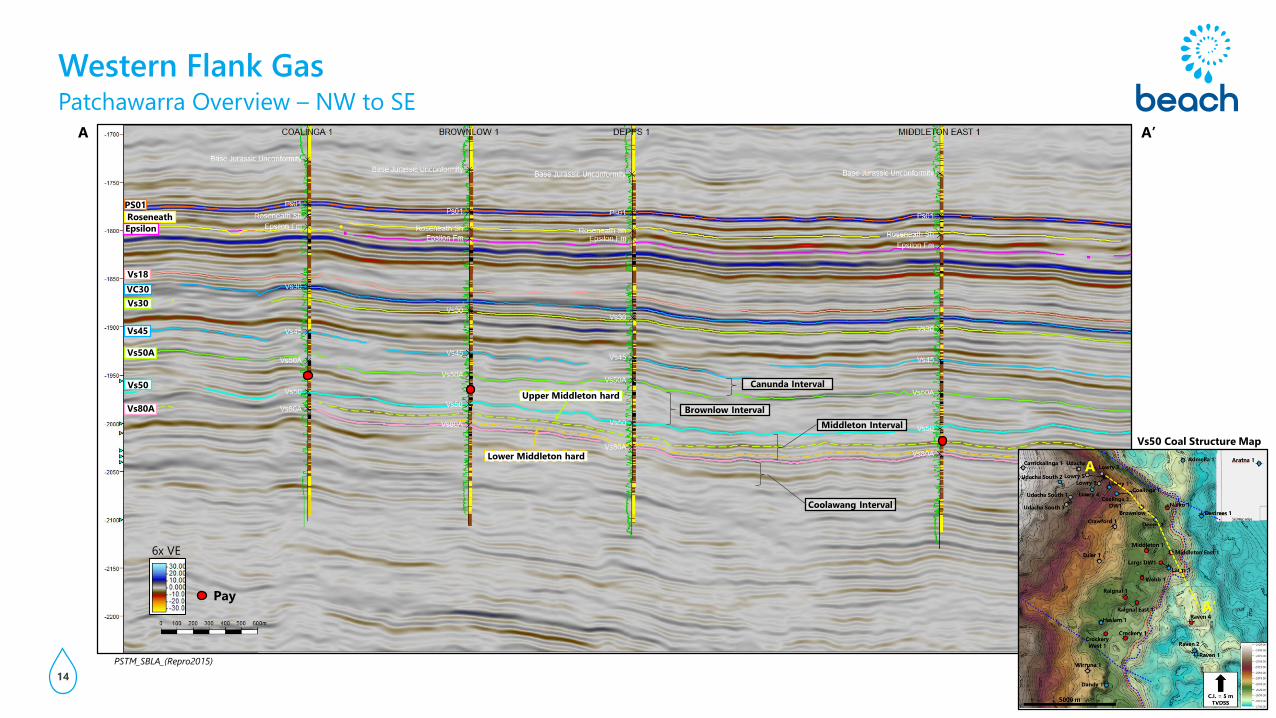
Patchawarra Overview – NW to SE
Western Flank Gas
A A’
A
A’
Vs50A
PS01
Roseneath
Epsilon
Vs18
Vs30
Vs45
Vs50
Vs80A
Pay
PSTM_SBLA_(Repro2015)
VC30
Upper Middleton hard
Lower Middleton hard
6x VE
Vs50 Coal Structure Map
Middleton Interval
Brownlow Interval
Coolawang Interval
Canunda Interval

15
Western Flank GasLowry Field activity
Lowry 1 Patchawarra DST Lowry 2,3,4,5 Pad

Beach Energy Limited
Level 8, 80 Flinders Street
Adelaide, South Australia 5000
T: +61 8 8338 2833
F: +61 8 8338 2336
beachenergy.com.au