WEST AFRICA: VOLTA DISCHARGE DATA QUALITY ASSESSMENT AND USE1
14
ABSTRACT: Water resource management in West Africa is often a complicated process due to inadequate resources, climatic extremes, and insufficient hydrological information. Insufficient data hinder sustainable watershed management practices, one of the top priorities in the Volta River Basin. This research properly fills in missing data by modeling the hydrological dis- tribution in the Volta River Basin. On average, discharge gages across the basin are missing 20 percent of their monthly data over 20 years. Two methods were used to supplement missing data: a statistically linear model and a conceptual hydrological model. A linear equation, developed from the regression of pre- cipitation and runoff, was used to evaluate the quality of exist- ing data. The hydrological model separates the system into root and groundwater zones. Measured values were used to cali- brate the hydrological model and to validate the statistical model. The quality of existing data was analyzed and organized for usability. Accuracy of the hydrological model was also eval- uated for its effectiveness using R 2 and standard error. It was found that the hydrological model was an improvement from the linear model on a monthly basis; R 2 values improved by as much as 0.5 and monthly error decreased. Monthly predictions of the hydrological model were used to fill gaps of measured data sets. (KEY TERMS: water balance; modeling, hydrology, statistics, Volta River Basin, West Africa.) Taylor, Joie C., Nick van de Giesen, and Tammo S. Steenhuis, 2006. West Africa: Volta Discharge Data Quality Assessment and Use. Journal of the American Water Resources Association (JAWRA) 42(4):1113-1126. INTRODUCTION Environmental sustainability is of top priority of watershed management in the Volta River Basin (Andreini et al., 2000). Hindrances to watershed man- agement in the Volta River Basin include high popu- lation densities, population growth rate, poverty, watershed size, the size and number of dams within the basin, the dynamics of the climate and environ- ment insufficient information, and inadequate com- munication between countries (Andreini et al., 2000; UNEP, 2001). The countries in the watershed, Ghana, Burkina Faso, Cote d’Ivoire, Togo, Benin, and Mali, are largely interdependent, as upstream/downstream actions and effects are greatly connected. Therefore, discourse between the countries aided by the use of a hydrological model is imperative. A model that repre- sents the entire watershed and is accepted by the international community can improve communication between each country, and support efforts towards environmental sustainability. At present, no compre- hensive hydrological model for the Volta River Basin exists (Andreini et al., 2000), which makes objective communication about water issues nearly impossible. To develop such a model requires quality, long term data sets of river discharge, precipitation, and evapo- ration, none of which are complete and available from any country in the watershed. Various methods have been developed to fill in for missing data within a set. Here a model has been developed to test and refine the quality of the data to describe river discharge. 1 Paper No. 04045 of the Journal of the American Water Resources Association (JAWRA) (Copyright © 2006). Discussions are open until February 1, 2007. 2 Respectively, Research Assistant, Department of Biological and Environmental Engineering, Cornell University, Riley Robb Hall, Ithaca, New York 14853; Professor, Department of Water Management, Civil Engineering, and Geosciences, TU Delft, Steevinweg 1,2628 CN Delft, P.O. Box 5048, 2600 GA Delft, The Netherlands; and Professor, Department of Biological and Environmental Engineering, Cornell University, Riley Robb Hall, Ithaca, New York 14853 (E-Mail/Steenhuis: [email protected].) JOURNAL OF THE AMERICAN WATER RESOURCES ASSOCIATION 1113 JAWRA JOURNAL OF THE AMERICAN WATER RESOURCES ASSOCIATION AUGUST AMERICAN WATER RESOURCES ASSOCIATION 2006 WEST AFRICA: VOLTA DISCHARGE DATA QUALITY ASSESSMENT AND USE 1 Joie C. Taylor, Nick van de Giesen, and Tammo S. Steenhuis 2
-
Upload
independent -
Category
Documents
-
view
1 -
download
0
Transcript of WEST AFRICA: VOLTA DISCHARGE DATA QUALITY ASSESSMENT AND USE1

ABSTRACT: Water resource management in West Africa is oftena complicated process due to inadequate resources, climaticextremes, and insufficient hydrological information. Insufficientdata hinder sustainable watershed management practices, oneof the top priorities in the Volta River Basin. This researchproperly fills in missing data by modeling the hydrological dis-tribution in the Volta River Basin. On average, discharge gagesacross the basin are missing 20 percent of their monthly dataover 20 years. Two methods were used to supplement missingdata: a statistically linear model and a conceptual hydrologicalmodel. A linear equation, developed from the regression of pre-cipitation and runoff, was used to evaluate the quality of exist-ing data. The hydrological model separates the system into rootand groundwater zones. Measured values were used to cali-brate the hydrological model and to validate the statisticalmodel. The quality of existing data was analyzed and organizedfor usability. Accuracy of the hydrological model was also eval-uated for its effectiveness using R2 and standard error. It wasfound that the hydrological model was an improvement fromthe linear model on a monthly basis; R2 values improved by asmuch as 0.5 and monthly error decreased. Monthly predictionsof the hydrological model were used to fill gaps of measureddata sets.(KEY TERMS: water balance; modeling, hydrology, statistics,Volta River Basin, West Africa.)
Taylor, Joie C., Nick van de Giesen, and Tammo S. Steenhuis,2006. West Africa: Volta Discharge Data Quality Assessmentand Use. Journal of the American Water Resources Association(JAWRA) 42(4):1113-1126.
INTRODUCTION
Environmental sustainability is of top priority ofwatershed management in the Volta River Basin(Andreini et al., 2000). Hindrances to watershed man-agement in the Volta River Basin include high popu-lation densities, population growth rate, poverty,watershed size, the size and number of dams withinthe basin, the dynamics of the climate and environ-ment insufficient information, and inadequate com-munication between countries (Andreini et al., 2000;UNEP, 2001). The countries in the watershed, Ghana,Burkina Faso, Cote d’Ivoire, Togo, Benin, and Mali,are largely interdependent, as upstream/downstreamactions and effects are greatly connected. Therefore,discourse between the countries aided by the use of ahydrological model is imperative. A model that repre-sents the entire watershed and is accepted by theinternational community can improve communicationbetween each country, and support efforts towardsenvironmental sustainability. At present, no compre-hensive hydrological model for the Volta River Basinexists (Andreini et al., 2000), which makes objectivecommunication about water issues nearly impossible.To develop such a model requires quality, long termdata sets of river discharge, precipitation, and evapo-ration, none of which are complete and available fromany country in the watershed. Various methods havebeen developed to fill in for missing data within a set.Here a model has been developed to test and refinethe quality of the data to describe river discharge.
1Paper No. 04045 of the Journal of the American Water Resources Association (JAWRA) (Copyright © 2006). Discussions are open untilFebruary 1, 2007.
2Respectively, Research Assistant, Department of Biological and Environmental Engineering, Cornell University, Riley Robb Hall, Ithaca,New York 14853; Professor, Department of Water Management, Civil Engineering, and Geosciences, TU Delft, Steevinweg 1,2628 CN Delft,P.O. Box 5048, 2600 GA Delft, The Netherlands; and Professor, Department of Biological and Environmental Engineering, Cornell University,Riley Robb Hall, Ithaca, New York 14853 (E-Mail/Steenhuis: [email protected].)
JOURNAL OF THE AMERICAN WATER RESOURCES ASSOCIATION 1113 JAWRA
JOURNAL OF THE AMERICAN WATER RESOURCES ASSOCIATIONAUGUST AMERICAN WATER RESOURCES ASSOCIATION 2006
WEST AFRICA: VOLTA DISCHARGE DATAQUALITY ASSESSMENT AND USE1
Joie C. Taylor, Nick van de Giesen, and Tammo S. Steenhuis2

Many models can be used to estimate river dis-charge; model choice depends on such factors ashydrological regime and data availability. To classifymodels according to hydrological regime, the distinc-tion between base flow versus direct overland flow isimportant. Another way models are categorized is bydata requirements. Generally, a distinction is madebetween lumped and distributed models; lumpedmodels can predict stream discharge at the outlet of awatershed relatively well with a few lumpedparameters. However, these models cannot addressthe water content of individual fields or slopes withinthe watershed. Semidistributed models, such as TOP-MODEL (Beven et al., 1995), and distributed models,such as Soil Moisture Routing (SMR) (Kuo et al.,1999), predict the spatial location of the runoff areasas well as the watershed discharge. For distributedmodels, spatial input data on topography, soils, andplant cover are needed. In addition to rules for calcu-lating surface runoff, each of these models maintainsa water balance that calculates evaporation as a func-tion of potential evaporation and moisture status ofthe soil. For lumped models the water balance usuallyholds for the entire watershed contributing to thestreamflow where distributed models calculate mois-ture content for individual grid cells in the watershed.
Data requirements vary between models. For amodel to be useful, its data requirements must bereadily obtainable. For example, infiltration excessmodels require detailed information on soil type,moisture status, and vegetation characteristics.Often, and in the case of the Volta watershed, thesedata are extremely difficult to obtain. Lumped modelshave less stringent data requirements. With just pre-cipitation (P) and potential evapotranspiration (ETp)data, discharge can be calculated with the lumpedThornthwaite-Mather (TM) procedure for relativelylarge watersheds using generalized soil and aquifercharacteristics (Thornthwaite and Mather, 1955). TheTM procedure was developed in the early 1940s andhas successfully been applied in basins throughoutthe world such as Mount Kilimanjaro in Kenya(Dunne and Leopold, 1978), Luancheng County inNorthern China (Kendy et al., 2003), Singkarark-Ombilin in Indonesia (Peranginangin et al., 2004),and northeastern Mexico (Mendoza et al., 2003). Forthis project, the TM procedure was used on a monthlytime step because of its proven ability to successfullypredict monthly stream discharge for larger water-shed where only P and ETp data are available.
Comparative assessments of models are necessaryto highlight strengths and weaknesses. To test theperformance of the TM procedure, we compared it to asimple precipitation runoff linear model. This linearmodel was chosen over others because it involves theleast parameters. It has been demonstrated that
simpler models are of preference because they are lessaffected by parameter uncertainty (Perrin et al.,2001). In the past this model has performed betterthan models that involve more parameters that aresubject to overparameterization and low performancelevels (Perrin et al., 2001).
THE VOLTA DESCRIBED
The Volta watershed (see Figure 1) drains approxi-mately 400,000 km2 of the six riparian countries, andis the ninth largest river/basin in SubSaharan Africa(UNEP, 2001). The percentage of the watershed ineach country varies: 42 percent in Burkina Faso, 40.2percent in Ghana, 6.35 percent in Togo, 4.57 percentin Mali, 3.62 percent in Benin, and 3.24 percent inCote d’Ivoire (Green Cross International, 2001). Thelandscape is predominantly flat with elevations notexceeding 1,000 m. Climatic extremes that character-ize this region are recurring drought, harmattan (hot,dry, usually dusty wind that blows from the northeastor east in the southern Sahara mainly in winter), andsometimes torrential flooding. Highest precipitationlevels occur in the south and can reach an annualmeasurement of 2,000 mm, where levels in the driestregions in the north can be as low as 200 mm annual-ly.
Throughout the region, the terrain includes rainforest, beaches, lagoons, plateaus, wetlands, desert,and savanna. The length of the watershed is approxi-mately 1,600 km long and has three major tributaries,the Black Volta (Mouhoun), the White Volta(Nakanbe), and the Oti (Pendjari). Both the Black andthe White Volta rivers flow south from Burkina Faso,and the Oti flows south from Togo. The Oti, the small-er tributary, is 940 km long. The Black Volta extends1,360 km and the White Volta flows for 1,140 kmbefore merging into the River Volta. Lake Volta,formed by the Akosombo dam, submerges most of theRiver Volta and has an area of 8,500 km2 with a stor-age capacity 153,000 million m3. This dam producesover 90 percent of the electric energy in Ghana. Envi-ronmental problems of top priority in the watershedare loss of biodiversity, waterborne diseases, dimin-ishing water resources, insufficient irrigation, inade-quate/lack of information, and poor institution/legalframework (UNEP, 2001).
For most of the basin precipitation variability isproblematic, forcing the region to suffer consequencesof both droughts and floods. Droughts between 1982and 1984 caused catastrophic energy decreases inBenin, Ghana, and Togo, and accounted for severalhundred thousand deaths throughout the basin,which promoted awareness of problems with reliable
JAWRA 1114 JOURNAL OF THE AMERICAN WATER RESOURCES ASSOCIATION
TAYLOR, VAN DE GIESEN, AND STEENHUIS

water supply, and initiated increases in research(Ofori-Sarpong, 1985). Floods during 1995 and 1999were responsible for several more deaths and the dis-placement of more than 300,000 people (Akuffo,1998). Since then research has attempted to charac-terize within season precipitation variability (Ofori-Sarpong, 1985), estimate average dry spell duration(Adiku et al., 1997), enhance weather prediction(Opuku-Ankomah and Cordery, 1994), and develop acorrelation between global climate change and region-al land use changes (Opoku-Ankoham and Amisigo,1998). However, a complete and thorough water bal-ance study of the entire basin, the first step to water-shed management, has not been carried out. This
project models the entire watershed as one system bydividing the watershed into its major subbasins, andby dividing sub-basins into smaller sections. Modelingthe entire basin as smaller sections provides detailedinformation on the effects of each country to the basinas a whole.
THE HYDROLOGICAL MODEL
This paper uses P, ETp, and soil physical parame-ters to administer the TM procedure for modeling
JOURNAL OF THE AMERICAN WATER RESOURCES ASSOCIATION 1115 JAWRA
WEST AFRICA: VOLTA DISCHARGE DATA QUALITY ASSESSMENT AND USE
Figure 1. Map Showing Tributaries, Dams, Stream Networks, Gaging Stations, and Drainage Areas of the Volta River Basin.Labels refer to gaging station ID numbers in Table 1. Overlapping labels have been omitted.

stream discharge. The soil physical parameter ofinterest is available water capacity (AWC) of the rootzone and is defined as the volume of water that isavailable to the roots of the plant after soil has beenwetted to above field capacity
AWC = Drz*(FC-WP)
where field capacity (FC) and wilting point (WP) arewater contents by volume and Drz represents thedepth of the root zone. Any moisture above the fieldcapacity can no longer be held by capillary forces andtherefore will drain out of the soil. Additionally,plants cannot withdraw moisture below the WP. The WP was estimated as one third of the field capac-ity (Dunne and Leopold, 1978). Also we define the parameter soil moisture (SM), which is the depth(volume/unit area) of water held above WP in the rootzone.
In the TM procedure, the calculation of evaporationand soil moisture depends on the distinction betweenwet and dry months. For wet months, the P is greaterthat the ETp and for dry months, the P is smallerthan the ETp. In the procedure, the value of AWC ofthe last month of a dry season is taken as the initialsoil moisture of the first wet month. For subsequentwet months, the amount of plant available moisturein the root zone is calculated as
SMt = SMt-1 + P - ETp
where SMt is the soil moisture storage of the currentmonth and SMt-1 is the soil moisture of the previousmonth. Note that SM is the soil moisture available toplants and thus at SM = 0 the moisture content in thesoil is at the WP. In Equation (2), values of P and ETpare monthly values. Since surplus water above fieldcapacity, SMsurplus, cannot be held by the soil, duringthe months where the calculated SMt is greater thanthe AWC, SMt is set to AWC and the surplus becomesrecharge to the ground water.
For the dry months, the soil moisture is calculatedas
Moisture surplus, SMsurplus, is zero when the calcu-lated SMt is less than the AWC.
The ground water recharge only takes place in theseasonal wet valleys. Consequently, only a portion ofthe ground water in the watershed contributes to thestreamflow. Then, the average volume of recharge, Rt,per unit area in the watershed can be calculated as
Rt = β*SMsurplus
where β is the fraction of the watershed thatrecharges the ground water.
The stream discharge itself is a function of theground water storage, SG. The ground water storageis depleted by the base flow in the stream and supple-mented by the recharge. We follow here the originalTM procedure (Thornthwaite and Mather, 1955)which assumes that a constant fraction (1-α) of theground water storage each month becomes stream-flow. The parameter a, is that fraction of the groundwater storage at the beginning of the month thatremains as storage at the end of the month. Based onthis, SG can be written as
SG(t) = (1 - α) * (SG(t-1) + Rt)
where SG(t-1) is the ground water storage in the previ-ous month, SG(t) is the current ground water storage,and Rt is the ground water recharge during the pastmonth. The fraction of water that leaves the basin asrunoff varies with the physics of the basin. Thornth-waite and Mather (1955) suggest that for large catchments in the southeastern United States,approximately 50 percent (i.e., α = 0.5) of the totalavailable runoff actually becomes river flow eachmonth. The rest of the surplus is retained in the sub-soil, small lakes, and channels and is available forrun-off in the following month. Values for AWC, α,and β are estimated by calibration as discussed laterin this paper.
DATA AVAILABLE
The model and simulation devised in this projectrequired various types of data. The data used for thehydrological model included ETp and P as inputparameters, and stream discharge for calibration andvalidation. Other data used includes a digital eleva-tion map (Land Processes, 2004). This map was usedin a geographic information system (GIS) based pro-gram, Idrissi 32 (Clark Labs, 2006), where watershedareas were outlined to extrapolate ETp, P, and dimen-sion information.
Because multiple sources were available for specificdata, it was necessary as a first step to select betweendifferent sources. Precipitation data were obtainedfrom three sources: Water Resources Institute of theCouncil for Scientific and Industrial Research (WRI),Accra, Ghana; the Global Gridded Climatology (GGC)compiled by the Climatic Research Unit at resolutionof 0.50 lat/lon, and published by New et al. (1999a,b);and Direction Générale de l'Inventaire des Ressources
JAWRA 1116 JOURNAL OF THE AMERICAN WATER RESOURCES ASSOCIATION
TAYLOR, VAN DE GIESEN, AND STEENHUIS
(1)
(2)
SM SMP ETp
AWCt t= −
−1 * exp (3)
(4)
(5)

Hydrauliques du Burkina-Faso (DGIRH). (Editor’snote: The author has explained that some data setsused for this paper were obtained from organizationsby very special request, and that no full citation ispossible.) The records from DGIRH included monthlyprecipitation data from 82 gages across the watershedover an average of 40 years. The GGC compiledmonthly data from nearly 90 gages over 50 yearsacross the entire watershed area, where WRI detailedweekly data from only nine gages over an average of60 years exclusively in Ghana. Because WRI was notcomprehensive enough, these data were not consid-ered or analyzed for its usability. To compare the pre-cipitation data from the two data sets, the monthlyprecipitation within the Black Volta basin fromDGIRH for gages (PDGIRH) were averaged togetherand then compared to monthly totals extracted fromone GGS pixel grid (PGGC) representing the BlackVolta sub-basin. The Black Volta subbasin was chosenbecause precipitation gages within the DGIRHspreadsheet were the most consistent. The R2 wasobtained and prediction error, PE was calculated as
where n is the number of observations. Figure 2shows a graphical comparison between the two datasets for the gages covering the area of the Black Voltasubbasin. The R2 value of 0.97 and the error of 15.5mm show that the two data sources for the BlackVolta subbasin (Figure 2) are similar. We decidetherefore to use the GGC data in all comparisons andsimulations. Additionally, GGC data was more conve-nient as it could be used directly with GIS while theDGIRH set was provided in a spreadsheet that wasnot organized by gage position and would have to bereformatted and recalculated for each stream dis-charge gage.
Potential evaporation was available from DGIRH.The Climatic Research Unit (CRU) (New et al.,1999a,b) also provided data for vapor pressure, windspeed, and temperature that was used to calculateETp using Penman’s equation. These calculationswere compiled by Philip Oguntunde of the Center forDevelopment Research at Bonn University, Germanyto allow use of GIS. The data from Burkina Faso cov-ers the region inside Burkina Faso exclusively. Thissource provides monthly ETp data for eight sitesthroughout the country from 1961-1990. BecauseOguntunde’s calculation was more inclusive, it waschosen as the source of ETp data. Both precipitationand precipitation estimates were made by overlayinga map of the area with a pixel grid. Each pixel, at
0.5˚ x 0.5˚ per cell (1 cell ≈ 11,700 km2), was weightedby that pixel’s contribution to the total area, and themonthly mean was computed by adding the weightedpixels in the total area (Andreini et al., 2000).
Two sources of stream discharge, the WRI ofGhana and L’Institut de Recherche pour le Développe-ment (ORSTOM), proved advantageous. Figure 1shows the location of each streamflow gage listed inTable 1. Table 1 lists the stream discharge gages forwhich data were available by source. Gages are cate-gorized by subbasin and are located on the principalriver unless noted. Gages located on tributaries ofrivers are followed by the name of the tributary inparentheses. The second column indicates which datasource provided the data. Between both sources, 20percent of the data over the entire watershed is miss-ing. Many of the gages are missing as much as 50 per-cent of their data, which indicates the necessity to fillthese gaps. This high percentage of missing data(Table 1) together with the percent difference betweenthe sources (Table 2) suggests data inaccuracy.
Often one source would have data for a gage thatanother would not, which allowed for filling in miss-ing data from one source to another. To determine ifthis was feasible, correspondence between the twogages was investigated. For the years and stationswhere both sources provided data, a linear regressionwas performed to examine the correlation betweenthe two sources. Figure 3 is a sample graph showingthe correlation between these two sources at Bamboion the Black Volta River. Bamboi, the gauging stationthat measures the entire Black Volta subbasin, waschosen as an example gage, because it has the fullestrecord of the gages that cover an entire subbasin.
JOURNAL OF THE AMERICAN WATER RESOURCES ASSOCIATION 1117 JAWRA
WEST AFRICA: VOLTA DISCHARGE DATA QUALITY ASSESSMENT AND USE
Figure 2. Linear Regression of Monthly Precipitation DataBetween GGC and MH on the Black Volta River.
PE
P P
n
DGIRH i GGC ii
n
=( ) − ( )[ ]
−=∑
2
11
(6)

JAWRA 1118 JOURNAL OF THE AMERICAN WATER RESOURCES ASSOCIATION
TAYLOR, VAN DE GIESEN, AND STEENHUIS
TABLE 1. Streamflow Gage Site Details.
Lat. Long. Yi Yf No. AreaID Name Source CC (˚) (˚) 19xx 19xx Years %miss (km2)
Black Volta
1 Badara (Kou) ORSTOM BF 11.37 -4.37 55 85 16 57.5 9712 Bamboi-WRI WRI GH 8.15 -2.03 51 91 33 36 134,2003 Bamboi ORSTOM GH 8.15 -2.03 51 74 24 0.7 134,2004 Banzo ORSTOM BF 11.32 -4.82 56 87 32 8.62 3,0245 Batie (Bambassou) ORSTOM BF 9.98 -2.90 71 85 15 2.9 6,0756 Boromo ORSTOM BF 11.78 -2.92 55 91 31 0.7 48,0787 Bui-WRI WRI GH 8.15 -2.12 54 93 33 4.5 111,8538 Dan (Bougouriba) ORSTOM BF 10.92 -3.67 70 85 16 28.83 90,859 Dapola ORSTOM BF 10.57 -2.92 52 84 32 0.63 96,437
10 Diebougou (Bougouriba) ORSTOM BF 10.93 -3.17 63 86 24 9.82 15,14011 Guena ORSTOM BF 11.08 -4.68 62 82 10 64.4 90712 Kalbuipe (Sur)-WRI WRI GH 8.79 -1.14 63 97 16 48.2 3,04413 Kouri ORSTOM BF 12.73 -3.48 55 83 21 33.63 27,15614 Lawra-WRI WRI GH 10.64 -2.94 51 75 23 16.8 96,00015 Lawra ORSTOM GH 10.63 -2.92 51 73 23 0 96,00016 Manimenso ORSTOM BF 12.75 -3.40 56 85 29 3.4 21,12417 Nasso (Kou) ORSTOM BF 11.20 -4.43 61 71 11 6.25 40618 Noumbiel ORSTOM BF 9.68 -2.77 75 85 8 27.6 87,62519 Nwokuy ORSTOM BF 12.52 -3.55 56 88 33 0 1209420 Ouessa ORSTOM BF 11.02 -2.83 70 85 16 16.7 6028321 Tainso (Tain)-WRI WRI GH 8.18 -2.17 63 92 19 29 611322 Tenado ORSTOM BF 12.17 -2.82 76 85 10 0 24086
White Volta
23 Bagre ORSTOM BF 11.20 0.43 74 90 17 6.4 3610224 Bagre (Tcherbo) ORSTOM BF 11.69 1.47 78 86 8 29.5 603325 Bissiga (nakanbe) ORSTOM BF 12.75 1.15 74 83 10 5.8 1800326 Bittou (Nouhao) ORSTOM BF 11.18 0.28 74 85 12 20.5 604427 Dakaye ORSTOM BF 11.78 1.60 75 86 12 1.4 603328 Garu-WRI WRI GH 10.90 0.39 66 70 5 47.2 13229 Lankatere (Mole)-WRI WRI GH 9.29 1.25 71 77 6 47.4 1825330 Nabogo(Nabogo)-WRI WRI GH 9.77 0.88 62 86 25 22 304031 Nakpanduri(Red)-WRI WRI GH 10.65 0.23 58 63 6 47.2 303032 Nangodi(Nazinon)-W WRI GH 10.87 0.62 63 74 10 16.2 1207733 Nangodi (Nazinon) ORSTOM GH 10.87 0.62 63 73 11 0 1207734 Nasia (Nasia) WRI GH 10.15 0.77 67 89 12 57.6 607035 Nawuni ORSTOM GH 9.70 1.10 53 73 21 2.8 9974136 Nawuni WRI GH 9.70 1.08 53 90 36 12.8 9974137 Nebbou (Sissili-WHT) ORSTOM BF 11.28 1.93 74 85 12 8.3 303038 Niagho (Nakanbe) ORSTOM BF 11.77 0.75 51 84 27 9.5 3004639 Nobere WRI GH 11.43 1.18 58 75 17 13.4 905240 Pwalugu (WHT) WRI GH 10.58 0.85 52 77 25 30.6 4824341 Pwalugu (WHT) ORSTOM GH 10.58 0.85 52 73 21 0 4824342 Rambo ORSTOM BF 13.6 2.07 83 87 4 13.3 299543 Sakoinse (Red,Nazinon) ORSTOM BF 12.2 2.02 70 85 11 33 3001
Notes: Identification numbers correspond to gage locations in Figure 1, Map of the Volta River Basin. Gages are listed per subbasin. CC = Country Code, BF = Burkina Faso, GH = Ghana, TG = Togo, IV = Cote d’Iviore, BJ = Benin. Latitude and longitude, datum WGS84, are given in decimal degrees. Yi (year initial) and Yf (year final) indicate the start and end of the range of data. The next column gives the total number of years that have data within the range followed by %miss, which indicates the percentage of data missing throughout the full range. The watershed areas of each station are in square kilometers as extrapolated from GIS program.

Six of the eight locations showed R2 values (WRIversus ORSTOM) of 0.94 and higher and errors wereless than 10 percent of the mean (Table 2). The gage
at Yarugu on the White Volta had an R2 value of 0.84and 12 percent difference, which is barely acceptable.Clearly for the Nangodi station on the White Volta
JOURNAL OF THE AMERICAN WATER RESOURCES ASSOCIATION 1119 JAWRA
WEST AFRICA: VOLTA DISCHARGE DATA QUALITY ASSESSMENT AND USE
TABLE 1. Streamflow Gage Site Details (cont’d).
Lat. Long. Yi Yf No. AreaID Name Source CC (˚) (˚) 19xx 19xx Years %miss (km2)
White Volta (cont’d).
44 Wayen ORSTOM BF 12.38 1.08 65 87 24 27.7 21,01045 Wiasi (Sisili) WRI GH 10.34 1.33 62 90 18 55.9 12,10546 Wiasi (Sisili) ORSTOM GH 10.33 1.35 62 73 12 0 12,10547 Yagaba (Kalpawn) WRI GH 10.26 1.29 58 79 22 15.9 9,10048 Yagaba (Kalpawn) ORSTOM GH 10.23 1.28 58 73 16 2.66 9,10049 Yakala (Nakanbe) ORSTOM BF 11.35 0.52 56 84 26 16.6 33,06550 Yarugu WRI BF 10.98 0.40 62 77 16 8.5 39,13251 Yarugu ORSTOM BF 10.98 0.40 66 73 8 0 39,13252 Yilou (Nakanbe) ORSTOM BF 13.00 1.55 73 83 11 3.9 14,995
Oti/Daka
53 Arly-dou(Oti) ORSTOM TG 11.53 1.42 78 85 8 18 9,06354 Arly-Pendjari ORSTOM BF 11.43 1.57 78 85 8 35.4 15,09755 Ekumdipe (Daka) WRI GH 8.46 0.09 63 73 9 27.1 9,13356 Ekumdipe (Daka) ORSTOM GH 8.47 0.22 63 73 11 0 9,13357 Koumangou (Kou) ORSTOM TG 10.2 0.45 59 73 15 0 6,07058 Mango ORSTOM TG 10.3 0.47 53 73 21 0 36,28759 Porga ORSTOM BJ 11.05 0.97 52 93 35 25.4 27,19760 Sabari ORSTOM GH 9.28 0.23 59 73 15 0 72,77561 Saboba (see gage) WRI TG 9.76 0.32 53 90 30 43.75 48,42362 Yendi* (Daka) WRI GH 9.1 -1.14 58 87 26 65.24 6,084
Volta Prop
63 Senchi ORSTOM GH 6.22 0.08 37 63 27 3.7 400,00064 Senchi ORSTOM GH 6.22 0.08 51 79 29 1.7 400,00065 Aframso (Afram) WRI GH 7.3 -1.37 67 95 23 36.7 4,50066 Ahamnasu (asukawkaw) WRI GH 7.67 0.33 79 91 5 72 1,01867 Asukawkaw (Volta) WRI GH 7.69 0.43 78 92 7 86 6,10968 Podoe WRI GH 6.63 -0.37 69 81 13 8.6 3,06769 Prang (Pru) ORSTOM GH 7.98 -0.88 57 67 11 3.1 6,11370 Pruso WRI GH 7.47 -1.67 57 91 35 13.4 4,100
Notes: Identification numbers correspond to gage locations in Figure 1, Map of the Volta River Basin. Gages are listed per subbasin. CC = Country Code, BF = Burkina Faso, GH = Ghana, TG = Togo, IV = Cote d’Iviore, BJ = Benin. Latitude and longitude, datum WGS84, are given in decimal degrees. Yi (year initial) and Yf (year final) indicate the start and end of the range of data. The next column gives the total number of years that have data within the range followed by %miss, which indicates the percentage of data missing throughout the full range. The watershed areas of each station are in square kilometers as extrapolated from GIS program.
TABLE 2. Discharge Data Source Correlation.
Gage Bamboi Lawra Yarugu Nawuni Wiasi Nangodi Yagaba Ekumdipe
R2 0.94 0.96 0.84 0.99 0.99 0.51 0.97 0.96
% diffave 6 6 12 4 1 28 4 9
Note: This table shows the association between data from WRI and ORSTOM. Row 1 holds the R2 values where Row 2 shows the percent difference from ORSTOM to WRI.

one of the data sources was in error. In the next sec-tion, we address the accuracy of the data and use thecalibrated TM procedure to fill in the missing records.
DATA QUALITY AND MODEL ASSESSMENT
This section describes how streamflow data wereevaluated for accuracy. First, we classify the stream-flow gages according to their quality. The TM model isthen analyzed for its effectiveness in predictingstreamflow. Finally, parameter values for the TMmodel are given and trends are discussed.
The quality of the stream discharge at each gage isnot known. It is important to discover which stationsprovide discharge data with reasonable accuracy andwhich do not. Since we expect that more precipitationwill result in greater discharge, as a first test, annualprecipitation and annual discharge were linearlyregressed to predict runoff. This linear regression canalso be used to predict streamflow for missing years.Although high correlation coefficients do not guaran-tee that stream discharge records are acceptable, poorcorrelations indicate that there are some problemswith the discharge data. The linear regression methodused was in the form of
where A is the drainage area, P is the average annualprecipitation in the watershed area with annual dis-charge volume, Qa, and c is the runoff coefficient(dimensionless) that represents the amount of precipi-tation that becomes runoff after the initial annualabstraction, Ia, is met. To be more explicit, we use thesimple equation for the slope of a line, y = mx + b,
where the runoff of interest y = Qa/A, the slope of pre-cipitation and runoff m = c, and the intercept b =Ia*m. Ia is the amount of annual precipitation thatdoes not become runoff over the area that contributesto the streamflow.
Arbitrarily, an R2 value of 0.50 for annual precipi-tation and runoff was chosen as the minimum valuebelow which gages were deemed highly inaccurateand were rejected for usage in simulation. Gages thatmet this criterion are listed in Table 3, and rejectedgages are listed in Table 4. An exception is the Rambogages, with an R2 value of 0.82, where the parameterscalibrated to the TM procedure were too low to bephysically possible. The equation for each gage isshown in Column 2 of Tables 3 and 4 (entitled linearregression method). In Tables 3 and 4, gages are cate-gorized by subbasin and are located on the principalrivers unless noted. Gages are listed according toposition from furthest south on the river followed bygages directly upstream. Of interest in Table 3 is theSenchi gaging station below the dam. The annualcoefficient of determination of P versus runoff (RO)for the period, 1937 to 1963 before the dam was builtis 0.82, the highest in the watershed. However, for theperiod after the dam was built, from 1963 to 1996, thevalue drops to 0.55, showing little relationshipbetween annual runoff flowing into the dam and damdischarge and indicating, as expected, that flow belowthe dam is governed by the operation of the turbineover a time scale larger than the annual cycle.
Error in the prediction, PE, was calculated to showthe difference between predicted values from the lin-ear model and measured values. These values are list-ed in Table 3, Column 5, and were calculated usingthe relationship
where Q indicates the measured discharge, Qm indi-cates the model results, and n represents the numberof measured values.
The linear regression of annual values in Table 3,Column 2, gives some interesting trends. In the upperpart of the Black Volta (located in the Burkina Faso),the amount of annual precipitation before runoffoccurs is on the order of 400 to 600 mm and is thelowest in the Volta basin. This is the driest part of theregion. In the rest of the basin (i.e., Oti and WhiteVolta basins) the initial abstraction is generally onthe order of 700 to 800 mm. These higher initialabstraction values could be attributed either to theexistence of more reservoirs with higher evaporationlosses or the large national parks in these areas that
JAWRA 1120 JOURNAL OF THE AMERICAN WATER RESOURCES ASSOCIATION
TAYLOR, VAN DE GIESEN, AND STEENHUIS
Figure 3. Comparison of Streamflow Data Sources.
QaA
c P Ia= −* ( ) (7)
PE
Q Qm
n
i ii
n
=−[ ]−
=∑ 2
11
(8)
JOURNAL OF THE AMERICAN WATER RESOURCES ASSOCIATION 1121 JAWRA
WEST AFRICA: VOLTA DISCHARGE DATA QUALITY ASSESSMENT AND USE
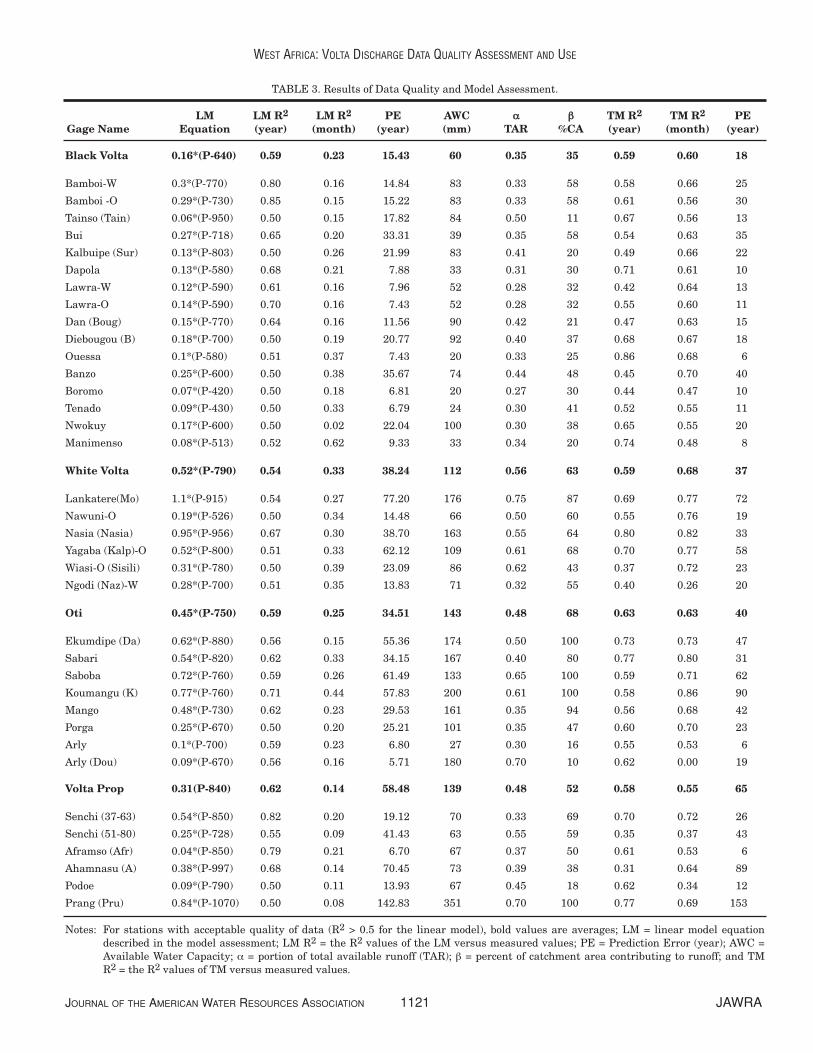
TABLE 3. Results of Data Quality and Model Assessment.
LM LM R2 LM R2 PE AWC αα ββ TM R2 TM R2 PEGage Name Equation (year) (month) (year) (mm) TAR %CA (year) (month) (year)
Black Volta 0.16*(P-640) 0.59 0.23 15.43 60 0.35 35 0.59 0.60 18
Bamboi-W 0.3*(P-770) 0.80 0.16 14.84 83 0.33 58 0.58 0.66 25
Bamboi -O 0.29*(P-730) 0.85 0.15 15.22 83 0.33 58 0.61 0.56 30
Tainso (Tain) 0.06*(P-950) 0.50 0.15 17.82 84 0.50 11 0.67 0.56 13
Bui 0.27*(P-718) 0.65 0.20 33.31 39 0.35 58 0.54 0.63 35
Kalbuipe (Sur) 0.13*(P-803) 0.50 0.26 21.99 83 0.41 20 0.49 0.66 22
Dapola 0.13*(P-580) 0.68 0.21 7.88 33 0.31 30 0.71 0.61 10
Lawra-W 0.12*(P-590) 0.61 0.16 7.96 52 0.28 32 0.42 0.64 13
Lawra-O 0.14*(P-590) 0.70 0.16 7.43 52 0.28 32 0.55 0.60 11
Dan (Boug) 0.15*(P-770) 0.64 0.16 11.56 90 0.42 21 0.47 0.63 15
Diebougou (B) 0.18*(P-700) 0.50 0.19 20.77 92 0.40 37 0.68 0.67 18
Ouessa 0.1*(P-580) 0.51 0.37 7.43 20 0.33 25 0.86 0.68 6
Banzo 0.25*(P-600) 0.50 0.38 35.67 74 0.44 48 0.45 0.70 40
Boromo 0.07*(P-420) 0.50 0.18 6.81 20 0.27 30 0.44 0.47 10
Tenado 0.09*(P-430) 0.50 0.33 6.79 24 0.30 41 0.52 0.55 11
Nwokuy 0.17*(P-600) 0.50 0.02 22.04 100 0.30 38 0.65 0.55 20
Manimenso 0.08*(P-513) 0.52 0.62 9.33 33 0.34 20 0.74 0.48 8
White Volta 0.52*(P-790) 0.54 0.33 38.24 112 0.56 63 0.59 0.68 37
Lankatere(Mo) 1.1*(P-915) 0.54 0.27 77.20 176 0.75 87 0.69 0.77 72
Nawuni-O 0.19*(P-526) 0.50 0.34 14.48 66 0.50 60 0.55 0.76 19
Nasia (Nasia) 0.95*(P-956) 0.67 0.30 38.70 163 0.55 64 0.80 0.82 33
Yagaba (Kalp)-O 0.52*(P-800) 0.51 0.33 62.12 109 0.61 68 0.70 0.77 58
Wiasi-O (Sisili) 0.31*(P-780) 0.50 0.39 23.09 86 0.62 43 0.37 0.72 23
Ngodi (Naz)-W 0.28*(P-700) 0.51 0.35 13.83 71 0.32 55 0.40 0.26 20
Oti 0.45*(P-750) 0.59 0.25 34.51 143 0.48 68 0.63 0.63 40
Ekumdipe (Da) 0.62*(P-880) 0.56 0.15 55.36 174 0.50 100 0.73 0.73 47
Sabari 0.54*(P-820) 0.62 0.33 34.15 167 0.40 80 0.77 0.80 31
Saboba 0.72*(P-760) 0.59 0.26 61.49 133 0.65 100 0.59 0.71 62
Koumangu (K) 0.77*(P-760) 0.71 0.44 57.83 200 0.61 100 0.58 0.86 90
Mango 0.48*(P-730) 0.62 0.23 29.53 161 0.35 94 0.56 0.68 42
Porga 0.25*(P-670) 0.50 0.20 25.21 101 0.35 47 0.60 0.70 23
Arly 0.1*(P-700) 0.59 0.23 6.80 27 0.30 16 0.55 0.53 6
Arly (Dou) 0.09*(P-670) 0.56 0.16 5.71 180 0.70 10 0.62 0.00 19
Volta Prop 0.31(P-840) 0.62 0.14 58.48 139 0.48 52 0.58 0.55 65
Senchi (37-63) 0.54*(P-850) 0.82 0.20 19.12 70 0.33 69 0.70 0.72 26
Senchi (51-80) 0.25*(P-728) 0.55 0.09 41.43 63 0.55 59 0.35 0.37 43
Aframso (Afr) 0.04*(P-850) 0.79 0.21 6.70 67 0.37 50 0.61 0.53 6
Ahamnasu (A) 0.38*(P-997) 0.68 0.14 70.45 73 0.39 38 0.31 0.64 89
Podoe 0.09*(P-790) 0.50 0.11 13.93 67 0.45 18 0.62 0.34 12
Prang (Pru) 0.84*(P-1070) 0.50 0.08 142.83 351 0.70 100 0.77 0.69 153
Notes: For stations with acceptable quality of data (R2 > 0.5 for the linear model), bold values are averages; LM = linear model equation described in the model assessment; LM R2 = the R2 values of the LM versus measured values; PE = Prediction Error (year); AWC = Available Water Capacity; α = portion of total available runoff (TAR); β = percent of catchment area contributing to runoff; and TM R2 = the R2 values of TM versus measured values.

are home to a diversity of plants, little erosion, and agreater retention of rainwater. The highest initialabstraction is 1,070 mm for the Prang station in theVolta proper subbasin, which is below all three sub-basins but upstream of the Akosombo Dam. Since theR2 value is rather low, the high initial abstraction islikely a consequence of the fitting of the data rather
than significant geographic features. The runoff coef-ficients, defined as a portion of the precipitation abovethe initial abstraction that becomes streamflow, alsofollow trends. In the Black Volta subbasin values donot exceed 0.3 and are 0.16 on average. In both down-stream ends of the White Volta and Oti basins, therunoff coefficients are higher than that for the Black
JAWRA 1122 JOURNAL OF THE AMERICAN WATER RESOURCES ASSOCIATION
TAYLOR, VAN DE GIESEN, AND STEENHUIS
TABLE 4. Gages That Were Discarded Because LM Values Did Not Meet the Set Criteria.
LM LM R2 LM R2 PE AWC αα ββ TM R2 TM R2 PEGage Name Equation (year) (month) (year) (mm) TAR %CA (year) (month) (year)
Black Volta 0.17 0.28 76 97 0.44 44 0.30 0.47 105
Guena 1.3*(P-800) 0.14 0.02 213 173 0.20 20 0.62 0.4 244
Batie (Bamb) 0.19*(P-670) 0.30 0.33 31 36 0.57 57 0.50 0.73 28
Noumbiel 0.11*(P-580) 0.39 0.35 10 131 0.20 20 0.46 0.27 14
Badara (Kou) 0.07*(P+900) 0.03 0.45 73 84 0.60 60 0.06 0.72 81
Kouri 0.04*(P-3) 0.10 0.00 14 93 0.30 30 0.15 0.19 14
Nasso (Kou) 0.24*(P+120) 0.06 0.54 115 67 0.76 76 0.03 0.50 250
White Volta 0.18 0.37 100 44 0.56 56 0.37 0.45 72
Bissiga (Naka) 0.00 0.35 5 7 0.44 44 0.23 0.00 34
Bagre (Tcher) 0.0051 0.4 2 27 0.40 40 0.04 0.64 25
Bagre (Nak) 0.09*(P-370) 0.16 0.55 15 1 0.62 62 0.63 0.72 22
Bittou (Nouhao) 0.1*(P-430) 0.06 0.54 30 33 0.70 70 0.8 0.7 21
Garu 0.04*(P-500) 0.012 0.13 22 1 0.50 50 0.2 0.07 437
Nakpan(Red) 0.02*(P-2500) 0.03 0.36 102 1 0.60 60 0.04 0.42 379
Nabogo (Nab) 0.43*(P-780) 0.35 0.30 68 179 0.68 68 0.71 0.65 53
Sakoins(Red) 0.02*(P-400) 0.29 0.35 57 21 0.70 70 0.84 0.72 3
Yarugu-W 0.3*(P-600) 0.29 0.42 33 111 0.90 90 0.35 0.16 53
Yarugu-O 0.03*(P-1440) 0.007 0.53 78 111 0.90 90 0.48 0.45 48
Nawuni -W 0.25*(P-650) 0.38 0.33 25 66 0.50 50 0.46 0.75 23
Nobere 1.13*(P+690) 0.38 0.44 1700 3 0.43 43 0.6 0.6 92
Pwalugu-W 0.09*(P-200) 0.05 0.44 27 5 0.49 49 0.22 0.65 32
Pwalugu-O 0.14*(P-320) 0.1 0.41 28 5 0.49 49 0.42 0.63 24
Rambo 0.1*(P-270) 0.82 0.61 4 1 0.70 70 0.02 0.01 88
Nangodi (Naz)-O 0.25*(P-690) 0.31 0.44 23 71 0.32 32 0.74 0.56 15
Nebbou (Sis) -0.04(P-1258) 0.15 0.26 10 61 0.92 92 0.08 0.27 29
Niagho (Nak) 0.24*(P-223) 0.15 0.35 46 1 0.30 30 0.10 0.31 118
Wiasi-W (Sisili) 0.13*(P-640) 0.114 0.35 29 104 0.62 62 0.02 0.75 39
Yakala (Nak) 0.08*(P-380) 0.28 0.53 12 27 0.48 48 0.53 0.32 14
Yilou (Nak) 0.02*(P-30) 0.06 0.00 7 109 0.17 17 0.30 0.13 12
Yagaba (Kalp)-W 0.5*(P-850) 0.35 0.28 75 109 0.61 61 0.68 0.73 104
Dakaye -0.01*(P-1956) 0.03 0.42 5 2 0.62 62 0.13 0.49 41
Wayen 0.01*(P+4) 0.07 8 3 0.30 30 0.17 0.19 17
Oti 0.23 0.23 286 155 0.54 54 0.12 0.61 105
Ekumdipe-W (Da) -3*(P-1830) 0.02 0.13 541 174 0.50 50 0.14 0.66 119
Yendi (Daka) 0.16*(P-890) 0.23 0.33 31 135 0.57 57 0.10 0.56 91
Proper 0.35 0.05 46 289 0.38 38 0.39 0.49 48
Asukaw (Vo) 0.21*(P-1095) 0.37 0.01 62 518 0.43 43 0.38 0.61 83
Pruso 0.06*(P-900) 0.32 0.09 30 61 0.32 32 0.40 0.37 13
Note: This table shows the results of gages where LM values did not meet the set criteria. For a description of terms refer to Table 3.
Volta subbasin. Upstream in the White Volta and Oti,runoff coefficients are lower and similar to the valuesin the Black Volta.
We also regressed linearly the monthly precipita-tion and discharge data similar to Equation (7). Asexpected, the annual R2 values are generally higherthan those for the monthly data (Table 3, Column 4).
Tables 3 and 4 also list the three parameters usedfor the TM procedure: Available Water capacity (AWC,Column 6), the fraction of ground water that does notbecome stream flow each month (α, Column 7), andthe fraction of drainage area contributing recharge tothe ground water, (β, Column 8). These parameterswere calibrated toward minimum annual PE listed inColumn 11 by using the solver solution function inMicrosoft Excel.
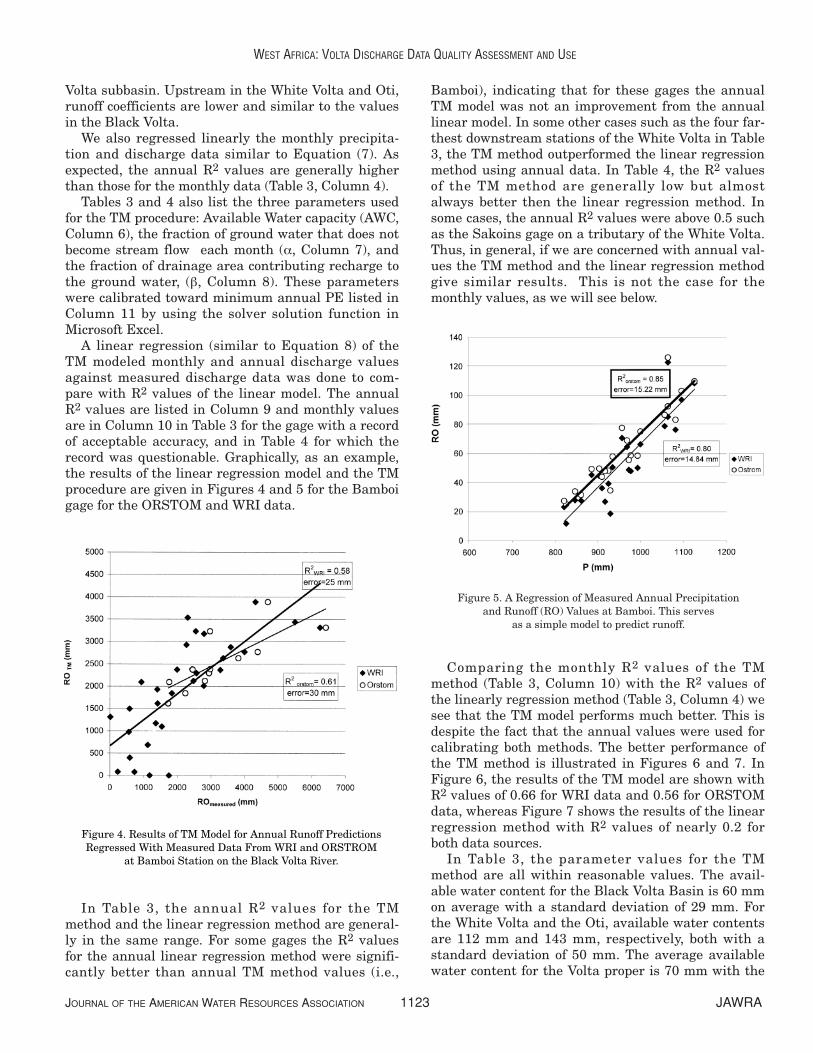
A linear regression (similar to Equation 8) of theTM modeled monthly and annual discharge valuesagainst measured discharge data was done to com-pare with R2 values of the linear model. The annualR2 values are listed in Column 9 and monthly valuesare in Column 10 in Table 3 for the gage with a recordof acceptable accuracy, and in Table 4 for which therecord was questionable. Graphically, as an example,the results of the linear regression model and the TMprocedure are given in Figures 4 and 5 for the Bamboigage for the ORSTOM and WRI data.
In Table 3, the annual R2 values for the TMmethod and the linear regression method are general-ly in the same range. For some gages the R2 values for the annual linear regression method were signifi-cantly better than annual TM method values (i.e.,
Bamboi), indicating that for these gages the annualTM model was not an improvement from the annuallinear model. In some other cases such as the four far-thest downstream stations of the White Volta in Table3, the TM method outperformed the linear regressionmethod using annual data. In Table 4, the R2 valuesof the TM method are generally low but almostalways better then the linear regression method. Insome cases, the annual R2 values were above 0.5 suchas the Sakoins gage on a tributary of the White Volta.Thus, in general, if we are concerned with annual val-ues the TM method and the linear regression methodgive similar results. This is not the case for themonthly values, as we will see below.
Comparing the monthly R2 values of the TMmethod (Table 3, Column 10) with the R2 values ofthe linearly regression method (Table 3, Column 4) wesee that the TM model performs much better. This isdespite the fact that the annual values were used forcalibrating both methods. The better performance ofthe TM method is illustrated in Figures 6 and 7. InFigure 6, the results of the TM model are shown withR2 values of 0.66 for WRI data and 0.56 for ORSTOMdata, whereas Figure 7 shows the results of the linearregression method with R2 values of nearly 0.2 forboth data sources.
In Table 3, the parameter values for the TMmethod are all within reasonable values. The avail-able water content for the Black Volta Basin is 60 mmon average with a standard deviation of 29 mm. Forthe White Volta and the Oti, available water contentsare 112 mm and 143 mm, respectively, both with astandard deviation of 50 mm. The average availablewater content for the Volta proper is 70 mm with the
JOURNAL OF THE AMERICAN WATER RESOURCES ASSOCIATION 1123 JAWRA
WEST AFRICA: VOLTA DISCHARGE DATA QUALITY ASSESSMENT AND USE
Figure 5. A Regression of Measured Annual Precipitationand Runoff (RO) Values at Bamboi. This serves
as a simple model to predict runoff.
Figure 4. Results of TM Model for Annual Runoff PredictionsRegressed With Measured Data From WRI and ORSTROM
at Bamboi Station on the Black Volta River.

exception of Prang (the uppermost, wetter subcatch-ment), which has an available water content of 350mm. These values are consistent with the parametersfound in Dunne and Leopold (1978) for moderatelydeep rooted crops (between 75 and 200 mm) and forclay in mature forest (above 350 mm).
The portion of available runoff that actually runsinto the stream for each month on the White Volta,the Volta proper, and the Oti, 0.56, 0.48, and 0.48,respectively, is almost identical to the values used byThornthwaite and Mather for North Carolina. Valuesfor the Black Volta are consistently lower. The percent
area of the watershed that contributes to runoff istypical for the semi-arid landscape. Average β valuesfor the White Volta and Oti are similar and higherthan the Black Volta, which also has lower availablewater contents on average. As expected, the wetterthe basin, the higher the contributing area.
In Table 4, R2 values for the linear model indicatelow quality of streamflow data for these gages.Smalls dams located upstream that store water fromone year to the next may affect values at these gages.Runoff coefficients are sometimes as low as 0.001 (i.e.,Bissiga and Bagre gages), higher than 1 (i.e., Guenaand Nobere gages) and even negative (i.e., Ekumdipegage from WRI). This clearly indicates that thesegages cannot be used for any model validation.
To further assess the validity of the Thornthwaite-Mather models, a cross validation analysis was done.Cross validation analysis estimates the generalizationerror, or average prediction error associated with themodel based on resampling (Weiss and Kulikowski,1991). Cross validation involves dividing a data setinto k subsets of equal size and then using a percent-age of the subsets to calibrate the model parameters.The error from this percentage will be referred to asthe “in sample” error. The outcome for the remainingpercentage is predicted and used to calculate the “outof sample” error. This is done repeatedly for x trialsuntil all the data have been used to predict error. Theaverage of the x trials of “out of sample” error pro-duces the generalized error value from cross valida-tion. This process was done using annual values fromthe gage at Senchi, which measures runoff over theentire watershed area. Since Senchi is the gage locat-ed right beneath the Akosombo, it was necessary to doa separate cross validation for before the dam wasbuilt and after. Table 5 shows the results of each trialfor both the linear regression method (LM) and theTM method at these different times annually andmonthly. The first row lists the error values of the “insample” points, to which the values of AWC, β, and α,for the TM method were calibrated for minimumerror. The second row gives the error values of the outof sample points.
Annually, for the years between 1937 to 1963(before the dam was built), cross validation gives ageneralized error of 19 mm for the linear model whichis lower than 23 mm for the TM. It was expected thatafter the dam was built, both models would producehigher error values. After the dam, the general errorfor the annual linear model is much larger than pre-dictions before the dam was built and only slightlylower than the TM model error. If the simulation is tobe done using annual values, the linear model isclearly a better choice for filling in gaps of missingdata. The goodness of fit shown by the cross valida-tion indicates that before the dam was built, the LM
JAWRA 1124 JOURNAL OF THE AMERICAN WATER RESOURCES ASSOCIATION
TAYLOR, VAN DE GIESEN, AND STEENHUIS
Figure 6. Results of Monthly TM Model With Measured FlowsFrom WRI and ORSTROM Over a 50-Year Range at
Bamboi Station. R2 values of 0.66 and 0.56 showacceptable performance of the model.
Figure 7. Results of Monthly LM Model With MeasuredFlows From WRI and ORSTROM Over a 50-Year
Range at Bamboi Station.

is a much better model. However, after the dam wasbuilt neither model would give acceptable results.
Monthly values give a much different outcome.Error values for the LM were much higher than forthe TM procedure for the time period prior to damconstruction and slightly higher than after construc-tion. Additionally, overall monthly R2 values for eachgage within the basin are higher for the TM proce-dure than for than the monthly linear regression of Pand RO. Since the data sets used for simulation willbe for monthly values, the TM model was chosen tofill in gaps of missing data.
CONCLUSIONS
Managing a watershed for an area as large as theVolta River Basin while attempting to promote con-servation and sustainable development is not a trivialtask. The size of the basin alone complicates conven-tional watershed management practices. Socioeco-nomic conditions, transnational communications,
environmental issues, and insufficient data addparameters that further entangle managementefforts. Irrigation throughout the watershed is under-developed and could be used as a means to approachmany of the socioeconomic and environmental short-comings of the basin. A sound hydrological knowledgebase is a prerequisite to refining management, butincomplete streamflow records hinder this.
Upon initial review of the discharge data collectedand donated for this research it was noted that ingeneral, discharge gages across the basin are missing20 percent of their data over an average range of 20years. Many of these gages were missing more than50 percent of their data. This paper approached theissue of insufficient data by first evaluating the avail-able data for its quality and then using an appropri-ate model to fill in the gaps. These models, theThornthwaite-Mather and linear regression models,were also assessed for the feasibility of their use inthis watershed.
The linear regression model was done as a firststep to assess data quality. For gage data to be accept-ed as reliable, we set the requirement that the linearregressions between precipitation and runoff result invalues where R2 > 0.5. For the data used in thisresearch, only half the gages met this criterion, mean-ing that only half of the streamflow gages matchedwith precipitation data and that only half of the avail-able data could be usable for any watershed manage-ment practices. The linear regression model could beused to fill in missing gaps; however, the quality ofthe values produced from the linear regression modeldid not increase significantly. The TM modelapproached both the issue of low quality and insuffi-cient data by providing basic physical informationthat is needed before any management can proceed.Comparing annual and monthly error values of thelinear model and the TM model shows that the TMmodel always predicts values closer to measured val-ues both annually and monthly. We also see higher R2
values from resulting TM runoff results against actu-al precipitation values than for the linear regressionmodel on a monthly basis. For monthly models, theTM model always results in higher R2 values than thelinear regression model. However, on an annual basis,TM gives a better correlation for only half of thegages. For this region, predicting annual values usingeither model could provide equivocal results, however,the TM model, which involves more detail, must beused for predicting monthly values or where manage-ment practices are concerned with hydrological pro-cesses on time increments shorter than a year.
The techniques used in this paper can be easilyapplied to any basin with similar data limitations.They may be particularly useful in other regions ofWest Africa or in other tropical climates with similar
JOURNAL OF THE AMERICAN WATER RESOURCES ASSOCIATION 1125 JAWRA
WEST AFRICA: VOLTA DISCHARGE DATA QUALITY ASSESSMENT AND USE
TABLE 5. Cross Validation Analysis for Senchi.
Annual
(1937 to 1963) LM (mm)In Sample (75%) 18 19 19 AverageOut Sample 23 20 19 19
TM (mm)In Sample (75%) 21 29 28 AverageOut Sample 39 15 9 23
(1963 to 1996) LM (mm)In Sample (75%) 48 43 37 AverageOut Sample 13 36 31 33
TM (mm)In Sample (75%) 43 43 39 AverageOut Sample 32 29 32 36
Monthly
(1937 to 1963) LM (mm)In Sample (75%) 75 76 75 AverageOut Sample 77 75 76 76
TM (mm)In Sample (75%) 9 7 8 AverageOut Sample 6 10 7 8
(1963 to 1996) LM (mm)In Sample (75%) 10 13 11 AverageOut Sample 15 4 14 11
TM (mm)In Sample (75%) 11 11 11 AverageOut Sample 8 10 9 10

environmental and socioeconomic conditions thatchallenge efforts at water resource management.Data quality assessment in these environments mustbe the primary step to watershed management toproperly approach solving such intricate problems asconservation, water allocation, and sustainable devel-opment.
ACKNOWLEDGMENTS
The authors want to express their appreciation to the WaterResources Institute (WRI) of Ghana; Legon University and Direc-tion Générale de l’Inventaire des Ressources Hydrauliques duBurkina-Faso for the use of their data; and Dr. Lambourdia Thiom-biano, Dr. Marc Andreini, Dr. Winston Andah, Philip Oguntunde,Dr. Wilfred Brutsaert, and Dr. Thomas Lyson for their advice andcollaboration.
LITERATURE CITED
Adiku, S.G.K., P.W.A. Dayananda, C.W. Rose, and G.N.N. Dowuona,1997. An Analysis of the Within Season Rainfall Characteristicsand Simulation of the Daily Rainfall in Two Savanna Zones inGhana. Agricultural and Forest Meteorology 86:51-62.
Akuffo, S.B., 1998. Pollution Control in a Developing Country, 1998.Ghana Universities Press, Accra, Ghana.
Andreini, M., N.C. van de Giesen, A. van Edig, M. Fosu, and W. Andah, 2000. Volta Basin Water Balance. ZEF-DiscussionPapers on Development Policy, No. 21, Center for DevelopmentResearch, Bonn, Germany.
Beven, K., R. Lamb, P. Quinn, R. Romanowisz, and J. Freer, 1995.Top Model. In: Computer Models of Watershed Hydrology, V.P.Singh (Editor). Water Resources Publications, Littleton, Col-orado, pp. 627-668.
Clark Labs, 2006. Idrisi 32 GIS Software. Available at http://www.clarklabs.org/IdrisiSoftware.asp?cat=2. Accessed in 2006.
Dunne, Thomas and Luna B. Leopold, 1978. Water in Environmen-tal Planning. W.H. Freeman Company, New York, New York,pp.236-251.
Green Cross International, 2001. Burkina Faso, Trans-BoundaryBasin Sub-Projects: The Volta River Basin. Available at http://www.greencrossinternational.net/en/programs/confprevention/wfp/publication/executif_summary.pdf. Accessed in May 2004.
Kendy, E., Y. Zhang, C. Liu, and T.S. Steenhuis, 2003. A Soil-WaterBalance Approach to Quantify Ground Water Recharge FromIrrigated Cropland in the North China Plain. Hydrol. Proc.17:2011-2031.
Kuo, W.L., T.S. Steenhuis, C.E. McCulloch, C.L. Mohler, S.D. DeGlo-ria, and D.P. Swaney, 1999. Effect of Grid Size and Soil Moisturefor a Variable-Source-Area Hydrology Model. Water ResourcesResearch 35(11):3419-3428.
Land Processes, 2004. USGS-NASA Distributed Active ArchiveCenter. Available at http://edcdaac.usgs.gov/gtopo30/gtopo30.html. Accessed in May 2004.
Mendoza, G.F., T.S. Steenhuis, M.T. Walter, and J.-Y. Parlange,2003. Estimating Basin-Wide Hydraulic Parameters of a Semi-Arid Mountainous Watershed by Recession-Flow Analysis. J. Hydrol. 279(1-4):57-69.
New, M., M Hulme., and P. Jones, 1999a. Representing TwentiethCentury Space-Time Variability. I: Development of a 1961-1990Mean Monthly Terrestrial Climatology. Journal of Climate12:829-856.
New, M., M. Hulme, and P. Jones, 1999b. Representing TwentiethCentury Space-Time Climate Variability. II: Development of1901-1996 Monthly Grids of Terrestrial Surface Climate. Jour-nal of Climate 13:2217-2238.
Ofori-Sarpong, E., 1985. The Nature of Rainfall and Soil Moisturein the Northeastern Part of Ghana During the 1975-1977Drought. Georgrafiska Annaler 67A, 3-4 pp., 177-186.
Opoku-Ankomah, Y. and I. Cordery, 1994. Atlantic Sea SurfaceTemperatures and Rainfall Variability in Ghana. Journal of Cli-mate 7:551-558.
Opoku-Ankomah, Y. and B.A. Amisgo, 1998. Rainfall and RunoffVariability in the Southwestern River System of Ghana. In:Water Resources Variability in Africa During the XXth Century,E Servat, D. Hughes, J-M. Fritsch, and M. Hulme (Editors).IAHS Publication No. 252, IAHS Press, Inst. Hyd., Wallingford,United Kingdom, pp. 307-314.
Peranginangin, N., R. Sakthivadivel, N.R. Scott, and T.S. Steenhuis,2004. Water Accounting for Conjunctive Groundwater/SurfaceWater Management: A Case of Singakorak-Ombilin River Basin,Indonesia. Journal of Hydrology 292(1-4):1-22.
Perrin, C., C. Michel, and V. Andreassian, 2001. Does a Large Num-ber of Parameters Enhance Model Performance? ComparativeAssessment of Common Catchment Model Structures on 429Catchments. Journal of Hydrology 242:275-301.
Thornthwaite, C.W. and J.R. Mather, 1955. The Water Balance.Publications in Climatology, Vol. VIII, No. 1, 22 pp.
UNEP (United Nations Environmental Protection), 2001. Proposalfor a Project Development and Preparation Facility (PDF) BlockB Grant: Benin, Burkina Faso, Côte d’Ivoire, Ghana, Mali, Togo.Integrated Management of the Volta River Basin. Available athttp://www.gefweb.org/COUNCIL/GEF_C15/GEF_C15_Inf.13/PDFBVOLTAFINALSENT GEFSEC.pdf. Accessed in November2004.
van de Giesen, N.C., T.J. Stomph, and N. de Ridder, 2000. ScaleEffects of Hortonian Overland Flow and Rainfall – RunoffDynamics in a West-African Catena Landscape. HydrologicalProcesses 14:165-175.
Weiss, S.M. and C.A. Kulikowski, 1991. Computer Systems ThatLearn: Classification and Prediction Methods From Statistics,Neural Nets, Machine Learning, and Expert Systems. M. Kauf-mann Publishers, San Mateo, California, 223 pp.
JAWRA 1126 JOURNAL OF THE AMERICAN WATER RESOURCES ASSOCIATION
TAYLOR, VAN DE GIESEN, AND STEENHUIS