Weight Management, Physical Activity and Nutrition
16
Weight Management ........................................................................................................................ 6‐2 Adults ........................................................................................................................................... 6‐3 Adolescents .................................................................................................................................. 6‐4 Youth............................................................................................................................................ 6‐5 Physical Activity ............................................................................................................................... 6‐6 Adults ........................................................................................................................................... 6‐6 Adolescents .................................................................................................................................. 6‐8 Nutrition .........................................................................................................................................6‐11 Adults and Adolescents................................................................................................................ 6‐12 Conclusion .......................................................................................................................................6‐13 “The physical and emotional health of an entire generation and the economic health and security of our nation is at stake." - First Lady Michelle Obama at the Let’s Move! launch on February 9, 2010 Weight Management, Physical Activity and Nutrition
-
Upload
khangminh22 -
Category
Documents
-
view
0 -
download
0
Transcript of Weight Management, Physical Activity and Nutrition

Weight Management ........................................................................................................................ 6‐2
Adults ........................................................................................................................................... 6‐3
Adolescents .................................................................................................................................. 6‐4
Youth ............................................................................................................................................ 6‐5
Physical Activity ............................................................................................................................... 6‐6
Adults ........................................................................................................................................... 6‐6
Adolescents .................................................................................................................................. 6‐8
Nutrition ......................................................................................................................................... 6‐11
Adults and Adolescents................................................................................................................ 6‐12
Conclusion ....................................................................................................................................... 6‐13
“The physical and emotional health of an entire generation and the economic
health and security of our nation is at stake."
- First Lady Michelle Obama at the Let’s Move! launch on February 9, 2010
WeightManagement,Physical
ActivityandNutrition

2014 GREATER NASHUA COMMUNITY HEALTH ASSESSMENT
WEIGHTMANAGEMENT,PHYSICALACTIVITY,NUTRITION PAGE6‐1
aintaining a healthy body weight through proper
nutrition and regular physical activity can help
decrease a person’s risk of developing serious
health conditions such as high blood pressure, high
cholesterol, diabetes, heart disease, stroke, and cancer. 1
These activities can have a positive impact on overall well‐
being through better management of existing health
conditions and improved quality of life.1 A number of factors,
such as access to healthy foods and safe places to engage in
physical activity, affect a person’s ability to eat a healthy diet,
stay physically active, and achieve or maintain a healthy
weight. 2 Healthy People 2020 (HP2020) is a program of the
US Department of Health and Human Services and the vision
for Healthy People 2020 is, “A society in which all people live
long, healthy lives”. For three decades, Healthy People has
set 10‐year national objectives for improving the health of
Americans. There are several HP2020 health topic indicators
regarding nutrition, physical activity, and obesity that will be
described in this chapter.
Lifestyle and behavioral changes in the United States over the
past several decades (increased sedentariness, increased time
in front of a screen, lack of walkability in neighborhoods,
larger portion sizes, and increased consumption of processed
foods, etc.), have led to substantial increases in obesity.
About one in three adults and one in six children are obese.3
These rates have doubled for adults and tripled for children
between 1980 and 2008.3 Although those with higher
education and income have lower rates of obesity overall,
the increases in obesity rates have been consistent regardless
of age, sex, race, ethnicity, socioeconomic status, education
level, or geographic region.3,4 Obesity has some significant
costs associated with it. According to the Centers for Disease
Control and Prevention (CDC), “The estimated annual medical
cost of obesity in the U.S. was $147 billion in 2008; the
medical costs for people who are obese were $1,429 higher
than those of normal weight.”5
The State of New Hampshire mirrors the national average
with 26% of adults and 18% of children being obese.6 In
comparison to the United States, New Hampshire has lower
rates of obesity than other parts of the country, especially
M Community
Spotlight on Mont Vernon:
Lamson Farm
The Lamson Farm is a working, town-owned farm house and museum at the north end of Lamson Road in Mont Vernon, NH. The farm no longer produces milk directly, but the hay is harvested by another farm in town that does produce milk. The process is mutually beneficial. Without harvesting, the hay fields would revert to brush fields with no economic benefit and limited recreational use within a few years. Other than the farm house and two acres, the remaining property is legally constrained to recreational use. The town of Mont Vernon purchased the property in order to provide recreational opportunities for residents and to preserve the rural character of the town. Trails for hiking, snowmobiling, cross country skiing and biking are all available.

2014 GREATER NASHUA COMMUNITY HEALTH ASSESSMENT
WEIGHTMANAGEMENT,PHYSICALACTIVITY,NUTRITION PAGE6‐2
compared to the southeast and Midwest (Figure 6.1).14 In response, the New Hampshire State Health
Improvement Plan, 2013‐2020 aims to reduce both adult and childhood obesity. Childhood obesity and
adult obesity were ranked state priority #1 and #3, respectively, using prioritization criteria in this
report.6
Goals for New Hampshire:
Reduce the proportion of adults considered obese from 25.5% (2010) to 24% by 2015 and 23%
by 20206
Reduce the proportion of children considered obese from 18.1% (2008) to 17.2% by 2015 and
16.2% by 20206
Figure 6.1 County‐level Estimates of Obesity among Adults ages >20 years: United States 2011
Source: CDC, 2011
WeightManagementObesity and overweight are associated with increased risk for several chronic diseases and conditions
and have been on the forefront of prevention strategies over the past few years.3 Progress in obesity
management and prevention are being made by developing programs, systems, and environmental
initiatives that help make healthy choices available, affordable, and easy.3
2014 GREATER NASHUA COMMUNITY HEALTH ASSESSMENT
WEIGHTMANAGEMENT,PHYSICALACTIVITY,NUTRITION PAGE6‐3
Overweight in adults is defined as a body mass index (BMI) of 25 or higher and obesity is definite as a
BMI of 30 or higher. BMI is a number calculated from a person’s weight in relation to their height. BMI
in children is also measured by height and weight but CDC Growth Charts are used to determine the
corresponding BMI for age and sex percentile. For children and adolescents (aged 2‐19 years),
overweight is defined as a BMI at or above the 85th percentile and lower than the 95th percentile for
children of the same age and sex. Obesity is defined as a BMI at or above the 95th percentile.6
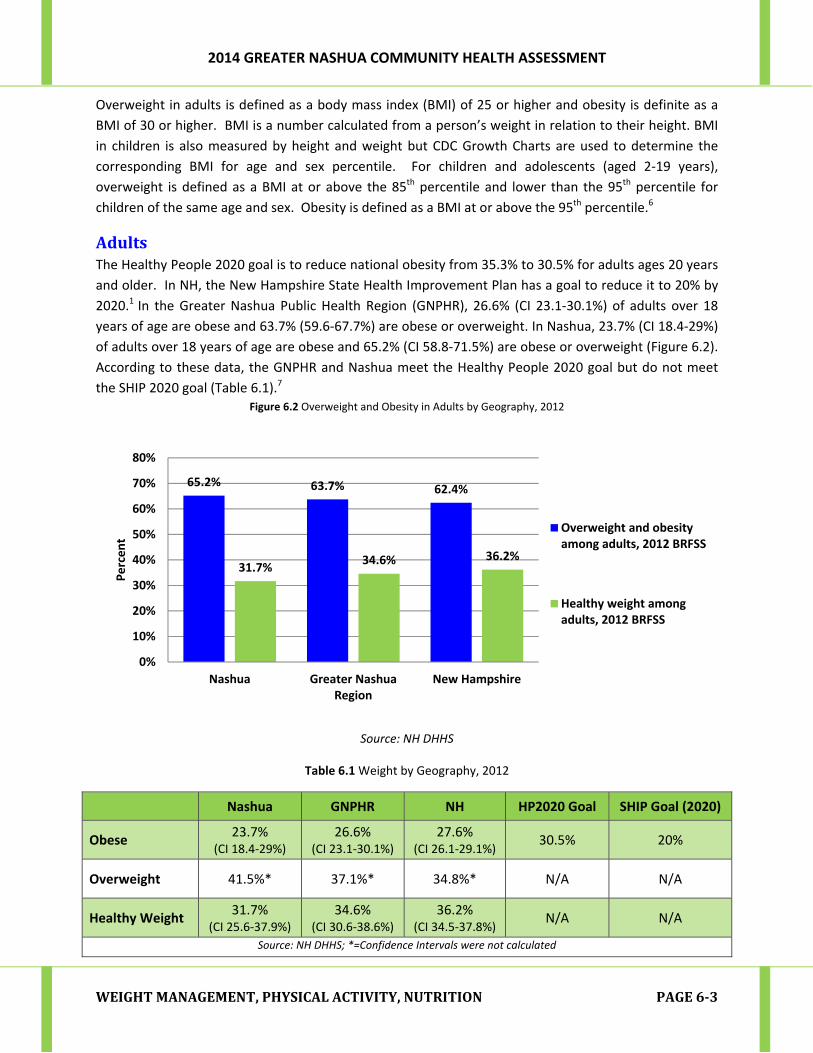
AdultsThe Healthy People 2020 goal is to reduce national obesity from 35.3% to 30.5% for adults ages 20 years
and older. In NH, the New Hampshire State Health Improvement Plan has a goal to reduce it to 20% by
2020.1 In the Greater Nashua Public Health Region (GNPHR), 26.6% (CI 23.1‐30.1%) of adults over 18
years of age are obese and 63.7% (59.6‐67.7%) are obese or overweight. In Nashua, 23.7% (CI 18.4‐29%)
of adults over 18 years of age are obese and 65.2% (CI 58.8‐71.5%) are obese or overweight (Figure 6.2).
According to these data, the GNPHR and Nashua meet the Healthy People 2020 goal but do not meet
the SHIP 2020 goal (Table 6.1).7 Figure 6.2 Overweight and Obesity in Adults by Geography, 2012
Source: NH DHHS
Table 6.1 Weight by Geography, 2012
Nashua GNPHR NH HP2020 Goal SHIP Goal (2020)
Obese 23.7%
(CI 18.4‐29%) 26.6%
(CI 23.1‐30.1%) 27.6%
(CI 26.1‐29.1%) 30.5% 20%
Overweight 41.5%* 37.1%* 34.8%* N/A N/A
Healthy Weight 31.7%
(CI 25.6‐37.9%) 34.6%
(CI 30.6‐38.6%) 36.2%
(CI 34.5‐37.8%) N/A N/A
Source: NH DHHS; *=Confidence Intervals were not calculated
65.2% 63.7% 62.4%
31.7%34.6% 36.2%
0%
10%
20%
30%
40%
50%
60%
70%
80%
Nashua Greater NashuaRegion
New Hampshire
Percent
Overweight and obesityamong adults, 2012 BRFSS
Healthy weight amongadults, 2012 BRFSS
2014 GREATER NASHUA COMMUNITY HEALTH ASSESSMENT
WEIGHTMANAGEMENT,PHYSICALACTIVITY,NUTRITION PAGE6‐4
Adolescents
When children transition from childhood to adulthood, important behavioral and lifestyle choices are
established. These choices can impact their health as a teenager and into their adult life. Some
adolescents also struggle to adopt behaviors that could decrease their risk of developing chronic
diseases in adulthood, such as eating nutritiously and engaging in physical activity.8 At the national
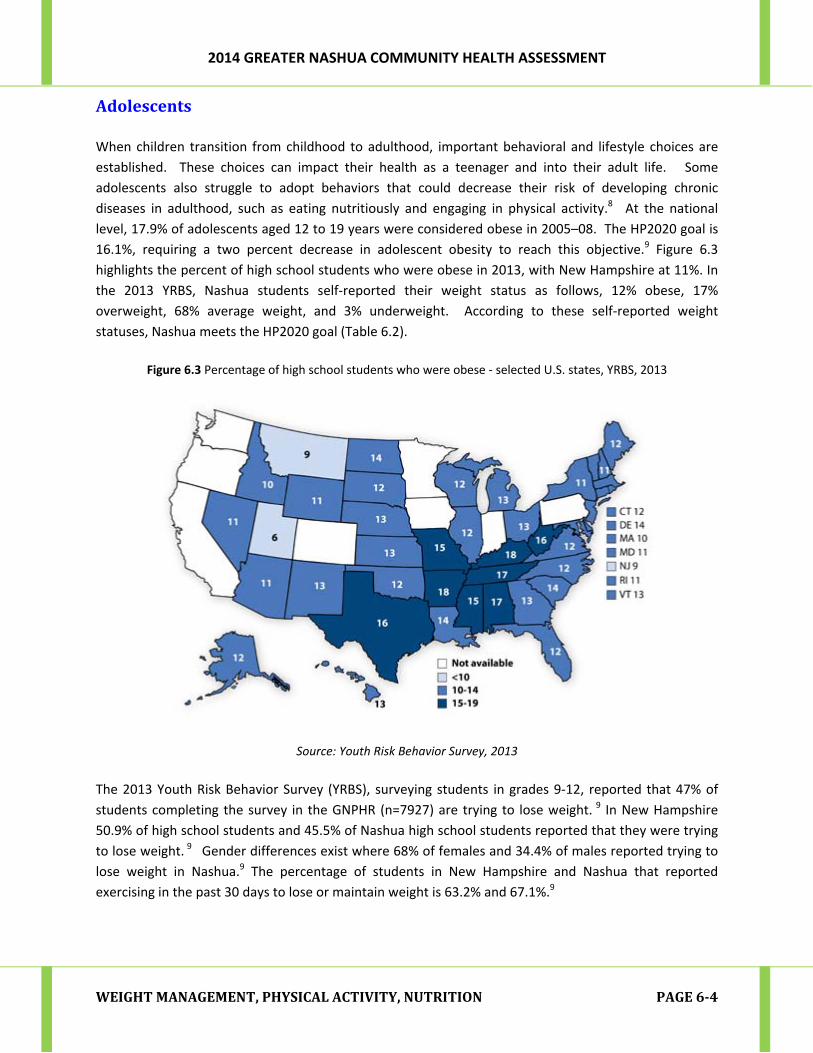
level, 17.9% of adolescents aged 12 to 19 years were considered obese in 2005–08. The HP2020 goal is
16.1%, requiring a two percent decrease in adolescent obesity to reach this objective.9 Figure 6.3
highlights the percent of high school students who were obese in 2013, with New Hampshire at 11%. In
the 2013 YRBS, Nashua students self‐reported their weight status as follows, 12% obese, 17%
overweight, 68% average weight, and 3% underweight. According to these self‐reported weight
statuses, Nashua meets the HP2020 goal (Table 6.2).
Figure 6.3 Percentage of high school students who were obese ‐ selected U.S. states, YRBS, 2013
Source: Youth Risk Behavior Survey, 2013
The 2013 Youth Risk Behavior Survey (YRBS), surveying students in grades 9‐12, reported that 47% of
students completing the survey in the GNPHR (n=7927) are trying to lose weight. 9 In New Hampshire
50.9% of high school students and 45.5% of Nashua high school students reported that they were trying
to lose weight. 9 Gender differences exist where 68% of females and 34.4% of males reported trying to
lose weight in Nashua.9 The percentage of students in New Hampshire and Nashua that reported
exercising in the past 30 days to lose or maintain weight is 63.2% and 67.1%.9

2014 GREATER NASHUA COMMUNITY HEALTH ASSESSMENT
WEIGHTMANAGEMENT,PHYSICALACTIVITY,NUTRITION PAGE6‐5
Table 6.2 Youth Risk Behavior Survey (YRBS) Indicators by Geography, 2013
Nashua North
Nashua South
GNPHR NH HP2020 Goal
Obese 12% 12% * 11.2% 16.1%
Trying to lose weight
48.9% 52.6% 47% 45.4% *
Exercising to lose or maintain weight
68.3% 66.1% 65.2% 63.2% *
Source: NH DHHS; * = data not available
YouthChildhood obesity increases the risk for several chronic diseases including type II diabetes, high blood
pressure, liver disease and depression during childhood as well as adulthood. The problem of childhood
obesity has increased significantly during recent years. The percentage of children ages 6–11 years in
the United States who were obese increased from 7% in 1980 to nearly 18% in 2012.8 The Healthy
People 2020 goal aims to reduce the proportion of children ages 6 to 11 years old who are considered
obese to 15.7% and the NH SHIP goal aims to reduce the proportion of children considered to be obese
to 17.2% by 2015 and 16.2% by 2020.1, 6
The City of Nashua 2013‐2014 Third Grade Survey was conducted between September 2013 and March
2014 in conjunction with the New Hampshire Third Grade Healthy Smiles Healthy Growth Survey.
Height and weight assessments for all participating third grade students indicated that 17.4% of
students were obese, 17.5% were overweight, 63.3% were normal weight, and 1.7% of students were
underweight (Table 6.3). There were no statistically significant differences between BMI categories by
sex. The City of Nashua has not met the Healthy People 2020 goal of reducing the proportion of 6 to 11
year olds that are considered obese to 15.7%.1 The NH SHIP goal is to reduce the proportion of children
considered obese from 18.1% to 17.2% by 2015 and Nashua is 0.2% away from reaching this goal but
needs to continue efforts to reach the NH SHIP 2020 goal of 16.2%. Regional data for this health
indicator is not available at this time.
Table 6.3 Overall (both males and females) age and gender, BMI categories, 2013
Variable
Students overall (n = 821)
No. Proportion
Obese 143 17.4%
Overweight 144 17.5%
Normal weight 520 63.3%
Underweight 14 1.7% Source: City of Nashua, Third Grade Survey; NH DHHS

2014 GREATER NASHUA COMMUNITY HEALTH ASSESSMENT
WEIGHTMANAGEMENT,PHYSICALACTIVITY,NUTRITION PAGE6‐6
Stratification by the FRL program participation at the school level indicated a statistically significant
greater burden of obesity among students attending schools with a greater than 50% FRL participation
than students attending schools with less than 50% FRL participation (Table 6.4, p=0.006).
Table 6.4 BMI Categories by the FRL Program Participation
Variable
Students in schools with <50% FRL participation
(n = 509)
Students in schools with >50% FRL participation
(n = 312)
P‐value**No. Proportion No. Proportion
Obese 74 14.5% 69 22.1% 0.006**
Not obese* 435 85.5% 243 77.9%
Source: City of Nashua, Third Grade Survey; NH DHHS
PhysicalActivityRegular physical activity is important for good health, and it's especially important if you're trying to lose
weight or to maintain a healthy weight. In addition to maintaining a healthy weight, there are many
benefits associated with physical activity. Physical activity also helps reduce high blood pressure, reduce
risk for type II diabetes, heart attack, stroke, some cancers, osteoporosis, reduce arthritis pain and
associated disability, and reduce symptoms of depression and anxiety.10 Personal, social, economic, and
environmental factors all play a role in physical activity levels among youth, adults, and older adults.
Physical activity includes both aerobic and muscle strengthening activities. Aerobic activities are
physical activities in which people move their large muscles in a rhythmic manner for a sustained
period.11 Running, brisk walking, bicycling, playing basketball, dancing, and swimming are all examples of
aerobic activities. Muscle‐strengthening activities provide additional benefits such as increased bone
strength and muscular fitness.11
AdultsPhysical activity is an important behavioral and lifestyle choice. Adults who are physically active are
healthier and less likely to develop many chronic diseases than adults who are inactive. They also have
better fitness, including a healthier body size and composition.
TheCityofNashua2013‐2014ThirdGradeSurveyisavailablehere:
http://bit.ly/NashuaHSHG.

2014 GREATER NASHUA COMMUNITY HEALTH ASSESSMENT
WEIGHTMANAGEMENT,PHYSICALACTIVITY,NUTRITION PAGE6‐7
The United States Department of Health and Human Services Physical Activity Guidelines suggest,
“Adults gain most…health benefits when they do the equivalent of at least 150 minutes of moderate
intensity aerobic physical activity (2 hours and 30 minutes) each week. Muscle‐strengthening activities
also provide health benefits and are an important part of an adult's overall physical activity plan.” 12
Physical activity for adults ages 18 and older includes aerobic physical activity and muscle strengthening.
Between 2008 and 2012, the rate of adults meeting physical activity and muscle strengthening
guidelines increased from 18.2% to 20.6%, nationally.1 This increase exceeded the HP2020 target of
20.1%.1 New Hampshire, GNPHR and the City of Nashua also have met this target, with rates of 22.6%(CI
21.1‐24.1%), 22.9% (CI 19.3‐26.6%) and 23.5% (CI 17.6‐29.4%), respectively (Table 6.5).7 Although these
rates have increased in the past years, about 80% of adults still do not meet the guidelines for both
aerobic and muscle‐strengthening activities.
Table 6.5 Physical Activity Indicators for Adults, BRFSS, 2012
Nashua GNPHR NH HP2020 Goal
Meeting aerobic physical activity guidelines for substantial health benefits among adults aged ≥18 years
49.8% (CI 43‐56.7%)
53.1% (CI 48.6‐57.6%)
56.5%
(CI 54.8‐58.2%)
N/A
Meeting aerobic physical activity guidelines for substantial health benefits and for muscle‐strengthening activity among adults aged ≥18 years
23.5% (CI 17.6‐29.4%)
22.9% (CI 19.3‐26.6%)
22.6% (CI 21.1‐24.1%)
20.1%
Meeting aerobic physical activity guidelines for additional and more extensive health benefits among adults aged ≥18 years
25% (CI 19.5‐30.5%)
28.7% (CI 24.7%‐32.7%)
34.8% (CI 33.1‐36.4%)
N/A
No leisure‐time physical activity among adults aged ≥18 years
24.8% (CI 19.0 – 30.5%)
19.8% (CI 16.6 – 23.1%)
20.30% (CI 19.0 – 21.6%)
32.6%
Source: NH DHHS
2014 GREATER NASHUA COMMUNITY HEALTH ASSESSMENT
WEIGHTMANAGEMENT,PHYSICALACTIVITY,NUTRITION PAGE6‐8
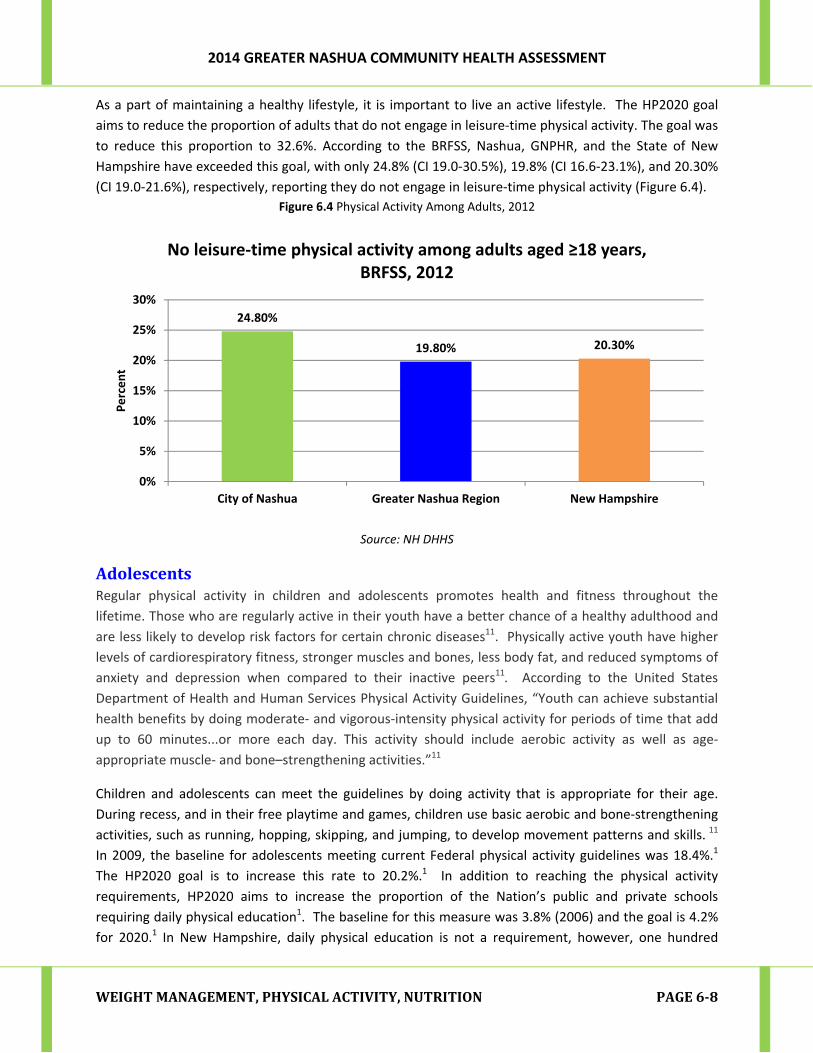
As a part of maintaining a healthy lifestyle, it is important to live an active lifestyle. The HP2020 goal
aims to reduce the proportion of adults that do not engage in leisure‐time physical activity. The goal was
to reduce this proportion to 32.6%. According to the BRFSS, Nashua, GNPHR, and the State of New
Hampshire have exceeded this goal, with only 24.8% (CI 19.0‐30.5%), 19.8% (CI 16.6‐23.1%), and 20.30%
(CI 19.0‐21.6%), respectively, reporting they do not engage in leisure‐time physical activity (Figure 6.4).
Figure 6.4 Physical Activity Among Adults, 2012
Source: NH DHHS
AdolescentsRegular physical activity in children and adolescents promotes health and fitness throughout the
lifetime. Those who are regularly active in their youth have a better chance of a healthy adulthood and
are less likely to develop risk factors for certain chronic diseases11. Physically active youth have higher
levels of cardiorespiratory fitness, stronger muscles and bones, less body fat, and reduced symptoms of
anxiety and depression when compared to their inactive peers11. According to the United States
Department of Health and Human Services Physical Activity Guidelines, “Youth can achieve substantial
health benefits by doing moderate‐ and vigorous‐intensity physical activity for periods of time that add
up to 60 minutes...or more each day. This activity should include aerobic activity as well as age‐
appropriate muscle‐ and bone–strengthening activities.”11
Children and adolescents can meet the guidelines by doing activity that is appropriate for their age.
During recess, and in their free playtime and games, children use basic aerobic and bone‐strengthening
activities, such as running, hopping, skipping, and jumping, to develop movement patterns and skills. 11
In 2009, the baseline for adolescents meeting current Federal physical activity guidelines was 18.4%.1
The HP2020 goal is to increase this rate to 20.2%.1 In addition to reaching the physical activity
requirements, HP2020 aims to increase the proportion of the Nation’s public and private schools
requiring daily physical education1. The baseline for this measure was 3.8% (2006) and the goal is 4.2%
for 2020.1 In New Hampshire, daily physical education is not a requirement, however, one hundred
24.80%
19.80% 20.30%
0%
5%
10%
15%
20%
25%
30%
City of Nashua Greater Nashua Region New Hampshire
Percent
No leisure‐time physical activity among adults aged ≥18 years, BRFSS, 2012

2014 GREATER NASHUA COMMUNITY HEALTH ASSESSMENT
WEIGHTMANAGEMENT,PHYSICALACTIVITY,NUTRITION PAGE6‐9
percent of New Hampshire’s schools must provide physical education K‐12. This is a requirement in the
Minimum Standards for School Approval.
At the state level, 22.9% of adolescents are meeting the Federal physical activity guidelines which
exceed the Healthy People 2020 goal of 20.2%. Among schools in the region, between 41% and 57% of
students reported being active for 60 minutes or more on five of seven days. Eight schools reported
rates higher than the national average of 47.3%. Seven schools reported rates that met or exceeded the
state average of 48.2% where students reported engaging in physical activity for a total of at least 60
minutes per day on five or more days (Figure 6.5)9. Figure 6.5 provides an overview of responses from
schools throughout the region.
Figure 6.5 Students Physically Active for at Least 60 Minutes per Day on 5 or more of the past 7 days,
YRBS 2013
Source: Youth Risk Behavioral Survey
Physical education can increase adolescents’ regularity of recommended physical activity each week.
Nationwide, 48% of students reported attending one or more Physical Education (PE) classes on one or
more days during an average week.15 Males reported higher attendance of PE classes than females,
53.3% and 42.8%, respectively.15 This difference was consistent across white, black and Hispanic male
and female students, grades 9‐12. The prevalence of having attended a PE class was higher among
Hispanic (57.5%) than white (43.1%) students.15 Higher prevalence of having attended a PE class among
Hispanic students remains consistent when comparing gender as well. Additionally, the prevalence of
students attending PE class consistently decrease as the grade level increased. Across the country, 9th
grade students, male and female, reported higher PE attendance than their older peers. This trend was
41%
49% 50%46%
48% 51%48%
57%
46% 48% 47%
0%
10%
20%
30%
40%
50%
60%
70%
80%
Percent
2014 GREATER NASHUA COMMUNITY HEALTH ASSESSMENT
WEIGHTMANAGEMENT,PHYSICALACTIVITY,NUTRITION PAGE6‐10
consistent for all grades, where the younger students reported higher rates of PE attendance than their
older peers.
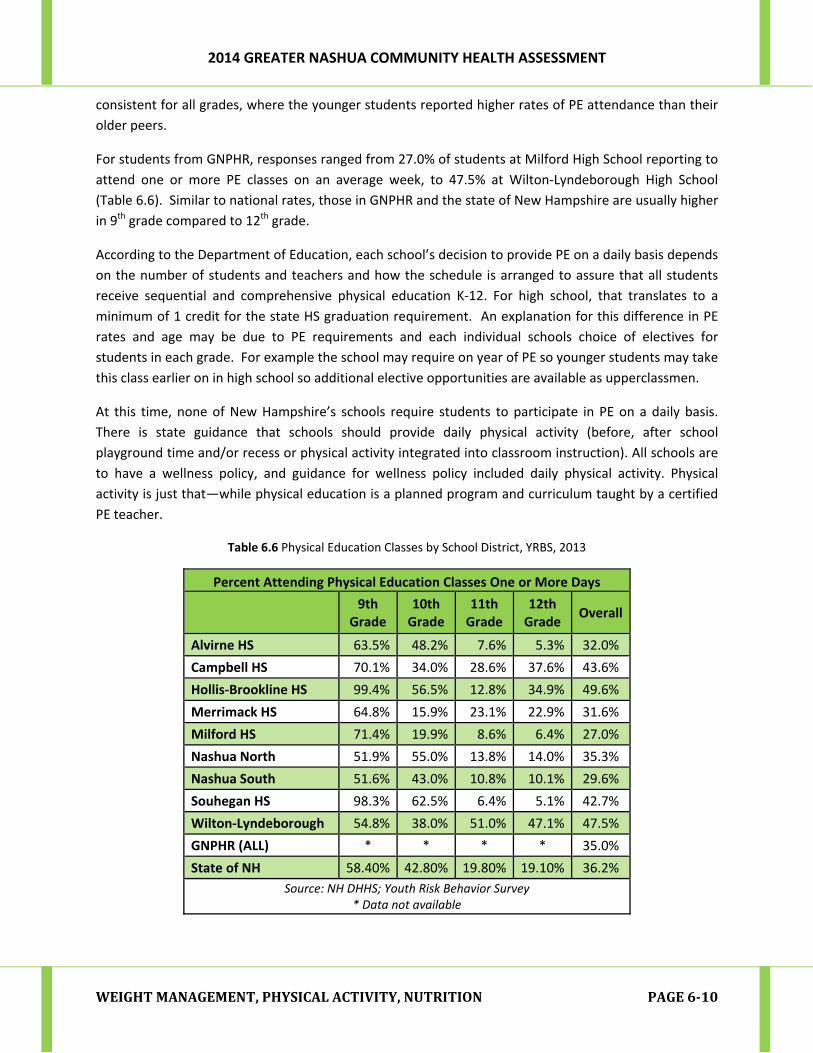
For students from GNPHR, responses ranged from 27.0% of students at Milford High School reporting to
attend one or more PE classes on an average week, to 47.5% at Wilton‐Lyndeborough High School
(Table 6.6). Similar to national rates, those in GNPHR and the state of New Hampshire are usually higher
in 9th grade compared to 12th grade.
According to the Department of Education, each school’s decision to provide PE on a daily basis depends
on the number of students and teachers and how the schedule is arranged to assure that all students
receive sequential and comprehensive physical education K‐12. For high school, that translates to a
minimum of 1 credit for the state HS graduation requirement. An explanation for this difference in PE
rates and age may be due to PE requirements and each individual schools choice of electives for
students in each grade. For example the school may require on year of PE so younger students may take
this class earlier on in high school so additional elective opportunities are available as upperclassmen.
At this time, none of New Hampshire’s schools require students to participate in PE on a daily basis.
There is state guidance that schools should provide daily physical activity (before, after school
playground time and/or recess or physical activity integrated into classroom instruction). All schools are
to have a wellness policy, and guidance for wellness policy included daily physical activity. Physical
activity is just that—while physical education is a planned program and curriculum taught by a certified
PE teacher.
Table 6.6 Physical Education Classes by School District, YRBS, 2013
Percent Attending Physical Education Classes One or More Days
9th
Grade 10th Grade
11th Grade
12th Grade
Overall
Alvirne HS 63.5% 48.2% 7.6% 5.3% 32.0%
Campbell HS 70.1% 34.0% 28.6% 37.6% 43.6%
Hollis‐Brookline HS 99.4% 56.5% 12.8% 34.9% 49.6%
Merrimack HS 64.8% 15.9% 23.1% 22.9% 31.6%
Milford HS 71.4% 19.9% 8.6% 6.4% 27.0%
Nashua North 51.9% 55.0% 13.8% 14.0% 35.3%
Nashua South 51.6% 43.0% 10.8% 10.1% 29.6%
Souhegan HS 98.3% 62.5% 6.4% 5.1% 42.7%
Wilton‐Lyndeborough 54.8% 38.0% 51.0% 47.1% 47.5%
GNPHR (ALL) * * * * 35.0%
State of NH 58.40% 42.80% 19.80% 19.10% 36.2%
Source: NH DHHS; Youth Risk Behavior Survey * Data not available
2014 GREATER NASHUA COMMUNITY HEALTH ASSESSMENT
WEIGHTMANAGEMENT,PHYSICALACTIVITY,NUTRITION PAGE6‐11
An important component to increasing physical activity
among youth and adolescents is to decrease time spent in
front of a screen. Screen time is a sedentary activity,
meaning you are being physically inactive while sitting
down. According to the Youth Risk Behavioral Survey,
41.3% of students nationwide played video or computer
games or used a computer for non‐school work for three
or more hours per day on an average school day.15 In
addition, it was reported 32.5% of students watched
television for three or more hours per day on an average
school day.15 The HP2020 goals aim to increase the
proportion of children and adolescents who engage in
screen time for no more than two hours each day from
75.1% in 2009 to 82.6% by 2020. “Screen time” includes
any activity done in front of a screen, such as watching
television or videos, playing video games, or using a
computer for non‐school work. In addition, the HP 2020
goal aims to increase the proportion of adolescents,
grades 9‐12, engaging in screen time no more than two
hours a day (television, videos, video games) from 67.2%
in 2009 to 73.9% by 2020.
Nutrition
Diet and body weight are related to health status. A
healthy diet also helps Americans reduce their risks for
many health conditions. The HP2020 objectives for
nutrition emphasize the health benefits of eating a
nutritious diet and maintaining a healthy body weight.
According to the National Association of County & City
Health Officials (NACCHO), those maintaining a healthy
diet, “consume a variety of nutrient‐dense foods within
and across the food groups, especially whole grains, fruits,
vegetables, low‐fat or fat‐free milk or milk products, and
lean meats and other protein sources”1. It is import to
limit caloric intake to what is needed daily and limit the
intake of saturated and trans‐fats, cholesterol, added
sugars, sodium and alcohol1.
Between 2001–2004 and 2007–2010, the mean daily
intake by persons aged 2 and older was unchanged at 0.8
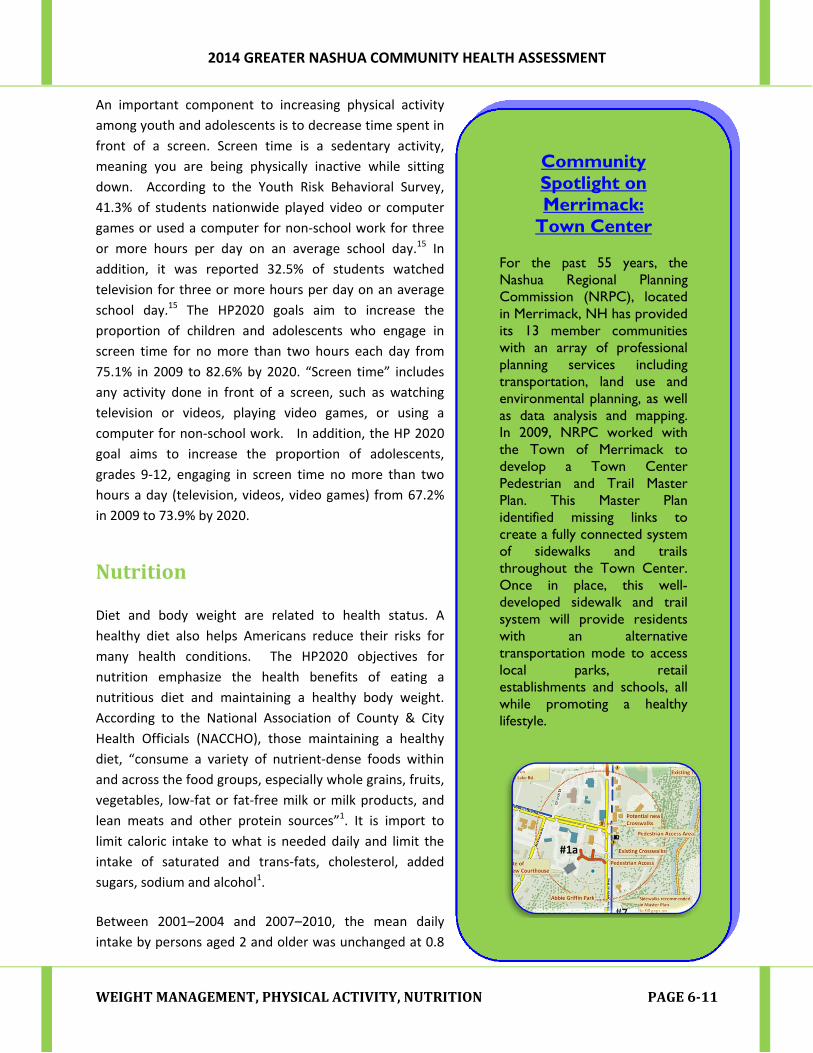
Community Spotlight on Merrimack:
Town Center
For the past 55 years, the Nashua Regional Planning Commission (NRPC), located in Merrimack, NH has provided its 13 member communities with an array of professional planning services including transportation, land use and environmental planning, as well as data analysis and mapping. In 2009, NRPC worked with the Town of Merrimack to develop a Town Center Pedestrian and Trail Master Plan. This Master Plan identified missing links to create a fully connected system of sidewalks and trails throughout the Town Center. Once in place, this well-developed sidewalk and trail system will provide residents with an alternative transportation mode to access local parks, retail establishments and schools, all while promoting a healthy lifestyle.
2014 GREATER NASHUA COMMUNITY HEALTH ASSESSMENT
WEIGHTMANAGEMENT,PHYSICALACTIVITY,NUTRITION PAGE6‐12
cup equivalents of total vegetables per 1,000 calories (age adjusted). 1 The Healthy People 2020 target is
1.1 cup of vegetables equivalents per 1,000 calories.1 Between 2001‐2004, the mean daily intake by
persons 2 and older was 0.5 cup equivalent of fruits per 1,000 calories (age adjusted to the year 2000
standard population)1. The HP 2020 goal is 0.9 cup equivalent per 1,000 calories1.
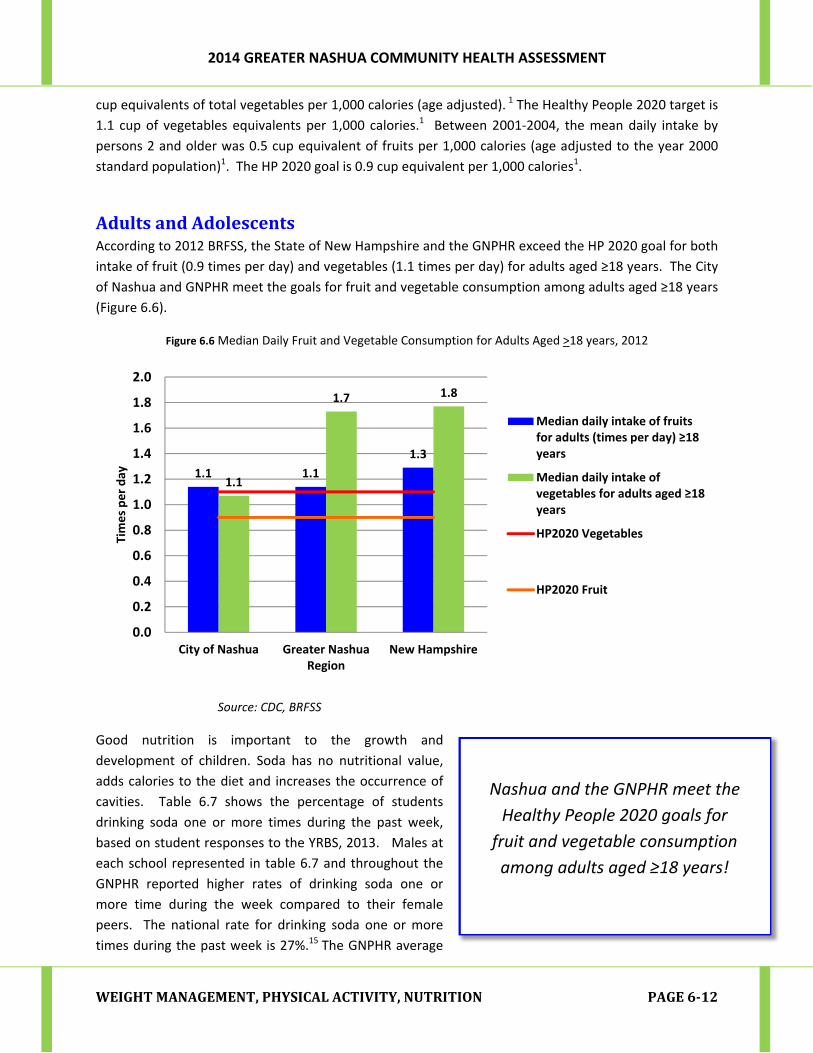
AdultsandAdolescentsAccording to 2012 BRFSS, the State of New Hampshire and the GNPHR exceed the HP 2020 goal for both
intake of fruit (0.9 times per day) and vegetables (1.1 times per day) for adults aged ≥18 years. The City
of Nashua and GNPHR meet the goals for fruit and vegetable consumption among adults aged ≥18 years
(Figure 6.6).
Figure 6.6 Median Daily Fruit and Vegetable Consumption for Adults Aged >18 years, 2012
Source: CDC, BRFSS
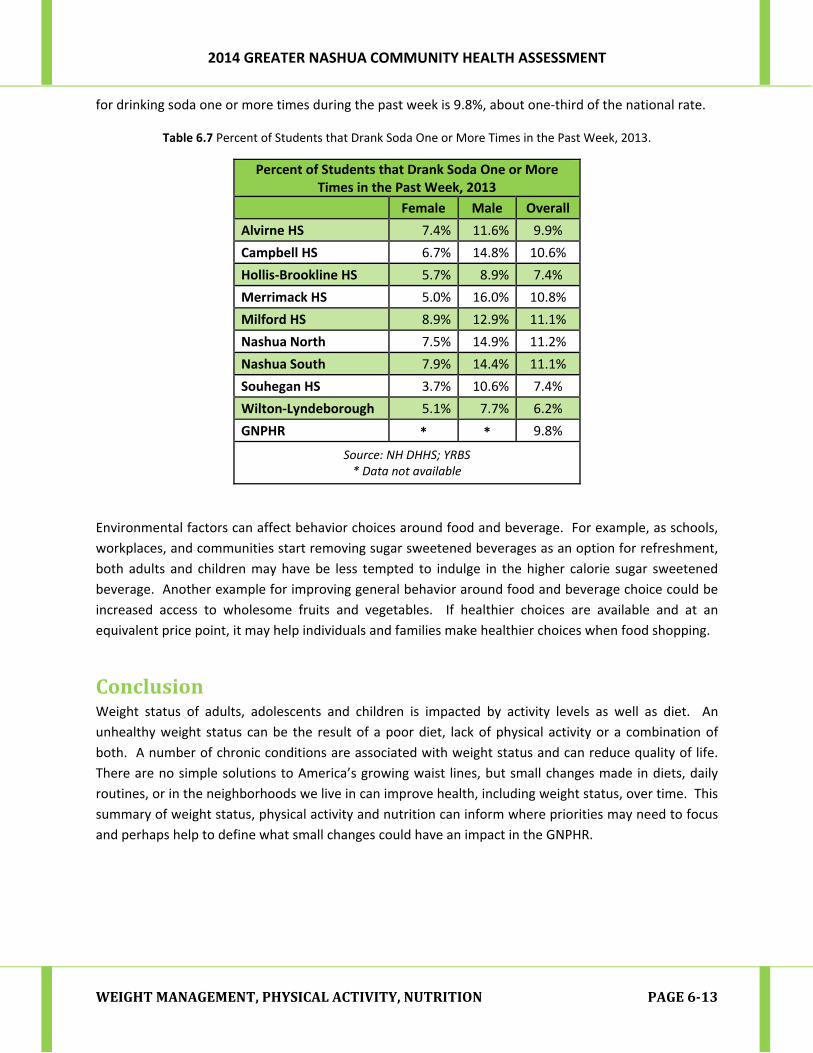
Good nutrition is important to the growth and
development of children. Soda has no nutritional value,
adds calories to the diet and increases the occurrence of
cavities. Table 6.7 shows the percentage of students
drinking soda one or more times during the past week,
based on student responses to the YRBS, 2013. Males at
each school represented in table 6.7 and throughout the
GNPHR reported higher rates of drinking soda one or
more time during the week compared to their female
peers. The national rate for drinking soda one or more
times during the past week is 27%.15 The GNPHR average
1.1 1.1
1.3
1.1
1.7 1.8
0.0
0.2
0.4
0.6
0.8
1.0
1.2
1.4
1.6
1.8
2.0
City of Nashua Greater NashuaRegion
New Hampshire
Times per day
Median daily intake of fruits for adults (times per day) ≥18 years
Median daily intake of vegetables for adults aged ≥18 years
HP2020 Vegetables
HP2020 Fruit
Nashua and the GNPHR meet the
Healthy People 2020 goals for
fruit and vegetable consumption
among adults aged ≥18 years!
2014 GREATER NASHUA COMMUNITY HEALTH ASSESSMENT
WEIGHTMANAGEMENT,PHYSICALACTIVITY,NUTRITION PAGE6‐13
for drinking soda one or more times during the past week is 9.8%, about one‐third of the national rate.
Table 6.7 Percent of Students that Drank Soda One or More Times in the Past Week, 2013.
Percent of Students that Drank Soda One or More Times in the Past Week, 2013
Female Male Overall
Alvirne HS 7.4% 11.6% 9.9%
Campbell HS 6.7% 14.8% 10.6%
Hollis‐Brookline HS 5.7% 8.9% 7.4%
Merrimack HS 5.0% 16.0% 10.8%
Milford HS 8.9% 12.9% 11.1%
Nashua North 7.5% 14.9% 11.2%
Nashua South 7.9% 14.4% 11.1%
Souhegan HS 3.7% 10.6% 7.4%
Wilton‐Lyndeborough 5.1% 7.7% 6.2%
GNPHR * * 9.8%
Source: NH DHHS; YRBS * Data not available
Environmental factors can affect behavior choices around food and beverage. For example, as schools,
workplaces, and communities start removing sugar sweetened beverages as an option for refreshment,
both adults and children may have be less tempted to indulge in the higher calorie sugar sweetened
beverage. Another example for improving general behavior around food and beverage choice could be
increased access to wholesome fruits and vegetables. If healthier choices are available and at an
equivalent price point, it may help individuals and families make healthier choices when food shopping.
ConclusionWeight status of adults, adolescents and children is impacted by activity levels as well as diet. An
unhealthy weight status can be the result of a poor diet, lack of physical activity or a combination of
both. A number of chronic conditions are associated with weight status and can reduce quality of life.
There are no simple solutions to America’s growing waist lines, but small changes made in diets, daily
routines, or in the neighborhoods we live in can improve health, including weight status, over time. This
summary of weight status, physical activity and nutrition can inform where priorities may need to focus
and perhaps help to define what small changes could have an impact in the GNPHR.
2014 GREATER NASHUA COMMUNITY HEALTH ASSESSMENT
WEIGHTMANAGEMENT,PHYSICALACTIVITY,NUTRITION PAGE6‐14
1United States Department of Health and Human Services, Centers for Disease Control and Prevention. “Healthy People 2020 Leading Health Indicators: Nutrition, Physical Activity, and Obesity”. May 2014. http://www.healthypeople.gov/2020/LHI/HP2020_LHI_Nut_PhysActiv.pdf. Retrieved, 6/9/2014.
2United States Department of Health and Human Services, Centers for Disease Control and Prevention. “Nutrition, Physical Activity, and Obesity Leading Health Indicators ‐ Healthy People 2020”. June 18, 2014. http://www.healthypeople.gov/2020/LHI/nutrition.aspx?tab=determinants. Retrieved 6/18/2014. 3National Association of County and City Health Officials (NACCHO). “Obesity Prevention/Physical
Activity/Nutrition”. 2014. http://www.naccho.org/topics/HPDP/chronicdisease/oppan.cfm. Retrieved 6/9/2014.
4United States Department of Health and Human Services, Centers for Disease Control and Prevention. National Center for Health Statistics. “Higher education and income levels keys to better health, according to annual report on nation's health”. Press Release. February 8, 2012. http://www.cdc.gov/media/releases/2012/p0516_higher_education.html. Retrieved 6/9/2014.
5United States Department of Health and Human Services, Centers for Disease Control and Prevention. “Adult Obesity Facts”. March 28, 2014. http://www.cdc.gov/obesity/data/adult.html. Retrieved 6/9/2014.
6New Hampshire Division of Public Health Services. Department of Health and Human Services. “New
Hampshire State Health Improvement Plan, 2013‐2020: Charting a Course to Improve the Health of New Hampshire”. October 2013.
7Bureau of Health Statistics and Data Management. (2012). New Hampshire Behavioral Risk Factor Surveillance System Data. Concord, NH: New Hampshire Department of Health and Human Services, 2012.
8United States Department of Health and Human Services, Centers for Disease Control and Prevention.
Division of Adolescent and School Health. Updated April 30 2012. Retrieved 07/30/14 from http://www.cdc.gov/healthyyouth/adolescenthealth/.
9Bureau of Health Statistics and Data Management. (2013). New Hampshire Behavioral Risk Factor Surveillance System Data. Concord, NH: New Hampshire Department of Health and Human Services, 2013.
10United States Department of Health and Human Services, Centers for Disease Control and Prevention.
Division of Nutrition, Physical Activity and Obesity. Updated September 13 2011. Retrieved 7/30/14 from http://www.cdc.gov/healthyweight/physical_activity/index.html.
11United States Department of Health and Human Services, Office of Disease Prevention and Health
Promotion. Physical Activity Guidelines, Chapter Three “Active Children and Adolescents”. Updated on July 30 2014. Retrieved on 7/30/14 from http://www.health.gov/paguidelines/guidelines/chapter3.aspx.

2014 GREATER NASHUA COMMUNITY HEALTH ASSESSMENT
WEIGHTMANAGEMENT,PHYSICALACTIVITY,NUTRITION PAGE6‐15
12United States Department of Health and Human Services, Office of Disease Prevention and Health Promotion. Physical Activity Guidelines, Chapter Four “Active Adults”. Updated on July 30 2014. Retrieved on 7/30/14 from http://www.health.gov/paguidelines/guidelines/chapter4.aspx.
13Community Health Institute. Greater Nashua Community Health Assessment, Focus Group Summary Report. May 2014. 14United States Department of Health and Human Services, Centers for Disease Control and Prevention.
County‐level Estimates of Obesity among Adults aged ≥ 20 years old, Trend 2005 – 2011, 2011. Retrieved on 8/7/14 from: http://www.cdc.gov/diabetes/atlas/countydata/Obesity_Prevalence.pdf
15United States Department of Health and Human Services, Centers for Disease Control and Prevention.
Morbidity and Mortality Weekly Report. Surveillance Summaries, Volumn 63, Number 4. Youth Risk Surveillance – United States, 2013. June 13, 2014.
Community Spotlight for Litchfield: Albuquerque Avenue
Litchfield’s Albuquerque Avenue gently winds on a north-south axis through the center of the Town. Nearly 70% of the Town’s 8200 residents live within a five to ten minute walk
of Albuquerque. In 2007, Litchfield secured funding to construct an eight foot wide pedestrian path/bikeway along this two mile corridor. This path leveraged available ARRA funds of approximately $470,000 and $18,500 of local money for design and construction.
Since its completion in 2010, the Albuquerque Bike Path has become a valuable community asset.
Throughout the day, this path sees a wide range of users early morning joggers, dog
walkers, students walking to Campbell High School (located along the path) and evening strollers. Given its proximity to the majority of residences in Litchfield, it is easily
incorporated into many residents’ healthy routines.