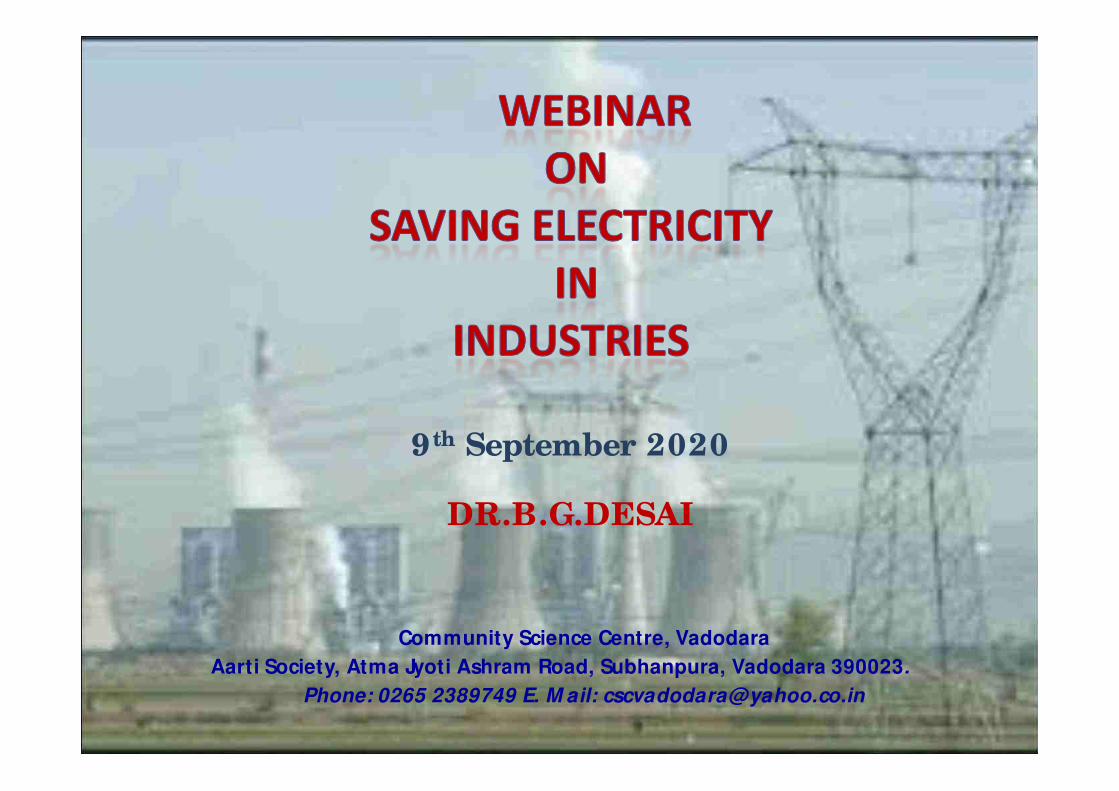
WEBINAR ON SAVING ELECTRICITY IN INDUSTRY
250
WELCOME WELCOME TO TO WEBINAR ON WEBINAR ON SAVING ELECTRICITY IN INDUSTRY SAVING ELECTRICITY IN INDUSTRY Community Science Centre, Vadodara Aarti Society, Atma Jyoti Ashram Road, Subhanpura, Vadodara 390023 . Phone: 0265 2389749 E. M ail: [email protected] DR.B.G.DESAI
-
Upload
khangminh22 -
Category
Documents
-
view
2 -
download
0
Transcript of WEBINAR ON SAVING ELECTRICITY IN INDUSTRY
WELCOMEWELCOME
TOTO
WEBINAR ON WEBINAR ON
SAVING ELECTRICITY IN INDUSTRYSAVING ELECTRICITY IN INDUSTRY
Community Science Centre, Vadodara
Aarti Society, Atma Jyoti Ashram Road, Subhanpura, Vadodara 390023.
Phone: 0265 2389749 E. M ail: [email protected]
DR.B.G.DESAI

Community Science Centre, Vadodara
• Community Science Centre, (CSC) Vadodara is a
non-profit charitable trust established in 1982, by
leading citizens, corporate bodies and charitable
trusts of Baroda. The Centre has been awarded as
“Grade A’ Regional Community Science Centre by
the Gujarat Council on Science & Technology
(GUJCOST), Department of Science and Technology,
Government of Gujarat. . The objective of the
centre is to promote dissemination of knowledge in
science and technology to Urban and Rural
communities.

Our Act ivit ies• Science Clubs Act ivit ies, Robot ics, Ast ronomy, Elect ronics, Rocket ry, M odel
M aking,,
• Annual Science Fairs Science Exhibit ions,
• STEM Educat ion,
• Expert / Popular Lectures,
• Laboratory Demonstrat ions, Inst itut ional Visits,
• Quizzes, Part icipatory
• Awareness Generat ion Act ivit ies on Energy Conservat ion, Energy
Efficiency, Environment , Biodiversity, Sustainable Technologies
• Seminars, Workshops,
• Summer Vacat ion Clubs,
• Nature Camps and Training and Capacity Building Programs that are
organized on ad-hoc basis to promote science and technology.

Energy Conservat ion Programs
• Energy Saving at Home:
• Petroleum Conservat ion Research Associat ion (PCRA) sponsored programmes.
• This program is carried out under the guidance of Energy Expert Dr. B.G.Desai for two groups i.e.
1. Domestic levels (mainly women and household people)The domest ic Workshop for women taught them aboutenergy saving at households and also steps for savingenergy. In last 6 years 45 Domest ic Programmes wereorganised in which approx. 2000 part icipants includingwomen, college girls, members of inst itut ions, Associat ions,Group of teachers etc have attended this workshop.
Energy Conservat ion Programs
2. Youth level : For Energy conservat ion 60
youth programmes have been conducted for
school students, ITI students, Engineering
Students and B.Ed. Students. About 2700
part icipants, hailing from various target
groups have benefited from these programs

Half Day/ One Day / Two Days Seminar on
Saving Energy in Industries
• The seminars were designed and developed by
Dr. B. G. Desai, an authority on energy
conservat ion in the country, and Late Shri J. S.
Rana Energy Efficiency Expert . In last 5 years
nearly 15 programmes have been conducted at
CSC, Vadodara and 4 programmes at different
industries. Nearly 250 engineers, BEE cert ified
energy auditors & managers working in
industries, ut ilit ies, and commercial
establishment benefited from this
Publicat ions on Energy Conservat ion
• SAVING ELECTRICITY IN INDUSTRY - B00K
•• ઘરમાં તથા ઓ ફસમાં ઊઘરમાં તથા ઓ ફસમાં ઊ બચતબચત•• Saving Energy in Home and OfficesSaving Energy in Home and Offices
•• લ ુલ ,ુ , મ યમ ઉ ોગો માટમ યમ ઉ ોગો માટ ઊ બચતઊ બચત• SAVING ELECTRICITY BY USE OF EFFICIENT EQUIPM ENTS (IN
GUJARATI & ENGLISH)
• Case Studies on energy conservation for industries
• Curriculum Development for Diploma Engineering
Colleges: the curriculum development for Diploma and
ITI Colleges of the state project was supported by the
GEDA.

8
DR. BG DESAI46, ATMA JYOTI NAGAR, VADODARA – 390023
PHONE: 0265 2396243, MAIL: [email protected]
M.E. ELECTRICAL – GUJARAT UNIVERSITY
Ph.D. - IIT BOMBAY,
PROFESSIONAL
FACULTY – IIT BOMBAY (1963-1968)
R & D MANAGER – JYOTI LTD. (1969-1975)
FOUNDER DIRECTOR & CHAIRMAN (1975-2005)
DEVKI R & D, DEVKI ENERGY CONSULTANCY PVT LTD.
RETIRED IN 2005, WORKING FOR PROMOTION OF ENERGY
CONSERVATION
SR. MEMBER IEEE,
FELLOW INSTITUTE OF ENGINEERS
ACADEMIC

9
Late Shri J.S.Rana (1934 – 2020)
Address:
5, Sarita Sangam, Near Rajesh Appartment , Gotri Road,
Vadodara- 390023. Phone: 0265 - 2397554
Academic:
B.E. Elect rical
M .E. Elect rical
Professional:
Faculty – L.D.Engeenering College (1959-1965)
R & D M anager – Jyot i Ltd. (1965-1983)
Consultant in the field of Power Elect ronics & Energy
Conservat ion (1983 – 2005)
Director Devki Energy (1990 – 2005)
Since 2005 working for promot ion of Energy Conservat ion
M r. B.N.Raval
• Graduate in Electrical Engineering.
• Joined GEB and worked in various department like
Distribution and Transmission
• He started working in EC Cell and worked for many
years in field of Energy Conservation in GEB
• He carried out large number of audits as well as training
programme on Energy Conservation in GEB.
• He became Chief Engineer GETCO and Chief Electrical
Inspector Gujarat Government
•He retired in 2010 and started own organisation SOHAM
Technologies
•He has carried out large number of Energy Audit and
Training Programe in last 10 years

Mr. Rajendra Pandya
• Mechanical Engineer
• Retired GEDA Sr. Executive (2016)
• Freelance Energy Consultant & Trainer
• Lead Auditor EnMS ISO 50001:2011
• Master Trainer En.Conservation Builing Code
• Visiting Faculty – CEPT, Ahmedabad and Parul University
• Domain Expert on Renewable Energy & Waste to Energy,
at Gujarat Energy Research & M anagement Inst itute
(GERM I), Gandhinagar
• Expertise in Industrial Energy Ef f iciency and Renewable
Energy Systems & Applications
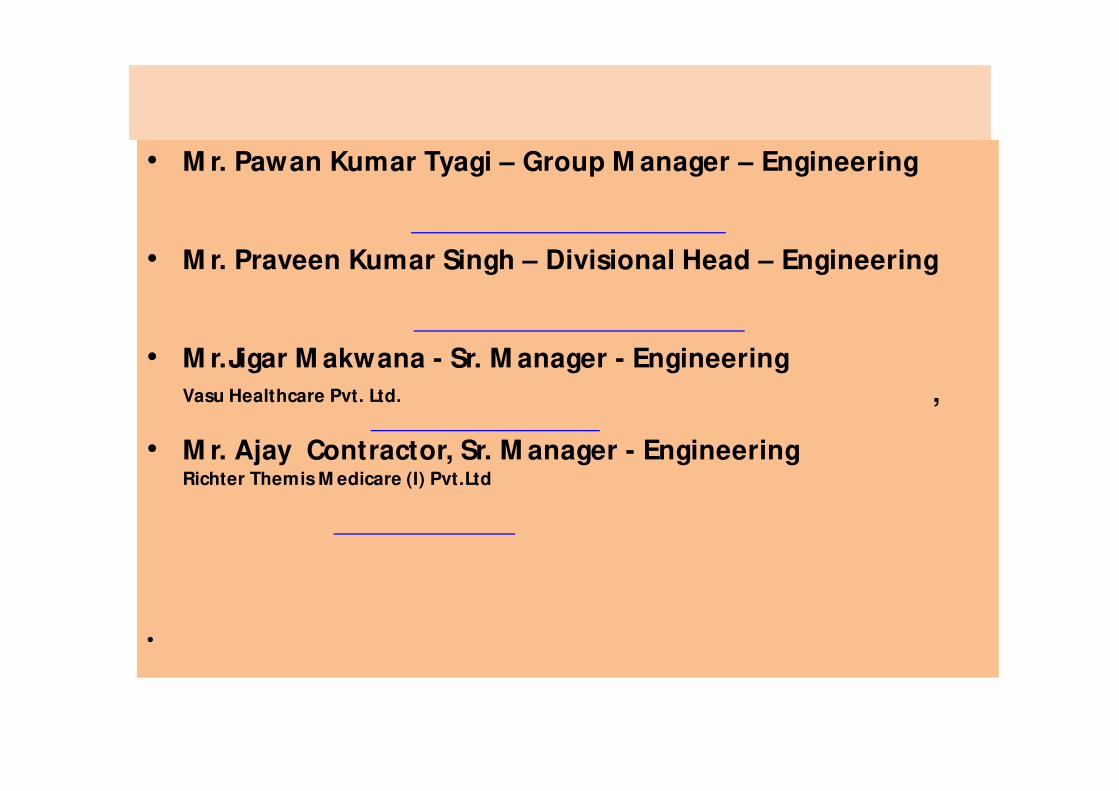
Our Part icipants• M r. Pawan Kumar Tyagi – Group M anager – Engineering
Apollo Tyres Ltd., Village - Limda, Waghodia, Vadodara -391760, Gujrat , India
M o.: 9979861943, E-M ail: [email protected]
• M r. Praveen Kumar Singh – Divisional Head – EngineeringApollo Tyres Ltd., Village - Limda, Waghodia, Vadodara -391760, Gujrat , India
M o.: 9913087048, E-M ail: [email protected]
• M r.Jigar M akwana - Sr. M anager - Engineering
Vasu Healthcare Pvt. Ltd. 967/ 4, G.I.D.C., M akarpura, Vadodara 390010 (Gujarat) India, 7069088772, E-M ail : [email protected]
• M r. Ajay Contractor, Sr. M anager - EngineeringRichter Themis M edicare (I) Pvt.Ltd.
Plot No.-69/A-2, GIDC Industrial Estate, Vapi - 396 195.
M . 9265044482, [email protected]
•

Webinar on Saving Electricity in Industry on 9th Sept. 2020
ScheduleTime Subject
9.30 –10.00 Registration
10.00-10.15 Introduction
10.15 - 11.30 Energy in India
Systems Approach
Energy Audit
11.30 -11.45 Break
11.45– 13.00 Electric M otors
Pumps & Fans
13.00 – 13.45 Break
13.45– 15.30 Lighting
Compressed Air, Refrigeration,
Power Factor & M D Control
15.30 – 15.45 Break
15.45– 17.00 Award Winning Case Studies
BEE Standard and Labeling
17.00 - 17.30 Discussion
14
Community Science Centre, Vadodara
Aarti Society, Atma Jyoti Ashram Road, Subhanpura, Vadodara 390023.
Phone: 0265 2389749 E. M ail: [email protected]
9 th September 2020
DR.B.G.DESAI

1. ENERGY IN INDIA AND WORLD
2. WHY ENERGY CONSERVATION
3. SYSTEM S APPROACH
4. ENERGY AUDIT
5. M OTORS
6. PUM PS,FANS,VARIABLE SPEED DRIVES
7. LIGHTING
8. COM PRESSED AIR
9. REFRIGERATION
10. ELECTRIC HEATING
11. ELECTROLYSIS
12. ELECRICITY TARIFFS & BILL ANALYSIS
13. M AXIM UM DEM AND CONTROL
14. POWER FACTOR
15. CASE STUDIES
16. M ANAGEM ENT OF ENERGY CONSERVATION
17. M AINTENANCE AND ENERGY CONSERVATION
18. CARBON FOOTPRINT
19. ANNEXURES
• A-1 E NE R GY CONS E R VAT ION ACT , 2 0 01
A-2 S t an dar ds an d L abel in g
15

CH AP T E R – 1
ENERGY IN INDIA AND WORLD
1. Energy In India
1.1. Conventional sources of energy used in India are
1. Coal and Lignite2. Oil3. Gas4. Nuclear Energy
These resources are non renewable resources and once used cannot be used
again. Their availability is also limited both in India and World. Use of these
resources lead to pollut ion and Global Warming.
To meet challenge of diminishing resources and global warming, renewable
energy resources are now widely used. M ajor renewable resources are Solar,
Wind and Hydroelectricity. Biomass resources like firewood, agriculture waste,
cow dung are st ill widely used in India for cooking and heat ing. They supply
25% to 30% of total energy in India. Efficiency of cook stoves is only 10%.
Improved cook stoves with 30% efficiency are available.
Electricity is a secondary energy source derived from coal oil and gas in
thermal power plants. Hydro electricity is renewable. Nuclear Energy depends
on Uranium which is also available in limited quant ity in India as well as World.
2

1.2 Energy Demand
Energy demand is increasing in India at rate of 5% to 6% in recent
years due to increase in economic act ivity in all sectors. e.g.
1. Indust rial and Commercial
2. Resident ial
3. Transport
4. Agriculture
Increased populat ion and increasing standards of living are driving
forces for increase in energy demand of all forms of energy.
Demand of 4 wheelers and 2 wheelers is increasing at rate of 10% to
20%. This leads to increase in oil consumpt ion as well as auto
manufacturing.
Similarly agricultural energy demand is increasing due to populat ion
as well as improved standard of living. Product ion of milk has
increased dramatically so also product ion of fruits and vegetables.
This leads to increased demand of fert ilizers, motors and pumps.

Building act ivity is also increasing at significant rate
leading to demand for Cement and Steel.
There is a reduct ion in demand of automobiles and
other products in first half of 2019-20.
Energy demand will also reduce.
M arket for domest ic appliances like refrigerator, TV is
increasing very fast .
Our per capita consumpt ion of total energy and
elect ricity as well as per capita GDP is very low. Our
per capital GDP is expected to increase significant ly in
next 10 years. This will also lead to significant increase
in energy demand.
3
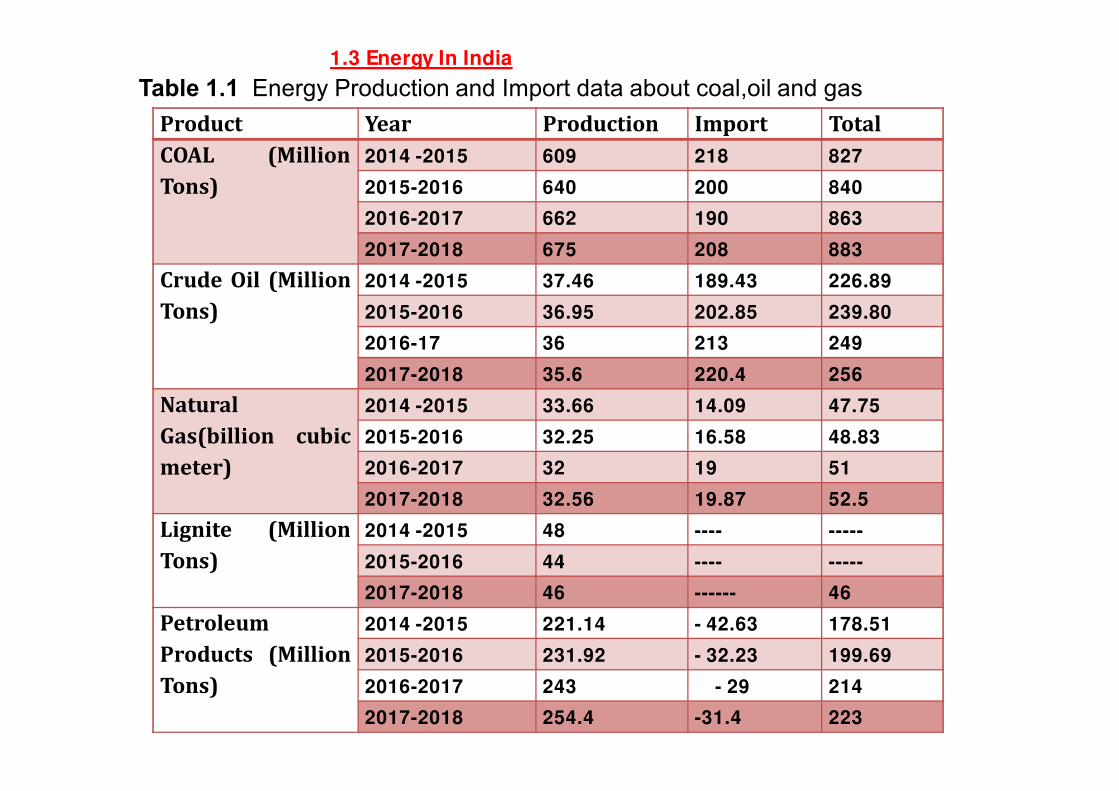
Product Year Production Import Total
COAL (Million
Tons)
2014 -2015 609 218 827
2015-2016 640 200 840
2016-2017 662 190 863
2017-2018 675 208 883
Crude Oil (Million
Tons)
2014 -2015 37.46 189.43 226.89
2015-2016 36.95 202.85 239.80
2016-17 36 213 249
2017-2018 35.6 220.4 256
Natural
Gas(billion cubic
meter)
2014 -2015 33.66 14.09 47.75
2015-2016 32.25 16.58 48.83
2016-2017 32 19 51
2017-2018 32.56 19.87 52.5
Lignite (Million
Tons)
2014 -2015 48 ---- -----
2015-2016 44 ---- -----
2017-2018 46 ------ 46
Petroleum
Products (Million
Tons)
2014 -2015 221.14 - 42.63 178.51
2015-2016 231.92 - 32.23 199.69
2016-2017 243 - 29 214
2017-2018 254.4 -31.4 223
1.3 Energy In India
Table 1.1 Energy Production and Import data about coal,oil and gas

Industries also have their own captive Power Plants.
Total capacity of Captive Power Plants is about 50,000 M W.
Table 1.2 Installed Capacit ies
TYPE 2015-16
M W
2016-17
M W
2017-18
M W
2018-19
M W
Coal 185172.88 192162.88 197171 194444.50
Gas 24508.63 25329.38 24897 24937.22
Diesel 993.53 837.63 837 637.63
Thermal 210675.0 218329.8 222906 226279.34
Hydro42783.42 44478.42 45293 45399.22
Nuclear 5780.00 6780.00 6780 6780
Renewable 38821.51 57260.23 69022 77641.63
Total 298059.97 326848.53 344082 356100.19
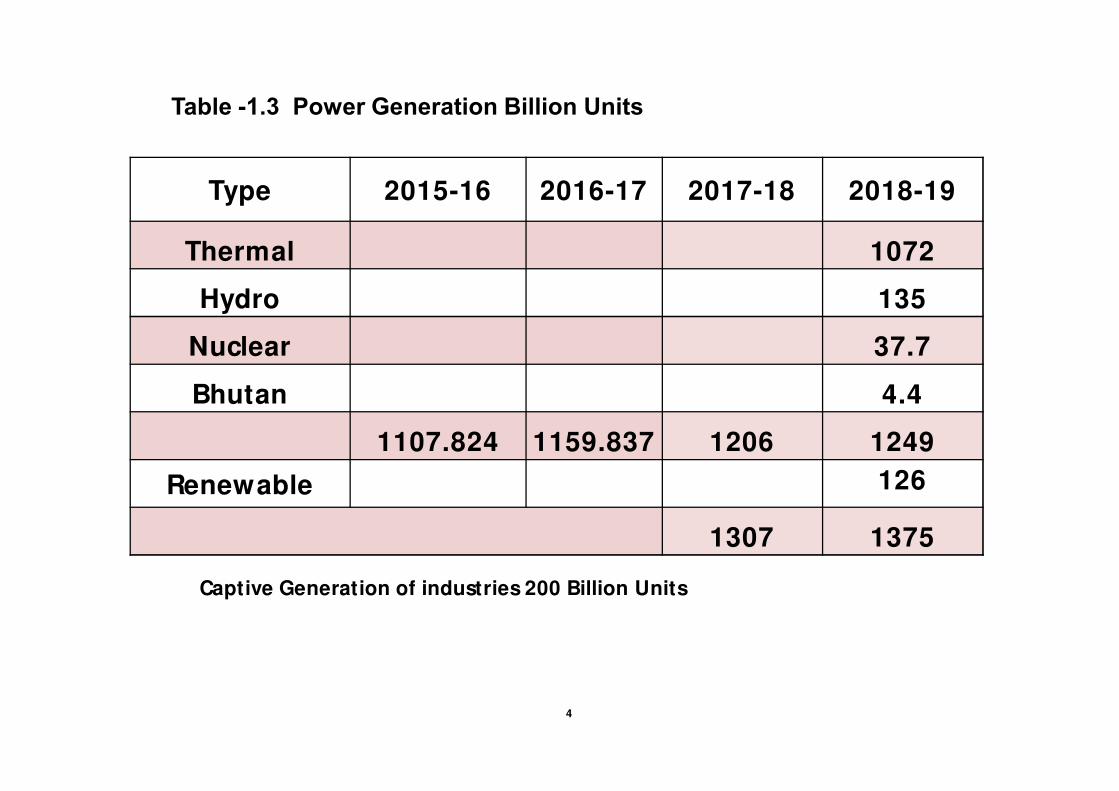
Table -1.3 Power Generation Billion Units
Type 2015-16 2016-17 2017-18 2018-19
Thermal 943.787 994.215 1037.1 1072
Hydro 121.377 122.312 126.1 135
Nuclear 37.416 37.664 38.3 37.7
Bhutan 5.244 5.644 4.8 4.4
Total 1107.824 1159.837 1206 1249
Renewable 65 82 101 126
Total 1307 1375
Captive Generation of industries 200 Billion Units
4
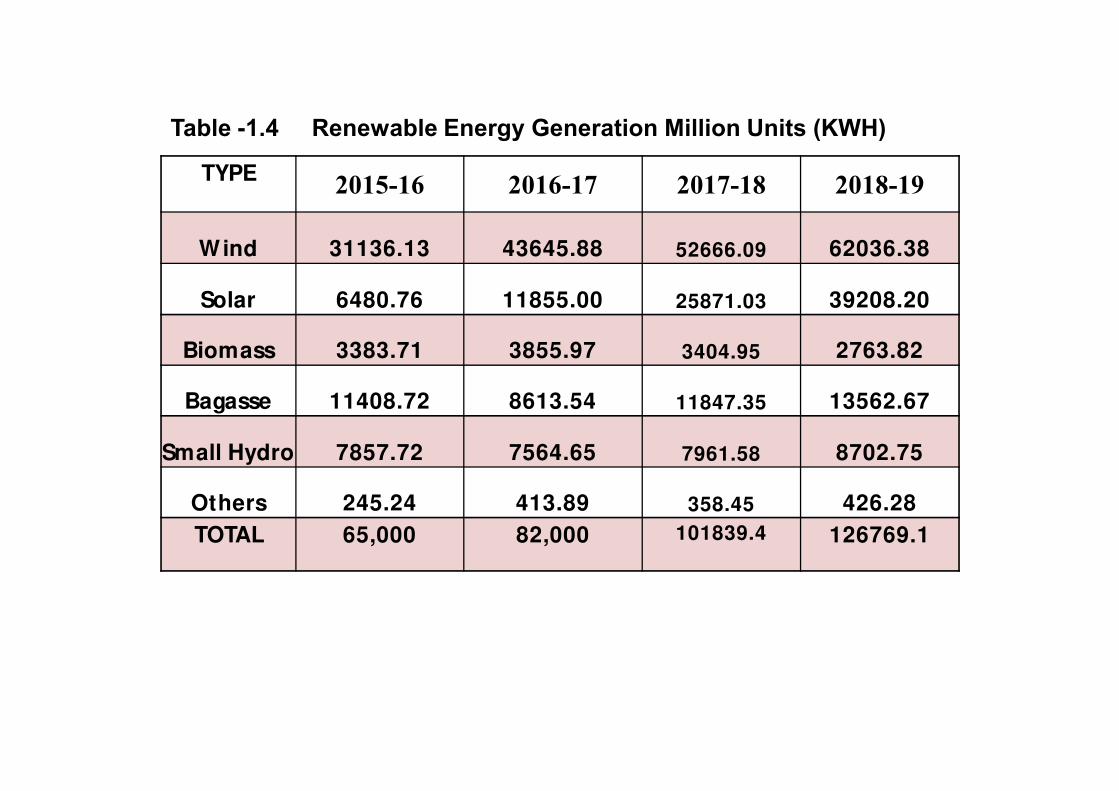
Table -1.4 Renewable Energy Generation Million Units (KWH)
TYPE2015-16 2016-17 2017-18 2018-19
Wind 31136.13 43645.88 52666.09 62036.38
Solar 6480.76 11855.00 25871.03 39208.20
Biomass 3383.71 3855.97 3404.95 2763.82
Bagasse 11408.72 8613.54 11847.35 13562.67
Small Hydro 7857.72 7564.65 7961.58 8702.75
Others 245.24 413.89 358.45 426.28
TOTAL 65,000 82,000 101839.4 126769.1

Total requirement of all forms of energy is
increasing. Indigenous product ion is not able to
meet demand and import of coal, oil and gas is
taking place. 80% of oil and 40% of gas is
imported, leading to huge out flow of foreign
exchange. India's overall import is much more
than its export leading to severe devaluat ion of
rupee 1$ =70 Rs. compared to 1$ = 1 rupee at
the t ime of independence.
Following points are to be noted

Electricity generation is mainly Thermal
(78%). Hydro electricity, a renewable resource
used to contribute 40% to 50% of total
generation 25 -30 years back. Now it has
reduced to 15%. Nuclear energy contributes
only 3 % of electricity generation.
Installed capacity of solar and wind is now
nearly 20% but electricity generation is only 8
% because solar and wind energy resources
are intermittent in nature.
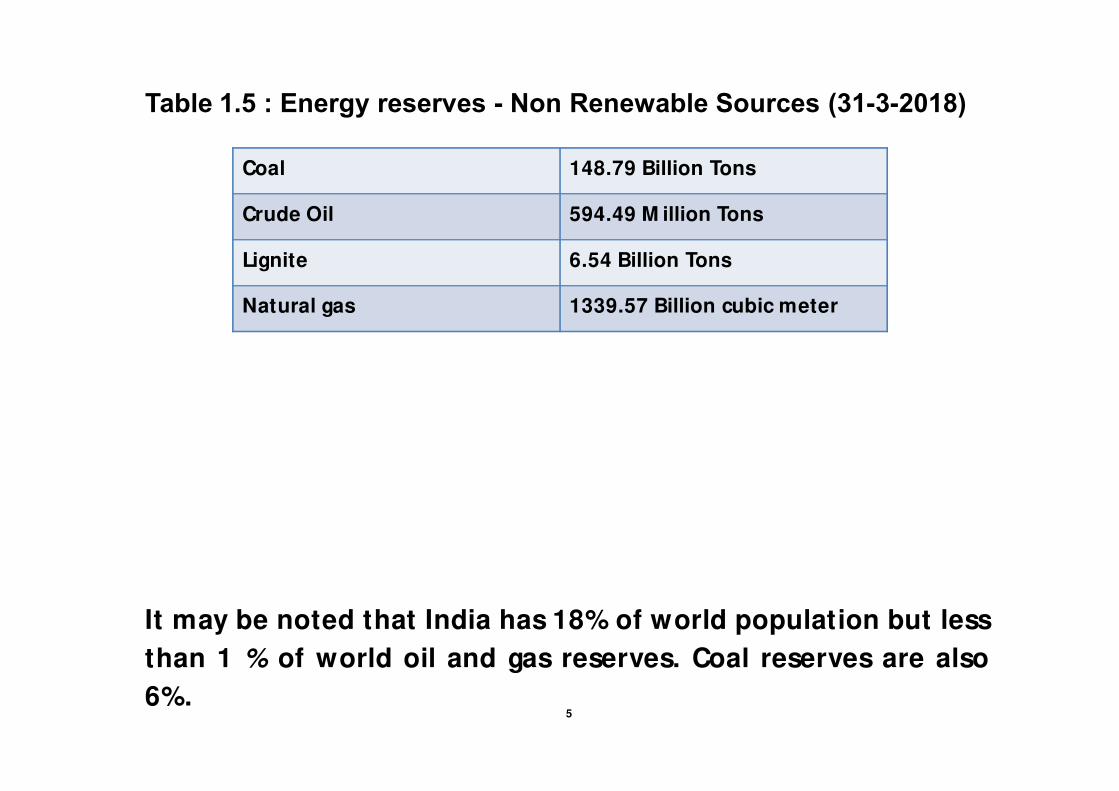
Table 1.5 : Energy reserves - Non Renewable Sources (31-3-2018)
It can be seen that coal reserves will be over in less than 100
years as product ion is expected to cross 1000 million tons soon
Crude oil will last not more than 15 years at exist ing product ion
rate. At present consumpt ion of 200 million tons, oil reserves will
be over in 3 years. Gas reserves will not also last more than 30
years.
It may be noted that India has 18% of world population but less
than 1 % of world oil and gas reserves. Coal reserves are also
6%.5
Coal 148.79 Billion Tons
Crude Oil 594.49 M illion Tons
Lignite 6.54 Billion Tons
Natural gas 1339.57 Billion cubic meter
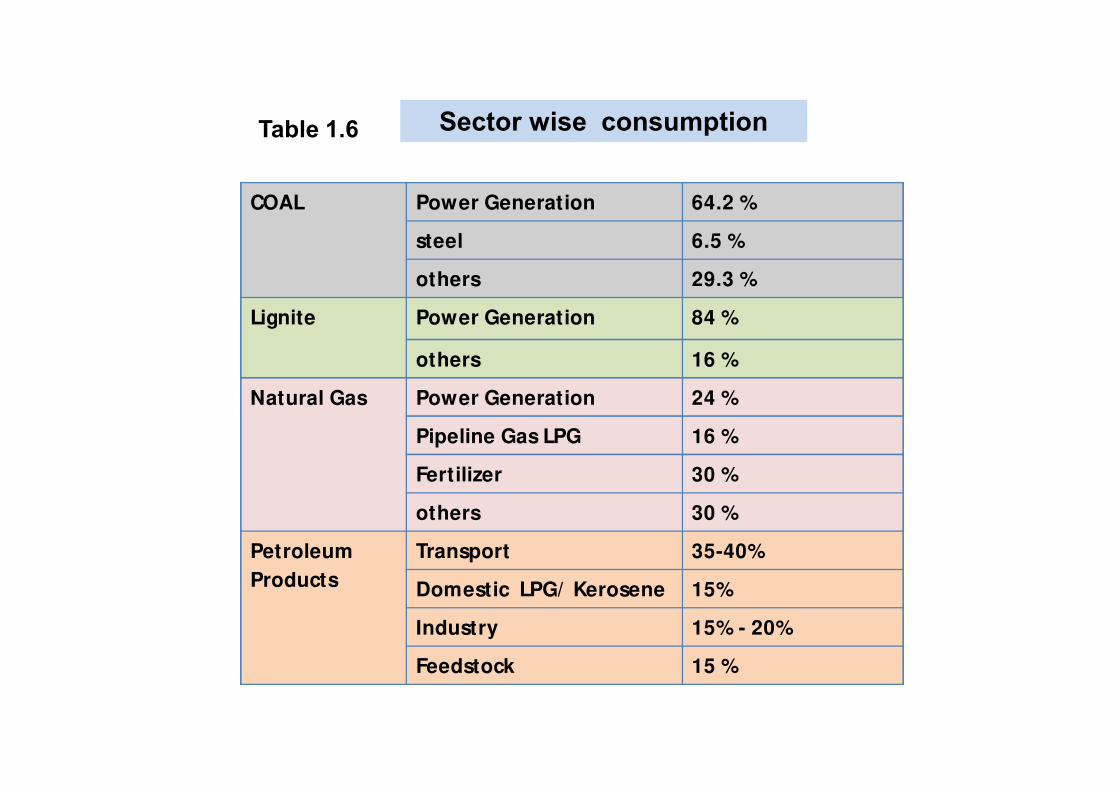
Sector wise consumption
COAL Power Generation 64.2 %
steel 6.5 %
others 29.3 %
Lignite Power Generation 84 %
others 16 %
Natural Gas Power Generation 24 %
Pipeline Gas LPG 16 %
Fertilizer 30 %
others 30 %
Petroleum
Products
Transport 35-40%
Domestic LPG/ Kerosene 15%
Industry 15% - 20%
Feedstock 15 %
Table 1.6
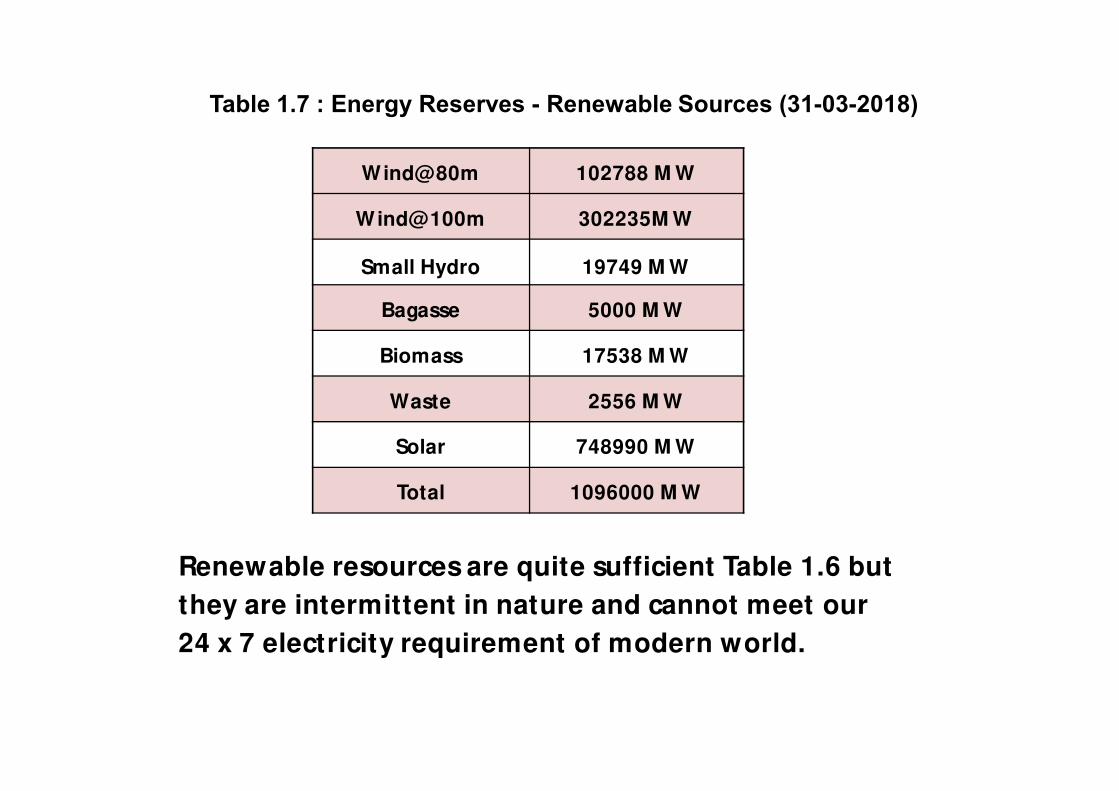
Table 1.7 : Energy Reserves - Renewable Sources (31-03-2018)
Wind@80m 102788 M W
Wind@100m 302235M W
Small Hydro 19749 M W
Bagasse 5000 M W
Biomass 17538 M W
Waste 2556 M W
Solar 748990 M W
Total 1096000 M W
Renewable resources are quite sufficient Table 1.6 but
they are intermittent in nature and cannot meet our
24 x 7 electricity requirement of modern world.

1.4 Comments on Energy scene in India
a) Energy demand of all forms of energy is increasing due
to increased
populat ion and improving standard of living.
b) 25% of populat ion is st ill dependent on firewood, wood
etc for energy. Decreasing poverty and improved
standard of living will lead to further increased demand
of energy
c) Coal remains major energy source in India and likely to
be so in near future.
d) 80% of oil and 30% of gas is imported. This leads to
serious problem in foreign exchange. This import
dependency is likely to increase in near future. It affects
Energy Security.
e) India has made good progress in solar and wind
and this progress is going to increase. They are
intermittent in nature and do no meet 24 x 7
modern requirement.
f) All convent ional forms of energy lead to increase
of pollut ion and Global Warming.
g) To reduce demand of imported fuel and meet
challenge of Global Warming.
Energy Efficiency and Renewable Energy are two solutions. International Energy Agency calls Energy Efficiency First Fuel
Comments on Energy scene in India
1.5 Direct and Indirect Uses of Energy
1. Elect ricity, LPG, Diesel, Pet rol, Coal Are Direct Uses of
Energy
2. We Use Lot Of M aterials, Take Food, Wear Clothes. All
these Act ivit ies consume lot of Energy. Const ruct ion of
Buildings also use Energy
Energy Conservat ion M eans Reducing Both Direct and Indirect
Uses Of Energy
6
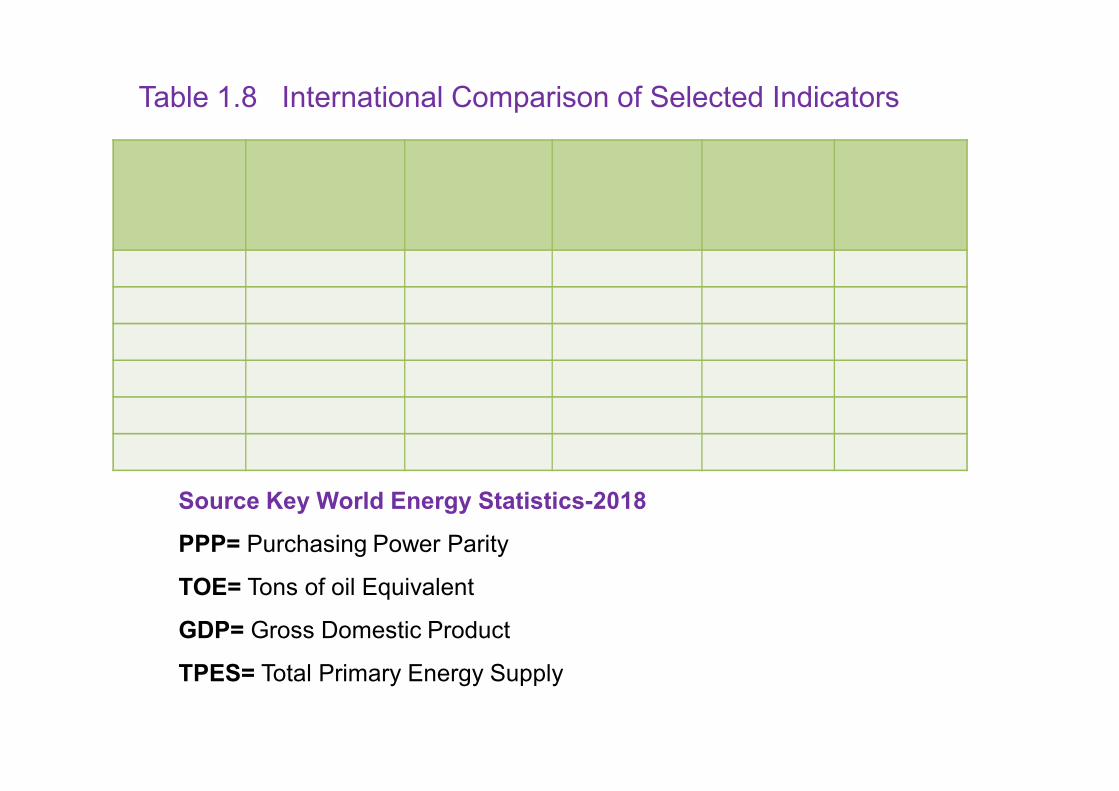
Populat ion
M illion
GDP Billion
US Dollar
GDP (PPP)
Billion US
Dollars
GDP/ Capit
a Dollars
GDP/ Capit
a Dollar
PPP
World 7429 77362 109231 10410 14700
China 1386 9775 19841 7050 14310
Germany 82.3 3781.7 3553.6 45950 43170
India 1324.2 2464.9 7904.5 1860 5960
UK 85.6 2757.5 2543 32210 29700
USA 323.4 16920 16920 52310 52310
Table 1.8 International Comparison of Selected Indicators
Source Key World Energy Statistics-2018
PPP= Purchasing Power Parity
TOE= Tons of oil Equivalent
GDP= Gross Domestic Product
TPES= Total Primary Energy Supply
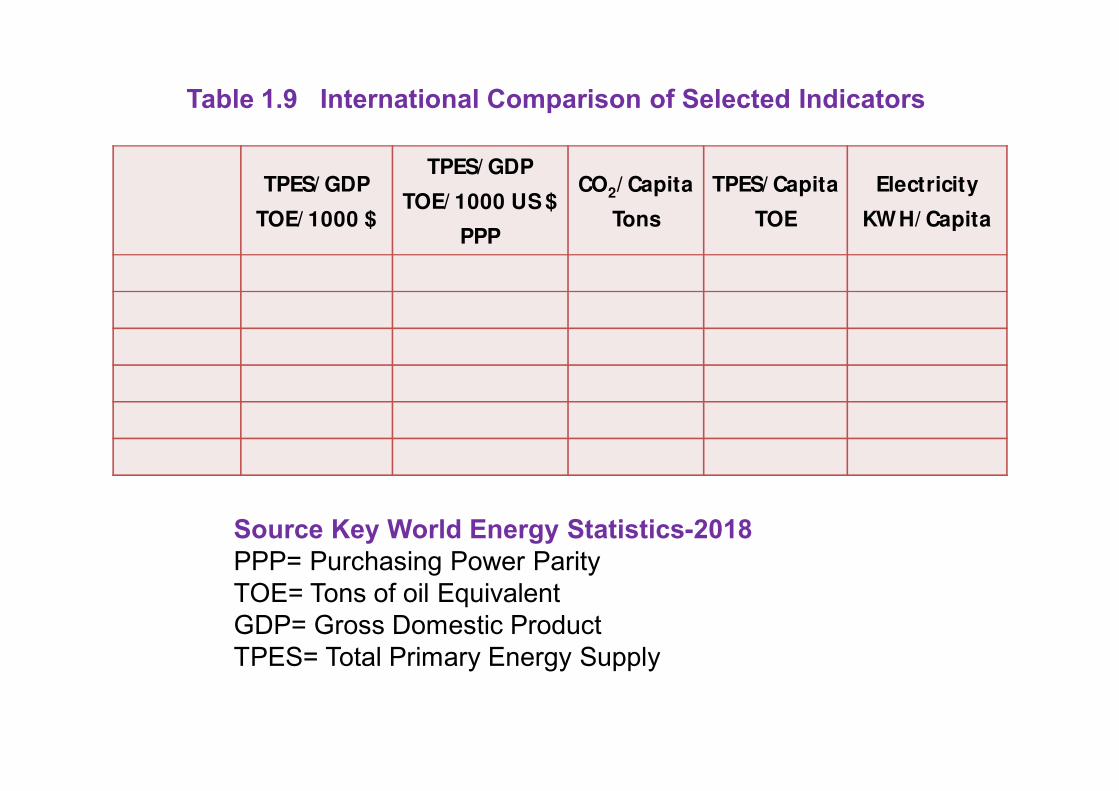
TPES/ GDP
TOE/ 1000 $
TPES/ GDP
TOE/ 1000 US $
PPP
CO2/ Capita
Tons
TPES/ Capita
TOE
Electricity
KWH/ Capita
World 0.18 0.13 4.35 1.85 3110
China 0.3 0.15 6.57 2.14 4290
Germany 0.08 0.09 8.88 3.77 6956
India 0.35 0.11 1.57 0.65 918
UK 0.06 0.07 5.65 2.73 5033
USA 0.13 0.13 14.95 6.70 12825
Source Key World Energy Statistics-2018
PPP= Purchasing Power Parity
TOE= Tons of oil Equivalent
GDP= Gross Domestic Product
TPES= Total Primary Energy Supply
Table 1.9 International Comparison of Selected Indicators
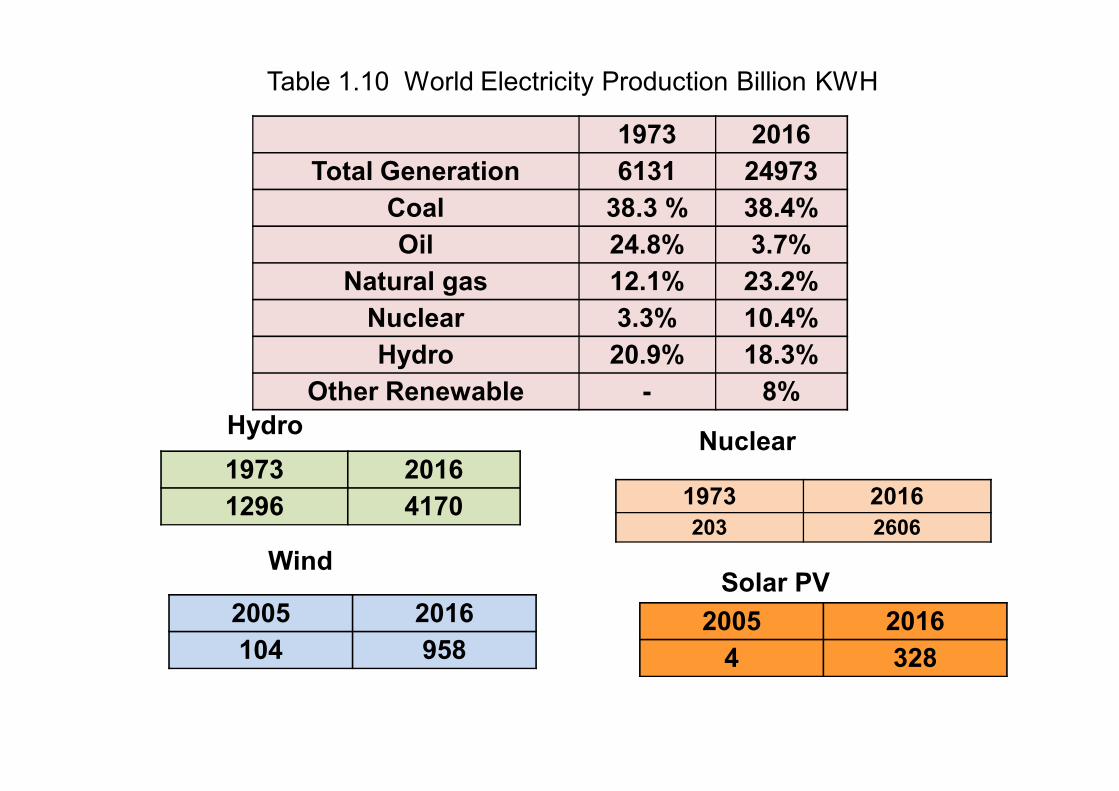
Table 1.10 World Electricity Production Billion KWH
1973 2016
Total Generation 6131 24973
Coal 38.3 % 38.4%
Oil 24.8% 3.7%
Natural gas 12.1% 23.2%
Nuclear 3.3% 10.4%
Hydro 20.9% 18.3%
Other Renewable - 8%
1973 2016
1296 4170
Hydro
1973 2016
203 2606
Nuclear
2005 2016
104 958
WindSolar PV
2005 2016
4 328

• India’s primary energy consumpt ion,
Elect ricity consumpt ion and per capita CO2
emission are significant ly lower than world
average. For good quality of life and significant
reduct ion in poverty per capita energy
consumpt ion as well as elect ricity consumpt ion
in India has to reach around 2000. Significant
increase in Energy product ion and uses are
required. Energy efficiency also has to be
improved.

• China’s energy consumpt ion, Elect ricity
consumpt ion and per capita CO2
emission are
at world average levels. This also shows very
low level of poverty in China.
• Primary energy consumpt ion, Elect ricity
consumpt ion and per capita CO2emission in
USA are very high and not sustainable.

India has set up ambit ious target for Renewable Energy –
175 GW
• Similarly Energy Efficiency target has to be set up to 50
GW in next 5 years
• Agencies like BEE and PCRA have to be significant ly
st rengthened in terms of man power, financial and
technological resources.
• This will help count ry in energy security as well as
climate change
Concluding Remarks:

38
• No new technologies are required for energy efficiency.
Exist ing technologies have to be taken to all consumers.
• India’s energy product ion and consumpt ion has to rise
significant ly while pursuing energy efficiency so that
every Indian has reasonable standard of living. American
consumpt ion of energy and other resources are not
sustainable.
• Solar energy prices, LED prices have dropped sharply
due to large scale procurement. Similar efforts are
required for elect ric motors, solar cookers, energy
efficient cook stoves.

Publications:
• Energy Statistics - 2017, Central Statistics Office, Govt. of India.
www.mospi.gov.in
• Key World Energy Statistics - 2018, International Energy Agency,
Paris – France. www.iea.org

HUM AN DEVELOPM ENT INDEX
RANK COUNTRY HDI KWH / CAPITA
4 USA 0.910 12884
9 GERM ANY 0.905 6781
12 JAPAN 0.901 7833
66 RUSSIA 0.755 -----
101 CHINA 0.687 2631
134 INDIA 0.547 597
GLOBAL HDI IS 0.682
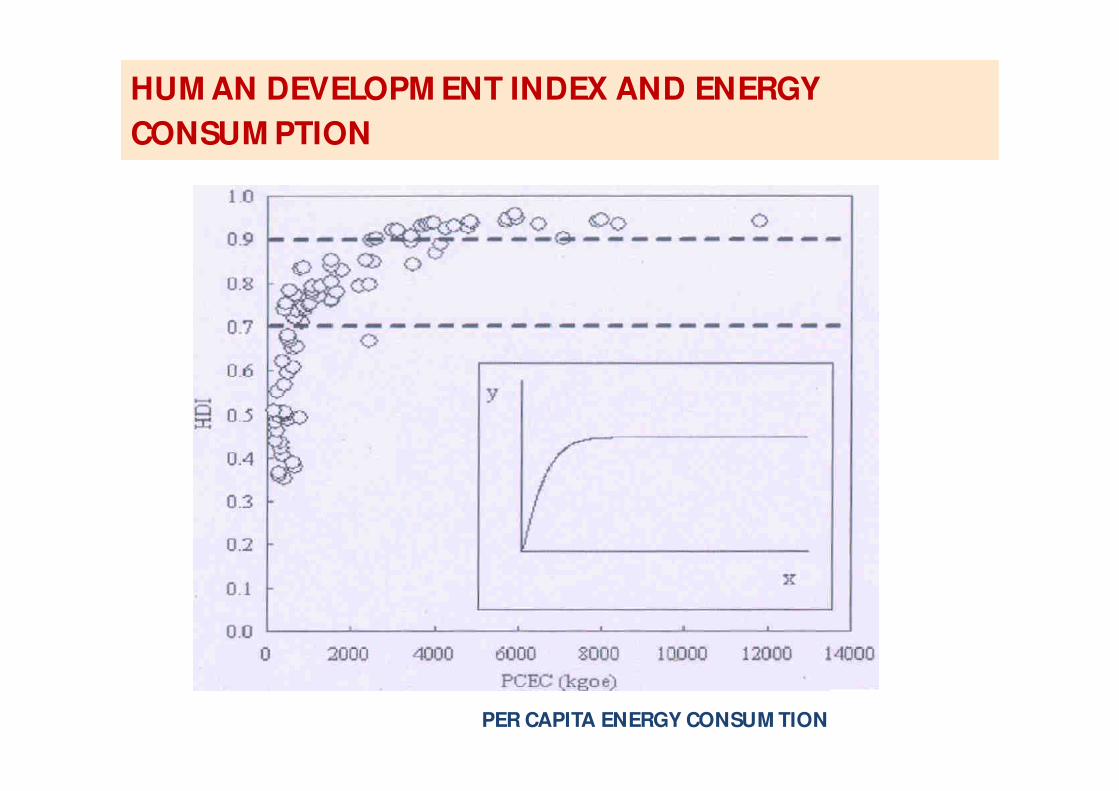
HUM AN DEVELOPM ENT INDEX AND ENERGY
CONSUM PTION
PER CAPITA ENERGY CONSUM TION
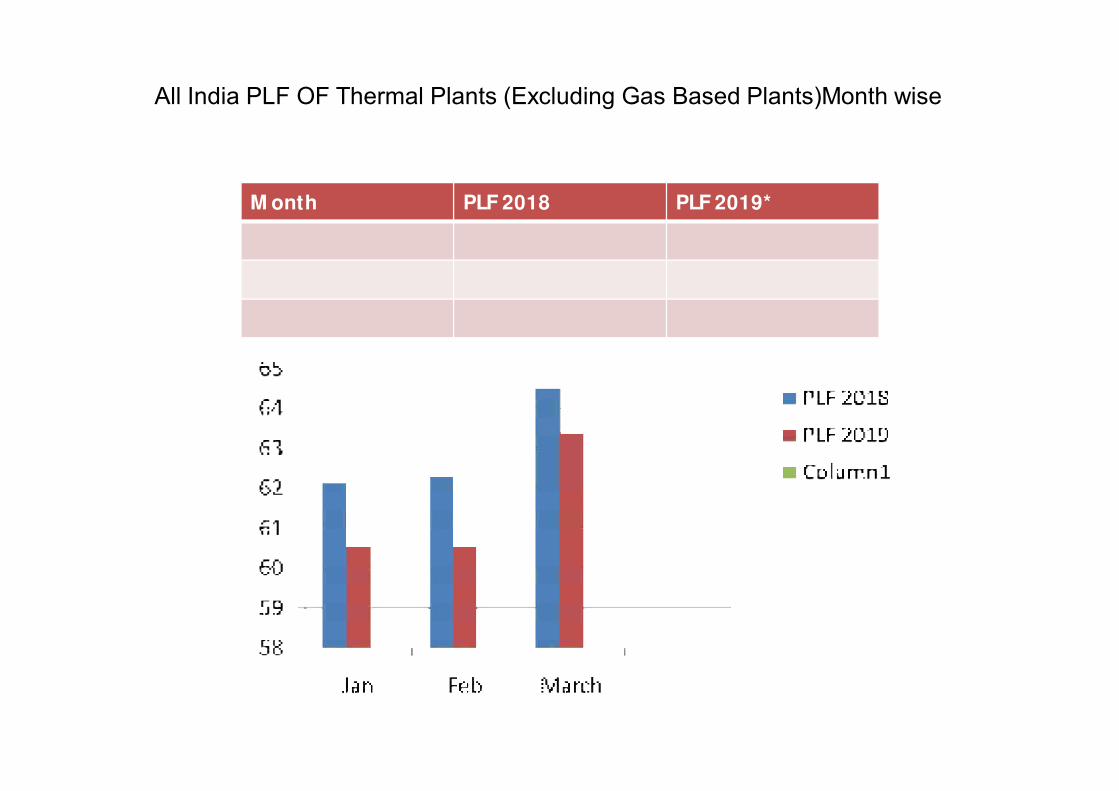
All India PLF OF Thermal Plants (Excluding Gas Based Plants)Month wise
M onth PLF 2018 PLF 2019*
Jan 62.15 60.54
Feb 62.30 60.51
M arch 64.52 63.40
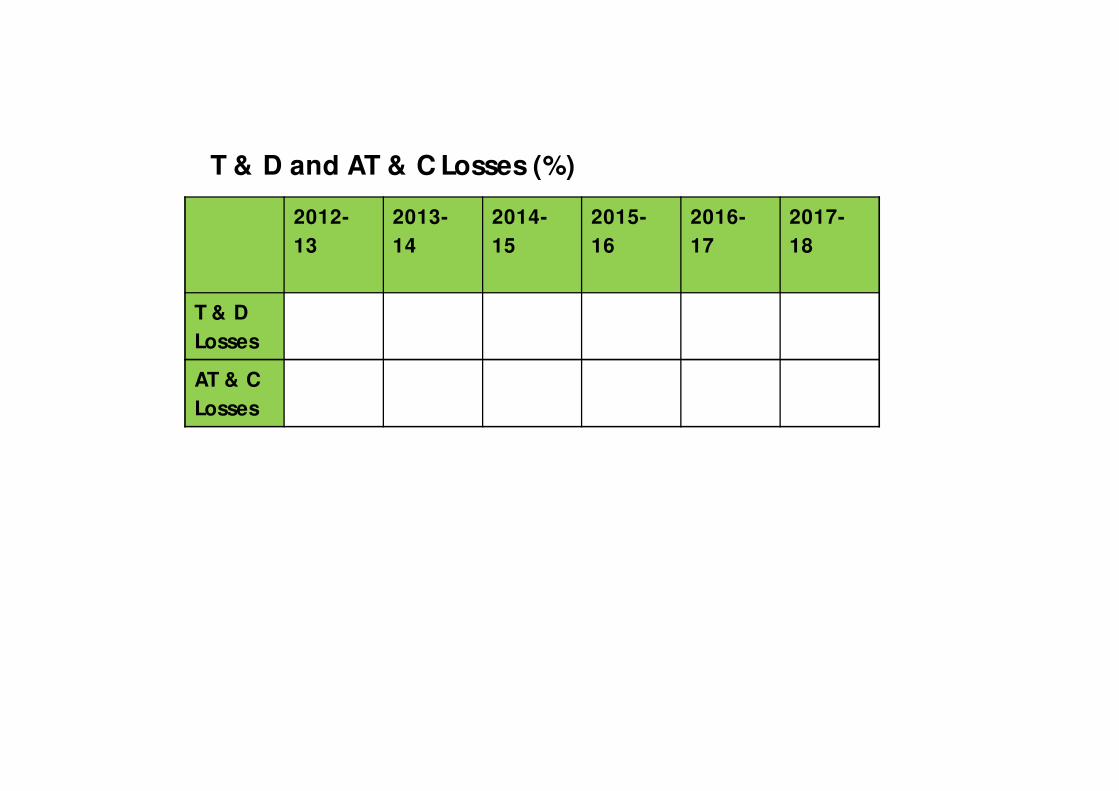
T & D and AT & C Losses (%)
2012-
13
2013-
14
2014-
15
2015-
16
2016-
17
2017-
18
T & D
Losses
23.04 22.84 22.77 21.81 21.42 21.15
AT & C
Losses
25.48 22.58 24.62 24
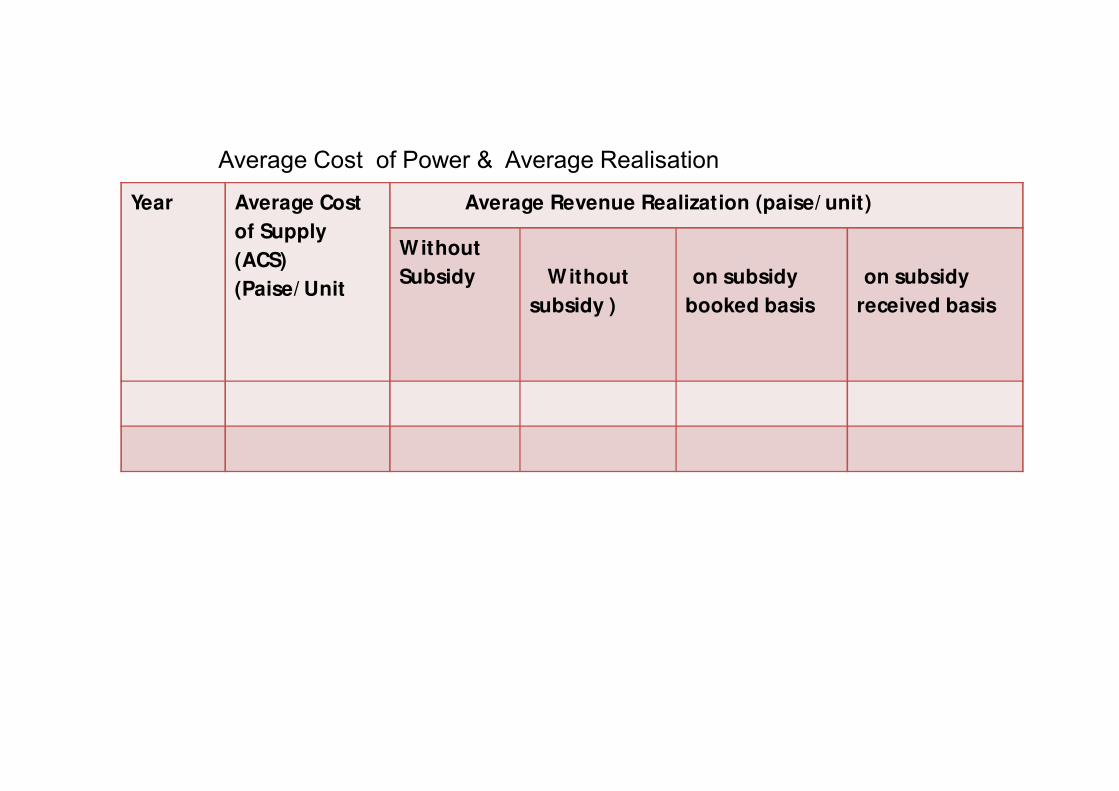
Average Cost of Power & Average Realisation
Year Average Cost
of Supply
(ACS)
(Paise/ Unit
Average Revenue Realization (paise/ unit)
Without
Subsidy
Gap ACS-ARR
( Without
subsidy )
Paise/ Unit
Gap ACS-ARR
(on subsidy
booked basis )
Paise/ Unit
Gap ACS-ARR
(on subsidy
received basis )
Paise/ Unit
2013-14 518 400 118 76 77
2014-15 520 412 108 58 60

CH AP T E R -2
E NE R GY CONS E R VAT ION
45
WHY SAVE ELECRICITY
• 80% GENERATION
THERM AL
• EFFICIENCY - 30%
• 1 KWH - 3 UNIT
CAOL/ GAS/ OIL
• T&D LOSSES - 30% -
40%
• 1 KWH USER - 4 TO 5
UNIT COAL / GAS/ OIL
• CAPITAL COSTS
• Rs.4 TO 5 CRORE/ M W
• Rs.40000 TO 50000/ KW
• ADD T&D
• Rs.60000 TO 70000/ KW
46

47
• POWER STATION LEAD TIM E 5 TO 10YRS
• NO STORAGE OF ELECRTICITY
• 1KWH LEADS TO 1KG OF CO2
• ENVIRONM ENTAL POLLUTION VERY IM PORTANT
ENERGYCONSERVATION PROJECT
• LEAD TIM E - 6 M ONTHS TO 1YR
• COSTS - RS.2000 TO 10000/ KW
• SAVES ENVIRONM ENTAL POLLUTION
• REDUCE, REUSE, RECYCLE
48

WHY SAVE ELECTRICITY
AN EXAM PLE : Replacement of Bulbs by CFL/ LED
• 10 * 100WATTS BULB COSTS Rs. 100 LOAD = 1000
WATTS
• 10 * 20 WATTS CFL / LED COST Rs. 1000 LOAD = 200
WATTS
• AN EXTRA INVESTM ENT OF Rs. (1000-100) Rs.900
LEADS TO SAVING OF (1000-200) 800 WATTS. THIS IS
EQUAL TO Rs. 1125 PER KW
• COM PARE THIS TO Rs. 60,000 TO Rs. 70,000 KW FOR
GENERATION
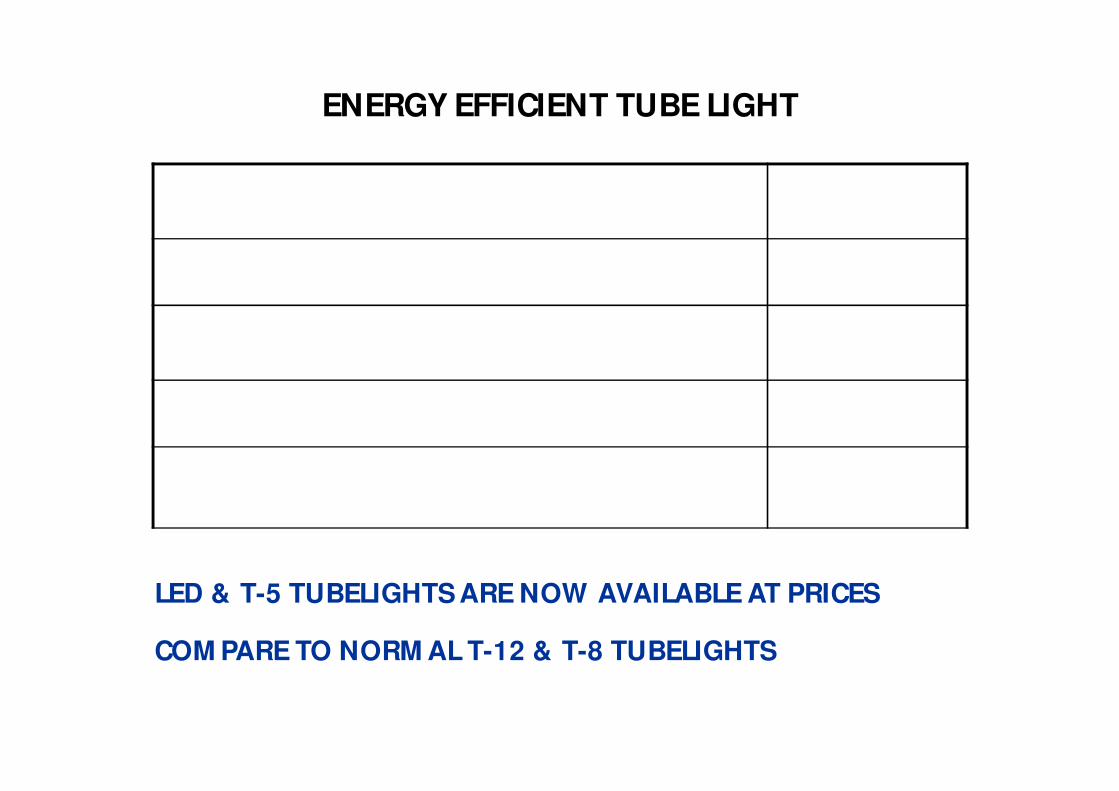
ENERGY EFFICIENT TUBE LIGHT
POWER CONSUM PTION OF T-5 WITH ELECTRONIC
BALLAST
30 WATTS
POWER CONSUM PTION OF LED TUBELIGHT 20 WATTS
POWER CONSUM PTION NORM AL TUBELIGHT &
BALLAST. (T-12, T-8 )
50/ 40 WATTS
POWER SAVING 20 WATTS
FOR 2000 HRS/ANNUM RUNNINGS UNIT SAVED= 20 *
2000 / 1000
= 40 KWh
= Rs.200
LED & T-5 TUBELIGHTS ARE NOW AVAILABLE AT PRICES
COM PARE TO NORM AL T-12 & T-8 TUBELIGHTS
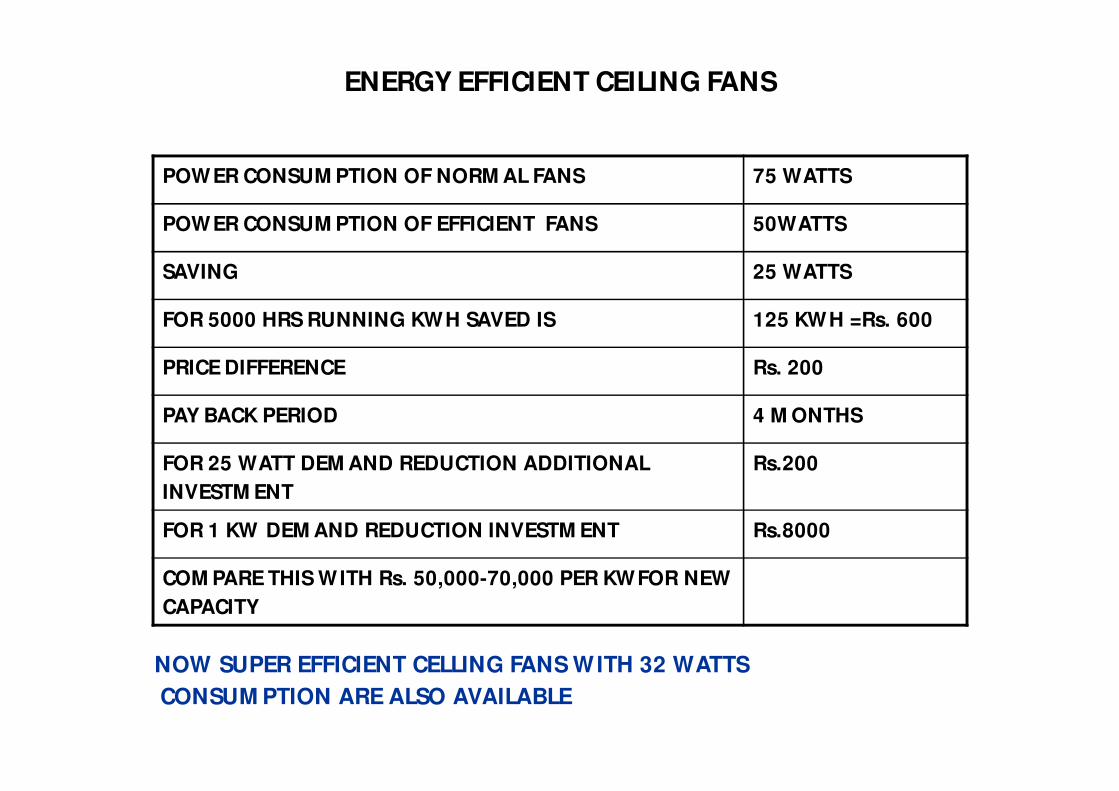
ENERGY EFFICIENT CEILING FANS
POWER CONSUM PTION OF NORM AL FANS 75 WATTS
POWER CONSUM PTION OF EFFICIENT FANS 50WATTS
SAVING 25 WATTS
FOR 5000 HRS RUNNING KWH SAVED IS 125 KWH =Rs. 600
PRICE DIFFERENCE Rs. 200
PAY BACK PERIOD 4 M ONTHS
FOR 25 WATT DEM AND REDUCTION ADDITIONAL
INVESTM ENT
Rs.200
FOR 1 KW DEM AND REDUCTION INVESTM ENT Rs.8000
COM PARE THIS WITH Rs. 50,000-70,000 PER KWFOR NEW
CAPACITY
NOW SUPER EFFICIENT CELLING FANS WITH 32 WATTS
CONSUM PTION ARE ALSO AVAILABLE
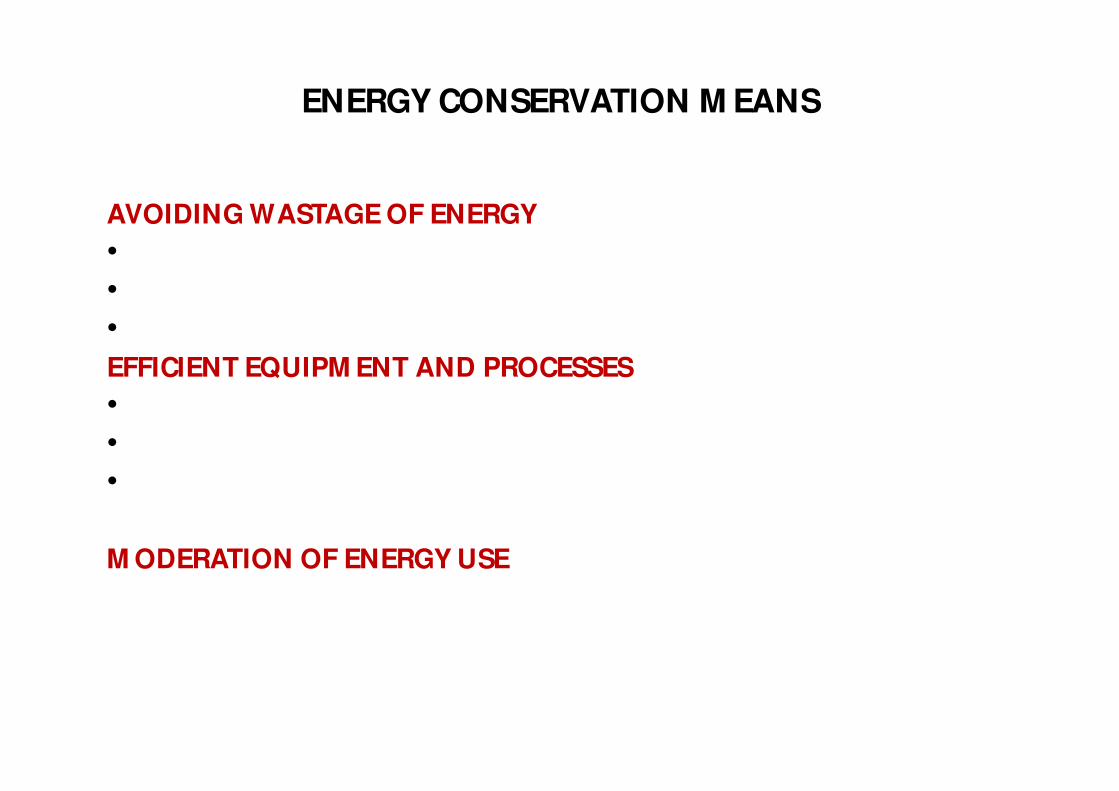
ENERGY CONSERVATION M EANS
AVOIDING WASTAGE OF ENERGY
• SWITCHING OFF IDLE LIGHTS,FANS
• SWITCHING OFF IDLE AND REDUNDANT EQUIPM ENT
• REDUCING WATER ,STEAM ,COM PRESSED AIR LEAKEAGES
EFFICIENT EQUIPM ENT AND PROCESSES
• HIGH EFFICIENCY PUM PS,FANS,M OTORS,LIGHTS
• EFFICIENT OPERATION AND M AINTENANCE
• CLEANING OF EQUIPM ENTS,WATER TREATM ENT
ETC.
M ODERATION OF ENERGY USE
52

M ODERATION OF ENERGY USE• USE COM PRESSIORS , FANS, PUM PS WITH M INIM UM
PRESSURE, TEM PERATURE, FLOW
• USE OF PROPER SIZE EQUIPM ENTS LIKE M OTORS, PUM PS,
REFRIGERATOR, T.V.SETS, VEHICLES. AVOID OVER
SIZING OF EQUIPM ENTS
• 400 LIT. HIGH EFFICIENCY FRIDGE WILL CONSUM E M ORE
ENERGY THAN 165 LIT. M ODEL
• 42 INCH T.V. WILL CONSUM E 4 TIM ES M ORE POWER THAN
21 INCH T.V.
• FAN POWER 50 WATTS
• AIRCOOLER 200 WATTS
• AIRCONDITIONER 1500 WATTS
• CYCLING/ WALKING IN PLACE OF 2/ 4 WHEELERS
TELEPHONE ,E-M AIL IN PLACE OF TRAVEL
53

ENERGY CONSERVATION
• REDUCES COST - SAVES M ONEY
• SAVES FUELS, NATURAL RESOURCES
• SAVES ENVIRONM ENTAL POLLUTION
• SAVES TIM E
• PROVIDES ENERGY SECURITY
54

DIRECT AND INDIRECT USES OF ENERGY
1. ELECTRICITY, LPG, DIESEL, PETROL, COAL ARE DIRECT USES
OF ENERGY
2. WE USE LOT OF M ATERIALS, TAKE FOOD, WEAR CLOTHES.
ALL THESE ACTIVITIES CONSUM E LOT OF ENERGY.
CONSTRUCTION OF BUILDINGS ALSO USE ENERGY
ENERGY CONSERVATION M EANS REDUCING
BOTH DIRECTAND INDIRECT USES OF ENERGY

CARBON EM ISSIONS
FUEL KG CO2 / KWH
COAL 0.9-1.2
OIL 0.75-0.8
GAS (OPEN
CYCLE)
0.58-0.6
COMBINED
CYCLE
0.43
HYDRO, WIND,
SOLAR,
NUCLEAR
NEGLIGIBLE
56
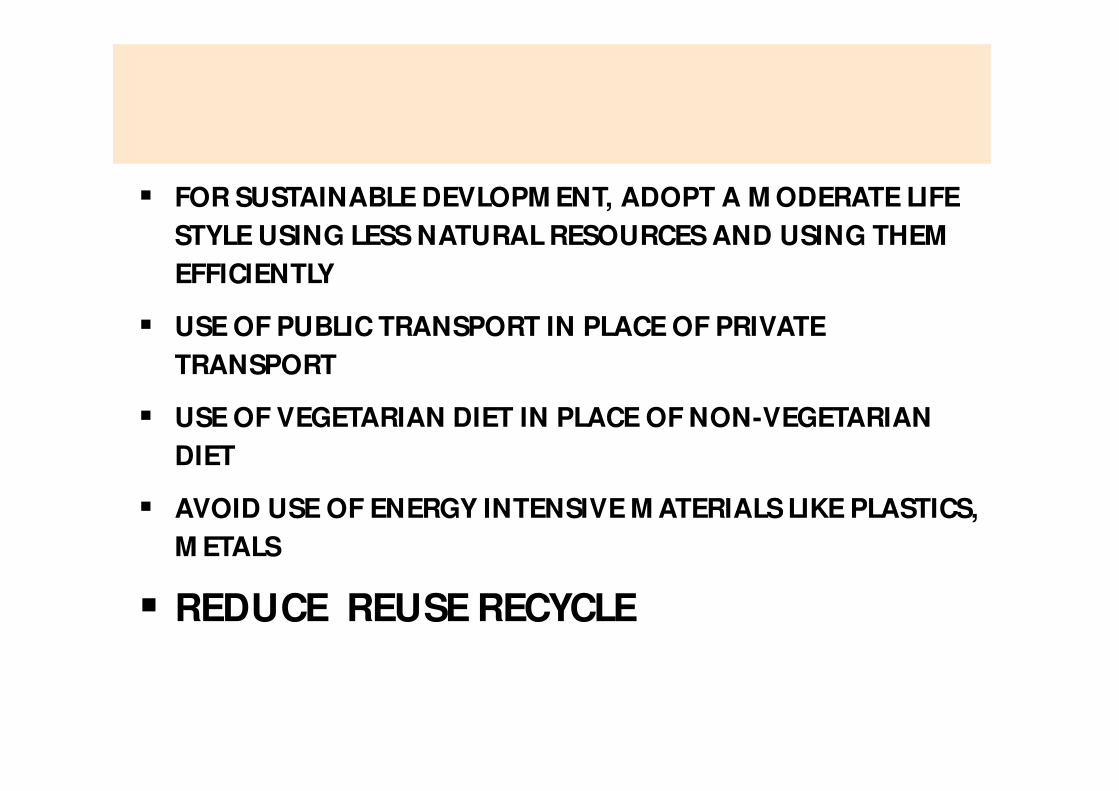
SUSTAINABLE DEVELOPM ENT
FOR SUSTAINABLE DEVLOPM ENT, ADOPT A M ODERATE LIFE
STYLE USING LESS NATURAL RESOURCES AND USING THEM
EFFICIENTLY
USE OF PUBLIC TRANSPORT IN PLACE OF PRIVATE
TRANSPORT
USE OF VEGETARIAN DIET IN PLACE OF NON-VEGETARIAN
DIET
AVOID USE OF ENERGY INTENSIVE M ATERIALS LIKE PLASTICS,
M ETALS
REDUCE REUSE RECYCLE
57

GLOBAL WARM ING
• PER CAPITA ELECTRICITY CONSUM PTION
< 600 KWH/ ANNUM IN POOR COUNTRIES
2800 KWH/ ANNUM WORLD AVERAGE
> 10,000 KWH/ ANNUM IN RICH COUNTRIES
FOR CONTAINING GLOBAL WARM ING RICH COUNTRIES HAVE
TO REDUCE THEIR ENERGY CONSUM PTION.
POOR COUNTRIES HAVE TO INCREASE THEIR CONSUM PTION
TO ELIM INATE POVERTY AND IM PROVE LIVING STANDARDS
58
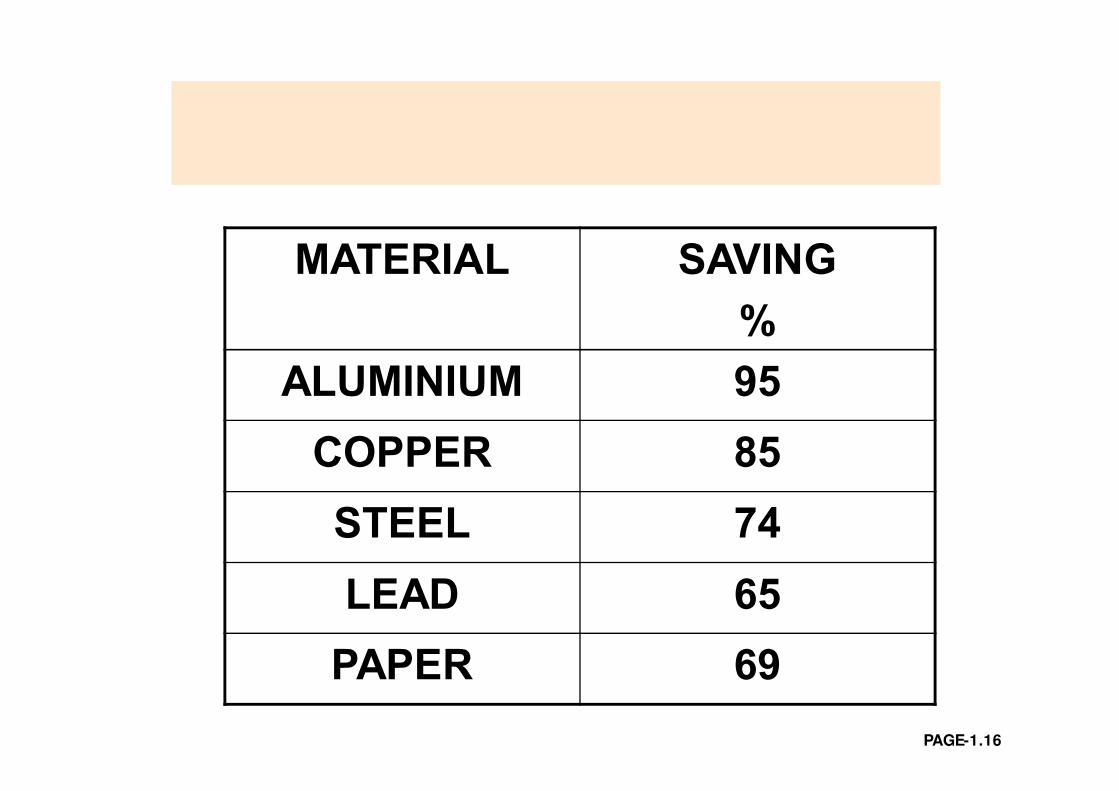
ENERGY SAVING BY RECYCLED M ATERIALS
PAGE-1.16
MATERIAL SAVING
%
ALUMINIUM 95
COPPER 85
STEEL 74
LEAD 65
PAPER 69

Efficient Use Of M aterials
• Product ion of materials like steel, Cement ,
Copper consume nearly 40% of total Energy
Consumpt ion. This can be reduced
significant ly by
1) improving recycling rates
2) Reducing M aterial use by design
We have to move from a linear economy to a
circular economy.
CH AP T E R -3S YS T E MS AP P R OACH
61

ELECTRICITY IS USED IN INDUSTRY,
COM M ERCE, RESIDENCE TO PROVIDE A
SERVICE LIKE LIGHTING, HEATING, M OTIVE
POWER FOR PUM PS, FANS, COM PRESSORS,
PRODUCTION M ACHINES, REACTORS
FOR LARGE SAVINGS, TOTAL SYSTEM FROM
INPUT ELECTRICITY TO OUTPUT ENDUSE LIKE
WATER, AIR, LIGHT TO BE STUDIED
62
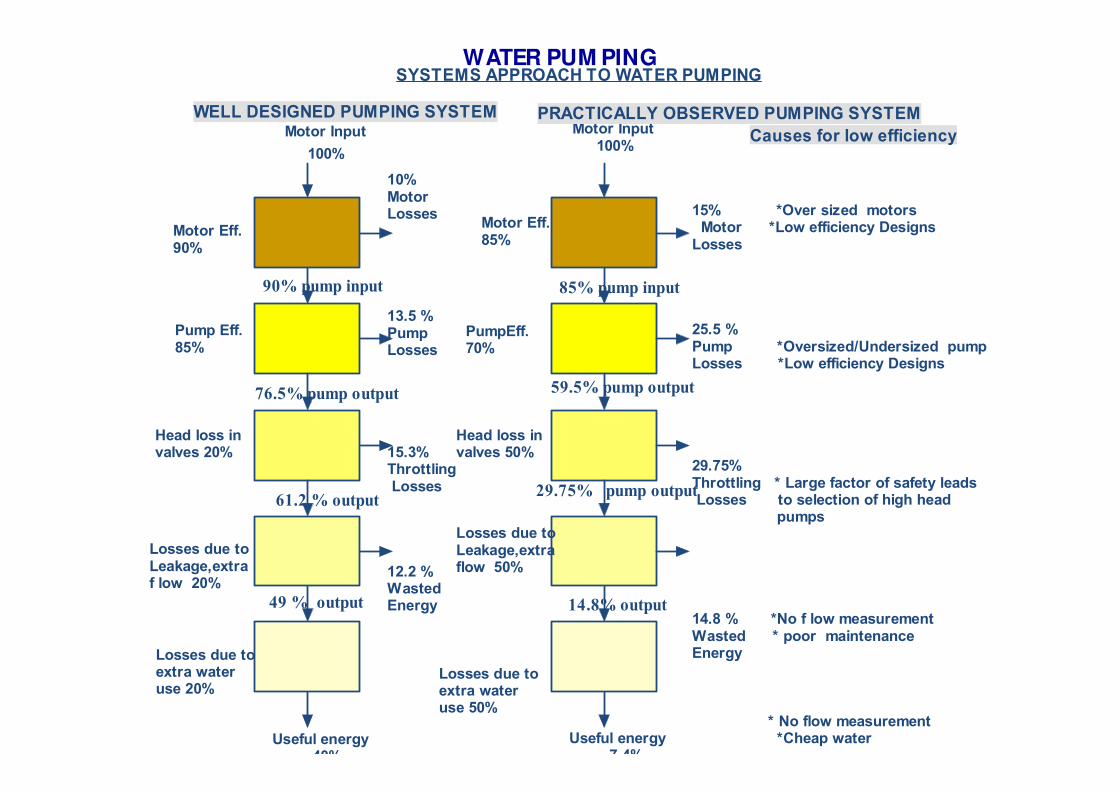
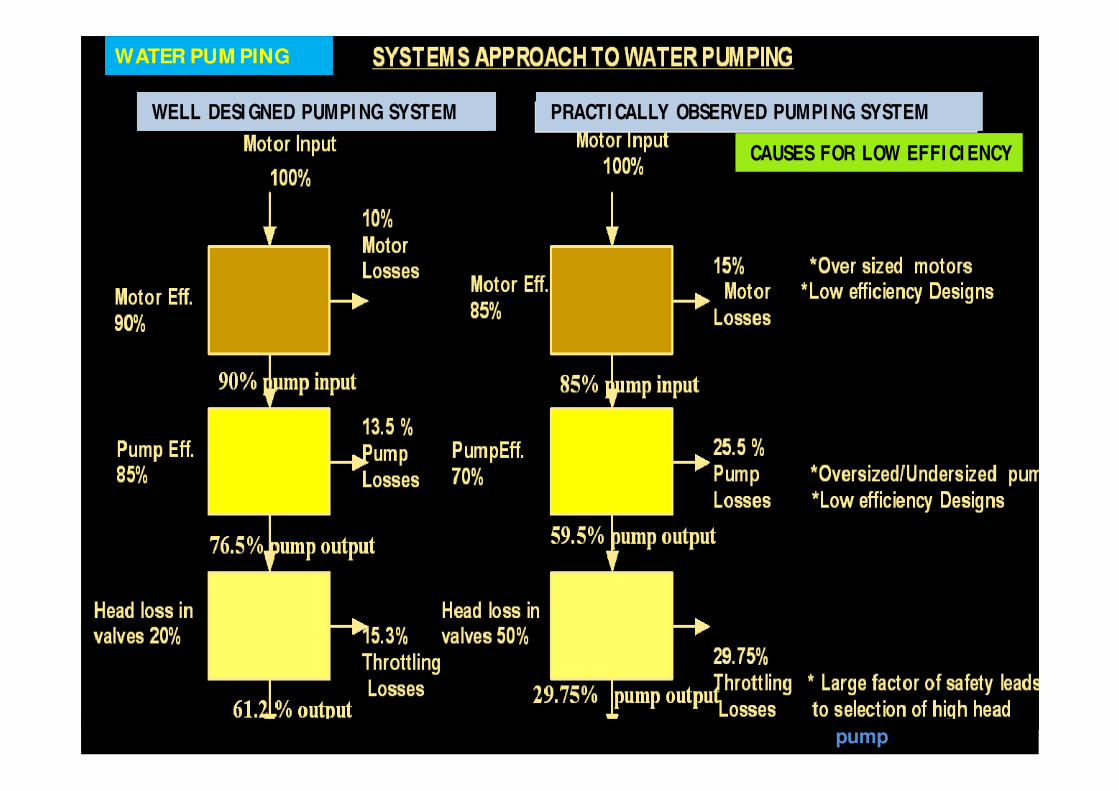
WATER PUM PING
100%
Motor Input
Motor Eff.90%
Pump Eff.85%
Head loss invalves 20%
Losses due toLeakage,extraf low 20%
Losses due toextra wateruse 20%
10%MotorLosses
13.5 %PumpLosses
15.3%Throttling Losses
12.2 %WastedEnergy
Useful energy 40%
100%
Motor Eff.85%
PumpEff.70%
Head loss invalves 50%
Losses due toLeakage,extraflow 50%
Losses due toextra wateruse 50%
Useful energy 7.4%
Motor Input
15% *Over sized motors Motor *Low efficiency DesignsLosses
25.5 %Pump *Oversized/Undersized pumpLosses *Low efficiency Designs
29.75%Throttling * Large factor of safety leads Losses to selection of high head pumps
14.8 % *No f low measurementWasted * poor maintenanceEnergy
* No flow measurement *Cheap water
Causes for low efficiency
85% pump input90% pump input
76.5% pump output 59.5% pump output
61.2 % output29.75% pump output
49 % output 14.8% output
WELL DESIGNED PUMPING SYSTEM PRACTICALLY OBSERVED PUMPING SYSTEM
SYSTEMS APPROACH TO WATER PUMPING
63
64
WELL DESI GNED PUMPI NG SYSTEM PRACTI CALLY OBSERVED PUMPI NG SYSTEM
CAUSES FOR LOW EFFI CI ENCY
WATER PUM PING
pump

WATER PUM PINGSYSTEM S APPROACH TO WATER PUM PING
65
WELL DESI GNED PUMPI NG SYSTEM
PRACTI CALLY OBSERVED PUMPI NG SYSTEM
WELL DESI GNED PUMPI NG SYSTEM PRACTI CALLY OBSERVED PUMPI NG SYSTEM
CAUSES FOR LOW EFFI CI ENCY

SAVING ELECTRICITY IN PUM PING
• M INIM ISE USE OF WATER
• REDUCE PIPE FRICTION LOSS
• AVOID FRICTION LOSS IN THROTTLING
• EFFICIENT PUM P – PROPER SIZE
• EFFICIENT M OTOR – PROPER SIZE
• VARIABLE SPEED DRIVES
66

COM PRESSED AIR
Motor Input =100%
CompressorInput = 90%
Useful energy incompressed air
available as pressure inreceiver = 18%
Useful energy availableat the end use = 12.6%
Mechanical Outputavailable at the
pneumatic tool shaft =4%
Motor Losses10%
*Mechanical Losses*Conversion losses removed bycooling water 80%
Pressure Drop = 10%
Air Leakage = 20%
Pneumatic tool efficiency = 30%
67
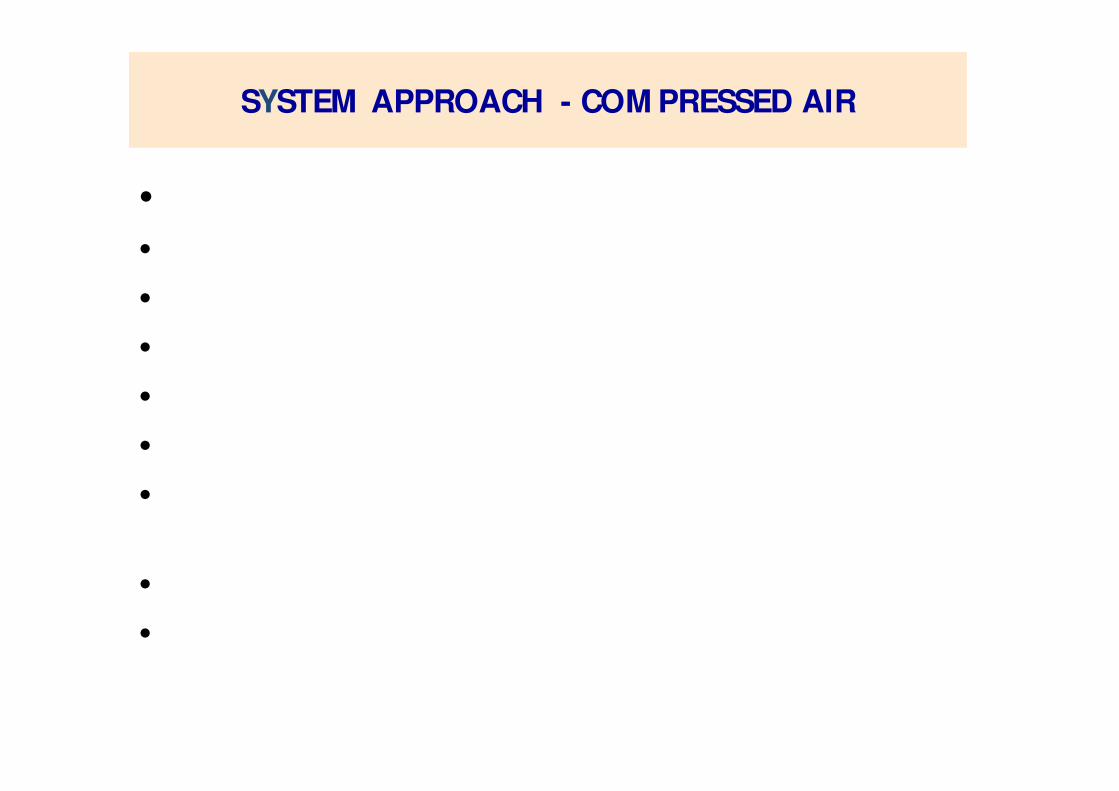
SYSTEM APPROACH - COM PRESSED AIR
• REDUCE COM PRESSED AIR USE
• REDUCE PRESSURE
• REDUCE LEAKAGE
• EFFICIENT COM PRESSOR
• EFFICIENT BELT/ GEAR
• EFFICIENT M OTOR
• Pneumat ic Transport replaced by M echanical
Transport - Cement , Paper ,Dairy Industry
• Pneumat ic Tools replaced by Elect ric Tools
• Saving 60 – 80%
68
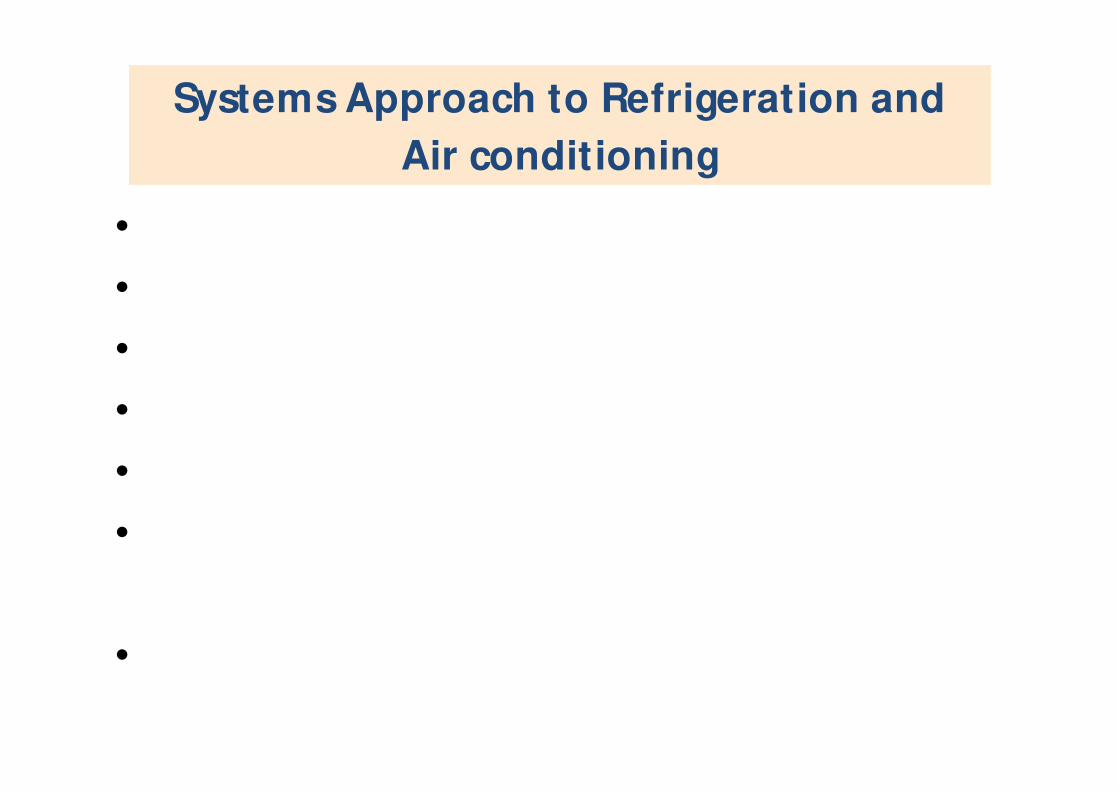
Systems Approach to Refrigeration and
Air conditioning
• Reduce need for Refrigerat ion, Air Condit ioning
• Increase Temperature Sett ing
• Reduce Heat Ingress
• Larger Heat Exchangers
• Energy Storage
• Use of Absorpt ion Chillers (Using Heat For
Refrigerat ion)
• Efficient M otor, Compressor and Drive
Transmission 69

SYSTEM APPROACH - LIGHTING
• EFFICIENT LIGHT SOURCE- CFL, LED, SODIUM
VAPOUR,M ETAL HALIDE
• USE OF DAY LIGHT – GLASS/ PLASTIC SHEETS
• TASK LIGHTING – PROVIDE LIGHT WHERE AND
WHEN REQUIRED
• LIGHTING CONTROL-
SWITCHES,DIM M ERS,OCCUPANCY SENSORS
70
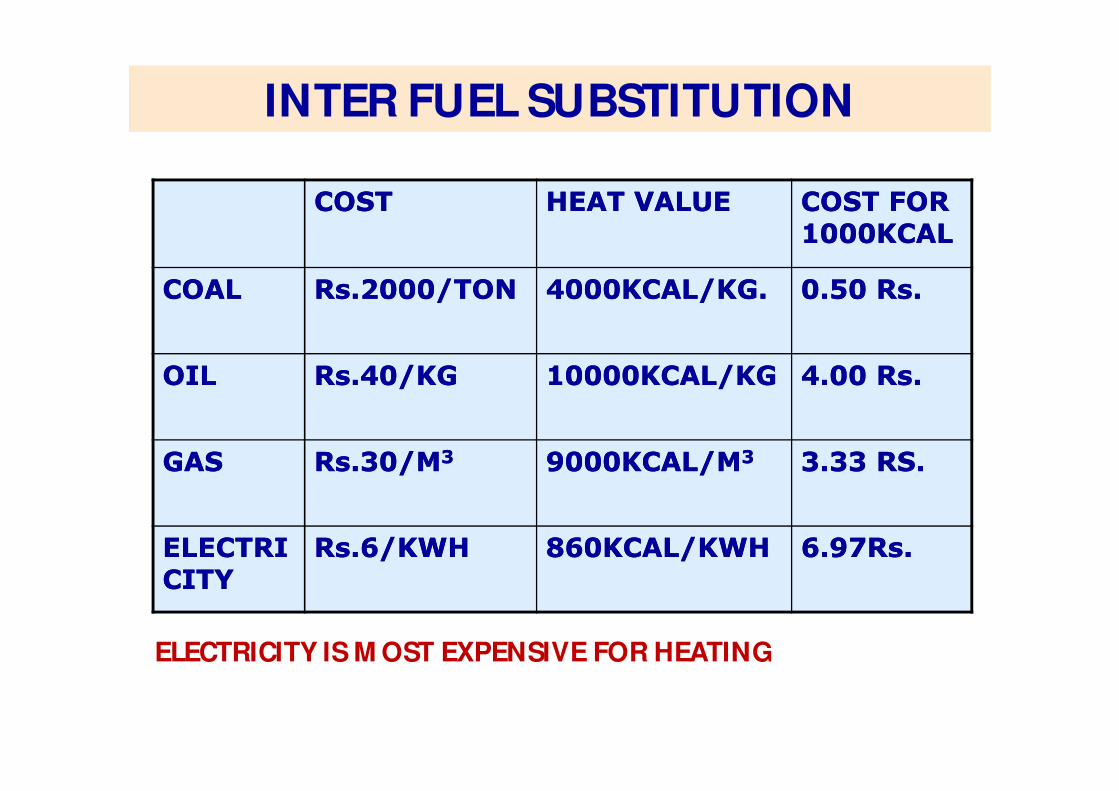
INTER FUEL SUBSTITUTION
COSTCOST HEAT VALUEHEAT VALUE COST FOR COST FOR
1000KCAL1000KCAL
COALCOAL Rs.2000/TONRs.2000/TON 4000KCAL/KG.4000KCAL/KG. 0.50 Rs.0.50 Rs.
OILOIL Rs.40/KGRs.40/KG 10000KCAL/KG10000KCAL/KG 4.00 Rs.4.00 Rs.
GASGAS Rs.30/MRs.30/M33 9000KCAL/M9000KCAL/M33 3.33 RS.3.33 RS.
ELECTRIELECTRI
CITYCITY
Rs.6/KWHRs.6/KWH 860KCAL/KWH860KCAL/KWH 6.97Rs.6.97Rs.
ELECTRICITY IS M OST EXPENSIVE FOR HEATING
CH AP T E R – 4E NE R GY AU DIT
72

ENERGY AUDIT
• ENERGY ACCOUNTING
• M ONITORING AND CONTROL
• REDUCTION OF LOSSES
• IM PROVEM ENT IN OPERATION AND
M AINTENANCE
• EFFICIENT EQUPIM ENTS AND PROCESSES
• CHOICE OF ALTARNATIVE FUELS
73

ENERGY ACCOUNTING
M ONITORING AND CONTROL
• ENERGY ACCOUNTING M EANS TRACKING ENERGY INPUTS AND
THROUGHPUTS. IT CAN BE M ADE AS DETAILED AS REQUIRED.
ELECTRICAL ENERGY CONSUM PTION OF EACH M AJOR EQUIPM ENTS
LIKE PUM PS ,COM PRESSORS,FURNACES CAN EASILY BE M ESURED
BY PUTTING SUBM ETERS.
• M ORE SOPHISTICATED SYSTEM S CAN USE TRANSDUCERS AT EACH
EQUIPM ENT AND M ONITORING FROM A CENTRAL COM PUTER
74
ENERGY AUDIT
• ENERGY AUDIT CRITICALLY LOOKS AT ALL
ENERGY USE IN A PLANT TO IM PROVE
OPERATIONAL EFFICIENCY.
• ENERGY AUDIT SYSTEM ATICALLY LOOKS AT
ENERGY INPUT,ENERGY CONVERSION AND
END USES.
75
ENERGY ACCOUNTING
M ONITORING AND CONTROL
• M ORE IM PORTANT AND SOM EWHAT DIFFICULT BUT
NECESSARY TASK IS TO M EASURE M ACHINE TROUGHPUT IN
TERM S OF PRODUCTION OR OUTPUT.
• EACH PLANT CAN BE DIVIDED INTO TWO BROAD
CATEGORIES.
• PRODUCTION M ACHINES LIKE M ACHINE TOOLS,
REACTORS,FURNACES. HERE PRODUCTION OUTPUTS ARE
NORM ALLY M EASURED CONTINUOUSLY OR ON SHIFT BASIS.
• UTILITY EQUIPM ENTS LIKE PUM PS COM PRESSED AIR ALSO
HAVE TO HAVE OUTPUT M EASURM ENTS LIKE FLOWS
PRESSURES ETC.
76

M EASURM ENT OF FLOWS, TEM PERATUERS AND
PRESSURES ARE ESSENTIAL IN UTILITY SYSTEM S
• INSTALLATION OF SUITABLE FLOWM ETERS,
TEM PERATURE SENSORS, PRESSURE GAUGES ARE
ESSENTIAL.
• COOLING TOWER FLOWS, CHILLED WATER FLOWS,
COM PRESSED AIR FLOW AND PRESSURE
M EASUREM ENT ARE ESSENTIAL.
• TODAY SUITABLE TRANSDUCERS AND DIGITAL
SYSTEM SM AKE THISSOM E WHAT EASIER.
77

ENERGY INDEX
• IT IS NECESSARY TO DEVELOPE AN ENERGY INDEX LIKE
KWH/ TON, KWH/ M ETER OF PRODUCTION. IT IS ALSO
NECESSARY TO DEVLOPE INDEX FOR UTILITIES LIKE
KW/ 100 CFM FOR COM PRESSED AIR KW/ TON FOR
REFRIGERATION KW/ M 3 FOR FLOW
• THESE ARE TO BE COM PARED WITH THE AVAILABLE
NATIONAL AND INTERNATIONAL INDICES FOR PRODUCTS
AND EQUIPM ENTS KEEPING PRODUCTION AND PROCESS
IN VIEW
78

M ONITORING AND CONTROL
• M ONITORING OF ENERGY ACCOUNTS ON A SHIFT
DAILY,WEEKLY,M ONTHLY BASIS IM M EDIATELY GIVES AN INDICATION
OF PLANT ENERGY EFFICIENCY
• PRODUCTION HAS DROPPED BUT ENERGY USE IS NOT DROPPING.
IT M EANSUTILITIESARE NOT USED PROPERLY
• COM PRESSORS, PUM PS, FURNACES CAN BE SWITCHED OFF WHEN
NOT REQUIRED. USE ALL EQUIPM ENT AT FULL CAPACITIES. ONE
EQUIPM ENT AT FULL LOAD IS TO BE PREFERED TO TWO
EQUIPM ENT AT HALF LOAD
• M ONITORING ITSELF CAN BE GIVE 2% TO 5% ENRGY SAVING
79
REDUCTION OF LOSSES
• ALL ELECTRIC EQUIPM ENTS HAVE HIGH
EFFICIENCIES,RANGING FROM 99.9% FOR
CIRCUIT BREAKERS TO 85% TO 90% FOR
M OTORS.
• TOTAL DISTRIBUTION LOSSES, INCLUDING
TRANSFORM ER AND CABLE LOSSES IN A
PLANT WILL BE IN RANGE OF 2% TO 4%.
80

M AJOR LOSSES
• M AJOR LOSSES ARE IN COM PRESSED AIR LEAKAGE(10% TO
50%) WATER AND STEAM LEAKAGE HEAT LOSS THROUGH
RADIATION, HEAT INGRESS IN REFRIGERATION AND
AIRCONDITINED SPACES. THESE HAVE TO BE M INIM ISED
COMPRESSED AIR LEAKAGE 7BAR(100PSIG)COMPRESSED AIR LEAKAGE 7BAR(100PSIG)
HOLE DIA.HOLE DIA. AIR LEAKAGEAIR LEAKAGE KW LOSSKW LOSS COST OF LOSS/YRCOST OF LOSS/YR
8000HRS.,Rs.7/KWH8000HRS.,Rs.7/KWH
1/32”1/32” 1.62CFM1.62CFM 0.2750.275 15,40015,400
1/8”1/8” 26 CFM26 CFM 4.424.42 2,47,5202,47,520
1/4”1/4” 104 CFM104 CFM 17.6817.68 9,90,0809,90,080
81
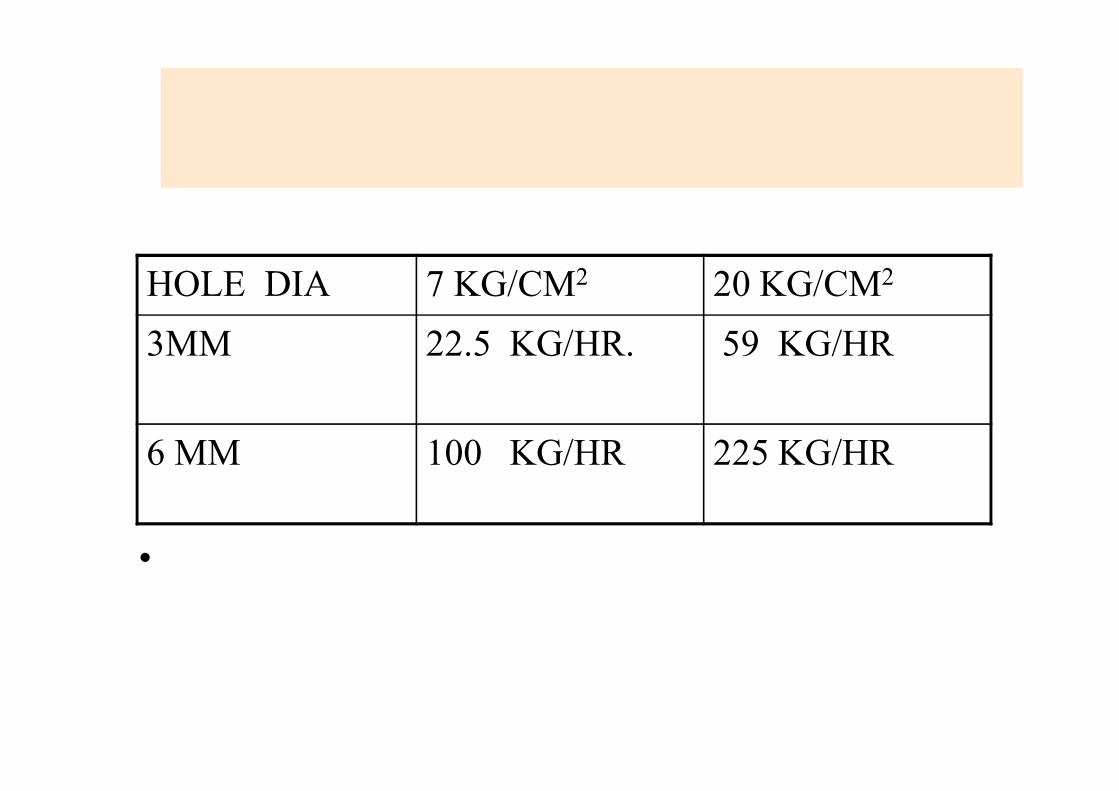
STEAM LEAKS
HOLE DIA 7 KG/CM2 20 KG/CM2
3MM 22.5 KG/HR. 59 KG/HR
6 MM 100 KG/HR 225 KG/HR
• STEAM LEAKAGE PREVENTION IS M OST IM PORTANT.
82
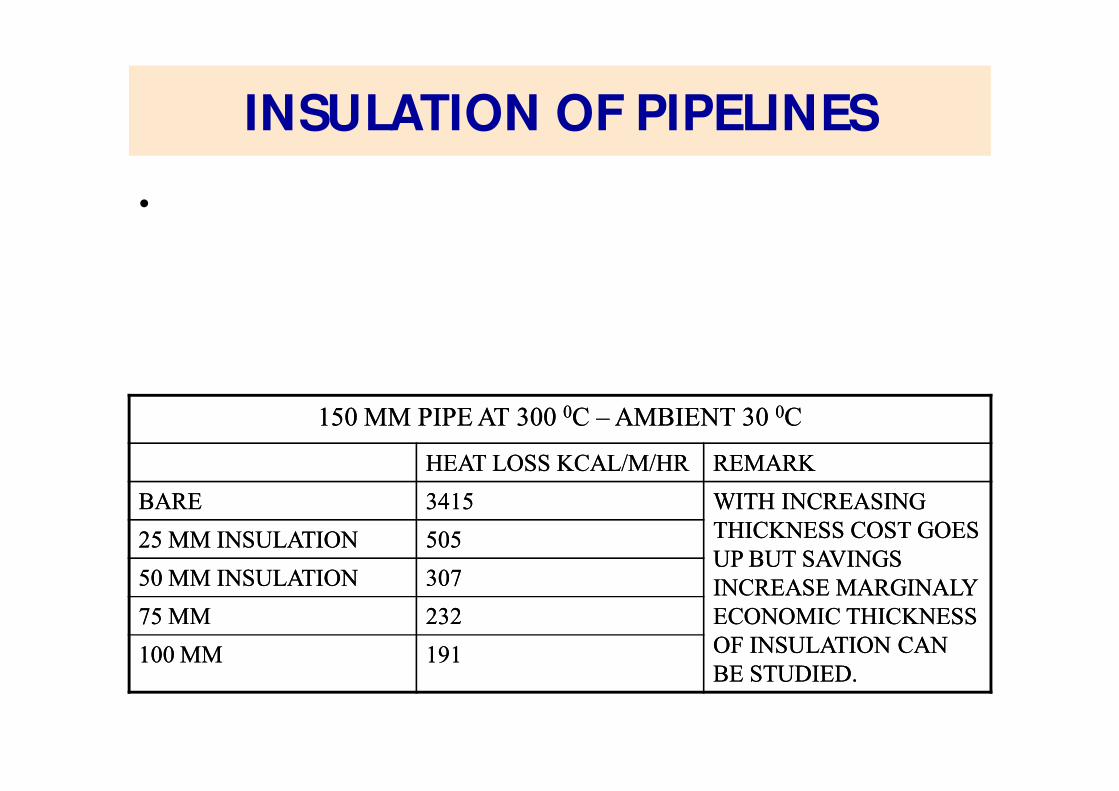
INSULATION OF PIPELINES
• ALL EQUIPM ENTS INCLUDING PIPELINES SHOULD BE
PROPERLY LAGGED. ALL FLANGES SHOULD ALSO BE LAGGED.
THIS IS THE CHEAPEST ENERGY CONSERVATION
OPPORTUNITY. THE FOLLOWING TABLE SHOWS EFFECT OF
INSULATION.
150 MM PIPE AT 300 150 MM PIPE AT 300 00C C –– AMBIENT 30 AMBIENT 30 00CC
HEAT LOSS KCAL/M/HRHEAT LOSS KCAL/M/HR REMARKREMARK
BAREBARE 34153415 WITH INCREASING WITH INCREASING
THICKNESS COST GOES THICKNESS COST GOES
UP BUT SAVINGS UP BUT SAVINGS
INCREASE MARGINALY INCREASE MARGINALY
ECONOMIC THICKNESS ECONOMIC THICKNESS
OF INSULATION CAN OF INSULATION CAN
BE STUDIED.BE STUDIED.
25 MM INSULATION25 MM INSULATION 505505
50 MM INSULATION50 MM INSULATION 307307
75 MM75 MM 232232
100 MM100 MM 191191
83
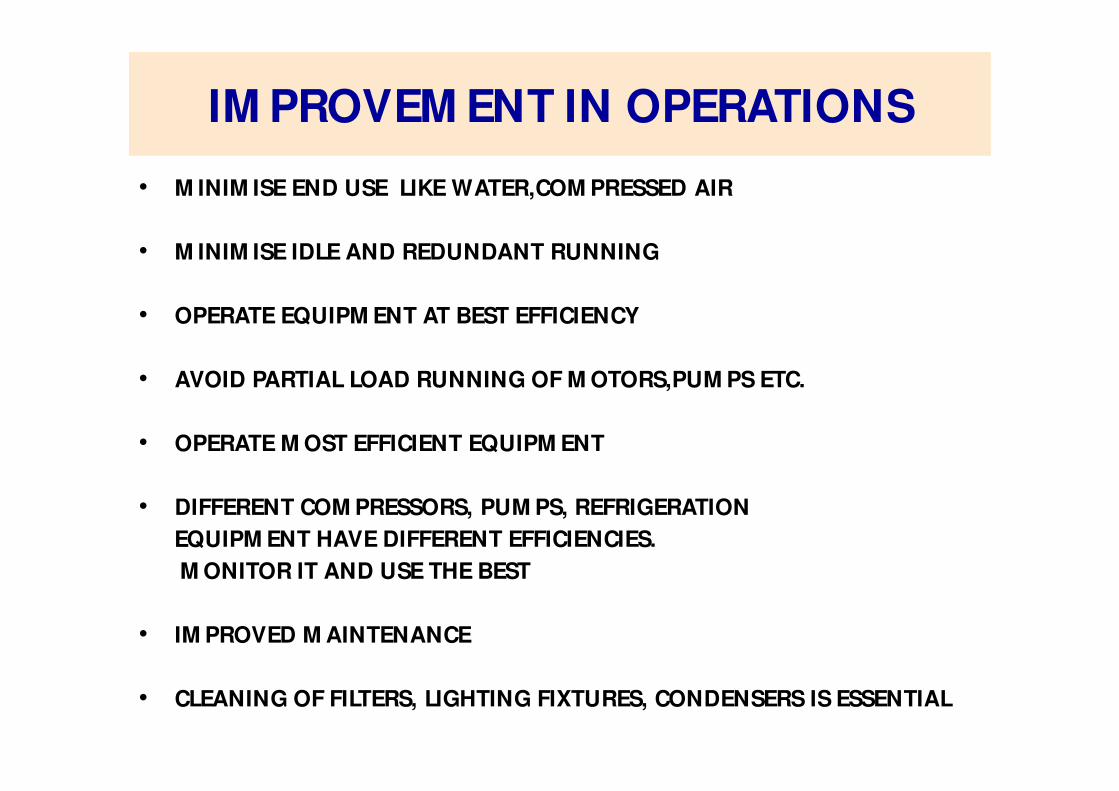
IM PROVEM ENT IN OPERATIONS
• M INIM ISE END USE LIKE WATER,COM PRESSED AIR
• M INIM ISE IDLE AND REDUNDANT RUNNING
• OPERATE EQUIPM ENT AT BEST EFFICIENCY
• AVOID PARTIAL LOAD RUNNING OF M OTORS,PUM PS ETC.
• OPERATE M OST EFFICIENT EQUIPM ENT
• DIFFERENT COM PRESSORS, PUM PS, REFRIGERATION
EQUIPM ENT HAVE DIFFERENT EFFICIENCIES.
M ONITOR IT AND USE THE BEST
• IM PROVED M AINTENANCE
• CLEANING OF FILTERS, LIGHTING FIXTURES, CONDENSERS IS ESSENTIAL84

M ORE EFFICIENT EQUIPM ENTS
• HIGH EFFICIENCY M OTORS
• HIGH EFFICIENCY PUM PS
• HIGH EFFICIENCY CHILLERS
• TECHNOLOGY HAS IM PROVED EFFICIENCY BY 5% TO
15%
• T-5 TUBE LIGHTS,ELECTRONIC BALLASTS
• SELECT AND LOOK FOR BEST ON BASIS OF LIFE CYCLE
COST
85
M ORE EFFICIENT PROCESSES
• NEW PROCESS TECHNOLOGIES ARE DEVELOPED TO
REDUCE ENERGY USE
• DRY PROCESS IN PLACE OF WETPROCESS FOR
CEM ENT
• M EM BRANE PROCESS IN PLACE OF M ERCURY CELL
FOR CAUSTIC SODA
• LOW PRESSURE TECHNOLOGY FOR
POLYPROLENE,OXYGEN AND OTHER CHEM ICHALS
• SAVING 10% TO 75%
86

INTER FUEL SUBSTITUTION
COST HEAT VALUE COST FOR
1000 KCAL
COAL Rs.2000/
TON
4000 KCAL/KG. 0.50 Rs.
OIL Rs.20/KG 10000
KCAL/KG.
2.00 Rs.
GAS Rs.10/M3 9000 KCAL/M3 1.11 RS.
ELECTRICITY Rs.5/KWH 860 KCAL/KWH 5.81Rs.
87
ELECTRICITY IS M OST EXPENSIVE FOR HEATING

ENERGY AUDIT EQUIPM ENT
• PORTABLE POWER M ETERS WITH FACILITES TOM EASURE HARM ONICS. KW, KVAR, KVA, PF. ALL AREM EASURED
• DIGITAL PRESSUREGUAGES
• DIGITAL TEM PERATUREINDICATORS
• NON CONTACT FLOW M ETERS
• ROTAM ETERS, ELECTROM AGNETIC FLOW M ETERS,ANEM OEM ETER (AIR FLOW) PITOT TUBEM ANOM ETER
88
ENERGY AUDITNEW APPROACH
M oderat ion of Energy Use
Redundant Running of M achines
High voltage VFDs
Alternat ives to Compressed Air
M oderation of Energy Use -1
• Process Plants are Designed For M aximum
Throughput, Worst Ambient Conditions and with
Large Factors Of Safety
• Critical Study Of Parameters Like Temperature,
Pressure, Flow, RPM Can Lead to Saving Without
Sacrificing Safety and Quality.
• This is Particularly True When Plant is Running at
Reduced Load, Favorable Ambient Condition.

M oderation OF Energy Use-2
• Increasing Chilled Water, Brine Temperature
• Reducing Steam Pressure, Comp. Air Pressure
• Use of Chilled Water in place of Brine
• Use of Cooling Water in Place of Chilled Water
• Reducing Light ing Voltage.

M oderat ion of Energy Use
Thermal Power Plant -210 M W
Differential Pressure Across Feed Control Valves.
Reduced From 6.0 Kg/ Cm2 to 0.4Kg/ Cm2
Boiler Feed Pump Current Reduces by 13 Amps-6.6KV
Combined Cycle Power Plant-220 M W
Differential Pressure For HP BFP reduced From 7.0 Bar to 5.0 Bar
Power Saving-30KW
Similarly For LPBFP Pressure reduced by 0.7 Bar
Power Saving-3KW
Compressed Air Pressure 8.5Bar to 7.5Bar.
Combined Cycle Power Plant 388 M W
Differential Pressure Across Control Value Reduced to 6 Bar
Power Saving-40KW.

FERTILIZER PLANTS-UREA
• Opt imisat ion of process parameters reduced
specific consumpt ion by 5%
• 14kg/ Cm2 Steam used for Deaerator
• 3kg/ Cm2 Steam used for Deaerator
Steam Saving 24000 T/ Year
FERTILIZER PLANT-PHOSPHATIC
For Dryers, Slurry Pump 2T/ HR Steam used
Pressure Reduced from 15 KG/ Cm2 to 10 KG/ Cm2
Coal Saving 82 Tons/ HR
Ammonia Pump Pressure Reduct ion
4 Stage to 3 Stage
71 KW to 59 KW
PAPER M ILL – NEWS PRINT FROM WASTE
PAPER
For PM 1 Vacuum System Opt imised
50 KW Pump in place of 90 KW Pump
Saving 228900 KWH/ YR
For PM 2 Vacuum System Opt imised
Saving 578700 KWH/ YR
Compressed Air Pressure Reduced
5.8 KG/ Cm2 to 5.5 KG/ Cm2
Saving 14700 KWH/ YR

PAPER M ILL – DUPLEX BOARD
• Chest Agitator – 5 Units
• RPM Reduced from 1000 RPM to 750 RPM
• Investment Rs.1.5 Lakh
• Saving Rs.4.5 Lakh
Redundant Running of M achines
• Process Plants are Provided With Large Safety
M argins. To Improve Reliability M ore
M achines Especially Auxiliaries are also
Provided.
• Careful Look at Operat ions Can Lead to
Switching Off Some M achines Without
Sacrificing Quality, Safety, Reliability.
• M achines Work With Opt imum Efficiency at
Near Full Load Condit ions. Part ial Load
Running Can be Avoided When Possible.
Case Studies
Redundant Running Of M achines
• Thermal Power Plant 210M W-1&2
• For Each Unit 2 CW Pump of 925KW Were Used.
Total CW Pump 2+2=4. In Winter, 1CW Pump Was
Switched off By Combining Two Systems . Total CW
Pump 1+2=3. This Can be done in Period Of Low Load
also.
• TACW Pump 2 x 110 KW For Each Unit .
In Winter One Unit Of 110 KW Stopped .
Total 3 Pumps in Place Of 4
• DM Water M ake Up Quant ity is Low
1 Hot Well Pump For Each Unit 2 x 1=2 Pump
Now 1 Pump is Run For Both Units.
Fertilizer Plant Urea
Waste Water pump Storage Tank pump Treatment
Waste Water Treatment
Saving 20,000KWH/ YR
Bore Well- Raw Water Storage –Softening Plant
Bore Well - Softening Plant
Saving 10,69,000KWH/ YR
Effluent Water RO feed Tank - RO Plant
Effluent Water RO Plant
Saving 3,94,000KWH/ YR
Fertilizer Plant Urea
One High Capacity Pump in Place of Two Low Capacity Pump
Energy Saving Rs. 7.33 Lakhs
Investment Rs. 2.00 Lakhs
High Capacity Pump For Cont inuous and Occasional Users of
Caust ic
Small Capacity Pump For Cont inuous Operat ion
High Capacity Pump Stopped M ost Of Time
Saving 48000 KWH- Rs.1.65 Lakhs
Fert ilizer Plant – Phosphat ic
Coal Conveyors Were Run in Large Numbers in Old Plant
Number of Conveyors Reduced in New Plant
Case Study-Railways
• Transport of Coal and Iron Ore
• In Return Journey With Empty Rakes
• One Or Two Locomot ives Switched of in 2/ 3 Loco
System
• Saving 56 Lakh KWH
• Switching Off Light Engines after 15 M inutes idling
• Switching Off Train Engines after 45 M inutes idling
• Full Stat ion Light ing Before Arrival Of Train
• Part ial Light ing When Trains Not Likely to Arrive
Case Study
Software Park-M ult inat ional Company
6 No. Of 400 KVA UPS Systems
Load On Individual Units 10% to 17%
50% Load M inimum by M FGR
Units Switched Off in Presence of
M anufacturer

High Voltage VFDS
• Process Industries In India are widely using Low
Voltage Drives For Pumps, Fans and Compressors.
• High Voltage M otors are not Provided VFDs.
• High Voltage VFDs 3.3KV, 6.6KV, 11KV is a M ature
Technology and Used in Tens of M egawatts Rat ing
For Offshore Plat form and Other Hazardous
Locat ions.
• High Voltage M otors For Pumps, Fans,
Compressors M ust be Provided With VFDs.
Alternatives To Compressed Air
• Compressed Air is Very Expensive and Energy
Inefficient Ut ility. M ust be Used in Rare Cases.
• Pneumat ic Transport Replaced by M echanical
Transport .
Cement , Paper,
• Pneumat ic Tool by Elect ric Tools
Engineering, Foundry.
• Vacuum Cleaners in Place Of Compressed Air Cleaning.
• Elect ronic Inst rumentat ion In Place Of Pneumat ic
Inst rumentat ion.

CHAPTER - 5
M OTORS
105
ELECTRICITY USE BY APPLICATION
• ELECTRIC M OTORS – 75%
• ELECTRIC LIGHTING – 15%
• HEATING ,ELECTROLYSIS – 10%
• INDUCTION M OTORS ACCOUNT FOR 90% OR M ORE
• D.C.M OTORS, SYNCHRONOUS M OTORS 10% OR LESS
106

M otor life is in range of 10 to 20 years. In fact
motors are repeatedly rewound and cont inue to
run for 30 – 40 years before they are scrapped.
Even now in 2019 when elect ricity prices for
Industry/ Commerce range between Rs. 7 to Rs. 9
per KWH. M otors cont inue to be purchased on
basis of init ial or first cost . Init ial or First Cost is
negligible compared to total cost of running the
M otor.
Importance of Running Cost
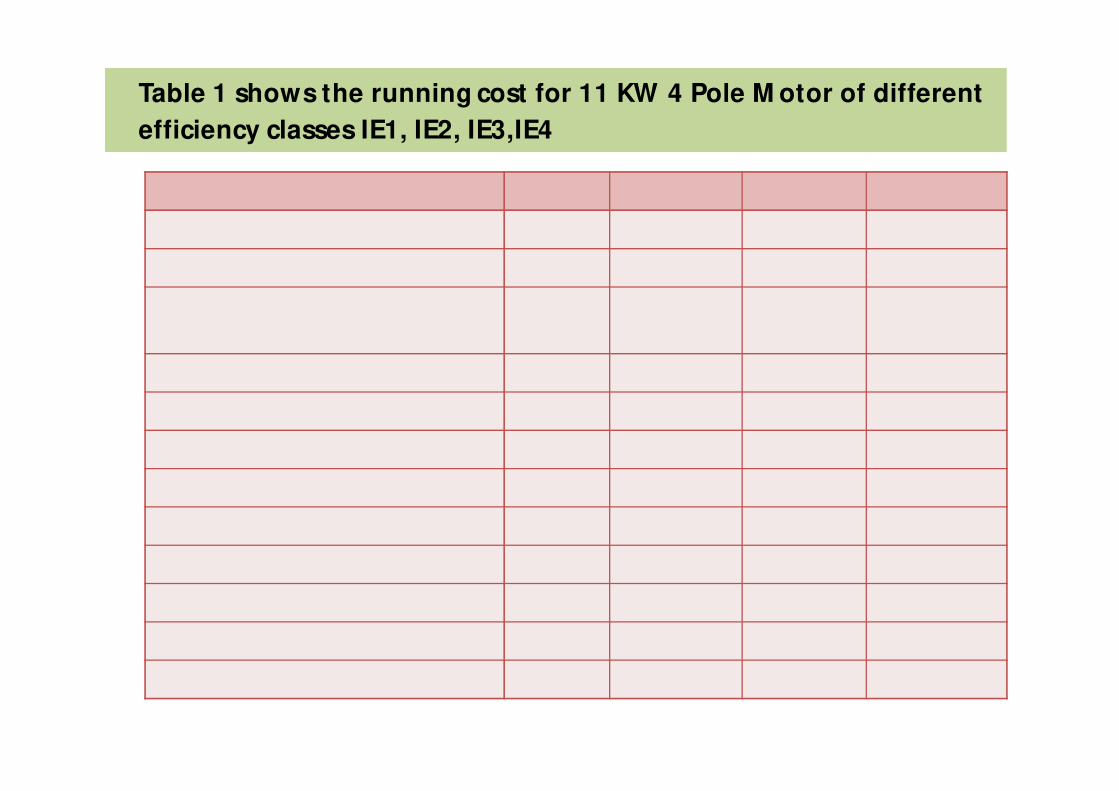
Table 1 shows the running cost for 11 KW 4 Pole M otor of different
efficiency classes IE1, IE2, IE3,IE4
IE1 IE2 IE3 IE4
Efficiency 87.6 89.8 91.4 93.3
Output (Kw) 11 11 11 11
Input (Kw) =
Output ÷ Efficiency
12.557 12.249 12.035 11.789
Running Hour/ Yr 7000 7000 7000 7000
KWH/ YR 87899 85743 84245 82523
Running Cost / Yr (Rs.)- 7RS./ KWH 615293 600201 589715 577661
Saving/ Yr (Rs.) 15092 25578 37632
Running Cost / 10 Yr (Rs.) 6152930 6002010 5897150 5776610
Init ial Cost (RS.) 90,000 100,000 115,000 140,000
Init ial Cost % Of Running Cost 1.46% 1.66% 1.95% 2.42%
Extra First Cost Compared IE1 (Rs.) 10,000 25,000 50,000
Time To Recover Extra Cost 8 M onths 1 Yr 16 M onths

• Init ial cost of purchasing a M otor is negligible,
(1% to 2 %) compared to running cost of motor
for 10 years.
• Importance should be given to Running Cost
which depends on efficiency of M otor rather
than Init ial Cost .
• It can be seen from above table that ext ra cost
for purchasing High Efficiency M otor is
recovered in about one year.
Following points can be noted from Table 1.

ENERGY SAVING OPPORTUNITIES
• STOPPING IDLE AND REDUNDANT RUNNING OF M OTORS
• REPLACING OVERSIZED M OTORS
• EFFICIENT DRIVE TRNSM ISSION
• HIGH EFFICIENCY M OTORS
• IM PROVEM ENT IN PUM P,FAN,COM PRESSED AIR SYSTEM
110
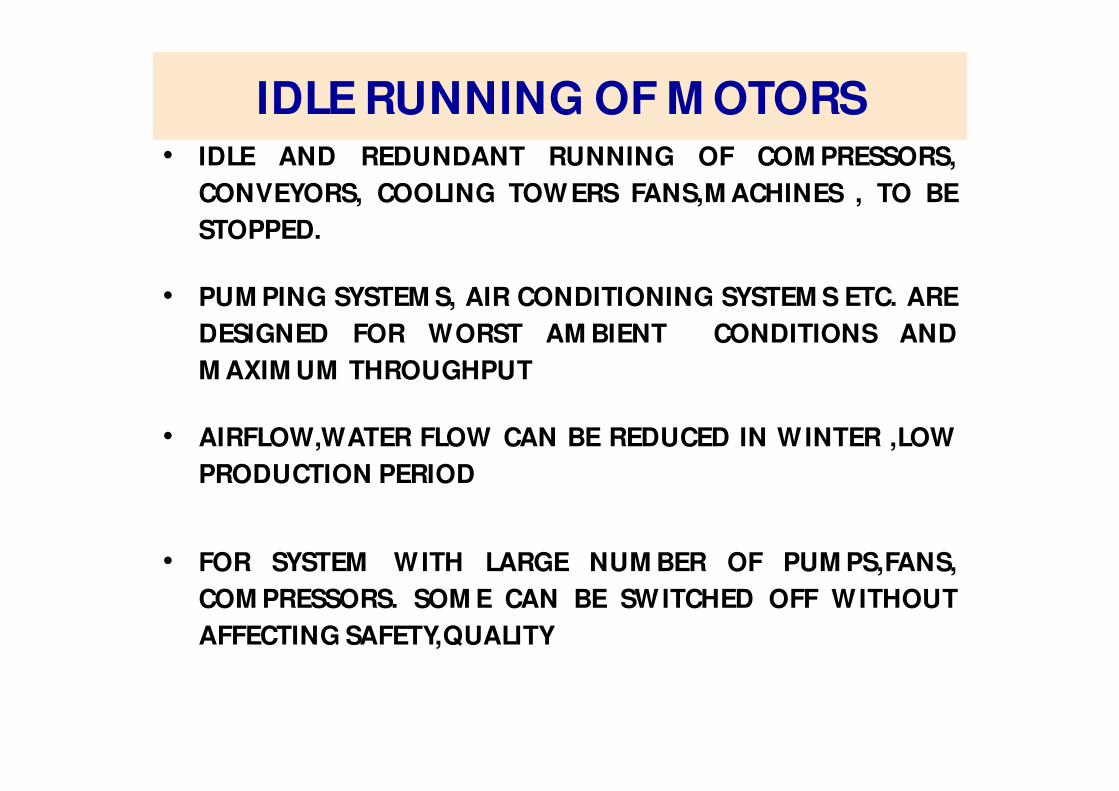
IDLE RUNNING OF M OTORS• IDLE AND REDUNDANT RUNNING OF COM PRESSORS,
CONVEYORS, COOLING TOWERS FANS,M ACHINES , TO BE
STOPPED.
• PUM PING SYSTEM S, AIR CONDITIONING SYSTEM S ETC. ARE
DESIGNED FOR WORST AM BIENT CONDITIONS AND
M AXIM UM THROUGHPUT
• AIRFLOW,WATER FLOW CAN BE REDUCED IN WINTER ,LOW
PRODUCTION PERIOD
• FOR SYSTEM WITH LARGE NUM BER OF PUM PS,FANS,
COM PRESSORS. SOM E CAN BE SWITCHED OFF WITHOUT
AFFECTING SAFETY,QUALITY
111
OVERSIZED M OTORS
• VERY COM M ON PROBLEM DUE TO LARGE FACTORS
OF SAFETY USED BY OEM S, CONSULTANTS
• LEADS TO
HIGH INVESTM ENT COST
HIGH RUNNING COST
HIGH M AXIM UM DEM AND
HIGH SWITCHGEAR, COST
HIGH INSTALLATION COST AND SPACE
HIGH RUNNING COST
HIGH REPLACEM ENT/ REWINDING COST
112

M OTOR PERFORM ANCE CHARACTRISTICS
113
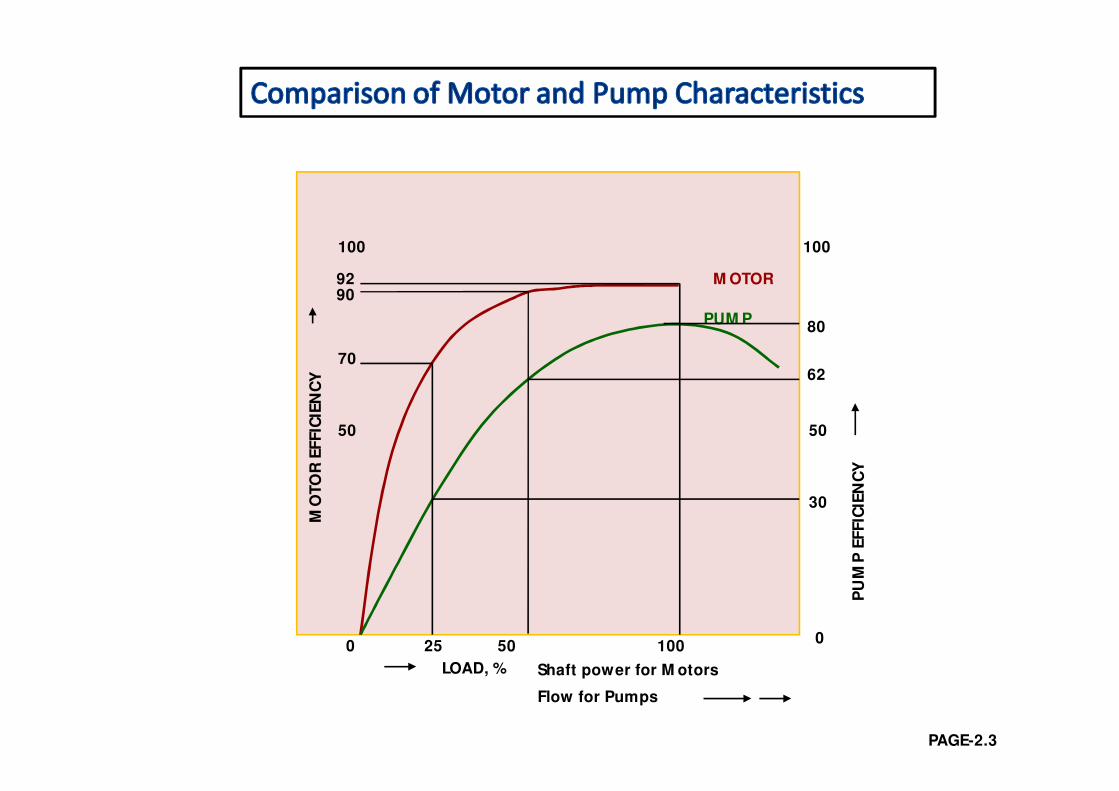
M OTOR
PUM P
LOAD, % Shaft power for M otors
Flow for Pumps
0 25 50 100
9290
100
50
70
80
62
30
MO
TO
RE
FFIC
IEN
CY
PU
MP
EFFIC
IEN
CY
100
0
50
PAGE-2.3
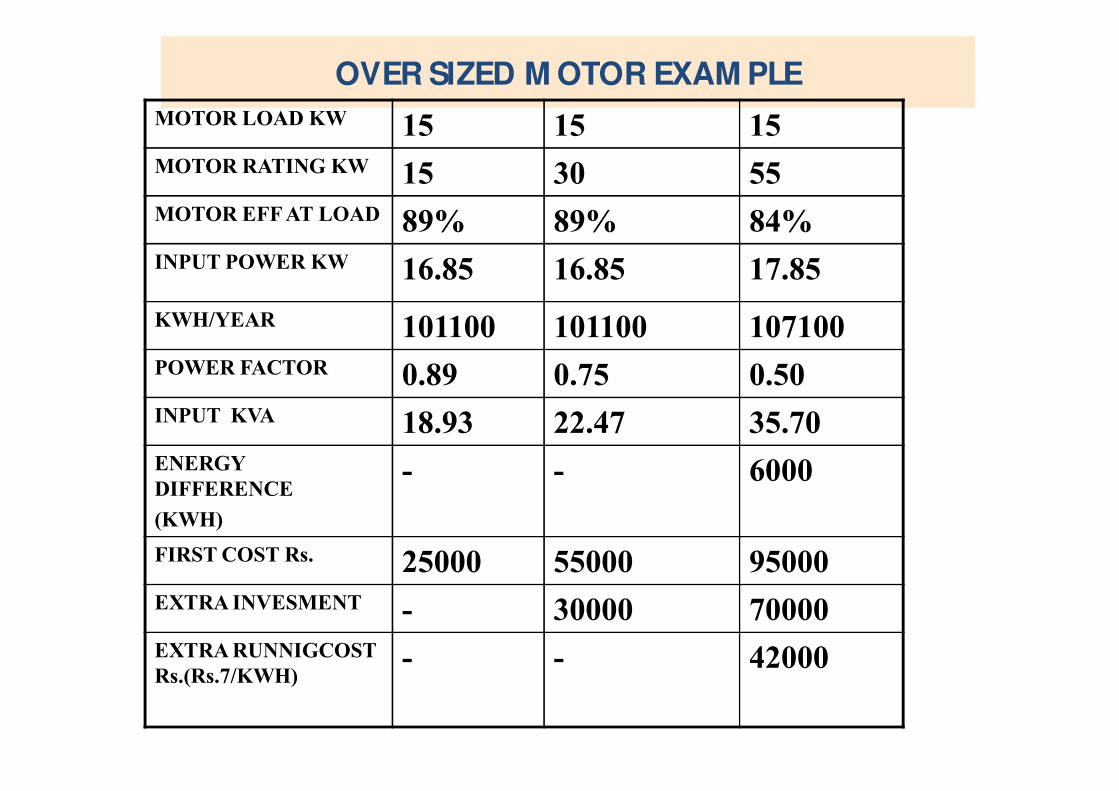
OVER SIZED M OTOR EXAM PLE
MOTOR LOAD KW 15 15 15
MOTOR RATING KW 15 30 55
MOTOR EFF AT LOAD 89% 89% 84%
INPUT POWER KW 16.85 16.85 17.85
KWH/YEAR 101100 101100 107100
POWER FACTOR 0.89 0.75 0.50
INPUT KVA 18.93 22.47 35.70
ENERGY
DIFFERENCE
(KWH)
- - 6000
FIRST COST Rs. 25000 55000 95000
EXTRA INVESMENT - 30000 70000
EXTRA RUNNIGCOST
Rs.(Rs.7/KWH)- - 42000
115
OVERSIZED M OTOR SOLUTIONS
• DELTA TO STAR CONVERSION
• SOFT STARTER
• REPLACE WITH PROPER SIZE AND HIGH
EFFICIENCY
116

DELTA TO STAR
• REDUCES PHASE VOLTAGE FROM 415 TO 240
• TORQUE,OUTPUT REDUCES AS V2 i.e. (240/ 415)2 i.e. 1/ 3
• A 15KW M OTOR BECOM ES 5KW M OTOR
• SIGNIFICANT REDUCTION OF CURRENT
• SIGNIFICANT IM PROVEM ENT IN PF
• SM ALL SAVING IN ENERGY
• RECOM M ENDED FOR LOADS LESS THAN 25% AUTOM ATIC
LOAD DEPENDENT STAR DELTA SYSTEM S AVAILABLE
117
ELCTRONIC SOFT STARTER
• TRANSISTORS AND THYRISTOR VARY THE M OTOR
VOLTAGE CONTINUOUSLY DEPENDING ON LOAD. NO
FREQUENCY CHANGE
• SAVINGS AT LIGHT LOADS ONLY
• EXPENSIVE AND VFDS TO BE PREFERRED
NOW. AS BOTH VOLTAGE & FREQUENCY ARE VARIED.
• JUSTIFIED, IN SPECIAL APPLICATIONS LIKE STATRING
LARGE M OTORS ON DG
• VFDS GIVE GOOD STARTING TORQUE AT LOW
STARTING CURRENT
118

REPLACE M OTOR WITH PROPER SIZE
• FIND OUT IM PORTANT M OTOR LOADS BY POWER
OR ENERGY M EASUREM ENTS
• SEE IF M OTORS CAN BE INTERACHANGED
• INSTEAD OF REWINDING, REPLACE WITH PROPER
SIZE HIGH EFFICIENCY.
119

DRIVE TRANSM ISSION
• DIRECT DRIVE ALWAYS PREFERRED
• FLAT SYNTHETIC BELTS IN PLACE OF V BELTS
• SAVINGS 2% TO 8%
• EFFICIENT HELICAL,PLANETARY GEARS IN PLACE
OF OLD WORM GEARS
• SAVINGS 10% TO 25%
120

HIGH EFFICIENCY M OTORS
• CORE LOSS REDUCED BY LOW LOSS COLD
ROLLED STEEL
• FRICTION & WINDAGE LOSS REDUCED BY
BETTER FAN AND BEARING DESIGN
• STATOR COPPER LOSS REDUCED BY LARGER
COPPERAREA
• ROTOR COPPER LOSS REDUCED BY LARGER
ALUM INIUM SECTION ALSO BY COPPER IN
PLACEOF ALUM INIUM
• STRAY LOSS REDUCED BY BETTER DESIGN AND
M ANUFACTURING
121
REWINDING OF M OTORS
• ALWAYS USE ORIGINAL WINDING DATA
• AVOID REPEATED REWINDING .
• FIND WHY M OTORS BURN
• REM OVE WINDING BY SOLVENTS OR OVENS AT TEM P LESS
THAN 3000C
• CHECK NO LOAD CURRENT AND POWER AFTER REWINDING
122

IEEE STANDARD
• IEEE STANDARD 1068-2015
• Repair and Rewinding of Elect ric M otors.
• This standards covers all types of M otors,
Induct ion, Synchronous Permanent M agnet
• It gives extensive informat ion about proper
rewinding procedures
Development of M otor Efficiency Standards
• M otor Efficiency has gained importance after
the energy crisis of 1973. Concern of global
warming and climate change has further
pushed the importance of Energy Efficiency
and M otor Efficiency. M inimum M otor
Efficiency standards are now mandated
around the world, USA, Europe, Japan, China
and now in India also.

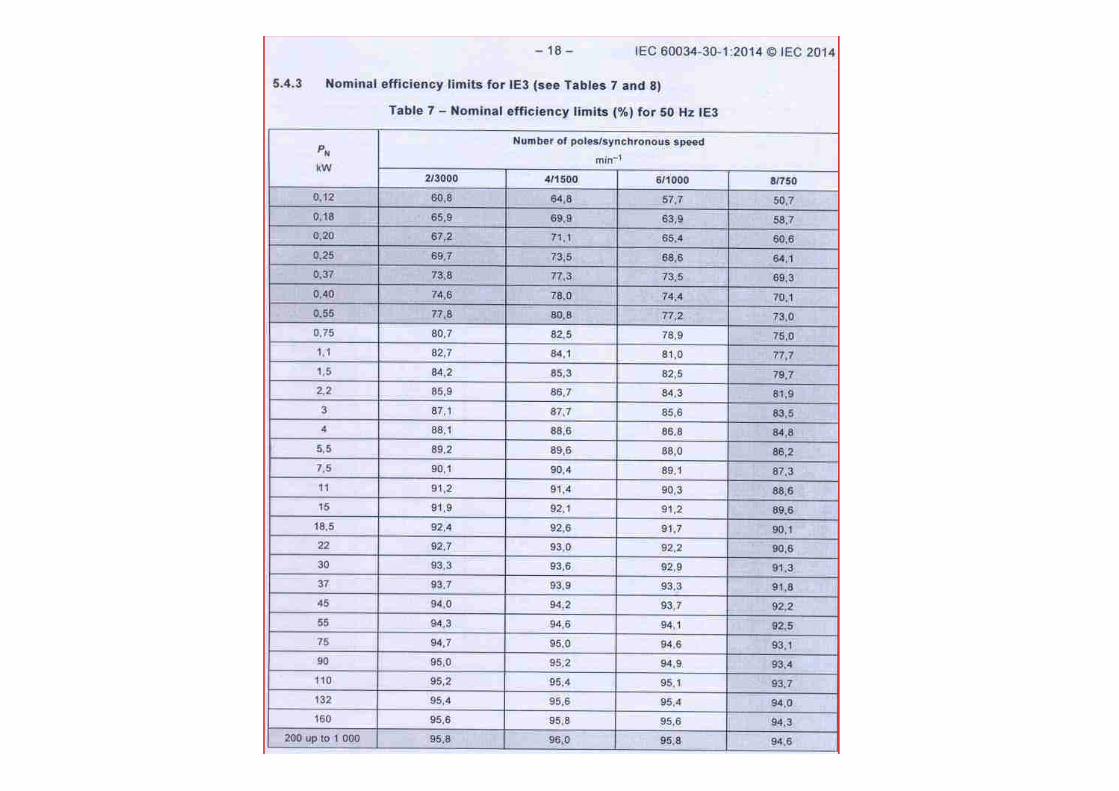
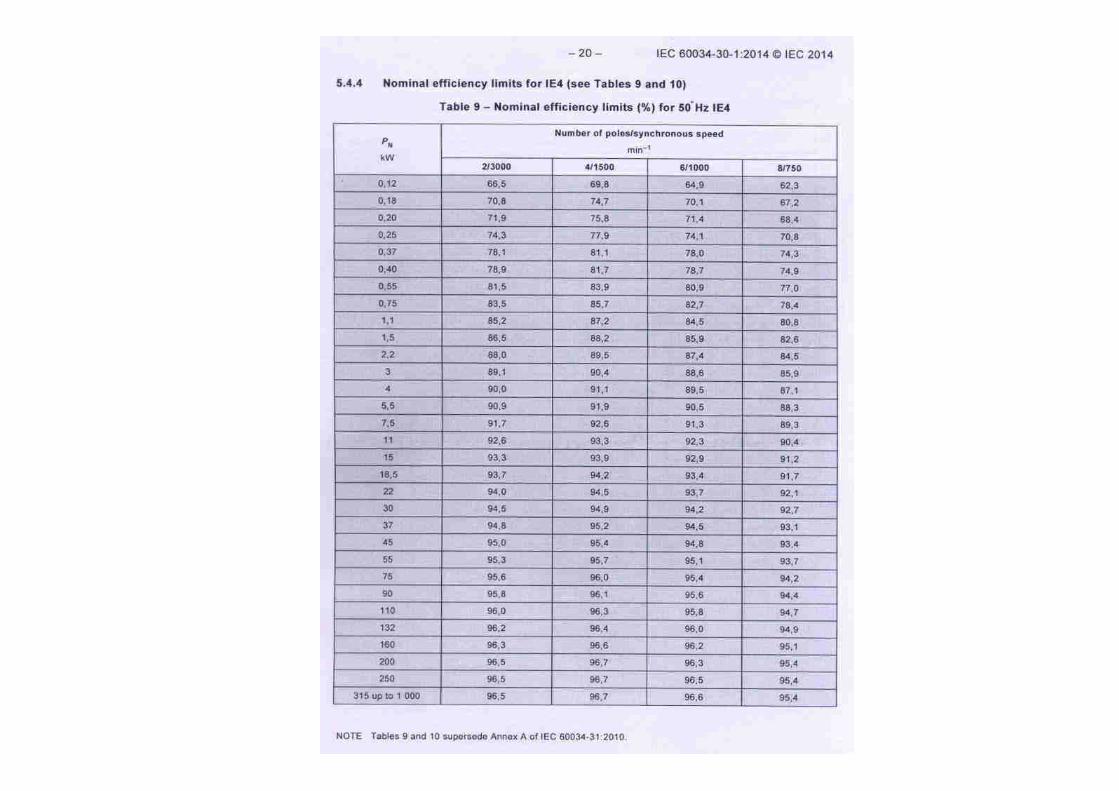
• IEC 600340-30-1-2014 (* Ref.) is the current
Internat ional Standard for M otor Efficiency. It defines
four classes of efficiency IE1, IE2, IE3, IE4. It also
ment ions IE5 but values are not defined. Standard
only ment ions IE1 IE2 IE3 IE4 but in common
technical language following nomenclature is used
• IE1 Standard Efficiency
• IE2 High Efficiency
• IE3 Premium Efficiency
• IE4 Super Premium Efficiency
---------------------------------------------------------------------* Ref.: IEC 60034-30-1: 2014Rotating electrical machines – Part
30-1: Efficiency classes of line operated AC motors (IE code).

• Previous IEC as well as Indian
Standards use to cover only
Induct ion M otor. Now IEC as well
new Indian Standard include all line
start M otors and not only Induct ion
M otor.

• Important part of the motor efficiency
development has been how to test motor
efficiency. US Standard IEEE 112 used to
determine efficiency by load test . European and
Japanese standard and also Indian standard
used to prefer summat ion of losses with value
of st ray load losses at 0.5%. IEEE insisted on
measurement of st ray losses or take as a value
which is much more than 0.5%. This caused
different efficiency values of M otor by different
standard.
• Now all IEC and American Standard are
harmonized and uses the same test
procedure. St ray loss measurement is very
difficult and few test laboratories or
manufacturers have facility to do it . Following
are st ray load loss allowances for new
standard. (* Ref.) gives details of relevant
standard
* Ref.
• IS 15999.2011 (Part 2/ Sec 1) Standard M ethods for
Determining Losses and Efficiency from Tests
• IEC 60034-2-1: 2007 Test standard for rotating M achine IE

IEC 60034-2-1 IEEE-112
1KW - 2.5% 1.8% -100KW
10KW -2% 1.5% -375KW
100KW -1.5% 1.2% -2000KW
1000KW-1% 0.90% - OTHERS
10000KW-0.5%
Table 2
Bureau of Indian Standard has IS 12615
for high efficiency motors since nearly 30 years 1989.
It was revised in 2004 as well as 2011. Now IS12615 -
2018 has been revised which is in line IEC Standard
60034-30-1-2014(* Ref.). New Indian Standard has
similar efficiency values of IE1 IE2 IE3 IE4 as per
Internat ional standard. It covers like IEC all line
operated M otors and not only Induct ion M otors.
Some differences are as follow.
----------------------------------------------------------------------* Ref.IS 15999.2011 (Part 2/ Sec 1) Standard M ethods for Determining Losses
and Efficiency from Tests
Revised Indian Standard IS12615-2018 (* Ref.).
IEC Standard covers 50 HZ and 60 HZ M otors. Indian Standard
covers only 50 HZ. Indian Standard does not include IE1 now.
Indian Standard specifies following addit ional performance
values.(* Ref.)
Start ing Current
Start ing Torque
Breakdown Torque
Rated Speed
Rated Current
• Efficiency to be determined by IS-15999-2011 which is in line
with revised IEC Standard 60034 -2-1-2007
………………………………………………………………………………………………
* Ref. IS 12615: 2018 Line operated three phase AC M otors (IE
Code). Efficiency classes and performance specification
(Third Revision).
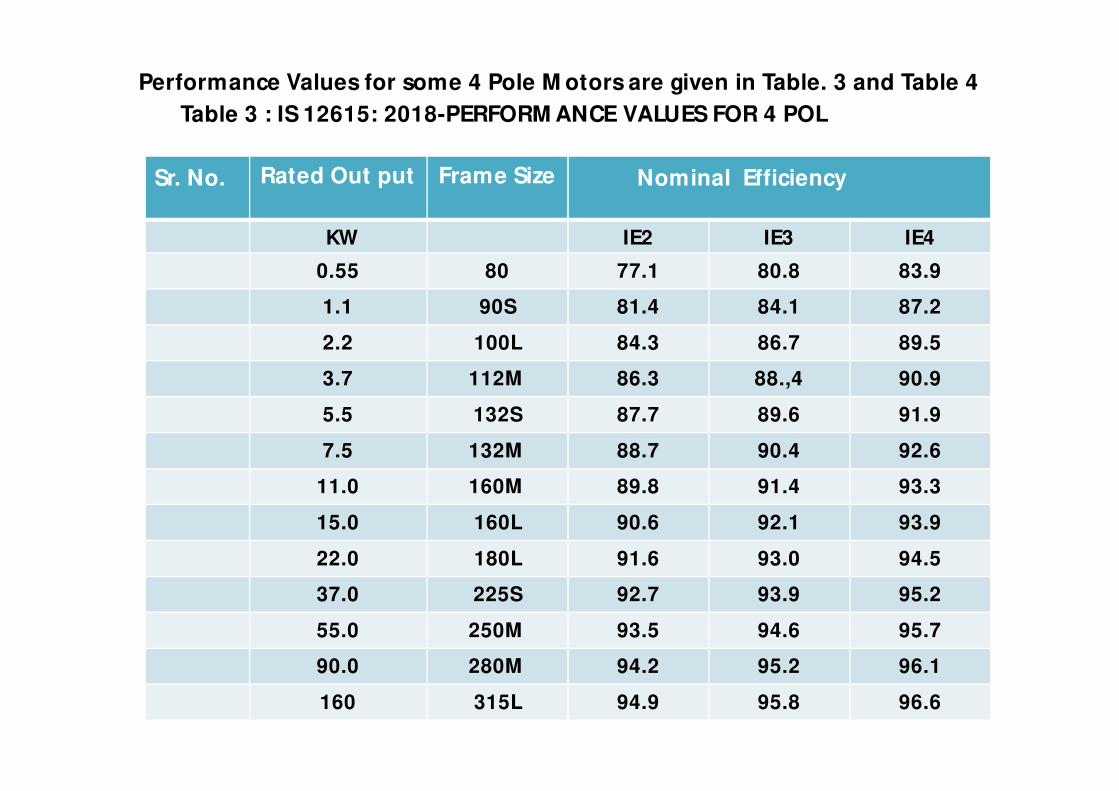
Performance Values for some 4 Pole M otors are given in Table. 3 and Table 4
Table 3 : IS 12615: 2018-PERFORM ANCE VALUES FOR 4 POL
Sr. No. Rated Out put Frame Size Nominal Efficiency
KW IE2 IE3 IE4
1 0.55 80 77.1 80.8 83.9
2 1.1 90S 81.4 84.1 87.2
3 2.2 100L 84.3 86.7 89.5
4 3.7 112M 86.3 88.,4 90.9
5 5.5 132S 87.7 89.6 91.9
6 7.5 132M 88.7 90.4 92.6
7 11.0 160M 89.8 91.4 93.3
8 15.0 160L 90.6 92.1 93.9
9 22.0 180L 91.6 93.0 94.5
10 37.0 225S 92.7 93.9 95.2
11 55.0 250M 93.5 94.6 95.7
12 90.0 280M 94.2 95.2 96.1
13 160 315L 94.9 95.8 96.6
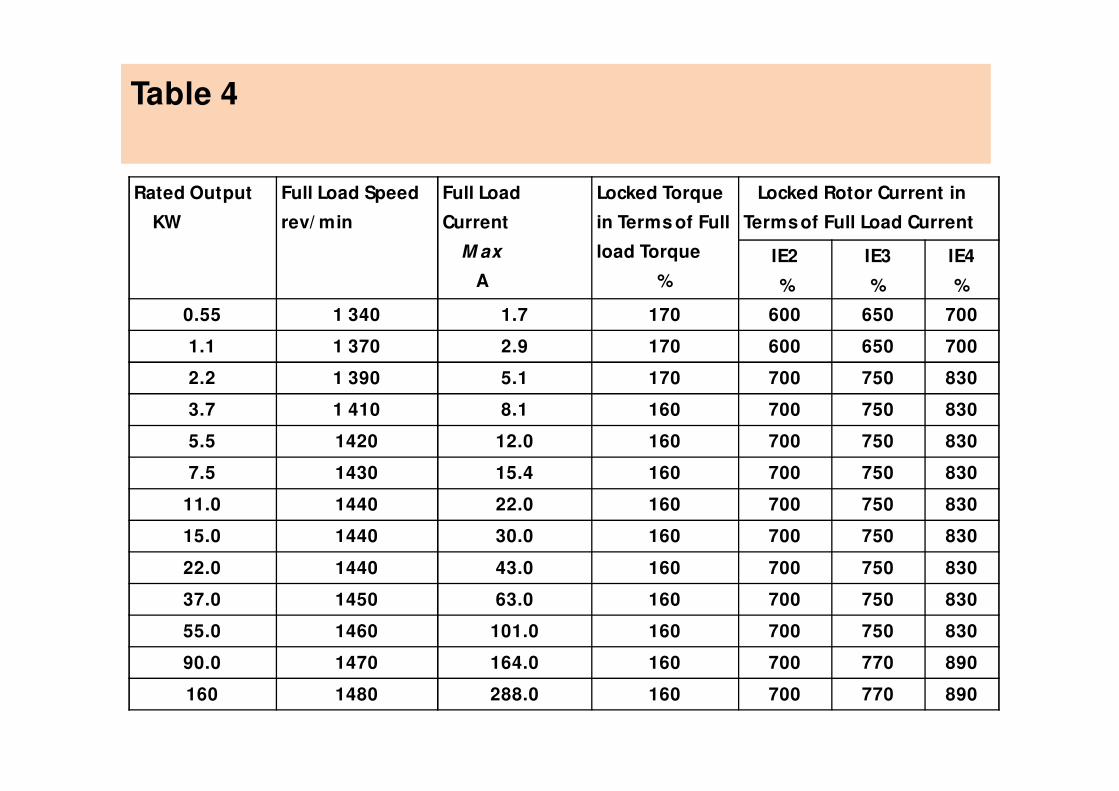
Rated Output
KW
Full Load Speed
rev/ min
Full Load
Current
M ax
A
Locked Torque
in Terms of Full
load Torque
%
Locked Rotor Current in
Terms of Full Load Current
IE2
%
IE3
%
IE4
%
0.55 1 340 1.7 170 600 650 700
1.1 1 370 2.9 170 600 650 700
2.2 1 390 5.1 170 700 750 830
3.7 1 410 8.1 160 700 750 830
5.5 1420 12.0 160 700 750 830
7.5 1430 15.4 160 700 750 830
11.0 1440 22.0 160 700 750 830
15.0 1440 30.0 160 700 750 830
22.0 1440 43.0 160 700 750 830
37.0 1450 63.0 160 700 750 830
55.0 1460 101.0 160 700 750 830
90.0 1470 164.0 160 700 770 890
160 1480 288.0 160 700 770 890
Table 4
IS12615: 2018-PERFORM ANCE VALUESFOR 4 POLE

High Efficiency M otor Technology
Induct ion M otor Losses are as follows
(a) Stator Copper Losses
(b) Rotor Copper Losses
(c) Iron Losses
(d) Frict ion and windage Losses
(e) St ray Losses

• Stator Copper losses are reduced by increasing Stator Copper
area, increasing slot fill factor as well as reducing overhang
length by machine winding.
• Rotor Copper Losses are reduced by increasing aluminum
area in rotor slots and endrings. Copper cast rotors are also
being used.
• Iron losses are reduced by better quality of stamping as well
as use of thinner laminat ion
• Friction Losses are reduced by improved bearing and fan
design. Advantage is also taken of fact that lower cooling is
required in view of lower losses of high efficiency motors
• Stray Losses are cont rolled by air gap, rotor stator slot
combinat ion and bet ter manufacturing.

Permanent M agnet Synchronous M otors (PM SM )
PM SM M otors are now widely used in indust ries and
especially in elect ric vehicles. They are able to achieve
higher efficiency than convent ional induct ion motors.
Since line start M otors are only specified,
Permanent-M agnet Synchronous M otors are other pract ical
opt ion. Brushless DC motors and Synchronous Reluctance
motors require a stat ic converter to start and run.
PM SM motors are similar to normal induct ion
motors except rotor has Permanent magnets.
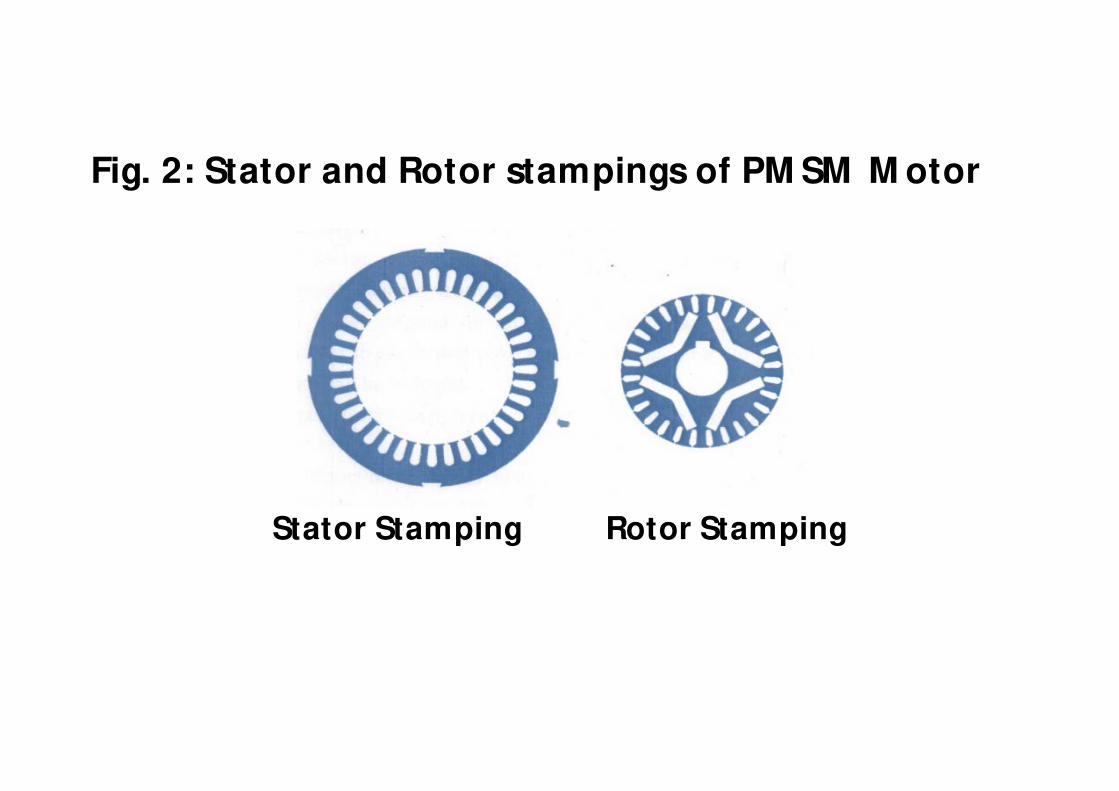
Fig. 2: Stator and Rotor stampings of PM SM M otor
Stator Stamping Rotor Stamping

M otor starts like a Induct ion M otor but
due to permanent magnets runs at
synchronous speed. Efficiency is improved
as stator current is less because of higher
power factor. Rotor losses are nearly zero.
Iron Losses, Frict ion, windage, st ray losses
are like normal motor
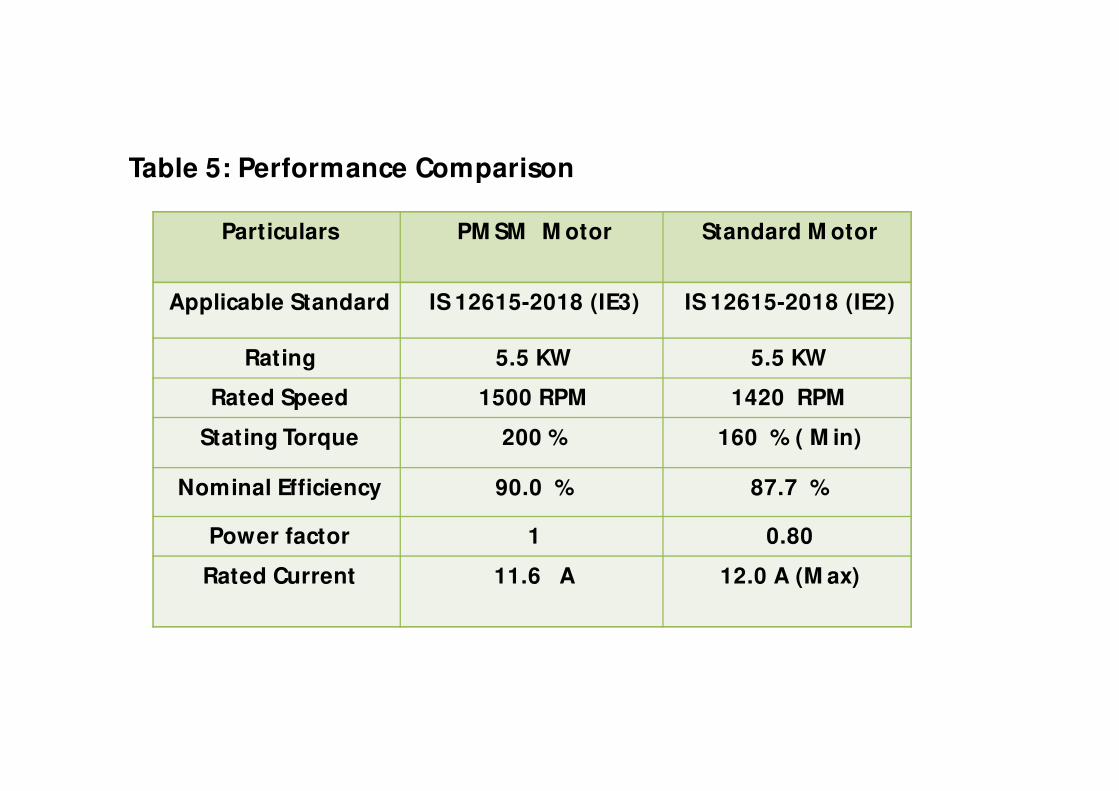
Particulars PM SM M otor Standard M otor
Applicable Standard IS 12615-2018 (IE3) IS 12615-2018 (IE2)
Rating 5.5 KW 5.5 KW
Rated Speed 1500 RPM 1420 RPM
Stating Torque 200 % 160 % ( M in)
Nominal Efficiency 90.0 % 87.7 %
Power factor 1 0.80
Rated Current 11.6 A 12.0 A (M ax)
Table 5 gives comparison of Standard and Permanent M agnet
Synchronous M otors
Table 5: Performance Comparison
Part iculars PM Sub. M otor Standard Sub. M otor
Applicable
Standard
- IS 9283-2013
Rat ing 5.5 KW 5.5 KW
Rated Speed 3000 RPM 2810 RPM
Start ing Torque 180 % 125 % (M in)
Efficiency (%) 83.5 % 77.0 %
Rated Current 10.5 A 14.5 A
Table 6 gives data about PM SM for Submersible Pump
showing significant improvement in efficiency.
Table 6: Performance Comparison

M ARKET SHARE INDIA
• IE4 less than 5%
• IE3 15% to 20%
• IE2 40% to 50%
• IE1 or less 25% or more

9. Other characteristics of High Efficiency M otors
(a) Lower Temperature Rise & Longer Life
Lower temperature rise lead to longer life for
high efficiency motors
Figure 3 : (* Ref.) shows temperature rise for IE1 IE2 IE3
IE4 motors
(* Ref.)
Reliability and operation of high efficiency Induction M otors, Fernando J. T. E.
Ferreira and others, IEEE Transactions on industry applications 52 (6), Nov-Dec 2016,
p 4628-4637
b) Lower Slip and higher Speed.
For M otor Loads like Pump, Fans, Output power
varies as cube of speed N3. Input power also may
increase significant ly. In such applicat ions use of High
Efficiency M otors require careful applicat ion study.
c) High Starting Current
High efficiency motors also take significant ly higher
start ing current (up to 900%). M otor protect ion
especially for large inert ia loads, conveyers, blowers
require careful study.
Case Study of Energy Efficient M otors Curtsy M r. Bharat Shah,
NEOPHASE M OTORS, Vadodara -390010
Industry – Cotton Ginning
• Rat ing – 5.7 KW 4 Pole for Ginning M achine
Standard M otor – Output - 3200 Watts
• Efficiency – 85% Input – 3765 Watts
High Efficiency M otor - Output 3200 Watts
• Efficiency – 89% Input – 3586 Watts
• Saving - 169 Watts 8000 hrs.
• 1352 KWH Tariff Rs. 7.5/ KWH = 10140 Rs.
• Standard M otor Price – Rs. 12000
• High Efficiency M otor Price – Rs.15000
• Price difference of Rs. 3000 is recovered by = 0.295 yrs = 3.5 M onths
• Addit ional Saving in Cable losses see Diagram


Standard M otor Cable Loss 56 M otors – 5660 Watts
High Efficiency M otor Cable Loss – 4152 Watts
Saving – 1508 Watts
• Standard M otor 7A X 56 M otors
M ain Cable Loss of 500 m – 18879 Watts
• High Efficiency M otor 6A X 56 M otors
M ain Cable of 500 m – 13870 Watts
Saving - 5009 Watts
Total Saving – 6517 Watts = 6.51 KW
For 8000 Hrs/ Yr Saving = 52080 KWH = Rs. 390600
• Ext ra Price for 56 M otors
56 x Rs. 3000 = Rs. 168,000
Energy Saving 56 M otors = 56 x10,140 Rs. = 567840 Rs.
Cable Loss Saving =390600 Rs
Total 958440 Rs
Pay Back Period = 0.17Yrs = 2.1 months

A Pump Driven by – 40 HP M otor was replaced with -
30 HP New M otor same pressure ,f low
M easured Power Saving – 1.15 KW
2. CHEMICAL PLANT, March 2019

Rewinding(* Ref)
• Rewinding leads to significant loss of efficiency
as can be seen by following case study
• Ten new 15KW motors were independent ly
tested and purposely damaged and sent to
nine different repair companies
• Efficiency loss varied from 0.3 to 3.4%
• Results of tests carried out on 15 kW motors
rewound at nine different repair companies is
given in Table No. 7
(* Ref) Informat ion received from ABB M aneja,
Vadodara 390013

M otor Efficiency Change %
1 -3.4
2 - 0.9
3 -0.6
4 -0.3
5 -1.0
6 -0.7
7 -0.4
8 -0.9
9 -1.5
Average -1.1
Table No. 7

• Every Failure even if repaired, generally reduces
the overall reliability of M otor
• Core losses are higher because of high
temperature & laminat ion damage.
• Higher copper losses for low copper fill.
• Higher frict ional losses for universal fans

Table No. 8 showing payback in months. IE3 in place of IEL
Payback period and Calculation (*Ref.)
* Ref. Information received from ABB M aneja, Vadodara 390013

References:
1. IS 12615: 2018 Line operated three phase AC M otors (IE
Code). Efficiency classes and performance specificat ion
(Third Revision).
2. IEC 60034-30-1: 2014Rotat ing elect rical machines – Part
30-1: Efficiency classes of line operated AC motors (IE
code).
3. IS 15999.2011 (Part 2/ Sec 1) Standard M ethods for
Determining Losses and Efficiency from Tests
4. IEC 60034-2-1: 2007 Test standard for rotat ing M achine
IEC
5. : Reliability and operat ion of high efficiency Induct ion
M otors, Fernando J. T. E. Ferreira and others, IEEE
Transact ions on indust ry applicat ions 52 (6), Nov-Dec
2016, p 4628-4637
6. Informat ion received from ABB M aneja, Vadodara 390013
CH AP T E R – 6 P U MP S , F ANS ,
VAR IAB L E S P E E D DR IVE S
155

PUM P CHARACTRISTIC
156
PUM P CHARACTERISTIC
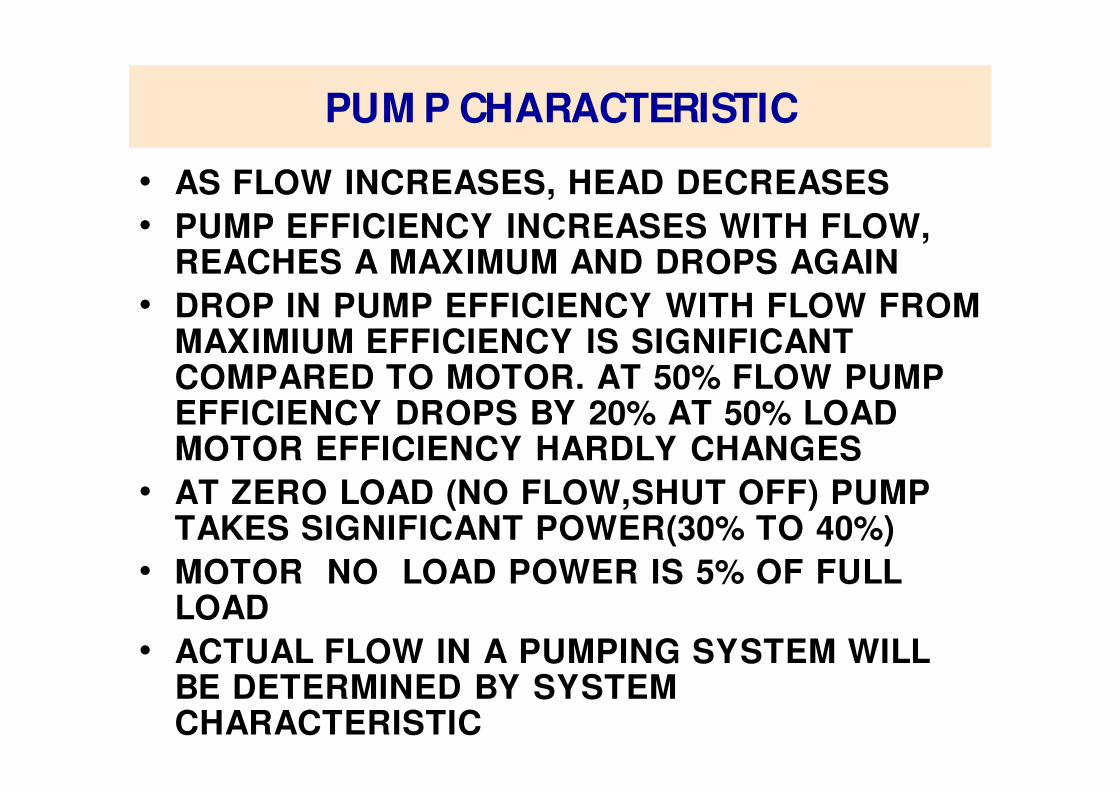
• AS FLOW INCREASES, HEAD DECREASES
• PUMP EFFICIENCY INCREASES WITH FLOW, REACHES A MAXIMUM AND DROPS AGAIN
• DROP IN PUMP EFFICIENCY WITH FLOW FROM MAXIMIUM EFFICIENCY IS SIGNIFICANT COMPARED TO MOTOR. AT 50% FLOW PUMP EFFICIENCY DROPS BY 20% AT 50% LOAD MOTOR EFFICIENCY HARDLY CHANGES
• AT ZERO LOAD (NO FLOW,SHUT OFF) PUMP TAKES SIGNIFICANT POWER(30% TO 40%)
• MOTOR NO LOAD POWER IS 5% OF FULL LOAD
• ACTUAL FLOW IN A PUMPING SYSTEM WILL BE DETERMINED BY SYSTEM CHARACTERISTIC 157

M OTOR
PUM P
LOAD, % Shaft power for M otors
Flow for Pumps
0 25 50 100
9290
100
50
70
80
62
30
MO
TO
RE
FFIC
IEN
CY
PU
MP
EFFIC
IEN
CY
100
0
50
PAGE-2.3
COM PARISION OF M OTOR AND PUM P

PUM P – SYSTEM INTERACTION
159
SYSTEM HEAD=STATIC HEAD+FRICTION HEAD WHICH VARIES AS
FLOW 2
ENERGY SAVING OPPORTUNITIES IN PUM P
• HIGH EFFICIENCY PUM PS AND FANS
• AVOID THROTTLING / DAM PLER LOSS
• M ATCH PUM P/ FAN TO SYSTEM BY
1. IM PELLER TRIM M ING
2. CHANGING IM PELLER
3. PROPER SIZE PUM P
4. VARIBLE SPEED DRIVES
160
HIGH EFFICIENCY PUM PS AND FANS
• IM PROVED DESIGN AVAILABLE AT SM ALL EXTRA
COST
• BETTER M ATERIAL BETTER DESIGN
• BETTER M ANUFACTURING TECHNIQUES
• M ANY INDUSTRIES REPLACING OLD M OTORS AND
PUM PSWITH HIGH EFFICIENCY DESIGNS
161
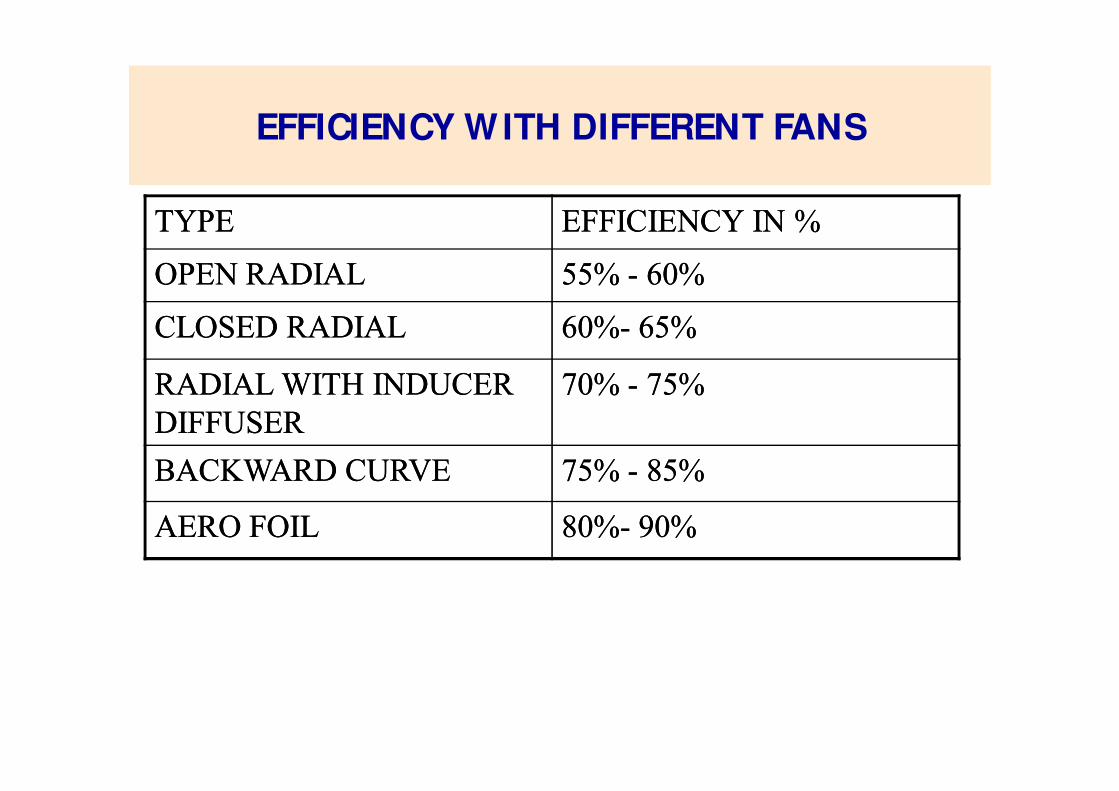
EFFICIENCY WITH DIFFERENT FANS
TYPETYPE EFFICIENCY IN %EFFICIENCY IN %
OPEN RADIALOPEN RADIAL 55% 55% -- 60%60%
CLOSED RADIALCLOSED RADIAL 60%60%-- 65%65%
RADIAL WITH INDUCER RADIAL WITH INDUCER
DIFFUSERDIFFUSER
70% 70% -- 75%75%
BACKWARD CURVEBACKWARD CURVE 75% 75% -- 85%85%
AERO FOILAERO FOIL 80%80%-- 90%90%
162
LARGE NUBER OF FANS CHANGED BY CEM ENT
AND PROCESS PLANTS
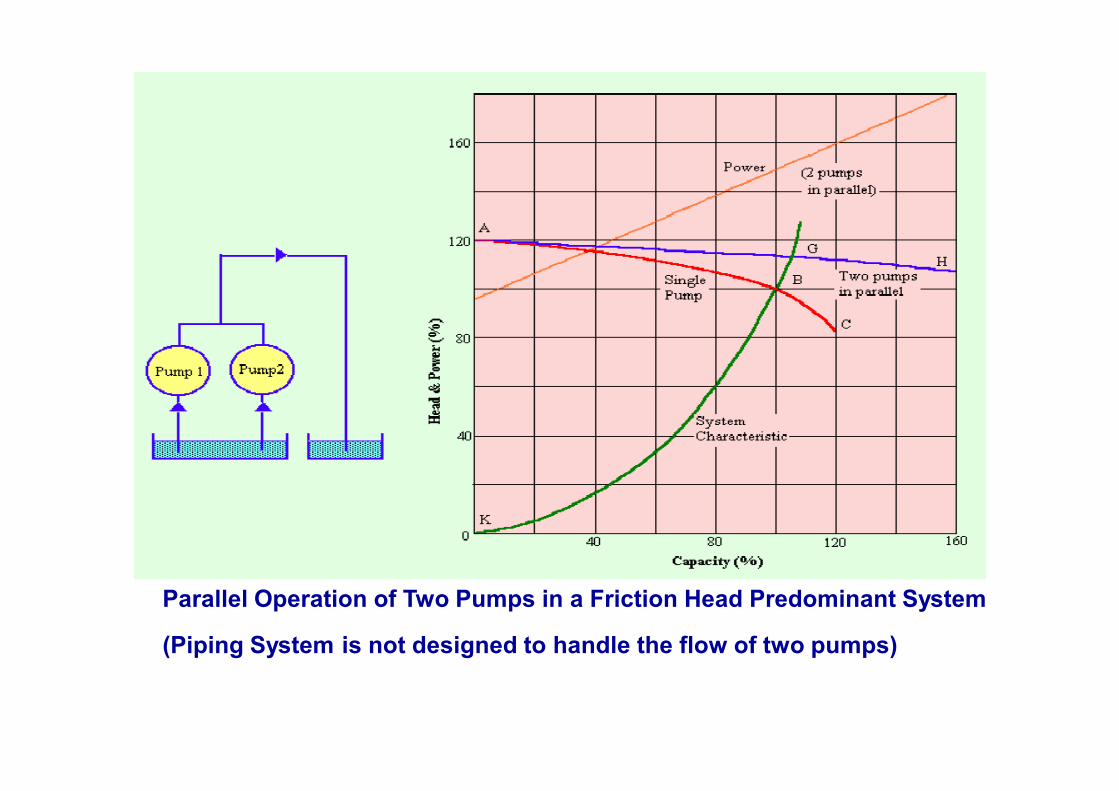
Parallel Operation of Two Pumps in a Friction Head Predominant System
(Piping System is not designed to handle the flow of two pumps)
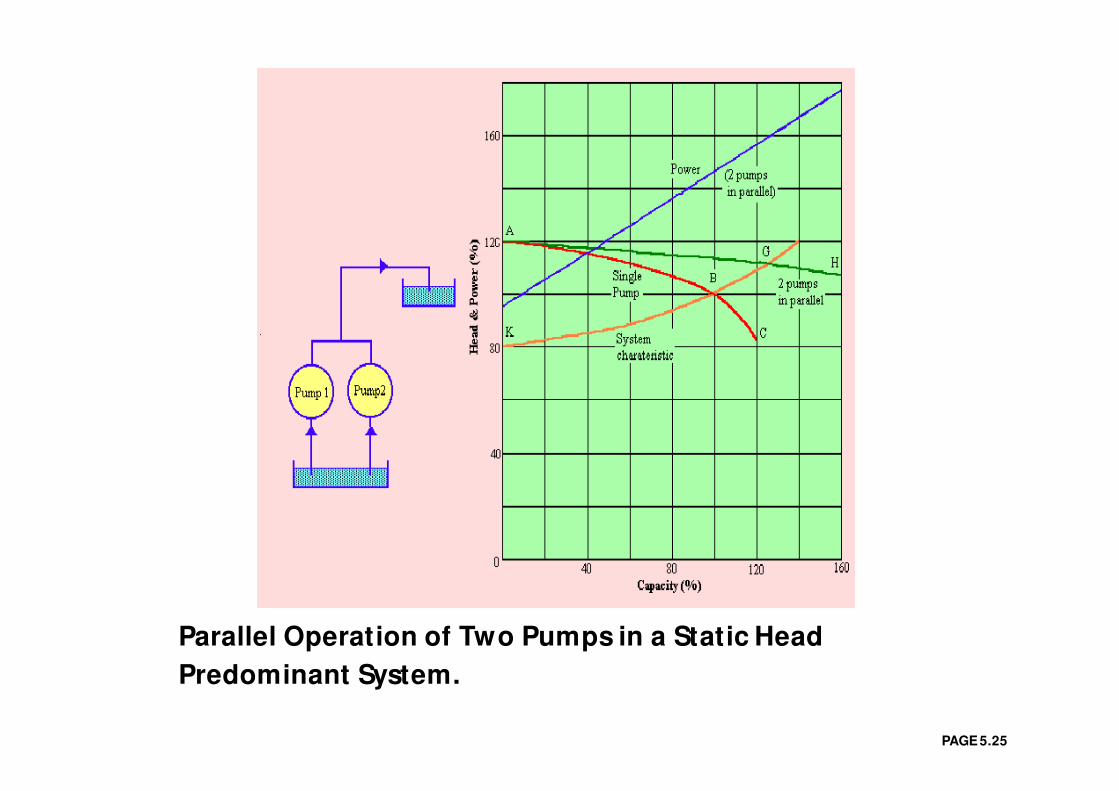
Parallel Operation of Two Pumps in a Static Head
Predominant System.
PAGE 5.25
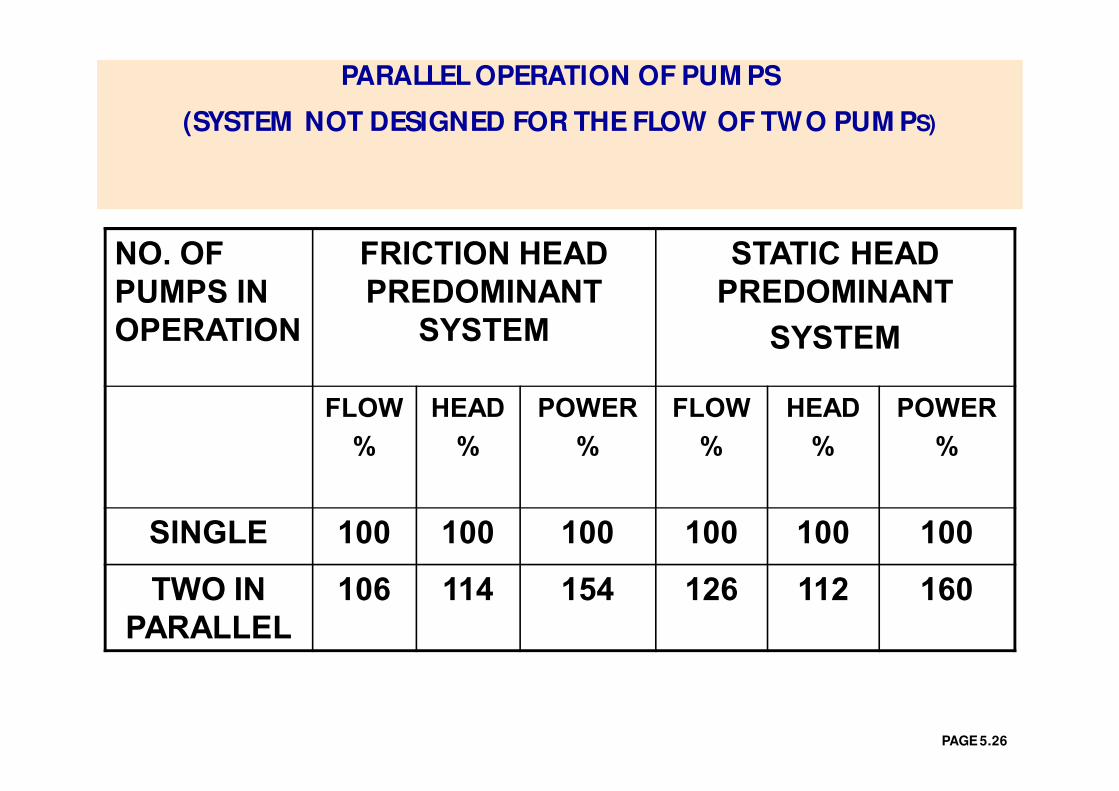
NO. OF
PUMPS IN
OPERATION
FRICTION HEAD
PREDOMINANT
SYSTEM
STATIC HEAD
PREDOMINANT
SYSTEM
FLOW
%
HEAD
%
POWER
%
FLOW
%
HEAD
%
POWER
%
SINGLE 100 100 100 100 100 100
TWO IN
PARALLEL
106 114 154 126 112 160
PARALLEL OPERATION OF PUM PS
(SYSTEM NOT DESIGNED FOR THE FLOW OF TWO PUM PS)
PAGE 5.26

THROTTLING LOSS
166
TO REDUCE THROTTLING LOSS
• TRIM IM PELLER
• SM ALLER IM PELLER
• SM ALLER PUM P
• VARIABLE SPEED DRIVE
167

PUM P PERFORM ANCE WITH THROTTLING CONTROL
Flow LPMFlow LPM 1200012000 1100011000 1000010000 90009000 80008000 70007000 60006000
System Pressure System Pressure
(m)(m)23.5023.50 21.4021.40 19.3419.34 17.9317.93 16.0016.00 14.6014.60 13.3513.35
Pump PressurePump Pressure 23.2023.20 25.0025.00 26.5026.50 27.5027.50 28.5028.50 29.0029.00 29.5029.50
Pump EfficiencyPump Efficiency 8686 8585 8383 79.5079.50 7575 7272 6969
Pump Input (kw)Pump Input (kw) 53.5853.58 52.8652.86 52.1652.16 50.8750.87 49.6749.67 46.0746.07 41.9241.92
Motor Load (%)Motor Load (%) 97.4197.41 96.1196.11 94.8594.85 92.4992.49 90.3190.31 83.7683.76 76.2076.20
Motor Effi. (%)Motor Effi. (%) 90.0090.00 89.9089.90 89.9089.90 89.6089.60 89.5089.50 89.3089.30 89.0089.00
Motor input (kw)Motor input (kw) 59.5359.53 58.8058.80 58.0258.02 56.7756.77 55.4755.47 51.5951.59 47.1047.10
Starter Effi. (%)Starter Effi. (%) 99.8099.80 99.8099.80 99.8099.80 99.8099.80 99.8099.80 99.8099.80 99.8099.80
Input (kw)Input (kw) 59.6559.65 58.9258.92 58.1458.14 56.8856.88 55.6155.61 51.6951.69 47.2047.20
168

Pump performance with Variable Speed
Flow LPMFlow LPM 1200012000 1100011000 1000010000 90009000 80008000 70007000 60006000
System Pressure System Pressure
(m) (Pump (m) (Pump
Pressure)Pressure)
23.5023.50 21.4021.40 19.3419.34 17.9317.93 16.0016.00 14.6014.60 13.3513.35
Pump EfficiencyPump Efficiency 8686 8686 85.585.5 8585 8383 8181 7878
Pump Input (kw)Pump Input (kw) 53.5853.58 44.7344.73 36.9636.96 31.0231.02 25.2025.20 20.6220.62 16.7816.78
Motor rpmMotor rpm 14501450 13351335 12801280 12101210 11301130 10651065 10001000
Motor Load (%)Motor Load (%) 97.4097.40 81.3281.32 67.2067.20 56.4056.40 45.8145.81 37.4037.40 30.5030.50
Motor Effi. (%)Motor Effi. (%) 93.7093.70 9494 93.7093.70 93.6093.60 92.5092.50 9292 90.0090.00
Motor input (kw)Motor input (kw) 57.1857.18 47.5847.58 39.4539.45 33.1433.14 27.2527.25 22.4122.41 18.6418.64
Controller Effi. (%)Controller Effi. (%) 9797 9696 9595 9494 9393 92.5092.50 89.5089.50
Input (kw)Input (kw) 58.9558.95 49.5649.56 41.5241.52 35.2535.25 29.3029.30 24.2324.23 20.8320.83
Saving input (kw)Saving input (kw) 0.700.70 9.369.36 16.6216.62 21.6321.63 26.3126.31 27.4627.46 26.3726.37
% saving (throttled % saving (throttled
i/p)i/p)
1.121.12 15.8915.89 28.5628.56 38.0338.03 47.3147.31 53.1253.12 55.8055.80
169
NOTE: M OTOR ALSO REPLACED BY HIGH EFFICIENCY M OTOR. M AJOR SAVINGS FROM
VARIABLE SPEED
170
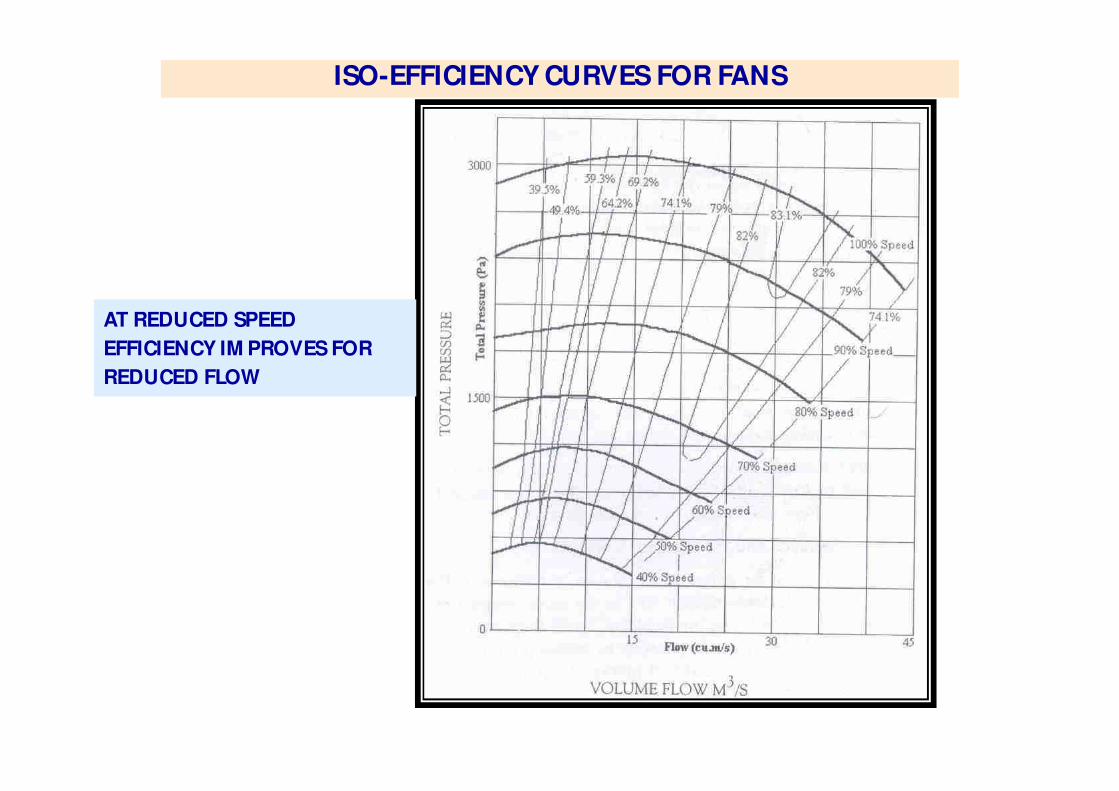
ISO-EFFICIENCY CURVES FOR FANS
AT REDUCED SPEED
EFFICIENCY IM PROVES FOR
REDUCED FLOW
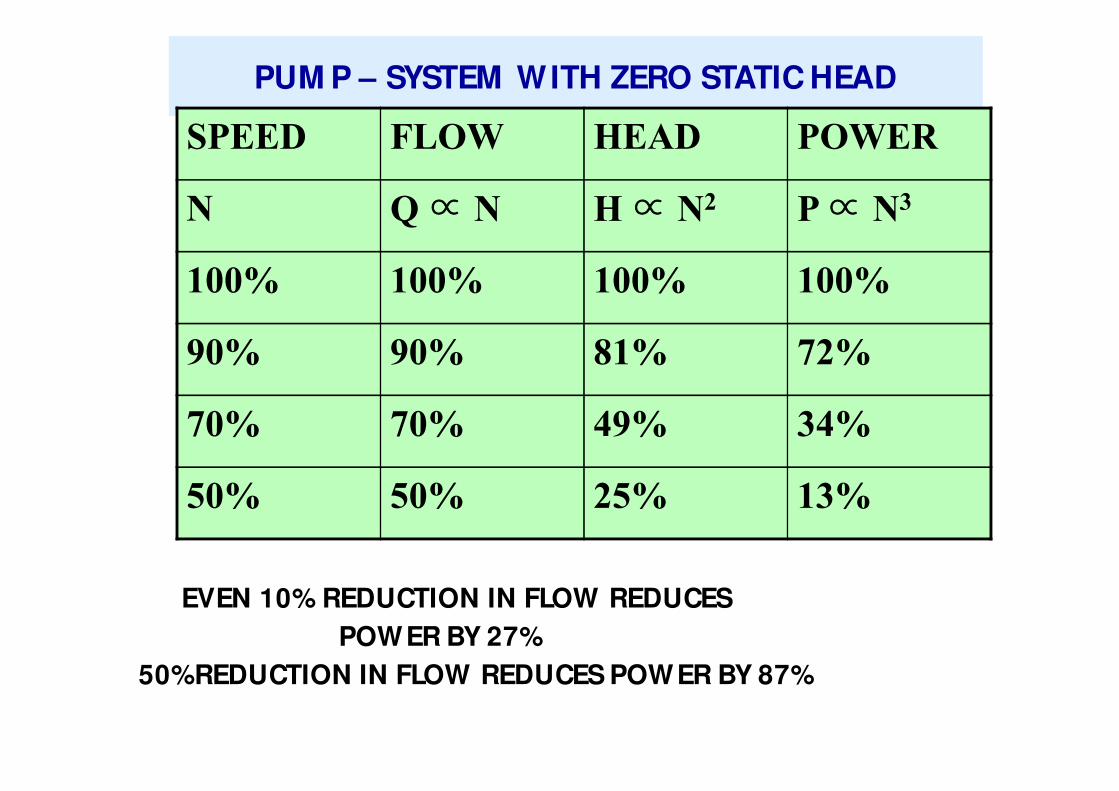
PUM P – SYSTEM WITH ZERO STATIC HEAD
SPEED FLOW HEAD POWER
N Q ∝ N H ∝ N2 P ∝ N3
100% 100% 100% 100%
90% 90% 81% 72%
70% 70% 49% 34%
50% 50% 25% 13%
171
EVEN 10% REDUCTION IN FLOW REDUCES
POWER BY 27%
50%REDUCTION IN FLOW REDUCES POWER BY 87%
VARIABLE SPEED DRIVES
• VARIBLE SPPED – M AJOR OPPURTUNITY IN PUM PS
AND FANS
• SAVINGS - 10% TO 70%
• PAYBACK – 1YEAR TO 2 YEAR
• SIZE – WATTS TO M EGAWATTS
172
VARIABLE SPEED OPTIONS
• STEAM TURBINE
• PULLEYS
• GEARS
• EDDY CURRENT COUPLING
• HYDRAULIC COUPLING
• M ULTI SPEED M OTOR
• SLIP RING M OTOR WITH SLIP POWER RECOVERY
• D C M OTOR
• INDUCTION M OTORS WITH INVERTERS
• INVERTERS NOW PREFERRED.
AVAILABLE IN ALL SIZES AND RELIABLE
173
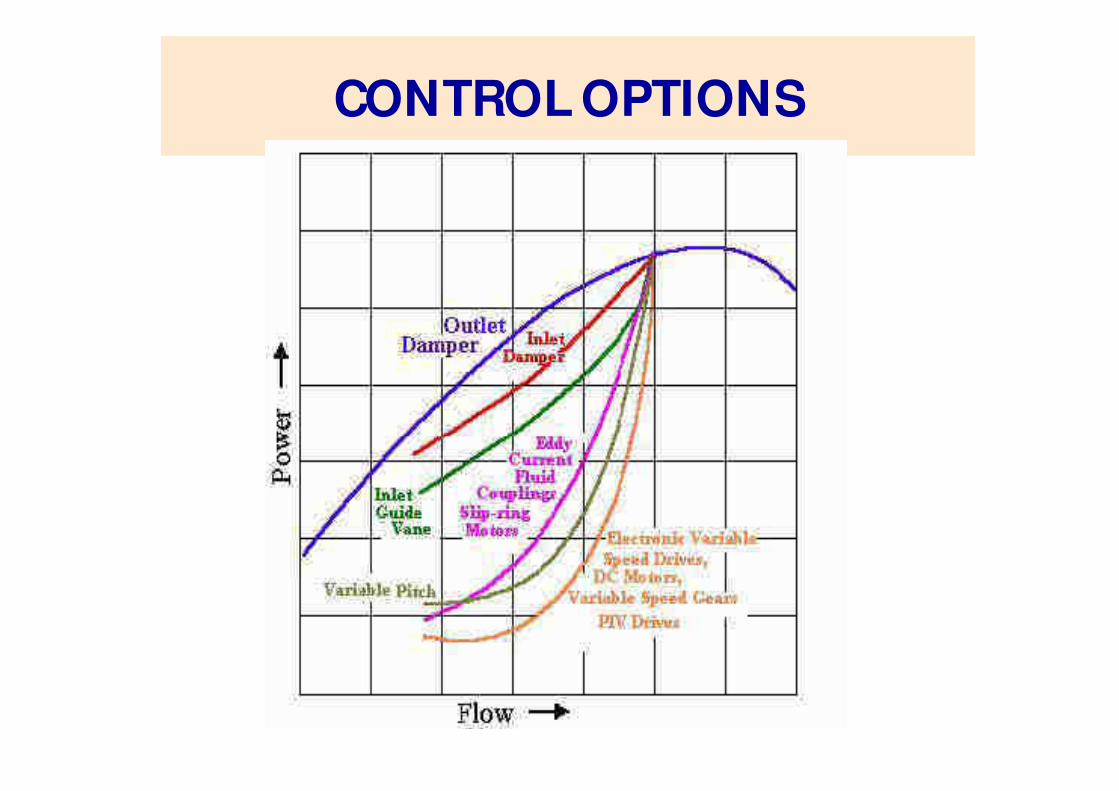
CONTROL OPTIONS
174

CH AP T E R – 7L IGH T ING
175
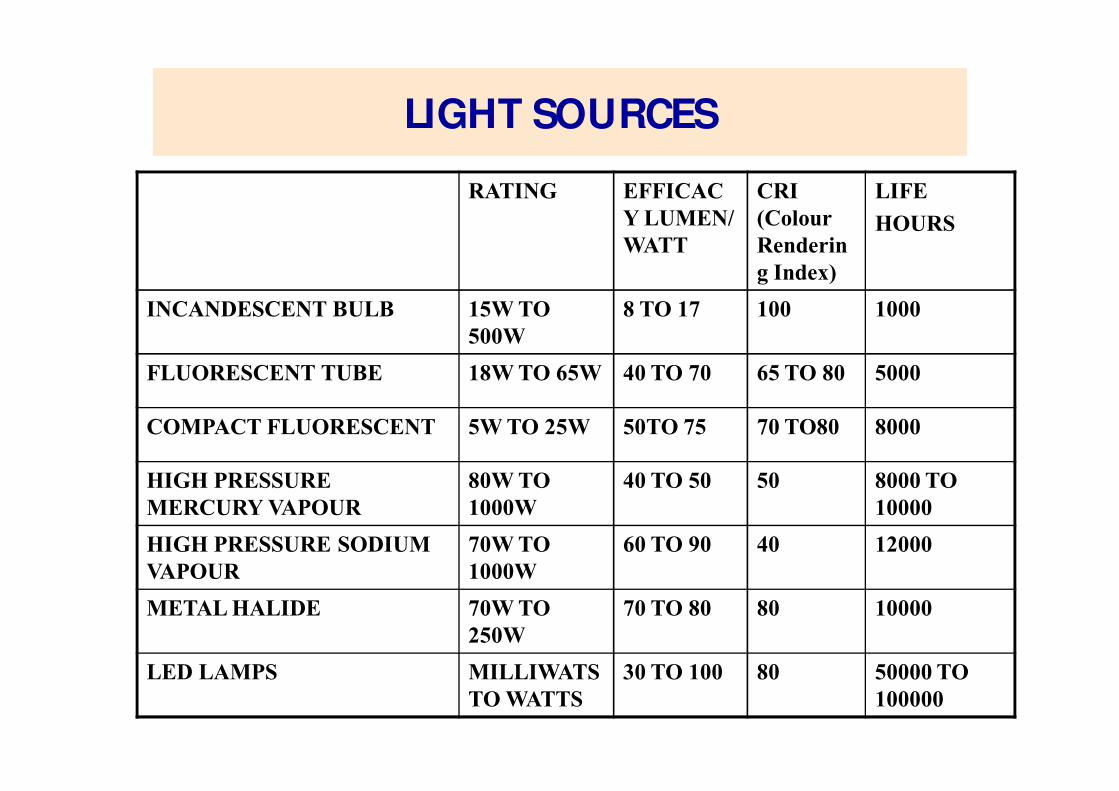
LIGHT SOURCES
RATING EFFICAC
Y LUMEN/
WATT
CRI
(Colour
Renderin
g Index)
LIFE
HOURS
INCANDESCENT BULB 15W TO
500W
8 TO 17 100 1000
FLUORESCENT TUBE 18W TO 65W 40 TO 70 65 TO 80 5000
COMPACT FLUORESCENT 5W TO 25W 50TO 75 70 TO80 8000
HIGH PRESSURE
MERCURY VAPOUR
80W TO
1000W
40 TO 50 50 8000 TO
10000
HIGH PRESSURE SODIUM
VAPOUR
70W TO
1000W
60 TO 90 40 12000
METAL HALIDE 70W TO
250W
70 TO 80 80 10000
LED LAMPS MILLIWATS
TO WATTS
30 TO 100 80 50000 TO
100000176
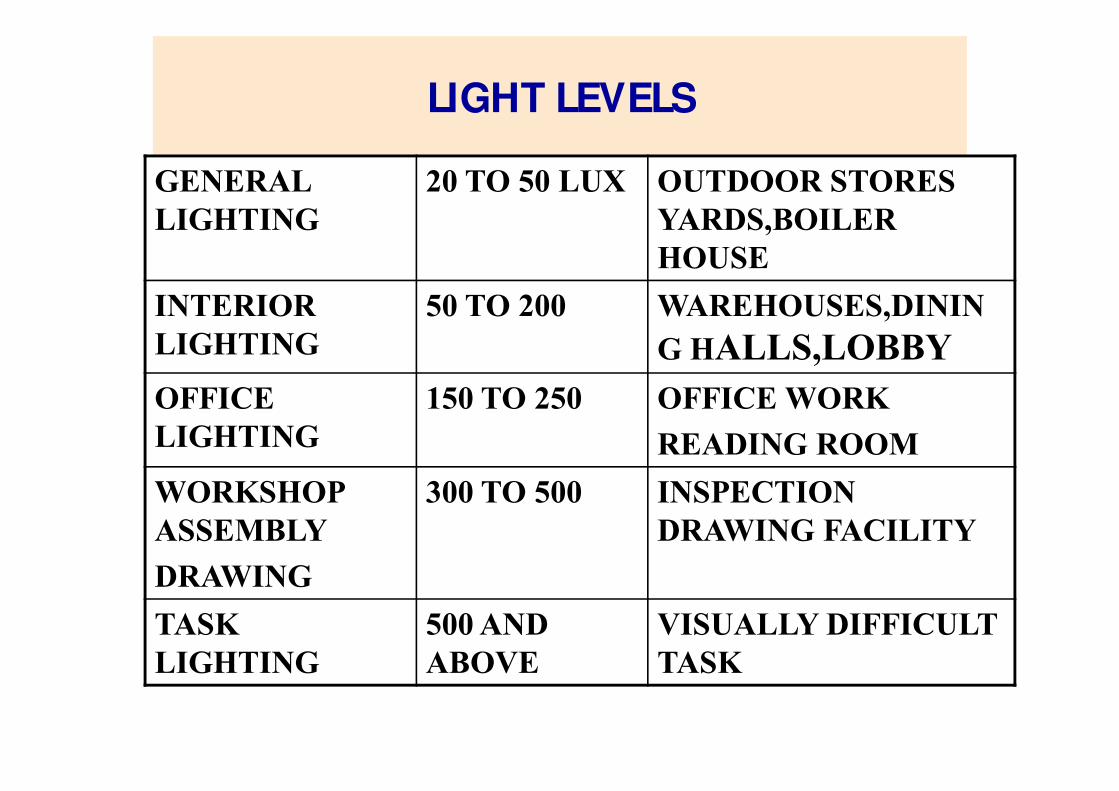
LIGHT LEVELS
GENERAL
LIGHTING
20 TO 50 LUX OUTDOOR STORES
YARDS,BOILER
HOUSE
INTERIOR
LIGHTING
50 TO 200 WAREHOUSES,DININ
G HALLS,LOBBY
OFFICE
LIGHTING
150 TO 250 OFFICE WORK
READING ROOM
WORKSHOP
ASSEMBLY
DRAWING
300 TO 500 INSPECTION
DRAWING FACILITY
TASK
LIGHTING
500 AND
ABOVE
VISUALLY DIFFICULT
TASK
177
ENERGY SAVING OPPORTUNITIES
• USE OF DAYLIGHT
• EFFICIENT LIGHT SOURCES
• TASK LIGHTING
• VOLTAGE CONTROL
• SENSORS, DIM M ERS, CONTROL DEVICES
178
DAYLIGHT
• IN INDUSTRIES, USE OF GLASS OR
POLYCARBONATE SHEETS HAS REDUCED
LIGHTING CONSUM PTION DURING
DAYTIM E
• IN OFFICES, LIGHTING USE CAN BE M INIM ISED
NEAR WINDOWS. DIM M ERS WITH SENSORS CAN
DO THISAUTOM ATICALLY
• LARGE COM PLEXES PROVIDE CENTRAL ATRIUM
WITH FRP SHEETS
179
M ORE EFFICIENT LIGHT SOURCES
• REPLACE INCANDESCENT WITH CFL/ LED
• REPLACE M ERCURYWITH M ETAL HALIDE
HIGH PRESSURE SODIUM
• REPLACE T – 12,T – 8 WITH T – 5/ LED
• REPLACE STANDARD TUBE LIGHT WITH TRI PHSPHO
ROUS TUBE LIGHT
• REPLACE ELECTROM AGNECTIC BALLAST WITH
ELECTRONIC BALLAST
180
TASK LIGHTING
• Task Light ing M eans Provide Illuminat ion For a GivenTask at That Point Only When Required
• For Factories Provide CFLS/ LED On M achine Tools.Provide Intensive Light ing at Inspect ion Benches Only
• For Offices; Provide CFL/ LED For Reading On a Table,Keeping Low Overall Light ing Levels
• Engineering, Text ile Industries have Reduced FixtureHeight To Reduce Number Of Lamps And ProvideBetter Light ing
181
VOLTAGE CONTROL
• LIGHTING FEEDER VOLTAGE RISES
DURING NIGHT TIM E FROM 415V TO 460/ 470V. THIS LEADS TO
WASTEFUL ENERGY CONSUM PTION
• FOR SINGLE PHASE, KEEP VOLTAGE 190-210
• FOR THREE PHASE, KEEP VOLTAGE 390-410
• SEPARATE LIGHTING TRANSFORM ERS WITH TAPS TO BE USED
• ENERGY SAVING 10%-20%
• LIGHT OUTPUT DOES DECREASE
182
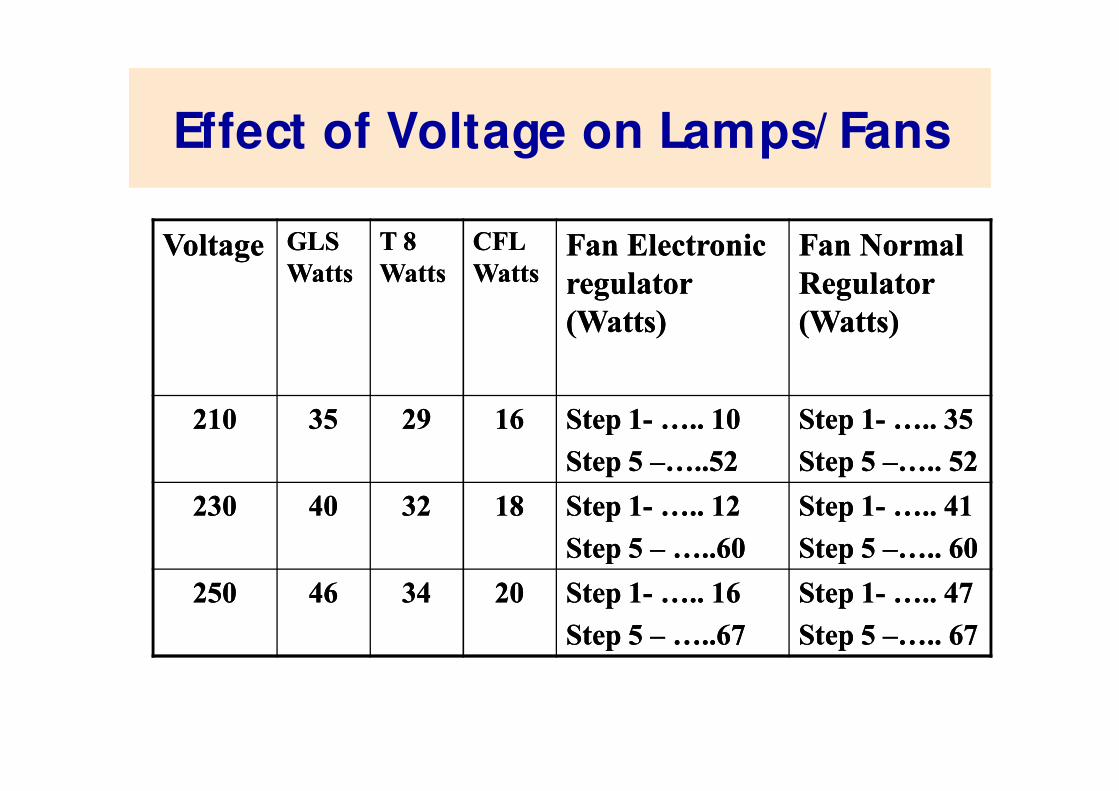
Effect of Voltage on Lamps/ Fans
VoltageVoltage GLS GLS
WattsWatts
T 8 T 8
WattsWatts
CFL CFL
WattsWattsFan Electronic Fan Electronic
regulator regulator
(Watts)(Watts)
Fan Normal Fan Normal
Regulator Regulator
(Watts)(Watts)
210210 3535 2929 1616 Step 1Step 1-- ….. 10 ….. 10
Step 5 Step 5 ––…..52…..52
Step 1Step 1-- ….. 35 ….. 35
Step 5 Step 5 ––….. 52….. 52
230230 4040 3232 1818 Step 1Step 1-- ….. 12 ….. 12
Step 5 Step 5 –– …..60…..60
Step 1Step 1-- ….. 41 ….. 41
Step 5 Step 5 ––….. 60….. 60
250250 4646 3434 2020 Step 1Step 1-- ….. 16 ….. 16
Step 5 Step 5 –– …..67…..67
Step 1Step 1-- ….. 47 ….. 47
Step 5 Step 5 ––….. 67….. 67
183
SENSORS, CONTROLS
• Dimmers available for Incandescent as well as
Fluorescent Tubes
• Provide M ult iple Switches So That Individual ,
M achine, table Light ing Can Be Controlled
• Occupancy Sensors Can Switch Off Lights , AC, When
Rooms Not Occupied, hotels, conference Rooms
184
NEW TECHNOLOGIES
• ELECTRONIC BALLAST CONSUM ES ONLY 1 TO 2 WATTS COM PARED TO 10 TO 16 WATTS OF NORM AL BALLAST
• NORM AL TUBE + CHOKE - 50 TO 55WATTS
• SLIM TUBE WITH ELECTRONIC CHOKE - 32 TO 38 WATTS
• ELECTRONIC BALLAST OPERATION 30 TO 50KHZ
• T- 12 TUBELIGHT DIA 12/ 8 INCH 40W
• T - 8 TUBELIGHT DIA 8/ 8 INCH 36W
• T - 5 TUBELIGHT DIA 5/ 8 INCH 28W
• SUPER REFLECTIVE ALUM INIUM COATING ALLOW FEWER TUBES
• LED LAM PS WERE EXPENSIVE. GOVERNM ENT IS PURCHASING LED LAM PS IN LARGE NUM BER. PRICES OF LED LAM PS AND TUBELIGHTS HAVE REDUCED DRASTCALYY IN LAST ONE YEAR.
185

Global M arket Share of Lighting Technology
• Incandescent Bulb 20%
• CFL and Tube lights 60%
• LEDs 15%
• Others 5%
186

Following shows significant deduct ion in product ion of
incandescent bulb and significant increase in product ions of LED
Lamps in last 7 years 2010 -2017.
CH AP T E R -8COMP R E S S E D AIR
188
INTRODUCTION
• Compressed Air Is Very Inefficient and Expensive
Ut ility
• Only 10% to 15% Input Energy available to do work.
Rest Is Wasted As Heat
• After Dist ribut ion Losses And Leakages Actual Work
done by Compressed Air Is only 5% or So
• 100 CFM at 7 Bar(100lbs/ Inch2) require 16 To 17 KW
189
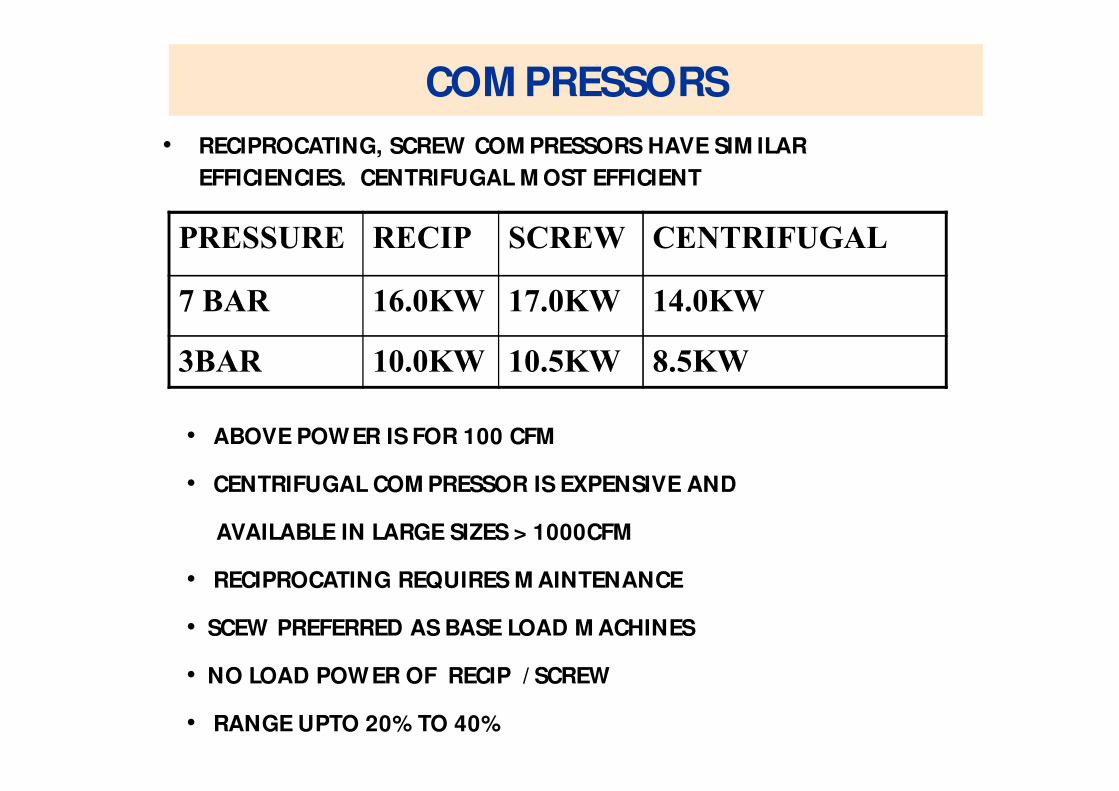
COM PRESSORS
• RECIPROCATING, SCREW COM PRESSORS HAVE SIM ILAR
EFFICIENCIES. CENTRIFUGAL M OST EFFICIENT
PRESSURE RECIP SCREW CENTRIFUGAL
7 BAR 16.0KW 17.0KW 14.0KW
3BAR 10.0KW 10.5KW 8.5KW
190
• ABOVE POWER IS FOR 100 CFM
• CENTRIFUGAL COM PRESSOR IS EXPENSIVE AND
AVAILABLE IN LARGE SIZES > 1000CFM
• RECIPROCATING REQUIRES M AINTENANCE
• SCEW PREFERRED AS BASE LOAD M ACHINES
• NO LOAD POWER OF RECIP / SCREW
• RANGE UPTO 20% TO 40%

ENERGY SAVING OPPORTUNITIES
• ALTERNATIVE TO COM PRESSED AIR
• M INIM ISE COM PRESSED AIR LEKAGE
• REGULAR COM PRESSOR M AINTENENCE
• PROPER TYPE OF AIR DRIER
• M INIM ISE AIR PRESSURE
191

ALTERNATIVES TO COM PRESSED AIR
• VACCUM CLEANING IN PLACE OF COM PRESSED AIR
• M INIM ISE AIR PRESURE IF AT ALL USED IN CLEANING. 2BAR
IN PLACE OF 7BAR
• M ECHANICAL TRANPORT OF M ATERIAL IN PLACE OF
PNUM ATIC TRANSPORT IM PLEM ENTED IN CEM ENT,
PAPERCHIPS, CHEM ICALS. SAVINGS 80%
• ELECTRICAL TOOLS IN PLACE OF PNUM ATIC TOOLS.
• IF NECESSARY USE 200HZ SUPPLY(FOR HIGH SPEED)
192
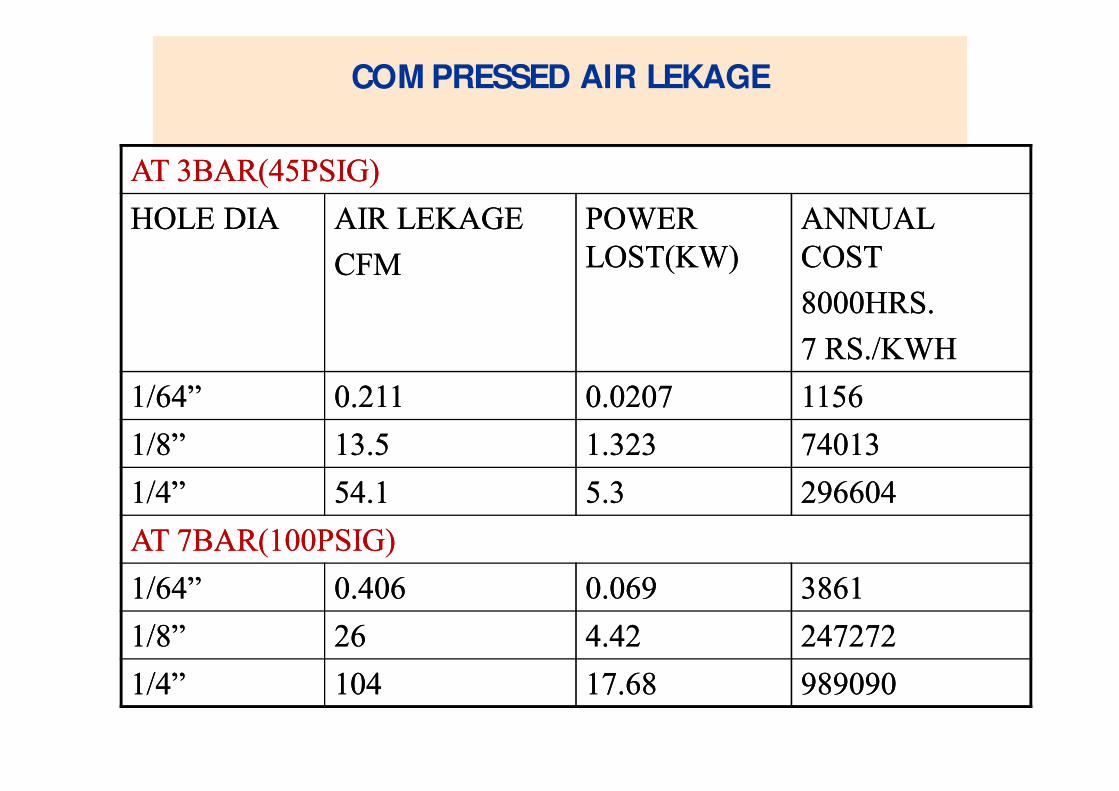
COM PRESSED AIR LEKAGE
AT 3BAR(45PSIG)AT 3BAR(45PSIG)
HOLE DIAHOLE DIA AIR LEKAGEAIR LEKAGE
CFMCFM
POWER POWER
LOST(KW)LOST(KW)
ANNUAL ANNUAL
COSTCOST
8000HRS.8000HRS.
7 RS./KWH7 RS./KWH
1/64”1/64” 0.2110.211 0.02070.0207 11561156
1/8”1/8” 13.513.5 1.3231.323 7401374013
1/4”1/4” 54.154.1 5.35.3 296604296604
AT 7BAR(100PSIG)AT 7BAR(100PSIG)
1/64”1/64” 0.4060.406 0.0690.069 38613861
1/8”1/8” 2626 4.424.42 247272247272
1/4”1/4” 104104 17.6817.68 989090989090193

LEAKAGE TEST
• OBSERVE LOADING,UNLOADING TIM E WHEN NO ACTUAL USE
• LEAKAGE= Q* ONTIM E/ ON+OFF TIM E
• Q – CAPACITY CFM
• CAN BE DONE WITH DIFFERENT SECTIONS
• TO BE DONE EVERY M ONTH
• LEAKAGES FROM FLANGES , JOINTS, VALVES, PIPES TO BE PLUGGED BY NOTING NOISE FROM LEAKAGES
• BETTER TO OUTSOURCE
• 5% TO 10% ACCEPTABLE
• 20% TO 50% ACTUAL
194
COM PRESSOR M AINTENANCE
• CARRY CAPACITY TEST WITH RECEIVER BY P1 INTIAL
PRESSURE TO P2 FINAL PRESSURE
• Q = P2-P1/ Pa* Vr/ t
• Q = CFM CAPACITY
• P2 = FINAL PRESSURE BAR
• P1 = INTIAL PRESSURE BAR
• Pa= ATM OSPHRIC PRESSURE, 1 BAR
• Vr = RECEIVER VOLUM E, FOR CFM / FT3
• t = TIM E IN M INUTES
• DO THIS EVERY SIX M ONTHS
• REPLACE WORN OUT PARTS,PROVIDE PROPER OIL
GREASE
195
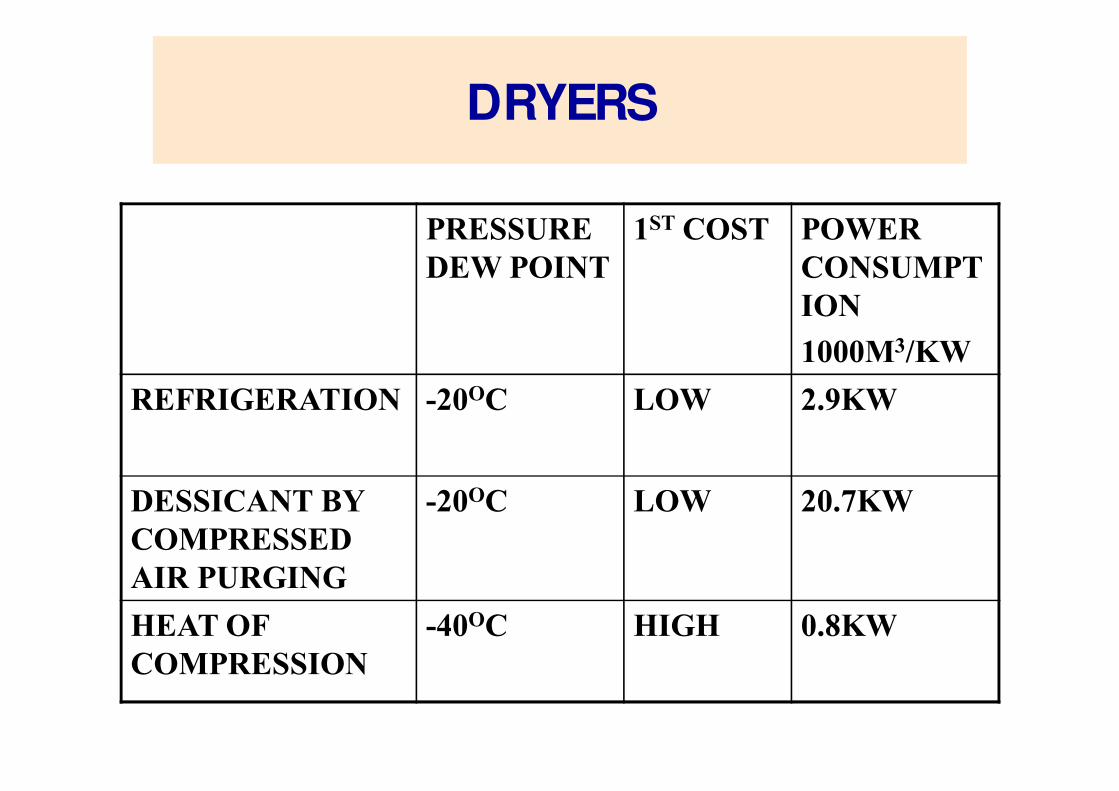
DRYERS
PRESSURE
DEW POINT
1ST COST POWER
CONSUMPT
ION
1000M3/KW
REFRIGERATION -20OC LOW 2.9KW
DESSICANT BY
COMPRESSED
AIR PURGING
-20OC LOW 20.7KW
HEAT OF
COMPRESSION
-40OC HIGH 0.8KW
196

NEW TECHNOLOGIES
• AIR AM PLIFIER TAKES OUTSIDE AIR. USES SM ALL
AM OUNT OF COM PRESSED AIR
• VFDS ARE USED FOR CAPACITY CONTROL OF
RECIPS AND SCREW COM PRESSORS
• 20% TO 30% SAVING
197

CH AP T E R -9 R E F R IGE R AT ION
198

REFRIGERATION
CHILLED WATER, BRINE FOR PROCESSES
ICE PLANTS
AIR CONDITIONING
HUM IDIFICATION – M OISTURE REM OVAL
VAPOUR COM PRESSION SYSTEM RUNS ON
ELECTRICITY
VAPOUR ABSOBPTION SYSTEM RUNS ON HEAT
199
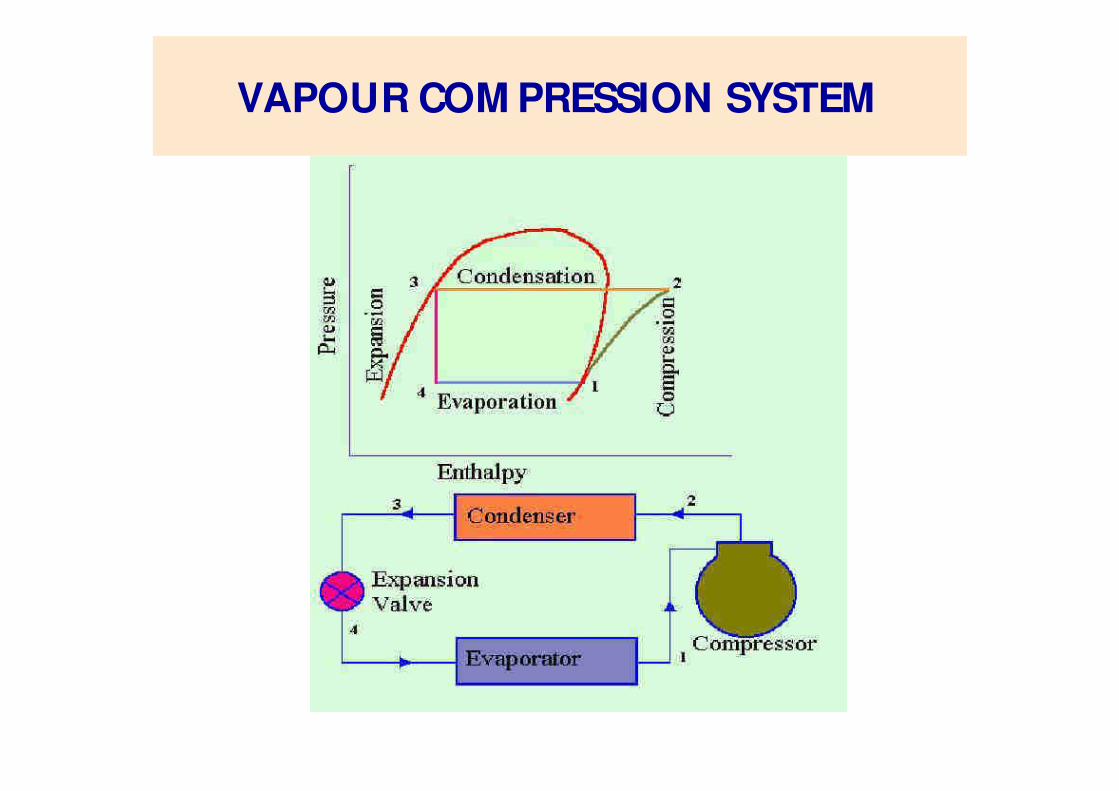
VAPOUR COM PRESSION SYSTEM
200
REFRIGERATION COM PRESSORS
• RECIPROCATING - UPTO 200TR
• SCREW - 100 TO 750 TR
• CENTRIFUGAL - 200 TR OR M ORE
• 1TON OF REFRIGERATION = 3023 KCAL/ HOUR
12000 BTU/ HOUR, OR 3.515 KW
201

VAPOUR ABSOBPTION SYSTEM
• LITHIUM BROM IDE AND WATER SYSTEM FOR TEM P
UPTO 60C
• WATER(ABSORBENT) AND AM M ONIA(REFRIGERENT)
FOR TEM P. SYSTEM LESS THAN 00C.
• SAVES 90% POWER BUT HEAT INPUT IS QUITE
SIGNIFICANT
• OVERALL ECONOM ICS DEPEND ON COSTOF HEAT
SUPPLIED
202
VAPOUR COM PRESSION SYSTEM
• COP = COEFFICIENT OF PERFORM ANCE
• COP = REFRIGERATION EFFECT/ WORK DONE
• VALUE- 4.0 TO 6.0 VAPOUR COM PRESSION
• 1.0 FOR VAPOUR ABSORPTION
• SPECIFIC POWER CONSUM PTION
• KW/ TON 0.6 TO 1.0 FOR CHILLED WATER AT 80C
• EER= ENERGY EFFICIENCY RATIO
• EER = COP = REFRIGERATION EFFECT/ WORK DONE
203
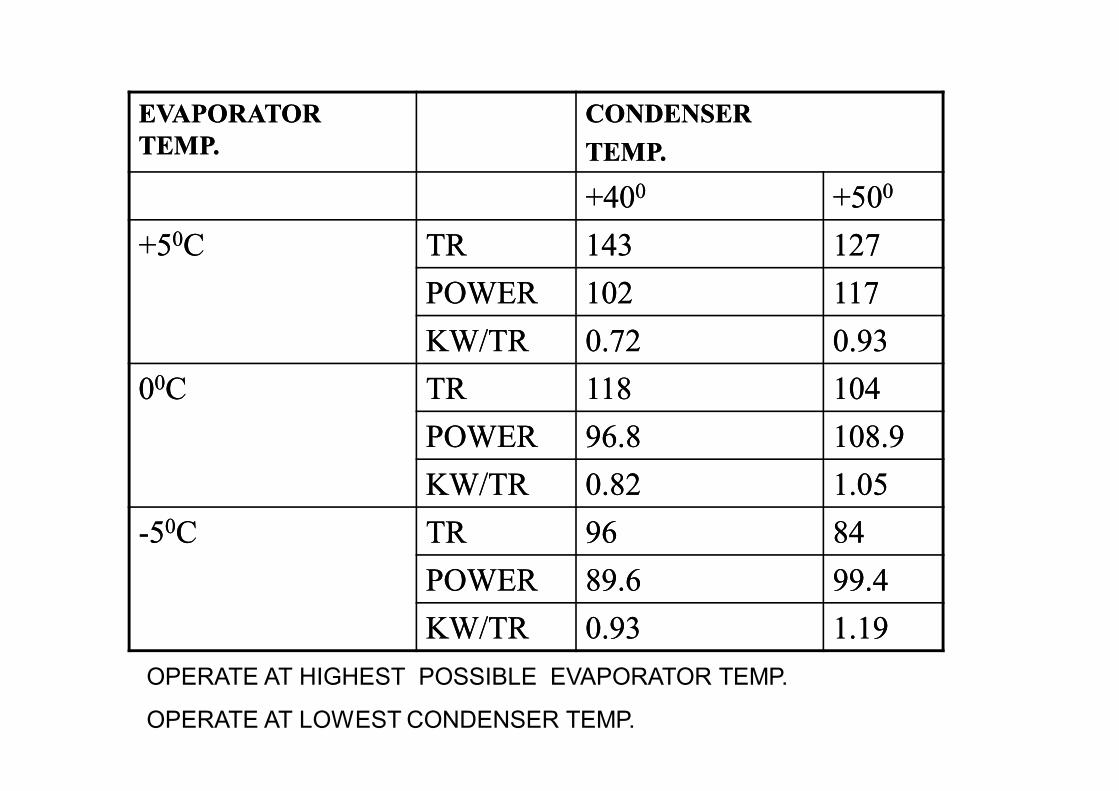
EFFECT OF TEM PERATURE
EVAPORATOR EVAPORATOR
TEMP.TEMP.
CONDENSERCONDENSER
TEMP.TEMP.
+40+4000 +50+5000
+5+500CC TRTR 143143 127127
POWERPOWER 102102 117117
KW/TRKW/TR 0.720.72 0.930.93
0000CC TRTR 118118 104104
POWERPOWER 96.896.8 108.9108.9
KW/TRKW/TR 0.820.82 1.051.05
--5500CC TRTR 9696 8484
POWERPOWER 89.689.6 99.499.4
KW/TRKW/TR 0.930.93 1.191.19
204
OPERATE AT HIGHEST POSSIBLE EVAPORATOR TEMP.
OPERATE AT LOWEST CONDENSER TEMP.

ENERGY SAVING OPPORTUNITIES
• OPTIM UM TEM P. SETTING
• EACH 10C TEM P INCREASE IN AIR CONDITIONED SPACE
REDUCES POWER BY 2% TO 3%
• SET A.C. TEM P. AT 270 TO 300
• USE FANS FOR AIR CIRCULATION
• FOR COLD STORAGE, BETTER AND EQUAL AIR DISTRIBUTION
ALLOWS HIGHER TEM P.
• BETTER HEAT EXCHANGERS
205
REDUCTION IN HEAT LOAD
• PROVIDE AIR CONDITIONING ONLY IN USED AREA
• PROVIDE FALSE CEILING
• REDUCE OUTSIDE HEAT BY INSULATION,SUN CONTROL FILM S ETC.
• FOR VEGETABLES 50C REQUIRED
• FOR ICECREAM ES -300 C REQUIRED
• SEGREGATE SUCH LOAD
• KEEP M OTORS,HEATING DEVICES OUTSIDE CONDITIONED SPACE
• AIR CURTAINS,AUTOM ATIC DOOR CLOSURES
206

LARGER HEAT EXCHANGER
• LARGER HEAT EXCHANGER,CONDENSER AND
EVAPORATORS ALLOW HIGHER EVAPORATOR TEM P.
AND LOWER CONDENSER TEM P.
• REGULARLYCLEAN ALL HEAT EXCHANGERS
• PROVIDE PROPER WATER TREATM ENT
• PERFORM ANCE CAN DROP BY 50% IN ABSCENCE OF
CLEANING AND WATER TREATM ENT
207

NEW TECHNOLOGY
• THERM AL STORAGE TO TAKE ADVANTAGE OF CHEAP
POWER AT NIGHT
• TARIIFF ASWELL ASTEM P. ARE FAVOURABLE
• HEAT RECOVERY SYSTEM S
• HEAT PIPES,HEAT WHEELS VARIABLE SPEED DRIVES,
HEAT PUM PS
208

Chapter - 10
Elect ric Heat ing
209
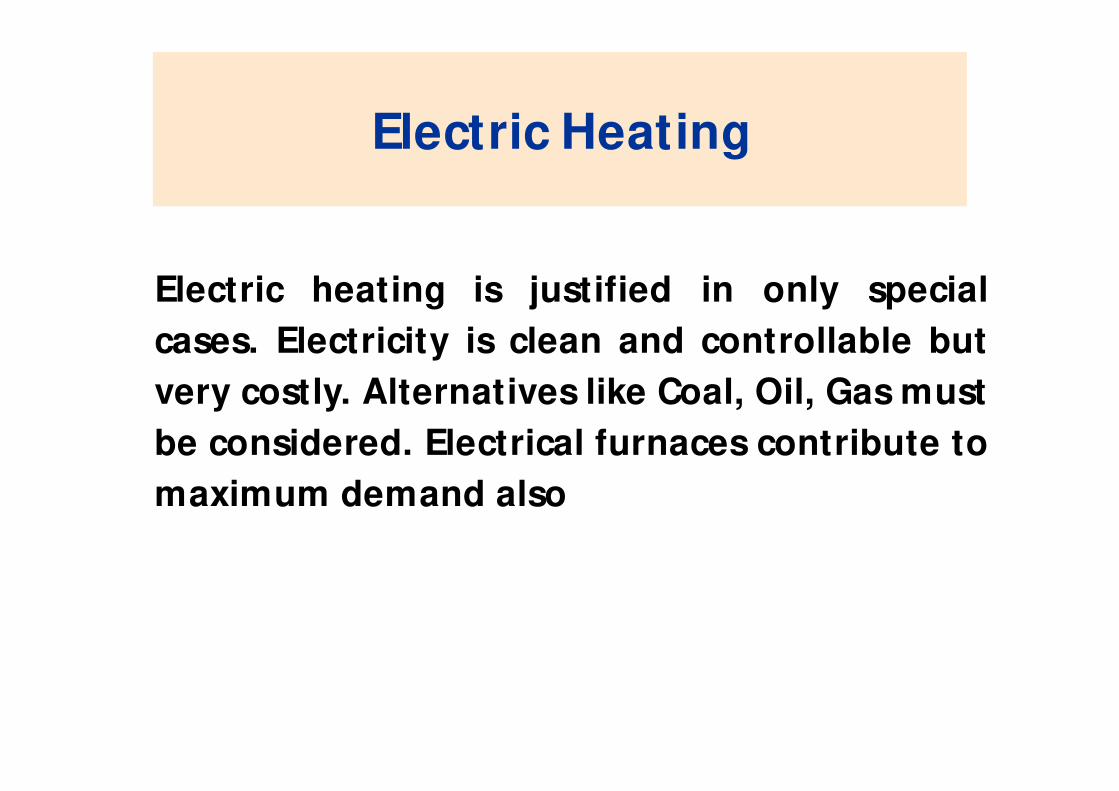
Electric Heating
Electric heating is justified in only special
cases. Electricity is clean and controllable but
very costly. Alternatives like Coal, Oil, Gas must
be considered. Electrical furnaces contribute to
maximum demand also
210
Heat Balance
A Heat Balance, even approximate is useful to
find efficiency of furnace and ident ify major
losses.
Energy Input is easily measured quant ity in
elect ric furnaces
Useful Energy is calculated using Heat
Content of metals knowing Specific Heat and
Latent Heat . (available in handbooks)
211
Furnace Losses
212
Radiat ion losses are calculated usingSurface area and Heat Loss Coefficients.Radiat ion Loss is proport ional to fourthpower of Temperature Difference.
Heat Loss through insulat ion iscalculated knowing skin temperature,ambient Temperature and surface type.
Thermal inert ia losses also to becalculated
Unaccounted losses
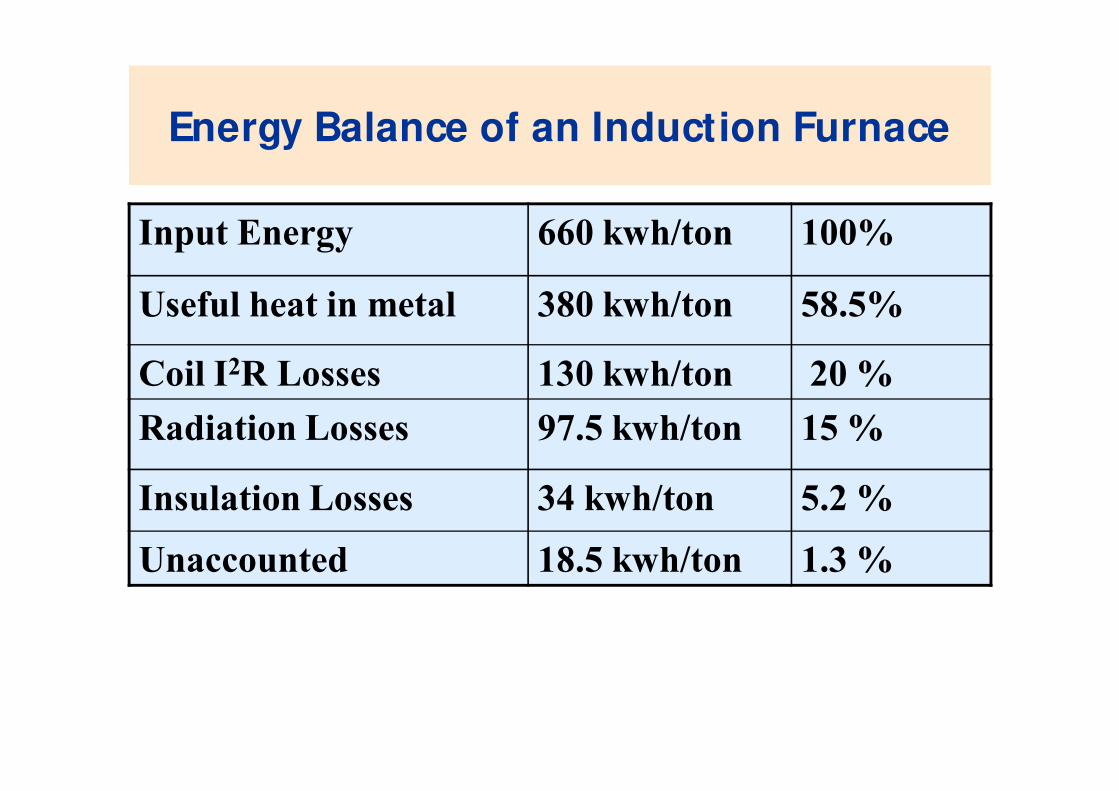
Energy Balance of an Induction Furnace
Input Energy 660 kwh/ton 100%
Useful heat in metal 380 kwh/ton 58.5%
Coil I2R Losses 130 kwh/ton 20 %
Radiation Losses 97.5 kwh/ton 15 %
Insulation Losses 34 kwh/ton 5.2 %
Unaccounted 18.5 kwh/ton 1.3 %
213

Energy Saving Opportunities
Operate at full power and capacity
Partial utilization gives very heavy energy penalty
Annealing Furnace
Production schedules must be adjusted to achieve good capacity utilisation
Sr.
No.
Production Total
kwh
kwh/ton
1 22.97 ton 2670 116
2 12.35 ton 1980 160
3 8.5 ton 1740 205
214

Energy Saving Opportunities
Accurate temperature measurement by opt ical
or direct contact is essent ial
Radiat ion losses should be minimised by
reducing openings and lid opening t ime
Charging system also should be designed to
minimize lid opening
Surface Temperature to be kept at near ambient
by proper insulat ion
Weights of jigs and fixtures to be minimised
215

InsulationLow Thermal Conduct ivity, Low Thermal Inert ia, Good
M echanical St rength are required
Ceramic Fiber insulat ion can withstand temperature up to
1400 0C and can replace firebricks for many applicat ions.
M ineral wool can be used up to 700 0C
Insulat ion Thickness can be calculated based on skin temperature
Furnace Temp Skin Temperature
600 0C 45 – 50 0C
600 0C – 1000 0C 60 0C -80 0C
1000 0C -1500 0C 80 0C - 120 0C
216

Annealing Oven
• An Annealing Oven was used to heat treatpolypropylene tapes coming out of an extruder.Oven temperature is 160 0C.
• Insulation was poor and hot air leakages weretaking place. Insulation was replaced. Powerconsumption dropped to 23.4 KW from 34 KW.
• A totally new oven was made to replace old oven.Power consumption was 14 KW.
This furnace is now replaced with a gas fired oven.
217
Chapter - 11
ELECTROLYTIC PROCESSES
218

ELECTROLYTIC PROCESSES
10.1 INTRODUCTION
10.2 CURRENT EFFICIENCY
10.3 CURRENT DENSITY & ENERGY CONSUM PTION
10.4 LOSSES IN TRANSFORM ERS & BUS BARS
10.5 ELECTROPLATING & BATH HEATING
219
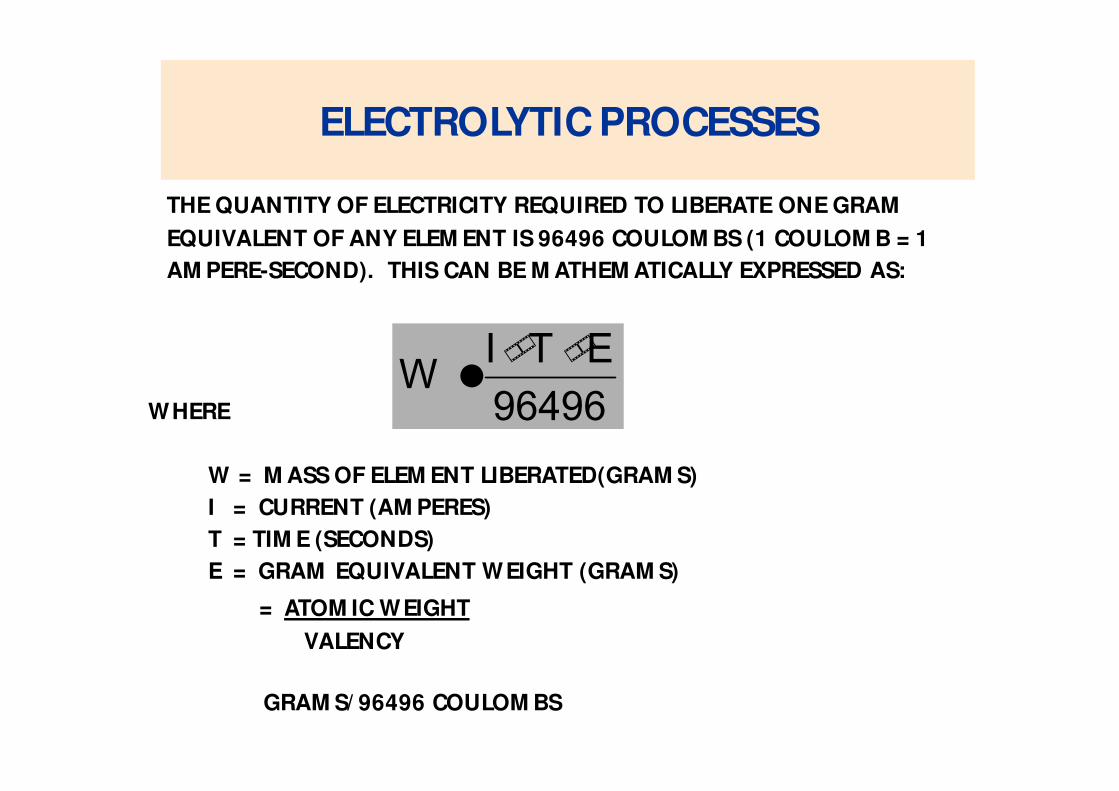
ELECTROLYTIC PROCESSES
THE QUANTITY OF ELECTRICITY REQUIRED TO LIBERATE ONE GRAM
EQUIVALENT OF ANY ELEM ENT IS 96496 COULOM BS (1 COULOM B = 1
AM PERE-SECOND). THIS CAN BE M ATHEM ATICALLY EXPRESSED AS:
WHERE
W = M ASS OF ELEM ENT LIBERATED(GRAM S)
I = CURRENT (AM PERES)
T = TIM E (SECONDS)
E = GRAM EQUIVALENT WEIGHT (GRAM S)
= ATOM IC WEIGHT
VALENCY
220
96496
ETIW
GRAM S/ 96496 COULOM BS
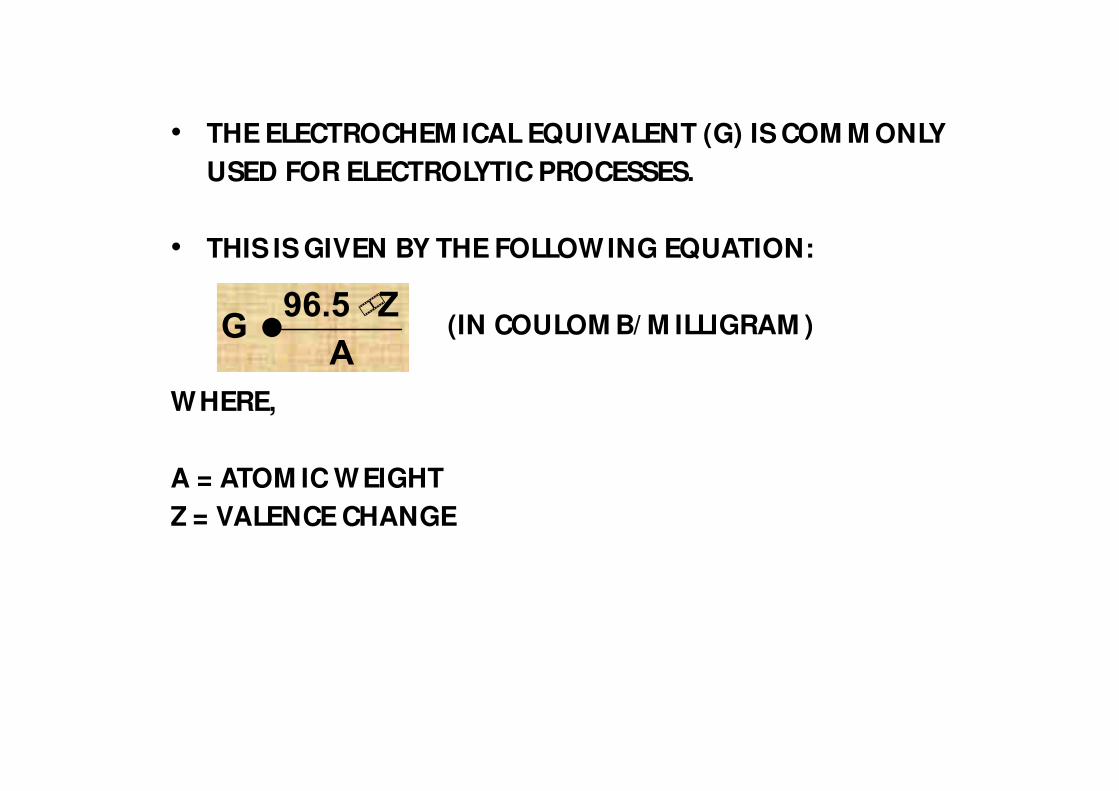
• THE ELECTROCHEM ICAL EQUIVALENT (G) IS COM M ONLY
USED FOR ELECTROLYTIC PROCESSES.
• THIS IS GIVEN BY THE FOLLOWING EQUATION:
(IN COULOM B/ M ILLIGRAM )
WHERE,
A = ATOM IC WEIGHT
Z = VALENCE CHANGE
221
A
Z96.5G
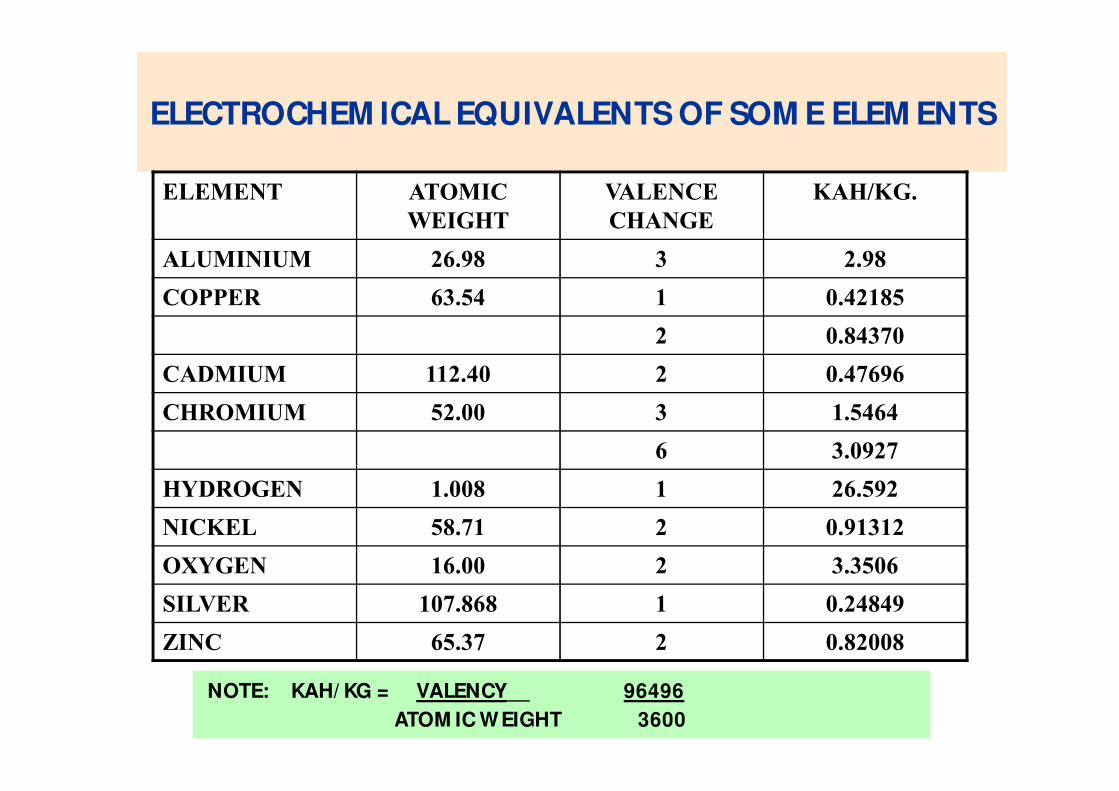
ELECTROCHEM ICAL EQUIVALENTS OF SOM E ELEM ENTS
222
ELEMENT ATOMIC
WEIGHT
VALENCE
CHANGE
KAH/KG.
ALUMINIUM 26.98 3 2.98
COPPER 63.54 1 0.42185
2 0.84370
CADMIUM 112.40 2 0.47696
CHROMIUM 52.00 3 1.5464
6 3.0927
HYDROGEN 1.008 1 26.592
NICKEL 58.71 2 0.91312
OXYGEN 16.00 2 3.3506
SILVER 107.868 1 0.24849
ZINC 65.37 2 0.82008
NOTE: KAH/ KG = VALENCY__ 96496
ATOM IC WEIGHT 3600X
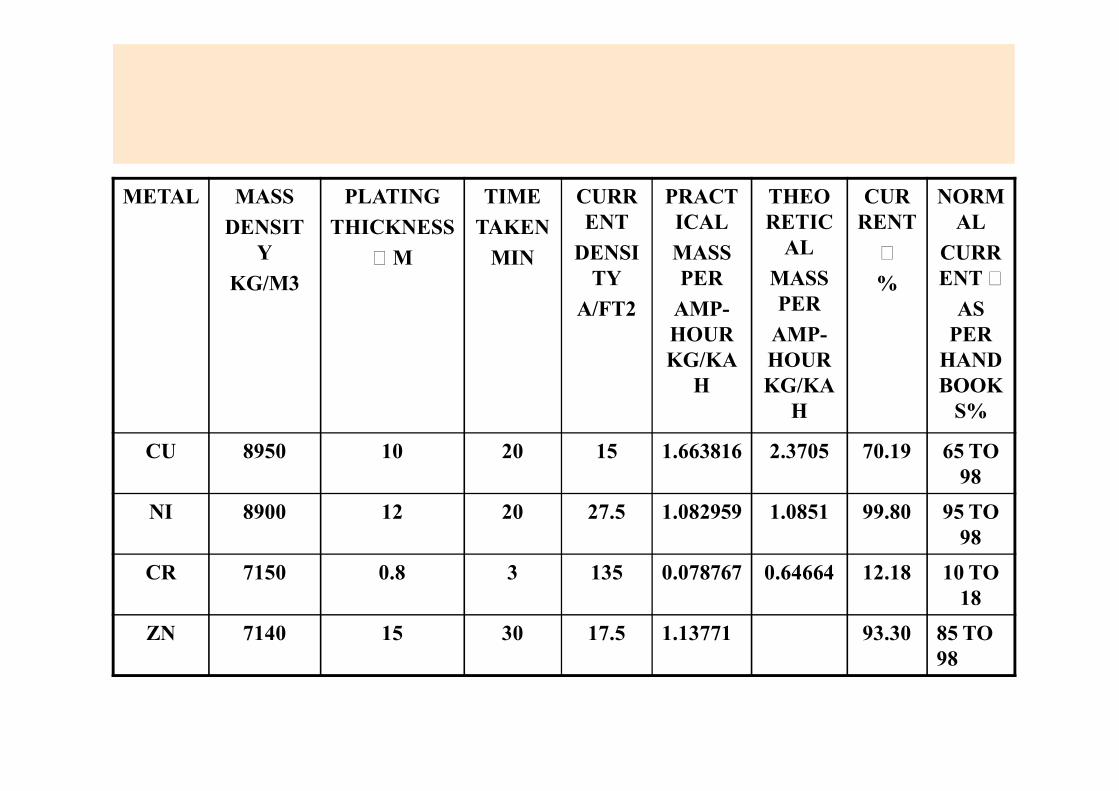
CALCULATION OF CURRENT EFFICIENCIES FOR
ELECTROPLATING
223
METAL MASS
DENSIT
Y
KG/M3
PLATING
THICKNESS
M
TIME
TAKEN
MIN
CURR
ENT
DENSI
TY
A/FT2
PRACT
ICAL
MASS
PER
AMP-
HOUR
KG/KA
H
THEO
RETIC
AL
MASS
PER
AMP-
HOUR
KG/KA
H
CUR
RENT
%
NORM
AL
CURR
ENT AS
PER
HAND
BOOK
S%
CU 8950 10 20 15 1.663816 2.3705 70.19 65 TO
98
NI 8900 12 20 27.5 1.082959 1.0851 99.80 95 TO
98
CR 7150 0.8 3 135 0.078767 0.64664 12.18 10 TO
18
ZN 7140 15 30 17.5 1.13771 93.30 85 TO
98
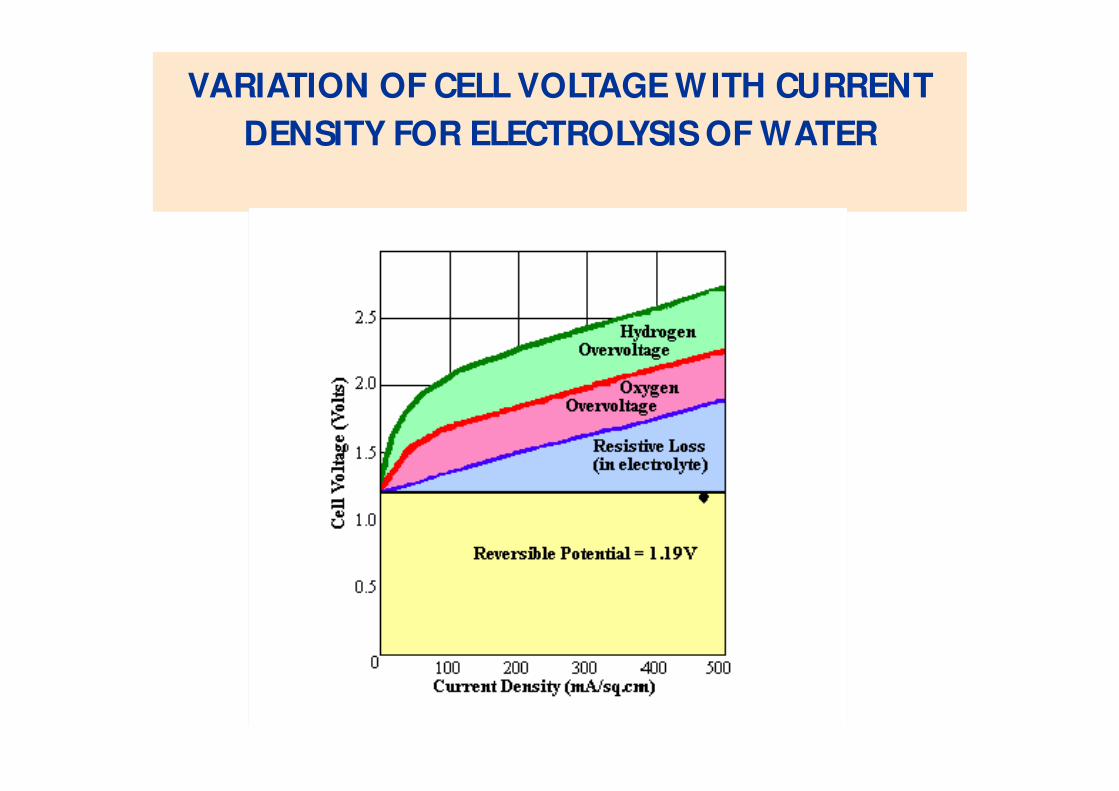
VARIATION OF CELL VOLTAGE WITH CURRENT
DENSITY FOR ELECTROLYSIS OF WATER
224

SPECIFIC ENERGY CONSUM PTION FOR M ANUFACTURE
OF HYDROGEN BY ELECTROLYSIS OF WATER
225
SPECIFIC ENERGY
CONSUMPTION
KWH/M3 OF H2
SAVING
%
AT RATED
CURRENT
AT 60% OF
RATED
CURRENT
CELL LINE 1 5.150 4.520 12.2
CELL LINE 2 5.800 5.125 11.6
LOSSES IN TRANSFORM ERS, RECTIFIERS AND
BUS BARS
• THE EFFICIENCY OF RECTIFIERS AND TRANSFORM ERS IS
QUITE HIGH (ABOVE 95%). IT IS ADVISABLE TO OPERATE
RECTIFIERS CLOSE TO THEIR RATED VOLTAGE.
• THE BUS BARS M AY BE LIBERALLY SIZED TO REDUCE
RESISTIVE LOSSES. THE ECONOM ICAL CURRENT DENSITY
(AND HENCE SIZE OF BUS BARS) CAN BE CALCULATED BY
THE FOLLOWING FORM ULA, WHICH IS DERIVED BY
EQUATING THE COST OF LOSSES WITH THE REQUIRED RATE
OF RETURN AS ANNUAL COST OF CAPITAL ON THE CAPITAL
COST FOR BUS BARS.
226
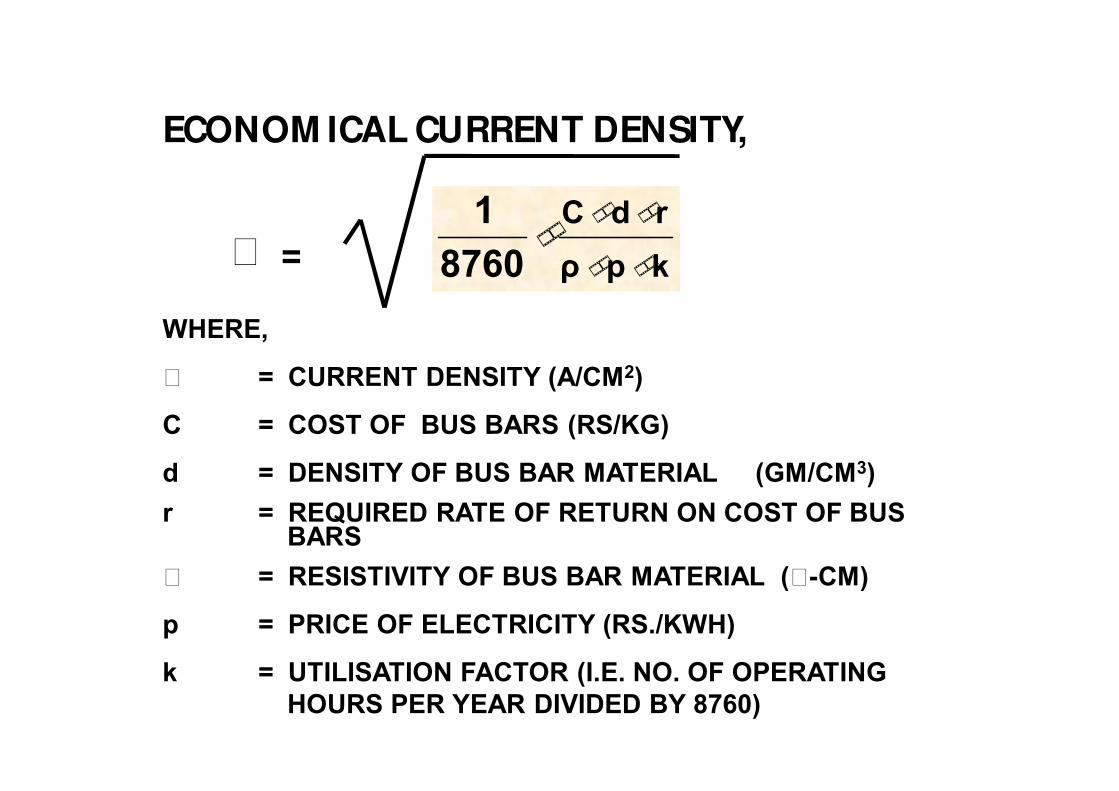
ECONOM ICAL CURRENT DENSITY,
=
227
kpρrdC
8760
1
WHERE,
= CURRENT DENSITY (A/CM2)
C = COST OF BUS BARS (RS/KG)
d = DENSITY OF BUS BAR MATERIAL (GM/CM3)
r = REQUIRED RATE OF RETURN ON COST OF BUS BARS
= RESISTIVITY OF BUS BAR MATERIAL (-CM)
p = PRICE OF ELECTRICITY (RS./KWH)
k = UTILISATION FACTOR (I.E. NO. OF OPERATING
HOURS PER YEAR DIVIDED BY 8760)

AT R = 25%, P = RS 5.00/ KWH AND K = 1.0, THE
ECONOM ICAL CURRENT DENSITIES FOR
COPPER AND ALUM INIUM ARE AS FOLLOWS:
COPPER
= 1.7 X 10⁻⁶ (-CM )
D = 8.9 GM / CM 3
C = RS. 120 PER KG
= 59.88 A/ CM 2
ALUM INIUM
= 2.86 X 10⁻⁶ (-CM )
D = 2.7 GM / CM 3
C = RS. 90 PER KG
= 22.02 A/ CM 2
228
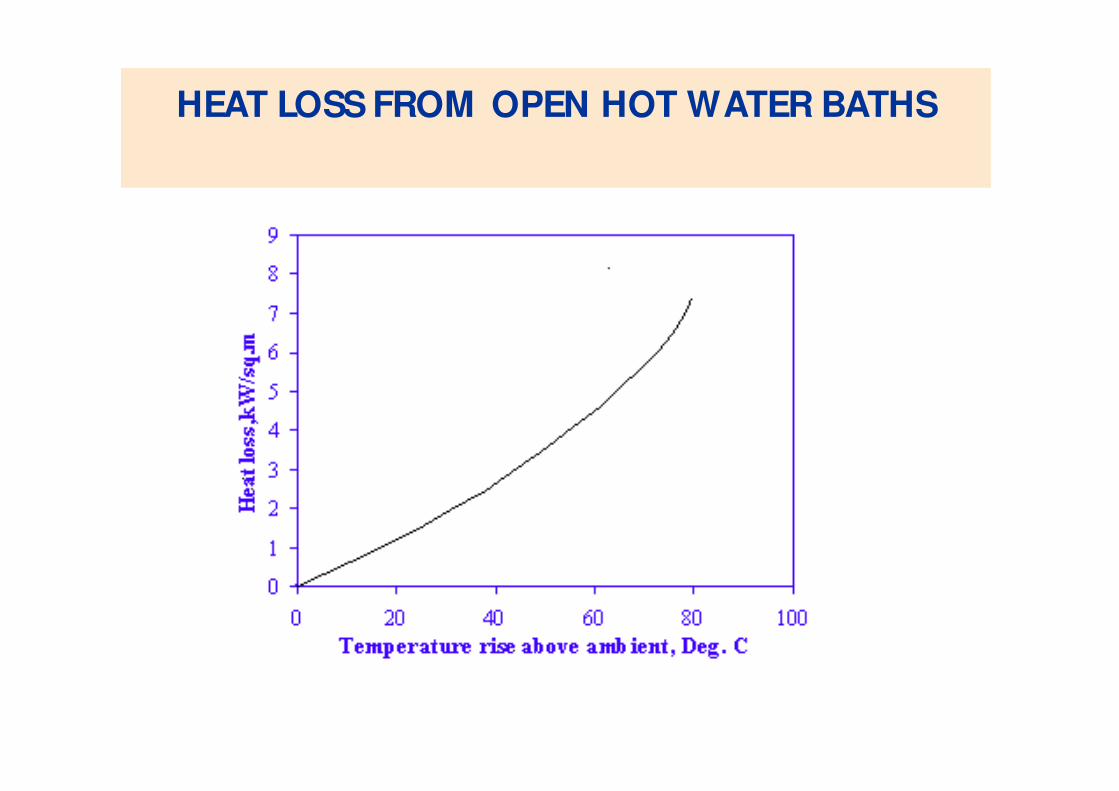
HEAT LOSS FROM OPEN HOT WATER BATHS
229
CH AP T E R – 12E L E CT R ICIT Y
T AR IF F S & B IL L ANAL YS IS

ELECTRICITY TARIFF AND BILL ANALYSIS
• TARIFFS
• Different Tariffs are Applicable for different categories of
consumers.
• M ain categories are:
Resident ial
Commercial
LT Indust ries
HT Indust ries
For Resident ial , Commercial, and LT Indust ries Tariff consist of 2
part
1. Fix charge depending on connected load
2. Energy charge depending on actual Energy use
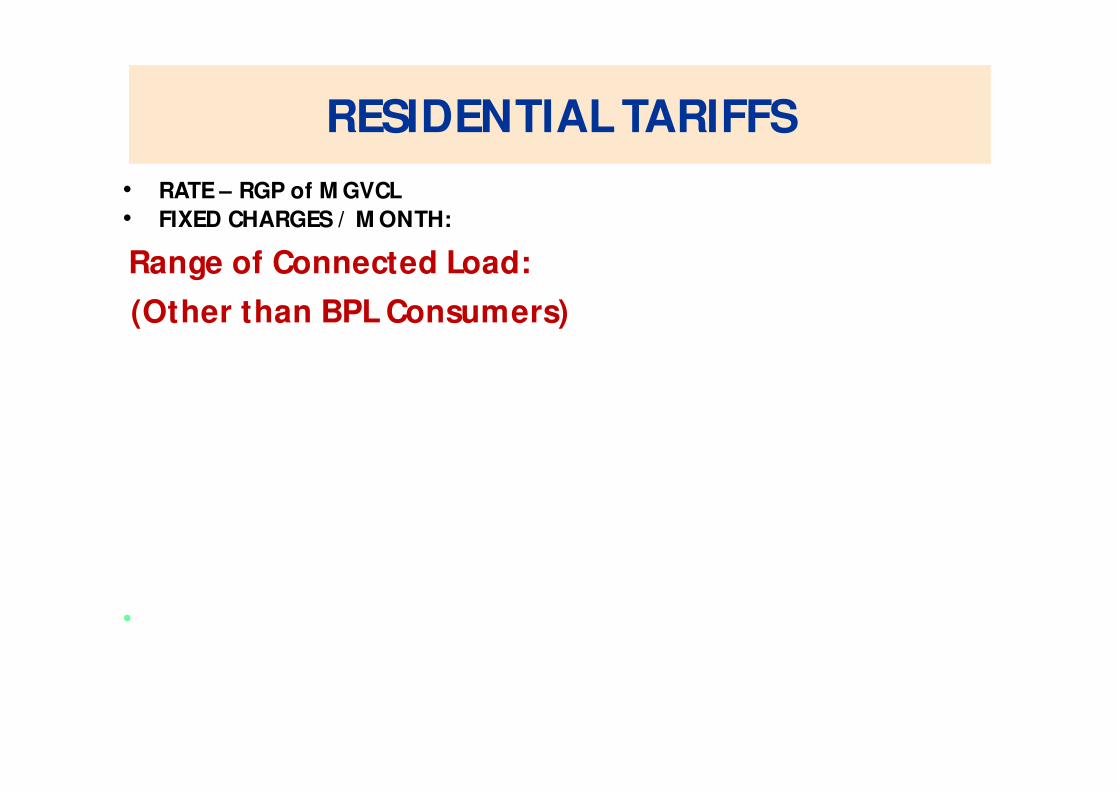
RESIDENTIAL TARIFFS
• RATE – RGP of M GVCL
• FIXED CHARGES / M ONTH:
Range of Connected Load:
(Other than BPL Consumers)
(a) Up to and including 2 kW Rs. 15/ - per month
(b) Above 2 to 4 kW Rs. 25/ - per month
(c) Above 4 to 6 kW Rs. 45/ - per month
(d) Above 6 kW Rs. 70/ - per month
•

ENERGY CHARGES
– FOR THE TOTAL M ONTHLY CONSUM PTION:
(OTHER THAN BPL CONSUM ERS)
(a) First 50 units 305 Paise per Unit
(b) Next 50 units 350 Paise per Unit
(c) Next 100 units 415 Paise per Unit
(c) Next 50 units 425 Paise per Unit
(d) Above 250 units 520 Paise per Unit
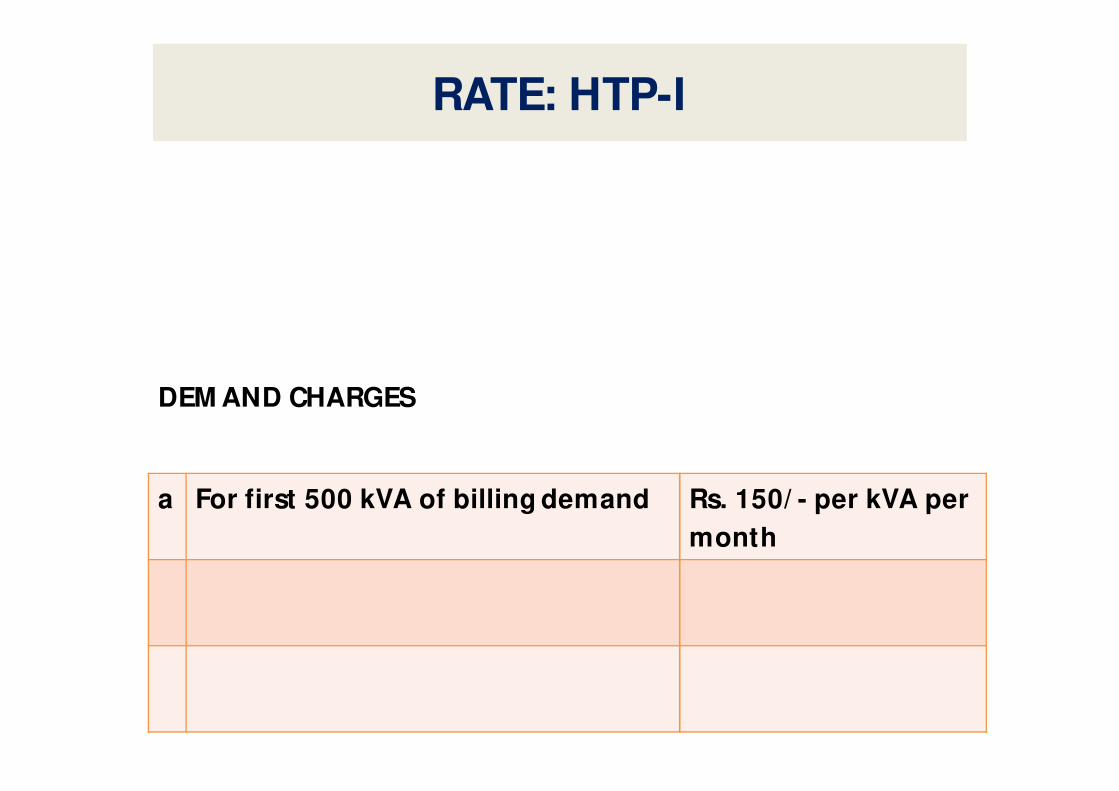
This tariff will be applicable for supply of elect ricity to
HT consumers contracted for 1 00 kVA and above for
regular power supply and requiring the power supply
for the purposes not specified in any other HT
Categories.
DEM AND CHARGES
For billing demand up to cont ract demand
RATE: HTP-I
a For first 500 kVA of billing demand Rs. 150/ - per kVA per
month
b For next 500 kVA of billing demand Rs. 260/ - per kVA per
month
c For billing demand in excess of 1000
kVA
Rs. 475/ - per kVA per
month
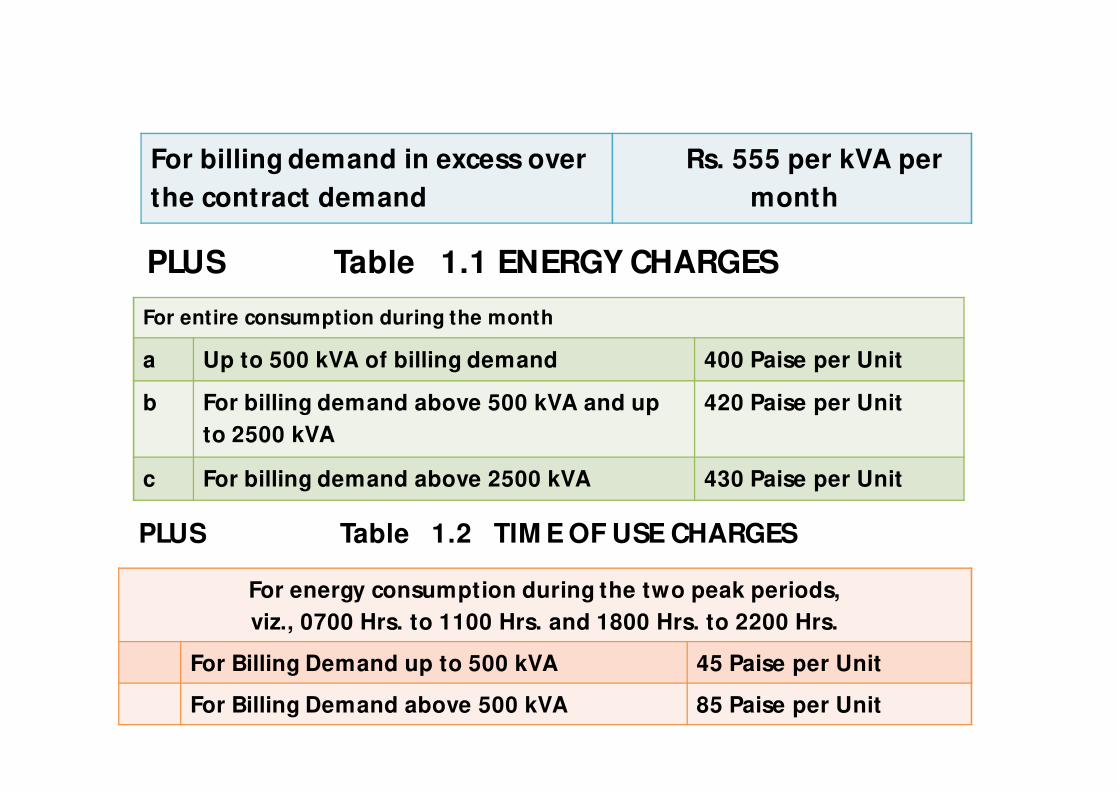
For Billing Demand in Excess of Contract Demand
PLUS Table 1.1 ENERGY CHARGES
PLUS Table 1.2 TIM E OF USE CHARGES
For billing demand in excess over
the contract demand
Rs. 555 per kVA per
month
For entire consumption during the month
a Up to 500 kVA of billing demand 400 Paise per Unit
b For billing demand above 500 kVA and up
to 2500 kVA
420 Paise per Unit
c For billing demand above 2500 kVA 430 Paise per Unit
For energy consumption during the two peak periods,
viz., 0700 Hrs. to 1100 Hrs. and 1800 Hrs. to 2200 Hrs.
a For Billing Demand up to 500 kVA 45 Paise per Unit
b For Billing Demand above 500 kVA 85 Paise per Unit

BILLING DEM AND:
• The billing demand shall be the highest of the
following:
• (a) Actual maximum demand established
during the month
• (b) Eighty-five percent of the cont ract demand
• (c) One hundred kVA
M INIM UM BILLS:
• Payment of Demand Charges based on Kva OF
Billing Demand
POWER FACTOR ADJUSTM ENT CHARGES:
• (a) The power factor adjustment charges shall
be levied at the rate of 1% on the total
amount of elect ricity bills for the month under
the head “ Energy & Demand Charges” for
every 1% drop or part thereof in the average
power factor during the month below 90% up
to 85%.

POWER FACTOR ADJUSTM ENT CHARGES:
• (b) In addit ion to the above clause, for every
1% drop or part thereof in average power
factor during the month below 85% at the rate
of 2% on the total amount of elect ricity bills
for the month under the head “ Energy &
Demand Charges”
Power Factor Rebate:
• If the power factor of the consumer ’s
installat ion in any month is above 95% , the
consumer will be ent it led to a rebate at the
rate of 0.5% (half percent ) in excess of 95%
power factor on the total amount of elect ricity
bill for that month under the “ Energy &
Demand Charges”.
M AXIM UM DEM AND AND ITS M EASUREM ENT:
The maximum demand in kW or kVA, as the
case may be, shall mean an average kW / kVA
supplied during consecut ive 30/ 15 minutes or
if consumer is having parallel operat ion with
the grid and has opted for 3 minutes, period
of maximum use where such meter with the
features of reading the maximum demand in
KW/ KVA direct ly, have been provided.
CONTRACT DEM AND:
The cont ract demand shall mean the maximum
KW/ KVA for the supply, of which the supplier
undertakes to provide facilit ies from t i me to
t ime.
REBATE FOR SUPPLY AT EHV:
On Energy charges: Rebate @
a If supply is availed at 33/ 66 kV 0.5%
b If supply is availed at 132 kV and
above
1.0%
CONCESSION FOR USE OF ELECTRICITY
DURING NIGHT HOURS:
• For the consumer eligible for using supply at
any t ime during 24 hours, ent ire
• consumpt ion shall be billed at the energy
charges specified above. However, the energy
consumed during night hours of 10.00 PM to
06.00 AM next morning shall be eligible for
concession at the rate of 40 Paise per unit .
Fuel Surcharge
• All consumers have to pay fuel surcharge
depending on actual cost of fuel compared to
a standard value. At present it varies from 110
paise / kwh to 150 paise/ kwh

Electricity Duty
• Elect ricity duty is applicable on demand and
energy charges at following rate.
• Resident ial 15%
• Commercial 25%
• LT Indust ries 10%
• HT Indust ries 15 %
ANALYSIS OF BILLS
• It is essent ial to analyse Elect ricity Bills for 1 year for
Commercial and Industrial users
• The Bill Analysis should work out relat ion between
product ion and elect ricity consumpt ion. It is
preferable to work out an index like KWH/ M eter of
cloth, KWH/ Kg of Yarn, KWH/ Ton of Cement , KWH
/ TON of Steel
ANALYSIS OF BILLS
• Each plant consist of Product ion M achines and
ut ilit ies. When product ion is reduced no of
product ion machines and ut ilit ies must be
reduced. No of Fans, Pumps, Compressors,
Reactors can be reduced
• For energy efficiency it is always worthwhile
running machines at full load rather than
part ial load

ANALYSIS OF BILLS
• LOAD FACTOR
• For large Indust ries it is worthwhile working out load factor
every month to cont rol maximum demand
L.F. = Average Demand for month
Peak Demand
Peak Demand is measured every half an hour. Highest value in
a month is taken as Peak Demand
Average Demand = KWH/ M onth
Running Hours
For cont inuous process indust ries L.F. Of 0.7 and above is
achievable.

Billing Analysis of Chemical Plant
• We analyse a chemical plant producing
number of chemicals. M anufacturing of each
chemical is done in reactors with associated
auxiliaries like pumps, st irring etc. Ut ilit ies are
common for all product ion and are monitored
separately.
• Table 1 shows analysis of data of product ion,
total elect ricity consumpt ion, elect ricity
consumed by product ion machines and
ut ilit ies like chilled water, brine.
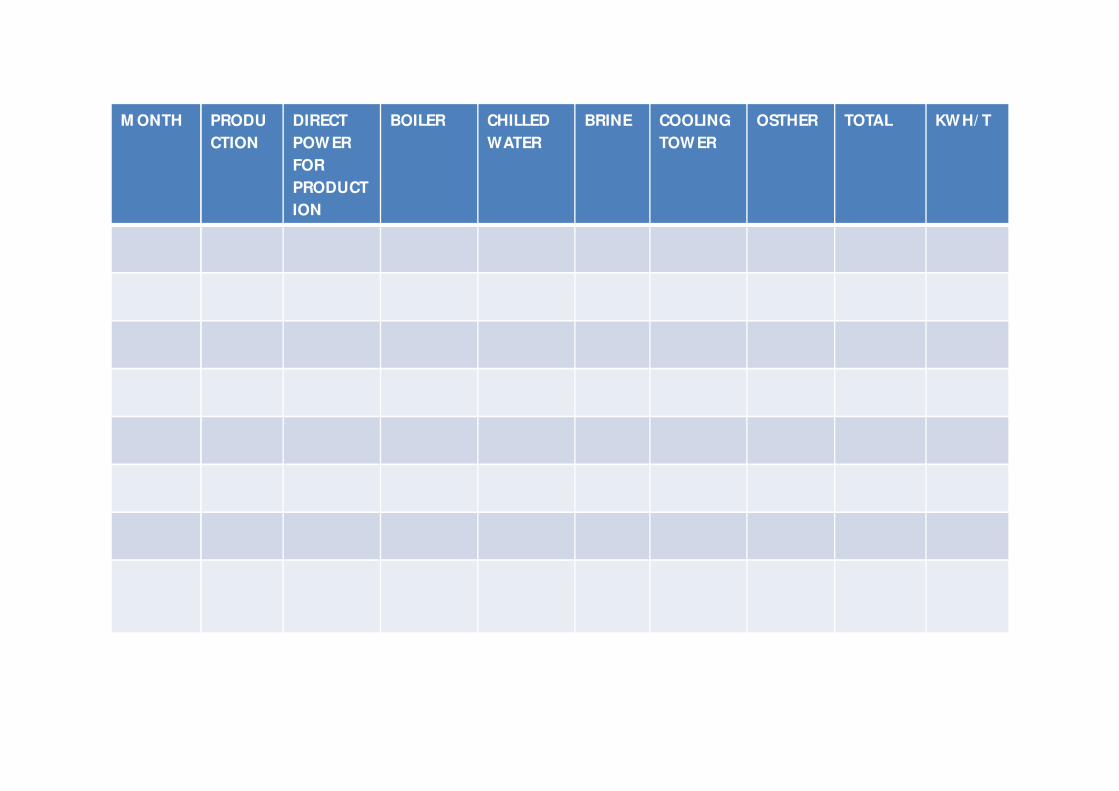
Analysis of Chemical Indust ry
M ONTH PRODU
CTION
DIRECT
POWER
FOR
PRODUCT
ION
BOILER CHILLED
WATER
BRINE COOLING
TOWER
OSTHER TOTAL KWH/ T
January
’17
6049 548559
42.8%
15851
1.2%
365964
28.5%
119982
9.3%
90673
7 %
128898
10.05%
1281488
100%
211.85
February’1
7
5889 506681
41.02%
13671
1.1%
364929
29.5%
112174
9.08%
87487
7.08%
140625
11.38%
1234936
100%
209.70
M arch’ 17 6764 569682
41.17%
11256
0.8%
401982
29.05%
120684
8.7%
93666
6.76%
175071
12.65%
1383656 204.56
April’17 2557 370993
34.8%
56844
5.2%
333150
30.81%
111709
10.83%
83019
7.67%
113994
10.54%
1081072 422.78
M ay’17 2475 400649
35.58%
63208
5.6%
319605
28.3%
131125
11.64%
85017
7.57%
115103
10.22%
1125824
100%
454.87
June’17 5622 5225.76
39.32%
70153
5.2%
390316
29.2%
99551
7.44%
101669
7.6%
139892
10.06%
1336488
100%
237.72
July’17 6372 578119
40.38%
38461
2.6%
386216
26.97%
125484
8.76%
132421
9.2%
158793
11.09%
1431440
100%
224.64
Total 35728 3497259
39.4
255144
2.87
2562162
28.86
719749
8.10
673952
7.59
969376
10.92
8874904 248.4

The following can be noted from Table 1
• Product ion changes significant ly from minimum of about 2500
T/ M onth to maximum of 6300T/ M onth. It may be noted that this
product ion is sum of different chemicals and not one chemical.
• Product ion machines consume 40% of total elect ricity
consumpt ion. Ut ilit ies account for 60%
• Specific consumpt ion increases significant ly from 200 kwh/ T to
more than 400 kwh/ T (200% increase) when product ion has
dropped by 60%.
• Consumpt ion of ut ilit ies like chilled water brine is not dropping
significant ly with product ion drops to 40%. With bet ter cont rol
and automat ion as well as use of VFDs for all machines. Ut ilit ies
consumpt ion can reduce considerably.
• Plant maximum demand is about 3400 KW. Actual demand is
remaining near billing demand. Load factor arrange to peak
demand is 1744/ 3400 = 5% which is reasonable considering wide
number of machines.