An Interconnect Architecture for Networking Systems on Chips
Upload
khangminh22Category
view
1download
0
Wear-out Leveling in Network on Chips (NoCs)
A thesis presented to
the faculty of
the Russ College of Engineering and Technology of Ohio University
In partial fulfillment
of the requirements for the degree
Master of Science
Juman Alshraiedeh
April 2017
© 2017 Juman Alshraiedeh. All Rights Reserved.

2
This thesis titled
Wear-out Leveling in Network on Chips (NoCs)
by
JUMAN ALSHRAIEDEH
has been approved for
the School of Electrical Engineering and Computer Science
and the Russ College of Engineering and Technology by
Avinash Karanth Kodi
Professor of Electrical Engineering and Computer Science
Dennis Irwin
Dean, Russ College of Engineering and Technology

3
Abstract
ALSHRAIEDEH, JUMAN, M.S., April 2017, Electrical Engineering
Wear-out Leveling in Network on Chips (NoCs) (64 pp.)
Director of Thesis: Avinash Karanth Kodi
According to Moore’s Law, the number of transistors on a single chip doubles every
two years, allowing tens or even hundreds of cores to be integrated. As multi-cores
communicate with memory, the underlying Network-on-Chip (NoC) experiences
different stress levels due to asymmetric traffic patterns and complex routing algorithms.
Unfortunately, the growth in the number of transistors in NoCs will significantly
impact both reliability (physical failures) and aging (uneven utilization) due to the
increasing effects of Electromigration (EM), Hot carrier injection (HCI) and Negative
Bias Temperature Instability (NBTI). A novel in-flight, adaptive, routing algorithm is
presented to reduce the accumulation of EM, HCI, and NBTI effects on the lifetime of
NoC. The proposed routing algorithm is based on a new metric called Packet-Per-Port
(P3) which equalizes the stress throughout the network. The net impact is that the network
components such as the links and the routers will age evenly and thereby improve NoC
reliability and maximize the lifetime of the chip. Results indicated that for Splash-2
traces, we observe 7.3% to 13.7% energy per bit reduction and up to 6.23% improvement
in the transistor reliability when compared to Dimensional Order Routing (DOR) on 8x8
mesh. P3 was also compared to age-adaptive routing proposed in [1] and we observe 1%
improvement in reliability and up to 11% energy per bit reduction.

4
I dedicate this thesis to my husbond and son; thanks for all your endless support. I could
not have done it without you

5
Acknowledgments
This work is partially supported by the National Science Foundation (NSF) grants CCF-
1054339 (CAREER), CCF-1318981, CCF-1420718, and CCF-1513606. I would like to
thank my parents and family for all the love and support. Many thanks to Dr. Avinash
Kodi for his guidance and support. Last but not least, I would like to thank my committee
members Dr. Kaya, Dr. Dill, and Dr. Ingram for their time and feedback.

6
Table of Contents
Page
Abstract . . . . . . . . . . . . . . . . . . . . . . . . . . . . . . . . . . . . . . . . . 3
Dedication . . . . . . . . . . . . . . . . . . . . . . . . . . . . . . . . . . . . . . . . 4
Acknowledgments . . . . . . . . . . . . . . . . . . . . . . . . . . . . . . . . . . . . 5
List of Tables . . . . . . . . . . . . . . . . . . . . . . . . . . . . . . . . . . . . . . 8
List of Figures . . . . . . . . . . . . . . . . . . . . . . . . . . . . . . . . . . . . . . 9
1 Introduction . . . . . . . . . . . . . . . . . . . . . . . . . . . . . . . . . . . . . 111.1 Motivation . . . . . . . . . . . . . . . . . . . . . . . . . . . . . . . . . . . 111.2 Causes of Age Degradation . . . . . . . . . . . . . . . . . . . . . . . . . . 17
1.2.1 Negative Bias Temperature Instability . . . . . . . . . . . . . . . . 181.2.2 Hot Carrier Injection . . . . . . . . . . . . . . . . . . . . . . . . . 191.2.3 Electromigration . . . . . . . . . . . . . . . . . . . . . . . . . . . 20
1.3 Related Work . . . . . . . . . . . . . . . . . . . . . . . . . . . . . . . . . 201.3.1 Use it or Lose it: Wear-out and Lifetime in Future Chip
Multiprocessors . . . . . . . . . . . . . . . . . . . . . . . . . . . . 211.3.2 Toward Graceful Aging Degradation in NoCs Through an
Adaptive Routing Algorithm . . . . . . . . . . . . . . . . . . . . . 221.4 Proposed Design . . . . . . . . . . . . . . . . . . . . . . . . . . . . . . . 23
2 Routing in NoCs . . . . . . . . . . . . . . . . . . . . . . . . . . . . . . . . . . 252.1 Dimensional Order Routing . . . . . . . . . . . . . . . . . . . . . . . . . 262.2 Regional Congestion Awareness . . . . . . . . . . . . . . . . . . . . . . . 272.3 Packet Per Port (P3) . . . . . . . . . . . . . . . . . . . . . . . . . . . . . . 28
2.3.1 P3 Routing Algorithm . . . . . . . . . . . . . . . . . . . . . . . . 292.3.2 Router Micro-Architecture . . . . . . . . . . . . . . . . . . . . . . 302.3.3 Routing Example . . . . . . . . . . . . . . . . . . . . . . . . . . . 32
3 Performance Evaluation . . . . . . . . . . . . . . . . . . . . . . . . . . . . . . . 373.1 Network Performance . . . . . . . . . . . . . . . . . . . . . . . . . . . . . 39
3.1.1 Utilization . . . . . . . . . . . . . . . . . . . . . . . . . . . . . . 393.1.2 Latency . . . . . . . . . . . . . . . . . . . . . . . . . . . . . . . . 503.1.3 Throughput . . . . . . . . . . . . . . . . . . . . . . . . . . . . . . 513.1.4 Aging . . . . . . . . . . . . . . . . . . . . . . . . . . . . . . . . . 543.1.5 Energy per Bit . . . . . . . . . . . . . . . . . . . . . . . . . . . . 56

7
4 Conclusions and Future Work . . . . . . . . . . . . . . . . . . . . . . . . . . . . 58
References . . . . . . . . . . . . . . . . . . . . . . . . . . . . . . . . . . . . . . . . 59
Appendix: Routers/Links Utilization . . . . . . . . . . . . . . . . . . . . . . . . . . 63

8
List of Tables
Table Page
2.1 P3 Routing Algorithm. [2] . . . . . . . . . . . . . . . . . . . . . . . . . . . . 31
3.1 Cache and Core Parameter Used for Splash-2 Traces Extraction. [3] . . . . . . 38

9
List of Figures
Figure Page
1.1 Common NoC topologies. . . . . . . . . . . . . . . . . . . . . . . . . . . . . 121.2 Intel Teraflop processors. [4]. . . . . . . . . . . . . . . . . . . . . . . . . . . . 141.3 IBM Power7 connection. [5] . . . . . . . . . . . . . . . . . . . . . . . . . . . 151.4 Switching techniques used in NoCs. [6] . . . . . . . . . . . . . . . . . . . . . 161.5 Threshold voltage changes through stress and recovery cycle. [7] Copyright
©2006, IEEE . . . . . . . . . . . . . . . . . . . . . . . . . . . . . . . . . . . 191.6 Use it or Lose it proposal router micro-architecture. [8] . . . . . . . . . . . . . 21
2.1 Routing protocol taxonomy. [9] . . . . . . . . . . . . . . . . . . . . . . . . . 252.2 XY/YX turns roles. Arrows show the possible turns while dash lines mean
prohibited turns. . . . . . . . . . . . . . . . . . . . . . . . . . . . . . . . . . . 272.3 Regional congestion branches. [10] Copyright©2008, IEEE . . . . . . . . . . 282.4 Router Microarchitecture. Left side shows the smaller crossbars connections
to the other parts of the router, the right top corner shows the congestioninformation collection and calculation. P3 circuit calculation is explained inthe right bottom corner. . . . . . . . . . . . . . . . . . . . . . . . . . . . . . . 33
2.5 Routing Example shows the routing path of a packet routed from router 15 torouter 1. Each graph describes the status of the network at the time of routingand the routing decision. a) shows routing the packet from R 15 to R14 basedon P3 routing algorithm, b) packet get routed from R 14 to R13, c) packetget routed from R13 to R9, d) packet get routed from R9 to 5, e) packet getrouted from R5 to R4, f) packet get routed to it final destination R1 from R4.[2] . . . . . . . . . . . . . . . . . . . . . . . . . . . . . . . . . . . . . . . . . 34
3.1 Load distribution for bit reversal traffic for 4x4 mesh under a) P3, b) DOR, c)RCA, d) AGE-ADAP. . . . . . . . . . . . . . . . . . . . . . . . . . . . . . . . 40
3.2 Load distribution for Matrix transpose traffic for 4x4 mesh under a) P3, b)DOR, c) RCA, d) AGE-ADAP. . . . . . . . . . . . . . . . . . . . . . . . . . . 41
3.3 Load distribution for Uniform traffic for 4x4 mesh under a) P3, b) DOR, c)RCA, d) AGE-ADAP. . . . . . . . . . . . . . . . . . . . . . . . . . . . . . . . 43
3.4 Load distribution for complement traffic for 4x4 mesh under a) P3, b) DOR,c) RCA, d) AGE-ADAP. . . . . . . . . . . . . . . . . . . . . . . . . . . . . . 44
3.5 Load distribution for uniform traffic for 8x8 mesh under a) P3, b) DOR, c) RCA. 453.6 Load distribution for complement traffic for 8x8 mesh under a) P3, b) DOR ,
c) RCA. . . . . . . . . . . . . . . . . . . . . . . . . . . . . . . . . . . . . . . 463.7 Load distribution for bit reversal traffic for 8x8 mesh under a) P3, b) DOR, c)
RCA. . . . . . . . . . . . . . . . . . . . . . . . . . . . . . . . . . . . . . . . 473.8 Load distribution for matrix transpose traffic for 8x8 mesh under a) P3, b)
DOR, c) RCA. . . . . . . . . . . . . . . . . . . . . . . . . . . . . . . . . . . . 48
10
3.9 Load distribution for Radiocity from splash-2 traces for 8x8 mesh under a)P3, b) DOR, c) RCA. . . . . . . . . . . . . . . . . . . . . . . . . . . . . . . . 49
3.10 Load distribution for FFM from splash-2 traces for 8x8 mesh under a) P3, b)DOR, c) RCA. . . . . . . . . . . . . . . . . . . . . . . . . . . . . . . . . . . . 50
3.11 Average network latency for 4 x 4 mesh for a few select synthetic trafficpatterns - (a) Uniform , (b) Complement , (c) Matrix Transpose , (d) BitReversal.[2] . . . . . . . . . . . . . . . . . . . . . . . . . . . . . . . . . . . . 52
3.12 Average network latency for 8 x 8 mesh for a few select synthetic trafficpatterns - (a) Uniform , (b) Complement , (c) Matrix Transpose, and (d) BitReversal.[2] . . . . . . . . . . . . . . . . . . . . . . . . . . . . . . . . . . . . 53
3.13 Average network latency for 8 x 8 mesh for splash-2 traces . . . . . . . . . . . 543.14 Network throughput - (a) 4x4 mesh under synthetic traffic , (b) 8x8 mesh
under synthetic traffic patterns, and (c) 8x8 mesh under Splach-2 traces(normalize to DOR). (notation: Uni: Uniform, Comp: Complement, Mt-Tr: MatrixTranspose, Bt-Re: Bit Reversal, Per-sh: Perfect Shuffle, BF: Butterfly, GEO-MEAN:Geometric Mean). . . . . . . . . . . . . . . . . . . . . . . . . . . . . . . . . . . 55
3.15 The aging effects on transistor reliability. [2] . . . . . . . . . . . . . . . . . . . 563.16 Energy per Bit for Splash-2 traces normalized to DOR. [2] . . . . . . . . . . . 57
A.1 Load distribution for Water from splash-2 traces for 8x8 mesh under a) P3, b)DOR , c) RCA. . . . . . . . . . . . . . . . . . . . . . . . . . . . . . . . . . . 63
A.2 Load distribution for Radix from splash-2 traces for 8x8 mesh under a) P3, b)DOR, c) RCA. . . . . . . . . . . . . . . . . . . . . . . . . . . . . . . . . . . . 64

11
1 Introduction
1.1 Motivation
As the ever-growing size of applications require faster and more computing resources,
research is rapidly proposing techniques to improve performance (latency, power, and cost)
of next generation processing cores and the underlying communication fabric to connect
the cores to the memory. While single core processors continue to improve in performance
dramatically (instruction per cycle, performance per Watt) dramatically, increasing the
clock frequency or voltage is challenging due to temperature and power limitations of a
single-chip. As technology scaling has enabled integration of billions of transistors on a
single chip, scaling the number of processing cores to achieve higher performance is the
approach of the industry. Starting with the first dual-core processor developed by Intel in
1998 (Celeron D), the technology has considerably improved whereas today, six multicore
processors are available for personal use as in Intel Core i7 970 and Extreme editions [11].
In the second quarter of 2016, Intel launched Intel Xeon E7 v4 family with 4-24 cores
on chip for workstation, and the system delivered high performance, high reliability, and
in-memory secured computation [12]. The number of processors scales even further for
graphical processing units (GPUs), to 512 processors that can be integrated on chip as in
GF100 512-core (Nivida) and this number of streaming multicores is also increasing. The
critical problem now is how to connect processors to communicate between cores, memory
and I/O devices to achieve the best performance under thermal limits of the chip.
Network on Chips NoCs are the defacto communication fabric used for data transfer
between several cores on the chip. NoCs will define the network topology, switching,
and routing techniques as well as determine the quality of service (QoS) for the network.
Network topologies are divided into two main subdivisions: switched networks -when
disjoint portions of the media are shared via switching, and shared networks where the

12
(a) Bus topology (b) Ring topology (c) Mesh topology (d) Toric topology
Figure 1.1: Common NoC topologies.
network media is shared by all devices on the network [6]. The number of nodes, the
connectivity pattern, and the overall cost in terms of (latency and power) determine the
appropriate network for the chosen application. Bus topology is a basic shared network
topology that restricts the number of simultaneous communication that can take place and
therefore it is bandwidth-limited. Although the bus topology is bandwidth-limited, it is
suitable for low number of cores to be connected anywhere between 2-4 nodes. For high
number of cores, crossbars and higher-radix (degree) switch topologies are more suitable.
Meshes and tori topologies showed promising performance as the bandwidth scales with
the number of nodes in these topologies; however the limited bisectional bandwidth
(maximum bandwidth available when the network is split into two equal halves [13]) affects
the performance gain as the number of processors is scaled. Interconnection networks
should be designed such that maximum amount of information can be transferred within
the least amount of power and with high reliability. The critical aspects that determine
the suitability of the topology are: link bandwidth, bisectional bandwidth, and diameter
(the shortest path between the most distant nodes for a given topology). For 2-D mesh
topology, the bandwidth scales linearly with the number of processors (N) N, but the
bi-sectional bandwidth does not scale as well with the number of processors (N12 )which

13
limits the performance under high load. The linearly growing diameter for 2-D mesh is
2(√
N − 1) which affects power consumption negatively due to extra network hops(links
and router power). On the other hand torus topology provides better bandwidth scalability
4N when compared to N for mesh, and better bisectional bandwidth, 2N12 and smaller
diameter (√
N) when compared to 2-D mesh architecture. Torus improves performance but
at the cost of power and area since torus requires wrap-around which increases the area
and decreases the diameter. The length of wrap-around links is affected by the number of
processors; research suggested to fold the torus to reduce the area to maximize the benefit
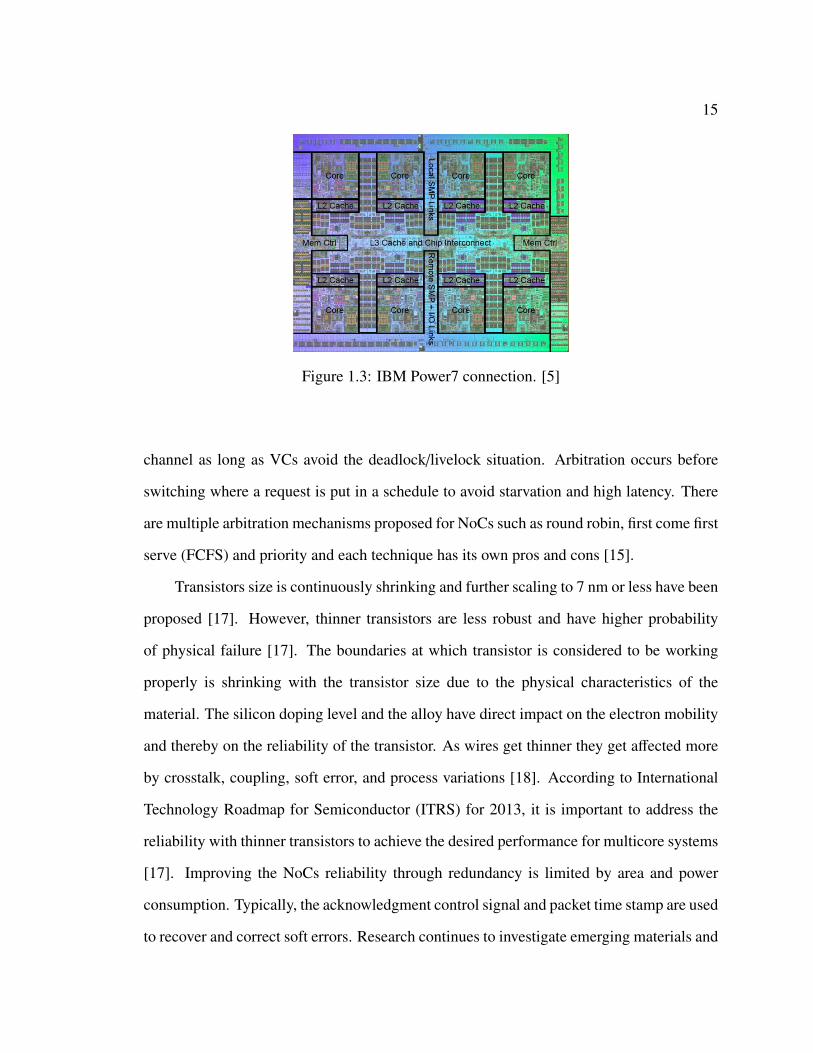
of torus [14]. Ring topology, mesh, and torus are all implemented in industry today. For
example TeraFlops was an Intel prototype with 80 cores connected in the mesh topology
(see Figure 1.2), whereas IBM Power7 is a CMP system with 8 cores connected in a ring
network (see Figure 1.3). In February 2015 IBM introduced Power8 which has 12 cores
fabricated using 22 nm technology connected in ring topology [5]. Many topologies have
been developed through the years to connect multicores taking into account that they have
to be mapped onto a two dimensional plane. Research in emerging technology showed
that this may change with the development of the die-stacking and the three-dimensional
integration [15].
NoCs performance relies on the router microarchitecture which decides on the routing,
switching, and arbitration. Routing scheme defines all possible paths that a packet may
take, switching resolves the order of transmission of packets, while arbitration resolves
the conflict when multiple packets request the same resource. Routing algorithms seek to
improve the performance of the network by lowering the latency and power consumption
while improving the throughput of the system. Routing algorithm is explained in more
detail in the next chapter.
Switching in NoCs can either be packet or circuit switching [16]. Packet switching
defines the granularity of the transmission to one packet. In circuit switching, the entire

14
Figure 1.2: Intel Teraflop processors. [4].
path is reserved until the communication ends which reduces the throughput of the network.
Figure 1.4 shows the switching techniques. For Wormhole Switching the header flit (the
minimum size of information transfer through the network) is the only flit that suffers
from latency, other flits follow the path of the header flit. In Store and Forward (S&F)
the entire packet has to be stored before it is forwarded which implies that large buffers
are needed. Unlike S&F, Virtual Cut-Through switching divides the packet into flits and
forwards it as soon as the next router has enough space. However, virtual cut-through
switching requires the same buffer space as S&F, and therefore none of the NoCs designs
have adopted these approaches. Virtual channels (VCs) with buffers are used to improve
the switching performance of the network by allowing multiple packets to occupy the same
15
Figure 1.3: IBM Power7 connection. [5]
channel as long as VCs avoid the deadlock/livelock situation. Arbitration occurs before
switching where a request is put in a schedule to avoid starvation and high latency. There
are multiple arbitration mechanisms proposed for NoCs such as round robin, first come first
serve (FCFS) and priority and each technique has its own pros and cons [15].
Transistors size is continuously shrinking and further scaling to 7 nm or less have been
proposed [17]. However, thinner transistors are less robust and have higher probability
of physical failure [17]. The boundaries at which transistor is considered to be working
properly is shrinking with the transistor size due to the physical characteristics of the
material. The silicon doping level and the alloy have direct impact on the electron mobility
and thereby on the reliability of the transistor. As wires get thinner they get affected more
by crosstalk, coupling, soft error, and process variations [18]. According to International
Technology Roadmap for Semiconductor (ITRS) for 2013, it is important to address the
reliability with thinner transistors to achieve the desired performance for multicore systems
[17]. Improving the NoCs reliability through redundancy is limited by area and power
consumption. Typically, the acknowledgment control signal and packet time stamp are used
to recover and correct soft errors. Research continues to investigate emerging materials and

16
Figure 1.4: Switching techniques used in NoCs. [6]
fabrication techniques to reduce the possibility of hard errors to improve Mean-Time-To-
Failure (MTTF) [15]. MTTF is defined as the expected time before system failure, and is
mathematically calculated as shown in equation 1.1
MTT F =
∫ ∞
0R(t)dt (1.1)
where R(t) is the reliability function.
The continuous scaling of transistors impacts the aging process negatively since aging
is connected to the transistor utilization and fabrication. Aging can be controlled but
not eliminated since it is a result of some physical phenomena. Even though aging
does not cause immediate failures, it shifts critical parameters such as threshold voltage
(Vth) and gate delay causing the transistors to fail. For example, routers fail to operate
under the specified timing constraints when the cumulative gate delay exceeds 10% from
the fabricated value, causing a system failure if no recovery mechanism is implemented.

17
Although aging is connected to physical phenomena, research has showed that the rate at
which router ages depends on the router utilization. Routing algorithms are responsible for
distributing the load throughout the network. Directional Order Routing (DOR) is the basic
routing algorithm where packets travel first in the x-direction, and then in the y-direction.
A prior study has showed that routers in the middle experience a higher traffic, and it is
almost double the traffic when compared to the peripheral routers. The higher aging rate
will dominate the chip aging rate, and therefore to maximize the lifetime of chip it would
be better if all the network components experience even utilization.
1.2 Causes of Age Degradation
Age degradation of transistors is a natural result due to usage and intrinsic property of
the material as well as the fabrication methodology. Today, there are no ideal material
where all defects can be eliminated or where novel materials can retain its production
condition eternally (lifetime of chip). With time, transistors age and deviate from their
production condition. It is possible to have minimal aging effects if aging was considered
at fabrication and changes in the material during runtime due to utilization were taking into
account.
Shrinking transistors and aggressive voltage scaling have reduced the lifetime of
transistors which results in reducing the lifetime of the chip. It is important first to identify
aging sources and reduce the impact as much as possible. Aging will produce a permanent
fault after certain period of time and if age-aware decisions/designs are incorporated, then
by improving the operating conditions, we may prolong the time before a permanent fault
will be observed in the system. Therefore, the goal here is not to eliminate the faults due
to aging but to design runtime decisions that delay the onset of faults and thereby improve
the lifetime of the chip.

18
1.2.1 Negative Bias Temperature Instability
Metal oxide semiconductor field effect transistors (MOSFET) is the technology used
to illustrate the functions in the Integrated Circuit (IC). MOSFET was chosen for ICs
because of its low static power consumption and high resistance to the field noise. Negative
Bias Temperature Instability (NBTI) which is the major cause for aging, primarily affects
the functionality of P-MOSFET. N-MOSFET effected by the temperature instability but the
effects are minimal when compared to p-MOSFET effects. NBTI decreases the electrons
mobility, drain current and conductivity, forcing the voltage threshold to go higher. The
cause of NBTI is not clear, but generally speaking when the logical zero is applied at the
gate for multiple consecutive cycles, interface traps start to build up causing the temperature
to elevate. Multiple diffusion models model the NBTI effects on the transistors, reaction
and diffusion model (R-D) [19] modeled NBTI degradation in two phases: reaction in
terms of chemical reactions and diffusion in terms of hydrogen molecules phases. Through
reaction phase degradation is linear with the stress time t, In the diffusion phase the
degradation is time dependent, but not linear. The hydrogen diffuses from the interface at
t0.25 rate. The number of traps generated through diffusion phase can be model as 1.2[19]:
4Nit(t) ≈
√AB
t0.25 (1.2)
where A and B are material related variables.
Figure[1.5] shows the effect of stress and recovery cycles and how the recovery is
not perfect when stressed with NBTI effects. This causes the voltage threshold to change
(4Vth). With longer stress time, the degradation loss is bigger. It is important to allow
some recovery time from NBTI, but what is more important is to eliminate longer stress
time. The duty cycle (the percentage of the cycle in which the signal is inactive) is a critical
measure to slow down aging. As shown in equation 1.3 proven by [8], duty cycle (β) has a
direct relationship to the lifetime of the transistor under NBTI.

19
Figure 1.5: Threshold voltage changes through stress and recovery cycle. [7] Copyright
©2006, IEEE
TT FNBT I = [ANBT I(1 − ββ
)n exp(nEaNBT I
kT)]
1n [8] (1.3)
1.2.2 Hot Carrier Injection
Hot Carrier Injection (HCI) is a semiconductor phenomenon, where electrons or holes
gain enough kinetic energy to leave the conduction/valence band. In MOSFET transistors
HCI occurs when carriers transfer high kinetic energy to holes and electrons allowing them
to leave the band leaving traps in the interface and therefore the connection efficiency
is reduced. HCI is correlated to the switching activity (αS A) in MOSFET transistors,
according to the equation 1.4 which shows that the lifetime of transistors is inversely
related to switching activity. The equation shows that increasing the switching activity
will increase the age degradation. However notice that the switching activity αS A does not

20
increase by reducing the duty cycle β [8]. The NBTI age degradation is related to 11−β while
HCI age degradation is related to αS A. Small improvement on the duty cycle β tends to
have a large impact on reducing NBTI degradation with small effect on HCI degradation,
see equations 1.5, 1.6.
TT FHCI = AHCI1
dg fαS A(Isub)−N ′exp(
EaHCI
kT) [8] (1.4)
δdg−NBT I = A(β
1 − β
n
tnexp(EaHCI
kT) [8] (1.5)
δdg−HCI = A(Isub)m)(dg fαS At)n [8] (1.6)
1.2.3 Electromigration
When electrons are passing through metal interconnection there is a possibility that
an electron will hit an ion and lose some of its energy resulting in creation of a void.
Electromigration can result in loss of connection because of the voids generated from the
collision which will decrease the efficiency of the conductor. Since the size of transistor is
shrinking, electromigration will have a bigger impact on the lifetime. According to [20],
65 nm processors have three times the failure rate when compared to 180 nm processors.
Electromigration is believed to dominate the IC failure and a lot of research on improving
the IC materials and conditions are already undergoing. Additional improvement to
maximize the lifetime of ICs is to level the degradation rate across the network. Distributing
the load throughout the network will decrease the age degradation rate across the entire
network.
1.3 Related Work
It is nearly impossible to eliminate age related degradation; however controlling the
amount of degradation and reverting aging effects will increase the lifetime of chips.
Previous work looked into aging problems, and has developed different mechanisms with
few of the approaches requiring hardware design changes while others require routing

21
algorithm modifications. In what follows, I will discuss few prior work related to age-
related avoidance and recovery.
1.3.1 Use it or Lose it: Wear-out and Lifetime in Future Chip Multiprocessors
After characterizing HCI and NBTI, it was found that network working under medium
utilization suffer the least aging effects when compared to low or high utilization network.
Under the assumption that real traffic have usually low utilization, Kim et al. [8] designed
wear-resistant router microarchitecture.
Figure 1.6: Use it or Lose it proposal router micro-architecture. [8]
They proposed a router micro-architecture as shown in Figure 1.6 where they added
additional exercise mode circuit to generate random cycles if the router is idle. They
proved that increasing the switching activity has lower impact on aging than higher duty
cycle. The proposal has been tested under Random number generators (ROM) and Linear
Feedback Shift Register (LFSR) and the results showed that LFSR was not able to produce
enough randomness to the network, while (ROM) with different length generator out-

22
performs LFSR and doubles the lifetime. The proposal weakness is in increasing the power
consumption in very large scale systems.
1.3.2 Toward Graceful Aging Degradation in NoCs Through an Adaptive Routing
Algorithm
As routers and links are not going to be used equally in the network, and the highly
used router will have a higher likelihood to fail, Bhardwaj,K et al. [1] proposed to route
packets taking into consideration both aging, and congestion. They used the property of
mesh topology that there are multiple shortest paths between source and destination that are
not in the same row or column. The authors alternatively routed packets through these paths
based on the age and congestion scores. The authors defined a new metric Traffic Threshold
per Epoch (TTpE) , where this metric is calculated off-line to define the maximum amount
of traffic each link or router should experience in different epochs. TTpE is used as an
aging metric while Regional Congestion Awareness (RCA) [10] is used as congestion score.
Packets get routed to the path that is least aged and least congested among all other available
paths by using the look-up table. Bhardwaj,K et al.[1] also implemented a recovery cycle
after a pre-calculated threshold, Traffic Threshold per Epoch (TTpE). When routers reach
their epoch threshold, they are forced to stay idle until the end of the epoch, and this will
allow some stress recovery.
They implemented a recovery cycle in the form of relaxation. If a router reaches its
TTpE value for the epoch, it will stop accepting any new packets until this epoch ends. By
implementing this recovery cycle, there will be some increase on latency but it will relax
the link and the router to reduce the aging degradation.
The need for an off-line calculation that depends on load distribution is one of the
drawbacks of the proposed idea. TTpE has to be set for every application or system. The
other drawback is the use of look-up table as it limits the scalability of the design and loses
23
the ability to adapt to changes in-flight. In the follow-up work, Bhardwaj,K et al. in [21]
considers the power consumption to improve the design [1].
1.4 Proposed Design
In this thesis, I propose an in-flight adaptive routing algorithm which works on aging
links and routers of the network at the same pace to reduce the aging effects and increase the
lifetime of the chip. The algorithm works by distributing the load throughout the network
with minimal effects on the network performance. We propose Packet Per Port (P3) as an
aging metric which is paired with an adaptive routing algorithm to deliver better distribution
of the network load. The algorithm takes advantage of the fully adaptive routing to avoid
the aged link and routers in-flight. P3 connects the routers/links age to the time they are
being used making it possible to control both ages at once to improve the lifetime of chip.
Smaller dependent crossbars [22] are used to further improve the performance and reduce
the power consumption of routers. The use of the simple but effective aging metric (P3)
allows us to improve the transistor reliability by 3.6% to 6.27% when compared to DOR.
We obtain up to 13.8% reduction in power consumption. The major contributions of this
work are as follows:
1. A new adaptive routing algorithm that will increase the lifetime of the chip by better
stress distribution, thus allowing minimum aging effects on the network without
sacrificing latency or throughput.
2. We propose to reduce the router power together with improving reliability by
implementing smaller, independent crossbars in the router instead of one large
monolithic crossbar.

24
3. The simulation results show that we can improve transistor reliability by 3.6% to
6.27% when compared to DOR while saving 13.8% in power on a 8 x 8 mesh
architecture.
The rest of the chapters in this thesis are organized as the following: Chapter 2
discusses routing in NoCs and introduces P3 routing algorithm and design. Chapter 3
evaluates the performance of the proposed design. Chapter 4 concludes and proposes future
work.

25
2 Routing in NoCs
Routing algorithms dictate the path a packet takes from source to destination. The
basic characteristic of any routing algorithm includes connectivity and deadlock/livelock
freedom. Connectivity is the ability to send/receive packets from any source/destination on
the network. Deadlock free is the elimination of any circular dependencies that will clog
the delivery of packets while livelock freedom ensures the forward progression of packets.
Other characteristics such as adaptivity and fault tolerance improve the performance of the
routing algorithm.
Figure 2.1: Routing protocol taxonomy. [9]
As Figure 2.1 shows the classification of routing algorithms. The classification
is based on the number of destinations, routing decisions, implementations, adaptivity,
progressiveness, minimality, and number of paths [6]. Routing algorithms can be
categorized into two main groups: deterministic (oblivious) routing and adaptive routing.

26
Deterministic routing is used to route packets regardless of the network status and is only
based on the destination address. In deterministic routing, packets take the same path
from source to destination. In oblivious routing, packets may take different paths, however
congestion information is not considered. On the other hand, in adaptive routing algorithms
packets take different paths between the same source/destination using congestion and
traffic condition. In this chapter, I will explain two routing algorithms: Dimensional Order
Routing (DOR) and Regional Congestion Awareness (RCA). DOR is an oblivious routing
algorithm and it is considered as the basic routing algorithm for mesh and torus topologies.
RCA is an adaptive routing algorithm which routes around congestion to avoid long latency.
2.1 Dimensional Order Routing
Dimensional Order Routing Algorithm (DOR) is based on a rule that packets cannot
leave the current dimension ( X or Y) until reaching the zero offset. After reaching the zero
offset, it can switch to the next dimension which ensures the deadlock/live lock freedom.
From the definition of DOR, only one turn is allowed from one dimension to the other
through the entire path. For 2-D mesh, DOR can be XY routing where packets are routed
in the X-dimension and then in the Y-dimension, or it can be YX routing (the opposite). In
both cases, DOR prohibits two of the four possible turns which depends on the direction
(XY or YX) to avoid deadlocks/livelocks. As shown in Figure 2.2 there is no circular
dependency since a circle cannot be formed. The prohibition of the turns is based on the
routing algorithm and ensures that the network is fully connected. Figure 2.2a (a) shows the
possible and prohibited turns for XY routing, Figure 2.2a (b) is for YX routing. DOR is a
simple and effective routing algorithm and DOR is the most common routing algorithm for
2-D mesh topology. DOR shows good performance in terms of latency and throughput, but
it does not consider the network status that could translate to high latency due to congestion.

27
(a) XY prohibited turns (b) YX prohibited turns
Figure 2.2: XY/YX turns roles. Arrows show the possible turns while dash lines mean
prohibited turns.
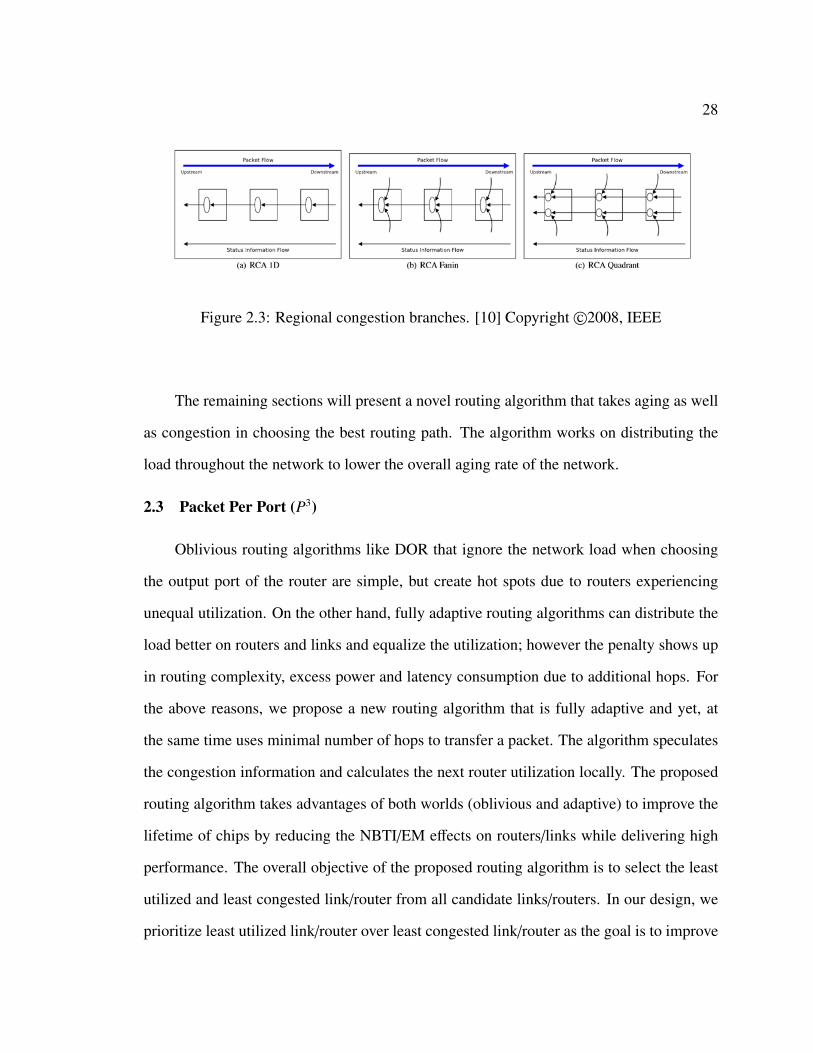
2.2 Regional Congestion Awareness
Regional Congestion Awareness (RCA) is an adaptive routing algorithm takes
congestion into consideration while making the routing decisions. It is proposed by Gratz
et al. [10], where they use the number of free virtual channel and crossbar demand to
speculate the network bottlenecks and avoid them. The proposal has three techniques
RCA-1D, RCA-fanin, and RCA-quadrant. The difference is the flow of the congestion
information; RCA-1D collect the congestion information of each direction independently,
while RCA-fanin provide a regional information because of its coarse view, RCA-quadrant
aim to increase the accuracy of the RCA-fanin by providing two separate scores for the
congestion, one for each axes. Even though RCA-1D is the simplest implementation, it
provides the most promising results.
Results show that when the traffic is uniform or complement, RCA increases the load
at the middle routers while keeping the peripheral routers at low utilization. The benefits
of RCA are shown when the load through the network is not well distributed.
28
Figure 2.3: Regional congestion branches. [10] Copyright©2008, IEEE
The remaining sections will present a novel routing algorithm that takes aging as well
as congestion in choosing the best routing path. The algorithm works on distributing the
load throughout the network to lower the overall aging rate of the network.
2.3 Packet Per Port (P3)
Oblivious routing algorithms like DOR that ignore the network load when choosing
the output port of the router are simple, but create hot spots due to routers experiencing
unequal utilization. On the other hand, fully adaptive routing algorithms can distribute the
load better on routers and links and equalize the utilization; however the penalty shows up
in routing complexity, excess power and latency consumption due to additional hops. For
the above reasons, we propose a new routing algorithm that is fully adaptive and yet, at
the same time uses minimal number of hops to transfer a packet. The algorithm speculates
the congestion information and calculates the next router utilization locally. The proposed
routing algorithm takes advantages of both worlds (oblivious and adaptive) to improve the
lifetime of chips by reducing the NBTI/EM effects on routers/links while delivering high
performance. The overall objective of the proposed routing algorithm is to select the least
utilized and least congested link/router from all candidate links/routers. In our design, we
prioritize least utilized link/router over least congested link/router as the goal is to improve
29
the reliability due to aging. However, one could easily pick least congested link/router if
the goal is higher performance.
2.3.1 P3 Routing Algorithm
The proposed routing algorithm makes routing decisions based on two primarily
scores: P3 and congestion score. P3 is the metric that provides the utilization information of
the next router locally. P3 is a directional metric that keeps track of all the link traversals.
Each router has four cardinal directions (+x, -x, +y, and -y) and therefore has four P3
values associated with each router. Age-aware routing [1] uses the delay variation in the
router’s critical path to select the output port, while P3 provides a more immediate reaction
since the decision is based on the link/router utilization. The number of free buffer slots
propagates dimensionally, either row-wise or column-wise to form the congestion score.
To minimize the lag time between the transmission of the congestion information and
the decision making, I confined the congestion information to the boundaries of source
and destination nodes within a grid. Every node receives congestion scores from each
node along the dimension rather than one cumulative score as in 1D-RCA. The node then
crunches the number to decide the congestion score. For example in a 4x4 mesh, the last
node will receive three congestion scores and depending on the packet destination, the
node will weigh the remaining nodes differently depending on the source and destination
boundaries. The sending router requests and receives congestion information from the two
possible routing directions (x and y) to reach the destination router. However, in 1D RCA
the congestion information is not bounded by the area of interest, as the router receives
congestion information along the entire row or column of the NoC which increases the lag
time between receiving the congestion information and making the decision. Moreover,
traffic intensities could change due to variation in application behavior making 1D-RCA
slower to respond to transient traffic changes. Therefore, our proposed routing algorithm

30
improves on reducing the lag time to receive congestion score and improves the congestion
score calculation as it is limited to source and destination nodes and not the entire network.
The trade-off is that instead of one single score, we receive multiple scores periodically
which incurs marginal power penalty. The routing algorithm selects the least utilized
as well as the least congested link with higher priority given to least utilization. The
route computation includes two stages of finding the possible routes and calculating the
congestion scores. Any source/destination combinations that are not located in the same
row/column have two possible links/routers one in each axis. The number of free input
buffer slots is used to calculate the propagation congestion. By using the 1-D RCA as
described in equations [ 2.1, 2.2 ]. P3is used as the aging metric. At each router, the
links/routers utilization are determined as XP3 = P3[Router][Xdirection] along the x-axis
and YP3 = P3[Router][Ydirection] along the y-axis. Both aging scores and the dimensional
congestion scores are fed to the routing algorithm.
XCong =
xdest∑N=xsrc
XrouterFBS
|xo f f set|(2.1)
YCong =
ydest∑N=ysrc
YrouterFBS
|yo f f set|(2.2)
where Xrouter is the next router on the X-axis, Yrouter is the next router on Y-axis and
FBS is Free Buffer Slots.
2.3.2 Router Micro-Architecture
Independently, smaller crossbars have been implemented to optimize the power
consumption and reduce the area as the wires are shorter and can deliver higher throughput
[22]. The router’s age is determined by the delay variation in the critical path, and
therefore the use of smaller crossbars will not impact aging. However, the use of multi-
crossbars within the router micro-architecture increases the probability of an output port
being occupied when compared to the conventional router [22]. Further, smaller crossbars

31
Table 2.1: P3 Routing Algorithm. [2]
Routing Algorithm
Inputs: Coordinate of current router (Xsrc,Ysrc)
and of destination router (Xdest,Ydest)
XCong, YCong, XP3, YP3
1. Calculate Xoffset = Xdest - Xsrc
2. Calculate Yoffset = Ydest - Ysrc
3. no. of hops = abs(Xoffest) + abs(Yoffset)
4. Determine the Virtual Network [X/Y , -X/Y , X/-Y , -X/-Y]
the packet is going to be routed in
5. If(XP3 > YP3) Output port = Ydirection
Else If( XP3 < YP3 ) Output port = Xdirection
Else If( XP3 == YP3 )
If(XCong <= YCong) = Output port = Xdirection
Else Output port = Ydirection
6. (Output port == Xdirection) ? Xoffset−− : Yoffset−−
7. (Output port == Xdirection) ? P3[Router][Xdirection]++
: P3[Router][Ydirection]++
8. While (no. of hops != 0 )

32
can better distribute the load and improve utilization of all wires within the crossbar. The
proposed micro-architecture with split crossbars along with congestion and aging score
calculation is shown in Figure 2.4. Virtual Channel (VC) allocation is critical in NoCs as
it prohibits any circular dependencies and therefore prevents any deadlock/livelock. In
routers with multi-crossbars, there are four quadrants (+x,+y), (+x,-y), (-x,+y), and (-
x,-y), where the packets can be adaptively routed to the destination, assuming that the
source is the reference point. As Figure 2.4 shows, we require four VCs to eliminate
deadlocks/livelocks with each VC allocated to one quadrant. The VC allocation is based on
the destination quadrant, if the destination is in the (+x,+y) quadrant, VC1 gets allocated.
If the destination is in the (+x,-y), VC2 gets allocated and so on. This separation creates
four Virtual Networks (VN) accordingly, and packets get injected to one VN and cannot
exit until the packet reaches its destination. Forcing packets to stay within the assigned VN
allows packets to move freely within the assigned VN and be routed adaptively.
The main target of P3 routing algorithm is to improve lifetime reliability of NoCs.
While lifetime is improved, this come at a cost of possible increase in latency due to
congestion. As describe above, P3 gives higher priority to aging over congestion and
our results showed that there is insignificant increase on the network latency as packets
sometimes get routed to highly congested routers. P3 routing algorithm were able to
improve the lifetime of chips and reduce power consumption with minimal cost on latency
and throughput.
2.3.3 Routing Example
In this section, I will illustrate an example of the proposed P3 routing algorithm. As
shown in Figure 2.5, the example depicts a 4x4 mesh architecture, however it can be applied
to 8 x 8 architecture as well. In this example router 15 (the top right corner) wants to
communicate with router 0 (bottom left corner). At the source node as shown in Figure

33
Figure 2.4: Router Microarchitecture. Left side shows the smaller crossbars connections
to the other parts of the router, the right top corner shows the congestion information
collection and calculation. P3 circuit calculation is explained in the right bottom corner.

34
Figure 2.5: Routing Example shows the routing path of a packet routed from router 15
to router 1. Each graph describes the status of the network at the time of routing and
the routing decision. a) shows routing the packet from R 15 to R14 based on P3 routing
algorithm, b) packet get routed from R 14 to R13, c) packet get routed from R13 to R9, d)
packet get routed from R9 to 5, e) packet get routed from R5 to R4, f) packet get routed to
it final destination R1 from R4. [2]
2.5(a), R15 (located at [3,3]), wants to communicate with the destination router R0 (located
at [0,0]) and the x and y offsets are [-3,-3]. I use red color for highly congested links and
higher P3 values, blue color for lower P3 values, black colored routers for routers through
which packets have traversed, black solid lines for links that the packet has, and black

35
dashed lines for next possible links. Based on the colors code (from the Figure 2.5) I see
that R14 on Y-axis is utilized higher than the R11 on the X-axis. R15 receives congestion
information from both -X, and -Y axes, R15 senses congestion (between R12 and R13 on
the X-axis, and between R7 and R11 on the Y-axis). Since congestion calculation is based
on the distance between the congestion and the source, XCong will be lower than the YCong.
The routing algorithm routes the packet to the least utilized and the least congested link and
P3[R15][−X] will be increased by 1. As shown in Figure 2.5 (b) for R14, the next router on
the X-axis is R13, and on the Y-axis is R10. In terms of utilization, R13 is preferred and in
terms of congestion R10 is preferred. As we prioritize utilization over congestion, R13 is
selected by the routing algorithm and P3[R14][−X] is increased by 1. As shown in Figure
2.5 (c), R12 and R9 are the next possible candidate routers for the packet. The algorithm
selects to make a turn to the Y-direction since R12 has higher utilization when compared
to R9 and increase P3[R13][−Y] by 1. Even though it senses congestion along the Y-axis,
priority is given to utilization rather than congestion. As shown in Figure 2.5 (d), the two
possible routers (R8 and R5) are potential candidates for the packet, the algorithm decides
to take the least utilized router as it is R5 and increase P3[R9][−Y] by 1. As shown in Figure
2.5 (e), R4 is less utilized than R1 however the congestion on the X-axis is higher than the
Y-axis. The algorithm avoids the highly utilized router and selects to route the packet to
X-axis and increase P3[R5][−X] by 1. As shown in Figure 2.5 (f), the packet has to take
Y-direction to reach router 0 which is the destination router and P3[R4][−Y] get increased
by 1. As this example illustrates, the routing algorithm decides to pick the least congested
and least utilized link with higher priority given to least utilization to improve performance
and reliability.
P3 routing algorithm works on leveling the load through out the network to reduce
aging effects on routers/links and thus improve the reliability of NoC’s and increase the
lifetime of the chip with minimal cost. However, since P3 has visibility to the neighbors

36
utilization packet gets routed to the least aged and/or least congestion to avoids highly aged
router/link and allows for some time to recover. In some cases, packets reach no return
point where it will have to travel the highly aged router/link. This is only allowed when
packets reach one of its zero offset and have to switch to the other direction. It could be
avoided if P3 does not take the shortest path and/or if P3 increases the utilization visibility.
Since shortest path decision saves on power consumption I would not recommend it. A
further improvement could be increasing the utilization visibility to improve the routing
decision by eliminating the number of times packets had to travel through highly aged
router/link. The addition would increase the lifetime of chip tremendously.

37
3 Performance Evaluation
The performance of P3 is evaluated in compared to Dimensional Order Routing
(DOR), Regional Congestion Awareness (RCA), which is an adaptive routing algorithm
that makes the routing decisions to avoid congestion, and Age-Aware Adaptive Routing
(AGE-ADAP) proposed in [1] where packets are being routed to the least aged and least
congested path using look-up table.
I use a cycle accurate network simulator that models the router microarchitecture
presented in section 2.3.2. Performance evaluation is done on 4x4 and 8x8 mesh with
different traffic characteristic to provide full analysis [23]. Synthetic traffic are chosen
to show the strengths and weaknesses of the proposed routing algorithm, two standard
synthetic traffic complement and uniform. Plus, two permutation synthetic traffic: perfect
shuffle and matrix transpose. Finally, we evaluate P3 on real traffic (Splash-2). To simulate
the synthetic traffic, simulator was warmed up then packets start injected and measurements
were collected. I tested the designs for as low as 0.05 network load and until reaching the
network saturation point. Splash-2 traces were collected from real application using SIMIC
simulator supported by GEMS simulator for memory package. Table 3.1 shows the core
caches parameter used to extract Splash-2 traces. While we compared all three algorithms
to P3 on a 4 x 4 mesh, we did not compare AGE-ADAP for 8 x 8 mesh. This is due to the
fact that AGE-ADAP was designed on a 4x4 mesh with a concentration of 4 and our design
is applicable to designs without any concentration. For the simulation, we used four VCs
allocated separately.
To model the aging effects we modeled a 45 nm transistor on Synopsys HSPICE using
HCI/NBTI long term degradation and Predictive Technology Models (PTM) [24] for 10
years. We observed the change in threshold voltage to model the aging factor as presented
by [25].

38
Table 3.1: Cache and Core Parameter Used for Splash-2 Traces Extraction. [3]
Parameter Value
L1/L2 coherence MOESI
L2 cache size/assoc 4MB/16-way
L2 cache line size 64
L2 access latency (cycles) 4
L1 cache size/assoc 64KB/4-way
L1 cache line size 64
L1 access latency (cycles) 2
Core Frequency (GHz) 5
Threads (core) 2
Issue policy In-order
Memory Size (GB) 4
Memory Controllers 16
Memory Latency (cycle) 160
Directory Latency (cycle) 80

39
3.1 Network Performance
In this chapter I will go over the performance (latency, throughput, and power) and
reliability matrices to evaluate P3 routing algorithm.
3.1.1 Utilization
Aging effects can be reduced by leveling the load throughout the network and thereby
improve the utilization (the percent of packets transfer through the router/link of the total
number of packet). P3 routing algorithm works on leveling the utilization throughout the
network to achieve longer lifetime. I calculated the utilization of each router/link of 4x4
mesh and compared the result to DOR, RCA, and AGE-ADAP routing algorithm. The
following Figures show how the load is distributed throughout the network, where each
point presents the percentage of the total packets that get to be routed through specific
coordinate of a specific router. Each router is connected to four coordinates (+X,-X,+Y,-
Y) and each router/link is presented in these figures to show how they suffer under basic
routing from large variation in the utilization while P3 was able to minimize the variation
in utilization and distribute the load more evenly. Figures 3.1, 3.2 show the improvement
of P3 over other routing algorithms for matrix transpose and perfect shuffle traffic patterns.
P3 increases the utilization of the low utilized router/link and decreases the utilization of
the highly utilized router/link. The load distribution for bit reversal and matrix transpose
under DOR routing shows that router/link utilization range is approximately three times
of P3 utilization range. Some routers/links that are physically there did not get to be used
under DOR; however all the physical links get to be used in P3 and this best usage of
the routers/links is what improves the utilization distribution. Comparing P3 to RCA and
AGE-ADAP shows that P3 has approximately 20% tighter range than RCA. In AGE-ADAP
avoiding the high congestion path allows to improve the load distribution. However; the
improvement in utilization falls behind P3 because of how the algorithm calculated the

40
aging score. It is noticeable that the links connected to the same router have very close
utilization values.
(a) P3 utilization under bit reversal traffic (b) DOR utilization under bit reversal traffic
(c) RCA utilization under bit reversal traffic (d) AGE-ADAP utilization under bit reversal
traffic
Figure 3.1: Load distribution for bit reversal traffic for 4x4 mesh under a) P3, b) DOR, c)
RCA, d) AGE-ADAP.

41
(a) P3 utilization under matrix transpose traffic (b) DOR utilization under matrix transpose traffic
(c) RCA utilization under matrix transpose traffic (d) AGE-ADAP utilization under matrix
transpose traffic
Figure 3.2: Load distribution for Matrix transpose traffic for 4x4 mesh under a) P3, b)
DOR, c) RCA, d) AGE-ADAP.

42
On the other hand, P3 is unable to improve the utilization of uniform and complement
traffic. As shown in Figures 3.3,3.4. As any adaptive routing algorithm, when the load is
evenly distributed, the algorithm manages the load on the peripheral routers better than it
does on the core routers. As it is shown in the Figures 3.3,3.4, P3 managed the load at the
peripheral routers and lost control at the middle routers.
The utilization for 8x8 mesh under uniform, complement, bit reversal, and matrix
transpose. figures 3.5, 3.6,3.7, 3.8, show how routers/links utilization distribution is better
for 8x8 mesh when compared to 4x4 mesh. P3 was able to reduce the highly utilized
(core) routers under complement traffic which was not possible for 4x4 mesh. This is
a result of increasing the number of shortest paths available which allows more turns to
avoid aged and congested routers. P3 was able to approximately reduce the routers/links
utilization range by 50% when compared to DOR. Even though P3 utilization range is
close to RCA utilization, the number of routers/links that suffer high or low utilization is
less which reduces the possibility of system failure. Figure 3.9,3.10 and appendix A show
the utilization under splash-2 traces which were improves when compared to DOR and
RCA by approximately 10% and 5% respectively.

43
(a) P3 utilization under uniform traffic (b) DOR utilization under uniform traffic
(c) RCA utilization under uniform traffic (d) AGE-ADAP utilization under uniform traffic
Figure 3.3: Load distribution for Uniform traffic for 4x4 mesh under a) P3, b) DOR, c)
RCA, d) AGE-ADAP.

44
(a) P3 utilization under complement traffic (b) DOR utilization under complement traffic
(c) RCA utilization under complement traffic (d) AGE-ADAP utilization under complement
traffic
Figure 3.4: Load distribution for complement traffic for 4x4 mesh under a) P3, b) DOR, c)
RCA, d) AGE-ADAP.

45
(a) P3 utilization under uniform traffic
(b) DOR utilization under uniform traffic (c) RCA utilization under uniform traffic
Figure 3.5: Load distribution for uniform traffic for 8x8 mesh under a) P3, b) DOR, c)
RCA.

46
(a) P3 utilization under complement traffic
(b) DOR utilization under complement traffic (c) RCA utilization under complement traffic
Figure 3.6: Load distribution for complement traffic for 8x8 mesh under a) P3, b) DOR ,
c) RCA.

47
(a) P3 utilization under bit reversal traffic
(b) DOR utilization under bit reversal traffic (c) RCA utilization under bit reversal traffic
Figure 3.7: Load distribution for bit reversal traffic for 8x8 mesh under a) P3, b) DOR, c)
RCA.

48
(a) P3 utilization under matrix transpose traffic
(b) DOR utilization under matrix transpose (c) RCA utilization under matrix transpose
Figure 3.8: Load distribution for matrix transpose traffic for 8x8 mesh under a) P3, b)
DOR, c) RCA.

49
(a) P3
(b) DOR (c) RCA
Figure 3.9: Load distribution for Radiocity from splash-2 traces for 8x8 mesh under a) P3,
b) DOR, c) RCA.

50
(a) P3
(b) DOR (c) RCA
Figure 3.10: Load distribution for FFM from splash-2 traces for 8x8 mesh under a) P3, b)
DOR, c) RCA.
3.1.2 Latency
Latency is a very critical measurement that shows the performance of the network.
It is the average time a packet would spend in the network before it will be delivered to
the destination. Figure 3.11 shows the network latency for 4 x 4 mesh architecture for
matrix transpose and bit reversal traffic pattern. DOR provides the best performance for
complement and uniform traffic since the load is well distributed throughout the network.
This is due to the fact that adaptive routing algorithms will try to balance the load on the
peripheral routers which results in traffic diverted to the core routers where congestion
builds up. However, since RCA is only concerned with congestion, it outperforms P3 when

51
the network load is uneven as shown in 3.11. It must be noted that RCA does not distribute
the load evenly throughout the network and the packet simply chooses the least congested
path. Even though P3 does not deliver the lowest latency, P3 improves the distribution of
load which will increase the lifetime of the chip. As P3 is concerned with load distribution
and congestion avoidance, latency impact is minimal. AGE-ADAP is able to outperform
P3 in terms of latency, as it is not a fully adaptive algorithm, however AGE-ADAP does not
distribute the load as P3.
For 8 x 8 mesh, P3 shows better load distribution as well as improves the network
latency. As shown in Figures 3.12(c) and 3.12(d), P3 outperforms DOR for permutation
traffic, 19% for matrix transpose and 77% bit reversal because it is able to avoid congestion
and load balance the traffic throughout the network. However, RCA showed better network
latency as it does not consider utilization, and only avoids congestion.
Latency results show that the network will not suffer from a high latency nor
starvation, as figures [3.11, 3.12, 3.13] show the effect on latency is very minimal and this
is due to the fact that the used path is still the shortest path and the congestion is avoided
as much as possible.
3.1.3 Throughput
For 4 x 4 mesh the results indicates that P3 did not affect the throughput for all
tested traffic patterns except for complement traffic where P3 reduces the throughput by
10%. However for 8 x 8 mesh as shown in Figure 3.14(a), P3 is able to improve the
throughput by 36% when compared to DOR for bit reversal traffic. As complement traffic
is well distributed throughout the network, throughput is affected because of the increased
congestion at the core routers. Real traffic throughput as shown in Figure 3.14(b) indicates
that the throughput degradation is marginal and depends on traffic distribution.

52
(a) Uniform Traffic (b) Complement Traffic
(c) Matrix Transpose (d) Bit Reversal
Figure 3.11: Average network latency for 4 x 4 mesh for a few select synthetic traffic
patterns - (a) Uniform , (b) Complement , (c) Matrix Transpose , (d) Bit Reversal.[2]

53
(a) Uniform (b) Complement
(c) Matrix Transpose (d) Bit Reversal
Figure 3.12: Average network latency for 8 x 8 mesh for a few select synthetic traffic
patterns - (a) Uniform , (b) Complement , (c) Matrix Transpose, and (d) Bit Reversal.[2]

54
Figure 3.13: Average network latency for 8 x 8 mesh for splash-2 traces
3.1.4 Aging
Aging in NoCs can be determined by the slow shift in the threshold voltage Vth and this
will result in an increase in gate delay. As NoCs is a latency sensitive network, increasing
the critical path delay by more than 10% is considered as a system failure [26]. The latency
induced will exceed the router pipeline which will create erroneous packet reception. Based
on reaction-diffusion, transistor delay is shifted by Vth according to Alpha Power Law[27]:
dg = αVdd
µ(Vdd − Vth)ϕ(3.1)
P3 will control the increase of the threshold voltage by dividing the load throughout
the network to reduce the age degradation. P3 was able to achieve a better utilization and
a shorter duty cycle. We ran Synopsys HSPICE for a transistor model under PTM for 10
years and collected the Vth to calculate aging[25] as described Aging = 4VthVth
.By increasing

55
(a) 4x4 mesh (synthetic traffic) (b) 8x8 mesh (synthetic traffic)
(c) 8x8 mesh (Splash-2 traces) [2]
Figure 3.14: Network throughput - (a) 4x4 mesh under synthetic traffic , (b) 8x8 mesh
under synthetic traffic patterns, and (c) 8x8 mesh under Splach-2 traces (normalize to
DOR). (notation: Uni: Uniform, Comp: Complement, Mt-Tr: Matrix Transpose, Bt-Re: Bit Reversal,
Per-sh: Perfect Shuffle, BF: Butterfly, GEO-MEAN: Geometric Mean).

56
Figure 3.15: The aging effects on transistor reliability. [2]
the load on the peripheral routers and decreasing the load on the core routers, P3 showed
the best load distribution through out the network. As shown in Figure [3.15], P3 is able to
increase the lifetime reliability by decreasing the diffusion of the threshold voltage.
3.1.5 Energy per Bit
The use of multi-crossbars within the routers and the distributed routing algorithm
paid off for P3 in terms of energy per bit. Figure 3.16 shows that P3 consumes the least
energy per bit for Splash-2 traces, P3 reduces the energy per bit between 7.3% and 13.7%.
All simulation has been done on DSENT simulator [28].

57
Figure 3.16: Energy per Bit for Splash-2 traces normalized to DOR. [2]
58
4 Conclusions and FutureWork
In this research, I propose an in-flight adaptive routing algorithm that improves the
lifetime of the network by leveling the load on the network. By distributing the load
on all links and routers, our evaluation showed that we can reduce the delay variation
and improve the reliability of the chip. Our results also indicate that we can reduce the
power consumption when compared to state-of-the-art routing algorithms with marginal
performance degradation. P3 improves the lifetime of chip by avoiding highly aged
routers/links, however it is based on the utilization of the next hop only. With limited
visibility to the next router/link utilization P3 shows promising results in term of improving
the lifetime of chips with minimal impact on the latency and throughput. In the future, P3
performance could be boosted by increasing the utilization visibility to find the optimal
path. P3 values could be transferred throughout the network with RCA. This improvement
would result in routing packets to the optimized path which reduces the impact on latency
and throughput.
This research covered two sources of age degradation; Negative Bias Temperature
Instability (NBTI) and Hot Carrier Injection (HCI). The results showed how those two
would improve the lifetime reliability of chip. Electromigration (EM) was not included
because the impact of EM on 45 nm transistors is mainly controlled by doping level
of silicon. As chips are designed with 14 nm transistor and smaller, the effects of EM
degradation on chip are becoming more critical and could dominate the lifetime of chip.
As of today, EM effects have been handled through improvement of the material and the
doping level of silicon. If a routing algorithm or router microarchitecture is designed to
account for EM effects, the lifetime of chip would be improved tremendously.

59
References
[1] Bhardwaj , K. and Chakraborty, K. and Roy, S., “Towards graceful aging degradationin nocs through an adaptive routing algorithm,” in Design Automation Conference(DAC), 2012 49th ACM/EDAC/IEEE, June 2012, pp. 382–391.
[2] J. Alshraiedeh and A. Kodi, “An adaptive routing algorithm to improve lifetimereliability in nocs architecture,” in 2016 IEEE International Symposium on Defectand Fault Tolerance in VLSI and Nanotechnology Systems (DFT), Sept 2016, pp.127–130.
[3] D. DiTomaso, A. Kodi, and A. Louri, “Qore: A fault tolerant network-on-chiparchitecture with power-efficient quad-function channel (qfc) buffers,” in 2014 IEEE20th International Symposium on High Performance Computer Architecture (HPCA),Feb 2014, pp. 320–331.
[4] Teraflop processors. [Online]. Available: http://www.intel.com/pressroom/kits/teraflops/
[5] Power7 processors. [Online]. Available: http://arstechnica.com/gadgets/2009/09/
ibms-8-core-power7-twice-the-muscle-half-the-transistors/
[6] Dally, William and Towles, Brian, Principles and Practices of InterconnectionNetworks. San Francisco, CA, USA: Morgan Kaufmann Publishers Inc., 2003.
[7] Bhardwaj, S. and Wenping Wang and Vattikonda, R. and Yu Cao and Vrudhula, S.,“Predictive modeling of the nbti effect for reliable design,” in Custom IntegratedCircuits Conference, 2006. CICC ’06. IEEE, Sept 2006, pp. 189–192.
[8] Kim, Hyungjun and Vitkovskiy, Arseniy and Gratz, Paul V. and Soteriou,Vassos, “Use it or lose it: Wear-out and lifetime in future chipmultiprocessors,” in Proceedings of the 46th Annual IEEE/ACM InternationalSymposium on Microarchitecture, ser. MICRO-46. New York, NY, USA: ACM,2013, pp. 136–147. [Online]. Available: http://doi.acm.org/10.1145/2540708.2540721
[9] J. Duato, S. Yalamanchili, and N. Lionel, Interconnection Networks: An EngineeringApproach. San Francisco, CA, USA: Morgan Kaufmann Publishers Inc., 2002.
[10] Gratz, P. and Grot, B. and Keckler, S.W., “Regional congestion awareness for loadbalance in networks-on-chip,” in High Performance Computer Architecture, 2008.HPCA 2008. IEEE 14th International Symposium on, Feb 2008, pp. 203–214.
[11] Intel core i7. [Online]. Available: http://ark.intel.com/products/47933/
Intel-Core-i7-970-Processor-12M-Cache-3 20-GHz-4 80-GTs-IntelQPI?wapkw=
core+i7+970/

60
[12] Xeon processor e7 v4 family. [Online]. Available: http://ark.intel.com/products/family/93797/Intel-Xeon-Processor-E7-v4-Family/
[13] K. Bolding and L. Snyder, Eds., PCRCW ’94: Proceedings of the First InternationalWorkshop on Parallel Computer Routing and Communication. London, UK, UK:Springer-Verlag, 1994.
[14] W. J. Dally and B. Towles, “Route packets, not wires: on-chip interconnectionnetworks,” in Design Automation Conference, 2001. Proceedings, 2001, pp. 684–689.
[15] L. Benini and G. D. Micheli, “Chapter 5 - network and transportlayers in networks on chip*,” in Networks on Chips: Topology and Tools,ser. Systems on Silicon, L. Benini, , and G. D. Micheli, Eds. SanFrancisco: Morgan Kaufmann, 2006, pp. 147 – 202. [Online]. Available:http://www.sciencedirect.com/science/article/pii/B9780123705211500060
[16] R. S. Ankur Agarwal, Cyril Iskander, “Survey of network on chip (noc) architecturesand contributions,” Journal of engineering, Computing and Architecture, vol. 3, no. 1,pp. 21–27, 2009.
[17] “ITRS International Technology Roadmap for Semiconductors. Process integration,devices, and structures (PIDS),” 2009.
[18] R. Hegde and N. R. Shanbhag, “Toward achieving energy efficiency in presence ofdeep submicron noise,” IEEE Transactions on Very Large Scale Integration (VLSI)Systems, vol. 8, no. 4, pp. 379–391, Aug 2000.
[19] S. Ogawa and N. Shiono, “Generalized diffusion-reaction model forthe low-field charge-buildup instability at the si-sio2 interface,” Phys.Rev. B, vol. 51, pp. 4218–4230, Feb 1995. [Online]. Available:http://link.aps.org/doi/10.1103/PhysRevB.51.4218
[20] Cher Ming Tan, Electromigration in ULSI interconnects. New Jersey, CA, USA:World Scientific Publishing Co.Pte.Ltd, 2010.
[21] b. Bhardwaj, K. and Chakraborty, K. and Roy, S., “An milp-based aging-aware routingalgorithm for nocs,” March 2012, pp. 326–331.
[22] A. Kodi, R. Morris, D. DiTomaso, A. Sarathy, and A. Louri, “Co-design of channelbuffers and crossbar organizations in nocs architectures,” in Computer-Aided Design(ICCAD), 2011 IEEE/ACM International Conference on, Nov 2011, pp. 219–226.
[23] A. K. Kodi and A. Louri, “Optisim: A system simulation methodology for opticallyinterconnected hpc systems,” IEEE Micro, vol. 28, no. 5, pp. 22–36, Sept 2008.
[24] “Predictive technology model,” http://ptm.asu.edu/.

61
[25] Y. Wang, S. Cotofana, and L. Fang, “A unified aging model of nbti and hci degradationtowards lifetime reliability management for nanoscale mosfet circuits,” in NanoscaleArchitectures (NANOARCH), 2011 IEEE/ACM International Symposium on, June2011, pp. 175–180.
[26] J.W. McPherson, Reliability Physics and Engineering: Time-To-Failure Modeling.Spring, 2010.
[27] T. Sakurai and A. R. Newton, “Alpha-power law mosfet model and its applications tocmos inverter delay and other formulas,” IEEE Journal of Solid-State Circuits, vol. 25,no. 2, pp. 584–594, Apr 1990.
[28] C. Sun, C. H. O. Chen, G. Kurian, L. Wei, J. Miller, A. Agarwal, L. S. Peh, andV. Stojanovic, “Dsent - a tool connecting emerging photonics with electronics foropto-electronic networks-on-chip modeling,” in Networks on Chip (NoCS), 2012 SixthIEEE/ACM International Symposium on, May 2012, pp. 201–210.
[29] Ancajas, D.M. and Bhardwaj, K. and Chakraborty, K. and Roy, S., “Wearoutresilience in nocs through an aging aware adaptive routing algorithm,” Very LargeScale Integration (VLSI) Systems, IEEE Transactions on, vol. 23, no. 2, pp. 369–373,Feb 2015.
[30] A. Kodi, A. Sarathy, A. Louri, and J. Wang, “Adaptive inter-router links for low-power, area-efficient and reliable network-on-chip (noc) architectures,” in DesignAutomation Conference, 2009. ASP-DAC 2009. Asia and South Pacific, Jan 2009,pp. 1–6.
[31] S. Kumar, A. Jantsch, J. P. Soininen, M. Forsell, M. Millberg, J. Oberg, K. Tiensyrja,and A. Hemani, “A network on chip architecture and design methodology,” in VLSI,2002. Proceedings. IEEE Computer Society Annual Symposium on, 2002, pp. 105–112.
[32] L. Benini and G. D. Micheli, “Networks on chips: a new soc paradigm,” Computer,vol. 35, no. 1, pp. 70–78, Jan 2002.
[33] A. K. Mishra, N. Vijaykrishnan, and C. R. Das, “A case for heterogeneous on-chipinterconnects for cmps,” SIGARCH Comput. Archit. News, vol. 39, no. 3, pp. 389–400, Jun. 2011. [Online]. Available: http://doi.acm.org/10.1145/2024723.2000111
[34] Dieter K. Schroder, “Negative bias temperature instability: What do we understand?”in Microelectronics Reliability 47 (2007), December 2006, p. 841852.
[35] K. Olukotun, B. A. Nayfeh, L. Hammond, K. Wilson, and K. Chang, “The case for asingle-chip multiprocessor,” SIGOPS Oper. Syst. Rev., vol. 30, no. 5, pp. 2–11, Sep.1996. [Online]. Available: http://doi.acm.org/10.1145/248208.237140

62
[36] S. Murali, T. Theocharides, N. Vijaykrishnan, M. J. Irwin, L. Benini, andG. D. Micheli, “Analysis of error recovery schemes for networks on chips,”IEEE Des. Test, vol. 22, no. 5, pp. 434–442, Sep. 2005. [Online]. Available:http://dx.doi.org/10.1109/MDT.2005.104

63
Appendix: Routers/Links Utilization
A.1 Splash-2 Router/Links Utilization
(a) P3
(b) DOR (c) RCA
Figure A.1: Load distribution for Water from splash-2 traces for 8x8 mesh under a) P3, b)
DOR , c) RCA.

64
(a) P3
(b) DOR (c) RCA
Figure A.2: Load distribution for Radix from splash-2 traces for 8x8 mesh under a) P3, b)
DOR, c) RCA.

!!!!!!!!!!!!!!!!!!!!!!!!!!!!!!!!!!!!!!!
!!
Thesis and Dissertation Services
Copyright © 2022 FDOKUMEN