Wealth Effect of Drug Withdrawals on Firms and Their Competitors
29
Wealth Effect of Drug Withdrawals on Firms and their Competitors Parvez Ahmed* , 1 John Gardella, MD** Sudhir Nanda* * Assistant Professor of Finance, School of Business Administration, Pennsylvania State University, Harrisburg. ** Clinical Director, Presbyterian Hospital - Matthews, NC. 1 Please direct all correspondence to: Parvez Ahmed Penn State Harrisburg School of Business Administration Middletown, PA 17057-4898. Voice: (717) 948-6162, Fax: (717) 948-6456 email: [email protected]
-
Upload
independent -
Category
Documents
-
view
1 -
download
0
Transcript of Wealth Effect of Drug Withdrawals on Firms and Their Competitors

Wealth Effect of Drug Withdrawals on Firms and their Competitors
Parvez Ahmed*, 1
John Gardella, MD** Sudhir Nanda*
* Assistant Professor of Finance, School of Business Administration, Pennsylvania State University, Harrisburg. ** Clinical Director, Presbyterian Hospital - Matthews, NC. 1Please direct all correspondence to: Parvez Ahmed Penn State Harrisburg School of Business Administration Middletown, PA 17057-4898. Voice: (717) 948-6162, Fax: (717) 948-6456 email: [email protected]
Wealth Effect of Drug Withdrawals on Firms and their Competitors
ABSTRACT
This paper studies the impact of drug withdrawals on shareholder wealth of producers and
competitors. Results show that the wealth loss is conditional on the information content of the
news of a drug withdrawal. Firms withdrawing drugs during advanced clinical investigations
suffer a larger wealth loss than withdrawals during post-marketing surveillance. The wealth loss
is inversely related to the market capitalization and is smaller in case multiple firms withdraw the
same type of drug. Moreover, reports of adverse drug reactions that sometimes precede the
eventual withdrawal of a drug lead to significant loss in shareholder wealth. Finally,
shareholders of the direct competitors gain only during the five-day post-event period.
JEL Classification: G3 Keywords: Product Recall, Product Withdrawal, Competitors, Event Study

1
Wealth Effect of Drug Withdrawals on Firms and their Competitors
The news of a product recall usually receives considerable market attention. Following
the news of the withdrawal of Firestone tires in August 2000, Bridgestone (parent of Firestone)
lost over 45% of its stock value.1 For pharmaceutical drugs, the high public scrutiny is usually
not just limited to issues of safety but extends to the effectiveness of the products. Previous
studies on recalls and withdrawals of products present conflicting evidence. Hoffer, Pruitt, and
Reilly (1988), and Bromiley and Marcus (1989) report insignificant wealth losses, while Pruitt
and Peterson (1986) show a significant decline in shareholder wealth around a product recall.
This paper focuses on the wealth effects of drug withdrawals. There are meaningful economic
differences between a product recall and a withdrawal. A recalled product is likely to be
reintroduced after some modifications. In contrast, a withdrawn product results in the
elimination of a revenue source since most products are never reintroduced. The loss in expected
cash flows should be higher for withdrawals than recalls. Davidson and Worrell (1992) show a
higher loss in shareholder wealth for product withdrawals than for product recalls.2 Thus,
limiting the study to drug withdrawals alone makes the sample more homogeneous and limits the
confounding of wealth effects.
Jarrell and Peltzman (1985), using a sample of drug recalls (such as recall of Tylenol to
fix tampering of packages) and drug withdrawals (such as withdrawal of MER-29, a cholesterol
reducer, linked to blindness and baldness), find significant shareholder wealth losses around the
1 Additionally, with 88 deaths attributed to the defective tires, the firm faces a plethora of product liability damages and possibility of bankruptcy. Source: Atlanta Constitution Journal, September 1, 2000. 2 Their study suffers from a very small sample size (27) and does not control for the type of product being withdrawn. The revenue loss from the withdrawal of an electric appliance or a toy will be much lower than that from a medical drug. This is mainly for two reasons - higher R&D cost for drugs and each drug being a large proportion of overall firm sales.

2
announcements. In contrast, Dranove and Olsen (1994) find significant but lower shareholder
wealth losses around the announcement of drug withdrawals only. Both studies span a very
small period of time primarily in the 1970s and early 1980s. The sample of drug withdrawals
does not exceed five in either study, which limits generalization of their results.
This study examines the wealth effects of drug withdrawals from 1966-1998. The longer
time period and a larger sample allow us to make more generalized inferences on the extent of
wealth losses from drug withdrawals. The larger sample also allows tests on subsamples
stratified by the information content of the news of a drug withdrawal. Specifically, this study
examines the impact of the following; (i) availability of substitutes for withdrawn drug, (ii)
simultaneous withdrawal of a class of drugs by multiple firms versus a withdrawal affecting only
one firm, (iii) reason for the withdrawal, and (iv) stage of drug withdrawal. Additionally, the
study examines wealth effects from unintended but severe side effects know as adverse drug
reactions (ADR). In instances where a drug withdrawal is preceded by an ADR, the total wealth
loss is the sum of wealth losses at the announcement of the ADR and the eventual withdrawal.
Finally, the study examines wealth effects for direct competitors of firms withdrawing drug.
The results show that stockholders of drug producers incur substantial losses at the time
of a drug withdrawal. The losses are higher in cases in which a drug has no available substitute.
Losses are also higher in instances when a single firm was required to withdraw a drug as
compared to the simultaneous withdrawal of a class of drugs by multiple producers. Withdrawal
of drugs that caused deaths or severe medical side effects resulted in higher wealth losses than
withdrawals resulting from ineffectiveness of the drug. However, the impact of cause of
withdrawal was subsumed by the other variables in multivariate tests. Smaller firms suffered
significantly higher losses than the large well diversified firms. Additionally, firms withdrawing

3
drugs during post-marketing surveillance suffered lower wealth losses. This study also finds
significant negative returns at the announcement of adverse drug reactions (ADRs). The results
for a matched sample of ADRs and corresponding withdrawals suggest that the previous studies,
which examine only withdrawals, understate losses to the firm. Finally, competitors do not gain
in the event period, but show significant positive returns in the five-day post-event period.
The rest of the paper is organized as follows. In Section I we provide the context for this
study from recent events, discuss the literature, and issues examined in this paper. Section II
describes the data and the event study methodology. Section III presents the empirical results
and discusses their implications. Finally, Section IV provides some concluding remarks.
I. Discussion and Research Issues
The safety of consumer products in the United States is ensured through a combination of
ex-ante and ex-post regulation (Marino, 1997). Ex-ante, products are required to meet minimum
safety standards, and ex-post their safety is monitored by various regulatory agencies. In
addition to random ex-post audits, producers may be liable for any significant harm from the use
of their products. The Food and Drug Administration (FDA) approves the marketing of all
pharmaceuticals and monitors their safety. Figure 1 provides a schematic overview of the
process of drug development, approval, and post-marketing monitoring. The FDA has the
power, vested in it by the United States Congress, to order the withdrawal of a drug that causes
any harmful side effects or is ineffective.3
The withdrawal of a product involves direct and indirect costs. Direct costs are easily
measurable as they arise from the cost of fixing a defect and loss in future revenue. The
3 Welling (1991) asserts that a ‘social planner’ such as the FDA, will issue a recall announcement if the social benefit from the recall exceeds the total cost.
4
permanent loss in revenue results in higher direct costs for product withdrawals than for product
recalls. Indirect costs are more difficult to determine, as they are usually attributable to loss in
goodwill or reputation. The loss of goodwill or social reputation can affect a firm's sales
(Hersch, 1991). Consumers, employees or suppliers may also punish a firm for its failure to
honor their implicit contracts. Such punitive measures impact future cash flows and in turn
affect current share prices.
Dowdell, Govindraj, and Jain (1992) show that following the much publicized Tylenol
poisoning incident in 1982, Johnson and Johnson (JNJ), the makers of Tylenol, lost 29% or
$2.31 billion in shareholder wealth. Recent stories on some drug withdrawals provide an
illustration of the context of this study and how the information content results in different
market reactions. On May 20, 2000 The Wall Street Journal reported the withdrawal of the drug
Vanlev during advanced clinical trials by Bristol Myers Squibb (BMS). At the time of this
announcement, BMS stock fell by 23% leading to a total wealth loss of approximately $30
billion. Similarly, Johnson and Johnson lost 11% or approximately $10 billion of its market
value following its decision to stop the marketing of Propulsid, which was linked to several cases
of patient death and irregular heartbeats. Such large losses in shareholder wealth seem to go
beyond any reasonable direct costs of recall or expected losses in direct future revenue. The
expected revenue from a moderately successful drug is currently $66 million per year (Kellogg
and Charnes, 2000).4 Dowdell et al. (1992), Rubin et al. (1988), and Jarell and Peltzman (1985)
attribute such perplexingly high wealth losses from catastrophic events to lower expected future
cash flows due to a loss in goodwill.
4 A marketed drug has a 60% chance of being of average quality and it takes a drug two years to reach its peak revenue. Assuming a profit margin of 25%, the net present value of an average drug is approximately $110 million if the cash flows are assumed to be perpetual and are discounted at 15%. Only 8% of all drugs launched reach annual sales of $350 million (Sauer, 1998).

5
Warner Lambert's share price declined by only 2% around the withdrawal of Rezulin.
While this loss is lower than in the previous examples, the total loss over all previously reported
ADRs (Rezulin was linked to 63 deaths over the previous three years) and the subsequent
withdrawal is close to the losses sustained by other drug manufacturers. Additionally, media
reports indicated that the withdrawal of Rezulin might help Warner's competitor Eli Lilly by
boosting its revenues by "hundreds of millions of dollars" from the sale of a competing drug
called Actos (Swiatek, 2000).
Negative publicity or withdrawal of a product can have a 'positive spillover' effect on
direct competitors (those with available substitute products) by improving their market share or
reputation or both. Bosch, Eckard and Singal (1998) report a 'negative spillover' effect on
competitors in the period surrounding an airline crash. They suggest that stakeholders, such as
consumers and insurers, out of concern for the overall efficacy of air safety exact a price for this
negative sentiment. However, the wealth effects for direct competitors will be positive if the
gain in market share outweighs any concern for the systemic safety of pharmaceutical drugs.
The previous examples illustrate the rich information content in each news release, which
causes the market to react differently in each circumstance. The impact of the information
content of the news is studied by stratifying the sample. The producers of drugs without
substitutes are likely to suffer a greater loss in shareholder wealth than producers marketing
drugs with available substitutes. This is mainly because drugs without substitutes enjoy a
monopoly for a number of years, which allows them to earn higher returns.
The FDA sometimes instructs multiple producers to simultaneously withdraw a class of
drugs, such as antibiotics in the 1970s.5 On finding a health risk from a certain chemical
5 On the other hand, after the antihistamine Terfenadine (Seldane) was found to have potentially fatal side effects, its removal action did not restrict the sale of other antihistamines

6
compound, all drugs containing the compound in question are ordered withdrawn. When
multiple firms withdraw similar drugs, no firm gains a competitive advantage and market shares
are likely to remain approximately the same following a withdrawal. Additionally, being
identical in chemical composition, these drugs are likely to be priced competitively resulting in
lower loss in expected revenues and profits. Thus, withdrawals by multiple producers should be
accompanied by lower wealth losses than those experienced by a single producer withdrawing a
drug.
As firms are expected to deliver safe products, deaths caused by drugs result in a
significant violation of implicit contracts, and increase the probability of lawsuits. The violation
of implicit contracts can also lead to the institution of costly procedures by stakeholders for
monitoring of their implicit contracts (Hersch, 1991). The additional costs from litigation and
the accompanying negative publicity can lead to higher losses in shareholder wealth.6
New pharmaceutical firms usually have few products. Being small, any single drug
would constitute a large proportion of overall cash flows for such firms. The withdrawal of such
drugs is expected to cause a more severe wealth loss than for large well-diversified firms.
Finally, the stage of a drug withdrawal can also have an impact on the level of abnormal return.
Given the high probability of success (66%) at Phase 3 and beyond, failure at the clinical trial
level is a severe disappointment to investors. Additionally, drugs withdrawn during post-
marketing surveillance should suffer a lower loss in net present value. Since the drug was
already producing some revenue the firm had a chance to recover some cost of development.7
6 "Warner Lambert was facing the possibility of litigation from people who suspect their use of Rezulin led to severe liver damage for themselves, or the death of family members" - March 22, 2000, AFX News Limited. 7 According to FDA's Center for Drug Evaluation and Research, the average R&D cost for a drug before being submitted for clinical trials is over $300 million.

7
Even before the withdrawal of a drug, major newspapers frequently report safety and
side-effect problems associated with its use. The recently instituted MedWatch program of the
FDA (reported on the FDA website) provides a list of such adverse drug reactions (ADR).8 An
ADR does not alter any explicit contracts nor does it affect a firm's ability to deliver the final
product. Thus, the news of an ADR will primarily affect a firm’s reputation or goodwill.9 In
instances where an ADR does lead to the withdrawal of a drug, the total wealth loss is the
cumulative loss from all preceding adverse drug reactions and the actual withdrawal.
Additionally, this study tests for differences in abnormal returns and return volatility of ADR
subsamples with and without an eventual drug withdrawal. Lack of any significant difference
between the subsamples would support the assertion that the market is unable to accurately
predict the eventual withdrawal of a drug following an ADR.
II. Data and Methodology
Drugs could be withdrawn during post-marketing surveillance or during advanced
clinical trials in humans (Figure 1). In either instance, withdrawals are reported in major
newspapers. In a majority of cases drugs withdrawn during advanced clinical trials were already
assigned a brand name. This is not surprising as 66% of drugs that make it to Phase 3 trials are
approved. The withdrawal of drugs in pre-marketing stages could result from the FDA Advisory
8 An ADR represents any noxious and unintended effect of a drug, which occurs in humans despite proper dosing (World Health Organization, 1966). Despite elaborate involvement of the FDA in the drug approval process it is unreasonable to expect them to be perfect. Drugs cannot be tested in all possible conditions of use and the final phase of drug testing reveals only the most overt risks. Many important side effects become apparent only when the new drug appears on the market, as less common risks escape early detection. 9 Other studies that report significant negative stock market returns from "loss in reputation" include Hersch (1991) on Equal Employment Opportunity violations; Davidson, Worrell, and Cheng (1989), and Fry and Lee (1989) on OSHA violations; and Reichert, Lockett, and Rao (1996) on corporate white collar crimes. Chauvin and Guthrie (1994) report significant gains to shareholders of firms cited as best employers in Working Mother magazine.

8
Committee rejecting a New Drug Application (NDA), or from a voluntarily withdrawal by a firm
due to a major adverse reaction or ineffectiveness.
This study identifies news of ADRs and withdrawal of drugs (post-marketing and in
advanced clinical trials) during the period 1966 to 1998 from the Wall Street Journal (WSJ).
The Physicians Desk Reference (PDR) identifies the competitors and availability of substitutes.
The sample of direct competitors only includes firms that were producing a substitute drug. In
contrast, most previous studies consider all firms in the industry as competitors. The day the
WSJ reports an ADR or a drug withdrawal is the event day (day 0).
The initial sample consisted of 162 withdrawals. Forty-three withdrawals by non-U.S.
manufacturers were excluded. Another 11 observations were eliminated due to either
insufficient historical return data or other contemporaneous news contaminating the actual event.
Reports in the WSJ also identify 617 instances of an adverse drug reaction. After applying
restrictions similar to those for drug withdrawals only 400 ADRs are considered for the final
sample. Of these, 196 observations make up the first report of an ADR while the remaining 204
observations were reports subsequent to the first ADR. In 44 instances the first report of an
ADR led to a withdrawal of the drug. The average (median) time between the first reported
ADR and the withdrawal of the drug is approximately 18 (13) months. We identified 81 direct
competitors from the Physician's Desk Reference of which 57 enter the final sample. The final
sample consists of 108 withdrawals, 400 ADRs, and 57 competitors. A firm withdrawing a drug
in one transaction is not included as a competitor in another transaction around the same date.
Table I shows that of the 108 withdrawals, 47 were by a single firm, in seven cases the
withdrawn drug did not have any available substitutes, and 42 withdrawals were related to death
or significant organ damage. In 84 withdrawals the drugs were in the post-marketing surveillance

9
phase and the remaining 24 were in the advanced clinical (human) trial phase. The sample of
firms withdrawing a drug had a mean market cap of $5.43 billion.10
The event study methodology is similar to that in Dodd and Warner (1983). Specifically,
for each security j, the excess return, or prediction error, for period t is computed as the
difference between the actual return, Rjt,, and the expected return. The expected return is
obtained from the market model. The market return, Rmt, in the market model is the return on the
CRSP value-weighted index on day t. The parameter estimates for the market model are
estimated from an ordinary least square regression using return data from days -200 to -51 in
relation to the announcement day (t = 0). The results remain similar when the CRSP equally-
weighted index is used as a proxy for market return. For transactions in which multiple firms
withdrew similar drugs on one day, event-day portfolios are used as one observation. For
withdrawals, 70 portfolios were formed, whereas for the competitors the number of portfolios
was 31. No portfolios were necessary for the sample of ADRs. This method mitigates any
biases in tests of significance from lack of independence among the observations.
III. Results
A. Wealth Effects of Drug Withdrawals
Panel A of Table II reports the cumulative mean abnormal return from day -1 to 0, +1 to
+5 and +1 to +50 for all firms withdrawing a drug. The abnormal return from day –1 to 0 of -
7.85%, with 71% of the firms reporting negative abnormal returns, is significant at the 1% level.
Panel A of Figure II plots the daily abnormal returns from day -5 to +5. The most significant
10 The current (year 2000) market value of drug manufacturers is computed using 15% annual compounding (the average annual market return from 1971 to 1999 is 15.28% when using the Wilshire 5000 index). The current mean value for the market cap is approximately $61 billion.

10
market reactions take place on days -1 and 0. Returns in the post-announcement period from
days +1 to +5 and +1 to +50 are statistically insignificant. The results confirm previous findings
that shareholders suffer significant wealth losses around the announcement of a drug withdrawal.
The magnitude of losses in this sample is higher than the 3.9% loss reported by Dranove
and Olsen (1994) over an equivalent event period. These results support the findings of Jarrell
and Peltzman (1985) who report a wealth loss of 12.82% in the ten-day interval from day -4 to
+5 (their withdrawal sample had only five firms). The results also show that the wealth loss
resulting from drug withdrawals is much larger than that for other product recalls or catastrophic
events. For non-pharmaceutical products, Davidson and Worrell (1992) report a shareholder
wealth loss of 4.54% over the period -1 to +1, while Bosch, Eckard, and Singal (1998) show that
stockholders in airlines suffer a 2.67% loss at the time of an air crash.
Examining the loss in dollars provides another perspective on the wealth effects of drug
withdrawals. Panel B of Table II presents the mean and median excess dollar returns. From day
-1 to 0, the median loss in wealth for a firm withdrawing a drug is $58.2 million. For most firms,
a single drug will not account for a large proportion of overall sales. However, the median dollar
losses translate to approximately 9% of annual sales in the year of the withdrawal. From day -1
to 0, the mean (median) dollar loss in current value terms is $441 ($154) million. The current
(year 2000) value of the dollar loss is calculated by using annual compounding and a constant
market return of 15%. Considering the fact that the peak revenue of an average drug is only $66
million, the dollar losses are fairly high.
Comparing the variance and beta of each firm between its pre-event period of days -200
to -11 and post-event period from days +11 to +200 allows us to test for changes in the firm's
risk due to a significant event (Marcus, Swidler, and Zivney, 1987). A F-value tests for
11
significance in the ratio of variance between pre- and post-event periods. Results indicate that
the cross-section of firms exhibit statistically insignificant changes in average variance after the
withdrawal of a drug. Similar inferences are made when comparing the betas of the firms.
Barber and Loeffler (1993) indicate that abnormal performance of a stock following an event is a
result of either price pressure or true information. In an efficient market, perfectly informed
revaluation can occur without any significant trading. However, a significant change in volume
confirms the presence of informed trading. The abnormal trading volume is calculated by
subtracting the expected from the actual trading volume. Expected trading volume is the average
daily trading volume over days -200 to -11. Results show that trading volume on average
increased by 240% and 295% on day -1 and 0 respectively, indicating the presence of informed
trading due to a fundamental change in the value of the firm. Part A of Figure II overlays the
abnormal volume on the abnormal return from days -5 to +5. The significant abnormal return is
backed by statistically significant increase in trading volume.
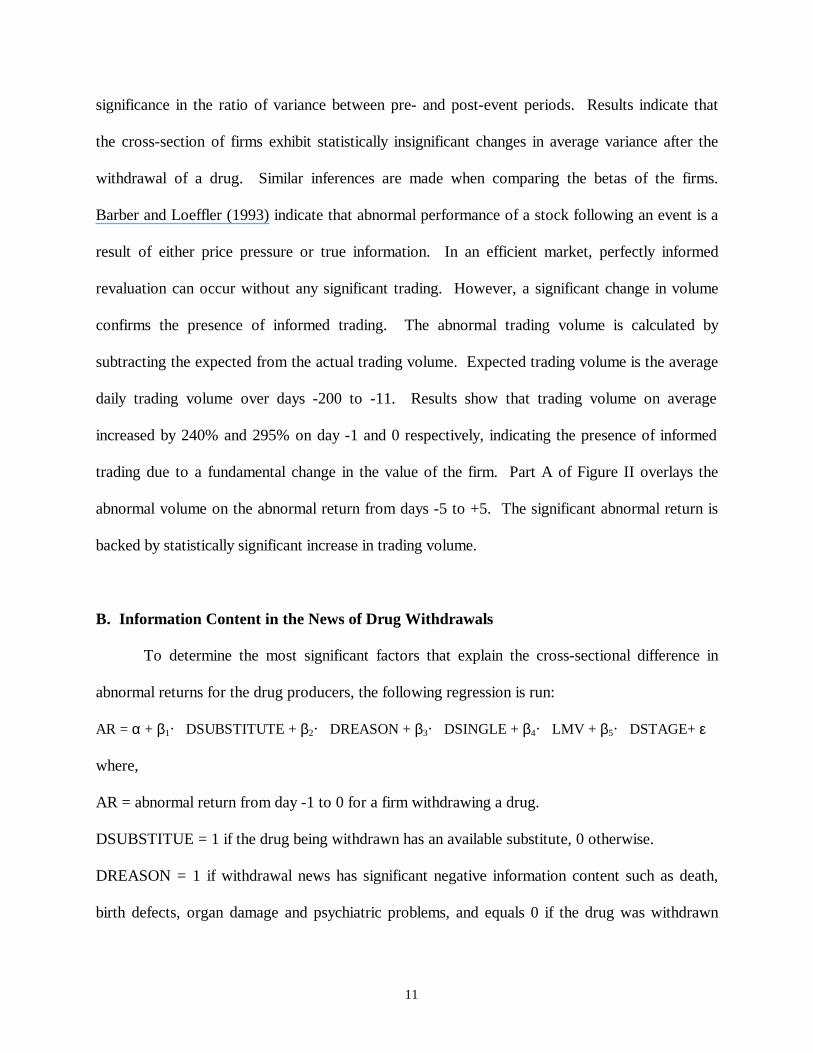
B. Information Content in the News of Drug Withdrawals
To determine the most significant factors that explain the cross-sectional difference in
abnormal returns for the drug producers, the following regression is run:
AR = α + β1· DSUBSTITUTE + β2· DREASON + β3· DSINGLE + β4· LMV + β5· DSTAGE+ ε
where, AR = abnormal return from day -1 to 0 for a firm withdrawing a drug.
DSUBSTITUE = 1 if the drug being withdrawn has an available substitute, 0 otherwise.
DREASON = 1 if withdrawal news has significant negative information content such as death,
birth defects, organ damage and psychiatric problems, and equals 0 if the drug was withdrawn

12
for being ineffective.
DSINGLE = 1 if only one drug producer withdraws a drug, 0 otherwise.
LMV = log of market value of firm six days before the news of drug withdrawal.
DSTAGE = 1 if drug was withdrawn during clinical trials, 0 if withdrawn during post-marketing
surveillance.
Table III presents the results for the multivariate regression. The results in Panel A show
that the factors DSINGLE, LMV, and DSTAGE are significant. The negative coefficients for
DSINGLE and DSTAGE show higher losses for single firm withdrawals and for withdrawals
during clinical trials. The positive coefficient for firm size, LMV, shows that losses are inversely
related to size.
Univariate tests of difference in mean abnormal returns between samples stratified by the
information content of the news are in Table IV. On 23 occasions the FDA ordered more than
one drug producer to withdraw a type of drug. These 23 orders affected a total of 61 firms. In
this subsample, 52% of firms have a negative abnormal return, with the mean excess returns of -
0.36% from day -1 to 0 being statistically insignificant. In contrast, for a single drug withdrawal,
the wealth loss is significantly higher with a mean abnormal return of -11.51%. In the subsample
of single withdrawals, 77% of the firms report a negative abnormal return (Table IV, Panel B).
The difference in mean abnormal return between subsamples of single and multiple withdrawals
is 10.30% and is statistically significant at the 1% level. The results indicate that the magnitude
of wealth loss is conditional on the number of firms (DSINGLE) withdrawing drugs on one day.
The stage of the drug withdrawal is a significant factor for the extent of wealth loss.
Firms withdrawing drugs during advanced clinical trials suffered a 18.69% loss in shareholder
wealth, while withdrawals during post-marketing surveillance resulted in only a 1.83% loss

13
(TableIV, Panel D). Both returns are significant at the 1% level. The difference in mean
abnormal returns between subsamples based on stage of withdrawal (DSTAGE) is statistically
significant at the 1% level.
The two variables that were not significant in the multivariate regression were
DSUSBTITUTE and DREASON. The producers of seven drugs that did not have a substitute,
on average, lost half their market values with a cumulative abnormal return of -48.57% from day
-1 to 0 (Table IV, Panel A). In contrast, the abnormal return for firms withdrawing drugs with
substitutes is much lower at -3.81%. Both abnormal returns are significant at the 1% level.
Moreover, the difference in the mean abnormal returns between the two subsamples is
statistically significant at the 1% level. The large wealth loss for the small number of firms
withdrawing drugs without any substitute could be partially due to confounding effects of firm
size and lack of product diversification. Insights into this issue are gained by comparing the
mean (median) market size of the firms withdrawing drugs with and without available
substitutes. The market value of the firms withdrawing drugs with available substitutes is
significantly larger [mean (median) of $7,524 ($975) million)] than firms withdrawing drugs
without any substitute [mean (median) of $600 ($401) million)]. The median annual sales of the
seven firms withdrawing drugs without any substitutes is $17 million, while the firms
withdrawing drugs that had an available substitute are significantly larger with median sales of
$2,362 million. Further, six out of these seven firms operated in one business segment and had
no principal product with sales greater than $20m. Thus, it is possible that in addition to the lack
of substitutes, the difference in share price reaction is a function of firm size.
Firms reporting significant medical reaction as the cause of withdrawal suffered high
losses in shareholder wealth with a mean cumulative abnormal return of -9.34% from day -1 to 0

14
(Table IV, Panel C). Additionally, 81% of such firms had a negative abnormal return. In
contrast, producers withdrawing a drug for being ineffective suffered smaller losses in
shareholder wealth with a mean cumulative abnormal return of -6.45% from day -1 to 0. Only
61% of firms withdrawing an ineffective drug report an abnormal loss. The difference in mean
return between the two subsamples is statistically insignificant indicating that the reason for a
drug withdrawal is not a significant factor in explaining the differences in abnormal returns.
Since the seven firms that withdrew drugs that lacked a substitute lost almost half their
market value, which can overstate wealth losses in small samples, the multivariate regressions
were rerun after eliminating these seven firms. Results in Panel B of Table III show that the
three variables DSINGLE, LMV, and DSTAGE remain significant at the 1% level. Thus, it can
be concluded that the following information primarily explains the difference in the abnormal
returns for drug withdrawals, (i) number of producers withdrawing a drug, with withdrawals by
single producers on average having higher wealth losses, (ii) firms with larger market value
suffer lower wealth losses, and (iii) firms withdrawing drugs during post-marketing surveillance
suffer lower wealth losses.
C. Adverse Drug Reaction (ADR)
The economic interpretation of the wealth effect of an ADR is that it should primarily
affect the reputation of the firm as no explicit contracts are violated and no direct costs are
incurred. Results in Table V indicate that the first report of an ADR is associated with a
significantly negative stock price reaction. For the 196 firms affected by an ADR, the
cumulative abnormal return from day -1 to 0 is -2.44%. For the 204 reports subsequent to the
first ADR, the abnormal reaction is much smaller at -0.72% but is statistically significant at the

15
1% level. Consistent with previous work on the economic impact of loss of reputation, the result
here lends support to the pricing of reputation. Although an ADR that leads to a drug withdrawal
has a higher negative abnormal return than an ADR that does not lead to a withdrawal, the
difference is statistically insignificant. Additionally, there is no significant difference in average
post-event variance or average beta between the subsamples of ADR that lead to a drug
withdrawal and those that do not. Thus, at the time of reporting of an adverse drug reaction the
market cannot anticipate if the ADR will lead to a withdrawal.
In 44 instances the first report of an ADR was followed by the eventual withdrawal of the
drug. In 18 cases there were additional ADR announcements prior to the withdrawal. The
average abnormal return at the announcement of the first ADR (44 instances) is -2.87%, which is
significant at the 5% level. The reports of subsequent ADRs produce a smaller stock price
reaction with an abnormal return of -1.10% for day -1 to 0, which is statistically insignificant.
The abnormal return to these 44 firms at the time of the drug withdrawal was -3.49%. The
cumulative abnormal return over all preceding announcements of an ADR and the drug
withdrawal is -6.63%. This indicates that the wealth loss over all preceding ADRs and the actual
withdrawal is substantially higher than the loss at the time of the drug withdrawal.
D. Impact of Drug Withdrawals on Competitors
Table VI presents the results for the 57 competitors that produced a substitute for the
withdrawn drug. The day -1 to 0 abnormal return to competitors is -0.34%, which is statistically
insignificant. Sixty-five percent of competitors have a negative abnormal return. This small but
statistically insignificant change in wealth is backed by an insignificant change in trading volume
(Figure II, Panel B). The insignificant wealth loss for the competing pharmaceutical firms is in

16
contrast to results reported by Bosch, Eckard, and Singal (1998), who show that following an
airplane crash there is a ‘negative spillover’ effect out of concern for overall safety of all
products in the industry. Additionally, according to them investors anticipate increases in costs
of regulatory compliance affecting all firms in the industry.
Following the withdrawal of a drug, the competitors gain over the period from days +1 to
+5. The cumulative abnormal return of 1.65% from day +1 to +5 is significant at the 1% level
and exceeds the losses sustained over the period -1 to 0. Sixty-eight percent of the competing
firms report a positive abnormal return. These results are significantly different from those in
other studies, which show the presence of a negative spillover in post-event periods (Bosch,
Eckard, and Singal, 1998; Jarrell and Peltzman, 1985). The positive post-event share price
reaction in our sample is also backed by a small increase (almost 21%) in trading volume. The
gains to competitors indicate that the increase in market share is more important to investors than
any concern for the systemic safety of drugs.
IV. Conclusions
Using a larger sample than in any previous study, this paper shows the impact of the
news of a drug withdrawal on the shareholder wealth of its producer and its competitors. In
many instances a drug withdrawal is preceded by one or more announcements of adverse drug
reactions. Most previous studies underestimate the total loss from the withdrawal of a drug by
not fully taking into account the wealth effects during preceding adverse drug reactions. This
paper shows that the combined loss from an ADR and subsequent withdrawal is substantially
higher than the loss at the time of the withdrawal announcement.

17
The results in this paper lend support to the earlier findings (Jarrell and Peltzman, 1985;
Dranove and Olsen, 1994) that large wealth losses result from the announcement of a drug
withdrawal. The results are also consistent with explanations in Marcus, Swidler and Zivney
(1987) and Jones and Rubin (1999), who suggest that the large loss in shareholder wealth is due
to a combination of expected loss in direct future revenue and lower indirect cash flow as a result
of loss in goodwill (reputation). The longer time period of the study allows data stratification on
the information content of the news of withdrawal. Withdrawals of the same product by multiple
firms and withdrawals of marketed drugs have lower losses as compared to withdrawals by
single firms and of drugs in advanced clinical trials, respectively. The losses are also higher for
smaller firms.
The findings in this study differ from previous work (Dowdell, Govindraj, and Jain,
1992; Bosch, Eckard, and Singal, 1998) on the wealth impact for competitors. While an airline
crash leads to significant negative spillover effect on the competitors, drug withdrawals did not
produce a negative spillover. An explanation for the difference is that the withdrawal of a drug
indicates failure of the firm but not of the overall system that governs the safety and efficacy of
pharmaceutical drugs.
Following the recent withdrawal of a very popular drug called Rezulin, Gilbert Ross,
Medical Director of the American Council on Science and Health wrote in the March 29, 2000
edition of the Wall Street Journal, "Actually, Rezulin's withdrawal shows that the FDA approval
process works exactly as it should. Just because a drug is withdrawn does not mean it should not
have been approved in the first place……. All drugs have risks, especially new drugs, and we
often need the data from post-marketing surveillance to detect them."11
11 “Rezulin Proves the System Works,” Wall Street Journal, March 29, 2000, A22.

18
References
Barber, B.M. and D. Loeffler, 1993, “The 'Dartboard' Column: Second Hand Information and Price Pressure, ” Journal of Financial and Quantitative Analysis 28, 273-284. Bosch, J.C., E. W. Eckard, and V. Singal, 1998, “The Competitive Impact of Air Crashes: Stock Market Evidence,” The Journal of Law and Economics, 41, 2(1) 503-519. Bromiley, P. and A. Marcus, 1989, “The Deterrent to Dubious Corporate Behavior: Profitability, Probability and Safety of Recalls,” Strategic Management Journal, 233-250. Chauvin, K.W. and J.P. Guthrie, 1994, “Labor Market Reputation and the Value of the Firm,” Managerial and Decision Economics, 543-552. Davidson, W. N. and D.L. Worrell, 1992, “The Effect of Product Recall Announcements on
Shareholder Wealth”, Strategic Management Journal, 467-473. Davidson, W.N., D. Worrell, and L.T. Cheng, 1994, “The Effectiveness of OSHA Penalties: A Stock-Market Based Test,” Industrial Relations, v. 33 283-296. Dodd, P. and J.B. Warner, 1983, “On Corporate Governance: A study of Proxy Contests,” Journal of Financial Economics, v. 11, 401-438. Dowdell, T.D., S. Govindaraj, and P.C. Jain, 1992, “The Tylenol Incident, Ensuing Regulation
and Stock Prices,” Journal of Financial and Quantitative Analysis, v.27, 283-301. Dranove, D. and C. Olsen, 1994, “The Economic Side Effect of Dangerous Drug
Announcements”, Journal of Law and Economics, v37, 323-348. Fry, C.L. and I. Lee, 1989, “OSHA Sanctions and the Value of the Firms,” The Financial Review, v.24 599-610. Hersch, J., 1991, “Equal Employment Opportunity Law and Firm Profitability,” Journal of Human Resources, v26. 139-153. Hoffer, G. E., S. Pruitt, and R.J. Reilly, 1988, “The Impact of Product Recalls on the Wealth of
the Sellers: A Reexamination”, Journal of Political Economy, v96 no. 3, 663-670. Jarrell, G. and S. Peltzman, 1985, “The Impact of Product Recalls on the Wealth of the Sellers,”
Journal of Political Economy, v93, no. 3, 512-536. Jones, K. and P. Rubin, 1999, “Effects of Harmful Environmental Events on Reputations of Firms, ” Emory University Working Paper.

19
Kellogg, D. and J.M. Charnes, 2000, “Real-Options Valuation for a Biotechnology Company,” Financial Analysts Journal, 56:3 76-84
Marcus, R. D., S. Swidler, and T.L. Zivney, 1987, “An Explanation of Why Shareholders’
Losses are so Large After Drug Recalls,” Managerial and Decision Economics, v8. 295-300.
Marino, A., 1997, “A Model of Product Recalls with Asymmetric Information,” Journal of
Regulatory Economics, 12: 245-265. Pruitt, S.W. and D.R. Peterson, 1986, “Security Price Reactions Around Product Recall
Announcements,” The Journal of Financial Research, 9:2 113-122. Reichert, A.K., M. Lockett, and R.P. Rao, 1996, “The Impact of Illegal Business Practice on Shareholder Returns,” The Financial Review, v.31 67-85. Rubin, P.H., R.D. Murphy, and G. Jarrell, 1988, “Risky Products, Risky Stock,” Regulation, 35-39. Sauer, P., 1998, “Finding the Next Blockbuster Drug,” Chemical Market Reporter v.254, n.21 Nov 23, 1998 FR3-FR6. Swiatek, J., 2000, “Rezulin's Withdrawal Could Benefit Eli-Lilly Marketed Drug,” The
Indianapolis Star, March 23. Welling, L, 1991, “A Theory of Voluntary Recalls and Products Liability,” Southern Economic
Journal, v57, 1092-1111. World Health Organization, 1966, “International Drug Monitoring: The Role of the Hospital,”
Geneva, World Health Organization, Technical Report Series Number 425.

20
FIGURE I. The New Drug Development Process Pre-Clinical Research
Clinical Studies Human Testing
New Drug Application Review by Advisory Board
Post-Marketing Surveillance
STAGE 1 STAGE 2 STAGE 3 STAGE 4 R&D by Firm 1. Synthesis and Purification 2. Animal Testing
Phase 1: Sufficient information about the drug's pharmacokinetics and pharmacological effects should be obtained to permit the design of well-controlled, scientifically valid, Phase 2 studies. Probability of Success - 70%. Phase 2: Includes the early controlled clinical studies conducted to obtain some preliminary data on the effectiveness of the drug. Probability of Success - 47% of drugs approved at Phase 1. Phase 3: Expanded controlled and uncontrolled trials. They are performed after preliminary evidence suggesting effectiveness of the drug. Probability of Success - 66% of drugs approved at Phase 3.
After a New Drug Application (NDA) is received by the agency, it undergoes a technical screening generally referred to as a completeness review. Much of the primary review process involves reviewer attempts to confirm and validate the sponsor's conclusion that a drug is safe and effective for its proposed use. The review is likely to involve a reanalysis or an extension of the analyses performed by the sponsor and presented in the NDA. Once the reviewers and their supervisors reach an approval recommendation, the decision must be evaluated and agreed to by the director of the applicable drug review division or office. Once the division director (or office director, as appropriate) signs an approval action letter, the product can be legally marketed starting that day in the United States.
FDA conducts "post-marketing surveillance of medical products to identify safety concerns and take necessary actions. The MedWatch program is one such surveillance instrument. It depends on doctors, dentists, nurses, pharmacists and others to pass on to FDA details of serious adverse drug reactions (ADR).
NOTE. - Adapted from Federal Drug Administration's Center for Drug Evaluation and Research (CDER) Handbook.

21
FIGURE II. Daily Abnormal Return and Volume from Days -5 to +5 Market model parameters for calculating abnormal return were estimated from days -200 to -51. Abnormal volume is the percentage change in volume, which was estimated by subtracting the average daily volume during the period from days -200 to -11 from each day’s volume. Day 0 is the date the Wall Street Journal reported the withdrawal.
A. Firms withdrawing a drug
B. Direct Competitors
-20
-10
0
10
20
30
-5 -4 -3 -2 -1 0 1 2 3 4 5
Day
Pe
rce
nt
Ch
an
ge
in
Vo
lum
e
-0.6
-0.4
-0.2
0.0
0.2
0.4
0.6
0.8
Abn
orm
al
Re
turn
(%
)
Volume Abnormal Return
0
100
200
300
400
-5 -4 -3 -2 -1 0 1 2 3 4 5
Day
Pe
rce
nt
Ch
an
ge
in
Vo
lum
e
-5
-4
-3
-2
-1
0
1
Abn
orm
al
Re
turn
(%
)
Volume Abnormal Return

22
TABLE I. Descriptive Statistics for Sample of Drug Withdrawals and Adverse Drug Reactions from 1966 to 1998
Description of sample of firms withdrawing drugs and reporting adverse drug reactions (ADR) between 1966 and 1998. News of drug withdrawals and ADRs was obtained from the Wall Street Journal. To be included in the sample, a firm had to be publicly traded on U.S. stock exchanges and meet additional criteria of data availability. The sample stratification is based on the information content of the news. Event-date portfolios are formed if multiple firms announce a drug withdrawal on the same day. The numbers in the table provide counts of event-date based portfolios in the sample. Market capitalization is measured at the end of the sixth day prior to the announcement date. The current (year 2000) value of the market capitalization is computed using 15% annual compounding. Total number of firms withdrawing drugs 108 Single or multiple withdrawals on one day Multiple 61 Single 47 Substitutes Available 44 Unavailable 7 Indeterminate 57 Reason for withdrawal Ineffective 59 Death/Organ Damage/Birth Defect/Psychiatric 42 Other 5 Stage of Drug Withdrawal Post-Marketing Surveillance 84 Advance Clinical Trials (Phase 3 and beyond) 24 Adverse Drug Reactions (ADR) All reported ADR 400 First ADR 196 ADRs leading to subsequent withdrawal of the drug 44 Number of direct competitors 57 Market capitalization of firms at the time of a drug withdrawal Mean $5.43 billion Mean present value (year 2000) of market cap $61.00 billion

23
TABLE II. Abnormal Returns to Firms Withdrawing Drugs This table presents the abnormal returns, Z-statistic for significance of mean abnormal return, and proportion of the sample (in percentage) with negative abnormal returns for all firms withdrawing a drug. For instances where several firms withdraw a drug on the same date, an event-date based equally-weighted portfolio is formed and treated as a single observation. NP is the total number of unique portfolios formed. Day 0 is the date on which the Wall Street Journal reports the news of drug withdrawal. Market model parameters were estimated from days -200 to -51. The percentage abnormal returns are in Panel A, and the dollar abnormal returns are in Panel B. For dollar abnormal return calculation, the full sample was used and event-date portfolios were not formed. A sign rank test is employed to test for significance of median dollar abnormal return. *, **, *** denote significance at the 1%, 5%, 10% levels respectively.
Interval Abnormal Return Z-Statistic Percentage of Negative Abnormal Returns
Panel A. Percentage Abnormal Return (Np = 70)
-1, 0 -7.85*
-13.95 71
+1, +5 -0.25
-0.05 46
+1, +50 1.59
0.29 54
Panel B. Dollar Abnormal Return (N=108)
Median Return $ million
p-value Mean Return $ million
-1, 0 -58.2**
0.042 -114.4
+1, +5 26.0
0.506 -128.4
+1, +50 -26.5
0.925 -108.8

24
TABLE III. Regressions of Abnormal Return on Information Content of News Regressions of abnormal returns on variables representing information content of the news of a drug withdrawal. AR = α + β1· DSUBSTITUTE + β2· DREASON + β3· DSINGLE + β4· LMV + β5· DSTAGE+ ε AR = abnormal return from day -1 to 0. Dummy variable DSUBSTITUE = 1 if the drug being withdrawn has an available substitute, 0 otherwise. Dummy for reason for withdrawal, DREASON = 1 if reason for withdrawal has significant negative information content such as death, birth defects, organ damage and psychiatric problems, and 0 if the drug was withdrawn for being ineffective. Dummy variable DSINGLE = 1 if only one drug producer withdraws a drug, 0 if multiple firms withdraw a similar drug on the same day. LMV = log of market capitalization of firm six days before the news of drug withdrawal. DSTAGE = 1 if drug was withdrawn during clinical trials, 0 if withdrawn during post-marketing surveillance. t-statistics are in parentheses below the coefficient estimates. *, **, *** denote significance at the 1%, 5%, 10% levels respectively.
PANEL A PANEL B Interval
Days -1, 0
Days -1, 0
Sample All Withdrawals Withdrawals excluding the seven firms without substitutes
Sample size
N = 108
N = 101
Intercept -0.4720*
(-3.51)
-0.2428* (-3.44)
DSUBSTITUTE
0.0520 (1.45)
DREASON
-0.0016 (-0.05)
-0.0243 (-1.41)
DSINGLE
-0.1030* (-2.81)
-0.0583* (-3.11)
LMV
0.0352* (3.53)
0.0194* (3.77)
DSTAGE -0.1445* (4.14)
-0.0472* (-2.44)
F- Value 9.60*
7.10*
Adjusted R2 0.3839
0.2823

25
TABLE IV. Cumulative Abnormal Returns for Subsamples of Firms Withdrawing a Drug Percentage abnormal returns, Z-statistic for significance of mean abnormal return, and percentage of negative abnormal returns for subsamples of drug withdrawals. For instances where several firms withdrew a drug on the same date, an event-date based equally-weighted portfolio is formed and treated as a single observation. NP is the total number of unique portfolios formed. Day 0 is the date on which the Wall Street Journal reports the news of the withdrawal. Market model parameters were estimated from days -200 to -51. The square brackets give the t-statistics for tests of difference of means. *, **, *** denote significance at the 1%, 5%, 10% levels respectively.
Interval
Percentage Abnormal Return Difference
Panel A. Availability of Substitutes
Available
(1) Np = 32
Available or indeterminate
(2) Np = 63
Not available
(3) N = 7
(1) and (3)
(2) and (3)
-1, 0 -3.81*
(-6.68, 75) -3.33**
(-7.86, 68) -48.57*
(-20.53, 100)
-44.76* [-9.37]
-45.23* [-10.87]
Panel B. Number of Firms Withdrawing Drug
Multiple
(1) Np = 23
Single excluding drugs
without substitutes
(2) Np = 47
(1) and (2)
-1, 0 -0.36
(-0.46, 52)
-11.51* (-16.71, 81)
-11.15** [-2.66]
Panel C. Reason for Withdrawal
Severe medical reaction
(1) Np = 36
Ineffective
(2) Np = 34
(1) and (2)
-1, 0 -9.34*
(-2.81, 81) -6.45*
(-2.59, 61)
-2.89 [-0.70]
Panel D. Stage of Withdrawal
Advanced Clinical Trials
(1) Np = 25
Post-Marketing Surveillance
(2) Np = 45
(1) and (2)
-1, 0 -18.69*
(-3.75, 76) -1.83*
(-2.81, 69)
-16.86 [-4.44]

26
TABLE V. Cumulative Abnormal Returns at the Announcement of an Adverse Drug Reaction (ADR)
This table reports the abnormal returns in percentage, Z-statistics and proportion (in percentage) of the sample with negative abnormal returns for a sample of adverse drug reactions. N is the total number of firms. Day 0 is the date on which Wall Street Journal reports the news of a drug withdrawal or an ADR. Market model parameters were estimated from days -200 to -51. The square brackets give the t-statistics for tests of significance. *, **, *** denote significance at the 1%, 5%, 10% levels respectively.
Interval All First ADRs
All Subsequent
ADRs
ADR Sample Matched With Subsequent Drug Withdrawal
(1)
N = 196
(2)
N = 204
Withdrawal of Drugs
(3)
N = 44
First ADR
(4)
N = 44
Subsequent ADR
(5)
N = 18
Total of ADR and
withdrawal (3+4+5)
N = 62
-1, 0 -2.44*
(-10.30, 67) -0.72*
(-4.87, 57) -3.49* (-1.78)
-3.90* (-5.80, 72)
-1.10 (-1.00, 54)
-6.63** [1.86]
+1, +5 0.05
(0.65, 50) 0.60**
(2.17, 46) 0.60
(0.56) -0.01
(-1.01, 40) 0.74
(-0.01, 40) 0.59
[0.56]

27
TABLE VI. Cumulative Abnormal Returns to Competitors of Firms Withdrawing Drugs This table reports the abnormal returns in percentage, Z-statistics and proportion (in percentage) of the sample with negative abnormal returns for competitors of firms withdrawing drugs. For instances where several announcements took place on the same date, an event-date based equally-weighted portfolio is formed and treated as a single observation. The sample size NP equals 31, and is the total number of unique portfolios formed. Day 0 is the date on which the Wall Street Journal reports the news of drug withdrawal. Market model parameters were estimated from days -200 to -51. *, **, *** denote significance at the 1%, 5%, 10% levels respectively.
Interval Abnormal Return Z-Statistic Percentage of Negative Abnormal Returns
-1, 0
-0.34
-1.54 65
+1, +5
1.65*
3.20 32