JULIUS BAER WEALTH REPORT: INDIA
124
JULIUS BAER WEALTH REPORT: INDIA NOVEMBER 2016
-
Upload
khangminh22 -
Category
Documents
-
view
0 -
download
0
Transcript of JULIUS BAER WEALTH REPORT: INDIA

JULIUS BAERWEALTH REPORT: INDIA
NOVEMBER 2016


1
JULIUS BAER WEALTH REPORT: INDIA
EDITORIAL
Atul Singh Managing Director and CEO Julius Baer India
Boris F. J. Collardi Chief Executive Officer Julius Baer Group
Dear Reader,
“It was the best of times, it was the worst of times” – To quote the opening lines of ‘The Tale of Two Cities’ by Charles Dickens is an apt way to describe how most investors see the world today. Overcapacities in traditional industries in China are balanced by the wave of consumer–driven activity and higher value–added services. Slower overall growth in Asia masks the boom that is taking place on a sector level, in particular in areas such as travel, the digital economy and beauty capital. Weighing the pros and cons, are you best served being either cautious or confident?
On balance, we believe the final judgment leans in favour of the ‘best of times’. Most large economies in Asia are addressing their structural challenges and are set to draw in foreign direct investment and portfolio flows as a result. In Japan, aggregated statistics fail to capture the dynamism of consumers as they switch from bricks and mortar distribution to being fully fledged digital citizens. In India, asset quality issues in the banking sector are being recognised while household balance sheets are solid and taking on credit to propel the consumer economy.
Amid this dynamism, this year we have added new items to the Julius Baer Lifestyle Index, enhancing our coverage of beauty–related consumption. While the prices of other luxury goods and services may be modulating, the newfound purchasing power of high net worth individuals in Asia is being evidenced in the strong demand for premium creams and treatments.
We invite you to share these insights offered by the 2016 Julius Baer Wealth Report: India and thank you for your longstanding interest.

2
JULIUS BAER WEALTH REPORT: INDIA
Editorial 1
Macro Introduction 4
The Julius Baer Lifestyle Index 12
Arising Asia – Beauty Capital 53
Singapore Macro 62
China Macro 68
Indonesia Macro 72
Japan Macro 76
India – Capitalising on 80 Macro–economic Stability
Wealth Creation in India – Alive and Kicking 94
Succession Planning – 100 Passing on the baton in India
Next Generation Entrepreneurs 104
Conclusions 116
Important Legal Information 118
TABLE OF CONTENTS


4
JULIUS BAER WEALTH REPORT: INDIA
MACRO INTRODUCTION
The 2016 edition of the Julius Baer Wealth Report: Asia marks the sixth consecutive year we have examined trends in wealth creation and lifestyle–related expenditure across the region. Since our first report, Asia has grown by over USD 3 trn in Gross Domestic Product (GDP) and population grew by 157 million. The same number of people has moved into Asia’s cities over this period, with 40% of the total population living in metropolises with over one
million residents, according to the World Bank. The knowledge economy has flourished, with close to 14 million patents and trademarks registered, underpinning Asia’s continuous movement up the value chain. Likewise travel has boomed: 2015 saw the number of air passengers carried exceed one billion for the first time, representing a 40% increase from when our first report was published in 2011.
By the same token, international tourist expenditure by Asian travellers has exceeded USD 300 bn, with both China and The Philippines having more than doubled their spending over the past five years. In a broad sense, therefore, the optimism that we expressed regarding Asia’s wealth creation prospects in the first report have played out and Julius Baer continues to believe that this region will lead the world in new wealth over the coming decade. Indeed,
most economic fundamentals across Asia today look better than comparables in most parts of the world, in our view and this is unlikely to change over the medium term. Average GDP growth rates, while not as fast as they have previously been, will likely remain relatively high, implying that Asia’s share of the global economy will climb beyond the 30% that is set to be reached this year.
Chart 1: Percentage of population living in cities with over one million people
Source: World Bank, Julius Baer

5
JULIUS BAER WEALTH REPORT: INDIA
While there is ample room to celebrate Asia’s economic achievements over the year, the world has simultaneously experienced an array of unexpected and unprecedented developments that should dissuade anyone from resting on their laurels. For example, global trade volumes in 2015 dropped to levels last seen before 2010, according to the World Trade Organisation (WTO). While the economic value added in Asia that stems from services is undoubtedly growing, the wellbeing of the region still remains inextricably tied to the development of manufacturing exports.
Although probably more than 50% of employment in Asia is linked to services, 2015 still saw approximately USD 10 trn worth of merchandise exports, which for a smaller open economy like Singapore, still amounts to double the size of GDP. In other words, the excitement and promise of an accelerating service sector may not fully compensate for the drag in trade volumes, especially when considering that there are spill overs that can impact employment trends, in particular.
Chart 2: Growing slower, but still well ahead of the rest of the world
Chart 3: Global goods and service exports
Source: WTO, HSBC, Julius Baer
Source: IMF, Julius Baer

6
JULIUS BAER WEALTH REPORT: INDIA
Further to this, capital inflows to emerging markets have slowed substantially in recent years. The combination of lower capital inflows to emerging markets and the drop in trade can conjure up the notion that we may be witnessing ‘the end of globalisation’ and could be cause for alarm. In part, this would reflect the slowdown in China and the related retooling of its economic model, which now demands less inward investment. Very high investment levels over the past decade have seen the buildup of excess capacities across an array of industries, as evidenced by low utilisation rates. This outcome has led to a chorus of policy makers to advocate that China should speed up the rebalancing of its economy, away from low cost production, supporting services and overall consumption. While there is good cause to believe that this process is
underway, it is equally plausible that substantial restructuring still lies ahead.
Estimates by HSBC, for example, see room for over two million job losses in the coming years as sectors such as coal, iron & steel and petrochemicals cut back production. It is argued that Japan underwent a similar process in the 1970s, accompanied later on by substantial yen appreciation under the Plaza Accord in 1985. Our view is that China’s rebalancing is clearly a far larger exercise with more at stake; not just for China’s prosperity but with global implications over the very long term. In principle, a medium term outcome whereby the renminbi appreciates against a broad set of currencies would underpin a wealthier society with stronger purchasing power and help drive the re–orientation of economic growth.
Chart 4: Capital inflows as a percentage of GDP
Source: IMF, Julius Baer

7
JULIUS BAER WEALTH REPORT: INDIA
In the shorter term, however, we expect to see the next few years mimic the recent trend. In short, global growth will be largely dictated by what happens in the United States (US) and China. Potential GDP growth rates in both have fallen, in part quite naturally due
to demographic shifts, with developments in the rest of the world unable to compensate. This in turn has motivated policy makers to move beyond conventional tools to smoothen the growth cycle.
Chart 7: Global real GDP growth, weighted by nominal GDP
Source: Nomura Global Economics, Julius Baer Source: Nomura Global Economics, Julius Baer
Source: IMF, Deutsche Bank, Julius Baer
Chart 5: China’s share of global production by industry (2015)
Chart 6: China’s capacity utilisation rates by industry (2015)

8
JULIUS BAER WEALTH REPORT: INDIA
The most telling shift that is currently taking place is based on the widespread recognition that the additional easing beyond a certain point, is less likely to yield meaningful benefits. This is arguably the predicament policy makers face in Japan, but less so in Europe. For the US, since the recovery in the labour market began in January 2010, upwards of 14 million jobs have been created, according to the Bureau of
Labor Statistics. At the same time, the expansion of the US Federal Reserve’s balance sheet has helped to lift risky asset prices restoring household balance sheets along the way. Arguably US policy can further be declared a success in that US rates have not been pushed below the (in)famous zero lower bound, as is the case for many other developed economies.
Chart 8: US Central bank total assets as a percentage of 2008 GDP
Chart 9: Key interest rates
Source: IMF, Bloomberg Finance L.P., Julius Baer
Source: IMF, Julius Baer
9
JULIUS BAER WEALTH REPORT: INDIA
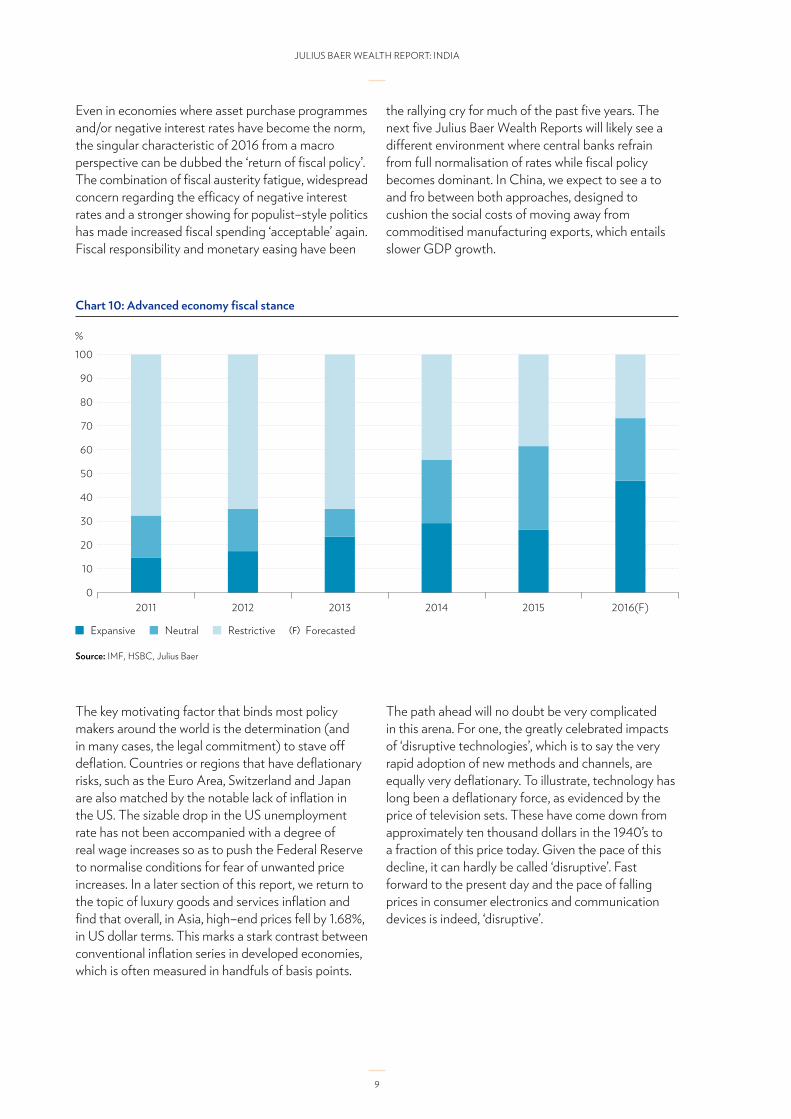
Even in economies where asset purchase programmes and/or negative interest rates have become the norm, the singular characteristic of 2016 from a macro perspective can be dubbed the ‘return of fiscal policy’. The combination of fiscal austerity fatigue, widespread concern regarding the efficacy of negative interest rates and a stronger showing for populist–style politics has made increased fiscal spending ‘acceptable’ again. Fiscal responsibility and monetary easing have been
the rallying cry for much of the past five years. The next five Julius Baer Wealth Reports will likely see a different environment where central banks refrain from full normalisation of rates while fiscal policy becomes dominant. In China, we expect to see a to and fro between both approaches, designed to cushion the social costs of moving away from commoditised manufacturing exports, which entails slower GDP growth.
Chart 10: Advanced economy fiscal stance
Source: IMF, HSBC, Julius Baer
The key motivating factor that binds most policy makers around the world is the determination (and in many cases, the legal commitment) to stave off deflation. Countries or regions that have deflationary risks, such as the Euro Area, Switzerland and Japan are also matched by the notable lack of inflation in the US. The sizable drop in the US unemployment rate has not been accompanied with a degree of real wage increases so as to push the Federal Reserve to normalise conditions for fear of unwanted price increases. In a later section of this report, we return to the topic of luxury goods and services inflation and find that overall, in Asia, high–end prices fell by 1.68%, in US dollar terms. This marks a stark contrast between conventional inflation series in developed economies, which is often measured in handfuls of basis points.
The path ahead will no doubt be very complicated in this arena. For one, the greatly celebrated impacts of ‘disruptive technologies’, which is to say the very rapid adoption of new methods and channels, are equally very deflationary. To illustrate, technology has long been a deflationary force, as evidenced by the price of television sets. These have come down from approximately ten thousand dollars in the 1940’s to a fraction of this price today. Given the pace of this decline, it can hardly be called ‘disruptive’. Fast forward to the present day and the pace of falling prices in consumer electronics and communication devices is indeed, ‘disruptive’.

10
JULIUS BAER WEALTH REPORT: INDIA
In the following section of this report, we examine the rise of ‘beauty capital’ whose impacts promise to shake up longstanding norms in the beauty and wellness industries, with interesting questions to be raised about the direction of prices as well. As it happens, the desire to ‘stay young and beautiful’ echoes another deflationary force: global ageing. Japan demonstrates both the opportunity of beauty capital in an ageing society, and likewise the challenge that is presented:
Chart 11: Technology tends to drive prices lower...
Chart 12: ...especially over the longer term
on balance, ageing populations tend to accompany lower inflation.
The second major complication on the macroeconomic front is the risk that protectionism, which has been silently rising. Financial markets dealt a harsh verdict against the outcome of the United Kingdom’s referendum on European Union membership this past summer, arguably in part because of the adverse
Source: Brent Cox (2011), Citi Research, Julius Baer
Source: Citi Research, Julius Baer

11
JULIUS BAER WEALTH REPORT: INDIA
impact on trade flows between the two parties. Both fiscal and monetary policy are ill–equipped to counteract artificial hindrances to trade. According to Global Trade Alert, since 2008, over 5,000 trade–
Chart 13: Distribution of trade distorting measures since 2008 (%)
Chart 14: Gross issuance and Bank of Japan’s (BoJ) outright purchase of Japanese government bond
Hopefully, there is time for policy makers to reverse this recent trend and avert a major swing toward protectionism. Undoubtedly, Asia would be hard hit under such circumstances. In the shorter term, however, the region is faced with more prosaic issues, such as the Bank of Japan’s policy path given the
move to negative interest rates and the dwindling supply of government bonds available for purchase. In the subsequent section of this report, take a closer look at the factors driving wealth creation, along with the where’s and why’s.
distorting measures have been enacted around the world. In our view, this represents perhaps the most significant threat to wealth creation on a global basis.
Source: Global Trade Alert, HSBC, Julius Baer
Source: Japan Ministry of Finance, HSBC, Julius Baer

Hong Kong Singapore China India Taiwan Indonesia Philippines Korea Malaysia Thailand Japan Average2015 Consumer price inflation
3.00% –0.50% 1.40% 4.93% –0.30% 6.40% 1.40% 0.70% 2.10% –0.90% 0.80% 1.73%
Julius Baer Lifestyle Index Y/Y local currency
–0.47% –6.76% –1.14% –4.62% 3.30% –1.30% 2.61% –2.41% 3.34% 0.95% –0.94% –0.68%
Julius Baer Lifestyle Index Y/Y USD
–0.56% –6.61% –7.08% –9.25% –0.26% –0.58% –0.62% –4.52% –2.93% –2.21% 16.14% –1.68%
12
JULIUS BAER WEALTH REPORT: INDIA
JULIUS BAER LIFESTYLE INDEx
Introducing the 2015/2016 lifestyle indexFor the sixth year running, we present our Julius Baer 2016 Lifestyle Index. This index comprises a basket of goods and services that closely reflects the lives of High Net Worth Individuals (HNWI) in Asia. We continue to present our findings across the expanded index of 11 cities but this time, in light of volatile currency movements, we present our data in both local currency and US dollar currency terms to allow for a more thorough analysis of demand and supply trends.
In addition, we included a new skincare item, a high–end skin cream to our index to complement the
facial aesthetic item of botox, extending our number of items measured from 20 to 21. The new item reflects the growing investment by HNWI in Asia on super–premium skincare products.
OverviewOverall prices for the items in our Lifestyle Index fell by 0.68% in local currency terms and by 1.68% year on year (y/y) in US dollar terms. This lags the average inflation experienced in the various Asian cities of +1.73% y/y during 2015, suggesting low correlation between conventional measures of inflation and that represented by our basket of luxury goods and services.
Chart 1: Inflation vs index
Source: World Bank, CSG Intage, Julius Baer

13
JULIUS BAER WEALTH REPORT: INDIA
Chart 2: Julius Baer Lifestyle Index, changes in prices of goods and services y/y, 2010 to 2016, US dollar terms
Chart 3: Julius Baer Lifestyle Index, changes in prices of goods and services y/y, 2015 to 2016, local currency and US dollar terms
Source: CSG Intage, Julius Baer
Source: CSG Intage, Julius Baer

14
JULIUS BAER WEALTH REPORT: INDIA
Chart 4: Price changes of Julius Baer Lifestyle Index items, y/y US dollar terms
In local currency terms, 16 of the 21 items in our index showed positive price momentum y/y, suggesting the overall demand for a number of luxury goods and services remains relatively resilient. The biggest price increases were found in cigars (+8.99%), ladies’ shoes (+5.95%) and golf club memberships (+5.36%) while the biggest declines came from residential properties (–7.18%), tooth implants (–5.14%) and wine (–2.26%).
In US dollar terms, we see an overall price decline (–1.68%), the second year since 2013/14 where this has occurred. More specifically, 8 of the 21 items measured suffered price declines on a y/y basis as US dollar strength negated stable or relatively small price increases in local currencies. Of note, the US dollar appreciated against most (8 out of 11) of our measured currencies with the exception of the Japanese yen, Singapore dollar and Indonesian rupiah.
Source: CSG Intage, Julius Baer

15
JULIUS BAER WEALTH REPORT: INDIA
Chart 5: Price changes of Julius Baer Lifestyle Index items, y/y local currency terms
US dollar–denominated items such as university fees (+4.55%) and boarding school fees (+3.74%) saw steady price increases, reflecting the ability of prestigious educational institutions to set prices higher regardless of currency movements or economic conditions.
We identify some trends that can help to explain the price movements in our basket of high–end goods and services. The first is the broad–based devaluation of Asian currencies. The second would be government–related measures which typically affect demand dynamics. The third relates to competitive pressures which can also influence prices of luxury goods and services.
Source: CSG Intage, Julius Baer

Hong KongUSD/ HKD
Singapore
USD/ SGD
Shanghai
USD/ CNY
Mumbai
USD/ INR
Taipei
USD/ TWD
Jakarta
USD/ IDR
Manila
USD/ PHP
Seoul
USD/ KRW
KualaLumpur
USD/ MYR
Bangkok
USD/ THB
Tokyo
USD/ JPY
Average
2015 Fx rate* 7.75 1.35 6.21 63.71 31.05 13,347.51 45.16 1,129.88 3.77 34.02 123.55
2016 Fx rate* 7.76 1.35 6.64 67.21 32.24 13,242.70 46.74 1,156.74 4.03 35.20 104.29
Change –0.10% 0.17% –6.45% –5.21% –3.68% 0.79% –3.36% –2.32% –6.48% –3.35% 18.47% –1.05%
16
JULIUS BAER WEALTH REPORT: INDIA
As seen in the table above, on average the currencies for the 11 cities we surveyed weakened against the US dollar (–1.05%) between June/July 2015 and June/July 2016. This has a negative impact on our lifestyle index which we report in US dollar terms for standardisation. The worst performing currencies were the Malaysian ringgit (–6.48%), Chinese yuan (–6.45%) and Indian rupee (–5.21%). The major exception was the Japanese yen which gained 18.47% while the Singapore dollar (+0.17%) and Indonesian rupiah (+0.79%) were relatively stable. There is limited impact on Hong Kong dollar (–0.10%) as it is pegged to the US dollar.
A weaker currency not only diminishes the purchasing power of a HNWI in his/her home–currency but also influences his/her decision on where to purchase a particular good. For example, the reversal of yen weakness in 2016 is likely to result in a reduced number of Chinese tourists to Japan where locals are not expected to spend as much at home to counterbalance. On the other hand, the yen’s purchasing power has increased, making imported luxury goods more affordable for Japanese tourists abroad.
Government intervention The personal luxury goods market in China, Hong Kong and Macau remains soft under the number of government measures aimed at reducing ostentatious spending and regulating the grey market in China. This could explain further y/y declines for prices of items such as jewellery, ladies’ shoes and wine in Shanghai and Hong Kong.
However, the propensity of the Chinese to spend on luxury items remains high. Research by Bain & Co shows that Chinese consumers continue to make up the largest portion of luxury purchases (31%) globally, followed closely by Americans (24%) and Europeans (18%). Instead of spending in Greater China, Chinese consumers have redirected their purchases to mature markets such as Europe where tax–free shopping is popular as well as Japan and Korea where they seek to leverage on currency fluctuations when it moves in their favour. We see some evidence of this from higher price movements in Seoul and Tokyo for ladies’ shoes, ladies’ handbags and men’s suits where the identical product is available across the various Asian cities.
In the past year, we have also witnessed a reduction of import duties on luxury goods in countries such as China, Indonesia and Thailand. The goal of the duty cuts is to encourage consumers to spend more domestically (rather than abroad) and boost retail–sales growth. This necessarily has a deflationary impact in our index of luxury items where taxes are included in the final calculation.
Another area where we see the impact of regulation and policy changes in the property sector. Here the government has many levers to tweak both supply (land sales) and demand (stamp duties and other taxes and financing restrictions/costs) in order to moderate (from the government’s perspective) over–inflated prices or to boost anaemic ones. Government cooling measures have tapered demand for property in Singapore and Jakarta while a more efficient permissions approval process in Mumbai is likely to reduce the price tag for residential projects in the city.
Chart 6: Currency effects
* Average Fx rate from 1 June – 31 July 2015/2016 respectivelySource: Bloomberg Finance L.P.

JULIUS BAER WEALTH REPORT: INDIA
Competitive landscapeA change in supply conditions from a more competitive environment can have an impact on items on our index which are less differentiated and more susceptible to substitution effects (e.g. business class flights and high–end hotel accommodation).
We see a clear example of this in the pricing for business class flights out of Kuala Lumpur, where capacity additions from Middle Eastern Airlines has led to more competition and prices falling by more than 20%, according to industry experts.
The hospitality segment is also susceptible to changes in supply conditions. When new hotels of a similar quality are built in close proximity to existing hotels, there is often a discounting on overall room rates and ancillary rates (function rooms etc). We see some evidence of this for wedding banquet prices in Mumbai (–16.7%) and Seoul (–8.2%) where new high–end hotels opened over the past year. Interestingly, this had an opposite effect in Kuala Lumpur where hoteliers managed to re–price room rates higher as new 5–star hotel supply raised the overall quality of accommodation in the city.

2016 cost (USD) / 2016 vs 2015 cost change (%) 2016 cost (Local currency) / 2016 vs 2015 cost change (%)
Taipei1,287 (-3.7%)41,500 (0.0%)
Seoul1,263 (-2.3%)1,461,000 (0.0%)
Mumbai1,255 (-0.5%)84,375 (5.0%)
Jakarta1,305 (6.2%)17,280,000 (5.4%)
Shanghai1,537 (-6.5%)10,200 (0.0%)
Singapore1,381 (0.2%)1,865 (0.0%)
Average1,342 (1.8%)(2.8%)
Tokyo1,368 (22.0%)142,668 (3.0%)
Kuala Lumpur1,425 (-6.5%)5,750 (0.0%)
Bangkok1,372 (11.2%)48,300 (15.0%)
Manila1,306 (-0.6%)61,050 (2.9%)
Hong Kong1,263 (-0.1%)9,800 (0.0%)
18
JULIUS BAER WEALTH REPORT: INDIA
Chart 7: Skincare
Source: CSG Intage, Julius Baer
Introducing high–end skin cream to our Lifestyle IndexThis year for the first time we include a high–end skincare cream to our Lifestyle Index to complement botox as a facial aesthetic item. As described in our special on beauty capital in the later section of this report, skincare is the second most dynamic and largest growth contributor to the beauty and personal care industry, accounting for nearly one third of global beauty market value growth over 2014–2019(E).
According to Euromonitor, Asia Pacific is predicted to generate USD 6 bn new sales in premium cosmetics over the next five years, due primarily to the strong demand from China. Within the premium cosmetics category, skincare remains the most valuable category in terms of growth potential. Super–premium skincare products have been positioned by cosmetics firms such as Beiersdorf via their super–premium brand
La Prairie to target the ultra–affluent consumers who are not affected by changes in economic conditions.
After extensive research, we have selected La Prairie’s Cellular Cream Platinum Rare (50ml) to represent this category in our index. A 50ml bottle of the cream retails at an average price of USD 1,342 among the cities we surveyed with Shanghai being the most expensive city to purchase the cream (USD 1,537) and Mumbai the cheapest (USD 1,255). This hefty price tag makes it one of the most expensive moisturisers per ounce on the market.
In US dollar terms, we found that the price for our high–end skin cream rose on a y/y basis (+1.8%) outperforming the overall index which fell by an average of 1.68% and reflecting price resilience for the product category. That said, we will need to examine price trends for this item over a longer period of time to make any firm conclusions.

2016 cost (USD) / 2016 vs 2015 cost change (%) 2016 cost (Local currency) / 2016 vs 2015 cost change (%)
Hong Kong7,223 (-1.0%)56,045 (-0.9%)
Shanghai7,191 (2.5%)47,713 (9.6%)
Singapore5,860 (-0.7%)7,916 (-0.8%)
Average5,586 (4.1%)(4.5%)
Taipei7,782 (5.3%)250,844 (9.3%)
Seoul7,609 (-4.4%)8,801,686 (-2.1%)
Tokyo4,714 (59.4%)491,643 (34.5%)Mumbai4,365 (-10.3%)293,380 (-5.4%)
Kuala Lumpur2,826 (-25.8%)11,400 (-20.6%)
Jakarta5,394 (18.0%)71,436,000 (17.0%)
Bangkok3,697 (2.6%)130,123 (6.2%)
Manila4,790 (-0.5%)223,868 (3.0%)
19
JULIUS BAER WEALTH REPORT: INDIA
Business class flightsOur index showed an average increase of +4.5% (+4.1% in US dollar terms) in prices for business class flights from specific Asian cities to London/New York. The greatest volatility was seen in flights departing from Kuala Lumpur (–20.6% y/y), Jakarta (+17.0% y/y) and Tokyo (+34.5% y/y).
Clearly, the significant strengthening of the Japanese yen was a contributor to higher airfares from Tokyo. However, prices were also reportedly influenced by a reduction in capacity as international carriers like British Airways and United Airlines upgraded from 777s and 747s to smaller but newer 787s, leading to a capacity reduction of 38%–48%. Over the medium term however, we expect pricing dynamics on Japanese outbound flights to be affected by
increased competition from Haneda Airport (versus Narita airport where we currently derive our price data) which has opened a new international terminal to handle both short–haul and long–haul flights.
Business class flights out of Kuala Lumpur were cheaper y/y as the ringgit depreciated and capacity was added by competing airlines. For example, British Airways started adding flights from Kuala Lumpur to London in the past year in a route which has been historically monopolised by Malaysia Airlines.
The cheapest cities for a round–trip full fare business class flight to New York and London are Kuala Lumpur, Bangkok and Mumbai, while the most expensive city for this trip is now Taipei (previously Seoul).
Chart 8: Business class flights
Source: CSG Intage, Julius Baer

2016 cost (USD) / 2016 vs 2015 cost change (%) 2016 cost (Local currency) / 2016 vs 2015 cost change (%)
Shanghai16,578,269 (-5.5%)110,000,000 (1.0%)
Singapore8,883,039 (-26.3%)12,000,000 (-26.4%)
Average8,531,071 (-8.4%)(-7.2%)
Hong Kong41,238,325 (-8.7%)320,000,000 (-8.6%)
Taipei6,080,255 (0.7%)196,000,000 (4.5%)
Tokyo5,705,399 (4.4%)595,000,000 (-11.9%)
Seoul3,890,231 (-7.0%)4,500,000,000 (-4.8%)
Mumbai3,719,639 (-25.9%)250,000,000 (-21.9%)
Kuala Lumpur2,139,297 (-5.0%)8,630,400 (1.5%)
Jakarta1,963,346 (-10.7%)26,000,000,000 (-11.4%)
Bangkok1,846,663 (-3.4%)65,000,000 (0.0%)
Manila1,797,315 (-4.5%)84,000,000 (-1.2%)
20
JULIUS BAER WEALTH REPORT: INDIA
Source: CSG Intage, Julius Baer
Chart 9: Residential property
Residential propertyResidential property (defined in our data set as one based in a prime location at around 4,000 sqft in area) which is allocated a higher weighting of 30% in our index due to its importance in asset allocation, experienced one of the largest y/y declines of –7.2% (–8.4% in US dollar terms). Amongst the hardest hit cities were Singapore (–26.4%), Mumbai (–21.9%) and Tokyo (–11.9%).
Singapore property prices remained soft as previously imposed stamp duties and property loan restrictions deterred non–resident investors and dampened speculative activity. However, we are starting to see signs of a bottoming of activity particularly in the prime districts where sales volumes have increased sharply in the first half of 2016 due to the various incentives and discounts offered by developers. We believe that over the medium term, Singapore’s key destination status for quality health care services coupled with its
enduring status as a liveable and business city, will continue to appeal to foreign homebuyers.
Jakarta property prices continue to moderate in 2016. Although the market saw an increase in launching activity, buying sentiment has remained lukewarm; investors and end–users are holding their plans to buy apartments in view of the current economic slowdown. Tighter mortgage rules since 2013 have hurt sentiment as Bank Indonesia has repeatedly emphasised that it will continue to closely monitor the market and enforce policies to prevent the property market from overheating. There is some expectation however that loan–to–value (LTV) regulations could be eased this year to bolster the current sluggish market.
Overall, we find that property prices remain the loftiest in the financial hubs of Shanghai, Singapore and Hong Kong while they are least expensive in Jakarta, Bangkok and Manila.

2016 cost (USD) / 2016 vs 2015 cost change (%) 2016 cost (Local currency) / 2016 vs 2015 cost change (%)
Hong Kong838 (4.7%)6,500 (4.8%)
Shanghai452 (1.1%)3,000 (8.1%)
Singapore517 (6.3%)699 (6.1%)
Average447 (2.6%)(3.5%)
Taipei592 (3.2%)19,080 (7.2%)
Tokyo923 (34.2%)96,300 (13.3%)
Seoul236 (-8.1%)272,857 (-5.9%)
Mumbai156 (-2.4%)10,500 (2.9%)
Kuala Lumpur164 (3.4%)662 (10.5%)
Jakarta284 (-5.0%)3,758,857 (-5.7%)
Bangkok375 (-4.8%)13,200 (-1.5%)
Manila374 (-4.4%)17,500 (-1.0%)
21
JULIUS BAER WEALTH REPORT: INDIA
Source: CSG Intage, Julius Baer
Chart 10: Hotel suite
Hotel suiteThe average cost of an overnight stay at a centrally located 5–star hotel rose by 3.5% (+2.6% in US dollar terms) with the biggest price movements found in Tokyo (+13.3%) and Kuala Lumpur (+10.5%).
Although already the most expensive city for a hotel stay in Asia, room rates in Tokyo inched even higher on the back of record inbound tourist flows and limited new supply. This kept Tokyo in pole position this year as the most expensive hotel suite option
in Asia. By comparison, a stay at a suite of a similar quality is about five times cheaper in Mumbai, which is our least expensive city for the category.
The price jump in Kuala Lumpur may in part be explained by a new supply of high–end hotels (Grand Hyatt, St Regis) which has helped to reprice room rates for the city where rates have typically lagged Asian counterparts. Even so, hotel rates for a 5–star hotel in the city are still the second cheapest in the region besting only Mumbai.

2016 cost (USD) / 2016 vs 2015 cost change (%) 2016 cost (Local currency) / 2016 vs 2015 cost change (%)
Hong Kong117,218 (-2.6%)909,586 (-2.5%)
Shanghai137,684 (-0.2%)913,560 (6.7%)
Singapore76,461 (0.2%)103,290 (0.0%)
Average74,902 (-1.3%)(-0.2%)
Taipei43,713 (2.0%)1,409,100 (5.9%)
Tokyo148,674 (18.1%)15,504,804 (-0.3%)
Seoul80,506 (-10.4%)93,125,000 (-8.2%)
Mumbai75,120 (-21.0%)5,048,888 (-16.7%)
Kuala Lumpur33,315 (4.0%)134,400 (11.2%)
Jakarta38,833 (2.2%)514,250,000 (1.4%)
Bangkok28,251 (-3.4%)994,400 (0.0%)
Manila44,145 (-3.4%)2,063,158 (0.0%)
22
JULIUS BAER WEALTH REPORT: INDIA
Source: CSG Intage, Julius Baer
Chart 11: Wedding banquet
Wedding banquet Arguably, no investment is more rewarding than for one's wedding ceremony. Every year, as part of our dataset, we source pricing for a wedding banquet for around 500 guests at a top–end hotel. Banquet pricing typically sees low level of flux in terms of pricing for hotels and tends not to change day to day based on demand. In local currency terms, banquet prices remained stable across the cities we surveyed at –0.2% y/y (–1.3% in US dollar terms).
However, we did see a notable increase in Kuala Lumpur (+11.2%) which is in line with the rising
pricing trend for luxury hotel room rates in Kuala Lumpur from a repricing of the market with new supply. On the other hand, Seoul (–8.2%) and Mumbai (–16.7%) suffered large declines due in part to new hotel/function room supply in those cities (Seoul: New Four Seasons and JW Marriot; Mumbai: New JW Marriot).
The most expensive city in Asia to plan your nuptials continues to be Tokyo (USD 148,674) where it costs more than five times as much as Bangkok (USD 28,251) the cheapest city to do so.

2016 cost (USD) / 2016 vs 2015 cost change (%) 2016 cost (Local currency) / 2016 vs 2015 cost change (%)
Hong Kong1,708 (-15.6%)13,250 (-15.6%)
Taipei2,116 (-21.3%)68,200 (-18.3%)
Tokyo2,154 (33.1%)224,640 (12.3%)
Seoul1,599 (0.4%)1,850,000 (2.8%)
Kuala Lumpur1,487 (-6.5%)6,000 (0.0%)
Shanghai2,645 (-17.3%)17,550 (-11.6 %)
Singapore2,369 (0.2%)3,200 (0.0%)
Average2,227 (-3.0%)(-2.3%)
Mumbai2,232 (-0.2%)150,000 (5.3%)
Jakarta2,391 (-0.8%)31,667,000 (-1.6%)
Bangkok2,699 (3.2%)95,000 (6.7%)
Manila3,092 (-8.1%)144,527 (-4.9%)
23
JULIUS BAER WEALTH REPORT: INDIA
Source: CSG Intage, Julius Baer
Chart 12: Wine
Wine On average in local currency terms, the price for a 750ml of our bottle of Chateau Lafite Rothschild 2000 fell by 2.3% (–3.0% in US dollar terms) this year. We found the largest price declines in Taipei (–18.3%), Hong Kong (–15.6%) and Shanghai (–11.6%) where the impact of austerity measures continue to have a lingering effect. The most expensive city to purchase a bottle of our Hero wine remains Manila where it is almost twice as expensive as the same bottle from Kuala Lumpur (where it is the cheapest).
The price of the wine item in our index has consistently come down in recent years, but this is a normalisation in price, which previously was arguably elevated. A number of reasons contribute to the decline including a shift in buying patterns (Burgundy on the rise), counterfeit industry in China and political changes discouraging lavish gift–giving in China. We should still treat Lafite as the ‘king of first growth’. It is also worth mentioning that apart from the Lafite, there are many other highly–rated expensive Bordeaux wines that have fallen to ‘bargain’ level prices, according to wine experts at Christie’s in Hong Kong.

2016 cost (USD) / 2016 vs 2015 cost change (%) 2016 cost (Local currency) / 2016 vs 2015 cost change (%)
Hong Kong101,549 (-6.8%)788,000 (-6.8%)
Shanghai109,115 (-12.8%)724,000 (-6.8%)
Singapore116,590 (14.7%)157,500 (14.6%)
Average83,249 (-2.0%)(-0.3%)
Taipei103,768 (-25.1%)3,345,000 (-22.2%)
Tokyo86,991 (-19.5%)9,072,000 (-32.1%)
Seoul139,313 (-1.3%)161,150,000 (1.1%)
Mumbai21,528 (3.5%)1,446,935 (9.2%)
Kuala Lumpur101,135 (11.7%)408,000 (19.5%)
Jakarta50,745 (9.4%)672,000,000 (8.6%)
Bangkok53,979 (8.0%)1,900,000 (11.8%)
Manila31,025 (-3.4%)1,450,000 (0.0%)
24
JULIUS BAER WEALTH REPORT: INDIA
Source: CSG Intage, Julius Baer
Chart 13: Jewellery
Jewellery Our index showed a flat price trend for jewellery this year (–0.3% in local currency, –2.0% in US dollar terms). Yet, jewellery is perhaps the hardest item in the index to standardise and build a clear picture of pricing and demand/supply trends. In the index, the only real ‘standard’ item that we try to look for across the markets is the Tiffany cut single stone. Even then, we might find variations from y/y depending on the colour, clarity and size of the stone that is available.
The main trend in APAC ex Japan for high end jewellery is that consumers are gradually shifting away from ‘local’ producers towards the branded ones, but the former still makes up about 80% of sales, according to industry experts.
Consumers in Asia tend to focus more on the individual stones and their cost, and worry less about setting, design and craftsmanship of the overall piece. Some brands, like Tiffany, are trying out targeted, mono–themed strategies like trying to raise awareness of single items, such as yellow diamonds. There is a perception now, especially in China, that diamonds are the only stone that can have an investment value, yellow diamonds in particular.
The prevailing view in the industry is that no other store has this cache at the moment. So this is a unique strategy that may be copied in some form by other firms in the future. Overall, it is not expected that local jewellers will match their craftsmanship or design capabilities, well into the medium term.

2016 cost (USD) / 2016 vs 2015 cost change (%) 2016 cost (Local currency) / 2016 vs 2015 cost change (%)
Hong Kong33,248 (3.9%)258,000 (4.0%)
Shanghai38,884 (-8.2%)258,000 (-1.9%)
Singapore34,666 (3.1%)46,830 (2.9%)
Average34,369 (3.1%)(4.1%)
Taipei34,108 (0.2%)1,099,500 (4.0%)
Tokyo34,382 (27.9%)3,585,600 (8.0%)
Seoul37,173 (-2.3%)43,000,000 (0.0%)
Mumbai33,998 (-1.8%)2,285,000 (3.6%)
Kuala Lumpur28,491 (-3.7%)114,939 (3.0%)
Jakarta30,734 (9.1%)407,000,000 (8.2%)
Bangkok37,939 (7.3%)1,335,400 (11.0%)
Manila34,438 (-1.3%)1,609,500 (2.2%)
25
JULIUS BAER WEALTH REPORT: INDIA
Source: CSG Intage, Julius Baer
Chart 14: Watch
WatchThe watch item in our index this year is the Rolex Oyster Perpetual Day–Date 40 in yellow gold which replaces the 41mm Day–Date II. Individually, the changes in the Day–Date 40 are all small, but taken as a whole they represent a significant upgrade to Rolex’s flagship model. The new flagship model features a new case, dials and next–generation movement.
We found positive price trends for our watch item across 9 of the 11 cities (except for Shanghai (–1.9%) and Seoul (0.0%)) helped by a model upgrade and
a bullish vintage Rolex market. This is reflective of the fact that the Day–Date is considered to be very fashionable currently especially with younger collectors. On average, our watch item saw prices rising by 4.1% in local currency terms (+3.1% in US dollar terms) making it one of the outperformers in the index.
We find Kuala Lumpur to be the least expensive city to purchase our watch (USD 28,491) while Shanghai remains the most pricey (USD 38,884).

2016 cost (USD) / 2016 vs 2015 cost change (%) 2016 cost (Local currency) / 2016 vs 2015 cost change (%)
Hong Kong253,616 (-0.1%)1,968,000 (0.0%)
Shanghai299,615 (-9.6%)1,988,000 (-3.4%)
Singapore429,939 (2.1%)580,800 (1.9%)
Average228,486 (-0.7%)(0.2%)
Taipei198,849 (-7.7%)6,410,000 (-4.2%)
Tokyo159,080 (27.0%)16,590,000 (7.2%)
Seoul165,810 (2.1%)191,800,000 (4.5%)
Mumbai229,874 (0.4%)15,450,000 (5.9%)
Kuala Lumpur195,527 (-9.9%)788,800 (-3.7%)
Jakarta157,747 (0.8%)2,089,000,000 (0.0%)
Bangkok198,843 (-26.5%)6,999,000 (-23.9%)
Manila224,450 (14.0%)10,490,000 (18.0%)
26
JULIUS BAER WEALTH REPORT: INDIA
All prices for BMW 750Li except:2015: BMW 740Li for Bangkok, Jakarta, Kuala Lumpur and Manila2016: BMW 740Li for Bangkok, Jakarta and Kuala LumpurSource: CSG Intage, Julius Baer
Chart 15: Car
Car We have replaced the luxury sedan in our index this year with the redesigned BMW 7 Series (previously Mercedes–Benz S–Class) which is also the flagship model of the brand for BMW. The new BMW 7 series features several innovations including the industry’s first Display Key, Gesture Control, Remote Control Parking, a passenger compartment constructed with light–weight carbon fibre and BMW Panorama glass roof Sky Lounge.
On average, our car item saw stable pricing trends over the past year up 0.2% in local currency terms (–0.7% in USD terms). At the extremes, we saw a
large price increase in Manila of 18.0% helped by a model upgrade (BMW 750Li from BMW 740Li, which is still available), while Bangkok saw a price fall of –23.9% as a price adjustment was carried out to stay competitive as Mercedes Benz dropped prices across its model range.
Singapore clinches the title of most expensive city to purchase a brand new BMW 7 Series sedan (approximately USD 430,000) due to import duties and regulatory taxes whereas Shanghai is a distant second at about USD 300,000. Jakarta is the cheapest overall to procure our car item (approximately USD 158,000).

Item (USD)
Hong Kong
Singapore Shanghai Mumbai Taipei Jakarta Manila Seoul KualaLumpur
Bangkok Tokyo
Average 4.10 4.00 2.48 7.62 5.43 7.14 6.24 5.48 7.43 5.57 5.29
3 5 4 9 1 6 7 2 11 10 8Business class flights
11 13 62 45 87 910Ladies’ shoes
1113 6 2 45 8 79 10Cigar
11 136 245 87 910Piano
111 362 4 58 79 10Facial aesthetics(Botox)
111 3 624 58 79 10Watch
111 36 24 58 79 10Lawyer
1113 6 245 8 79 10Wine
11 1 36 2 45 879 10Ladies’ handbag
11 1 362 45 8 7 9 10Golf club membership
3 5 2 6 8 9 7 4 10 11 1Wedding banquet
2 4 5 11 3 8 7 9 10 6 1Hotel Suite
1 3 2 7 4 9 11 6 8 10 5Residential property
1113 6 24 587910Hospital
11 13 62 45 8 79 10Jewellery
11 13 624 5 87 910Men’s suit
1072 813 54 6 11 9Car
1113 6 2 4 58 7 910Skincare
3 62 45 879 10Tooth implant 11 1
27
JULIUS BAER WEALTH REPORT: INDIA
Chart 16: 2016 Julius Baer Lifestyle Index city ranking by items, in USD
Source: CSG Intage, Julius Baer

28
JULIUS BAER WEALTH REPORT: INDIA
Most expensive city: ShanghaiFor the second year since we began to compare the cost of luxury living in Asian cities, Shanghai is ranked as the most expensive city scoring first place for 5 items (hospital stay, watch, botox, cigars and high–end skin cream) and second for another 6 (property, wedding banquet, ladies’ handbag, men’s suit, car and ladies’ shoes). As seasoned shoppers will know, factors such as exchange rates, taxes and duties can cause a luxury item to cost significantly more on the mainland than overseas.
Least expensive city: MumbaiFor the second year since we began to compare the cost of luxury living in Asian cities, Mumbai is ranked
as the least expensive city scoring 11th for 7 items (hotel suite, tooth implant, ladies’ handbag, jewellery, men’s suit, cigars and skincare) and second cheapest for botox.
Upgrades and downgradesSingapore has overtaken from Hong Kong as the second most expensive city in Asia as the latter remains out of favour with Chinese tourists. Another notable upgrade is Tokyo (up 3 notches from 7th to 4th spot) due to favourable Fx rates displacing Bangkok which is downgraded from 5th to 7th. Kuala Lumpur falls 2 notches from 8th to 10th position on adverse currency movement.
Source: CSG Intage, Julius Baer
Chart 17: Change in ranking 2015/2016
( ) Change from 2015 ranking
Shanghai (–)
Hong Kong ( 1)
Taipei ( 1)
Bangkok ( 2)
Jakarta ( 1)
Mumbai (–)
Singapore ( 1)
Tokyo ( 3)
Seoul ( 2)
Manila ( 1)
Kuala Lumpur ( 2)
123456789
1011

(USD)
SkincareGolf clubmembership
Facial aesthetics
(Botox)
HospitalBusiness-classflights
Weddingbanquet
Hotelsuite
Toothimplant
LawyerResidentialproperty
Ladies’handbag
Watch Wine Jewellery PianoMen’ssuit
Car Cigar Ladies’shoes
min. 3,306min. 1,797,315 min. 121min. 2,826 min. 28,251 min. 156 min. 595 min. 104 min. 28,491 min. 1,487min. 3,273 min. 21,528 min. 1,278 min. 195,825min. 151 min. 157,747 min. 818 min. 540 min. 1,255
max. 791,675max. 41,238,325 max. 1,038max. 7,782 max. 148,674 max. 923 max. 4,794 max. 888 max. 38,884 max. 3,092max. 4,078 max. 139,313 max. 3,778 max. 255,692max. 904 max. 429,939 max. 1,590 max. 860 max. 1,537
31%33%
54%
26%
46%
57%
52%
46%
57%
40%
26%
33%
17%
56%
39% 38%40%
57%
45%
(USD)
100%
80%
60%
40%
20%
0%
39%
100%
89%
74%
89%
96%
3%
67%
52%
46%
14%
26%
68%
83%
71%
96%
35%
73%
45%
Hong Kong Average
30
JULIUS BAER WEALTH REPORT: INDIA
Source: CSG Intage, Julius Baer
Chart 18: Julius Baer Lifestyle Index – Hong Kong
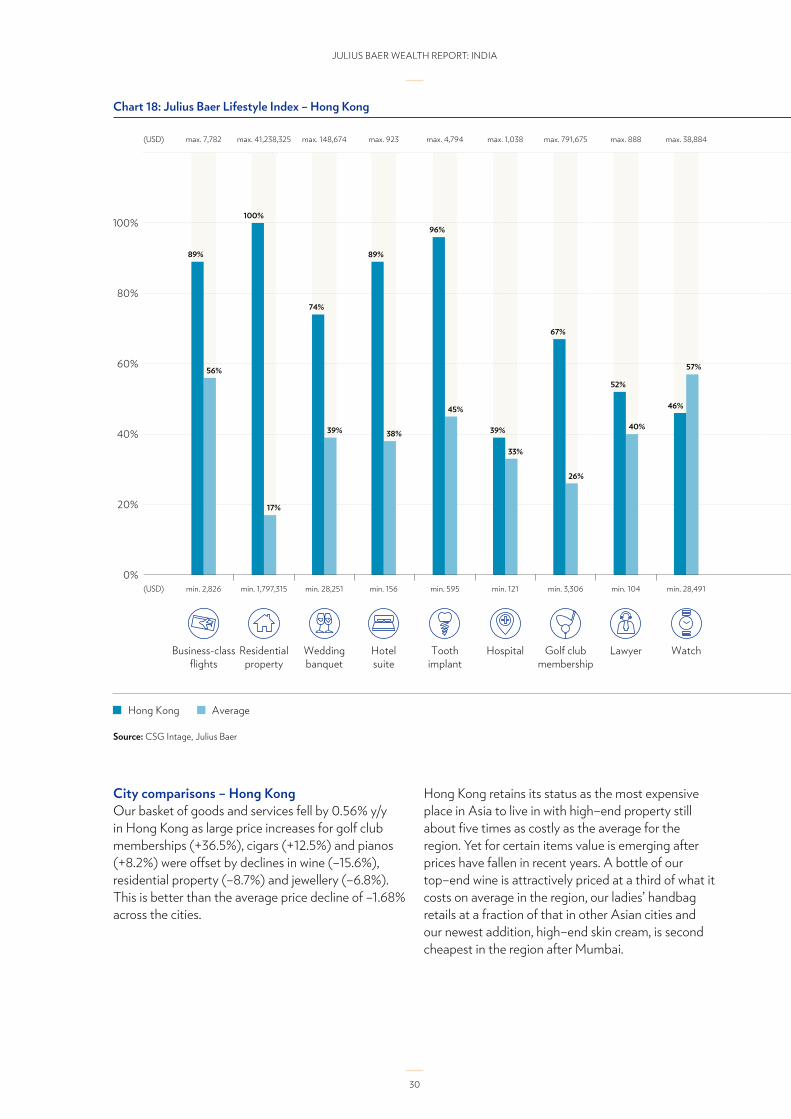
City comparisons – Hong Kong Our basket of goods and services fell by 0.56% y/y in Hong Kong as large price increases for golf club memberships (+36.5%), cigars (+12.5%) and pianos (+8.2%) were offset by declines in wine (–15.6%), residential property (–8.7%) and jewellery (–6.8%). This is better than the average price decline of –1.68% across the cities.
Hong Kong retains its status as the most expensive place in Asia to live in with high–end property still about five times as costly as the average for the region. Yet for certain items value is emerging after prices have fallen in recent years. A bottle of our top–end wine is attractively priced at a third of what it costs on average in the region, our ladies’ handbag retails at a fraction of that in other Asian cities and our newest addition, high–end skin cream, is second cheapest in the region after Mumbai.

(USD)
SkincareGolf clubmembership
Facial aesthetics
(Botox)
HospitalBusiness-classflights
Weddingbanquet
Hotelsuite
Toothimplant
LawyerResidentialproperty
Ladies’handbag
Watch Wine Jewellery PianoMen’ssuit
Car Cigar Ladies’shoes
min. 3,306min. 1,797,315 min. 121min. 2,826 min. 28,251 min. 156 min. 595 min. 104 min. 28,491 min. 1,487min. 3,273 min. 21,528 min. 1,278 min. 195,825min. 151 min. 157,747 min. 818 min. 540 min. 1,255
max. 791,675max. 41,238,325 max. 1,038max. 7,782 max. 148,674 max. 923 max. 4,794 max. 888 max. 38,884 max. 3,092max. 4,078 max. 139,313 max. 3,778 max. 255,692max. 904 max. 429,939 max. 1,590 max. 860 max. 1,537
31%33%
54%
26%
46%
57%
52%
46%
57%
40%
26%
33%
17%
56%
39% 38%40%
57%
45%
(USD)
100%
80%
60%
40%
20%
0%
39%
100%
89%
74%
89%
96%
3%
67%
52%
46%
14%
26%
68%
83%
71%
96%
35%
73%
45%
Hong Kong Average
31
JULIUS BAER WEALTH REPORT: INDIA
Chart 18: Julius Baer Lifestyle Index – Hong Kong
We remain sanguine on the Hong Kong economy as we expect the bellwether property sector to remain resilient. Hong Kong real estate is highly sensitive to interest rates, which given Hong Kong’s currency peg, follow those of the United States where rate hikes have been pushed back. There is also optimism in the commercial sector, where the transition from luxury shops to mass market shops is close to completion, and landlords can start from a new base.
Our view on the Hong Kong dollar (which is pegged to the US dollar) is bullish as US economic data is improving despite an already strong currency, justifying more currency strength.

(USD)
SkincareGolf clubmembership
Facial aesthetics
(Botox)
HospitalBusiness-classflights
Weddingbanquet
Hotelsuite
Toothimplant
LawyerResidentialproperty
Ladies’handbag
Watch Wine Jewellery PianoMen’ssuit
Car Cigar Ladies’shoes
min. 3,306min. 1,797,315 min. 121min. 2,826 min. 28,251 min. 156 min. 595 min. 104 min. 28,491 min. 1,487min. 3,273 min. 21,528 min. 1,278 min. 195,825min. 151 min. 818 min. 540 min. 1,255
max. 791,675max. 41,238,325 max. 1,038max. 7,782 max. 148,674 max. 923 max. 4,794 max. 888 max. 38,884 max. 3,092max. 4,078 max. 139,313 max. 3,778 max. 255,692max. 904 max. 1,590 max. 860 max. 1,537
31%33%
54%
46%
57%
52%
46%
57%
40%
26%
33%
17%
56%
39% 38%40%
57%
45%
26%
min. 157,747
max. 429,939(USD)
100%
80%
60%
40%
20%
0%
36%
18%
61%
40%
47% 48%44%
20%
100%
59%55%
62%
81%
43%46%
18%
100%
62%
51%
Singapore Average
32
JULIUS BAER WEALTH REPORT: INDIA
Chart 19: Julius Baer Lifestyle Index – Singapore
City comparisons – Singapore Our basket of goods and services fell by 6.6% y/y in Singapore dragged by a significant decline in high–end property prices (–26.3%). Large price increases for items such as jewellery (+14.7%) and cigars (+20.0%) were unable to make up for the difference. The price performance for our luxury index in Singapore was worse than the –1.68% across the cities.
Singapore has gained ground on Hong Kong this year and it is now the 2nd most expensive city in Asia according to our index. Cars, legal fees and jewellery are considerably more expensive in the lion–city but
these can be explained by idiosyncratic factors such as local taxes and controlled supply for cars.
Botox and golf club memberships could be considered as ‘cheap’ relative to the region. Golf club membership prices (–4.2%) in Singapore have fallen after buyers stopped trading in memberships in the wake of government announcements that it was taking back the land from three clubs and that two others would not have their leases renewed. Over the medium term however, we would expect membership prices to rise again as players from clubs due to close buy new memberships to continue playing the sport.
Source: CSG Intage, Julius Baer
(USD)
SkincareGolf clubmembership
Facial aesthetics
(Botox)
HospitalBusiness-classflights
Weddingbanquet
Hotelsuite
Toothimplant
LawyerResidentialproperty
Ladies’handbag
Watch Wine Jewellery PianoMen’ssuit
Car Cigar Ladies’shoes
min. 3,306min. 1,797,315 min. 121min. 2,826 min. 28,251 min. 156 min. 595 min. 104 min. 28,491 min. 1,487min. 3,273 min. 21,528 min. 1,278 min. 195,825min. 151 min. 818 min. 540 min. 1,255
max. 791,675max. 41,238,325 max. 1,038max. 7,782 max. 148,674 max. 923 max. 4,794 max. 888 max. 38,884 max. 3,092max. 4,078 max. 139,313 max. 3,778 max. 255,692max. 904 max. 1,590 max. 860 max. 1,537
31%33%
54%
46%
57%
52%
46%
57%
40%
26%
33%
17%
56%
39% 38%40%
57%
45%
26%
min. 157,747
max. 429,939(USD)
100%
80%
60%
40%
20%
0%
36%
18%
61%
40%
47% 48%44%
20%
100%
59%55%
62%
81%
43%46%
18%
100%
62%
51%
Singapore Average
33
JULIUS BAER WEALTH REPORT: INDIA
Chart 19: Julius Baer Lifestyle Index – Singapore
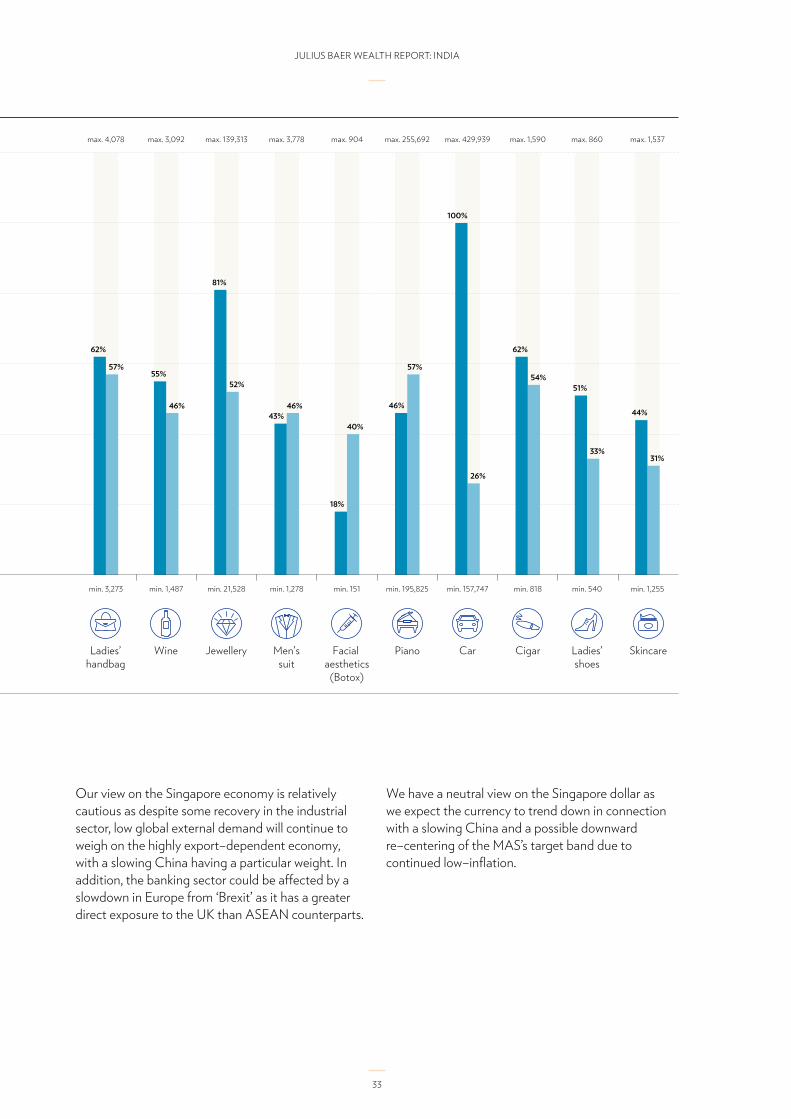
Our view on the Singapore economy is relatively cautious as despite some recovery in the industrial sector, low global external demand will continue to weigh on the highly export–dependent economy, with a slowing China having a particular weight. In addition, the banking sector could be affected by a slowdown in Europe from ‘Brexit’ as it has a greater direct exposure to the UK than ASEAN counterparts.
We have a neutral view on the Singapore dollar as we expect the currency to trend down in connection with a slowing China and a possible downward re–centering of the MAS’s target band due to continued low–inflation.

(USD)
SkincareGolf clubmembership
Facial aesthetics
(Botox)
HospitalBusiness-classflights
Weddingbanquet
Hotelsuite
Toothimplant
LawyerResidentialproperty
Ladies’handbag
Watch Wine Jewellery PianoMen’ssuit
Car Cigar Ladies’shoes
min. 3,306min. 1,797,315 min. 121min. 2,826 min. 28,251 min. 156 min. 595 min. 104 min. 28,491 min. 1,487min. 3,273 min. 21,528 min. 1,278 min. 195,825min. 151 min. 818 min. 540 min. 1,255
max. 791,675max. 41,238,325 max. 1,038max. 7,782 max. 148,674 max. 923 max. 4,794 max. 888 max. 38,884 max. 3,092max. 4,078 max. 139,313 max. 3,778 max. 255,692max. 904 max. 1,590 max. 860 max. 1,537
31%33%
54%
46%
57%
52%
46%
57%
40%
26%
33%
17%
56%
39% 38%40%
57%
45%
26%
min. 157,747
max. 429,939(USD)
100%
80%
60%
40%
20%
0%
100%
37%
88%91%
39%
58%
100%
21%
16%
100%
72%
90%
74%
94%
88%
100%
52%
100%
53%
Shanghai Average
34
JULIUS BAER WEALTH REPORT: INDIA
Chart 20: Julius Baer Lifestyle Index – Shanghai
City comparisons – ShanghaiOur basket of goods and services fell by 7.0% y/y in Shanghai affected by a depreciation (–6.5%) of the Chinese yuan against the US dollar. This was more deflationary than the –1.68% we saw across the cities. In addition, most items saw prices falling except for tooth implants (+10%), cigars (+7.5%) and business class flights (+2.5%). The items with outsized declines were botox (–29.8%), ladies’ shoes (–20.0%), wine (–17.3%) and legal fees (–13.9%).
Yet in absolute terms, Shanghai remains the most expensive city in Asia. To put it another way, legal fees and golf club memberships are the only two items which are cheaper in Shanghai than in the region. In many cases, luxury goods and services originating from Shanghai cost two times what they would cost elsewhere in Asia.
Source: CSG Intage, Julius Baer

(USD)
SkincareGolf clubmembership
Facial aesthetics
(Botox)
HospitalBusiness-classflights
Weddingbanquet
Hotelsuite
Toothimplant
LawyerResidentialproperty
Ladies’handbag
Watch Wine Jewellery PianoMen’ssuit
Car Cigar Ladies’shoes
min. 3,306min. 1,797,315 min. 121min. 2,826 min. 28,251 min. 156 min. 595 min. 104 min. 28,491 min. 1,487min. 3,273 min. 21,528 min. 1,278 min. 195,825min. 151 min. 818 min. 540 min. 1,255
max. 791,675max. 41,238,325 max. 1,038max. 7,782 max. 148,674 max. 923 max. 4,794 max. 888 max. 38,884 max. 3,092max. 4,078 max. 139,313 max. 3,778 max. 255,692max. 904 max. 1,590 max. 860 max. 1,537
31%33%
54%
46%
57%
52%
46%
57%
40%
26%
33%
17%
56%
39% 38%40%
57%
45%
26%
min. 157,747
max. 429,939(USD)
100%
80%
60%
40%
20%
0%
100%
37%
88%91%
39%
58%
100%
21%
16%
100%
72%
90%
74%
94%
88%
100%
52%
100%
53%
Shanghai Average
35
JULIUS BAER WEALTH REPORT: INDIA
Chart 20: Julius Baer Lifestyle Index – Shanghai
In terms of our currency outlook, we are expecting mild depreciation for the Chinese yuan against the US dollar due to cyclical and structural pressures in the Chinese economy. We are overall positive on the Chinese economy. Market worries have calmed after better data in the first half indicated a temporary stabilisation of economic conditions. We expect a controlled slowdown to resume in the second half of 2016.
(USD)
SkincareGolf clubmembership
Facial aesthetics
(Botox)
HospitalBusiness-classflights
Weddingbanquet
Hotelsuite
Toothimplant
LawyerResidentialproperty
Ladies’handbag
Watch Wine Jewellery PianoMen’ssuit
Car Cigar Ladies’shoes
min. 3,306min. 1,797,315 min. 121min. 2,826 min. 28,251 min. 156 min. 595 min. 104 min. 28,491 min. 1,487min. 3,273 min. 21,528 min. 1,278 min. 195,825min. 151 min. 818 min. 540 min. 1,255
max. 791,675max. 41,238,325 max. 1,038max. 7,782 max. 148,674 max. 923 max. 4,794 max. 888 max. 38,884 max. 3,092max. 4,078 max. 139,313 max. 3,778 max. 255,692max. 904 max. 1,590 max. 860 max. 1,537
31%33%
54%
46%
57%
52%
46%
57%
40%
26%
33%
17%
56%
39% 38%40%
57%
45%
26%
min. 157,747
max. 429,939(USD)
100%
80%
60%
40%
20%
0%
27%
5%
31%
39%
0% 0% 0%
6%
25%
53%
46%
0% 0% 0%
77%
8%
26%
0%
36%
Mumbai Average
36
JULIUS BAER WEALTH REPORT: INDIA
Chart 21: Julius Baer Lifestyle Index – Mumbai
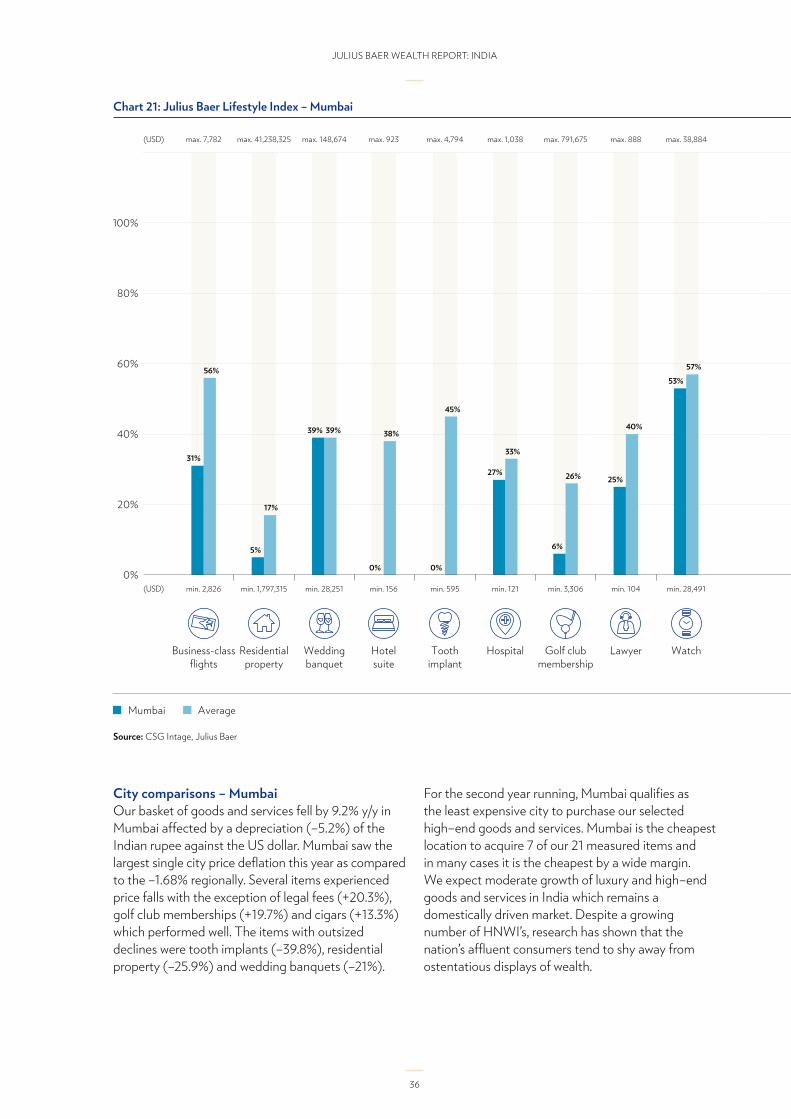
City comparisons – MumbaiOur basket of goods and services fell by 9.2% y/y in Mumbai affected by a depreciation (–5.2%) of the Indian rupee against the US dollar. Mumbai saw the largest single city price deflation this year as compared to the –1.68% regionally. Several items experienced price falls with the exception of legal fees (+20.3%), golf club memberships (+19.7%) and cigars (+13.3%) which performed well. The items with outsized declines were tooth implants (–39.8%), residential property (–25.9%) and wedding banquets (–21%).
For the second year running, Mumbai qualifies as the least expensive city to purchase our selected high–end goods and services. Mumbai is the cheapest location to acquire 7 of our 21 measured items and in many cases it is the cheapest by a wide margin. We expect moderate growth of luxury and high–end goods and services in India which remains a domestically driven market. Despite a growing number of HNWI’s, research has shown that the nation’s affluent consumers tend to shy away from ostentatious displays of wealth.
Source: CSG Intage, Julius Baer

(USD)
SkincareGolf clubmembership
Facial aesthetics
(Botox)
HospitalBusiness-classflights
Weddingbanquet
Hotelsuite
Toothimplant
LawyerResidentialproperty
Ladies’handbag
Watch Wine Jewellery PianoMen’ssuit
Car Cigar Ladies’shoes
min. 3,306min. 1,797,315 min. 121min. 2,826 min. 28,251 min. 156 min. 595 min. 104 min. 28,491 min. 1,487min. 3,273 min. 21,528 min. 1,278 min. 195,825min. 151 min. 818 min. 540 min. 1,255
max. 791,675max. 41,238,325 max. 1,038max. 7,782 max. 148,674 max. 923 max. 4,794 max. 888 max. 38,884 max. 3,092max. 4,078 max. 139,313 max. 3,778 max. 255,692max. 904 max. 1,590 max. 860 max. 1,537
31%33%
54%
46%
57%
52%
46%
57%
40%
26%
33%
17%
56%
39% 38%40%
57%
45%
26%
min. 157,747
max. 429,939(USD)
100%
80%
60%
40%
20%
0%
27%
5%
31%
39%
0% 0% 0%
6%
25%
53%
46%
0% 0% 0%
77%
8%
26%
0%
36%
Mumbai Average
37
JULIUS BAER WEALTH REPORT: INDIA
Chart 21: Julius Baer Lifestyle Index – Mumbai
Our outlook for the Indian economy and the currency is moderately bullish – we expect continued outperformance of the rupee against its Asian emerging market peers given its resilience. We expect the rupee to profit from a better macroeconomic backdrop and an improving balance of payments. In addition, we expect a steady flow of reforms to keep more realistic expectations for fundamental change alive.

(USD)
SkincareGolf clubmembership
Facial aesthetics
(Botox)
HospitalBusiness-classflights
Weddingbanquet
Hotelsuite
Toothimplant
LawyerResidentialproperty
Ladies’handbag
Watch Wine Jewellery PianoMen’ssuit
Car Cigar Ladies’shoes
min. 3,306min. 1,797,315 min. 121min. 2,826 min. 28,251 min. 156 min. 595 min. 104 min. 28,491 min. 1,487min. 3,273 min. 21,528 min. 1,278 min. 195,825min. 151 min. 818 min. 540 min. 1,255
max. 791,675max. 41,238,325 max. 1,038max. 7,782 max. 148,674 max. 923 max. 4,794 max. 888 max. 38,884 max. 3,092max. 4,078 max. 139,313 max. 3,778 max. 255,692max. 904 max. 1,590 max. 860 max. 1,537
31%33%
54%
46%
57%
52%
46%
57%
40%
26%
33%
17%
56%
39% 38%40%
57%
45%
26%
min. 157,747
max. 429,939(USD)
100%
80%
60%
40%
20%
0%
9%11%
100%
13%
57%
52%
11%
16%
12%
54%
39%
56%
70%
38%
87%
42%
15%
82%
2%
Taipei Average
38
JULIUS BAER WEALTH REPORT: INDIA
Chart 22: Julius Baer Lifestyle Index – Taipei
City comparisons – TaipeiOur basket of goods and services fell slightly by 0.26% y/y in Taipei in a somewhat mixed picture. Items which showed large price falls include jewellery (–25.1%), wine (–21.3%) and golf club memberships (–9.1%) while ladies’ shoes (+27.8%) and botox (+25.6%) outperformed. Overall, price momentum outperformed the average price movement of –1.68% across the cities.
Relative to regional peers, Taipei’s goods and services are not expensive with the city retaining its 6th spot in our index ranking. Historically, tourism marketing has focused largely on local culture, natural sights, street food and cuisine. However, this may change as the government has been taking steps to promote Taiwan as a luxury shopping destination including easing visa restrictions, introducing a more consumer–friendly tax system and opening more upscale department stores in the Taipei 101 area. Given the attractive pricing of the city’s goods and services, we see further upside potential for the city’s ranking.
Source: CSG Intage, Julius Baer

(USD)
SkincareGolf clubmembership
Facial aesthetics
(Botox)
HospitalBusiness-classflights
Weddingbanquet
Hotelsuite
Toothimplant
LawyerResidentialproperty
Ladies’handbag
Watch Wine Jewellery PianoMen’ssuit
Car Cigar Ladies’shoes
min. 3,306min. 1,797,315 min. 121min. 2,826 min. 28,251 min. 156 min. 595 min. 104 min. 28,491 min. 1,487min. 3,273 min. 21,528 min. 1,278 min. 195,825min. 151 min. 818 min. 540 min. 1,255
max. 791,675max. 41,238,325 max. 1,038max. 7,782 max. 148,674 max. 923 max. 4,794 max. 888 max. 38,884 max. 3,092max. 4,078 max. 139,313 max. 3,778 max. 255,692max. 904 max. 1,590 max. 860 max. 1,537
31%33%
54%
46%
57%
52%
46%
57%
40%
26%
33%
17%
56%
39% 38%40%
57%
45%
26%
min. 157,747
max. 429,939(USD)
100%
80%
60%
40%
20%
0%
9%11%
100%
13%
57%
52%
11%
16%
12%
54%
39%
56%
70%
38%
87%
42%
15%
82%
2%
Taipei Average
39
JULIUS BAER WEALTH REPORT: INDIA
Chart 22: Julius Baer Lifestyle Index – Taipei
We have been mildly optimistic on the Taiwanese economy however, we note that this year’s growth forecasts have a downward bias as weakness in external demand for the island’s products and components is starting to impact recent signs of economic recovery.
Over the medium term, the newly elected government plans to focus on industrial upgrading, income distribution and reducing trade reliance on China. It remains to be seen if these reform measures can be executed given an anaemic macro–environment, limited fiscal firepower and regional competition.

(USD)
SkincareGolf clubmembership
Facial aesthetics
(Botox)
HospitalBusiness-classflights
Weddingbanquet
Hotelsuite
Toothimplant
LawyerResidentialproperty
Ladies’handbag
Watch Wine Jewellery PianoMen’ssuit
Car Cigar Ladies’shoes
min. 3,306min. 1,797,315 min. 121min. 2,826 min. 28,251 min. 156 min. 595 min. 104 min. 28,491 min. 1,487min. 3,273 min. 21,528 min. 1,278 min. 195,825min. 151 min. 818 min. 540 min. 1,255
max. 791,675max. 41,238,325 max. 1,038max. 7,782 max. 148,674 max. 923 max. 4,794 max. 888 max. 38,884 max. 3,092max. 4,078 max. 139,313 max. 3,778 max. 255,692max. 904 max. 1,590 max. 860 max. 1,537
31%33%
54%
46%
57%
52%
46%
57%
40%
26%
33%
17%
56%
39% 38%40%
57%
45%
26%
min. 157,747
max. 429,939(USD)
100%
80%
60%
40%
20%
0%
18%
0%0%
52%
9%
17%14%
0%
22% 22%25%
39%
7%
20%
0%
19%
56%
100%
48%
Jakarta Average
40
JULIUS BAER WEALTH REPORT: INDIA
Chart 23: Julius Baer Lifestyle Index – Jakarta
City comparisons – JakartaOur basket of goods and services fell by 0.58% y/y in Jakarta as healthy price increases in golf club memberships (+26.0%), business class flights (+18.0%) and legal fees (+11.9%) were more than offset by a decline in tooth implants (–14.6%) and residential property (–10.7%) which carries a higher weight. Overall, the fall in prices in Jakarta were mild as compared to the region (–1.68%).
Notwithstanding, Jakarta still ranks third cheapest in our index within the region (up one level from last year). It is cheapest for hospital stays and golf club memberships and second cheapest for cars and watches. The only item where it claims top spot is for ladies’ handbags.
Source: CSG Intage, Julius Baer

(USD)
SkincareGolf clubmembership
Facial aesthetics
(Botox)
HospitalBusiness-classflights
Weddingbanquet
Hotelsuite
Toothimplant
LawyerResidentialproperty
Ladies’handbag
Watch Wine Jewellery PianoMen’ssuit
Car Cigar Ladies’shoes
min. 3,306min. 1,797,315 min. 121min. 2,826 min. 28,251 min. 156 min. 595 min. 104 min. 28,491 min. 1,487min. 3,273 min. 21,528 min. 1,278 min. 195,825min. 151 min. 818 min. 540 min. 1,255
max. 791,675max. 41,238,325 max. 1,038max. 7,782 max. 148,674 max. 923 max. 4,794 max. 888 max. 38,884 max. 3,092max. 4,078 max. 139,313 max. 3,778 max. 255,692max. 904 max. 1,590 max. 860 max. 1,537
31%33%
54%
46%
57%
52%
46%
57%
40%
26%
33%
17%
56%
39% 38%40%
57%
45%
26%
min. 157,747
max. 429,939(USD)
100%
80%
60%
40%
20%
0%
18%
0%0%
52%
9%
17%14%
0%
22% 22%25%
39%
7%
20%
0%
19%
56%
100%
48%
Jakarta Average
41
JULIUS BAER WEALTH REPORT: INDIA
Chart 23: Julius Baer Lifestyle Index – Jakarta
An important development in Indonesia in 2015 was the exemption of luxury tax from certain items which are found in our lifestyle index such as musical instruments and branded goods in order to boost household consumption and reduce overseas spending. So far this has not had a large impact on the price data of affected items in our index, suggesting that retailers had not fully passed through lower taxes on to consumers.
We are neutral on the Indonesian rupiah with a mildly depreciating outlook. While the pass–through of important reforms has lifted investor confidence somewhat, still rather weak fundamentals, such as a considerable current–account deficit, will continue to weigh on the currency.

(USD)
SkincareGolf clubmembership
Facial aesthetics
(Botox)
HospitalBusiness-classflights
Weddingbanquet
Hotelsuite
Toothimplant
LawyerResidentialproperty
Ladies’handbag
Watch Wine Jewellery PianoMen’ssuit
Car Cigar Ladies’shoes
min. 3,306min. 1,797,315 min. 121min. 2,826 min. 28,251 min. 156 min. 595 min. 104 min. 28,491 min. 1,487min. 3,273 min. 21,528 min. 1,278 min. 195,825min. 151 min. 818 min. 540 min. 1,255
max. 791,675max. 41,238,325 max. 1,038max. 7,782 max. 148,674 max. 923 max. 4,794 max. 888 max. 38,884 max. 3,092max. 4,078 max. 139,313 max. 3,778 max. 255,692max. 904 max. 1,590 max. 860 max. 1,537
31%33%
54%
46%
57%
52%
46%
57%
40%
26%
33%
17%
56%
39% 38%40%
57%
45%
26%
min. 157,747
max. 429,939(USD)
100%
80%
60%
40%
20%
0%
21%
0%
40%
13%
28%
11%
18%
100%
36%
57%
100%
18%
8%
4%0%
25%
63%
24%
Manila Average
95%
42
JULIUS BAER WEALTH REPORT: INDIA
Chart 24: Julius Baer Lifestyle Index – Manila
City comparisons – ManilaOur basket of goods and services fell by 0.62% y/y in Manila tempered by a weaker peso (–3.3%) and price declines in all but 3 items in the index, namely cars (+14.0%), men’s suits (+10.5%), golf club memberships (+8.3%) and cigars (+1.4%). This was a better performance than the region’s –1.68%.
In relative terms, Manila is the 4th cheapest city to obtain our basket of goods and services (up from 3rd cheapest previously). It remains the least expensive city to purchase a luxury high–end apartment, a segment which has seen growing interest from expatriates who are converting from lessees to unit owners, as well as overseas based Filipinos. As with years past, Manila remains one of the least expensive places to purchase branded ladies’ handbags and Armani suits, or to seek cosmetic medical procedures like botox and tooth implants.
Source: CSG Intage, Julius Baer

(USD)
SkincareGolf clubmembership
Facial aesthetics
(Botox)
HospitalBusiness-classflights
Weddingbanquet
Hotelsuite
Toothimplant
LawyerResidentialproperty
Ladies’handbag
Watch Wine Jewellery PianoMen’ssuit
Car Cigar Ladies’shoes
min. 3,306min. 1,797,315 min. 121min. 2,826 min. 28,251 min. 156 min. 595 min. 104 min. 28,491 min. 1,487min. 3,273 min. 21,528 min. 1,278 min. 195,825min. 151 min. 818 min. 540 min. 1,255
max. 791,675max. 41,238,325 max. 1,038max. 7,782 max. 148,674 max. 923 max. 4,794 max. 888 max. 38,884 max. 3,092max. 4,078 max. 139,313 max. 3,778 max. 255,692max. 904 max. 1,590 max. 860 max. 1,537
31%33%
54%
46%
57%
52%
46%
57%
40%
26%
33%
17%
56%
39% 38%40%
57%
45%
26%
min. 157,747
max. 429,939(USD)
100%
80%
60%
40%
20%
0%
21%
0%
40%
13%
28%
11%
18%
100%
36%
57%
100%
18%
8%
4%0%
25%
63%
24%
Manila Average
95%
43
JULIUS BAER WEALTH REPORT: INDIA
Chart 24: Julius Baer Lifestyle Index – Manila
Our view on the Philippines economy is neutral, as much depends on the new government’s ability to execute on announced policies. Key drivers are plans to increase deficit spending from 0.9% of GDP in 2015 to 3.0% of GDP, and infrastructure spending from an average of 2.2% in the past five years to around 5.0% in the next six years.

(USD)
SkincareGolf clubmembership
Facial aesthetics
(Botox)
HospitalBusiness-classflights
Weddingbanquet
Hotelsuite
Toothimplant
LawyerResidentialproperty
Ladies’handbag
Watch Wine Jewellery PianoMen’ssuit
Car Cigar Ladies’shoes
min. 3,306min. 1,797,315 min. 121min. 2,826 min. 28,251 min. 156 min. 595 min. 104 min. 28,491 min. 1,487min. 3,273 min. 21,528 min. 1,278 min. 195,825min. 151 min. 818 min. 540 min. 1,255
max. 791,675max. 41,238,325 max. 1,038max. 7,782 max. 148,674 max. 923 max. 4,794 max. 888 max. 38,884 max. 3,092max. 4,078 max. 139,313 max. 3,778 max. 255,692max. 904 max. 1,590 max. 860 max. 1,537
31%33%
54%
46%
57%
52%
46%
57%
40%
26%
33%
17%
56%
39% 38%40%
57%
45%
26%
min. 157,747
max. 429,939(USD)
100%
80%
60%
40%
20%
0%
25%
5%
97%
43%
10%
37%
3%
7%
66%
84%
7%
66%
100% 100%
32%
37%
3%
45%
3%
Seoul Average
44
JULIUS BAER WEALTH REPORT: INDIA
Chart 25: Julius Baer Lifestyle Index – Seoul
City comparisons – SeoulOur basket of goods and services fell by 4.52% y/y in Seoul affected by local currency weakness (–2.3%) and large corrections in the prices of certain items such as tooth implants (–33.7%), botox treatments (–18.6%) and golf club memberships (–12.3%). This was a more severe fall than the average for the region (–1.68%).
Seoul has fallen to the 5th most expensive from 4th a year ago based on our methodology. It is the most expensive to purchase an Armani suit, a diamond ring or simply as a point of disembarkation for long–haul business class flights to New York and London. Yet in certain areas such as cosmetic/elective procedures in plastic surgery and dentistry, prices have declined due to heightened competition.
Source: CSG Intage, Julius Baer

(USD)
SkincareGolf clubmembership
Facial aesthetics
(Botox)
HospitalBusiness-classflights
Weddingbanquet
Hotelsuite
Toothimplant
LawyerResidentialproperty
Ladies’handbag
Watch Wine Jewellery PianoMen’ssuit
Car Cigar Ladies’shoes
min. 3,306min. 1,797,315 min. 121min. 2,826 min. 28,251 min. 156 min. 595 min. 104 min. 28,491 min. 1,487min. 3,273 min. 21,528 min. 1,278 min. 195,825min. 151 min. 818 min. 540 min. 1,255
max. 791,675max. 41,238,325 max. 1,038max. 7,782 max. 148,674 max. 923 max. 4,794 max. 888 max. 38,884 max. 3,092max. 4,078 max. 139,313 max. 3,778 max. 255,692max. 904 max. 1,590 max. 860 max. 1,537
31%33%
54%
46%
57%
52%
46%
57%
40%
26%
33%
17%
56%
39% 38%40%
57%
45%
26%
min. 157,747
max. 429,939(USD)
100%
80%
60%
40%
20%
0%
25%
5%
97%
43%
10%
37%
3%
7%
66%
84%
7%
66%
100% 100%
32%
37%
3%
45%
3%
Seoul Average
45
JULIUS BAER WEALTH REPORT: INDIA
Chart 25: Julius Baer Lifestyle Index – Seoul
We are mildly positive on the Korean economy and currency as despite concerns about large household debt, the Bank of Korea is likely to cut interest rates further in the second half of 2016. Fiscal support is underway too and this should stabilise growth. In addition, fundamentals remain strong with the nation’s large current–account surplus while valuation is attractive.

(USD)
SkincareGolf clubmembership
Facial aesthetics
(Botox)
HospitalBusiness-classflights
Weddingbanquet
Hotelsuite
Toothimplant
LawyerResidentialproperty
Ladies’handbag
Watch Wine Jewellery PianoMen’ssuit
Car Cigar Ladies’shoes
min. 3,306min. 1,797,315 min. 121min. 2,826 min. 28,251 min. 156 min. 595 min. 104 min. 28,491 min. 1,487min. 3,273 min. 21,528 min. 1,278 min. 195,825min. 151 min. 818 min. 540 min. 1,255
max. 791,675max. 41,238,325 max. 1,038max. 7,782 max. 148,674 max. 923 max. 4,794 max. 888 max. 38,884 max. 3,092max. 4,078 max. 139,313 max. 3,778 max. 255,692max. 904 max. 1,590 max. 860 max. 1,537
31%33%
54%
46%
57%
52%
46%
57%
40%
26%
33%
17%
56%
39% 38%40%
57%
45%
26%
min. 157,747
max. 429,939(USD)
100%
80%
60%
40%
20%
0%
22%
1%0%
4%1%
37%
60%
4%
97%
0% 0%
49%
68%
36%
0%
39%
14%
58%
0%
Kuala Lumpur Average
46
JULIUS BAER WEALTH REPORT: INDIA
Chart 26: Julius Baer Lifestyle Index – Kuala Lumpur
City comparisons – Kuala LumpurOur basket of goods and services fell by 2.93% y/y in Kuala Lumpur as the Malaysian ringgit depreciated significantly (–6.5%) against the US dollar and items such as business class flights (–25.8%) and legal fees (–28.5%) fell by more than 20% y/y. Overall, price momentum underperformed the average price increase of –1.68% across the cities.
Within the region, Kuala Lumpur ranks as the second least expensive city down two notches from 2014/2015 where it ranked 8th overall. Kuala Lumpur offers the best value for business class flights, luxury watches, wine, pianos and ladies’ shoes where it is the cheapest in Asia to purchase these items.
Source: CSG Intage, Julius Baer

(USD)
SkincareGolf clubmembership
Facial aesthetics
(Botox)
HospitalBusiness-classflights
Weddingbanquet
Hotelsuite
Toothimplant
LawyerResidentialproperty
Ladies’handbag
Watch Wine Jewellery PianoMen’ssuit
Car Cigar Ladies’shoes
min. 3,306min. 1,797,315 min. 121min. 2,826 min. 28,251 min. 156 min. 595 min. 104 min. 28,491 min. 1,487min. 3,273 min. 21,528 min. 1,278 min. 195,825min. 151 min. 818 min. 540 min. 1,255
max. 791,675max. 41,238,325 max. 1,038max. 7,782 max. 148,674 max. 923 max. 4,794 max. 888 max. 38,884 max. 3,092max. 4,078 max. 139,313 max. 3,778 max. 255,692max. 904 max. 1,590 max. 860 max. 1,537
31%33%
54%
46%
57%
52%
46%
57%
40%
26%
33%
17%
56%
39% 38%40%
57%
45%
26%
min. 157,747
max. 429,939(USD)
100%
80%
60%
40%
20%
0%
22%
1%0%
4%1%
37%
60%
4%
97%
0% 0%
49%
68%
36%
0%
39%
14%
58%
0%
Kuala Lumpur Average
47
JULIUS BAER WEALTH REPORT: INDIA
Chart 26: Julius Baer Lifestyle Index – Kuala Lumpur
Our view on the Malaysian economy is favourable despite some risks such as a further decline in oil prices which still account for a large part of public revenues. The economy has diversified from commodities and the introduction of GST in 2015 has helped to broaden the revenue base. We expect a mild depreciation for the ringgit over the course of the next year supported by improving trade surplus and foreign–exchange reserves.

(USD)
(USD)
SkincareGolf clubmembership
Facial aesthetics
(Botox)
HospitalBusiness-classflights
Weddingbanquet
Hotelsuite
Toothimplant
LawyerResidentialproperty
Ladies’handbag
Watch Wine Jewellery PianoMen’ssuit
Car Cigar Ladies’shoes
100%
80%
60%
40%
20%
0%min. 3,306min. 1,797,315 min. 121min. 2,826 min. 28,251 min. 156 min. 595 min. 104 min. 28,491 min. 1,487min. 3,273 min. 21,528 min. 1,278 min. 195,825min. 151 min. 818 min. 540 min. 1,255
max. 791,675max. 41,238,325 max. 1,038max. 7,782 max. 148,674 max. 923 max. 4,794 max. 888 max. 38,884 max. 3,092max. 4,078 max. 139,313 max. 3,778 max. 255,692max. 904 max. 1,590 max. 860 max. 1,537
31%33%
54%
46%
57%
52%
46%
57%
40%
26%
33%
17%
56%
39% 38%40%
57%
45%
26%
min. 157,747
max. 429,939
53%
0%
18%
0%
29%
45%41%
0%
12%
91%
75%
80%
28%
38%
100%
59%
15%
71%
3%
Bangkok Average
48
JULIUS BAER WEALTH REPORT: INDIA
Chart 27: Julius Baer Lifestyle Index – Bangkok
City comparisons – BangkokOur basket of goods and services rose by 2.21% y/y in Bangkok as generally positive price performance offset a weaker Thai baht. We saw steady price gains in most items in our basket such as skincare (+11.2%), tooth implants (+9.8%) with the exception of the luxury cars item (–26.5%).
Bangkok currently ranks as the 7th most expensive city in Asia for luxurious living, which is two notches below last year’s position. While big ticket items like property (ranked 11th most expensive), wedding banquets (ranked 11th) and golf club memberships (ranked 11th) are excellent value in Bangkok, it is a price leader for certain discretionary items such as pianos, cars, jewellery and wine largely due to high import taxes on luxury goods.
Source: CSG Intage, Julius Baer

(USD)
(USD)
SkincareGolf clubmembership
Facial aesthetics
(Botox)
HospitalBusiness-classflights
Weddingbanquet
Hotelsuite
Toothimplant
LawyerResidentialproperty
Ladies’handbag
Watch Wine Jewellery PianoMen’ssuit
Car Cigar Ladies’shoes
100%
80%
60%
40%
20%
0%min. 3,306min. 1,797,315 min. 121min. 2,826 min. 28,251 min. 156 min. 595 min. 104 min. 28,491 min. 1,487min. 3,273 min. 21,528 min. 1,278 min. 195,825min. 151 min. 818 min. 540 min. 1,255
max. 791,675max. 41,238,325 max. 1,038max. 7,782 max. 148,674 max. 923 max. 4,794 max. 888 max. 38,884 max. 3,092max. 4,078 max. 139,313 max. 3,778 max. 255,692max. 904 max. 1,590 max. 860 max. 1,537
31%33%
54%
46%
57%
52%
46%
57%
40%
26%
33%
17%
56%
39% 38%40%
57%
45%
26%
min. 157,747
max. 429,939
53%
0%
18%
0%
29%
45%41%
0%
12%
91%
75%
80%
28%
38%
100%
59%
15%
71%
3%
Bangkok Average
49
JULIUS BAER WEALTH REPORT: INDIA
Chart 27: Julius Baer Lifestyle Index – Bangkok
Following in the footsteps of Indonesia, the Thai customs department is considering reducing import duties on luxury goods to boost spending at home and give a fillip to the tourism industry. If this is implemented, we expect Bangkok’s ranking in our index to fall closer to peers such as Manila and Jakarta within ASEAN given comparable living costs.

(USD)
SkincareGolf clubmembership
Facial aesthetics
(Botox)
HospitalBusiness-classflights
Weddingbanquet
Hotelsuite
Toothimplant
LawyerResidentialproperty
Ladies’handbag
Watch Wine Jewellery PianoMen’ssuit
Car Cigar Ladies’shoes
min. 3,306min. 1,797,315 min. 121min. 2,826 min. 28,251 min. 156 min. 595 min. 104 min. 28,491 min. 1,487min. 3,273 min. 21,528 min. 1,278 min. 195,825min. 151 min. 818 min. 540 min. 1,255
max. 791,675max. 41,238,325 max. 1,038max. 7,782 max. 148,674 max. 923 max. 4,794 max. 888 max. 38,884 max. 3,092max. 4,078 max. 139,313 max. 3,778 max. 255,692max. 904 max. 1,590 max. 860 max. 1,537
31%33%
54%
46%
57%
52%
46%
57%
40%
26%
33%
17%
56%
39% 38%40%
57%
45%
26%
min. 157,747
max. 429,939(USD)
100%
80%
60%
40%
20%
0%
32%
10%
38%
100% 100% 100%
40%
45%
0%
57%
42%
82%
56%
31%
25%
21%
0%
18%
100%
Tokyo Average
50
JULIUS BAER WEALTH REPORT: INDIA
Chart 28: Julius Baer Lifestyle Index – Tokyo
City comparisons – TokyoOur basket of goods and services rose by the most in Tokyo (+16.14%) y/y due primarily to the surging yen (+18.4%). However, stripping out the Fx component, we still saw high double–digit increases in the price of business class flights, hotel suites, and men’s suits.
As a result, Tokyo rises 3 notches to capture the position of 4th most expensive city in Asia. For individual items, Tokyo is the most expensive city to host a wedding banquet, stay at a top–end hotel, go for a tooth implant and procure ladies’ shoes. On the other hand, it is one of the least expensive for legal fees, cigars and luxury cars.
Source: CSG Intage, Julius Baer

(USD)
SkincareGolf clubmembership
Facial aesthetics
(Botox)
HospitalBusiness-classflights
Weddingbanquet
Hotelsuite
Toothimplant
LawyerResidentialproperty
Ladies’handbag
Watch Wine Jewellery PianoMen’ssuit
Car Cigar Ladies’shoes
min. 3,306min. 1,797,315 min. 121min. 2,826 min. 28,251 min. 156 min. 595 min. 104 min. 28,491 min. 1,487min. 3,273 min. 21,528 min. 1,278 min. 195,825min. 151 min. 818 min. 540 min. 1,255
max. 791,675max. 41,238,325 max. 1,038max. 7,782 max. 148,674 max. 923 max. 4,794 max. 888 max. 38,884 max. 3,092max. 4,078 max. 139,313 max. 3,778 max. 255,692max. 904 max. 1,590 max. 860 max. 1,537
31%33%
54%
46%
57%
52%
46%
57%
40%
26%
33%
17%
56%
39% 38%40%
57%
45%
26%
min. 157,747
max. 429,939(USD)
100%
80%
60%
40%
20%
0%
32%
10%
38%
100% 100% 100%
40%
45%
0%
57%
42%
82%
56%
31%
25%
21%
0%
18%
100%
Tokyo Average
51
JULIUS BAER WEALTH REPORT: INDIA
Chart 28: Julius Baer Lifestyle Index – Tokyo
Given exceptional movements in the currency during our measurement period, the price increases we saw this year may not be sustained. This is supported by our bearish view of the Japanese yen over a 12–month time frame, as we expect the return of deflationary threats to force the Bank of Japan to expand its policy further preventing the yen from strengthening short term, weakening it in the longer term.
On the plus side, however, the upcoming Olympics promises to raise Tokyo’s profile quite substantially for travellers into the medium term. Non–resident spending will likely see a considerable boost into the medium term as Tokyo enhances its infrastructure from already high levels, to accommodate more visitors.


53
JULIUS BAER WEALTH REPORT: INDIA
ARISING ASIA – BEAUTY CAPITAL
• Urbanisationandanageingpopulationaredrivingtheworldwidebeautymarket.• Asiamakesup36%oftheglobalbeautymarketanditisexpectedtogrow4.5%everyyearuntil2019,
far faster than the global market.• ChinaisexpectedtoovertakeJapanasthesecondlargestpremiumbeautymarketaftertheUSby2018.• PremiumskincareisoneofthefastestgrowingsegmentswithinAsialedbyChinaasconsumersbecome
more willing to invest into higher–end products and expanding skincare regimes.
IntroductionBeauty is a modern obsession. The average man or woman in modern society spends 30–40 minutes in a typical day washing, dressing, and grooming himself or herself. A survey by Euromonitor across a number of major markets finds no discernible differences in terms of time spent on beauty routines.
We not only spend time enhancing our appearance; we spend large sums of money on it too. The global beauty market reached a size of USD 229 bn in 2015 and continues to grow at a steady rate. In this edition
of the Wealth Report: Asia we examine the beauty market with a specific focus on the Asian consumer and premium skincare.
Size of the global beauty marketThe size of the global beauty market reached EUR 203 bn (USD 229 bn), recording growth of 3.9% in 2015, in line with the average of 3.9% observed in the past decade. The market continues to expand steadily and has proved resilient even during times of tough economic conditions, reporting positive growth even during the Lehman crisis.
Chart 1: Daily grooming time in selected countries (2014)
Source: Euromonitor

54
JULIUS BAER WEALTH REPORT: INDIA
Chart 2: Global cosmetics industry market growth
Chart 3: Global cosmetics market segmentation by products (2015)
Chart 4: Global cosmetics market segmentation by geography (2015)
Source: L’Oreal Annual Report 2015
Source: L’Oreal Annual Report 2015 Source: L’Oreal Annual Report 2015
Beauty market at a glanceBy product segment, skincare and hair care account for more than half of the beauty market while by geography, Asia continues to dominate demand at 36%. In the next decade, every region in the world is expected to grow with China, US, Brazil, India and Japan expected to be the top five markets.
Skincare accounts for 36% of the beauty market, the largest by far and is expected to remain so. Global sales for skincare are expected to exceed USD 131 bn by 2019 mainly driven by emerging markets in Asia including China which will account for nearly 60% of skincare’s value growth by 2019.

Markets 2000(USD m)
2005(USD m)
2010(USD m)
2011(USD m)
2012(USD m)
2013(USD m)
2014(USD m)
2000–14 CAGR (%)
China 7,629 13,951 30,134 35,540 39,914 44,229 47,806 14.0 Japan 32,637 34,658 43,806 47,204 47,457 39,259 37,116 0.9 South Korea 4,302 6,164 7,545 8,682 9,228 10,058 11,081 7.0 US 54,459 63,592 68,020 71,056 73,459 74,861 76,276 2.4
55
JULIUS BAER WEALTH REPORT: INDIA
China: Slowly rising to the topIn the global beauty market, China ranks second, having exceeded Japan in US dollar terms in 2013,
following the depreciation of the Japanese yen. US remains the global leader but it is possible that China could overtake the US in the next decade.
Source: CLSA, Euromonitor
China has already assumed the mantle as the leading global consumer of skincare products, having surpassed the US within the past decade and having overtaken Japan in 2013. Within China’s beauty
market, half of the total revenue comes from skincare, which has seen a 14.0% compound annual growth rate (CAGR) since 2015, a faster growth rate than the overall beauty industry.
Chart 5: Historical growth of selected beauty markets
Chart 6: Beauty market by geography
Source: CLSA, Euromonitor

56
JULIUS BAER WEALTH REPORT: INDIA
Key demand drivers Emerging Asian markets: Urbanisation Urbanisation is a key driver behind beauty product consumption. Higher population density in urban areas facilitates product distribution. Demand for beauty products also tend to rise alongside a rise in disposable income and increased social interaction. Within Asia, India and China have significant potential for greater urbanisation. In the past decade, China grew its urbanisation rate by almost 50%. Yet this is still 35% below the level of developed countries. India’s is even lower, but growth in urbanisation is occuring at a slower pace.
Developed markets: Ageing Population In contrast to emerging markets, an ageing population is a more important driver for the beauty market in the US and Western Europe. By 2017, approximately half of the population in the US will be 50 years or older thereby controlling 70 percent of the country’s disposable income. Worldwide, the spending power of this >50–year age group is expected to reach USD 15 trn by 20201.
Global beauty market growth by segmentNatural products: Industry players have expanded their portfolios into natural products driven by consumers’ and manufacturers’ interest to be more environmentally responsible, as well as public scrutiny
over the safety of ingredients. While natural products first debuted in the skincare product segment, they have now expanded to other segments of the beauty industry.
Men’s products: There has been an acceleration in demand for men’s products in the past few years led by Asia (which accounts for two–thirds of global demand). However, the market for men’s skincare is still miniscule compared to the women’s skincare market at roughly 3%, implying significant upside potential2.
Premiumisation: As consumer concern for personal appearance grows, demand for more sophisticated ingredient formulations and efficacious solutions is increasing. This is particularly noticeable in skincare which is the most valuable category in terms of growth potential in the premium space. Strong demand from Asia, Latin America and North America is expected to add over USD 5 bn in new sales to this segment between 2012 and 20173.
Focus on the premium beauty marketThe growth of the premium beauty market is expected to generate a quarter of the growth for the global beauty industry over the next five years largely driven by China which is expected to overtake Japan as the second largest premium beauty market after the US by 2018.
Source: Euromonitor
Chart 7: Premium beauty vs mass beauty growth
1 Source: Bank of America Merrill Lynch2 Source: Ernst & Young3 Source: Euromonitor

57
JULIUS BAER WEALTH REPORT: INDIA
Premium beauty is forecasted to grow slightly faster than mass beauty, with a 3% CAGR up to 2019. Companies which focus on premium beauty products still rely on developed markets for the bulk of their growth. However, the emerging markets contribution continues to increase with China, the largest growth contributor, expected to add USD 5.2 bn in retail value by 2019.
Premium skincare The premium skincare market can be roughly divided into masstige, prestige and ultra–prestige segments which are thus defined by price, retail availability and marketing. Ultra–prestige segments are expensive and exclusive with low accessibility at more than ten times the price point of a mass–market brand. Prestige brands are less exclusive than ultra–prestige brands and can be found at five to ten times the price point of mass–market. Masstige brands, including dermatologist brands and other less exclusive brands, typically retail at two to five times the price point of a mass–market product.
In the US market, the premium skincare market has grown at a CAGR of 5.5% over the past decade as more customers are willing to invest money into skincare and expanding skincare regimes, driving growth in the ultra–prestige and prestige segments.
In China, the premium skincare market has grown to comprise a quarter of the total skincare market up from 17% in 2001. This is below the share in other Asian markets such as Hong Kong (72%), Taiwan (59%), South Korea (57%) and Japan (55%)4. The high numbers in Asia stand in contrast to the proportion in the West at only 20% in Germany, 30% in the US, 44% in Canada and 48% in France. Looking at other Asian markets there is significant growth potential for the Chinese market.
Impact of exogenous factors (currency and regulation) Despite a slowdown in the macro–environment, global luxury demand for beauty products is still growing, sustained by tourist consumption, which has been heavily influenced by currency fluctuations and regulations. Consumption and nationality are mutually exclusive in the luxury market. China continues to be the top consumer country (a third of the total market), but Chinese customers tend to consume outside their home country. Europe and Japan benefited from this trend in 2015, with Japan growing the fastest followed by Europe.
Chart 8: Premium vs mass proportion and historic vs forecast (2009–2019)
Source: Euromonitor
4 Source: Mirae Asset Financial Group

58
JULIUS BAER WEALTH REPORT: INDIA
What is driving growth for the Asian beauty market?The growing consciousness towards maintaining one’s personal appearance and a considerable increase in disposable incomes are the two major drivers of growth for the beauty market in the Asia Pacific region.
How is the Asian beauty market different?One area where Asian consumers tend to spend or invest more than those on other continents is on skincare because of the increased cultural importance of having well–maintained skin. For example, skincare accounts for roughly 70% of the Chinese beauty market whereas it is only 35% in North America, 32% in Brazil, or 37% in Russia5.
Asians also tend to spend more on products that have higher price points (premium or prestige products) with added functions (e.g. whitening, anti–ageing, anti–pollution). An Asian woman, on average, will use eight different skincare products each day, including special products like whitening creams.
In addition, local cosmetic players in Asia are generally very strong compared to those in other emerging markets. This is because many Asian countries have
solid competitiveness in manufacturing, and local companies usually have better distribution networks.
‘Asianification’ of the beauty marketThere is a growing number of Asia–inspired products and innovation present already in international markets and the Asianification trend is expected to grow stronger and deliver more product concepts from the region.
The Korean waveWithin Asia, South Korea is one of the most innovative beauty markets with local companies that pioneered BB and alphabet creams within the skincare category. Korean brands have also been expanding internationally. In 2015, Korean exports to China grew more than 300% y/y in value terms (Japanese exports increased 34%)6. Korean cosmetics companies have gained popularity in China due to the surge in Chinese tourism as well as aggressive product marketing by Korean companies. One company which has been particularly successful is Amorepacific which has popular brands such as Innisfree and Sulwhasoo. The latter combines Asian medicinal herbs with advanced modern science as its selling point in Western markets.
Chart 9: Luxury goods demand growth by nationality and area (2015)
Source: Business Monitor International
5 Source: Mirae Asset Financial Group6 Source: China Customs

59
JULIUS BAER WEALTH REPORT: INDIA
Source: Euromonitor
Chinese consumers today shop globallyChinese consumers are one of the biggest drivers of luxury spending worldwide. They spend the most globally (31%) on luxury goods, followed by the Americans (24%) and the Europeans (18%)7. 80% of luxury shopping by the Chinese is done abroad with only about 20% in Mainland China. Travel destinations for Chinese luxury shoppers tend to respond to currency fluctuations as they take advantage of favourable price gaps overseas for example in Japan, Korea or Europe.
Growth areas in ChinaThe most important growth areas in China today are e–commerce, speciality stores and Asian brands.
E–commerceAs a growing number of customers shop on the internet, and e–commerce platforms (like Taobao and JD.com) have matured, e–commerce has delivered the highest growth in the past three years, with a CAGR of 37%8. As seen in chart 11, internet retailing as a sales channel for beauty products has grown from 1% to 16% in the five years since 2009. This is partly due to the structural decline faced by general merchandisers and department stores and this trend is likely to continue.
China is one of the fastest growing beauty markets
Chart 10: Projected growth of total beauty and skincare market for 2015–2019 (CAGR) (2015–2019)
Focus on the Chinese beauty marketThe Chinese beauty market is the second–largest in the world with a size of USD 47 bn in 2014 or a CAGR of 14% since 2000. Beauty products remain highly discretionary items where there is still a low annual cosmetics consumption per capita of USD 35, one–eighth that of Japan. As incomes rise, consumers
become more willing to spend money on beauty either by purchasing more product types or more expensive products. According to Euromonitor, the Chinese beauty market is expected to grow at a CAGR of 10.3% from 2015 to 2019 and reach CNY 491 bn (USD 77 bn) in 2019.
7 Source: Bain & Co.8 Source: iResearch
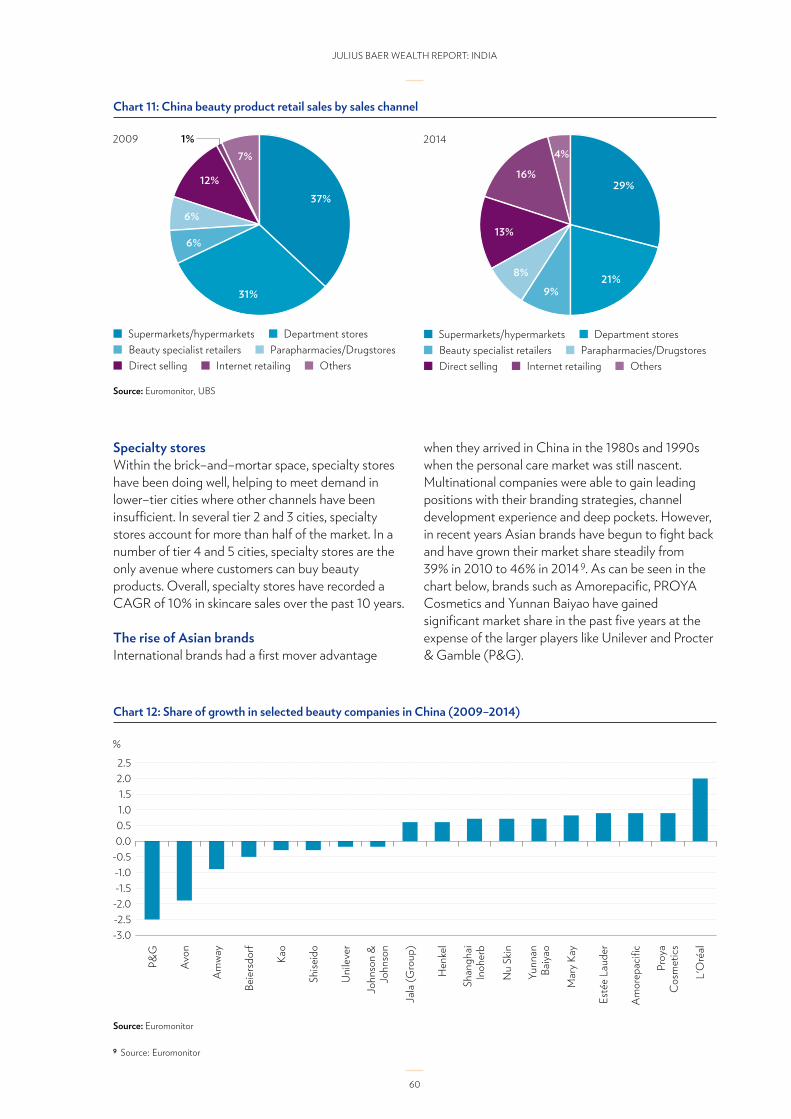
Chart 12: Share of growth in selected beauty companies in China (2009–2014)
60
JULIUS BAER WEALTH REPORT: INDIA
Specialty stores Within the brick–and–mortar space, specialty stores have been doing well, helping to meet demand in lower–tier cities where other channels have been insufficient. In several tier 2 and 3 cities, specialty stores account for more than half of the market. In a number of tier 4 and 5 cities, specialty stores are the only avenue where customers can buy beauty products. Overall, specialty stores have recorded a CAGR of 10% in skincare sales over the past 10 years.
The rise of Asian brandsInternational brands had a first mover advantage
when they arrived in China in the 1980s and 1990s when the personal care market was still nascent. Multinational companies were able to gain leading positions with their branding strategies, channel development experience and deep pockets. However, in recent years Asian brands have begun to fight back and have grown their market share steadily from 39% in 2010 to 46% in 20149. As can be seen in the chart below, brands such as Amorepacific, PROYA Cosmetics and Yunnan Baiyao have gained significant market share in the past five years at the expense of the larger players like Unilever and Procter & Gamble (P&G).
Source: Euromonitor
Chart 11: China beauty product retail sales by sales channel
Source: Euromonitor, UBS
9 Source: Euromonitor
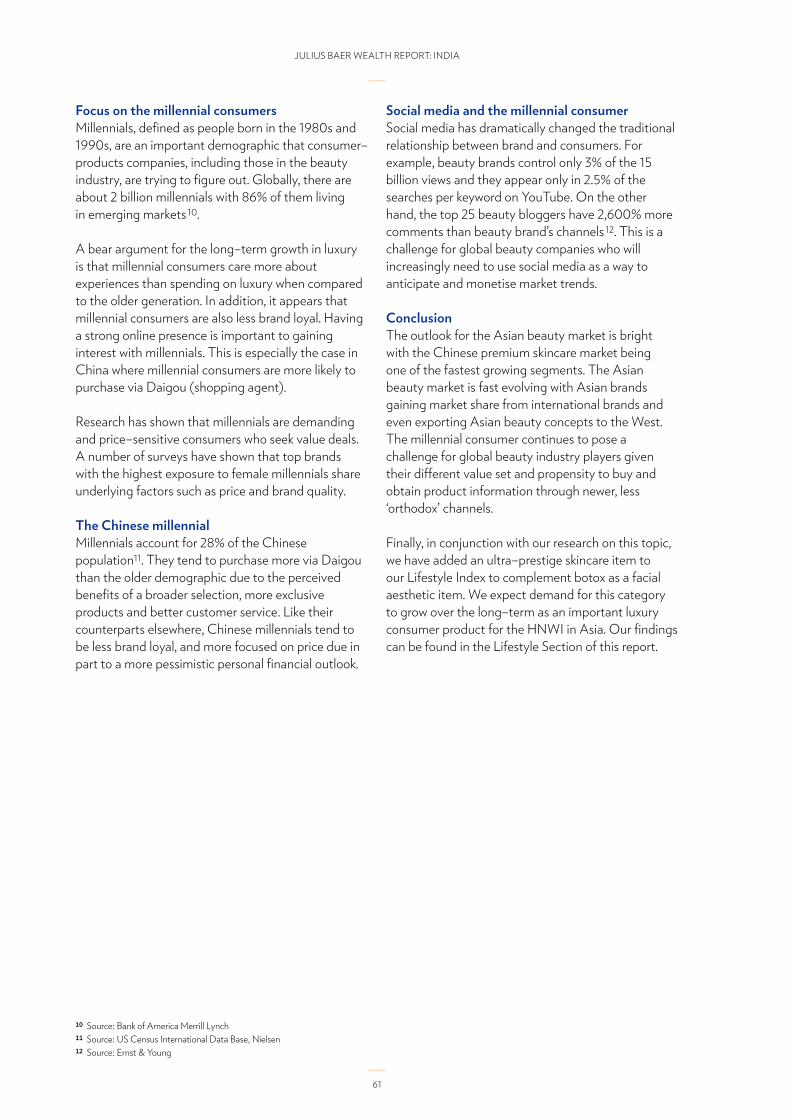
61
JULIUS BAER WEALTH REPORT: INDIA
Focus on the millennial consumers Millennials, defined as people born in the 1980s and 1990s, are an important demographic that consumer–products companies, including those in the beauty industry, are trying to figure out. Globally, there are about 2 billion millennials with 86% of them living in emerging markets10.
A bear argument for the long–term growth in luxury is that millennial consumers care more about experiences than spending on luxury when compared to the older generation. In addition, it appears that millennial consumers are also less brand loyal. Having a strong online presence is important to gaining interest with millennials. This is especially the case in China where millennial consumers are more likely to purchase via Daigou (shopping agent).
Research has shown that millennials are demanding and price–sensitive consumers who seek value deals. A number of surveys have shown that top brands with the highest exposure to female millennials share underlying factors such as price and brand quality.
The Chinese millennial Millennials account for 28% of the Chinese population11. They tend to purchase more via Daigou than the older demographic due to the perceived benefits of a broader selection, more exclusive products and better customer service. Like their counterparts elsewhere, Chinese millennials tend to be less brand loyal, and more focused on price due in part to a more pessimistic personal financial outlook.
Social media and the millennial consumer Social media has dramatically changed the traditional relationship between brand and consumers. For example, beauty brands control only 3% of the 15 billion views and they appear only in 2.5% of the searches per keyword on YouTube. On the other hand, the top 25 beauty bloggers have 2,600% more comments than beauty brand’s channels12. This is a challenge for global beauty companies who will increasingly need to use social media as a way to anticipate and monetise market trends.
ConclusionThe outlook for the Asian beauty market is bright with the Chinese premium skincare market being one of the fastest growing segments. The Asian beauty market is fast evolving with Asian brands gaining market share from international brands and even exporting Asian beauty concepts to the West. The millennial consumer continues to pose a challenge for global beauty industry players given their different value set and propensity to buy and obtain product information through newer, less ‘orthodox’ channels.
Finally, in conjunction with our research on this topic, we have added an ultra–prestige skincare item to our Lifestyle Index to complement botox as a facial aesthetic item. We expect demand for this category to grow over the long–term as an important luxury consumer product for the HNWI in Asia. Our findings can be found in the Lifestyle Section of this report.
10 Source: Bank of America Merrill Lynch11 Source: US Census International Data Base, Nielsen12 Source: Ernst & Young

62
JULIUS BAER WEALTH REPORT: INDIA
SINGAPORE MACRO
Singapore has regained much of the ground it lost since the crisis of 2008. Singapore’s annual average nominal GDP growth rate in the new millennium (2000–08) was 6.4%. Since 2008, the growth rate has fallen somewhat to 5.8%. The story is similar with respect to real GDP growth rates. If anything, the gap is smaller at 5.5% and 5.1% respectively.
In the 2011 Singapore General Elections, the ruling People’s Action Party returned to office but with a reduced mandate. In 2015, however, the Party won again and with a much larger vote share than it did in 2011. The policies that were put in place since 2011, however, have stayed. The annual average growth rates of the economy in the last four years up to 2015 at 3.8% and 3.4% in nominal and real terms respectively are reasonable growth rates for an advanced economy with a rapidly ageing population and with tight controls on influx of foreign labour. Singapore is managing its transition to that of mature and ageing economy well.
Prudent management Singapore has restricted inflows on immigrants since 2010–11. At the same time, mindful of the consequences of a property bubble going bust, the government and the Monetary Authority of Singapore (MAS) have tightened loan norms and
raised stamp duties on home purchases. Both buyers and sellers now have to pay stamp duty. In fact, these norms were gradually introduced from 2009 onwards. Property speculation has waned considerably along with real demand as immigrants were the biggest contributors to real demand. Excess supply of housing too has played part in the property slump that has endured for quite some time. Home prices have dropped 9% from the peak in 2013 and transaction volumes have halved. Yet the decline has been orderly. Relatively high down payment from the buyers (at least 20%) has shielded bank balance sheets from the deterioration in asset values.
Labour market concernsWage growth in Singapore has been resilient (see chart 1). Total wage growth has averaged 5.2% per annum since the crisis similar to that of 5.1% in the years preceding the crisis. These figures are nominal and include employers’ contribution to the Central Provident Fund. Wages at the bottom fifth percentile too have grown more strongly than before. For the six years ending 2014, the annual average wage growth has been 4.7% compared to a meagre 0.9% in the eight years up to 2008. Real wages are rising even faster. The consumer price index has been contracting steadily for a long time. Up to June 2016, the contraction in CPI (y/y change) had lasted 20 months.

63
JULIUS BAER WEALTH REPORT: INDIA
Yet there are some areas of labour anxiety as mentioned in the biannual Macro–Economic Review prepared by MAS:
“Residents who have been laid off are finding it increasingly difficult to re–enter the workforce within six months, with the re–entry rate falling steadily since March 2015 to 51% as of December 2015. This was particularly the case for PMETs1. While about half the job openings in Q4 2015 were PMET–related, only 48% of resident PMETs made redundant re–entered
the workforce within six months, much lower than clerical, sales & service workers (63%) and production & transport operators, cleaners & labourers (53%).”
Redundancies have been rising steadily since 2010. Redundancies include retrenchment and early release of contract workers. They spiked in 2008 and in 2009 and came down sharply in 2010. However, since then they have been rising steadily, reaching a 15,580 in 2015 (see chart 2).
Chart 1: Total nominal wage growth
Source: Ministry of Manpower, Singapore
1 PMET stands for Professionals, Managers, Executives and Technicians.
Chart 2: Redundancy
Source: Ministry of Manpower, Singapore

64
JULIUS BAER WEALTH REPORT: INDIA
Low levels of economic dynamism are evident too. Formation of new businesses has yet to recover. It has been down in the last five months up to June 2016 (see chart 3). Clearly, cost of doing business in
Singapore is a big factor. This statistic accords with anecdotal reports of businesses relocating out of Singapore for cost reasons.
participation rate is up from 14.3% in 2005 to 25.8% in 2015. This is not necessarily a bad thing. They keep themselves economically independent and mentally healthy too as they are gainfully employed in some activity. Yet there is a skills mismatch for an economy that aspires to become productivity and knowledge based rather than rely on factor accumulation as before. This is a worldwide phenomenon with no straightforward answers.
Much of this is intentional. The Singapore government is encouraging uncompetitive businesses to close down as it is keen to raise Singapore’s capital and labour productivity. This will not be a painless transition. A tight immigration policy has drawn senior citizens to the labour force. Participation rate for people above 55 in the labour force has risen (see chart 4). For those in the age group 55–64, participation rate has gone up from 56.3% in 2005 to 69.5% in 2015. For those above 65 years, the
Chart 3: Net new business formation (6–month moving average)
Source: Department of Statistics, Government of Singapore

65
JULIUS BAER WEALTH REPORT: INDIA
Chart 4: Labour force participation rate by age group
Source: Department of Statistics, Government of Singapore
Global headwindsWhile Singapore’s costs and tight labour market are important factors, the main challenge has come from a stagnant global economy given its export–oriented economy. The International Monetary Fund (IMF)has been downgrading its global growth forecasts year after year (see chart 5). Forecasts for 2016 have been lowered by the IMF. Monetary stimulus that has been applied by central banks around the world has not yet returned the world economy to sustained growth.
The stimulus has sustained asset prices more successfully, though.
Consequently, export growth from emerging Asia in volume terms has been declining. Data available up to February 2016 show that export growth from emerging Asia turned negative in March of last year and has persisted since then, except for a break in June 2015 (see chart 5).

66
JULIUS BAER WEALTH REPORT: INDIA
Singapore dollar as a store of value As a small, open economy, Singapore remains vulnerable to a downturn in the world economy as policymakers elsewhere in advanced economies appear determined to repeat the boom–bust cycles. That is a non–diversifiable risk for Singapore. However, the important point is that Singapore is managing its domestic risks quite ably.
Under the circumstances, Singapore has opted to manage the difficult transition through restructuring and deflation in the prices of goods, services and
assets rather than through asset price reflation. That is commendable. Indeed, Singapore’s gently deflating property market has kept it shielded thus far from any systemic risks.
A counterfactual scenario would have been to persist with stimulus with painful and debilitating consequences down the road. Therefore, Singapore’s strategy of managing the transition through income support for lower income families while the rest of the economy restructures appears sound. That marks out the Singapore dollar as a long–term store of value.
Chart 5: Emerging Asia export growth (seasonally adjusted. Fixed base 2005=100)
Source: CPB Netherlands Bureau for Economic Policy Analysis

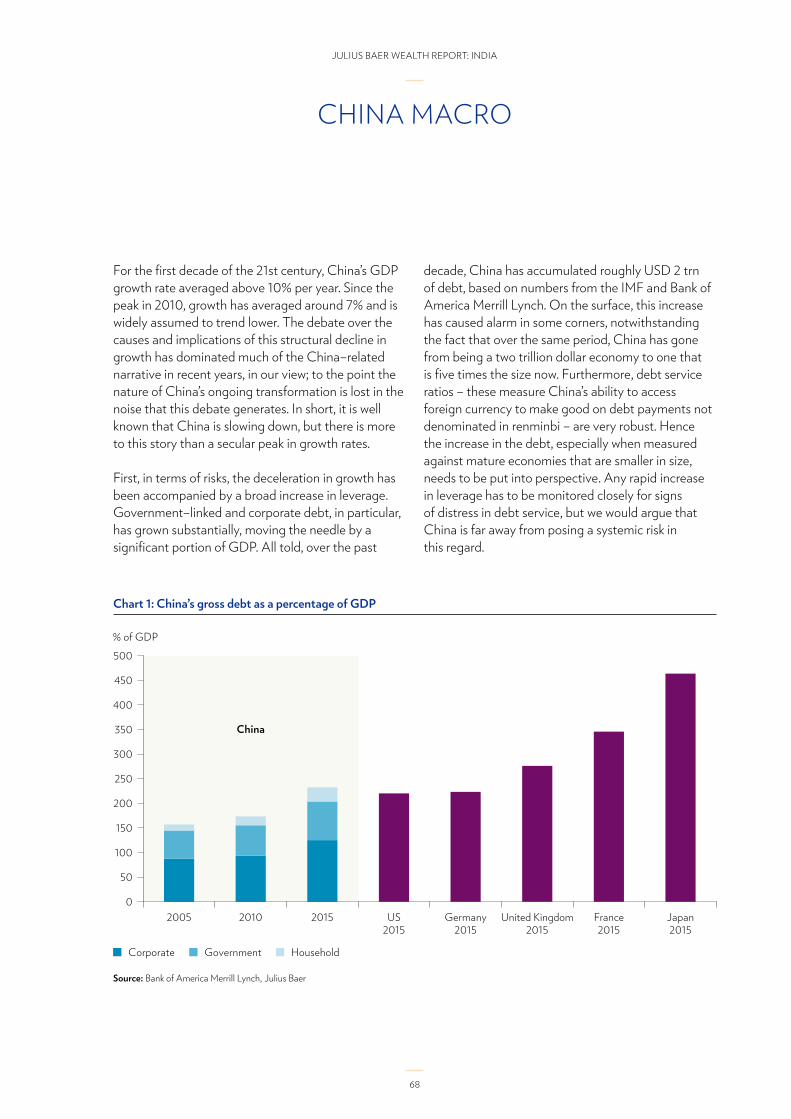
68
JULIUS BAER WEALTH REPORT: INDIA
For the first decade of the 21st century, China’s GDP growth rate averaged above 10% per year. Since the peak in 2010, growth has averaged around 7% and is widely assumed to trend lower. The debate over the causes and implications of this structural decline in growth has dominated much of the China–related narrative in recent years, in our view; to the point the nature of China’s ongoing transformation is lost in the noise that this debate generates. In short, it is well known that China is slowing down, but there is more to this story than a secular peak in growth rates.
First, in terms of risks, the deceleration in growth has been accompanied by a broad increase in leverage. Government–linked and corporate debt, in particular, has grown substantially, moving the needle by a significant portion of GDP. All told, over the past
decade, China has accumulated roughly USD 2 trn of debt, based on numbers from the IMF and Bank of America Merrill Lynch. On the surface, this increase has caused alarm in some corners, notwithstanding the fact that over the same period, China has gone from being a two trillion dollar economy to one that is five times the size now. Furthermore, debt service ratios – these measure China’s ability to access foreign currency to make good on debt payments not denominated in renminbi – are very robust. Hence the increase in the debt, especially when measured against mature economies that are smaller in size, needs to be put into perspective. Any rapid increase in leverage has to be monitored closely for signs of distress in debt service, but we would argue that China is far away from posing a systemic risk in this regard.
CHINA MACRO
Source: Bank of America Merrill Lynch, Julius Baer
Chart 1: China’s gross debt as a percentage of GDP

69
JULIUS BAER WEALTH REPORT: INDIA
More poignantly, the critical question is to what extent the economy is shifting towards higher value–added services and in turn, a consumer–driven model. Taking this a step further, there is a notion that economies can ‘leap frog’ stages in their development, something that is arguably taking place in China now. For example, China lags other countries in terms of
overall smartphone usage, yet at the same time, roughly half the world’s smartphones are sold to Chinese consumers. What this fact magnifies is the untold potential of China’s digital economy, a topic we explore more closely in the entrepreneur profile that follows this section.
Chart 2: Number of smartphones by region
Chart 3: Percentage of adult population with a smartphone (2015)
Source: Citi Research, Julius Baer
Source: Citi Research, Pew Research, Julius Baer

70
JULIUS BAER WEALTH REPORT: INDIA
Beyond hardware, China is equally undergoing rapid growth in software: perhaps one of the clearest examples of this is the boom in movie box office sales. The well over CNY 40 bn per year in movie theater
revenue speaks of the opportunities in mobile content distribution, as smartphone penetration rises in tandem with the demand for content.
More prosaically perhaps, the market for passenger vehicles displays another important facet of China’s development: intense competition where early leads do not guarantee a permanent dominant position. A decade ago, European car makers were in pole position relative to other car makers in China. Since
then, market shares have shifted, with Korean and US manufacturers jostling for customers alongside Japanese and Chinese firms. This outcome underscores an important distinction that we argue is vital to keep per capita income growth rising: market–derived competition and innovation.
Source: CLSA, China State Administration for Radio, Film and Television, Julius Baer
Chart 4: China’s box office revenue
Chart 5: Market share of passenger vehicles by origin
Source: UBS Investment Bank, Julius Baer

71
JULIUS BAER WEALTH REPORT: INDIA
Lastly, sticking with the ‘beauty capital’ theme of this year’s report, this is certainly one area that China’s influence is being widely felt. As tourism volumes grow globally, visitors from China are notable for their high spending, especially in the cosmetics and related goods. For an economy such as Japan, being able to
attract some of this demand has been an important trend in recent years. Indeed, the average outlay by a visitor to Japan from China is 60% higher than the average, with roughly USD 500 being spent on cosmetics alone.
Chart 6: Amount spent by item, per shopper (between October and December 2015)
Source: Japan Tourism Agency, JP Morgan, Julius Baer
What this demonstrates to us is that aggregate measures of wealth, in particular nominal GDP size, have less relevance today now that China’s economy has reached its current size. Far greater importance
should be placed on sector–level developments to see where consumers are headed next, be it as tourists with increased spending power or as avid fans of digital content in a fiercely competitive environment.

72
JULIUS BAER WEALTH REPORT: INDIA
INDONESIA MACRO
Indonesia: Staying out of the limelightIndonesia was considered one of the ‘Fragile Five’ economies along with India in 2013 when the Federal Reserve thought aloud about ending its bond purchases (Quantitative Easing). The US dollar could buy 3% more Indonesian rupiah by the end of 2014 and 10% more by the end of 2015. However, something interesting happened along the way.
The Indonesian rupiah had weakened to an average exchange rate of USD/IDR 14,402.3 in September 2015. By the end of the year, it had strengthened to USD/IDR 13,840.0. Indeed, since October 2015, the Indonesian rupiah had been the top performer among Asian currencies vs. US dollar, except for the Japanese yen (see chart 1).
Indonesian President Joko Widodo (October 2014), assumed office a few months after Narendra Modi (May 2014) took office in India. Initially, he struggled to get the better of his opposition in his own party and outside. The international press dubbed the country’s attempt to secure Indonesian ownership of resource assets as ‘resource nationalism’. This turnaround has been largely because the Indonesian
government had received breathing space to govern. Further, the falling price of crude oil helped prevent the fiscal deficit from getting out of control. Of course, the government took action like India did by cutting fuel subsidies and raising fuel prices towards the end of 2014. Indonesia’s fiscal deficit is a modest 3.9%, in part thanks to these efforts.
Source: Bloomberg Finance L.P.
Chart 1: Asian currencies in recent months (% change vs. US dollar) (between October 2015 and July 2016)

73
JULIUS BAER WEALTH REPORT: INDIA
Another reason for the outperformance of the Indonesian currency has been the relatively better health of the Indonesian banking system and its inflation performance. Just to provide a comparative perspective, Indonesia’s banks have a capital adequacy ratio of 21%, while non–performing loans were 2.5% (gross) and 1.2% (net).
Indonesia’s current account deficit/GDP ratio is estimated at 2.1% for 2015. Indonesia’s economy is not clearly firing on all cylinders. Two–wheeler and automobile sales are trending down. GDP growth which was expected to be around 5.0% for 2016 is now estimated only at 4.8%. While the forecast is for the growth rate to recover to 5.4% next year (Asian Development Bank estimates), it is quite possible that global headwinds peg the growth rate back to 5.0%, if the numbers for the first quarter are any indication. GDP growth contracted q/q for an annual growth rate of 4.9%, whereas consensus expectations expected 5.1%. This is not a big miss but a minor disappointment, nonetheless. Overall, economic growth rate for 2016 is still expected to be around 5.0%.
Inflation in Indonesia looked likely to get out of hand in 2015 as it did between 2013 and 2014 (one reason why it was part of the ‘Fragile Five’ club) but it quickly
subsided thanks to the falling price of crude oil, slower economic growth and more moderate growth in M2 Money supply. Relative to India, inflation has been benign so far this year. Earlier rate hikes in 2013 and 2015 placed the central bank in a position to ease policy in 2016, from a position of strength. Despite a narrower interest rate differential, the rupiah has remained resilient in the face of global shocks, such as the surprise Brexit vote. In February, Bank Indonesia lowered the reserve requirement on banks from 7.5% to 6.5%. It took effect from mid–March. The rupiah did not weaken then. Nor has the financial market turmoil caused by the British vote to exit the European Union weakened the rupiah. The currency has remained resilient. Clearly, Bank Indonesia has passed the test of credibility with financial markets.
In April 2016, Indonesia also changed its monetary policy framework by replacing the one–year rate as a policy instrument with a one–week repo rate. The one–year policy rate was at 6.75% when this change was announced. The one–week repo rate was 5.5%. It was not a rate cut but it was a stealth ease, nonetheless. By referencing the one–week rate, the psychology on interest rates will change as the focus will be on a much lower number. The one–week (reverse) repo rate was further lowered to 5.25% in June.
Source: Ministry of Statistics and Programme Implementation, India and Bank Indonesia
Chart 2: Indonesian inflation trails Indian inflation rate

74
JULIUS BAER WEALTH REPORT: INDIA
In a move to liberalise investment into the economy, Indonesia removed many items from the Negative Investment List in February of this year. This opens the door to foreign participation in a broad range of sectors and alleviates the risks of protectionism as discussed earlier in this year’s report. Interestingly, Indonesia has expressed an interest to join the Trans–Pacific Partnership; this in itself would likely boost trade but could also potentially expose the rupiah to upward pressures. Foreign ownership can be a double–edged sword. The currency can quickly become overvalued as inflows surge.
Indeed, Indonesia experienced the negative effects of huge and rapid entry of foreign capital from 2010 to 2012 which subsquently exited in 2013. However, this time it is not about portfolio flows but about direct investment inflows. The country is still proceeding only gradually on liberalising foreign ownership rules. In dollar terms, India has received more foreign direct investment (FDI) than Indonesia. However, as a share of GDP, Indonesia has received more FDI than India since 2010 (see chart 3). In real terms, the rupiah effective exchange rate is more competitive than that of the Indian rupee (see chart 4).
Source: UNCTAD
Chart 3: FDI inflows

75
JULIUS BAER WEALTH REPORT: INDIA
Barring a significant deterioration in external conditions, the outlook for Indonesia is moderately positive. The positives as mentioned include moderating inflation, stronger rupiah, pick–up in business sentiment and credit growth as well as higher spending on infrastructure investment by the
government. In addition, a number of economic reform packages, including the Tax Amnesty programme which recently came into force, have been implemented. These should help to support the currency and attract greater investment interest from both portfolio and FDI investors.
Source: Bank for International Settlements
Chart 4: Real Effective Exchange Rates (REER): rupiah is better off (2010=100)

76
JULIUS BAER WEALTH REPORT: INDIA
Over the past five years, Japan’s population has declined by over one million. At the same time, however, per capita income has risen by approximately USD 2,000. These two facts illustrate how Japan’s economy continues to push policy makers, academics and analysts in coming to terms of what ‘needs to be done’ to ‘fix’ a myriad of unique challenges. An ageing population arguably contributes to a natural deflationary drag as lack of meaningful immigration and a shrinking labour force tends to pull down prices. However deflation preserves the purchasing power
of cash, which represents over 40% of the asset allocation of households. High levels of government debt are in stark contrast to low household borrowings and ample savings in the corporate sector. Put differently, despite the often discussed malaise that Japan’s economy seems to be laboring under, the reality is that there are robust counter arguments against this at almost every turn. The most straight forward of all is perhaps that income per head growth in Japan has kept pace with Switzerland over the past 15 years, and exceeded that of France.
Source: IMF, Julius Baer
Chart 1: Per capita GDP (in local currency) indexed to 2,000
JAPAN MACRO

77
JULIUS BAER WEALTH REPORT: INDIA
Nevertheless, the Abe government launched a series of fiscal, monetary and structural measures in late 2012 to great acclaim, dedicated to overcoming deflation and boosting national income. One core tenant of these policies was the central role to be played by a competitive devaluation of the yen.
Detractors of these efforts, collectively labeled as ‘Abenomics’, point to the limited success in lifting durable goods inflation, as well as the perceived caution on the part of both households and the corporate sector to boost spending.
Source: HSBC, Julius Baer
Chart 2: Contribution to Japan’s goods inflation
To be fair, during the course of the Abenomics programme, the government lifted consumption taxes in a bid to shore up its long term fiscal outlook. With net government debt at over 130% of GDP, few would argue that measures are not needed to restore Japan’s fiscal path to a more solid footing. However, in the wake of the April 2014 tax hike, consumption appears to have moved sideways. To add insult to injury, in the wake of heightened international political risk over the course of 2016, the yen assumed its traditional function of being a safe haven asset, undermining the BoJ’s concerted efforts to support a depreciation bias in the currency.
That said, the Japanese economy has undergone rapid change, both in connection with Abenomics and arguably separate to it. For example, while aggregate consumption statistics imply that very little has
changed in recent years, the way that consumers are engaging with the economy has changed significantly. In this regard, internet–driven sales have grown at a rapid pace, suggesting what we see in overall consumption numbers is a blend of a cautious consumer sentiment and a radical shift to online retailing. This speaks of a much broader global phenomenon which faces off the legacy of bricks and mortar points of sale versus a world that is largely mobile and where consumers rely on their smartphones and tablets to do a lot of what they did in the past. This does not change the outcome that the propensity to consume has not moved higher in a material way; households and the corporate sector do not appear confident enough yet to shift their stockpile of savings into spending or investing, but it is equally wrong to argue that consumption in itself is not dynamic.

78
JULIUS BAER WEALTH REPORT: INDIA
Source: Japan Cabinet Office, JP Morgan, Julius Baer
Source: Bloomberg Finance L.P., Julius Baer
Chart 3: Japan’s propensity to consume: consumption as a percentage of compensation
Chart 4: Japan’s consumption indices

79
JULIUS BAER WEALTH REPORT: INDIA
The great debate in Japan over the coming quarters will centre on how to achieve a second wind for Abenomics. Having accomplished an important milestone in its fiscal consolidation and reaped benefits of earlier yen depreciation, the question is invariably down to ‘what next?’
Our view is that policy makers will closely examine the merits of what is termed ‘overt money financing of government deficits’, a.k.a ‘helicopter money’, but ultimately elect not to go down this path. At first glance, it can be argued that both negative interest rates and asset purchase programmes by the BoJ have had a material impact on raising inflation expectations. While this may be the case, it does not automatically follow that helicopter money is the next natural step for the Bank of Japan to take. This is for two reasons: one, the Japanese public is well aware of the extremely high cost of similar undertaking that occurred in the 1930s, equivalent to the oft mentioned German aversion to unconventional monetary policies owing to memories of hyperinflation
in its own past. Second, it may not be technically possible for the Bank of Japan to execute helicopter money without incurring costs for the Finance Ministry, thereby negating the benefits of this strategy in the first place.
In any event, a move to helicopter money would likely be preceded by a period of further negative interest rates and asset buying that could last years. What we image is more likely is that Japan is likely to be forced to persevere through a complicated 2016–17 period, where external factor such as uncertainty over China’s policy mix, the risk of global protectionism and the rise of populism conspire to keep the yen strong. In the shorter term, yen strength will likely see an acceleration of outbound merger and mergers acquisitions (M&A), which has been somewhat neglected in recent years. This means that corporate Japan may end up using the ‘opportunity’ of a stalled Abenomics to gain access to growth markets and customers overseas.
We examine the topic of overseas investment opportunities for Japanese companies in the following
section, highlighting an entrepreneur in the dynamic field of Internet security.
Source: UBS Investment Bank, Julius Baer
Chart 5: Overseas M&A deals and value

80
JULIUS BAER WEALTH REPORT: INDIA
INDIA – CAPITALISING ON MACRO–ECONOMIC STABILITY
Early in September 2016, the heads of governments of G–20 nations met in Hangzhou, China for their annual summit. Prior to the summit, the IMF released their Staff Report on G–20 economies. On India, the IMF noted that economic growth was underpinned by private consumption. The report also noted with satisfaction the recent swift progress, after more than a decade of delay, in the implementation of a national Goods and Services Tax (GST). According to the IMF, the tax held out promise of tax buoyancy and faster economic growth. Thus, among the G–20 nations and, in particular, among BRIC1 nations, India’s macroeconomic fundamentals are stable and appear to provide the platform for an acceleration in economic growth that has been held back in recent years, up to 2014–15, by economic overheating, high inflation, high fiscal and current account deficits and debt binge by Indian corporations. To some extent, some of these factors continue to hold back growth. However, it appears that their adverse effects are waning.
In its latest edition of the World Economic Outlook (October 2016), IMF projects India's real GDP growth at 7.6% in 2016-17 and in 2017-18. This is 0.1% higher than the projection made by the Fund in April 2016 (India’s financial year runs from April to March). As per IMF forecasts, among the major economies, India’s growth rate is expected to be the highest. For India, the scope for catch–up exists as its GDP crossed USD 2.0 trn threshold only recently and in per capita terms, its GDP is lower than countries like China, Indonesia, Thailand and Malaysia.
From bad to better in two yearsThe government has begun addressing many long–standing problems – problems that should have been addressed decades ago. When India's present National Democratic Alliance (NDA) government took office in May 2014, India had just come out of a crisis caused by its twin deficits. India’s current account deficit and fiscal deficit had both ballooned and the Indian rupee depreciated substantially
against the US dollar in 2013. Many firms with foreign currency loans were adversely affected. Further, India’s consumer price inflation had gone up by more than 60% cumulatively in the five years ending March 2014.
Although the previous government had belatedly begun a fiscal consolidation and slashed imports, particularly that of gold, in the two years it has been in office, the incumbent government has successfully restored macroeconomic stability. It continued to adhere to the path of fiscal consolidation. Combining its prudent procurement policies with adroit monetary policy by the Reserve Bank of India, the government brought down the rate of consumer price inflation. So far, the inflation rate is steady at lower levels. It took advantage of the collapse in the international price of crude oil to raise additional fiscal resources for public investment as the private sector has been pre–occupied with its balance sheet repair. This may crowd in private investment sooner rather than later.
Structural challenges remain. Balance sheets of public sector banks need to be strengthened. National and household savings rates have either stagnated or declined. However, at the margin, in the last two years, economic conditions have gone from bad to better. Hence, barring geopolitical shocks that could push the price of crude oil sharply higher, the Indian economy appears poised for a cyclical upswing.
India’s cyclical growth outlookIt has been more than two years since the present government in India came to office in May 2014. In these two years (2014–15 and 2015–16), the growth rate of capital formation has been 4.9% and 3.9% respectively. As chart 1 shows, there has been a little change in the growth rate over the last two years. Thus, overall capital formation is lower than what is required for a country of India’s development. However, there are early signs that the slump in capital formation has bottomed out, as we discuss later.
1 Brazil, Russia, India and China

Chart 2: Ratio of gross fixed capital formation (GFCF) to GDP at constant 2011–12 prices
Chart 1: Annual growth rates of select items of GDP at constant 2011–12 prices
Source: Ministry of Statistics and Programme Implementation, Government of India, Julius Baer
Source: ‘Key Economic Indicators’ (August 2016 – Table 3), Office of the Economic Advisor, Department of Industrial Policy and Promotion, Ministry of Commerce, Government of India
81
JULIUS BAER WEALTH REPORT: INDIA

Chart 3: Asset quality of banks in India
Source: Financial Stability Report (June 2016), Reserve Bank of India
4.2
7.6
4.9
9.6
2.7
3.9
0.3
1.8
PVBsPSBs FBs ALL SCBs16
14
12
10
8
6
4
2
0
%
Mar
12
Mar
13
Mar
14
Mar
15
Sep
15
Mar
16
Mar
12
Mar
13
Mar
14
Mar
15
Sep
15
Mar
16
Mar
12
Mar
13
Mar
14
Mar
15
Sep
15
Mar
16
Mar
12
Mar
13
Mar
14
Mar
15
Sep
15
Mar
16
Restructured standard advances to total advancesGNPA to total advances
82
JULIUS BAER WEALTH REPORT: INDIA
As share of GDP too, GFCF has declined steadily from 34.3% in 2011–12 to 31.6% in 2015–16.
The reasons for the none–too–impressive growth rates of capital formation are several. With few exceptions, most of India’s large private sector corporations particularly in the infrastructure sectors, took on too much debt. They expanded capacity domestically and internationally too. China’s growth slowdown has left them with enough spare capacity to export to the world. As a result, prices of many
infrastructure goods – iron, steel, coal and copper – have declined considerably in recent years. Indeed, the final declaration of the G–20 Summit referred to excess capacity in steel since many American and European steel producers are affected. Therefore, companies that took on debt to invest in additional capacity are particularly hit and they are struggling to rebuild their balance sheets and their market share as well. Naturally, their appetite for fresh investments is rather low.
Second, in India, loans to corporations are made mostly by majority government–owned banks (‘Public Sector Banks’). Their balance sheets are severely crimped by the loans made in the past that have either not been repaid or serviced. According to the June 2016 report on financial stability published by Reserve Bank of India (RBI), the ratio of stressed assets of Indian banking system was 11.5% (chart 3). The figure for government–owned banks was higher at 14.5%. However, there are signs that the problem may have peaked. Banks collectively doubled their
provisions against bad debts in the year ending March 2015 and the provisions have further increased in the year ending March 2016.
For now, banks remain understandably cautious in their lending. It should not come as a surprise, consequently, that bank loans to micro, small and medium enterprises are contracting. Credit to large enterprises is growing but the growth rate has slowed sharply from around 7.0% (y/y) in January to just under 2.0% in July (chart 4).

Source: Reserve Bank of India
Chart 4: Non–food bank credit growth
83
JULIUS BAER WEALTH REPORT: INDIA
Third, businesses might be cautious about undertaking big investments when the global economic and political environments are uncertain and becoming more so, by the day.
Finally, the private sector in India has been used to particular ways of doing business with the government and with government–owned entities. The present government’s determination to depart from those methods towards more transparent methods of bidding for contracts or licenses from the government might be unsettling at first and it might take some time for businesses to get accustomed to them. That could also be a factor in the insipid rise in capital formation in recent years.
Given these factors and given that they are still being worked out, the onus of steering India’s economic growth rate has fallen on the government and on the Indian household. In other words, private consumption expenditure and government spending are driving the economy. We will have more to say on these two not just in the cyclical context but also in the context of what lies ahead for the medium to long term.
But, first, we will assess the cyclical growth outlook for India. In particular, is monetary policy supportive of growth?
Monetary policy turns growth–friendlyIndia’s monetary policy has become increasingly accommodative in the last two years. When Raghuram Rajan took over as the RBI Governor, the policy rate was 7.5%. It was raised to 8.0% in the first few months of his term. From January 2014, it has been declining and now stands at 6.25% as on October 2016. In real terms, the policy rate has increased. The trailing 12–month inflation rate in January 2014 was 9.7%. The policy rate then was 8.0%. Hence, the real rate was –1.7%. Now, the policy rate is 6.25% and the inflation rate as of August 2016 is 5.1%. Therefore, the current real policy interest rate is +1.15%. It has swung 2.85% in the last two odd years. Has it held back investment? The answer is not straightforward. In a balance sheet constrained environment, low interest rates stoke speculative investment in real estate and stock markets rather than in real assets that generate employment.

84
JULIUS BAER WEALTH REPORT: INDIA
In any case, in its first monetary policy meeting for the new financial year 2016–17 held in April 2016, RBI had embarked on a policy of ensuring ample liquidity provision for the economy. That would make the reverse repo rate as the operative interest rate rather than the repo rate since banks would not be required to borrow from the central bank. The reverse repo rate is 5.75% and the repo rate is 6.25%. If banks earn 5.75% by placing their surplus liquidity with RBI, then they would be able to lend to prime borrowers at rates above 5.75%. This would amount to a substantial ease of monetary policy. Therefore, monetary conditions are likely to become increasingly supportive in the course of the year.
Of course, the discussion on monetary policy would not be complete without acknowledging the fact that there has been a change of personnel at the top. Raghuram Rajan, the high–profile governor has made way for Dr. Urjit Patel. Under Raghuram Rajan, many new initiatives were undertaken. India issued licenses for new banks and for different types of banks for depending on the need – Small Finance Banks and Payment Banks. With a steady hand on interest rates, the inflation rate has been brought down and the Indian rupee has remained stabled, giving confidence to companies to issue bonds denominated in Indian rupees to overseas investors who are taking them up enthusiastically. India’s foreign exchange reserves swelled considerably under Dr. Rajan. It went up from USD 274.8 bn on his taking over as RBI Governor to around USD 366.8 bn when he left office.
Dr. Patel assumed office as the 24th Governor of the Reserve Bank of India on 05 September 2016. Prior to this, he had been the deputy Governor from January 2011 until 04 September 2016. His academic qualifications, international experience and specific monetary policy experience make him an ideal choice for the role. Dr. Urjit Patel has the opportunity to steer monetary policy gradually in either direction without having to make abrupt moves.
The near–normal monsoon in 2016 and the relatively stable inflation leave him with ample scope to be supportive of economic growth without having to sacrifice the inflation goals the central bank is pursuing. The Indian government and RBI have signed on to an inflation–targeting framework. Both
of them have to ensure the framework is respected and there is sincere striving towards meeting the inflation target. The good news is that external conditions are favourable for maintaining price stability. Therefore, one can expect monetary policy to be growth supportive. In his first monetary policy meeting in October 2016, as the new Governor and heading the newly constituted Monetary Policy Committee, he cut the Repo rate by 25 basis points to 6.25%.
Monetary policy, even as it remains supportive, will be unlikely to lead to a quick revival in private investment. Hence, in the near–term, there is a need to sustain economic growth through public investment that eventually crowds in private investment. The government has been proactive in doing that. That is what we turn to next.
Infrastructure Development MissionMaking up for private investment slackIn the absence of support to economic growth from private corporate investment and with export growth stymied by India’s endemic productivity and competitiveness challenges coupled with slack global demand, the onus of sustaining economic growth has fallen on public investment and private consumption. Public investment spending had to be revived while keeping one eye on the fiscal deficit because the government inherited a difficult fiscal situation. Even now, India’s fiscal situation improvement remains a work in progress. However, the union government has been walking the tightrope without slipping. It is doing so by plugging leakages in government subsidies and by collecting taxes more efficiently. First, the absence of private capital formation is starkly evident in the information that RBI has provided in its September 2016 monthly bulletin. The article on ‘Private Corporate Investment Growth in 2015–16 and Prospects for 2016–17’ provides information on phasing of capital expenditure by companies raising funds through banks, financial institutions, external commercial borrowing, foreign currency convertible bonds and equity issuance. It does not include companies raising funds through private placement of debt and from foreign investors since they do not provide information on the end–use of funds raised. The data need no further explanation (chart 5).

Chart 5: Phasing of capital expenditure of projects
Chart 6: Net FDI inflows
Source: Private Corporate Investment: Growth in 2015–16 and Prospects for 2016–17’, RBI Monthly Bulletin (September 2016) – Table 5
Source: Reserve Bank of India
85
JULIUS BAER WEALTH REPORT: INDIA
Given this, it is no surprise that the government has been assiduously wooing foreign investment, led personally by the Prime Minister and the government has the numbers to show for its efforts. Net FDI2 – as per Balance of Payment statistics of the Reserve
Bank of India – was little over USD 36.0 bn in 2015–16, higher than USD 32.6 bn received in the whole of 2014–15 which, in turn, was a substantial improvement over USD 21.6 bn in 2013–14 (chart 6).
2 ‘Net’ here refers to the FDI after removing repatriations and investment by Indians overseas.

86
JULIUS BAER WEALTH REPORT: INDIA
The government has continued to build roads at a fast pace. Roads construction picked up pace in 2014–15. 36,000 kms of new rural roads were added in 2014–15, about 11,000 kms more than in the previous year. Nearly 8,000 kms of highways were awarded in 2014–15 compared to only 3,170 kms in the year before. Out of the target of 10,000 kms, for 2015–16, about 64% was awarded up to December 2015. As for construction, highway construction at 4,410 kms was slightly more than that of the 4,260 kms in 2013–14 but, in 2015–16, the speed of construction has picked up. In the nine months ending December, nearly 4,000 kms have been added. In recent years, the best year for highway construction was, however, 2012–13, when 5,732 kms were added3.
Marching towards ‘One nation, one grid, one price’‘Bijli, sadak aur paani’ are the key concerns of an Indian average household. This government is working on providing all Indians electricity 24/7 through multiple fronts. They are providing lighting to villages, they are replacing halogen lamps with LED lighting and thus saving hugely on power consumption and they have come up with an incentive (carrot–and–stick) scheme (‘UDAY’ – which means the dawn) to make the state–run electrical utilities to transfer their losses to the State government budgets.
Utilities’ balance sheets will improve under the scheme. Banks’ loans to utilities that are non–performing will be replaced by state–guaranteed bonds. Power producers will benefit as utilities will buy power from them again. States will have to provide for electricity subsidy explicitly, going forward, if they wish to sell electricity below economic rates. They cannot hide behind the balance sheet of utilities. Third, if States continued to avoid taking responsibility for their subsidies, their borrowing limits might be reduced.
While the ultimate success of UDAY rests with the States’ ability and willingness to charge an economically viable price for electricity, the Union government has also embarked on Project Ujala which seeks to replace all fluorescent lamps in the country with LED lighting. According to official statistics, more than 158 million LED lamps have been distributed throughout the country resulting in 56 million KWh of energy saved on a daily basis. In addition, the government has set itself the audacious goal of ‘One Nation, One Grid and One Price’ for electricity. If electricity of reliable and consistent quality were made available to all Indians on a 24/7 basis, it could boost India’ real GDP growth by a percentage point or two.
India is also making a big push for solar energy with its copious sunshine on most days in the year, almost throughout the country. The installed capacity of Solar Power was around 5000 MW in India by the end of 2015. Six years ago, the number was 161 MW4.
Towards the end of March 2016, the government has also announced a comprehensive Hydrocarbon Exploration and Licensing Policy (HELP). It has helped remove policy uncertainties. License fees will be based on revenues and not on profits. Second, oil companies can apply to take up for exploration fields not put up by the government for exploration. In other words, they do not have to wait for the government to offer the fields for exploration. They can initiate action at their end. It might draw in foreign investor interest especially if the persisting uncertainty over tax claims based on a retrospective tax law is removed. It is important that the policy translates into higher investment in the sector because growth in India’s production of petroleum products lags consumption growth. But for the dramatic reduction in the price of crude oil in 2015–16, India would have found it a lot harder to narrow its current account deficit and reduce the depreciation pressure on the Indian rupee5.
3 Source: Annual Report 2015–16, Ministry of Road Transport & Highway, Government of India (p. 19)4 India Solar Handbook 2016, Bridge To India, April 2016.5 According to the Annual Report of the Ministry of Petroleum & Natural Gas for 2015–16, landed cost of crude oil for India averaged USD 50.91/bbl.
in the first nine months of the financial year 2015–16, compared to USD 94.69/bbl. in the first nine months of 2014–15 and USD 84.16/bbl. for the full year 2014–15. In 2013–14, the cost was USD 105.52/bbl.

Chart 7: Production and consumption (indigenous sales) of petroleum products
Source: Annual Report 2015–16, Ministry of Petroleum & Natural Gas, Government of India
87
JULIUS BAER WEALTH REPORT: INDIA
Digital enhancement to the funding of India’s economic growthOn that, the government is embarked clearly on two long–term goals. One is to enable the banking sector to grow after cleaning it up. The establishment of the Bank Boards Bureau for streamlining appointments to top management posts in public sector banks and the induction of lateral talent with proven experience and competence from the private sector are the building blocks of the process which would culminate in eventual consolidation and privatisation of the banking sector. As a share of GDP, India’s banking sector is relatively small. It is around 75% of GDP whereas the typical Asian average is around 120% to 150% of GDP. However, growing the banking sector involves trade–offs such as economic and financial stability as many other nations have discovered. India does not have to go through the same learning cycle.
Indeed, the government’s initiatives to kickstart the establishment of a corporate bond market and technological disruptions might eliminate the need for growing the banking sector. On 18 August 2016, the RBI published the working group report on the
development of a corporate bond market in the country. Without fanfare, some of the areas in which actions were due from RBI were announced a week later. These are profound changes. It allowed banks to offer partial credit enhancement up to 50% of a bond issue from the present 20% and RBI proposing to accept corporate bonds as collateral under the liquidity adjustment facility are likely transformational. These are desirable and they constitute the necessary conditions for the growth of the corporate bond market.
The technological disruptions that are taking place in the field of financial disintermediation in India are breathtaking. India has the world’s unique payment interface system. Many banks have signed up to be part of India’s ‘instantaneous, paperless, cashless financial transactions’. The Unified Payment Interface, with its interoperability, instantaneous and two–way payment systems, is unique in the world. It went live on 25 August 2016 with 21 banks signing up to the Unified Payments Interface of the National Payments Corporation of India.

Chart 8: The India stack
Source: ‘The quick and the dead’, Ideas Engine Series, Credit Suisse Research, June 2016
Consent layer
Cashless layer
Paperless layer
Presence-less
Provides a modern privacy sharing network
Game changing electronic payment systems
Rapidly growing base of paperless systems
Unique digital biometric identity
Indi
a St
ack
J A MUnique Identity for every Indian Mobile connectivityJan-Dhan - banking for all
• 219 mn bank accounts opened so far• Zero balance accounts now only 26%• ~50% accounts Aadhaar linked
• ~1bn Aadhaar cards issued (~80%+ of population)
• More than 650mn mobile phone users • Smartphone penetration at ~20% – rising at a fast pace• ~700mn smartphone users by 2020
88
JULIUS BAER WEALTH REPORT: INDIA
Over time, the seamless payments system with its digital footprints will make India data–rich from data–poor. The sheer scale of informality of the Indian economy has made it difficult for data to be collected and verified and it has hampered the flow of credit to the credit–starved informal businesses. That may become history soon. With the government pushing and prodding corporations to turn to capital markets
to raise their funds, banks, armed with better data, will be able to finance micro, small and medium enterprises. That is the transformational potential of this digital disruption to India’s cash–dominated payments and informal economy. Chart 8 below captures the potential of the transformation that could be unleashed in India in the years ahead.

89
JULIUS BAER WEALTH REPORT: INDIA
We have already mentioned that the Government had managed to get the Constitution amendment Bill passed to introduce a National GST. It has been quickly ratified by a required number of State governments and the President has given his assent. The government has set up a GST council which will determine the GST rate, etc. The government is working towards a start date of April 2017. It has the potential to be a game changer both for tax revenues and for economic growth through realisation of many efficiencies including easier and relatively less costly and hassle–free access to a national market for producers. The potential for economic benefits to exceed the potential abridgement of taxation rights of individual States in a Federal setup remains high.
On infrastructure front, the ex-RBI Governor, Raghuram Rajan in a speech said that what is happening in India now, reminds him of the 1997–2002 period when a lot of good work was being done but the results only showed up in the decade that followed6.
Private consumptionThe India consumption story is a breathless promise of imminent arrival that has, so far, failed to show up. The last time it was touted as a story that had arrived was in 2012 before the Indian economy and the currency hit the wall in 2013. Before that, it had made its first and perhaps more exciting appearance in the heady growth years of 2003–08. That proved unsustainable once the global economic crisis of 2008 intervened. But, hopes revived along with economic growth in 2009 only to be snuffed out by the rupee crisis and growth stagnation from 2012 until 2014. But, the promise never fails to appeal. It is a promise that keeps India’s hopes up of making to middle–income status in the next decade, if not earlier.
Will it be a case of third time lucky? For the India consumption story to be sustainable and to become
a reality, it has to avoid the dangers of the past two false starts. In other words, it has to be built on solid foundations. Economic growth is more sustainable if it were propelled by investment, productivity and technology leading to output, job creation, income growth and consumption.
In the case of India, in recent years, private capital formation rates have fallen as big corporations are smarting under the burden of debt that they are carrying. Banks are unable to and unwilling to lend to them. Hence, generation of employment in the formal sector may not be taking place to the desired extent. Economic growth for the time being is driven by government spending – both consumption and investment spending and by private consumption. It is not necessarily a healthy mix but it helps to sustain economic growth for now. It is not a healthy mix because of India’s persistent current account deficit. Right now, India’s current account deficit is contained and is modest because of the dramatic collapse of the price of crude oil and, second, because India’s private sector economic activity is somewhat subdued. However, the consumption story, if it continues without a rise in investment with income growth to follow, would cause India’s current account deficit to widen, potentially paving the way for economic turbulence down the road.
There are strong reasons to believe that India is mindful of the dangers of unsustainable consumption–led growth. That is evident in its commitment to fiscal credibility and price stability. Further, the government is making sure that its welfare schemes reach only the needy so that the resulting savings can be deployed for infrastructure creation that will facilitate economic activity and higher economic growth.
The share of private consumption in India’s GDP and the growth rate of private consumption are chart 9.
6 ‘Financial Reforms: Past and Present’ Speech by Dr. Raghuram Rajan at the National Council for Applied Economic Research, 29 January 2016

90
JULIUS BAER WEALTH REPORT: INDIA
It is hard to arrive at trends from chart 9 with logical explanations for the same. Clearly, the share of private consumption in the economy has gone down a notch and is staying around the new base of around 55% of GDP. However, the contribution of private consumption in the overall economic growth rate
of the country remains very high. It is evident in the improvement in automobile sales (chart 10) and in the number of registered GSM mobile phone users (chart 11). Personal credit growth is strong at 19% y/y, as seen in chart 4 above on bank credit growth.
Chart 9: Trends in private consumption and real GDP
Note: All series are in constant prices. Data up to 2010–11 are old series based on 2004–05 prices. Data from 2011–12 are new series data and are based on 2011–12 prices. Private consumption and real GDP growth rates for 2011–12 (the year of changeover) are not yet available as the historical series have to be re–based to 2011–12 prices.Source: Key Economic Indicators, Office of the Economic Advisor, Department of Industrial Policy and Promotion, Ministry of Commerce & Industry, Government of India (August 2016)

Source: Society of Indian Automobile Manufacturers and media reports (only for 2015–16 figures)
Chart 10: Domestic vehicle sales trends
* Data only up to November as December data was erroneous.Source: Cellular Operators Association of India
Chart 11: Registered GSM mobile users
91
JULIUS BAER WEALTH REPORT: INDIA

Penetration % Urban Rural DeltaMobile phone handset 92 78 14 Television 80 50 30 Motorcycle, scooters 38 18 20 Refrigerator 44 9 35 Air conditioner, air cooler 24 6 18 Washing machine 21 3 18 Motor car, jeep 8 2 6 PC incl. Laptop 15 2 13
Chart 12: Rural India still under-penetrated
Source: NSSO 68th round survey
Boosting agriculture productivity
– Irrigation: A fund of USD 3 bn launched; targeting 2.85 million hectares of land– Crop insurance: covers 20% of framers currently; target of 50% in next 3 years– Agricultural marketing system: 585 wholesale outlets to be integrated by March 2018 via National
Agriculture Market (eNAM)
Diversifying sources of rural income
– Skill development: 1,100 approved training centers to help train nearly 2 mn youth– Encourage entrepreneurship: MUDRA Scheme to provide formal access to credit for small entrepreneurs
Urbanising rural areas – Roads: Build 22.3 million kms of additional rural roads by 2019; increased pace to 100 km per day in FY16 from 70 km per day earlier
– Electrification: Over 7,000 villages electrified; target 11,000 more by May 2018– Housing: Rural housing scheme to build 10 million houses by 2019– Telecom: To connect all 250,000 village councils with broadband; over 50,000 connected so far– Financial penetration: 135 million of new banks’ accounts in rural area
Chart 13: Recent initiatives by the government to boost rural activity
Source: ‘India: A tale of two economies – Rural and Urban’, Goldman Sachs Research (June 2016)
92
JULIUS BAER WEALTH REPORT: INDIA
Further, wage revisions for government employees because of the government accepting the recommendations of the Seventh Pay Commission will provide its own temporary boost to consumption–led growth in the country. Bank of America–Merrill Lynch (BAML) expects a consumption recovery of more than 1% of GDP in the second half of 2016, driven by lower lending rates, 7th Pay Commission award of 0.55% of GDP, household savings of 0.4% of GDP on account of lower oil prices and due to an
increase in wheat prices to implement the Swaminathan formula.
In the medium to long–term, India has 180mn rural households and 88mn urban households. If the penetration of products in rural India were to reach urban levels (driven by increasing purchasing power in rural India), the sheer size of opportunity can provide support to the next phase of volume growth.
Undoubtedly, it is good news for the economy near term. However, it is important not to put the cart before the horse. Key to sustained consumption growth is employment and income growth. Economic growth driven by consumption will eventually prove to be unsustainable. Even advanced nations are discovering that belatedly. It is both healthy and sustainable for consumption growth to be the consequence rather than the cause of economic growth. Much of this anticipated rural consumption story depends on sustainable rise in rural incomes.
Employment in rural India is mostly informal. In India, the share of informal employment in the overall non–agricultural employment at 84% is the highest in the world7. This is good news in the sense that much of India’s growth potential remains to be tapped and yet it is already an USD 2.0 trn economy.
Recent initiatives on the part of the government to boost the rural economy are well captured in the box below:
7 ILO – Department of Statistics, June 2012

93
India has always been on the cusp of entering a period of sustainably high economic growth with rising standards of living for hundreds of millions. Good beginnings soon turned into excesses and petered out. There is always the hope that India would get it right the next time. In the last two years, economic growth has been slow to pick up but it is picking up. High inflation and twin deficits have given way to low inflation and moderate growth. Public investment in infrastructure is picking up even while fiscal prudence
is being maintained. The private sector is being encouraged to opt for market–based solutions for long–term capital needs. With the aid of technology, government subsidies are directed towards the needy and deserving. Once the private sector puts behind its debt troubles, investment in real assets will pick up followed by employment and income growth in the organised sector. Then, all the good work being done by the government will translate into sustainable economic growth.

94
JULIUS BAER WEALTH REPORT: INDIA
WEALTH CREATION IN INDIA – ALIVE AND KICKING
Wealth creation, in simple terms, is a direct function of economic growth. The higher the economic growth, the higher the output, employment and income generation. Out of incomes, households consume and save. Accumulated residual income – otherwise, known as savings – is wealth.
What financial markets do is wealth transformation and more desirably, wealth multiplication. Asset markets are not wealth creators in that sense. They transform liquid and short–duration savings (cash and bank balances) into somewhat less liquid and long–term investments. The willingness to give up a bit of liquidity and lengthen the horizon is compensated by the financial market. That results in the pie of savings growing larger. In the process, financial markets allow wealth to multiply as well.
Crucial to this role of the stock markets in transforming and multiplying wealth is its role as a mechanism for allocating capital. In an ideal world, companies that raise money through equity markets invest them efficiently and profitably. That generates returns for shareholders. The price of the company’s stock rises. That lowers its cost of capital, drawing even more investors. Hence, the stock market signals to investors attractive investment opportunities. Thus, capital markets reward those who deploy capital prudently and profitably and also investors who trust the signals of the stock market in this manner.
Is India different from other developed world? The current matter of debate globally is whether stock markets have been performing their roles of providing capital to the entrepreneurs. That debate has become acute in the developed world where monetary policies that provide generous liquidity to the economy have, inadvertently or deliberately, ended up stocking asset price bubbles. Surely, they have boosted wealth. The net worth of American households, for example, has reached historically high levels. However, they run the risk of being eroded as quickly as they are generated if economic fundamentals do not justify the level of
asset prices. Hence the first pre-condition of wealth creation is economic growth. Second, such massive and swift increases in asset prices have also stoked concerns of income and wealth inequality. However, these concerns are less relevant to India. Monetary policy of the RBI does not target asset prices either implicitly or explicitly. RBI is not pursuing any policy of quantitative easing. Real rates are positive in India unlike in advanced nations and economic fundamentals are aligned with robust capital markets. To sum up, the three pillars of wealth creation are economic growth, national savings rate and capital markets and India is in a sweet spot vis–à–vis the global peers with respect to these three pillars.
Wealth Creation by Indian EntrepreneurPre liberalisation (1991) large companies mostly belonged to the government or rich industrial houses who were somehow connected to it.
Infosys was India’s first great startup. The key mantra of Infosys was – a strong sense of entrepreneurship, values grounded in humility, honesty and fairness, and an intense focus on creating value rather than wealth.
In this process, Infosys created lot of wealth for the shareholders as well as the promoters. Infosys was one of the first Indian companies to offer employee stock options plans (ESOP), as a way of ‘democratising wealth’.
Over last 20 years the Indian stock markets have done better than the overall emerging market index and stocks in China. From May 1994 (since MSCI has data on Indian stocks) to August 2016, MSCI–IMI (investable market index) for India has returned an annual average of 6.6% (net) in USD terms compared to 4.3% for MSCI–Emerging Markets IMI and 6.5% for MSCI–All Country World Index (IMI). On a gross basis, the return from Indian stocks is slightly higher at 6.8%. In stark contrast to India, MSCI–China (IMI) has delivered an annualised return of 1.3% (gross) in the same period.
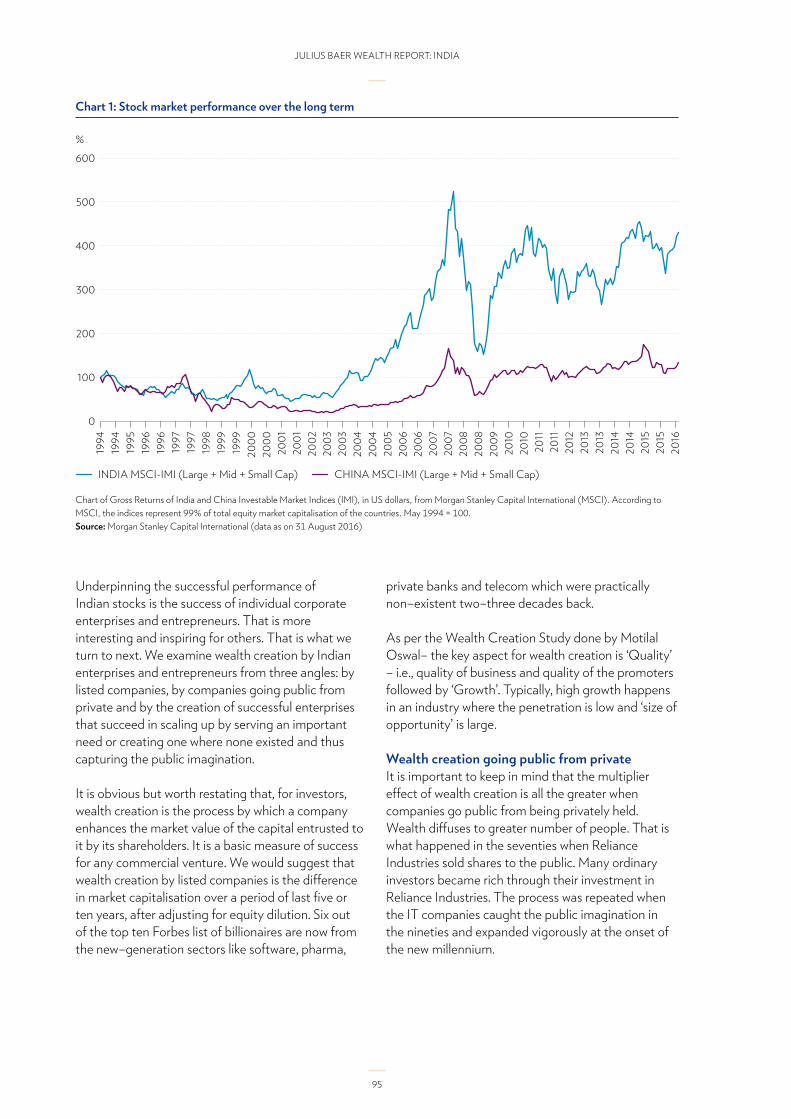
600
500
400
300
200
100
0
INDIA MSCI-IMI (Large + Mid + Small Cap) CHINA MSCI-IMI (Large + Mid + Small Cap)
%
1994
1994
1995
1996
1996
1997
1997
1998
1999
1999
2000
2000
2001
2001
2002
2003
2003
2004
2004
2005
2006
2006
2007
2007
2008
2008
2009
2010
2010
2011
2011
2012
2013
2013
2014
2014
2015
2015
2016
Chart 1: Stock market performance over the long term
Chart of Gross Returns of India and China Investable Market Indices (IMI), in US dollars, from Morgan Stanley Capital International (MSCI). According to MSCI, the indices represent 99% of total equity market capitalisation of the countries. May 1994 = 100. Source: Morgan Stanley Capital International (data as on 31 August 2016)
95
JULIUS BAER WEALTH REPORT: INDIA
Underpinning the successful performance of Indian stocks is the success of individual corporate enterprises and entrepreneurs. That is more interesting and inspiring for others. That is what we turn to next. We examine wealth creation by Indian enterprises and entrepreneurs from three angles: by listed companies, by companies going public from private and by the creation of successful enterprises that succeed in scaling up by serving an important need or creating one where none existed and thus capturing the public imagination.
It is obvious but worth restating that, for investors, wealth creation is the process by which a company enhances the market value of the capital entrusted to it by its shareholders. It is a basic measure of success for any commercial venture. We would suggest that wealth creation by listed companies is the difference in market capitalisation over a period of last five or ten years, after adjusting for equity dilution. Six out of the top ten Forbes list of billionaires are now from the new–generation sectors like software, pharma,
private banks and telecom which were practically non–existent two–three decades back.
As per the Wealth Creation Study done by Motilal Oswal– the key aspect for wealth creation is ‘Quality’ – i.e., quality of business and quality of the promoters followed by ‘Growth’. Typically, high growth happens in an industry where the penetration is low and ‘size of opportunity’ is large.
Wealth creation going public from privateIt is important to keep in mind that the multiplier effect of wealth creation is all the greater when companies go public from being privately held. Wealth diffuses to greater number of people. That is what happened in the seventies when Reliance Industries sold shares to the public. Many ordinary investors became rich through their investment in Reliance Industries. The process was repeated when the IT companies caught the public imagination in the nineties and expanded vigorously at the onset of the new millennium.

Chart 2: PE deals: On an upswing over the last few years
Source: Bain & Company
96
JULIUS BAER WEALTH REPORT: INDIA
Wealth creation by new enterprises and unicornsThe private equity (PE) space in India improved considerably in the last two years on back of easy global liquidity. That is where the foundations of wealth creation are laid, at the micro level. According to a report by Bain consulting, “PE investments in India experienced a robust increase over 2015. Deal value, including real estate, infrastructure and venture capital (VC) deals, increased by 51% to USD 22.9 bn – surpassing 2007 peak levels of USD 17.1 bn. Overall deal volume in India grew by 31%, while overall deal
value also rose as a result of a few megadeals. Looking at the year ahead, GPs in India expect a further increase in deal activity, propelled by macroeconomic conditions, an improved exit environment and changes in valuation expectations”1.
In 2015, the PE/VC deal volume in India grew by 31% to 1,049 transactions (i.e., 4 transactions/ working day with average ticket size of USD 22 m) driven by the consumer technology, BFSI2 and the real estate sector.
It is one thing for new businesses to attract investors and another to enable them to exit profitably. The latter excites more investors and draws in more funds in the future, creating a virtuous circle. India did far better than in the past on that score too in 2015. The exit market in India performed exceedingly well in 2015. According to Bain, “the number of reported
exits in the country grew 10% from 2014 to 2015, and the value of exited investments increased by 57% across the same period, rising from USD 6 bn in 2014 to USD 9.4 bn in 2015. Also in 2015, public market sales, secondary sales and strategic sales were equally prominent as exit options. Average deal sizes were significantly higher for secondary and strategic sales”1.
1 ‘India Private Equity Report 2016’, Bain & Company 2 Banking, Financial services and Insurance

Chart 3: PE exit deals have also increased
Source: Bain & Company
97
JULIUS BAER WEALTH REPORT: INDIA
It is always more interesting to read about the individual success stories. Data on broad trends do not inspire. They inform. Individual stories do. Over last few years, a lot of wealth has been created globally, as well as in India by ‘Unicorns’. Unicorn, a term promoted and made conversant by Aileen Lee, a venture investor to describe start–ups valued at a USD 1 bn or more. Globally, 163 unicorns are listed at a total cumulative valuation of USD 568 bn.
The unicorn club in India houses nine startups namely–Flipkart, Snapdeal, Mu Sigma, InMobi, Paytm, Zomato, Shopclues, Ola and Quikr. Among Indian companies, seven of the nine unicorns are consumer–internet start–ups.
Indian start–up founders have had it good over the last few years. Valuations of their companies have soared, and they have witnessed a sudden change of fortunes. Many of India’s famed start–ups have been valued highly in the market and by the market and therefore received generous amount of capital through multiple rounds of funding. This has seen many of the new age start–up entrepreneurs becoming wealthy as their start–ups reached the famed unicorn status.
If current trends persist and India maintains its growth momentum, India is expected to produce billionaires and many times millionaires among the start–ups in the next five years with e–commerce, financial services and other technology driven fields generating the maximum interest, an ASSOCHAM study on start–ups has pointed out.
Out of 9 unicorns in India, named earlier, 5 are headquartered at Bengaluru, the bedrock on which the country’s USD 146 bn IT sector that houses global brands like Infosys and Wipro was built. With multinational corporations establishing their presence in big numbers in Bengaluru, technology talent pool is leveraged with R&D outposts. The city houses 350 global captive centres, including Target and Shell, of 1,000 such centres in India.
The early success of some billion–dollar start–ups in the country signals the rise of potential unicorns in India. Start–ups like UrbanLadder and Portea Medical are foreseen to join the unicorn club sooner as per the reports of Forbes.

In 1990 (June)No. Company Long Name Industry Market Cap in INR bn1 Tata Steel Ltd Steel – Large 282 Sanofi India Ltd Pharmaceuticals – Multinational 193 Tata Motors Ltd Automobiles – LCVs/HCVs 164 SIV Industries Ltd Textiles – Rayon 15 5 Reliance Industries Ltd Refineries 146 Hindustan Unilever Ltd Personal Care – Multinational 127 Century Textiles & Industries Ltd Cement – Major – North India 98 Bajaj Holdings & Investment Ltd Finance – Investment / Others 9 9 Gujarat State Fertilizers & Chemicals Ltd Fertilizers – Nitrogenous / Phosphatic 9 10 Colgate–Palmolive (India) Ltd Personal Care – Multinational 7
In 2000 (June)1 Wipro Ltd Computers – Software – Large 6652 Hindustan Unilever Ltd Personal Care – Multinational 6243 Infosys Ltd Computers – Software – Large 5504 Reliance Industries Ltd Refineries 3595 Oil & Natural Gas Corpn Ltd Oil Exploration / Allied Services 1966 ITC Ltd Cigarettes 1957 Zee Entertainment Enterprises Ltd Entertainment – Electronic Media 1848 HCL Technologies Ltd Computers – Software – Large 1809 Mahanagar Telephone Nigam Ltd Telecommunications – Service Provider 13510 Vatsa Corporations Ltd Finance – Small 133
In 2010 (June)1 Reliance Industries Ltd Refineries 3,5552 Oil & Natural Gas Corpn Ltd Oil Exploration / Allied Services 2,8243 NTPC Ltd Power Generation And Supply 1,6424 Infosys Ltd Computers – Software – Large 1,6005 MMTC Ltd Trading – Large 1,5616 Tata Consultancy Services Ltd Computers – Software – Large 1,4707 State Bank of India Banks – Public Sector 1,4618 Bharat Heavy Electricals Ltd Electric Equipment – General – Large 1,204 9 ITC Ltd Cigarettes 1,16310 Larsen & Toubro Ltd Engineering – Turnkey Services 1,088
Chart 4: Top 10 Market Capitalisation companies in India
98
JULIUS BAER WEALTH REPORT: INDIA
Finally, we also assess the health of the wealth creation process in the country from the churn in the Indian stock market. If old companies are replaced by new at the top, then that is also a sure sign that wealth creation process affords opportunities to many a shot at the high table. The table below shows the top ten companies by market capitalisation in India over the last quarter century. Comparing the current top ten with the top ten in 1990, we notice that cement, textile and steel are gone. The list now
features a private sector bank and a housing finance company. There are two computer software companies now in the list. None figured in the top ten in 1990. The churn is healthy. Old wealth is giving way to new wealth. Lately, several Ecommerce companies have received financial support from private equity funds from around the world. By 2020, at least two of them might figure in the top ten honours list.

Current Top 10 (September 2016)1 Tata Consultancy Services Ltd Computers – Software – Large 4,652 2 Reliance Industries Ltd Refineries 3,488 3 HDFC Bank Ltd Banks – Private Sector 3,300 4 ITC Ltd Cigarettes 3,150 5 Infosys Ltd Computers – Software – Large 2,435 6 Housing Development Finance Corporation Ltd Finance – Housing – Large 2,217 7 Oil & Natural Gas Corpn Ltd Oil Exploration / Allied Services 2,149 8 Coal India Ltd Mining / Minerals 2,052 9 State Bank of India Banks – Public Sector 1,974 10 Hindustan Unilever Ltd Personal Care – Multinational 1,974
Chart 4: Top 10 Market Capitalisation companies in India (con’t)
Source: Capital Line
99
JULIUS BAER WEALTH REPORT: INDIA
According to a study, done by Assocham in association with Thought Arbitrage Research Institute, India is home to the third largest number of technology driven start–ups in the world, with the US and the UK occupying the top two positions. Value creation is expected in the fledgling e–commerce, music–entertainment, payment gateways and city transport aggregators like radio taxis. The push given by the government on innovation and start–ups will also add to the growth of the economy. It is estimated that creating 20 USD 1 bn unicorns would lead to a 1% growth in the economy. The government has put together a fund of funds, the India Aspiration Fund, to support the start–up ecosystem in India. These initiatives can be expected to contribute to the growth of the economy.
Further, there is a clear potential for these trends to improve substantially as only a tiny fraction of Indian
households participate in capital markets. But, this might be changing. In its Annual Report for 2015–2016, RBI reported that gross financial savings of Indian households as a percentage of Gross National Disposable Income moved up to 10.8% in 2015–16, from 10.0% the year before. It is the highest in five years.
The narrative of India is gradually changing. At a time when the global economies are facing headwinds, India appears poised to move on to a higher growth trajectory. Reform measures initiated by the government will likely enhance India’s long–term growth potential in the years ahead. Barring global economic and political developments and potential conflicts in the neighbourhood, given recent improvements in India’s policy environment, India is likely to evolve into a more attractive investment destination.

100
JULIUS BAER WEALTH REPORT: INDIA
SUCCESSION PLANNING – PASSING ON THE BATON IN INDIA
In India, we are witnessing a twin phenomenon of significant wealth creation alongside a rising trend of intergenerational wealth transfers. It is estimated that around USD 343 bn wealth will pass down from one generation to the next over the next 20 years (Source: Forbes list of Top 100 richest Indians). This wealth consists of personal assets as well as business net worth. Many families will transfer their wealth successfully, yet there will be many others who will struggle to do it. So what does succession planning mean? What are the steps involved in it and how to prepare oneself for it?
Succession PlanningMost of the families in India are now aware of the importance of personal wealth succession planning and they have tried to implement the succession plan in the best possible way, be it a Will or a Family Trust. Wealth succession planning is no more a taboo subject. But when it comes to planning for succession of business, there is still a lacuna. Speak to family business owners about this apathy, and the apprehensions that one encounters are
1. Fear of losing control over a business which has been built by the owner personally
2. Fear of losing social status and pivotal position in the family
3. Fear of losing financial independence
4. Fear of business being destroyed
5. Unavailability of suitable successor from the next generation
6. Dilemma in choosing the right successor
7. Successor being too young
According to Professor Ramachandran of Indian School of Business who advises many business families on succession planning “those in decent health do not recognise the need to have a change or a second line of command; this is particularly so for those with high level of mental energy even if physically not that strong”. Taxes and other legal expenses also play their part in succession planning. When it comes to choosing a successor in non–family managed businesses, the reasons are completely different. Such organisations have collective decision making mechanisms, which makes getting consensus on a crucial matter such as succession a difficult task. Also many times interests of all the stakeholders are not necessarily aligned. Succession planning in non–family managed businesses is often driven by occurrence of an event such as resignation or death of a CEO or it could also be market driven. But overall family business owners are comparatively better at succession planning. If we look at Forbes list of top 100 richest Indians, most of them have already started the process of passing the baton on to the next generation. A study conducted by the Boston Consulting Group in 2015 also highlights that the family business leaders ranked succession as the second–most–important subject on their minds. So what are the typical strategies that are followed by these family business owners?
Succession planning strategies1. Grooming the eldest male child in the family to
become the leader; according to leading family business advisor Mr. Anil Sainani quite a few of his clients still see the eldest male child as a potential successor. “In some cases where daughters are given ownership, they may not be the first or obvious choice for succeeding in the management role” says Anil. The children are encouraged to work outside the family business to hone the basic management skills.

101
JULIUS BAER WEALTH REPORT: INDIA
2. Employing a bridge or a caretaker Managing Director till the time next generation is ready to become a leader.
3. Appointing external professionals to manage the business whereas ownership continues in the family. This strategy is typically adopted by the families who do not have a suitable successor in the family or the successor(s) is not keen to play an active role in the family business management.
But these strategies primarily work for the first or second generation businesses. When the business grows beyond second generation and there is more cousin consortium, owners often end up fragmenting the business wherever possible. Such fragmentation if done ahead of disputes, can actually help all segmented businesses flourish. But, if not done proactively it can destroy the family wealth and reputation substantially.
This is an era of unicorns where success has a different connotation. Most of the start–ups these days are built to be sold, and very few intend to run them for generations. Here the succession strategy is completely different. For wealth succession entrepreneurs rely on ‘shareholders agreement’ whereas business succession is more driven by the Private Equity and Venture capitalists.
“We have very strong succession plans across
all group companies. But we do not comment on it.
The retirement age is 60 years, but it does not apply to
family professionals who work in the business.”
Adi Godrej 1
Changing landscape in succession planning Last one decade has drawn the attention of many families to the succession planning exercise. Families have learnt from the mistakes which are done by some of their peer families. Also an effort is made by many industrial forums and entrepreneurs to create an awareness of the importance of succession planning. This awareness is also attributable to the exposure of the next generation to international practices. There is also professional help available on succession planning and mentoring as well as building good governance in the families of the business owners. Leading management institutions are also making an effort to formally groom the next generation to become the leaders. Along with this wealth managers and personal advisors have proactively started to bring up the topic of succession as a part of financial planning. Amongst all these aids there are certain best practices available. According to Professor Ramachandran it is important to consider succession planning in a proactive way than reactively. A business – family owned or otherwise – should prepare a proper succession plan underlining all guiding principles. Professor Ramachandran draws the attention to the following key aspects involved in a succession planning process:
1. Define a retirement age for all key positions
2. Identify the candidates (family members or existing employees) who can be groomed to be the managers/ leaders
3. Understand the aspirations and vision of such candidates/ family members
4. Selection of candidate should not be driven by emotion, but business wellbeing should be given the utmost importance
5. Seek external professional guidance in grooming and mentoring these candidates
6. Review the succession plan periodically to accommodate the changes in the family, business or regulation
1 Source: Times of India, Jun 15, 2013.
102
JULIUS BAER WEALTH REPORT: INDIA
It is also very important to note here that ownership succession and management succession are two different exercises and need to be dealt with different sensitivity. Ownership Succession brings a lot of responsibility along with it and hence next generation should be prepared well in advance to deal with such inheritance. But talking about wealth does not mean opening up the family’s balance sheet and sharing every detail. It is about gradually passing over information and teaching the next generation what wealth means, how it should be managed and how it impacts their lives. However families need to be particularly careful when ownership succession leads to the management succession.
Succession – retirementIt is a fact that succession and retirement are two sides of a coin. When one is planning for a succession, it obviously means the retirement of a current leader. Retirement has a negative connotation but there are many leaders who are successfully changing that
perception. Instead of retiring from something, they are retiring to something. They retire from active management role but continue to provide guidance to the successors. There are certain leaders who have even taken up the task of mentoring leaders, not just in the family but outside too. Investing in the social sector or pursuing charitable endeavors is also an option many retiring leaders are exploring. But a successful succession planning is incomplete without an effective retirement planning– a financial and emotional one.
Succession planning is an exercise which has fiscal and non–fiscal impact. It can literally make or break the families and businesses. If not done proactively it can destroy the wealth for family, shareholders and society. Understanding the negative impact that it can create, regulators are also making an effort to formalise this exercise. It is important to remember that succession planning is a step by–step process – it’s not an event that happens by chance.


104
JULIUS BAER WEALTH REPORT: INDIA
NExT GENERATION ENTREPRENEURS
INTRODUCTION
Mr. Amit Lohia Group Managing Director, Indorama Corporation
Mr. Amit Lohia is a third generation entrepreneur and Group Managing Director of Indorama Corporation since 2004.
Indorama was founded in 1975 by Mr. Lohia’s father S.P., and has grown today to become a global manufacturer of a variety of industrial products with over 28,000 employees globally. The company has grown and
expanded across the years successfully into several overseas markets in North America, Africa & Europe with a number of greenfield and
acquisition projects spearheaded by Mr. Lohia himself.
In this exclusive interview, we get insights from Mr. Lohia about leadership and entrepreneurship in Asia, the influence of his Indian heritage and his views
on the challenges and opportunities ahead.


106
JULIUS BAER WEALTH REPORT: INDIA
In lieu of what is happening in the world today, how optimistic or worried are you about the current economic environment?I think there are two aspects to consider: the real economy – which is what our organisation is concerned with as a manufacturer – is still doing fine. In our case, we make products which are used ultimately in day–to–day fast moving consumer goods such as diapers, car–related products, healthcare, wellness and beauty products like cosmetics, and also food fertilisers. The consumption and demand for these still hold strong so our core business is holding up well and I’m fairly optimistic that it will continue to be so in the near future.
I think the financial markets are probably showing more nervousness than I see in our core business. In terms of a macro scenario, we are now in a new paradigm of lower and slower global growth. While we knew this was inevitable and had to come, yet when it came, it still hit us hard and everyone is now getting accustomed to this era of slower growth.
How do you view the monetary and fiscal policies that have been introduced over the past few years? Has the business environment become more certain or do you think it has become riskier?What affects us directly in our business and our investments are interest rates. I think the low interest rates of the past several years have done their job in most parts, but going forward, I don’t think we can bank on it too much more. It has served its purpose and we need to move on and not depend on it too much to save the economy.
At the same time, I don’t foresee rates nor inflation to go up too much. Everyone understands and recognises that rapid rising interest rates will do more harm than good – not just for corporations and individuals, but even for governments with high level of debts. It is in nobody’s interest to raise rates. Inflation should also remain fairly under control.
How do you view the Asian economy right now and in the foreseeable future?Asia continues to be important as an economic region for the world and it is also a key part of our business portfolio. While we focus more on organic growth in this region specifically for our business in Southeast Asia, a lot of our assets in China were possible due to the acquisitions we made. When we do M&A acquisitions in the Americas or in Europe, we often acquire their operations and assets in Asia, particularly in China where we have seen strong growth in the country.
Is innovation a key area of focus in your business?Innovation is actually something we think about a lot internally, and we try to imbue it as part of our corporate culture. I am of the view that innovation should not be compartmentalised as a function in a company and it is key to have all employees think and exercise innovation in their respective functions.
Innovation is not the sole responsibility of the R&D team and it is, in fact, a journey that should be followed collectively by all in the company. It takes time and has to be implemented both at a top–down and bottoms–up approach.
In our company, all business managers demonstrate innovation by spearheading special projects and we have seen that such participation has helped foster the spirit of innovation within our organisation. For example, one which I personally lead is an information–sharing platform likened to a social media sharing platform which we hope will make sharing and learning of information and best practices – a fun, interactive and informative experience.

107
JULIUS BAER WEALTH REPORT: INDIA
How do you keep your entrepreneurial spirit sharp when it comes to managing your business?I believe in the importance of being hands–on yet not micro–managing. It may be a balancing act but it can be done. We practise this in our company where senior managers are hands–on in their respective area but yet empower junior managers sufficiently without being stifling.
We also have to reward entrepreneurial spirit and behaviour and that is also something we try to do. We encourage employees to take on projects and assume the role of a project leader. As the project leader, they are given the autonomy of running the project akin to running their own business; having a proper business case, project plan and managing risks and budgets.
As a successful Global Indian, what do you see as the strengths and weaknesses of the Indian economy?India is very entrepreneurial as a nation, aided particularly by its large population and rising middle class. Prime Minister Modi’s ‘Make in India’ initiative seems to be pushing the right buttons and sending a strong positive signal and all these can only bode well for the country to cement its position as a leading economy of the world. In terms of challenges, the high interest rates observed will impact growth for the country. I am also of the opinion that prudent financial discipline can be better in many Indian organisations.
Would you say your Indian heritage has influenced your views and practices both personally and professionally?I come from a traditional Indian family and our business remains primarily family–owned, so in this aspect, our corporate culture is still very much family–oriented. It is a seemingly simple concept but yet very powerful notion. We believe in taking care of each other and this applies not only to our family relationships but it also extends to our company where every employee in our organisation is part of the family.
My father built the company and led it to its success and preserving our family legacy is very important to us and ensuring the preservation of our business for the next generation is part of our DNA. We promote values such as hard work, dedication, commitment, and loyalty in our family as well as in our company culture.
What is your management philosophy? How are you like as a leader?While I can be very empirical and I love data, I am on the other hand very easy going and believe in the power of delegation. I am more risk averse than my father but I believe we have been well–balanced in our investment decisions.
When I joined Indorama (as my first job), I learned as much as I could from my father in managing the business and now that I have taken over the day–to–day running of the operations, one common trait we still share is our people–oriented approach which is still very much evident in our company culture to date.

108
JULIUS BAER WEALTH REPORT: INDIA
INTRODUCTION
Mr. Wu xinhong Co–founder and Chief Executive Officer, Meitu, Inc.
Mr. Wu Xinhong is co–founder and CEO of Meitu, Inc. which was established in 2008. After three years of idea conceptualisation,
Meitu launched it’s first mobile app on 14 February 2011. Since then, riding on the exponential growth of smartphone users in China,
Meitu’s suite of apps, which include MeituPic and BeautyPlus, have been activated on more than 1.1 billion unique smartphones.
Mr. Wu believes Meitu’s growth opportunities are still abundant in the global scene. Currently, more than 80% of Meitu’s users come from
the Greater China region. Developing countries such as Indonesia and India are at the top of his list to expand Meitu’s presence as market saturation
and intense competition in developed nations limit growth opportunities.
We sit down for an exclusive interview with Mr. Wu to discuss the opportunities and challenges for aspiring entrepreneurs in China.


110
JULIUS BAER WEALTH REPORT: INDIA
What are the biggest challenges (obstacles) you’ve encountered while building Meitu? How have you tackled them?The first major challenge we have encountered was between 2008 and 2010, when Meitu planned to launch the mobile version of MeituPic (called Meitu xiuxiu in China). iPhone 1 was released in 2007. We realised that smartphones were becoming a mega–trend. However, we could not find engineers specialised in iOS and Android development, as Meitu is located in xiamen, a city with a relatively small talent pool. Therefore, the mobile version of MeituPic has remained an idea for over two years. MeituPic’s first mobile version was officially launched on 14 February 2011, the Valentines’ Day. From idea conceptualisation in 2009 to the official launch in 2011, it took us three years. Luckily, the smartphone has remained a niche market product until 2011.
In 2011, smartphone users grew exponentially. Meitu grabbed and leveraged on this opportunity. Nevertheless, we believe that it could have turned out to be even better if the product had been launched earlier, since optimal user experience could only be achieved through constant product optimisation and upgrade.
The second challenge we face is the current one, that is, migrating the Meitu suite of apps into platform and materialise the commercialisation of our product chain.
Over the next five years, what do you expect to be the key opportunities and challenges facing your business?In the next five years, a big opportunity not to be missed by Meitu is the rising of the post–00s generation, such as those born from 2000 to 2009. We have leveraged on the opportunity when the post–90s users became the mainstream. Likewise, we have to leverage on the rising of the post–00s generation. Another opportunity not to be missed is the exponential growth of online videos and the boom of user generated content (UGC). Previously, Youku Inc., (formerly known as Youku.com) and iQIYI.com operated more or less like online TV stations in China, streaming professionally produced videos they had procured. UGC is gaining traction in China, e.g. Papi Jiang (‘ papi醬’), the most viewed video blogs produced by a talented Chinese video blogger Jiang Yilei, is a typical example of UGC. Previously people doubted whether this type of content would be popular among online viewers, whereas nowadays the younger generation enjoys watching videos produced by their peers. The growth of smartphone users between 2008 and 2015 brought about the explosive growth of visual content. We see 2015 as a turning point when online video started to gain traction. We see substantial growth potential for online videos, including UGC and live stream, both of which use video as media. Meipai, the video editing app launched by Meitu in 2014, also uses video as media.
What products have Meitu launched globally? Has Meitu initiated internationalisation procedures?We have successfully launched some products globally. BeautyPlus, the global version of BeautyCam (called 美顏相機 in Chinese), is used by over 100 million users globally. India is one of Meitu’s biggest overseas markets. Meitu’s applications are popular among Japanese users too. Step by step, we will launch the global version of all major products. We have set up offices in seven countries and regions outside China, namely Brazil, Hong Kong, Singapore, India, Indonesia, Japan and the US. The overseas representative offices focus on products localisation and business development.

111
JULIUS BAER WEALTH REPORT: INDIA
What makes Meitu stand out from its peers? We pay great attention to young users and value their need and preference. As students, they think and behave differently from the rest of us who have joined the workforce. Back in 2007, I developed a Martian Translator, many of its users were post 90s who were considered the ‘non–mainstream’ then. In 2008, we launched MeituPic, targeting young users who were born after the 1990s. Today, we see the boom in demand from the post–00 users who are to turn into the mainstream. Therefore, we value their need and preference.
What is the key message from your experience that you want to share with aspiring entrepreneurs?I would think of two terms which are of crucial importance to me: one is ‘unpredictable’ and the other is ‘anatta’. In an ever–evolving marketplace with ever–changing user demographics, we need to be open–minded and flexible to embrace all the changes. Entrepreneurs need to embrace the changes with a positive mind–set, since changes might be good or bad. When you are running a business, you tend to be self–centred and make decisions by yourself. However, as the company grows, personal influence and energy is not enough to ensure effective communication with each and every person, therefore, there’s a need for decentralisation in order to ensure effective communication within the company. ‘Anatta’, or selfless, can make you see things from others’ perspective, for example, that of the users, colleagues or partners. These two points are really important.
The future development of Meitu cannot solely rely on my own efforts. I need to step back, and transform Meitu into a platform and consequently it would enter into an elevated platform which requires more support. I hope that products can be made efficiently, with each colleague doing their own job. The products are handled by their own project teams. Given my experience, I am able to provide more support to this platform, helping each person to unleash their potential.
As a successful Chinese technopreneur, what do you see as the opportunities and challenges in the current market environment in China? Do you feel the current market environment in China is supportive for young entrepreneurs like you?A huge opportunity has arisen in China at the moment–the state is encouraging entrepreneurship and innovation. This is an extremely good thing. It has been more than 15 years since I started my own business. We saw unprecedented level of support for innovation from the government. You will find that the entire chain is increasingly improved and becoming more mature, which is a fantastic historical opportunity. China’s Internet industry is booming, which renders a great help to entrepreneurs. In the past, it was pretty difficult for a product to reach out to 1 billion users within a day. However, now with WeChat, good things can go viral instantly. It might be a fun game, or a good film. Good things can become a hit and make headline instantly, which means that in a very mature market, as long as you can come out with a good product, you then have the leverage to quickly reach out to more users in a well–established platform. It’s not like before when products lacked distribution channels.
What challenges are there in the current market?At present, some oligarchies have already formed in China. If one has not joined their system, it is very hard to quickly get the needed resources. In China, we have magnates like BAT (Baidu, Alibaba and Tencent). Their presence is seen in almost every arena. This could turn out to be quite a challenge for start–ups.

112
JULIUS BAER WEALTH REPORT: INDIA
INTRODUCTION
Mr. Toshio Dogu Founder and Chief Executive Officer, Digital Arts Inc.
As a founder and chief executive of IT company Digital Arts, Toshio Dogu is on the forefront of meeting Japan’s evolving digital security needs.
Established in 1995, it now targets providing Internet security solutions for smartphones, building upon its established business of IT security for
corporations. Spearheading an international expansion, Digital Arts is taking its ‘Made in Japan’ technology to new markets and adapting its product range
as security needs increase rapidly on the back of new portable services.
Social responsibility is a hallmark of Digital Arts, as many of its products help to filter content and make devices safer for all to use.
In the next pages, Dogu–san explains to us how his approach to being an entrepreneur has changed over time and what his vision for the future is.


114
JULIUS BAER WEALTH REPORT: INDIA
What do you do to keep the entrepreneurial focus sharp in a your company?As an entrepreneur, I take the similar perspective that parents have towards their children. Consequently, it is vital for me to protect my child (company), see it grow and succeed in society overall. This is arguably different from a manager who is not an owner at the same time. While important, I do not concern myself solely with sustaining high profile margins or creating a well–known brand. Rather, my higher goal is to work towards keeping the child (company) in good condition for the longer term.
What are currently your highest priorities? In many ways, companies can be seen as people. In this context, I feel that most people are running at only 60% of their true capacity, irrespective of their education and abilities. So it is up to the organisation to create an environment where people can reach their true potential and go beyond. Naturally here we also speak of staff evaluation and compensation models. I have found that some firms offer high returns for staff taking higher risks, which is very clear cut from a management perspective; it follows a ‘give and take’ principal. However, what is lost is the importance of performance as a team. It is essential to maintain a good balance to achieve strong results as a group, and therefore, my focus is on building an organisation and environment where people feel inspired to deliver 130%.
How do you approach the topic of innovating your business?We approach innovation differently from large companies, where very often the goal is to achieve sales target. Rather, we raise the question, “what can we change?” or “what can we solve?” and build our marketing and innovation activities around the search for those answers. This is also in contrast to the manufacturing sector, where innovation is planted like a seed and technology adapts over time. In our case, the technology we use has been around for some time, but we can apply it in new ways, creating an entirely new concept. Indeed this can be patented and is a ‘sweet spot’ that we target.
Are you more or less optimistic today than one year ago, regarding the global economy?As we only recently started our overseas operations, the global economy per se has not been a material factor as of yet. That said, we are very optimistic about the growth prospects of our overall business, as IT is the foundation of the global economy going forward and cybersecurity will certainly play a crucial role. What we observe is that security demand has not kept pace with the development of IT in general. In part, this is because too often people believe that security related incidents “surely cannot happen to me”. Organisations have not experienced significant damage in order to take cybersecurity seriously, and I feel that many are not aware that various risks increase as IT usage grow at a rapid pace. By extension, the importance of IT security will not be left behind as risks need to be addressed.
Which markets do you regard as growth markets in Asia/globally for your business?We are present in both North America and Asia, but we believe our largest growth market right now is Europe. From a cultural perspective, the IT security needs of European consumers are a good match for our business strategy. We are currently setting up our operations in London which will be launched by Summer 2016. For the IT industry in general, however, we see ample opportunities that stretch across Asia, Africa and into South America as well.
Over the next five years, what do you expect to be the key opportunities and challenges facing your business?Our firm has a 50% market share in the Japanese market. Currently, no Japanese IT company has succeeded on a global scale. As a Japanese IT company, our ambition is to grow beyond our domestic success and meet the challenges and opportunities in the international markets, notably our North American counterparts. In short, our goal is to bring de facto solutions to the global market.

JULIUS BAER WEALTH REPORT: INDIA
What is the key message from your experience that you want so share with aspiring entrepreneurs?I believe it is important to remember that when individuals are starting out, be it as entrepreneurs or otherwise, there is a great deal to learn from others. Education is a measure of success for students, however it does not guarantee your success in your career. A certain measure of patience is therefore needed to absorb useful lessons from colleagues and those that have led the way before us. Beyond this, I find that very often entrepreneurs are active in industries that they first started off in as employees, so when you chose your first job, think to yourself “can I devote my life and career to this industry?” Paying close attention to what you experience early on in your working life has great value.

116
JULIUS BAER WEALTH REPORT: INDIA
CONCLUSIONS
Despite the fact that it has been almost a decade since the Global Financial Crisis, the consensus among investors that a recovery has come full circle has yet to be formed with confidence. This is evidenced by the seemingly contradictory signs regarding the state of the global economy, Asia included. Asia’s growth rates and overall economic fundamentals remain better positioned than the rest of the world, albeit there are clear signs of secularly lower growth. In such an environment, how should investors view the prospects for wealth creation in Asia?
Reflecting upon this year’s Julius Baer Wealth Report: Asia, our main takeaway is that sector–level evidence confirms Asia’s deserved reputation of dynamism and change. Adoption rates of new technologies that enable consumption and higher value added services are not homogenous across the region, implying that several key economies have ample room to catch up, spurring wealth creation well into the medium term. Mature economies like Hong Kong, Singapore and Japan promise to grow slower, but can take advantage of their sizable accumulation in financial and human capital. As Asia integrates further over the coming years, our key concern is the rise of barriers to trade and protectionism, which threaten value chains across the world and is a risk that needs to be closely monitored.


118
JULIUS BAER WEALTH REPORT: INDIA
IMPORTANT LEGAL INFORMATIONThis publication constitutes marketing material and is not the result of independent financial/investment research. Therefore it has not been prepared in accordance with the legal requirements regarding the independence of financial/investment research and is not subject to any prohibition on dealing ahead of the dissemination of financial/investment research.
The information and opinions expressed in this publication were produced by Bank Julius Baer & Co. Ltd., Singapore branch, which is regulated by the Monetary Authority of Singapore, as of the date of writing and are subject to change without notice. This publication is intended for information purposes only and does not constitute an offer, a recommendation or an invitation by, or on behalf of, Bank Julius Baer & Co. Ltd., Singapore branch, or of its subsidiaries or affiliated companies (Julius Baer) to make any investments. Opinions and comments of the authors reflect their current views, but not necessarily those of other Julius Baer entities or any other third party.
Services and/or products mentioned in this publication may not be suitable for all recipients and may not be available in all countries. Clients of Julius Baer are kindly requested to get in touch with the local Julius Baer entity in order to be informed about the services and/or products available in such country.
This publication has been prepared without taking account of the objectives, financial situation or needs of any particular investor. Before entering into any transaction, investors should consider the suitability of the transaction to individual circumstances and objectives. Any investment or trading or other decision should only be made by the client after a thorough reading of the relevant product term sheet, subscription agreement, information memorandum, prospectus or other offering document relating to the issue of the securities or other financial instruments. Nothing in this publication constitutes investment, legal, accounting or tax advice, or a representation that any investment or strategy is suitable or appropriate for individual circumstances, or otherwise constitutes a personal recommendation for any specific investor. Julius Baer recommends that investors independently assess, with a professional advisor, the specific financial risks as well as legal, regulatory, credit, tax and accounting consequences. The value of investments may fall as well as rise, and returns may be affected by exchange rates. The investor may not get back the amount invested. Past performance is not a reliable indicator of future results. Performance forecasts are not a reliable indicator of future performance.
Although the information and data herein are obtained from sources believed to be reliable, no representation is made that the information is accurate or complete. Julius Baer does not accept liability for any loss arising from the use of this publication. This publication may only be distributed in countries where its distribution is legally permitted. This publication is not directed to any person in any jurisdiction where (by reason of that person’s nationality, residence or otherwise) such publications are prohibited.
External Asset Managers/External Financial Advisors: in case this marketing publication is provided to an External Asset Manager or an External Financial Advisor, Julius Baer expressly prohibits that it is redistributed by the External Asset Manager or the External Financial Advisor and is made available to their clients and/or third parties. By receiving any marketing publication, the External Asset Managers or the External Financial Advisors confirm that they will make their own independent analysis and investment decisions, if applicable.
India: This is not a publication of Julius Baer Wealth Advisors (India) Private Limited (JBWA) (a group company of Julius Baer, Zurich) or any of its Indian subsidiaries under the SEBI Research Analyst Regulations, 2014. This publication has been produced by Bank Julius Baer & Co. Ltd. (Julius Baer), a company incorporated in Switzerland with limited liability and it does not have a banking license in India. This publication should not be construed in any manner as an offer, solicitation or recommendation by JBWA or any Julius Baer entity globally.
United States: NEITHER THIS PUBLICATION NOR ANY COPY THEREOF MAY BE SENT, TAKEN INTO OR DISTRIBUTED IN THE UNITED STATES OR TO ANY US PERSON.
This publication may contain information obtained from third parties, including ratings from rating agencies such as Standard & Poor’s, Moody’s, Fitch and other similar rating agencies. Reproduction and distribution of third–party content in any form is prohibited except with the prior written permission of the related third party. Third–party content providers do not guarantee the accuracy, completeness, timeliness or availability of any information, including ratings, and are not responsible for any errors or omissions (negligent or otherwise), regardless of the cause, or for the results obtained from the use of such content. Third–party content providers give no express or implied warranties, including, but not limited to, any warranties of merchantability or fitness for a particular purpose or use. Third–party content

119
JULIUS BAER WEALTH REPORT: INDIA
providers shall not be liable for any direct, indirect, incidental, exemplary, compensatory, punitive, special or consequential damages, costs, expenses, legal fees, or losses (including lost income or profits and opportunity costs) in connection with any use of their content, including ratings. Credit ratings are statements of opinions and are not statements of fact or recommendations to purchase, hold or sell securities. They do not address the market value of securities or the suitability of securities for investment purposes, and should not be relied on as investment advice.
© Julius Baer Group, 2016


JULIUS BAER GROUP
Head OfficeBahnhofstrasse 36
P.O. Box8010 ZurichSwitzerland
Telephone +41 (0) 58 888 1111Fax +41 (0) 58 888 1122
www.juliusbaer.com
JULIUS BAER WEALTH ADVISORS(INDIA) PVT. LTD.
Head Office8th Floor
Mafatlal CentreNariman Point
Mumbai 400 021
JULIUS BAER CAPITAL (INDIA) PVT. LTD.Registered & Main Office
8th floorMafatlal CentreNariman Point
Mumbai 400 021www.juliusbaer.in
The Julius Baer Group is present in more than50 locations worldwide,
including Zurich (Head Office), Bangalore, Chennai, Kolkata, Mumbai, New Delhi, Dubai,
Frankfurt, Geneva, Hong Kong, London, Luxembourg, Monaco,
Singapore and Tokyo.
11.2016 Publ. No. PU00480EN © JULIUS BAER GROUP, 2016