
Waveshapes of continuing currents and properties of M-components in natural negative cloud-to-ground...
9
Waveshapes of continuing currents and properties of M-components in natural negative cloud-to-ground lightning from high-speed video observations Leandro Z.S. Campos, Marcelo M.F. Saba ⁎ , Osmar Pinto Jr., Maurício G. Ballarotti National Institute for Space Research — INPE, Av. dos Astronautas, 1758, S. José dos Campos, SP, P.O. Box 515–12201–970, Brazil Received 19 May 2005; received in revised form 14 September 2006; accepted 14 September 2006 Abstract Continuing current is a continuous mode of charge transfer to ground in a lightning flash. The extent to which the continuing current contributes to the total negative charge lowered to earth is large. In order to study the waveshape of the continuing currents of natural flashes, we developed a computational algorithm that analyzes the pixels of the images obtained by a high-speed camera and plots luminosity-versus-time. Tower measurements have shown that during the continuing current phase of the flash the luminosity of the channel is directly proportional to the current that flows through it. Using this information it was possible to infer the continuing current waveshape for 63 natural discharges and classify them into six different types. Statistics on some characteristics of 345 M-components (that occurred during the same 63 events) are also presented. As far as we know, this is the first study on waveshapes of continuing currents for natural lightning. © 2006 Elsevier B.V. All rights reserved. Keywords: Continuing current; Waveshape; M-component; Lightning; High-speed video 1. Introduction and review As described by previous works (Rakov et al., 2001; Rakov and Uman, 2003), there are three possible modes of charge transfer to ground associated with the strokes in negative lightning discharges: the return stroke, the con- tinuing current (CC) and the M-component. As the last two modes are the subject of this study, a brief description of them is presented. 1.1. Continuing current Kitagawa et al. (1962) and Brook et al. (1962) defined “long” continuing current (CC) as indicated by a steady electric field change with a duration in excess of 40 ms. Shindo and Uman (1989) defined “short” CC as indi- cated by a similar field change with a duration between 10 ms and 40 ms, and “questionable” lasting 1 to 10 ms. Ballarotti et al. (2005), based on data from a high-speed video system, and avoiding contamination from what could just be return stroke pulse tails, introduced the term “very-short” defining continuing currents with a Atmospheric Research 84 (2007) 302 – 310 www.elsevier.com/locate/atmos ⁎ Corresponding author. Av. dos Astronautas,1758-P.O. Box 515– 12201–970,S. José dos Campos, SP, Brazil. Tel.: +55 12 3945 6768; fax: +55 12 3945 6810. E-mail addresses: [email protected] (L.Z.S. Campos), [email protected] (M.M.F. Saba), [email protected] (O. Pinto), [email protected] (M.G. Ballarotti). 0169-8095/$ - see front matter © 2006 Elsevier B.V. All rights reserved. doi:10.1016/j.atmosres.2006.09.002
-
Upload
independent -
Category
Documents
-
view
1 -
download
0
Transcript of Waveshapes of continuing currents and properties of M-components in natural negative cloud-to-ground...
4 (2007) 302–310www.elsevier.com/locate/atmos
Atmospheric Research 8
Waveshapes of continuing currents and properties of M-componentsin natural negative cloud-to-ground lightning from
high-speed video observations
Leandro Z.S. Campos, Marcelo M.F. Saba⁎, Osmar Pinto Jr., Maurício G. Ballarotti
National Institute for Space Research — INPE, Av. dos Astronautas, 1758, S. José dos Campos, SP, P.O. Box 515–12201–970, Brazil
Received 19 May 2005; received in revised form 14 September 2006; accepted 14 September 2006
Abstract
Continuing current is a continuous mode of charge transfer to ground in a lightning flash. The extent to which the continuingcurrent contributes to the total negative charge lowered to earth is large. In order to study the waveshape of the continuing currentsof natural flashes, we developed a computational algorithm that analyzes the pixels of the images obtained by a high-speed cameraand plots luminosity-versus-time. Tower measurements have shown that during the continuing current phase of the flash theluminosity of the channel is directly proportional to the current that flows through it. Using this information it was possible to inferthe continuing current waveshape for 63 natural discharges and classify them into six different types. Statistics on somecharacteristics of 345 M-components (that occurred during the same 63 events) are also presented. As far as we know, this is thefirst study on waveshapes of continuing currents for natural lightning.© 2006 Elsevier B.V. All rights reserved.
Keywords: Continuing current; Waveshape; M-component; Lightning; High-speed video
1. Introduction and review
As described by previous works (Rakov et al., 2001;Rakov and Uman, 2003), there are three possible modesof charge transfer to ground associated with the strokes innegative lightning discharges: the return stroke, the con-tinuing current (CC) and the M-component. As the last
⁎ Corresponding author. Av. dos Astronautas,1758-P.O. Box 515–12201–970,S. José dos Campos, SP, Brazil. Tel.: +55 12 3945 6768;fax: +55 12 3945 6810.
E-mail addresses: [email protected] (L.Z.S. Campos),[email protected] (M.M.F. Saba), [email protected] (O. Pinto),[email protected] (M.G. Ballarotti).
0169-8095/$ - see front matter © 2006 Elsevier B.V. All rights reserved.doi:10.1016/j.atmosres.2006.09.002
two modes are the subject of this study, a brief descriptionof them is presented.
1.1. Continuing current
Kitagawa et al. (1962) and Brook et al. (1962) defined“long” continuing current (CC) as indicated by a steadyelectric field change with a duration in excess of 40 ms.Shindo and Uman (1989) defined “short” CC as indi-cated by a similar field change with a duration between10 ms and 40 ms, and “questionable” lasting 1 to 10 ms.Ballarotti et al. (2005), based on data from a high-speedvideo system, and avoiding contamination from whatcould just be return stroke pulse tails, introduced theterm “very-short” defining continuing currents with a
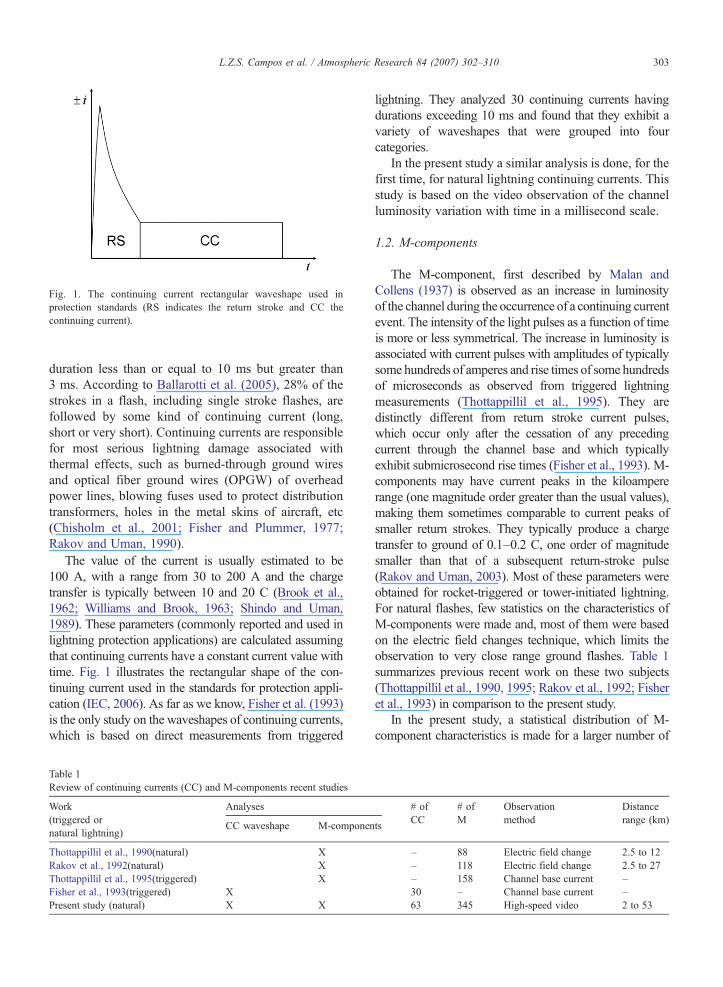
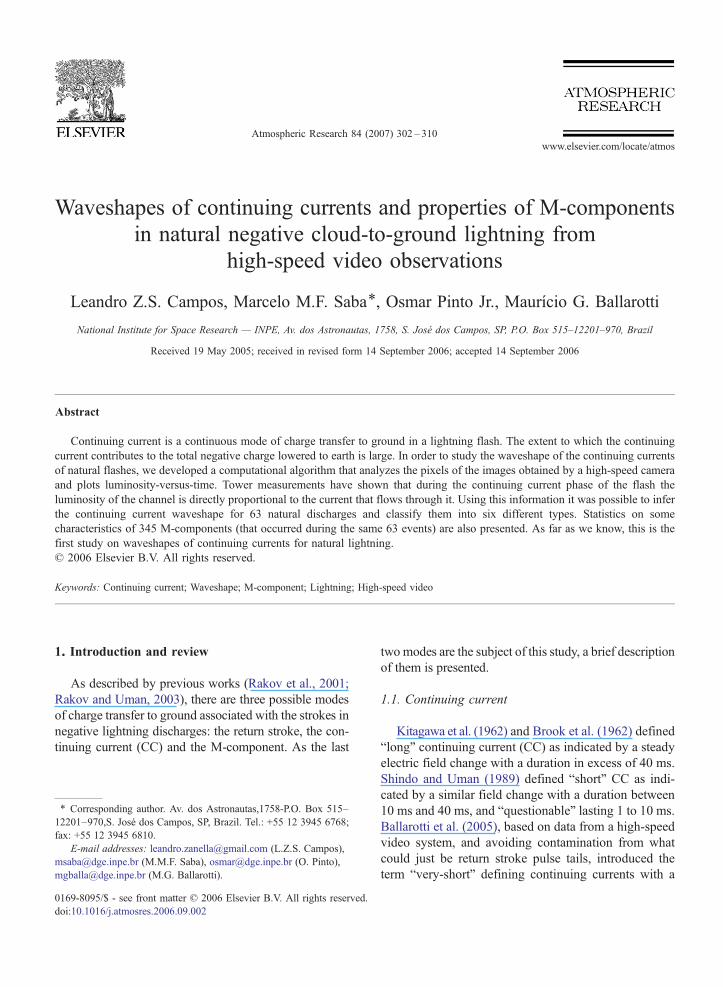
Fig. 1. The continuing current rectangular waveshape used inprotection standards (RS indicates the return stroke and CC thecontinuing current).
303L.Z.S. Campos et al. / Atmospheric Research 84 (2007) 302–310
duration less than or equal to 10 ms but greater than3 ms. According to Ballarotti et al. (2005), 28% of thestrokes in a flash, including single stroke flashes, arefollowed by some kind of continuing current (long,short or very short). Continuing currents are responsiblefor most serious lightning damage associated withthermal effects, such as burned-through ground wiresand optical fiber ground wires (OPGW) of overheadpower lines, blowing fuses used to protect distributiontransformers, holes in the metal skins of aircraft, etc(Chisholm et al., 2001; Fisher and Plummer, 1977;Rakov and Uman, 1990).
The value of the current is usually estimated to be100 A, with a range from 30 to 200 A and the chargetransfer is typically between 10 and 20 C (Brook et al.,1962; Williams and Brook, 1963; Shindo and Uman,1989). These parameters (commonly reported and used inlightning protection applications) are calculated assumingthat continuing currents have a constant current value withtime. Fig. 1 illustrates the rectangular shape of the con-tinuing current used in the standards for protection appli-cation (IEC, 2006). As far as we know, Fisher et al. (1993)is the only study on the waveshapes of continuing currents,which is based on direct measurements from triggered
Table 1Review of continuing currents (CC) and M-components recent studies
Work(triggered ornatural lightning)
Analyses
CC waveshape M-componen
Thottappillil et al., 1990(natural) XRakov et al., 1992(natural) XThottappillil et al., 1995(triggered) XFisher et al., 1993(triggered) XPresent study (natural) X X
lightning. They analyzed 30 continuing currents havingdurations exceeding 10 ms and found that they exhibit avariety of waveshapes that were grouped into fourcategories.
In the present study a similar analysis is done, for thefirst time, for natural lightning continuing currents. Thisstudy is based on the video observation of the channelluminosity variation with time in a millisecond scale.
1.2. M-components
The M-component, first described by Malan andCollens (1937) is observed as an increase in luminosityof the channel during the occurrence of a continuing currentevent. The intensity of the light pulses as a function of timeis more or less symmetrical. The increase in luminosity isassociated with current pulses with amplitudes of typicallysome hundreds of amperes and rise times of some hundredsof microseconds as observed from triggered lightningmeasurements (Thottappillil et al., 1995). They aredistinctly different from return stroke current pulses,which occur only after the cessation of any precedingcurrent through the channel base and which typicallyexhibit submicrosecond rise times (Fisher et al., 1993). M-components may have current peaks in the kiloampererange (one magnitude order greater than the usual values),making them sometimes comparable to current peaks ofsmaller return strokes. They typically produce a chargetransfer to ground of 0.1–0.2 C, one order of magnitudesmaller than that of a subsequent return-stroke pulse(Rakov and Uman, 2003). Most of these parameters wereobtained for rocket-triggered or tower-initiated lightning.For natural flashes, few statistics on the characteristics ofM-components were made and, most of them were basedon the electric field changes technique, which limits theobservation to very close range ground flashes. Table 1summarizes previous recent work on these two subjects(Thottappillil et al., 1990, 1995; Rakov et al., 1992; Fisheret al., 1993) in comparison to the present study.
In the present study, a statistical distribution of M-component characteristics is made for a larger number of
# ofCC
# ofM
Observationmethod
Distancerange (km)
ts
– 88 Electric field change 2.5 to 12– 118 Electric field change 2.5 to 27– 158 Channel base current –30 – Channel base current –63 345 High-speed video 2 to 53
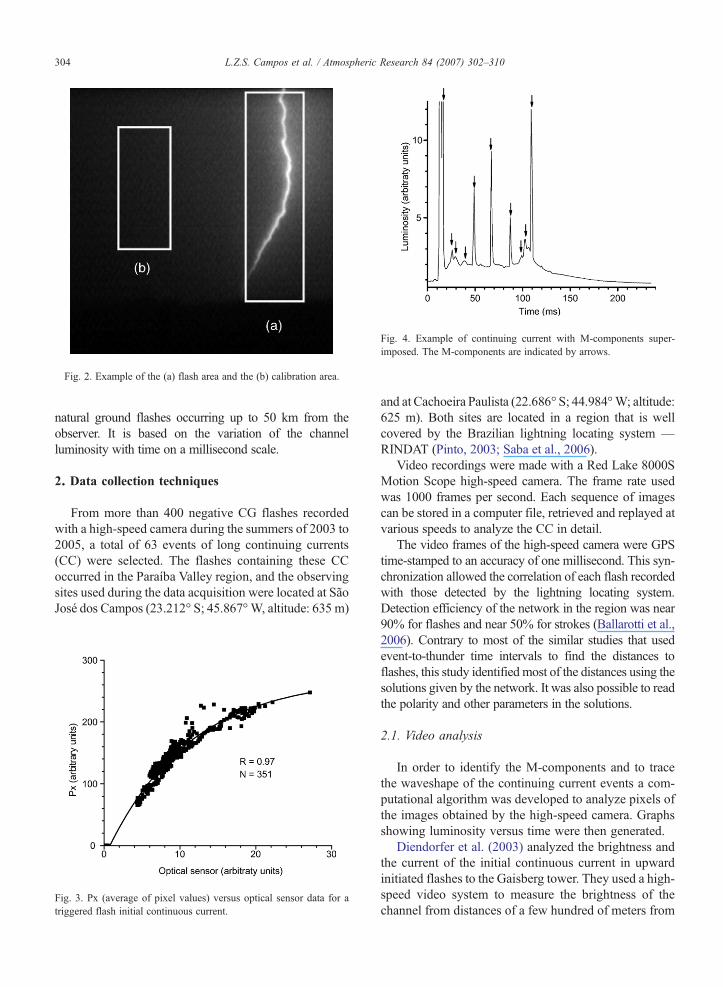
Fig. 2. Example of the (a) flash area and the (b) calibration area.
Fig. 4. Example of continuing current with M-components super-imposed. The M-components are indicated by arrows.
304 L.Z.S. Campos et al. / Atmospheric Research 84 (2007) 302–310
natural ground flashes occurring up to 50 km from theobserver. It is based on the variation of the channelluminosity with time on a millisecond scale.
2. Data collection techniques
From more than 400 negative CG flashes recordedwith a high-speed camera during the summers of 2003 to2005, a total of 63 events of long continuing currents(CC) were selected. The flashes containing these CCoccurred in the Paraíba Valley region, and the observingsites used during the data acquisition were located at SãoJosé dos Campos (23.212° S; 45.867°W, altitude: 635 m)
Fig. 3. Px (average of pixel values) versus optical sensor data for atriggered flash initial continuous current.
and at Cachoeira Paulista (22.686° S; 44.984°W; altitude:625 m). Both sites are located in a region that is wellcovered by the Brazilian lightning locating system —RINDAT (Pinto, 2003; Saba et al., 2006).
Video recordings were made with a Red Lake 8000SMotion Scope high-speed camera. The frame rate usedwas 1000 frames per second. Each sequence of imagescan be stored in a computer file, retrieved and replayed atvarious speeds to analyze the CC in detail.
The video frames of the high-speed camera were GPStime-stamped to an accuracy of one millisecond. This syn-chronization allowed the correlation of each flash recordedwith those detected by the lightning locating system.Detection efficiency of the network in the region was near90% for flashes and near 50% for strokes (Ballarotti et al.,2006). Contrary to most of the similar studies that usedevent-to-thunder time intervals to find the distances toflashes, this study identified most of the distances using thesolutions given by the network. It was also possible to readthe polarity and other parameters in the solutions.
2.1. Video analysis
In order to identify the M-components and to tracethe waveshape of the continuing current events a com-putational algorithm was developed to analyze pixels ofthe images obtained by the high-speed camera. Graphsshowing luminosity versus time were then generated.
Diendorfer et al. (2003) analyzed the brightness andthe current of the initial continuous current in upwardinitiated flashes to the Gaisberg tower. They used a high-speed video system to measure the brightness of thechannel from distances of a few hundred of meters from
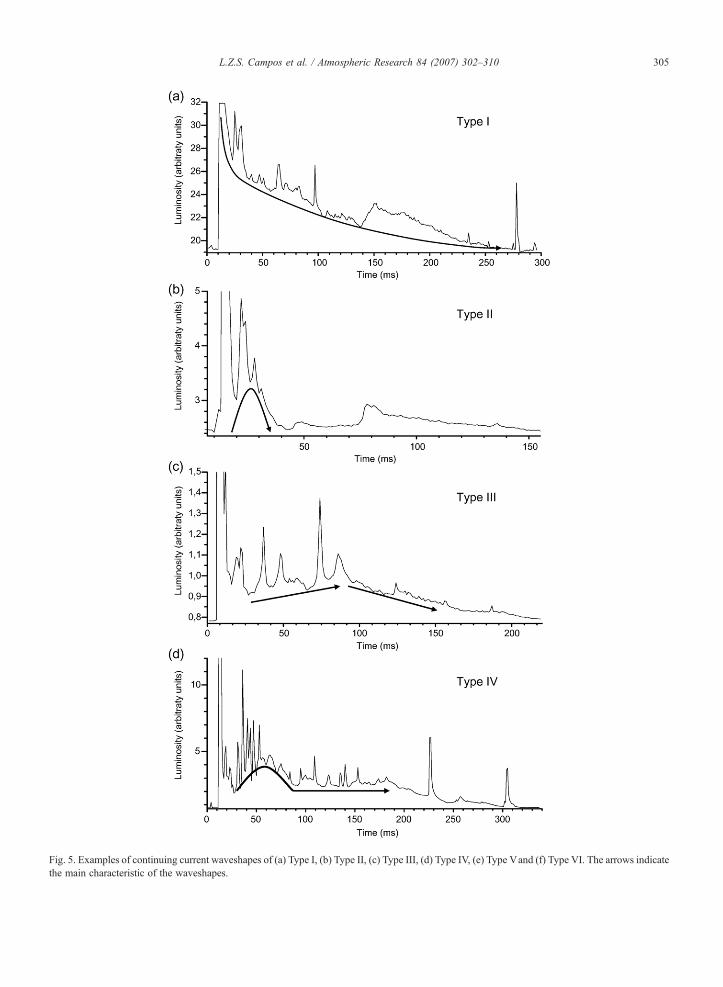
Fig. 5. Examples of continuing current waveshapes of (a) Type I, (b) Type II, (c) Type III, (d) Type IV, (e) Type Vand (f) Type VI. The arrows indicatethe main characteristic of the waveshapes.
305L.Z.S. Campos et al. / Atmospheric Research 84 (2007) 302–310
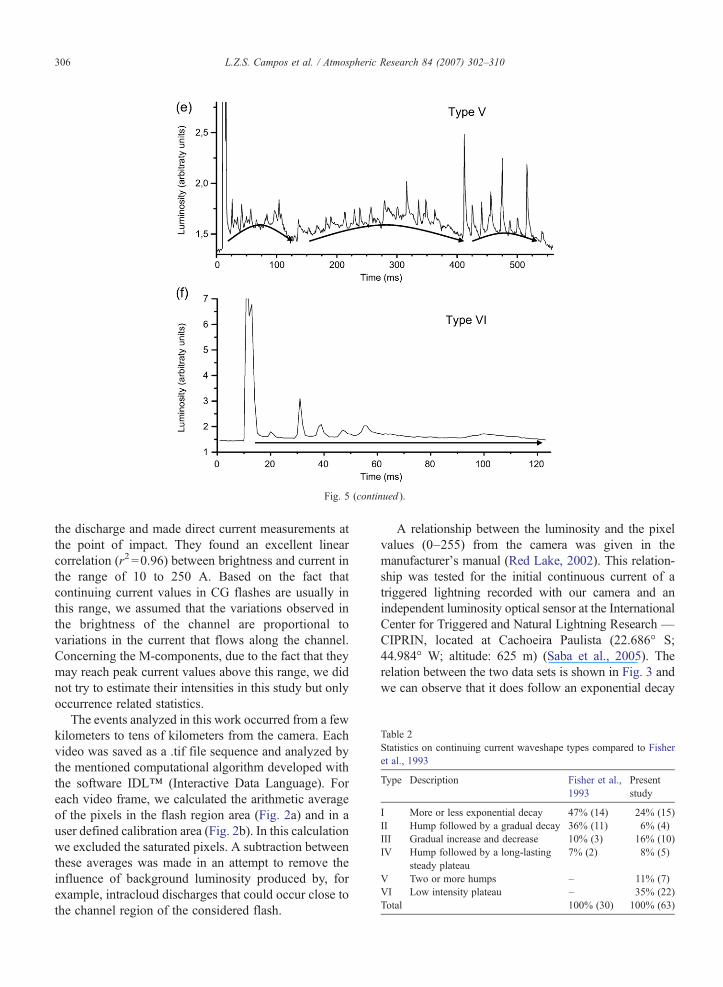
Fig. 5 (continued ).
Table 2Statistics on continuing current waveshape types compared to Fisheret al., 1993
Type Description Fisher et al.,1993
Presentstudy
I More or less exponential decay 47% (14) 24% (15)II Hump followed by a gradual decay 36% (11) 6% (4)III Gradual increase and decrease 10% (3) 16% (10)IV Hump followed by a long-lasting
steady plateau7% (2) 8% (5)
V Two or more humps – 11% (7)VI Low intensity plateau – 35% (22)Total 100% (30) 100% (63)
306 L.Z.S. Campos et al. / Atmospheric Research 84 (2007) 302–310
the discharge and made direct current measurements atthe point of impact. They found an excellent linearcorrelation (r2 =0.96) between brightness and current inthe range of 10 to 250 A. Based on the fact thatcontinuing current values in CG flashes are usually inthis range, we assumed that the variations observed inthe brightness of the channel are proportional tovariations in the current that flows along the channel.Concerning the M-components, due to the fact that theymay reach peak current values above this range, we didnot try to estimate their intensities in this study but onlyoccurrence related statistics.
The events analyzed in this work occurred from a fewkilometers to tens of kilometers from the camera. Eachvideo was saved as a .tif file sequence and analyzed bythe mentioned computational algorithm developed withthe software IDL™ (Interactive Data Language). Foreach video frame, we calculated the arithmetic averageof the pixels in the flash region area (Fig. 2a) and in auser defined calibration area (Fig. 2b). In this calculationwe excluded the saturated pixels. A subtraction betweenthese averages was made in an attempt to remove theinfluence of background luminosity produced by, forexample, intracloud discharges that could occur close tothe channel region of the considered flash.
A relationship between the luminosity and the pixelvalues (0–255) from the camera was given in themanufacturer's manual (Red Lake, 2002). This relation-ship was tested for the initial continuous current of atriggered lightning recorded with our camera and anindependent luminosity optical sensor at the InternationalCenter for Triggered and Natural Lightning Research —CIPRIN, located at Cachoeira Paulista (22.686° S;44.984° W; altitude: 625 m) (Saba et al., 2005). Therelation between the two data sets is shown in Fig. 3 andwe can observe that it does follow an exponential decay
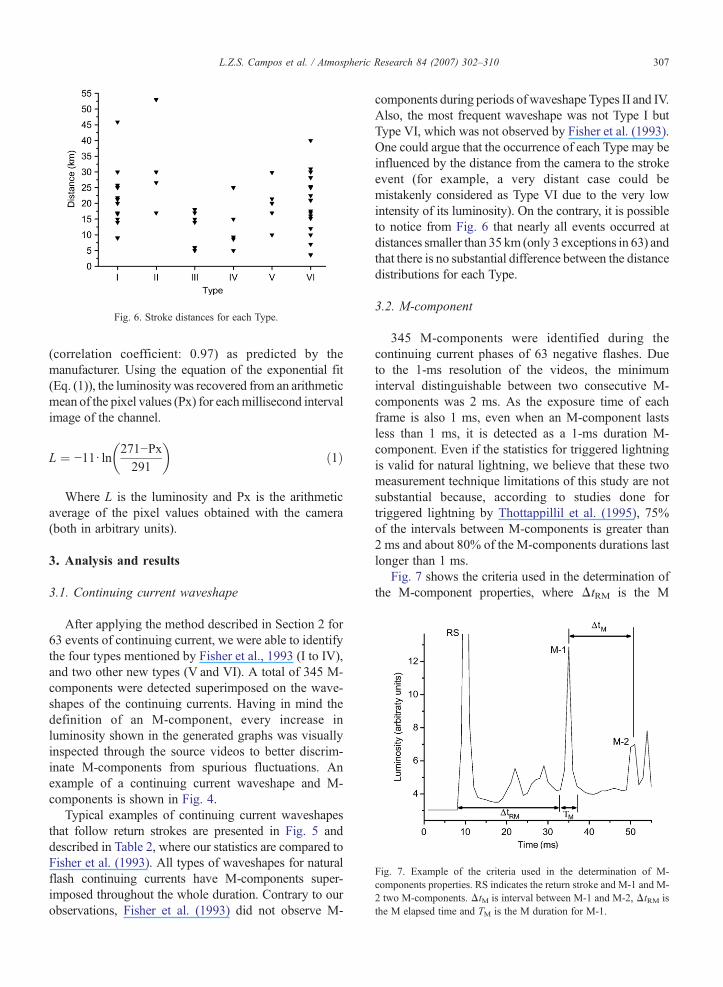
Fig. 6. Stroke distances for each Type.
Fig. 7. Example of the criteria used in the determination of M-components properties. RS indicates the return stroke and M-1 and M-2 two M-components. ΔtM is interval between M-1 and M-2, ΔtRM isthe M elapsed time and TM is the M duration for M-1.
307L.Z.S. Campos et al. / Atmospheric Research 84 (2007) 302–310
(correlation coefficient: 0.97) as predicted by themanufacturer. Using the equation of the exponential fit(Eq. (1)), the luminosity was recovered from an arithmeticmean of the pixel values (Px) for eachmillisecond intervalimage of the channel.
L ¼ −11d ln271−Px291
� �ð1Þ
Where L is the luminosity and Px is the arithmeticaverage of the pixel values obtained with the camera(both in arbitrary units).
3. Analysis and results
3.1. Continuing current waveshape
After applying the method described in Section 2 for63 events of continuing current, we were able to identifythe four types mentioned by Fisher et al., 1993 (I to IV),and two other new types (V and VI). A total of 345 M-components were detected superimposed on the wave-shapes of the continuing currents. Having in mind thedefinition of an M-component, every increase inluminosity shown in the generated graphs was visuallyinspected through the source videos to better discrim-inate M-components from spurious fluctuations. Anexample of a continuing current waveshape and M-components is shown in Fig. 4.
Typical examples of continuing current waveshapesthat follow return strokes are presented in Fig. 5 anddescribed in Table 2, where our statistics are compared toFisher et al. (1993). All types of waveshapes for naturalflash continuing currents have M-components super-imposed throughout the whole duration. Contrary to ourobservations, Fisher et al. (1993) did not observe M-
components during periods of waveshape Types II and IV.Also, the most frequent waveshape was not Type I butType VI, which was not observed by Fisher et al. (1993).One could argue that the occurrence of each Type may beinfluenced by the distance from the camera to the strokeevent (for example, a very distant case could bemistakenly considered as Type VI due to the very lowintensity of its luminosity). On the contrary, it is possibleto notice from Fig. 6 that nearly all events occurred atdistances smaller than 35 km (only 3 exceptions in 63) andthat there is no substantial difference between the distancedistributions for each Type.
3.2. M-component
345 M-components were identified during thecontinuing current phases of 63 negative flashes. Dueto the 1-ms resolution of the videos, the minimuminterval distinguishable between two consecutive M-components was 2 ms. As the exposure time of eachframe is also 1 ms, even when an M-component lastsless than 1 ms, it is detected as a 1-ms duration M-component. Even if the statistics for triggered lightningis valid for natural lightning, we believe that these twomeasurement technique limitations of this study are notsubstantial because, according to studies done fortriggered lightning by Thottappillil et al. (1995), 75%of the intervals between M-components is greater than2 ms and about 80% of the M-components durations lastlonger than 1 ms.
Fig. 7 shows the criteria used in the determination ofthe M-component properties, where ΔtRM is the M
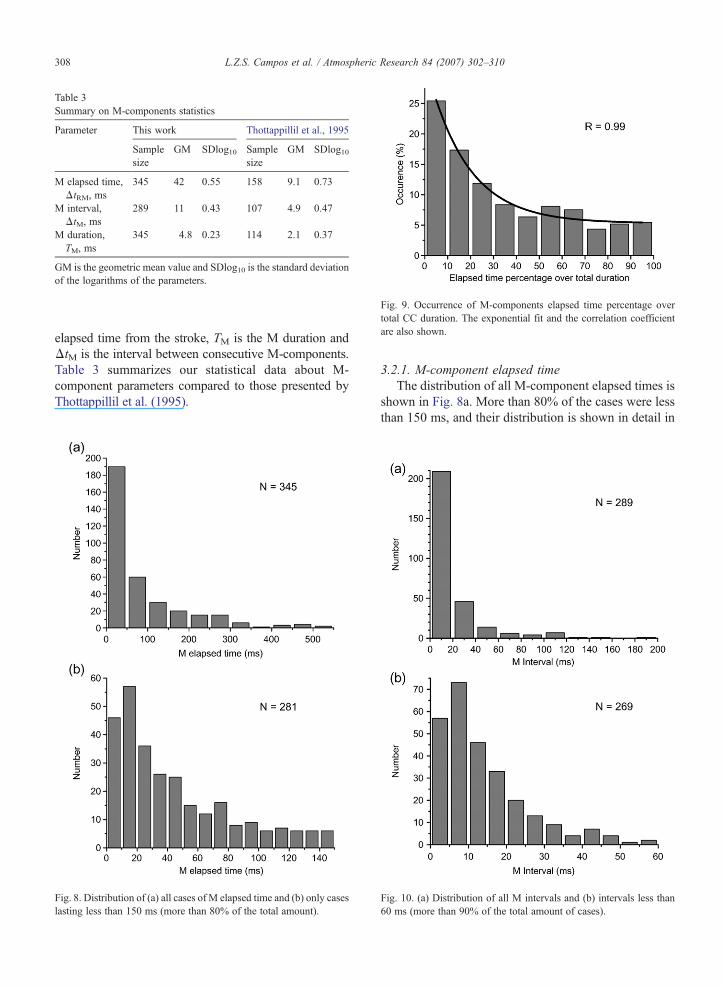
Fig. 9. Occurrence of M-components elapsed time percentage overtotal CC duration. The exponential fit and the correlation coefficientare also shown.
Table 3Summary on M-components statistics
Parameter This work Thottappillil et al., 1995
Samplesize
GM SDlog10 Samplesize
GM SDlog10
M elapsed time,ΔtRM, ms
345 42 0.55 158 9.1 0.73
M interval,ΔtM, ms
289 11 0.43 107 4.9 0.47
M duration,TM, ms
345 4.8 0.23 114 2.1 0.37
GM is the geometric mean value and SDlog10 is the standard deviationof the logarithms of the parameters.
308 L.Z.S. Campos et al. / Atmospheric Research 84 (2007) 302–310
elapsed time from the stroke, TM is the M duration andΔtM is the interval between consecutive M-components.Table 3 summarizes our statistical data about M-component parameters compared to those presented byThottappillil et al. (1995).
Fig. 8. Distribution of (a) all cases of M elapsed time and (b) only caseslasting less than 150 ms (more than 80% of the total amount).
3.2.1. M-component elapsed timeThe distribution of all M-component elapsed times is
shown in Fig. 8a. More than 80% of the cases were lessthan 150 ms, and their distribution is shown in detail in
Fig. 10. (a) Distribution of all M intervals and (b) intervals less than60 ms (more than 90% of the total amount of cases).
309L.Z.S. Campos et al. / Atmospheric Research 84 (2007) 302–310
Fig. 8b. The most frequent values occurred between 10and 20 ms (57 cases in 281).
We have normalized the M elapsed time absolutevalues in terms of percentage over the total duration of theCC, as shown in Fig. 9. These data were never presentedin the literature before. Nearly 25% of M-componentsoccur in the first 10% of the duration of the CC, and morethan 75% occur in the first half of the CC. The occurrencefollows an exponential decay with the time of thecontinuing current (correlation coefficient: 0.99).
Our geometric mean for M-component elapsed timewas 42 ms (Table 3), very different from the valuepresented by Thottappillil et al. (1995), who found 9.1 msfor triggered flashes. A possible explanation for thisdiscrepancy is that although we could not see elapsedtimes lower than 2 ms, we recorded some very long CC.The maximum value of elapsed time was 538 ms whilethe maximum value of the elapsed time found byThottappillil et al. (1995) was lower than 256 ms.
3.2.2. Time interval between successive M-componentsThe distribution of the 289 time intervals between
successive M-components is shown in Fig. 10a. Morethan 90% of the intervals are shorter than 60 ms(distribution in detail shown in Fig. 10b), in agreementwith the range obtained by Thottappillil et al. (1995),(intervals less than 64 ms). Note that as the cameraintegrates the luminosity over 1 ms for each 1-msduration frame, even M-components lasting less than1 ms were detected and considered in the statistics.However, due to the temporal resolution of the camera,two successive M-components with a time interval lessthan 2 ms would look like a single one. This mayexplain the difference in the geometric mean values(Table 3).
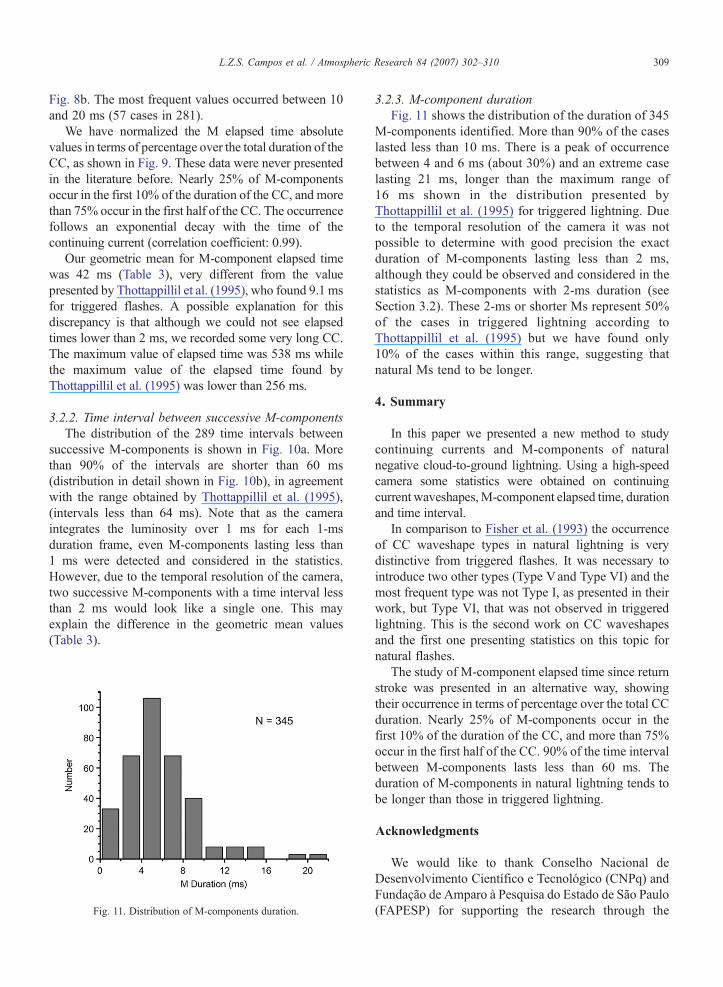
Fig. 11. Distribution of M-components duration.
3.2.3. M-component durationFig. 11 shows the distribution of the duration of 345
M-components identified. More than 90% of the caseslasted less than 10 ms. There is a peak of occurrencebetween 4 and 6 ms (about 30%) and an extreme caselasting 21 ms, longer than the maximum range of16 ms shown in the distribution presented byThottappillil et al. (1995) for triggered lightning. Dueto the temporal resolution of the camera it was notpossible to determine with good precision the exactduration of M-components lasting less than 2 ms,although they could be observed and considered in thestatistics as M-components with 2-ms duration (seeSection 3.2). These 2-ms or shorter Ms represent 50%of the cases in triggered lightning according toThottappillil et al. (1995) but we have found only10% of the cases within this range, suggesting thatnatural Ms tend to be longer.
4. Summary
In this paper we presented a new method to studycontinuing currents and M-components of naturalnegative cloud-to-ground lightning. Using a high-speedcamera some statistics were obtained on continuingcurrent waveshapes,M-component elapsed time, durationand time interval.
In comparison to Fisher et al. (1993) the occurrenceof CC waveshape types in natural lightning is verydistinctive from triggered flashes. It was necessary tointroduce two other types (Type Vand Type VI) and themost frequent type was not Type I, as presented in theirwork, but Type VI, that was not observed in triggeredlightning. This is the second work on CC waveshapesand the first one presenting statistics on this topic fornatural flashes.
The study of M-component elapsed time since returnstroke was presented in an alternative way, showingtheir occurrence in terms of percentage over the total CCduration. Nearly 25% of M-components occur in thefirst 10% of the duration of the CC, and more than 75%occur in the first half of the CC. 90% of the time intervalbetween M-components lasts less than 60 ms. Theduration of M-components in natural lightning tends tobe longer than those in triggered lightning.
Acknowledgments
We would like to thank Conselho Nacional deDesenvolvimento Científico e Tecnológico (CNPq) andFundação de Amparo à Pesquisa do Estado de São Paulo(FAPESP) for supporting the research through the
310 L.Z.S. Campos et al. / Atmospheric Research 84 (2007) 302–310
projects 475299/2003–5 and 99/09165–3 respectively.The authors also thank Francisco G. Cardoso for hissupport, and the first author also would like to thankCNPq for the scholarship 102356/2005–9.
References
Ballarotti, M.G., Saba, M.M.F., Pinto Jr., O., 2005. High-speed cameraobservations of negative ground flashes on a millisecond-scale.Geophys. Res. Lett. 32, L23802. doi:10.1029/2005GL023889.
Ballarotti, M.G., Saba, M.M.F., Pinto Jr., O., 2006. A new performanceevaluation of the Brazilian Lightning Location System (RINDAT)based on high-speed camera observations of natural negativeground flashes. Paper Presented at the 19th International LightningDetection Conference (ILDC), Vaisala, Tucson, Arizona.
Brook, M., Kitagawa, N., Workman, E.J., 1962. Quantitative study ofstrokes and continuing currents in lightning discharges to ground.J. Geophys. Res. 67, 649–659.
Chisholm, W.A., Levine, J.P., Chowdhuri, P., 2001. Lightning arc damageto optical fiber ground wires (OPGW): parameters and test methods.2001 Power Engineering Society Summer Meeting. Conference Pro-ceedings, vol. 1, pp. 88–93.Vancouver, BC, Canada, 15–19 July 2001.
Diendorfer, G., Viehberger, M., Mair, M., Schulz, W., 2003. An attemptto determine currents in lightning channels branches fromoptical dataof a high speed video system. International Conference on Lightningand Static Electricity. Blackpool, United Kingdom, Feb. 2003.
Fisher, F.A., Plumer, J.A., 1977. Lightning Protection of Aircraft,NASA Ref. Publ., NASA-RP-1008.
Fisher, R.J., Schnetzer, G.H., Thottappillil, R., Rakov, V.A., Uman,M.A.,Goldberg, J.D., 1993. Parameters of triggered-lightning flashes inFlorida and Alabama. J. Geophys. Res. 98, 22887–22908.
ProtectionAgainst Lightning, Part 1: General Principles. IEC 62305–1.Kitagawa, N., Brook, M., Workman, E.J., 1962. Continuing currents in
cloud-to-ground lightning discharges. J. Geophys. Res. 67, 637–647.Malan, D.J., Collens, H., 1937. Progressive lightning, III, the fine
structure of return lightning strokes. Proc. R. Soc. Lond., A, Math.Phys. Sci. 162, 175–203.
Pinto Jr., O, 2003. The Brazilian Lightning Detection Network: ahistorical background and future perspectives, paper presented at VIIinternational symposium on lightning protection. Inst. de Electrotéc.e Energia, Univ. de São Paulo, Curitiba, Brazil, 17 – 21 Nov. 2003.
Rakov, V.A., Uman, M.A., 1990. Long continuing current in negativelightning ground flashes. J. Geophys. Res. 95, 5455–5470.
Rakov, V.A., Uman, M.A., 2003. Lightning: Physics and Effects.Cambridge Univ. Press, New York. 687 pp.
Rakov, V.A., Thottappillil, R., Uman, M.A., 1992. Electric field pulses inK and M changes of lightning ground flashes. J. Geophys. Res. 97,9935–9950.
Rakov,V.A., Crawford,D.E., Rambo,K.J., Schnetzer, G.H., Uman,M.A.,Thottappillil, R., 2001. M-component mode of charge transfer toground in lightning discharges. J. Geophys. Res. 106, 22817–22831.
Instructions for Operating the MotionScope® PCI High Speed DigitalImaging System. Manual No. 9400–0010 Revision S.
Saba,M.M.F., Pinto Jr., O., Solórzano, N.N., Eyebert-Berard, A., 2005.Lightning current observation of an altitude-triggered lightningflash. Atmos. Res. 76, 402–411.
Saba, M.M.F., Ballarotti, M.G., Pinto Jr., O., 2006. Negative cloud-to-ground lightning properties from high-speed video observations.J. Geophys. Res. 111, D03101. doi:10.1029/2005JD006415.
Shindo, T., Uman, M.A., 1989. Continuing current in negative cloud-to-ground lightning. J. Geophys. Res. 94, 5189–5198.
Thottappillil, R., Rakov, V.A., Uman, M.A., 1990. K andM changes inclose lightning ground flashes in Florida. J. Geophys. Res. 95,18631–18640.
Thottappillil, R., Goldberg, J.D., Rakov, V.A., Uman, M.A., Fisher, R.J.,Schnetzer, G.H., 1995. Properties of M components from currentsmeasured at triggered lightning channel base. J. Geophys. Res. 100,25711–25720.
Williams,D.P., Brook,M., 1963.Magneticmeasurements of thunderstormscurrents, 1, continuing currents in lightning. J. Geophys. Res. 68,3243–3247.