watershed governance and its implications on food security in ...
350
WATERSHED GOVERNANCE AND ITS IMPLICATIONS ON FOOD SECURITY IN THE LOWER SIO RIVER BASIN BUSIA COUNTY, KENYA Namenya Daniel Naburi A thesis submitted in partial fulfillment for the requirements of the award of the Degree of Doctor of Philosophy in Disaster Management and Sustainable Development of Masinde Muliro University of Science and Technology November, 2018
-
Upload
khangminh22 -
Category
Documents
-
view
1 -
download
0
Transcript of watershed governance and its implications on food security in ...
1
WATERSHED GOVERNANCE AND ITS IMPLICATIONS ON
FOOD SECURITY IN THE LOWER SIO RIVER BASIN BUSIA
COUNTY, KENYA
Namenya Daniel Naburi
A thesis submitted in partial fulfillment for the requirements of the award of the Degree
of Doctor of Philosophy in Disaster Management and Sustainable Development of
Masinde Muliro University of Science and Technology
November, 2018

i
DECLARATION

ii
COPYRIGHT
This thesis is a copyright material protected under the Berne Convention, the Copyright
Act of Kenya 1999 and other international and national legislations on intellectual
property. It may not be reproduced by any means in full or in part except for short
extracts in fair dealing for research or private study, critical scholarly review or discourse
with acknowledgement, and with the permission of the Dean School of Graduate Studies
on behalf of both the author and Masinde Muliro University of Science and Technology.

iii
DEDICATION
I dedicate this thesis to my wife Roseline, son, Baraka, daughters; Ziza and Tunu, my
mum Maximilla Nangira and the entire Naburi family for the continued support,
encouragement and prayers.

iv
ACKNOWLEDGEMENTS
This research thesis was made possible by the contribution from a number of individuals
who committed their time, energy, resources and advice. I sincerely thank my
supervisors, Prof. John F. Obiri and Dr. Edward Mugalavai of Masinde Muliro University
of Science and Technology for their advice and guidance throughout the study. I also
thank Prof. Andreas Theil from The University of Kassel's, Germany for his guidance in
the development of the research proposal, Mr. Milton Bwibo for assistance in statistical
analysis and a team of eleven research assistants who helped in data collection. I wish to
thank Mr. John Kim Stewart and his entire family for their support in my education up to
this level. The people of Busia County, County Secretary office, County Commissioner
office, KNBS office, Director of Forestry Mr. Were, County Director of Irrigation, Mr.
Charles Maloba, County Agriculture Development Fund Director, and the people of
Nambale, Matayos and Funyula Sub-counties for their support in giving responses during
data collection. My sincere gratitude goes to Dr. Daniel Masiga and Dolly Masiga, their
family and entire Abang’are Clan of Samia Community for their encouragement and
support throughout my education. My friends and colleagues Mrs. Mary Maingi, Mr.
K’Oyooh Odhiambo, Mr. Fredrick F. Oundo, Mr. Gilbert Muyumbu and Mr. Peter
Maliatso for their support in prior research consultancies that ended up in the
identification of the research problem in this thesis. Lastly, my heartfelt gratitude goes to
my mother, Maximilla Nangira, Late Father, Milton Naburi Oundo, wife Roseline and
son Baraka, daughters Ziza, Tunu and the entire family for being a source of inspiration
in my life and above all, to Almighty God for giving me life to this level.

v
ABSTRACT Efforts to implement Integrated Water Resource Management are often hampered by
inefficient political and institutional environments. As a result, Lower Sio River basin has
experienced land use and land cover changes which have exerted negative ecological
impacts on local livelihoods. It is unclear how much watershed governance is integrated
into policy across the county levels to promote food security. Therefore, the study aimed
at determining the status of watershed governance and its place in enhancing food
security in the Lower Sio River basin; Nambale, Matayos and Funyula Sub-counties in
Busia County, Kenya. The specific objectives were to: determine the perceptions of
households on changes in rural watershed governance; examine the adaptive capacity of
state and non-state institutions to enhance watershed governance for food security;
evaluate the impacts of watershed governance structures on rural food security; and
evaluate the effectiveness of adaptive co-management of watershed governance for food
security. Cross-sectional and evaluation research design; qualitative and quantitative
approaches, and probability and non-probability sampling techniques were used to ensure
triangulation and cross-checking the research process. A structured questionnaire,
interview guide, focus group discussion guide and observation checklist were tools used
to collect data. Two-level multi-stage sampling was combined with simple random and
proportionate sampling to select a sample of 387 households for quantitative data.
Purposive, convenient and snowball sampling procedures were used to select a sample
for key informants’ interviews and focus group discussions. Descriptive statistics, bi-
variate, Chi-square and T-test, context and qualitative analysis were done. The study
found that 75.2% of the households’ depended on farmlands for food while 81.9% agreed
that watershed governance determined food security. Consequently, 86.3% needed
changes in watershed governance systems. Creating social resilience to adapt to a
changing climate, and clarifying roles and responsibilities at p-value=0.000; enhancing
water-use efficiency and improving management at p-value=0.010 were significant
governance aims at households’ food security. Watershed governance structures such as
water resources management policies and plans p-value=0.000, and water resource
institutions p-value=0.001 were also significant to households' food security status.
Majority 86.8% blamed low farm yield as a key driver for households' food insecurity.
Low supply of food in the market, incidences of prolonged droughts and low levels of
income p-value=0.000 and ineffective government policy p-value=0.007 drivers of food
insecurity were significant in determining households' food security status. On average
55.3% of households were food insecure. Regression analysis results showed that
religion, watershed expertise, level of satisfaction towards watershed governance and co-
management of watershed could only explain 20.8% variations in households’ food
security status. Generally, watershed governance structures did not affect households’
food security. Further, the study found that there were collaborations among actors
without coordination and monitoring framework. Furthermore, 70.0% and 85.8% of
households indicated that they did not offer support to National Environment
Management Authority and Water Resources Authority respectively. The study
concluded that watershed governance did not enhance sustainable food security thus it
was recommended for deliberate policy changes and efforts towards watershed
governance through building actors adaptive capacities, co-management, households’
satisfaction and participation for sustainable food security in the basin.

vi
TABLE OF CONTENTS
DECLARATION ................................................................................................................. I COPYRIGHT ...................................................................................................................... II DEDICATION .................................................................................................................. III ACKNOWLEDGEMENTS .............................................................................................. IV ABSTRACT ....................................................................................................................... V TABLE OF CONTENTS .................................................................................................. VI LIST OF FIGURES ........................................................................................................... X LIST OF TABLES ........................................................................................................... XII LIST OF PLATES ......................................................................................................... XIV LIST OF APPENDICES .................................................................................................. XV LIST OF ABBREVIATIONS AND ACRONYMS ...................................................... XVI OPERATIONAL DEFINITION OF TERMS ............................................................... XXI CHAPTER ONE INTRODUCTION .................................................................................. 1 1.1: Background to the study .............................................................................................. 1
1.2: Statement of the problem ............................................................................................. 4
1.3: Research objectives...................................................................................................... 5
1.4: Research questions ....................................................................................................... 6
1.5: Justification to the study .............................................................................................. 6
1.6: The scope of study ....................................................................................................... 7
1.6.1: Inclusion criteria.................................................................................................... 7
1.6.2: Exclusion criteria .................................................................................................. 8
CHAPTER TWO LITERATURE REVIEW ...................................................................... 9 2.1: Introduction .................................................................................................................. 9
2.2: Watershed governance and integrated water resource management ........................... 9
2.3: Food Security and Governance .................................................................................. 14
2.4: Perceptions influencing watershed governance and hence food security .................. 16
2.5: Resilience and adaptive capacity of institutions in a social ecological change impacts
........................................................................................................................................... 17
2.5.1: Institutional Role in Socio-ecological Resilience and Adaptive Capacity
Enhancement ................................................................................................................. 21
2.5.2: Governance role in Socio-ecological Resilience and Adaptive Capacity
enhancement .................................................................................................................. 25
2.6: Nexus between watersheds governance and food security ........................................ 29
2.6.1: Watershed governance changes impacts on food security .................................. 30
2.6.2: Watershed governance and food security initiatives in Kenya ........................... 35
2.7: Effective adaptive co- management in a social ecological watershed system ........... 37
2.8: Linking Devolved Governance in Kenya to Socio-ecological Adaptive Capacity and
Co-management ................................................................................................................ 40
2.9: Theoretical Applications ............................................................................................ 46
2.9.1: Common Pool of Resources ................................................................................ 46
vii
2.9.2: The Tragedy of the Commons............................................................................. 46
2.9.3: Institutional Theory ............................................................................................. 48
2.10: Conceptual Framework ............................................................................................ 50
CHAPTER THREE RESEARCH METHODOLOGY..................................................... 52 3.1: Introduction ................................................................................................................ 52
3.2: Study area .................................................................................................................. 52
3.2.1: Physiographic and natural conditions ................................................................. 54
3.2.2: Physical and topographic features ....................................................................... 54
3.2.3: Ecological conditions .......................................................................................... 55
3.2.4: Climatic and hydrological conditions ................................................................. 56
3.2.5: Sources of livelihoods and socio-economic practices ......................................... 57
3.3: Study population ........................................................................................................ 59
3.4: Research design ......................................................................................................... 60
3.5: Qualitative methods ................................................................................................... 62
3.5.1: Narrative method ................................................................................................. 62
3.5.2: Case method ........................................................................................................ 63
3.5.3: Documents review method .................................................................................. 63
3.5.4: Qualitative methods ............................................................................................ 64
3.6: Quantitative sampling methods ................................................................................. 65
3.7: Data collection instruments ....................................................................................... 68
3.7.1: Household Questionnaires .................................................................................. 69
3.7.2: Key Informants Interview guides ........................................................................ 70
3.7.3: Focus Group Discussion guide ........................................................................... 70
3.7.4: Observation and photography checklist .............................................................. 72
3.8: Pre-test, validity and reliability of data instruments .................................................. 73
3.9: Data analysis .............................................................................................................. 75
3.9.1: Descriptive data analysis approach ..................................................................... 76
3.9.2: Qualitative data analysis approach ...................................................................... 77
3.9.3: Inferential data analysis....................................................................................... 78
3.10: Data management and Quality Standards ................................................................ 79
3.11: Measurements, data analysis and interpretation ...................................................... 80
3.12: Limitations to the study ........................................................................................... 83
3.13: Assumptions to the study ......................................................................................... 84
3.14: Participation, ethical consideration and informed consent ...................................... 85
CHAPTER FOUR HOUSEHOLDS PERCEPTIONS TO CHANGES IN RURAL
WATERSHED GOVERNANCE ..................................................................................... 87 4.1: Introduction ................................................................................................................ 87
4.2: Households Socio-demographic Characteristics and Food Security ........................ 87
4.2.1: Households’ Gender Distribution and Food Security ......................................... 88
viii
4.2.2: Households’ Levels of Education and Food Security ......................................... 89
4.2.3: Households’ Main Occupation and Food Security ............................................. 91
4.2.4: Households’ Religion and Food Security ........................................................... 92
4.2.5: Households’ Members Average Age and Food Security .................................... 93
4.2.6: Household Size and Composition, and Food Security ........................................ 94
4.2.7: Average Households income and Food Security ................................................ 95
4.2.8: Households’ Land Tenure System and Food Security ........................................ 97
4.2.9: Households’ Land Legal document possessed and Food Security ..................... 99
4.2.10: Households’ watershed land area occupied, main land use and main source of
food.............................................................................................................................. 100
4.3: Households’ Perceptions to Changes in Rural Watershed Governance and Food
Security ........................................................................................................................... 113
4.3.1: Households Perception on Rural Watershed Governance and Food Security .. 113
4.3.2: Households Satisfaction with Aims of Watershed Governance and Food Security
..................................................................................................................................... 116
4.3.3: Watershed Governance Contextual Factors that need to be addressed ............. 119
4.3.4: Households Perception on Driver for Collaborative Watershed-focused approach
and Food Security........................................................................................................ 120
4.3.5: Households Perception on the need for Changes in Watershed Governance
Systems........................................................................................................................ 123
CHAPTER FIVE ADAPTIVE CAPACITY OF STATE AND NON-STATE ACTORS
IN WATERSHED GOVERNANCE FOR SUSTAINABLE FOOD SECURITY......... 126 5.1: Introduction .............................................................................................................. 126
5.2: Watershed Governance Goals .................................................................................. 126
5.3: Aims for Watershed Governance and Households Food Security .......................... 128
5.4: Observed Socio-economic and environmental changes in the Lower Sio Basin since
2010................................................................................................................................. 130
5.5: Watershed Governance Conditions ......................................................................... 133
5.6: Knowledge on Watershed Governance Structures and Households Food Security 135
5.7: Drivers to Watershed Destruction and Households Food Security ......................... 139
5.8: Factors that Contribute to Public Involvement in Watershed Management ............ 142
5.9: Public Participation in Watershed Management Plans, Policies and Programmes and
Households Food Security .............................................................................................. 145
5.10: Governance Values observed and Household Food Security ................................ 149
5.11: Watershed Management Expertise and Households Food Security ...................... 152
5.12: Sources of finances for Watershed Management and Food Security Activities .... 156
5.13: Sources of Watershed Management Information .................................................. 159
CHAPTER SIX IMPACTS OF DEVOLVED GOVERNMENTS WATERSHED
GOVERNANCE STRUCTURES ON RURAL FOOD SECURITY ............................. 161

ix
6.1: Introduction .............................................................................................................. 161
6.2: Households Food Security Goals ............................................................................. 161
6.3: Watershed Management Policies that Contribute to Food Security Goals .............. 164
6.4: Drivers of Food insecurity and Households Food Security ..................................... 166
6.5: County Governance Impact on Watershed Management and Households Food
Security ........................................................................................................................... 172
6.6: Regression Analysis Results on Watershed Governance and Food Security .......... 181
CHAPTER SEVEN EFFECTIVENESS OF ADAPTIVE CO-MANAGEMENT OF
WATERSHEDS FOR SUSTAINABLE FOOD SECURITY ........................................ 186 7.1: Introduction .............................................................................................................. 186
7.2: Co-ordination in Watershed Resource Management and Households Food Security
......................................................................................................................................... 186
7.3: Water Resources Management Plans in Use ........................................................... 196
7.4: Policies that Support or Hinder Watershed Management and Households Food
Security ........................................................................................................................... 205
7.5: State and Non-state Actors in Watershed and Food Security Activities ................. 217
7.6: Collaboration and Approach in Watershed Governance and Food Security ........... 233
7.7: Capacity offered by Actors in Watershed and Food Security Activities ................. 240
7.8: Conflicts in Watershed Governance that Hinder Food Security Goals ................... 245
CHAPTER EIGHT SUMMARY, CONCLUSIONS AND RECOMMEMDATIONS
......................................................................................................................................... 254 8.1: Introduction .............................................................................................................. 254
8.2: Summary of Findings on Watershed Governance for Food Security in the Lower Sio
River Basin, Busia County .............................................................................................. 254
8.3: Conclusions .............................................................................................................. 257
8.4: Recommendations .................................................................................................... 258
8.5: Suggested for further study ...................................................................................... 259
REFERENCES ............................................................................................................... 260 APPENDICES ................................................................................................................ 283

x
LIST OF FIGURES
FIGURE PAGE
Figure 2.1: Conceptual Framework Model of Watershed Governance and Food security
........................................................................................................................................... 51 Figure 3.1: Map of the Lower Sio River Basin ................................................................. 53 Figure 4.1: Average monthly income of households in different categories .................... 96 Figure 4.2: Household Land Tenure System in the Lower Sio River watershed ............. 98 Figure 4.3: Household Land Legal document possessed .................................................. 99 Figure 4.4: Household watershed landform occupied, main land use and main source of
food ................................................................................................................................. 102 Figure 4.5: Households Perception on the need for Changes in Watershed Governance
Systems ........................................................................................................................... 124 Figure 5.1: Aims for watershed governance in the Lower Sio River Basin ................... 129 Figure 5.2: Socio-economic and environmental changes observed since 2010 .............. 131 Figure 5.3: Observed Socio-economic and environmental changes since 2010 ............. 132 Figure 5.4: Drivers to Watershed Destruction in the Lower Sio River Basin ................ 140 Figure 5.5: Stages of participation in watershed management plans, policies and
Programmes .................................................................................................................... 145 Figure 5.6: Awareness of Existence of Watershed Governance Values ......................... 149 Figure 5.7: Governance Values observed at different levels of Watershed and Food
policies ............................................................................................................................ 150 Figure 5.8: Sources of finances for Watershed Management and Food Security Activities
......................................................................................................................................... 156 Figure 6.1: Food Security Goals in the Lower Sio River Basin ..................................... 163 Figure 6.2: Contribution of Watershed Management Policies and Programs to Shared
Food Security Goals ........................................................................................................ 165 Figure 6.3: Drivers for food insecurity in the Lower Sio River Basin ........................... 167 Figure 6.4: Contribution of County Government on Watershed Management for Food
Production and Distribution ............................................................................................ 173 Figure 7.1: Households Knowledge of Government Departments Tasked to coordinate
other departments in Watershed and Food security activities ........................................ 187 Figure 7.2: New Departments at the National and County Governments Known to the
Households ...................................................................................................................... 191 Figure 7.3: Sio-Siteko Sub basin Plan part of the Lower Sio River Basin ..................... 200 Figure 7.4: New Social Policy Identified at National and County Governments level by
the Households ................................................................................................................ 206 Figure 7.5: Contribution of Watershed Management Policies to Food Production and
Distribution ..................................................................................................................... 212 Figure 7.6: Role of Actors in Watershed Management Knowledge and Resources in
enhancing Food Security Interventions .......................................................................... 241 Figure 7.7: Role of Non-State Actors on the Watershed Management Gap between
Government Agencies at various Governance levels ..................................................... 243 Figure 7.8: Influence of Political Will in Support of Non-state Actors in Watershed
Management and Food Security Activities ..................................................................... 244

xi
Figure 7.9: Conflicts in the Watershed Governance Systems that Hinder Food Security
Goals ............................................................................................................................... 246 Figure 7.10: Inter-actor Conflicts in Watershed Management and Food security that Lead
to Exclusion of other Actors ........................................................................................... 247 Figure 7.11: Causes of Inter- Actor Conflicts in Watershed Management and Food
Security Sectors .............................................................................................................. 248

xii
LIST OF TABLES
TABLE PAGE Table 3.1: Population distribution by sub-county in the Lower Sio River basin .............. 59 Table 3.2: Summary of research design of each study objective and respective variables
........................................................................................................................................... 61 Table 3.3: Calculated study proportionate sample size distribution ................................. 67 Table 3.4: Summary of sampling methods and sample size for the study population...... 68 Table 3.5: Summary of instruments for primary data collection ...................................... 72 Table 3.6: Reliability Statistics using Cronbach’s Alfa .................................................... 74 Table 3.7: Summary of data analysis methods with reference to specific objectives and
research designs ................................................................................................................ 79 Table 4.1: Summary of Households Socio- demographic Characteristics ....................... 88 Table 4.2: Socio-demographic Characteristics on interval scale ...................................... 93 Table 4.3: Food security and insecurity households’ measurement comparison association
amongst the Socio-demographic background factors of respondents at their household
levels ............................................................................................................................... 106 Table 4.4: Summary of Observed Land Use activities and their Environmental Impacts in
the Lower Sio River Basin .............................................................................................. 109 Table 4.5: Households Perception on Changes in Rural Watershed Governance .......... 114 Table 4.6: Food security and insecurity households’ measurement comparison association
amongst the households perception of changes in rural watershed governance ............. 115 Table 4.7: Households Level of Satisfaction with Aims of Watershed Governance ...... 116 Table 4.8: Households’ food security and insecurity measurement comparison association
amongst level of satisfaction with aims watershed governance ..................................... 117 Table 4.9: Watershed Governance Contextual Factors that need to be Addressed ........ 119 Table 4.10: Households perception on the need for a more collaborative watershed-
focused approach ............................................................................................................ 121 Table 4.11: Food security and insecurity households’ measurement comparison
association amongst the drivers for a collaborative watershed-focused model variables
......................................................................................................................................... 122 Table 5.1: Watershed Governance Goals among the
households……………………………........................................................................... 127 Table 5.2: Food security and insecurity of households’ measurement comparison
association amongst the domains /aims for watershed governance ................................ 130 Table 5.3: Watershed Governance Conditions Present ................................................... 134 Table 5.4: Watershed Governance Structures Present .................................................... 135 Table 5.5: Food security and insecurity of households’ measurement comparison
association amongst the watershed governance structures ............................................. 137 Table 5.6: Food security and insecurity of households’ measurement comparison
association amongst the drivers to watershed destruction .............................................. 141 Table 5.7: Factors that contribute to public involvement in watershed management
activities .......................................................................................................................... 143 Table 5.8: Food security and Insecurity households’ measurement comparison association
amongst the stages of participation in various watershed policies and plans ................. 147 Table 5.9: Food security and Insecurity households’ measurement comparison association
amongst the governance values at stage of policy/plan .................................................. 151

xiii
Table 5.10: Watershed Management Expertise Present ................................................. 153 Table 5.11: Food security and Insecurity households’ measurement comparison
association amongst the watershed expertise variables .................................................. 154 Table 5.12: Comments on the sources of funds for watershed management and food
security activities ............................................................................................................ 157 Table 5.13: Sources for Watershed Management Information ....................................... 159 Table 6.1: Food security and Insecurity households’ measurement comparison association
amongst households drivers for food insecurity ............................................................. 169 Table 6.2: Impact of Watershed Governance Structure on the Domains of Households
food security.................................................................................................................... 175 Table 6.3: Variables Measuring the Impact of Watershed Governance Structures on
Various Factors of Households Food Security ............................................................... 176 Table 6.4a: Linear regression results .............................................................................. 183 Table 6.4b: Logistic Regression results .......................................................................... 184 Table 7.1: Food security and Insecurity households’ measurement comparison association
amongst households knowledge on departments tasked to coordinate other departments in
watershed management activities ................................................................................... 188 Table 7.2: Food security and Insecurity households’ measurement comparison association
amongst households knowledge on new departments created to enhance watershed
management for food security ........................................................................................ 193 Table 7.3: Summary of the Watershed Management Plan and Governance issues ........ 204 Table 7.4: Food security and Insecurity households’ measurement comparison association
amongst households knowledge on the new social policy created under devolution that
enhanced watershed management for food security ....................................................... 208 Table 7.5: Policy Derivatives of Watershed Governance under the New Devolved System
in the Lower Sio River .................................................................................................... 210 Table 7.6a: Actors involved in Watershed Governance and Food Security ................... 218 Table 7.6b: Actors involved in Watershed Governance and Food Security ................... 219 Table 7.7: Major Actors Collaborating in Watershed Governance and Food Security . 235 Table 7.8: Watershed Management Knowledge and Resources Created by Actors to
contribute to Food Production and Distribution ............................................................. 240 Table 7.9: Food security and insecurity households’ measurement comparison association
amongst the watershed management knowledge variables ............................................ 242 Table 7.10: Ranking of Public Support for the Watershed Management Institutions .... 252

xiv
LIST OF PLATES
PLATES PAGE
Plate 4.1: Watershed destruction activities due to County roads infrustruture in the Lower
Sio River Basin ............................................................................................................... 104
Plate 4.2: Land use practices in the Lower Sio River Basin ........................................... 110
Plate 4.3: Forms of soil conservation efforts in the Lower Sio River Basin .................. 112
Plate 5.1: Watershed resources degradation due to ineffective watershed governance in
the Lower Sio River Basin .............................................................................................. 142

xv
LIST OF APPENDICES
APPENDIX PAGE
Appendix I: Sample Frame Population Distribution by Number of Households, Area,
Density and Administrative Units ................................................................................... 283
Appendix II: List of Actors In Agriculture And Environment ....................................... 285
Appendix III: Informed Consent/ Introductory Letter .................................................... 287
Appendix IV: Template for Analysis – Observation /Mapping...................................... 288
Appendix V: Household Questionnaire .......................................................................... 289
Appendix VI: Key Informant Interview Guide ............................................................... 301
Appendix VII: Focused Group Discussion Guide .......................................................... 307
Appendix VIII: Stakeholders Inventory –Busia County ................................................. 316
Appendix IX: Simpact Kenya NGO; Farmer’s Internal Regulations guideline ............. 322
Appendix X: Status of Small Holders Irrigation Schemes in Busia County as at October
2017................................................................................................................................. 323
Appendix XI: Research Permit from NACOSTI ............................................................ 326

xvi
LIST OF ABBREVIATIONS AND ACRONYMS
AM Adaptive Management
ADB African Development Bank
ADF Agriculture Development Fund
ADS Anglican Development Services
AFC Agriculture Finance Corporation
ASDSP Agricultural Sector Development Support Programme
BCIDP Busia County Integrated Development Plan
BUWASCO Busia Water and Sewerage Company
CAAC Catchment Area Advisory Committee
CBD Convention on Biological Diversity
CBO Community Based Organizations
CDALD County Department of Agriculture and Livestock Development
CDEWNR County Department of Environment, Water and Natural Resources
CDF Constituency Development Fund
CEC County Executive Committee Members
CEO Chief Executive Officer
CFA Community Forest Association
CGB County Government of Busia
CIDA Canadian international Development Agency
CIG Common Interest Group
CMS Catchment Management Strategies
CPR Common Pool Resource

xvii
CSO Civil Society Organization
CWFS Committee on World Food Security of (FAO)
DFRD District Focus for Rural Development
DRRESP Disaster Risk Reduction and Extensions Services Providers
DRR Disaster Risk Reduction
DTSC District Technical Steering Committees
DWO District Water Officers
EIA Environmental Impact Assessments
EMCA Environment Management and Coordination Act
ERC Ethical Review Committee
EWS Early Warning Systems
FAO Food Agriculture Organization
FBO Faith Based Organizations
FGDs Focused Group Discussion
FNSP Food and Nutrition Security Policy
GEF Global Environmental Facility
GFFSN Global Forum on Food Security and Nutrition of (FAO)
G.o.K Government of Kenya
GWP Global Water Partnership
HH Household
IAD Institutional Analysis and Development
IEA Institute of Economic Affairs
IFRC International Federation of Red Cross and Red Crescent Societies

xviii
IPCC Intergovernmental Panel on Climate Change
IMF International Monetary Fund
IWRM Integrated Water Resource Management
IWUA Irrigation Water Users Association
KAFFA Kenya Agriculture, Fisheries and Food Authority
KALRO Kenya Agricultural and Livestock Research Organization
KCB Kenya Commercial Bank
KES Kenya Shillings
KEFRI Kenya Forestry Research Institute
KeRRA Kenya Rural Roads Authority
KFS Kenya Forestry Service
KMD Kenya Meteorological Department
KNBS Kenya National Bureau of Statistics
KWFT Kenya Women Finance Trust
KWS Kenya Wildlife Service
LATF Local Authority Transfer Fund
LVBA Lake Victoria Basin Authority
LVNCMS Lake Victoria North Catchment Management Strategy
LVNCA Lake Victoria North Catchment Area
LVNWSB Lake Victoria North Water Services Board
MCA Member of County Assembly
MDG Millennium Development Goal
MP Member of Parliament
xix
MSPNDV Ministry of State for Planning, National Development and Vision 2030
NASA National Super Alliance
NEMA National Environment Management Authority
NGMoA National Government Ministry of Agriculture
NGMoENR National Government Ministry of Environment and Natural Resources
NGO Non-Governmental Organization
NBI Nile Basin Initiative
NIB National Irrigation Board
NRM Natural Resource Management
NTEAP Nile Tran boundary Environment Action Project
PALWECO Programme for Agriculture and Livelihoods in Western Communities
PMT Programme Management Team
PSC Programme Steering Committee
PSP Participatory Scenario Planning
PSU Programme Support Unit
SAP Structural Adjustment Programmes
SDGs Sustainable Development Goals
SIDA Sweden International Development Agencies
SPSS Statistical Package for Social Sciences
USAID (KAVES) Kenya Agriculture Value Chain Enterprises Project
TAC Technical Advisory Committee
UNDP United Nations Development Programmes
UNEP United Nations Environment Programmes

xx
UNFCCC UN Framework Convention on Climate Change
WB World Bank
WDF Ward Development Funds
WEF World Economic Forum
WHO World Health Organization
WKCDD/FMP Western Kenya Community-Driven Development and Flood Mitigation
WRA Water Resources Authority
WRUA Water Resources Users Associations
WSB Water Services Boards
WSP Water Services providers
WUA Water Users Associations
SAP Structural Adjustment Programmes
SPA Service Provision Agreement
xxi
OPERATIONAL DEFINITION OF TERMS
Adaptive capacity: The ability of a human system to adjust to changes (including social,
economic, political, institutional climate variability and extremes), to moderate potential
damages, to take advantage of opportunities, or to cope with the consequences.
Adaptive co-management: is an institutional arrangements and ecological knowledge
are tested and revised in a dynamic, ongoing, self-organized process of learning by doing.
Adaptive governance: Changing rules and norms of institutions to steer policy
interactions and guide management of resources in a manner that is able to recover or
adjust to change so as to maintain or improve to a desirable state. It involves devolution
of management rights and power-sharing that promotes participation.
Adaptive institutions: Those institutions that actors are able to adjust to encourage
individuals to act in ways that maintains or improve to a desirable state.
Adaptive management: A systematic process for continually improving management
practices. It involves learning by doing; using feedback mechanisms from the
environment to shape policy, followed by further systematic experimentation, in a never-
ending cycle (Engle et al., 2011).
Governance: The interactions among structures, processes, rules, and traditions that
determine how people in societies make decisions and share power, exercise
responsibility, and ensure accountability, and how stakeholders have a say in the
management of natural resources. Governance thus includes the development and
application of the principles, rules, norms, and enabling institutions that guide public and
private interactions (Lebel et al., 2006).
xxii
Integrated Water Resources Management: This is an approach that promotes the
coordinated development and management of water, land and related resources, in order
to maximize the resultant economic and social welfare in an equitable manner without
compromising the sustainability of vital ecosystems. It recognizes the interdependence of
social, political and economic systems with biological and ecological ones within the
hydrological limits of the watershed.
Institution: Enduring regularities of human action in situations structured by rules,
norms and shared strategies. Created by people, institutions organize and structure human
behaviour towards collective ends.
Watershed: A hydrological defined unit, an area of land draining into a common body of
water such as a lake, river, or ocean. Or a topographically limited area from which all
water is drained by a common water course/outlet. Watershed is also known as catchment
or basin.
Watershed governance: a field of action research that emphasizes attention to important
questions of governance when considering integrated water resource management. It
addresses issues such as institutional and legal reform to reinvigorate the role of
government – transforming governments from top-down managers to facilitators of local
action in the context of a broader public trust. Watershed governance specifically
recognizes the critical importance of civil society as the key facilitator of change and
innovation while embracing the idea that the watershed is the starting point for
sustainable water management – addressing the challenges of integration and holistic
resource management at the watershed scale.

xxiii
Watershed management: the integrated use of land, vegetation and water in a
geographically discrete catchment or drainage area for the benefit of its residents, with
the objective of maintaining the hydrological services that the watershed provides and of
reducing or avoiding negative downstream or groundwater impacts. This implies also
monitoring other ecological services such as soil productivity, biodiversity, carbon cycle
and climate change adaptation and mitigation as well as the socio-cultural services such
as aesthetics, recreation, tourism, heritage, etc.
Food security: Situation that exists when all people, at all times, have physical, social,
and economic access to sufficient, safe, and nutritious food that meets their dietary needs
and food preferences for an active and healthy life.

1
CHAPTER ONE
INTRODUCTION
1.1: Background to the study
Watershed management challenges in river basins of Sub-Saharan Africa and in other
parts of the world are increasing due to rapid urbanization, poverty and food insecurity,
growing energy demands, and climate change (Komakeoch, 2013). To make it worse,
increased consequences of climatic alteration are becoming more visible as climatic
conditions and ecosystems change (Yanda and Mubaya, 2011). Climate variability and
climate change contribute to land and natural resource degradation by exposing soils to
extreme conditions and straining the capacity of existing land management practices to
maintain resource quality (Malo et al., 2012). Further, droughts, floods, and storms pose
a risk to human livelihoods across the globe (IPCC, 2012). The growing pressure on
natural resources leads to loss of livelihood, food insecurity and widespread poverty
(Shisanya, 1996; Shisanya, 2005). As a result, rain fed-areas in the developing world are
the hot spots of poverty, malnutrition, water scarcity and severe land degradation.
Farmers' crop yields in the rain fed areas are lower by two to five folds of the achievable
yields (Rockstrom et al., 2007).
In Sub-Saharan Africa, livelihoods and food security of the small-scale farmers are
particularly threatened by climate change, which impacts directly on agricultural
production and productivity (Malo et al., 2012). Although small-scale farmers
continuously adapt to climate change, it is widely acknowledged that climate change has
the potential to overwhelm the adaptive capacity of vulnerable populations, (IPCC,
2007).

2
Despite all these risks, the international communities have failed to limit the emission of
greenhouse gases (IEA, 2012) and to prevent unsustainable land use changes thereby
accelerating the rate at which watershed degradation affects food security. African
governments are now placing top priority on adaptation, while at the same time
recognizing the co-benefits and synergies with mitigation (Dejene and Malo, 2010).
Integrated Water Resource Management (IWRM) has evolved over decades in promoting
the coordinated development and management of water, land and related resources in
order to maximize the resultant economic and social welfare in an equitable manner
without compromising the sustainability of vital ecosystems (GWP-TAC, 2000). IWRM
approach has continuously evolved in countries through new guidelines, policies,
institutions, and expanding the scope (Wani et al., 2008) and promoted as an appropriate
strategy for improving productivity and sustainable intensification of agriculture in the
rain‐fed, drought‐prone regions in Kenya.
Watershed governance as a field of action research has been used in Australia, Canada
among other states to help prepare for climate change, bolster water system reliance and
strengthen drought resilience (Dietz et al., 2003 and Kendall, 2013). It specifically
emphasizes attention to important questions of governance in IWRM and addresses
issues such as institutional and legal reform as well as the critical importance of the civil
society as key facilitators of change and innovation (Brandes, 2006). It also provides a
means of forestalling problems in food insecurity. Watershed governance is emerging as
a paradigm shift essential to fill the gaps in IWRM, traditional governance, climate
change adaptation and mitigation, and management approaches that failed to reflect
3
public expectations and were insufficiently responsive to changing social and
environmental conditions within key watersheds (Kendall, 2013). It also provides a more
resilient governance framework capable of evolving along with changes in local
conditions by including mechanism to ensure social and policy learning (Dietz et al.,
2003).
According to FAO (2014), protected and well-managed watersheds generate multiple
positive effects on communities’ livelihoods, the environment and the overall economy.
However, climate change and watershed resources degradation are major challenges to
food security (GoK, 2011). Recent studies indicate that in Kenya, changing climate
impacts on food security and environmental changes of individuals, households as well as
regions and the whole nation (Gregory et al., 2005; Patel et al., 2012; Waithaka et al.,
2013). It is believed that solutions to socio-ecological problems are well addressed in the
Constitution of Kenya, 2010, and the County Government Act of 2012 which gave way
to transformations and institutional re-organization through a devolved system of
governance (GoK, 2010). However, the Water Act of 2016 addresses conservation of
water catchments and development of water resources (Kagombe et al., 2018).
Consequently, it is unclear how much watershed governance is present in river basins in
Kenya under devolution. Therefore, this study aimed at determining the status of
watershed governance and its place in enhancing food security in the Lower Sio River
basin.
4
1.2: Statement of the problem
Agriculture and food security largely depend on the quality of surface water and
sediments, collected and transported by the slopes of watersheds (FAO, 2007; GoK,
2011). As a result, watershed management approaches have been main target in food
security policy (GoK, 2011). However, effective watershed management depends on
sustained political commitment and investment by the national governments (FAO,
2017). Despite the fact that IWRM has been widely accepted in managing watershed
resources, at all levels efforts to implement IWRM are often hampered by inadequate or
inefficient political and institutional environments (Ballweber, 2006). To address the
hindrances in IWRM, watershed governance approach has been used to promote political,
institutional and legal reforms, and refocus the role of government transforming
governance from top-down managers to facilitators of local action (Brandes, 2006).
In Kenya, decentralization as a political and institutional tool has been expected to
strengthen the mandate of county governments in watershed governance and facilitate the
involvement of stakeholders at different levels in the food sector. However, it has often
been easier for the central government to decentralize powers to the county governments
than to ensure that the county governments have needed resources, capabilities and
accountability necessary for watershed management. Consequently, devolved
development efforts such as Constituency Development Fund Projects (CDF) have not
adopted watershed management approaches to ensure sustainability (Namenya, 2012).
Further, failure to recognize the economic value of water has resulted in its unsustainable
use and degradation of its natural base (GoK, 2010; Kagombe et al., 2018).
5
In western Kenya, a recent study in the Upper Sio River catchment in Bungoma County
showed that despite the existence of several stakeholders necessary to enhance food
security under the county governance system, food insecurity remained a challenge to
human development (Wabwoba, 2017). In Busia County, the Lower Sio River basin has
continued to experience land use and land cover changes which have exerted negative
ecological impacts affecting the community livelihoods (Obando et al., 2007). In
addition, 54% of the households in the watershed were reported to be food insecure
(GoK, 2013a). At the national level, there is the need for strong evidence from field
experiences and implementation of oriented research to influence policy dialogue,
decision making and investment priorities in the watersheds (Liniger et al., 2017; FAO,
2017). It was on this premise that the study determined the status of watershed
governance and its place in food security in the Lower Sio River basin.
1.3: Research objectives
The study aimed at determining the status of watershed governance and its place in
enhancing food security in the Lower Sio River basin, Busia County, Kenya. The specific
objectives of the study included to:
i. Determine the perceptions of households on changes in rural watershed
governance in the Lower Sio River basin.
ii. Examine the adaptive capacity of state and non-state institutions to enhance
watershed governance for sustainable food security in the Lower Sio River basin.
iii. Evaluate the impacts of watershed governance structures on rural food security in
the Lower Sio River basin under devolved governments in Kenya.

6
iv. Evaluate the effectiveness of adaptive co-management of watersheds for
sustainable food security in the Lower Sio River basin.
1.4: Research questions
i. What are the perceptions of households on changes in rural watershed governance
in the Lower Sio River basin?
ii. What is the adaptive capacity of state and non-state institutions to enhance
watershed governance for sustainable food security in the Lower Sio River basin?
iii. What are the impacts of watershed governance structures on rural food security in
the Lower Sio River basin under devolved governments in Kenya?
iv. How effectiveness is adaptive co-management of watersheds for sustainable food
security in the Lower Sio River basin?
1.5: Justification to the study
There is limited scholarly work developed on watershed governance and food security at
a watershed level in Kenya. The findings of the study are expected to contribute to the
implementation of watershed management and food security policy at household, village,
ward, sub-county, county and national levels. The study recommendations focus on a
shift in priorities, improvement in capabilities, and filling institutional and organizational
gaps left by the implementation of IWRM at a river basin in the Lower Sio River basin.
The study is also expected to contribute to scientific knowledge on hindrances to adaptive
watershed governance at household and organizational level thus unsustainable food
security interventions in the watersheds of Lake Victoria Basin and Sub-Saharan Africa.

7
As well as contribute to the ongoing debate on Global Sustainable Development Goals
(SDGs); Water, Energy and Food Nexus, and the Sendai Framework on Disaster Risk
Reduction at county and national levels in Kenya.
1.6: The scope of study
The study focused on the Lower Sio River basin that lies in Busia County, Kenya. The
area falls under Lake Victoria Basin and forms part of the wider Nile basin and is located
at the border between Kenya and Uganda. The study assessed variables on adaptive
governance, adaptive capacity, adaptive institutions and adaptive co-management of both
the state and non-state actors, formal and informal institutions in the study area. The data
collection period was from September, 2017 to February, 2018.
1.6.1: Inclusion criteria
While analyzing actors and institutions, the structures or tools that have been put in place
to govern the behaviour of human beings in the watershed were considered. The
structures and tools did not operate in a vacuum but were exercised in groupings that
came into being to achieve some shared goals of individuals and collective larger groups.
Therefore, existing community organizations formed the basis for achieving the study
objectives.
The study was carried out at a multi-level; at the village level, male and female household
heads and individuals from 18 years and above of age was targeted as respondents. Only
one respondent either female or male represented a household. Village elders were
interviewed while the biophysical environment was observed and recorded. At the ward,
sub-county and county levels the representatives of the national and county governments

8
and non-governmental organizations were interviewed, these included: Assistant county
commissioners, environment, water, social services, cooperative and agriculture sub-
county officers, ward administrators, chiefs and assistant chiefs, County Kenya Forest
Service officer, County Kenya Meteorological Department Officer, County department of
irrigation and fisheries, Water Resources Management Authority, Busia Water and
Sewerage Company, Coordinator of Western Kenya Community-Driven Development
and Flood Mitigation, Programme for Agriculture and Livelihoods in Western
Communities, Simpact Kenya, One Acre Fund, Anglican Development Services and
County NEMA officer. In addition, community groups including; Farmers Common
Interest Groups, Community Forest Associations and Water Resources User Associations
were targeted. The relevant policies and legal frameworks that institutionalized the
functions of the actors in watershed governance and food security were also analyzed
based on the study objectives.
1.6.2: Exclusion criteria
The study excluded state and non-state actors who were at entry level in the sub-county
and county such as KIWASH (Kenya Integrated Water Sanitation and Health) project.
Similarly, actors in the county, sub-county and working with institutions not directly or
not indirectly related to watershed management, environment and food security sector nor
consented to the research were excluded from the study. However, in the Lower Sio
River basin, there were no active WRUAs and CFAs as confirmed by County Director of
Forestry and Principal Environment Officer.

9
CHAPTER TWO
LITERATURE REVIEW
2.1: Introduction
This chapter reviews literature from the existing works of other similar or related studies
alongside introducing key variables in watershed governance and food security. It also
integrates theories that provide guidance to this study. The theories applied not only to
facilitate interpretation of the specifics of the research but also to assist in forming a
general understanding of the themes involved in the socio-ecological study by
maximizing the usage of the existing theoretical frameworks. To understand how
watershed governance affects food security, these theories were reviewed: Common
Property Resources, The Tragedy of the Commons, and Institutional Theories. All these
theories originated within sociology and natural resource management studies. These
perspectives view the interaction of humans with the environment or natural resources as
the outcome of human behaviour that need to be regulated. Finally, it outlined the
conceptual framework that indicates how the study variables are interconnected. All these
provided the necessary insight and helped in the conceptualization of the study problem,
and identified gaps that the study intended to address and the variables assessed.
2.2: Watershed governance and integrated water resource management
In the twenty-first century, watershed management has increasingly become a forum for
public engagement in discussions about water and soil management issues. This is after
the realization that no one actor or institution can make very significant inroads into the
complex and multifaceted issues related to water resources (Parkes et al., 2008).

10
Therefore, a wide range of engaged and empowered partners are needed at the smallest
scales of a village and household.
Most watersheds are comprised of both public and private land, and so the active
participation of landowners is needed to help implement watershed management plans,
particularly in more heavily developed watershed areas such as those dominated by
agricultural, urban and/or peri-urban interests (Parkes et al., 2008). Integrated Water
Resources Management (IWRM) approach has undergone several interconnected shifts,
resulting in the current paradigm. Studies in the Lake Victoria Basin indicated that the
basin has been deforested as demand for human settlements, agriculture and grazing land
increases leading to land degradation that is characterized by fertility losses, soil erosion
by water, wind as well as increased sediment load as they drain in Lake Victoria (Ogutu
et al., 2005). Lower Sio River has experienced land use and land cover changes which
have exerted negative ecological impacts affecting the livelihoods of communities
(Obando et al., 2007). FAO (2017) identified gaps in the implementation of IWRM such
as: First, identifying the appropriate scale for interventions and delineating boundaries.
Second, selecting technical and methodological elements to define what constitutes
integration. Third, handling uncertainties that iterative negotiation processes among
stakeholders may bring about; and fourth, measuring multiple benefits and impact.
Therefore, there is need to identify the gaps left with the implementation of IWRM in the
Lower Sio River Basin by focusing on watershed governance and its place in determining
households’ food security.
Recent literature on watershed management indicates demands for new approaches,
which emerged in the last decade (Benson et al., 2015). One such significant change has

11
been the movement towards adaptive water management, which emerged in the United
States of America and Australia. Adaptive management (AM) has been understood as a
systematic process for continually improving management practices (Engle et al., 2011).
This approach involves learning by doing; using feedback mechanisms from the
environment to shape policy, followed by further systematic experimentation, in a never-
ending cycle (Allen et al., 2011). Further, it also features stakeholder input and
knowledge generation, objectives setting management planning, monitoring
implementation and incremental plan adjustment in the face of uncertainty.
Another more recent development has been in integrating governance as a key pillar in
watershed management. Governance refers to the interactions among structures,
processes, rules, and traditions that determine how people in societies make decisions and
share power, exercise responsibility, and ensure accountability, and how stakeholders
have a say in the management of natural resources (Lebel et al., 2006). According to
Dietz et al, (2003) governance provides a social context that allows the collective action,
rule making, and institutions for social coordination at different watershed management
scales. Recently researchers have advanced the concept of adaptive governance arguing
that it is responsive to emerging problems and knowledge surrounding complex
ecological systems (Heikkilia, 2010). It is argued that adaptive governance can foster
effective management and use of shared assets such as common pool resources and
environmental assets that provide ecosystem services (Hatfield- Dodds et al., 2007).
Other researchers emphasize the complementary government and community-based
institutional arrangements that work together in adaptive governance (Nelson et al.,

12
2008). Therefore, adaptive governance aims at providing for collaborative, flexible,
learning-based approaches to managing ecosystems (Olsson et al., 2006).
Globally, the involvement of diverse stakeholders in watershed management is not
unique. The quality, nature and processes for multi-stakeholder involvement have been
seen as critical to the success of watershed management (Mullen and Allison, 1999) and
have provided new insights into the value of an integrated understanding of social and
ecosystem dynamics in watersheds (Sneddon et al., 2002). On the other hand, there has
been a growing perception developed amongst water professionals globally that a new
paradigm was required to better reflect the multidimensional nature of water management
(Biswas, 2008). Although key functions of IWRM identified by researchers include;
stakeholder participation, water allocation, basin planning, information management,
flood and drought management, pollution control, monitoring and financial management
adds, Biswas, (2008). According to Brandes (2006), watershed governance is emerging
as a viable approach to achieving long-term ecological and economic sustainability and
better engagement of local communities, including both rights holders and stakeholders,
in critical decisions that affect all communities living upstream and downstream. Further,
Brandes, (2006) argued that, a key factor for watershed governance success is improved
collaboration and connections between citizens, and decision-makers at the watershed
scale. This is in contrast to IWRM which forwards 'good governance' principles such as
transparency, collaborative decision-making and the use of specific policy instruments
(Benson et al., 2012; Gain et al., 2013). The watershed governance approach is gaining
momentum in Canada, Sweden and Australia among other developed nations. Brandes
and O'Riordan (2014) assert that the six critical watershed governance principle that

13
informs institutional architecture include; water for nature, whole systems approaches
transparency and engagement of affected parties, subsidiarity and clear roles for decision
making, sustainable financing and capacity, and accountability and independent
oversight. These formed the basis for the study assessment in the Lower Sio River
watershed.
Watershed governance approach has many benefits, including building resilience to adapt
to change and enable innovation; leveraging expertise and a diverse range of resources;
clarifying roles and responsibilities, thus increasing accountability; creating opportunities
for shared learning and capacity building; and reducing conflict and increasing public
confidence (Brandes and O'Riordan, 2014). According to Baltutis et al., (2014), it needs
not be yet another layer of government or bureaucracy rather; the overarching goal is to
provide an alternative to current systems of governance and planning that focus too
narrowly on single sectors, thereby isolating water and watershed resources from their
broader interactions across communities and within ecosystems. Brandes and O'Riordan
(2014) identified nine winning conditions for a watershed governance system. These
include: enabling powers in legislation for watershed entities; co-governance with other
international; support from and partnership with local government; sustainable long-term
funding; functional legal framework for sustainable water and watershed management;
availability of data, information and monitoring; independent oversight and public
reporting; assessing cumulative impact; and continuous peer to peer learning and capacity
building.

14
2.3: Food Security and Governance
Globally, attainment of food security is described as a situation in which all people, at all
times have access to adequate, affordable, safe and nutritious food to meet their dietary
requirements and food preferences for a productive and healthy life (FAO, 1996). Key
indicators for food security include food availability, accessibility and utilization and to
sum it up to food stability (Schmidhuber, 2007). While food availability refers to the
physical presence of food where it is needed, food accessibility is the means by which
people acquire the food they need, food utilization refers to the way in which people
make use of food and finally food stability is how the three indicators balance at
equilibrium in a particular community (IFRC, 2007). Therefore, food security requires
the interaction of factors such as food prices, agricultural trade, poverty reduction,
infrastructure, watershed management, education, and crisis management.
In addition to these interactions aimed at improving food security, food security
governance is about managing the context in which these interactions take place (Jessop,
2003). “The Rome declaration identifies poverty and environmental degradation as the
main causes of food insecurity. Further, The Heads of State and their governments also
recognized the need for urgent action to combat natural resource degradation, including
desertification and erosion of biological diversity as means towards the attainment of
food security. They recommended that poverty eradication and food security must be
achieved without putting additional stress on natural resources. In many situations,
therefore, food security and natural resource protection go together” (FAO, 1996).
In developing countries, there are a number of key challenges that undermine food
security such as rapidly growing demand and changes in consumption patterns,
15
competition for agricultural lands for other uses, the effects of global environmental
change, serious degradation of agricultural soil, erosion of the genetic base of agricultural
biodiversity, water scarcity (Pretty, 2009). It was proposed that prescriptions for meeting
the identified challenges range from the need to increase productivity, through the
development and diffusion of different forms of technologies, to an integrated system for
meeting challenges of soil degradation, loss of biodiversity, efficiency in agricultural
water and energy use. Studies concluded that generating and sustaining agricultural
growth is seen as an important element in reaching and sustaining food security
especially in developing countries (Pingali, 2007). On the other hand, Kropff et al. (2013)
indicated that food security cannot be realized by means of idealistic plans or new
technologies only, but it needs advanced steering strategies that involve governments as
well as companies, NGOs and citizens at a watershed level.
Further, recent studies reveal econometric substantiation on the relationship between
institutions, human capital, and agricultural productivity growth in developed and
developing countries while other studies found no evidence that political institutions
could necessarily cause growth in agricultural productivity (Candel, 2014). As a result,
researchers have expressed that human capital accumulation emerges as an important
factor in driving the process towards food security (Fulginiti, 2010). On the other hand,
Candel, (2014) noted that within the recent food security debates, the role of governance
has been attracting increasing attention for both researchers and policy makers.
The reason advanced for this course is that food security solutions or approaches should
not only address the technical and environmental dimensions of the issue, but also take
social, economic, and political aspects into account (von Braun, 2009; FAO, 2012;

16
Wahlqvist et al., 2012; Maye and Kirwan, 2013). However, Candel, (2014) argued that
there may be changes over time as global institutions, regions, national governments and
communities attempt to make use of different resources within their reach to attain
agricultural growth objectives. Further, added that in spite of various calls for food
security governance, it is not very clear yet what food security governance entails, what
its essential characteristics or features, and how it could be enhanced. The study looked at
watershed governance as a prerequisite for food security conceding also that food
security governance also contributes to watershed management.
2.4: Perceptions influencing watershed governance and hence food security
Kristin et al. (2015) pointed out that human behaviour is the driving force underlying
many resource management concerns, but is often the component that is given the least
amount of attention in the development of management plans. Moreover, Werg et al.
(2013) argued that social factors like perceptions of risks have a particular importance for
reducing vulnerabilities and building social capacities because they can be changed easily
and faster than other social factors like economic, technological or infrastructural
development, which often need longer timeframes to be altered.
Studies in social science theories that describe and predict the relationships among these
factors and watershed projects include, but are not limited to, attitudes, value orientations,
perceptions of social capital, trust, risk, and awareness (Kristin et al., 2015). Therefore,
the role of institutions in the watershed governance is central in impacting and sustaining
natural resources behaviour change (Heberlein, 2012; Kristin et al., 2015) since
institutions are responsible in determining these factors. According to Ajzen (1991), the
influence of attitudes, subjective norms, and perceived behavioural control on the

17
intentions of individuals to undertake particular actions, also holds promise for
understanding the social determinants of human behaviour related to water resources, and
for informing policies on watershed management.
On the other hand, perceived behavioural control in watershed management can have
several components, including ones’ understanding of opportunity, knowledge, skills,
time, or perception of financial resources necessary to carry out the behaviour (Ajzen,
1991; Ajzen, 2002; Fishbein and Ajzen, 2010). In addition, Kristin et al. (2015), observed
that watershed plans that assume the main barrier to changing behaviours of individuals
or lack of knowledge regarding issues impacting water and the actions that can be taken
to solve them. Behaviour choices are predicated on a variety of social, psychological,
institutional, and economic factors that need to be understood for successful watershed
plan implementation (Kristin et al., 2015). Watershed managers may work with risk
perceptions revolving around water quality, water quantity, flood control, and the impacts
of water development on other values, such as biodiversity or scenic views to effect on
food security (Robles et al., 2011; 2014). Therefore, the changeability of factors such as
perceptions of risk associated with watershed destructions, knowledge, experience,
habitual behaviour, norms and values is important in adaptive watershed governance.
2.5: Resilience and adaptive capacity of institutions in a social ecological change
impacts
The literature on resilience and adaptation indicates that adaptive capacity is one of the
determinants of vulnerability, in addition to exposure and sensitivity. Hence systems with
high adaptive capacity are able to re-configure themselves when subject to change
without significant declines in crucial functions of the socio-ecological system (Koontz et

18
al., 2015). In various discussions, authors have used the term resilience, while others
have focused adaptive capacity of households, local communities and nations; there is
little research on assessing institutions on their ability to enhance the adaptive capacity of
society (Gupta et al., 2010). Elsewhere, adaptation has been found useful in disaster risk
reduction; environment and climate change because it recognizes that the same climate
change might produce different impacts due to variations in the stability and vulnerability
of different social or ecological systems. According to Pelling, (2011) resilience “is not
simply synonymous with adaptation.” This is illustrated by an example where (short-
term) risk management can lead to (longer- term) institutional inertia, which highlights
the need to understand the “social processes shaping resilience”.
Successful adaptive approaches in any ecosystem will; first require building knowledge
and understanding of resource and ecosystem dynamics (Schultz, 2009). These will
include mechanisms to detect and respond to environmental feedback in a way that
resilience is created as well as ecological knowledge and understanding of ecosystem
processes and functions. Second, feed ecological knowledge into adaptive management
practices which will require continuous testing, monitoring, and re-evaluation to enhance
adaptive response factoring in uncertainty in complex systems (Schultz, 2009).
Therefore, local watershed governance systems need to adapt to new knowledge and
build this into management plans rather than striving for optimization based on past
records (Berkes et al., 2003). Third, the adaptive system will support flexible institutions
and multilevel governance systems through operationalization of the adaptive governance
framework (Olsson et al., 2004). The dynamic learning characteristic of adaptive
management is combined with the multilevel linkage characteristic of co-management.

19
There will be the sharing of management power and responsibilities which involve
multiple and polycentric, cross-level institutional and organizational linkages among user
groups and communities, government agencies, and nongovernmental organizations
(Schultz, 2009).
Gupta et al., (2010) stressed on adaptive capacity by arguing that it should include; the
characteristics of institutions (formal and informal; rules, norms and beliefs) that enable
society (individuals, organizations and networks) to cope with climate change and the
degree to which such institutions allow and encourage actors to change these institutions
to cope with climate change. Adger (2003) noted that promoting resilience means
changing, in particular, the nature of decision-making to recognize the benefits of
autonomy and new forms of governance in promoting social goals, self-organization, and
the capacity to adapt.
Promoting resilience is concerned with the knowledge required to facilitate robust
governance systems that can cope with environmental changes and social, demographic
and democratic transitions (Adger, 2003). According to Gupta et al., (2010), institutions
that promote adaptive capacity should be assessed based on their ability to; encourage the
involvement of a variety of perspectives, actors and solutions; enable social actors to
continuously learn and improve their institutions; allow and motivate social actors to
adjust their behaviour; mobilize leadership qualities; mobilize resources for
implementing adaptive measures; and support principles of fair governance. In most
cases, adaptation activities are more local (that is a district, regional or national) issues
rather than international (Paavola et al., 2005; Parry et al., 2005). This is because
different communities in different geographical locations and scales are exposed to

20
different levels of vulnerability and possess varying adaptive capacities, thus they tend to
be impacted differently, and thereby exhibiting different adaptation needs (Ndesanjo,
2009). Moreover, Majule et al. (2007) noted that adaptive capacity to climate change
varies within communities due to various factors including the variation in wealth among
social groups, age, gender and sex. It is, therefore, necessary to understand what
influences the ability of institutions to adapt to climate change (Adger et al., 2005) as
such ability is one main factor affecting adaptive capacity of other actors in the water
sector to climate (Adger et al., 2007; Gupta et al., 2010). This is because even if
institutions appear to possess or create adaptive capacity, this does not automatically
mean that society will use this capacity and be able to successfully adapt as it merely
indicates that the institutions provide a higher likelihood of allowing for adaptation
(Gupta et al., 2010).
A good case of adaptation and eventual resilience is put across by Bolling’s (2003) work
on Pokot pastoral community in Kenya. Bolling explained that both populations have
developed a number of strategies to cope with shortfalls in food production. These
include: herd diversification to contain different impacts of drought on grass and bush
land; intensified sharing of food; networks of livestock sharing through livestock loans
and gifts during good times to create networks of obligations; institutionalized resource
protection through indigenous knowledge approach; extended spatial mobility and rituals;
as well as reliance on food aid. Adger (2003) postulated that adaptation to global
environmental change is likely to be punctuated by examples of system collapse unless
resilience is recognized as a central goal of sustainable development. Further, success in
environmental policy should be redefined by how it promotes and facilitates resilience,

21
and by how it promotes legitimate, a broad-based development that allows individuals
and societies to cope with risk and adapt to changing circumstances over time (Adger,
2003). In the same argument, Majule et al., (2007) noted that adaptation mechanisms
have been developed by different socio-economic groups; the poor people sell labour in
rich peoples’ farms, engaging in non-farm income generating activities such as brick and
charcoal making, reducing the number of meals from two to one per day; the middle
adapt by engaging in non-farm income generating activities, food vending, and resorting
to cheap marriages; and the rich tend to hide food to discourage the rest of the community
from begging food. Researchers indicated that most works on the adaptive capacity of
watershed institutions are either hypothetical assessments or not focusing on the inherent
characteristics of the institution’s capacity. Hence approaches are proposed to assess if
institutions are enhancing the adaptive capacity of society to respond to climate change
(Gupta et al., 2010) and how the characteristics of governance approach shape the
adaptive capacity of water systems to climate change (Engle and Lemos, 2011).
2.5.1: Institutional Role in Socio-ecological Resilience and Adaptive Capacity
Enhancement
Crawford and Ostrom (1995), defined institutions as enduring regularities of human
action in situations structured by rules, norms and shared strategies. Created by people,
institutions organize and structure human behaviour towards collective ends (Ostrom,
2005; Bussey et al., 2012). Institutions can promote or hinder individual actions to adapt
to changing conditions (Koontz et al., 2015).
Advancing from IPCC, (2007) definition of ‘adaptation’ and Ostrom’s definition of
‘institution’ Engle and Lemos (2010) defined adaptive institutions as those institutions

22
where actors are able to adjust to, encourage individuals to act in ways that maintain or
improve to a desirable state. Further, such adjustment demonstrates flexibility and
diversity, where the ‘‘ability of the institution to bend, but not break, and to learn through
experience, speaks to its ability to manage a crisis effectively and efficiently''.
River basin management is designed to address the effects of upstream and downstream
interdependencies of water use in a catchment (Moss, 2004). The challenge is that a river
basin is not just a simple spatial entity but a complex one. In terms of space, most river
basins are said to comprise several smaller catchments ranging from the scale of trans-
boundary, sub-national or regional to local scale, nested within one another, each
presenting unique water management problems and affecting the choice and functioning
of water management structures (Bohensky and Lynam, 2005).
Adaptive institutions are intended to cope with multiple objectives inherent in such
social-ecological systems (Pahl-Wostl, 2009). Komakech, (2013) argued that an effective
coordinated management of the water resources of a river basin as stipulated in IWRM
depends on the presence of an institution whose regulatory mandate and tasks are known
and accepted by a majority of stakeholders. Stakeholders can then be considered those
who have a legitimate claim to the water resources (Komakech, 2013). Studies identified
numerous characteristics of adaptive institutions, including participatory, inclusive,
integrative, risk tolerant, flexible, legitimate, accountable, diverse, creative, learning,
iterative, autonomous, resourceful, self-assessing, collaborative, transparent, reflexive,
and integrated them broader processes (Gupta et al., 2010).

23
Researchers have also identified a variety of variables linked to adaptive institutions
including; social capital, leadership, resources, external regimes, self-organization, rule
compliance, and biophysical context. These characteristics are described as normatively
desirable since they help promote the desired end of more successful problem solving
(Koontz et al., 2015). The institutional memory of past climate events and traditional
knowledge have, to the present, dominated adaptation experiences among local
communities in Kenya. Among farmers, for instance, the increasing unpredictability of
rainfall season in East Africa has led to more people having to adapt simple modern
technologies such as use oxen ploughs and tractors as opposed to traditional approaches.
Ploughing land using oxen is much faster than hand and this speed allows maximum use
of the shortened, often intermittent rainy period for crop production. However, the
poorest households can rarely afford to plough using oxen and the wealthier owners
prepare their own fields first (Nelson and Stathers, 2009).
An entitlement literature by Sen (1981), concerned with the problem of inequality, and
the ways in which formal and informal rules create and reinforce unequal access to
resources such as watersheds. According to Leach et al. (1999) in the framework for
environmental entitlement, heterogeneity among communities and categories of
institutions at macro, meso, and micro levels were considered. Therefore, the
relationships among the institutions and between scale levels influences which social
actors that gain access to and have control over local resources. This was found useful
because it keeps an eye on the conflicting interest in organizing livelihoods since
communities are not static and multiple identities and conflicting values and claims over
the natural environment occur; it also showed how political arena of livelihoods should

24
be analyzed through the working of institutions (de Haan and Zoomers, 2005). Therefore,
the framework contributed to the analysis of livelihoods as it emphasized the economic
attributes of livelihoods as mediated by social institutional processes (Scoones, 2009).
Elsewhere, according to Moss (2004), institutional interplay refers to boundaries
problems related to political responsibilities and social sphere of influence, and that it is
along these boundaries, where the jurisdictions and interests of actors’ overlap, that
conflicts between institutions arise (Komakech, 2013). Similarly, Warner et al. (2008)
argued that water management approaches are not cast on stone but outcomes of political
choices which are based on values and preferences. The choice of a river basin as the
most appropriate scale of water management is just a political one; it can be made
differently (Warner et al., 2008). Nygren (2005) applied the Leach et al. (1999)
framework in analyzing the institutional context of communal forest management in
Honduras and found that sustainability of communal forest management depended on
many macro-scale forces including land tenure legislation, loan conditions, and national
and global forest markets.
Foerster (2011) advanced that adaptive institutions are necessary to move towards
sustainability outcomes because of their ability to adjust participation from multiple
stakeholders with multiple interests that evolve over time. Adaptive institutions are
important for adaptive governance (Koontz et al., 2015) whereby they are thought to help
a governance system cope with uncertainty and complexity (Huntjens et al., 2012). In
summary, the concept of adaptive institutions is different from the general concept of
institutional change. Institutional change they do not necessarily mean to take a direction
that maintains or improves a desirable state. For instance, it is suggested that an
25
institutional change could make an institution less adaptive or improve institutional
characteristics other than adaptiveness (Koontz et al., 2015).
Furthermore, Koontz et al. (2015) also noted that in order to adjust systems to
environmental issues, make and implement the right decisions, institutions need to be
changed, adjusted, expanded, or created. Hence adaptive institutions have been
highlighted by researchers studying water resource systems, wetlands, climate change,
flood infrastructure, and more generally the ‘‘tragedy of the commons’’ dilemma facing
many social-ecological systems (Huntjens et al., 2012) such as the Lower Sio River
Basin.
2.5.2: Governance role in Socio-ecological Resilience and Adaptive Capacity
enhancement
Adaptive governance is an approach that is expected to generate the desired end goal of
adaptive capacity (Cook et al., 2011). Studies indicate that researchers confuse adaptive
governance with adaptive institutions, Koontz et al. (2015), defined adaptive governance
as changing rules and norms of institutions as defined by Ostorm (1990). Adaptiveness
can be understood as the ability to recover or adjust to change through learning and
flexibility, so as to maintain or improve to a desirable state (Engle and Lemos, 2010).
Advancing from Lebel et al. (2006) definition of the concept of governance, researchers
noted that governance also include “a range of institutions and relationships involved in
the process of governing,” which “encompasses both formal institutions such as laws,
policies, and organizational structures, and informal institutions (Huitema et al., 2007).
These institutions can provide more effective solutions to collective action problems than
centrally mandated institutions because they foster local knowledge, the inclusion of

26
participants, better-adapted rules, and lower enforcement costs (Ostrom, 1990).
According to Koontz et al. (2015), adaptive governance steers policy interactions to
guide management of resources in a manner that is able to recover or adjust to change so
as to maintain or improve to a desirable state. The adaptive governance approach was
found relevant for social-ecological systems, whose dynamic nature is not well served by
a static approach. These systems occur at a variety of scales and include a wide range of
resources, from local fishing economies to global climate change (Ostrom, 2009).
Klein (2004) clarified that adaptation is undertaken by governments on behalf of society,
sometimes in anticipation of change, but, again in response to individual events. At any
level, adaptation proceeds through two main steps: facilitation and implementation.
Whereas the former involves raising awareness, removing barriers and making funds
available for adaptive strategies, the latter involves making physical operational changes
in practice and behaviour. Adaptation to climate change can be reactive or proactive
(anticipatory) (Paavola and Adger, 2005; Parry et al., 2005). Literature on adaptation
showed that reactive adaptation responds by reacting to the present impacts of climate
change with, for example, the provision of food aid after a disaster, relocation or
reconstruction of infrastructure after flood damage or migration to a new location.
Proactive adaptation, on the other hand, seeks to avoid the risks and impacts of climate
change before they happen for instance diversification of crops and change of agricultural
patterns, designing and building higher floor levels or suspended timber floors and land
zoning (Parry et al., 2005).
Based on Lawrence et al. (2011) argument, an institutional work highlighted how and
why actors work to interpret, translate, transpose, edit, and recombine institutions, and

27
how those actions lead to unintended adaptations, mutations, and other institutional
consequences. However, it is indicated that in Africa, policymakers have recognized the
need to integrate climate change adaptation into all spheres of public policy-making
(Madzwamuse, 2010). Adaptive governance of ecosystems generally involves polycentric
institutional arrangements, which are nested on quasi-autonomous decision-making units
operating at multiple scales (McGinnis, 2000). They involve local, as well as higher,
organizational levels and aim at finding a balance between decentralized and centralized
control (Imperial, 1999). The vertical links of such arrangements may boost adaptive
governance, for instance when local and national institutions gain strength from being
nested in regional and global institutions. According to Young (2002), such links can also
stifle adaptive governance, as in cases where national land-use regulations contradict or
undermine informal local systems of land tenure and limit practitioners' abilities to
exploit an inter-organizational network's collaborative capacity (Imperial, 2001).
Koontz et al. (2015) argued that if adaptive governance of social-ecological systems is
the desired approach, then researchers should seek to understand what factors promote it.
Further, several studies in the past two decades have identified a variety of such factors
operating in different contexts including; polycentric systems, vertical coordination,
informal networks, learning, leadership, evolving rules, information, conflict resolution,
rule compliance, infrastructure, institutional preparedness for change, nested institutions,
institutional variety, dialog, social capital, memory, knowledge, cross-scale interaction,
multi-level governance, and organizations. Such factors promote or influence adaptive
governance through adaptive institutions (Koontz et al., 2015).

28
Integrated planning and management of international river basins has seldom proved
straightforward in Africa. Developing these basins requires agreements, institutions,
information sharing and human resources (Wright et al., 2003). Some authors
acknowledge that degradation of water resources in Kenya is compounded by intense
water exploitation. However, more literature has revealed that the water sector in Kenya
has historically suffered from low levels of investment, resulting in low adaptive
capacities, also many watersheds have been damaged by logging, encroachment of
settlements, and changing borders, in addition to government policy changes which
include de-gazettement of national forests in the early 1990s (Miller et al., 2003). The
Water Act (2002) now repealed Water Act (2016) did not recognize the existence of a
pluralistic legal framework or customary rights (Mumma, 2005). On the other hand,
although irrigation schemes such as the proposed Lower Sio Irrigation Scheme are
considered by some as important for agricultural development and food security, for
others these are "white elephants". According to Yanda and Mubaya, (2011), the success
of these schemes is notably fought by conservation groups and other resource users. As a
result of little capacity by the governments to feasibly implement climate change
adaptation, the burden is left to local communities, households and/or individuals. It is
valid to note that local communities need help to adapt to climate change and other
environmental changes, as these coping strategies may lead them to become more
vulnerable not only to changes in the natural resource base but to food and nutritional
insecurity (Yanda and Mubaya, 2011).

29
2.6: Nexus between watersheds governance and food security
Studies by Wani et al. (2008b) and FAO, (2017) revealed that a watershed is not only a
hydrological unit but also a socio-ecological entity that plays an important role in
determining food, social and economic security as well as providing life support services
to rural people. As a result, recent developments have occurred in response to global food
and economic crises at a watershed level. The Water- Energy Food Nexus (Bazilian et
al., 2011) acknowledged the links between water, energy and food resources in
management, planning and implementation (Bach et al., 2012). Water, energy, climate
and food security are self-evidently close related. The nexus is often presented as the
integration of multiple sectorial elements such as energy, climate, and water and food
production within an overarching governance approach (Benson et al., 2015). Moreover,
global policy makers emphasize that good governance is a precondition for water, energy
and food security where political stability with the absence of violence, the rule of law,
voice and accountability, government effectiveness, regulatory quality, control of
corruption and environmental governance (World Bank, 2004). Instability of food prices
linked to climate change events highlighted the general vulnerability of resource
production systems and the overexploitation of water in particular. To avert such issues,
the 2008 World Economic Forum (WEF) annual meeting agreed upon a Call to Action on
Water aimed at re-examining the relationship between water and economic growth (Bach
et al., 2012).
A fundamental prerequisite for this integration is coordination between government
agencies (Rouillard et al., 2014) and hence government steering of different policy
objectives. Two important objectives involve linking social and economic development

30
with natural ecosystems protection, and the optimal allocation of water services (GWP,
2010). Recent indicators underpinning discussions on water resources, food security,
climate, energy globally, focus on policy integration, governance, scale, participation,
resource efficiency and sustainable development. There is need to conceptualize these
terms together to ensure sustainability. In addition, the WEF nexus was one of the main
approaches considered by the United Nations in setting its Sustainable Development
Goals (SDGs). According to Benson et al. (2015) given this high-level support, it could
be anticipated that the nexus discourse should be influencing national water governance
strategies. Early studies indicated that water-food nexus issues are salient in Kenya (Patel
et al., 2012; Obando et al., 2007). This is as a result of competing demands for water
resources resulting to a challenge to decision-makers in the face of population growth and
increasing negative impacts of climate change (FAO et al., 2012; Villamayor, 2015). To
sieve through the complexity in watershed management and food security, this study
examined the state of adaptive watershed governance in enhancing food security in the
Lower Sio River Basin, Busia County, Kenya.
2.6.1: Watershed governance changes impacts on food security
Watershed governance can be viewed as both a challenge and a solution to food security.
Literature revealed that bad governance in any state or a nation is to blame for the
negative outcomes on the nation’s food security (Candel, 2014). Therefore, well-
developed governance arrangements that are able to respond effectively to both crisis
situations and structural concerns are inherent to eradicating hunger (Haddad, 2011;
Candel, 2014).

31
Researchers in food security and watershed governance emphasized that poor governance
that may lead to the destruction of watersheds rather than the natural conditions may
constitute the main driver of food insecurity (Boyd and Wang (2011). Thus governance
systems characterized by conflicts, lack of institutional capacity, poor policy design, and
lagging implementation can inflict serious harm to the production and distribution of
healthy food (Candel, 2014). It can be a significant contributing factor to food insecurity
when it fails to effectively address natural, economic, or social drivers of conjectural or
structural hunger (Sahley et al., 2005; FAO, 2012; Pereira and Ruysenaar, 2012). Earlier
studies have proved that governments often fail to respond to crises because of poor
decision making, limited coordination, weak institutions, and scarce resources
(Ruysenaar, 2012). The creation of a new social policy program and a ministry, which
has been tasked with coordinating the work of other ministries toward a number of food
security goals, has had a significant positive impact on food and nutrition security for
example in Brazil’s (Haddad, 2011; Candel, 2014).
Watershed governance can be a very complex in food security interventions. Food
security is always affected by a wide array of domains such as agriculture, trade,
fisheries, environment, development cooperation, and energy, as a result of which many
actors and institutions are involved in food security governance (Mohamed, 2009).
Therefore, it is recognized that food security is a highly complex and multi-dimensional
issue that is impacted by a broad range of drivers and food system activities, stretches
across various scales, and involves multiple sectors and policy domains (Pereira and
Ruysenaar, 2012; Colonelli and Simon, 2013).

32
The literature emphasizes that food security governance is spread not only across
domains and sectors but also across spatial scales. States of, as well as challenges to, food
security can be considered on a global, regional, or national level, but have also been
increasingly studied and addressed at local, community, household, or individual levels
over the last decades (Candel, 2014). As a result, Paarlberg (2002) argued that the main
drivers and solutions should primarily be sought at national level while McKeon (2011)
emphasized that recent food crises have shown that ongoing globalization and the
associated entanglement of world food systems have led to a situation whereby food
insecurity drivers increasingly lie outside the scope of national governance.
The successes and failures of current institutional architectures to address complexities in
watershed governance as a necessary condition for food security governance is also
another concern. Critiques of the global governance and food security are that there is no
truly authoritative and encompassing body or institution with a mandate to address food
security concerns across sectors and levels (McKeon, 2011; Colonelli and Simon, 2013).
However, this can be attributed to the lack of national and sub-national governance
arrangements and associated studies, especially in developing countries (Thomson,
2001). Candel (2014), indicated that instead, responsibilities, jurisdictions, and foci are
spread across a broad range of international organizations and forums, which all have
their own core business, but none of which dealt with food insecurity in a holistic and
inclusive manner (FAO, 2011; FAO, 2012).
In addition, complexity and the difficulties with the design of institutional structures stem
from an increase in the number of actors involved in the watershed and food security
approaches, or that have a direct or indirect impact on food security (McKeon, 2011;

33
Pereira and Ruysenaar 2012; Seed et al., 2013). The increase in stakeholders in watershed
management and food security can be reduced to three types in particular: international
organizations, civil society organizations (CSOs), and private sector corporations
(Candel, 2014). These actors are active on all governance levels and within international
organizations or government agencies, whereby they often ‘shop’ between forums or
venues, depending on where they perceive their interests to be best represented (McKeon,
2011; Duncan and Barling, 2012). Civil society organization participation in the
watershed and food security activities provides a complementary role to more traditional
government-centred approaches.
Civil society can provide the policy-making process with valuable information, brings
watershed and food security governance closer to the people, therefore, enhancing the
legitimacy of, and public support for, food security interventions, which, together with
the resources that CSOs can bring in, stimulate effective implementation (Koc et al.,
2008). CSOs also form bridges and linkages between government agencies that did not
previously cooperate, or between various governance levels (global – national, national –
local, global-local), and thus contribute to a multi-sector and multi-scalar approach
(McKeon, 2011; Edwards, 2012). CSOs frequently operate as co-workers of government
agencies and can offer the capacity that government often lacks (Seed et al., 2013;
Candel, 2014). In some cases, some actors may benefit from the exclusion of others,
because it enables them to satisfy their own agendas. Therefore, these forms of
collaborative governance call for appropriate structures, capacity, and political will,
which are not always at hand. In addition, involving civil society actors entails a shift in

34
bureaucratic philosophies, and this requires time and continuous effort (Seed et al., 2013;
Koc et al., 2008).
According to Candel (2014) the individual actions of organizations, countries, donors,
corporations, and other private actors can address various drivers and aspects of
watershed governance and food insecurity but would, together, have to result in a
coherent and holistic approach, whereby trade-offs and duplicated efforts are minimized
and one actor’s course of action does not impair that of others. Therefore, a high degree
of coordination was proposed, both between the currently fragmented institutions and
between governance levels, and integration of food security concerns into other policy
domains or sectors (McKeon, 2011; Seed et al., 2013). On the other hand, various
discourses or paradigms may exist at the same time and compete for domination; this
leads to conflicts between their proponents about the courses of action to follow and
about who is to decide (Lang and Barling, 2012). Increasing awareness and
understanding of the multitude of ideas and to agree on some basic principles and values
will be necessary (McKeon, 2011).
Based on Brandes (2006) proposals, good watershed governance arrangements will
require various types of resources that are essential to create and maintain responsiveness
and effectiveness to food security issues. Further, it is indicated that governance
arrangements have often failed to effectively address hunger because most energies were
expended on shaping their architectural features without sufficiently thinking out the
sustainable resource allocation that these institutional architectures need to be effective in
the long term (Candel, 2014). For example, a sufficient budget (FAO, 2009), political
will, leadership, prioritization, knowledge and values such as accountability,
35
transparency, legitimacy, inclusiveness, and responsiveness are inherent to enhance food
security (FAO, 2011; Haddad, 2011; FAO, 2012). These values are applicable not only
during policy formulation but throughout all governance processes, including
implementation and evaluation (FAO, 2011).
2.6.2: Watershed governance and food security initiatives in Kenya
From the year 1999, the Government of Kenya (GoK) has been in the process of water
sector reforms that culminated with the enactment of the “Water Act 2002” (GoK, 2002)
and currently Water Act of 2016. Since then, all previous policies and programmes
related to the conservation of water sources and water bodies (including; lakes, streams
and rivers) have been subjected to this new Act. The review of the Act revealed that
institutional reforms in the Water Act (2016) were guided by several principles among
them; decentralization of the decision making and operations from the national level to
the catchment level to increase efficiency and effectiveness, devolution of responsibilities
for water resources management to the Water Resources Authority, Catchment Boards,
communities and other actors, and the inclusion of stakeholders and users in advisory and
decision-making capacities wherever possible (GoK, 2005). It, therefore, provided
mechanisms for complaints, public notification and consultation (Section 107). Section
15 of the Act empowered the Water Resources Authority (WRA) to formulate Catchment
Management Strategies (CMS) for the management, utilization, development,
conservation, protection and control of water resources. This was to be done in
consultation with local stakeholders gathered around an entity known as the “Water
Resources Users’ Association (WRUA) (Luwesi et al., 2014).

36
On the other hand, the National Water Resources Management Strategy (NWRMS)
outlined major issues and challenges faced as well as key objectives and strategies that
would address these issues (GoK, 2007). According to Ngigi and Macharia (2007), it
emphasized the application of Integrated Watershed Management (IWM) principles to
support Kenya's social and economic development and required substantial investments
in the water sector. Therefore, the implementation of these reforms was directly
supported by development partners such as German International Cooperation and
academic institution such as Kenyatta University alongside Integrated Watershed
Management (IWM) practitioners and local stakeholders. These forums focused on
capacity building for the implementation of IWM plans. Hence, they provided a ground
for the development of implementable strategies that address major challenges facing
watersheds in the country (Luwesi et al., 2014). According to Obando and Shisanya,
(2006), in Kenya, the Bwathonaro and Ngaciuma Kinyaritha watersheds of the Tana
River Basin were retained as pilot areas for implementations of the new water rules
(Luwesi et al., 2014). Therefore, governance issues in watersheds in Kenya have been
conceptualized as part of IWM which has been viewed as an appropriate analytical and
management unit for sustainable utilization of resources.
Studies indicate that Kenya suffers from chronic food shortages with less than 20 per cent
of its land suitable for agricultural use (Langinger, 2011); the majority of the population
in Kenya is still living in rural areas, hence depending on agriculture as their source of
livelihoods. To make it worse, agricultural production heavily depends on rainfall, thus
current trends of climate change heavily impacts Kenya's agricultural sector (GoK, 2011).
For instance, according to Patel et al. (2012), droughts are more frequent and last longer,

37
rainfall patterns in recent years have become unpredictable and heavier thus destroying
crop yields while rain fed agriculture is the major contributor to domestic food supply in
Kenya.
Water has been recognized to be the most limiting factor for food production in the
country. Food and water are inextricably linked; without water security, there will be no
food security (Patel et al., 2012). Therefore, for food security to be achieved in Kenya, an
integrated approach in managing water resources is necessary; at the community level
(upstream-downstream relationships), Sub-basin (within countries), Basin, Nationals
(shared water, basins) and Regional (for example, Nile Basin Initiative). Some authors
suggested that failure to achieve food security is due to ignorance of agricultural sector in
developing country's agenda (Rajaonarison, 2014); the Kenyan government has
continued to implement agricultural policies and programs related to environmental
protection and food security to foster sustainable food production. The country receives
foreign aid in form of various development programs related to natural resource
management and food aid. In addition, watershed resources management has remained a
focus in Kenya’s food security policies (GoK, 2011).
2.7: Effective adaptive co- management in a social ecological watershed system
According to Armtage et al. (2009), social-ecological complexity and the ever-changing
human-environment conditions require building trust through collaboration, institutional
development, and social learning efforts to foster ecosystem management and resolve
multi-scale society–environment dilemmas. Therefore, adaptive co-management is
emerging as an approach towards addressing these dilemmas. According to Olsson et al.,
(2006) governance in adaptive co-management is fundamentally founded on the concept

38
of cross-scale linkages, but the cases that are used to illustrate how this might work are
almost invariably drawn from experiences in developed countries. According to Armtage
et al., (2009), attention to the learning (experiential and experimental) and collaboration
(vertical and horizontal) functions necessary to improve the understanding of, and ability
to respond to, complex social-ecological systems is need. On the other hand, Koontz et
al. (2015) noted that collaborative governance is also another closely related concept to
polycentrism. This is a situation whereby governments or non-governmental actors
configure and reconfigure networks and organizations related to a particular issue or
functional area (Ansell and Gash, 2008). Moreover, Koontz et al. (2015) postulated that
collaborative governance shares many features with polycentricism. For example,
collaborative governance for environmental issues such as watershed management is
marked by overlapping boundaries (watersheds that cross political jurisdictions), a focus
on a particular issue, and power sharing across multiple jurisdictions (Schlager and
Blomquist, 2008). This is a characteristic of the Lower Sio River Basin whereby it is a
trans-boundary river between Kenya and Uganda as well as the upper Sio originates from
Bungoma and Kakamega counties in Kenya.
The literature indicates that most developing countries, characterized by low levels of
capacity at multiple scales, cross-scale institutional linkages constitute the fundamental
challenge when attempting to initialize transitions toward adaptive co-management
(Cundill and Fabricius, 2009). There are concerns among scientists and researchers that
adaptive co-management of complex systems has not progressed beyond mere
philosophy and that the concepts and processes involved are poorly understood. This is
because: First, although the need to evaluate the processes and outcomes of adaptive co-

39
management is recognized (Plummer and Armitage, 2007), approaches to achieving this
have not been tested on the ground (Cundill and Fabricius, 2009). Second, although a
descriptive analysis of transformations in local governance has been provided (Olsson et
al., 2006) based on case study comparisons, the mechanisms that drive transformations in
social-ecological systems are not well understood (Walker et al., 2006). Third, although
the need to understand the ways in which such transformations might be initiated and
monitored is considered critical (van der Brugge and van Raak, 2007), appropriate
methods to measure and monitor change in complex systems have not been
systematically developed or tested (Western, 2004), and the tools for evaluating co-
management, in general, have been described as surprisingly blunt (Carlsson and Berkes,
2005). Such interventions have not been tested under the current system of governance in
Kenya. Creating a supportive environment for developing the self-organizing capabilities
of role players in adaptive co-management is therefore critical. Further, it is identified
that factors requiring greater attention in efforts to initiate adaptive co-management in the
future include community perceptions of support from outside agencies, access to long-
term funding for adaptive management, and access to reliable information (Cundill and
Fabricius, 2009). In Kenya, the agencies and actors in watershed management and
agriculture sector exist but a mechanism of engagement within the new governance
system is not yet documented at a multiple-level for example county and national levels.
Armitage et al. (2009) provided ten conditions necessary for adaptive co-management.
These include; well-defined resource system, small-scale resource use contexts, clear and
identifiable set of social entities with shared interests, reasonably clear property rights to
resources of concern, access to adaptable portfolio of management measures,
40
commitment to support a long-term institution-building process, provision of training,
capacity building and resources for local-regional-national level stakeholders, key leaders
or individuals prepared to champion the process, openness of participants to share and
draw upon a plurality of knowledge systems and sources, and national and regional
policy environment explicitly supportive of collaborative management efforts. Co-
management emphasizes the sharing of rights, responsibilities, and power between
different levels and sectors of government and civil society (Huitema et al., 2009).
However, polycentricism contributes to adaptive governance, through the promotion of
self-organized institutions, because individuals in a polycentric system are empowered to
develop collective solutions to local problems as they arise (Koontz et al., 2015).
Polycentric systems can also give rise to spillover effects with potentially undesirable
consequences for racial segregation, income sorting, urban sprawl and environmental
degradation (Ross et al., 2013).
2.8: Linking Devolved Governance in Kenya to Socio-ecological Adaptive Capacity
and Co-management
In recent years, Kenya has undergone through socio-economic, environmental and
political transformations that have been instigated by development challenges such as
poor governance, threats of climate change, environment resource degradation, rapid
population growth and increasing levels of socio-economic inequalities among others.
This resulted in institutional and organizational reforms as an adaptive policy response to
the challenges. Like other world governments, the focus today is on introducing
decentralized decision-making bodies such as River Basin Authorities, with prescriptions
for public and private sectors involvement in decision making (Komakech, 2013). Central
41
to the approaches are some key design principles contending that management
institutions can be crafted by the resource users and policymakers (Ostrom, 1990;
Ostrom, 1993).
Actors involved are likely to rework the new arrangements in combination with the pre-
existing local institutions, or reject them all together (Cleaver, 2002). Thus the
governance process can be undertaken by the government, resource users as well as by
organizations of all types and at all scales (Blomquist, 2009). The challenge, however, is
that no perfect governance arrangements, to be applied in water-stressed river basins,
exist (Komakech, 2013). According to the World Bank, (2012), decentralization has been
increasingly seen and adopted worldwide as a guarantee against the discretionary use of
power by central elites, as well as a way to enhance the efficiency of social service
provision, by allowing for a closer match between public policies and the desires and
needs of local constituencies. Earlier lessons on African Socialism at Kenya's
independence; Harambee; District Focus on Rural Development (DFRD); Local
Authority Transfer Fund (LATF); and Constituency Development Fund (CDF)
development strategies (Namenya, 2012) just to list a few were faced with challenges of
efficiency in delivery of public services in addition to highly centralized government
bureaucracies as earlier indicated by Mwabu et al. (2001). At its heart, the Constitution of
Kenya (2010) came with the change through the concept of devolution of political and
economic power to forty-seven newly created counties as a key vehicle for addressing
spatial inequalities and institutional inefficiencies.
In Western Kenya, regional authorities such as Water Management Authority, Lake
Victoria Water Service Boards created under the Water Act of 2002 now Water Act

42
2016, National Environment Management Authority created under Environment
Management and Coordination Act (EMCA) of 1999 revised 2015; alongside Lake Basin
Authority and among others were institutions created to promote water resources and
environment sectors. Similarly, the Constitution of Kenya (2010) marked a critical
juncture in the nation’s history, as a Constitutional law, it is concerned with the role and
powers of state institutions and with the relationship between citizens and the state
(Giussani, 2008) this includes in watershed resource governance. In Chapter 2, Article
6(2) of the Constitution of Kenya (2010), the two levels of government (national and
county governments) were created each with distinct, interdependent and to conduct
business on the basis of consultation and cooperation. This gave the Kenyan system of
governance a more polycentric and multi-level governance outlook. The forty-seven
county governments in Kenya are responsible for; county legislation, executive functions,
and functions transferred from the national government functions agreed upon with other
counties and establishment and staffing of a public service (GoK, 2010).
Polycentricism is a system of governance featuring multiple, overlapping jurisdictions at
different scales, each with some independent authority over particular issues or functional
areas (Koontz et al., 2015). On the other hand, Ostrom et al., (1999) defined
Polycentricism as a pattern of an organization where many independent elements are
capable of mutual agreement for ordering their relationships with one another within a
general system of rules. To sum it up, polycentricism describes a governance system of
qualified independence among interdependent centres of authority (Oakerson and Parks,
2011). A key feature of polycentricism is adaptable boundaries where new jurisdictions
being created as needs arise. These new boundaries can be made to match the scale of the
43
issue at hand, for example, a watershed, and not necessarily contained within just one
higher level jurisdiction, such as a nation. Polycentric systems typically exist within
federal systems (Koontz et al., 2015).
Polycentric systems are described as self-organized, arising in a bottom-up fashion, as
stakeholders interested in particular goods and services institute arrangements to do so
(Pahl-Wostl, 2009). The presence of a variety of special purpose jurisdictions encourages
people to create new, self-organized arrangements to tackle common problems. Although
polycentric institutions are often associated with federal systems, they can be created
outside of federal systems, a case when the French national government (a more unitary
system) created regional watershed jurisdictions that overlapped existing local
government boundaries (Buller, 1996). Another closely related concept to polycentrism
according to Koontz et al. (2015), is the concept of Type 2 governance (Hooghe and
Marks, 2003) whereby jurisdictions spanning vertically across political organizations and
horizontally across mutually exclusive but rather overlapping geographically and lack
established representation.
According to the World Bank (2001), when governments devolve functions, they transfer
authority for decision making, finance, and management to quasi-autonomous units of
local governments with corporate status. Further, devolution usually transfers
responsibilities for services to municipalities (equivalent to county governments in
Kenya) that elect their own mayor and councils (equivalent to the county executives and
county assemblies in Kenya), raise their own revenues, and have independent authority to
make investment decisions. In a devolved system, local governments have clear and
legally recognized geographical boundaries over which they exercise authority and within

44
which they perform public functions (World Bank, 2001). The county governments
present an opportunity to address the diversity of local needs, choices and constraints in
Kenya. Needs are very different between geographical regions in Kenya. The County
Government Act of 2012 provides for county governments' powers, functions and
responsibilities to deliver services and for connected purposes. Counties are better placed
than the national government to deliver social services because different regions have
specific challenges and the local knowledge to address them. With a constitutional
guarantee of unconditional transfers from the centre, Kenya's counties have the means
and the autonomy to begin to address local needs, and their citizen are abler to be held
accountable for their performance including institutional strengthening and development,
watershed, natural resources, environmental management and agriculture and food
security.
Further, based on the World Bank (2012) sentiments, enabling counties to deliver implies
a massive re-organization of state functions around these new units. It is inevitable that
things will not always go according to plan, and that implementation will reveal problems
which were not anticipated. The breadth of the transformation makes it imperative to
consider clearly what these changes will involve, and how best to prepare for them. At
this point, it is necessary to start thinking how to make institutions being created more
adaptive given threats like climate change, degradation of environmental resources, food
insecurity and increasing population among others; especially in watershed management
and food security as a paradigm shift from the past where little or no attention was given
to such sector institutions or adopting watershed management approaches in development
agendas in Kenya (Namenya, 2012). This study explored how the current system of

45
governance in Kenya enhances adaptive watershed governance by assessing the
possibilities of adaptive governance, adaptive institutions and adaptive co-management at
the village, ward, sub-county, county and national levels in micro-watersheds that have
initially lacked well-defined management plans and governance framework such as
Lower Sio River Basin. As such, it presents the building blocks that need to be in place
for devolution to be successful in achieving its goal especially in the watershed and
environmental management and sustainable food security.
The World Bank (2012) described the Kenyan devolution as one of the most ambitious
even by international standards implemented globally because, besides the creation of the
forty-seven counties, the process has also involved the creation of new systems of
administration that have absorbed some or all of three prior systems of administration.
Implementing devolution involves simultaneous changes to both political and
administrative arrangements, in a context where other key government institutions are
being reformed, poses enormous challenges. An entirely new layer of elected and the
executive government has been created, that assume major service delivery functions at
the local county level. With so much change occurring concurrently, complexity is
inevitable.
Under this dispensation, as argued by many researchers, effective water institutions may
be achieved by upscaling nested arrangements in which local communities have been
managing their water resources from homestead, plot, village, and sub-catchment levels
(Van der Zaag 2007). This is based on the premise that local communities do recognize
their interdependencies and in return adopts and discard rules including management
strategies as and when they require, by integrating history, and cultural meanings into the

46
management of water and conflict (Komakech, 2013). It is important to understand how
the watershed institutions form relational effects that can be successful in certain contexts
such as enhancing food security and fail in others.
2.9: Theoretical Applications
2.9.1: Common Pool of Resources
The Lower Sio River Basin is considered what Ostrom (1990) termed as a Common Pool
of Resources (CPR) where efforts to promote IWRM approach failed to integrate
institutional and political dimensions in the governance of the resource. The watershed
exhibits two main characteristics: excludability whereby the supply of water and other
resources may exclude or limit the potential resource beneficiaries from utilizing; and
substractability whereby when one person utilizes the resource in an unsustainable
manner reduces the availability of the resource to another user (Ostrom, 1990). The
challenges to the governance of Lower Sio River basin is how to coordinate and
implement the sustainable use of the resources by an individual as the population grows,
increased resource degradation, accelerated by the negative impacts of climate change
and changing social governance occasioned by devolution in Kenya. This is in order to
prevent overexploitation and degradation (Williams, 1998).
2.9.2: The Tragedy of the Commons
Moreover, to focus on what could happen to the watershed resource in the face of the
mentioned changes, the study revisited Hardin model of “The Tragedy of the Commons”.
The description based on what could happen when a hypothetical open access to pasture
(in this thesis watershed resources; land, water, riparian and wetlands in River Sio) is

47
open for all people. Hardin argued that people are motivated by selfish and individual
nature and pasture will be overexploited due to the maximization of benefits by
individual users over several users (Hardin, 1968). Since users are likely to ignore the
effects (in this case watershed resources degradation) of their actions on the pool of
resources when pursuing their self-interest, it must be concluded that most of the
watershed resources in common river basins as Lower Sio River bear the risk of a tragedy
of the commons.
Proponents have proposed efforts towards promoting private ownership of natural
resources such as watershed resources (farmland, forests, hilltops, wetlands pastures,
riversides) to ensure that users have incentives to manage their resources well (Raymond,
2003) while other proponents advocate for state ownership whereby governments are
appropriate custodians of the natural resources (Hardin, 1968). However, there are other
researchers who emphasized that there is no universal solution to the tragedy of commons
problems of resource management as private owners, governments and communal
resource management (Acheson, 2006). Through self-organization and self-governance,
collective action can be a means by which communities can overcome common property
resources overexploitation and use the resources in a more sustainable manner. Collective
action is action taken by a group, either directly or on its behalf through an organization,
in pursuit of members perceived shared interest (Marshall, 1998). Therefore, sustainable
communal resource management is attained by seeking people's participation and
devising resource management approaches according to the local socio-cultural settings
(Lise, 2007).

48
At the centre of all the proposed solutions to the problem of the tragedy of commons as
either governments or collective approach through social groups and communal resource
management, the institutional arrangements play a key role in the organization and
sustainability of the solutions. Formal and informal institutions play a critical role in
linking people and the environment, whether at an individual or at different collectivities.
2.9.3: Institutional Theory
According to North (1990), institutions are viewed as "rules of the game in society" or
"the humanly devised constraints that shape human interaction". Institutions stabilize the
human behaviour and interaction of agents, create predictability, and hence resolve
conflicts by regularizing rules of engagement (March and Olsen, 1989). Institutions affect
how social groups, governments, and authorities are constituted, exercised, controlled,
and redistributed by providing a source of constraint, reward, or punishment such as
monetary sanctions (Olsen, 2007). As a result of this perspective, institutions influence
the outcomes of collective efforts towards managing communal resources such as
watershed resources (Moe, 2005). Particular institutional forms and capacities will vary
according to national circumstance (Meadowcroft, 2009). By examining and assessing
watershed governance structures and their applications, watershed management expertise
and resources created as an incentive in watershed management, the effectiveness of co-
management and households' satisfaction towards the watershed governance, these
variables determined the structure of governance of the nature-related transaction
(Hagedorn, 2008) in the study area. Hence study aimed at assessing the status of
watershed governance as a means of preventing the tragedy of commons that result in
perpetuating food insecurity in the Lower Sio River Basin.

49
Building a resilient watershed governance system for food security in the Lower Sio
River involve institutional networking that will lead to the formation of polycentric
management networks, and cut across scales, which include local communities at village,
wards, sub-county, county and central government managing ecosystem services across
scales, from the level of a village to a catchment (Xu et al., 2005). The importance and
advantage to institutional diversity are that it promotes alignment of rules and policies at
different scales whereby it becomes more difficult for "free riders" to break diverse sets
of rules; stakeholders at various scales might use information and resources at their
disposal from cross-scale interactions to undermine trust and reinforce their own
authority (Dietz et al., 2003). Further, Adger et al., (2005) posited that “understanding
adaptation required consideration not only of different scales of human action but also of
the social construction of appropriate scales by institutions to further their own aims”.
Further, Ostrom et al. (1994) developed the Institutional Analysis and Development
(IAD) framework which focused on individuals that make decisions over the course of
action. The framework introduced the context in which local actors interact to create the
institutional arrangements that shape their collective decisions and individual actions
(Andersson, 2006). The framework identified four variables that could affect policy
processes and outcomes that are applicable to Lower Sio River Basin: attributes of the
physical world; attributes of the community within which actors are embedded, a rule that
creates incentives and constraints for certain actions; and interactions with other
individuals.

50
2.10: Conceptual Framework
The existence of national and county governments, communities and individual
households, and other non-state actors under the devolved system of governance makes it
difficult to understand the scale at which watershed governance should be implemented
given the socio-ecological dynamics at a river basin. Bohensky and Lynam (2005) noted
that across scales, well-defined formal institutions and policies that are easy to
understand and adapted could effectively facilitate local adaptive capacity and enable
communities to participate in and influence policy processes.
Therefore, the study adopted the framework below: It was organized in three levels in the
sense that the primary level independent variables determined watershed governance in
the Lower Sio River watershed. These included variables that determined watershed
governance; adaptive capacity, effective co-management, and perception variables at
different scales. This study modified variables considered by different researchers
including Gupta et al. (2010) to define intervening variables that formed the basis for this
study at multilevel institutions such as national and county, sub-county, ward, village and
household levels that could viably contribute to adaptive watershed governance.
The intervening variables included: Knowledge, attitude, satisfaction, policies, laws,
plans, institutional memory, watershed conditions, visionary leadership, watershed
expertise, financial resources, participation, accountability, and collaboration.
Governance is also a pre-requisite for sustainable food security, by assessing these
variables; the study also aimed at assessing the contribution of watershed governance to
food security. Therefore, the outcome variable was food security. Finally, tertiary
variables on food security including the availability of food, access to food, utilization of

51
food, and stability of food supply were assessed in the Lower Sio River Basin (Figure
2.1).
Figure 2.1: Conceptual Framework Model of Watershed Governance and Food security
Source: Author (2018)
Food Security
Availability of
food
Access to food
Utilization of
food
Food distribution
Stability of food
supply
Dependent variable Independent variables
Intervening variables
Attitude
Satisfaction
Visionary leadership
Watershed expertise
Financial resources
Participation
Accountability
Collaboration
Watershed Governance
Actors’ perception
Actors’ adaptive
capacity
Governance
structures; Policies,
laws, plans
Adaptive co-
management
52
CHAPTER THREE
RESEARCH METHODOLOGY
3.1: Introduction
This chapter presents a description of the study area based on location, geographical
features, climatic conditions, livelihoods, socio-economic characteristic and land use. It
describes the research designs, methodology, sampling strategy, data collection, data
analysis and presentation.
3.2: Study area
The Lower Sio River Basin is trans-boundary, (Figure 3.1), It originates in Kaujai and
Luucho Hills in Bungoma County, Kenya at an altitude of 1800m and flows into
Berkeley Bay in Lake Victoria Basin in Uganda. The upper 65% of this sub-watershed is
in Kenya, while the remaining portion 35% lies in Uganda (Obando et al., 2007). The
watershed lies between latitudes 00N and 10
0N and longitudes 30
0E and 36
0E (Wanjogu,
2004). The drainage pattern of Sio River basin is dendritic and the drainage density is
high. The mainstream of Sio River stretches approximately 78 km from the source in
Kenya to the mouth in Uganda (Albinus et al., 2008). The lower parts of Funyula also
have numerous degraded Samia hilltops which are sources of numerous streams, springs
and wetlands most of them draining into River Sio which drains into Lake Victoria thus
forming a common hydrological unit ‘a watershed’or a basin. There are diverse, unevenly
distributed natural resources which connect communities that use the resources
differently depending on their positions. Consequently, both the watershed resources and
the user communities are interdependent (Shiferaw et al., 2012; FAO, 2017).
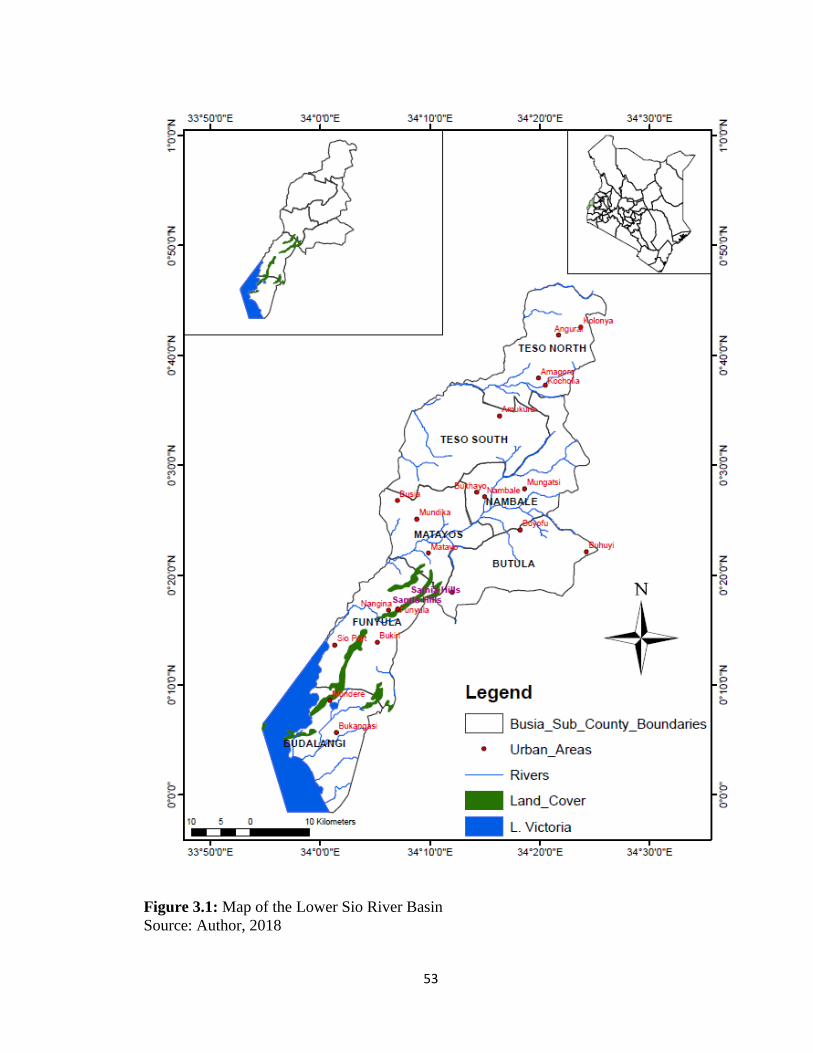
53
Figure 3.1: Map of the Lower Sio River Basin
Source: Author, 2018

54
The selected sites in Busia County, Kenya are down-stream of Sio River entering Lake
Victoria, situated at the mouth and in villages’ representative as the midstream section of
the basin thus targeted the three; Funyula, Matayos and Nambale Sub-counties out of the
seven sub-counties in Busia County, Kenya (Figure 3.1). These study sites were selected
on the basis of the observed environmental and land use changes; through onsite
observations such as setting up of two sugar factories, National Irrigation Board Lower
Sio Irrigation scheme, deforestation and degradation of Busia hilltops among other
changes in the watershed that resulted from the increased unsustainable population and
county government activities, and preliminary interviews with key informants. In
addition, the area has high poverty levels of 65.9% (GoK, 2007) with 93.5% of the
households in Funyula Sub-county depending on rain-fed on-farm and off-farm activities
for their livelihoods (Namenya, 2012). In addition, the rationale for the selection of the
Lower Sio River Basin in Kenya was guided by field visits, interpretation of existing
topographic maps and literature.
3.2.1: Physiographic and natural conditions
The physiographic and the natural conditions of Lower Sio River Basin are largely
reflective of the relief features that are in Busia County and its surroundings. They are the
physical land features and ecological and climatic conditions.
3.2.2: Physical and topographic features
Most parts of Lower Sio River Basin fall within the Lake Victoria Basin. The land is
undulating and rises from about 1,130 metres above sea level at the shores of Lake
55
Victoria to a maximum of about 1,500 metres in the Samia and North Teso Hills (GoK,
2013a).
The central part of the watershed, especially Matayos and Nambale Sub-counties, are
occupied by a peneplain marked by low flat divides of approximately uniform height,
often capped by lateritic and a shallowly incised swampy drainage system (GoK, 2013a).
The Samia Hills, occupying most parts of Funyula Sub-county, represent the basement
complex and consist of acid and sub-acid lavas, tuffs, and agglomerates, banded quartzite
and ironstones. The Kavirondo series rocks are developed around Matayos and Nambale
sub-counties. The northern part of the central region bordering Nambale sub-county
features granitic outcrops, which is essentially part of the peneplain and is characterized
by the presence of large granitic hills (GoK, 2013a).
The southern part of the basin is covered by a range of hills comprising the Samia and
Funyula Hills which run from the North East to the South West culminating at Port
Victoria; forming a very conspicuous topographic feature. The River Sio stream traverses
Nambale, Matayos and Funyula Sub-counties and drains into Lake Victoria at Sio Port in
Funyula Sub-county. The area forms a colony of papyrus growth forming a wide wetland
and is broken by irregular water channels and occasional small dams with grassy islands.
This area is covered with lacustrine and alluvial deposits of recent and Pleistocene times
(GoK, 2013a).
3.2.3: Ecological conditions
The Lower Sio River Basin lies in a Lower Middle Ecological Zone, divided into four
Agro-ecological zones (Jaetzold et al., 2010). Whereas most parts of the Lower Sio River

56
basin have sandy and loam soils, dark clay soils cover the central parts of Nambale and
Matayos sub-counties the Lower Midland Sugar Cane Zone, at an altitude of 1200-1440
meters above sea level and receives an annual rainfall of about 1800-2000 mm. Also,
patches of other soil types found in most parts of several streams in the watershed are
sandy clays and clays.
Funyula North sub-county is classified under Marginal Sugar Cane Zone, at an altitude of
1,200-1,350 meters above mean sea level and receive an annual rainfall of about 1,550-
1,800 mm (GoK, 2016b). The land formation and structure makes it suitable for both
food and cash crops like tobacco in the Northern parts of Nambale. The lower part
covering parts of Nambale, Funyula sub-counties are suitable for maize, Robusta coffee,
sorghum, millet, cotton and sugarcane cultivation (GoK, 2013a). Therefore, most parts of
the watershed have a high potential for agriculture and promises of faster growth to
sustain food security.
3.2.4: Climatic and hydrological conditions
Due to its proximity to the equator and the lake, the area experiences high humidity as a
result of evaporation. The annual mean maximum temperature ranges from 260
C to 300
C, while the annual mean minimum temperature varies between 14 0C to 18
0C.
Evaporation in this region varies between 1800 mm to 2000 mm per year (GoK, 2007).
River Sio is the main river flowing across the sub-county a few kilometres to Lake
Victoria. The rainfall pattern in the region varies between 1020 mm and 1270 mm mean
annually. The long rains may start as early as mid-February and last until mid-May with a
peak in April. The short rains may last from mid-November to mid-January. The dry

57
season with scattered rains falls from December to February. Precipitation in the
watershed is unreliable and drought is an ever expected phenomenon.
3.2.5: Sources of livelihoods and socio-economic practices
The Lower Sio River Basin forms a significant base for the livelihood of small-scale
farmers engaged in mixed farming, depending on agriculture and livestock keeping as
well as a large population depending on fishing which also forms a larger percentage of
sources of food. Rain fed farming is the main socio-economic activity whereby food
crops which include; cassava, sweet potatoes, arrowroots, finger millet, sorghum,
bananas, groundnuts, cowpeas, green-grams and monkey nuts whereas poultry include
quill, chicken and ducks, other sources of livelihoods are fish, termites and animals such
as sheep, goats and cattle. Crop production is majorly for subsistence purpose and the
nature of farming is characterised by the use of low input level, and local seed varieties
are used by about 80% of the farmers (GoK, 2007). In 2013, 87% of the households did
not have enough food (GoK, 2016b). Malnutrition of children below 5 years was very
high where approximately 27%, 14% and 10% of the children were stunted, underweight
and wasted respectively, a factor that was attributed to high consumption of cereals and
low consumption of animal and vegetable proteins (Nungo et al., 2012).
The basin has a high population density exceeding 300 persons per square kilometre
(GoK, 2010a) and cattle density of 38 per square kilometre, and continue to increase
pressing heavy demand on the watershed resources – water, soil, vegetation (Obando et
al., 2007). Majority of the population (83% of the male- and 87% of the female-headed
households) use firewood as the main source of energy for cooking (GoK, 2013b).
Access to health facilities is also poor as 71% of the population has to walk for 5 or more

58
kilometres to a health facility (GoK, 2016b). Lower Sio River wetlands, river banks and
road reserves have degraded as a result of farmers exploiting these ecologically fragile
ecosystems without initiating appropriate conservation measures (GoK, 2007). To make
it worse uncontrolled charcoal burning, hilltop burning, stone and sand harvesting
(Namenya, 2012) are key businesses that put both public and private land, forests, hill-
tops and River Sio stream flow at risk.
The watershed continues to be deforested as demand for human settlements, agriculture
and grazing land increases leading to land degradation that is characterised by fertility
losses, erosion by water and increases in sediment load as it drains into Lake Victoria.
The livelihood of the population has been adversely affected by environmental and
climatic changes and has, in turn, led to unsustainable natural resources utilization as
existing development initiatives such as the CDF projects do not adopt watershed
management approaches (Namenya, 2012).
The irony is that all these activities happen in the wake of new institutional reforms in
Kenya whereby decision making, local legislation, financial resources on key livelihood
sectors such as agriculture, environment and natural resources management are
decentralized while devolved funds have been on increase to tackle poverty at grass root
levels with the aim of reducing poverty-environment impacts. The county governments
have been mandated by the Constitution of Kenya (2010), County Government Act,
(2012) to share with the national government the function of environmental management,
lead in agricultural, crop and animal production and formulate county plans, legal
frameworks and to facilitate execution of such functions. This calls for sound ecological

59
management governance that can be achieved through adaptive watershed governance in
the Lower Sio River Basin.
3.3: Study population
Lower Sio River basin, Busia County was expected to be having a human population of
383,232 by 2017 as shown in Table 3.1. The basin has a higher population growth rate of
3.1% compared to 2.9% at national level rate due to high fertility rate placed at 6%
compared to the national rate of 4.2%. The population is largely rural considering that
only 10% of the population resides in the urban areas (GoK, 2013). Approximately 64%
of the population lives below the poverty line, making Busia one of the counties with the
highest poverty incidences in the country. Majority of these people are found in the rural
compared to the urban areas (64% and 42% respectively) (GoK, 2016b).
Table 3.1: Population distribution by sub-county in the Lower Sio River basin
Sub County Density
(km2)
2009
(census)
2012
(projection)
2015
(projections)
2017
(projections)
Matayos 568 111,345 122,197 134,106 142,684
Nambale 398 94,637 103,861 113,983 121,274
Funyula 353 93,500 102,613 112,613 119,817
Total 437 299,482 328,671 360,702
383,232
Source: Kenya National Bureau of Statistics, (Gok, 2010a)
The targeted population in this study were (19,002) households in Nambale, (68,781) in
Matayos and (19,395) in Funyula sub-counties, Busia County Kenya as shown in
Appendix I (GoK 2010a) and the state and non-state actors who were service providers at
the villages, wards, sub-county and county level in leading organizations that directly or
indirectly dealt with watershed activities, agricultural services and governance at local
level. In addition to local community-based organizations and local based international
non-governmental organizations in the sub-counties of Busia County.

60
3.4: Research design
According to the Oxford Dictionary (2010), a research design is defined as a scheme,
culture or plan that is used to generate answers to research problems. Research designs
are constructed to answer research questions which vary considerably. It utilized both
qualitative and quantitative methods, probabilistic and non-probabilistic sampling
techniques. As a socio-ecological study, it employed a mixed methods approach
(Stringer, 2009). The study focused on polycentric and multi-level watershed governance,
therefore, the need to ensure both external and social validity which called for evaluation
design to address the third and fourth of study objectives on watershed governance and
food security. More so, the cross sectional survey design was employed in the pre-test
study. The use of a mixed method approach in this study provided an opportunity to
triangulate and cross-check the results thus ensuring validity and credibility in the
research process (Stringer, 2009).
The cross-sectional survey design was employed in determining the characteristics of a
household’s perceptions, attitudes, satisfaction and knowledge in the first and second
study objectives. According to Walingo and Ngaira, (2008), cross sectional design is
applied in determining the frequency with which something occurred, or with which it
was associated with something else. The major purpose of adoption of a cross-sectional
survey design in this study was the description of the state of affairs as it existed at the
moment. The design was also suitable because it was used to ascertain attitudes and
opinions as well as factual information. According to Serem et al. (2013), survey studies
are used to obtain information about existing phenomenon by asking individuals their
perceptions, attitudes, behaviours or values.

61
Evaluation research design is concerned with assessing the effects and impacts of social
and development interventions in the real world; it uses scientific methods to measure the
implementation and outcomes of programs. According to Punch (2003), outcome or
impact evaluation is the aspect of assessment that focuses on the effects that have been
achieved by the intervention. It aims at establishing causal effects. It has a strong
experimental tradition with a quantitative approach. But some researchers (Maxwell and
Caldwell, 2008) have also introduced qualitative approach. Table 3.2 below summarizes
the research design for each study objective and the variables for measurement.
Table 3.2: Summary of research design of each study objective and respective variables
Source: Author, (2018)
Objective Measurable Variables Research
Design
i. To determine the perceptions of households
on changes in rural watershed governance in
the Lower Sio River Watershed.
Knowledge
Attitude
Perceptions
Satisfaction
Cross-sectional
survey
ii. To examine the adaptive capacity of state
and non-state institutions to watershed
governance for sustainable food security in
the Lower Sio River Watershed.
learning, institutional memory,
access to information,
visionary leadership, authority,
watershed expertise and
financial resources
Cross-sectional
survey
iii To evaluate the impacts of watershed
governance structures on rural food security
in the Lower Sio River Watershed under
devolved governments in Kenya
Food availability, food access,
food utilization, food stability,
food distribution
Evaluation
iv. To determine the effectiveness of adaptive
co-management of watersheds for
sustainable food security in the Lower Sio
River Watershed.
Multi-level actor,
collaboration, policies and
plans, legislation, equity,
responsiveness, accountability
Evaluation

62
3.5: Qualitative methods
3.5.1: Narrative method
The research intended to unfold facts and perceptions from actors in a multi scale
institutions approach. Storytelling unveils how humans explain, make sense of social
reality and share knowledge. Traditionally, a narrative has a clear beginning, a
chronological progress, a plot and an ending (McDougall, 2008). In social sciences,
researchers construct knowledge through their interaction with relevant respondents for
the purpose of revealing social reality through their own stories and or according to the
ideas that present them through the stories. In order to understand institutions' or
organizations' characteristics and processes of management, it has become increasingly
important to discover knowledge from a narrative approach (Rhodes, 2005). A social
researcher can always further develop the story with additional interviews or theoretical
perspectives, and subsequently, end up with a completely new story. Therefore, using a
narrative approach implies that the researcher understands reality as a social construction,
where the varied understanding of the same story and those stories exist is continually
transforming (McDougall, 2008).
Story-telling has long been recognized as a means by which individuals find meaning in
institutional and organizational life (Rhodes, 2005). In this study, knowledge construction
was premised on the stories of relevant institutional actors involved in promoting
watershed governance activities as a path towards sustainable food security. It is
envisaged that through narrating their own experiences in relation to what and how
institutions engaged in watershed governance, came to understand the approach to
sustainable food security from the experiences from actors in the field.

63
Focusing on the relations between the characteristics of institutions attempting to foster
adaptive capacity in communities as a pillar in watershed governance, its core values and
practices on ensuring food security, in a changing environment. Through stories,
institutional actors and participants from the field shared their experiences, institutional
and otherwise. Narratives are thus regarded as the means through which experience is
reflexively reconstituted, made meaningful and made communicably (Rhodes and
Brown, 2005). The stories generated in this study were recently revealing the change
process and the institutional reactions that have developed in watershed governance and
food security.
3.5.2: Case method
Case studies lend themselves to the exploration of present day phenomena within its real
life context and are especially appropriate when the boundaries between phenomenon and
context are not clear (Yin, 2003). A case study provides the researcher with an
uncontrolled and unpredictable environment to observe a range of social phenomena
including the description of routine events that may otherwise be overlooked
(McDougall, 2008). According to Yin (2003), cases that are singular in nature are used
for various reasons when the case is unique or severs to a revealing phenomenon
previously not observed. In this study, a case study was presented in the form of the table
of cases of actors.
3.5.3: Documents review method
This study utilized secondary data from existing documents to review a variety of
existing sources with the intention of collecting independently verifiable data and
64
information. The documents were internal to programs or institutions and organization.
Documents were hard copies and electronic and included; reports, performance ratings,
funding proposals, policy documents, project evaluation reports among others. This
method was relevant to collect background information, determined if the
implementation of the programs reflected program plans, as well as collected information
that helped develop other data collection tools for the assessment. Both qualitative and
quantitative data were collected during the documents review process. Document analysis
was guided by data collection on legislations, policies, and power analysis during the
study.
3.5.4: Qualitative methods
In this study, purposive, convenient and snowballing sampling were used to determine
the sample for key informants who participated in the interviews and other necessary
community participatory workshops, while quota sampling was used to select a sample
for the focus group discussions. Key informants’ interviews were conducted with senior
and operational staff in relevant governmental directorates, civil societies and non-
governmental organizations. Qualitative data were collected in a participatory manner.
The sample size was determined by the nature of actors including the elderly due to their
long term experience in the study site, county government officials; and grassroots
community-based organizations and non-governmental organizations working in the sub-
counties. The staff were systematically selected and interviewed from their work stations
by use of a key informant interview guide.
A list of registered associations, governmental and non-governmental organizations that
offer climate change, environment, watershed management, and agriculture and food

65
security related activities in the sub-counties were obtained from the relevant Busia
County government departments of Social services, Environment, Water and Natural
Resources, and Agriculture and Animal Resources. Members who participated in Focus
Group Discussion (FGDs) and narrative sessions were registered members of the
organizations identified earlier and were selected from established lists of registered
members of specific organizations. Members were selected from sites with the
organizations as well as non-organization intervention. These groups were selected and
classified according to age, gender and status. One FGD session was done at start and end
of data collection in each location. These groups of individuals comprised of actors in
climate change adaptation, watershed management, environmental management and
agriculture known to share common interests and therefore the researcher expected free
and fair discussions.
3.6: Quantitative sampling methods
The study used both probability and non-probability sampling techniques to determine
the sample size for quantitative data. Primary quantitative data was basically drawn at the
individual household level. Purposive sampling was used to select the three sub-counties;
Nambale, Matayos and Funyula through which River Sio flow thus forming a common
hydrological basin. A two-level multi-stage sampling was conducted; the First level,
simple random sampling techniques were used to select at least 10% (Mugenda and
Mugenda, 1999) of the two locations from each of the Sub-county; and second level, two
sub-locations from each selected location were selected using the simple random
technique.

66
The appropriate sample size (Table 3.3) for this study was calculated from a (sample
frame) list with the number of all households in each sub-location in the three sub-
counties obtained from the Kenya National Bureau of Statistics (KNBS) 2009 National
Census Report (GoK, 2010a) at Busia County offices and updated with household lists
obtained from respective chiefs’ offices in May, 2017.
Proportionate sampling was used to distribute the samples in the sub-locations based on
their population variations in the sample frame. Finally, a simple random technique was
used to select the households that formed the unit of analysis while the household heads
formed the unit of observation during data collection process. Yamane (1967) simplified
the formula for small population sample size calculation was adopted for the study. The
formula equation (3.1) states:
21 eN
Nn
…...………….………………………Equation (3.1)
Where:
n = the desired sample size
N= Population of households in the watershed from the sample frame
11,988
e = Margin of error 5 %
From the formula: n = 387
205.0988,111
988,11
n

67
Simple random sampling was used to identify samples for households’ respondents. The
proportionate samples sizes for each sub-location were calculated from the formula in
Equation (3.2):
)(nTNhh
NhhPs ………………...……………………Equation (3.2)
Where:
Ps = Proportionate sample for each sub location
Nhh = Number of households in each sub-location recorded at Chief
office as at May, 2017
TNhh = Total number of households in all sampled sub-locations at Chief
Offices as at May, 2017 which was (11,988)
n = Calculated sample size which was (387)
Table 3.3: Calculated study proportionate sample size distribution
Sub-County Location Sub-
Location
HH per
KNBS
HH at Chief as at
May, 2017
Proportionate
Sample size
Nambale Township Kisoko 1833 1912 62
Syekunya 1597 1670 54
Walatsi Musokoto 892 965 31
Khwirale 1247 1370 44
Matayos Nangoma Muyafwa 792 901 29
Nangoma 948 992 32
Lwanya Busende 638 681 22
Igero 665 701 22
Funyula Nambuku Lugala 413 521 17
Mango 406 492 16
Namboboto Luanda 889 982 32
Buloma 721 801 26
Total 6 12 11,041 11,988 387 Note: Locations and sub-locations as at 2009 Kenya National Census were used instead of wards and villages because
all these administrative units existed and population information on created wards and villages were not available.
Source: Author (2018)

68
The study further benefited from the purposively sampled key informants, representatives
of the national and county governments, and non-governmental organizations including:
Assistant county commissioners, environment, water, social services, cooperative and
agriculture sub-county officers, ward administrators, chiefs and assistant chiefs, County
Kenya Forest Service officer, County Kenya Meteorological Department Officer, County
department of irrigation and fisheries, Water Resources Management Authority, Busia
Water and Sewerage Company, Coordinator of Western Kenya Community-Driven
Development and Flood Mitigation, Programme for Agriculture and Livelihoods in
Western Communities, Simpact Kenya, One Acre Fund, Anglican Development Services
and County NEMA officer. In addition, community groups including; Farmers Common
Interest Groups, Community Forest Associations and Water Resources User Associations
were targeted. The information from the key informants was instrumental particularly in
triangulating information provided by the interviewed households. Table 3.4 summarizes
sampling methods and sample sizes for the study population.
Table 3.4: Summary of sampling methods and sample size for the study population
Study Population Units Sampling method Sample size
Household Heads Multi-stage random, Simple
random and proportionate
387
State Actors or government
officers
Purposive, convenient and
snowballing
12
Non-State Actors or non-
governmental representatives
Purposive, convenient and
snowballing
15
Focus group discussion Quota 8-12
Observation units Purposive Three sub-counties
Source: Author, (2018)
3.7: Data collection instruments
Data collection techniques for this study varied according to respective activities to
address each study objective.

69
3.7.1: Household Questionnaires
The procedure for data collection essentially necessitated semi structured questions, open
and closed ended questions, and attitudinal questions based on a Likert scale. The
questionnaire gathered data on the four study objectives through the variables that
included; diversity of solutions, learning capacity, institutional memory, access to
information, visionary leadership, authority, human resources, financial resources, multi-
level actors, collaboration, policies and plans, legislations, equality, responsiveness,
accountability, knowledge, attitude, and perceptions. Socio-demographic variables were
used to determine the association between dependent and independent variables.
Research assistants were identified and recruited and trained to conduct face to face
interview exercises.
Respondents who were not available for the first round of interviews were mapped and
targeted for follow-up for an interview, to ensure consistency in data for the sampled
population. The English version of the questionnaire was used. Serial numbers were
inserted on the questionnaire to avoid individual identification. This, therefore, meant that
no identifiable details of participants were disclosed on the format any given time. The
researcher ensured data obtained was kept confidential and protected from access by
unauthorized persons. The researcher also kept and protected the list that contained
contacts of participants. The researcher was allowed access to the data, serialized forms
as well as the list that contained contacts of participants.

70
3.7.2: Key Informants Interview guides
Key informant interviews were individually conducted on twenty-seven key informants
who included senior staff and operational staff of government departments and non-
governmental organizations. National and county government service provider including
the; members of county assembly, ward administrators, ward managers, chiefs, assistant
chiefs, sub county water, agriculture and environment officers, NGOs and CBOs
representatives were also interviewed. The interviews were carried out at their work
stations and guided by interview guide with unstructured questions. The study also
determined adaptive capacity, roles and characteristics of governmental and non-
governmental organizations in watershed governance the characteristics that fostered
adaptive capacity and how they impacted on food security in communities as well as
climate change adaptation as a key determinant to food security.
The data gathered from governmental and non-governmental staff covered areas on:
diversity of solutions, learning capacity, institutional memory, access to information,
visionary leadership, authority, human resources, financial resources, multi-level actors,
collaboration, policies and plans, legislations, equality, responsiveness, accountability,
knowledge, attitude, and perceptions. The researcher together with the research assistants
ensured data obtained was kept and protected from access by anybody not permitted.
3.7.3: Focus Group Discussion guide
Focus Group Discussion (FGD) sessions were participatory, performed on formal and
informal groups or associations that engaged in environment and watershed management
activities, agricultural production, food security, and climate change adaptation in their

71
usual meeting site. Participants for FGDs sessions were selected from established and
registered groups and associations of people. Jointly ward managers, chiefs and assistant
chiefs helped study teams in mobilizing respondents to attend sessions as designed.
Discussion sessions were carried out at their usual meeting place.
The researcher with two selected research assistants (moderator and note taker) guided
FGD sessions and also ensured participants understood the purpose of the stated
discussion before the participants' consent. They controlled any tension likely to erupt;
encourage the use of acceptable language, and also created an environment that was
encouraging throughout the process. Audio-taping and video recording during the focus
group discussion sessions were done by research assistants and the researcher with the
permission of the respondents. The data collected were under the custody of the
researcher.
Discussion sessions were guided by a FGD guide. The instruments that were used during
the FGD sessions included; checklist, the flip chart for writing any information that was
necessary, audio recorder and video camera after obtaining consent from respondents.
One session groups were held in each sub-location, one cluster comprised of six youths
both males and females and another group comprised of six adults both males and
females.
Overall four FGD sessions were carried out one from each location. Individuals were
selected and grouped categorically according to their status, education, sex and age. A
moderator, timekeeper to monitor the time taken by each group together with an audio
recorder was identified from the research assistant team members and mandated to take

72
tasks as assigned. Video recording was done as the note taker did not capture all
information conversed. Each FGD session was virtually one hour and 30 minutes with
time guided by FGD moderator. Participants discussed and expressed views on watershed
governance aspects in their respective locale in addition to, how the food security
situation was affected by such aspects. They further discussed and provided details about
experiences as well as institutional intervention in watershed governance as well as food
security.
3.7.4: Observation and photography checklist
Observation method was used to solicit on-site information on watershed governance
activities in ensuring food security in the three sub-counties in the Lower Sio River
Basin. In addition, information and images on the biophysical environment in the sub-
county were gathered and photographs were taken and documented based on different
study themes. Table 3.5 summarizes the targeted population, sampling method, sample
size, and data instruments for primary data collection.
Table 3.5: Summary of instruments for primary data collection
Study Population
Units
Sampling method Sample size Data collection
instruments
Appendix
number
Household Heads Multi-stage random,
Simple random and
proportionate
387 Household
Questionnaire
V
State Actors or
government officers
Purposive, convenient
and snowballing
12 Key informant guide VI
Non-State or non-
government actors
Purposive, convenient
and snowballing
15 Key informant guide VI
FGD Quota 8-12 FGD guide VII
Observation checklist Purposive Three sub-
counties
Photography and visual
Observation checklist
IV
Source: Author, (2018)
73
3.8: Pre-test, validity and reliability of data instruments
Validity is the ability of the instrument to measure what it is supposed to measure
(Walingo and Ngaira, 2008). It considers whether data obtained in the study represents
the variables of the study. This is important in research because conclusions drawn from
such data are more accurate, relevant and meaningful. Therefore, to test the validity of
data collection instruments, a pre-test study was conducted in thirty-nine (39) households
of the total calculated sample size (10% of 387).
A pre-test study is important in testing the validity of the instruments and clarity of
language (Mugenda and Mugenda, 1999). The pre-test was performed on both the
quantitative and qualitative data collection instruments to assure validity, reliability and
sensitivity in Esikulu Sub-location, Matayos Sub-county. This sub-location was not
among the sampled sub-locations although it had similar biophysical environmental and
socio-economic characteristics with the sampled sub-locations in the three sub-counties.
The aim of the pre-test study was to assess the clarity of the wordings in the
questionnaires, interview schedule, focus group discussion guide and observation check
lists. Issues on the interpretation of concepts, length and time to be spent at each
respondent emanated. The items which failed to meet the anticipated data were discarded
after pretest.
The instruments were then reviewed to capture changes that emanated from the pre-test.
In addition, issues such as the length of the tool, time to be spent on each tool and
interpretation of the tools to the local language where applicable were addressed.
Interpretations of concepts were then revised among the research assistants re-training to
ensure concepts were interpreted in a similar manner to all households. The researcher
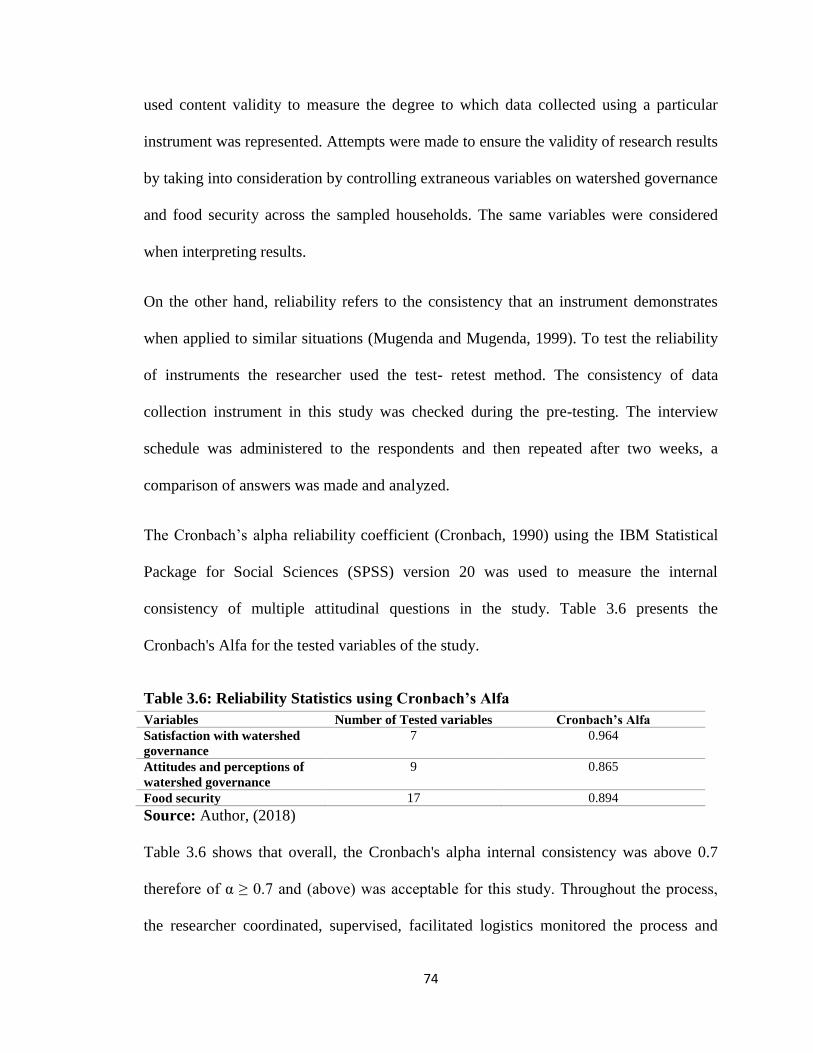
74
used content validity to measure the degree to which data collected using a particular
instrument was represented. Attempts were made to ensure the validity of research results
by taking into consideration by controlling extraneous variables on watershed governance
and food security across the sampled households. The same variables were considered
when interpreting results.
On the other hand, reliability refers to the consistency that an instrument demonstrates
when applied to similar situations (Mugenda and Mugenda, 1999). To test the reliability
of instruments the researcher used the test- retest method. The consistency of data
collection instrument in this study was checked during the pre-testing. The interview
schedule was administered to the respondents and then repeated after two weeks, a
comparison of answers was made and analyzed.
The Cronbach’s alpha reliability coefficient (Cronbach, 1990) using the IBM Statistical
Package for Social Sciences (SPSS) version 20 was used to measure the internal
consistency of multiple attitudinal questions in the study. Table 3.6 presents the
Cronbach's Alfa for the tested variables of the study.
Table 3.6: Reliability Statistics using Cronbach’s Alfa
Variables Number of Tested variables Cronbach’s Alfa
Satisfaction with watershed
governance
7 0.964
Attitudes and perceptions of
watershed governance
9 0.865
Food security 17 0.894
Source: Author, (2018)
Table 3.6 shows that overall, the Cronbach's alpha internal consistency was above 0.7
therefore of α ≥ 0.7 and (above) was acceptable for this study. Throughout the process,
the researcher coordinated, supervised, facilitated logistics monitored the process and

75
ensured instruments were filled correctly. Similarly, ensured all instruments and data
were well protected with no access to any unauthorized persons. A total of 12 research
assistants were identified and recruited to undertake training for competency in data
collection. The training ensured they were able to understand, interpret, and translate
designed instruments to local language for easier use. Research assistants were recruited
from the local community, familiar with the local language and also possessing respect
locally based on certain criteria; they comprised females and males of above 18 years of
age who have attained at least an undergraduate degree and above in environmental
studies, natural resource management and social sciences related field.
3.9: Data analysis
Institutional analysis of communally managed watershed systems is very complex.
Usually, these kinds of resources are frequently characterized by multiple users and
actors. In addition, there is a need for an arrangement for individual and collective
negotiation and mechanisms for resource use and management among different
stakeholders. Therefore, institutional rules for sharing the resources comprise individual
actions, which are useful in resolving misuse and creating incentives for investment and
resource development (Acheson, 2006). At the same time, there is need to have
institutions for collective action, either in the form of formal organizations or informal
forms, state or no-state for cooperation, to ensure sustainable utilization while adhering to
the property rights as well as act collectively for the betterment of the community and
sustainable livelihoods. These characteristic of watershed governance institutions that
enhance food security are a bit difficult to analyze quantitatively.

76
However, qualitative approaches are increasingly used in conjunction with quantitative
approaches and such combinations can enhance the validity and reliability of analysis and
evaluation (Bamberger, 2000). Therefore, triangulation formed the basis for analysis for
complementing data to ensure validity. In this study, a mixture of both quantitative and
qualitative approaches was appropriate to provide the quantifiable results of factors
which determine adaptive capacity, adaptive co-management of state and non-state
institutions that promoted the adaptive capacity of society in addition to changes in rural
watershed governance structures under Kenyan devolution. It provided an explanation on
adaptive co-management of the watershed at different levels for food security in the
Lower Sio River Basin.
3.9.1: Descriptive data analysis approach
This analysis approach mainly focused on analyzing the descriptive statistics of the whole
data spectrum. The data mainly contained information regarding the adaptive capacity of
state and non-state institutions that promoted the adaptive capacity of communities in
addition to, institutional and rural watershed governance structures changes under
Kenyan devolution system in the Lower Sio River Basin. Quantitative data from the
households’ questionnaires on the four study objectives with variables assessing;
diversity of solutions, learning capacity, institutional memory, access to information,
visionary leadership, authority, human resources, financial resources, multi-level actors,
collaboration, policies and plans, legislations, equality, responsiveness, accountability,
knowledge, attitude, and perceptions were subjected to descriptive statistics. The study
used IBM Statistical Package for Social Sciences (SPSS) version 20 and Microsoft Office

77
excel software to analyze quantitative data collected. The data was summarized and
presented in percentages, tables, charts, graphs and figures.
3.9.2: Qualitative data analysis approach
This approach was used to analyze the households and other actors’ characteristics,
arrangements and processes in watershed governance and mechanisms as pathways to
enhancing households’ food security. Specifically, the data contained variables that
indicate the adaptive capacity of state and non-state actors, adaptive co-management,
actors’ perceptions and the impact of selected watershed governance variables on
households’ food security. These included variables that assessed; diversity of solutions,
learning capacity, institutional memory, access to information, visionary leadership,
authority, human resources, financial resources, multi-level actors, collaboration, policies
and plans, legislations, equality, responsiveness, accountability, knowledge, attitude, and
perceptions.
The qualitative information was gathered using an open-ended and Likert scale questions
that were included in the questionnaire. Qualitative data was analyzed and presented on
pre-determined themes through the thematic approach, specific institutional case analysis,
content analysis, categorization, contextualization, verbatim and plates and determination
of similarities and trends of watershed governance and food security.

78
3.9.3: Inferential data analysis
Cross tabulation was used to compare relationship among variables, to give inference and
thereafter ensure generalization. Quantitative data were analyzed using; bi-variate
analysis to ascertain the association and level of significance between the dependent and
independent variables. Quantitative data were analyzed using IBM Statistical Package for
Social Science (SPSS) version 20 software. Frequency distribution was used to organize
categorical variables for quantitative data and further calculated measures of mean
alongside measures of variation. Chi-square (χ2) was used to examine the statistical
significance of relationships between categorical variables. Regression analysis
determined whether the potential for food security is a function of background socio-
demographic factors such as age, sex, and religion and land tenure system on different
scales. More so, regression analysis was also used in determining the relationship
between index score of food security and watershed governance structure, watershed
expertise, households' satisfaction towards watershed governance and co-management of
the watershed. Results were presented in form of tables, charts, and graphs. Table 3.7
summarizes data analyses methods with reference to specific study objectives.

79
Table 3.7: Summary of data analysis methods with reference to specific objectives and
research designs
Specific Objective Measurable Variables Research
Design
Methods of data Analysis
i) To determine the perceptions
of households on changes in
rural watershed governance in
the Lower Sio River
Watershed.
Knowledge
Attitude
Perceptions
Satisfaction
Cross
Sectional
Survey
Descriptive statistics, bi-
variate analysis, Likert
scale, Chi-square, T-test
and context and qualitative
analysis
ii) To examine the adaptive
capacity of state and non-state
institutions to watershed
governance for sustainable food
security in the Lower Sio River
Watershed.
learning, institutional
memory, access to
information, visionary
leadership, authority,
watershed expertise and
financial resources
Cross-
sectional
survey
Descriptive statistical
analysis, bi-variate
analysis, Chi-square and T-
test , context and
qualitative analysis
iii) To evaluate the impacts of
watershed governance
structures on rural food security
in the Lower Sio River
Watershed under devolved
governments in Kenya.
Food availability, food
access, food utilization, food
stability, food distribution
Evaluation
Descriptive statistics bi-
variate Chi-square, T-test
and regression analysis,
context and qualitative
analysis
iv) To evaluate the
effectiveness of adaptive co-
management of watersheds for
sustainable food security in the
Lower Sio River Watershed.
Multi-level actor,
collaboration, policies and
plans, legislation, equity,
responsiveness,
accountability
Evaluation Descriptive statistics, bi-
variate analysis, Chi-
square T-test and, context
and qualitative analysis
Source: Author (2018)
3.10: Data management and Quality Standards
Qualitative data from the field was cleaned to yield accurate information that can easily
be used for analysis and report writing. Each team led by team leader went through four
transcripts and compared them with the audio versions to check whether accuracy and
consistency of data reported had been maintained. There was high-level quality control of
quantitative data. Quantitative data for the study were collected from the field using a
web based - online system (Open Data Kit (ODK) by a well-trained team of data
collectors using their smart phones. The principal researcher who was the administrator
of the online system www.ona.io.com invited the research team, trained and hosted the
server for the results relay. An XLSFORM was developed with no room for sending the
incomplete form to the server by the research assistants. Also, the GPS location of each

80
filled questionnaire was shown, time and the data collector were indicated in the server
thus, improving the quality of the data.
During the data collection process, the principal researcher supervised the research team
and had access to the server at all times for data quality assurance. The principal
researcher also had access to the research assistants’ phones each evening for verification
purposes before the questionnaires were sent to the server. Upon completion of the data
collection exercise, the principal researcher downloaded and exported the raw data to
IBM Statistical Package for Social Sciences (SPSS) version 20 for analysis. Thus, there
was an improvement in the quality of the data and reduction of data that contains errors.
Consequently, validity and reliability of the data were adhered to throughout the data
collection exercise.
3.11: Measurements, data analysis and interpretation
There were no statistical measurements for qualitative data however analysis was done
based on each thematic area provided for data triangulation with quantitative data for
coherent results. However, quantitative data were analyzed using the IBM Statistical
Package for Social Sciences (SPSS) version 20 and excel spreadsheet. Frequencies were
run using all the variables to check for missing cases if any as well as for explanations.
The dependent variables (food security), watershed governance structures, actors’
adaptive capacity (expertise), watershed governance conditions, watershed co-
management knowledge, watershed level of satisfaction and watershed level of attitudes
and perceptions were recorded to ensure that a higher score means a correct or more
positive answer (0-1 for binary; (yes, no) and 0-4 for Likert scale). Each dependent
variable that was used to measure food security was summed up to compute an index

81
score of food security. (Therefore, an index food security score, Modified Bloom's cut-off
point was created for the purpose of performing inferential statistics).
Further, independent variables concepts values were summed up and computed to form
different independent index scores for the specific concept. Due to the high quality of
data collected from the field, all the 17 variables for the food security dependent variable
were included in the calculation of index score of food security since the reliability tests
showed tight coherence with a Cronbach's alpha above 0.7 or higher being considered
sufficient. Depending on the number and nature of independent variables (for the
dependent, all the 17 variables), index scores were summed up and recalculated to a score
of 0-100 through multiplying by 100 and dividing with the number of variables. Further,
a binary food security variable was generated on a scale of 0 to 1 where 0 ‘indicated
households scored 0-49%' (food insecurity households) and 1 ‘indicated households
scored 50-100%' (food security households).
Bivariate analysis was done to ascertain the association and level of significance between
the generated groups of households with food security and food insecurity and each
variable for watershed governance structures, actors’ adaptive capacity (expertise),
watershed governance conditions, watershed co-management knowledge, watershed level
of satisfaction and watershed level of attitudes and perceptions. In running Chi square
tests by the groups for background information (watershed governance structures, actors’
adaptive capacity (expertise), watershed governance conditions, watershed co-
management knowledge, watershed level of satisfaction and watershed level of attitudes
and perceptions variables) p values were used to show the level of
significance/differences between the groups of households with or without food security.

82
Pearson Chi-square results that showed p-values: p<0.1 at 90 % confidence level; p<0.05
at 95 % confidence level; and p<0.01 at 99 % confidence level (meant that there was
statistically significant evidence or difference or variations between the tested variable
and control variable (households with food security and households with food insecurity)
in terms of watershed governance structures, adaptive capacity, expertise, knowledge,
conditions, co-management, level of satisfaction and, perceptions.
The t-test was run to provide the overall index score of independent variables towards
food security and food insecurity group of households; with mean, standard deviation and
p values being recorded and interpreted. The difference was highlighted and presented in
various tables: where the food insecurity group of households scored higher than the food
security group of households; in watershed governance structures, actors’ adaptive
capacity (expertise), co-management knowledge, level of satisfaction and watershed level
of attitudes and perceptions towards watershed governance and; where the food security
group of households scored higher than food insecurity group of households.
To control the results of background characteristics and independent variables both linear
and logistic regression analysis were run using index score for food security and dummy
binary food security, respectively as the dependent variable against age, sex, land size,
religion, household land tenure system, watershed governance structures, actors’ adaptive
capacity, knowledge of governance structures, and level of satisfaction as independent
variables that had showed statistical relationship with groups of food security and food
insecurity households. Although age and sex showed no relationship they were
considered as more important background factors in both regression analyses.

83
Sex, religion and land tenure system variables were considered categorical when running
logistic regression and dummy variables when running the linear regression to distinguish
scores of 0,1 and 2 where necessary for example in sexes (0=Female and 1=Male);
religion (1=Christians and 0=Others). Age (on continuous scale, 18-87 years), land
tenure system (0=Freehold, 1=lease and 2=Communal with lease as reference category),
watershed governance structures (continuous scale), actors' adaptive capacity (continuous
scale), co-management knowledge (continuous scale), level of satisfaction (continuous
scale) and watershed level of attitudes and perceptions (continuous scale) towards
watershed governance were control or background variables explaining variations on the
scores of levels or status of food security outcome on both continuous and binary (food
secured and food insecure) scale among the households. The index score of food security
levels and dummy binary level of food security among different households were
outcomes being measured.
3.12: Limitations to the study
The following limitations were encountered in the field while collecting data;
i. Some targeted county and national government officers feared to disclose
information on watershed governance and food security projects for fear of being
investigated or victimization. The researcher obtained research authority from the
County Secretary and County Commissioner who were direct supervisors of the
officers. The authority simplified the release of information. The researcher also
clearly explained how the data collected could be used in addition to assuring the
actors of total confidentiality of the information released.

84
ii. Limited data on watershed governance and food security projects in the watershed
because most households did not participate in public governance forums and did
not keep records. The researcher depended on estimates and approximations as
narrated by the household heads and this was compared with secondary and key
informants’ data during triangulation.
iii. Some household respondents did not conceptualize the study at the beginning of
the interviews. The researcher had to explain to the households’ key concepts in
Kiswahili and local language where possible. Further, the researcher clearly
explained the objective of the study and the importance of the respondents’
participation beforehand in addition to triangulation during data collection and
analysis process.
3.13: Assumptions to the study
The following assumptions were made in regard to the study:
i. All respondents and key informants would cooperate in releasing required
information.
ii. All respondents understood the objectives and key terms operationalized for
effective participation in the study.
iii. The political environment was conducive for the successful completion of the
study.
iv. Information gathered from the study was generalized for other watersheds in the
country.
85
3.14: Participation, ethical consideration and informed consent
Participation was voluntary with participants allowed to withdraw at any time they
wished to. Individuals who chose to take part in the interview were asked to read and
ensure they had understood the idea before consenting. The protocol of the study was put
through the scientific processes set by the University Directorate of Postgraduate Studies
research requirements. Ethical clearance for the study was sought from the National
Commission of Science and Technology (NACOSTI). The approval was then presented
to the County Director of Education, County Commissioner and County Secretary before
presented to the sub-county officers. Each participant was asked to give consent before
participating in the study. Participants undertook face to face interviews. During the
process of study, there was no known harm or risks associated with the procedures done
that affected participants, although some participants felt uncomfortable answering some
questions on leadership and financial resources due to victimization as a fear for
corruption "whistleblowing".
Participants for quantitative interview were randomly selected from existing locations
and sub-locations. The interviews took place at homesteads in a discrete manner to
breach confidentiality. Selected participants who were not available for interview were
visited at home by research assistants for the second time. Key informant interviews were
conducted with respective staff officers including senior managers and operational
officers. Interviews with the key informants took place at respective workstations.
FGD was conducted on established groups' common meeting places. The researcher was
liable for ensuring that recorded audio and video instruments were kept. Only research
assistants involved in moderating FGD accessed data kept in the cabinet. To ensure the

86
issue of confidentiality, unauthorized persons were not allowed to join any of the
discussion sessions. The researcher together with the research team ensured that the data
obtained was well kept and protected from access by any unauthorized person. No
identifiable details of any participant were disclosed during and after study, and
dissemination of findings.

87
CHAPTER FOUR
HOUSEHOLDS PERCEPTIONS TO CHANGES IN RURAL
WATERSHED GOVERNANCE
4.1: Introduction
This chapter presents and discusses the quantitative together with qualitative findings
based on the interviewed household heads (HH) and community focus groups
discussions; knowledge, attitudes and satisfaction on various variables that determine
watershed governance and food security. This is in order to corroborate the information
gathered using the household questionnaires on the status of adaptive capacity of the state
actors and non-state institutions, adaptive co-management and the impact of watershed
governance on food security in the Lower Sio River Basin. Therefore, the chapter covers
the first objective of the study. The chapter starts by presenting data on households’
socio-demographic determinants of watershed governance and food security.
4.2: Households Socio-demographic Characteristics and Food Security
The household questionnaires were administered to a total of 387 respondents from 12
sub-locations found in the Lower Sio River Basin in Busia County, Kenya. The study
sought to establish the background information of the household heads; their gender,
ages, religion, the composition of the households, levels of formal education attained
acreage of land, legal status and tenure system of the land held. These variables play an
important role in determining households’ perception, adaptive capacity and co-
management in various interventions in watershed management and food security.
Majule et al. (2007) observed that adaptive capacity to climate change varied within

88
communities due to various factors including variations in wealth among social groups,
age, gender and sex. The variables were further analyzed in relation to the variations in
household food security status among the households with food secure and food insecure
status and hence formed part of the independent variables during data analysis. Table 4.1
provides a summary of the socio-demographic characteristics of the respondents in the
study.
Table 4.1: Summary of Households Socio- demographic Characteristics Characteristics Categories Frequency(N=387) Percent
Sex of the respondent Male 184 47.5
Female 203 52.5
Are you head of household Yes 273 70.5
No 114 29.5
Educational level None 43 11.1
Primary 179 46.3
Secondary 131 33.9
Tertiary 34 8.8
Main Occupation Farmer 266 68.7
Civil servant 16 4.1
Employee in private sector 09 2.3
Business person 49 12.7
On farm laborer 16 4.1
Off farm laborer 21 5.4
Other specify 10 2.6
Religion Christians 348 89.9
Muslims 09 2.3
Traditional African 01 0.3
Other specify 29 7.5
Note: Other occupations include: housewife, retired officers; Religion others include; Non-believers/Pagans.
Source: Field data, (2018)
4.2.1: Households’ Gender Distribution and Food Security
Although the study targeted household heads, during household visiting time only 70.5%
(273) of the household heads were available and interviewed in their homes while 29.5%
(114) were not available, therefore adults aged 18 years and above were interviewed as
representatives of household heads. The respondents' gender in the study was assessed

89
based on the biological sex either male or female (Table 4.1). Therefore, in terms of
gender, 52.5% (203) of the respondents were female while male respondents were 47.5%
(184). Adhikari and Lovett, (2006) indicated that increased female representation in
decision making always leads to improved performance of collective action institutions,
an example given is in the domestic water supply, while women exclusion in watershed
decision making negatively affected collective watershed management action (Agrawal,
2001).
The gender composition in this study was well balanced, like in any other African rural
community; males own the land resource while females are the workers in agricultural
food crop production. It was, therefore, assumed that the findings from the study
presented a balanced gender view of the actual scenario in watershed governance and
food security. However, similar to Bekele and Drake (2003) findings that gender had no
significant factor in influencing farmers’ decision to adopt climate change adaptation
measures, the Chi-square test performed on households’ responses shown in Table 4.3
found that there was no statistically significant difference between gender and
households' food security status in the Lower Sio River Basin.
4.2.2: Households’ Levels of Education and Food Security
The study assessed the education level of respondents since education is considered as an
important factor in determining individual opportunities, income and access to resources
and information, knowledge, and perceptions on watershed governance and food security
in the watershed. From Table 4.1, the study found that majority (46.3%) (179) of the
respondents had attained the basic primary level of education, 33.9% (131) had the
90
secondary education while 8.8% (34) had attained the tertiary level of education.
However, it was also important to note that a large portion of the respondents, 11.1% (43)
did not have formal education. On the contrary, earlier Albinus et al. (2008) found that
the number of respondents with primary education in the Sio River basin Kenya was at
58% while those with secondary education was 19% and those without formal education
was 21% suggesting an increase in the percentage of the respondents with secondary
education and a decrease in the percentage of the respondents without formal education
in the Lower Sio River Basin.
The variations in the statistics of primary, secondary and those without formal education
were attributed to the Government of Kenya education policies that were initiated in the
year 2002 such as Free and Compulsory Primary Education policy, increased education
bursaries through devolved funds such as CDF, Ministry of Education bursaries, and
efforts to regulate secondary school fees to make education affordable as efforts to
increase enrollment rates at primary level as well as increasing transition rate from
primary to secondary education. This was also one of the efforts aimed at attaining the
Millennium Development Goal (MDG) now Sustainable Development Goals (SDGs) on
education in Kenya.
A study by Terry and Israel (2004) found that the higher the farmers’ education level the
greater their likelihood of satisfaction in any form of extension service offered to them.
Moreover, Elias et al. (2015) noted that education not only increased the farmer's
resources and the capacity to achieve goals but also it expanded farmer's awareness of
alternatives and the rewards expected from farmer's activities. Further, Maddison (2007)
emphasized that educated and experienced farmers were expected to have more

91
knowledge and information about climate change and adaptation measures to use in
response to climate challenges. However, a Chi-square test carried out on the households’
responses and presented in Table 4.3 did not establish any statistically significant
difference between education and households' food security status. On the contrary, the
early study in the neighbouring Bungoma County found that there was a statistically
significant association between educational levels and food security (food supply) in the
county (Wabwoba et al., 2015). Therefore, the level of education of the household
decision maker determines households’ ability to obtain and process information and to
implement knowledge intensive conservation practices and agricultural technologies
(Kagombe et al., 2018).
4.2.3: Households’ Main Occupation and Food Security
The study assessed at the main occupation of the respondents and other household
members. Findings presented in Table 4.1 indicate that majority (68.7%) (266) of the
households in the Lower Sio River Basin depended on farming as their main occupation,
4.1% (16) and 5.4% (21) were on-farm and off-farm labourers respectively, while 12.7%
(49) practiced on businesses, 4.1% (16) were civil servants and 2.3% (09) were
employees in the private sector respectively. About 2.6% (10) of the households’ heads
reported engaging in other activities which included; housewives, carpentry, the local
brewery and retired officers. Studies revealed that farmers are the key determinants in the
success of watershed governance as they are expected to make major decisions on the
willingness to accept incentives in conservation (Kagombe et al., 2018).
Further, the main household occupation is the main determinant of household disposable
income which is vital in efforts to invest in watershed management activities and access

92
to food. Anley et al. (2007) urged that improving education and employment was
necessary to stimulate local participation in various adaptation measures and natural
resource management initiatives. However, Wabwoba et al. (2015) found a highly
significant variation in the source of income and households' food security status. In
Table 4.3 the Chi-square test performed on households' responses unexpectedly found out
that there was no statistically significant variation between occupation and households'
food security and food insecurity status in the Lower Sio River Basin.
4.2.4: Households’ Religion and Food Security
Religious ethics and morals are inherent in determining human behaviour related to
watershed resources management and utilization in attaining food security. Therefore,
during the study, the religious affiliation of the respondents was assessed. The study
found in Table 4.1 that the majority (89.9%) (348) of the households in the watershed
practiced Christianity while 2.3% (09) practiced Islam and 0.3% (01) practiced
Traditional African religion. However, 7.5% (29) practices others forms of religion which
included activities that were classified either as Christianity, traditional African religion
and paganism. In Christianity, environmentalism is enshrined in the story of creation in
the Holy Bible, the book of Genesis; God gave the man the mandate to take care of other
creatures and manage all other resources, this call for good environmental stewardship
among the Christians. In Table 4.3 the study showed that there was a highly statistically
significant difference with p-value =0.000 at 99% confidence level in religion types and
status of households’ food security. This implied that religious activities were important
in promoting determining households’ food security Lower Sio River Basin.

93
Table 4.2: Socio-demographic Characteristics on interval scale Characteristic Mean Median Std.
Deviation
Variance Range Min Max
Age (in completed
years)
42.73 42 13.24 175.40 69 18 87
Land size (acres) 2.73 2 2.52 6.35 25 0 25
How many male are
in the household?
3.11 3 1.70 2.90 10 0 10
How many female
are in the
household?
3.26 3 1.81 3.28 11 0 11
How many members
are aged below 18
years in this HH?
2.83 3 1.80 3.25 10 0 10
How many members
are aged 18-64 years
in this HH?
3.41 3 2.31 5.34 15 0 15
How many members
are aged 65 years
and above in this
HH?
0.21 0 0.49 0.24 2 0 2
Source: Field data, (2018)
4.2.5: Households’ Members Average Age and Food Security
The age of the respondents was considered to be an important variable in determining the
status of understanding watershed governance issues and the status of households' food
security. The average age of 43 years of the respondents was documented and other
descriptive statistic measures drawn as presented in Table 4.2. Age of the beneficiaries of
any project is important in determining the participation, satisfaction and knowledge
about a given phenomenon. According to Lavis and Blackburn (1990) and Terry and
Israel (2004) in the study of farmers’ satisfaction on extension services in Ethiopia, it was
concluded that older farmers were more satisfied with the services provided by extension
officers compared to younger farmers the factor that was attributed to differences in farm
experience.
However, in the same study, older farmers were viewed as less flexible in addition to less
willing to engage in the new or innovative activity as a result of fear of risk while

94
younger farmers were found to be more risk averse to implement new farming
technologies on their farm (Elias et al., 2013). However, the Chi-square test results
presented in Table 4.3 showed that there was no statistically significant difference
between age and households' food security status in the Lower Sio River Basin. This is
similar to Bekele and Dekele (2003) findings where age had no influence on farmer’s
decision to participate in climate change adaptation activities which is a key determinant
of households’ food security. On the contrary, Bayard et al. (2007) found that age was
positively related to some climate change adaptation measures in Haiti.
4.2.6: Household Size and Composition, and Food Security
The size of the households based on the number and composition of members was
considered an important determinant of household engagement in watershed activities
and food security and thus an influencing factor in the household adaptive capacity and
co-management. The households’ sizes were classified based on gender and age of
members. Table 4.2 shows that on average the households had three male members and
three female members. An average of three members was aged below 18 years while
three members in the household were aged between 18 years and 64 years. Further, on
average one member of the household was aged above 65 years. Elsewhere, studies
indicate that the composition of the household in a watershed is important since it helps
mitigate farm labour issues (Elias et al., 2015) hence how watershed resources are
utilized as well as how the resources are managed.
An earlier study by Albinus et al. (2008) in the Sio River basin Kenya noted that family
labour was the main soil tillage practice with 21.8% of the households using family
labour. However, during the interviews in group discussions, oldest aged and females

95
who were heads of the households argued that it was difficult for them to engage in
simple soil management activities such as digging of terraces because they did not have
the energy to do so even though they were willing. For those who had school going male
youth, engaged them in digging terraces and digging tree planting holes especially on the
slopes of hills where land had formed hardpans. In the Kenya Rural Household Budget
Survey of 1981-1982, it was found that women in Kenya spent 65% of their time in
agricultural crop production as compared to men who spent 35% of their time on similar
activities (African Women's Studies Centre, 2014). A similar finding was reported by
Kumar (1994) study in Zambia who found that women were responsible for 49% of the
agricultural crop production family labour compared to men (39%) and children at 12%.
Elsewhere, studies on asset ownership in Ethiopia showed that wealth status of rural
household farmers motivated them to implement extension advice effectively thus
adaptation activities. Further, the family size of farmers, livestock ownership, and the size
of land helped farmers to mitigate labour shortage, incomplete credit and insurance
markets (Ayalew and Deininger, 2012).
4.2.7: Average Households income and Food Security
On average, (54.3%) (210) of the total households reported to earned less than
KES.3000= (USD 30) monthly income while 34.6% (134) on average earned income
ranging from KES. (3000 = (USD 30) to KES. 10,000= USD 100) monthly. Those who
indicated to earn between (KES. 10,000=USD 100 to KES. 20,000= USD 200) were
7.8% (30) while 1.3% (05) indicated to earn between (KES. 20,000=USD 200 to KES.
30,000=USD 300). Only 2.1% (08) of the households in the Lower Sio River watershed
reported earning above KES. 30,000 = USD 300 per month as presented in Figure 4.1. A

96
study by Namenya (2012) in Funyula Sub-county one of the study sites found that
majority (60.2%) of the households reported earning an income below KES.
15,000=USD 150. Results show that the Chi-square test carried out and presented in
Table 4.3 show that the study did not establish any statistical significant variation
between various levels household income and households' food security or food
insecurity. This is contrary to earlier study findings in the neighbouring, Siaya County
where it was reported highly significant variations in the level of income and households'
food security among fish farmers (Shitote, 2013).
NOTE: Exchange rate at 1USD =KES. 100
Figure 1.1: Average monthly income of households in different categories
Source: Field data, (2018)
In a similar study in Ethiopia (Oromia, Amhara and Tigray) where the actors
concentrated on watershed management activities as an approach to increase household
income and thus food security, the findings indicated that watershed management
improved farmers’ incomes and food security by an average of 50% and 50%,
respectively. This affirmed that investment in watershed management activities as a long-
term development agenda in a watershed has a positive impact on natural resource
N=387

97
conservation, crop and livestock production and productivity, socioeconomic conditions
and livelihood (Gebregziabher, 2016).
4.2.8: Households’ Land Tenure System and Food Security
Based on the findings presented in Figure 4.2, the majority (58.4%) (226) of the
respondents reported that the household land tenure system practiced was freehold. In
addition, communal land tenure system was practiced by 37.5% (145) while lease land
tenure system was practiced by 3.6% (14) of the households. In addition, 0.5% (02)
reported other land tenure system such as donations and gift in the watershed. The focus
group discussions also indicated that the land tenure system was in favour of the male
members in the household; the land cultural practices including inheritance rights only
considered the males in the families in households with freehold, lease and communal
tenure systems. This reduced the adaptive capacity of women in the watershed since
women were left with limited options for holding productive land other than depending
on males for them to access land and decision making.
However, some respondents acknowledged the land ownership rights in the Constitution
of Kenya (2010) were the key milestone and a game changer in female land ownership in
the watershed although reported that they were yet to be affected. In addition, in Table
4.3, a Chi-square test established that there was a positive statistical significant difference
p-value =0.085 at 90% level of confidence in households with freehold and lease land
tenure systems and households with food security. On the other hand, communal land
tenure system had a marginal significant variation in households' food insecurity status in
the Lower Sio River Basin. Elsewhere, in the study by Wabwoba et al. (2015) a

98
significant variation on household heads decision making on land allocation and food
security was reported in Bungoma County.
Note: Other; donations and gifts. Communal meant collectively owned by extended family members
Figure 2.2: Household Land Tenure System in the Lower Sio River watershed
Source: Field data, (2018)
Land tenure was found to have an influence on natural resources management with many
environmental problems such as soil degradation and forest depletion characterized as a
result of incomplete, inconsistent and non-enforceable property right (Bromley & Cernea,
1989; Watchter, 1992; Kagombe et al., 2018). The study findings were similar to an
explanatory study by the World Bank (2012b) where it was found that women’s access to
land in Kenyan agricultural communities through the local power dynamics in both
formal and informal justice systems underpin control and ultimately undermined the
access to land by women. Further, it is indicated that past formal titling initiatives led to
men holding almost all land titles in Kenya through patrilineal landholding practices
where inheritance systems through kinship structure were also based (African Women's
Studies Centre, 2014).
N=387

99
4.2.9: Households’ Land Legal document possessed and Food Security
Based on the findings, Figure 4.3 shows that 48.3% (187) of the households in the Lower
Sio River Basin held own land title deeds while 47.8% (185) held family title deeds.
Land allotment letters were land legal documents held by 2.6% (10) of the households
while other 1.3% (05) of the households indicated that had no physical document hence
families’ agreements were considered during allocation of land. During focus group
discussions it was noted that collective family title deeds prohibited most households
from practicing watershed management activities including tree planting and soil
conservation terraces and gabions. This was attributed to ownership conflicts that
emerged during the informal sub-division of family land. Therefore, individuals reported
abandoning soil and water management activities for fear that other family members with
economically stable claimed trees upon maturity and fertile lands for which they never
contributed to planting or conservation initiatives.
Note: Other include; No land legal document
Figure 3.3: Household Land Legal document possessed
Source: Field data, (2018)
N=387

100
In the interview with the County Land Registrar, it was observed that most of those who
held land title deeds either had purchased land or acquired through succession. Land
ownership disputes were on the rise since most of those title deeds held were issued in the
1970s; since then families with numerous adult male children have increased resulting to
family land sub-divisions without following the legal procedure of acquiring land title
deeds. In addition, the Land and Environment Court in Busia had also recorded an
increased number of land succession cases as well as land disputes that result from deaths
of grandparents whose land parcels were registered in the 1970s. The court process was
reported to take long, a minimum of five years which was also another challenge to
ownership and effective use of land as watershed resource. According to FAO (2011),
gender inequalities in control of livelihood assets limited women's participation in food
production. A study in Ghana found that insecure access to land led women, farmers, to
practice shorter fallow periods than their colleague men who securely owned land, hence
reduced women agricultural production yield, income and the availability of food for the
households headed by women (African Women’s Studies Centre, 2014).
4.2.10: Households’ watershed land area occupied, main land use and main source
of food
The results show that majority, 74.7% (289) of the households in Lower Sio River basin
are inhabitants of plain land area, 12.1% (47) mountain slopes, 9.8% (38) valley bottoms
and 3.4% (13) hilltops as illustrated in Figure 4.4. The landforms occupied by households
determined access to water resources thus the quality of agricultural production. During
transect walk, it was observed that numerous streams formed the tributaries of River Sio.
Water pans, wetlands along the streams and the main river channel, shallow wells in the

101
settlement areas, boreholes, protected and unprotected springs and roof water from
rainfall were the possible sources of water for domestic and agricultural production.
Through consensus, the groups acknowledged that the amount of water in all sources had
reduced in recent years due to frequent prolonged droughts. Among tributaries of River
Sio is the Walatsi which joins the Sio River at Nambale Market.
Other smaller tributaries of the Sio River listed by groups include the Mererak,
Musokoto, Muyala, Mumbao, Ludacho, Mudoma, Wakhungu and Munana which also
join the Sio River near Nangina. All the streams and the main Sio River are covered by
extensive wetland which is a colony of papyrus reeds. Gebregziabher et al., (2016)
showed that upstream and downstream areas of a watershed are linked through
hydrology. However, during discussions with communities’ groups, it was reported that
there were no mechanisms in place to regulate the activities of the upstream land user for
the sustainability of the downstream water users' activities in the Lower Sio River Basin.
According to Gebregziabher et al. (2016), natural resource management interventions at
the watershed level in Ethiopian Highlands were used to reduce the rate of soil erosion,
sedimentation in the downstream reservoirs and river systems for improved soil moisture
and increased crop yield. On the contrary, in the Lower Sio River, the ineffective natural
resources management in the upstream was blamed by Busia County NEMA officer
during the interview as the ultimate cause of flooding and destruction of means of
livelihoods in the downstream of both rivers. Further, a comparative study showed that a
successful watershed management intervention increased groundwater recharges and
raised the sub-surface water levels which in turn led to increased irrigated and increased
crop yields across the watershed in Ethiopia (Gebregziabher et al., 2016).

102
The main challenges identified in the Lower Sio River identified during the key
informant interviews include: lack of clear ownership by the communities for some of the
water sources and facilities, ineffective water management practices and lack of clear
laws and regulations at the grassroots to protect water sources that threatened the sources
with pollution and environmental degradation. Consequently, increased human activities
were also blamed for water scarcity in the watershed including; unsustainable farming
practices that resulted to a negative impact on the water cycle reducing underground
water recharge and high evaporation occasioning huge shortages during the dry spells
from September to March every year. Further, it was noted that most affected areas with
water scarcity in the watershed were small urban markets including Busia town,
Mundika, Nambale, Matayos, Namboboto and Funyula which had experienced
immigrants who come from rural areas in search for economic opportunities as a result of
the devolved system of governance.
Note: Other source of food include; Donations from neighbours, government Figure 4.4: Household watershed landform occupied, main land use and main source of
food
Source: Field data (2018)
N=387

103
Further, the study in Figure 4.4 shows that 52.2% (202) of the households indicated that
rain-fed cropland was the main land use activity, 42.4% (164) of the households indicated
mixed farming was practiced on the land while 5.4% (21) of the household indicated that
the land held was only for settlement and infrastructure. During transect walk, it was
observed that the agricultural land use activities in the Lower Sio River Basin were rain-
fed subsistence farming. However, other studies in East Africa showed that
diversification of options at the household level were critical for incomes and food
security. Further, it was found that the households that were engaged in more cropping
and non-agricultural activities tended to be better off than those who engaged in fewer
activities (Thornton et al., 2007, 2011; Patt et al., 2012). However, during the focus
group discussions, a male respondent said: -
“Farming practices in this watershed have not been sustainable whereby
the expanded cultivated land had exacerbated soil erosion. In addition,
large areas of forest cover especially on the hill slopes in Matayos and
Funyula Sub-counties and riparian zones along River Sio and its
tributaries have been lost to agriculture due to increased demand for food
as the population increase. Further, watershed degradation is on the rise as
soil erosion and sedimentation increase as a result of increased county
government activities such as grading and murram roads, ploughing using
tractors and increased use of subsidized inorganic fertilizer in farms”.
Plate 4.1 presents some of watershed destruction activities due to county roads
infrustructure that results from poor watershed management activities.

104
Plate 4.1: Watershed destruction activities due to County roads infrustruture in the Lower Sio
River Basin
Source: Field data, (2018)
On the lowlands along main streams and River Sio channel, small-scale farming was
observed to be practiced by the households. In most cases, due to the undulating terrain,
as a result of hills in Matayos and Funyula sub-counties, the County Irrigation Officer
revealed that farmlands suitable for irrigation were located at higher elevations than the
river level, together with lack of sufficient fund among the households to procure water
pumping systems restricted irrigation to small-scale plots for food production.
The study findings in Figure 4.4 further showed that 75.2% (291) of the households’
main source of food was from own farmlands while 24.5% (95) of the households depend

105
on bought food. Government, civil society organization and neighbours donations were
other sources of food to 0.3% (01) of the households in the Lower Sio River Basin.
Results in Table 4.3 show a bivariate analysis, Chi-square tests and T-tests were run to
show the statistical significance between the background factors and different levels of
food security at households. Based on earlier discussions in various sections of this
chapter, the analyses show that age and sex of the head of the household, geographical
area (sub-county), education level, main occupation, and average income had no
statistically significant difference with levels of food security at the households.
However, with reference from previous studies, age was expected to have a positive
impact on food security (Geda et al., 2001; Deaton, 1997 and Lemba, 2009).
This finding is similar to Nyariki et al. (2002) who found that age had insignificant
influence on energy availability levels of households in the former Makueni District
(Lemba, 2009). On the other hand, level of education was expected to have a positive
effect on food security due to its link with better production and access to non-farm
income (Geda et al., 2001; Nyariki et al., 2002). Similar findings were reported by
Lemba (2009) in the study on food security in the former Makueni District Kenya.
Results showed that land size in acreages showed no statistically significant difference
with food security status, implying that households with less land size were more food
secure while those with more acreage of land were food insecure (p-value=0.000 at 99%
confidence level). Out of 10 background variables whose associations were tested with
food security levels, only two showed the positive relationship with households that were
food secure at the time of the study.

106
For instance, there was significant difference (d=8.8; p-value =0.000) at 99% confidence
level in religion types and status of food security where 94.8% (164) households with
food security reported as Christians and 86% (184) of households with food insecurity,
implying that households with Christians as heads were more food secure than those
households with heads of different religions (Table 4.3). Similarly, household land tenure
system had positive marginal statistical differences with food security status at the
household level (p=0.085) at 90% confidence level. Households with freehold (d=4.2)
and lease (2.9) land tenure systems reported being more food secure than those with
communal (d=-8.2) and others (d=1.2) land tenure systems.
Table 4.3: Food security and insecurity households’ measurement comparison
association amongst the Socio-demographic background factors of respondents at
their household levels Variable Food
Insecurity
(n=214)
Food
Security
(n=173)
Difference χ2 p-value Significant
?
Age group 18-35 years 35 37 2 1.182 0.554 No
36 - 64 years 57 57.8 0.8
65 - 87 years 7.9 5.2 -2.7
Sex Male 49.1 45.7 -3.4 0.444 0.505 No
Female 50.9 54.3 3.4
Sub
County
Funyula 15+ 19.1 4.1 1.484 0.476 No
Matayos 33.2 34.1 0.9
Nambale 51.9 46.8 -5.1
Education
level
None 11.7 10.4 -1.3 0.173 0.982 No
Primary 45.8 46.8 1
Secondary 33.6 34.1 0.5
Tertiary 8.9 8.7 -0.2
Religion Christians 86 94.8 8.8 20.589 0.000*** Yes
Muslims 1.4 3.5 2.1
Traditional
African
0 0.6 0.6
Other specify 12.6 1.2 -11.4
Main
Occupation
Farmer 65.4 72.8 7.4 6.506 0.369 No
Civil servant 4.2 4 -0.2
Employee in
private sector
1.9 2.9 1
Business
person
16.4 8.1 -8.3
On farm
labourers
4.2 4 -0.2

107
Cont’
Off farm
labourers
5.6 5.2 -0.4
Other specify 2.3 2.9 0.6
land size
(acres)
Categorical
less than 2
acres
27.1 46.2 19.1 15.476 0.000*** Yes
2 - 4 acres 53.7 41 -12.7
More than 4
acres
19.2 12.7 -6.5
Average
monthly
income
<3,000 52.8 56.1 3.3 2.785 0.594 No
3,000 -
<10,000
37.4 31.2 -6.2
10,000 -
<20,000
7.5 8.1 0.6
20,000 -
<30,000
0.9 1.7 0.8
>30,000 1.4 2.9 1.5
HH land
tenure
system
Free hold 56.5 60.7 4.2 6.634 0.085* Yes
Lease 2.3 5.2 2.9
Communal 41.1 32.9 -8.2
Other specify 0 1.2 1.2
Age Mean 43.15 42.20 -1.0 t-test
(F=0.4
3)
0.835 No
Standard
Deviation
13.22 13.29 0.1
Land size
(acres)
Mean 2.90 2.52 -0.4 t-test
(F=1.2
41)
0.266 No
Standard
Deviation
2.19 2.87 0.7
*p<0.1 ***p< 0.01 statistically significant difference between the households with food secure and insecure
Source: Field data (2018)
During transect walk, it was observed that the Lower Sio River Basin, especially in
Nambale and Matayos sub-counties, were dominated by farmlands which comprised of
areas under cultivation for either commercial or subsistence agriculture purposes.
Therefore, farmlands formed the main livelihood opportunities, especially for the rural
population. In commercial sugar cane farming, agricultural production was reported to
be done by farm machinery in large plantations, using agro-chemicals and inorganic
fertilizers. The farms had access roads for machinery, animals and humans; therefore, in
most cases, the roads acted as a runoff concentration area and result in gullies. In
addition, the compacted road areas promoted surface runoff generation. On the other

108
hand, machinery movement also caused compaction of the subsoil in the farms hence
reducing infiltration and recharge into the groundwater. Consequently, the surface runoff
generated builds the potential for soil erosion and flooding.
As a result of subsistence agricultural practices, simple tools were used for cultivation in
advanced households, where animal power was employed. The Sio River Basin was
characterized by small-sized farmlands most of which were demarcated downslope as a
result of high population growth and the cultural requirement of formation of the new
household for married adults which contributed to land fragmentation. This encouraged
waterways between the small land sub-divisions which in most cases ran down slopes. As
a result, runoff concentrated along the farm boundaries since the neighbouring farms
discharged runoff into the waterways, therefore, increased runoff volumes accelerated
gully erosion in most farmlands adjacent to graded roads in the watershed. Studies show
that soil erosion has been associated with the persistent reduction in crop yields and river
sedimentation and flooding in the downstream areas (National Environment Management
Authority Uganda, 2002; Fiona et al., 2013). Studies in Sasumua showed that contour
farming combined with grass strips had highest effects of reducing sediment load,
followed by terracing, contour farming and grasses waterway (Namirembe et al., 2013;
Kagombe et al., 2018). Table 4.4 and Plate 4.2 present a summary of observed land use
activities and its implications in various sections of the basin.
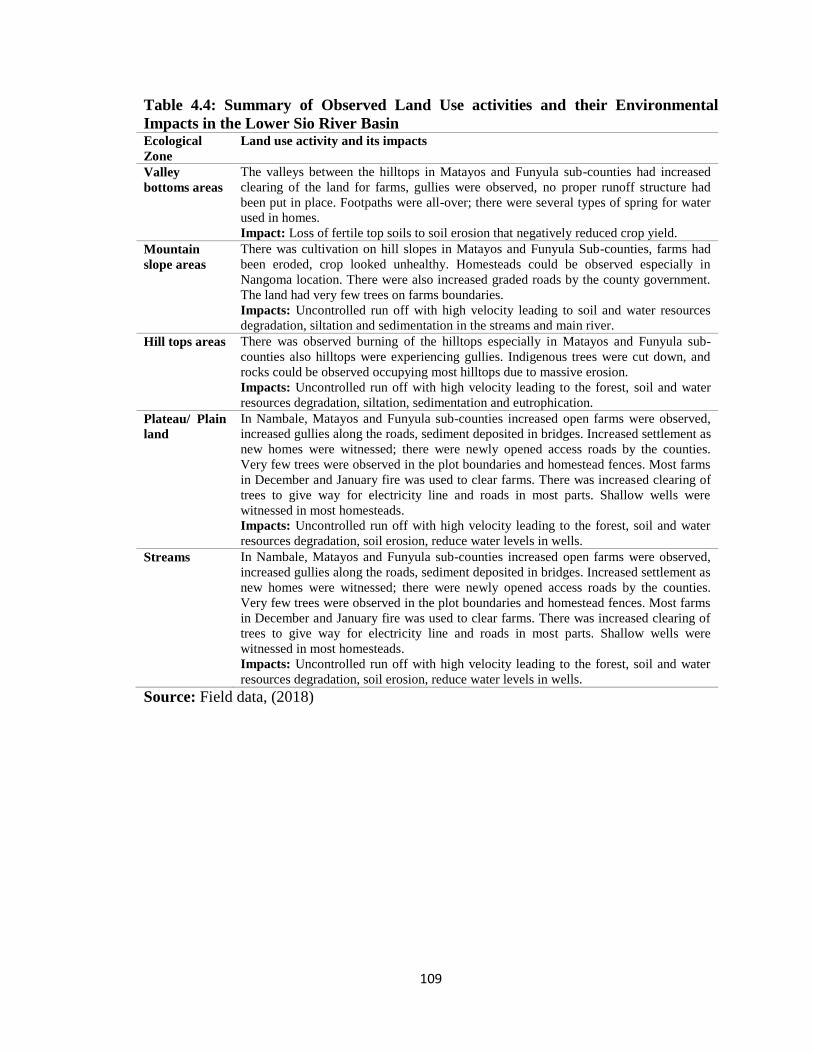
109
Table 4.4: Summary of Observed Land Use activities and their Environmental
Impacts in the Lower Sio River Basin Ecological
Zone
Land use activity and its impacts
Valley
bottoms areas
The valleys between the hilltops in Matayos and Funyula sub-counties had increased
clearing of the land for farms, gullies were observed, no proper runoff structure had
been put in place. Footpaths were all-over; there were several types of spring for water
used in homes.
Impact: Loss of fertile top soils to soil erosion that negatively reduced crop yield.
Mountain
slope areas
There was cultivation on hill slopes in Matayos and Funyula Sub-counties, farms had
been eroded, crop looked unhealthy. Homesteads could be observed especially in
Nangoma location. There were also increased graded roads by the county government.
The land had very few trees on farms boundaries.
Impacts: Uncontrolled run off with high velocity leading to soil and water resources
degradation, siltation and sedimentation in the streams and main river.
Hill tops areas There was observed burning of the hilltops especially in Matayos and Funyula sub-
counties also hilltops were experiencing gullies. Indigenous trees were cut down, and
rocks could be observed occupying most hilltops due to massive erosion.
Impacts: Uncontrolled run off with high velocity leading to the forest, soil and water
resources degradation, siltation, sedimentation and eutrophication.
Plateau/ Plain
land
In Nambale, Matayos and Funyula sub-counties increased open farms were observed,
increased gullies along the roads, sediment deposited in bridges. Increased settlement as
new homes were witnessed; there were newly opened access roads by the counties.
Very few trees were observed in the plot boundaries and homestead fences. Most farms
in December and January fire was used to clear farms. There was increased clearing of
trees to give way for electricity line and roads in most parts. Shallow wells were
witnessed in most homesteads.
Impacts: Uncontrolled run off with high velocity leading to the forest, soil and water
resources degradation, soil erosion, reduce water levels in wells.
Streams In Nambale, Matayos and Funyula sub-counties increased open farms were observed,
increased gullies along the roads, sediment deposited in bridges. Increased settlement as
new homes were witnessed; there were newly opened access roads by the counties.
Very few trees were observed in the plot boundaries and homestead fences. Most farms
in December and January fire was used to clear farms. There was increased clearing of
trees to give way for electricity line and roads in most parts. Shallow wells were
witnessed in most homesteads.
Impacts: Uncontrolled run off with high velocity leading to the forest, soil and water
resources degradation, soil erosion, reduce water levels in wells.
Source: Field data, (2018)

110
Plate 4.2: Land use practices in the Lower Sio River Basin
Source: Field data, (2018)
An earlier study indicated that 42% of the respondents in the Sio River Basin in Kenya
revealed that land productivity was lower than 30 years back (Makalle et al., 2008). The
reasons advanced for the declining land productivity were over cultivation because
owned and cultivated land was decreasing as a result of overgrazing and increase in
human settlements that reduced acreage under cultivation. Consequently, poor cultivation
techniques, use of fire to clear land, inadequate use of fertilizers, mono-cropping and
persistent drought periods contributed to the decline in agricultural productivity and were
cited as the main causes of declining land productivity in the Lower Sio River Basin
(Makalle et al., 2008). The study findings show that since the time the study by Makalle
111
and others was carried out in (2008), little interventions have been implemented to
increase land productivity through watershed management as a result of ineffective
watershed governance in the study area.
As evidenced in studies from Ethiopia, watershed governance interventions are needed in
the study area to reverse land productivity. A study by Gebrehaweria et al., (2016)
revealed that reclamation of gullies along hill slopes and roadsides, reforestation
activities through a watershed management program resulted in improved soil depth in
Bechyti, Goho-Cheri, Bedesa Kela and Kereba watersheds. This was implemented
together with simple land management technologies at the household farm level such as
soil and stone bunds, hillside terraces, deep trenches, check dams, diversion ditches and
sedimentation storage dams. Further, on the hillside landscapes, efforts to stabilize the
conservation structures through tree planting were of economic importance. On the other
hand, cultivated areas needed grasses, legume plants to stabilize and reinforce soil and
water structures in addition to soil fertility improvement measures such as the use of
compost and nutrient-fixing plants (Gebrehaweria et al., 2016).
The decrease in farm sizes in the Sio River Basin was attributed to the increased
subdivision of land parcels as a result of population increase, extensive soil erosion which
was associated with river siltation and sedimentation on the river bank resulting to
papyrus reeds growth (Makalle et al., 2008). Despite the fact that respondents
acknowledged the decrease in land productivity and diversion to alternative sources of
livelihoods such as sand harvesting and charcoal burning, fishing farming were not

112
widely practiced along the hilltops, streams of River Sio. In group discussions, various
reasons were given these included; threats from dangerous wildlife such as crocodiles,
snakes, monitor lizards along the River Sio at its tributaries, lack of adequate finances at
the household level to invest in fishing ponds and other fishing farming infrastructure,
limited skills and extension services to promote fish farming. Evidence shows that fish
farming is a key contributor to households’ food security and management of water
resources in Siaya County (Shitote, 2013). The Plate 4.3, shows pieces of evidence
pieces of forms of soil conservation efforts taken during the transect work.
Plate 4.3: Forms of soil conservation efforts in the Lower Sio River Basin
Source: Field data, (2018)
113
4.3: Households’ Perceptions to Changes in Rural Watershed Governance and Food
Security
Households' perceptions play an important role in determining watershed governance and
food security in the Lower Sio River Basin. This section focuses on the assessment of
households' perceptions, knowledge, satisfaction and attitude on various variables of
watershed governance and food security. The section presents households’ perception of
the need for changes in rural watershed governance and household satisfaction with the
domains of watershed governance; factors that are needed for a more collaborative
watershed governance. The section also explains why there is the need for changes in the
watershed governance in the study area. The relationship between variables that test
perceptions and two types of households (food secure and food insecure) and satisfaction
with the background socio-demographic data were discussed.
4.3.1: Households Perception on Rural Watershed Governance and Food Security
The study sought to establish households' perception of changes in rural watershed
governance. Results in Table 4.5 revealed that 81.9% (317) of the households agreed that
watershed governance determined the status of household food security while 64.6%
(250) were in agreement that the current devolved system of governance in Kenya had
impacted on watershed governance. Subsequently, 88.1% (341) of the households in the
Lower Sio River basin agreed with the fact that the county government system had a
potential to promote watershed governance and thus impact on households’ adaptive
behaviour, this factor was agreed by 85.0% (329) of the households. Consequently,
93.0% (360) of the households supported that watershed management should be
prioritised during county planning.

114
Table 4.5: Households Perception on Changes in Rural Watershed Governance Changes in rural watershed governance Disagreed Undecided Agreed
Percentages (N=387)
Watershed governance determine food security 11.9 (46) 6.2(24) 81.9(317)
Current devolution system in Kenya has impacted on
watershed governance
22.7(88) 12.7(49) 64.6(250)
The county system has potential to promote watershed
governance
7.2(28) 4.7(18) 88.1(341)
Current devolution system has potential to promote
adaptive behaviour through watershed governance
7.5(29) 7.5(29) 85.0(329)
Watershed management should be prioritized during
county planning
3.4(13) 3.6(14) 93.0(360)
Accepted watershed governance will promote sustainable
livelihoods.
3.1(12) 2.8(11) 94.1(364)
County government focus on watershed governance will
increase budgetary allocations and human resources for
sustainable food security.
14.0(54) 12.1(47) 73.9(286)
Source: Field data, (2018)
A chi-square test carried out on the households' perceptions of changes in rural watershed
governance in Table 4.6 indicated that there was a highly significant variation in the
household's perceptions among the households with food security and households with
food insecurity with the variables that were used to measure the expected changes in the
rural watershed governance. Results showed that watershed governance determined food
security at p-value=0.000 at 99% level of confidence implying that the households
expected improvement in watershed governance to positively improve the status of
households’ food security.
On the other hand, current devolution system in Kenya had impacted on watershed
governance at p-value=0.003 at 99% level of confidence implying that the households
observed that the county governance had an impact on watershed governance thus food
security. Further, results showed that at p-value =0.000 at 99% level of confidence, the
household perceived that the county devolved system had a potential to promote adaptive
behaviour through watershed governance.

115
Table 4.6: Food security and insecurity households’ measurement comparison
association amongst the households perception of changes in rural watershed
governance
Food
insecurity
(n= 214)
Food
Security
(n=173)
Difference χ2 p-value Significant?
Watershed governance determine food security
Disagreed 9.6 2.05 -7.95 35.33 0.000*** Yes
Undecided 8.9 2.9 -6.0
Agreed 36.0 47.1 11.1
Current devolution system in Kenya has impacted watershed governance
Disagreed 12.2 10.4 -1.75 16.15 0.003*** Yes
Undecided 9.8 16.2 6.4
Agreed 33.0 31.5 -1.5
The county system has potential to promote watershed governance
Disagreed 2.8 4.7 1.9 5.31 0.257 No
Undecided 4.2 5.2 1.0
Agreed 45.1 42.8 -2.3
Current devolution system has potential to promote adaptive behavior through watershed
governance
Disagreed 5.9 1.2 -4.7 20.45 0.000*** Yes
Undecided 6.1 9.2 3.1
Agreed 41.2 44.2 3.0
Watershed management should be prioritized during county planning
Disagreed 0.7 2.9 2.2 32.78 0.000*** Yes
Undecided 2.3 5.2 2.9
Agreed 48.2 44.5 -3.7
Accepted watershed governance will promote sustainable livelihoods
Disagreed 0.9 2.3 1.4 5.31 0.257 No
Undecided 1.9 4 2.1
Agreed 48.2 45.7 -2.5
County government focus on watershed governance will increase budgetary allocations and
human resources for sustainable food security
Disagreed 4.7 9.8 5.1 32.78 0.000*** Yes
Undecided 13.1 11 -2.1
Agreed 38.8 34.7 -4.1
***p <0.01 statistically significant difference between the households with food secure and insecure
Source: Field data (2018)
From focus group discussions it emerged that households expected the county
government through its departments to lead all actors including the households in
watershed management activities with the aim of promoting sustainable agricultural
production in the Lower Sio River Basin. Studies on households’ perceptions and status
of food security concluded that food insecure households felt that the government should
provide social security and that the households themselves were not responsible at all for

116
their food insecurity situation. This suggested that policymakers needed to consider
households’ perceptions on poverty and other factors that contribute to poverty such as
inefficient watershed management policies as part of developing a policy framework
towards addressing poverty in low-income neighbourhoods (Grobler, 2016).
4.3.2: Households Satisfaction with Aims of Watershed Governance and Food
Security
The study assessed the households’ level of satisfaction with the domains of watershed
governance in enhancing involvement in food production and distribution. As indicated
in Table 4.7 the majority of the households were not satisfied with various domains of
watershed governance. Whereby, 45.7% (177) of the interviewed households indicated
that were not satisfied while 24.5% (95) were satisfied with the creation of local social
resilience to adapt to climate change. On the other hand, only 19.9% (77) of the
households were satisfied with the goal of enhancing water-use efficiency and
conservation and improving management in the study area.
Table 4.7: Households Level of Satisfaction with Aims of Watershed Governance Domains of watershed governance in enhancing
household involvement in food production and
distribution in this watershed
Not
Satisfied
Moderate
satisfied
Satisfied
Percentages (N=387)
Clear roles and responsibilities of various actors 43.9(170) 30.5(118) 25.6(99)
Creation of local social resilience to adapt to climate
change
45.7 (177) 29.7(115) 24.5(95)
Watershed management for food production decision-
making process
46.5(180) 30.0(116) 23.5(91)
Protection of ecological health and functions including food
production
49.1(190) 29.7(115) 21.2(82)
Enhancing water-use efficiency and conservation and
improving management
48.8(189) 31.3(121) 19.9(77)
Reducing or avoiding watershed related conflicts 45.5(176) 34.6(134) 19.9(77)
Involving local expertise and resources 44.7(173) 35.9(139) 19.4(75)
Source: Field data (2018)

117
According to the WHO (2000), assessing beneficiaries’ satisfaction can address the
reliability and responsiveness of services or the willingness of the service providers to
meet beneficiaries’ needs. This finding shows the need to consider households’
satisfaction in policies on watershed governance in the study area.
Table 4.8: Households’ food security and insecurity measurement comparison
association amongst level of satisfaction with aims watershed governance Satisfaction with
aims of watershed
governance
Food
insecurity
(n=214)
Food
Security
(n=173)
Difference χ2 p-value Significant?
Creation of local social resilience to adapt to climate change
Satisfied 19.9 26.6 6.7 44.11 0.000*** Yes
Moderate satisfied 11.2 24.3 13.1
Not satisfied 24.5 11.3 -13.2
Enhancing water-use efficiency and conservation and improving management
Satisfied 22.5 26.9 4.4 39.68 0.000*** Yes
Moderate satisfied 10.7 21.4 10.7
Not satisfied 22.2 12.4 -9.8
Involving local expertise and resources
Satisfied 20.3 24.9 8.6 54.33 0.000*** Yes
Moderate satisfied 12.6 26.0 13.4
Not satisfied 23.4 12.15 6.3
Clear roles and responsibilities of various actors
Satisfied 22.9 20.8 -2.1 42.21 0.000*** Yes
Moderate satisfied 9.8 20.8 11.0
Not satisfied 22.2 18.8 -3.4
Protection of ecological health and functions including food production
Satisfied 23.6 25.8 2.2 32.25 0.000*** Yes
Moderate satisfied 7.0 19.7 12.7
Not satisfied 22.9 14.5 -8.4
Reducing or avoiding watershed related conflicts
Satisfied 21.5 24.3 2.8 49.01 0.000*** Yes
Moderate satisfied 14.0 19.7 5.7
Not satisfied 21.5 15.9 -5.6
Watershed management for food production decision-making process
Satisfied 22.0 24.9 2.9 49.36 0.000*** Yes
Moderate satisfied 7.9 20.2 12.3
Not satisfied 24.1 15.1 -9.0
The overall score for the satisfaction of watershed governance
Mean(SD) 44.26
(34.95)
55.92
(23.66)
11.7
(-11.3)
83.939 0.000*** Yes
***p<0.01 statistically significant difference between the households with food secure and insecure
Source: Field data (2018)

118
A Chi-square test carried out on the households’ responses indicated in Table 4.8 that
there was a highly significant variation in the responses among the households with food
security and households with food insecurity and the levels of households' satisfaction
with the aims of watershed governance in all the seven variables tested at p-value=0.000.
This finding revealed that household level of satisfaction with aims of watershed
governance was inherent in determining the household status of food security. Early
studies on perceptions of food secure and food insecure households on causes of poverty
found that statistically, a significant difference existed between food secure and food
insecure households and poverty (Grobler, 2016).
Drawing conclusions from early studies on the evaluation of farmer satisfaction with
agricultural extension services in Ethiopia (Elias et al., 2015) the primary beneficiaries’
satisfaction is vital in a number of ways. Apart from the beneficiaries having the right to
judge the performance of the level of watershed governance, as the end users and
implementers of the activities, the households have personal experiences with watershed
management and food insecurity challenges which are not shared by non-users of
watershed resources. Lastly, the sustainability of watershed governance and thus food
security initiatives ultimately are dependent on the willingness of the beneficiaries to
continue with their involvement. Therefore, assessing beneficiaries’ levels of satisfaction
has been at the centre of policy research (Ridaura et al., 2002) as an important indicator
of sustainability (Flores and Sarandon, 2004).
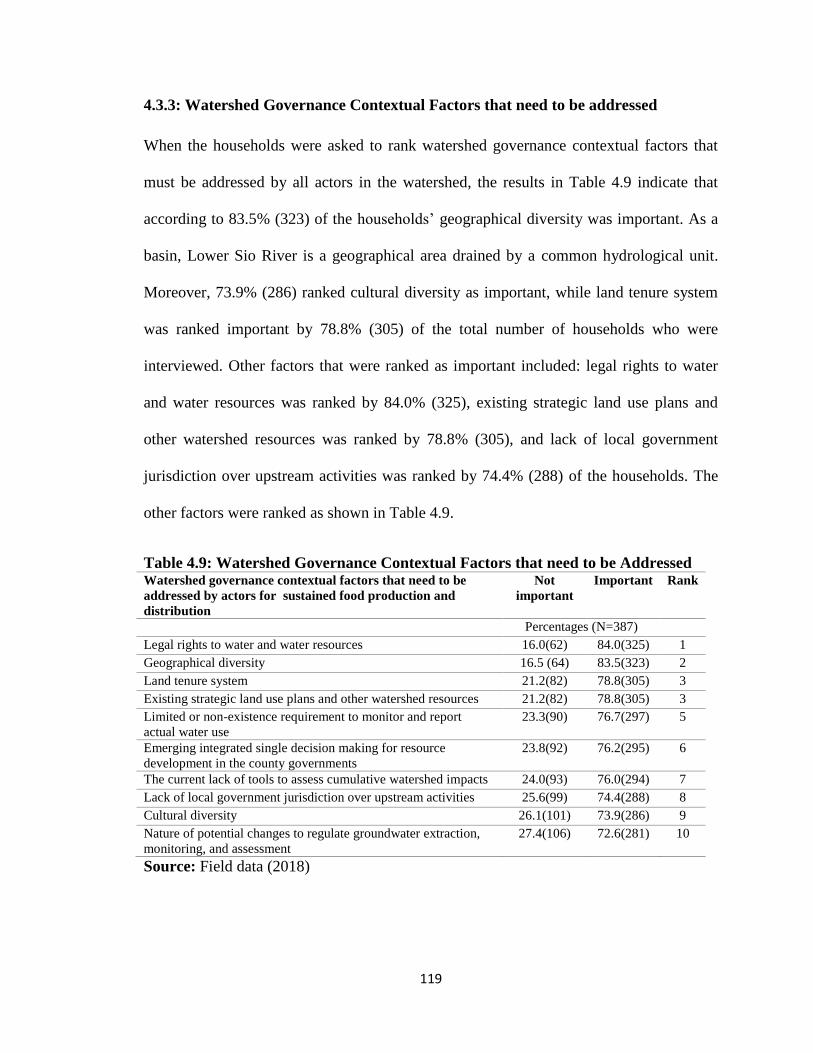
119
4.3.3: Watershed Governance Contextual Factors that need to be addressed
When the households were asked to rank watershed governance contextual factors that
must be addressed by all actors in the watershed, the results in Table 4.9 indicate that
according to 83.5% (323) of the households’ geographical diversity was important. As a
basin, Lower Sio River is a geographical area drained by a common hydrological unit.
Moreover, 73.9% (286) ranked cultural diversity as important, while land tenure system
was ranked important by 78.8% (305) of the total number of households who were
interviewed. Other factors that were ranked as important included: legal rights to water
and water resources was ranked by 84.0% (325), existing strategic land use plans and
other watershed resources was ranked by 78.8% (305), and lack of local government
jurisdiction over upstream activities was ranked by 74.4% (288) of the households. The
other factors were ranked as shown in Table 4.9.
Table 4.9: Watershed Governance Contextual Factors that need to be Addressed Watershed governance contextual factors that need to be
addressed by actors for sustained food production and
distribution
Not
important
Important
Rank
Percentages (N=387)
Legal rights to water and water resources 16.0(62) 84.0(325) 1
Geographical diversity 16.5 (64) 83.5(323) 2
Land tenure system 21.2(82) 78.8(305) 3
Existing strategic land use plans and other watershed resources 21.2(82) 78.8(305) 3
Limited or non-existence requirement to monitor and report
actual water use
23.3(90) 76.7(297) 5
Emerging integrated single decision making for resource
development in the county governments
23.8(92) 76.2(295) 6
The current lack of tools to assess cumulative watershed impacts 24.0(93) 76.0(294) 7
Lack of local government jurisdiction over upstream activities 25.6(99) 74.4(288) 8
Cultural diversity 26.1(101) 73.9(286) 9
Nature of potential changes to regulate groundwater extraction,
monitoring, and assessment
27.4(106) 72.6(281) 10
Source: Field data (2018)

120
Management of its watershed resources is a human action that is aimed at ensuring
sustainable use (FAO, 2007; 2017). This calls for an integrated ecosystem approach
based on the understanding of interactions between biotic and abiotic factors, upstream
and downstream users' interests. It also calls for understanding of inequalities among
communities in terms of their socio-economic status and their access to water and other
resources and services as a result of their geographical location addressed at watershed
level (FAO, 2017).
4.3.4: Households Perception on Driver for Collaborative Watershed-focused
approach and Food Security
The study further revealed (Table 4.10) that the majority (82.2%) (318) of the households
agreed that the demand for local domestic use water protection called for a more
collaborative watershed approach. However, 46.0% (178) of the households were
undecided whether threat of increasing water use along River Sio formed one of the main
drivers for a more collaborative approach to watershed governance. More so, 44.4%
(172) and 58.9% (228) of the households indicated that fiscal constraints on all levels of
government and institutional barriers that result from fragmented decision-making
respectively were main drivers for a need for a more collaborative watershed-focused
model in the Lower Sio River Basin. This finding is vital since the influence of attitudes,
subjective norms, and perceived behavioural control on the intentions of individuals to
undertake particular actions, is premised in understanding the social determinants of
human behaviour related to water resources, and for informing policies on watershed
management (Ajzen, 1991). It is worth to note that consideration of the perception of

121
households on their needs for collaborations in watershed management activities would
result in more ownership and participation in other actors' activities at a watershed level.
Table 4.10: Households perception on the need for a more collaborative watershed-
focused approach Driver for a collaborative watershed-focused
approach
Disagree Undecided Agree Rank
Percentages
(N=387)
The demand for local domestic use water protection 6.7 (26) 11.1(43) 82.2(318) 1
Concerns of fish and other water habitant protection 2.1(08) 20.2(78) 77.8(301) 2
Growing demand for citizens to have a viable voice in
watershed decision making
6.7(26) 18.9(73) 74.4(288) 3
Recognition of increasing water scarcity 3.6(14) 30.5(118) 65.9(255) 4
Institutional barriers that results from fragmented
decision-making
4.4(17) 36.7(142) 58.9(228) 5
Increasing uncertainty and conflicts among water users 5.9(23) 40.1(155) 54.0(209) 6
Threat of increasing water use along River Sio 4.1(16) 46.0(178) 49.9(193) 7
Fiscal constraints on all levels of government 7.5(29) 48.1(186) 44.4(172) 8
Source: Field data (2018)
Table 4.11 shows the significant differences using p-values generated from chi-square
test carried out on the drivers for more collaborative watershed-focused approach
variables and levels of households' food security. The findings indicate that out of the
nine drivers' items that were tested, only four showed the positive significant difference
between the households that were food secure and food insecure. These include; the
demand for local domestic use water protection (p-value=0.000), water pollution control
(p-value=0.087), recognition of increasing water scarcity (p-value=0.073), and growing
demand for citizens to have a viable voice in watershed decision making (p-value=0.000).
The results showed that the demand for local domestic use water protection, concerns of
fish and other water habitat protection, and the growing demand for citizens to have a
viable voice in watershed decision making had positive significant differences between
two types of households with food secure and food insecure (d=0.2; d=-0.1 and d=0.0
respectively p-value=0.000) at 99% level of confidence. In addition, fiscal constraints at

122
all levels of government were found to be significant d=-0.1; p-value=0.001. Further,
water pollution control and recognition of increasing water scarcity were found to be
significant with households’ food security (d=0.1; p-value=0.087 and d=0.2; p-
value=0.073) respectively at 90% level of confidence, meaning that these drivers were
mentioned most by food secure households.
Table 4.11: Food security and insecurity households’ measurement comparison
association amongst the drivers for a collaborative watershed-focused model
variables Variable
Food
Insecurity
(n=214)
Food
Security
(173)
Difference χ2 p-value Significant?
The demand for local
domestic use water
protection
3.0 3.1 0.2 20.125 0.000*** Yes
Water pollution control 3.0 3.2 0.1 8.122 0.087* Yes
Threat of increasing water
use along River Sio
2.5 2.6 0.0 2.383 0.666
Concerns of fish and other
water habitant protection
3.0 3.0 -0.1 25.513 0.000*** Yes
Recognition of increasing
water scarcity
2.8 3.0 0.2 8.573 0.073* Yes
Increasing uncertainty and
conflicts among water users
2.6 2.6 0.0 4.112 0.391
Growing demand for citizens
to have a viable voice in
watershed decision making
2.9 2.9 0.0 23.503 0.000*** Yes
Fiscal constraints on all
levels of government
2.5 2.4 -0.1 17.954 0.001*** Yes
Institutional barriers that
results from fragmented
decision-making
2.6 2.7 0.0 3.272 0.513
The overall score for attitudes towards watershed governance
Mean(SD) 69.43
(16.14)
70.57
(13.20)
1.1(-2.9) F=0.738 0.391 No
*p<0.1, ***p< 0.01 statistically significant difference between the households with food secure and
insecure Source: Field data (2018)
Furthermore, Table 4.11 shows that institutional barriers that result from fragmented
decision-making and increasing uncertainty under a multi-level decision-making structure
that has been occasioned by the current devolution in Kenya and conflicts among water
users that are currently being observed in the watershed were found to be insignificant to

123
the households' food security status. This is despite the fact that there exist numerous
regulations at the county and national level some conflicting as well as conflicts in the
use of water resources from the river as indicated in Chapter seven. Overall the mean
score for drivers for a collaborative watershed-focused model (d=1.1) had insignificant
difference thus conclusion that drivers in the collaborative watershed-focused model were
found to be insignificant in ensuring household food security in the Lower Sio River
Basin. Watershed management will not be successful because people talk about issues,
but because people use their power and influence to change others' beliefs, opinions, and
behaviour (Morton, 2011; Kristin et al., 2015). For effective watershed policy making it
is prudent to consider the mentioned drivers by either government agencies or non-
governmental agencies.
4.3.5: Households Perception on the need for Changes in Watershed Governance
Systems
When respondents were asked about necessary changes in watershed governance
systems, it was revealed that majority 86.3% (334) of the households as shown in Figure
4.5 needed changes in watershed governance to ensure water resources management was
treated as a public trust while 79.3% (307) felt that the changes were necessary to ensure
that new forms of governance were put in place that involved sharing of power or re-
scaling of decision making processes to the local level. In addition, 78.3% (303) of the
households were of the opinion that the changes were necessary to ensure a commitment
to a more holistic watershed management approaches in the Lower Sio River Basin.
Moreover, 65.9% (255) of the households also felt that change was needed for the
institutions that attempt to address the problem of fit between physical boundaries.

124
Overall 62.8% (243) of the households needed changes in watershed governance system
in the in the study area. This finding is in support for households call for adopting
systems in the governance of watershed resources. Evidence shows that systems with
high adaptive capacity are able to re-configure themselves when subject to change
without significant declines in crucial functions of the socio-ecological system (Koontz et
al., 2015).
Figure 4.5: Households Perception on the need for Changes in Watershed Governance
Systems
Source: Field data (2018)
In this study household, food insecurity was used as an indicator of unresponsive
watershed governance policies. Therefore, understanding of households' perception may
help to develop policies to promote watershed governance especially at river watersheds
in Kenya. Policy-makers both at the county and national government levels need to
understand the opinions of the public and any other involved stakeholders in order to
make well-informed decisions with a positive outcome. This is especially important in
N=387

125
the context of watershed management, where the watershed and a range of diverse
stakeholders may be affected (Borecki et al., 2016).

126
CHAPTER FIVE
ADAPTIVE CAPACITY OF STATE AND NON-STATE ACTORS IN
WATERSHED GOVERNANCE FOR SUSTAINABLE FOOD
SECURITY
5.1: Introduction
The study examined and described the status of adaptive capacity of state and non-state
actors based on Gupta et al. (2010) suggested variables. Therefore, the ability of
institutions to encourage the involvement of a variety of perspectives, actors and
solutions were examined. In addition, the ability of the institutions to enable social actors
to continuously learn and improve their institutions was also examined during the study.
Examination of other variables was based on the ability of the institutions to allow and
motivate social actors to adjust their behaviour alongside the ability to mobilize quality
leadership and resources for implementing adaptive measures at a watershed level.
Finally, the study examined the support principles of fair governance in watershed and
food activities in the Lower Sio River Basin.
5.2: Watershed Governance Goals
The results in Table 5.1 illustrate that majority 40.3% (156) of the households identified
water for nature while 20.2% (78) identified the whole system approaches as the main
watershed governance goal. In group discussions, it was indicated that there was no
collective and shared watershed governance goal in the Lower Sio River Basin. As a
result, 33.1% (128) of the households did not know or have any goals for watershed
governance. Individual watershed governance goals guided household initiatives that
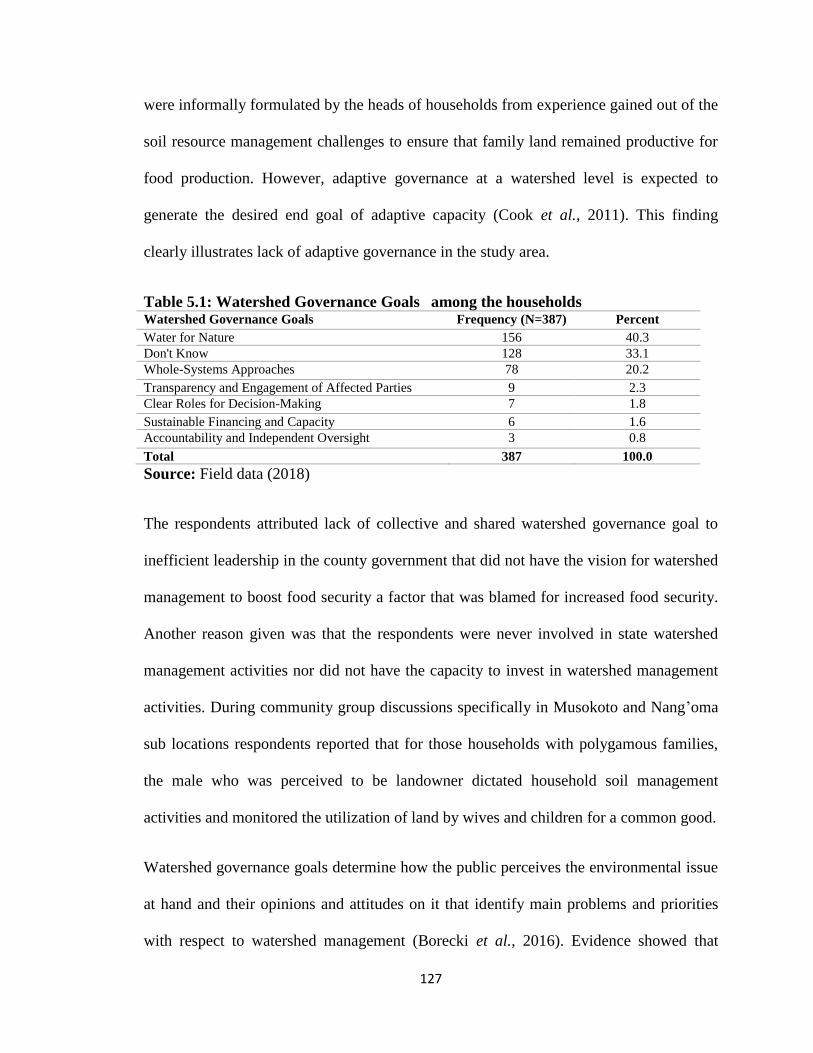
127
were informally formulated by the heads of households from experience gained out of the
soil resource management challenges to ensure that family land remained productive for
food production. However, adaptive governance at a watershed level is expected to
generate the desired end goal of adaptive capacity (Cook et al., 2011). This finding
clearly illustrates lack of adaptive governance in the study area.
Table 5.1: Watershed Governance Goals among the households Watershed Governance Goals Frequency (N=387) Percent
Water for Nature 156 40.3
Don't Know 128 33.1
Whole-Systems Approaches 78 20.2
Transparency and Engagement of Affected Parties 9 2.3
Clear Roles for Decision-Making 7 1.8
Sustainable Financing and Capacity 6 1.6
Accountability and Independent Oversight 3 0.8
Total 387 100.0
Source: Field data (2018)
The respondents attributed lack of collective and shared watershed governance goal to
inefficient leadership in the county government that did not have the vision for watershed
management to boost food security a factor that was blamed for increased food security.
Another reason given was that the respondents were never involved in state watershed
management activities nor did not have the capacity to invest in watershed management
activities. During community group discussions specifically in Musokoto and Nang’oma
sub locations respondents reported that for those households with polygamous families,
the male who was perceived to be landowner dictated household soil management
activities and monitored the utilization of land by wives and children for a common good.
Watershed governance goals determine how the public perceives the environmental issue
at hand and their opinions and attitudes on it that identify main problems and priorities
with respect to watershed management (Borecki et al., 2016). Evidence showed that

128
adaptation activities are more local (that is sub-county, regional or national) issues rather
than international (Paavola et al., 2005; Parry et al., 2005). Therefore, ensuring that
national and county department’s watershed management goals are owned at the
household level will translate to adaptive behaviour. According to Adger (2003),
promoting resilience in any socio-ecological system means changing, in particular, the
nature of decision-making to recognize the benefits of autonomy and new forms of
governance in promoting social goals, self-organization, and the capacity to adapt.
5.3: Aims for Watershed Governance and Households Food Security
With respect to the aims of watershed governance, 40.1% (155) of the households
identified enhancing water-use efficiency, conservation and improving management. On
the other hand, 36.4% (141) reported protecting and enhancing ecological health and
functions including food production as the aim that guided household activities in the
watershed. Moreover, 25.1% (97) of the household reported that the aim of watershed
governance was to create social resilience to adapt to a changing climate as illustrated in
Figure 5.1. According to Pahl-Wostl (2009) an adaptive institution is able to cope with
multiple ambiguous objectives inherent in such social-ecological systems. It is evident
that lack of a clear collective aim in the watershed resulted in fragmented interventions
that could not result in cumulative positive impact.

129
Figure 5.1: Aims for watershed governance in the Lower Sio River Basin
Source: Field data (2018)
A Chi-square test carried out on the responses as shown in Table 5.2 indicated that there
was a highly significant variation among the responses of households with food security
and households with food insecurity on the following aims of watershed governance:
creating social resilience to adapt to a changing climate, and clarifying roles and
responsibilities at p-value=0.000; enhancing water-use efficiency and conservation and
improving management at p-value=0.010. This implied that the three watershed
governance aims according to the households were important predictor of the status of
food security in the watershed. Having a collective watershed governance aim is inherent
since the public might underestimate the value of watershed protection because they
cannot physically see all the aspects related to it (Borecki et al., 2016). On contrary, the
aims of watershed governance including; involving local expertise and resources,
protecting, enhancing ecological health and functions including food production, and
reducing or avoiding watershed related conflicts one of the main functions that WRUAs
N=387
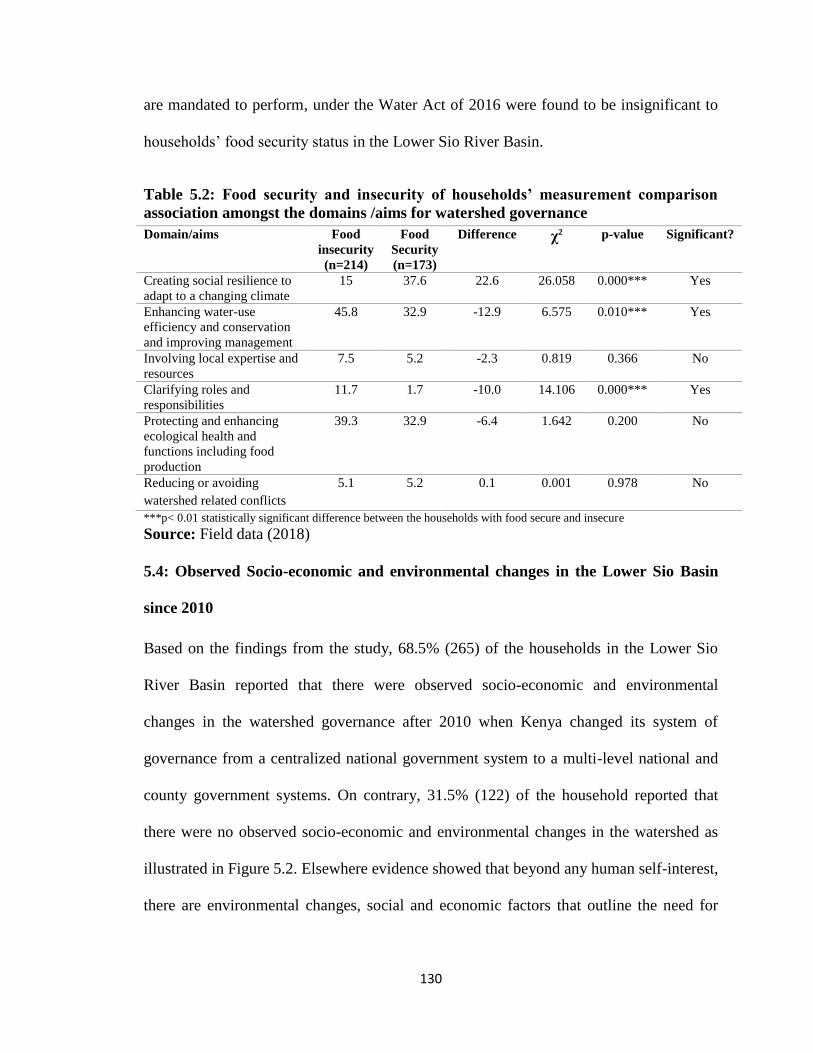
130
are mandated to perform, under the Water Act of 2016 were found to be insignificant to
households’ food security status in the Lower Sio River Basin.
Table 5.2: Food security and insecurity of households’ measurement comparison
association amongst the domains /aims for watershed governance
Domain/aims Food
insecurity
(n=214)
Food
Security
(n=173)
Difference χ2 p-value Significant?
Creating social resilience to
adapt to a changing climate
15 37.6 22.6 26.058 0.000*** Yes
Enhancing water-use
efficiency and conservation
and improving management
45.8 32.9 -12.9 6.575 0.010*** Yes
Involving local expertise and
resources
7.5 5.2 -2.3 0.819 0.366 No
Clarifying roles and
responsibilities
11.7 1.7 -10.0 14.106 0.000*** Yes
Protecting and enhancing
ecological health and
functions including food
production
39.3 32.9 -6.4 1.642 0.200 No
Reducing or avoiding
watershed related conflicts
5.1 5.2 0.1 0.001 0.978 No
***p< 0.01 statistically significant difference between the households with food secure and insecure
Source: Field data (2018)
5.4: Observed Socio-economic and environmental changes in the Lower Sio Basin
since 2010
Based on the findings from the study, 68.5% (265) of the households in the Lower Sio
River Basin reported that there were observed socio-economic and environmental
changes in the watershed governance after 2010 when Kenya changed its system of
governance from a centralized national government system to a multi-level national and
county government systems. On contrary, 31.5% (122) of the household reported that
there were no observed socio-economic and environmental changes in the watershed as
illustrated in Figure 5.2. Elsewhere evidence showed that beyond any human self-interest,
there are environmental changes, social and economic factors that outline the need for

131
effective management strategies and sustainable water-land systems (Parkes et al., 2010;
Borecki et al., 2016).
Figure 5.2: Socio-economic and environmental changes observed since 2010
Source: Field data (2018)
According to Cooper et al., (2011), in East Africa farmers have continued to experience
rainfall variability thus the farming systems have not been static. Therefore, farmers have
been testing and adopting new agricultural practices some of which have contributed to
soil and water conservation with the aim of addressing the negative impacts of climate
change. Patt et al. (2012) noted that changes in agricultural practices among the farmers
in East Africa include: improved crop, soil, land, water and livestock management
systems, such as introducing crop cover, micro-catchments, ridges, rotations, improved
pastures, planting trees, and new technologies such as improved seeds, shorter cycle
varieties, and drought tolerant crop varieties.
Socio-ecological changes in a watershed are realized at the household and community
level; however, they are likely to differ across watersheds based on the differences in
outcomes that depend on the specific socio-economic, institutional and biophysical
factors. Figure 5.3 depicts socio-economic and environmental changes that the
N=387
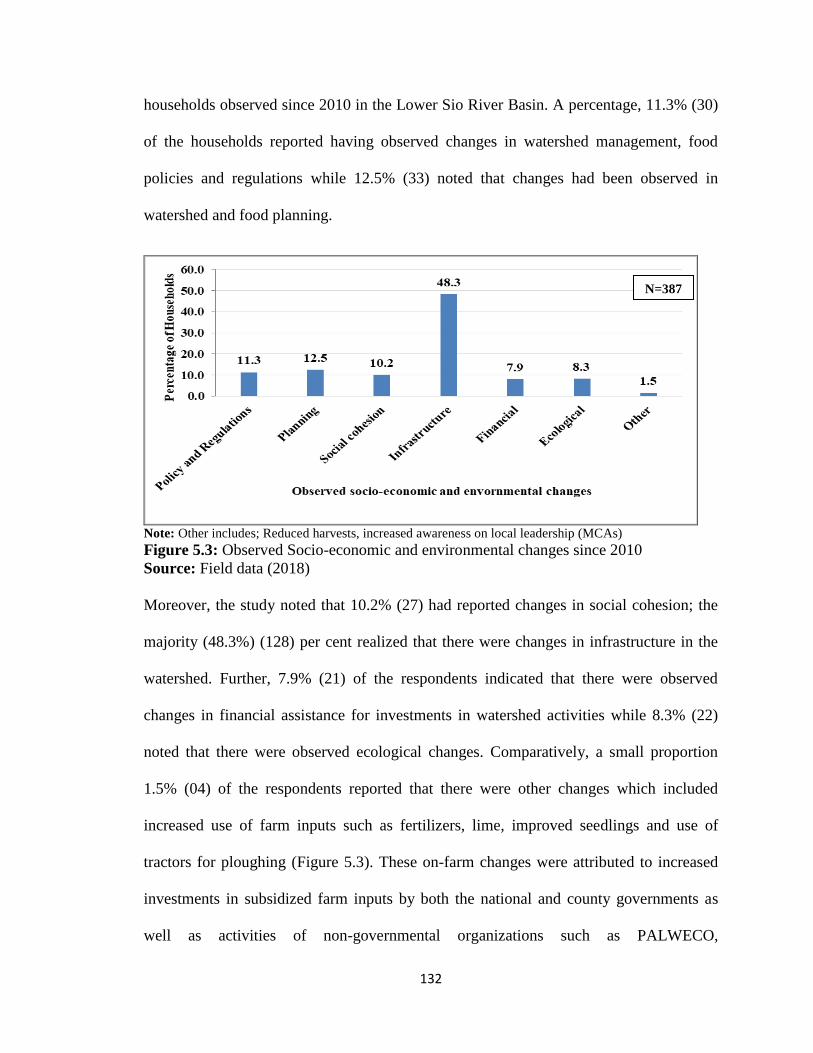
132
households observed since 2010 in the Lower Sio River Basin. A percentage, 11.3% (30)
of the households reported having observed changes in watershed management, food
policies and regulations while 12.5% (33) noted that changes had been observed in
watershed and food planning.
Note: Other includes; Reduced harvests, increased awareness on local leadership (MCAs)
Figure 5.3: Observed Socio-economic and environmental changes since 2010
Source: Field data (2018)
Moreover, the study noted that 10.2% (27) had reported changes in social cohesion; the
majority (48.3%) (128) per cent realized that there were changes in infrastructure in the
watershed. Further, 7.9% (21) of the respondents indicated that there were observed
changes in financial assistance for investments in watershed activities while 8.3% (22)
noted that there were observed ecological changes. Comparatively, a small proportion
1.5% (04) of the respondents reported that there were other changes which included
increased use of farm inputs such as fertilizers, lime, improved seedlings and use of
tractors for ploughing (Figure 5.3). These on-farm changes were attributed to increased
investments in subsidized farm inputs by both the national and county governments as
well as activities of non-governmental organizations such as PALWECO,
N=387

133
WKCDD/FMP, One Acre Fund and Hand in Hand East Africa. These organizations were
reported to offer inputs to farmers’ groups on credit.
According to Gebregziabher et al., (2016), successful watershed management in Abraha-
Atshaba, Kereba and Goho-Cheri watersheds in Ethiopia revealed that changes such as
enhanced biophysical conditions that led to increased water availability, reduced
downstream flooding and siltation, reduced water pollution and increased irrigation were
more visible at the community level. In addition, socioeconomic benefits such as
diversified income sources, increased recreational opportunities, strengthening of
community institutions, better conflict mitigation capacity and improved food security
status emerged due to successful watershed management interventions. Unlike in the
Lower Sio River Basin, the study expected similar socio-ecological changes to be
reported by the households, since there has been a major shift in socio-ecological
governance in Kenya since the year 2010 occasioned by constitutional reforms.
5.5: Watershed Governance Conditions
During the study, respondents were asked to identify watershed governance conditions
that were present or absent that contributed to household’s adaptation to social, economic
and environmental changes observed. The results show in Table 5.3 that 30% (116) of the
respondent acknowledged that collective grassroots by-laws were absent. Out of the
interviewed respondents, only 21.2% (82) recognized the presence of collective
grassroots by-laws while 17.8% acknowledged the presence of traditional and cultural
values systems that were vital in the households’ adaptation to social, economic and
environmental conditions experienced in the Lower Sio River Basin.

134
On the other hand, 6.2% (24) of the respondents identified the presence of co-
management with other international actors in watershed management while 8.0% (31)
reported the absence of long-term funding for adaptive watershed management activities.
Moreover, 7.2% (28) observed that a functional legal framework for sustainable
watershed management was lacking in the study area. According to listed watershed
governance conditions, none of the conditions was identified to be present by 50% and
more respondents. Consequently, examination of Brandes and O'Riordan (2014) nine
winning conditions for watershed governance systems showed the Lower Sio River Basin
lacked watershed governance to enrich households’ adaptive capacity towards food
security. According to Candel (2014), governance systems characterized by conflicts,
lack of institutional capacity, poor policy design, and lagging implementation can inflict
serious harm to the production and distribution of healthy food.
Table 5.3: Watershed Governance Conditions Present Watershed governance conditions % reported present
n=285
% reported
absent
n=410
Grass-root by-laws 21.2 (82) 30.0 (116)
Traditional/cultural value systems 17.8 (69) 8.0 (31)
Continuous peer to peer learning and capacity building 8.5 (33) 4.7 (18)
Co- management with other international actors 6.2 (24) 4.4 (17)
Independent oversight and public reporting 4.9 (19) 4.1 (16)
Support from and partnership with local government 4.1 (16) 13.4 (52)
Enabling powers in county/national legislation for
watershed entities
3.9 (15) 8.8 (34)
The mechanism for interaction between upstream and
downstream water users
1.8 (07) 6.5 (25)
Availability of data, information and monitoring 1.8 (07) 5.9 (23)
A functional legal framework for sustainable watershed
management
1.3 (05) 7.2 (28)
Sustainable long-term funding 1.0 (04) 8.0 (31)
Assessing cumulative impact 1.0 (04) 4.9 (19)
Note: Reported present weighted average = 0.211886305
Reported absent weighted average =0.299741602
Source: Field data (2018)

135
5.6: Knowledge on Watershed Governance Structures and Households Food
Security
In order to regulate people's behaviour and activities in the watershed, the study assessed
households' knowledge of the structures that existed that could govern peoples' watershed
management actions to adapt to socio-ecological changes. The findings in Table 5.4 show
that a small portion 25.3% (98) of the households understood that there were water
resources management plans while 12.9% (50) understand that there were water resource
laws and regulations that guided the households’ activities in the watershed. However,
only 1.6% (06) of the total households in the watershed understood that there were water
resources monitoring frameworks in the watershed. On contrary, 17.3% (67)
acknowledged that cultural value such as community norms and beliefs guided
households’ watershed management activities. Further, 27.9% (108) understood that
other non-formal structures such as household heads rule and religious values existed to
guide utilization of watershed resources such as land.
Table 5.4: Watershed Governance Structures Watershed governance structures Frequency (n=430) Percent of HH
Other specify 108 27.9
Water resources management plans 98 25.3
Cultural values systems 67 17.3
Water resources laws and regulations 50 12.9
Water resources policies 46 11.9
Water resource institutions 34 8.8
Water resources financial budgets 12 3.1
Transparency and accountability means 9 2.3
Water resources monitoring frameworks 6 1.6
Total 430
Note: Others include; Household head (family) rules and religious values
Source: Field data (2018)
The low number of households who answered this question was also attributed to the
households understanding of what constituted watershed governance structure. Therefore,

136
the majority of respondents did not identify any governance structure due to low levels of
knowledge and participation in watershed governance structures. Studies in governance
revealed that a range of institutions and relationships involved in the process of
governing encompasses both formal institutions such as laws, policies, organizational
structures, and informal institutions (Huitema et al., 2007) such as traditional and
religious values, norms and beliefs.
Contrary to the intended purpose of watershed policies, the households who identified the
existence of water resources regulations also indicated that laws such as Wildlife
Conservation and Management Act (2013) and riparian buffer zone regulations hindered
household food production initiatives. An example given was that the Wildlife
Conservation and Management Act (2013) prohibited the killing of monkeys which were
a problem of food destruction in their farms. On the other hand, the riparian 30 meters’
buffer regulation was said to be a hindrance to households’ food production because most
of the farmlands had been eroded and fertile lands were reported to exist along the buffer
zones. This showed that the households did not understand the importance of the laws in
watershed governance. Therefore, social information is needed to understand and
segment target households to develop effective messages and policy tools to support
behaviour change (Kristin et al., 2015).
Table 5.5 shows the significant differences using p-values generated from Chi-square
tests between watershed governance structure variables and levels of food security. The
findings indicated that, out of the nine watersheds governance structures, items that were
tested, only four showed positive statistically significant difference between the
households with food secure and insecure. They included: Water resources management

137
plans (p-value=0.000); Water resource institutions (p-value=0.001); Water resources
policies (p-value=0.000); and other (family rules and religious values) (p-value=0.000).
Food security cannot be realized by means of idealistic plans or new technologies only. It
requires advanced steering strategies that involve governments as well as companies,
NGOs and citizens (Kropff et al., 2013). This calls for the involvement of all
stakeholders at the watershed level in formulation and implementation of watershed
governance structures.
Table 5.5: Food security and insecurity of households’ measurement comparison
association amongst the watershed governance structures Governance
structure
Food
Insecurity
(n=214)
Food
Security
(n=173)
Difference χ2 p-value Significant?
Water resources
management plans
7.9 46.8 38.9 76.459 0.000*** Yes
Water resources laws
and regulations
13.6 12.1 -1.5 0.170 0.680 No
Water resources
monitoring
frameworks
0.9 2.3 1.4 1.189 0.275 No
Water resources
financial budgets
3.3 2.9 -0.4 0.046 0.830 No
Water resource
institutions
4.7 13.9 9.2 10.104 0.001*** Yes
Water resources
policies
18.2 4.0 -14.2 18.361 0.000*** Yes
Transparency and
accountability means
2.3 2.3 0.0 0.000 0.987 No
Cultural values
systems
17.3 17.3 0.0 0.000 0.989 No
Other specify 40.2 12.7 -27.5 35.881 0.000*** Yes
The overall score for the watershed governance structure
Mean(SD) 12.05
(3.92)
12.72
(4.75)
0.7 (0.8) F=8.636 0.003***
Yes
***p< 0.01 statistically significant difference between the households with food secure and insecure
Note: Others include; Household head (family) rules and religious values
Source: Field data (2018)
Results showed that watershed governance structures including water resources laws and
regulations, monitoring frameworks, financial budgets, and means of ensuring
transparency and accountability and cultural value systems were found to be insignificant

138
in determining the households’ food security status. This is despite the fact that
households in focus group discussions had indicated that failure in implementation of
formal laws and regulations, left them to rely on indigenous knowledge in maintaining
the farms for food production. However, positive results showed that water resource
management plans showed significant differences between two types of households i.e.
with food secure and food insecure (d=38.9; p-value=0.000), while water resource
institutions had positive significant differences with food security (d=9.2; p-
value=0.001). On the other hand, water resources policies were found to have a negative
significance difference with food security (d=-14.2; p-value=0.000), implying that more
households with food insecurity reported that water resources policies were present than
those with food secure.
In addition, other watershed structures which included group bylaws which were found to
have a positive significance with food security (d=-27.5; p-value=0.000), meaning that
other watershed structures were mentioned most by food insecure households. Overall the
mean score for watershed governance structure (d=0.7) had significantly different at p-
value=0.003. Consequently, the mean score difference among food security households
and food insecurity households was enough to conclude that watershed governance
structures were significant in ensuring the adaptive capacity of households towards food
security in the Lower Sio River Basin. These institutions at the watershed level could
provide more effective solutions to collective action problems than centrally mandated
institutions because they foster local knowledge, the inclusion of participants, better-
adapted rules, and lower enforcement costs (Ostrom, 1990). This implied the need for
institutional strengthening to improve watershed governance based on the analysis of
139
policy and institutional challenges, and support system for strategic planning and
institutional coordination processes alongside creating incentives for multi-stakeholder
dialogue and action platforms (FAO, 2017).
5.7: Drivers to Watershed Destruction and Households Food Security
The study results showed that there were several drivers of watershed destruction in the
Lower Sio River Basin which were well known to the households. About, 68.2% (264) of
the households were aware that unsustainable farming practices were responsible for
watershed destruction. This was emphasized during key informants’ interviews, focus
group discussion and review of plans; it was revealed that an unsustainable farming
practice for purposes of increasing food production was the main contributing factor to
households’ destruction of soil and water resources in the watershed. Low public
knowledge on watershed management was identified by 53.7% (208) whereas non-
implementation and enforcement of existing laws were identified by 34.1% (132) of the
households.
Other reasons included lack of information and early warning system which was
identified by 32.0% (124) of the respondent while lack of financial resources for
investment in watershed management activities was mentioned by 28.2% (109).
Moreover, the collapse of the traditional watershed management systems was a driver to
watershed destructions identified by 9.6% (37) of the respondents. Other causes of
watershed destruction reported by 6.7% (26) included neighbours conflicts and lack of
ownership of watershed resources management among community members in the
watershed as presented in Figure 5.4. Kagombe et al. (2018) concluded that lack of

140
awareness among the community members on the importance of conservation of
catchment areas negatively influenced farmers’ utilization of watershed resources.
Note: Other includes; lack of means of ensuring social accountability, negligence from the public Figure 5.4: Drivers to Watershed Destruction in the Lower Sio River Basin
Source: Field data (2018)
Earlier studies by Aloo (1993) and Namenya (2012) in Funyula Constituency found that
it was difficult for landowners in the hilly areas to plant trees or rehabilitate eroded hilly
areas due to lack of financial, labour and other resources. Further in the study, 80% of the
households in non-hilly areas revealed that they practiced own initiatives in watershed
management whose activities included; terraces, drainage ditches, live fencing of
homesteads. These activities were reported to be based on community's indigenous
knowledge (Namenya, 2012).
Further, a Chi-square test carried out on households’ responses shown in Table 5.6
indicated a highly significant variation in the responses among the households with food
security and food insecurity and the three drivers of watershed destructions namely:
unsustainable farming practices at p-value=0.000; low public knowledge in watershed
N=387

141
management at p-value=0.004; and others at p-value=0.007. In addition, real variation
was noted on lack of financial resources for investment in watershed management at p-
value=0.027. These implied that the four drivers of watershed destruction were important
in determining the status of households' food security in the watershed. The study found
out that non-implementation of existing laws, lack of information and early warning
systems to weather changes and the collapse of traditional systems drivers to watershed
destruction were insignificant determining households' food security status in the study
area.
Table 5.6: Food security and insecurity of households’ measurement comparison
association amongst the drivers to watershed destruction Drivers to watershed
destruction
Food
insecurity
(n=214)
Food
Security
(n=173)
Difference χ2 p-value Significant?
Unsustainable farming
practices
60.3 78 17.7 13.91 0.000*** Yes
Non-implementation and
reinforcement of existing laws
35.5 32.4 -3.1 0.421 0.517 No
Low public knowledge in
watershed management
60.3 45.7 -14.6 8.220 0.004*** Yes
Lack of information and early
warning systems
29.9 34.7 4.8 1.002 0.317 No
Lack of financial resources for
investment in watershed
management
32.7 22.5 -10.2 4.887 0.027** Yes
The collapse of traditional
systems
32.7 22.5 -10.2 1.515 0.218 No
Others specify 9.8 2.9 -6.9 7.316 0.007*** Yes
**p<0.05 ***p< 0.01 statistically significant difference between the households with food secure and insecure
Note: Other includes; lack of means of ensuring social accountability, negligence from the public
Source: Field data (2018)
Watershed destruction hinders the adaptive capacity of ecosystems and rural poor
communities whose livelihoods are largely dependent on ecosystem services for
agricultural production. Available evidence indicated that reduced water flow, watersheds
and catchment forest degradation were mainly due to failures in watershed governance
(Yong et al., 2003; Franks et al., 2011; Brandes, 2005; Makarius et al., 2015). Plate 5.1

142
shows evidence of watershed resources degradation due to ineffective watershed
governance in the Lower Sio River Basin.
Plate 5.1: Watershed resources degradation due to ineffective watershed governance in the Lower
Sio River Basin
Source: Field data (2018)
Consequently, it is necessary that adaptation is undertaken by governments on behalf of
society, sometimes in anticipation of change, but, again in response to individual events.
At any level, adaptation proceeds through two main steps: facilitation and
implementation (Klein, 2004). Whereas the former involves raising awareness, removing
barriers and making funds available for adaptive strategies, the latter involves making
physical operational changes in practice and behaviour (Paavola and Adger, 2005; Parry

143
et al., 2005). Furthermore, watershed governance focuses on improving decision-making
in a more inclusive framework, achieving sustainable, healthy watersheds and the flow of
benefits from them (Makarius et al., 2015).
5.8: Factors that Contribute to Public Involvement in Watershed Management
The study assessed factors that contributed to the public involvement in watershed
management activities. This was done by respondents ranking the factors in order of
importance to their participation. Based on the findings the need to increase or sustain
food production at the household level was highly ranked as an important factor for
watershed management by 86.8% (336) of the households. Availability of financial
resources was ranked second as important by 79.6% (308) of the households while
adequate knowledge and expertise were ranked as important by 70.0% (271) of the
interviewed households as shown in Table 5.7.
Table 5.7: Factors that contribute to public involvement in watershed management
activities Watershed Management factors Ranking scale ( Percentage (N=387)
Not
Important
Important Rank Don’t Know
Need to increase or sustain food production 2.3 (09) 86.8 (336) 1 10.9 (42)
Availability of financial resource 0.8 (03) 79.6 (308) 2 19.6 (76)
Adequate knowledge and expertise 1.0 (04) 70.0 (271) 3 28.9 (112)
Good leadership that promotes activities 2.8 (11) 69.8 (270) 4 27.4 (106)
Local watershed policies, laws, plans 3.1 (12) 67.2 (260) 5 29.7 (115)
Collaborations and partnership with other actors 1.6 (06) 60.2 (233) 6 38.2 (148)
Traditional/cultural values systems 7.0 (27) 57.9 (224) 7 35.1 (136)
Local political will and support 7.2 (28) 57.6 (223) 8 35.1 (136)
Working with research institutions 2.8 (11) 50.1 (194) 9 47.0 (182)
Availability of early warning systems 7.2 (28) 49.9 (193) 10 42.9 (166)
Clear conflict resolution framework 3.6 (14) 49.6 (192) 11 46.8 (181)
Source: Field data (2018)

144
Other watershed management factors ranked as important by the households included;
good leadership that promotes watershed management activities ranked as important by
69.8% (270), local watershed policies, laws and plan ranked as important by 67.2%
(260), and collaborations and partnership with other actors ranked as important by 60.2%
(233). The absence of the listed factors would mean that households in the watershed
could not effectively participate in watershed management and food security activities.
Makarius et al. (2015) noted that for effective and efficient watershed governance at any
level, there were a number of management components that must be fulfilled. These
included actual integration of economic and environmental objectives within the
watershed context; integration of policies, programs and protocols which guide outcome-
based planning, monitoring and enforcement; and, effective and efficient delivery of
watershed services through the development of high-performance public and private
organizational structures.
According to the study by Namenya (2012) on watershed management approaches and
CDF in Funyula sub-county, it was found that 40.7% of the households in Funyula Sub-
county were members of watershed user groups and felt that the existing social groups
and institutions in the watershed were the focal point for watershed management
activities. Thus, Young (1999) noted that, though a number of physical, social and
cultural factors influenced the watershed management, institutions understood as a
patterned behaviour of the social group over a period of time constituted a cross-cutting
factor and a particular driving force in watershed decision making (Young, 1999;
Namenya, 2012).

145
5.9: Public Participation in Watershed Management Plans, Policies and
Programmes and Households Food Security
The results in Figure 5.5 illustrate stages of participation of the households in watershed
management policies, plans, and programmes at the grassroots level. The findings
indicate that majority 87.3% (338) of the households did not participate in any way in the
watershed and food security policies, plans and programmes organized by either state or
other non-state actors in the Lower Sio River Basin. A study by Joshua et al. (2015) on
changes in the adaptive capacity of Kenyan fishing communities, revealed that people
with least participation in decision making had lower occupational multiplicity, trust and
social capital making them socially and politically marginalized with the lowest adaptive
capacity. Further, the study noted that, the households who did not participate in
decision-making had limited chances to influence soil and water resource governance, in
addition to being least able to respond to negative effects.
Figure 5.5: Stages of participation in watershed management plans, policies and
Programmes
Source: Field data (2018)
N=387

146
On the contrary, 4.7% (18), and 4.9% (19) of the households indicated to have
participated in the policy and plans formulation and implementation level respectively
while 3.1% (12) of the households indicated that they were involved in monitoring and
evaluation of the policies, plans and programmes related to watershed management and
food security. It is important to involve the beneficiaries at different levels of the
watershed governance programmes to enhance adaptive capacity. Even during this era of
the national and county governments in Kenya, as earlier observed by Lemma et al.
(2011), the approach to watershed extension service delivery remains top-down with
issues of accountability mainly flowing upwards.
During focus group discussions, it was reported that those who were involved either at
formulation, implementation or monitoring and evaluation were either grassroots national
and county government staff, local administrators or leaders representing civil society
organizations and the households who were closely related to the county government
staff. The discussion further revealed that mode of public participation used by the county
government was not inclusive since community avenues such as worshipping centres,
burial and funeral ceremonies, weddings and market days were neglected as avenues to
involved most people in the processes of policy making and planning.
A Chi-square test carried out on households’ responses shown in Table 5.8 revealed that
there was a significantly real variation at p-value=0.047 among the households with food
security and households with food insecurity and households’ involvement in the
monitoring of watershed policies and plans.

147
Table 5.8: Food security and Insecurity households’ measurement comparison
association amongst the stages of participation in various watershed policies and
plans
Stage of
Policy/plan
Food
insecurity
(n=214)
Food
Security
(n=173)
Difference χ2 p-value Significant?
Formulation 45.5 72.2 26.7 2.078 0.149 No
Implementation 72.7 61.1 -11.6 0.408 0.523 No
Monitoring 18.2 55.6 37.4 3.932 0.047** Yes
**p<0.05 statistically significant difference between the households with food secure and insecure
Source: Field data (2018)
This implied that households' involvement in the monitoring of the watershed policies
and plan contributed significantly to the status of households' food security in the
watershed. However, the study did not establish any significant variations among the
households with food secure and food insecure and their involvement in formulation and
implementation of watershed management and food security policies, plan and
programmes.
A study by Kristin et al., (2015) observed that it is vital for watershed management
projects to determine at the outset the degree of power they are able to extend to
stakeholders at each stage of planning and implementation. Failure to which perceptions
of trust, legitimacy and fairness could be quite negative if stakeholders expect greater
power in implementation of decision making that could reasonably be afforded by
watershed managers. On the other hand, embracing constitutional ideals, such as
devolution and participation as well as the promotion of discourse of good governance,
provides a further impetus for changes in natural resource management policy in Kenya.
Exclusionary natural resources policies both at county and national levels are viewed as
undemocratic and incompatible with the goals of participatory democracy in devolution,
accountability, transparency and efficiency that are promoted by the discourse of good
148
governance. According to Foerster (2011), adaptive institutions are necessary to move
towards sustainability outcomes because of their ability to adjust participation from
multiple stakeholders with multiple interests that evolve over time.
Interviews with the county government officers indicated that most households in the
watershed did not participate in meeting forums called and organized by the county
government departments because people expected monetary reimbursement which was
not offered. The public labeled the meetings as Member of the County Assembly (MCAs)
meetings and not their public meetings. As noted by Brennan (2005), people are more
likely to accept solutions that are consistent with their local situation and culture.
Therefore, it is important that beneficiaries in the different watershed and food security
activities engage in planning to evaluation of the policies, plans and programmes.
Watershed governance also features stakeholders input and knowledge generation,
objectives setting management planning, monitoring implementation and incremental
plan adjustment in the face of uncertainty (Engle et al., 2011).
A study by Schwilch et al., (2009) showed that through the policy-making workshops,
different stakeholder groups have the opportunity to express their opinions and learn
about others’ opinions. This is an important step towards building a common vision of
what needs to be done. Through participation, social learning necessary for individual
adaptive capacity is stimulated, the participants realize that it is possible to collectively
agree on the best way to manage their watershed resources and importantly involve
different stakeholders in decision making because they have much to learn from one
another (Fiona et al., 2013). Furthermore, participatory approaches are considered an
important aspect of improving extension services provided to farmers to improve

149
accountability and increase transparency in organizational performance (Elias et al.,
2015).
5.10: Governance Values observed and Household Food Security
Based on the results, majority 50.6% (196) of the households did not know any
governance values in the watershed. Only 8.8% (34) of the household were aware that
there were governance values to be observed in the watershed. On the other hand, 40.6%
(157) indicated that there was lack of governance values in the watershed as illustrated in
Figure 5.6.
Figure 5.6: Awareness of Existence of Watershed Governance Values
Source: Field data (2018)
Evidence from studies carried out by FAO recommended that careful consideration must
be given to designing mechanisms that ensure social inclusiveness and equitable
representation of all watershed stakeholders, including socially and economically
disadvantaged groups in planning and decision making processes (FAO, 2017). Further,
from the study, those who reported the presence of watershed governance values in the
watershed indicated observation of accountability, transparency, legitimacy,
N=387
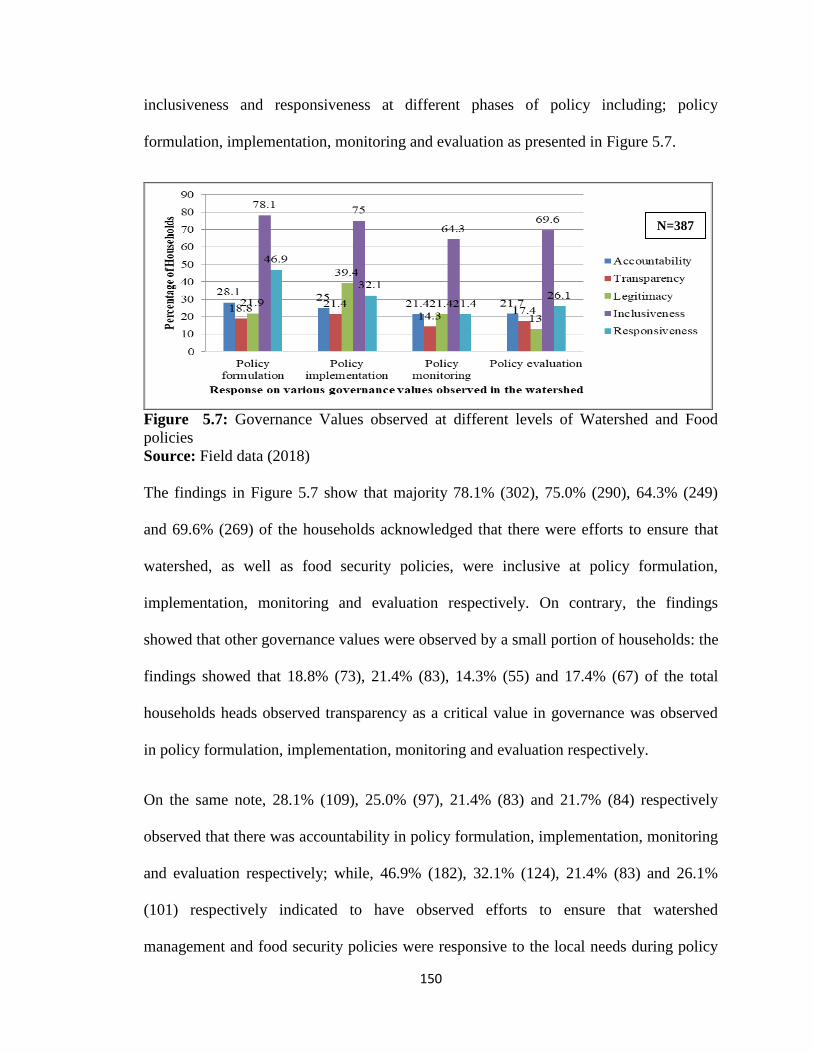
150
inclusiveness and responsiveness at different phases of policy including; policy
formulation, implementation, monitoring and evaluation as presented in Figure 5.7.
Figure 5.7: Governance Values observed at different levels of Watershed and Food
policies
Source: Field data (2018)
The findings in Figure 5.7 show that majority 78.1% (302), 75.0% (290), 64.3% (249)
and 69.6% (269) of the households acknowledged that there were efforts to ensure that
watershed, as well as food security policies, were inclusive at policy formulation,
implementation, monitoring and evaluation respectively. On contrary, the findings
showed that other governance values were observed by a small portion of households: the
findings showed that 18.8% (73), 21.4% (83), 14.3% (55) and 17.4% (67) of the total
households heads observed transparency as a critical value in governance was observed
in policy formulation, implementation, monitoring and evaluation respectively.
On the same note, 28.1% (109), 25.0% (97), 21.4% (83) and 21.7% (84) respectively
observed that there was accountability in policy formulation, implementation, monitoring
and evaluation respectively; while, 46.9% (182), 32.1% (124), 21.4% (83) and 26.1%
(101) respectively indicated to have observed efforts to ensure that watershed
management and food security policies were responsive to the local needs during policy
N=387

151
formulation, implementation, monitoring and evaluation respectively. Furthermore,
21.9% (85), 39.4% (152), 21.4% (83) and 13.0% (50) of the respondents observed that
there was legitimacy in watershed management and food security policies at policy
formulation, implementation, monitoring and evaluation processes respectively. Failure
to realize the governance values in the study area is an indication of ineffective watershed
governance that results in a low adaptive capacity of stakeholders.
Table 5.9: Food security and Insecurity households’ measurement comparison
association amongst the governance values at stage of policy/plan
Governance values at
phases of Policy/Plan
Food
insecurity
(n=214)
Food
Security
(n=173)
Difference χ2 p-value Significant?
Formulation
Accountability 66.7 13.0 -53.7 9.201 0.002*** Yes
Transparency 33.3 13.0 -20.3 1.748 0.186 No
Legitimacy 44.4 13.0 -31.4 3.732 0.053* Yes
Inclusiveness 55.6 87.0 31.4 3.732 0.053* Yes
Responsiveness 44.4 47.8 3.4 0.030 0.863 No
Implementation
Accountability 50.0 18.2 -31.8 2.545 0.111 No
Transparency 33.3 18.2 -15.1 0.643 0.423 No
Legitimacy 100.0 22.7 -77.3 11.802 0.001*** Yes
Inclusiveness 50.0 81.8 31.8 2.545 0.111 No
Responsiveness 16.7 36.4 19.7 0.839 0.360 No
Monitoring and Evaluation
Accountability 0.0 26.1 26.1 1.660 0.198 No
Transparency 0.0 17.4 17.4 1.014 0.314 No
Legitimacy 20.0 21.7 1.7 0.007 0.932 No
Inclusiveness 40.0 69.6 29.6 1.564 0.211 No
Responsiveness 40.0 17.4 -22.6 1.247 0.264 No
*p<0.1, ***p< 0.01 statistically significant difference between the households with food secure and insecure
Source: Field data (2018)
A Chi-square test carried out on the households’ responses presented in Table 5.9
indicated that there was a highly significant variation among households with food
security and households with food insecurity with accountability at policy and plan
formulation phase at p-value=0.002 and legitimacy at policy and plan implementation

152
phase at p-value=0.001. However, unlike in Table 5.8 where households’ participation
was found to be significant at monitoring and evaluation phase, the findings in Table 5.9
did not establish any significance between governance values tested and households’
food security status at monitoring and evaluation phase of watershed governance policies,
plans and programmes. This implied that observing accountability at watershed
management policy and plans formulation phase and legitimacy at policy and plan
implementation phase contributed significantly to the households’ food security in the
basin.
Evidence showed that a watershed governance system that provides an opportunity for
inclusiveness enhances the adaptive capacity of actors. Political will, leadership,
prioritization, knowledge and values such as accountability, transparency, legitimacy,
inclusiveness, and responsiveness are inherent to enhance food security (FAO, 2011;
Haddad, 2011; FAO, 2012). On the other hand, Koc et al. (2008) emphasized that
participation of civil society provided the policy-making process with valuable
information, brings watershed and food security governance closer to the people therefore
enhancing the legitimacy of, and public support for, food security interventions, which,
together with the resource s that CSOs can bring in, stimulate effective implementation.
5.11: Watershed Management Expertise and Households Food Security
To assess watershed management expertise that existed to support households’ in
adapting to socio-ecological changes, respondents were asked to list existing watershed
expertise needed to enhanced households’ involvement in watershed management
activities in the watershed.

153
Table 5.10: Watershed Management Expertise Present Watershed Expertise Frequency(N=387) Percentage of HH
Traditional expertise 133 34.4
Land management 133 34.4
Watershed planning 62 16.0
Farmers coordination 48 12.4
Information and communication 42 10.9
Sustainable Agricultural production 39 10.1
Water quality monitoring 17 4.4
Stream restoration 22 5.7
Forest Management 19 4.9
Wetland restoration 13 3.4
Law enforcements 7 1.8
Fund raising 6 1.6
Research and Training 6 1.6
Advocacy and lobbying 4 1.0
Policy making and influencing decisions 2 0.5
Source: Field data (2018)
The findings in Table 5.10 showed that majority (34.4%) (133) of the households
depended on traditional expertise for their involvement in watershed management
activities, 34.4% (133) of the households also indicated that land management expertise
existed however during group discussions respondents agreed that the land management
expertise was dependent on traditional skills, knowledge and experience (fencing homes
with live fences and using farm manure) that the respondents had accumulated for a long
period of time in the watershed. Other watershed management expertise was identified by
very few households a clear indication that government and non-governmental actors did
not promote the expertise.
Additional results in Table 5.11 illustrated the Chi-square test values for comparison of
means association between the watershed management expertise variables and
households’ food security in the watershed. Based on the findings, variables that were
used to measure watershed management expertise including water quality monitoring,
laws enforcement, policy making and influencing decisions, advocacy and lobbying

154
expertise were found to be insignificant to households’ food security. Implying that the
study never found any influence of the four variables in determining the status of
household food security.
Table 5.11: Food security and Insecurity households’ measurement comparison
association amongst the watershed expertise variables Watershed expertise
variable
Food
Insecurity
(n=214)
Food
Security
(n=173)
Difference χ2 p-value Significant?
Watershed planning 3.7 31.2 27.5 53.677 0.000*** Yes
Traditional expertise 27.6 42.8 15.2 9.805 0.002*** Yes
Land management 29.0 41.0 12.0 6.177 0.013* Yes
Water quality monitoring 3.7 5.2 1.5 0.488 0.485 No
Stream restoration 1.9 10.4 8.5 12.999 0.000*** Yes
Law enforcements 1.4 2.3 0.9 0.446 0.504 No
Wetland restoration 1.9 5.2 3.3 3.274 0.070* Yes
Forest Management 5.1 4.6 -0.5 0.055 0.815 No
Fund raising 1.9 1.2 -0.7 0.319 0.572 No
Sustainable Agricultural
production
7.0 13.9 6.9 4.973 0.026** Yes
Information and
communication
7.9 14.5 6.6 4.187 0.041** Yes
Farmers coordination 6.1 20.2 14.1 17.646 0.000*** Yes
Policy making and
influencing decisions
0.0 1.2 1.2 2.487 0.115 No
Research and Training 0.5 2.9 2.4 3.679 0.055*** Yes
Advocacy and lobbying 0.9 1.2 0.3 0.046 0.830 No
Other 34.6 0.6 -34.0 70.786 0.000*** Yes
The overall score for watershed expertise
Mean(SD) 8.32
(4.98)
12.39
(8.29)
4.1 (3.3) F=51.709 0.000***
Yes
*p<0.1 **p<0.05 ***p< 0.01 statistically significant difference between the households with food secure and insecure
Note: Others included: Use of inorganic fertilizers and preparation of manure and watershed conflict management
Source: Field data (2018)
However, watershed planning (d=27.5), stream restoration (d=8.5) and farmers’
coordination (d=14.1) were found to be significant in determining households’ food
security at p-value =0.000 at 99% level of confidence while traditional watershed
expertise (d=15.2; p-value=0.002 at 99% level of confidence), implying that
consideration of this watershed management expertise in watershed governance results in
enhanced status of households’ food security in the study area. On the other hand, the
statistical analyses show that land management and wetland restoration expertise were
155
also significant to households’ food security at (d=12.0; p-value=0.013) and (d=3.3; p-
value=0.070) respectively at 90% level of confidence.
Further, statistical analysis indicated that sustainable agricultural production and
information and communication expertise were significant to households’ food security at
(d=6.9; p-value=0.026) and d=6.6; p-value=0.041 respectively at 95% level of
confidence, meaning consideration of this watershed management expertise in watershed
governance at household level translates into households’ food security in the Lower Sio
River Basin. More statistical analysis showed that forest management and fundraising
watershed expertise were insignificant to households' food insecurity meaning that the
two expertise also determined the status of households’ food security while watershed
research and training expertise was found to be significant to households’ food security at
d=2.4; p-value=0.055 at 99% level of confidence.
The mean score difference among food secure households and food insecure households
was enough to conclude that watershed management expertise of the sixteen tested
variables at (d=4.1; p-value=0.000 at 99% level of confidence) was significant in
ensuring the adaptive capacity of households towards food security in the Lower Sio
River. This indicated that consideration of watershed expertise in watershed governance
at the household level contributes to enhanced households’ food security in the
watershed. Colonelli and Simon (2013) postulates that households’ food security is a
highly complex and multi-dimensional issue that is impacted by a broad range of drivers
and food system activities which stretch across various scales, and involves multiple
sectors and policy domains that calls for various expertise.
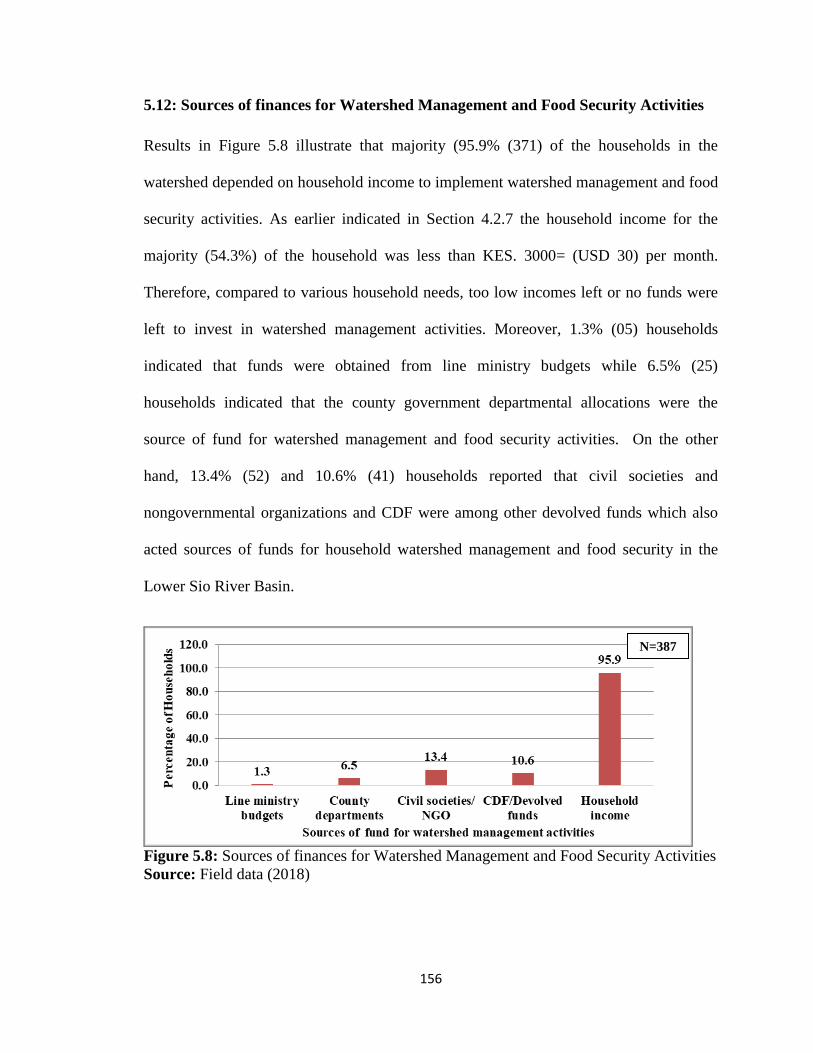
156
5.12: Sources of finances for Watershed Management and Food Security Activities
Results in Figure 5.8 illustrate that majority (95.9% (371) of the households in the
watershed depended on household income to implement watershed management and food
security activities. As earlier indicated in Section 4.2.7 the household income for the
majority (54.3%) of the household was less than KES. 3000= (USD 30) per month.
Therefore, compared to various household needs, too low incomes left or no funds were
left to invest in watershed management activities. Moreover, 1.3% (05) households
indicated that funds were obtained from line ministry budgets while 6.5% (25)
households indicated that the county government departmental allocations were the
source of fund for watershed management and food security activities. On the other
hand, 13.4% (52) and 10.6% (41) households reported that civil societies and
nongovernmental organizations and CDF were among other devolved funds which also
acted sources of funds for household watershed management and food security in the
Lower Sio River Basin.
Figure 5.8: Sources of finances for Watershed Management and Food Security Activities
Source: Field data (2018)
N=387
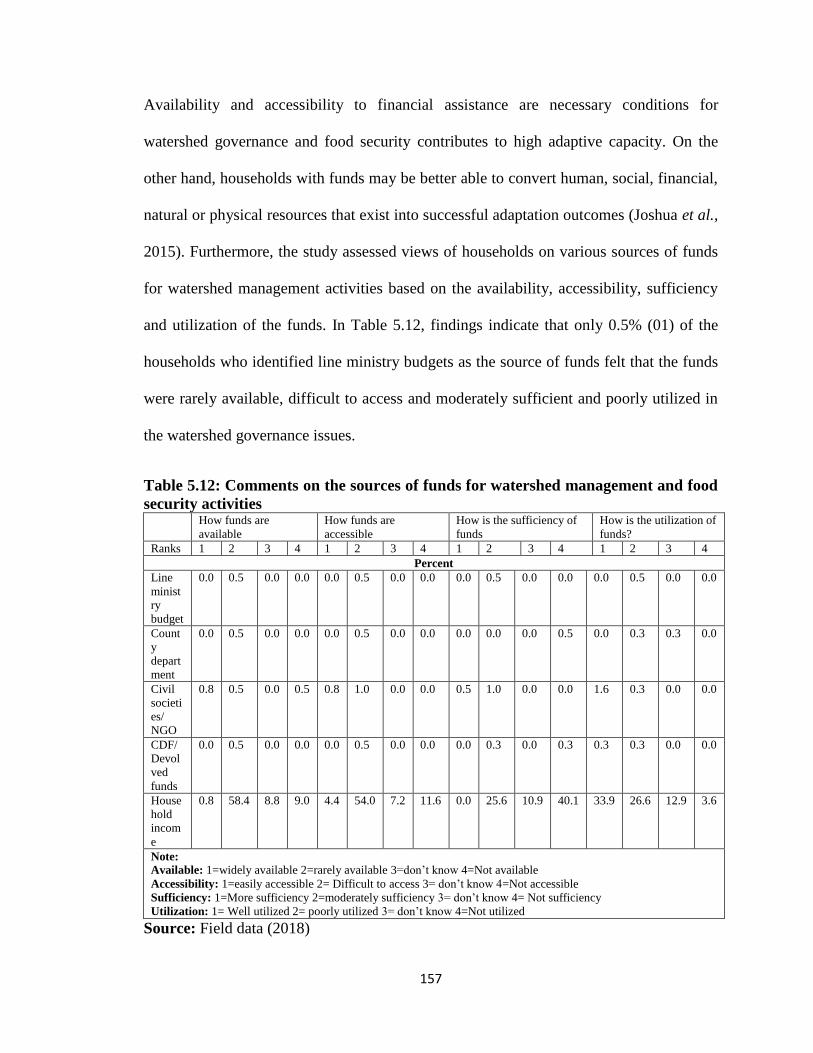
157
Availability and accessibility to financial assistance are necessary conditions for
watershed governance and food security contributes to high adaptive capacity. On the
other hand, households with funds may be better able to convert human, social, financial,
natural or physical resources that exist into successful adaptation outcomes (Joshua et al.,
2015). Furthermore, the study assessed views of households on various sources of funds
for watershed management activities based on the availability, accessibility, sufficiency
and utilization of the funds. In Table 5.12, findings indicate that only 0.5% (01) of the
households who identified line ministry budgets as the source of funds felt that the funds
were rarely available, difficult to access and moderately sufficient and poorly utilized in
the watershed governance issues.
Table 5.12: Comments on the sources of funds for watershed management and food
security activities How funds are
available
How funds are
accessible
How is the sufficiency of
funds
How is the utilization of
funds?
Ranks 1 2 3 4 1 2 3 4 1 2 3 4 1 2 3 4
Percent
Line
minist
ry
budget
0.0 0.5 0.0 0.0 0.0 0.5 0.0 0.0 0.0 0.5 0.0 0.0 0.0 0.5 0.0 0.0
Count
y
depart
ment
0.0 0.5 0.0 0.0 0.0 0.5 0.0 0.0 0.0 0.0 0.0 0.5 0.0 0.3 0.3 0.0
Civil
societi
es/
NGO
0.8 0.5 0.0 0.5 0.8 1.0 0.0 0.0 0.5 1.0 0.0 0.0 1.6 0.3 0.0 0.0
CDF/
Devol
ved
funds
0.0 0.5 0.0 0.0 0.0 0.5 0.0 0.0 0.0 0.3 0.0 0.3 0.3 0.3 0.0 0.0
House
hold
incom
e
0.8 58.4 8.8 9.0 4.4 54.0 7.2 11.6 0.0 25.6 10.9 40.1 33.9 26.6 12.9 3.6
Note:
Available: 1=widely available 2=rarely available 3=don’t know 4=Not available
Accessibility: 1=easily accessible 2= Difficult to access 3= don’t know 4=Not accessible
Sufficiency: 1=More sufficiency 2=moderately sufficiency 3= don’t know 4= Not sufficiency
Utilization: 1= Well utilized 2= poorly utilized 3= don’t know 4=Not utilized
Source: Field data (2018)

158
Similar, views were reported by the majority of those who identified county department
funds. On civil societies and NGO funds, 0.8% (01) of the household who identified them
as the source of funds indicated that the funds were widely available and easily accessible
while 1.6% (01) that the funds were well utilized. On the contrary, 0.5% (01) of those
households who identified CDF and other devolved funds as the main source of funds for
watershed management and food security activities noted that the funds were rarely
available and difficult to access respectively. The study by Namenya (2012) found that in
Funyula sub-county CDF was not used to finance watershed management approaches for
sustainable development projects.
Finally, on the household income, 58.4% (217) of the respondents reported that the fund
was rarely available, 54.0% (200) of the respondents felt that the funds were difficult to
access, 40.1% (149) reported that the funds were not sufficient, and 33.9% (126) of the
respondents reported that the household income was well utilized on watershed
management and food security activities. A study by Shitote (2013) in Siaya County
found that there was a significant variation among fish farmers and the use of household
income that accrued from fish farming activities. Among the uses highlighted were
paying school fees, building and construction of houses, medical services, farming,
procurement of household goods, travelling and entertainment. There was no evidence
that income from fish farming was used for soil and watershed management activities.
This was similar to the situation in Lower Sio River Basin.
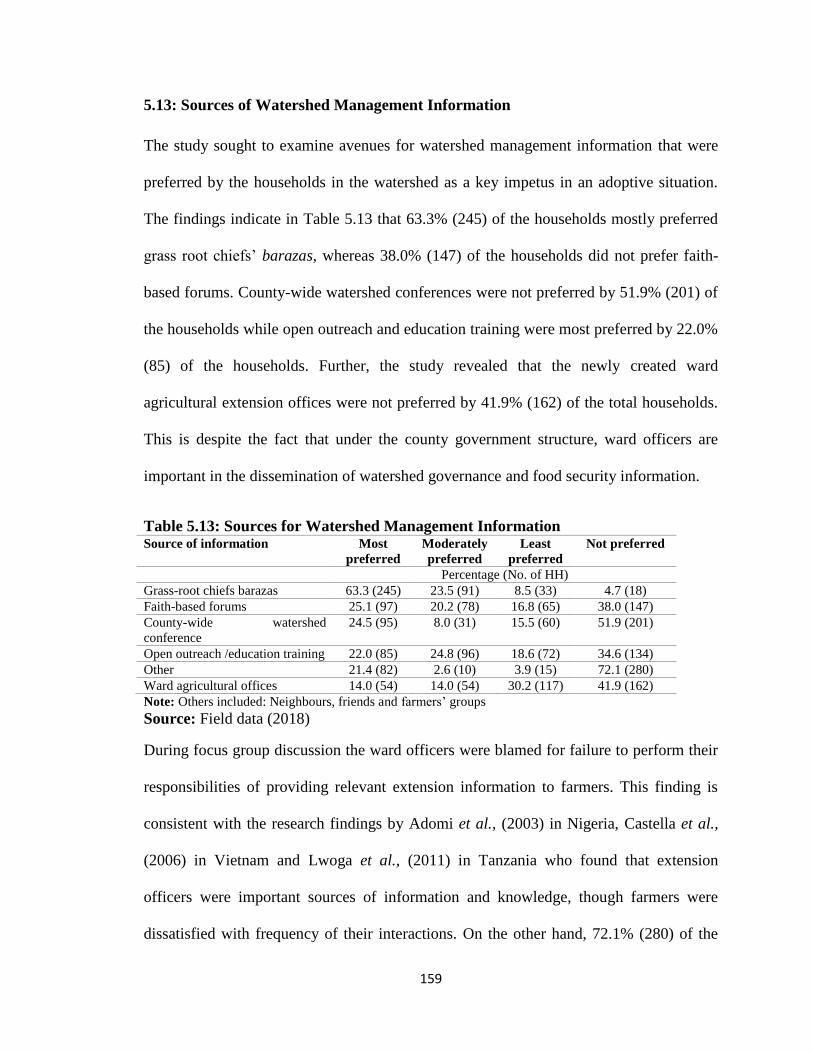
159
5.13: Sources of Watershed Management Information
The study sought to examine avenues for watershed management information that were
preferred by the households in the watershed as a key impetus in an adoptive situation.
The findings indicate in Table 5.13 that 63.3% (245) of the households mostly preferred
grass root chiefs’ barazas, whereas 38.0% (147) of the households did not prefer faith-
based forums. County-wide watershed conferences were not preferred by 51.9% (201) of
the households while open outreach and education training were most preferred by 22.0%
(85) of the households. Further, the study revealed that the newly created ward
agricultural extension offices were not preferred by 41.9% (162) of the total households.
This is despite the fact that under the county government structure, ward officers are
important in the dissemination of watershed governance and food security information.
Table 5.13: Sources for Watershed Management Information Source of information Most
preferred
Moderately
preferred
Least
preferred
Not preferred
Percentage (No. of HH)
Grass-root chiefs barazas 63.3 (245) 23.5 (91) 8.5 (33) 4.7 (18)
Faith-based forums 25.1 (97) 20.2 (78) 16.8 (65) 38.0 (147)
County-wide watershed
conference
24.5 (95) 8.0 (31) 15.5 (60) 51.9 (201)
Open outreach /education training 22.0 (85) 24.8 (96) 18.6 (72) 34.6 (134)
Other 21.4 (82) 2.6 (10) 3.9 (15) 72.1 (280)
Ward agricultural offices 14.0 (54) 14.0 (54) 30.2 (117) 41.9 (162)
Note: Others included: Neighbours, friends and farmers’ groups
Source: Field data (2018)
During focus group discussion the ward officers were blamed for failure to perform their
responsibilities of providing relevant extension information to farmers. This finding is
consistent with the research findings by Adomi et al., (2003) in Nigeria, Castella et al.,
(2006) in Vietnam and Lwoga et al., (2011) in Tanzania who found that extension
officers were important sources of information and knowledge, though farmers were
dissatisfied with frequency of their interactions. On the other hand, 72.1% (280) of the
160
households did not prefer other sources of information including television, newspapers,
social media, funeral gatherings, market open days and neighbours. Reasons given in
focus group discussions were that the sources were given the low level of income among
the households. Elsewhere, a study by Lwoga et al., (2011) indicated that village leaders,
livestock headers, agricultural shops, NGOs, cooperative unions, farmer groups, religious
bodies, and middlemen were important sources of knowledge in some local communities.
The findings suggest the need to have a flexible, more participatory and adaptive means
of accessing information on watershed governance and food security in the Lower Sio
River Basin.

161
CHAPTER SIX
IMPACTS OF DEVOLVED GOVERNMENTS WATERSHED
GOVERNANCE STRUCTURES ON RURAL FOOD SECURITY
6.1: Introduction
This chapter places food security at the centre of watershed governance initiatives. In
particular, it assesses the sustainability of domains of food security as it relates to policy
intervention aimed at enhancing watershed management. The chapter argues that without
a clear and inclusive watershed governance to guide peoples' agricultural production,
water and soil resources utilization behaviour, it will be impossible to achieve food
security in the watershed. First, the section examines existence and knowledge on
institutional developments such as a collective food security goal, policies supporting
incentives, and watershed management structures; and seventeen (17) variables for
testing food security used in the inferential analysis in the study. Secondly, the section
discusses the drivers of food security that was well known to the households which are
characterized by high levels of food security. The last part draws attention to the
contribution of existing governance structures to food security factors in Lower Sio River
Basin.
6.2: Households Food Security Goals
Data analysis from household interviews in Figure 6.1 revealed that the main household
heads individual food security goal known by the majority (53.5%) (207) of the
households was to improve rural livelihoods through food and agricultural systems. The

162
households were able to associate their agricultural activities to the fact that agriculture
was the main economic activity and occupation for the households.
The interviews with local administrative leaders such as assistant chiefs and chiefs
revealed that at the village level and thus household level, the government or even key
stakeholders in agriculture sector had not instilled a culture of a common food production
purpose to the farmers in the watershed. This resulted in fragmentation of farming
activities and abandonment of a large percentage of farmers from governmental and non-
governmental actors’ watershed and agricultural activities. More so, the leaders
confirmed that lack of a common purpose in farming occasioned unsustainable food
production practices since every household had to struggle on its own with the resources
at their disposal.
On the other hand, 43.4% (168) of the households observed that the common goal for
food security was to engage and educate farmers on sustainable food and agriculture,
while 14.7% (57) observed that food agricultural research innovation to feed the county
was the goal for food security. In group discussions, the argument focused on these goals
since most of the respondents indicated that a small portion amongst them who worked
closely with the county government thought about the county as a whole, an example
given was a slogan “food in the mouth and money in the pocket” which respondents
associated with the County Executive Member of Agriculture and Livestock
Development who used the slogan to mobilize farmers during county agricultural
workshops. The Constitution of Kenya (2010) aims to rally all Kenyans to zero tolerance
to hunger in Article 43 (1) (c), as food security is regarded as a key indicator of the
nation’s level of development (GoK, 2010b). The qualitative analysis from both group

163
discussions and key informants agreed that this was a vision that was far from realization
in the study area.
This was attributed to emerging challenges to food security in the watershed such as
increased negative impacts of climate change on watershed resources such as land which
was the basis for food production as well as a rapidly growing population. On the other
hand, 11.6% (45) of the households identified encouraging a new generation of food
agricultural leaders while 6.7% (26) indicated advancing new food and agricultural
product solutions as goals for food security as shown in Figure 6.1.
Figure 6.1: Food Security Goals in the Lower Sio River Basin
Source: Field data (2018)
Studies showed that globally, efforts to eradicate poverty and to ensure sustainable
economic growth, the key developmental goal of all governments has been to eradicate
hunger and poverty, ensuring access to basic needs such as clean water, access to food,
and medical treatment (World Bank, 2007; Grobler, 2016). However, the findings
showed that food security as a development goal has never been realized in the Lower
Sio River Basin.
N=387

164
6.3: Watershed Management Policies that Contribute to Food Security Goals
The study sought to examine households' knowledge of watershed-related policies and
their contribution to food security in the watershed. The results (Figure 6.2) indicated that
43.4% (168) of the households did not agree that existing watershed management policies
and programmes contributed to food security while 41.9% (162) indicated that they did
not know whether watershed management policies in the watershed contributed to food
security. Only 14.7% (57) of the households agreed that policies for watershed
management also contributed to food security. Elsewhere, Grobler, (2016) in the study on
perception of poverty; a study of food secure and food insecure households in the urban
areas in South African found that food insecure households who also happened to be poor
households, felt that the government was responsible for their predicaments and
therefore, the study concluded that the government should provide social security to lift
them out of the food insecurity situations.
Rajaonarison (2014) suggested that failure to achieve food security is due to ignorance of
the agricultural sector in the national building agenda. On the other hand, policies
directed towards addressing food security are often politically instigated and manipulated
to control all aspects of food from production to distribution and utilization in any socio-
ecological set-up. However, it’s important to note that the Lower Sio River Basin has
been a beneficiary of the implementation of government and donor agricultural policies
and programmes related to environmental protection and food security in the past
decades. The results from such policies or co-management have not translated in
improved watershed governance or improvement in households’ food security status.

165
Figure 6.2: Contribution of Watershed Management Policies and Programs to Shared
Food Security Goals
Source: Field data (2018)
The Constitution of Kenya (2010) under the Bill of rights, states that national security
includes the protection of the fundamental rights and freedoms of every Kenyan. Thus
Kenyans in the study area have and need to enjoy the freedom from hunger, access to
information and participation in decision making on matters that pertain their lives (GoK,
2010). The results of this study clearly indicate that majority of households in the
watershed do not contribute to legitimizing watershed management policies hence
experience trickledown effect to ensuring food security.
The Kenya National Food and Nutrition Security Policy (2009) recognized the
importance of environmental management in food security thus watershed management
and climate change adaptation and mitigation were identified as key determinants of food
insecurity in the country (GoK, 2009b). In addition, the long-term national development
blueprints, such as the Vision (2030) and the Strategy for Revitalization of Agriculture in
Kenya are just a few of the national frameworks that recognize the importance of
environmental management and people’s participation for ensuring sustainable
agricultural development in the country.
N=387

166
At the county level, the Constitution of Kenya (2010) in the Fourth Schedule devolved
agricultural functions and what was left at the national level is national policy and
research. Thus, the counties are mandated to domesticate and modify ratified
international conventions, national policies on agriculture and watershed resource
utilization with the knowledge of primary beneficiaries to fit into local needs and
conditions (GoK, 2010b). In order to deliver, the First Busia County Integrated
Development Plan (BCIDP) (2013) also indicated the necessity of environmental
management and climate change adaption and mitigation strategies and involvement of
the people in all matters directly or indirectly relating to their lives as key elements in
ensuring food security for the citizens of Busia County (GoK, 2013a).
The finding indicated that most of these efforts were only on paper have not been
implemented by the inhabitants of Lower Sio River Basin. As noted earlier, ineffective
governance and political will and the on-going negative impacts of donor policies such as
Structural Adjustment Programmes (SAPs) of the World and IMF continue to hinder
governments at both levels (National and Counties) from providing incentives and
support systems to farmers to improve in their production capacities (Kimani-Murage et
al., 2014).
6.4: Drivers of Food insecurity and Households Food Security
It is worth to note that ‘it’s the wearer of the shoe, who knows where it pinches.’ Food
insecurity is a major threat to human development and human security in the watershed.
During the field study when households were asked to list drivers of food insecurity the
question was positively answered by the respondents who were able to identify several
factors. Results in Figure 6.3 revealed that majority 86.8% (336) blamed low farm yield

167
recorded in recent years as a key driver of food security. This was attributed to various
factors that were also mentioned to contribute to food insecurity in the basin including the
prolonged droughts reported by 58.7% (227) of the households; failure of traditional food
systems reported by 11.1% (43) households; weak early warning systems mentioned
reported by 25.6% (99); land degradation reported by 52.5% (203); and watershed
resource degradation mentioned by 24.8% (96) of the respondents respectively.
Figure 6.3: Drivers for food insecurity in the Lower Sio River Basin
Source: Field data (2018)
An earlier study by Makalle et al. (2008) found that in the Sio basin, Kenya, land
productivity had been declining over time due to various reasons; this was confirmed by
42% of the respondents who indicated that land productivity was currently lower than
that of 30 years back. The main reasons that were advanced for the declining land
productivity included; over cultivation due to land fragmentation and thus reduction in
cultivated land in the Sio River basin and overgrazing. Further, poor cultivation
techniques, use of fire to clear land, inadequate use of fertilizers, mono-cropping and
drought were also experienced in the watershed (Makalle et al., 2008). Elsewhere in
N=387

168
Kapingazi, Embu Kenya, studies showed that farmers preferred adoption of riparian area
management by removing eucalyptus planted along the rivers, capacity building on good
environmental practices and diversification of income base by introducing nature-based
enterprises like beekeeping that would lead to a win-win in economic and environmental
impacts (Balana et al., 2011; Kagombe et al., 2018). Other factors that contributed to
food insecurity in the Lower Sio River Basin that were identified by the respondents
included; low levels of income in the study which was identified by 59.9% (232) of the
households. Furthermore, 44.2% (171) of the households observed that there was a low
supply of food in the market. This resulted in elevated food prices which were indicated
by 45.0% (174) of the households as a driver to food insecurity.
Further, a Chi-square test carried out on the households' responses shown in Table 6.1
indicate that there was a highly significant variation among the households with food
security and the households with food insecurity with the four drivers of food insecurity
namely: high prices of foods, low supply of food in the market, incidences of prolonged
droughts and low levels of income at p-value=0.000 while poor government policy at p-
value=0.007. However, the Chi-square test on respondents' socio-demographic
characteristics found that the various levels of households' incomes were insignificant to
households' status of food security. This is attributed to the fact that food security is
determined by multiple factors and the household with low levels of income might
depend on other factors such as their farming activities or relatives’ donations for food.
Therefore, low levels of households' income in the basin might not necessarily mean
households food insecurity.

169
Other drivers of food insecurity that showed significant variations among the two types
of households included; weak warning information systems at p-value=0.030 and failure
of traditional food systems at p-value=0.089. These findings implied that the mentioned
drivers for food security were significant in determining the status of households' food
security in the Lower Sio River Basin. However, results showed that low farm yield, land
and watershed resources degradation were found to be insignificant in determining the
household food security status.
Table 6.1: Food security and Insecurity households’ measurement comparison
association amongst households drivers for food insecurity Drivers to food
insecurity
Food
insecurity
(n=214)
Food
Security
(n=173)
Difference χ2 p-value Significant?
Low farm yield 85.5 88.4 2.9 0.715 0.398 No
High prices of foods 31.3 61.8 30.5 36.059 0.000*** Yes
Low supply of food in
the market
31.3 60.1 28.8 32.190 0.000*** Yes
Prolonged drought 50.5 68.8 18.3 13.238 0.000*** Yes
Land degradation 51.4 53.8 2.4 0.213 0.645 No
Watershed resources
degradation
22.0 28.3 6.3 2.075 0.150 No
Low incomes 68.2 49.7 -18.5 13.656 0.000** Yes
Weak warning
information systems
29.9 20.2 -9.7 4.704 0.030** Yes
Ineffective government
policy
31.8 19.7 -12.1 7.243 0.007*** Yes
Failure of traditional
food systems
13.6 8.1 -5.5 2.886 0.089* Yes
Other Specify 6.1 5.2 -0.9 0.136 0.712 No *p<0.1 **p<0.05 ***p< 0.01 statistically significant difference between the households with food secure and insecure
Others included; political instability, conflicts among neighbours including from Uganda.
Source: Field data (2018)
During the transect walk in various study sites, it was observed that crop production
practices in the watershed were characterized by traditional methods such as the use of
hoe for Ploughing, burning farms for clearance with very few farmers practicing
improved farming methods due to low affordability of farm inputs. A large percentage of
farmers practiced intercropping or mixed cropping systems which utilize a combination

170
of crops on the same piece of land, with the aim of intensifying crop production both in
time and space. The crops mostly intercropped by the small-holder agricultural producers
were legumes and cereals specifically beans and maize.
Overgrazing was another major important land use practice witnessed and identified in
focus group discussions as well as key informants’ interviews that contributed to
watershed issues and food insecurity in the basin. The major types of livestock kept were
cattle, goats, and sheep. During the periods of pasture shortage, most of the interviewed
livestock keepers along the streams and the river bank indicated that they moved their
livestock from one place to another in search of pasture especially in the riparian wetland
of the Sio River and its streams and water in the river banks. In Mango sub-location, it
was disclosed that the same practices applied to colleagues from the Uganda side. Those
with one to three animals practiced tethering at the homesteads where they searched and
transported fodder.
However, the respondents observed that in recent years, there has been changes in
vegetation cover along the river banks which they attributed to severe negative impacts of
climatic changes such as frequent drought and flooding in addition, to increased poor
land management practices such as increased homesteads, use of inorganic fertilizers,
clearance of land for farming, burning of farms, destruction of soil cover on adjacent
farmlands that resulted to siltation, sedimentation, eutrophication, soil erosion, and
deforestation. However, the study did not establish the amount of reduction in the pasture
and some of the listed impacts since the data were not available at the respective
authorities.

171
Irrigated agriculture was not widely practiced in the Lower Sio River Basin despite the
existence of several streams and rivers that were potential for irrigation. During
interviews with the County Irrigation Officer said: -
“The limited investments and support to farmers by the county and national
governments agencies in the provision for water of irrigation has left
farmers in this basin to rely on unreliable rain and rudimentary technologies
at their disposal for agricultural production. Hence there is low uptake of
irrigation development from nongovernmental organization and
programmes such as PALWECO and WKCDD/FMP.”
Further, the major challenges affecting watershed management and food security
identified in the focus group discussion included: high levels of poverty that made most
households to sell portions of their land thus increasing land fragmentation reinforced by
lack of community involvement in the development projects decision making and
planning; poor infrastructure for social amenities such as roads, impacts of HIV and
AIDS, collapse of agricultural marketing; high cost of farm inputs; lack of access to
production assets; delay in payment of sugarcane; inhibitive cultural practices; corruption
in county government service provider offices; collapse of cotton industry; crime and
insecurity. These results were similar to Wabwoba (2017) findings that established small
land size for farming, non-use of fertilizer and certified seeds, soil infertility, poor
infrastructure, and disorganized marketing system were significant in determining
households’ food security in Bungoma County.

172
6.5: County Governance Impact on Watershed Management and Households Food
Security
Overall, the results showed that the county government through its activities had
insignificant impact on watershed management for food production in the watershed. The
results (Figure 6.4) indicate that only 11.1% (43) of the respondents highlighted farmland
as the watershed aspect that the county government activities have impacted. From the
discussions with groups it was reported that although not all respondents had benefited
from the county government agricultural production investments, the county had invested
in: tractors for ploughing, grading and murram of rural roads, subsidized fertilizers and
lime for farmers, in some areas supplied improved seeds, banana tissue cultured seeds
and soil testing were activities that targeted improving food security in the watershed.
However, 10.1% (39) of the respondents felt that the county government had impacted
the river stream. For example, siltation and sedimentation along the streams where the
county roads and bridges were done, and eutrophication that resulted from fertilizers
washed to the streams and rivers. The respondents were concerned that the roads opened
all over the basin without proper drainage systems were leading runoff leading to
sedimentation and erosion in the farmlands and streams.
Based on the study, only 4.4% (17) of the respondents felt that the county government
activities had impacted negatively on hilltops and hill slopes. Much of the noticed impact
was that roads had been opened on the hill slopes without proper runoff drainage systems
especially in Matayos and Funyula Sub-counties. At the hilltops quarrying activities for
building stones had increased as the county government spending and increased
construction of buildings throughout the county. According to the respondents, activities

173
at hilltops had contributed to increased gullies in the hilltops since no rehabilitation
efforts had been put in place by the county government (Figure 6.4).
Figure 6.4: Contribution of County Government on Watershed Management for Food
Production and Distribution
Source: Field data (2018)
On the other hand, 4.9% (19) of the respondents observed that the county had impacted
on the floodplain along River Sio. The main reason given during discussions was that
sedimentation in the floodplain with runoff from farms ploughed by tractors and graded
roads were deposited on the floodplain causing the floods to increase towards farms
especially during heavy rainfall seasons. According to 1.3% (05) of those interviewed
other watershed resources such as forests were also impacted by the county government
activities since most of the construction contracts were awarded to local people who went
on using local resources such as timber from the local private forest for construction.
Therefore, there was a general feeling from respondents that the negative impacts of
increased county government activities if unchecked, in the long run, the projects will be
unsustainable due to ignored consideration of watershed management approaches in
planning and implementation of the projects.
N=387

174
This finding is similar to Namenya (2012) findings where it was concluded that due to
lack of adoption of watershed management approaches in Constituency Development
Fund Projects in Funyula Constituency, the projects were not sustainable, although
studies indicate that economic gains from environmental rehabilitation are realized in the
long term (Gebregziabher et al., 2016). Kagombe et al. (2018) found that in Ndakaini
Dam watershed, there was a significant relationship between farmers’ acceptance of
environmentally conservation practices and incentives given by water providers.
Similarly, there may be delays in economic impacts from the county governance
arrangements in Kenya due to the low net value of changes in watershed governance
investments in the Lower Sio River. Some economic gains related to watershed
management as well as food security are short-term and may have been realized in the
first five years after the devolved system of governance.
Although it was acknowledged by majority respondents in both households’ interviews
and focus group discussions that the county government had put in place efforts to
improve food production, results in Table 6.2 show that 42.4% (164) of the households
pointed out that the existing watershed governance structures such as policies did not
have impact on the rural agricultural crop production while 16.5% (64) did not know if
such impact existed in the watershed. It was observed by 44.7% (173) of the respondents
that there was no impact on rural agricultural livestock production as well. This was a
result of low investments by the county government in these food security domains. Only
39.0% (151) of the respondents observed that the watershed governance structures had
positively contributed to rural food trade. This was attributed to opening up of access

175
roads and establishment of smallholder market centres in the watershed, the reasons
which the county government was praised for.
Table 6.2: Impact of Watershed Governance Structure on the Domains of
Households food security Ranks
Domains of food security Positively No impact Negatively Don't Know
Percentage of HH (N=387)
Rural agriculture crop production 40.8 (158) 42.4(164) 0.3(01) 16.5(64)
Rural food trade 39.0(151) 39.8(154) 2.1(08) 19.1(74)
Rural agriculture livestock
production
34.9(135) 44.7(173) 1.6(06) 18.9(73)
Traditional production systems 28.9(112) 37.5(145) 4.1(16) 29.5(114)
Ecosystems/Environmental
activities
28.2(109) 40.8(158) 3.6(14) 27.4(106)
Development cooperation 15.5(60) 46.0(178) 3.6(14) 34.9(135)
Aquaculture activities 13.2(51) 43.7(169) 1.0(04) 42.1(163)
Source: Field data (2018)
On the other hand, only 13.2% (51) of the households felt that the watershed governance
structures in the Lower Sio River Basin contributed positively to aquaculture activities,
while 40.8% (158) observed that the structures had not impacted on ecosystems and
environmental activities. Nevertheless, 46.0% (178) and 37.5% (145) concluded that the
watershed governance structures had no impact on development cooperation and
traditional production systems respectively. Governments’ policies are meant to carry out
watershed and food security interventions on behalf of the households, to avoid a
situation whereby the governments are blamed for watershed resources degradation and
households’ food insecurity problems. Therefore, policies to eradicate food insecurity and
poverty, in general, should take note of food insecure household’s perception that the
households are not responsible for food insecurity situation, and that it is the sole
responsibility of government to solve food insecurity situation (Grobler, 2016).

176
Table 6.3: Variables Measuring the Impact of Watershed Governance Structures on
Various Factors of Households Food Security Factors of Households Food Security HH
reported Yes
(N=387)
HH (%)
reported
Yes
Foods are available
HHs willingness to change food production practices 214 55.3
HH farmers access to productive technologies and practices 161 41.6
HH farmers access to resources, labour, finance, agricultural inputs 129 33.3
HH farmers secure and timely access to fertile land, water and ecosystem
services
140 36.2
HHs knowledge and skills to improve food production 192 49.6
On Average, Availability of food 167 43.2
Foods are accessed
Women have a strong say in HH economic decision making 192 49.6
Increased HH income 126 32.6
HH engage in secure income generating activities 133 34.4
On Average, Access to food 142 36.7
Food stability
Farmers grow climate adapted crops 191 49.4
HH are energy efficient 110 28.4
Land restoration including soil and water conservation and management 160 41.3
HHs have and implement preparedness plans to protect lives and assets 87 22.5
HH have coping strategies 126 32.6
Resource assets, income exists which can be mobilized by HHs 123 31.8
On Average, food stability 198 51.2
Foods are utilized effectively
Access to clean water 273 70.5
HHs willingness to change diets 198 51.2
HHs skills and knowledge to ensure good nutrition, food safety and
sanitation
179 46.3
On Average, utilisation of food 220 56.8
The overall Index Score of food security
Mean (SD) 41.21 (30.0)
Median 41.2
Food insecurity 214 55.3
Food Security 173 44.7
Source: Field data (2018)
The results show that on average 55.3% (214) of the households in the watershed were
foods insecure (Table 6.3), slightly higher level of food insecurity than the Government
of Kenya estimation of food insecurity in Busia County which placed it at 54% (GoK,
2013a; GoK, 2016b). This implied that the situation of food insecurity was worsening
despite recent changes in the governance system that is expected to have positive impacts
on watershed governance and food security. Only 44.7% (173) of the households

177
observed that the watershed governance interventions by the national and county
governments and other stakeholders had made the households' food secure.
Based on the study findings, on average 43.2% (167) of the households indicate that the
current watershed governance structures have ensured that food is available. On specific
variables that were used to measure food availability in the study area, 55.3% (214)
reported that the recent watershed governance interventions by actors had enhanced their
willingness to change food production practices in their farms. In addition, 41.6% (161)
reported that the interventions had promoted farmers access to productive technologies
and practices, 33.3% (129) reported that household farmers’ accessed resources such as
labour, finance, agricultural inputs to name afew.
Evidence from the neighbouring Bungoma County showed a highly significant
association between access to credit, finance and agricultural with food security
(Wabwoba et al., 2015). Moreover, 36.2% (140) reported that the interventions ensured
that household farmers’ secured and timely access to fertile land, water and ecosystem
services while 49.6% (192) reported that the interventions provided the households with
knowledge and skills to improve food production. The study by Wabwoba (2017) in
Bungoma County revealed that there was a significant relationship between physical
factors such as soil fertility, the state of infrastructure and organization of the market
system and food production levels in the county. Elsewhere, Meaza (2015) found that in
Adwa watershed, Ethiopia, in efforts to promote watershed management activities for
food security interventions, the government introduced 1 to 5 households’ network which
had a great contribution to household's social interaction and adoption of new
technologies. The study revealed that one farmer adopts the new technology successfully
178
and allows other farmers to learn from him or her (farmer field school approach) as an
advisor and or a teacher thereby maximizing on the multiplier effect.
In their findings, Elias et al. (2015) alluded that family size, credit, off-farm income,
perceived economic return and frequency of extension contact were significant
determinants of farmers’ satisfaction with agricultural extension services. However, other
proposed predictors such as age, education, livestock ownership, extension experience,
training, participatory nature of the program, perceived package appropriateness and use
of multiple communication methods were not significant in North West Ethiopia.
Similarly, in the Chi-square test established that age, education and sex did not have any
significant relationship with food security.
On the other hand, the findings showed that watershed governance structures in the
Lower Sio River Basin had not done much in ensuring that the households had access to
food. Only 49.6% (192) of the households indicated that the watershed governance
structures had ensured that women have a strong say in household economic decision
making. Wabwoba et al. (2015) found that household head decision making on land
allocation, crop processing, marketing of farm produce and using proceeds from the crop
sales had a statistically significant association with food security in Bungoma County.
Moreover, 32.6% (126) reported that the interventions had increased household income
levels, while 34.4% (133) noted that the watershed governance structures had ensured
that the households engaged in secure income generating activities. Thus on average, the
study indicates that only 36.7% (142) of the total population of households in the study
area had access to food as a consequence of the current watershed governance structures.

179
Further, studies show that soil preparation and ridging tended to be done predominately
by males early in the cropping seasons while weeding and harvesting of crops were
predominately women’s tasks and thus women work more than men in the rural food
production (African Women's Studies Centre, 2014). Moreover, farming decisions at the
watershed level have a higher level of influence based on the gender and hence the need
to integrate gender issues in agricultural and watershed management programmes for
successful implementation and uptake of new adaptive technologies and crops. As
recommended by the African Development Bank (2004), poverty reduction strategies in
rural agricultural economies must focus on influencing the factors that affect women
participation in decision-making process since it ultimately affects access to resources
and ability to generate income at the household level.
In addition, based on the analysis from the study, on average 51.2% (198) of the total
population of households in the Lower Sio River Basin found that the watershed
governance structures would contribute to the general stability of food in the watershed.
Analysis of specific variables that contribute to food stability showed that 49.4% (191)
indicated that the watershed governance structures had ensured that farmers grew climate
adapted crops, while 28.4% (110) of the households were energy efficient, 41.3% (160)
were engaged in land restoration including soil and water conservation and management,
22.5% (87) household had and implement preparedness plans to protect lives and assets,
32.6% (126) household had coping strategies, and 31.8% (123) resource assets, income
exists which can be mobilized by households. Wabwoba et al., (2015) found that there
was a significant variation in households’ assets and households’ food security status in
Bungoma County.

180
The study by Jacobs and Saggers (2011) found that where assets and property rights for
women are viewed as key to economic progress, like in the Lower Sio River Basin,
women continue to own just a fraction of land worldwide. Additionally, despite laws that
protect women rights to property, men together with women often are unaware of their
rights (African Women’s Studies Centre, 2014). Furthermore, the study by Ahmed et al.
(2010) revealed that increasing vulnerability to environmental conditions such as
diminishing biodiversity, soil degradation, growing water scarcity can easily threaten the
stability of food security for populations which depend on the products of the land,
forests, pastures and marine environments for their livelihoods (Wabwoba, 2017).
Therefore, limited investments by the stakeholders in the management of the mentioned
activities as revealed in the study implied low levels of food stability in the Lower Sio
Basin.
Finally, on the last aspect of food security which entails ensuring that foods were well
utilized, the findings show that on average (56.8%) (220) of the households in the Lower
Sio River Basin indicated that the watershed governance structures had contributed to
food utilization in the watershed. More specifically, 70.5% (273) reported that the
structure had impacted on access to clean water for domestic and livestock consumption,
51.2% (198) reported that the structures had impacted on households’ willingness to
change diets, while 46.3% (179) indicated that the watershed governance structures had
contributed to households’ skills and knowledge to ensure good nutrition, food safety and
sanitation. In focus group discussions, it revealed that the county government had drilled
shallow wells and rehabilitation of springs to ensure that clean and safe water was
available for domestic use. This was in support of Lake Victoria North Water Service
181
Board and non-governmental organizations such as Sustained East Africa, World Vision
among others.
Another factor given was the devolution of health functions whereby the county has
employed enough public health officers who offered extension services to the households
in collaboration with Community Health Workers who were trained and facilitated by
AMREF and UNICEF. The findings on the current state of food security in the Lower Sio
River Basin contributes to the findings from earlier studies which warned that both
poverty levels and household food insecurity were rising across East Africa (Charles et
al., 2010; Kristjanson et al., 2010; Thornton et al., 2011; Patti et al., 2012) despite the
fact that governments are heavily investing in measures to combat hunger threats in the
region.
6.6: Regression Analysis Results on Watershed Governance and Food Security
The bi-variate analysis done in the previous chapters between dependent and independent
variables showed varied results. Therefore, to confirm if both background and controlling
variables have the effect on households' food security both linear and logistic regression
analyses were run. Linear regression analyses were carried out separately, using the
explanatory variables such as; age in complete years, sex, and religion, land tenure
(freehold and communal), watershed governance structures, watershed expertise,
satisfaction towards watershed governance and co-management of watershed index
scores towards watershed governance in the Lower Sio River Basin. Since R2
is affected
by the sample size and number of variables, the adjusted value of R2
was used to explain
the variation in predictors on the indices used.
182
Results indicate that age (significance=0.667), sex (significance=0.106) and land tenure
system had no effect on the status of households' food security (Table 6.4a). Other than
age and sex, Table 6.4a presents the regression results using food index score against
explaining variables (items) retained as most coherent i.e. showed a significant difference
in the bivariate analysis. The results show that religion, watershed expertise, level of
satisfaction towards watershed governance and co-management of watershed could only
explain 20.8% variation between households' food security and food insecurity
differences at household levels, implying that religion, satisfaction, watershed expertise
and co-management had the effect on households' food security.
Interestingly, watershed governance structures did not have an effect on households’ food
security and in reverse order the higher the score of watershed governance the lower the
level of households’ food security. This is attributed to the study findings which showed
that watershed governance structures in the Lower Sio River Basin did not contribute to
household's satisfaction, households' adaptive capacity and adaptive co-management
respectively. The watershed governance structures which include policies, plans and
pieces of legislation are not implemented and remain in government offices shelves as
tools for public relations. Further, regression results show that the households’ food
security score increased with increased watershed expertise, satisfaction towards
watershed governance and co-management of watershed scores, meaning that these
variables had a positive influence on households’ food security. Thus, an increase in the
levels of watershed expertise, co-management and households’ satisfaction means an
increase in levels of food security in the Lower Sio River Basin (Table 6.4a).

183
Table 6.4a: Linear regression results 95.0% Confidence
Interval for B
B Std.
Error
Sig. Lower
Bound
Upper
Bound
Constant 18.153 9.93 0.068 -1.372 37.678
Age (in completed years) 0.046 0.106 0.667 -0.163 0.255
Sex -4.512 2.785 0.106 -9.988 0.964
Religion 9.824 4.724 0.038 0.535 19.113
Land tenure: “freehold” -10.961 7.035 0.120 -24.793 2.871
Land tenure: “communal” -9.126 7.155 0.203 -23.195 4.943
Index score: watershed governance
structures
-0.112 0.337 0.740 -0.775 0.551
Index score: watershed expertise 0.99 0.214 0.000 0.568 1.411
Index score satisfaction: questions on
satisfaction towards watershed governance
0.207 0.047 0.000 0.114 0.299
Index score: Co-management of watershed 0.272 0.061 0.000 0.152 0.391
R2 0.227
Adjusted R Square 0.208
ANOVA F Value 12.295
Significance 0.000
Note: B stands for Beta Coefficient value
Source: Field data (2018)
To carry out a robustness check, an alternative logistic regression was run using a
categorised (binary) household's food security variable (food security and food
insecurity) with the one with linear regression, in relation to age, sex, religion and land
tenure against retained independent variables (Table 6.4b). The results show that male-
headed households were 1.42 times more likely to be food secure than those headed by
the females. This was attributed to inequalities between men and women in engagement
in economic activities and decision-making process. In focus group discussions it was
revealed that men who were perceived to be household heads had more access to
economic opportunities compared to women. This made men to access diverse
employment opportunities which translated to more incomes that could be invested in
food security activities. A study by Wabwoba et al. (2015) revealed that household heads
decision making on land allocation, crop processing, marketing of farm produce and

184
using proceeds from the crop sales had a statistical significance on households’ food
security status.
Similarly, on background factors analysis, households with Christian heads scored better
in food security than those with heads of other religions – they were twice likely to be
food secure. Results show that for communal and lease land tenure system households
scored better in food security than those with freehold land system. During key informant
interviews, it was revealed that communal land was better managed collectively by either
the community landowners or the leasers. Therefore, the use of such lands for food
production was subject to community collective regulations which do not exist in
privately or freehold land system.
Table 6.4b: Logistic Regression results B S.E. Wald Sig. Exp(B)
Age -0.001 0.009 0.024 0.877 0.999
Sex(1) 0.351 0.23 2.339 0.126 1.421
Religion(1) 0.684 0.44 2.412 0.120 1.981
Land tenure system 4.861 0.088
Land tenure system (1) 0.37 0.24 2.383 0.123 1.448
Land tenure system(2) 1.149 0.602 3.643 0.056 3.156
Index score: watershed governance
structures
-0.021 0.03 0.487 0.485 0.979
Index score: watershed expertise 0.088 0.021 17.303 0.000 1.092
Index score satisfaction: questions on
satisfaction towards watershed governance
0.011 0.004 7.308 0.007 1.011
Index score: Co-management of watershed 0.015 0.005 8.79 0.003 1.015
Constant -2.669 0.713 14.023 0.000 0.069
Cox & Snell R Square 0.155
Nagelkerke R Square 0.207
Note: B stands for Beta Coefficient value
Source: Field data (2018)
This finding is similar to Economic Commission for Africa (2004) finding that land held
by groups of individuals under freehold tenure systems and by the state attracted the least
regulation while customary systems attracted numerous land use regulations. Therefore,

185
collective land use regulations were used to prevent what Hardin in 1968 posited as “The
Tragedy of Commons”. Security of land tenure is inherent to having control over major
decisions on land use such as what crop to grow, what techniques to be used, what to
consume and what to sell. In addition, the security of land tenure also determines soil and
land management practises (Economic Commission for Africa, 2004).
Finally, empirical evidence showed that watershed management activities when
supplemented with water harvesting technologies in the rural areas increased the
availability of water for irrigated agricultural production. This was implemented together
with improved agronomic practices contributed to increased land and crop productivity.
This was observed in Abraha-Atshaba, Kereba and Bechyti watershed in Ethiopia where
the implementation of watershed management increased crop production up to 200-300%
(Gebregziabher et al., 2016). This implies that enhancing food security in the Lower Sio
River Basin needed to be approached through watershed governance practices promoted
through watershed management. These include; watershed expertise, satisfaction towards
watershed governance and co-management of the watershed.

186
CHAPTER SEVEN
EFFECTIVENESS OF ADAPTIVE CO-MANAGEMENT OF
WATERSHEDS FOR SUSTAINABLE FOOD SECURITY
7.1: Introduction
This chapter presents results of the process of watershed governance through co-
management of watershed resources with the aims of enhancing food security in the
Lower Sio River Basin. The study evaluated the effectiveness of adaptive co-
management by using variables including role played by multi-level actors, collaboration,
coordination, policies and plans, legislation, equity, responsiveness, and inclusiveness in
watershed resource management approaches. The evaluation focused on water
governance policies; the existence of various actors, different approaches used by various
actors to deliver services to the people as well as promoting ecosystem services and
establishing the status of adaptive co-management.
7.2: Co-ordination in Watershed Resource Management and Households Food
Security
The study findings in Figure 7.1 indicated that, majority 56.6% (219) of the households
in the Lower Sio River Basin did not know which department either at the county or
national government level was tasked with coordinating the work of other departments
and stakeholders towards a number of watershed management and food security goals.
On the contrary, 21.2% (82) and 10.9% (42) of the households revealed that the County
Department of Agriculture and Livestock Development (CDALD) and the County
Department of Environment, Water and Natural Resources (CDEWNR) respectively

187
were mandated to coordinate activities of other stakeholders in watershed management
and food security activities at the county level. However, 4.1% (16) and 4.1% (16) of the
households related the same functions with the National Government Ministry of
Agriculture (NGMoA) and the National Environment Management Authority (NEMA)
respectively.
Note: Other included; State department of social services (due to vulnerable groups cash transfer program) Figure 7.1: Households Knowledge of Government Departments Tasked to coordinate
other departments in Watershed and Food security activities Source: Field data (2018)
Based on the study by Komakech (2013), an effective co-ordinated management of water
resources at a river basin as stipulated in IWRM depended on the presence of an
institution whose regulatory mandate and tasks are known and accepted by a majority of
stakeholders. However, in the study area it was evident from this finding that such
institutions are lacking as well as unknown to the primary stakeholders. This shows unco-
ordinated watershed management functions in the watersheds which go against the tenets
of IWRM. Further, the findings provided evidence that six years after devolution and
eight years after promulgation of the Constitution of Kenya (2010), many Kenyans were
neither part of the devolution process nor lacked knowledge on devolution and the
N=387
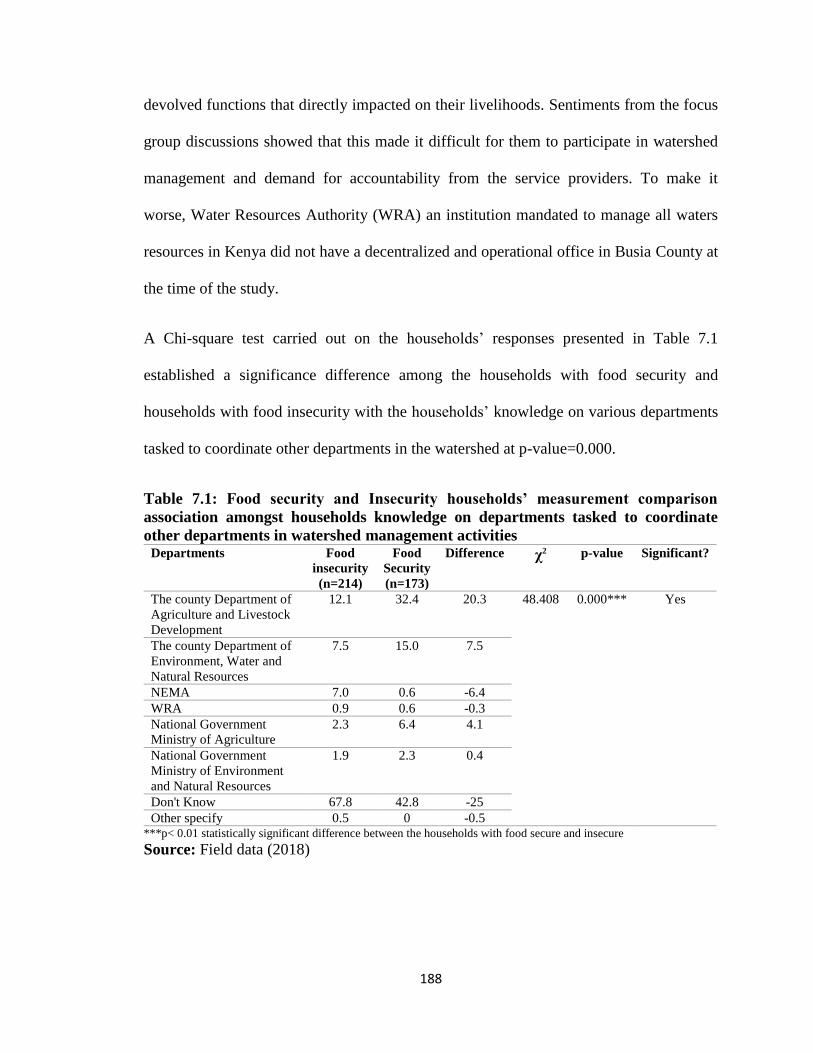
188
devolved functions that directly impacted on their livelihoods. Sentiments from the focus
group discussions showed that this made it difficult for them to participate in watershed
management and demand for accountability from the service providers. To make it
worse, Water Resources Authority (WRA) an institution mandated to manage all waters
resources in Kenya did not have a decentralized and operational office in Busia County at
the time of the study.
A Chi-square test carried out on the households’ responses presented in Table 7.1
established a significance difference among the households with food security and
households with food insecurity with the households’ knowledge on various departments
tasked to coordinate other departments in the watershed at p-value=0.000.
Table 7.1: Food security and Insecurity households’ measurement comparison
association amongst households knowledge on departments tasked to coordinate
other departments in watershed management activities Departments Food
insecurity
(n=214)
Food
Security
(n=173)
Difference χ2 p-value Significant?
The county Department of
Agriculture and Livestock
Development
12.1 32.4 20.3 48.408 0.000*** Yes
The county Department of
Environment, Water and
Natural Resources
7.5 15.0 7.5
NEMA 7.0 0.6 -6.4
WRA 0.9 0.6 -0.3
National Government
Ministry of Agriculture
2.3 6.4 4.1
National Government
Ministry of Environment
and Natural Resources
1.9 2.3 0.4
Don't Know 67.8 42.8 -25
Other specify 0.5 0 -0.5 ***p< 0.01 statistically significant difference between the households with food secure and insecure
Source: Field data (2018)

189
This implied that household's knowledge of the department that co-ordinated watershed
management in the county significantly contributed to the status of food security. In the
focus group discussions, it was revealed that the households' knowledge of departments
contributed to their involvement in departments' activities at the grassroots or even
sought assistance from various departments at times of needs.
In regard to water resources management in Kenya, the Water Act of (2016) provided for
the creation of WRA. The responsibility of the authority is to manage water resources.
The authority is mandated to monitor water resources alongside administration of water
regulation, for example, issuing water abstraction and discharge permits countrywide
through its main six catchment regional offices. For the Lower Sio River Basin, this is
done by Lake Victoria North Catchment Area (LVNCA). The vision for LVNCA is that
“The people in the catchment conserve to ensure adequate quality water for all”. During
analysis of data from LVNCA and WRA, this vision was found to be consistent with the
national vision which state that: “To manage, regulate and conserve water resources
judiciously, involving stakeholders for enhanced equitable allocation and environmental
sustainability.”
As part of institutional decentralization and to ensure effective water resources
management at the grassroots in Kenya, the Water Act (2016) also provide for the
establishment of Water Resources User Associations (WRUAs) under WRA. This was
inherent in ensuring that water users participate in decision making concerning the
management of local water resources in sub-catchment areas for the benefit of all. The
main mandate for the WRUAs was to prevent and solve conflict over water. Further, on
institutional development, Section 16 of the Water Act (2016) provided for the formation

190
of Catchment Area Advisory Committee (CAAC) for every region. The mandate for
CAAC was to advise the regional authority on proper water resource management. Key
among the principles that guided the formation of WRUAs and CAAC were gender
parity, right-based and pro-poor approaches in order to ensure improved water resources
management for the benefit of all.
The study did not find the presence of any active operational WRUA in the study area
during the period of study. Nevertheless, WRUAs were expected to report to WRA a
national government agency and not the CDWENR. Although the gap was identified and
addressed in the revised Water Act of 2016, there exists a governance gap since the
WRUAs are formed under an Act of the National Parliament and remains the grassroots
agency of WRA yet expected to be under the CDWENR. To regularize formulation and
responsibilities, facilitation and ownership of WRUAs at the county level, there is a need
for them to be formed under an Act of the County Assembly and report directly to
CDWENR.
The study found that watershed governance values such as accountability, inclusiveness
and legitimacy were the basis for the formulation of WRUAs and CAAC as grassroots
governance structures. Sustainable communal resource management through governance
structures as WRUAs is attained by seeking people’s participation and devising resource
management approaches according to the local socio-cultural settings (Lise, 2007). On
the other hand, among the core functions of LVNCA, according to the Water Act of
(2002) section 15 and now Water Act (2016) is to formulate and operationalize the
Catchment Management Strategy (CMS). The strategy as a governance tool is an
instrument for achieving proper co-ordination of the use, development, conservation,

191
protection, control of water resources within a catchment area. This was not the case in
the study area as evident from households’ responses.
Further, the respondents were asked which new departments, ministries or agencies
created to enhance watershed management for food security activities in the Lower Sio
River Basin. The results in Figure 7.2 show that 61.8% (229) of the households in the
study area did not know the newly formed departments after devolution that was
mandated to enhance watershed management and food security activities in the
watershed. Although, 22.5% (87) identified the CDALD; 17.8% (69) of the respondents
identified the CDEWNR while 9.8% (38) and 4.4% (17) of the respondents identified
NEMA and WRA respectively as departments created to foster watershed management
and food security in the watershed.
Note: Other included; State department of social services (due to vulnerable groups cash transfer program) Figure 7.2: New Departments at the National and County Governments Known to the
Households
Source: Field data (2018)
N=387

192
Furthermore, 5.7% (22) and 4.7% (18) of the households mentioned that the NGMoA and
National Government Ministry of Environment and Natural Resources (NGMoENR)
respectively as recently created departments to promote watershed management and food
security. Although the findings showed mixed responses, in order to adjust systems to
social and environmental issues, make and implement the right decisions at a watershed
level, institutions need to be changed, adjusted, expanded, or created for consistency with
the watershed governance system (Koontz et al., 2015). This finding shows that although
departments such as CDALD and CDEWNR were formed under the devolved system of
governance, their formation and functions had not been legitimized by the beneficiaries
of their responsibilities.
It is vivid to note that collective action needs to be taken by a group, either directly or on
its behalf through an organization, in pursuit of members perceived shared interest
(Marshall, 1998). Therefore, departments as organizations are supposed to pursue
watershed management for the benefit of the households especially in ensuring that soil
and water resources provided food for the population. Foerster (2011) argued that
adaptive institutions are necessary to move towards sustainability outcomes because of
their ability to adjust participation from multiple stakeholders with multiple interests that
evolve over time. Therefore, the new departments formed the basis for adaptive
governance due to their nature since as suggested by researchers that such an adaptive
tool is thought to help a governance system cope with uncertainty and complexity
(Huntjens et al., 2012).
A Chi-square test carried out on the households’ responses shown in Table 7.2 indicate
that there was a high variation among the households with food security and the

193
households with food insecurity knowledge of the CDALD, and CDEWNR as new
departments created to enhance watershed management for food security at p-
value=0.000. Similarly, there was a significant difference among the households with
food security and households with food insecurity who indicated that they did not know
the new department created to enhance watershed management for food security at p-
value=0.000. In addition, households’ knowledge of NEMA and WRA showed a
significant difference between the two types of households and food security. This
implied that knowledge of CDALD and CDEWNR, NEMA, WRA and ignorance of the
new departments determined the households’ food security status in the basin.
Table 7.2: Food security and Insecurity households’ measurement comparison
association amongst households knowledge on new departments created to enhance
watershed management for food security Department Food
insecurity
(n=214)
Food
Security
(n=173)
Difference χ2 p-value Significant?
The County Department
of Agriculture and
Livestock Development
9.8 38.2 28.4 44.080
0.000*** Yes
The County Department
of Environment, Water
and Natural Resources
8.4 29.5 21.1 28.984 0.000*** Yes
NEMA 12.1 6.9 -5.2 2.936 0.087* Yes
WRA 2.8 6.4 3.6 2.878 0.090* Yes
National Government
Ministry of Agriculture
4.7 6.9 2.2 0.914 0.339 No
National Government
Ministry of Environment
and Natural Resources
5.6 3.5 -2.1 0.987 0.320 No
Don't Know 77.1 42.8 -34.3 47.733 0.000*** Yes
Other specify 0.5 0.0 -0.5 0.811 0.368 No
*p<0.1, ***p< 0.01 statistically significant difference between the households with food secure and insecure
Note: Other included; State department of social services (due to vulnerable groups cash transfer program) Source: Field data (2018)
On the other hand, the Environment Management and Coordination Act (EMCA) of 1999
now EMCA (2015), resulted to the formation of NEMA, an institution mandated to
manage all matters relating to environmental management in Kenya. Consequently,
NEMA plays a crucial role in providing guidance on regulation during interactions with
194
stakeholders in watershed management activities such as the CDEWNR and CDALD.
One of NEMA’s limitation identified during interviews with the county director was that,
at the county level, NEMA had only two permanent technical staff (the County Director
and an Environment Officer) who worked closely with private individual registered
consultants (Environmental Impact Assessment Experts) to provide Environmental
Impact Assessments (EIAs) at inception of programs and projects as stipulated under
EMCA (2015).
During key informant interviews, it was established that NEMA's capacity to monitor and
respond to all complaints on environmental management issues raised by the public, as
well as unreported issues was extremely limited. Additionally, as a primary national
stakeholder in environmental management matters, NEMA county office had considered
drawing public support for increased budget allocation on environmental management
programmes from both the national government and county government support through
the CDEWNR. Further, there were reports of discomfort in the county government
environment department as reported in key informants' interviews. This was based on the
allocation of budgets and working relations since NEMA was a national government
agency thus served the interest of national government at the county level therefore
expected to get all its allocation and staff from the national government. The Fourth
Schedule of the Constitution of Kenya (2010) placed environmental management as a
shared function between the national and county government, thus NEMA county office
has an upper hand to negotiate for budgetary allocations to support staff or use the
CDEWNR staff to ensure that programmes on proper management of watershed
resources are prioritized during planning and budgeting at the county level.

195
The study found that the water reforms in Kenya since the year 2002, led to the
establishment of Water Services Boards (WSBs) in the seven catchment areas with the
aim of spearheading the development of domestic and industrial water supplies in
integrated and coordinated development interventions, and avoid socio-political and
administrative fragmentation. Therefore, the Lower Sio River Basin falls under the Lake
Victoria North Water Services Board (LVNWSB). The board is mandated to provide
water for domestic and industrial use through the Water Services Providers (WSP).
Currently, in the watershed, Busia Water and Sewerage Company (BUWASCO) an
institution formed under the Act of the County Assembly of Busia is the main water
services provider. Under the Water Act (2016), the WSPs signed Service Provision
Agreements (SPAs) with the WSB to provide water and sanitation services to the specific
areas. Before the county governments were put in place, the areas without WSP, the
District Water Officers were mandated to operate water supply systems on behalf of the
board. This was more specific to the urban areas while in the rural areas water supplies
were managed by the members of communities through the establishment of Water Users
Associations (WUAs). Similarly, in Tanzania, Komakech et al. (2011) observed that
WUAs were quite essential for facilitating water resources governance at local level. For
example, in Pangani River Basin in Tanzania, WUAs facilitated water management
decisions, by-laws formation, supervision and development of water resources
infrastructures that endured equitable allocation of irrigation water through water
rationing and collection of water user fees from smallscale farmers (Makarius et al.,
2015).

196
The Water Act (2016) also allowed for private sector participation in the water service
provision. Like in other developing countries, the Water Act (2002) and revised Water
Act (2016) decentralized institutional frameworks necessary for local stakeholders’
involvement in watershed governance in Kenya. Elsewhere, studies on institutional
linkages, Gebregziabher et al. (2016) noted that hydrological relationships across a
watershed influence a large number of stakeholders in the use and management of the
watershed resources. On the other hand, the relationships in watersheds go beyond
administrative boundaries, ownership rights with limited regulations and institutions
governing the rights and duties of different stakeholders.
For example, the study carried out in Bedesa, Kela and Kereba watersheds in Ethiopia,
community members had concerns that their upstream investments in watershed
management formed swampy areas and perennial river in the downstream thus benefiting
the downstream users without the contributions of the downstream communities.
According to the study, this showed that managing watershed externalities required
cooperation among various stakeholders and establishment of institutions and by-laws
that address the benefits and cost-sharing systems at the watershed across different scales
(Gebregziabher et al., 2016).
7.3: Water Resources Management Plans in Use
According to the findings, Busia County Integrated Development Plan (BCIDP) (2013-
2017) resulted from participatory inputs from all agencies both the national, county and
non-governmental organizations in the county as well as input from sector-specific
professionals and the communities at large. The BCIDP envisages improving the
livelihoods of the people of Busia County, Lower Sio River Basin. The plan also aimed at

197
helping the communities realize socio-economic and environmental potentials by
mobilizing and equitably distributing resources as well as providing support and enabling
policy and legal environments for the sustainable development and a green economy. As
a result, under the county development priority programmes and projects, the BCIDP
acknowledged and prioritized watershed management and food security interventions
under the CDALD; and the CDEWNR with support from other key departments and
agencies working in Busia County. As a development planning tool for the county, it is a
key document to link the international and national development priorities to the local
community development priorities thus necessary for both top-down and bottom-up
planning processes as watershed governance roles (GoK, 2013).
On the other hand, Lake Victoria North Catchment Management Strategy, under which
the Lower Sio River Basin falls, acknowledged high population growth rate as a major
challenge facing management of underdeveloped water resources in the catchment area.
Other challenges outlined included: Climate variability, underdevelopment of the
available renewable fresh water, catchment degradation, degradation of water resources,
poor groundwater recharge, competing needs for the diminishing water resources, a
crumbled water resources assessment and monitoring programme, HIV and AIDS and
gender issues related to water (GoK, 2007).
The results indicate that WRA recognized three key mechanisms for improving water
resources management which encompasses watershed governance efforts. First is the
regulation and enforcement which included setting standards and procedures that must be
followed in water resource management. Influencing community behaviour through;
awareness, incentives and other options to encourage better use of the water resources is

198
the second mechanism (GoK, 2007). Finally, enhancing co-governance of water resource
management in which other state agencies or institutions have a mandate and
coordination is important to maximize the impact of cooperative efforts (Foerster, 2011).
The strategy recognized that as a source of water in the catchment, the springs and
wetlands attracted several activities such as cultivation through irrigation, water
abstraction for livestock watering, domestic and commercial use. Out of which some
activities were not controlled leading to degradation of the spring sources, reduction of
water quality among others.
The interviews identified gaps in watershed governance in the Lower Sio Basin, WRA
representative said: -
“Land adjudication system leads to allocation of springs and wetland areas
to individual community members together with unprotected and
undeveloped springs throughout the catchment is a major hindrance. To
make it worse, encroachment of the recharge areas of springs which are
swamps, wetlands and forested hill areas contribute to the degradation of
the quality and quantity of water yield from the streams and springs.
Another gap is lack of an organized system of drawing water from the
springs which cause both animals and humans accessing water at the same
time which is worsened by cutting down of water-friendly indigenous trees
leading to drying up of streams and springs.”
During the transect walk, it was observed that fertile soils from the hill-slopes were
washed away by surface runoff and finally deposited along banks of River Sio, and
streams, wetlands and dams. This was attributed to unprotected riparian lands. The
eroded soils deposited in the streams and rivers resulted in the reduction of water quality,
reduced capacity of river or storage facilities, overflow of river banks that resulted in
high incidences of floods and quick depletion of the water resources in the basin.

199
Similarly, under the Nile Trans-Boundary Environment Action Project (NTEAP) of the
Nile Basin Initiative (NBI), the Sio-Siteko Trans boundary Community-Based Wetland
Management Plan was developed in 2009 (NBI, 2009). Like other watershed governance
tools, the study noted that the plan was made in a participatory manner whereby several
stakeholders at the international level and national level were involved. At the
international level, the financial support from the Canadian International Development
Agency (CIDA) and the Netherlands Government, through the Nile Basin Trust Fund
managed by the World Bank, the plan was made possible. At the local level, the team
made up of stakeholders from Busia County (Kenya), Busia District Uganda, other
wetland management experts were involved including; community resource users, local
administrators, political leaders and extension workers in the watershed. These findings
show that there was co-management at the watershed plan formulation level.
The Lower Sio River Basin being part of the Sio-Siteko trans-boundary wetland plan
showed that the guiding vision for the communities in the watershed is “A well conserved
Sio-Siteko Wetlands, sustainably utilized for both socio-economic and ecological benefits
in a harmonized trans-boundary relationship.” The findings show that the vision was
consistent with WRA vision although the plans did not refer to each other. Figure 7.3
presents the Sio-Siteko Sub Basin. The study observed that given a wide geographical
coverage of the wetland, only six sites were sampled for community participation during
formulation of the plan.
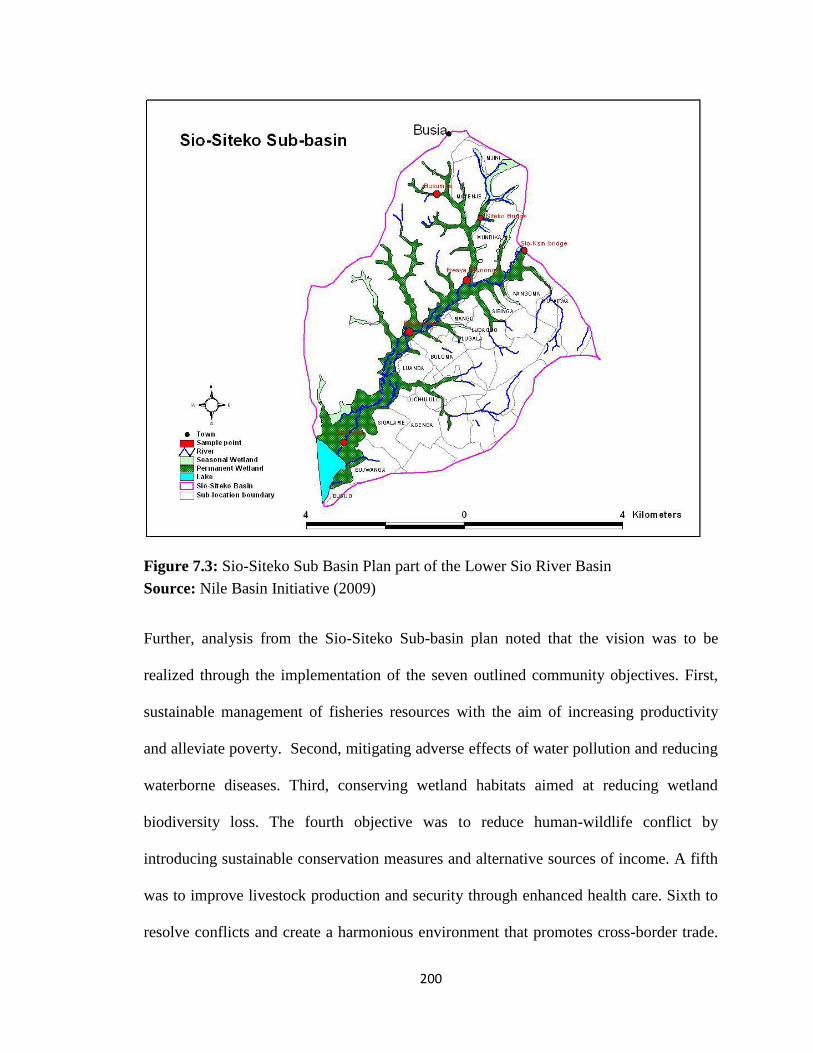
200
Figure 7.3: Sio-Siteko Sub Basin Plan part of the Lower Sio River Basin
Source: Nile Basin Initiative (2009)
Further, analysis from the Sio-Siteko Sub-basin plan noted that the vision was to be
realized through the implementation of the seven outlined community objectives. First,
sustainable management of fisheries resources with the aim of increasing productivity
and alleviate poverty. Second, mitigating adverse effects of water pollution and reducing
waterborne diseases. Third, conserving wetland habitats aimed at reducing wetland
biodiversity loss. The fourth objective was to reduce human-wildlife conflict by
introducing sustainable conservation measures and alternative sources of income. A fifth
was to improve livestock production and security through enhanced health care. Sixth to
resolve conflicts and create a harmonious environment that promotes cross-border trade.
201
Seventh, set up, facilitating and monitoring management plan implementation structures
and mechanisms (NBI, 2009).
Among the key issues proposed in the plan was involvement of all stakeholders with
emphasis on community participation in monitoring of ecological and socio-economic
indicators and implementation structures. However, during the study, it was evident that
majority of households in the Lower Sio River Basin did not have any understanding or
the existence of this plan. As reported from the interviews with the local administrators
the Chiefs and Assistant Chiefs, the process of formulating the Sio-Siteko Community
Wetland Management Plan was not all-inclusive, only the assistant chiefs and the
households whose land border the Sio River main channel were targeted and participated
in the formulation meetings. The sentiments were further acknowledged in the focus
group discussions and interviews with the local elders at Nang'oma Sub-location. The
chief of Nang’oma Location said: -
“It was perceived by the organizers of community forums that after training
and meetings with the sampled immediate neighbours of the Sio River
channel who border the riparian land and the area local administrators, the
chiefs and assistant chiefs could use their barasas and other networks to
reach other households, especially those who resided on main tributaries of
the river. However, without facilitation, inadequate training on the wetland
issues and without follow-ups, the intended meetings spill-over effect was
never realized. This is the reason why almost all household in the Lower Sio
River are not aware of the plan and the plan has never been implemented.”
On the other hand, the interviews with the Busia County Principal Environment Officer
confirmed that there was lack of ownership of the plan although key departmental heads
were involved in its formulation. It was also noted that the plan lacked a practical
implementation framework including a committee to oversee its implementation. A study

202
by Komakech and van der Zaag (2011) concluded that watershed conservation and
governance can be achieved through improving river committees. In addition, it was
confirmed in the interviews that in the first five years of the county government no
investments were made to implement the plan since most of the county agriculture and
environment stakeholders associated the plan with the Nile Basin Initiative whose
projects were closed in the year 2012 in the county. As a result, the principal environment
officer said: -
“There are arrangements to review the plan and make it more adaptable by
the county government system before implementation.”
Warner et al. (2008) argued that water management approaches are not cast on stone but
outcomes of political choices which are based on values and preferences. The choice of a
river basin as the most appropriate scale of water management is just a political one; it
can be made differently. This is a typical case in the Lower Sio River Basin, adoption and
adjustments in the previous non-implemented watershed management plans are needed to
enhance the management of watershed resources.
Further, the study noted that there was a possibility of a spillover effect in the reasoning
of the management of watershed resources from the neighbouring Yala Swamp
Integrated Environmental Management Plan 2016-2026. The plan was produced with the
financial support from the Global Environmental Facility (GEF) through United Nations
Environment Programme (UNEP). The catchment area of the Yala Swamp is in Siaya
and Busia Counties. The plan proposes various management interventions for the
watershed resources with a broad vision for the communities and stakeholders in the

203
Swamp. In addition, the plan provides mechanisms for resource mobilization and a
monitoring and evaluation framework.
Nevertheless, this study noted that apart from Sio-Siteko Community Wetland
Management Plan, there was lack of a proper adaptable, implementable watershed
resource management plan at the Lower Sio River Basin based on the recently formed
administrative levels; the county, sub-counties, wards and villages. These are the
constitutional administrative levels through which devolution is implemented in Kenya.
According to Paavola et al. (2005) and Parry et al. (2005), in most cases, adaptation
activities are more local (that is the district, regional or national) issues rather than
international. This is because different communities in different geographical locations
and scales are exposed to different levels of vulnerability and possess varying adaptive
capacities, thus they tend to be impacted differently, and thereby exhibiting different
adaptation needs (Ndesanjo, 2009). Therefore, there is need to have watershed resources
management plans at these levels for easier resource mobilization and capacity building
at grassroots level.
The review of the plans showed that the plans were ‘Standalone’ whereby no plan
referred to the other; key issues such as common vision and goals, harmonization of
implementation, resource mobilization, collaborations, community capacity building
were separately addressed in the plans. Although all plans indicated that the processes of
producing them were participatory and the target community was the same. The study
also noted that there was no proper implementation structure and monitoring framework
for the plans either from bottom-up or top-down levels of planning thus failure or non-
implementation resulting to poor watershed governance. Consequently, the primary

204
beneficiaries were not aware of the existence of such plans out of which some such as
Sio-Siteko Wetland Management Plan had lasted for more than five years prior to the
study period. Fiona et al. (2013) argued that developing the action plans and concretizing
them in work plans enabled the stakeholders to collectively agree on practical solutions to
the problems in the basin.
Table 7.3: Summary of the Watershed Management Plan and Governance issues Watershed
Plan
Key Management and Governance Issues addressed
Busia County
Integrated
Development
Plan
Linking watershed resources management and legislative issues to the socio-
economic development of the communities.
Acknowledged the need for capacity building and resource mobilization to
enhance watershed resource management.
Called for the integrative approach, guided by the participation of all key
stakeholders in watershed resource management.
Acknowledged the need to monitor the impact of development on watershed
resources.
Called for equitable distribution and sustainable management of land resources as
well as forestry and wildlife resources for improved livelihood and food security.
Called for promoting, conserving and protecting the environment and improving
access to water for sustainable development.
Lake Victoria
North
Catchment
Management
Strategy
Outlined a broad vision for the catchment in line with the national vision for
catchment management.
Used a rights-based approach and poverty reduction to formulate the
management objectives.
Classified the catchment management unit as part of decentralization of the
management interventions.
Estimated the water balance and water demand management, water allocation
and water use management.
Outlined water resources protection issues, catchment protection and
conservation strategy.
Areas for institutional development and collaborations were identified.
Resource mobilization and development of water infrastructure and finally,
monitoring and information management.
Sio-Siteko
Community
Wetland
Management
Plan (NBI)
Management vision for the community wetland activities.
Formulated wetland management objectives for the community.
Formulated management actions and activities for the community.
Formulated an implementation strategy for community monitoring and
evaluation framework.
Yala Swamp
Environmental
Management
Plan
Outlined the vision and objectives for the stakeholders in the environmental
management of the swamp and its environs
Outlined the management interventions for the Yala Swamp ecosystem
Outlined the resource mobilization strategy, implementation matrix and the
monitoring and evaluation framework.
Source: Field data (2018)

205
Unlike in the Lower Sio River Basin, empirical evidence from Morocco show that
watershed management plan is a result of a complex and time-consuming iterative
process involving baseline studies, demonstration actions, specialized studies and
significant interventions by line agencies under their regular programme of action (FAO,
2017). The Table 7.3 shows the summary of watershed management plans that exist in
the Lower Sio River Basin and highlights watershed governance issues in the plans.
Further, studies on watersheds in Ecuador, Morocco and Mauritania proved that well-
planned actions and mobilization of different funding sources facilitated the inclusion of
all possible partners in plan formulation process. As a result, local people and
associations, technical line agencies, local authorities, NGOs, universities and
international partners were brought together. The inclusive approach enhanced the
trustworthy partnership obtaining observer status in relevant regional and provincial
committees (FAO, 2017).
7.4: Policies that Support or Hinder Watershed Management and Households Food
Security
When the respondents were asked to name the new social policy programs which were
created under devolution that enhanced watershed management for food security in the
study area, it was interesting to note (Figure 7.4) that the majority 70.8% (274) of the
households in the watershed did not know any new policy not created at the county level
or the national level that enhanced watershed management for food security. More
findings indicated that 20.9% (81) of the households in the watershed acknowledged the
presence of the county environmental policy while 11.4% (44) acknowledged the
presence of water services provision policy. Out of the interviewed respondents in the

206
study, 7.2% (28) felt that agricultural development policy existed as a new social policy
to guide watershed management activities towards food security.
Figure 7.4: New Social Policy Identified at National and County Governments level by
the Households
Source: Field data (2018)
FAO (2006) noted that some of the policies whether at macro or micro levels may affect
agriculture more than other socio-economic sectors of the economy, hence, policies can
be classified into pricing and marketing, including marketing institutions; research and
extension; land, credit and financial institutions, including the role of cooperatives;
infrastructure investment, including transport and irrigation; food security and self-
sufficiency; and agricultural input policies (Kang’ethe, 2006). Although county
government policies such as Agriculture Development Fund Act 2014 and Co-operative
Development Fund Act 2014 and Busia Water and Sewerage Company Act 2015 were
formulated after devolution, the study established that there lacked a direct policy in
county environmental management reason being that the functions were not fully
devolved to the counties. These policies were envisioned to provide adaptive assistance
to the households in agriculture, water and environmental management sectors, the
N=387

207
majority of the household beneficiaries were not aware of such policies, their functions
and how they could be assisted.
The findings revealed that the service providers for the period 2013 to 2018 of devolution
in Busia County did not build the knowledge of the households on various policies at the
grassroot. Consequently, there was lack of ownership of the policies at the county level
by the primary beneficiaries which in most cases compromised implementation and
sustainability of the watershed management and food security policies and programmes.
Success in environmental policy should be redefined by how it promotes and facilitates
resilience, and by how it promotes legitimate, a broad-based development that allows
individuals and societies to cope with risk and adapt to changing circumstances over time
(Adger, 2003).
Although the above findings show that majority of the households did not know the new
social policy created under devolution that enhanced watershed management for food
security, a Chi-square test carried out on the households responses presented in Table 7.4
indicated that there was a high variation among the households with food security and
households with food insecurity on knowledge of the county environmental protection
policy, water services provision policy as well as those households who indicated that
they did not know any new social policy at p-value=0.000. These findings implied that
the knowledge of the new social policy on watershed management and food security
activities was important in determining the status of household's food security.

208
Table 7.4: Food security and Insecurity households’ measurement comparison
association amongst households knowledge on the new social policy created under
devolution that enhanced watershed management for food security Policy programs Food
insecurity
(n=214)
Food
Security
(n=173)
Differences χ2 p-value Significant
?
County Environmental
Protection Policy
5.1 40.5 35.4 72.121 0.000*** Yes
Water Services Provision
policy
4.7 19.7 15.0 21.304
0.000*** Yes
Agricultural Development
Policy
5.1 9.8 4.7 3.130 0.077* Yes
Don't know 87.4 50.3 -37.1 63.673 0.000*** Yes *p<0.1, ***p< 0.01 statistically significant difference between the households with food secure and insecure
Source: Field data (2018)
Like in other watersheds in the modern world, sustainable development and
environmental management policies in the Lower Sio Basin are no longer an affair of a
single local and national government but rather a global and or international affair. The
policy frameworks in most developing countries are driven by international
nongovernmental organizations with interest in perpetuating the demands of their mother
nations. Mfune (2012) argued that a key danger to the developing countries like Kenya is
that these organizations leave little room for the countries to articulate their own visions
of the future which end up raising the questions of ownership of the policies and
initiatives planned in areas such as local watershed management. For example, the World
Bank and International Monetary Fund (IMF) Structural Adjustment Programmes (SAPs)
policies in the late 1980s and 1990s contributed to the reduction in government
expenditure and expansion of private sector in the provision of services to the public,
affected to a larger extent is provision of government agricultural extension services
which contributed negatively to watershed management and food security (Nyangito,
2001).

209
Moreover, the introduction of the demand driven approach under the same policies has
never worked effectively in communities characterized by low level of education, lack of
information and low public participation in government-owned development forums such
as the Lower Sio River Basin communities. According to Nyangito (2001) policies that
affect agriculture are made up of government decisions that influence the level and
stability of input and output prices, public investments, costs and revenues, and allocation
of research and development funds to improve farming and agriculture-related processing
technologies. Some of these policies fail due to lack of political will, low technical and
financial capacity and weak institutional arrangements, in addition to lack of harmony
with local realities (Mfune, 2012).
The analysis of development policies and legislation indicate that since independence in
1963, Kenya has been attempting to address issues of environmental sustainability and
food security all together in its economic and social planning processes through national
policies and development plans. These efforts have yielded fruits in some cases while in
others not much has been achieved, more emphasis put on efforts to promote food
security without much consideration of soil and water management which are the basis of
food production. Currently, there are various policies and legislative frameworks that aim
at promoting watershed governance and food security that have undergone
transformations to adapt to the requirement of the Constitution of Kenya 2010 and
changing socio-ecological circumstances as presented in Table 7.5.

210
Table 7.5: Policy Derivatives of Watershed Governance under the New Devolved
System in the Lower Sio River Key Element of
watershed
governance
County
framework
Kenya (National) framework International
Framework
Decentralized
environment and
natural resources
management thus
contributing to
adaptive capacity
Agriculture
Development
Fund Act, 2014;
Cooperative
Development Act
2014; Public
Participation Act
2016; Water and
Sewerage
Services Act 2015
Constitution of Kenya (2010),
EMCA 2015, Forest Conservation
and Management Act (2016),
Intergovernmental Relations Act
(2012), National Government
Coordination Act (2013),National
Drought Management Authority
Act (2016), National Land
Commission Act (2012),Wildlife
Conservation and Management Act
(2013), Environment and Land
Court Act (2011), County
Government Act (2012), Draft
National Wetlands Conservation
and Management policy (2013),
Agriculture and Food Authority
Act (2013),CDF Act(2017),
Climate Change Act (2016), Water
Act (2016) NEAP, National Food
and Nutrition Security Policy,
2011; National Biodiversity
Strategy and Action Plan, 2007
Agenda 21 Chapter 28
on the role of major
groups and Local
Agenda
Rio Declaration
(Subsidiary Principle)
Forestry Principles
Sustainable Land
use Conservation
Agriculture, Agro-
forestry for food
security
Water and
Sewerage
Services Act,
2015; Agriculture
Development
Fund Act, 2015;
County Road
Infrastructure,
2016;
Vision 2030, National Land use
Policy, Agriculture Policy,
National Environmental Policy
(NEP), Constitution of Kenya
2010, County Government Act
(2012); Kenya Agriculture,
Fisheries and Food Authority
(AFFA) Act
Agenda 21 on
Sustainable
Agriculture
UNFCC, Convention
on Biological
Diversity
Source: Field data (2018)
Watershed governance includes action at the national, county, sub-county, ward and
village levels. Thus sound national and county policies and efficient institutions at all
levels are essential in setting up a coherent normative framework aimed at guiding local
arrangement and interventions in a consistent way (FAO, 2017). The Constitution of
Kenya (2010) presents the boldest move by National and County Governments towards
the achievement of watershed governance and food security goals. The constitution spells
out the responsibilities of both governments. Under the Bill of rights: every person has a
211
right to a clean and healthy environment, which includes the right; to have the
environment protected for the benefit of the present and future generations through
legislative and other measures, particularly those contemplated in Article 69; and to have
obligations relating to the environment fulfilled under Article 70 (GoK, 2010b).
On the other hand, the constitution provides for the right to food for all Kenyan people.
Therefore, both levels of governments must not take actions that result in increasing
levels of hunger, food insecurity and malnutrition. Further, the government must use its
resources to eradicate hunger (African Women’s Studies Centre, 2014). As evidence of
an adaptive institution, all major pieces of legislation (Acts) and regulations that existed
before the Constitution of Kenya (2010) have undergone through ratification and
amendments to conform to the spirit of the constitution thus calling for a shift in
watershed governance in Kenya.
During the study, household respondents were also asked whether watershed
management policies and programs mutually reinforce food production and distribution
in the Lower Sio River Basin. The illustration in Figure 7.5 shows that 51.7% (200) of
the households did not know, 34.6% (134) of the households indicated that watershed
management policies and programs did not mutually reinforce food production and
distribution in the watershed. However, only 13.7% (53) of the respondents agreed that
watershed management policies and programs mutually reinforce food production and
distribution in the watershed. The findings are similar to Makarius et al., (2015) finding
who found out that in Pangani River Basin in Tanzania, the majority of the smallholder
farmers and their water users’ association leaders did not know or were not aware of
water rights policies.
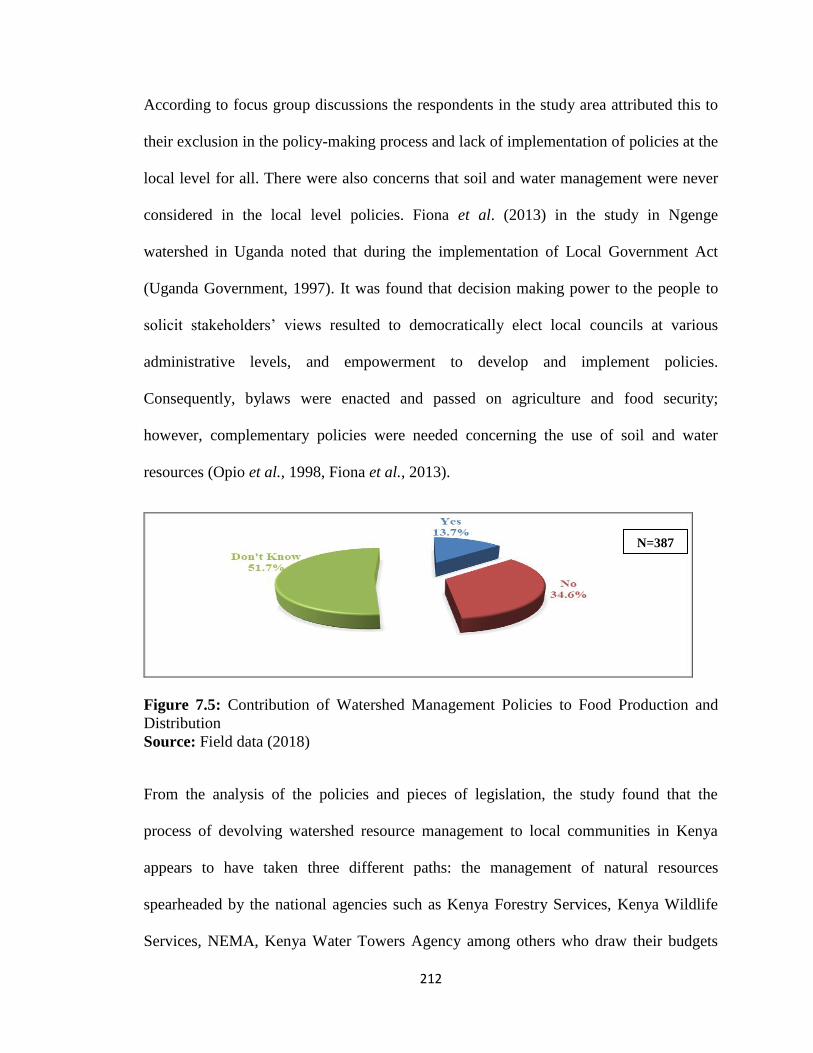
212
According to focus group discussions the respondents in the study area attributed this to
their exclusion in the policy-making process and lack of implementation of policies at the
local level for all. There were also concerns that soil and water management were never
considered in the local level policies. Fiona et al. (2013) in the study in Ngenge
watershed in Uganda noted that during the implementation of Local Government Act
(Uganda Government, 1997). It was found that decision making power to the people to
solicit stakeholders’ views resulted to democratically elect local councils at various
administrative levels, and empowerment to develop and implement policies.
Consequently, bylaws were enacted and passed on agriculture and food security;
however, complementary policies were needed concerning the use of soil and water
resources (Opio et al., 1998, Fiona et al., 2013).
Figure 7.5: Contribution of Watershed Management Policies to Food Production and
Distribution
Source: Field data (2018)
From the analysis of the policies and pieces of legislation, the study found that the
process of devolving watershed resource management to local communities in Kenya
appears to have taken three different paths: the management of natural resources
spearheaded by the national agencies such as Kenya Forestry Services, Kenya Wildlife
Services, NEMA, Kenya Water Towers Agency among others who draw their budgets
N=387

213
directly from the national government treasury. Second, those initiatives spearheaded by
the county government departments whose budgets are appropriated by the county
assemblies and drawn from the county treasury. Third, are the conservation and
management initiatives by the civil societies and non-governmental organizations that
draw their finances from donor funding. It emerged from the key informants' interviews
that, each of the actors struggles to embrace the donor at the expense of the common man
who is the intended primary beneficiary. The challenges as earlier noted are the new
policy initiatives that arose as a result of devolution in these three categories of actors
that are poorly linked and are characterized by overlapping conflicting mandates. This
was confirmed during the interview with one of the local administrator who said: -
“These people (NGOs) who come here to help us, are always conflicting
with each other in the manner in which they provide farming services to us.
We understand their aim is not to help us solve our soil resources
management problems but to promote the interests of their donors and make
the profit from us. For example, we have had WKCDD/FM and PALWECO
here, barely a year ago, and we cannot trace anything they left behind. At
the same time One Acre Fund is here purporting to help us access to farm
inputs through credit, but when the season weather patterns fail to support
good yields, we cannot afford to pay them. They auction our property and in
most cases, my colleagues who were members to such schemes have
suffered unintended loss leading to increased poverty around here.”
Further analysis showed that as a result of uncoordinated agricultural production farmers
and the environment have suffered to a greater extent. Existing evidence showed that to
provide coordination in agriculture sectors in Kenya under the Constitution of Kenya
2010, the Kenya Agriculture, Fisheries and Food Authority (AFFA) Act 2013 provides
for the establishment of the Agriculture, Fisheries and Food Authority to administrate
matters of agriculture, preservation, utilization and development of agricultural land and
related matters (GoK, 2013). Given that agriculture is a fully devolved function, the Act

214
provides that the Authority shall in consultation with the county governments among
other stakeholders: administer the Crop Act No. 16 of 2013 and the Agriculture, Fisheries
and Food Authorities Act No. 13 of 2013. This is aimed at promoting best practices in,
and regulating; the production, processing, marketing, grading, storage, collection,
transportation and warehousing of agricultural and aquatic products (GoK, 2013; African
Women’s Studies Centre, 2014).
At the county level, there are several government departments and non-governmental
organizations involved in watershed management and agricultural production with the
presence of the national level in the Lower Sio River Basin. During the interviews with
the CDALD staff, it was said:-
“Although agriculture and environment management policy functions are
supposed to be handled by the national government, the national
government was in the process of decentralizing national operations through
various departments and authorities to the county levels; sub-counties and
wards levels.”
As Koontz et al. (2015) puts it collaborative governance shares many features with
polycentricism, a similar situation to Kenya today. For example, collaborative
governance for environmental issues such as watershed management is marked by
overlapping boundaries (watersheds that cross political jurisdictions such as wards, sub-
counties and counties in Kenya and trans-boundary in case of Sio River between Kenya
and Uganda) requires a polycentrism policymaking approach. The focus is needed on a
particular issue, and power sharing across multiple jurisdictions (Schlager and Blomquist,
2008). Such political jurisdictions make it complex for adaptive co-management of the
watershed thus requires collective and integrated approaches across scales.

215
It emerged from the interviews with key informants that there were a limited integration
and collaboration between non-governmental and governmental organizations, most
organizations worked in the same areas and duplicate programs (GoK, 2016b). One of the
key informants said: -
“To harmonize the work of all stakeholders operating in the agriculture
sector at the county level, the CDALD has been developing a Sector Co-
ordination Concept which has since stalled due to differences in political
interests.”
Studies in governance indicate that institutional fragmentation across jurisdictions,
unequal power among river basin actors in different jurisdictions, a potential for high
levels of political conflict, and differences in a culture of decision making contribute to
problem contexts and can undermine efforts to make the science and policy interface
work better (Levin et al., 2012; Armitage et al., 2015). A male respondent in the group
discussions in Nang’oma location said: -
“The devolved services at the county level are characterized by politics,
tribalism and nepotism. The county leaders are blamed to take development
and more so watershed conservation interventions to their home communities
and in areas where they received much support during the elections.”
Due to conflict of interest, the CDEWNR concentrated more on the rehabilitation and
management of River Malakisi and not Sio River by engaging the women and youth
groups to form WRUAs. While along Sio River there lacked an active WRUA to be
utilized by the County government in watershed management, WRUAs under the Water
Act 2016 are formed and facilitated by WRA. This was attributed to the fact that the
Committee Member for Environment Water and Natural Resources equivalent to the

216
Minister in the National government came from Teso North Sub-county where River
Malakisi is the main source for domestic water and where the Governor received many
votes in 2013 general elections.
According to African Women’s Studies Centre, (2014) due to the highly cross-sectorial
nature and the multiple dimensional food security related issues and initiatives, a very
large number of relevant legislation, policies and strategies were carefully reviewed and
considered. Most sectors of the national economy, during the formulation of the Food and
Nutrition Security Policy (2011) as part of the institutional memory in the process were
included. Nelson and Stathers, (2009) note that institutional memory of past climate
events and traditional knowledge have dominated adaptation experiences among local
communities in Kenya. The aim was to understand and build from existing Government
and partner initiatives rather than duplicate such efforts, identifying and building on such
complementation. The FNSP is framed in the context of the Constitution of Kenya 2010
therefore, providing for basic human rights, child rights and women’s rights including the
universal Right to Food (GoK, 2011).
On the other hand, Kenya Vision (2030) although diverted environment management as
one of the key pillars of sustainable development to include political as a key pillar in
addition to economic and social pillars of development; it is a long-term development
blueprint and a significant government policy document that aims to boost sustainable
food security and watershed management in the country through various flagship
projects. The outlined development projects include; improvement of infrastructure,
conservation of soil and water resources and development of irrigation schemes, among
others. The vision for agriculture sector is to be innovative, commercially-oriented and to

217
develop a modern farm and livestock sector (GoK. 2007) while taking into consideration
soil and water resources management. Therefore, Vision 2030 forms a key driver for
watershed governance and food security policy tool upon which both national and county
government activities are supposed to be housed. In Kenya, like any other country where
the central government provides an annual development budget to local communities and
county governments to finance part of their local development plans. It is more prudent to
enrich existing plans with principles, elements and practices of watershed management
(FAO, 2017).
7.5: State and Non-State Actors in Watershed and Food Security Activities
During the analysis of the LVNCMS it was evident that there was a general common
understanding of the root causes for deficiencies in integrated co-operation in water
resources management in the catchment at policy level, including Lower Sio River Basin:
Insufficiency in resources; lack of adequate co-governance; inadequate knowledge and
skills at the community level; inadequate community engagement; lack of public
awareness of the values of the catchment assets; and lack of integrated concept for water
resource management (GoK, 2007). Similarly, Sanginga et al. (2004) found that despite
considerable progress in local government reforms in Uganda, policy-makers sought
information only to a limited extent from communities in formulating policies. When
asked to identify the main actors in watershed governance the participants in key
informants’ interviews and FGDs response was summarized in Table 7.6a and 7.6b.
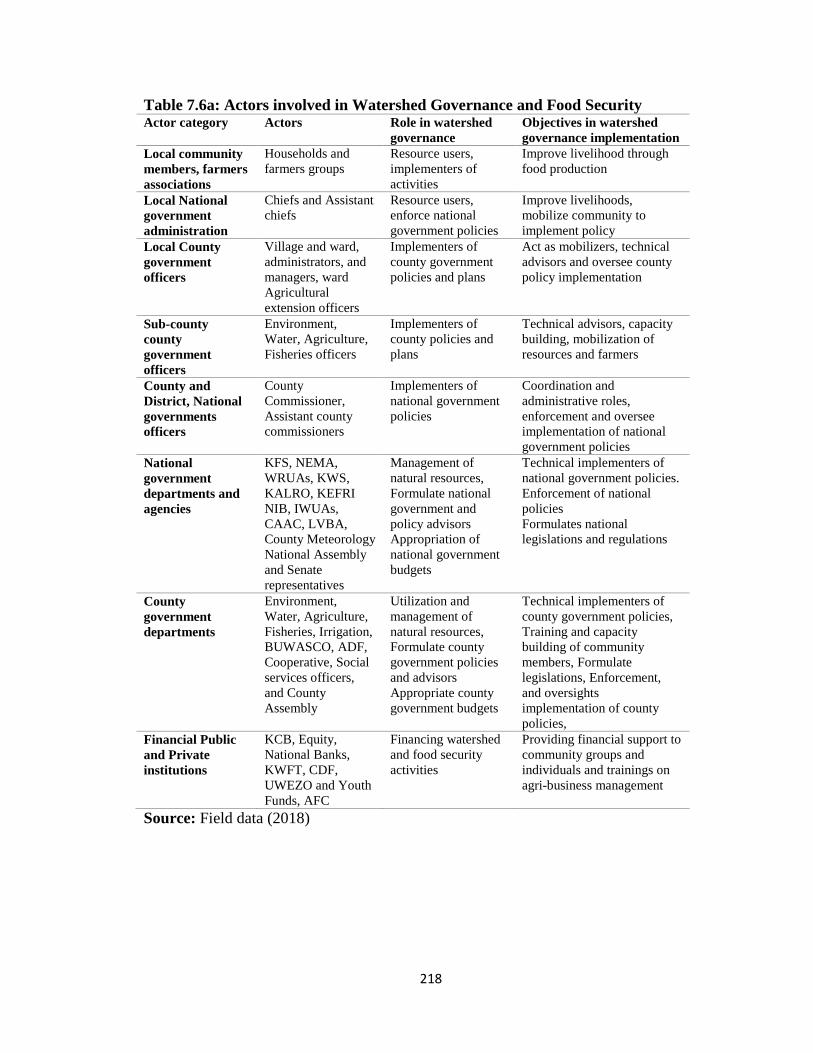
218
Table 7.6a: Actors involved in Watershed Governance and Food Security Actor category Actors Role in watershed
governance
Objectives in watershed
governance implementation
Local community
members, farmers
associations
Households and
farmers groups
Resource users,
implementers of
activities
Improve livelihood through
food production
Local National
government
administration
Chiefs and Assistant
chiefs
Resource users,
enforce national
government policies
Improve livelihoods,
mobilize community to
implement policy
Local County
government
officers
Village and ward,
administrators, and
managers, ward
Agricultural
extension officers
Implementers of
county government
policies and plans
Act as mobilizers, technical
advisors and oversee county
policy implementation
Sub-county
county
government
officers
Environment,
Water, Agriculture,
Fisheries officers
Implementers of
county policies and
plans
Technical advisors, capacity
building, mobilization of
resources and farmers
County and
District, National
governments
officers
County
Commissioner,
Assistant county
commissioners
Implementers of
national government
policies
Coordination and
administrative roles,
enforcement and oversee
implementation of national
government policies
National
government
departments and
agencies
KFS, NEMA,
WRUAs, KWS,
KALRO, KEFRI
NIB, IWUAs,
CAAC, LVBA,
County Meteorology
National Assembly
and Senate
representatives
Management of
natural resources,
Formulate national
government and
policy advisors
Appropriation of
national government
budgets
Technical implementers of
national government policies.
Enforcement of national
policies
Formulates national
legislations and regulations
County
government
departments
Environment,
Water, Agriculture,
Fisheries, Irrigation,
BUWASCO, ADF,
Cooperative, Social
services officers,
and County
Assembly
Utilization and
management of
natural resources,
Formulate county
government policies
and advisors
Appropriate county
government budgets
Technical implementers of
county government policies,
Training and capacity
building of community
members, Formulate
legislations, Enforcement,
and oversights
implementation of county
policies,
Financial Public
and Private
institutions
KCB, Equity,
National Banks,
KWFT, CDF,
UWEZO and Youth
Funds, AFC
Financing watershed
and food security
activities
Providing financial support to
community groups and
individuals and trainings on
agri-business management
Source: Field data (2018)

219
Table 7.6b: Actors involved in Watershed Governance and Food Security Actor category Actors Role in watershed
governance
Objectives in
watershed
governance
implementation
Private
entrepreneurs
Agrochemicals and
seed companies value
chain
Supply of agricultural
farm inputs
Trade in fertilizers,
seed, pesticides
Donor/International
NGOs programmes
PALWECO,
(WKCDD/FM),
ASDSP
Funding,
implementers of
policy
Mobilize funds for
projects, offer
technical advice to
county and community
Local NGOs ADS western, One
Acre Fund, IPA,
Hand in Hand,
SIMPACT
Support environment
and agriculture policy
implementation
Provide financial
support, mobilize
resources and educate
the community
CBOs, FBOs Community groups,
Churches
Empowerment of
members on policy
Training, education
and awareness creation
Source: Field data (2018)
Based on the study findings in Table 7.6a and 7.6b, in the Lower Sio River Basin, there
are various actors involved either directly or indirectly in watershed governance and food
security activities (see full list Appendix II). The stakeholders include; Community
members and groups, National Government departments and authorities, County
government departments, programmes co-funded by international donors and Kenya
National Government, International and local nongovernmental organizations, financial
institutions private business enterprises, research institutions.
Studies reveal that multi-stakeholder initiatives are increasingly established globally to
promote collective forms of watershed governance as well as creating discussion
platforms where diverse stakeholders from the public, private and civil sectors can
collaborate to improve the management of natural resources and, more broadly, to
address complex development challenges that cannot be solved by one party alone (FAO,
2017). During interviews with various key informants and community participatory
workshops, the study established that the actors have different operational models and

220
approaches to watershed management and food security. Some have different interests
and targets as well as means of mobilizing resources and the community towards
watershed management and food security.
The study found that throughout the watershed, households were largely composed of
farmers who had mobilized themselves into groups by the help of own initiatives and
actors from the non-governmental organizations. Thus formed Common Interest Groups
(CIGs) whereby community members organized themselves together to achieve a
common purpose (FAO, 2005a; 2017). Examples of community groups listed by the
respondents were groups mobilized to engage in activities of WKCDD/FMP,
PALWECO, One Acre Fund, and ADS Western, Hand in Hand among others. One of the
Female respondents at Syekunya Location said: -
“Most farmers’ groups are trained and capacity built by the mobilizing
organizations in their areas of interest. Examples, One Acre Fund groups we
are trained in land preparation, seed planting, harvesting and storage of farm
produce. While Hand in Hand and ADS Western, groups are trained on table
banking, merry-go-round for financial mobilization and financial
management alongside the formation of farmers groups to access
government and other donor services.”
Based on Jayne et al. (2006) and Patt et al. (2012) argument, farmer-driven organizations
success depend on how well they coordinate with both public and private sector players
to streamline food and natural resource systems and without excluding smallholders. This
plays a key role in whether or not small farmers were able to take up improved practices
that will allow them to adapt to their changing circumstances and, in the longer run, to a
changing climate and social systems as well.

221
Further, interviews and group discussions revealed that the organizations also linked the
community to the county and national government technical officers. For example, the
groups were mobilized by ADS to register and license by the County Department of
Social Services and Department of Cooperative Societies Management, and obtained
legally recognized certificates of registration. This was done after the groups were trained
to come up with group operational by-laws and group constitutions for regulation of
members' activities and behaviour. Evidence shows that working with individual
households requires more attention, resources and efforts than working with households
organized in a group (FAO, 2017). One of the female respondents at Kisosko Location
said: -
“Before community groups are legally recognized, the groups elect the
leaders to manage groups' affairs. After the registration, the groups open
bank accounts where monies from members' contributions or donor-financed
activities are channeled. The same was done in community interest groups
(CIGs) which were used to implement and benefited from the WKCDD/FM
and PALWECO programs.”
Fiona et al. (2013) found that in Ngenge watershed in Uganda, apart from associations,
farmers mainly interacted through farmers’ groups that were not successful except in a
few areas midstream. Therefore, to facilitate the groups, building capacity for co-
operation with government departments was necessary. Another important strategy was
to form partnerships within the watershed and link farmers to other stakeholders who
have the knowledge they needed (Kessler, 2006). A male respondent in Namboboto
Location said: -

222
“Community groups have failed to integrate all community members
interested in the activities. As a result, the majority of those not in groups do
not benefit from the group activities. In addition, there are concerns that the
community groups in most cases benefit from multiple donor actors for the
same activities resulting in duplication and embezzlement of funds for
projects from donor organizations.”
The finding was similar to the situation found in Ngenge watershed (Fiona et al., 2013)
during the stakeholder analysis; it was found that categories of key stakeholders were
always avoided at the community level watershed forums. Among them were highly
influential people such as elders, religious leaders, retired civil servants, and the security
forces, and specific types of farmers living under marginal socio-economic conditions,
such as tenant farmers, who may not be interested in soil and water conservation. This is
because they did not own the land, and landowners, who may not be very much involved
in land management because they mostly hire out their land. Moreover, the majority of
the households during the focus group discussions felt that the groups were formed for
short-term agendas and collapsed upon the end of the main donor engagement. Rastogi et
al. (2009) contended that it was possible within one stakeholder group such as a
community, diversity of perception to occur, making the possible further breakdown of
other groups and thus bringing other factors into play.
The interviewed community members were concerned that they did not prioritize most of
watershed management activities such as soil and water management activities,
including: as terracing, the building of gabions, tree planting, use of organic manure,
cover cropping among others because these activities were not the main project agenda of
the donor organizations. Similarly, it was argued that some of the soil and water

223
conservation projects were easy targets for corruption after the allocation of funds by the
County government and donors. One male respondent in Nang’oma Location said: -
“There was an allocation of KES. 20 Million= USD 20,000 for tree planting
on the hilltops in Matayos and Funyula Sub-counties by the County
government in 2014/2015 county budget. The tree planting was never
implemented while funds were allocated and disbursed; the matter was
forwarded to the Senate for investigation and sanctioning of the culprits by
Kengele Forum a civil society group in Busia County. Until now, no
response has been given to people of us concerning the matter at the Senate.”
Such misallocation and corruption are governance problems (Mathews, 2012) which need
to be addressed for future efficiency of watershed management. Furthermore, a male
respondent at a focus group discussion held at Musoko Location said: -
“Organizations such as One Acre Fund and Innovation Poverty Action whose
programme approach is to offer farm inputs on credit or inform of loans to us
farmers were harassing us when it comes to repayment of the loans. The
household heads attributed this to the fact that farming activities in the
watershed are dependent on weather conditions. In most cases, we incur
losses when crops fail due to unfavourable weather conditions such as
insufficient rainfall.”
However, the farmers were expected to repay the loans as agreed at the inception of the
contract. The organizations neither insured nor waived loans during unfavourable
weather conditions which resulted in farmers' losses, the perpetuation of poverty and
collapsing of the farmers' groups. Thus the households raised concern with the manner in
which such actors' activities were not regulated by the county to stop the exploitation of
poor farmers. Another key actor in the study was the County Government of Busia.
According to the Constitution of Kenya (2010), in the Fourth Schedule on the distribution
of functions between the national government and the county governments is captured in

224
Part 2. The functions and power of the county covernments in relation to watershed
management and food security include development of agriculture both crop and animal
husbandry and to develop county transport including the establishment of county roads.
Trade development and regulation include cooperative societies together with county
planning and development including land survey and mapping. Implementation of
specific national government policies on natural resources and environmental
conservation, including soil and water conservation and forestry, county public works
and services, including storm water management systems and water and sanitation
services. Disaster management and ensuring and coordinating participation of
communities and locations in governance at the local level and assisting communities and
locations to develop the administrative capacity for the effective exercise of the functions
and power and participation in governance at the local level (GoK, 2010).
To deliver the constitutional mandates, the County Government Act (2012), established
the County Executive and County Assembly arms of the county governments. The county
executive is made up of county government departments that are mandated to provide
devolved functions services to the citizens while the county assembly is mandated to
represent, legislate, oversight, appropriate county budgets and approve development
plans made by the county executive departments (GoK, 2012). However, one male youth
respondent at Nambuku Location said: -

225
“Members of the County Assemblies (MCAs) who are the elected members
at the ward level have not invested in legislation and oversight on
programmes related to watershed management and food security at the ward
level. MCAs are allocated Ward Development Funds (WDF) to enable the
wards they represent prioritize community developments but still, watershed
management is not prioritized. This is made worse by low levels of
knowledge and skills among the MCAs in watershed management and food
security strategies.”
The discussions proved that some of the MCAs do not possess higher levels of education
and majority had the only secondary education. The County Government Act (2012) did
not spell out the minimum qualifications for the MCAs. An example given at Nambale
group discussion was the failure of the County Assembly to pass the Busia County
Biodiversity Policy, (2016). The policy was developed by KALRO in collaboration and
funding from FAO. The failure to enact and pass the policy in the County Assembly was
attributed to low levels of knowledge on the importance of the drafted policy in
conservation, management and preservation of watershed resources at the county level
for food and nutritional security. This is despite the fact that losses of biodiversity and
food insecurity were main developmental challenges in the county.
Another concern from the community workshops was that the county departments were
not working in harmony since there was lack of coordination for collective delivery of the
devolved functions that was occasioned by the struggle based on tribal lines. For
example, what goes to the Luhya side and what goes to the Teso side, the main
communities in Busia County among the County Executive Committee Members (CECs)
and Chief Officers (COs) over control departmental financial resources. A key
interviewee who worked with the county government said: -

226
“The departmental directors and other technical staff are not well facilitated
to provide services to the ordinary citizens in the watershed. Although there
is a County Integrated Development Plan (CIDP), the county departments
lack a common vision and goal on the utilization and management of
watershed resources for food security. An example is the housing of the
County Directorate of Irrigation, initially, the directorate was housed under
the CDALD, and however recently, the directorate was transferred to the
CDEWNR.”
This led to confusion and misunderstanding of roles and responsibilities of the
Directorate of Irrigation, how it was supposed to be facilitated to provide services to the
citizens. Further, some key informants urged that the directorate was responsible for the
provision of water for crops and thus played a key role in ensuring food security and thus
should be housed under the CDALD. While other key informants observed that the
Directorate of irrigation utilizes water resources, therefore, for its effectiveness and
efficiency in the allocation of county resources it was worth to be housed under the
CDEWNR. Adaptability of the departmental structures at the county level with the aim of
delivering intended services to the citizens is important. Since adaptive institutions are
able to cope with multiple ambiguous objectives inherent in such social-ecological
systems (Pahl-Wostl, 2009). The respondents felt that the lead county departments such
as CDALD and CDEWNR had not put in place a mechanism to regulate watershed
activities of other actors such as local non-governmental organizations a reason for
advancing watershed resources degradation in the Lower Sio River Basin.
Alongside the departmental limitations, the county assembly was also blamed for failing
to make laws, appropriate budgets, represent and provide oversight on watershed
management and food security in the county. During the group discussions at Namboboto

227
shopping Centre, community members indicated that the grassroots county officers such
as Ward Agricultural Extension Officers were not well facilitated to provide extension
services to the farmers in watershed management; alongside carrying out other functions
the majority were left at the mercy of the MCAs thus perpetuating partisan interests and
exclusion in provision of service to the farmers.
Under the Fourth Schedule of the Constitution of Kenya (2010), Part 1; the National
Government functions that relates to watershed management and food security include:
the use of international waters and water resources, securing sufficient residual water,
hydraulic engineering and the safety of dams; protection of the environment and natural
resources with a view to establishing a durable and sustainable systems of development,
including fishing, wildlife, water protection; disaster management; and agricultural policy
development. As a result, various national governments ministry departments and
authorities are mandated to operate in the Lower Sio River Basin to actualize the
constitutional mandates of the national government. These include; KFS, NEMA,
WRUAs, KWS, KALRO, KEFRI, NIB, IWUAs, CAAC, and LVBA. During the key
informant interviews, the study found out that some departments including NEMA, KFS
and KWS were understaffed at the county level.
The study noted the need to tackle the challenge of low community engagement in
forestry services and environmental management in the Lower Sio River Basin. The
County Director of Forestry indicated that the KFS County Department had promoted the
establishment of Eco-Green Kenya, a local based Youth-led non-governmental

228
organization. KFS helped the organization in the mobilization of youths, capacity
building and networking with other actors in environment and forestry conservation and
management. The respondent further observed that the NGO was housed in county KFS
compound so that it promotes community engagement in environment and forestry
services in collaboration with KFS. KFS County Directors said: -
“Eco-Green Kenya NGO in 2016 secured KES.6 Million=USD 60000 from
Kenya Commercial Bank (KCB) as cooperate social responsibility. The
funds were used by the NGO and KFS to engage the community in tree
planting and soil conservation activities at Siteko wetland areas thus
contributing to the implementation of the Sio-siteko Community Wetland
Management Programme. In addition, the NGO is being used by KFS and
KEFRI to promote the planting of the bamboo tree and Eco-tourism across
the watershed and the county in general.”
The findings from key informants’ interviews including the local administration such as
Assistant County Commissioners, Chiefs, and Assistant Chiefs showed that there was a
gap left in enforcement and implementation of national environmental conservation and
agriculture development laws at the grassroot created by the devolved system of
governance. It was revealed that the former district, division and location level
agriculture committees under the provincial administration were used to ensure that all
stakeholders in agricultural production were coordinated and activities regulated.
However, the best practice was missing upon devolution in the year 2013.
It was further reported that the grassroots committees were well integrated into the
Provincial Agricultural Board and National Agricultural Board which were mandated to
make agricultural decisions at different level of jurisdictions. Furthermore, it was

229
reported that the committees were all inclusive and comprised of the representative from;
farmers at the location and divisional committees, district agricultural officer and other
key agricultural stakeholders at each level. More so, the respondents singled out a gap in
watershed governance that resulted from the abandonment of the famous Chiefs Act in
Kenya. Assistant County Commissioner at Funyula said: -
“The Chiefs Act gave the Chiefs and their Assistants powers to enforce, soil
and water conservation and management activities such as terracing, the
building of gabions, maintaining 30 Meter Buffer zone in the riparian zones
which promoted watershed management in the riparian zone. They also
prevented farmers from harvesting and selling food crops before maturing
such as green maize as a measure to food security. Currently, under the
national and county governance system, the Chiefs and their Assistants do
not have same powers to enforce soil and water conservation and
management activities leading to the increased destruction of soil and water
resources in most parts of Kenya.”
According to the interviews with the Assistant County Commissioners, the current
National Government Co-ordination Act (2012) does not expressly give any powers to
the establishment, roles and responsibilities of the chiefs and their assistants’ thus
promoting negligence of watershed conservation at the community level. The researcher
witnessed a chief at Musokoto location adjudicating on sand harvesting matter that had
been presented before the chief by a widow who alleged that two male youths had
trespassed to her land to harvest sand. During the hearing of the matter, the chief had only
to use threats to stop the youth from such activities but could not arrest and sanction the
culprits as before the current governance system. The interviewed chiefs and assistant
chiefs also blamed the county system for neglecting their role in the governance at the
wards and village levels. The Chief at Musokoto Location said: -

230
“We and our assistants’ roles were taken away by the county ward
administrator and village administrators who do not understand very well
their role in soil, water management and food security. The wards and
villages administrators are blamed for promoting exclusion and partisan
interests at the expense of service delivery for all at the community level and
serve the interests of their bosses at the county headquarters.”
On the other hand, the study revealed that the existence of Intergovernmental Act of
(2012), spelt out how the national and county governments were supposed to work
together to ensure good governance and service delivery to the citizens under devolution.
However, there was total lack of proper co-ordination between the national and county
government departmental functions at the county level. This was attributed to differences
that arise on who should control financial resources although the target primary
beneficiaries were the community members. The example given during the interviews
with key informants was the working relationship between the National Irrigation Board
(NIB) and the County Directorate of Irrigation. The NIB was created by an Act of
parliament as an independent institution mandated to carry out irrigation water supply
projects for large-scale irrigation schemes countrywide.
According to the interviews, the NIB activities were regulated by the NIB Act, which
mandated the board to implement huge flagship irrigation projects with the aim of
providing water for crops and thus promoting food security. However, it was noted
during the interviews that the board operates in the county using same community
members and resources that are under the jurisdiction of the county government, but the
county government could not hold the board accountable for irrigation activities in the
county nor the board was mandated to work with the County Directorate of Irrigation to
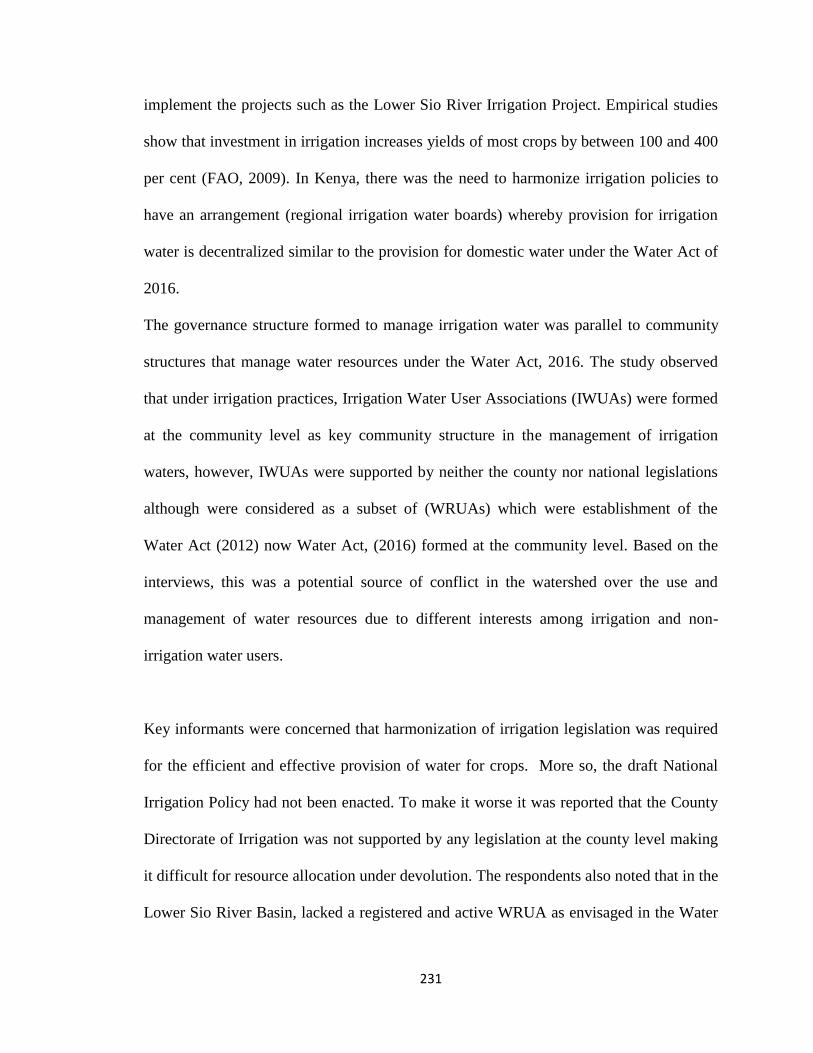
231
implement the projects such as the Lower Sio River Irrigation Project. Empirical studies
show that investment in irrigation increases yields of most crops by between 100 and 400
per cent (FAO, 2009). In Kenya, there was the need to harmonize irrigation policies to
have an arrangement (regional irrigation water boards) whereby provision for irrigation
water is decentralized similar to the provision for domestic water under the Water Act of
2016.
The governance structure formed to manage irrigation water was parallel to community
structures that manage water resources under the Water Act, 2016. The study observed
that under irrigation practices, Irrigation Water User Associations (IWUAs) were formed
at the community level as key community structure in the management of irrigation
waters, however, IWUAs were supported by neither the county nor national legislations
although were considered as a subset of (WRUAs) which were establishment of the
Water Act (2012) now Water Act, (2016) formed at the community level. Based on the
interviews, this was a potential source of conflict in the watershed over the use and
management of water resources due to different interests among irrigation and non-
irrigation water users.
Key informants were concerned that harmonization of irrigation legislation was required
for the efficient and effective provision of water for crops. More so, the draft National
Irrigation Policy had not been enacted. To make it worse it was reported that the County
Directorate of Irrigation was not supported by any legislation at the county level making
it difficult for resource allocation under devolution. The respondents also noted that in the
Lower Sio River Basin, lacked a registered and active WRUA as envisaged in the Water

232
Act (2016); the County Director of Forestry also confirmed absence of Community
Forestry Associations (CFAs) to help in watershed management through forestry
management despite the report that the tree cover in the county was below the required
10% (GoK, 2013b).
Based on the key informant interviews it was also indicated that different political
interests at the watershed level were possible due to the existence of the actors from the
national and county government. The reasons advanced for this argument was that the
national government was implementing the Jubilee rulling party (National government
political alliance) government manifesto or development agenda, while the county
government was implementing its own agenda inclined towards the National Super
Alliance (NASA opposition political alliance) development agenda. As a result, the
interviewees indicated that there were possibilities of conflicting projects at the
watershed level based on political rivalry on watershed management for food security.
An example given was the stalled Lower Sio Basin Irrigation Scheme Project, which was
the national government project financed and implemented through NIB.
It was reported that the county government and other county leaders such as the Members
of Parliament (MPs) did not have the direct mandate to hold NIB accountable to complete
the project. Elsewhere, the Colorado Basin Study pointed at multi-agency and multi-
government effort to offer an example of how a broad array of non-state and state actors
in a watershed, along with diverse scientific expertise, can be brought together to re-
define watershed management problems, and to incorporate science into decision making

233
about current and projected challenges (United States Department of the Interior, 2012).
This was not the case at the Lower Sio River Basin where actors’ conflicts were always
expected. Elsewhere, FAO (2017) observed that managing collaborative action and
planning at the watershed level is an increasingly popular approach for balancing local
needs, global challenges and addressing both environmental protection and food
production goals.
7.6: Collaboration and Approach in Watershed Governance and Food Security
Results showed in Table 7.7 that in the Lower Sio River Basin, there were collaborations
among actors. These included; Government of Kenya and other International
Governments; National and County government departments, Western Kenya
Community-Driven Development and Flood Mitigation (WKCDD/FMP); Programme for
Agriculture and Livelihoods in Western Communities (PALWECO); Agricultural Sector
Development Support Programme (ASDSP); Anglican Development Services (ADS-
Western) and Agriculture Development Fund (ADF) among other actors. This is
exhibited by the global requirements of Agenda 21 that called for effective participation
of a broad range of stakeholders in the management of natural; environmental resources;
Our Common Future on another hand that called for the strengthening of the interaction
between governments, NGOs and scientist (UNEP, 2007). The departure opened a forum
for multiple stakeholders’ involvement in watershed management activities of a given
locality at a given time. Evidence showed that promoting collaborative action at the
watershed has been proved to have many advantages other than making the planning,
implementation and supervision of activities easier, more concentrated faster and more
cost efficient (FAO, 2017).

234
The new county and national watershed management policies in Kenya do not only seek
to involve many stakeholders but also devolving watershed resource management to
appropriate local level institutions (GoK, 2015). In order to devolve watershed
management to the local population, the Constitution of Kenya (2010) requires the full
involvement of the public in the decision-making process on matters that directly affect
their livelihoods. This is translated to the county government where the emphasis is
placed on public participation in all development processes. According to Fiona et al.
(2013) the success of collaboration processes in the watershed planning workshops, result
in action and work plans, and the general satisfaction among the participants in the
process. The study interrogated the key actors’ programmes that were identified by the
majority of the households during household interviews, key informant and focus group
discussions and documented as case studies in Table 7.7:
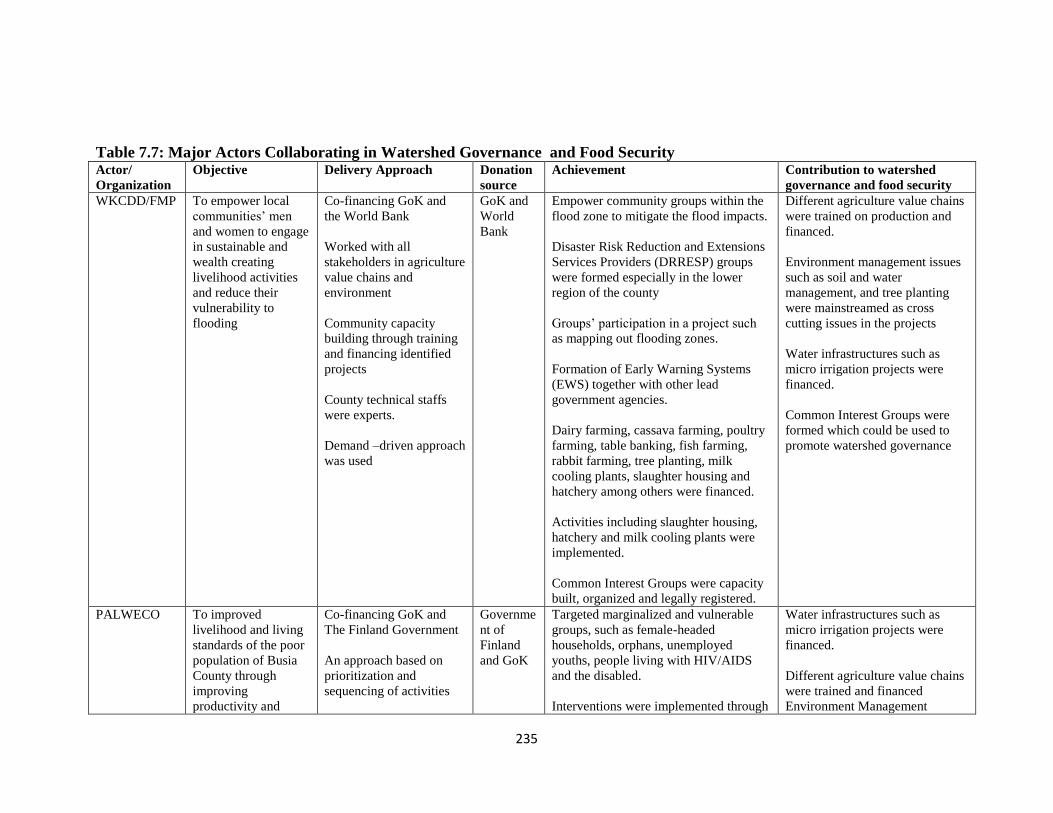
235
Table 7.7: Major Actors Collaborating in Watershed Governance and Food Security Actor/
Organization
Objective Delivery Approach Donation
source
Achievement Contribution to watershed
governance and food security
WKCDD/FMP To empower local
communities’ men
and women to engage
in sustainable and
wealth creating
livelihood activities
and reduce their
vulnerability to
flooding
Co-financing GoK and
the World Bank
Worked with all
stakeholders in agriculture
value chains and
environment
Community capacity
building through training
and financing identified
projects
County technical staffs
were experts.
Demand –driven approach
was used
GoK and
World
Bank
Empower community groups within the
flood zone to mitigate the flood impacts.
Disaster Risk Reduction and Extensions
Services Providers (DRRESP) groups
were formed especially in the lower
region of the county
Groups’ participation in a project such
as mapping out flooding zones.
Formation of Early Warning Systems
(EWS) together with other lead
government agencies.
Dairy farming, cassava farming, poultry
farming, table banking, fish farming,
rabbit farming, tree planting, milk
cooling plants, slaughter housing and
hatchery among others were financed.
Activities including slaughter housing,
hatchery and milk cooling plants were
implemented.
Common Interest Groups were capacity
built, organized and legally registered.
Different agriculture value chains
were trained on production and
financed.
Environment management issues
such as soil and water
management, and tree planting
were mainstreamed as cross
cutting issues in the projects
Water infrastructures such as
micro irrigation projects were
financed.
Common Interest Groups were
formed which could be used to
promote watershed governance
PALWECO To improved
livelihood and living
standards of the poor
population of Busia
County through
improving
productivity and
Co-financing GoK and
The Finland Government
An approach based on
prioritization and
sequencing of activities
Governme
nt of
Finland
and GoK
Targeted marginalized and vulnerable
groups, such as female-headed
households, orphans, unemployed
youths, people living with HIV/AIDS
and the disabled.
Interventions were implemented through
Water infrastructures such as
micro irrigation projects were
financed.
Different agriculture value chains
were trained and financed
Environment Management

236
incomes from
agriculture
Promotion of co-operation
with other development
projects and donor
agencies.
Use of community
planning cycle tools
Use of local labour and
resources.
The demand-driven
approach was used
the service providers, including national
and county government technical staff,
private service providers, common
interest groups and NGOs.
Programme contributed to the
development of county integrated
development plan,
Routinely maintenance of rural roads
Training and financing different
agricultural value chains
activities were mainstreamed as
cross cutting issues through the
value chains.
Common interest groups were
capacity built on engagement in
county governance such as county
planning and budgeting process.
ASDSP To facilitate the
development of
agricultural value
chains
Co-financed by the
Kenyan government
through the Ministry of
Agriculture and the
Sweden Development
Agency
convening and
coordinating stakeholder
forums,
Providing training and
facilitating linkages
between various
agricultural value chain
actors
Operated on a cost-
sharing basis, with the
major forums funded by
ASDSP at the initial
stages and progressively
by other stakeholders
GoK and
Sweden
governme
nt
Facilitated the development of
agricultural value chains in Busia
County.
Farmers in fish, groundnut and improved
poultry agricultural value chains were
supported through training
Organization of Participatory Scenario
Planning (PSP) forums (MET, MoA
departments, CBOs ), development of
various value chain concepts, and
dissemination of scientific and
traditional early warning weather and
climatic information
Agriculture value chains were
organized and capacity built
through trainings
Weather and climatic information
were disseminated to farmers
through barazas.
Watershed governance issues
were implemented as cross-
cutting issues through
environment resilience
management component.
ADS-western Focus on building Co-financing of activities Bread for Formation of Common Interest Groups Linked farmers to key

237
self-reliant
communities in
which participating
rural communities
have a sustainable
socio-economic
development
The overall strategy of the
organization is to
influence and strengthen
local communities’
capacities to mobilize and
access equitable resources
towards sustainable
development and good
governance.
Farmers to farmers’
approach
the World,
Germany,
USAID
KAVES
(CIGs),
Training on business management (such
as on tree nursery management) and
linking rural farmers with County
departments and other development
stakeholders.
Linked farmers to national and county
departments and other stakeholders in
agriculture, environment, water, health
and research institutions for accessing
services offered
Organized farmers field days and field
demonstration for technology uptake
departments of agriculture, water
and environment where services
such as tree planting, improved
agricultural production were
targeted..
Simpact Kenya
NGO
Promote the
conservation of the
environment through
organic farming
Worked together with the
county department of
agriculture, and other
stakeholders such as
NGOs in promoting
organic farming
Adventist
Developm
ent
Organizati
on
(ADRA)
mainly promoting organic farming of
Sesame (Simsim) production
Domestication of international
and national organic farming
concepts through use of local
language and practices to
conserve soil and water resources
See Appendix IX
Agriculture
Development
Fund (ADF)
Formed through the
Act of Busia County
Assembly to provide
agricultural based
credit to small and
medium scale
farmers in the county
Provided cheap financial
credit to farmers at 4%
interest rate per year.
County
governme
nt of
Busia
Mainly provided cheap financial support
to farmers of different value chains in all
wards of Busia County.
Agricultural value chains
supported were expected to
mainstream watershed
management and conservation
activities.
Source: Filed data, (2018)

238
Findings in Table 7.7 showed that there is enough evidence that the collaboration among
actors exhibited: Co-financing of agriculture and livelihood development interventions
between the government of Kenya and international governments' organizations, local
nongovernmental and international nongovernmental organizations, the national
government of Kenya and the County government. For example, ADF provided cheap
loans for farmers at a rate of 4% per annum with no collateral as compared to commercial
banks which provide loans at 14% per annum in addition to collateral. The selected cases
mainly targeted livelihoods improvement through agri-business agricultural production
projects. Studies by FAO (2017) have shown that development assistance provides a safe
operating space to demonstrate and field-test innovative practices, approaches and forms
of cross-sectoral collaboration for the sustainable management of natural resources and to
facilitate adoption and uptake by local stakeholders through national programmes.
Based on the findings, the approach targeted households in Common Interest Groups
(CIGs) where an integrated approach of service delivery bringing together; CIGs, local
leaders, sub-county, county, national technical expertise and international donors were
involved in the programmes cycle. However, the study noted that environment and
watershed governance and management issues in the identified programmes were
targeted as cross-cutting issues. This resulted, in reducing the gap between the county
service providers and the rural farmers. Nambuku Ward Agricultural Officer said: -
“The project has involved me as a technical expert in agricultural extension
at the ward level. We currently face a problem of getting to farmers through
the needed ‘demand driven’ approach the government is using to help
farmers. Most of our framers have since been left out, our county government
does not facilitate us with necessary resources to get to the farmers, we only
earn salaries with empty motorcycles, and these have made most of us to
neglect our roles. I used to wake up in the morning but I did not know where

239
to start from. With ADS Western intervention, my work has been made
easier and more organized; I can now plan for the activities and reach out to
farmers through meetings in CIGs and with little facilitation from ADS and
partners like USAID KAVES.”
The study also revealed that the main actors identified used demand-driven approach to
deliver programme activities. The approach according to the respondents' disadvantaged
watershed management activities. The majority of households were farmers with the
primary level of education, did not have sufficient knowledge to mainstream or demand
effectively for watershed management services from government extension officers.
Designing of CIGs proposals and implementation of the activities missed watershed
governance and management priorities and the interest of agri-business override the need
to ensure that soil and water resources were well utilized for sustainable agri-business
activities.
Consequently, households who did not belong to CIGs were left out and most CIGs were
dominated by opinion leader households who depended on almost all programmes at the
same time in training, demonstrations and finances leading inequalities. These crowd out
a large number of households as well as limited the multiplier effect of the programmes.
Studies in Ecuador, Morocco and Mauritania showed that collaboration with several
partner institutions fostered the integrated dimension of the watershed management plan,
triggered specialized studies in various areas such as forest regeneration, transhumance,
rangeland management and value chain development which supported plans formulation
(FAO, 2017).

240
7.7: Capacity offered by Actors in Watershed and Food Security Activities
Table 7.8 shows that 36.7% (142) of the households indicated that actors' activities
contributed to land management. On the other hand, 8.0% (31) and 18.3% (71) agreed
that the actors contributed to forest management and watershed planning respectively.
Although most of the state and non-state actors' activities targeted farmers who had been
organized in groups or in some cases the CIGs and specific to agricultural products value
chains, only 24.3% (94) of the total households acknowledged that the actors' activities
contributed to farmers' co-ordination in the basin. However, interviews with
representatives of various non-governmental organizations in the basin revealed that most
of the organizations used integrated approaches that targeted to address the whole
agricultural production value chains, from farmers’ groups formation, capacity building
through training, to demonstrations' on land, water and crop management to marketing
and agri-businesses. Other resources and capacities offered by the actors.
Table 7.8: Watershed Management Knowledge and Resources Created by Actors to
contribute to Food Production and Distribution Watershed management knowledge and
resources
Frequency
(N=387)
Percentage of HH
Land management 142 36.7
Farmers coordination 94 24.3
Sustainable agricultural production 76 19.6
Information and communication 76 19.6
Watershed planning 71 18.3
Agri-business marketing 46 11.9
Forest Management 31 8.0
Stream restoration 20 5.2
Water quality monitoring 20 5.2
Watershed law making 19 4.9
Research and training 13 3.4
Advocacy and lobbying 8 2.1
Fund raising 8 2.1
Wetland restoration 5 1.3
Policy making and influencing decisions 0 0.0
Source: Filed data, (2018)

241
Makarius et al. (2015), and Lein and Tagseth (2009) contended that it is essential to
improve watershed conservation through water governance and strengthening water user
associations through training and financial provision for modernizing infrastructures. The
interviews with the household respondents indicated that 41.3% (160) households did not
know whether the watershed management knowledge and resources created by various
actors enhanced the legitimacy of and public support for food security interventions. In
addition, 30.0% (116) households indicated that the watershed management knowledge
and resources created by actors did not enhance the legitimacy and public support for
food security intervention in the study area. However, only 28.7% (111) households
agreed that the watershed management knowledge and resources provided by various
actors in the watershed enhanced the legitimacy and public support for food security
interventions as shown in Figure 7.6.
Figure 7.6: Role of Actors in Watershed Management Knowledge and Resources in
enhancing Food Security Interventions
Source: Field data, (2018)
However, Chi-square test carried out on household responses and presented in Table 7.9
showed that watershed management knowledge and resources created by various actors
enhanced the legitimacy, and public support for households’ food security interventions
N=387
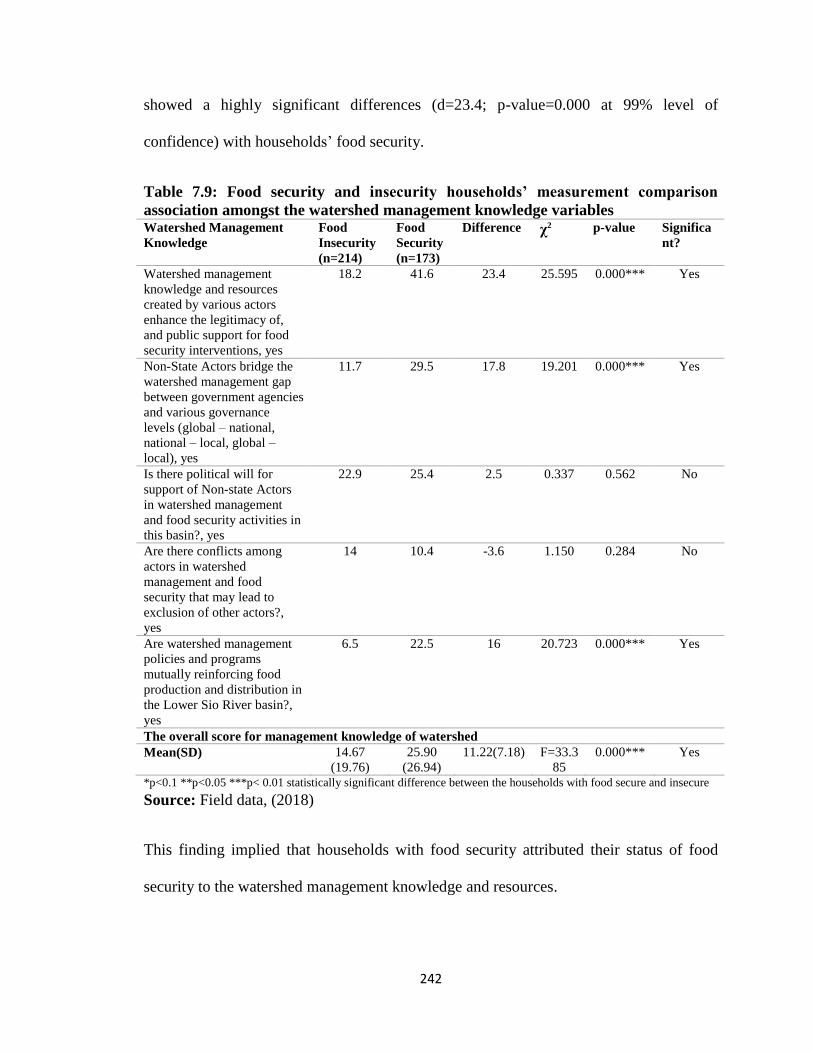
242
showed a highly significant differences (d=23.4; p-value=0.000 at 99% level of
confidence) with households’ food security.
Table 7.9: Food security and insecurity households’ measurement comparison
association amongst the watershed management knowledge variables Watershed Management
Knowledge
Food
Insecurity
(n=214)
Food
Security
(n=173)
Difference χ2 p-value Significa
nt?
Watershed management
knowledge and resources
created by various actors
enhance the legitimacy of,
and public support for food
security interventions, yes
18.2 41.6 23.4 25.595 0.000*** Yes
Non-State Actors bridge the
watershed management gap
between government agencies
and various governance
levels (global – national,
national – local, global –
local), yes
11.7 29.5 17.8 19.201 0.000*** Yes
Is there political will for
support of Non-state Actors
in watershed management
and food security activities in
this basin?, yes
22.9 25.4 2.5 0.337 0.562 No
Are there conflicts among
actors in watershed
management and food
security that may lead to
exclusion of other actors?,
yes
14 10.4 -3.6 1.150 0.284 No
Are watershed management
policies and programs
mutually reinforcing food
production and distribution in
the Lower Sio River basin?,
yes
6.5 22.5 16 20.723 0.000*** Yes
The overall score for management knowledge of watershed
Mean(SD) 14.67
(19.76)
25.90
(26.94)
11.22(7.18) F=33.3
85
0.000***
Yes
*p<0.1 **p<0.05 ***p< 0.01 statistically significant difference between the households with food secure and insecure
Source: Field data, (2018)
This finding implied that households with food security attributed their status of food
security to the watershed management knowledge and resources.

243
When the respondents were asked whether the Non-State Actors activities bridged the
watershed management gap between government agencies and various governance levels
(global – national, national – local, global-local), the findings in Figure 7.7 illustrates that
46.5% (180) households did not know while 33.9% (131) said did not. Only 19.6% (76)
households answered in affirmative. The findings are attributed to low levels of
knowledge on actors' programmes visions and goals as well as low levels of involvement
of the households in policies and programme formulation, planning, implementation and
evaluation as earlier indicated.
Figure 7.7: Role of Non-State Actors on the Watershed Management Gap between
Government Agencies at various Governance levels
Source: Field data (2018)
The Chi-square test presented in Table 7.9 indicate that watershed management gap
bridged by Non-State Actors between government agencies and various governance
levels (global – national, national – local, global-local) showed a highly significant
differences with household food security at d=17.8; p-value= 0.000 at 99% level of
confidence meaning that for those households who were food secure, it was reported that
watershed management gaps were bridged by Non-state Actors more than those
households who reported to be food insecure.
N=387

244
Further, when the respondents were asked whether there was political will for support of
Non-State Actors in watershed management and food security activities in the watershed,
the study findings in Figure 7.8 depicts that 46.5% (180) respondents did not know while
29.5% (114) responded no. Only 24.0% (93) households in the watershed responded yes
implying that they agreed that there was a political will for support of Non-State Actors
in watershed management and food security activities.
Figure 7.8: Influence of Political Will in Support of Non-state Actors in Watershed
Management and Food Security Activities
Source: Field data (2018)
The Chi-square test presented in Table 7.9 did not find any significant influence of
political will support for Non-State Actors in watershed management and status of
households’ food security. World Bank (2010) indicated that politicians provide public
services and support to clients in exchange for political advantage. Furthermore, Elias et
al. (2015) cited earlier studies in Ethiopia by Cohen and Lemma (2011) and Berhanu
(2014) who found that the implicit goal in establishing uncontested monopoly over
Ethiopia’s agricultural extension system was driven by the lust for obtaining legitimacy
and acceptance from smallholders whose support was instrumental in averting threats and
boosting prospects for unhindered regime survival and security under the façade of
periodic electoral exercises.
N=387

245
7.8: Conflicts in Watershed Governance that Hinder Food Security Goals
Based on the findings in Figure 7.9, the study indicated that 43% (167) households were
able to identify human to human conflicts that resulted from watershed governance issues
to be the major hindrance to food security goals in the basin. On the other hand, 46%
(178) respondents identified human-wildlife conflict as a hindrance to food security. The
respondents were able to identify conflict with monkeys which were the major problem
since the Wildlife Conservation and Management Act, 2013 did not allow people to kill
monkeys who destroy crops in the farms. More so, 5% (19) indicated that there were
conflicts with the county government, especially when it came to opening up county
roads, trees along the roads were cut down while road drainage systems were directed to
people’s farms causing sedimentation and gullies in farms.
As a result, in Figure 7.9, 4% (15) respondents indicated that there were conflicts with
local government policies on watershed governance. Only 1% (04) respondents agreed
that there were citizen-national government conflicts as well as 1% (04) of the
respondents who indicated they did not know of any conflict in the Lower Sio River
basin. Further, the Chi-square test presented in Table 7.9 did not find any significant
difference in households with food security and food insecurity with conflicts in
watershed management in the study area.

246
Figure 7.9: Conflicts in the Watershed Governance Systems that Hinder Food Security
Goals
Source: Field data (2018)
Furthermore, the study also assessed whether there were inter-actor conflicts observed by
households which could negatively influence watershed governance by leading to
exclusion of other actors in the study area. The study findings in Figure 7.10 illustrates
that 64.9% (251) of the respondents did not know whether there existed inter actor
conflicts while 22.7% (88) indicated that there were no such conflicts in the watershed
governance. On the contrary, 12.4% (48) of the respondents agreed that there were
conflicts among actors that could result in the exclusion of others in watershed
management activities.
An example given during the focus group discussion meeting was that of the farmers who
extended sugarcane farming to the riparian land (wetlands along Sio River) without
observing the 30 Meter buffer zone regulation for economic benefits while the
government needed farmers to preserve and conserve the riparian lands through several
authorities as NEMA and WRA. Studies have proved that effective watershed
management provides a framework for understanding and reconciling the
interconnections among various land-use systems and for collaborative action and
N=387

247
decision making in the face of competing claims on resources (FAO, 2017). However, the
Chi-square test carried out and presented in Table 7.9 did not find any influence of
conflicts among actors in watershed management and food security.
Figure 7.10: Inter-actor Conflicts in Watershed Management and Food security that Lead
to Exclusion of other Actors
Source: Field data (2018)
The follow-up on the causes of identified inter-actor conflicts established that differences
in actor policies, struggle for same donors among the civil societies, watershed resources
competition, lack of proper co-ordination framework at the county level, and to some
extent government officers and political interference in watershed management activities
of the other actors were responsible for inter-actor conflicts in the Lower Sio River basin
as shown in Figure 7.11. According to Komakech (2013), boundaries problems related to
political responsibilities and social sphere of influence, along these boundaries, the
jurisdictions and interests of actors’ overlap causing conflicts between institutions
involved in watershed governance.
N=387
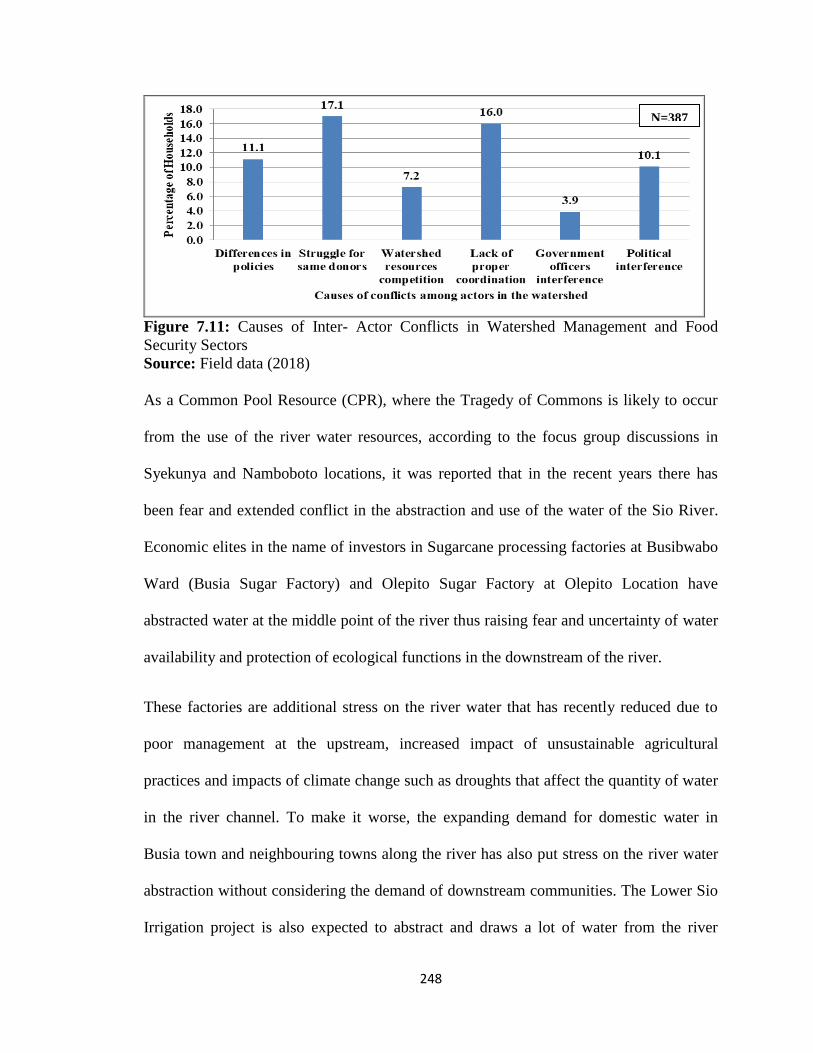
248
Figure 7.11: Causes of Inter- Actor Conflicts in Watershed Management and Food
Security Sectors
Source: Field data (2018)
As a Common Pool Resource (CPR), where the Tragedy of Commons is likely to occur
from the use of the river water resources, according to the focus group discussions in
Syekunya and Namboboto locations, it was reported that in the recent years there has
been fear and extended conflict in the abstraction and use of the water of the Sio River.
Economic elites in the name of investors in Sugarcane processing factories at Busibwabo
Ward (Busia Sugar Factory) and Olepito Sugar Factory at Olepito Location have
abstracted water at the middle point of the river thus raising fear and uncertainty of water
availability and protection of ecological functions in the downstream of the river.
These factories are additional stress on the river water that has recently reduced due to
poor management at the upstream, increased impact of unsustainable agricultural
practices and impacts of climate change such as droughts that affect the quantity of water
in the river channel. To make it worse, the expanding demand for domestic water in
Busia town and neighbouring towns along the river has also put stress on the river water
abstraction without considering the demand of downstream communities. The Lower Sio
Irrigation project is also expected to abstract and draws a lot of water from the river
N=387

249
channel; the action requires damming of water during flooding seasons so as to protect
the interests of the downstream communities. A male respondent at Syekunya location
said: -
“NEMA and WRA betrayed us when we demanded accountability from the
Olepito Sugar Factory investors before abstracting Sio River water at
Syekunya location point. None of us or our local leaders including the chiefs
and their assistant was consulted prior to water abstraction.”
The interviews with the chiefs and their assistants indicated that the orders came from
senior national government officers’ i.e. the County Commissioners who ordered that the
factory is allowed to abstract water. Lack of public consultation led to public
demonstrations demanding the share of water as a community resource through the co-
corporate social responsibility of the factory. However, the local politicians, the factory
management, NEMA and WRA representatives were reported to promise the locals jobs
in the factory. Eventually, the factory went on abstracting water without an agreement
with the community or a water resource management plan to address pertinent river
management and conservation issues.
On the same, due to downstream communities fears on increased abstraction of river
water in the upstream, one of the community governance activists: Mr. Kenneth Olulu
from Namboboto location petitioned Busia Sugar Factory (Busibwabo) at the National
Environment Tribunal in 2015 a national institution mandated under EMCA, 2015 to hear
and determine environmental resources conflicts. The factory was stopped from
abstracting water until the matter was addressed. However, the national and local politics
dominated the hearing and determination of the petition. Political elites from Matayos
sub-county and Busia county felt that the move to block the factory from abstracting river

250
water could make the county to lose potential investors and result in loss of job
opportunities.
According to the petitioner, due to economic disadvantage, his life was threatened and he
was denied an equal opportunity and justice during the tribunal hearings. The petitioner
could not afford to hire a good environmental advocate while the local community
members feared to support the petitioners due to political threats. As a result, the
petitioner lost the case and his property was auctioned. This contributed to increased fear
in the community to hold such investors accountable on the use of Sio River water
resources.
Like in the Olepito Sugar Factory, the Busia Sugar Factory was allowed to go on without
a proper framework in place to address River Sio water issues between the upstream and
downstream communities on one side and the investors on the other hand. Consequently,
the watershed management framework was never realized. Therefore, short-term
economic benefits outdid the long-term ecological benefits of Sio River ecosystem
management and conservation. The respondents showed that the downstream community
feared that the tragedy of water abstraction might escalate in the near future leading to a
bigger conflict between the upstream and downstream water users in the Lower Sio River
Basin. The study also noted that legal structure such as WRUAs did not exist to help
handle water resources conflict as envisaged in the Water Act 2016.
Due to its rivalry and non-excludability characteristics, Sio River basin resources stand to
be categorized as common property resources (Ostrom and Gardner 1993). The location
asymmetry between upstream and downstream users, the rich and the poor, economic

251
elites and non-economic users, whereby the upstream, the rich and the economic elites
claim and utilize the water first (Van der Zaag, 2007). All the water users need a
collective action over the water resources of Sio River as a common pool resource
management. However, various interpretations may dominate the involvement of various
actors and complex set of rules and institutions arising out of historical, ecological and
other structural processes in such watersheds (Ostrom, 1993; Ostrom, 2000; Naidu, 2009;
and Komakech, 2013).
To establish the legitimacy and support of various actors in the watershed, the study
assessed the level of public support for key agencies in watershed management and food
security in the study area. The findings in Table 7.10 indicate that 30.5% (118) of the
households in the watershed offered high support to the grass root groups. Forty-nine
point nine per cent (49.9%) (193) of the households indicated that they did not offer any
support to the county government departments while 66.7% (258) did not offer support to
the national government departments. The majority 70.0% (271) and 85.8% (332) of the
households indicated that they did not offer support to NEMA and WRA respectively.
Based on earlier findings this is attributed to the low level of engagement and knowledge
created by NEMA and WRA in form of public capacity building on their roles at the
grassroots level necessary for public support. The study noted that WRUAs were not
present in the watershed. During the focus group discussion at Syekunya in Nambale sub-
county a male respondent said: -
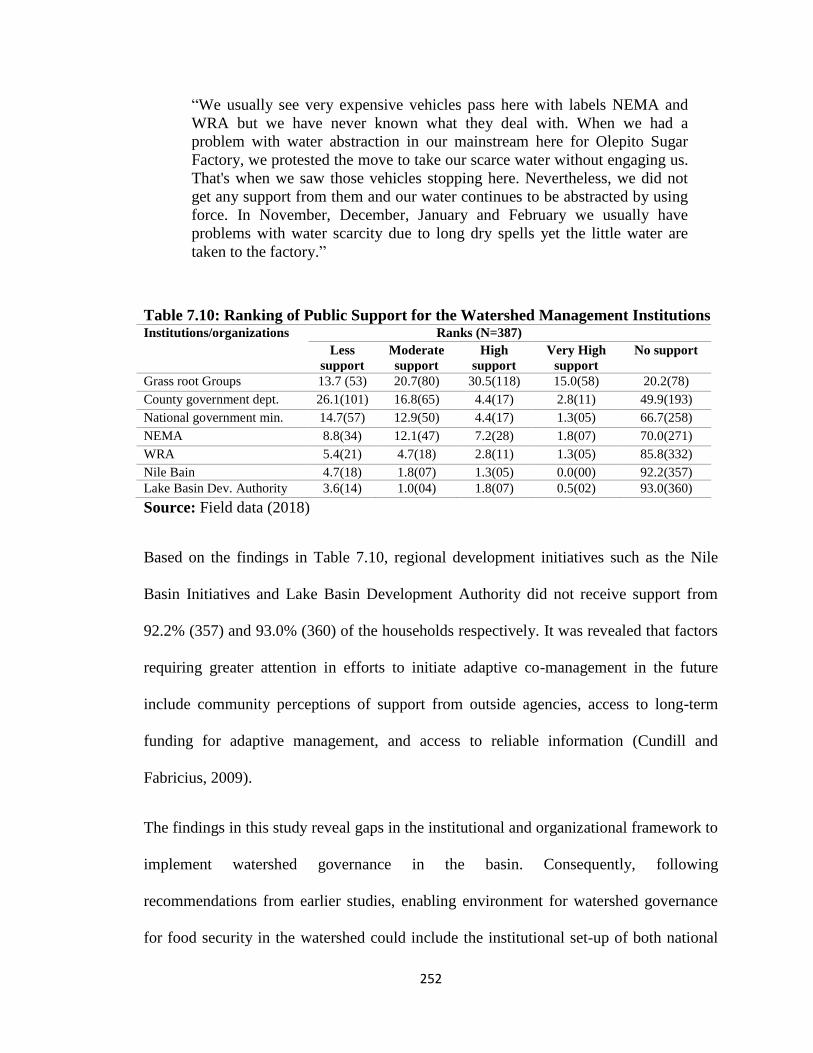
252
“We usually see very expensive vehicles pass here with labels NEMA and
WRA but we have never known what they deal with. When we had a
problem with water abstraction in our mainstream here for Olepito Sugar
Factory, we protested the move to take our scarce water without engaging us.
That's when we saw those vehicles stopping here. Nevertheless, we did not
get any support from them and our water continues to be abstracted by using
force. In November, December, January and February we usually have
problems with water scarcity due to long dry spells yet the little water are
taken to the factory.”
Table 7.10: Ranking of Public Support for the Watershed Management Institutions Institutions/organizations Ranks (N=387)
Less
support
Moderate
support
High
support
Very High
support
No support
Grass root Groups 13.7 (53) 20.7(80) 30.5(118) 15.0(58) 20.2(78)
County government dept. 26.1(101) 16.8(65) 4.4(17) 2.8(11) 49.9(193)
National government min. 14.7(57) 12.9(50) 4.4(17) 1.3(05) 66.7(258)
NEMA 8.8(34) 12.1(47) 7.2(28) 1.8(07) 70.0(271)
WRA 5.4(21) 4.7(18) 2.8(11) 1.3(05) 85.8(332)
Nile Bain 4.7(18) 1.8(07) 1.3(05) 0.0(00) 92.2(357)
Lake Basin Dev. Authority 3.6(14) 1.0(04) 1.8(07) 0.5(02) 93.0(360)
Source: Field data (2018)
Based on the findings in Table 7.10, regional development initiatives such as the Nile
Basin Initiatives and Lake Basin Development Authority did not receive support from
92.2% (357) and 93.0% (360) of the households respectively. It was revealed that factors
requiring greater attention in efforts to initiate adaptive co-management in the future
include community perceptions of support from outside agencies, access to long-term
funding for adaptive management, and access to reliable information (Cundill and
Fabricius, 2009).
The findings in this study reveal gaps in the institutional and organizational framework to
implement watershed governance in the basin. Consequently, following
recommendations from earlier studies, enabling environment for watershed governance
for food security in the watershed could include the institutional set-up of both national

253
and county governments, their implicit and explicit rules, power structures, policy and
legal framework environment in which individual households and local organizations
function (FAO, 2017). The recommended changes may involve policy reforms, changes
in legislation, strategic exercises at the national and county level planning and
prioritization, and changes to incentive systems (FAO, 2010).

254
CHAPTER EIGHT
SUMMARY, CONCLUSIONS AND RECOMMEMDATIONS
8.1: Introduction
This chapter outlines the summary of the study findings based on the four objectives.
Based on the findings, the chapter also gives conclusions and recommendations for each
objective and suggests further areas of research.
8.2: Summary of Findings on Watershed Governance for Food Security in the
Lower Sio River Basin, Busia County
The overall objective of the study was to determine the status of watershed governance
and its place in enhancing food security in the Lower Sio River Basin. The findings
indicate specific objectives:
First, on the actors' perceptions towards watershed governance for food security, the
study revealed that: the majority (81.9%) of the household agreed that watershed
governance determines food security. More so, the majority of the households reported
that were not satisfied with the aims of watershed governance. However, the study
revealed that the nine watershed governance variables used to measure aims had positive
significance with food security p-value=0.000 at 99% level of confidence. The study also
revealed that majority (86.3%) of the households needed changes in watershed
governance systems to ensure water resource management is treated as a public trust.
Second, the study found that the following aims of watershed governance: creating social
resilience to adapt to a changing climate, and clarifying roles and responsibilities at p-
255
value=0.000; enhancing water-use efficiency and conservation and improving
management at p-value=0.010 were significant to households’ food security status. On
the other hand, 68.5% (265) of the households reported that there were observed socio-
economic and environmental changes in the watershed governance after 2010. The study
also found that: water resources management plans at p-value=0.000, water resource
institutions at p-value=0.001 and water resources policies at p-value=0.000 were
watershed governance structures that showed significance to households’ food security.
The three drivers of watershed destructions namely: unsustainable farming practices at p-
value=0.000, low public knowledge in watershed management at p-value=0.004, lack of
financial resources for investment in watershed management at p-value=0.027 showed
statistically significance difference in determining households' food security. Moreover,
need to increase or sustain food production was ranked first by 86.8% as a factor that
contributed to public involvement in watershed management activities while traditional
expertise and land management expertise were highly identified by 34.4% as present in
the watershed. Furthermore, 87.3% of the households did not participate at any phase of
watershed management and food security policy, plan or programmes.
Third, the study revealed that the main household heads individual food security goal
known by the majority (53.5%) (207) was to improve rural livelihoods through food and
agricultural systems while 41.9% (162) indicated that they did not know whether
watershed management policies contributed to food security. Majority (86.8%) (336)
blamed low farm yield recorded in recent years as a key driver to food security whereby,
four drivers of food insecurity namely: high prices of foods, low supply of food in the
market, incidences prolonged droughts and low levels of income at p-value=0.000 and

256
poor government policy at p-value=0.007 were significant in determining household food
security status. Only 11.1% (43) of the respondents highlighted farmland as a watershed
aspect that the county government activities have impacted while 42.4% (164) pointed
out that the existing watershed governance structures such as policies did not have
positive impacts on the rural agricultural crop production. The status of food insecurity
had arisen from earlier government estimate of 54% in 2013 to 55.3% at the time of the
study an indication that the state of food insecurity was worsening.
Results indicate that age (significance=0.667), sex (significance=0.106) and land tenure
system had no effect on the status of households' food security. Further, the results
showed that religion, watershed expertise, level of satisfaction towards watershed
governance and co-management of watershed could only explain 20.8% variation
between households' food security and food insecurity differences at the household level.
Interestingly, watershed governance structures did not have the effect on households'
food security.
Lastly, the study found out that there was collaboration among the different actors at
different levels, both governmental and nongovernmental. The approaches and delivery
of the projects were reported to be participatory whereby most state and non-state actors
at the grassroots level were involved in planning, implementation and evaluation of the
programmes. However, the demand-driven approach to the services offered by the actors
left most households and watershed management activities out the project beneficiaries.
More results showed that 51.7% (200) of the households did not know whether watershed
management policies and programs mutually reinforced food production and distribution
while 36.7% (142) indicated that actors’ activities contributed to land management.

257
Watershed management gap bridged by Non-State Actors between government agencies
and various governance levels (global – national, national – local, global-local) showed
highly significant differences with household food security at p-value= 0.000. However,
the study did not find any significant influence of political will support for Non-State
Actors in watershed management and status of households’ food security. The majority
70.0% (271) and 85.8% (332) indicated that they did not offer support to NEMA and
WRA respectively.
8.3: Conclusions
Overall, the study revealed that watershed governance in the Lower Sio River Basin did
not contribute to sustainable food security interventions. As a result, majority of the
households in the watershed are at a risk of getting into food insecurity trap. Specifically,
the study concluded that:
1. Based on the findings, majority of the households perceived that watershed
governance determined food security. However, were not satisfied with the state
of watershed governance and expected a change to a more collaborative,
integrative approach towards watershed governance for food security.
2. Watershed governance structures, expertise, capacities created, satisfaction
towards watershed governance and co-management of watershed did not
contribute to the desired adaptive capacity at the household level. However, the
governmental and non-governmental actors had the capacity towards watershed
governance because of collaborations and diversified technical support and
delivery models to enhance household’s food security.
258
3. Watershed governance did not positively impact on food security in the rural
Lower Sio River Basin resulting to increased number of households with food
insecurity from 54% in 2013 based on government estimates to 55.3% in 2017 the
time when the study was carried out.
4. There were supportive watershed management legislations, policies and plans to
regulate and foster co-management watershed resources for food security among
the households, local non-governmental, national and county government and
international actors. However, there was lack of ownership, coordination and
monitoring frameworks for co-management activities, as well as approaches used
were not inclusive thus ineffective co-management at the watershed level.
8.4: Recommendations
The study recommends that there is need to prioritize watershed governance in food
security policy frameworks at the Lower Sio River Basin. More specifically:
1. Households’ perceptions, expectations and satisfaction need to be taken into
consideration for an effective adaptive capacity building, co-management and
ownership of watershed governance processes towards sustainable food security.
2. There is the need for state actors to enhance adaptive capacities of households and
local non-governmental organizations through formulating and implementing
policies towards improving and integrating watershed governance structures,
expertise, knowledge given the ongoing socio-ecological changes such as changes
in governance arrangement, land use, ecological and climate to enhance food
security.

259
3. Watershed governance needs to be improved in food security policy to positively
impact on the status of food security in the Lower Sio River Basin.
4. Watershed structures, expertise, level of satisfaction towards watershed
governance together with coordination, participation and monitoring framework
of actors’ activities as well as village management plans are needed to ensure
effective co-management of the watershed for sustainability of food security
interventions in the Lower Sio Basin.
8.5: Suggested for further study
From the study findings its worth to recommend the following further studies:
i. A study is recommended on food security governance and its impact on watershed
management in the upper watershed contributes to the well-being of the
downstream/ Lower Sio River Basin.
ii. The Lower Sio River is a trans-boundary basin; a study needs to be conducted to
establish the status of watershed governance in Uganda side to contribute to the
collective management of the basin.
iii. Finally, it will be prudent to carry out a study to quantify variables such as levels
of sedimentation, siltation, water quality and loss of biodiversity and
eutrophication that result increased county government activities such as
subsidized fertilizers, mechanization of land Ploughing, grading of rural roads
among others in order to monitor the changes for proper food security and
adaptive efforts.

260
REFERENCES
Adomi,E.E.,Ogbomo,M.O. and Inoni,O. E.(2003). “Gender factor in crop farmers’ access
to agricultural information in rural areas of Delta State, Nigeria”. Library Review,
Vol. 52 No. 8, pp. 388-393.
Adhikari,B. and Lovett,J. C. (2006). Institutions and collective action: does heterogeneity
matter in community-based resource management? The Journal of Development
Studies, 42(3), 426-445.
Adger,N.W., Arnell,N.W., and Tompkins, E. L. (2005). Successful Adaptation to Climate
Change across Scales. Global Environmental Change 15 77-86.
Adger,W.N.,(2003).Building Resilience to Promote Sustainability; an Agenda for Coping
with Globalization and Promoting Justice, International Human Dimensions
Programme on Global Environmental Change (IHDP).
Acheson, J.(2006).Institutional failure in resource management. The Annual Review of
Anthropology. 35: 117-134.
African Development Bank (ADB) (2004).Multi-sector Country Gender Profile:
Agriculture and Rural Development North East and South Region (ONAR). Addis
Ababa, Ethiopia: African Development Bank
African Women’s Studies Centre, (2014). Status Report on the Kenya National Food
Security. Nairobi. University of Nairobi Press.
Agrawal,A.(2001). Common property institutions and sustainable governance of
resources. World Development, 29(10), 1649-1672.
Ahmed A, Quisumbing A, Nasreen M, Hoddinott J, Bryan E (2010). Comparing food and
cash transfers to the ultra-poor in Bangladesh, IFPRI Research Monograph 163.
Washington DC: International Food Policy Research Institute, USA.
Ajzen, I. (1991). The Theory of Planned Behavior. Organizational Behavior and Human
Decision Processes 50:179-211.
Ajzen, I. (2002). Perceived behavioral control, self-efficacy, locus of control, and the
Theory of Planned Behavior. Journal of Applied Psychology 32(4):665-683.
Albinus M.P, Makalle, Obando. J., Yazidhi B., (2008). Effects of land use practices on
livelihoods in the Trans boundary sub-Watersheds of the Lake Victoria. African
Journal of Environmental Science and Technology Vol. 2 (10). pp. 309-317,
October, 2008 Available online at http://www.academicjournals.org/ AJest ISSN
1996-0786 © 2008 Academic Journals. Accessed on 05/05/2015.
Allen,C.R.; Fontaine,J.J.; Pope,K.L. and Garmestani, A.S. (2011). Adaptive Management
for a Turbulent Future. Journal of Environmental Management 92(5): 1339-1345.

261
Aloo T. C. (1993). Fuel wood and tree planting: a case study from Funyula Division in
Western Kenya. (PhD Thesis) The University of British Columbia.
Andersson, K. (2006). Understanding decentralized forest governance: An application of
the institutional analysis and development framework. Sustainability: Science,
Practice, and Policy: 2 (1): 25-35.
Anley, Y., Bogale, A., & Haile-Gabrile, A. (2007). Adoption decision and use intensity
of soil and water conservation measures by smallholder subsistence farmers in
Dedo district, western Ethiopia. Land degradation and development, 18, 289-302.
Ansell, C., Gash, A., (2008). Collaborative Governance in Theory and Practice. J. Public
Adm. Res. Theory Adv. Access, http://dx.doi.org/10.1093/jopart/mum032. Accessed
on 02/03/2015.
Armitage D., Rob C., Morris M., Tom W. D., Andrea K. G., Roland I. H., Huitema D.,
Ison R., Livingstone D., MacDonald G., Mirumachi N., Plummer R., Brent B. W
(2015). Science–policy processes for trans-boundary. Royal Swedish Academy of
Sciences 2015 www.kva.se/en water governance.
Armitage D.R., Plummer R, Berkes F., Arthur I. R., Charles A.T., Davidson I J., Diduck
A.P., Doubleday N.C., Johnson D. S., Marschke M., McConney P., Pinkerton E. W.
and Wollenberg E.K (2008). Adaptive Co-Management for Social-ecological
complexity. The Ecological Society of America. Available at;
www.frontiersinecology.org Accessed on 05/05/2015.
Ayalew, D. and Deininger, K. (2012). Causes and Implications of Credit Rationing in
Rural Ethiopia. The Importance of Spatial Variation. Policy Research Working
Paper No. 6096, The World Bank e-Library.
Bach, H.; Bird, J.; Clausen, T.J.; Jensen, K.M.; Lange, R.B.; Taylor, R.; Viriyasakultorn,
V. and Wolf, A. (2012). Tran boundary River Basin Management: Addressing
Water, Energy and Food Security. Lao, PDR: Mekong River Commission.
Ballweber, J .A. (2006). A Comparison of IWRM Frameworks: The United States and
South Africa. Journal of Contemporary Water Research and Education Issue 135,
page 74-79.
Baltutis, J., Brandes, L., Brandes .O.M., Moore, M., Natasha .O. and Plummer. R.,
(2014). Watersheds 2014. Towards Watershed Governance in British Columbia and
Beyond. A Forum for water practitioners, watershed groups, First Nations, and
other decision Makers. January 27-29, 2014 Quw’utsun’ Cultural and Conference
Centre Duncan, British Columbia.
Bamberger, Michael [editor]; Chung, Kimberly; Spalter-Roth, Roberta; Kozel, Valerie;
Parker, Barbara; Wansbrough, Gwyn; Jones, Debra; Kappaz, Christina; Rawlings,
Laura; Sedlacek, Guilherme; Hunte, Pamela; Brown, Gillian; Kudat, Ayse;
Lampietti, Julian; Patel, Mahesh. (2000). Integrating Quantitative and Qualitative
Research in Development Projects. Directions in Development. Washington, D.C.:

262
The World Bank.
http://documents.worldbank.org/curated/en/2000/06/2095601/integrating-
quantitative-qualitative-research-development-projects Accessed on 02/03/2015
Bayard, B., Jolly, C. M., & Shannon, D. A. (2007). The economics of adoption and
management of alley cropping in Haiti. Journal of Environmental Management, 84,
62-70.
Bazilian, M.; Rogner, H.; Howells, M.; Hermann, S.; Arent, D.; Gielen, D.; Steduto, P.;
Mueller, A.; Komor, P. and Tol, R.S.J. (2011). Considering the Energy, Water and
Food Nexus: Towards an Integrated Modelling Approach. Energy Policy 39(12):
7896-7906
Bekele,W., and Drake,L. (2003). Soil and water conservation decision behaviour of
subsistence farmers in the Eastern Highlands of Ethiopia: a case study of the
Hunde-Lafto area. Ecological Economics, 46, 437-451.
Benson, D.; Gain, A.K. and Rouillard, J.J. (2015). Water governance in a Comparative
Perspective: From IWRM to a 'nexus' approach? Water Alternatives 8(1): 756-773
Benson, D.; Jordan, A.J. and Smith, L. (2013). Is environmental management really more
collaborative? A comparative analysis of putative 'paradigm shifts' in Europe,
Australia and the USA. Environment and Planning 30(7): 1695-1712.
Benson,D.; Jordan,A. and Huitema,D. (2012). Involving the public in Watershed
management: An analysis of the scope for learning lessons from abroad.
Environmental Policy and Governance 22(1): 42-54.
Biswas, A.K. (2008). Current directions: Integrated Water Resources Management – A
second look. Water International 33(3): 274-278.
Blomquist, W., (2009). Multi-level governance and natural resource management: The
challenges of complexity, diversity, and uncertainty. In: Beckmann, V. and
Padmanabhan, M. eds. Institutional sustainability: Political economy of agriculture
and the environment - Essays in honour of Konrad Hagedorn. Springer.
Bohensky, E. and Lynam, T. (2005). Evaluating responses in complex adaptive systems:
Insights on water management from the Southern African Millennium Ecosystem
Assessment (SAFMA). Ecology and Society, 10(1), 11.
Bollig, M., (2003). Vulnerability and Resilience in Africa: The Creation of Resilience in
two African Herder Societies, International Human Dimensions Programme on
Global Environmental Change (IHDP).
Borecki,J.,Dunlop,R.,Kerford,A.,Wang,J.(2016).Public Perception of Water Management
and Understanding of the Watershed: A Case Study on Calgary, Alberta. Faculty of
Science, Environmental Science Program, University of Calgary, Alberta, Canada.

263
Boyd, M., and Wang, H. H. (2011). Guest editorial: the role of public policy and
agricultural risk management in food security. China Agricultural Economic
Review, 3(4), 417–422.
Brandes, O., and O'Riordan, J. (2014). A blueprint for watershed governance in British
Columbia. Victoria, Canada: POLIS Project on Ecological Governance, University
of Victoria.
Brandes, O.M., (2005). At a Watershed: Ecological Governance and Sustainable Water
Management in Canada. J. Environ. Law Pract. 16 (November), 1.
Brandes M.O., (2006). Watershed Governance Concept Backgrounder; Water
Sustainability Project. University of Victoria- POLIS project on Ecological
Governance. 6-14.
Brennan, M. A. (2005). The Importance of Incorporating Local Culture into Community
Development. EDIS, Florida Cooperative Extension Service, University of Florida.
Bromley, D. W., and Cernea, M. M. (1989) The management of Common Property
Resources: Some Conceptual and Operational Fallacies. World Bank Discussion
Papers, No 57, Washington D. C.: The World BankBunn, S.E. and Arthington,
A.H., (2002). Basic principles and ecological consequences of altered flow regimes
for aquatic biodiversity. Environmental Management. 30 (4), 492–507.
Buller, H., (1996). Towards Sustainable Water Management: Watershed Planning in
France and Britain. Land Use Policy 13 (4) 289–302.
Bussey, M., Carter, R., Keys, N., Carter, J., Mangoyana, R., Matthews, J., Nash, D.,
Oliver, J., Richards, R., Roiko, A., (2012). Framing Adaptive Capacity through a
History-Futures Lens: lessons from the South East Queensland Climate Adaptation
Research Initiative. Futures 44 (4) 385–397.
Candel, J.J.L., (2014). Food security governance: a systematic literature review. Springer
Science Business Media Dordrecht and International Society for Plant Pathology
20:14
Carlsson, L., and F. Berkes. (2005). Co-management: Concepts and Methodological
Implications. Journal of Environmental Management 75(1):65-76.
Castella, J., Slaats, J., Quang, D. D., Geay, F., Van Linh, N. and Tho, P. T. H. (2006),
“Connecting marginal rice farmers to agricultural knowledge and information
systems in Vietnam Uplands”. The Journal of Agricultural Education and
Extension, Vol. 12, No. 2, pp. 109–125, available at:
http://dx.doi.org/10.1080/13892240600861625 (accessed 12 June 2016).
Charles, H., Godfray, J., Beddington, J. R., Crute, I. R., Haddad, L., Lawrence, D., Muir,
J. F., Pretty, J., Robinson, S., Thomas, S. M., & Toulmin, C. (2010). Food security:
The challenge of feeding 9 billion people. Science, 327(5967), 812–818.

264
Cleaver, F. (2002). Reinventing institutions: Bricolage and the social embedness of
natural resource management. The European Journal of Development Research,
14(2), 11-30.
Colonelli, E., & Simon, G. (2013). Food Security Governance: History, Definitions and
Institutions. Available at
http://www.jeanmonnet.it/public/Food%20Security%20Governance%20Catania%2
02013.pdf. Accessed 5 June 2015.
Cooper, P. J. M., & Coe, R. (2011). Assessing and addressing climate induced risk in
sub-Saharan rain fed agriculture. Experimental Agriculture, 47(02), 179–184.
Cronbach, L., (1990). Essentials of psychological testing. Harper & Row, New York.
Cundill, G., and C. Fabricius. (2009). Monitoring in Adaptive Co-management: Toward
Learning Based Approach. Journal of Environmental Management 90(11):3205-
3211.
Deaton, A. (1997). The Analysis of Household Surveys. A Microeconomic Approach to
Development Policy. Published for The World Bank, Johns Hopkins University
Press, Baltimore.
Debara M., and Gebretsadik (2016). Assessment of Knowledge, Attitude and Practice of
the Local Community on Watershed Management at Kindo Koysha Woreda of
Wolayta Zone, Southern Ethiopia. International Journal of Community
Development, Vol. 4, No. 2, 2016, 74-84 DOI: 10.11634/233028791604847
de Haan, L. and A. Zoomers (2005). Exploring the frontier of livelihoods research.
Development and Change 36 (1): 27-47.
Dietz T, Ostrom E, Stern PC (2003). The Struggle to Govern the Commons. Science,
302:1907–1912. doi:10.1126/science.1091015.
Duncan, J., & Barling, D. (2012). Renewal through Participation in Global Food Security
Governance: Implementing the International Food Security and Nutrition Civil
Society Mechanism to the Committee on World Food Security. International
Journal of Sociology of Agriculture and Food, 19(2), 143–161.
Economic Commission for Africa (2004). Land Tenure Systems and their Impacts on
Food Security and Sustainable Development in Africa. Economic Commission for
Africa. Addis Ababa, Ethiopia
Edwards, M. E. (2012). Food Insecurity in Western US States: Increasing Collaboration
between State Agencies and Nonprofit Organizations. Food Culture & Society,
15(1), 93–112.
Elias, A., Nohmi, M., Yasunobu, K. and Ishida, A. (2013). Effect of Agricultural
Extension Program on Small Holders’ Farm Productivity: Evidence from Three
Peasant Associations in the Highlands of Ethiopia. J. Agr. Sci., 5(8): 163-181.

265
Elias. A, Nohmi. M., Yasunobu. K. and Ishida. A. (2015). Farmers’ Satisfaction with
Agricultural Extension Service and Its Influencing Factors: A Case Study in North
West Ethiopia. J. Agr. Sci. Tech. (2015) Vol. 18: 39-53
Engle, N.L., Lemos, M.C., (2010). Unpacking Governance: Building Adaptive Capacity
to Climate Change of River Basins in Brazil. Glob. Environ. Chang. 20 (1) 4–13.
Engle, N.L.; Johns, O.R.; Lemos, M. and Nelson, D.R. (2011). Integrated and Adaptive
Management of Water Resources: Tensions, Legacies, and the Next Best Thing.
Ecology and Society 16(1): 19, www.ecologyandsociety.org/vol16/iss1/art19/.
Accessed on 01.05.2015.
Fiona P. M, A. Kessler, Katia L., and Saskia V., (2013). The Use of Stakeholder Analysis
in Integrated Watershed Management: Experiences From the Ngenge Watershed,
Uganda. Mountain Research and Development, 33(2):122-131 International
Mountain Society. http://www.bioone.org/doi/full/10.1659/MRD-JOURNAL-D-12-
00031.1 Accessed on 24/02/2018
Fishbein, M. and I. Ajzen. (2010). Predicting and changing behavior. Psychology Press,
New York, New York.
Flores, C. C. and Sarandón, S. J. (2004). Limitations of Neoclassical Economics for
Evaluating Sustainability of Agricultural Systems: Comparing Organic and
Conventional Systems. J. Sustain. Agr., 24 (2): 77–91.
Food and Agriculture Organization (FAO) (1996). Rome Declaration on World Food
Security and World Food Summit Plan of Action; Report of the World Food
Summit, FAO: Rome, Italy, 13–17 November.
Food and Agriculture Organization (FAO) (2005a). Rapid guide for missions. Analyzing
local institutions and livelihoods. Rome.
Food and Agriculture Organization (FAO) (2007). Why invest in watershed management,
FAO: Rome, Italy.
Food and Agriculture for United Nations (2009). Coping with a changing climate:
consideration for adaption and mitigation in Agriculture. Rome.
Food and Agriculture Organization (FAO) (2009). Global Governance of Food Security.
ftp://ftp.fao.org/docrep/fao/meeting/018/k6367e.pdf. Accessed 5 June 2015.
Food and Agriculture Organization (FAO) (2010). Enhancing FAO’s practices for
supporting capacity development of member countries. Learning Module 1. Rome.
Food and Agriculture Organization (FAO) (2011). Good Food Security Governance: The
Crucial Premise to the Twin-Track Approach - Background paper.
http://www.fao.org/fileadmin/templates/righttofood/documents/other_documents/2
011_od_food_security_gov/FoodSecurityGovernanceWorkshop_backgroundpaper.
pdf. Accessed 5 June 2015.

266
FAO (2012). Global Strategic Framework for Food Security and Nutrition.
http://www.fao.org/fileadmin/templates/cfs/Docs1112/WGs/GSF/MD976E_GSF_
Draft_Two.pdf. Accessed 5 June 2015.
FAO (Food and Agriculture Organization of the United Nations); WFP (United Nations
World Food Program) and IFAD (International Fund for Agricultural
Development). (2012). The state of food insecurity in the world 2012. Economic
growth is necessary but not sufficient to accelerate reduction of hunger and
malnutrition. Rome: FAO.
Food and Agriculture Organization (FAO) (2014). Adapting to Climate Change through
Land and Water Management in Eastern Africa; Results of pilot projects in
Ethiopia, Kenya and Tanzania. Food and Agriculture Organization, United Nations
Rome.
Food and Agriculture Organization (FAO) (2011). Women play a decisive role in
household food security, dietary diversity and children’s health. Food and
Agriculture Organization, United Nations. Rome.
Food and Agriculture Organization (FAO) (2017). Watershed Management in Action:
Lessons Learned from FAO field projects. Food and Agriculture Organization,
United Nations. Rome.
Folke, C., Hahn, T., Olsson, P., and Norberg, J. (2005). Adaptive Governance As Social-
Ecological Systems. Annual Review of Environmental Resources 30 441-473.
Foerster, A., (2011). Developing Purposeful and Adaptive Institutions for Effective
Environmental Water Governance. Water Resource Management. 25, 4005–4018.
Franks, T., Bdliya, H., Mbuya, L., (2011).Water governance and river basin management:
comparative experiences from Nigeria and Tanzania. Int. J. River Basin Manage. 9
(2), 93–101, http://dx.doi.org/10.1080/15715124.2011.591292.
Fulginiti, L.E. (2010). What Comes First, Agricultural Growth or Democracy? Agr.
Econ.,41,15-24.
Gain, A.K.; Rouillard, J.J. and Benson, D. (2013). Can Integrated Water Resources
Management increase adaptive capacity to climate change adaptation? A critical
review. Journal of Water Resource and Protection. 5(4A): 1120.
Geda, A., Niek de Jong, Mwabu, G., and Kimenyi, S. M. (2001). Determinants of poverty
in Kenya: Household-level Analysis. The Kenya Institute for Public Policy
Research and Analysis (KIPRA). Discussion Paper No. 9.
Gebregziabher, G.; Abera, D. A.; Gebresamuel, G.; Giordano, M.; Langan, S. (2016). An
assessment of integrated watershed management in Ethiopia. Colombo, Sri Lanka:
International Water Management Institute (IWMI). 28p. (IWMI Working Paper
170). doi: 10.5337/2016.214
267
Genesis, T. Y, Armah, F.A and Onumah, E.E. (2010). Paths to Attaining Food Security:
The Case of Cameroon Challenges. ISSN 2078-1547.
www.mdpi.com/journal/challenges/pdf. Accessed on 05/07/2015.
Giussani, E. (2008). Constitutional and Administrative Law. UK, Thomson Reuters
(Professional) Limited
Global Forum on Food Security and Nutrition (2011). Global Governance for Food
Security: Are the current arrangements fit for the job?
http://www.fao.org/fsnforum/sites/default/files/file/68_global_governance/SUMM
ARY%20Global%20Governance.pdf. Accessed 5 June 2015.
GoK (2002). Water Act of 2002. Nairobi; Government Printers
GoK (2002). Water Act of 2016. Nairobi; Government Printers
GoK (2005b). Kenya National Water Development Report; Water for wealth creation
and Healthy Environment. Prepared for the UN World Water Development Report
‘Water: A shared responsibility’ (2006). Nairobi. Government Printers Kenya.
GoK (2005). Busia District Strategic Plan 2005-2010: For Implementation of the
National Population Policy for Sustainable Development. Nairobi; Government
Printers.
GoK (2007). The National Water Services Strategy (NWSS) (2007-2015). Nairobi,
Ministry of Water and Irrigation (MWI), Government Printer
GoK (2007). Samia District Development Plan. Nairobi; Government Printers.
GoK (2009). Integrated Water Resource Management and Water Efficiency Plan.
Nairobi; Government Printers.
GoK (2009b). Kenya National Food and Nutrition Security Policy. Nairobi; Government
Printers.
GoK (2010a). Kenya National Census Report of 2009. Nairobi; Government Printers.
GoK (2010b). Constitution of Kenya. Nairobi; Government Printers.
GoK/NCCRS, (2010). National Climate Change Response Strategy. Government
Printers, Nairobi, Kenya.
GoK (2011). Kenya National Food and Nutrition Security Policy. Nairobi; Government
Printers.
GoK (2012). County Government Act of 2012. Nairobi; Government Printers.
GoK, (2013a). County Government of Busia: First Busia County Integrated Development
Plan (CIDP) 2013-2017 Nairobi; Government Printers.
268
Government of Kenya. (2013b). The Project on the Development of the National Water
Master Plan 2013. Final report Volume 5- Sectoral Report (2/3)
GoK (2015). Environment Management and Coordination Act, Revised 2015. Nairobi;
Government Printers.
GoK (2016). Yala Swamp Integrated Environmental Management Plan 2016-2026. Busia
and Siaya County Governments and NEMA.
GoK (2016b). Climate Risk Profile for Busia. Kenya County Climate Risk Profile Series.
The Kenya Ministry of Agriculture, Livestock and Fisheries (MoALF), Nairobi,
Kenya.
Gregory, P. J., Ingram, J. S. I. & M, B., (2005). Climate Change and Food Security.
Philosophical Transactions of the Royal Society. Issue 360, pp. 2139-2148.
Grobler. W.C.J., (2016). Perceptions of Poverty: A Study of Food Secure and Food
Insecure Households in an Urban Area in South Africa: 7th International
Economics & Business Management Conference, 5th & 6th October 2015.
Procedia Economics and Finance, 35 ( 2016 ) 224 – 231. Available online at
www.sciencedirect.com Accessed on 5/6/2018.
Gupta, J. Termeer, C, Klostermann, J. Mejierink, S. Brink, M.V.D. Jong, P. Nooteboom,
S. & Bergsma, E., (2010). The Adaptive Capacity Wheel: A Method to Assess the
Inherent Characteristics of Institutions to Enable the Capacity of Society.
Environmental Science & Policy 13: 459-471.
GWP (Global Water Partnership) (2010). IWRM Components. Stockholm: GWP.
www.gwp.org/en/The-Challenge/What-is-IWRM/IWRM-Principles/. Accessed on
01.05.2015.
GWP-TAC (Global Water Partnership – Technical Advisory Committee) (2000).
Integrated Water Resources Management. TAC Background Papers No. 4, GWP,
Stockholm, Sweden.
Haddad, L. (2011). Why India needs a national nutrition strategy. BMJ (Online),
343(7832), 1042–1044.
Hardin, G. (1968). The Tragedy of the Commons. Science 162: 1243-48.
Heberlein, T.A. (2012). Navigating environmental attitudes. Oxford University Press,
New York, New York.
Hooghe, L., Marks, G., (2003). Unraveling the Central State, But How? Types of Multi-
level Governance. Am. Political. Science. Rev. 97 (2) 233–243.
Huitema, D., E. Mostert, W. Egas, S. Moellenkamp, C. Pahl-Wostl, and R. Yalcin.
(2009). Adaptive water governance: assessing the institutional prescriptions of
adaptive (co-) management from a governance perspective and defining a research
agenda. Ecology and Society 14(1): 26.

269
Huitema, Dave, Erik Mostert, Wouter Egas, Sabine Moellenkamp, Claudia Pahl-Wostl,
and Resul Yalcin. (2007)."Adaptive Water Governance: Assessing the Institutional
Prescriptions of Adaptive (Co-) Management from a Governance Perspective and
Defining a Research Agenda." Ecology and Society 14, no. 1 (2009): 26.
Huntjens, P., Lebel, L., Pahl-Wostl, C., Rshulze, R., Camkin, J., Kranz, N., (2012).
Institutional Design Propositions for the Governance of Adaptation to Climate
Change in Water Sector. Glob. Environ. Chang 22, 67-81.
Imperial MT. (1999). Institutional Analysis and Ecosystem-based Management: the
Institutional Analysis and Development Framework. Environmental Management.
24:449–65.
Imperial M. T. (2001). Collaboration as an Implementation Strategy: An Assessment of
Six Watershed Management Programs. PhD thesis, Indiana University.,
Bloomington, IN
Institute of Economic Affairs (IEA) Kenya (2012). Report of the National Conference on
Non-State Actors Role in Decentralized Financing in Kenya. Nairobi: IEA Kenya.
International Society of Bible Collectors (2014). The New International Reader's
Version: Grand Rapids, MI: Zondervan. Retrieved 2015-09-10
International Federation of Red Cross and Red Crescent Societies – IFRC. (2007). Long-
term Food Security: Investing in People and Livelihoods. Five Year Strategic
Framework on Food Security in Africa 2008–2012; Disaster Policy and
Preparedness Department: Geneva, Switzerland, pp. 1-8.
Intergovernmental Panel on Climate Change (IPCC) (2007). Summary for Policy Makers.
In: Climate Change 2007: Impacts Adaptation and Vulnerability. Contribution of
Working Group II to the Fourth Assessment Report of the Intergovernmental Panel
on Climate Change. Parry M, Canziani O, Palutikof J, van der Linden P and
Hanson CE, eds Cambridge, United Kingdom, Cambridge University Press.
IPCC, Intergovernmental Panel on Climate Change, (2012). Managing the Risks of
Extreme Events and Disasters to Advance Climate Change Adaptation. Cambridge
University Press, Cambridge, New York.
Israel G, D. (1992). Sampling the Evidence of Extension Program Impact. Program
Evaluation and Organizational Development, IFAS, University of Florida. PEOD-
5. October
Jacobs, K. and Saggers, M, (2011). Advancing Women’s Assets Rights: ICRW’s
Research and Programming June 23rd
, 2011.
Jaetzold, R., Schmidt H., Hornetz B., Shisanya C., (2011). Farm Management Handbook
of Kenya, Vol. II – Natural Conditions and Farm Management Information – 2nd
edition.

270
Jayne, T. S., Mather, D., & Mghenyi, E. (2006). Smallholder farming under increasingly
difficult circumstances: Policy and public investment priorities for Africa. MSU
International Development Working Paper No. 86. Michigan State University, East
Lansing, Michigan. Available at http://www.aec.msu.edu/agecon/fs2/ index.htm.
Jessop, B. (2003). Governance and meta-governance: on reflexivity, requisite variety and
requisite irony. In H. P. Bang (Ed.), Governance as social and political
communication (pp. 101–116). Manchester: Manchester University Press.
Johnson, C. (2004). Uncommon ground: The ‘poverty of history’ in common property
discourse. Development and Change 35 (3): 407-433.
Joshua E. C, Cindy H, Christina C. H, Tim M. D, Nadine M, Andrew W and Edward H.
A (2015). Changes in adaptive capacity of Kenyan fishing communities. Nature
Climate Change DOI: 10.1038/NCLIMATE2690 Available at
www.nature.com/natureclimatechange accessed on 5/6/2018
Kagombe J.K., Kungu J., Mugendi D., and Cheboiwo J. K. (2018). Evaluating the
Willingness to Pay for Watershed Protection in Ndaka-ini Dam, Muranga County,
Kenya. Civil and Environmental Research. ISSN 2224-5790 (Paper) ISSN 2225-
0514. Vol.10, No.1, 2018. (Online) www.iiste.org accessed on 6/6/2018.
Kang’ethe W. G, (2006). Agricultural Development and Food Security in Sub-Saharan
Africa (SSA): Building a Case for more Public Support. The Case of Kenya. FAO,
Rome, Policy Assistance Unit of the FAO Sub-regional Office for East and
Southern Africa.
Kessler C.A. (2006). Decisive key factors influencing farm households’ soil and water
conservation investments. Applied Geography 26:40–60.
Kendall M. (2013). Drought and its Role in Shaping Water Policy in Australia. In:
Schwabe K, Albiac Murillo J, Connor JD, Hassan RM, Meza Gonzalez L, eds.
Drought in Arid and Semi-Arid Regions: A Multidisciplinary and Cross-Country
Perspective. Dordrecht, the Netherlands: Springer (e-book); 451–467.
Kenya National Bureau of Statistics. (2013). Exploring Kenya’s Inequality; pulling apart
or pulling together. Busia County. Kenya National Bureau of Statistics (KNBS),
Nairobi.
Kenya National Bureau of Statistics. (1984), Kenya Rural Household Budget Survey of
1981-1982 Basic Report. Kenya National Bureau of Statistics (KNBS), Nairobi.
Kimani-Murage, E. (2014). Vulnerability to Food Insecurity in Urban Slums:
Experiences from Nairobi, Kenya. Journal of Urban Health: Bulletin of the New
York Academy of Medicine.
Klein, R.J.T., (2004). “Approaches, Methods and Tools for Climate Change”, Keynote
Lecture to the In Session Workshop on Impacts of, and Vulnerability to Climate
271
Change, 21st Session of the UNFCCC Subsidiary Body for Scientific and
Technological Advice, Buenos Aires, 8 December 2004.
Koc, M., Macrae, R., Desjardins, E., & Roberts, W. (2008). Getting civil about food: The
interactions between civil society and the state to advance sustainable food systems
in Canada. Journal of Hunger and Environmental Nutrition, 3(2–3), 122–144.
Komakech. C. H. (2013). Emergence and Evolution of Endogenous Water Institutions in
an African River Basin: Local Water Governance and State Intervention in the
Pangani River Basin, Tanzania. Leiden, The Netherlands. CRC Press/Balkema.
Komakech, H.C., van der Zaag, P., (2011). Understanding the emergence and functioning
of river committees in a catchment of the Pangani basin. Tanzania Water Altern. 4
(2), 197–222.
Koontz. T.M., Gupta. D., Mudliar. P., and Ranjan. P. (2015). Adaptive Institutions in
Social-ecological Systems Governance: A Synthesis Framework. Environ. Sci.
Policy. http://dx.doi.org/10.1016/j.envsci.2015.01.003 Accessed on 01.05.2015
Kristin Floress, Kofi Akamani, Kathleen E. Halvorsen, Andrew T. Kozich, and Mae
Davenport. (2015). The Role of Social Science in Successfully Implementing
Watershed Management Strategies. Universities Council on Water resources.
Journal of Contemporary Water research & education issue 154, pages 85-105,
April 2015.
Kristjanson, P., Mango, N., Krishna, A., Radeny, M., & Johnson, N. (2010).
Understanding poverty dynamics in Kenya. Journal of International Development,
22(7), 978–996.
Kropff, M. J., Van Arendonk, J. A. M., & Löffler, H. J. M. (Eds.). (2013). Food for all:
Sustainable Nutrition Security. Wageningen UR: Wageningen.
Kumar, S. K. (1994), Adoption of Hybrid Maize in Zambia: Effects on Gender Roles,
Food Consumption, and Nutrition, Research Report No. 100, Washington, D.C.:
International Food Policy Research Institute.
Lang, T., & Barling, D. (2012). Food security and food sustainability: Reformulating the
debate. Geographical Journal, 178(4), 313–326.
Langinger, N., (2011). School Feeding Programs in Kenya: Transitioning to a
Homegrown Approach. Stanford Journal of International Relations, 13(1), pp. 30-
37.
Lavis, K R. and Blackburn, D. J. (1990). Extension Clientele Satisfaction. J. Extension,
28-36.
Lawrence, T. Suddaby, R. Leca, B. (2011). Institutional Work: Refocusing Institutional
Studies of Organizations. Journal of Management Inquiry, 20, 1, pp. 52-58.

272
Leach, M., R. Mearns, and I. Scoones. (1999). Environmental Entitlements: Dynamics
and Institutions in Community-Based Natural Resource Management. World
Development 7 (2): 225-247.
Lebel, L., J. M. Anderies, B. Campbell, C. Folke, S. Hatfield-Dodds, T. P. Hughes, and J.
Wilson. (2006). Governance and the Capacity to Manage Resilience in Regional
Social-ecological Systems. Ecology and Society 11(1): 19. [online] URL:
http://www.ecologyandsociety.org/vol11/iss1/art19/ Accessed on 01.06.2015.
Lein, H., Tagseth, M., (2009). Tanzanian water policy reforms—between principles and
practical applications. Water Policy 11, 203–220.
Lemba, J.K. (2009). Intervention model for sustainable household food security in the dry
lands of Kenya: Case study of Makueni district; Thesis submitted in fulfillment of
the requirements For the degree of Doctor (PhD) in Applied Biological Sciences:
(Agriculture), Ghent University.
Lemma, T., Sehai, E. and Hoekstra, D. (2011). Status and Capacity of Farmer Training
Centres (FTCs) in the Improving Productivity and Market Success (IPMS) Pilot
Learning Woredas (PLWs). Retrieved from:
http://cgspace.cgiar.org/handle/10568/16899. Accessed on 01.06.2015
Levin, K., B. Cashore, S. Bernstein, and G. Auld. (2012). Overcoming the tragedy of
super wicked problems: Constraining our future selves to ameliorate global climate
change. Policy Sciences 45:123–152.
Liniger, H.P., Mekdaschi Studer, R., Moll, P. & Zander, U. (2017). Making sense of
research for sustainable land management. Bern, Switzerland & Leipzig, Germany,
Centre for Development and Environment, University of Bern & Helmholtz-Centre
for Environmental Research (UFZ).
Lwoga, E. T., Stilwell, C., & Ngulube, P. (2011). Access and use of agricultural
information and knowledge in Tanzania. Library Review, 60(5), 383-395.
Madzwamuse M., (2010). Climate Change Governance in Africa: Adaptation Strategies
and Institutions. Heinrich Boll Stiftung, Cape Town.
Maddison, D. (2007). The Perception of and Adaptation to Climate Change in Africa.
Policy Research Working Paper 4305. World Bank, Washington DC.
Majule, A.E., Gibson, R. and Chiwatakwenda, A. (2007). Climate Change Adaptations in
Low Potential Area of Tanzania: Local perceptions, vulnerability, current
adaptations and in future strategies in Sanjaranda Village, Manyoni, Singida,
CCAA-Tanzania, Malawi Working Paper No. 2
Makarius C.S. L, Meire, P., and Yonika M. N., (2015). Exploring watershed conservation
and water governance along Pangani River Basin, Tanzania. Land Use Policy.
Elsevier. www.elsevier.com/locate/landusepol

273
Malo, M., Jember, G. and Woodfine, A.C. (2012). Strengthening Capacity for Climate
Change Adaptation in the Agriculture Sector in Ethiopia, Proceedings from
National Workshop held in Nazreth, Ethiopia 5-6 July 2010. Climate, Energy and
Tenure Division, Natural Resources Management and Environment Department
Food and Agriculture Organization of the United Nations, Rome, Italy. Available
from: http://www.fao.org/docrep/014/i2155e/i2155e00.pdf. Accessed May 2015.
March, J. and J. Olsen. (1989). Rediscovering Institutions: The Organizational Basics of
Politics. New York, Free Press.
Maye, D., & Kirwan, J. (2013). Food security: A fractured consensus. Journal of Rural
Studies, 29, 1– 6.
Maxwell, D., & Caldwell, R. (2008). The coping strategies index: a tool for rapid
Measurement of household food security and the impact of food aid programs in
humanitarian emergencies. Field methods manual (2nd
ed.).
USAID/CARE/WFP/Tufts University/TANGO.
Meaza H. (2015). The Role of Community Based Watershed Management for Climate
Change Adaptation in Adwa, Central Tigray Zone. International Journal of
Weather, Climate Change and Conservation Research Vol.1, No.1, pp. 11-35,
March 2015. European Centre for Research Training and Development UK
(www.eajournals.org) Accessed on 2/2/2018
McDougall, C. L. S. (2008). Why Food Aid Persists and Food Security Recedes:
Organizational Adaptation of a Canadian NGO. Aalborg: Institut for Historie,
Internationale Studier og Samfundsforhold, Aalborg Universitet. (SPIRIT PhD
Series; No. 15).
McGinnis M. (2000). Polycentric Governance and Development. Ann Arbor, MI: Univ.
Michigan Press.
McKeon, N. (2013). ‘One Does Not Sell the Land Upon Which the People Walk’: Land
Grabbing, Transnational Rural Social Movements, and Global Governance.
Globalizations, 10(1), 105–122.
Meadowcroft J. (2009). Climate Change Governance: A paper contributing to the 2010
World Bank World Development Report.
Mfune, Orleans (2012). From fortresses to sustainable development: the changing face of
environmental conservation in Africa, the case of Zambia. PhD thesis. University
of Glasgow http://theses.gla.ac.uk/3082/
Miller, S. (2003). Sustainable Management of Watersheds: The River Njoro, Kenya.
Annual Report of Sustainable Management of Watersheds (SUMAWA) project,
Global Livestock Collaborative Research Support Program (USAID) in
collaboration with Unv of California,
Davis.http://www.uwyo.edu/sumawa/Publications/SUMAWA%20End%20of%20Y
ear%20Report%202002-2003.pdf. Accessed on 05/06/2015.
274
Moe, T. (2005). Power and Political Institutions. Perspectives on Politics 3(2): 215-233.
Mohamed Salih, M. A. (2009). Governance of Food Security in the 21st Century. In H. G.
Brauch, U. O. Spring, J. Grin, C. Mesjasz, P.Kameri-Mbote, N. C. Behera, et al.
(Eds.), Facing Global Environmental Change (pp. 501-507, Hexagon Series on
Human and Environmental Security and Peace, Vol. 4). Berlin/Heidelberg:
Springer.
Morton, L.W. (2011). Relationships, connections, influence, and power. In Pathways for
Getting to Better Water Quality: The Citizen Effect, L.W. Morton and S.S. Brown
(Eds.). Springer, New York, pp. 41-55.
Moss, T. (2004). The governance of land use in river basins: prospects for overcoming
problems of institutional interplay with the EU Water Framework Directive. Land
Use Policy, 21(1), 85-94.
Mullen, M. and Allison, B. (1999). Stakeholder Involvement and Social Capital: Keys to
Watershed Management Success in Alabama. Journal of the American Water
Resources Association, 35(3), 655–662.
Mumma, A. (2005). Kenya’s New Water Law: An analysis of the implications for the
rural poor. International Workshop on African Water Laws: Plural Legislative
Frameworks for Rural Water Management in Africa, 26–28 January 2005,
Johannesburg, South Africa.
http://www.iwmi.cgiar.org/publications/CABI_Publications/CA_CABI_Series/Co
mmunity_Law/protected/Ch%2010.pdf Accessed on 05/07/2015.
Mugenda. M.O &Mugenda A.G. (1999). Research Methods Qualitative and Quantitative
Approaches. African Centre for Technology Studies (ACTS), Nairobi.
Mwabu, G., Ugaz C.,and White, G., (2001). Social Provision in Low-Income Countries.
Oxford University Press.
Naidu, S. C. (2009). Heterogeneity and collective management: Evidence from common
forests in Himachal Pradesh, India. World Development, 37(3), 676-686.
Namenya, D. N (2012). Watershed Management. For Sustainable Constituency
Development Fund Projects in Funyula, Kenya. Saarbrucken, Germany. Lambert
Academic Publishing.
Namirembe Sara, Leimona Beria, Noordwijk Meine, Bernard Florence and Bacwayo
Kukunda E. (2013). Coinvestment paradigms as alternative to payment for tree-
based ecosystems services in Africa. Environmental Sustainability 2014: 6 pg. 89-
97.
Ndesanjo, R., (2009). Climate Change Impacts and Adaptive Strategies in the Rufiji
Delta, MSc. Dissertation (Unpublished), Dar es Salaam, University of Dar es
Salaam.

275
Nelson, R., Howden, M., Smith, M.S., (2008). Using adaptive governance to rethink the
way science supports Australian drought policy. Environmental Science Policy 11
(7) 588–6.
Nelson, V., and T. Stathers., (2009). “Resilience, Power, Culture and Climate: A case
Study from Semi-Arid Tanzania, and New Research Directions”, Gender and
Development Journal Vol. 17 No 4 81-94.
NEMA Uganda [National Environment Management Authority]. 2002. State of the
Environment Report for Uganda. Kampala, Uganda: NEMA.
Ngigi A and Macharia D. (2007). Kenya Water Sector Overview. Nairobi, IT Power East
Africa.
Nile Basin Initiative (2009) Sio - Siteko Tran boundary management Plan Production of
the Wetlands and Biodiversity Conservation component of the Nile Tran boundary
Environmental Action Project. Nile basin Initiative Secretariat.
North, D. (1990). Institutions, Institutional Change and Economic Performance.
Cambridge, UK. Cambridge University Press.
Nungo, R. A., Okoth, M. W., & Mbugua, S. K. (2012). Nutrition status of children under-
five years in cassava consuming communities in Nambale, Busia of Western
Kenya. Food and Nutrition Sciences, 3(6), 796.
Nyariki, D.M., Wiggins, S. L., Imungi, J. K., (2002). Levels and Causes of Household
Food and Nutrition Insecurity in Dryland Kenya. Ecology of Food and Nutrition,
41: 155-176.
Nygren, A. (2005). Community-based forest management within the context of
institutional decentralization in Honduras. World Development 33 (4): 639-655.
Oakerson, R., Parks, R.B., (2011). The Study of Local Public Economies: Multi-
organizational, Multi-level Institutional Analysis and Development. Policy Stud. J.
39 (1) 2011.
Obando, J. A., Bamutaze, Y. and Makalle, A. (2007) (In prep), The Impact of Land Use
Changes on Community Livelihoods of Sio sub-Watershed in the Lake Victoria
Basin. Watershed Lake Research
Obando JA and Shisanya CA. (2006). “A Review of the DAAD Alumni Summer School
2005: ‘Topics of Integrated Watershed Management’”. Weiterbilding in Siegen 20:
43-47.
Ogutu, Z.A.; Misana, S.; and Mwaka, V. (2005). Land Use Research in the Lake Victoria
Basin: Analysis and Synthesis. IUCEA, SIDA.
Olsen, J. (2007). Understanding Institutions and Logics of Appropriateness: Introductory
Essay. Working Paper 13. Centre for European Studies, University of Oslo, Oslo

276
Olsson, P., L. H. Gunderson, S. R. Carpenter, P. Ryan, L. Lebel, C. Folke, and C. S.
Holling. (2006). Shooting the Rapids: Navigating Transitions to Adaptive
Governance of Social-ecological Systems. Ecology and Society 11(1): 18. [online]
URL: http://www.ecologyandsociety.org/vol11/iss1/art18. Accessed on 05/06/2015
Olsson, P., Folke, C. and Berkes F. (2004). Adaptive Co-management for Building
Resilience in Social- Ecological Systems. Environmental Management, 34(1):75–
90.
Opio F, Akello G, Bahiigwa G, Maikut C, Muduuli DS, Ngategize P, Odwongo W,
Sabiiti EN, Tumusiime RP. (1998). 2020 Vision Network for East Africa Country
Note for Uganda. Kampala, Uganda: International Food Policy Research Institute.
Ostrom, E., (2005). Understanding Institutional Diversity. Princeton University Press.
Ostrom E, Gardner R, Walker J. (1994). Rules, games and common-pool resources. The
University of Michigan Press.
Ostrom, E. 1993. Design principles in long-enduring irrigation institutions. Water
Resources Research, 29(7), 1907-1912.
Ostrom, E. (1990). Governing the commons: The evolution of Institutions for Collective
Action. Cambridge: Cambridge University Press.
Ostrom, E. and Gardner, R. (1993). Coping with asymmetries in the commons: Self-
governing irrigation systems can work. Economic Perspectives, 7(4), 93-112.
Ostrom, E. (2000). Collective action and the evolution of social norms. Journal of
Economic Perspectives, 14(3), 137-158.
Oxford Dictionary, (2010), Advanced Learning Dictionary. Cambridge: Cambridge
University Press.
Paarlberg, R. L. (2002). Governance and food security in an age of globalization. Food,
Agriculture, and the Environment Discussion Paper 36. Washington, D.C.:
International Food Policy Research Institute.
Paavola, J., and T.W. Adger., (2005), “Analysis of Fair Adaptation to Climate Change”,
Journal of Ecological Economics Volume 56, (2006), Norwich, UK, pp 594-609.
Pahl-Wostl, C., (2009). A Conceptual Framework for Analyzing Adaptive Capacity and
Multi-level Learning Processes in Resource Governance Regimes. Global Environ.
Chang. 19 (3) 354–365, http://dx.doi.org/10.1016/j.gloenvcha.2009.06.001.
Peterson, P.E., 1995. The Price of Federalism. R.R. Donnelley & Sons Co. Press,
New York.
Parkes, M.W., Morrison, K.E., Bunch, M.J., and Venema, H.D. (2008). Ecohealth and
Watersheds: Ecosystem Approaches to Re-integrate Water Resources Management
with Health and Well-being. Network for Ecosystem Sustainability and Health
(Publication Series No. 2) and the International Institute for Sustainable

277
Development, Winnipeg, MB. Available online at
http://www.iisd.org/pdf/2008/ecohealth_watersheds.pdf. Accessed on 03/07/2015.
Parkes, M.W., Morrison, K.E., Bunch, M.J., Hallstrom, L.K., Neudoerffer, R.C.,
Venema, H.D. and D. Waltner-Toews (2010), Towards integrated governance for
water, health and social-ecological systems: The watershed governance prism,
Global Environmental Change, 20, 693-704.
Parry, J., A, Hammill., and J, Drexhage., (2005). Climate Change and Adaptation,
Manitoba, Canada, http://www.iisd.org/ retrieved on, 23/05/2015.
Patel, P. N., Mbagaya, G. M. & Imo, B. E., (2012). Impact of Climate Change on Food
and Nutrition Security in Kenya. International Journal of Current Research, 4(1),
pp. 242-248.
Patti K., Henry N., Anja G., Joash M., Florence B. K., Solomon D., George S., Brian T.,
Wiebke F., Philip K. T., and Richard C. (2012). Are food insecure smallholder
households making changes in their farming practices? Evidence from East Africa.
Food Sec, access at Springerlink.com accessed on 20/05/2015.
Pelling, M., (2011). Adaptation to Climate Change: from Resilience to Transformation,
London, Routledge.
Pereira, L. M., & Ruysenaar, S. (2012). Moving from traditional government to new
adaptive governance: the changing face of food security responses in South Africa.
Food Security, 4(1), 41–58.
Pingali, P. (2007). Agricultural Growth and Economic Development: A View through the
Globalization lens. Agr. Econ., 37, pp. 1-12
Plummer, R., and D. Armitage. (2007). A Resilience-based Framework for Evaluating
Adaptive Co-management: Linking Ecology, Economics and Society in a Complex
World. Ecological Economics 61(1):62-74.
Pretty, J.(2009). The Sustainable Intensification of Agriculture. Natural. Recourse.
Forum, 21, 247-256.
Punch, K. E. (2003). Survey Research: The Basics. London: Sage Publication Limited.
Rajaonarison, H. M., (2014). Food and Human Security in Sub-Saharan Africa. Procedia
Environmental Sciences, Issue 20, pp. 377-385.
Rastogi AR, Badola SA, Hussain, Hickey GM. (2009). Stakeholder Analysis of Corbett
National Park. Unpublished paper presented at the 13th World Forestry Congress.
Buenos Aires, Argentina, 18–23 October. Available from Food and Agriculture
Organization of the United Nations.
Ridaura, S. L., Masera, O. and Astier, M. (2002). Evaluating the Sustainability of
Complex Socio-environmental Systems: The MESMIS Framework. Ecol. Indic., 2
(2): 135–148.
278
Rhodes, C & Brown A. (2005). “Narrative, Organizations and Research.” International
Journal of Management Reviews 7:3 p.167-188 (p.172).
Rhodes, C. (2005).“Narratives, Organizations and Research” International Journal of
Management Review, 7:3 September (2005) p. 167-188.
Robles Morua, A., K.E. Halvorsen, A.S. Mayer, and E.R. Vivoni. (2014). Can hydrologic
models change water-related risk perceptions? Results of a participatory modeling
workshop in the Sonora River Basin, Mexico. Environmental Modeling and
Software 52: 273-282.
Robles Morua, A., K.E. Halvorsen, and A.S. Mayer. (2011). Waterborne disease-related
risk perceptions in the Sonora River Basin, Mexico. Risk Analysis 35(5): 866-878.
Rockström, J., Nuhu Hatibu, Theib Oweis and S.P. Wani (2007). Managing Water in
Rain‐fed Agriculture. In: Molden, D., (ed.) Water for Food, Water for Life: A
Comprehensive Assessment of Water Management in Agriculture, Earthscan,
London, UK and International Water Management Institute (IWMI), Colombo,
Srilanka, pp. 315‐348.
Ross, J.M., Hall, J.C., Resh, W.G., (2013). Frictions in Polycentric Administration with
Noncongruent Borders: Evidence from Ohio School District Class Sizes. J. Public
Adm. Res. Theory 24 (3) 623–649, http://dx.doi.org/10.1093/jopart/mus090Sabatier
Accessed on 04/07/2015
Rouillard, J.J.; Benson, D. and Gain, A.K. (2014). Evaluating IWRM Implementation
Success: Are Water Policies in Bangladesh Enhancing Adaptive Capacity to
Climate Change Impacts? International Journal of Water Resource Development
30(3): 515-527.
Sahley, C., Groelsema, B., Marchione, T., & Nelson, D. (2005). The Governance
Dimensions of Food Security in Malawi. USAID.
Sanginga PC, Kamugisha R, Martin A, Kakuru A, Stroud A. (2004). Facilitating
participatory processes for policy change in natural resource management: Lessons
from the highlands of southwestern Uganda. Uganda Journal of Agricultural
Sciences 9:958–970.
Schlager, E., Blomquist, W.A., (2008). Embracing Watershed Politics. University Press
of Colorado, Boulder, CO.
Schmidhuber, J.; Tubiello, F.N. (2007). Global Food Security under Climate Change.
PNAS, 104, 19703-19708.
Schwilch G, Bachmann F, Liniger HP. (2009). Appraising and selecting conservation
measures to mitigate desertification and land degradation based on stakeholder
participation and global best practices. Land Degradation and Development
20:308–326.

279
Scoones, I. (2009). Livelihoods perspectives and rural development. Journal of Peasant
Studies 36 (1): 171-196.
Seed, B., Lang, T., Caraher, M., & Ostry, A. (2013). Integrating food security into public
health and provincial government departments in British Columbia, Canada.
Agriculture and Human Values, 30(3), 457–470.
Sen, A. (1981). Poverty and Famines: An essay on entitlement and deprivation. Oxford.
Oxford University Press.
Serem, D. K., Boit, J. M., & Wanyama, M. N. (2013). Understanding Research: A
Simplified Form. Eldoret: Utafiti Foundation.
Shiferaw, B., Kebede, T.A. & Reddy, V.R. (2012). Community watershed management
in semiarid India: the state of collective action and its effect on natural resources
and rural livelihoods. In E. Mwangi, H. Markelova & R. Meinzen-Dick, eds.
Collective action and property rights for poverty reduction: insights from Africa
and Asia, pp. 153–188. Washington, DC, International Food Policy Research
Institute.
Shisanya CA. (2005). "An Analysis of Accessibility and Pricing of Water Supply in
Rural Watersheds: A Case Study of Kakamega District, Kenya". Weiterbilding in
Siegen 18:161-172.
Shisanya CA. (1996). Chances and Risks of Maize and Bean Growing in the Semi-Arid
Areas of Kenya During Expected Deficient, Normal and Above Normal Rainfall of
the Short Rainy Seasons, PhD Thesis. Trier, University of Trier.
Shitote Z., (2013). Fish Farming Household Food Security and Livelihoods in Siaya
County Western Kenya. PhD Thesis School for Disaster Management and
Humanitarian Assistance, MMUST.
Sneddon, C., Harris, L., Dimitrov, R. and Özesmi, U. (2002). Contested Waters: Conflict,
Scale and Sustainability in Aquatic Socio-ecological Systems. Society and Natural
Resources, 15(8), 663–675.
Stein, C., H. Ernstson and J, Barron. (2011). A Social Network Approach to Analyzing
Water Governance: The case of the Mkindo Watershed, Tanzania, Physics and
Chemistry of the Earth, Vol 36(14-15), pp1085-1092.
Stringer L.C (2009). Testing the Orthodoxies of Land Degradation Policy in Swaziland.
Land Use Policy, Vol. 26, p157-168.
Terry, B. D. and Israel, G. D. (2004). Agent Performance and Customer Satisfaction. J.
Extension, 42(6). Available at: http://www.joe.org/joe/2004december/a4.php
Thomson, A. M. (2001). Food security and sustainable livelihoods: The policy challenge.
Development, 44(4), 24–28.

280
Thornton, P. K., Rufino, M. C., Karanja, S., Jones, P. G., Mutie, I., & Herrero, M. (2011).
Genesis reversed: Climate change impacts on agriculture and livelihoods in mixed
crop-livestock systems of East Africa. Final report to the World Bank (p. 162).
Nairobi: International Livestock Research Institute (ILRI).
Tompkins, E.L., Adger, W.N., (2005). Defining Response Capacity to Enhance Climate
Change Policy. Environmental Science & Policy, 8, 562–571.
United States Agency for International Development (USAID). (2010). Property Rights
and Resource Governance, Kenya Country Profile.
http://usaidlandtenure.net/sites/default/fi les/country-profiles/full-
reports/USAID_Land_Tenure_Kenya_Profile.pdf, accessed 03 September 2015.
United States Department of the Interior. (2012). Colorado River Basin water supply and
demand study. Bureau of Reclamation. Retrieved September 9, 2016, from
http://www.usbr.gov/lc/ region/programs/crbstudy/finalreport/index.html.
UNICEF (2009). Determinants of malnutrition in children: A conceptual Framework.
van der Brugge, R., and R. van Raak. (2007). Facing the Adaptive Management
Challenge: Insights from Transition Management. Ecology and Society, 12(2): 33.
[online] URL: http://www.ecologyandsociety.org/vol12/iss2/art33/ Accessed on
04/06/2015
Van der Zaag, P. (2007). Asymmetry and equity in water resources management: Critical
institutional issues for Southern Africa. Water Resources Management, 21(12),
19932004.
Villamayor-Tomas, S.; Grundmann, P.; Epstein, G.; Evans, T. and Kimmich, C. (2015).
The water-energy-food security nexus through the lenses of the value chain and the
Institutional Analysis and Development frameworks. Water Alternatives 8(1): 735-
755. Available at www.water-alternatives.org Volume 8 | Issue 1. Accessed on
06/06/2016
von Braun, J. (2009). Addressing the food crisis: governance, market functioning, and
investment in public goods. Food Security, 1(1), 9–15.
Wahlqvist, M. L., McKay, J., Chang, Y. C., & Chiu, Y. W. (2012). Rethinking the food
security debate in Asia: Some missing ecological and health dimensions and
solutions. Food Security, 4(4), 657–670.
Waithaka, M., Nelson, G., Thomas, T. & Kyotalimye, M., (2013). Kenya. In: East
African Agriculture and Climate Change. Washington, D.C.: International Food
Policy Research Institute.
Walingo, M. K, & Ngaira, J. K. (2008). Research Methods for Social and Behavioral
Sciences. Kisumu: Kisumu Lake Publishers & Enterprises Ltd.
Walker, B. H., L. H. Gunderson, A. P. Kinzig, C. Folke, S. R. Carpenter, and L. Schultz.
(2006). A Handful of Heuristics and Some Propositions for Understanding
281
Resilience in Social-Ecological Systems. Ecology and Society, 11(1): 13. [online]
URL: http://www.ecologyandsociety.org/vol11/iss1/art13/. Accessed on
04/06/2015
Wabwoba M.S., Wakhungu, J.W., Obiri, J.O., and Lwevo. E., (2015). Household
Potential in Improving Food Security in Bungoma County, Kenya. Journal of
International Academic Research for Multidisciplinary. Impact Factor 1.625, ISSN:
2320-5083, Volume 3, Issue 7, August 2015.
Wabwoba M.S., (2017). Factors Contributing to Low Productivity and Food Insecurity in
Bungoma County, Kenya. Biomed J Sci & Tech Res 1(7)-2017. BJSTR.
MS.ID.000556. DOI : 10.26717/BJSTR.2017.01.000556. Accessed on 28/05/2018.
Wani, S.P., Joshi, P.K., Ramakrishna, Y.S., Sreedevi, T.K., Piara Singh and P. Pathak
(2008). A New Paradigm in Watershed Management: A Must for Development of
Rain‐fed Areas for Inclusive Growth. Conservation Farming: Enhancing
Productivity and Profitability of Rain fed Areas, Eds: Anand Swarup, Suraj Bhan
and JS Bali. 2008. Soil Conservation Society of India, New Delhi. 163‐178
Wani, S.P., Sreedevi, T.K., Reddy, T.S.V, Venkateswarlu, B. & Prasad, C.S. (2008b).
Community watersheds for improved livelihoods through consortium approach in
drought prone rain-fed areas. Journal of Hydrological Research and Development,
23: 55–77.
Wanjogu, S.N (2004). The Distribution, Characteristics and Utilization of wetland Soils
in Sio Basin, Western Kenya. Lake Victoria Environmental Management Project.
http://hdi.handle.net/11671/811 Downloaded from EAC IRC Respiratory, Accessed
on 8/9/2016.
Werg, J., Grothmann, T., and Schmidt, P. (2013). Assessing social capacity and
vulnerability of private households to natural hazards – integrating psychological
and governance factors, Nat. Hazards Earth Syst. Sci., 13, 1613–1628, doi:
10.5194/nhess-131613-2013.
Western, D. (2004). The Challenge of Integrated Rangeland Monitoring: Synthesis
Address. African Journal of Range and Forage Science, 21(2):129-136.
Williams, T. (1998). Multiple Uses of Common Pool Resources in Semi-Arid West
Africa: A Survey of Existing Practices and Options for Sustainable Resource
Management. Natural Resources Perspectives No. 38. London.
World Bank Group. (2001). Decentralization and Sub-National Regional Economics.
Retrieved from
http://www1.worldbank.org/publicsector/decentralisation/admin.htm on 20/06/2014
World Bank (2004), World Bank Report: Making Service work for the people.
Washington, D.C

282
World Bank. (2010). Agriculture and Rural Development Series: Gender and Governance
in Rural Service: Insight from India, Ghana, and Ethiopia. World Bank,
Washington, DC.
World Bank (2012). Devolution Without Disruption. Pathways to a Successful New
Kenya. Nairobi. The World Bank Kenya Fiscal Decentralization Knowledge
Programme. Available at www.worldbank.org/Kenya/devolution Accessed on
04/05/2014
World Bank (2012b). Justice for the Poor Program (www. Worldbank.org/justiceforthe
poor) Accessed on 04/05/2014
Wright, A., Donkor, S., Yahaya, S., and Woudeneh, T. (2003). The Africa Water Vision
for 2025: Equitable and Sustainable Use of Water for Socio-economic
Development. UN Water/Africa, ECA/AU/ADB, 34 p
Xu, J., Y. Yang, Z. Li, N. Tashi, R. Sharma, and J. Fang. (2005). Understanding land use,
livelihoods, and health transitions among Tibetan nomads: a case from Gangga
Township, Dingri County, Tibetan Autonomous Region of China. Ecohealth 5
104–114.
Yamane, T. (1967). Statistics, An Introductory Analysis, 2nd Ed, New York: Harper and
Row
Yanda, P.Z., and C.P. Mubaya., (2011). Managing a Changing Climate in Africa; Local
Level Vulnerabilities and Adaptation Experiences. Dar es Salaam, Mkuki na Nyota.
Yin, R. (2003). Case Study Research, Design and Methods. (3rd Ed.), London: Sage
Yong, U.T.K., Bruns, P.C., Bruns, B.R., (2003). The Emergence of Polycentric Water
Governance in Northern Thailand. Paper presented at the workshop on Asian
Irrigation in Transition–Responding to the Challenges Ahead. April 22–23,2002.
Asian Institute of Technology, Bangkok, Thailand
Young O. (2002). The Institutional Dimensions of Environmental Change: Fit, Interplay
and Scale. Cambridge, MA: MIT Press.
Young,O.R.(1999).Institutional Dimensions of Global Environment Change.
International Human Dimensions Program Report 9, Bonn, Germany

283
APPENDICES
APPENDIX I: SAMPLE FRAME POPULATION DISTRIBUTION BY NUMBER OF
HOUSEHOLDS, AREA, DENSITY AND ADMINISTRATIVE UNITS
Administrative Units Households Area in Sq. KM Density
Matayos 68781 681.0 481
Township Location 8558 22.3 1597
Township 8558 22.3 1597
Mjini 6639 7.7 3434
Mayenje 1919 14.6 628
Matayos 15268 173.9 435
Nangoma Location 2504 28.4 431
Muyafwa 792 8.0 487
Murende 764 11.3 342
Nangoma 948 9.1 494
Lwanya Location 1832 18.3 478
Busende 638 7.7 407
Igero 665 5.6 559
Luliba 529 5.0 494
Bukhayo West Location 6700 72.8 460
Bugengi 2296 27.8 405
Mundika 1964 23.4 426
Esikulu 2440 21.6 568
Busibwabo Location 2253 32.5 349
Nasira 906 12.5 364
Alungoli 639 7.0 449
Nakhakina 708 13.0 280
Nasewa Location 1979 21.8 452
Mabunge 704 6.3 575
Buyama 588 7.4 391
Lunga 687 8.2 413
Nambale Sub county 19002 237.8 398
Nambale Township Location 6727 68.7 470
Nambale Township 3297 33.6 469
Kisoko 1833 21.7 412
Syekunya 1597 13.3 568
Bukhayo East Location 4309 58.6 371
Sikinga 1139 15.0 382
Madibo 1129 12.4 465
Buyofu 782 11.5 341
Mungatsi 1259 19.6 319
Bukhayo Central Location 3741 48.0 379
Malanga 1334 19.2 345
Sidende 1609 18.0 421
Lwanyange 798 10.7 371

284
Administrative Units Households Area in Sq. KM Density
Bukhayo North Location 2086 27.5 398
Lupida 956 14.3 359
Kapina 1130 13.2 440
Walatsi Location 2139 35.0 329
Musokoto 892 12.5 379
Khwirale 1247 22.5 300
Funyula 19395 265.1 353
Nambuku Location 2453 32.7 364
Lugala 413 5.6 351
Mango 406 4.5 420
Sibinga 583 7.1 419
Ganjala 470 7.5 302
Ludacho 581 8.0 350
Namboboto Location 3418 37.3 436
Luanda 889 9.5 444
Buloma 721 8.2 424
Namboboto 522 4.8 507
Mudoma 640 5.2 578
Nyakhobi 646 9.7 327
Odiado Location 2038 22.6 425
Kabwodo 306 4.1 331
Odiado 613 8.5 354
Budalanga 246 3.4 349
Wakhungu 873 6.7 610
Nangosia Location 2283 27.5 386
Luchulululo 348 4.6 358
Sirekeresi 592 6.1 443
Bukhulungu 714 9.1 370
Sigulu 629 7.7 378
Agenga Location 2902 44.5 313
Sigalame 804 12.6 315
Agenga 897 12.5 352
Ojibo 797 10.9 335
Bukiri 404 8.6 226
Naguba Location 2368 36.3 315
Bujwanga 1158 14.5 394
Nanderema 625 12.0 260
Rumbiye 585 9.8 267
Bwiri Location 3933 64.3 308
Busembe 854 11.9 366
Busijo 814 11.1 384
Hakati 1101 20.0 283
Namuduru 1164 21.2 259
Source: KNBS. 2009 Kenya National Census Report

285
APPENDIX II: LIST OF ACTORS IN AGRICULTURE AND ENVIRONMENT
Actor Actor category
National government level State
1. Ministry of Environment State
2. Ministry of Agriculture State
3. Ministry of Water State
4. Water Resource Authority (WRA) State
5. National Environment Management Authority (NEMA) State
6. National Irrigation Board Western Region (NIB) State
7. Department of Forestry/ County Ecosystem Conservator State
8. Location Chiefs State
9. Sub-location assistant chiefs State
10. KARI- ALUPE State
11. KAPAP State
12. Horticultural Crops Development Authority (HCDA) State
13. Lake Victoria North Water Services Board (LVNWSB) State
14. County Director, Special programme State
15. LVEMP State
County government level
16. Director of Fisheries State
17. Director of Water State
18. Director of environment and natural resources State
19. Director of agriculture (crop and animal production) State
20. Director of irrigation State
21. Sub-county environment and natural resources officers (3) State
22. Sub-county waters officers (3) State
23. Sub-county agricultural officers (3) State
24. Members of the county Assembly (MCAs) State
25. Water Resource Users Associations (WRUAs) Non State
Non-Governmental Organizations and Community Based
Org.
26. Programme for Agriculture and Livelihoods in Western
Communities (PALWCO)
Non State
27. SEND A COW Non State
28. ACCI-GIZ Non State
29. Anglican Development Services (ADS) Westerrn Non State
30. Grass Root Poverty Alleviation Programme (GAPP) Non State
31. ONE ACRE FUND Non State
32. Integrated poverty action(IPA)/ ICS (International Child
Support)
Non State
33. KENFAP Non State
34. Rural energy and food security organization (REFSO) Non State
35. Participatory Approaches in Integrated Development-CA
regional program (PAFID-CARP)
Non State
36. Appropriate Rural Development in Agriculture Programme Non State

286
Actor Actor category
(ARDAP)
37. Farm concern international Non State
38. Heifer international Non State
39. GAPK-grow against poverty Kenya Non State
40. One World Development Foundation (OWDF) BUSIA Non State
41. Family Life Education Program(FLEP) Non State
42. Hand In Hand Non State
43. World Vision Kenya Non State
44. Catholic Relief Services Non State
45. Farm Africa Non State
46. Centre for African Bio-Entrepreneurship (CABE) Non State
47. International Crops Research Institute for Semi-Arid Tropics
(ICRISAT)
Non State
48. Lake Basin Development Authority (LBDA) Non State
49. KI-Wash Non State
50. APHIA-Plus Non State
51. Sustainet (EA) Non State
52. Community Asset Building and Development Action
(CABDA)
Non State
53. Busia Community Development Organization Non State

287
APPENDIX III: INFORMED CONSENT/ INTRODUCTORY LETTER
Dear Respondent,
This is to introduce you to the study on “Watershed Governance and Food Security in the
Lower Sio River Watershed, Busia County, Kenya”. The study will be done in the Lower
Sio River Watershed, specifically in Nambale, Matayos and Funyula Sub-counties.
The study will be helpful in shaping the policy frameworks, state and non-state actors
activities in watershed management and food security in this area.
Your participation in this study is very important as one of the beneficiaries of such
watershed resources, food security activities and policy frameworks. The researcher will
ensure maximum level of confidentiality as well as use the information only for the
academic purposes.
Thank you in advance for your positive response.
Yours sincerely,
Namenya Daniel Naburi
Researcher

288
APPENDIX IV: TEMPLATE FOR ANALYSIS – OBSERVATION /MAPPING
Mapping issues Detailed information
Natural resources
Water Watersheds
Crop fields
Rangelands
Gardens
Forests
Hilltops
Wetland
Others (specify)
Infrastructure
Roads/bridges
Settlements
Commodity markets
Stock feed sources
Others (specify)
Social services
Health
Schools
Church
Local administration
Traditional authorities
Extension offices
Government/NGO/CBO offices
Others (specify)
Watershed resource use
system
Croplands and use of crop
residues
Communal rangelands
Grazing reserves
Water use
Agro forestry practices
Brick making
Charcoal burning
Quarrying
Sand harvesting
Others (specify)

289
APPENDIX V: HOUSEHOLD QUESTIONNAIRE
STUDY TITLE: WATERSHED GOVERNANCE AND FOOD SECURITY IN THE
LOWER SIO RIVER WATERSHED, BUSIA COUNTY: HOUSEHOLD
QUESTIONNAIRE
Section 1: 001: General Social, Economic and Demographic Information
(Please tick/fill blank space)
Interviewer Name/Code: Questionnaire No: Date:
1. County: 2. Sub-county: 3. Location:
Respondent Name: 4. Gender: 1= Male [ ]2 = Female [ ]
005.Are you head of
household
1= Yes [ ], 2 = No [ ]
006.Land size (acres) 1= <1[ ], 2 = 2 [ ], 3 = 4 [ ], 4 = 6 [ ], 5 = 10&> [ ]
007.Educational level 1=None[ ], 2=Primary[ ], 3=Secondary[ ] , 4= Tertiary[
]
008.Age (years) 1=18-35yrs[ ], 2=36-50 yrs. [ ],3=51-65[ ] 4=above 65yrs[
] _____________________________________________
009. Main occupation 1=Farmer [ ] 2= Civil servant [ ] 3=Employee in private
sector [ ] 4= Business person [ ] 5= On farm laborer [ ]
6= off farm laborer [ ] 7=other specify________________
010.Household size 1=Females [ ] 2=Males [ ] 3=No. below 18 [
] 4=No. above 65years [ ]_______________________
011. HH Religion 1=Christians [ ] 2= Muslims [ ] 3=Hindus [ ] 4=
Traditional African [ ] 5= Other specify_______________
012. HH Average monthly
income
1= <3,000[ ] 2=3,000-10,000[ ] 3=10,000-20,000[ ] 4=
20,000 - 30,000[ ] 5= > 30,000[ ]
013. HH Land tenure system 1= Free hold [ ] 2= Lease[ ] 3=Communal [ ] 4=
Government [ ] 5= other specify_____________________
014.HH Land legal
documents held
1=Owner Land Title deed[ ] 2=Family Title deed[ ] 3=
Allotment letter [ ] 4= other specify [___]
015. HH Watershed landform
adjacent to
1= Plateua/plains[ ] 2= Mountain slopes[ ] 3= Hill tops[ ]
4=Valley bottoms [ ]______________________________
016. HH Land use activities 1=Cropland (total) Rain fed[ ] 2=Cropland (total)
Irrigated[ ] 3=Grazing land[ ] 4=Forest/woodland[ ]
5=Mixed land[ ] 6=settlement, infrastructure[
]_______________________
017. HH Main source of food 1= Own Farm [ ] 2= Buying [ ] 3=Government donations[
] 4=Neighbors gifts [ ] 5=NGO [ ] 6=Other
Specify_________________________________________

290
Section 2: 002: Examining the Adaptive Capacity of State and Non-State
Institutions
201. Tick in order of priority the main watershed governance goals in the Lower Sio
River Watershed.
1 = Water for Nature [ ] 2 = Whole-Systems Approaches [ ] 3 = Transparency and
Engagement of Affected Parties [ ] 4 = Subsidiary and Clear Roles for Decision-Making
[ ] 5 = Sustainable Financing and Capacity [ ] 6 =Accountability and Independent
Oversight [ ] 7= Don’t Know [ ]
202. What are the domains/aims for watershed governance in the Lower Sio River
Watershed?
1= Creating social resilience to adapt to a changing climate [ ] 2= Enhancing water-use
efficiency and conservation and improving management [ ] 3= Involving local expertise
and resources [ ] 4= Clarifying roles and responsibilities [ ] 5= Protecting and
enhancing ecological health and functions including food production [ ] 6= Reducing or
avoiding watershed related conflicts [ ]
203. What changes have you observed in watershed governance since the year 2010 after
devolution in Kenya? Indicate if yes what the changes observed before and after
devolution.
Changed Aspect 1=Yes 2=No Before devolution After devolution
a. Policy and
Regulations
b. Planning
c. Social cohesion
d. Infrastructure
e. Financial
f. Ecological
G Other
204. How have the changes affected food production and distribution in this
watershed?…………………………………………………………………………………
………………………………………………………………………………………………

291
205. Which of the following watershed governance conditions are present or absent that
contributes to your adaptation to social, economic and environmental changes in the
Lower Sio River Watershed?
Watershed governance
conditions
1=Present
2= Absent
If YES give examples and
If NO give reasons
Grass-root by-laws
a. Enabling powers in
county/national legislation
for watershed entities
b. Co- management with other
international actors
c. Support from and
partnership with local
government
d. Sustainable long-term
funding
e. A functional legal
framework for sustainable
watershed management
f. Availability of data,
information and monitoring
g. Independent oversight and
public reporting
h. Assessing cumulative impact
i. Continuous peer to peer
learning and capacity
building
j. Mechanism for interaction
between upstream and
downstream water users
k. Traditional/cultural value
systems
206. What are watershed governance structures in the Lower Sio River Watershed that
respond to food security crisis?
1= Water resources management plans [ ] 2= Water resources laws and regulations [ ]
3= Water resources monitoring frameworks [ ] 4= Water resources financial budgets [ ]
5= Water resource institutions [ ] 3=Water resources policies [ ] 4=Transparency and
accountability means [ ] 5=Cultural values systems [ ] 6= Other specify……………………
207. List watershed governance structures that hinder effective food production and
distribution in the Lower Sio River Watershed.

292
………………………………………………………………………………………………
………………………………………………………………………………………………
………………………………………………………………………………………………
208. What are the drivers to watershed destruction in the Lower Sio River Watershed?
1=unsustainable farming practices [ ] 2=Non implementation and reinforcement of
existing laws [ ] 3= Low public knowledge in watershed management [ ] 4=Lack of
information and early warning systems [ ] 5=Lack of financial resources for investment
in watershed management [ ] 6= Collapse of traditional systems [ ] 7=Other……………..
209. In order of importance, what factors contribute to the public involvement in
watershed management activities in this Lower Sio River Watershed?
1= Not important 2= less Important 3= Important 4= Very important 5= Don’t know
Watershed Management Factors Rank Give examples and
give reasons
a. Need to increase or sustain food
production
b. Availability of financial resource
c. Local political will and support
d. Good leadership that promotes
activities
e. Local watershed policies, laws, plans
f. Traditional/cultural values systems
g. Adequate knowledge and expertise
h. Collaborations and partnership with
other actors
i. Working with research institutions
j. Availability of early warning systems
k. Clear conflict resolution framework
210. At what stage did/do you participate in watershed management plans, policies and
programmes in the watershed?
Stage 1=Yes 2=No Comment
a Formulation
b Implementation
c Monitoring and
evaluation

293
d Do not participate
211. Are the following watershed governance values observed in all food security policy
processes in the Lower Sio River watershed? 1= Yes 2=No 3= Do not Know
Values Policy
formulation
Policy
implementation
Policy
monitoring
Policy
evaluation
Comment
Accountability
Transparency
Legitimacy
Inclusiveness
Responsiveness
212. What watershed expertise exists that enhance your involvement in watershed
management activities in the Lower Sio River Watershed?
1=Watershed planning [ ] 2= Traditional expertise [ ] 3= Land management [ ]
4=Water quality monitoring [ ] 5=Stream restoration [ ] 6= Law enforcements [ ]
7= Wetland restoration [ ] 8= Forest Management [ ] 9=Fund raising [ ]
10=Sustainable Agricultural production [ ] 11=Information and communication [ ] 12
Farmers coordination [ ] 13 Policy making and influencing decisions [ ] 14=Research
and Training [ ] 16= Advocacy and lobbying [ ] 17=Other……………………………………
213. Comment on the following sources of funds for watershed and food security
activities.
Source of fund Availability Accessibility Sufficiency Utilization
a Line ministry budgets
b County departments
c Civil societies/ NGO
d CDF/Devolved funds
e Household income Available: 1=Widely available 2=Rarely available 3=Not available 4=Don’t know
Accessibility: 1=Easily accessible 2= Difficult to access 3=Not accessible 4= Don’t know
Sufficiency: 1=More sufficiency 2=moderately sufficiency 3= Not sufficiency 4= Don’t know
Utilization: 1= Well utilized 2= poorly utilized 3=Not utilized 4=Don’t know
214. What are the avenues for watershed information sharing that are preferred by the
public in this watershed? RANK (1=Most preferred, 2= moderately preferred, 3= Least
preferred, 4= Not preferred)

294
Avenue Ranking Comment
a County-wide watershed conference
b Grass-root chiefs barasas
c Open outreach /education training
d Ward agricultural offices
e Faith-based forums
f Other
Section 3: 003: Determining the Effectiveness of Adaptive Co-Management
301. Which department at the county or national level has been tasked with coordinating
the work of other departments and stakeholders towards a number of watershed
management and food security goals in the Lower Sio River watershed?
1=County department of Agriculture [ ] 2= County department of Environment [ ] 3=
NEMA [ ] 4= WRMA [ ] 5= Ministry of Agriculture [ ] 6=Ministry of Environment [ ] 6=
Don’t Know [ ] 7= Other specify………………………………………………………………….
302. Which new departments, ministries or agencies have been created that enhance
watershed management for food security activities in the Lower Sio River watershed?
1=County department of Agriculture [ ] 2= County department of Environment [ ] 3=
NEMA [ ] 4= WRMA [ ] 5= Ministry of Agriculture [ ] 6=Ministry of Environment [ ] 7=
Don’t Know [ ] 8= Other specify…………………………………………………………………..
303. What new social policy programs have been created under devolution that enhances
watershed management for food security in the Lower Sio River watershed?
1= County Environmental Protection Policy [ ] 2= Water Services Provision policy [ ]
3= Agricultural Development Policy [ ] 4= Don’t Know [ ] 5= Other
Specify…………………………………………………………………………………………………
304. Who are the main Non State Actors in watershed management activities in this
watershed?
…………………………………………………………………………………………………………
………………………………………………………………………………………………………..
305. What watershed management knowledge and resources created by these actors that
contribute to food production and distribution in the Lower Sio River Watershed?

295
1= Watershed planning [ ] 2= Watershed law making [ ] 3= Land management [ ]
4= Water quality monitoring [ ] 5= Stream restoration [ ] 6= Advocacy and lobbying [ ]
7=Wetland restoration [ ] 8= Forest Management [ ] 9= Fund raising [ ]
10=Sustainable Agricultural production [ ] 11=Information and communication [ ]
12=Farmers coordination [ ] 13=Agri business marketing [ ] 14 Policy making and
influencing decisions [ ] 15= Research and training [ ] 16= Other…………………………
306. Does the watershed management knowledge and resources created by various actors
enhance the legitimacy of, and public support for food security interventions?
1=Yes [ ] 2=No [ ] 3=Don’t know [ ] if yes specify………………………………………
307. Does the Non-State Actors bridge the watershed management gap between
government agencies and various governance levels (global – national, national – local,
global – local)?
1=Yes [ ] 2=No [ ] 3=Don’t know [ ] if yes specify………………………………………...
308. Is there political will for support of Non-state Actors in watershed management and
food security activities in this watershed?
1=Yes [ ] 2=No [ ] 3=Don’t know [ ] if yes specify………………………………………...
309. What conflicts in the watershed governance systems exist in the Lower Sio River
Watershed that may hinder food security goals?
1= Human- Human Conflicts [ ] 2= Human- Wildlife Conflict [ ] 3= Citizen-national
conflict [ ] 4= Citizen- County government conflict [ ] 5= Locals –government policies
6= Don’t Know [ ] 7= Other Specify………………………………………………………………
310. Are there conflicts among actors in watershed management and food security that
may lead to exclusion of other actors?
if yes specify…………………………………………..
311. What are the causes of conflicts among actors in watershed management and food
security sectors?

296
1= Differences in policies [ ] 2=Struggle for same donors [ ] 3= Watershed resources
competition [ ] 3= Lack of proper coordination [ ] 4= Government officers interference [
] 5= Political interference [ ] 6=Do not Know [ ]
312. Are watershed management policies and programs mutually reinforcing food
production and distribution in the Lower Sio River Watershed?
1=Yes [ ] 2=No [ ] 3=Don’t know [ ] if yes specify……………………………………..
313. Rank and comment on the public support for the following institutions in watershed
governance in the Lower Sio River Watershed.
(RANKING: 1= Less support, 2=Moderate support, 3= High support, 4= Very High
support 5= No support)
Institution Ranking Comment
Grass root Group
County government dept.
National government min.
NEMA
WRA
Nile Bain
Lake Basin Dev. Authority
Other
Section 4: 004: Evaluating the impacts of watershed governance structures on rural
food security
401. What are the food security goals for the Lower Sio River Watershed?
1= Food Agricultural research Innovating to feed the county [ ]
2=Engaging and educating the farmers on sustainable food and agriculture [ ]
3=Improving rural livelihoods through food and agricultural systems [ ]
4=Advancing new food and agricultural product solutions [ ]
5=Encouraging a new generation of food and agricultural leaders [ ]

297
402. Are watershed management policies and programs contributing to shared food
security goals and outcomes?
1=Yes [ ] 2=No [ ] if yes specify…………………………...
403. What are the drivers for food insecurity in the Lower Sio River Watershed?
1= Low farm yield [ ] 2= High prices of foods [ ] 3= Low supply of food in the market [ ]
4=Prolonged drought [ ] 5= Land degradation [ ] 6=Watershed resources degradation [
] 7=Low incomes [ ] 8= Weak warning information systems [ ] 9= Poor government
policy [ ] 7= Failure of traditional food systems [ ] 8=Other Specify……………………..
404. Has the county government impacted in any way on watershed management for food
production and distribution in the Lower Sio River Watershed? Reply per section of
watershed
Section 1=Yes 2=No Specify
A Hill tops
B Hill slopes
C Farm/ plain land
D Flood plain
E River stream
F Others
405. How does existing watershed governance structure impact on the following domains
of food security in the Lower Sio River Watershed? IMPACTS: (1= Positively, 2= No
impact, 3= Negatively 4= Don’t Know)
Food security domain Level of
impact
Give reasons for your answer
a. Rural agriculture crop production
b. Rural agriculture livestock
production
c. Rural food trade
d. Aquaculture activities
e. Ecosystems/Environmental activities
f. Development cooperation
g. Traditional production systems
406. Are the existing watershed governance structures contributing to the following
factors of food security in the Lower Sio River watershed?
Factors of food security 1=Yes
2= No
Give reason
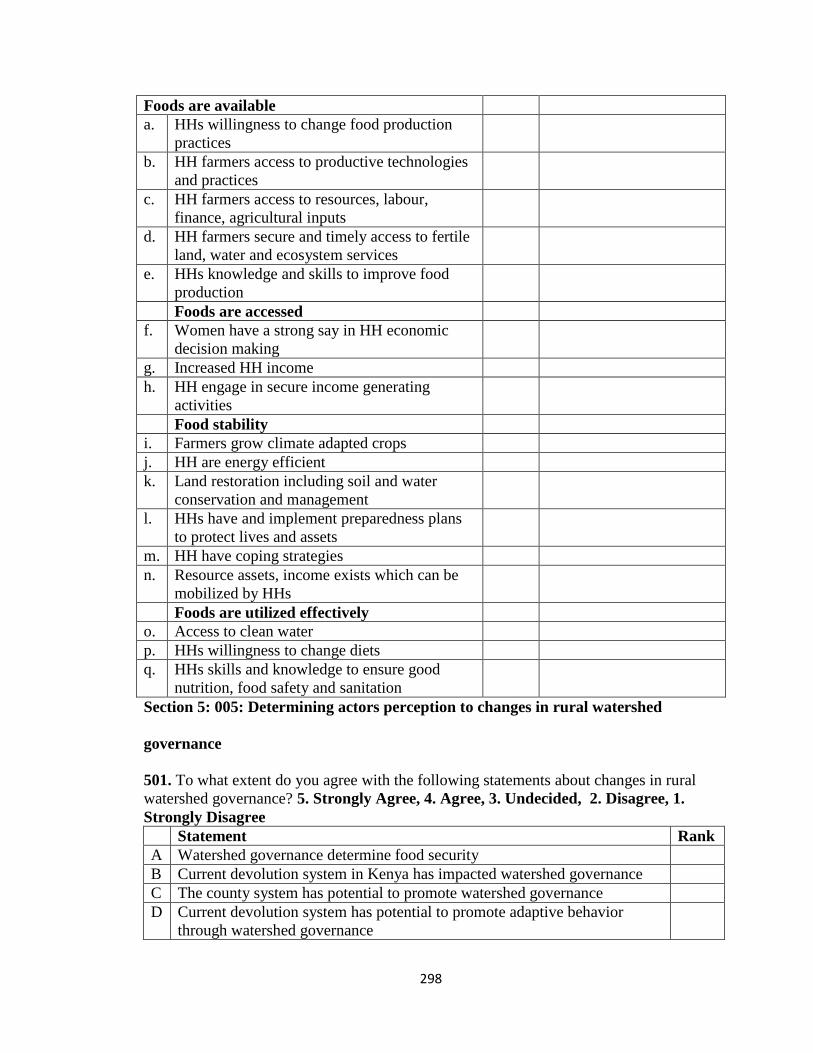
298
Foods are available
a. HHs willingness to change food production
practices
b. HH farmers access to productive technologies
and practices
c. HH farmers access to resources, labour,
finance, agricultural inputs
d. HH farmers secure and timely access to fertile
land, water and ecosystem services
e. HHs knowledge and skills to improve food
production
Foods are accessed
f. Women have a strong say in HH economic
decision making
g. Increased HH income
h. HH engage in secure income generating
activities
Food stability
i. Farmers grow climate adapted crops
j. HH are energy efficient
k. Land restoration including soil and water
conservation and management
l. HHs have and implement preparedness plans
to protect lives and assets
m. HH have coping strategies
n. Resource assets, income exists which can be
mobilized by HHs
Foods are utilized effectively
o. Access to clean water
p. HHs willingness to change diets
q. HHs skills and knowledge to ensure good
nutrition, food safety and sanitation
Section 5: 005: Determining actors perception to changes in rural watershed
governance
501. To what extent do you agree with the following statements about changes in rural
watershed governance? 5. Strongly Agree, 4. Agree, 3. Undecided, 2. Disagree, 1.
Strongly Disagree
Statement Rank
A Watershed governance determine food security
B Current devolution system in Kenya has impacted watershed governance
C The county system has potential to promote watershed governance
D Current devolution system has potential to promote adaptive behavior
through watershed governance

299
E Watershed management should be prioritized during county planning
F Accepted watershed governance will promote sustainable livelihoods.
G County government focus on watershed governance will increase budgetary
allocations and human resources for sustainable food security.
502. What is your level of satisfaction with the following domains of watershed
governance in enhancing your involvement in food production and distribution in this
watershed?
Levels: 1=Highly satisfied 2=Satisfied 3=Fairly Satisfied 4=Less Satisfied 5= Not
satisfied
Watershed governance domains Level of
satisfaction
a. Creation of local social resilience to adapt to climate change
b. Enhancing water-use efficiency and conservation and improving
management
c. Involving local expertise and resources
d. Clear roles and responsibilities of various actors
e. Protection of ecological health and functions including food production
f. Reducing or avoiding watershed related conflicts
g. Watershed management for food production decision making process
503. In order of importance rank the watershed governance contextual factors that must
be addressed by all actors for effective and sustained food production and distribution in
the Lower Sio River Watershed. RANKS 1= Most Important 2= Fairly Important 3=
Important 4= Least Important 5= Not important
Factor Rank Give Reason for your ranking
Geographical diversity
Cultural diversity
Land tenure system
Legal rights to water and water
resources
Existing strategic land use plans and
other watershed resources
Lack of local government
jurisdiction over upstream activities
Emerging integrated single decision
making for resource development in
the county governments
Limited or non-existence
requirement to monitor and report
actual water use
The current lack of tools to assess
cumulative watershed impacts
Nature of potential changes to
regulate groundwater extraction,
monitoring, and assessment

300
504. To what extend do you agree with the following as the main driver for a more
collaborative watershed-focused model of management and governance in the Lower Sio
River Watershed. RANKS: 5. Strongly Agree, 4. Agree, 3. Undecided, 2. Disagree, 1.
Strongly Disagree
Driver Rank Give reason for your ranking
The demand for local domestic use water
protection
Water pollution control
threat of increasing water use along River
Sio
Concerns of fish and other water habitant
protection
Recognition of increasing water scarcity
Increasing uncertainty and conflicts among
water users
Growing demand for citizens to have a
viable voice in watershed decision making
Fiscal constraints on all levels of
government
Institutional barriers that results from
fragmented decision-making
505. Why do you think change is necessary in watershed governance systems at the local
level in the Lower Sio River Watershed?
Reason 1= Yes
2= No
Give reason for your reason
A commitment to more holistic
watershed management
approaches
Ensuring water resource
management are treated as a
public trust
New forms of governance that
involve the sharing of power or
rescaling of decision making
Need for institutions that attempt
to address the problem of fit
between administrative and
biophysical boundaries
There is no need for change in
watershed governance systems
Thank you for participating in the study

301
APPENDIX VI: KEY INFORMANT INTERVIEW GUIDE
STUDY TITLE: WATERSHED GOVERNANCE AND FOOD SECURITY IN THE
LOWER SIO WATERSHED, BUSIA COUNTY: ACTORS IN-DEPTH
INTERVIEW GUIDE
This guide targeted the State and Non-State Actors
Instruction: Complete each section as indicated. This instrument will be used on
conducting face to face interviews.
1. Name of the Organization ____________________Contact____________________
2. Name of the Interviewee ____________________Designation____________________
3. Which description best fits your organization?
1=National government dept [ ] 2=County government dept. [ ] 3=International NGO [
] 4=Local NGO [ ] 5=Non-profit/community-based [ ] 6=Faith-based organization [ ]
7=Academic organization [ ] 8=Private consulting/business [ ] 9= Other _____________
4. Within which watershed/river basin(s) does your organization work? (Please select all
that apply).
1=International [ ] 2= Sub Saharan Africa [ ] 3= Eastern Africa [ ] 4= Entire nation
(Kenya) [ ] 5=Busia County [ ] 6= Lake Victoria Basin [ ] 7= Sio River [ ] 8= Western
Kenya Region [ ] 9= Other specify __________________________________________
5. Which of the following priority topic areas fall under your organization’s mission?
(Please check all that apply.)

302
1=Watershed management [ ] 2=Forest resource management [ ] 3=Agricultural
production [ ] 4= Land/habitat conservation [ ] 5= Food security [ ]6= Research/data
collection [ ] 7= Grassroot institutions building [ ] 8= Education outreach & advocacy [
]9= other (please list) ___________________________________________________
6. Approximately how many years has your organization been involved in watershed
related efforts? (Please only enter a number.) __________________________________
7. What is the main priority watershed governance goals in the Lower Sio River
Watershed?______________________________________________________________
________________________________________________________________________
________________________________________________________________________
8. What are the domains/aims for watershed governance in the Lower Sio River
Watershed?______________________________________________________________
________________________________________________________________________
________________________________________________________________________
9. What are the watershed governance structures in the Lower Sio River
Watershed?______________________________________________________________
________________________________________________________________________
________________________________________________________________________
10. What are the drivers to watershed destruction in the Lower Sio River Watershed? Are
they the same drivers for food insecurity in the
watershed?_______________________________________________________________
________________________________________________________________________
________________________________________________________________________
11. What changes either social, economic and/ or environmental have you observed in
watershed governance in the Lower Sio River Watershed since the year 2010 after
devolution in Kenya?

303
________________________________________________________________________
________________________________________________________________________
________________________________________________________________________
12. Which watershed governance conditions are present that contributes to public
adaptation to social, economic and environmental changes in the Lower Sio River
Watershed?
________________________________________________________________________
________________________________________________________________________
________________________________________________________________________
13. How has your organization or institution adapted to the social, economic and
environmental changes mentioned above?
________________________________________________________________________
________________________________________________________________________
________________________________________________________________________
14. How does your organization or institution contribute to the public watershed
management activities for food security?
________________________________________________________________________
________________________________________________________________________
________________________________________________________________________
15. What watershed knowledge and resources does your organization offer that
complement the efforts of other actors in watershed management in the Lower Sio River
Watershed?______________________________________________________________
________________________________________________________________________
16. Does your organization have by-laws and plans that contribute to watershed activities
in this watershed? Give examples.
________________________________________________________________________
________________________________________________________________________
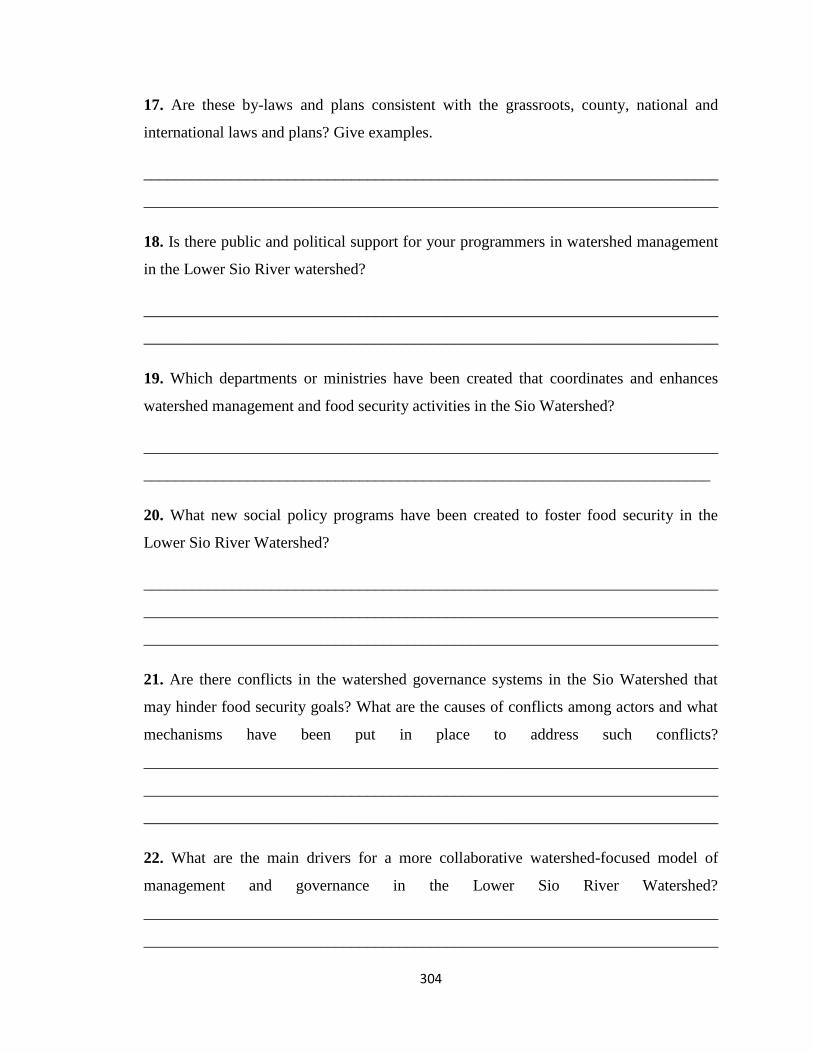
304
17. Are these by-laws and plans consistent with the grassroots, county, national and
international laws and plans? Give examples.
________________________________________________________________________
________________________________________________________________________
18. Is there public and political support for your programmers in watershed management
in the Lower Sio River watershed?
________________________________________________________________________
________________________________________________________________________
19. Which departments or ministries have been created that coordinates and enhances
watershed management and food security activities in the Sio Watershed?
________________________________________________________________________
_______________________________________________________________________
20. What new social policy programs have been created to foster food security in the
Lower Sio River Watershed?
________________________________________________________________________
________________________________________________________________________
________________________________________________________________________
21. Are there conflicts in the watershed governance systems in the Sio Watershed that
may hinder food security goals? What are the causes of conflicts among actors and what
mechanisms have been put in place to address such conflicts?
________________________________________________________________________
________________________________________________________________________
________________________________________________________________________
22. What are the main drivers for a more collaborative watershed-focused model of
management and governance in the Lower Sio River Watershed?
________________________________________________________________________
________________________________________________________________________
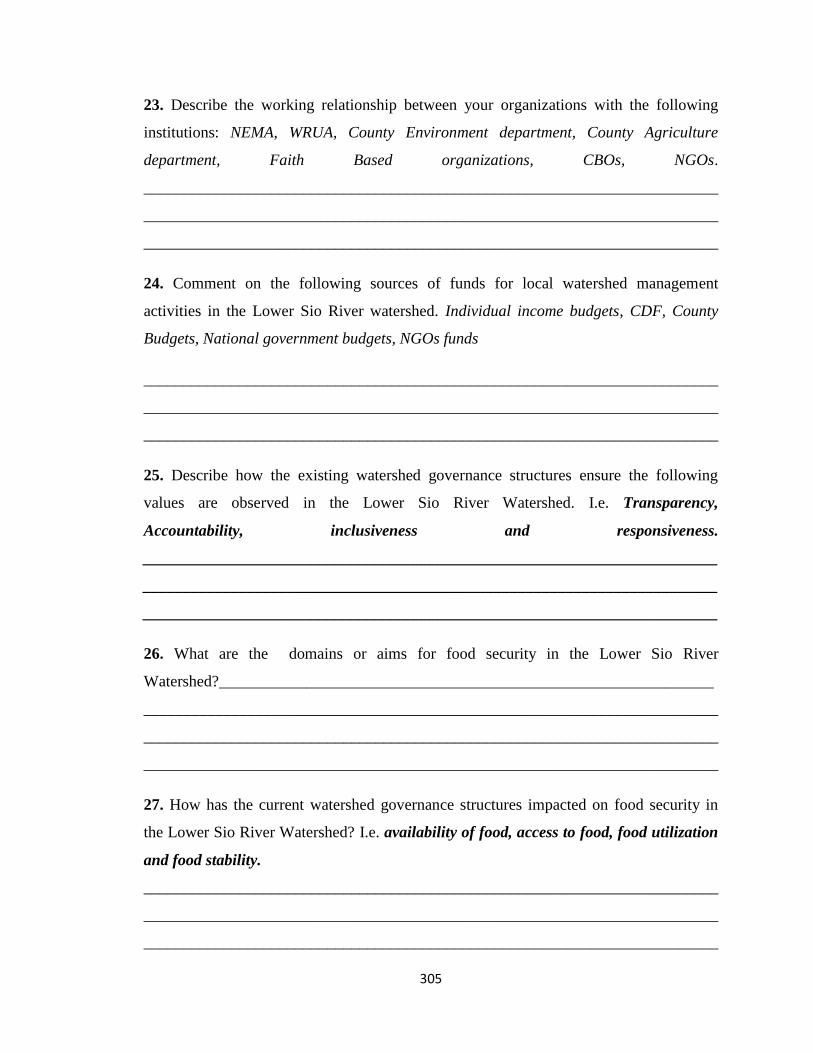
305
23. Describe the working relationship between your organizations with the following
institutions: NEMA, WRUA, County Environment department, County Agriculture
department, Faith Based organizations, CBOs, NGOs.
________________________________________________________________________
________________________________________________________________________
________________________________________________________________________
24. Comment on the following sources of funds for local watershed management
activities in the Lower Sio River watershed. Individual income budgets, CDF, County
Budgets, National government budgets, NGOs funds
________________________________________________________________________
________________________________________________________________________
________________________________________________________________________
25. Describe how the existing watershed governance structures ensure the following
values are observed in the Lower Sio River Watershed. I.e. Transparency,
Accountability, inclusiveness and responsiveness.
________________________________________________________________________
________________________________________________________________________
________________________________________________________________________
26. What are the domains or aims for food security in the Lower Sio River
Watershed?______________________________________________________________
________________________________________________________________________
________________________________________________________________________
________________________________________________________________________
27. How has the current watershed governance structures impacted on food security in
the Lower Sio River Watershed? I.e. availability of food, access to food, food utilization
and food stability.
________________________________________________________________________
________________________________________________________________________
________________________________________________________________________

306
28. What are watershed governance structures in the Lower Sio Watershed that respond
to food security crisis?
________________________________________________________________________
________________________________________________________________________
________________________________________________________________________
29. What are watershed governance structures in the Sio Watershed that hinder effective
food security in the area?
________________________________________________________________________
________________________________________________________________________
________________________________________________________________________
30. Are you satisfied with watershed management and food security governance process
in this Watershed? What changes do you proposed that will enhance watershed
governance for food security in the Lower Sio River Watershed?
________________________________________________________________________
________________________________________________________________________
Thank you for participating in the study

307
APPENDIX VII: FOCUSED GROUP DISCUSSION GUIDE
STUDY TITLE: WATERSHED GOVERNANCE AND FOOD SECURITY IN THE
LOWER SIO WATERSHED, BUSIA COUNTY: FOCUSED GROUP DISCUSSION
GUIDE
Section 1: 001: General Information
FGD No: Name of
Facilitator:
Name of the County: Sub county:
Ward: Village:
No of Males: No of Female:
Other information:
Section 2: 002 Probing on Watershed Governance and Food Security
1. Which description best fits this group?
1= WRUA. [ ] 2= CFA. [ ] 3= Social Accountability [ ] 4= Faith based [ ] 5= Farmers
group [ ] 6= Other ____________________
2. Within which watershed/river basin(s) does your group work? (Please select all that
apply.)
1=Village [ ] 2= Location [ ] 3= Sub-county [ ] 4= County [ ] 5= Other specify_______
3. Which of the following priority topic areas fall under your group’s mission? (Please
check all that apply.)
1=Watershed management [ ] 2=Forest resource management [ ] 3=Agricultural
production [ ] 4= Land/habitat conservation [ ] 5= Food security [ ]6= Research/data
collection [ ] 7= Governance/ citizen engagement [ ] 8= Education outreach & advocacy
[ ] 9= other (please list) __________________________________________________

308
4. Approximately how many years has your group been involved in watershed related
efforts? (Please only enter a number.) ________________________________________
5. What are the main priority watershed governance goals in the Lower Sio River
Watershed?
Men
Women
General
6. What are the domains/aims for watershed governance in the Lower Sio River
Watershed?
Men
Women
General
7. What are the watershed governance structures in the Lower Sio River Watershed?
Men
Women
General
8. What are the drivers to watershed destruction in the Lower Sio River Watershed? Are
they the same drivers for food insecurity in the watershed?

309
Men
Women
General
9. What changes social, economic and/ or environmental have your group observed in
watershed governance in the Lower Sio River Watershed since the year 2010 after
devolution in Kenya
Men
Women
General
10. Which watershed governance conditions are present that contributes to the members
adaptation to social, economic and environmental changes in the Lower Sio River
Watershed?
Men
Women
General
11. How has your community adapted to the social, economic and environmental changes
mentioned above?

310
Men
Women
General
12. How does your group contribute to the watershed management activities?
Men
Women
General
13. Does your group has by-laws, plans to regulate members watershed activities? Give
examples.
Men
Women
General
14. Are there any external assistance you received in making the by-laws and the plans to
regulate members watershed activities?
Men
Women
General

311
15. If yes are these by-laws and plans coherent with the county, national and international
laws and plans?
Men
Women
General
16. What watershed knowledge and resources does your group offer that complement the
efforts of other actors in watershed management in the Lower Sio River Watershed?
Men
Women
General
17. Do you and local political leadership support other actors’ programmes in watershed
management in the Lower Sio River watershed?
Men
Women
General
18. Which departments or ministries have been created that coordinates and enhances
watershed management and food security activities in the Sio Watershed?
Men

312
Women
General
19. What new social policy programs have been created to foster food security in the
Lower Sio River Watershed?
Men
Women
General
20. Are there conflicts in the watershed governance systems in the Sio Watershed that
may hinder food security goals? What are the causes of conflicts among actors and what
mechanisms have been put in place to address such conflicts?
Men
Women
General
21. What are the main drivers for a more collaborative watershed-focused model of
management and governance in the Lower Sio River Watershed?
Men
Women
General

313
22. Describe the working relationship between your groups with the following
institutions: NEMA, WRUA, County Environment department, County Agriculture
department, Faith Based organizations, CBOs, NGOs.
Men
Women
General
23. Comment on the following sources of funds for your participation in watershed
management activities in the Lower Sio River watershed. Individual income budgets,
CDF, County Budgets, National government budgets, NGOs funds
Men
Women
General
24. Describe how the existing watershed governance structures ensure the following
values in the Lower Sio River Watershed. I.e. Transparency, Accountability,
inclusiveness and responsiveness.
Men
Women
General
25. What are the domains or aims for food security in the Lower Sio River Watershed?

314
Men
Women
General
26. How has the current watershed governance structures impacted on food security in
the Lower Sio River Watershed? i.e. availability of food, access to food, food utilization
and food stability.
Men
Women
General
27. What are watershed governance structures in the Lower Sio Watershed that respond
to food security crisis?
Men
Women
General
28. What are watershed governance structures in the Sio Watershed that hinder effective
food security in the area?
Men
Women

315
General
29. Are you satisfied with watershed management and food security governance process
in this Watershed? What changes do you proposed that will enhance watershed
governance for food security in the Lower Sio River Watershed.
Men
Women
General
Thank you for participating in the study

316
APPENDIX VIII: STAKEHOLDERS INVENTORY –BUSIA COUNTY
S/n
o NAME OF
STAKEHOLD
ER
TYPE OF
ORGANIZ
ATN
GEOGRAP
HICAL
AREA OF
COVERA
GE
SERVICES OFFERED /
ACTIVITIES
PROJECT TITLES
1 Family bank Private Bag County
wide
Financial services
2 K-Rep Bank Microfinanc
e
County
wide
Provision of credit
3 AFC GoK
microfinanc
e
County
wide
Provision of agricultural credit
4 KCB Limited Private Bag County
wide
Kilimo biashara loans.
Agricultural loans
5 KWFT Private Bag County
wide
Provision of Microfinance to
groups and individuals.
6 Equity bank Private Bag County
wide
Kilimo biashara loans
Agricultural loans
7 KARI Research
organization
Bungoma,
Busia Siaya
& Kisumu
counties
Research activities: Maize,
Grain legumes (Pulses),
Horticulture, Sweet potatoes,
Cassava, Oil crops, Sorghum and
millet, KARI Seed Unit,
Livestock, biotechnology & Fruit
Nursery, Soil Fert & Water
Management
8 PALWECO
programme for
agriculture and
livelihoods in
western
communities
NGO County
wide
C1-Household economy, C2-
Value chains approach in
agriculture sub-sector,
C3-Support functions that result
into strengthened capacity of
beneficiaries
9 ACCI-GIZ
NGO
Busia
Bunyala
Namable
Butula
ACCI-Adaptation to climate
change and insurance,
Greenhouse gas sources and
emissions and enhancing
greenhouse gas sinks.
10 Fisheries
Department
GOK County
wide
Farmed Tilapia,
Farmed Catfish,
Catfish fingerling production for
bait and fish farming
11 Livestock GOK County Indigenous poultry, honey value

317
Department wide chain, dairy value chain, Small
ruminants.
Extension services
12 Cooperative
Department
GOK County
wide
cooperatives development
13 ADS/WRCCS NGO(ACK-
Church
organization
)
County
wide
Bee keeping, amaranth, oil palm,
rice promotion
14 GAPP-Grass
root poverty
alleviation
programme
NGO Bunyala Markets processed products from
cassava, s/potatoes, sorghum and
ground nuts.
15 NEMA Parastatal County
wide
Environmental conservation
16 KAPAP GOK
programme
Busia,
Bunyala,
Namable,
Butula.
Capacity building
Input support to groups
17 ONE ACRE
FUND
NGO Countywide Provision of input on credit
18 Agriculture
department
GOK County
wide
Extension services
19 Forestry
Department
GOK County
wide
Forestry extension, river bank
rehabilitation
20 IPA(Integrated
poverty action)
NGO busia sub
county
Spring protection, environmental
conservation
21 KENFAP Private
farmers
organization
County
wide
Advocacy, lobbying ,biogas
22 Irrigation
Department
GOK Nambale,
Busia,
Butula.
Have 2 irrigation projects
:mairo/Mukemo and Syekunya in
namable on rice and local
vegetables
23 BUSIA
AGROVET
Private Busia sub
county
Agric inputs
24 REFSO(Rural
energy and food
security
organization)
Private County
wide Cassava-
provision of clean planting
Materials to groups and also does
Bulking
25 Kenya Breweries Private County
wide Sorghum- engages farmers in contract
farming
26 PAFID-CARP
(Participatory
Private Countywide Conservation Agriculture-by use
of Minimum tillage and herbicide

318
Approaches in
Integrated
Development-
CA regional
program
control on weeds )
27 REEP(rural
education and
empowerment
programme
Private Busia,
Butula,
Namable
Sweet potatoes and tomatoes
28 ARDAP(appropr
iate rural
development in
agriculture
programme)
Private Busia,
Butula,
Namable
Sweet potatoes, Nerica rice, soya
beans, g/nuts capacity building on
production and value addition.
Gives loan to groups
29 L3f Sacco (life
long learning
sacco)
Private Busia,
Butula,
Namable
Sorghum- Collecting, storage and
marketing of sorghum
30 ICS
(International
Child Support)
NGO Busia,
Butula,
Namable
Cereal banking, Input credit
31 KENVEST Financial
Institution
Country
wide
Provides financial credit
32 Lands
Department
GOK County
wide
Land issues
33 Youth
Department
GOK County
wide
Provides youth fund credit
34 Planning
department
GOK County
wide
Provision of planning data
35 Veterinary
Department
GOK County
wide
Veterinary services
36 Cooperative
department
GOK County
wide
Marketing of agricultural
products
37 Gender
Department
GOK County
wide
Gives women enterprise fund
credit
38 LBDA NGO Countywide Fish, rice VCs
39 Farm concern
international
NGO Busia,
Butula
Support horticulture and cassava
production
40 Heifer
international
NGO County
wide
Support dairy value chain-gives
heifer grants to
41 KEBS Parastatal County
wide
standardization of products
42 Public health
department
GOK County
wide
Regulates products entry
Controls quality of products
Ensures food quality

319
43 KEPHIS Parastatal Countywide Regulates products entry
44 Municipal
council of Busia
GOK
45 KICKSTART Private County
wide
Demonstration on irrigation
46 Western seed
company
Private County
wide
Provision of certified seed
47 Kirinyaga
Millers
Private Busia sub
county
Buys orange freshed sweet potato
flour
48 Faulu Kenya Private Countywide Provision of microfinance to
groups
49 GAPK-grow
against poverty
Kenya
Private Busia sub
county
Promotes cassava cottage
Supports the vulnerable with
dairy goats.
50 Cotton
Development
Authority(COD
A)
Parastatal Countywide Promotion of cotton farming
51 Horticultural
Crops
Development
Authority(HCD
A)
Parastatal Countywide Facilitate development,
promotion, coordination and
regulation of the horticultural
sub-sector
52 One World
Development
Foundation(OW
DF)BUSIA
NGO Countywide Promotion of sorghum, soya
beans, local poultry, local goats
53 KENYA SEED
COMPANY
Parastatal Countywide Promotion of maize, beans,
sorghum, finger millet. Coming
up with Nerica rice 4
54 DEMAS
BUSIA
NGO Countywide Promotes bee keeping
55 AGRICULTUR
AL
CONSULTANT
BUSIA
Private Countywide Consultancy on agriculture and
livestock enterprises
56 KEPOFA/KDB
NAMBALE
Private Countywide Service provider for poultry and
dairy production
57 SEEDCO(K) Private Countywide Deal with soya beans, sorghum &
maize
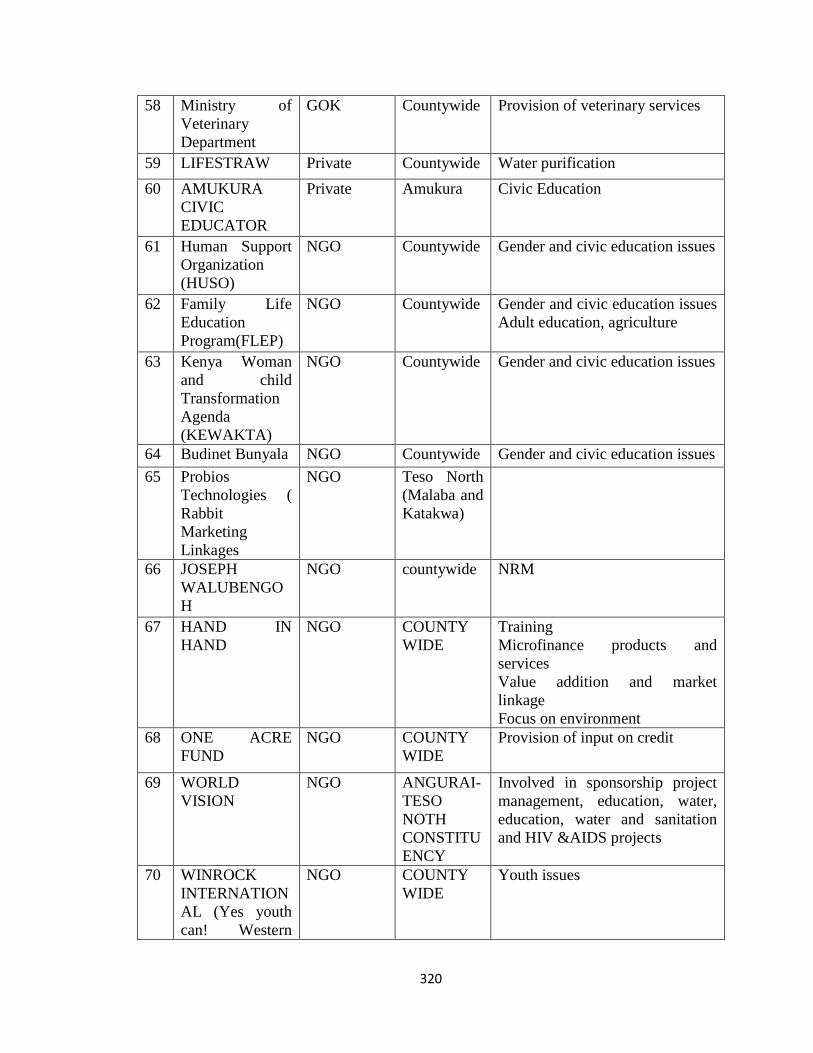
320
58 Ministry of
Veterinary
Department
GOK Countywide Provision of veterinary services
59 LIFESTRAW Private Countywide Water purification
60 AMUKURA
CIVIC
EDUCATOR
Private Amukura Civic Education
61 Human Support
Organization
(HUSO)
NGO Countywide Gender and civic education issues
62 Family Life
Education
Program(FLEP)
NGO Countywide Gender and civic education issues
Adult education, agriculture
63 Kenya Woman
and child
Transformation
Agenda
(KEWAKTA)
NGO Countywide Gender and civic education issues
64 Budinet Bunyala NGO Countywide Gender and civic education issues
65 Probios
Technologies (
Rabbit
Marketing
Linkages
NGO Teso North
(Malaba and
Katakwa)
66 JOSEPH
WALUBENGO
H
NGO countywide NRM
67 HAND IN
HAND
NGO COUNTY
WIDE
Training
Microfinance products and
services
Value addition and market
linkage
Focus on environment
68 ONE ACRE
FUND
NGO COUNTY
WIDE
Provision of input on credit
69 WORLD
VISION
NGO ANGURAI-
TESO
NOTH
CONSTITU
ENCY
Involved in sponsorship project
management, education, water,
education, water and sanitation
and HIV &AIDS projects
70 WINROCK
INTERNATION
AL (Yes youth
can! Western
NGO COUNTY
WIDE
Youth issues
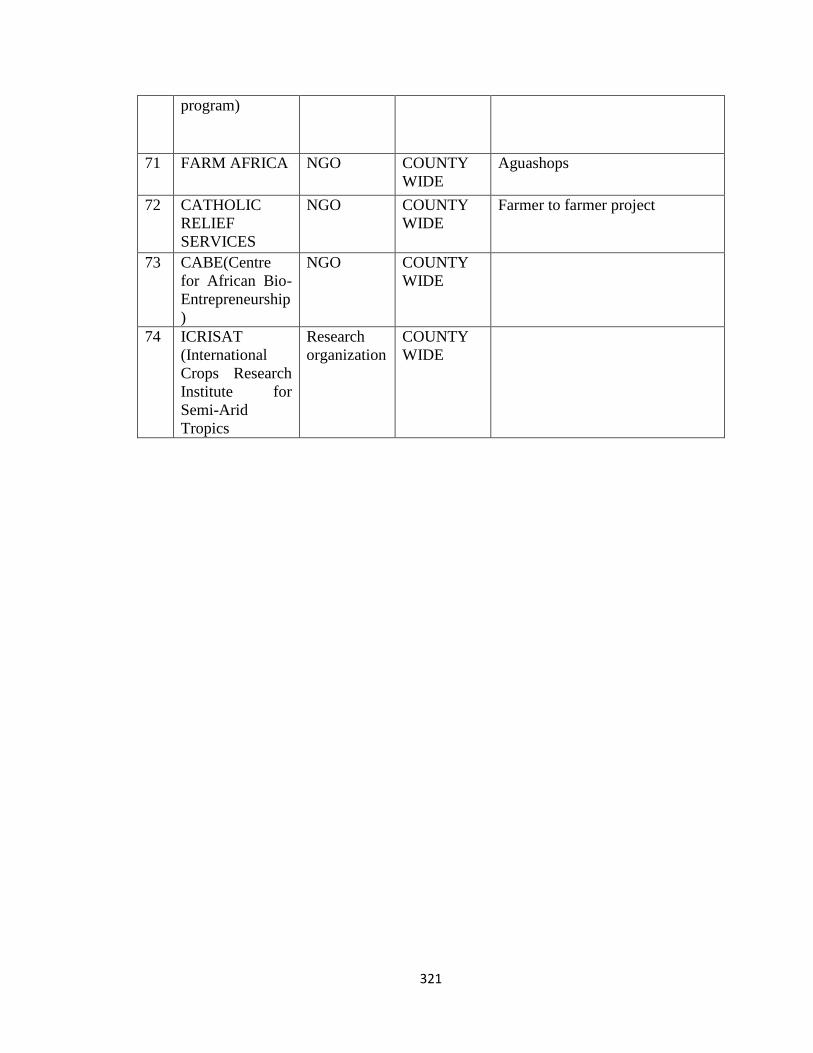
321
program)
71 FARM AFRICA NGO COUNTY
WIDE
Aguashops
72 CATHOLIC
RELIEF
SERVICES
NGO COUNTY
WIDE
Farmer to farmer project
73 CABE(Centre
for African Bio-
Entrepreneurship
)
NGO COUNTY
WIDE
74 ICRISAT
(International
Crops Research
Institute for
Semi-Arid
Tropics
Research
organization
COUNTY
WIDE

322
APPENDIX IX: Simpact Kenya NGO; Farmer’s Internal Regulations guideline
Simpact Kenya NGO; Farmer’s Internal Regulations guideline (From English to Iteso
language)
1. Farmers willing to join the organic sesame project will first receive training on organic sesame
production.
Lukakorwok lulokokina akoru nemam abosetaiti na agwelata ebaiti adumun akisisianakino naka
akoru kikanyim itosomaete abosetait nakore.
2. New farmers joining the project or new fields being registered for organic production will take 2
years transition period unless exempted because of non-use disallowed input at least in at least three
years before commencing organic production
Lukakorwok lukitetiak kotani amaata nukiteteak lugirio akoru naemam ebosetait nagwelata
eyangari ikaru iyare lukakilomo akoru nakakitsoma abosetaiti naka ore. Lu emamum kitosomato
ikee kamaata kokaru kiuni nesiboni esikino.
3. Soil fertility shall be built using nutrient recycling, compositing, manures, improvement of soil
organisms and control of soil erosion. Only allowed amendements/ natural inputs like phosphate
rocks may be used.
Abosetaiti kamana inyakakino kakitosoma abosetaiti nakore na ingarakiti bobo komam alelianar
kalipo adepare iboro luechamakite (Natural inputs e.g Lime and Phosphate).
4. Tools and materials used for handling organic sesame shall be cleaned always before use.
Iboro lutosomayo kakoru ikanyim lu ekorite kabosetaiti naka ore ilosio eroko kitosoma.
5. Farmers shall construct buffer zone to avoid contamination from neighbouring farms.
Amaata kikanyim ejai atiakara kamaka kinyamata kaluche kanuka akirebokin akipwokun.
6. Crop production practices such as crop rotation shall be practiced. There shall be no burning of
organic materials.
Akoru naka akibelebele inyamata ejai itunga akisisia. Emamu akichwe abosetait.
7. Weeds, pests and diseases, shall only be managed through physical, biological and cultural methods.
Only authorized and approved inputs may be used. Farmers shall not use synthetic materials at any
one time on their farms.
Inya, ikuru ka dekasinoi irebokino ka irotin lukasek (biological, physical and cultural). I boro
luechamamakite boni esikite (inputs).
8. Farmers shall only use organic seeds provided by the cooperative or sourced from recommended
source (own farm).
Lukakorwok esikite boni adumun icoko luemamum ekeya kakatongotont bon.
9. Handling of organic sesame shall be done using clean materialand containers. Packing shall be done
using labeled and designated bags.
Akidara ikanyim luekorite emamum ekeya itosomayo iboro lu emam ekeya. Iboro lu igwaere paka
kigirigiritete.
10. Sesame shall be stored in a designated clean store separated from possible source of contamination.
No use of synthetic pesticides in the organic stores.
Nama igwaere ikanyim ebait kolaye akirebokini ekipwokun. Mam ikitosoma ikee luka oduka.
11. Transport shall be done using the recommended and clean means. Vehicle transporting sesame shall
be covered appropriately.
Adakite ikanyim itosomayo iboro luelaete kicakitete. Amotoka karapitete tenan.
12. Farmers registered in the project shall only sell their sesame through the cooperative.
Lukakorwok lu-igirakina egwelatere ikanyim kakatongongoto.
13. Processing shall be done by trained personnel using cleaning equipment.
Akitene ikanyim esikite kwi lu-isisikite bon kiboro lu-elaete bon.
14. Farmers shall keep update records of their farms operations.
Lukakorwok ebait ejautu kakigirigirisia ka koru kes.
15. Framers shall allow cooperative officials and inspectors to visit their farms.
Lukakorwok ejai acamakin luka akatongotongot, kalu esikite anyanar amaata bon.
Source: Analysis from the interview with the Simpact Agronomist.

323
APPENDIX X: STATUS OF SMALL HOLDERS IRRIGATION SCHEMES IN BUSIA COUNTY AS AT OCTOBER 2017
Name of project Size
in HA
No of
H/H
Location Started Type of
scheme
Activities
achievements
constraints Remarks
Nandikinya 200 60 Bunyala
sub
county
1986 Pumping Survey &Design
canals laid Basic
IWUA training
Lack of funds
silted canals
Flooding of
pump house
Lack of
electricity
Big changes
in suction
head
The has stalled for
long and farmers are
almost giving up
Action on the intake
system will ensure a
quick result& Training
of famers should be
upscaled
Mudembi/Ruamb
wa
250 100 Bunyala
sub
county
Pumping Incomplete Designs
Basic IWUA
training Laid canals
installed intake
system
Lack of funds
Incomplete
laying of
canals Many
farmers are
not trained
The scheme is
operating on phase 1
of 50 acres despite the
challenges
Sisenye 200 Bunyala
Sub
County
Pumping The intake
construction &pump
installation Canals
are 50% done Basic
IWUA training
Control
flooding
around the
intake
`Power
supply not
complete On
farm
distribution
line
This project was taken
up by NIB for up
scaling
Samia Fruits 60 60 Samia Sub
County
2010 Pumping&gra
vity
Installation of intake
system Laying of
rising main line
Flooding of
the intake
area Leaking
The intake must be
protected from the
rising levels of the

324
Construction of
storage tank Basic
IWUA training
water tank
Lack of funds
Lack of
distribution
lines
lake and the tank
repaired for
objectives to be
achieved
Neela irrigation
project
120 80 Butula
Sub
county
Esikoma
ward
Gravity
scheme
2008 2 springs protected
Collection pan
constructed Basic
IWUA training
Not enough
water
Use of open
canals Lack
of funds
Farmers on
the steep
slopes
Desilting of storage
and change from open
canals to pipes and
drip system &storage
tanks be combined to
increase efficiency
Namusala 100 50 Butula
Sub Cou
Butula
ward
Gravity
scheme
2011 IWUA formed
sensitization done
Surveyed &designed
No funding
Lack of
cohesiveness
among the
farmers
The project did not
start as it was not
funded
Namalenga 50 45 Matayos
Sub
County
Gravity 2009 Laid open canals
Basic IWUA
training
Use of pipe
instead of
open canals
for efficient
conveyance
The project is viable
with improvement of
water conveyance
&utilization on the
farms
Akatagroit 40 100 Teso
south
Gravity Intake weir
constructed main
line 2220m installed
On farm
distribution
not done drip
kits and
storage
Intake works done by
GOK Pipe works
funded by WKCDD
Syekunya
drainage site
Nambale
Sub
county
2009 Drainage Drainage channels
dug but incomplete
Basic IWUA
formation Survey
and Design done
Late
disbursement
of funds
Poor conflict
resolution
There is need to
capacity build the
project committee
members and the
farmers

325
among
members
Mayenje drainage
project.
150 100 Matayos
Sub
County
1998 Drainage Sensitization and
mobilization
Excavation of
drainage canals
Low funding
Incomplete
designs
Need to complete the
designs and Carryout
EIA

326
APPENDIX XI: RESEARCH PERMIT FROM NACOSTI