Waterlogging risk assessment: An undervalued disaster risk in ...
33
1 Waterlogging risk assessment: An undervalued disaster risk in coastal urban community of Chattogram, Bangladesh Md. Rezuanul Islam 1 , Debasish Roy Raja 2 1 School of Environment and Society, Tokyo Institute of Technology, Tokyo, Japan 2 Department of Urban and Regional Planning, Chittagong University of Engineering and Technology, Chattogram, Bangladesh Corresponding author: [email protected] Abstract In recent years, rainfall-induced waterlogging has become a common hazard in the highly urbanized coastal city of Chattogram, Bangladesh resulting in high magnitude of property damage and economic loss. Therefore, the primary objective of this research is to prepare a waterlogging inventory map and understand the spatial variation of the risk by means of hazard intensity, exposure, and vulnerability of waterlogging. In this research, the inventory map and factors influencing waterlogging hazard were determined from a participatory survey and other spatial data including land elevation, population, and structural data were collected from secondary sources. Analytical Hierarchy Process was applied to measure the hazard intensity and the exposure and vulnerability were estimated by overlaying the spatial data onto the hazard intensity map. A total of 58 locations in 22 wards have been identified as waterlogging affected, which covers ~8.42% of the city area. Obtained waterlogging vulnerability index map suggests that ward no. 5, 6, 16, 17, and 33 are greatly vulnerable to waterlogging in terms of their social, infrastructure, critical facilities, economic and environmental vulnerability. We show that ~2.71% of the study area is at very high risk, while the risk score is considerably higher for ward no. 5, 8, 17, 19, and 33. Keywords: waterlogging, vulnerability, risk, participatory survey, GIS, Chattogram Preprints (www.preprints.org) | NOT PEER-REVIEWED | Posted: 27 January 2021 doi:10.20944/preprints202101.0572.v1 © 2021 by the author(s). Distributed under a Creative Commons CC BY license.
-
Upload
khangminh22 -
Category
Documents
-
view
7 -
download
0
Transcript of Waterlogging risk assessment: An undervalued disaster risk in ...
1
Waterlogging risk assessment: An undervalued disaster risk in coastal
urban community of Chattogram, Bangladesh
Md. Rezuanul Islam1, Debasish Roy Raja2
1School of Environment and Society, Tokyo Institute of Technology, Tokyo, Japan 2Department of Urban and Regional Planning, Chittagong University of Engineering and
Technology, Chattogram, Bangladesh
Corresponding author: [email protected]
Abstract
In recent years, rainfall-induced waterlogging has become a common hazard in the highly
urbanized coastal city of Chattogram, Bangladesh resulting in high magnitude of property
damage and economic loss. Therefore, the primary objective of this research is to prepare a
waterlogging inventory map and understand the spatial variation of the risk by means of hazard
intensity, exposure, and vulnerability of waterlogging. In this research, the inventory map and
factors influencing waterlogging hazard were determined from a participatory survey and other
spatial data including land elevation, population, and structural data were collected from
secondary sources. Analytical Hierarchy Process was applied to measure the hazard intensity
and the exposure and vulnerability were estimated by overlaying the spatial data onto the
hazard intensity map. A total of 58 locations in 22 wards have been identified as waterlogging
affected, which covers ~8.42% of the city area. Obtained waterlogging vulnerability index map
suggests that ward no. 5, 6, 16, 17, and 33 are greatly vulnerable to waterlogging in terms of
their social, infrastructure, critical facilities, economic and environmental vulnerability. We
show that ~2.71% of the study area is at very high risk, while the risk score is considerably
higher for ward no. 5, 8, 17, 19, and 33.
Keywords: waterlogging, vulnerability, risk, participatory survey, GIS, Chattogram
Preprints (www.preprints.org) | NOT PEER-REVIEWED | Posted: 27 January 2021 doi:10.20944/preprints202101.0572.v1
© 2021 by the author(s). Distributed under a Creative Commons CC BY license.
2
1. Introduction
Urban waterlogging caused by heavy rainfall has become an increasingly prevailing
problem for the city dwellers and is creating adverse economic, physical, social, and
environmental consequences in major Asian cities such as Tokyo, Beijing, and Dhaka (Islam
& Das, 2014). Rapid population growth, unplanned urbanization, and climate extremes are the
major triggering factors for making this disaster more frequent in recent years (Sun et al., 2020).
Unlike other disasters, waterlogging-induced human losses are not common, billions of dollars
in damage are inflicted upon city's infrastructure every year by this event. For example, The
Ministry of Land, Infrastructure, Transport and Tourism of Japan had shown that 86% of total
economic flood damage in the Tokyo metropolitan during 1998–2007 was only due to
waterlogging (MLIT, 2008). From 2001 to 2018, there was an average of more than 40 million
people affected by waterlogging and caused more than the US $10 billion economic losses each
year in urban areas of Eastern China (Sun et al., 2020). Although a massive investment in the
improvement of waterlogging control infrastructures has been made, it remains a major disaster
risk throughout the Asian countries and the case of urban areas in Bangladesh is also similar.
Along with the reasons above, Bangladesh is greatly susceptible to waterlogging due to two-
thirds of its' land is less than five meters above sea level (Dasgupta et al., 2011; Islam & Das,
2014). In particular, 2009-14 period, waterlogging disasters caused yearly 2677 million BDT
(Bangladesh currency) in property damages at the household level. It is estimated that if there
was no such economic loss in that period, GDP volume could be increased by 0.02% per year
(Bangladesh Disaster-related Statistics, 2016). These exemplify the importance of assessing
waterlogging risk for alleviating its' impact on society and development works.
Waterlogging generally brings shallower inundation depth and slower flow velocity than
floods but causes severe disruption of regular city life, including traffic paralysis, infrastructure
damage, health, and environmental problems in Bangladesh (Subrina & Chowdhury, 2018). At
Preprints (www.preprints.org) | NOT PEER-REVIEWED | Posted: 27 January 2021 doi:10.20944/preprints202101.0572.v1
3
present major urban areas such as Dhaka, Chattogram, and Khulna have been suffering from
waterlogging almost every year in the monsoon season. In 2014, more than 65,000 households
were affected by rainfall-induced waterlogging disasters in southern coastal districts only
(Bangladesh Disaster-related Statistics, 2016). Sarkar et al., 2020 reported that 38% of coastal
inhabitants in southern Khulna city experience short-term waterlogging every year. More
recently, Chattogram, the most prosperous economic region of Southern Bangladesh, suffered
its highest recorded economic damage of 6000 million BDT caused by several waterlogging
events in the single financial year of 2017 (Quddusi, 2017). Although disaster risk management
practitioners widely investigate water disasters, mostly in assessing fluvial flooding risk, less
attention has been paid to the sufferings caused by the waterlogging disasters (Islam & Das,
2014).
Risk assessment as a pre-requisite for an effective warning is essential to mitigate the risks
to life and property posed by disasters. The Bangladesh Meteorological Department (BMD)
has been responsible for monitoring and reporting weather data as well as forecasting rainfall
over many years. The BMD issues heavy rainfall warnings when the estimated rainfall within
24 hours over an area is 44 mm or more. This warning has four contents: (1) expected affected
area; (2) approximate time of commencement; (3) severity of the heavy rainfall; (4) future
status of heavy rainfall condition (Hossain, 2007). On the other hand, Bangladesh Water
Development Board utilizes the European Centre of Medium-Range Weather Forecasts rainfall
data for forecasting large-scale floods, including fluvial and flash flood (Rahman et al., 2012).
However, the authorized department for assessing risk, forecasting, and issuing warnings for
urban waterlogging has not been established until now. Mainstreaming waterlogging risk in
national disaster risk management is fundamental to achieving reductions in related loss of
economy and property damage. Essentially, such improvement can only be achieved through
Preprints (www.preprints.org) | NOT PEER-REVIEWED | Posted: 27 January 2021 doi:10.20944/preprints202101.0572.v1
4
an in-depth understanding of both the physical factors of waterlogging and its degree of risk in
a particular area.
Many previous studies have revealed that heavy rainfall is not the only other critical factors
can markedly influence waterlogging; others, including land-use changes, unplanned
urbanization, low terrain profile, backwater effect, and absence of proper drainage planning
and management, also have an impact (Quan et al., 2010; Suriya & Mudgal, 2012; Ning et al.,
2017; Akter et al., 2017). Consequently, a range of different risk assessment methodologies for
waterlogging has been introduced. For example, Quan, (2014) performed hydrological
modeling and GIS spatial analysis for Shanghai city, considering hypothetical heavy rainfall
conditions, terrain, building, and drainage system as impact factors. It showed that the water
depth, vulnerability, and economic loss tend to increase as rainstorm intensity increases.
Employing a similar method but for a small-scale urban area (Jing'an district) in Shanghai, Yin
et al., (2011) developed stage-damage curves and explained that for maximum inundation
depth of 50 cm, the average annual waterlogging loss could be reached as much as RMB 3.42
million yuan. Shi, (2012) analyzed the risk of a 50-year return period rainstorm waterlogging
by integrating a hydraulic model with GIS over the same region. The study found that water
depth and population density were the determining factors for the correlation among exposure,
vulnerability, and waterlogging risk. Smith et al., (2015) applied a hydrodynamic model in
Carlisle, North West England, to assess the impact of sustainable drainage system design for
urban flood modeling. Sarkar et al., 2020 utilized a MIKE hydrological model for Khulna,
Bangladesh and showed that both the existing drainage area and capacity are inadequate to
mitigate waterlogging risk. Inspired by these previous studies of the dependence of
waterlogging on the various factors, including meteorological and hydrological, that have
advanced the understanding of the waterlogging risk of the many places worldwide, the present
study investigated the potential waterlogging risk in Chattogram City, Bangladesh.
Preprints (www.preprints.org) | NOT PEER-REVIEWED | Posted: 27 January 2021 doi:10.20944/preprints202101.0572.v1

5
Chattogram is the most populous coastal and well-known port city of Bangladesh. The
population of Chattogram City is estimated to be 2.6 million (BBS, 2011). The metropolitan
area is located on the Karnaphuli River banks between the Chattogram Hill Tracts and the Bay
of Bengal, centered at 22°21'N, 91°50'E (Figure 1). Chattogram City is divided into 41 wards,
which are the smallest administrative units of the city, and its total area is around 155.4 sq.km
(Chattogram City Corporation, 2021). It has a tropical monsoon climate and a majority of the
people along the coastlines living between 0 to 5-meter elevation from sea level (Hoque &
Khan, 1996). The city's annual rainfall fluctuates between 2540 mm to 3810 mm, of which an
average of 2400 mm occurs only during the monsoon (June-October) (Ahmed & Rubel, 2013;
Ahmed, 2015). Using 32 years (1982-2013) of rainfall data, BMD showed a significant
increment in precipitation during January to July while the decreasing trend persists from
August to December. However, some individual occurrences of uneven rainfall, such as heavy
precipitation during July 2009 in contrast to a very low precipitation in July 2010, were reported
by Akter et al., (2017). Despite the climatological facts, economic agglomeration with
unplanned urbanization leads to change in the hydrological cycle (i.e., uneven distribution of
precipitation in time and space) by reducing infiltration capacities. For instance, the declination
rate of forest and agricultural lands is 9% and 8%, during 1990-2004, respectively (Hashemi,
2006). In addition, District Fisheries Department in 1991 reported that the number of water
bodies in the city was 19250, while this figure changed into 4523 as reported by Chattogram
Development Authority (CDA) during 2006-2007 (decreasing rate: 920/year). Thus, along with
modified hydrological cycle, the frequency of rainfall-induced waterlogging in Chattogram
City has increased remarkably in the last decade or so (M. R. Islam & Das, 2014). A series of
field surveys conducted in 2013-14 revealed that some places (i.e., Kapasgola, Badurtala) in
Chattogram City had experienced waterlogging up-to 12 times in a year (Akter et al., 2017). In
2017, the inundation height was reported to be 0.5 – 0.9 m in the commodity hubs
Preprints (www.preprints.org) | NOT PEER-REVIEWED | Posted: 27 January 2021 doi:10.20944/preprints202101.0572.v1

6
Fig. 1 Location map of Chattogram City
(i.e., Khatunganj, Chaktai) that submerged 80% of the warehouses and apparel factories and
damaged more than 30% of the city road (Quddusi, 2017). The CDA has spent more than USD
650 million over the last five years for re-excavation, expansion, and development of canals to
improve the drainage system of Chattogram City (The Daily Star, 2017). However,
waterlogging has remained perennial woe to city dwellers.
To the best of the author's knowledge, the methods of identifying waterlogging affected
areas in Chattogram and spatial risk of those areas have not yet been clarified in a published
document. Therefore, it is not apparent to which extent the city areas are at risk due to the
waterlogging hazard. Ashraf & Chowdhury, (2009) conducted a field survey on the perception
of drainage and waterlogging problem in the eastern part of Chattogram City and reported
inadequate stormwater drainage, backwater effect, and low terrain profile are the primary
influential factors. More recently, Akter et al., (2017) performed an HEC-HMS hydrological
Preprints (www.preprints.org) | NOT PEER-REVIEWED | Posted: 27 January 2021 doi:10.20944/preprints202101.0572.v1

7
modeling and developed a depth-duration-frequency curve for 13 locations in the city.
However, no published literature includes inventory maps, causative factors, exposure,
vulnerability, and overall risk to waterlogging hazard covering the entire city. Therefore, this
present study aims to prepare a waterlogging inventory map and understand the spatial
variation of waterlogging risk in Chattogram City. The risk is determined by means of intensity,
exposure, and vulnerability of waterlogging.
2. Data and methods
Waterlogging risk index (WRI) presented in this study is estimated with the following basic
eq. 1 (Cardona et al., 2012):
Risk = Hazard × Exposure × Vulnerability (1)
Using the waterlogging hazard intensity index map developed in Geographic Information
System (GIS) environment and GIS database at the city level, the elements at risk are combined
to assess the exposure. A vulnerability assessment is carried out using the exposure
information. Finally, utilizing the hazard, exposure, and vulnerability assessment, waterlogging
risk index map was developed for Chattogram for the first time at the city level. The
methodology adopted in this study is summarized in Figure 2. The detailed methods and data
collection procedure for waterlogging inventory map, hazard intensity, vulnerability, and risk
index are described step by step in the following.
2.1 Preparation of waterlogging inventory
A waterlogging inventory map was prepared from existing literature and field survey. At
first, preliminary waterlogging locations were identified from existing literature such as local
newspapers, research articles, and Govt. reports (Alamgir, 2008; Islam, 2009; Barua, 2010;
Dey, 2013; Quddusi, 2017). An extensive field survey was then conducted employing a
participatory survey to confirm the exact location and extent of this hazard. The participatory
Preprints (www.preprints.org) | NOT PEER-REVIEWED | Posted: 27 January 2021 doi:10.20944/preprints202101.0572.v1

8
survey is adopted for increasing the reliability and accuracy of the inventory data, assuming
that local people have a better knowledge of waterlogging. Hand GPS (Global Positioning
System; Model: Garmin handheld GPS etrex 30x) was used to collect field data. This field
survey was first conducted in 2014 and updated in 2019.
Fig 2. The adopted methodology of the study
Preprints (www.preprints.org) | NOT PEER-REVIEWED | Posted: 27 January 2021 doi:10.20944/preprints202101.0572.v1

9
2.2 Preparation of waterlogging hazard intensity index
Based on the inventory map, waterlogging hazard intensity index (WHII) was prepared
following two steps: (a) determining major influential factors to waterlogging through the
participatory survey; (b) applying the GIS-based overlying technique to combine identified
factors into a single composite layer (WHII). At first, local people respective to each identified
waterlogging point were asked to identify the reasons behind the water stagnation problem.
The collected primary and secondary data (land elevation data: ALOS 30m Digital Elevation
Model (DEM); (JAXA, 2021)) were processed and represented spatially - using GIS mapping,
which is explained below.
Drainage condition map
In this study, the role of drainage condition on waterlogging hazard was determined based
on the local peoples' qualitative judgment and it was generalized by considering the
performance of existing local (ward wise) drainage facilities. Residents judged it into three
broad categories: unsatisfactory, marginally satisfactory, and satisfactory. The unsatisfactory
level of drainage facility denotes waterlogging affected ward with poor operational and
maintenance performance; low gravity and capacity of drainage structure; insufficient and
inactive natural water bodies; and natural drainage encroachment. Ward having a subsequently
better condition of the criteria mentioned above was considered as a marginally satisfactory or
satisfactory level of drainage condition.
Tidal water effect map
Some low-lying flat areas in Chattogram City have small or no water level difference with
the adjacent tidal canals and river Karnaphuli during high tide, resulting in tidal water entrance
in the city on a regular basis (Ashraf & Chowdhury, 2009). Hence, local citizens were asked
about the influence of tidal water in the waterlogging situation and four broad categories,
Preprints (www.preprints.org) | NOT PEER-REVIEWED | Posted: 27 January 2021 doi:10.20944/preprints202101.0572.v1

10
including high, moderate, low, and absent, were identified. If the tidal water stands for more
than two hours in any waterlogging point, the influence was determined as high. The moderate
influence was considered when it stands between one to two hours. The areas that can recede
water less than one hour of the high tide without affecting nearby built-up areas were counted
with the low influence of tidal water during waterlogging.
Waterlogging frequency map
To portray the importance of rain on waterlogging hazard, we asked residents about the
frequency of waterlogging hazard that directly represents the occurrence of rainfall events to
cause waterlogging to a specific place in a year. The class ranges between 3 to 24 times,
indicates the heterogeneity of waterlogging events in Chattogram City.
Other layers
The depth of inundation and water stagnation time maps were produced using the local
experiences recorded during the field survey. Furthermore, an elevation map was generated
from a DEM layer.
Analytic hierarchy process analysis
GIS-based overlying technique - Multi-Criteria Decision Analysis (MCDA) was applied to
prepare WHII map. MCDA belongs to heuristic analysis, including Analytic Hierarchy Process
(AHP), the Weighted Linear Combination, and the Ordered Weighted Average (Feizizadeh &
Blaschke, 2013). In this study, AHP (Saaty, 1977) was employed to derive the weights
associated with four thematic map layers identified by local people: drainage condition (A1),
waterlogging frequency (A2), topographical characteristics (A3), and tidal water effect (A4).
AHP was chosen because it can deal with complex decision-making and useful for checking
the consistency of the evaluation measures as suggested by the experts. Thus, it is widely used
for vulnerability and risk mapping (i.e., Feizizadeh & Blaschke, 2013; Ahmed, 2015).
Preprints (www.preprints.org) | NOT PEER-REVIEWED | Posted: 27 January 2021 doi:10.20944/preprints202101.0572.v1

11
The AHP process requires a pre-defined score or weight to input (Saaty, 1977). In this
study, it was assigned from expert opinion surveying. To avoid biases in decision-making,
expert opinions from four different backgrounds: planner, engineer, geographer, and disaster
risk manager were taken. A normalized set of weights was established to compare alternatives
using the factors (A1-A4). Next, a pairwise comparison matrix was formed where the number
in the ith row and jth column gives Ai's relative importance compared with Aj. Finally, all layers
were overlaid together using the eq. 2:
𝑊𝐻𝐼𝐼 = ⅀ (𝑊𝑖 ∗ 𝑅𝑖) (2)
Here, WHII is the required hazard intensity index for a specific site; Wi and Ri are factor
weight and class weight (or rating value) for factor i, respectively. Equal weight was assigned
to different classes (Ri) under each factor (Ai). The higher Ri value means the class is more
influential to waterlogging hazard. Finally, the WHII stands for each site = weight for A1 ×
("1" for unsatisfactory drainage; "0.66" for marginally satisfactory drainage; "0.33" for
satisfactory drainage condition) + weight for A2 × ("1" for more than eighteen times; "0.75"
for thirteen to eighteen times; "0.50" for seven to twelve times; "0.25" for three to six times
waterlogging event in a site) + weight for A3 × ("1" for land elevation less than 6 m; "0.75" for
6 -10 m; "0.50" for 11-15 m; "0.25" for land elevation greater than 15 m from mean sea level)
+ weight for A4 × ("1" for high; "0.66" for moderate; "0.33" for low; "0" for no tidal water
influence).
After applying the AHP generated weights in the attribute layers, the resulting WHII map
was reclassified using the equal interval method (ArcGIS help 10.3, 2015) into five levels: very
high, high, moderate, and low, and very low in waterlogging hazard intensity.
Preprints (www.preprints.org) | NOT PEER-REVIEWED | Posted: 27 January 2021 doi:10.20944/preprints202101.0572.v1

12
2.3 Preparation of waterlogging exposure index
Exposure was assessed for elements at risk within the affected area of waterlogging hazard
where population and infrastructure were identified as elements at risk for this hazard.
Population and infrastructure data were collected from Bangladesh Bureau Statistics (BBS,
2011) and (DAP, 2008), respectively. These data include different population information,
roads, structures, and water bodies. To prepare the waterlogging exposure index (WEI), first,
elements at risk were standardized using eq. 3. The standardized values were summed up and
rescaled for normalizing the score between 0 to 1 applying eq. 4. This index value was
represented visually by GIS mapping.
𝑧 = 𝑋 − 𝜇𝜎 (3)
𝑋 =
(4)
Where, Z = standardized value, X = observed value, μ = mean value, σ = standard deviation,
Xnew = normalized vale, Xmin = minimum value of the data set, Xmax = maximum value of the
data set.
2.4 Preparation of waterlogging vulnerability index
The vulnerability assessment was focused on determining the vulnerability of key
individual facilities and resources within the city area due to waterlogging. This facilities and
resources were broadly categorized in five dimensions (complex variables): a) social; (b)
infrastructure; (c) critical facilities; (d) economic; and (e) environmental. We further sub-
divided these complex variables into 18 different simple variables, which were determined as
sensitive (Flax et al., 2002) to waterlogging. These simple variables were selected based on
available attribute information in the spatial data summarized in Table 1. All the sensitive
groups of people, infrastructures, critical facilities, economic activities, and environmental data
that are in and within proximity to waterlogging affected areas were identified by overlaying
Preprints (www.preprints.org) | NOT PEER-REVIEWED | Posted: 27 January 2021 doi:10.20944/preprints202101.0572.v1

13
the spatial data onto the waterlogging affected area. Finally, the waterlogging vulnerability
index (WVI) was estimated similar to WEI (eq. 3, 4) by combining the indices for five complex
variables.
Table 1 Description of variables used in vulnerability analysis
No.
Vulnerability dimension (Complex variable)
Simple Variables Description
1
Social
Female No. of female populations in the affected area
2 Children
(< 10 years) No. of children less than ten years old in the affected area who are
3 Elder
(> 60 years) No. of older people greater than 60 years old in the affected area
4
Infrastructures
Structure
Kutcha
Foundation: Earthen plinth/brick perimeter wall with earth infill; Wall: CI sheet/part or full brick/Earthen walls; Roof: CI sheet with timber/split bamboo framing
5 Semi- Pucka
Foundation: Concrete/brick; Wall: brick; roof: CI sheet with timber/iron framing.
6 Pucka Foundation: Reinforced concrete (RC); Wall: brick; Roof: RC
7
Road
Kutcha Earth filling (km)
8 Semi- Pucka
Herring-bone-bond (HBB: brick made) (km)
9 Pucka Bituminous & RC (km)
10
Critical facilities
Educational institute
No. of elementary, high school, and college in the affected area
11 Hospital /clinic No. of hospital and clinic in the affected area 12 Police station No. of police station in the affected area
13 Fire service
station No. of fire service station in the affected area
14
Economic
Shops No. of bakery and computer goods shop in the affected area
15 Manufacturing and processing
industries
No. of manufacturing and processing industry in the affected area
16 Environmental
Pond No. of pond in the affected area 17 Water reservoir No. of water reservoir in the affected area 18 Dustbin No. of dustbin in the affected area
Preprints (www.preprints.org) | NOT PEER-REVIEWED | Posted: 27 January 2021 doi:10.20944/preprints202101.0572.v1

14
2.5 Preparation of waterlogging risk index
Waterlogging risk index (WRI) for Chattogram City was estimated by multiplying WHII,
WEI, and WVI layers (eq. 1). The score was standardized and normalized using eq. 3 and 4,
respectively. Finally, the resulting WRI map was reclassified using the equal interval method
(ArcGIS help 10.3, 2015) into five levels: very high, high, moderate, low, and very low risk
due to waterlogging.
3. Results and Discussion
3.1 Preparation of waterlogging inventory map
A total of 58 waterlogging locations were identified in Chattogram City, where 22 wards
among 41 wards have been found as waterlogging affected (Figure 3). The entire size of the
affected area is 13.08 sq.km (~8.42% of city area), with the mean size and standard deviation
Fig. 3 Ward wise waterlogging inventory map for Chattogram City
of 0.57 and 0.9 sq.km respectively. The extent area respective to each waterlogging location is
shown in Figure 4b. Figure 3 shows that most waterlogging locations were found on the east
side of the city, adjacent to the Karnaphuli river, where the land elevation is between 3 to 6 m
Preprints (www.preprints.org) | NOT PEER-REVIEWED | Posted: 27 January 2021 doi:10.20944/preprints202101.0572.v1

15
from mean sea level and identified as an attributing factor to cause waterlogging by local
people. It should be noted that the elevation value in Figure 3 may be showing higher than the
actual because of the coarse resolution (30 m) of ALOS DEM. This study reports that some of
the waterlogging points locate in the major locations of the city, such as Kapasgola and
Badurtola (ward no. 6), Muradpur junction area (ward no. 7), Solokbahar (ward no. 8),
Probartok moore, and Katalgonj (ward no. 16), CDA residential area (ward no. 27), Firingi
Bazar (ward no. 30) and Chaktai canal area (ward no. 35). The provided inventory map is the
first waterlogging inventory that covers the entire area of Chattogram City.
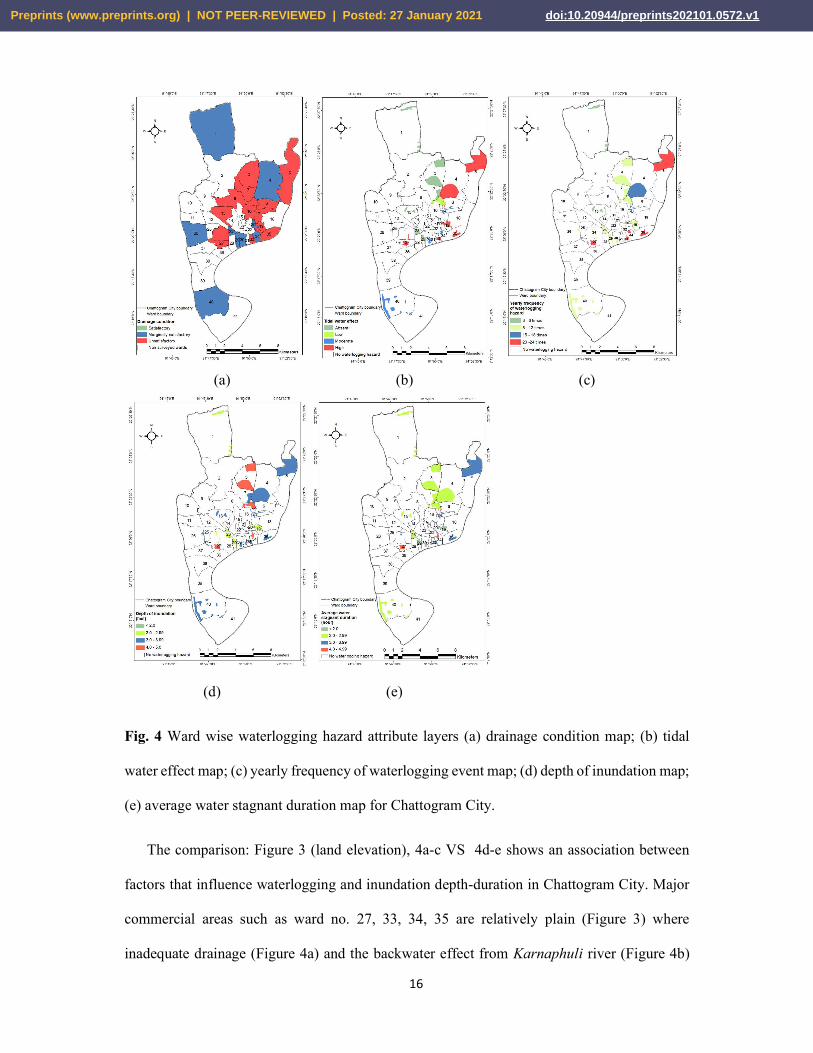
During the field survey, respondents from 13 wards (out of 22) (Fig. 4a) pointed out that
they were unsatisfied with existing local drainage facilities' performance because their places
go knee-deep water during a heavy shower. Interestingly, there is no ward where respondents
were satisfied with their local drainage facilities, implying that drainage condition is one of the
major influential factors to cause waterlogging.
The impact of tidal level on waterlogging in Chattogram City is inevitable. It is found that
23% of waterlogging points experience tidal water influence more than 2 hours (indicated as a
high influence in Figure 4b) when heavy rain coincides with high tide. The respondents claimed
that improper management and lack of sluice gates on the mouth of different canals connecting
with Karnaphuli River resulted in tidal water entrance to the built-up areas.
Figure 4c-e depicts the summary of field survey data on frequency-inundation depth-
duration for 58 locations. Places in ward no. 5, 27, 33, 34, and 35 experience more frequent
waterlogging disasters than other locations (Figure 4c). On the other hand, places (i.e., ward
no. 1, 13) far away from the Karnaphuli river suffer less frequent waterlogging, indicating the
joint influence of rainfall, topography, local drainage facilities and tidal level on waterlogging.
Preprints (www.preprints.org) | NOT PEER-REVIEWED | Posted: 27 January 2021 doi:10.20944/preprints202101.0572.v1
16
(a) (b) (c)
(d) (e)
Fig. 4 Ward wise waterlogging hazard attribute layers (a) drainage condition map; (b) tidal
water effect map; (c) yearly frequency of waterlogging event map; (d) depth of inundation map;
(e) average water stagnant duration map for Chattogram City.
The comparison: Figure 3 (land elevation), 4a-c VS 4d-e shows an association between
factors that influence waterlogging and inundation depth-duration in Chattogram City. Major
commercial areas such as ward no. 27, 33, 34, 35 are relatively plain (Figure 3) where
inadequate drainage (Figure 4a) and the backwater effect from Karnaphuli river (Figure 4b)
Preprints (www.preprints.org) | NOT PEER-REVIEWED | Posted: 27 January 2021 doi:10.20944/preprints202101.0572.v1
17
were found significant. These result in greater water depth (3 – 5 feet, Figure 4d) and remains
for a longer duration (3-5 hours, Figure 4e) during waterlogging. The Master Plan Organization
(MPO) categorized the flood land into five types: F0 (0 – 1 feet), F1 (1.0 – 2.95 feet), F2 (2.95
– 5.9 feet), F3 (5.9 – 9.8 feet) and F4 (over 9.8 feet) (MPO, 1987). This study shows that
waterlogging depth reaches an average of 2.95 feet (Figure 4d) during a waterlogging event in
Chattogram City. It suggests that as per MPO (1987), waterlogging affected land type ranges
from medium low land to above flood level. This finding is consistent with the previous study
done by Akter et al., (2017), who showed that water depth reaches around 2.8 feet during a
waterlogging event in Chattogram City.
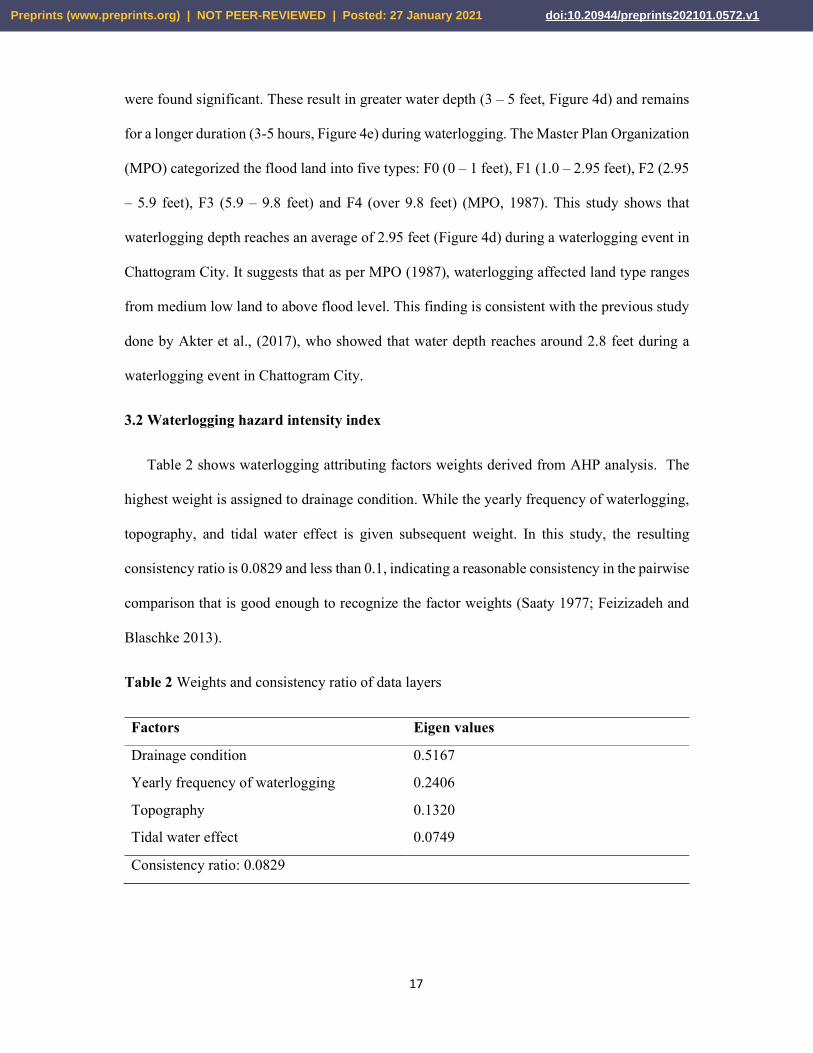
3.2 Waterlogging hazard intensity index
Table 2 shows waterlogging attributing factors weights derived from AHP analysis. The
highest weight is assigned to drainage condition. While the yearly frequency of waterlogging,
topography, and tidal water effect is given subsequent weight. In this study, the resulting
consistency ratio is 0.0829 and less than 0.1, indicating a reasonable consistency in the pairwise
comparison that is good enough to recognize the factor weights (Saaty 1977; Feizizadeh and
Blaschke 2013).
Table 2 Weights and consistency ratio of data layers
Factors Eigen values
Drainage condition 0.5167
Yearly frequency of waterlogging 0.2406
Topography 0.1320
Tidal water effect 0.0749
Consistency ratio: 0.0829
Preprints (www.preprints.org) | NOT PEER-REVIEWED | Posted: 27 January 2021 doi:10.20944/preprints202101.0572.v1

18
After applying the AHP generated weights in eq. 2, the resulting WHII (Figure 5) is
evaluated qualitatively. The very high and high-intensity zone covers 2.63% (4.1 sq.km) of the
total Chattogram City, while about 4.17% (6.48 sq.km) area is classified as moderate, and the
remaining 2.49 sq.km is classified as low to very low (Table 3). Total 13 waterlogging points
and eight wards fall within the very high and high-intensity zones. However, it does not reflect
their respective waterlogging risk should also be greater, as shown in the following sections.
Figure 5 shows that most of the affected areas with greater intensity (i.e., WHII > 0.78) locate
Fig. 5 Ward wise waterlogging hazard intensity index for Chattogram City
Preprints (www.preprints.org) | NOT PEER-REVIEWED | Posted: 27 January 2021 doi:10.20944/preprints202101.0572.v1

19
in the eastern part of the city adjacent to the Karnaphuli river where inundation height was
observed higher (≥ 3 feet, Figure 4d) with a longer stagnant time (≥ 3h, Figure 4e). Overall,
AHP generated WHII agrees well with the field survey data.
Table 3 Distribution of area, locations, and affected wards according to the WHII level
WHII Hazard intensity level
Area (sq.km)
No. of waterlogging locations
Affected wards
> 0.87 Very high 4.06 10 5, 6, 17, 27, 33, 35
0.79- 0.87 High 0.04 3 16, 24(a)
0.69- 0.78 Moderate 6.48 19 3, 4, 7, 8, 19, 24(b), 34
0.60-0.68 Low 1.36 10 13, 30, 40
< 0.60 Very low 1.15 16 1, 20, 23, 26, 29
3.3 Waterlogging exposure index
Figure 6 illustrates waterlogging exposure index (WEI) for Chattogram City. The WEI is
equally divided into five categories: very high (> 0.8), high (0.61-0.8), moderate (0.41-0.60),
low (0.21-0.4), and very low (< 0.21). Total 20 waterlogging points and six wards fall within
the very high and high exposed zone (Table 4). It is clear that except ward no. 5, most of the
wards with a greater EI (>0.6) belong to a moderate hazard intensity zone (Figure 5). Table 4
shows that although many waterlogging points fall within the densely populated wards (i.e.,
16, 33, 35; BBS 11), their respective EI is found significantly low. It is reasonable as the
elements at risk (population and infrastructure) linearly increase with the hazard affected area's
spatial size.
Table 4 Exposure of area, locations, and wards as per the level of WEI
WEI Exposure level
Area (sq.km)
No. of waterlogging
locations
Exposed wards
Preprints (www.preprints.org) | NOT PEER-REVIEWED | Posted: 27 January 2021 doi:10.20944/preprints202101.0572.v1

20
> 0.80 Very high 9.23 14 3, 4, 5, 8, 19
0.61- 0.80 High 1.05 6 40
0.41- 0.60 Moderate 1.11 12 7, 17, 23, 27
0.21-0.40 Low 0.31 9 13, 16, 20, 33
< 0.21 Very low 1.15 17 1, 6, 26, 29, 30, 34, 35, 24(a), 24(b)
Fig. 6 Ward wise waterlogging exposure index for Chattogram City
3.4 Waterlogging vulnerability index
Figure 7 shows waterlogging vulnerability for Chattogram City. It includes the overall
waterlogging vulnerability index (WVI) that combines five different vulnerability dimensions:
Preprints (www.preprints.org) | NOT PEER-REVIEWED | Posted: 27 January 2021 doi:10.20944/preprints202101.0572.v1

21
social, infrastructure, critical facilities, economic, and environment (see data and methods
section for variables considered in each dimension). It is determined that more than 1,60,000
sensitive group of people (~6.2% of the total population) are vulnerable in the city and ~27%
and ~5.9% of them are children (< 10 years) and elderly (> 60 years) population, respectively.
Figure 7a illustrates that the city's outer skirt has lower social vulnerability while it is
comparatively higher in the city center. Among 22 waterlogging affected wards, ward no. 19
is ranked 1st in its social vulnerability. This map is expected to help decision-makers in
providing suitable mitigations and adaption measures depending upon the vulnerable people in
an affected area.
Figure 7b shows a sensitive group of structures and roads that are comparatively higher in
the city center than the outer skirt. Among the 22 affected wards, infrastructure vulnerability
for ward no. 6, 17, and 33 is high along with its' greater WHII (Figure 5). It is identified that
over 22,000 residential structures (~14.6% of total residential structures), including Chandgaon
(ward no. 4; Figure 3) and CDA (ward no. 27; Figure 3) residential area are vulnerable under
the five different categories of hazard intensity. The very high and highly vulnerable areas
cover more than 1600 kutcha structures (see data and methods section for the definition), which
are essentially unable to withstand potential hazard damage due to low structural integrity.
Additionally, a large number of semi-pucka structure (more than 10000) is found as vulnerable
which are not out of damage potential as the wall and foundation are made of less sustainable
building materials (i.e., brick). In the context of Chattogram City, pucka structures might also
be affected by waterlogging due to the corrosive effect of saline water. Such damage could
increase the reconstruction costs.
The entire city is served by ~2889 km road while 361.5 km road has been identified as
vulnerable to waterlogging hazard. The present study reveals that several important roads,
including Probortok moore (ward no. 16; Figure 3) and Chattogram-Cox's Bazar connecting
Preprints (www.preprints.org) | NOT PEER-REVIEWED | Posted: 27 January 2021 doi:10.20944/preprints202101.0572.v1

22
(a) (b) (c)
(d) (e) (f)
Fig. 7 Ward wise (a) Social Vulnerability index; (b) Infrastructure vulnerability index; (c)
Critical facilities vulnerability index; (d) Economic vulnerability index; (e) Environmental
vulnerability index; (f) Overall waterlogging vulnerability index (WVI) for Chattogram City.
high way (ward no 35; Figure 3), are covered by the very high hazard intensity zone (Figure
5). During the rainy season, these roads go under 3-4 feet of water (Figure 4d), resulting in
Preprints (www.preprints.org) | NOT PEER-REVIEWED | Posted: 27 January 2021 doi:10.20944/preprints202101.0572.v1

23
severe disruption in the major communication system of Chattogram City. It is determined that
different categories of hazard intensity zones cover a total of 133 km semi-pucka (brick soling)
and 44.3 km kutcha road (made from mud). The vulnerable pucka road (paved) percentage is
~39% higher than the vulnerable semi-pucka road. In Chattogram City, pucka roads have a
bituminous surface and waterlogging might cause sustained severe damage. On the contrary,
kutcha roads might also be damaged through topsoil removal. Such damage could affect the
natural traffic flow by creating traffic jams with higher delay times, increasing the accident
rate, hindering people's daily activities, and increasing the city's financial burden for repairing
the damaged roads.
Figure 7c shows critical facilities vulnerability due to waterlogging in Chattogram City.
Among the waterlogging affected areas, ward no. 8, 23, and 34 are ranked highest in its' critical
facilities vulnerability. It is found that more than 250 educational institutes (~17.7% of total
educational institutes in the city) fall within the different vulnerable zones. Thus, academic
activities are hampering because students might not attend the classes during the waterlogging
events. There are also several hospitals and police stations covered by different vulnerable
zones. It is important to protect critical facilities (i.e., through relocating, elevating) to confirm
that service interruption is reduced as these facilities play a key role in emergency response
and recovery.
Figure 7d exhibits economic vulnerability to waterlogging by identifying major economic
sectors: shops and manufacturing and processing industries in Chattogram City. Some major
economic centers, including Katalganj (ward no. 16; Figure 3) and Firingi bazar (ward no 30;
Figure 3), are ranked as the highest vulnerable, which might threaten greater economic loss in
the country. It is identified that more than 850 economic centers providing various services are
located in different vulnerable zones. Chattogram is served as a commercial hub of the country
where waterlogging results in loss of income and jobs associated with business interruptions
Preprints (www.preprints.org) | NOT PEER-REVIEWED | Posted: 27 January 2021 doi:10.20944/preprints202101.0572.v1

24
every year. It appears necessary to take advanced hazard mitigation options to prevent or
minimize such losses.
Figure 7e shows spatial distribution of environmental vulnerability in Chattogram City due
to waterlogging. While ward no. 5 and 6 both are ranked highest for its' environmental
vulnerability, most of the affected wards remain very low vulnerable. Several secondary risk
sites include ponds (more than 750), waste collection sites and water reservoirs identified,
which can trigger further disastrous conditions if waterlogging occurs. Therefore, waterlogging
can result in contamination whereby wastes, pesticides, raw sewage, chemicals, hazardous
materials are transported through neighborhoods, sensitive habitats, and businesses. Water-
borne diseases like diarrhea, skin problems could also break out in an epidemic form. These
circumstances can lead to major cleanup and remediation activities, as well as natural resource
degradation.
Summing up the five different vulnerability dimensions (7a-e) discussed above yields
overall WVI for Chattogram City, as shown in Figure 7f. The variation in WVI is significantly
different from the individual vulnerability score at the ward level. Wards at the eastern side of
the city show greater vulnerability than the others. Table 5 reports that the very high and high
vulnerable zone covers ~3.03% (4.71 sq.km) of the total Chattogram City. The comparison
between WVI and WHII (Figure 5) reveals that ward no. 5, 6, 16, 17, and 33 have scored higher
in both than other affected wards. It also needs to be noted that although some wards (i.e., ward
no. 35) show greater hazard intensity scores, the overall vulnerability score is found less (<
0.41).
Table 5 Vulnerable area, locations, and wards as per the level of WVI
WVI Vulnerability level
Area (sq.km)
No. of waterlogging
locations
Vulnerable wards
Preprints (www.preprints.org) | NOT PEER-REVIEWED | Posted: 27 January 2021 doi:10.20944/preprints202101.0572.v1

25
> 0.80 Very high 0.07 5 6, 16, 24(b)
0.61- 0.80 High 4.64 16 5, 8, 17, 19, 30, 33, 34
0.41- 0.60 Moderate 1.11 13 20, 23, 24(a), 26, 27, 29
0.21-0.40 Low 3.07 10 3, 7, 13
< 0.21 Very low 4.44 14 1, 4, 35, 40
3.5 Waterlogging risk index
To address the risk potential of Chattogram City under waterlogging condition, WHII,
WEI, and WVI were combined using eq.1 and the resulting WRI is spatially presented in Figure
Fig. 8 Ward wise Waterlogging Risk Index for Chattogram City
Preprints (www.preprints.org) | NOT PEER-REVIEWED | Posted: 27 January 2021 doi:10.20944/preprints202101.0572.v1

26
8. The area, waterlogging points, and wards in each risk level are summarized, as shown in
table 6. ~2.71% of the study area is found in very high risk, followed by moderate (0.15%),
low (3.89%), and very low (1.67%). The comparison among WHII (Figure 5), WEI (Figure 6),
WVI (Figure 7f), and WRI shows that ward no. 5 has scored highest in terms of all indices,
followed by ward no. 8, 19, 17, and 33. Although the WHII and WVI scores are comparatively
larger for ward no. 6 and 16, the associated WEI score is found less and thus, resulted in low
risk (< 0.21) due to waterlogging.
Table 6 Risk area, locations, and wards as per the level of WRI
WRI Risk level Area (sq.km)
No. of waterlogging
locations
Wards in risk
> 0.40 Very high 4.22 9 5, 8, 19
0.31- 0.40 High - - -
0.21- 0.30 Moderate 0.23 4 17, 33
0.11-0.20 Low 6.05 18 3, 4, 7, 16, 23, 27, 24(b)
< 0.11 Very low 2.59 27 1, 6, 13, 20, 26, 29, 30, 34, 35, 40, 24(a)
4 Summary and conclusion
The analyses presented here to prepare a waterlogging inventory map and assessing
waterlogging risk in Chattogram City, Bangladesh. In this regard, participatory survey and
GIS-MCDA method – the AHP – were applied to create a WHII map. Finally, utilizing the
WHII map and spatial database available at the city level, WEI, WVI, and WRI were prepared.
A total of 58 locations in 22 wards have been identified as waterlogging affected, which covers
~8.42% of the city area. Local people addressed four factors: drainage condition, topography,
heavy rain, and tidal water effect as primary attributes to cause waterlogging. WHII map shows
that most of the affected areas with greater intensity (i.e., WHII > 0.78) locate in the eastern
Preprints (www.preprints.org) | NOT PEER-REVIEWED | Posted: 27 January 2021 doi:10.20944/preprints202101.0572.v1

27
part of the city, where inundation height was also observed higher (≥ 3 feet) than the other
places. It needs to be noted that waterlogging affected areas shown in this study do not confirm
the complete accuracy because the underlying judgments are subjective and based on local
residents' descriptions who are not necessarily technical experts in water disasters. In addition,
the AHP method is based on weighting the factors maps and overlaying those layers into a
single composite layer. Any incorrect perception of the different criteria' role can be easily
conveyed from the expert's opinion into the weight assignment (Kritikos & Davies, 2011).
Hence, it can lead to an inaccurate assessment of the final outputs. Nevertheless, the inventory
and hazard intensity maps presented in this study should be useful for validating any data-
driven model and minimizing the city's waterlogging risk.
The vulnerability analyses combined five major components: social, infrastructure, critical
facilities, economic, and environmental vulnerability. The social and infrastructural
vulnerability maps show the sensitive group of people, structures, and roads are comparatively
higher in the city center than the outer skirt. Obtained WVI map suggests that ward no. 5, 6,
16, 17, and 33 are greatly vulnerable to waterlogging than the other locations in Chattogram
City.
Waterlogging risk determined herein combines the hazard intensity, exposure, and
vulnerability indices. It suggests that ~2.71% of the study area is at very high risk, followed by
moderate (0.15%), low (3.89%), and very low (1.67%). The comparison among WHII, WEI,
WVI, and WRI shows that ward no. 5 has scored highest in all indices, followed by ward no.
8, 19, 17, and 33. This risk assessment does not constitute a hydrodynamic or hydrological
model to confirm overall waterlogging risk in Chattogram City. Thus, a future study needs to
include a quantitative evaluation of a complex urban system's contribution, including the
impact of land-use change. Nonetheless, waterlogging risk map presented in this study provides
Preprints (www.preprints.org) | NOT PEER-REVIEWED | Posted: 27 January 2021 doi:10.20944/preprints202101.0572.v1

28
a comprehensive database that can allow disaster risk managers, urban planners, and
stakeholders to propose mitigation plans for reducing waterlogging risk in Chattogram City.
Acknowledgments
The first author is thankful to the Ministry of Education, Culture, Sports, Science, and
Technology (MEXT) of Japan for the provided scholarship to research in disaster risk
reduction. Both authors are grateful for the logistic support of Urban and Regional Planning,
Chittagong University of Engineering & Technology (CUET), for conducting the field survey
and research. Appreciation extended to Chittagong Development Authority (CDA) for their
kind support in providing relevant spatial data. Special thanks go to all of the survey team
members and respondents providing valuable information during the participatory survey.
Author contribution
Conceptualization, M.R.I. and D.R.R.; Field Investigation, M.R.I.; Writing—Original
Draft Preparation, M.R.I.; Writing—Review, Modifying, and Editing, M.RI. and D.R.R.
Funding
This research received no specific grant from any funding agency in the public,
commercial, or not-for-profit sectors.
Disclosure statement
No potential conflict of interest was reported by the author(s).
References
Ahmed, B. (2015). Landslide susceptibility mapping using multi-criteria evaluation techniques
in Chittagong Metropolitan Area, Bangladesh. Landslides, 12(6), 1077–1095.
https://doi.org/10.1007/s10346-014-0521-x
Preprints (www.preprints.org) | NOT PEER-REVIEWED | Posted: 27 January 2021 doi:10.20944/preprints202101.0572.v1

29
Ahmed, B., & Rubel, Y. R. (2013). Understanding the issues involved in urban landslide
vulnerability in Chittagong metropolitan area, Bangladesh.
https://sites.google.com/a/aag.org/mycoe-servirglobal/final-arafat
Akter, A., Mohit, S. A., & Chowdhury, M. A. H. (2017). Predicting urban storm water-logging
for Chittagong city in Bangladesh. International Journal of Sustainable Built
Environment, 6(1), 238–249. https://doi.org/10.1016/j.ijsbe.2017.01.005
Alamgir, N. U. (2008). CCC move fails to prevent waterlogging | The Daily Star.
https://www.thedailystar.net/news-detail-46035
ArcGIS help 10.3. (2015). Classifying numerical fields for graduated symbology—Help |
ArcGIS for Desktop. https://desktop.arcgis.com/en/arcmap/10.3/map/working-with-
layers/classifying-numerical-fields-for-graduated-symbols.htm
Ashraf, M. A., & Chowdhury, M. S. A. (2009). Drainage Planning in the Cities of Bangladesh:
Case Study of Drainage and Water Logging in Chaktai Commercial area, Chittagong.
Journal of Bangladesh Institute of Planners, 2, 49–60.
https://doi.org/10.3329/jbip.v2i0.9556
Bangladesh Disaster-related Statistics. (2016). Bangladesh Disaster-related Statistics 2015
Climate Change and Natural Disaster Perspectives.
http://203.112.218.65:8008/WebTestApplication/userfiles/Image/National Account
Wing/Disaster_Climate/Presentation_Realease_Climate15.pdf
Barua, D. (2010). Waterlogging hits life again in Ctg | The Daily Star.
https://www.thedailystar.net/news-detail-158340
BBS. (2011). Population-and-Housing-Census. http://www.bbs.gov.bd/site/page/47856ad0-
7e1c-4aab-bd78-892733bc06eb/Population-and-Housing-Census
Preprints (www.preprints.org) | NOT PEER-REVIEWED | Posted: 27 January 2021 doi:10.20944/preprints202101.0572.v1

30
Cardona, O.-D., van Aalst, M. K., Birkmann, J., Fordham, M., McGregor, G., Perez, R.,
Pulwarty, R. S., Lisa Schipper, E. F., Tan Sinh, B., Décamps, H., Keim, M., Davis, I., van
Aalst, M., Birkmann, J., Fordham, M., McGregor, G., Perez, R., Pulwarty, R., Schipper,
E., Midgley, P. (2012). Determinants of risk: exposure and vulnerability. Cambridge
University Press, Cambridge, UK, and New York, NY, USA, pp. 65-108.
Chattogram City Corporation. (2021). Chattogram City Corporation. https://www.ccc.org.bd/
DAP. (2008). Detailed Area Plan – Chattogram Development Authority.
https://cda.gov.bd/detailed-area-plan/
Dasgupta, S., Huq, M., Zahirul Huq Khan, Sohel Masud, M., Manjur Murshed Zahid Ahmed,
Mukherjee, N., & Pandey, K. (2011). Climate Proofing Infrastructure in Bangladesh: The
Incremental Cost of Limiting Future Flood Damage. The Journal of Environment &
Development, 20(2), 167–190. https://doi.org/10.1177/1070496511408401
Dey, A. B. (2013). Torrential downpour batters Ctg city | The Daily Star.
https://www.thedailystar.net/news/torrential-downpour-batters-ctg-city
Feizizadeh, B., & Blaschke, T. (2013). GIS-multicriteria decision analysis for landslide
susceptibility mapping: Comparing three methods for the Urmia lake basin, Iran. Natural
Hazards, 65(3), 2105–2128. https://doi.org/10.1007/s11069-012-0463-3
Flax, L. K., Jackson, R. W., & Stein, D. N. (2002). Community Vulnerability Assessment Tool
Methodology. Natural Hazards Review, 3(4), 163–176.
https://doi.org/10.1061/(asce)1527-6988(2002)3:4(163)
Hashemi, K. M. A. (2006). City Report of Chittagong. AUICK First 2006 Workshop on
Population and Environmental Protection in Urban Planning, 2006 Kobe, Japan. Asian
Urban Information Center.
Preprints (www.preprints.org) | NOT PEER-REVIEWED | Posted: 27 January 2021 doi:10.20944/preprints202101.0572.v1

31
Hoque, M. M., & Khan, M. S. A. (1996). Storm surge flooding in Chittagong city and
associated risks.
Hossain, M. A. (2007). Role of Bangladesh Meteorological Department in providing warnings
in support of cyclone preparedness program.
https://www.adrc.asia/acdr/2006seoul/documents/006b_country_presen/Bangladesh_Me
t.pdf
Islam, M. R., & Das, S. (2014). Assessment of Waterlogging and Landslide Vulnerability using
CVAT Tool in Chittagong City Corporation area [Chittagong University of Engineering
and Technology]. https://doi.org/10.13140/RG.2.2.14575.94885
Islam, S. (2009). Canal digging eases waterlogging in Ctg | The Daily Star.
https://www.thedailystar.net/news-detail-99458
JAXA. (2021). ALOS Global Digital Surface Model “ALOS World 3D - 30m” (AW3D30).
https://www.eorc.jaxa.jp/ALOS/en/aw3d30/index.htm
Kritikos, T., & Davies, T. R. H. (2011). GIS-basierte multikriterielle entscheidungsanalysen
zur kartierung von massenverlagerungspotenzialen im nördlichen Evia, Griechenland.
Zeitschrift Der Deutschen Gesellschaft Fur Geowissenschaften, 162(4), 421–434.
https://doi.org/10.1127/1860-1804/2011/0162-0421
MLIT. (2008). Mitigation of inundation damage - sewerage - MLIT.
https://www.mlit.go.jp/crd/sewerage/policy/01.html
MPO. (1987). National Water Plan, Phase I. Master Plan Organization Development, Dhaka,
Bangladesh.
Ning, Y. F., Dong, W. Y., Lin, L. S., & Zhang, Q. (2017). Analyzing the causes of urban
waterlogging and sponge city technology in China. IOP Conference Series: Earth and
Preprints (www.preprints.org) | NOT PEER-REVIEWED | Posted: 27 January 2021 doi:10.20944/preprints202101.0572.v1

32
Environmental Science, 59(1), 12047. https://doi.org/10.1088/1755-1315/59/1/012047
Quan, R. S. (2014). Rainstorm waterlogging risk assessment in central urban area of Shanghai
based on multiple scenario simulation. Natural Hazards, 73(3), 1569–1585.
https://doi.org/10.1007/s11069-014-1156-x
Quan, R. S., Liu, M., Lu, M., Zhang, L. J., Wang, J. J., & Xu, S. Y. (2010). Waterlogging risk
assessment based on land use/cover change: A case study in Pudong New Area, Shanghai.
Environmental Earth Sciences, 61(6), 1113–1121. https://doi.org/10.1007/s12665-009-
0431-8
Quddusi, K. S. M. K. A. (2017). Water-Logging in Chittagong: Glimpses of Losses-245013.
https://www.daily-sun.com/arcprint/details/245013/WaterLogging-in-Chittagong:-
Glimpses-of-Losses/2017-08-02
Rahman, M. M., Singh Arya, D., Goel, N. K., & Mitra, A. K. (2012). Rainfall statistics
evaluation of ECMWF model and TRMM data over Bangladesh for flood related studies.
Meteorological Applications, 19(4), 501–512. https://doi.org/10.1002/met.293
Saaty, T. L. (1977). A scaling method for priorities in hierarchical structures. Journal of
Mathematical Psychology, 15(3), 234–281. https://doi.org/10.1016/0022-2496(77)90033-
5
Sarkar, S. K., Rahman, M. A., Esraz-Ul-Zannat, M., & Islam, M. F. (2020). Simulation-based
modeling of urban waterlogging in Khulna City. Journal of Water and Climate Change.
https://doi.org/10.2166/wcc.2020.256
Shi, Y. (2012). Risk analysis of rainstorm waterlogging on residences in Shanghai based on
scenario simulation. Natural Hazards, 62(2), 677–689. https://doi.org/10.1007/s11069-
012-0099-3
Preprints (www.preprints.org) | NOT PEER-REVIEWED | Posted: 27 January 2021 doi:10.20944/preprints202101.0572.v1

33
Smith, L. S., Liang, Q., & Quinn, P. F. (2015). Towards a hydrodynamic modelling framework
appropriate for applications in urban flood assessment and mitigation using heterogeneous
computing. Urban Water Journal, 12(1), 67–78.
https://doi.org/10.1080/1573062X.2014.938763
Subrina, S., & Chowdhury, F. K. (2018). Urban Dynamics: An undervalued issue for water
logging disaster risk management in case of Dhaka city, Bangladesh. Procedia
Engineering, 212, 801–808. https://doi.org/10.1016/j.proeng.2018.01.103
Sun, S., Zhai, J., Li, Y., Huang, D., & Wang, G. (2020). Urban waterlogging risk assessment
in well-developed region of Eastern China. Physics and Chemistry of the Earth, 115,
102824. https://doi.org/10.1016/j.pce.2019.102824
Suriya, S., & Mudgal, B. V. (2012). Impact of urbanization on flooding: The Thirusoolam sub
watershed - A case study. Journal of Hydrology, 412–413, 210–219.
https://doi.org/10.1016/j.jhydrol.2011.05.008
The Daily Star. (2017). Waterlogging: Mega project okayed to save port city | The Daily Star.
https://www.thedailystar.net/backpage/waterlogging-mega-project-approved-save-port-
city-1446385
Yin, Z., Yin, J., Xu, S., & Wen, J. (2011). Community-based scenario modelling and disaster
risk assessment of urban rainstorm waterlogging. Journal of Geographical Sciences,
21(2), 274–284. https://doi.org/10.1007/s11442-011-0844-7
Preprints (www.preprints.org) | NOT PEER-REVIEWED | Posted: 27 January 2021 doi:10.20944/preprints202101.0572.v1