The Sendai Framework for Disaster Risk Reduction and persons with disabilities
Upload
khangminh22Category
view
3download
0
Nat. Hazards Earth Syst. Sci., 18, 2241–2260, 2018https://doi.org/10.5194/nhess-18-2241-2018© Author(s) 2018. This work is distributed underthe Creative Commons Attribution 4.0 License.
From tsunami risk assessment to disaster risk reduction –the case of OmanIgnacio Aguirre-Ayerbe1, Jara Martínez Sánchez1, Íñigo Aniel-Quiroga1, Pino González-Riancho2, María Merino1,Sultan Al-Yahyai3, Mauricio González1, and Raúl Medina1
1Environmental Hydraulics Institute – IHCantabria, University of Cantabria, Santander, 39011, Spain2GFA Consulting Group, Hamburg, 22359, Germany3Directorate General of Meteorology and Air Navigation, Public Authority for Civil Aviation, Muscat, 111, Oman
Correspondence: Ignacio Aguirre-Ayerbe ([email protected])
Received: 20 December 2017 – Discussion started: 9 January 2018Revised: 18 June 2018 – Accepted: 10 July 2018 – Published: 24 August 2018
Abstract. Oman is located in an area of high seismicity, fac-ing the Makran Subduction Zone, which is the major sourceof earthquakes in the eastern border of the Arabian plate.These earthquakes, as evidenced by several past events, maytrigger a tsunami event. The aim of this work is to minimizethe consequences that tsunami events may cause in coastalcommunities by integrating tsunami risk assessment andrisk reduction measures as part of the risk-management pre-paredness strategy. An integrated risk assessment approachand the analysis of site-specific conditions permitted to pro-pose target-oriented risk reduction measures. The process in-cluded a participatory approach, involving a panel of localstakeholders and international experts. One of the main con-cerns of this work was to obtain a useful outcome for the ac-tual improvement of tsunami risk management in Oman. Thisgoal was achieved through the development of comprehen-sive and functional management tools such as the TsunamiHazard, Vulnerability and Risk Atlas and the Risk ReductionMeasures Handbook, which will help to design and plan aroadmap towards risk reduction.
The integrated tsunami risk assessment performed showedthat the northern area of Oman would be the most affected,considering both the hazard and vulnerability components.This area also concentrates nearly 50 % of the hot spots iden-tified throughout the country, 70 % of them are located in ar-eas with a very high risk class, in which risk reduction mea-sures were selected and prioritized.
1 Introduction
Tsunamis are low-frequency natural events but have a greatdestructive power when striking coasts around the world,involving loss of life and extensive damage to infrastruc-ture and coastal communities worldwide. Between 1996 and2015, estimated tsunami disaster losses reached 250 000lives, more than 3 500 000 affected people and more thanUSD 220 000 million (International Disaster Database, EM-DAT; UNISDR/CRED, 2016).
Oman is located in an area of high seismicity, facingthe Makran Subduction Zone (MSZ), which is the majorsource of earthquakes in the eastern border of the Arabianplate (Al-Shaqsi, 2012). These earthquakes may trigger atsunami event, as evidenced at least three times in the past(Heidarzadeh et al., 2008; Jordan, 2008). The high poten-tial for tsunami generation of MSZ makes it one of themost tsunamigenic areas of the Indian Ocean. The most re-cent tsunami event of seismic origin was the 1945 Makrantsunami, which caused more than 4000 fatalities and prop-erty losses in Iran, Pakistan, Oman and the United ArabEmirates (Heck, 1947; Heidarzadeh et al., 2008, 2009; Hei-darzadeh and Kijko, 2011; Heidarzadeh and Satake, 2014a,b; Mokhtari, 2011, Latcharote et al., 2017). Similar episodesmay occur again in this area.
In addition to the tsunami threat on the coast of Oman, therapid development and industrialization of this area explainsthe need to develop specific studies on tsunami vulnerabilityand risk, especially in the northern low-lying coastal plain,which is the most densely populated and most exposed to theMSZ.
Published by Copernicus Publications on behalf of the European Geosciences Union.
2242 I. Aguirre-Ayerbe et al.: From tsunami risk assessment to disaster risk reduction
Suitable tsunami vulnerability and risk assessments are es-sential for the identification of the exposed areas and the mostvulnerable communities and elements. They allow identi-fying appropriate site-specific risk management strategiesand measures, thus enabling to mainstream disaster risk re-duction (DRR) into development policies, plans and pro-grammes at all levels including prevention, mitigation, pre-paredness, and vulnerability reduction, considering its rootcauses.
Most methods for risk assessment are quantitative or semiquantitative (usually indicator-based). Quantitative risk as-sessments are generally better related to the analysis of spe-cific impacts, which require large scales and high resolutionfor all the components contributing the risk. Results are usu-ally expressed in terms of potential losses both economic (de-rived from building damage or even infrastructure damage)and human (derived from mortality estimations). There areseveral works following this approach, among others Tintiet al. (2011) and Valencia et al. (2011) within the frameof the SCHEMA Project (2007–2010), Leone et al. (2011),Suppasri et al. (2011, 2013, 2018), Mas et al. (2012), andShoji and Nakamura (2017), with a main focus on infras-tructure and building damage. Sato et al. (2003), Sugimotoet al. (2003), Koshimura et al. (2006), Jonkman et al. (2008)and Løvholt et al. (2014) focused on human damage and ca-sualties whereas Berryman (2005) and Harbitz et al. (2016)dealt with both aspects.
Although not as common, quantitative risk assessmentsare sometimes applied at global scale such as the case ofthe GRM – Global Risk Model (last version in the UNISDRGlobal Assessment Report, UNISDR, 2017), which ad-dresses a probabilistic risk model at a world scale to assesseconomic losses based on buildings damage (Cardona et al.,2015).
However, when the scope requires a holistic and in-tegrated approach in which several dimensions, criteriaand variables with different magnitudes and ranges ofvalues have to be taken into consideration, such as thecase of the present work, it is necessary to apply anindicator-based method. Some works following this ap-proach may be found in ESPON (2006), Dall’Osso etal. (2009), Dall’Osso and Dominey-Howes (2009), Tauben-böck et al. (2008), Jelínek (2009, 2012), Birkmann etal. (2010, 2013), Strunz et al. (2011), Aguirre-Ayerbe (2011),Wegscheider et al. (2011), González-Riancho et al. (2014),the TRANSFER project (2006–2009), the Coasts at Riskreport (Beck, 2014), the World Risk Report (last version:Garschagen et al., 2016) and the INFORM Global Risk Index(INFORM, 2017).
Nevertheless, very few of the previous works tacklewith the direct link between integrated tsunami risk resultsand risk reduction measures (RRM). González-Riancho etal. (2014) propose a translation of risk results into disasterrisk management options and Suppasri et al. (2017) describe
some recommendations based on the lessons learned in re-cent tsunamis.
Therefore, it has been identified that there is not a clear ap-plicability of science-based tsunami hazard and vulnerabilitytools to improve actual DRR efforts, highlighting a generaldisconnection between technical and scientific studies andrisk management.
This work attempts to be complementary to preceding ef-forts and to fill the gap found in previous studies. The devel-oped methodology is based on the direct relationship foundbetween risk components (hazard, exposure and vulnerabil-ity) and specific DRR measures and integrates tsunami riskassessment and site-specific characteristics to select a suit-able set of tsunami countermeasures. The ultimate goal is theapplication of the method and the generation of useful man-agement tools to minimize the consequences that a potentialtsunami could have on the coast of Oman.
2 Methodology
The methodology comprises two main phases: (i) the inte-grated tsunami risk assessment and (ii) the identification,selection and prioritization of appropriate DRR measures.These two different but complementary tasks will guide theentire methodology applied in this work.
In regard to the conceptual framework, the methodol-ogy applied is fundamentally adapted from the definitionsof UNISDR (2004, 2009), ISO Guide 73 (2009), UN-ESCO (2009b) and UN (2016). Accordingly, the sequence ofthe work is summarized schematically in Fig. 1. Within thedisaster risk assessment phase and prior to any risk study, itis necessary to define the consequence to be analysed and thetype of result pursued (for example, the estimation of build-ings damages or the community’s affection from a holisticperspective, as the case presented in this article). The estab-lishment of this main goal determines the specific method,the dimensions to include in the study and the spatial andtemporal scales (point 1 of Fig. 1).
Next, the assessment of the hazard, explained in detail inSect. 2.1, requires the selection of the variable associated tothe event (e.g. flow depth), mainly determined by the generalgoal defined in the first step. The hazard evaluation drives theanalysis of the individuals and elements exposed (e.g. peo-ple, buildings and infrastructure located in a flooded popu-lated area) together with its vulnerability (e.g. sensitive agegroups). The risk assessment is performed by the combina-tion of the vulnerability assessment of what is exposed andthe hazard intensity (points 3, 4 and 5 of Fig. 1, explainedin detail in Sect. 2.2 and 2.3). Exposure, vulnerability andthe integration of all risk components, circumscribed to agiven spatial, cultural and socioeconomic context, are neces-sary for the preliminary selection of risk reduction strategiesand measures. These countermeasures are essential to pre-vent new and reduce existing risk, as stated by UN (2016),
Nat. Hazards Earth Syst. Sci., 18, 2241–2260, 2018 www.nat-hazards-earth-syst-sci.net/18/2241/2018/

I. Aguirre-Ayerbe et al.: From tsunami risk assessment to disaster risk reduction 2243
Disaster risk management
Disaster risk assessment
HazardAssociated-tsunami threat
selection
2Exposure
Identification and location
3Vulnerability
Analysis of sensitivity/capacities
4
Risk assessment
5
Disaster risk reduction
Selection of:• Consequence / impact• Dimension• Spatial scale
1
Site-specific
conditions
Risk
redu
ctio
n m
easu
res
reco
mm
enda
tion6
WorkflowFeed
Figure 1. Schematic workflow.
contributing to the strengthening of resilience and reductionof disaster losses (point 6 in Fig. 1. – schematic workflow,detailed in Sect. 2.4).
The determination of the efficiency of each proposedcountermeasure is essential for the success of the risk re-duction planning. When an appropriate countermeasure is se-lected, the overall risk assessment must be conducted againto understand how and to what extent it will actually reducethe risk.
DRR measures are framed in the disaster risk manage-ment cycle proposed below, which brings together fourmain strategies for risk reduction (Fig. 2): (i) preventionand (ii) preparedness strategies in the pre-event stage and(iii) emergency response and (iv) recovery in the post-eventphase. Each of the strategies includes several actions thatmay be overlapped on time and that may even belong to morethan one strategy. At the centre of the figure, research is pre-sented as an essential element to improve disaster manage-ment enriching the process through the integration of variousdisciplines and studies. This particular study focuses on thestrategies related to the pre-event phase: the prevention andthe preparedness, which are explained in Sect. 2.4.
Risk and vulnerability assessments are performed both fora specific place and at a specific time. For this reason, boththe analysis and the proposal of measures for risk reductionmust be updated periodically, considering the changes thatmay occur over time and their influence on the results, suchas a significant variation in population, land-use changes,new constructions or new lessons learnt.
The involvement of key local stakeholders and decision-makers in coastal risk management is essential throughoutthe entire process, both to include their knowledge and exper-
tise and to enhance the usefulness of the results of the projectthroughout their encouragement. Thus, a stakeholder panelcomposed of local and international experts on coastal risksand risk management supported the entire process, driven toactively participate and collaborate to achieve the goal ofDRR. Their main contribution focused on the validation ofthe methodological approach, the identification of hot spotsand the analysis of the technical, institutional and financialcapacities of the country for implementing each one of thecountermeasures. In the last stage of the study, they priori-tized each measure according to their knowledge and exper-tise.
2.1 Hazard assessment
The hazard analysis allows determining the areas that wouldbe affected due to the potential tsunamis that may strike thestudy area. The analysis is carried out considering the worstpossible tsunami scenarios based on the seismic-tectoniccharacterization of the area, so that the maximum impact thata tsunami would cause is calculated. Similar approaches maybe found in Jelínek et al. (2009, 2012), Álvarez-Gómez etal. (2013) and Wijetunge (2014) among others. The deter-ministic tsunami hazard analysis allows identifying, locatingand analysing the elements at risk in a conservative approach.It is worth considering this method when dealing with inten-sive risks, i.e. derived from low frequency but high sever-ity hazards, such as tsunamis, where the catastrophic conse-quences of the impact are complex and difficult to estimate.
In this study, only potential earthquake sources were con-sidered as the tsunami generation mechanism. A seismic-tectonic analysis was performed to identify and character-
www.nat-hazards-earth-syst-sci.net/18/2241/2018/ Nat. Hazards Earth Syst. Sci., 18, 2241–2260, 2018

2244 I. Aguirre-Ayerbe et al.: From tsunami risk assessment to disaster risk reduction
Preparedness• Risk assessment and mapping.• Social and institutional education
/capacity building.• Emergency planning
• Evacuation planning.• Early warning systems.• Contingency planning.• Stockpiling of equipment
& supplies.• Arrangements for
coordination.
Prevention• Engineering based.• Nature-based.• Coastal planning, land use
regulation and architectural.
Recovery• Reconstruction.• Rehabilitation (supply
and disposals, communication, transport).
• Damage analysis and compensation.
Emergency• Alert / Instructions.• Evacuation action.• Emergency action.• Rescue.• Short term relief.
• Social / Economic• Geology• Engineering• Ecology• Risk analysis• Event analysis• Insurance• Policy development
Tsunami
Figure 2. Disaster risk management cycle.
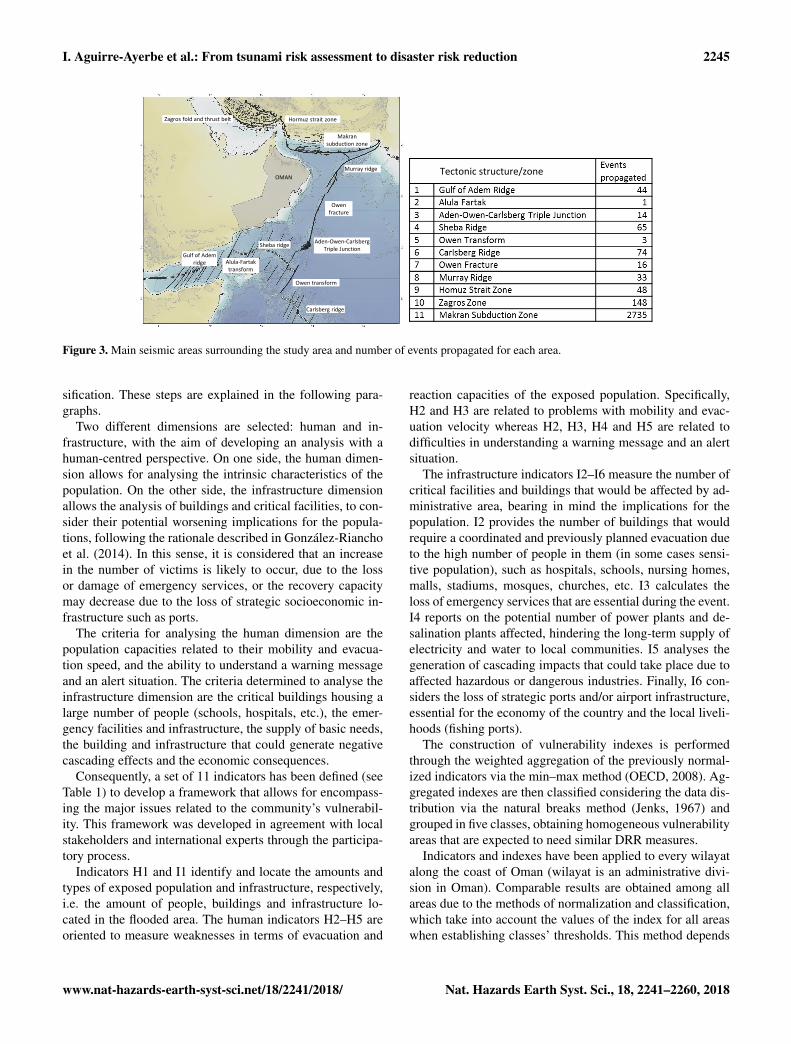
ize the major seismic structures with capacity to generate atsunami affecting the coast of Oman (see Aniel-Quiroga etal., 2015). The study area was divided in three tectonicallyhomogeneous zones including eleven main structures. Thegeometrical characterization of the fault planes (from the tec-tonics and the focal mechanisms analysis) allowed identify-ing 3181 focal mechanisms with a magnitude varying fromMw 6.5 to 9.25.
Once these scenarios are established, the analysis includesthe characterization of the quake (fault location, magnitude,length and width of the fault, fault dislocation angles, epi-centre location and focal depth of the epicentre) and the sealevel. The numerical modelling applied to conduct the sim-ulations is COMCOT (Wang, 2009), which solves shallowwater equations using Okada model (Okada, 1985) modelto generate the initial deformation of the sea surface. Thismodel uses moving boundary technique for land flooding.Based on the bathymetry, the propagation of each potentialtsunami is modelled from the source to the coast. Finally, ac-cording to the topography, the coastal area is flooded, with afinal resolution (grid size) of 45 m onshore.
The approach is described in detail in Aniel-Quiroga etal. (2015) and is based on the works of Álvarez-Gómez etal. (2014) and Gutiérrez et al. (2014).
Figure 3 shows the distribution of the major seismic struc-tures and the number of events propagated for each of them.The seismic-tectonic study was particularly focused in theMakran subduction zone, as it is possibly the most activearea in the western Indian Ocean and located very near thenorth coast of Oman.
On one side, the complete set of the 3181 scenarios wasincluded in a tsunami-scenarios database, which is the ba-sis of the current early warning system in the country. On
the other, seven scenarios were selected to perform the deter-ministic hazard assessment, including the historical event of1945, which took place in the Makran subduction zone (Hei-darzadeh et al., 2008). Hazard variables are calculated at eachtime step of every single simulation and then the maximumvalues are selected. These scenarios were aggregated into amap that shows at each point of the study area the worst pos-sible situation. This enveloping map is the base for the riskassessment and includes the variables of flow depth (verti-cal distance between the water surface and the ground, alsocalled inundation depth by some authors, e.g. Aniel-Quirogaet al., 2015), water velocity, and a proxy for the drag force,the depth-velocity product (drag level).
Hazard variables were finally classified into five levels ofintensity to be subsequently combined with vulnerability, asdescribed in Sect. 2.3. Tsunami drag level classification isbased on previous works carried out by Xia et al. (2014),Jonkman et al. (2008), Karvonen et al. (2000), and Abt etal. (1989), which establish different thresholds related tohuman-related stability factors. As for the flow depth vari-able, the classification is based on the work developed in theSCHEMA project (Tinti et al., 2011) to establish buildingdamage levels, based on empirical damage functions consid-ering building materials and water depth.
2.2 Vulnerability assessment
The method applied to assess the vulnerability relies on anindicator-based approach. The process includes three mainstages: (a) the definition of criteria for selecting the dimen-sions and variables to be analysed for the exposed elements;(b) establishment, calculation and classification of indicators;and (c) the construction of vulnerability indexes and its clas-
Nat. Hazards Earth Syst. Sci., 18, 2241–2260, 2018 www.nat-hazards-earth-syst-sci.net/18/2241/2018/
I. Aguirre-Ayerbe et al.: From tsunami risk assessment to disaster risk reduction 2245
Zagros fold and thrust belt Hormuz strait zone
Makran subduction zone
Murray ridge
Owen fracture
Carlsberg ridge
Owen transform
Sheba ridge
Alula-Fartaktransform
Gulf of Ademridge
OMAN
Aden-Owen-CarlsbergTriple Junction
Tectonic structure/zone
Figure 3. Main seismic areas surrounding the study area and number of events propagated for each area.
sification. These steps are explained in the following para-graphs.
Two different dimensions are selected: human and in-frastructure, with the aim of developing an analysis with ahuman-centred perspective. On one side, the human dimen-sion allows for analysing the intrinsic characteristics of thepopulation. On the other side, the infrastructure dimensionallows the analysis of buildings and critical facilities, to con-sider their potential worsening implications for the popula-tions, following the rationale described in González-Rianchoet al. (2014). In this sense, it is considered that an increasein the number of victims is likely to occur, due to the lossor damage of emergency services, or the recovery capacitymay decrease due to the loss of strategic socioeconomic in-frastructure such as ports.
The criteria for analysing the human dimension are thepopulation capacities related to their mobility and evacua-tion speed, and the ability to understand a warning messageand an alert situation. The criteria determined to analyse theinfrastructure dimension are the critical buildings housing alarge number of people (schools, hospitals, etc.), the emer-gency facilities and infrastructure, the supply of basic needs,the building and infrastructure that could generate negativecascading effects and the economic consequences.
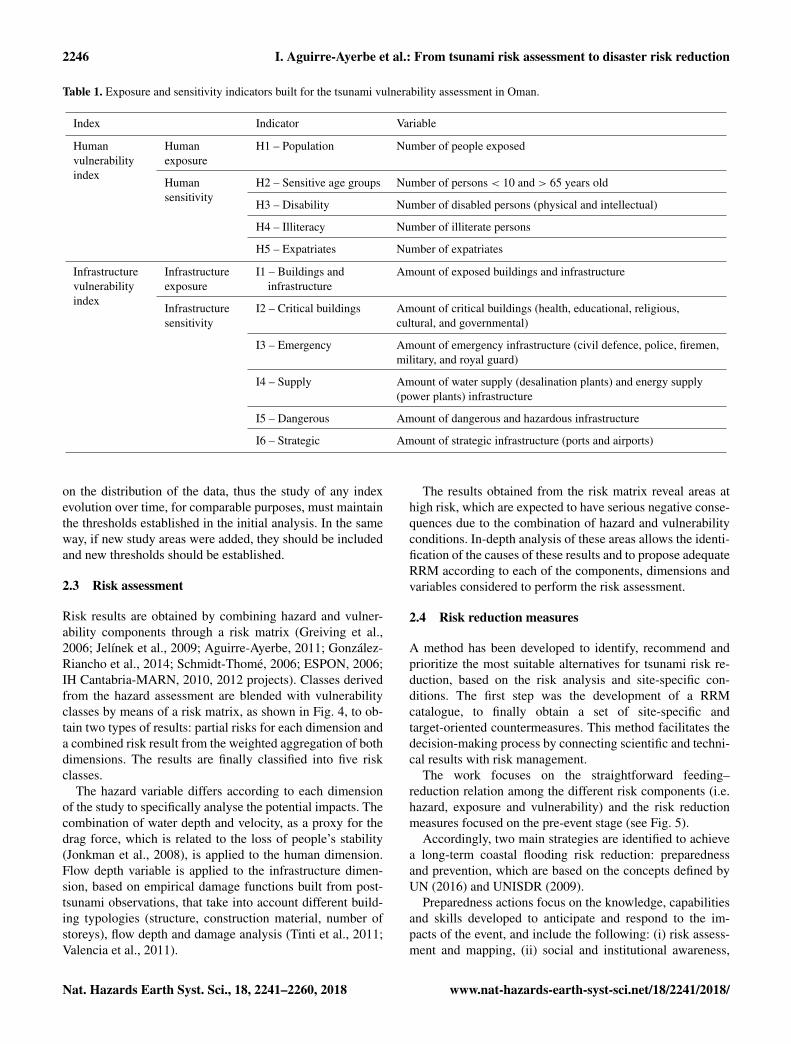
Consequently, a set of 11 indicators has been defined (seeTable 1) to develop a framework that allows for encompass-ing the major issues related to the community’s vulnerabil-ity. This framework was developed in agreement with localstakeholders and international experts through the participa-tory process.
Indicators H1 and I1 identify and locate the amounts andtypes of exposed population and infrastructure, respectively,i.e. the amount of people, buildings and infrastructure lo-cated in the flooded area. The human indicators H2–H5 areoriented to measure weaknesses in terms of evacuation and
reaction capacities of the exposed population. Specifically,H2 and H3 are related to problems with mobility and evac-uation velocity whereas H2, H3, H4 and H5 are related todifficulties in understanding a warning message and an alertsituation.
The infrastructure indicators I2–I6 measure the number ofcritical facilities and buildings that would be affected by ad-ministrative area, bearing in mind the implications for thepopulation. I2 provides the number of buildings that wouldrequire a coordinated and previously planned evacuation dueto the high number of people in them (in some cases sensi-tive population), such as hospitals, schools, nursing homes,malls, stadiums, mosques, churches, etc. I3 calculates theloss of emergency services that are essential during the event.I4 reports on the potential number of power plants and de-salination plants affected, hindering the long-term supply ofelectricity and water to local communities. I5 analyses thegeneration of cascading impacts that could take place due toaffected hazardous or dangerous industries. Finally, I6 con-siders the loss of strategic ports and/or airport infrastructure,essential for the economy of the country and the local liveli-hoods (fishing ports).
The construction of vulnerability indexes is performedthrough the weighted aggregation of the previously normal-ized indicators via the min–max method (OECD, 2008). Ag-gregated indexes are then classified considering the data dis-tribution via the natural breaks method (Jenks, 1967) andgrouped in five classes, obtaining homogeneous vulnerabilityareas that are expected to need similar DRR measures.
Indicators and indexes have been applied to every wilayatalong the coast of Oman (wilayat is an administrative divi-sion in Oman). Comparable results are obtained among allareas due to the methods of normalization and classification,which take into account the values of the index for all areaswhen establishing classes’ thresholds. This method depends
www.nat-hazards-earth-syst-sci.net/18/2241/2018/ Nat. Hazards Earth Syst. Sci., 18, 2241–2260, 2018
2246 I. Aguirre-Ayerbe et al.: From tsunami risk assessment to disaster risk reduction
Table 1. Exposure and sensitivity indicators built for the tsunami vulnerability assessment in Oman.
Index Indicator Variable
Humanvulnerabilityindex
Human H1 – Population Number of people exposedexposure
Humansensitivity
H2 – Sensitive age groups Number of persons < 10 and > 65 years old
H3 – Disability Number of disabled persons (physical and intellectual)
H4 – Illiteracy Number of illiterate persons
H5 – Expatriates Number of expatriates
Infrastructurevulnerabilityindex
Infrastructure I1 – Buildings and Amount of exposed buildings and infrastructureexposure infrastructure
Infrastructuresensitivity
I2 – Critical buildings Amount of critical buildings (health, educational, religious,cultural, and governmental)
I3 – Emergency Amount of emergency infrastructure (civil defence, police, firemen,military, and royal guard)
I4 – Supply Amount of water supply (desalination plants) and energy supply(power plants) infrastructure
I5 – Dangerous Amount of dangerous and hazardous infrastructure
I6 – Strategic Amount of strategic infrastructure (ports and airports)
on the distribution of the data, thus the study of any indexevolution over time, for comparable purposes, must maintainthe thresholds established in the initial analysis. In the sameway, if new study areas were added, they should be includedand new thresholds should be established.
2.3 Risk assessment
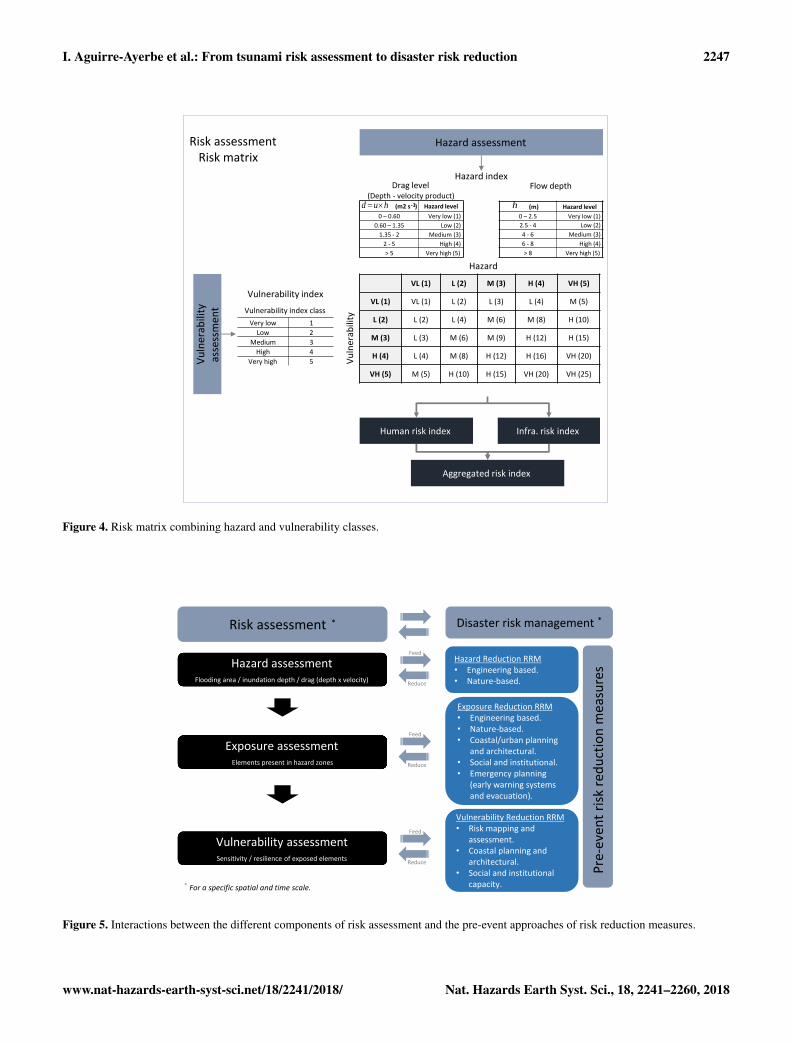
Risk results are obtained by combining hazard and vulner-ability components through a risk matrix (Greiving et al.,2006; Jelínek et al., 2009; Aguirre-Ayerbe, 2011; González-Riancho et al., 2014; Schmidt-Thomé, 2006; ESPON, 2006;IH Cantabria-MARN, 2010, 2012 projects). Classes derivedfrom the hazard assessment are blended with vulnerabilityclasses by means of a risk matrix, as shown in Fig. 4, to ob-tain two types of results: partial risks for each dimension anda combined risk result from the weighted aggregation of bothdimensions. The results are finally classified into five riskclasses.
The hazard variable differs according to each dimensionof the study to specifically analyse the potential impacts. Thecombination of water depth and velocity, as a proxy for thedrag force, which is related to the loss of people’s stability(Jonkman et al., 2008), is applied to the human dimension.Flow depth variable is applied to the infrastructure dimen-sion, based on empirical damage functions built from post-tsunami observations, that take into account different build-ing typologies (structure, construction material, number ofstoreys), flow depth and damage analysis (Tinti et al., 2011;Valencia et al., 2011).
The results obtained from the risk matrix reveal areas athigh risk, which are expected to have serious negative conse-quences due to the combination of hazard and vulnerabilityconditions. In-depth analysis of these areas allows the identi-fication of the causes of these results and to propose adequateRRM according to each of the components, dimensions andvariables considered to perform the risk assessment.
2.4 Risk reduction measures
A method has been developed to identify, recommend andprioritize the most suitable alternatives for tsunami risk re-duction, based on the risk analysis and site-specific con-ditions. The first step was the development of a RRMcatalogue, to finally obtain a set of site-specific andtarget-oriented countermeasures. This method facilitates thedecision-making process by connecting scientific and techni-cal results with risk management.
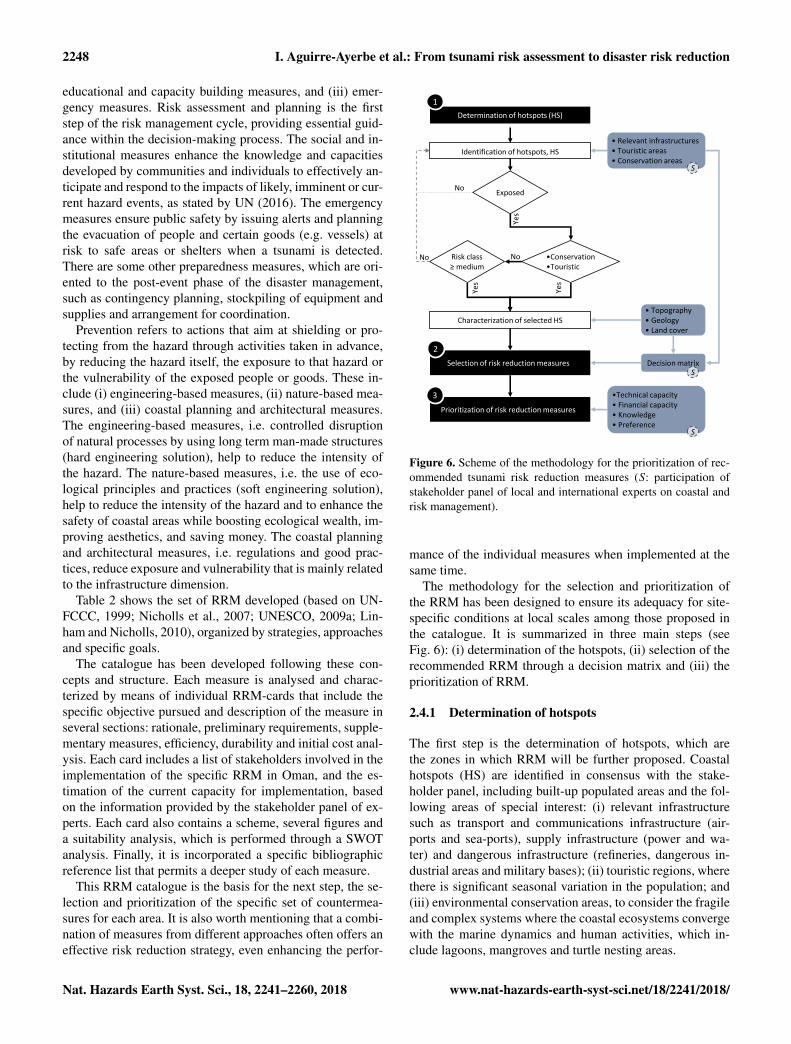
The work focuses on the straightforward feeding–reduction relation among the different risk components (i.e.hazard, exposure and vulnerability) and the risk reductionmeasures focused on the pre-event stage (see Fig. 5).
Accordingly, two main strategies are identified to achievea long-term coastal flooding risk reduction: preparednessand prevention, which are based on the concepts defined byUN (2016) and UNISDR (2009).
Preparedness actions focus on the knowledge, capabilitiesand skills developed to anticipate and respond to the im-pacts of the event, and include the following: (i) risk assess-ment and mapping, (ii) social and institutional awareness,
Nat. Hazards Earth Syst. Sci., 18, 2241–2260, 2018 www.nat-hazards-earth-syst-sci.net/18/2241/2018/
I. Aguirre-Ayerbe et al.: From tsunami risk assessment to disaster risk reduction 2247
Risk assessmentRisk matrix
Vuln
erab
ility
as
sess
men
t
VL (1) L (2) M (3) H (4) VH (5)
VL (1) VL (1) L (2) L (3) L (4) M (5)
L (2) L (2) L (4) M (6) M (8) H (10)
M (3) L (3) M (6) M (9) H (12) H (15)
H (4) L (4) M (8) H (12) H (16) VH (20)
VH (5) M (5) H (10) H (15) VH (20) VH (25)
Hazard assessment
Hazard index
Human risk index
Vulnerability index
Infra. risk index
Aggregated risk index
Vulnerability index classVery low 1
Low 2Medium 3
High 4Very high 5
Drag level(Depth - velocity product)
(m2 s ) Hazard level
0 – 0.60 Very low (1)0.60 – 1.35 Low (2)
1.35 - 2 Medium (3)2 - 5 High (4)> 5 Very high (5)
d u h
Flow depth
(m) Hazard level
0 – 2.5 Very low (1)2.5 - 4 Low (2)4 - 6 Medium (3)6 - 8 High (4)> 8 Very high (5)
h
Vuln
erab
ility
Hazard
-1
Figure 4. Risk matrix combining hazard and vulnerability classes.
Disaster risk management *Risk assessment *
* For a specific spatial and time scale.
Hazard assessmentFlooding area / inundation depth / drag (depth x velocity)
Exposure assessmentElements present in hazard zones
Vulnerability assessmentSensitivity / resilience of exposed elements
Exposure Reduction RRM• Engineering based.• Nature-based.• Coastal/urban planning
and architectural.• Social and institutional.• Emergency planning
(early warning systems and evacuation).
Hazard Reduction RRM• Engineering based.• Nature-based.
Vulnerability Reduction RRM• Risk mapping and
assessment.• Coastal planning and
architectural.• Social and institutional
capacity.
Pre-
even
t risk
redu
ctio
n m
easu
res
Feed
Reduce
Feed
Reduce
Feed
Reduce
Interactions between the different components of Risk Assessment and the pre-event approaches of Risk Reduction MeasuresFigure 5. Interactions between the different components of risk assessment and the pre-event approaches of risk reduction measures.
www.nat-hazards-earth-syst-sci.net/18/2241/2018/ Nat. Hazards Earth Syst. Sci., 18, 2241–2260, 2018
2248 I. Aguirre-Ayerbe et al.: From tsunami risk assessment to disaster risk reduction
educational and capacity building measures, and (iii) emer-gency measures. Risk assessment and planning is the firststep of the risk management cycle, providing essential guid-ance within the decision-making process. The social and in-stitutional measures enhance the knowledge and capacitiesdeveloped by communities and individuals to effectively an-ticipate and respond to the impacts of likely, imminent or cur-rent hazard events, as stated by UN (2016). The emergencymeasures ensure public safety by issuing alerts and planningthe evacuation of people and certain goods (e.g. vessels) atrisk to safe areas or shelters when a tsunami is detected.There are some other preparedness measures, which are ori-ented to the post-event phase of the disaster management,such as contingency planning, stockpiling of equipment andsupplies and arrangement for coordination.
Prevention refers to actions that aim at shielding or pro-tecting from the hazard through activities taken in advance,by reducing the hazard itself, the exposure to that hazard orthe vulnerability of the exposed people or goods. These in-clude (i) engineering-based measures, (ii) nature-based mea-sures, and (iii) coastal planning and architectural measures.The engineering-based measures, i.e. controlled disruptionof natural processes by using long term man-made structures(hard engineering solution), help to reduce the intensity ofthe hazard. The nature-based measures, i.e. the use of eco-logical principles and practices (soft engineering solution),help to reduce the intensity of the hazard and to enhance thesafety of coastal areas while boosting ecological wealth, im-proving aesthetics, and saving money. The coastal planningand architectural measures, i.e. regulations and good prac-tices, reduce exposure and vulnerability that is mainly relatedto the infrastructure dimension.
Table 2 shows the set of RRM developed (based on UN-FCCC, 1999; Nicholls et al., 2007; UNESCO, 2009a; Lin-ham and Nicholls, 2010), organized by strategies, approachesand specific goals.
The catalogue has been developed following these con-cepts and structure. Each measure is analysed and charac-terized by means of individual RRM-cards that include thespecific objective pursued and description of the measure inseveral sections: rationale, preliminary requirements, supple-mentary measures, efficiency, durability and initial cost anal-ysis. Each card includes a list of stakeholders involved in theimplementation of the specific RRM in Oman, and the es-timation of the current capacity for implementation, basedon the information provided by the stakeholder panel of ex-perts. Each card also contains a scheme, several figures anda suitability analysis, which is performed through a SWOTanalysis. Finally, it is incorporated a specific bibliographicreference list that permits a deeper study of each measure.
This RRM catalogue is the basis for the next step, the se-lection and prioritization of the specific set of countermea-sures for each area. It is also worth mentioning that a combi-nation of measures from different approaches often offers aneffective risk reduction strategy, even enhancing the perfor-
Determination of hotspots (HS)
1
• Topography• Geology• Land cover
Selection of risk reduction measures
2
Prioritization of risk reduction measures
3
Decision matrix
•Technical capacity• Financial capacity• Knowledge• Preference
• Relevant infrastructures• Touristic areas• Conservation areas
Characterization of selected HS
Risk class ≥ medium
Exposed
Identification of hotspots, HS
•Conservation•Touristic
NoNo
No
Yes
Yes
Yes
S
S
S
Figure 6. Scheme of the methodology for the prioritization of rec-ommended tsunami risk reduction measures (S: participation ofstakeholder panel of local and international experts on coastal andrisk management).
mance of the individual measures when implemented at thesame time.
The methodology for the selection and prioritization ofthe RRM has been designed to ensure its adequacy for site-specific conditions at local scales among those proposed inthe catalogue. It is summarized in three main steps (seeFig. 6): (i) determination of the hotspots, (ii) selection of therecommended RRM through a decision matrix and (iii) theprioritization of RRM.
2.4.1 Determination of hotspots
The first step is the determination of hotspots, which arethe zones in which RRM will be further proposed. Coastalhotspots (HS) are identified in consensus with the stake-holder panel, including built-up populated areas and the fol-lowing areas of special interest: (i) relevant infrastructuresuch as transport and communications infrastructure (air-ports and sea-ports), supply infrastructure (power and wa-ter) and dangerous infrastructure (refineries, dangerous in-dustrial areas and military bases); (ii) touristic regions, wherethere is significant seasonal variation in the population; and(iii) environmental conservation areas, to consider the fragileand complex systems where the coastal ecosystems convergewith the marine dynamics and human activities, which in-clude lagoons, mangroves and turtle nesting areas.
Nat. Hazards Earth Syst. Sci., 18, 2241–2260, 2018 www.nat-hazards-earth-syst-sci.net/18/2241/2018/

I. Aguirre-Ayerbe et al.: From tsunami risk assessment to disaster risk reduction 2249
Table 2. Strategies, approaches, measures and specific goals for risk reduction derived from coastal risk due to tsunami hazard (H : hazard,Ep: permanent exposure, Et: temporary exposure, V : vulnerability).
Strategy Approach Code Mitigation measure Specific goal
Preparedness Risk mapping and assessment RA. 1 Hazard, vulnerability and risk V
Social and institutional capacity PR. 1 Raising awareness Et and V
PR. 2 Capacity building
PR. 3 Education
Emergency planning EM. 1 Early warning systems Et
EM. 2 Evacuation planning
Prevention Engineering-based EN. 1 Seawalls and sea dykes H
EN. 2 Breakwaters
EN. 3 Movable barriers and closure dams
EN. 4 Land claim
Nature-based NA. 1 Managed realignment H
NA. 2 Beach nourishment
NA. 3 Artificial sand dunes and dune restoration
NA. 4 Living shorelines
NA. 5 Wetland restoration
Coastal planning and architectural PL. 1 Building standards V
PL. 2 Flood proofing
PL. 3 Coastal setbacks Ep
After the identification of the HS, it is evaluated whetherthey are exposed to a tsunami hazard (i.e. located in theflooded area) and if they exceed the risk class threshold asshown in Fig. 6, in order to determine the units that willfeed the decision matrix into the second phase. Due to theirsignificance, the scarcity of data when performing the vul-nerability assessment and the relevance given by local stake-holders, touristic regions and environmental conservation ar-eas will move to the next step if the HS is exposed, regard-less of the risk level. In all other cases, for those HS undervery low, low risk or not exposed, no countermeasures willbe assigned. The HS characterization is carried out by as-signing elevation characteristics (highlighting low-lying ar-eas and wadis), a geological categorization (bare consoli-dated or non-consolidated substratum) and the land cover(cropland, built-up areas and vegetation-covered areas).
2.4.2 Selection of risk reduction measures
The second stage consists of the preliminary assignment ofRRM to each HS according to the decision matrix. The ma-trix, which was validated by the stakeholder panel, is fed bythe specific characteristics of each HS and by type of HS,as described previously. Table 3 shows the decision matrix,
already sorted by the ratings of the stakeholder panel of ex-perts on coastal risk management in Oman, as explained inSect. 2.4.3.
The assignment of each recommended measure (highlyrecommended, recommended or not recommended) is basedon the information described in each of the RRM-cards anddepends on the characteristics that have determined the typeHS. Firstly, the topography of the area, with a focus on thelow-lying areas and wadis, where coastal and pluvial flood-ing occurs on a regular basis, at least annually. Likewise, thegeology and land cover is analysed to consider the bedrockand type of land use, that condition the suitability of oneor another measure. Finally, as shown in the decision ma-trix, the type of hotspot also conditions the suitability of theRRM preliminary selection. The sets of RRM obtained ac-cording to the decision matrix for each of the determinantsare merged, and finally the most restricted recommendationis considered.
2.4.3 Prioritization of risk reduction measures
Finally, in the third phase, the prioritization analysis con-siders the characteristics of each measure, its technical andeconomic requirements, efficiency and durability, the SWOT
www.nat-hazards-earth-syst-sci.net/18/2241/2018/ Nat. Hazards Earth Syst. Sci., 18, 2241–2260, 2018

2250 I. Aguirre-Ayerbe et al.: From tsunami risk assessment to disaster risk reduction
analysis and the capacity of the country to implement them.In addition to technical criteria, there are subjective as-pects, including local knowledge and expertise, which shouldbe taken into account when selecting certain recommendedRRM as preferred over others. Results of these preferences,shown in Fig. 7, are also reflected in the sorting of Table 3,based on the last column.
3 Results
This section presents two types of results. First, Sect. 3.1 and3.2 deal with technical results obtained from the applicationof the methodology to the Sultanate of Oman. Section 3.1describes the most relevant results of the tsunami risk assess-ment and Sect. 3.2 describes one example regarding the riskreduction measures selected and prioritized for a specific site.Finally, Sect. 3.3 describes the management tools developedand its usefulness for the tsunami DRR decision-making pro-cess.
3.1 Tsunami risk assessment
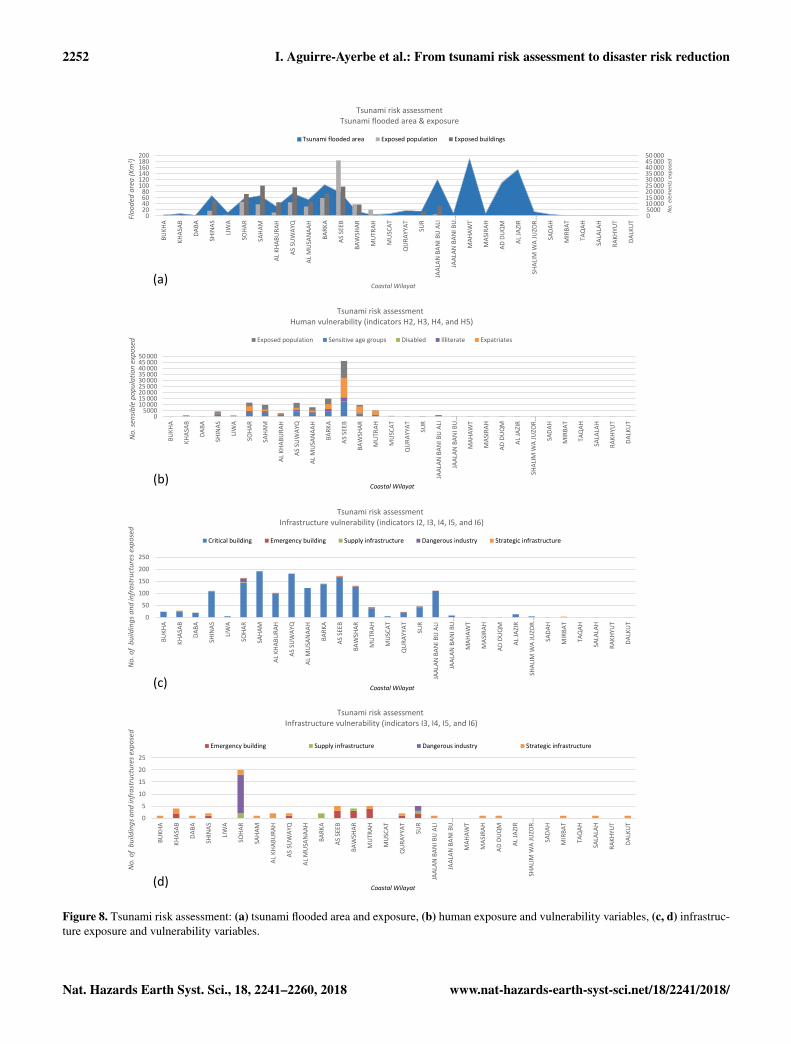
The tsunami hazard analysis indicates that the greater floodedarea is located in the northern plain and in one section of theeastern face of the country, as shown in Fig. 8a (the Omaniwilayats are sorted from north to south in this and the fol-lowing graphs). However, the greatest flooded area does notnecessarily yield the greatest the impact. In fact, the vulner-ability analysis show that the elements at risk are not ho-mogenously distributed along these flooded areas. The great-est values for the exposure are on the northern plain, espe-cially between Shinas and Bawshar wilayats (see Fig. 8b andc). Saham, Suwayq, Al Musanaah, Barka and As Seeb wilay-ats have the highest percentage of exposed population, allabove 10 %, the latter two more than 15 %, whereas there isalmost no exposure in the coastline from Sur to Dalkut wilay-ats, with most of relative values below 1 %. The wilayat of AlJazir, despite having a low absolute number of exposed pop-ulation, represents about 8 % of the total, ranking on the sideof the most exposed in relative terms. Regarding the expo-sure of buildings and infrastructure, the pattern is very simi-lar. The highest rates of exposure take place in the northernarea, especially from Sinas to As Seeb wilayat (with expo-sure values over 40 %), with the exception of Liwa. In therest of the country, Jaalan Bani Bu Ali and Al Jazir havethe highest values, with 45 % (about 8300 items) and 25 %(about 750 elements), respectively.
The vulnerability assessment reveals the different charac-teristics of each wilayat in terms of both population and in-frastructure, being the highest values correlated to the highestexposure values. In general, the most representative variablesof the human vulnerability assessment along the entire coastare the “expatriates” and the “sensitive age groups”, botharound the 30 % of the total population exposed (Fig. 8b).
Table3.D
ecisionm
atrixforthe
selectionofrecom
mended
RR
M(++
:highlyrecom
mended;
+:recom
mended;
−:notrecom
mended).L
astcolumn:prioritization
ofRR
Maccording
tothe
stakeholderpanelratingson
Om
anrisk
managem
ent.The
matrix
ispresented
orderedby
theseprioritization
results.
RR
Mcode
Risk
reductionm
easureTopography
Geology
Land
coverTypes
ofHS
Prioritizationstakeholdersranking
Floodprone
Bare
Bare
Built-up
Crop
Covered
byC
onservationTouristic
Relevant
areas(low
-non-con-
con-land
vegetationL
agoons/Turtle
nestingareas
infra-lying/w
adis)solidated
solidatedm
angrovesareas
structures
PR.1
Socialandinstitutionalraising
awareness
++
++
++
++
++
++
++
++
1E
M.1
Em
ergencyplanning
earlyw
arningsystem
s++
++
++
++
++
++
++
2PR
.3Socialand
institutionaleducation++
++
++
++
++
++
++
++
3R
A.1
Hazard,vulnerability
andrisk
assessment
++
++
++
++
++
++
++
++
++
++
4E
M.2
Em
ergencyplanning
evacuationplanning
++
++
++
++
++
+++
++
5PR
.2Socialand
institutionalcapacitybuilding
++
++
++
++
++
++
++
++
6E
N.2
Breakw
aters++
++
++
++
−−
+++
7N
A.3
Artificialsand
dunesand
dunerestoration
++
++
+−
+++
−++
++
8N
A.4
Living
shorelines++
+−
++
+++
++
++
++
9PL
.3C
oastalsetbacks++
++
++
+++
++
++
10N
A.5
Wetland
restoration++
+−
−+
++
++
++
++
11PL
.1B
uildingstandards
++
++
++
++
++
++
12E
N.4
Land
claim++
++
++
+−
−+
++
13N
A.2
Beach
nourishment
++
++
+−
+++
−++
++
14PL
.2Flood
proofing++
++
++
++
++
++
15N
A.1
Managed
realignment
++
+−
−+
+−
++
++
16E
N.1
Seawalls
andsea
dykes++
++
++
++
−−
+++
17E
N.3
Movable
barriersand
closuredam
s++
++
++
++
−−
+++
18
Nat. Hazards Earth Syst. Sci., 18, 2241–2260, 2018 www.nat-hazards-earth-syst-sci.net/18/2241/2018/

I. Aguirre-Ayerbe et al.: From tsunami risk assessment to disaster risk reduction 2251
0 % 10 % 20 % 30 % 40 % 50 % 60 % 70 % 80 % 90 % 100 %
RA.1. Flood risk mapping and assessmentPR. 1. Raising awareness
PR. 2. Capacity buildingPR. 3. Education
EM. 1. Early warning systemsEM. 2. Evacuation planning
EN. 1 . Seawalls and sea dykesEN. 2. Breakwaters
EN. 3. Movable barriers and closure damsEN. 4. Land claim
NA. 1. Managed realignmentNA. 2. Beach nourishment
NA. 3. Artificial sand dunes and dune rehabilitationNA. 4. Living shorelines
NA. 5. Wetland restorationPL.1. Building standards
PL. 2. Flood proofingPL. 3. Coastal setbacks
Tsunami risk reduction measures priority scores
Score 1 Score 2 Score 3 Score 4 Score 5
Figure 7. Scoring of the RRM according to the stakeholder panel ratings (1: the least preferred; 5: most preferred).
The variable that contributes less to the human vulnerabilityis “disabled persons”, but even if it is not very representativein relative values (about 2 % of total exposure), it was main-tained in the analysis because of its relevance and importancewithin the risk assessment.
As for the infrastructure dimension (Fig. 8c and d), thevulnerability analysis highlights that the “critical buildings”category is the most affected, being around 96 % of all sen-sitive and exposed buildings. Around 70 % of the buildingswithin this class are religious, the wilayats Saham and AsSuwayq being the most affected. Despite their lower abso-lute number, it is necessary to consider the other variablesthat feed the infrastructure vulnerability analysis due to theirsignificant relevance in case of an emergency (emergency,supply, dangerous and strategic), as described in the risk as-sessment section. In this sense, Fig. 8d shows their distribu-tion along the coastal wilayats, highlighting Sohar, where 10petrochemical industries, three container terminals, two bulkliquid terminals, one general cargo terminal and a sugar re-finery could be affected. All of these industries are locatedwithin the area and surroundings of the Port of Sohar.
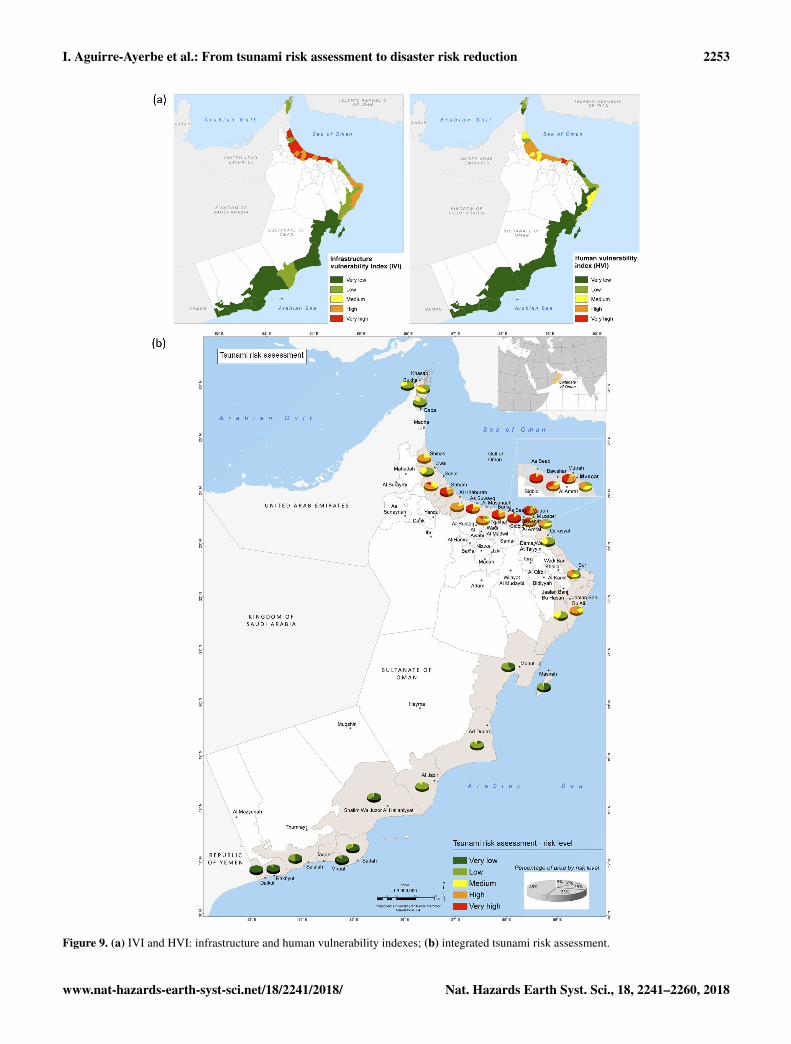
Integrated vulnerability results are shown in Fig. 9a forboth human and infrastructure dimensions. According tothe vulnerability classification, the colour ramp varies fromgreen to red, green being the lowest value of the index and redthe highest. Note that, for a better understanding, the repre-sentation is at the wilayat level, while the vulnerability analy-sis is performed exclusively for the potentially inundated areadue to the tsunami hazard considered. The highest vulnera-bility scores mainly corresponds with the wilayats locatedin the northern plain area. Analysing the differences among
them, it may be concluded that the most vulnerable wilayats(sorted from north to south) are Sohar, Saham (highest IVIscore), As Suwayq, Barka, As Seeb (highest HVI score) andBawshar.
Finally, Fig. 9b shows the integrated risk map as a syn-thesis, indicating the amount of area disaggregated by eachrisk level and wilayat, which shows the amount of popula-tion and infrastructure per level. Therefore, it is shown thatthe northern area of the country would be the most affectedby the tsunami scenario modelled in this work, both becauseof the greater impact of the hazard and the higher degree ofexposure and vulnerability.
Summarizing tsunami risk results, Fig. 10a shows the dis-tribution of the exposed population by risk level and wilayat,the greater consequences being on As Seeb and Barka wilay-ats. Almost 55 % of the exposed population is located in veryhigh-risk areas and around 25 % in high-risk areas. Regard-ing the infrastructure dimension, most of the exposed built-up area is located in medium risk zones (about 60 %), andaround a 25 % in high-risk zones. Less than 1 % of the builtup areas result in very high infrastructure risk areas. Built-up areas by risk level and wilayat are presented in Fig. 10b,showing that Sohar and As Seeb are the most affected wilay-ats, both in terms of built-up area exposure and risk level.
3.2 Tsunami risk reduction in Oman
The methodology applied for the selection and prioritizationof optimal RRM, resulted in the identification of 89 hot spots(HS) along the entire coast of the country, half of them lo-cated on the north coast, mainly from Liwa to Sur wilayats.About 25 % of them are concentrated in the southeast area
www.nat-hazards-earth-syst-sci.net/18/2241/2018/ Nat. Hazards Earth Syst. Sci., 18, 2241–2260, 2018
2252 I. Aguirre-Ayerbe et al.: From tsunami risk assessment to disaster risk reduction
05000
10 00015 00020 00025 00030 00035 00040 00045 00050 000
BU
KH
A
KH
ASA
B
DA
BA
SHIN
AS
LIW
A
SOH
AR
SAH
AM
AL
KH
AB
UR
AH
AS
SUW
AYQ
AL
MU
SAN
AA
H
BA
RK
A
AS
SEEB
BA
WSH
AR
MU
TRA
H
MU
SCA
T
QU
RA
YYA
T
SUR
JAA
LAN
BA
NI B
U A
LI
JAA
LAN
BA
NI B
U…
MA
HA
WT
MA
SIR
AH
AD
DU
QM
AL
JAZI
R
SH
ALI
M W
A J
UZO
R…
SA
DA
H
MIR
BA
T
TA
QA
H
SA
LALA
H
RA
KH
YUT
DA
LKU
T
No
. sen
sib
le p
op
ula
tio
n e
xpo
sed
Coastal Wilayat
Tsunami risk assessmentHuman vulnerability (indicators H2, H3, H4, and H5)
Exposed population Sensitive age groups Disabled Illiterate Expatriates
0
50
100
150
200
250
BU
KH
A
KH
ASA
B
DA
BA
SHIN
AS
LIW
A
SOH
AR
SAH
AM
AL
KH
AB
UR
AH
AS
SUW
AYQ
AL
MU
SAN
AA
H
BA
RK
A
AS
SEEB
BA
WSH
AR
MU
TRA
H
MU
SCA
T
QU
RA
YYA
T
SUR
JAA
LAN
BA
NI B
U A
LI
JAA
LAN
BA
NI B
U…
MA
HA
WT
MA
SIR
AH
AD
DU
QM
AL
JAZI
R
SH
ALI
M W
A J
UZO
R…
SA
DA
H
MIR
BA
T
TA
QA
H
SA
LALA
H
RA
KH
YUT
DA
LKU
T
No
. of
bu
ildin
gs
an
d in
fra
stru
ctu
res
exp
ose
d
Coastal Wilayat
Tsunami risk assessmentInfrastructure vulnerability (indicators I2, I3, I4, I5, and I6)
Critical building Emergency building Supply infrastructure Dangerous industry Strategic infrastructure
0
5
10
15
20
25
BU
KH
A
KH
ASA
B
DA
BA
SHIN
AS
LIW
A
SOH
AR
SAH
AM
AL
KH
AB
UR
AH
AS
SUW
AYQ
AL
MU
SAN
AA
H
BA
RK
A
AS
SEEB
BA
WSH
AR
MU
TRA
H
MU
SCA
T
QU
RA
YYA
T
SUR
JAA
LAN
BA
NI B
U A
LI
JAA
LAN
BA
NI B
U…
MA
HA
WT
MA
SIR
AH
AD
DU
QM
AL
JAZI
R
SH
ALI
M W
A J
UZO
R…
SA
DA
H
MIR
BA
T
TA
QA
H
SA
LALA
H
RA
KH
YUT
DA
LKU
T
No
. of
bu
ildin
gs
an
d in
fra
stru
ctu
res
exp
ose
d
Coastal Wilayat
Tsunami risk assessmentInfrastructure vulnerability (indicators I3, I4, I5, and I6)
Emergency building Supply infrastructure Dangerous industry Strategic infrastructure
0500010 00015 00020 00025 00030 00035 00040 00045 00050 000
020406080
100120140160180200
BU
KH
A
KH
ASA
B
DA
BA
SH
INA
S
LIW
A
SO
HA
R
SA
HA
M
AL
KH
AB
UR
AH
AS
SUW
AYQ
AL
MU
SAN
AA
H
BA
RK
A
AS
SEEB
BA
WSH
AR
MU
TRA
H
MU
SCA
T
QU
RA
YYA
T
SUR
JAA
LAN
BA
NI B
U A
LI
JAA
LAN
BA
NI B
U…
MA
HA
WT
MA
SIR
AH
AD
DU
QM
AL
JAZI
R
SHA
LIM
WA
JU
ZOR
…
SAD
AH
MIR
BA
T
TAQ
AH
SALA
LAH
RA
KH
YUT
DA
LKU
T
No
. ele
men
ts e
xpo
sed
Flo
od
ed a
rea
(K
m2 )
Coastal Wilayat
Tsunami risk assessmentTsunami flooded area & exposure
Tsunami flooded area Exposed population Exposed buildings
(a)
(b)
(c)
(d)
Figure 8. Tsunami risk assessment: (a) tsunami flooded area and exposure, (b) human exposure and vulnerability variables, (c, d) infrastruc-ture exposure and vulnerability variables.
Nat. Hazards Earth Syst. Sci., 18, 2241–2260, 2018 www.nat-hazards-earth-syst-sci.net/18/2241/2018/
I. Aguirre-Ayerbe et al.: From tsunami risk assessment to disaster risk reduction 2253
Figure 9. (a) IVI and HVI: infrastructure and human vulnerability indexes; (b) integrated tsunami risk assessment.
www.nat-hazards-earth-syst-sci.net/18/2241/2018/ Nat. Hazards Earth Syst. Sci., 18, 2241–2260, 2018

2254 I. Aguirre-Ayerbe et al.: From tsunami risk assessment to disaster risk reduction
0
4000
8000
12 000
16 000
20 000
BUKH
A
KHAS
AB
DABA
SHIN
AS
LIW
A
SOHA
R
SAHA
M
AL K
HABU
RAH
AS S
UW
AYQ
AL M
USA
NAA
H
BARK
A
AS S
EEB
BAW
SHAR
MU
TRAH
MU
SCAT
QU
RAYY
AT SUR
JAAL
AN B
ANI B
U A
LI
JAAL
AN B
ANI B
U…
MAH
AWT
MAS
IRAH
AD D
UQM
AL JA
ZIR
SHAL
IM W
A JU
ZOR…
SADA
H
MIR
BAT
TAQ
AH
SALA
LAH
RAKH
YUT
DALK
UT
Bu
ilt-u
p a
rea
(m
2)
Coastal wilayat
Tsunami risk assessmentCoastal built-up area at risk
Risk level: Very low Low Medium High Very high
x
x10
00
0
10 000
20 000
30 000
40 000
50 000
BUKH
A
KHAS
AB
DABA
SHIN
AS
LIW
A
SOHA
R
SAHA
M
AL K
HABU
RAH
AS S
UW
AYQ
AL M
USA
NAA
H
BARK
A
AS S
EEB
BAW
SHAR
MU
TRAH
MU
SCAT
QU
RAYY
AT SUR
JAAL
AN B
ANI B
U A
LI
JAAL
AN B
ANI B
U…
MAH
AWT
MAS
IRAH
AD D
UQM
AL JA
ZIR
SHAL
IM W
A JU
ZOR…
SADA
H
MIR
BAT
TAQ
AH
SALA
LAH
RAKH
YUT
DALK
UTP
eop
le (
inh
ab
ita
nts
)
Coastal wilayat
Tsunami risk assessmentPeople at risk
People by risk level
Risk level: Very low Low Medium High Very high
(a)
(b)
Figure 10. Population and built up areas by risk level.
of the country, especially in wilayats Salalah (12) and Sadah(9). Mashira and Ad Duqm concentrates 10 and 5 HS, re-spectively. According to the method followed, 79 out of theinitial 89 were assigned with a set of RRM.
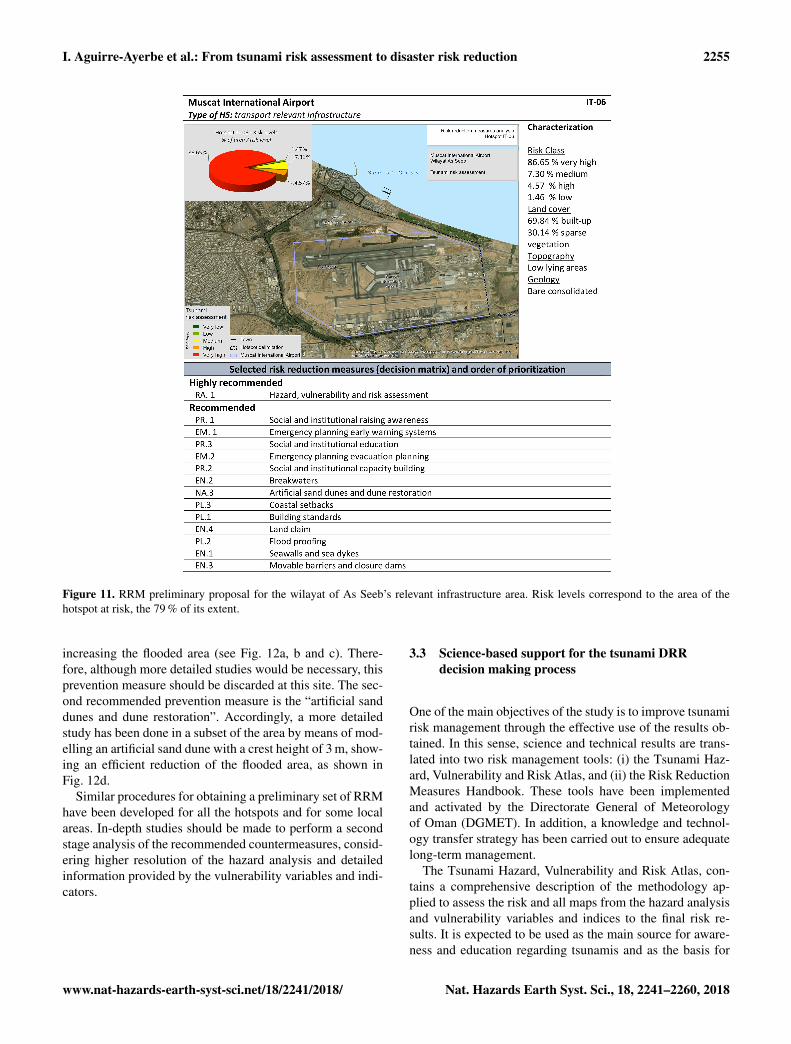
Next, an example is included to show the whole proce-dure, focused on the wilayat As Seeb. This wilayat concen-trates the largest amount of population exposed to the high-est level of risk and is the second wilayat with the greatestinfrastructure risk level. The target area (the HS) is the Mus-cat International Airport and surroundings where, in additionto the airport itself, the building of the Public Authority forCivil Aviation of Oman (PACA) that houses the Multi Haz-ard Early Warning System and the National Tsunami Warn-ing Centre is located.
Figure 11 shows the selected HS, a simple view of the riskassessment results, a summary of the characterization, andthe preliminary set of RRM recommended resulting from thedecision matrix. The list is shortened (most preferred on top)according to the prioritization made by the stakeholder panel,based on their knowledge and expertise on the feasibility andthe institutional, economic and technological capacity of thecountry for their implementation.
The first six recommended RRM are related to the pre-paredness strategy. Based on this result, the implementationof these measures require specific supplementary studies ata greater resolution. These may be high-resolution data col-lection for the risk analysis (topo-bathymetry, tsunamigenicsources characterization, and vulnerability), in-depth numer-ical modelling of the flooding physical process, developmentof a strategy for education of critical groups (most vulnerablemembers, leaders, institutions, government, educators, etc.),and the cooperation between the government, relief agenciesand local communities to enhance the early warning systemsand the evacuation planning process.
Regarding the prevention strategy, the first recommendedcountermeasure is the construction of breakwaters (EN. 2 inFig. 11). Tsunami breakwaters are usually constructed in themouth of a bay or estuary, not on open coasts. However, ac-cording to the general workflow developed and presented inFig. 1 (point 6), a detached breakwater has been modelled tounderstand the efficiency of the measure. The model resultedin a local increase in the elevation of the waves in the studyarea due to the transformation that the breakwater generatesin the tsunami waves. The waves overtop the structure gener-ating an acceleration of the flow that penetrates inland, thus
Nat. Hazards Earth Syst. Sci., 18, 2241–2260, 2018 www.nat-hazards-earth-syst-sci.net/18/2241/2018/
I. Aguirre-Ayerbe et al.: From tsunami risk assessment to disaster risk reduction 2255
Figure 11. RRM preliminary proposal for the wilayat of As Seeb’s relevant infrastructure area. Risk levels correspond to the area of thehotspot at risk, the 79 % of its extent.
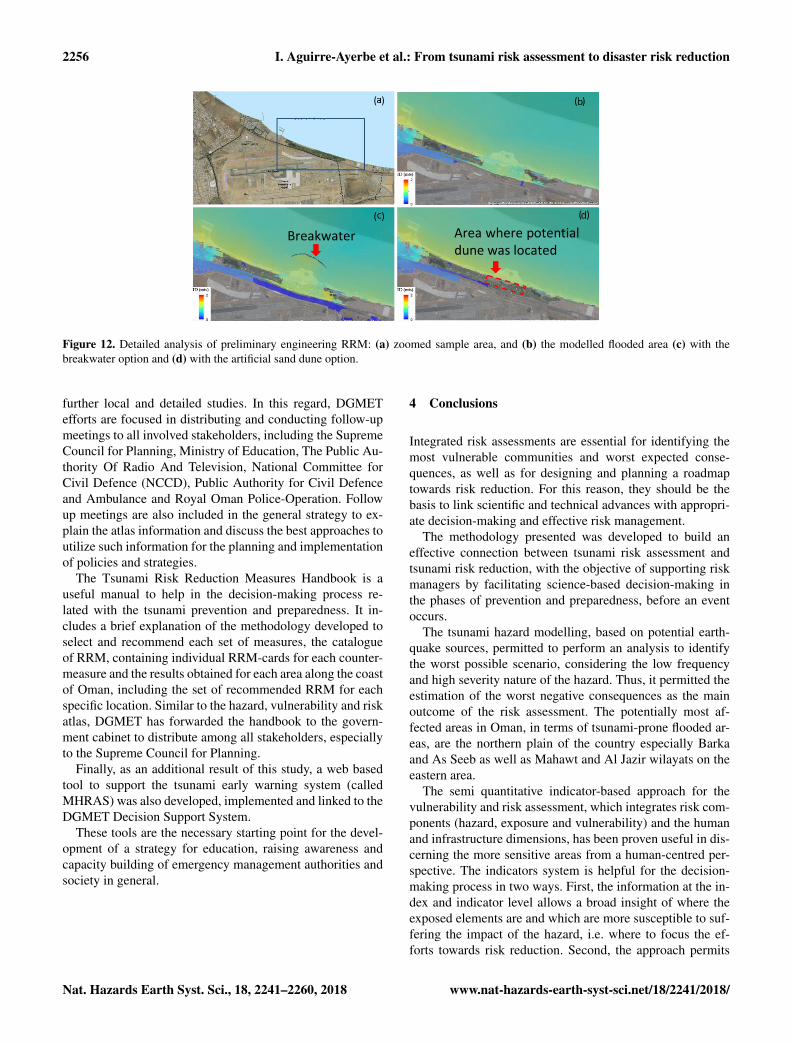
increasing the flooded area (see Fig. 12a, b and c). There-fore, although more detailed studies would be necessary, thisprevention measure should be discarded at this site. The sec-ond recommended prevention measure is the “artificial sanddunes and dune restoration”. Accordingly, a more detailedstudy has been done in a subset of the area by means of mod-elling an artificial sand dune with a crest height of 3 m, show-ing an efficient reduction of the flooded area, as shown inFig. 12d.
Similar procedures for obtaining a preliminary set of RRMhave been developed for all the hotspots and for some localareas. In-depth studies should be made to perform a secondstage analysis of the recommended countermeasures, consid-ering higher resolution of the hazard analysis and detailedinformation provided by the vulnerability variables and indi-cators.
3.3 Science-based support for the tsunami DRRdecision making process
One of the main objectives of the study is to improve tsunamirisk management through the effective use of the results ob-tained. In this sense, science and technical results are trans-lated into two risk management tools: (i) the Tsunami Haz-ard, Vulnerability and Risk Atlas, and (ii) the Risk ReductionMeasures Handbook. These tools have been implementedand activated by the Directorate General of Meteorologyof Oman (DGMET). In addition, a knowledge and technol-ogy transfer strategy has been carried out to ensure adequatelong-term management.
The Tsunami Hazard, Vulnerability and Risk Atlas, con-tains a comprehensive description of the methodology ap-plied to assess the risk and all maps from the hazard analysisand vulnerability variables and indices to the final risk re-sults. It is expected to be used as the main source for aware-ness and education regarding tsunamis and as the basis for
www.nat-hazards-earth-syst-sci.net/18/2241/2018/ Nat. Hazards Earth Syst. Sci., 18, 2241–2260, 2018
2256 I. Aguirre-Ayerbe et al.: From tsunami risk assessment to disaster risk reduction
Area where potentialdune was located
Breakwater
( ) ( )
( ) ( )
Figure 12. Detailed analysis of preliminary engineering RRM: (a) zoomed sample area, and (b) the modelled flooded area (c) with thebreakwater option and (d) with the artificial sand dune option.
further local and detailed studies. In this regard, DGMETefforts are focused in distributing and conducting follow-upmeetings to all involved stakeholders, including the SupremeCouncil for Planning, Ministry of Education, The Public Au-thority Of Radio And Television, National Committee forCivil Defence (NCCD), Public Authority for Civil Defenceand Ambulance and Royal Oman Police-Operation. Followup meetings are also included in the general strategy to ex-plain the atlas information and discuss the best approaches toutilize such information for the planning and implementationof policies and strategies.
The Tsunami Risk Reduction Measures Handbook is auseful manual to help in the decision-making process re-lated with the tsunami prevention and preparedness. It in-cludes a brief explanation of the methodology developed toselect and recommend each set of measures, the catalogueof RRM, containing individual RRM-cards for each counter-measure and the results obtained for each area along the coastof Oman, including the set of recommended RRM for eachspecific location. Similar to the hazard, vulnerability and riskatlas, DGMET has forwarded the handbook to the govern-ment cabinet to distribute among all stakeholders, especiallyto the Supreme Council for Planning.
Finally, as an additional result of this study, a web basedtool to support the tsunami early warning system (calledMHRAS) was also developed, implemented and linked to theDGMET Decision Support System.
These tools are the necessary starting point for the devel-opment of a strategy for education, raising awareness andcapacity building of emergency management authorities andsociety in general.
4 Conclusions
Integrated risk assessments are essential for identifying themost vulnerable communities and worst expected conse-quences, as well as for designing and planning a roadmaptowards risk reduction. For this reason, they should be thebasis to link scientific and technical advances with appropri-ate decision-making and effective risk management.
The methodology presented was developed to build aneffective connection between tsunami risk assessment andtsunami risk reduction, with the objective of supporting riskmanagers by facilitating science-based decision-making inthe phases of prevention and preparedness, before an eventoccurs.
The tsunami hazard modelling, based on potential earth-quake sources, permitted to perform an analysis to identifythe worst possible scenario, considering the low frequencyand high severity nature of the hazard. Thus, it permitted theestimation of the worst negative consequences as the mainoutcome of the risk assessment. The potentially most af-fected areas in Oman, in terms of tsunami-prone flooded ar-eas, are the northern plain of the country especially Barkaand As Seeb as well as Mahawt and Al Jazir wilayats on theeastern area.
The semi quantitative indicator-based approach for thevulnerability and risk assessment, which integrates risk com-ponents (hazard, exposure and vulnerability) and the humanand infrastructure dimensions, has been proven useful in dis-cerning the more sensitive areas from a human-centred per-spective. The indicators system is helpful for the decision-making process in two ways. First, the information at the in-dex and indicator level allows a broad insight of where theexposed elements are and which are more susceptible to suf-fering the impact of the hazard, i.e. where to focus the ef-forts towards risk reduction. Second, the approach permits
Nat. Hazards Earth Syst. Sci., 18, 2241–2260, 2018 www.nat-hazards-earth-syst-sci.net/18/2241/2018/

I. Aguirre-Ayerbe et al.: From tsunami risk assessment to disaster risk reduction 2257
tracking back to the variables easily. This information is es-sential to understand the precise root causes of vulnerabilityand risk results, to be tackled by adequate and specific DRRmeasures. In Oman, the most vulnerable areas are located inthe northern plain of Oman, highlighting wilayat As Seeb,both in the human and infrastructure dimension and wilay-ats Saham and Suwayq in the infrastructure dimension. Theeastern part, although affected by the inundation, is not sovulnerable. The combination of hazard and vulnerability as-sessments reveals that the worst expected consequences arefor As Seeb and Barka wilayats in terms of human risk andfor Sohar and As Seeb in terms of infrastructure risk, accord-ing to the tsunami modelled in this work.
As for the connection between risk assessment results andrisk management, for each defined tsunami-risk managementarea, the methodology allows identifying, selecting and pri-oritizing a preliminary set of suitable and site-specific RRM.This analysis discards non-suitable measures and allows amore in-depth exploration, defining the basis for analysingthe feasibility of its implementation, including its technicaland economic viability.
The involvement and support of relevant stakeholders incharge of the risk management process is essential for thesuccess and usefulness of the method. Their encouragementhas been one of the priorities throughout the application ofthe method to achieve the main objective of minimizing theconsequences that a potential tsunami could trigger in thisarea.
Through the example shown for the area of Muscat Inter-national Airport, the usefulness of the methodology has beenillustrated, which can be applied in other parts of the worldfacing other natural events that may trigger a disaster. Localconditions should be always considered in the definition ofthe vulnerability indicators, in order to integrate site-specificconditions.
In this sense, with the aim of producing a useful outcomefor the risk management, all the results obtained and the de-tailed description of the method were compiled in two handymanagement tools. These tools permit the analysis and fa-cilitation of decision-making, to replicate and to update thestudy by the tsunami disaster managers of Oman, thus con-tributing to the connection between science-based risk resultsand disaster risk management.
Data availability. Data are not publicly available.
Competing interests. The authors declare that they have no conflictof interest.
Acknowledgements. The authors thank the Ministry of Transportand Communications of the Government of the Sultanate of Oman(MOTC), the Public Authority for Civil Aviation (PACA) and the
Directorate General of Meteorology (DGMET), for supporting andfunding the project “Assessment of Coastal Hazards, Vulnerabilityand Risk for the Coast of Oman” during the period 2014–2016.We also thank and appreciate the collaboration of the InternationalOceanographic Commission of the United Nations Educational,Scientific and Cultural Organization personnel (IOC-UNESCO).
Edited by: Ira DidenkulovaReviewed by: Filippo Zaniboni and one anonymous referee
References
Abt, S. R., Wittler, R. J., Taylor, A., and Love, D. J.: Human stabilityin a high flood hazard zone, Water Resour. Bull., 25, 881–890,1989.
Aguirre-Ayerbe, I.: Propuesta metodológica para la evaluación delriesgo de tsunami en zonas costeras. Aplicación en el litoral deEl Salvador, MSc thesis, Earth Science Department, Universidadde Cantabria, Spain, 2011.
Al-Shaqsi, S.: Emergency management in the Arabian Peninsula: Acase study from the Sultanate of Oman, in: Comparative Emer-gency Management: Understanding Disaster Policies, Organiza-tions, and Initiatives from Around the World, edited by: McEn-tire, D., FEMA, USA, 19 pp., 2012.
Álvarez-Gómez, J. A., Aniel-Quiroga, Í., Gutiérrez-Gutiérrez,O. Q., Larreynaga, J., González, M., Castro, M., Ga-vidia, F., Aguirre-Ayerbe, I., González-Riancho, P., and Car-reño, E.: Tsunami hazard assessment in El Salvador, Cen-tral America, from seismic sources through flooding numer-ical models., Nat. Hazards Earth Syst. Sci., 13, 2927–2939,https://doi.org/10.5194/nhess-13-2927-2013, 2013.
Álvarez-Gómez, J. A., Martínez Parro, L., Aniel-Quiroga, I.,González, M., Al-Yahyai, S. Jara„ M. S., Méndez, F., Rueda, A.,and Medina, R.: Tsunamigenic seismic sources characterizationin the Zagros fold and thrust belt, Implications for tsunami threatin the Persian Gulf, Geophys. Res. Abstr., EGU2014-10951,EGU General Assembly 2014, Vienna, Austria, 2014.
Aniel-Quiroga, Í., Álvarez-Gómez, J. A., González, M., AguirreAyerbe, I., Fernández Pérez, F., Jara, M. S., González-Riancho,P., Medina, R., Al-Harthy, S., Al-Yahyai, S., and Al-Hashmi, S.:Tsunami Hazard assessment and Scenarios Database develop-ment for the Tsunami Warning System for the coast of Oman,Reducing Tsunami Risk in the Western Indian Ocean conference,Muscat, Oman, 2015.
Beck, M. W. (Ed.): Coasts at Risk: An Assessment of Coastal Risksand the Role of Environmental Solutions. A joint publication ofUnited Nations University – Institute for Environment and Hu-man Security (UNU-EHS), The Nature Conservancy (TNC) andthe Coastal Resources Center (CRC) at the University of RhodeIsland Graduate School of Oceanography, 2014.
Berryman, K. (Ed.): Review of tsunami hazard and risk in NewZealand, Geological and Nuclear Sciences (GNS) Client Report2005/104, p. 149, Institute of Geological & Nuclear Sciences,New Zealand, 2005.
Birkmann, J., Teichman, K. v., Welle, T., González, M., andOlabarrieta, M.: The unperceived risk to Europe’s coasts:tsunamis and the vulnerability of Cadiz, Spain, Nat. Hazards
www.nat-hazards-earth-syst-sci.net/18/2241/2018/ Nat. Hazards Earth Syst. Sci., 18, 2241–2260, 2018
2258 I. Aguirre-Ayerbe et al.: From tsunami risk assessment to disaster risk reduction
Earth Syst. Sci., 10, 2659–2675, https://doi.org/10.5194/nhess-10-2659-2010, 2010.
Birkmann, J., Cardona, O. D., Carreño, M. L., Barbat, A. H.,Pelling, M., Schneiderbauer, S., Kienberger, S., Keiler, M.,Alexander, D., Zeil, P., and Welle, T.: Framing vulnerability, riskand societal responses: the MOVE framework, Nat. Hazards, 67,193–211, 2013.
Cardona, O. D., Bernal, G. A., Ordaz, M. G., Salgado-Gálvez,M. A., Singh, S. K., Mora, M. G., and Villegas, C. P.: Updateon the probabilistic modelling of natural risks at global level:Global Risk Model – Global Earthquake and Tropical CycloneHazard Assessment. Disaster Risk Assessment at Country Levelfor Earthquakes, Tropical Cyclones (Wind and Storm Surge),Floods, Tsunami and Volcanic Eruptions, CIMNE & INGENIARConsortium, Background paper for GAR15, Barcelona-BogotáD.C., Colombia, 2015.
Dall’Osso, F. and Dominey-Howes, D.: A method for assessing thevulnerability of buildings to catastrophic (tsunami) marine flood-ing, 138 pp., available at: http://www.sydneycoastalcouncils.com.au/Project/Vulnerability_of_Buildings_Tsunami_Flooding(last access: September 2017), 2009.
Dall’Osso, F., Gonella, M., Gabbianelli, G., Withycombe, G., andDominey-Howes, D.: Assessing the vulnerability of buildings totsunami in Sydney, Nat. Hazards Earth Syst. Sci., 9, 2015–2026,https://doi.org/10.5194/nhess-9-2015-2009, 2009.
ESPON Monitoring Committee: The Spatial Effects and Manage-ment of Natural and Technological Hazards in Europe, Euro-pean Spatial Observation Network (ESPON 2006) Project 1.3.1.,2006.
Garschagen, M., Hagenlocher, M., Comes, M., Dubbert, M.,Sabelfeld, R., Lee, Yew J., Grunewald, L., Lanzendörfer, M.,Mucke, P., Neuschäfer, O., Pott, S., Post, J., Schramm, S.,Schumann-Bölsche, D., Vandemeulebroecke, B., Welle, T., andBirkmann, J.: World Risk Report 2016, World Risk Report,Bündnis Entwicklung Hilft and UNU-EHS, Bündnis Entwick-lung Hilft (Alliance Development Works), Berlin, United Na-tions University – Institute for Environment and Human Security(UNU-EHS), Bonn, 2016.
González-Riancho, P., Aguirre-Ayerbe, I., García-Aguilar, O., Med-ina, R., González, M., Aniel-Quiroga, I., Gutiérrez, O. Q.,Álvarez-Gómez, J. A., Larreynaga, J., and Gavidia, F.: Integratedtsunami vulnerability and risk assessment: application to thecoastal area of El Salvador, Nat. Hazards Earth Syst. Sci., 14,1223–1244, https://doi.org/10.5194/nhess-14-1223-2014, 2014.
Greiving, S., Fleischhauer, M., and Lückenkötter, J.: Amethodology for an integrated risk assessment of spa-tially relevant hazards, J. Environ. Plann. Man., 49, 1–19,https://doi.org/10.1080/09640560500372800, 2006.
Gutiérrez, O., Aniel-Quiroga, I., and González, M.: Tsunami run upin coastal areas: a methodology to calculate run up in large scaleareas, Proc. 34th International Conference on Coastal Engineer-ing, 2014, edited by: Smith, J. M. World Scientific, ASCE, Seoul(Korea), June, 2014.
Harbitz, C. B., Nakamura, Y., Arikawa, T., Baykal, C., Do-gan, G. G., Frauenfelder, R., Glimsdal, S., Guler, H. G.,Issler, D., Kaiser, G., Kânoglu, U., Kisacik, D., Kortenhaus,A., Løvholt, F., Maruyama, Y., Sassa, S., Sharghivand, N.,Strusinska-Correia, A., Tarakcioglu, G. O., and Yalciner, A.Y.: Risk Assessment and Design of Prevention Structures
for Enhanced Tsunami Disaster Resilience (RAPSODI)/Euro-Japan Collaboration. Coast. Eng. J., 58, 1640012-1–1640012-37,https://doi.org/10.1142/S057856341640012X, 2016.
Heck, N. H.: List of seismic sea waves, B. Seismol. Soc. Am., 37,269–286, 1947.
Heidarzadeh, M. and Kijko, A.: A probabilistic tsunami hazard as-sessment for the Makran subduction zone at the northwestern In-dian Ocean, Nat. Hazards, 56, 577–593, 2011.
Heidarzadeh, M. and Satake, K.: New insights into the source of theMakran tsunami of 27 November 1945 from tsunami waveformsand coastal deformation data, Pure Appl. Geophys., 172, 621–640, 2014a.
Heidarzadeh, M. and Satake, K.: Possible sources of the tsunamiobserved in the northwestern Indian Ocean following the2013 September 24 Mw 7.7 Pakistan inland earthquake, Geo-phys. J. Int., 199, 752–766, 2014b.
Heidarzadeh, M., Pirooz, M. D., Zaker, N. H., Yalciner, A. C.,Mokhtari, M., and Esmaeily, A.: Historical tsunami in theMakran Subduction Zone off the southern coasts of Iran and Pak-istan and results of numerical modeling, Ocean Eng., 35, 774–786, 2008.
Heidarzadeh, M., Pirooz, M. D., and Zaker, N. H.: Modelling thenear-field effects of the worst-case tsunami in the Makran sub-duction zone, Ocean. Eng., 36, 368–376, 2009.
IH Cantabria-MARN (Instituto de Hidráulica Ambiental IHCantabria, Ministerio de Medio Ambiente y Recursos Natu-rales de El Salvador MARN): Catálogo de Peligrosidad de-bida a la inundación por Tsunami en la costa de El Sal-vador, Spanish Agency for International Development Coop-eration (AECID), available at: http://www.ihcantabria.com/es/proyectos-id/item/839-tsunami-hazard-el-salvador (last access:September 2017), 2010 (in Spanish).
IH Cantabria-MARN (Instituto de Hidráulica Ambiental IHCantabria, Ministerio de Medio Ambiente y Recursos Natu-rales de El Salvador MARN): Catálogo de Vulnerabilidad yRiesgo debido a la inundación por Tsunami en la costa de ElSalvador, Spanish Agency for International Development Coop-eration (AECID), available at: http://www.ihcantabria.com/es/proyectos-id/item/843-tsunami-vulnerability-risk-el-salvador(last access: September 2017), 2012 (in Spanish).
INFORM: Index for Risk Management. Results 2017. Inter-AgencyStanding Committee Reference Group on Risk, Early Warningand Preparedness and European Commission, 2017.
ISO Guide 73:2009: Risk management – Vocabulary, Interna-tional Electrotechnical Commission/International Organizationfor Standardization. IEC/ISO, available at: https://www.iso.org/standard/44651.html (last access: 31 July 2018), 2009.
Jelínek, R., Eckert, S., Zeug, G., and Krausmann, E.: Tsunami Vul-nerability and Risk Analysis Applied to the City of Alexandria,Egypt, Tsunami Risk ANd Strategies For the European Region(TRANSFER Project), 2009.
Jelínek, R., Krausmann, E., Gonzalez, M., Álvarez-Gómez, J. L.,Birkmann, J., and Welle, T.: Approaches for tsunami risk assess-ment and application to the city of Cádiz, Spain, Nat. Hazards,60, 273–293, https://doi.org/10.1007/s11069-011-0009-0, 2012.
Jenks, G. F.: The data model concept in statistical mapping, Int.Yearbook Cartogr., 7, 186–190, 1967.
Jordan, B. R.: Tsunamis of the Arabian Peninsula. A guide of his-toric events, Science of Tsunami Hazards, 27, 31–46, 2008.
Nat. Hazards Earth Syst. Sci., 18, 2241–2260, 2018 www.nat-hazards-earth-syst-sci.net/18/2241/2018/

I. Aguirre-Ayerbe et al.: From tsunami risk assessment to disaster risk reduction 2259
Jonkman, S. N., Vrijling, J. K., and Vrouwenvelder, A. C. W. M.:Methods for the estimation of loss of life due to floods: a litera-ture review and a proposal for a new method, Nat. Hazards, 46,353–389, https://doi.org/10.1007/s11069-008-9227-5, 2008.
Jordan, B. R.: Tsunamis of the Arabian Peninsula. A guide of his-toric events, Science of Tsunami Hazards, 27, 31–46, 2008.
Karvonen, R. A., Hepojoki, H. K., Huhta, H. K., and Louhio, A.:The use of physical models in dam-break analysis. RESCDAMFinal Report, Helsinki University of Technology, Helsinki, Fin-land, 2000.
Koshimura, S., Katada, T., Mofjeld, H. O., and Kawata, Y.: Amethod for estimating casualties due to the tsunami inundationflow, Nat. Hazards, 39, 265–274, https://doi.org/10.1007/s11069-006-0027-5, 2006.
Latcharote, P., Al-Salem, K., Suppasri, A., Pokavanich, T., Toda, S.,Jayaramu, Y., Al-Enezi, A., Al-Ragumand, A., and Imamura, F.:Tsunami hazard evaluation for Kuwait and Arabian Gulf due toMakran Subduction Zone and Subaerial landslides, Nat. Hazards,1–26, https://doi.org/10.1007/s11069-017-3097-7, 2017.
Linham, M. and Nicholls, R. J.: Technologies for Climate ChangeAdaptation: Coastal erosion and flooding, TNA Guidebook Se-ries, UNEP/GEF, 2010.
Leone, F., Lavigne, F., Paris, R., Denain, J. C., and Vinet, F.: Aspatial analysis of the December 26th, 2004 tsunami-induceddamages: lessons learned for a better risk assessment integratingbuildings vulnerability, Appl. Geogr., 31, 363–375, 2011.
Løvholt, F., Setiadi, N. J., Birkmann, J., Harbitz, C. B., Bach, C.,Fernando, N., Kaiser, G., and Nadim, F.: Tsunami risk reduction– are we better prepared today than in 2004?, Int. J. Disast. RiskRe., 10, 127–142, https://doi.org/10.1016/j.ijdrr.2014.07.008,2014.
Mas, E., Koshimura, S., Suppasri, A., Matsuoka, M., Matsuyama,M., Yoshii, T., Jimenez, C., Yamazaki, F., and Imamura, F.: De-veloping Tsunami fragility curves using remote sensing and sur-vey data of the 2010 Chilean Tsunami in Dichato, Nat. HazardsEarth Syst. Sci., 12, 2689–2697, https://doi.org/10.5194/nhess-12-2689-2012, 2012.
Mokhtari, M.: Tsunami in Makran Region and its effect on thePersian Gulf, in: Tsunami – A Growing Disaster, edited by:Mokharti, M., InTech, 2011.
Nicholls, R. J., Cooper, N., and Townend, I. H.: The manage-ment of coastal flooding and erosion, in: Future Flood andCoastal Erosion Risks, edited by: Thorne, C. R., Evans, E. P.,and Penning-Rowsell, E. C., Thomas Telford, London, 392–413,https://doi.org/10.1680/ffacer.34495.0023, 2007.
OECD (Organization for Economic Co-operation andDevelopment)/EC-JRC (European Commission Joint ResearchCentre): Handbook on Constructing Composite Indicators,Methodology and Users Guide, OECD Publications, Paris, 2008.
Okada, Y.: Surface deformation due to shear and tensile faults in ahalf-space, B. Seismol. Soc. Am., 75, 1135–1154, 1985.
Sato, H., Murakami, H., Kozuki, Y., and Yamamoto, N.: Study on aSimplified Method of Tsunami Risk Assessment, Nat. Hazards,29, 325–340, https://doi.org/10.1023/A:1024732204299, 2003.
SCHEMA Project: Scenarios for Hazard-induced EmergenciesManagement, European 6th Framework Programme Projectno. 030963, August 2007–October 2010.
Schmidt-Thomé, P. (Ed.): ESPON Project 1.3.1 – Natural and tech-nological hazards and risks affecting the spatial development ofEuropean regions, Geological Survey of Finland, 2006.
Shoji, G. and Nakamura, T.: Damage Assessment of Road BridgesSubjected to the 2011 Tohoku Pacific Earthquake Tsunami, J.Disaster Res., 12, 79–89, 2017.
Strunz, G., Post, J., Zosseder, K., Wegscheider, S., Mück, M.,Riedlinger, T., Mehl, H., Dech, S., Birkmann, J., Gebert, N., Har-jono, H., Anwar, H. Z., Sumaryono, Khomarudin, R. M., andMuhari, A.: Tsunami risk assessment in Indonesia, Nat. HazardsEarth Syst. Sci., 11, 67–82, https://doi.org/10.5194/nhess-11-67-2011, 2011.
Sugimoto, T., Murakami, H., Kozuki, Y., Nishikawa, K., and Shi-mada, T.: A Human Damage Prediction Method for TsunamiDisasters Incorporating Evacuation Activities, Nat. Hazards, 29,587–602, https://doi.org/10.1023/A:1024779724065, 2003.
Suppasri, A., Koshimura, S., and Imamura, F.: Developing tsunamifragility curves based on the satellite remote sensing andthe numerical modeling of the 2004 Indian Ocean tsunamiin Thailand, Nat. Hazards Earth Syst. Sci., 11, 173–189,https://doi.org/10.5194/nhess-11-173-2011, 2011.
Suppasri, A., Mas, E., Charvet, I., Gunasekera, R., Imai, K., Fuku-tani, Y., Abe, Y., and Imamura, F.: Building damage characteris-tics based on surveyed data and fragility curves of the 2011 GreatEast Japan tsunami, Nat. Hazards, 66, 319–341, 2013.
Suppasri, A., Leelawat, N., Latcharote, P., Roeber, V., Yamashita K.,Hayashi, A., Ohira, H., Fukui, K., Hisamatsu, A., Nguyen, D.,and Imamura, F.: The 2016 Fukushima earthquake and tsunami:Local tsunami behavior and recommendations for tsunami dis-aster risk reduction, Int. J. Disast. Risk Re., 21, 323–330,https://doi.org/10.1016/j.ijdrr.2016.12.016, 2017.
Suppasri, A., Fukui, K., Yamashita, K., Leelawat, N., Ohira, H.,and Imamura, F.: Developing fragility functions for aquacul-ture rafts and eelgrass in the case of the 2011 Great EastJapan tsunami, Nat. Hazards Earth Syst. Sci., 18, 145–155,https://doi.org/10.5194/nhess-18-145-2018, 2018.
Taubenböck, H., Post, J., Roth, A., Zosseder, K., Strunz, G., andDech, S.: A conceptual vulnerability and risk framework as out-line to identify capabilities of remote sensing, Nat. HazardsEarth Syst. Sci., 8, 409–420, https://doi.org/10.5194/nhess-8-409-2008, 2008.
Tinti, S., Tonini, R., Bressan, L., Armigliato, A., Gardi, A., Guil-lande, R., Valencia, N., and Scheer, S.: Handbook of TsunamiHazard and Damage Scenarios, SCHEMA project (Scenarios forHazard induced Emergencies Management), European Commis-sion’s Joint Research Centre, Institute for the Protection and Se-curity of the Citizen, EU Publications Office, Luxembourg, 2011.
TRANSFER project: Tsunami Risk and Strategies for the EuropeanRegion, European 6th Framework Programme no. 37058, Octo-ber 2006–September 2009.
UN (United Nations): Report of the open-ended intergovernmen-tal expert working group on indicators and terminology relat-ing to disaster risk reduction. United Nations General AssemblyA/71/644.1 December 2016, New York, USA, 2016.
UNFCCC: Coastal Adaptation Technologies, Bonn, UNFCCC,1999.
UNESCO (United Nations Educational, Scientific and Cultural Or-ganization): Hazard Awareness and Risk Mitigation in Integrated
www.nat-hazards-earth-syst-sci.net/18/2241/2018/ Nat. Hazards Earth Syst. Sci., 18, 2241–2260, 2018
2260 I. Aguirre-Ayerbe et al.: From tsunami risk assessment to disaster risk reduction
Coastal Management (ICAM), IOC Manual and Guides No. 50,ICAM Dossier No. 5, UNESCO, Paris, 2009a.
UNESCO (United Nations Educational, Scientific and Cultural Or-ganization): Tsunami risk assessment and mitigation for the In-dian Ocean, Knowing your tsunami risk – and what to do aboutit, IOC Manuals and Guides No. 52, UNESCO, Paris, 2009b.
UNISDR (United Nations International Strategy for Disaster Re-duction): Living with Risk: a Global Review of Disaster Reduc-tion Initiatives, 2004 version, UN Publications, Geneva, 2004.
UNISDR (United Nations International Strategy for Disaster Re-duction): Terminology on Disaster Risk Reduction, UN/ISDR,Geneva, Switzerland, 2009.
UNISDR (United Nations International Strategy for Disaster Re-duction): Global Assessment Report on Disaster Risk Redcu-tion, GAR Atlas, available at: https://www.unisdr.org/we/inform/publications/53086 (last access: 31 July 2018), 2017.
UNISDR/CRED: Tsunami Disaster Risk: Past impacts and pro-jections. United Nations Office for Disaster Risk Reduction(UNISDR), Centre for Research on the Epidemiology of Dis-asters (CRED), available at: https://www.unisdr.org/we/inform/publications/50825 (last access: 31 July 2018), 2016.
Valencia, N., Gardi, A., Gauraz, A., Leone, F., and Guil-lande, R.: New tsunami damage functions developed in theframework of SCHEMA project: application to European-Mediterranean coasts, Nat. Hazards Earth Syst. Sci., 11, 2835–2846, https://doi.org/10.5194/nhess-11-2835-2011, 2011.
Wang, X.: COMCOT User Manual Ver. 1.7, 59 pp., Cornell Univer-sity, NY, USA, 2009.
Wegscheider, S., Post, J., Zosseder, K., Mück, M., Strunz, G.,Riedlinger, T., Muhari, A., and Anwar, H. Z.: Generating tsunamirisk knowledge at community level as a base for planning andimplementation of risk reduction strategies, Nat. Hazards EarthSyst. Sci., 11, 249–258, https://doi.org/10.5194/nhess-11-249-2011, 2011.
Wijetunge, L. J.: A deterministic analysis of tsunami hazard andrisk for the southwest coast of Sri Lanka, Cont. Shelf Res., 79,23–35, 2014.
Xia, J., Falconer, R. A., Wang, Y., and Xiao, X.: New criterion forthe stability of a human body in floodwaters, J. Hydraul. Res.,52, 93–104, 2014.
Nat. Hazards Earth Syst. Sci., 18, 2241–2260, 2018 www.nat-hazards-earth-syst-sci.net/18/2241/2018/
Copyright © 2022 FDOKUMEN