
People, Place and Power on the Nineteenth-Century Waterfront
Upload
khangminh22Category
view
4download
0
Waterfront Toronto Port Lands Flood Protection and Enabling Infrastructure FINAL Report July 2016
-Confidential- Waterfront Toronto 2 Port Lands Flood Protection and Enabling Infrastructure
Table of contents
1. Executive Summary............................................................................................................................................ 4 1.1 Project Overview ........................................................................................................................................ 4 1.2 P3 Suitability Screen ................................................................................................................................... 4 1.3 Market Sounding ........................................................................................................................................ 4 1.4 Qualitative Assessment .............................................................................................................................. 5 1.5 Quantitative Assessment ............................................................................................................................ 6
2. Introduction ....................................................................................................................................................... 7 2.1 Project Overview ........................................................................................................................................ 7
3. P3 Suitability Screen ........................................................................................................................................ 10 3.1 Methodology ............................................................................................................................................ 10 3.2 P3 Screen Criteria ..................................................................................................................................... 10 3.3 Application of the Screening Criteria ........................................................................................................ 12 3.4 Summary of P3 Screen .............................................................................................................................. 17
4. Market Sounding ............................................................................................................................................. 19 4.1 Methodology ............................................................................................................................................ 19 4.2 Market Sounding Findings ........................................................................................................................ 19 4.3 Additional Considerations ........................................................................................................................ 23 4.4 Market Sounding Conclusion .................................................................................................................... 25
5. Qualitative Assessment .................................................................................................................................... 26 5.1 Long List of Procurement Options ............................................................................................................ 26 5.2 Qualitative Assessment Methodology ...................................................................................................... 28 5.3 Scoring of procurement options ............................................................................................................... 30
6. Quantitative Assessment ................................................................................................................................. 41 6.1 Value for Money Methodology ................................................................................................................. 41 6.2 Project Costs ............................................................................................................................................. 41 6.3 Risk Assessment ........................................................................................................................................ 42 6.4 Value-for-Money Assessment ................................................................................................................... 47
7. Findings and Considerations ............................................................................................................................ 53 7.1 Summary of Findings ................................................................................................................................ 53
Appendix A: Market Sounding Participants ................................................................................................................. 54 Appendix B: Market Sounding Information Package ................................................................................................... 55 Appendix C: Risk Matrix ............................................................................................................................................... 56 Appendix D: Risk Definitions ........................................................................................................................................ 57 Appendix E: The Guide to the new Building Canada Fund P3 Screen – Suitability Assessment .................................. 60

-Confidential- Waterfront Toronto 3 Port Lands Flood Protection and Enabling Infrastructure
Notice
Ernst and Young Orenda Corporate Finance Inc. (“EY”) was engaged by Waterfront Toronto to assist in analyzing the viability of delivering all or part of the Port Lands Flood Protection and Enabling Infrastructure Project (the “Project”) via a Public-Private Partnership (“P3”) approach. This report (the “Report”) highlights the methods, tools and findings of the procurement/delivery options analysis, qualitative analysis (including multi-criteria analysis and market sounding), quantitative analysis (including risk and value for money) and integrated recommendations for the Project. This Report was prepared on Waterfront Toronto instructions solely for the purposes of the Waterfront Toronto. It should not be relied upon for any other purpose. The Report is based on objective analysis and information provided to us by Waterfront Toronto and third parties and does not necessarily represent EY views, comments, conclusions and opinions. The Report may not have considered issues relevant to any third parties. Any use such third parties may choose to make of the Report is entirely at their own risk and we shall have no responsibility whatsoever in relation to any such use and to the fullest extent permitted by law we do not accept or assume responsibility to anyone other than Waterfront Toronto for our work, for this Report or for the opinions formed. Our Report to Waterfront Toronto is based on inquiries of, and discussions with, Waterfront Toronto and its consultants. We have not undertaken any form of investigation, audit, substantiation or verification procedures for the information, data and projections provided to us. We have not sought to verify the accuracy of the data or the information and explanations provided. Our work has been limited in time and scope and a more detailed / lengthy exercise may reveal material issues that this review has not addressed. The methodologies applied in undertaking this Report were based on market-tested and modified PPP Canada and Infrastructure Ontario methodologies for conducting value for qualitative and quantitative analyses (including value for money). No obligation is assumed by EY to revise this Report to reflect any circumstances or information that become available subsequent to the date of this Report.
-Confidential- Waterfront Toronto 4 Port Lands Flood Protection and Enabling Infrastructure
1. Executive Summary
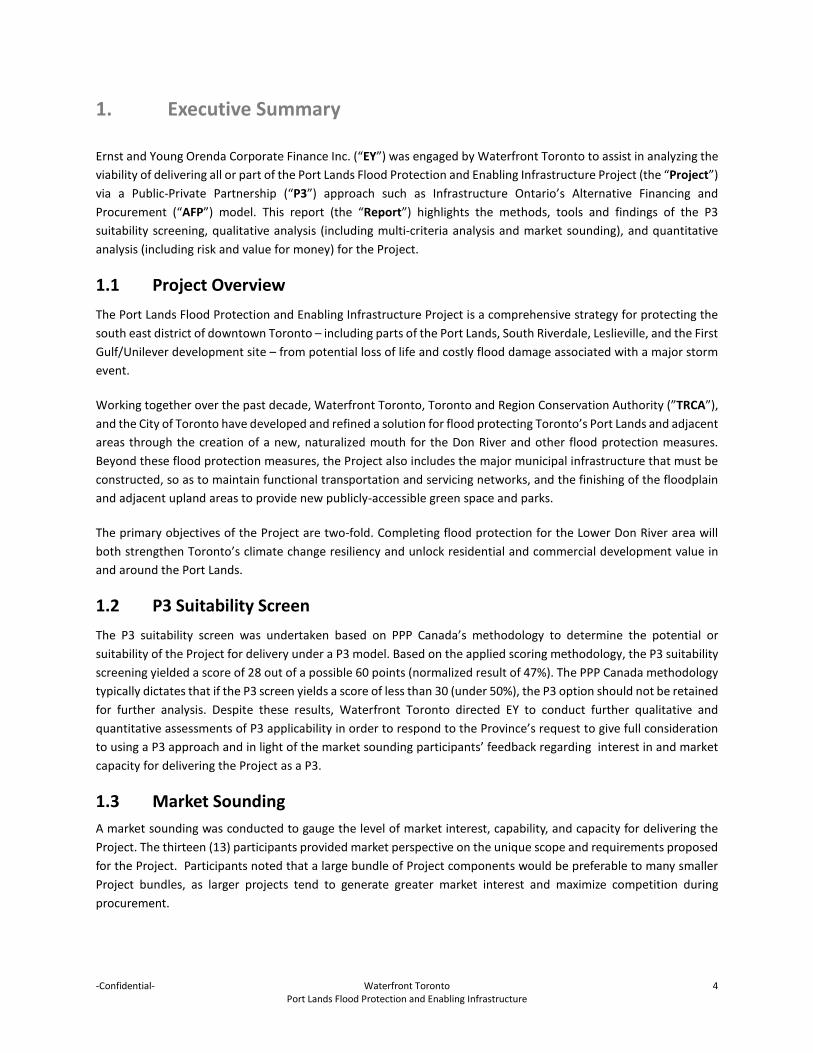
Ernst and Young Orenda Corporate Finance Inc. (“EY”) was engaged by Waterfront Toronto to assist in analyzing the viability of delivering all or part of the Port Lands Flood Protection and Enabling Infrastructure Project (the “Project”) via a Public-Private Partnership (“P3”) approach such as Infrastructure Ontario’s Alternative Financing and Procurement (“AFP”) model. This report (the “Report”) highlights the methods, tools and findings of the P3 suitability screening, qualitative analysis (including multi-criteria analysis and market sounding), and quantitative analysis (including risk and value for money) for the Project.
1.1 Project Overview The Port Lands Flood Protection and Enabling Infrastructure Project is a comprehensive strategy for protecting the south east district of downtown Toronto – including parts of the Port Lands, South Riverdale, Leslieville, and the First Gulf/Unilever development site – from potential loss of life and costly flood damage associated with a major storm event.
Working together over the past decade, Waterfront Toronto, Toronto and Region Conservation Authority (”TRCA”), and the City of Toronto have developed and refined a solution for flood protecting Toronto’s Port Lands and adjacent areas through the creation of a new, naturalized mouth for the Don River and other flood protection measures. Beyond these flood protection measures, the Project also includes the major municipal infrastructure that must be constructed, so as to maintain functional transportation and servicing networks, and the finishing of the floodplain and adjacent upland areas to provide new publicly-accessible green space and parks.
The primary objectives of the Project are two-fold. Completing flood protection for the Lower Don River area will both strengthen Toronto’s climate change resiliency and unlock residential and commercial development value in and around the Port Lands.
1.2 P3 Suitability Screen The P3 suitability screen was undertaken based on PPP Canada’s methodology to determine the potential or suitability of the Project for delivery under a P3 model. Based on the applied scoring methodology, the P3 suitability screening yielded a score of 28 out of a possible 60 points (normalized result of 47%). The PPP Canada methodology typically dictates that if the P3 screen yields a score of less than 30 (under 50%), the P3 option should not be retained for further analysis. Despite these results, Waterfront Toronto directed EY to conduct further qualitative and quantitative assessments of P3 applicability in order to respond to the Province’s request to give full consideration to using a P3 approach and in light of the market sounding participants’ feedback regarding interest in and market capacity for delivering the Project as a P3.
1.3 Market Sounding A market sounding was conducted to gauge the level of market interest, capability, and capacity for delivering the Project. The thirteen (13) participants provided market perspective on the unique scope and requirements proposed for the Project. Participants noted that a large bundle of Project components would be preferable to many smaller Project bundles, as larger projects tend to generate greater market interest and maximize competition during procurement.

-Confidential- Waterfront Toronto 5 Port Lands Flood Protection and Enabling Infrastructure
All participants asserted that there is currently sufficient market capacity and interest in delivering the Project under a design-build-finance (“DBF”) or traditional model. It was noted, however, that the timing of the procurement may align or interfere with other large infrastructure projects projected to be in-market or under development in spring 2017. All participants identified permitting and approvals delays, specifically those related to environmental approvals, as high risk items. Environmental and site contamination issues were discussed at length as key Project risks. Allocations for environmental risks were noted as a significant issue for both constructors and lenders and required consideration. Participants also expressed some concerns related to soil contamination, remediation and treatment on the brownfield site for this Project. Participants recommend that a clear identification of the contractual counterparty prior to the procurement phase would provide comfort to the market. Should the Project move forward as a P3, participants recommended the use of established P3 procurement processes and template documentation thoughtfully adapted to the specific needs of the Project to minimize bidding costs. Participants noted a keen interest in bidding on the Project given the information provided, regardless of the application of a P3 or traditional model.
1.4 Qualitative Assessment The qualitative assessment considered the long-listed procurement options against qualitative assessment criteria in order to determine which procurement options should be short-listed for detailed quantitative analysis. The long-listed options (the “Procurement Options”) included:
Design-Bid-Build (“DBB”) Design-Build (“DB”) Construction Manager / General Contractor (“CM/GC”) Build-Finance (“BF”) Design-Build-Finance (“DBF”) Design-Build-Finance-Maintain (“DBFM”) Design-Build-Finance-Operate-Maintain (“DBFOM”)
Market sounding participants noted that the operations and maintenance components related to the Project scope were relatively small in comparison to total capital costs. As such, it was discussed that there would not be sufficient operations and maintenance scope to create value or efficient risk transfer. Following discussion with Waterfront Toronto, the DBFM and DBFOM delivery options were removed from the long list of options.
In order to evaluate the long list of procurement options through a suitable qualitative process, multi criteria analysis was applied to each of the long-listed Procurement Options. The table below summarizes the applied scoring of the procurement options against the identified Evaluation Criteria.
Table 1: Qualitative Scoring Summary
Criterion Design Bid Build (DBB)
Design Build (DB)
Construction Management /
General Contractor (CM/GC)
Build Finance (BF)
Design Build Finance (DBF)
Overall Score 83 94 111 96 136
-Confidential- Waterfront Toronto 6 Port Lands Flood Protection and Enabling Infrastructure
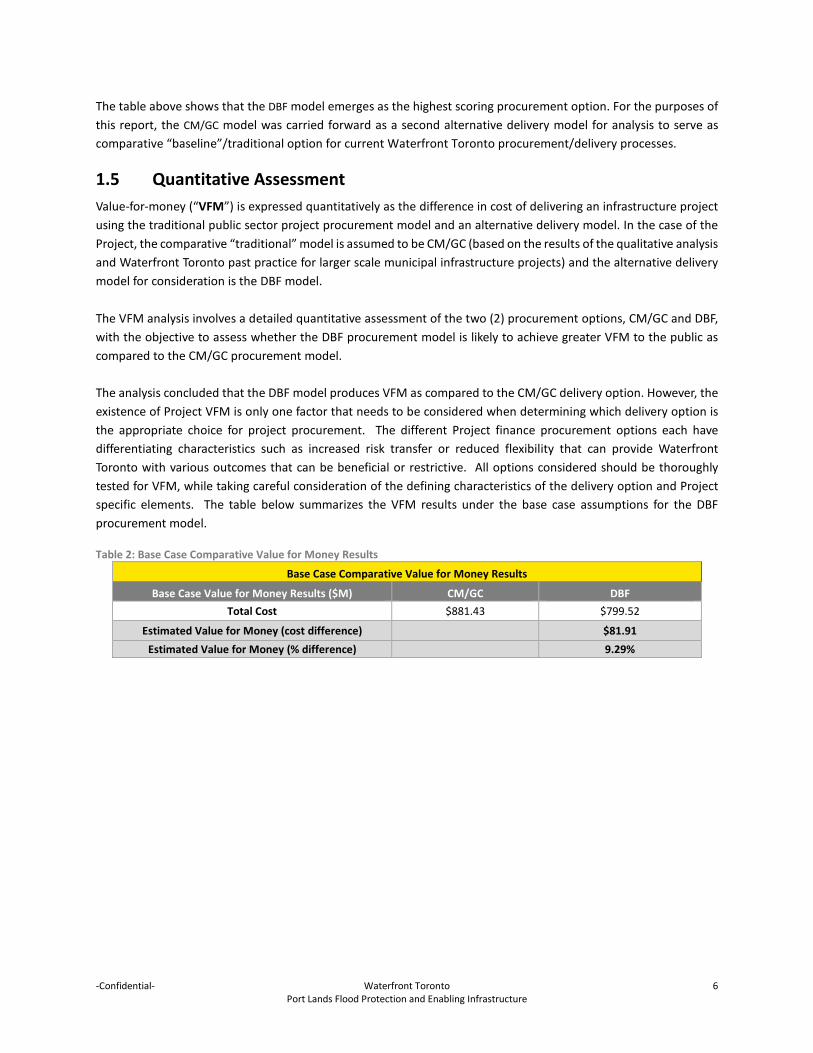
The table above shows that the DBF model emerges as the highest scoring procurement option. For the purposes of this report, the CM/GC model was carried forward as a second alternative delivery model for analysis to serve as comparative “baseline”/traditional option for current Waterfront Toronto procurement/delivery processes.
1.5 Quantitative Assessment Value-for-money (“VFM”) is expressed quantitatively as the difference in cost of delivering an infrastructure project using the traditional public sector project procurement model and an alternative delivery model. In the case of the Project, the comparative “traditional” model is assumed to be CM/GC (based on the results of the qualitative analysis and Waterfront Toronto past practice for larger scale municipal infrastructure projects) and the alternative delivery model for consideration is the DBF model. The VFM analysis involves a detailed quantitative assessment of the two (2) procurement options, CM/GC and DBF, with the objective to assess whether the DBF procurement model is likely to achieve greater VFM to the public as compared to the CM/GC procurement model.
The analysis concluded that the DBF model produces VFM as compared to the CM/GC delivery option. However, the existence of Project VFM is only one factor that needs to be considered when determining which delivery option is the appropriate choice for project procurement. The different Project finance procurement options each have differentiating characteristics such as increased risk transfer or reduced flexibility that can provide Waterfront Toronto with various outcomes that can be beneficial or restrictive. All options considered should be thoroughly tested for VFM, while taking careful consideration of the defining characteristics of the delivery option and Project specific elements. The table below summarizes the VFM results under the base case assumptions for the DBF procurement model.
Table 2: Base Case Comparative Value for Money Results
Base Case Comparative Value for Money Results
Base Case Value for Money Results ($M) CM/GC DBF Total Cost $881.43 $799.52
Estimated Value for Money (cost difference) $81.91 Estimated Value for Money (% difference) 9.29%

-Confidential- Waterfront Toronto 7 Port Lands Flood Protection and Enabling Infrastructure
2. Introduction
Ernst and Young Orenda Corporate Finance Inc. (“EY”) was engaged by Waterfront Toronto to assist in analyzing the viability of delivering all or part of the Port Lands Flood Protection and Enabling Infrastructure Project (the “Project”) via a Public-Private Partnership (“P3”) approach such as Infrastructure Ontario’s Alternative Financing and Procurement (“AFP”) model. This report (the “Report”) highlights the methods, tools and findings of the P3 suitability screening, qualitative analysis (including multi-criteria analysis and market sounding), and quantitative analysis (including risk and value for money) for the Project.
The Report is organized into the following six (6) major sections based on EY’s scope of work:
Introduction; P3 Suitability Screen Qualitative Analysis; Market Sounding; Quantitative and Risk Analysis; and Findings and Other Considerations.
2.1 Project Overview The Port Lands Flood Protection and Enabling Infrastructure Project is a comprehensive strategy for protecting the south east district of downtown Toronto – including parts of the Port Lands, South Riverdale, Leslieville, and the First Gulf/Unilever development site – from potential loss of life and costly flood damage associated with a major storm event.
Working together over the past decade, Waterfront Toronto, Toronto and Region Conservation Authority (”TRCA”), and the City of Toronto have developed and refined a solution for flood protecting Toronto’s Port Lands and adjacent areas through the creation of a new, naturalized mouth for the Don River and other flood protection measures. Beyond these flood protection measures, the Project also includes the major municipal infrastructure that must be constructed, so as to maintain functional transportation and servicing networks, and the finishing of the floodplain and adjacent upland areas to provide new publicly-accessible green space and parks.
The primary objectives of the Project are two-fold. Completing flood protection for the Lower Don River area will both strengthen Toronto’s climate change resiliency and unlock residential and commercial development value in and around the Port Lands.
2.1.1 Project Scope
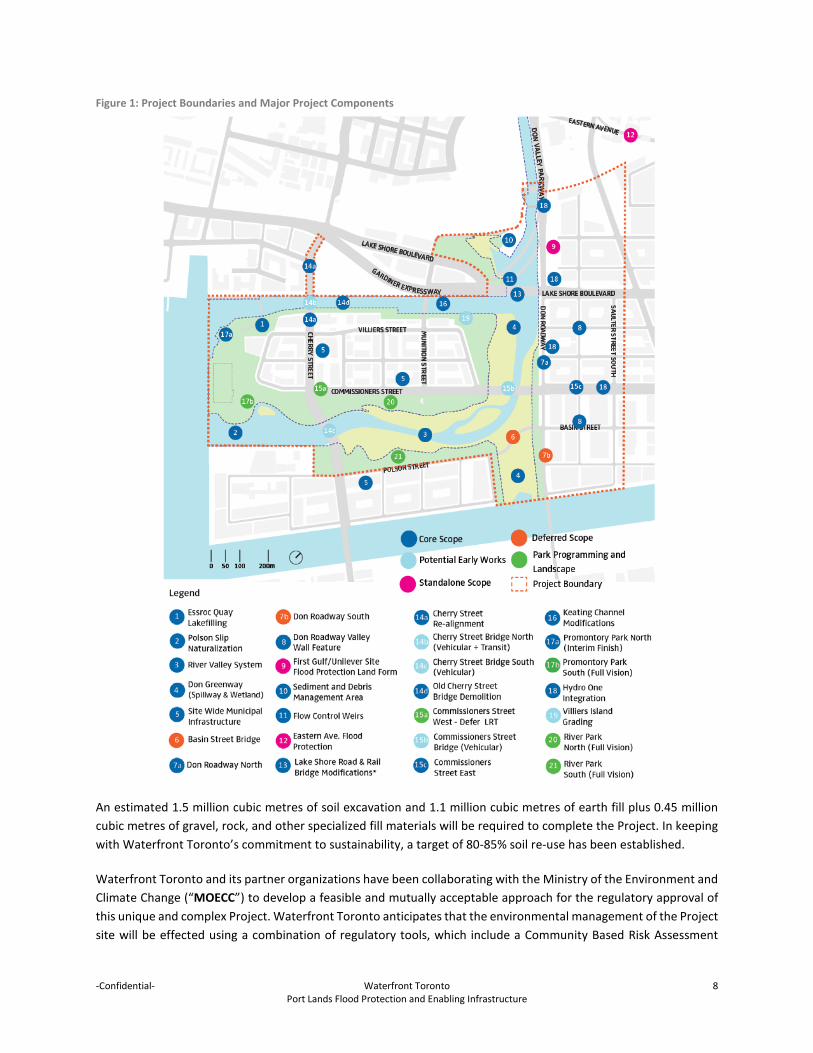
The Project encompasses flood protection infrastructure, marine works, parks and naturalized areas, and enabling municipal infrastructure (bridges, roads, and services) in the vicinity of the new flood protection works. Figure 1 shows the approximate Project boundaries and identifies the major Project components. “Deferred” components are currently outside the scope of the Project for construction and maintenance purposes, but may need to be considered to some extent during the design and approval phases.
-Confidential- Waterfront Toronto 8 Port Lands Flood Protection and Enabling Infrastructure
Figure 1: Project Boundaries and Major Project Components
An estimated 1.5 million cubic metres of soil excavation and 1.1 million cubic metres of earth fill plus 0.45 million cubic metres of gravel, rock, and other specialized fill materials will be required to complete the Project. In keeping with Waterfront Toronto’s commitment to sustainability, a target of 80-85% soil re-use has been established.
Waterfront Toronto and its partner organizations have been collaborating with the Ministry of the Environment and Climate Change (“MOECC”) to develop a feasible and mutually acceptable approach for the regulatory approval of this unique and complex Project. Waterfront Toronto anticipates that the environmental management of the Project site will be effected using a combination of regulatory tools, which include a Community Based Risk Assessment

-Confidential- Waterfront Toronto 9 Port Lands Flood Protection and Enabling Infrastructure
(“CBRA”) process carried out in consultation with MOECC, and site-specific risk assessment (“RA”) processes that may be carried out under Ontario Regulation (O. Reg.) 153/04. The design and construction specifications for the Project will incorporate a variety of environmental risk management measures to address the current environmental condition of the site.
The target date for Project completion is late 2023. The potential scope of services initially considered for inclusion in a P3/AFP Procurement was as follows, without limitation:
Design and construction of flood protection infrastructure, marine works, parks and naturalized areas, bridge structures, roads, and municipal services;
Maintenance and repair of flood protection infrastructure, including weir and dockwall structures, channel dredging, debris removal, and flood damage restoration; and
Maintenance of parks and trails, bridge structures, roads, and municipal services.
Following the market sounding exercise, it was determined that some of the above noted scope was not suitable for inclusion under a P3 delivery model.

-Confidential- Waterfront Toronto 10 Port Lands Flood Protection and Enabling Infrastructure
3. P3 Suitability Screen
The P3 suitability screen is designed to assist procuring Authorities (municipal, provincial, territorial) in determining the potential or suitability of a particular infrastructure project for delivery under a P3 model. The objective of the P3 screening is to consider the applicability of P3 models in the delivery of the Project.
3.1 Methodology
The methodology agreed with the Waterfront Toronto for carrying out this objective was:
1. To utilize PPP Canada’s P3 Screen – Suitability Assessment to complete the Project’s P3 screening; and 2. To apply the qualitative evaluation scores and recommend whether further investigation of the P3 delivery
model is warranted.
It is important to note that the identification of P3 potential does not imply that the P3 approach will be the final delivery approach. Rather, it means that further detailed analysis of potential P3 options is appropriate.
3.2 P3 Screen Criteria
The evaluation criteria applied in the P3 screening process were based on PPP Canada’s market-accepted and standardized P3 Screen – Suitability Assessment. Twelve (12) criteria were identified and applied in conducting the P3 screen:
Asset life; Asset complexity; Outputs and performance specifications (construction); Stability of operational requirements; Performance specifications and indicators (operations period); Life-cycle costs; Revenue generation; Private sector expertise; Market precedents; Nature of the development site; Scope for private sector innovation gains; and Potential for contract integration.
The table below lists the Evaluation Criteria and corresponding screening questions, along with brief explanations of how they indicate the degree of P3 suitability.

-Confidential- Waterfront Toronto 11 Port Lands Flood Protection and Enabling Infrastructure
Table 3: Screening Criteria
Criteria Description
Asset Life: What is the anticipated useful life (i.e. service life) of this asset?
The duration of P3 contracts tends to be tied to the useful life of the asset and, in general, longer-lived assets tend to be better suited to a P3.
Asset Complexity: How complex is the asset both with respect to construction and operations & maintenance?
P3s lend themselves to complex investments. Complexity can arise as a result of the nature of the asset, the site on which it will be constructed, or the number of distinct asset classes involved in the investment
Outputs and Performance Specifications (Construction): What is the availability of output specifications for the construction of the asset?
P3s are characterized by the public sector setting its desired outcomes or outputs in the form of measurable technical output/service/performance specifications that provide the basis for performance based contracts.
Stability of Operational Requirements: Are the long term operational requirements of the planned asset relatively stable and predictable?
Assets with stable and predictable performance and maintenance requirements lend themselves to P3 delivery.
Performance Specifications and Indicators (Operations Period): What is the availability of operations- and maintenance-related performance specifications and indicators?
Establishing and monitoring performance in relation to key performance indicators (KPIs) is an important element of performance based contracts, a foundational element of P3s.
Life-Cycle Costs: Can most of the full life-cycle costs of the asset, mainly related to construction and fit-up (i.e. project costs) and long-term operations, including maintenance, be quantified upfront with reasonable assumptions and/or availability of historic data?
Life cycle costs are very important factor in success of a P3. Should a DBFM or DBFOM approach be adopted, the public sector will pay for maintenance and/or operation through the P3 agreement and expects the asset to be well-maintained and efficiently operated at the lowest cost possible.
Revenue Generation: Does the planned investment have inherent scope to generate any revenue?
Revenue generation is not a requirement for a successful P3. However, where an asset could potentially generate revenue and reduce the burden on public funds, the P3 model is ideally suited to leveraging that potential.
Private Sector Expertise: How many private sector firms have the capacity to deliver and maintain this type of asset?
The availability of private sector expertise is critical for two reasons: (1) ensuring a competitive bidding environment; and (2) ensuring that there is private sector capacity to perform the functions and manage the risks envisioned in the P3.

-Confidential- Waterfront Toronto 12 Port Lands Flood Protection and Enabling Infrastructure
Criteria Description
Market Precedents: Have investments with similar requirements and of similar size and scale been delivered through the P3 model?
The existence of P3s for similar assets is a key indicator regarding the viability of a P3.
Nature of Development Site: What is the nature of the development site (greenfield vs. brownfield) and what proportion of this investment involves the expansion/renovation of existing facilities/assets?
In general, investments involving all new construction on previously undeveloped sites lend themselves to maximizing risk transfer to the private sector.
Scope for Private Sector Innovation Gains: To what extent will the public sector be able to rely on output/performance-based requirements/specifications?
The scope for private sector innovation is inversely related to the public sector's need to be prescriptive.
Potential for Contract Integration: Which elements of the potential P3 (i.e., design, build, finance, maintain, operate) can be integrated into one contract?
One of the mechanisms by which P3s generate value is the integration of various elements of the potential P3 (i.e., design, build, finance, operate/maintain). The greater the potential for integration, the more likely a P3 will be viable.
3.3 Application of the Screening Criteria
For each of the screening criteria, the Project Team applied a scale from one (1) to five (5), with five (5) representing a high score and higher Project applicability for the P3 approach. The Project Team applied a scoring methodology based on the market accepted and tested PPP Canada P3 screen methodology. These scores are then normalized to a score out of 100, which can range from 1 to 100.
The PPP Canada P3 Suitability Screen indicates an appropriate level of P3 suitability for the Project being considered and produces a final numerical output that should be assessed against the following:
Score Range Normalized Score Range
Evaluating Investments for P3 Viability
0 – 30 0 - 50 The P3 option should not be retained for further analysis.
31 – 45 51 - 75 The Project presents a mix of favourable and unfavourable indicators for P3 delivery. Further assessment is necessary.
46 – 60 76 - 100 The Project shows P3 delivery potential and requires further assessment.

-Confidential- Waterfront Toronto 13 Port Lands Flood Protection and Enabling Infrastructure
Further details on the accompanying scales and scoring indicators are provided in Appendix E: The Guide to the new Building Canada Fund P3 Screen – Suitability Assessment.
3.3.1 Asset life
Asset life is defined as the anticipated useful life (i.e. service life) of the asset to be delivered. The duration of P3 contracts extending through the operations and/or maintenance phases tends to be tied to the useful life of the asset and therefore the length of the maintenance period. In general, longer-lived assets tend to be better suited to a P3. The longer contract linked to the P3 delivery of infrastructure projects may provide benefits of efficiencies, innovations and long term cost certainty as provided by a private sector partner. Below, we provide the score and corresponding rationale for this criterion:
Assigned Score Rationale
3 Generally, the Project is expected to have an asset life of greater than 25 years. In some instances, the Project components, such as land reclamation, may exceed asset life of 25 years on their own. The asset life of the Project is conducive to a P3 approach.
3.3.2 Asset complexity
Asset complexity gauges the intricacy of the Project and resulting asset(s) both with respect to construction and to operations and maintenance. P3s lend themselves to complex investments. Complexity can arise as a result of the nature of the asset, the site on which it will be constructed, or the number of distinct asset classes involved in the investment. The Project is highly complex, comprising multiple asset classes. Below, we provide the score and corresponding rationale for this criterion:
Assigned Score Rationale
3
The construction of the Project is expected to be a highly complex undertaking because of the: diversity of Project components; challenging geotechnical and environmental site conditions; environmental management and other regulatory approval requirements; access and logistics requirements; and multiple interfaces with adjacent projects, requiring extensive coordination. For those Project components needing periodic maintenance (municipal services, roads, bridges, marine structures, the sediment trap, and the public realm), specific maintenance requirements are relatively routine. Much of the total construction investment will be in re-grading, land reclamation, and environmental clean-up, activities which are not accompanied by a need for on-going post-construction maintenance.

-Confidential- Waterfront Toronto 14 Port Lands Flood Protection and Enabling Infrastructure
3.3.3 Outputs and performance specifications (construction)
P3s are characterized by the public sector setting its desired outcomes or outputs in the form of measurable technical output/service/performance specifications that provide the basis for performance based contracts. The outputs and performance specifications criterion assesses the availability of output specifications for the construction of the proposed asset(s). As the Project includes several different types of infrastructure, multiple output specifications will be required to address the full range of component characteristics and performance requirements. Below, we provide the score and corresponding rationale for this criterion:
Assigned Score Rationale
3
Existing conventional specifications can be converted into output or performance specifications for most Project components, while some aspects of the design (e.g., the grading plan) must be specified in prescriptive terms. It may prove particularly difficult to translate design excellence requirements into unambiguous output specifications.
3.3.4 Stability of operational requirements
Assets with stable and predictable performance and maintenance requirements lend themselves to P3 delivery. This criterion measures the relative stability and predictability of the long term operational requirements of the planned asset(s). The stability of operational requirements would be dependent on the known factors of Project scope. Below, we provide the score and corresponding rationale for this criterion:
Assigned Score Rationale
2 Operation and periodic maintenance requirements for certain Project components tend to be relatively stable and consistent with those for the larger networks of roads, services, etc. to which such components will be connected.
3.3.5 Performance specifications and indicators (operations period)
Establishing and monitoring performance in relation to key performance indicators (KPIs) is an important element of performance based contracts, a foundational element of P3s. This criterion assesses the availability of operations- and maintenance-related performance specifications and indicators for the proposed Project. Below, we provide the score and corresponding rationale for this criterion:
Assigned Score Rationale
1
Given the unique nature of many Project components, there is limited to no data related to performance outputs and indicators for comparable assets. The Project scope related to operations and maintenance is expected to be small, as compared to capital requirements, and much of the infrastructure extends existing networks already being operated and maintained by others.

-Confidential- Waterfront Toronto 15 Port Lands Flood Protection and Enabling Infrastructure
3.3.6 Life-cycle costs
Life-cycle costs are very important factor in the success of a P3. The public authority will pay for maintenance and/or operation through the P3 agreement and expects the asset to be well-maintained and efficiently operated at the lowest cost possible. In assessing P3 applicability, we measure whether most of the full life-cycle costs of the asset (related both to construction and to long-term operations and maintenance) can be quantified upfront with reasonable assumptions and/or availability of historic data. Below, we provide the score and corresponding rationale for this criterion:
Assigned Score Rationale
1
The total asset life-cycle costs for some Project components are well understood, and can be accurately estimated. In contrast, asset renewal/refurbishment requirements for flood protection infrastructure will be dictated by the occurrence of major storm events, which are inherently unpredictable, as such, associated life cycle costs may be difficult to establish.
3.3.7 Revenue generation
Revenue generation is not a requirement for a successful P3. However, where an asset could potentially generate revenue and reduce the burden on public funds, the P3 model is ideally suited to leveraging that potential. Consideration was given to whether the planned investment (Port Lands Project) had the inherent scope to generate any revenue. Below, we provide the score and corresponding rationale for this criterion:
Assigned Score Rationale
1 It is unlikely that the planned investment will generate any revenues.
3.3.8 Private sector expertise
The availability of private sector expertise is critical for two reasons: (1) ensuring a competitive bidding environment; and (2) ensuring that there is private sector capacity to perform the functions and manage the risks envisioned in the P3. A subsequent market sounding exercise will be implemented to gauge market capacity and interest in the Port Lands Project. For the purposes of the P3 screen, however, we generally assessed how many private sector firms have the capacity to deliver and maintain this type of asset given current market conditions. Below, we provide the score and corresponding rationale for this criterion:
Assigned Score Rationale
5 There are more than 5 private sector firms capable of designing, constructing and maintaining the asset types as required by this Project, however, the market capacity is to be further determined with market sounding interviews.

-Confidential- Waterfront Toronto 16 Port Lands Flood Protection and Enabling Infrastructure
3.3.9 Market precedents
The existence of P3s for similar assets is a key indicator regarding the viability of a P3. In assessing the applicability of this measure, research was conducted to investigate investments with similar requirements and of similar size and scale to the Port Lands Project having been delivered through the P3 model. Below, we provide the score and corresponding rationale for this criterion:
Assigned Score Rationale
2
There is P3 market precedent for some municipal infrastructure components of the Project (including roads, bridges, retaining walls, water and sewer networks, etc.); however there is no P3 market precedent for a project involving earth moving and environmental work of this scale and scope.
3.3.10 Nature of development site
In general, investments involving all new construction on previously undeveloped sites lend themselves to maximizing risk transfer to the private sector. This criterion considers the nature of the development site (Greenfield vs. brownfield) and what proportion of this investment involves the expansion/renovation of existing assets or site conditions. Below, we provide the score and corresponding rationale for this criterion:
Assigned Score Rationale
2 The Project represents a unique development site requiring extensive earthwork, land reclamation, soil and groundwater management, and marine works
3.3.11 Scope of private sector innovation gains
The scope for private sector innovation is inversely related to the public sector's need to be prescriptive. The Project was assessed to determine the extent to which the public sector will be able to rely on output/performance-based requirements/specifications for the Project under consideration. Below, we provide the score and corresponding rationale for this criterion:
Assigned Score Rationale
3
It is anticipated that the private sector will bring some innovation to the Project by way of efficiencies in the construction approach, sequencing, and schedule and with respect to soil and groundwater treatment approaches, resulting from designer/constructor collaboration and the competitive process. However, the private sector innovations might be limited based on Project approval requirements.

-Confidential- Waterfront Toronto 17 Port Lands Flood Protection and Enabling Infrastructure
3.3.12 Potential for contract integration
The potential for contract integration considers which elements of the potential P3 (i.e., design, build, finance, maintain, operate) can be integrated into one contract. One of the mechanisms by which P3s generate value is the integration of various elements of the potential P3 contract. The greater the potential for integration, the more likely a P3 will be viable. Below, we provide the score and corresponding rationale for this criterion:
Assigned Score Rationale
2
Design-build-finance-maintenance and some operations could be integrated into a contract with a single service provider. This is contingent on the scope of operation and maintenance for specific Project elements. The long-term operations and maintenance requirements for this Project are expected to be small compared to the capital requirements.
3.4 Summary of P3 Screen
The table below summarizes the scores applied to the screening criteria.
Criteria Score
Asset Life 3
Asset Complexity 3
Outputs and Performance Specifications (Construction) 3
Stability of Operational Requirements 2
Performance Specifications and Indicators (Operations Period) 1
Life-Cycle Costs 1
Revenue Generation 1
Private Sector Expertise 5
Market Precedents 2
Nature of Development Site 2
Scope for Private Sector Innovation Gains 3
Potential for Contract Integration 2
Total Score 28
Total Normalized Score 47%
Based on the applied scoring methodology, the P3 suitability screening yielded a score of 28 out of a possible 60 points (normalized result of 47%). The PPP Canada methodology typically dictates that if the P3 screen yields a score

-Confidential- Waterfront Toronto 18 Port Lands Flood Protection and Enabling Infrastructure
of less than 30 (under 50%), the P3 option should not be retained for further analysis. Despite these results, Waterfront Toronto directed EY to conduct further assessments of P3 applicability in order to respond to the Province’s request to give full consideration to using a P3 approach and in light of the market sounding participants’ feedback regarding interest in and market capacity for delivering the Project as a P3. As a result of these discussions, further qualitative and quantitative assessments for both traditional and P3 models are presented in Sections 5 and 6 to determine the applicability of P3 models.
-Confidential- Waterfront Toronto 19 Port Lands Flood Protection and Enabling Infrastructure
4. Market Sounding
A market sounding was conducted to gauge the level of market interest, capability, and capacity for delivering the Project. The key objectives of the market sounding exercise were to:
Provide preliminary project information to the market;
Assess the capability and appetite of the market to carry out the Project under different procurement options; and
Assist in structuring a transaction that will generate competitive tension and best value to the procuring authority.
4.1 Methodology Working with Waterfront Toronto and Infrastructure Ontario (AFP subject matter experts and advisors to the project team), EY compiled a list of prospective market sounding participants from a variety of backgrounds to cover the different facets of the Project. A total of seventeen (17) primary companies were identified and approached, thirteen (13) of which agreed to participate in teleconference interviews. This included infrastructure developers/operators, civil infrastructure contractors active in public-private partnership (“P3”) market, specialty contractors, lenders and equity providers.
The market sounding participants list is included in Appendix A. A market sounding information briefing document was developed and delivered to prospective participants prior to the market sounding interviews. A copy of this information package has been included in Appendix B of this Report. Note that some details about the Project changed subsequent to the preparation and distribution of this briefing document, but these changes would not be expected to materially impact the Market Sounding Findings.
4.2 Market Sounding Findings The market sounding interviews were held between 14 January 2016 and 10 February 2016. Comments received from market sounding participants during the interviews were generally supportive of the contemplated Project. In particular, respondents were pleased with Waterfront Toronto’s interest in collecting market feedback for consideration in structuring any future transaction. An overview of high-level findings from the market sounding, including issues requiring further consideration are summarized below.
4.2.1 Project scope and size Based on the information included in the briefing document, participants noted that a large bundle of Project components would be preferable to many smaller Project bundles. Larger projects generally generate greater market interest, lead to economies of scale and maximize competition during procurement. In considering bundled projects, it was noted that different components may carry varying levels of risk. It was suggested that a well-defined and narrow scope would more suitable for application of a P3 delivery model.

-Confidential- Waterfront Toronto 20 Port Lands Flood Protection and Enabling Infrastructure
Waterfront Toronto also noted that some components of the Project scope (as detailed in the market sounding briefing package) were potentially suitable for early works. Such components would be removed from the final scope tendered to market.
4.2.2 Preferred Delivery Option 4.2.2.1 P3 Delivery Models vs. Traditional Delivery Model
The majority of participants expressed a keen interest in bidding on the Project regardless of the application of a P3 or traditional model. Several participants noted that a P3 model would be well suited to delivering the Project scope in its entirety. However, many noted that the maintenance component in the current project scope would not be large enough to add value or innovations under a DBFM/DBFOM model, as discussed in Section 4.2.2.2. One participant highlighted the importance of selecting one delivery option as opposed to using a hybrid model (selecting components from different models), which can introduce a broad range of risks and may not attract the most efficient bidding teams. The design-build-finance (“DBF”) model was determined to be the most relevant model to be applied to this Project, given the currently available information and scope requirements. Based on the Project scope, the DBF model was suggested as the most relevant for Project delivery.
4.2.2.2 Scope of Operations and Maintenance
Several participants noted that the maintenance component as detailed in the scope would not be sufficient to provide value in justification of the design-build-finance-maintain (“DBFM”) or design-build-finance-operate-maintain (“DBFOM”) models. A few participants specifically noted that the maintenance related to the flood damage restoration as an area of concern as it would be difficult to transfer these risks to the private sector. The flood damage restoration components were addressed as difficult to price during the procurement phase. As such, this item may be associated with high risk premiums for market sounding participants. One (1) participant suggested tendering maintenance items separately, to allow for the contracting of specialized firms for maintenance of parks, trails or bridge structures. Marine works were also cited as a particular component which may require more specialized resources or team members in the formation of consortia. In an effort to integrate further operations or maintenance scope as part of a DBFM or DBFOM delivery model, two (2) participants suggested the inclusion of a large social infrastructure asset within the Project scope, to serve as a maintenance “anchor” component. The asset could include community or recreational facilities, stadiums, or other social infrastructure assets which would entail a long-term operations and maintenance component (typically 30 years).
4.2.3 Site conditions, permits and approvals 4.2.3.1 Environmental approvals and permitting
Any delays in obtaining necessary approvals or permits would have the potential to impact downstream works, resulting in overall schedule delays or additional costs. Open ended timelines can lead to material risk premiums added by bidders.

-Confidential- Waterfront Toronto 21 Port Lands Flood Protection and Enabling Infrastructure
All participants identified delays in required environmental approvals as a high risk item. Risks associated with environmental approvals and permitting could be mitigated through well-defined rules of engagement with approval agencies and specification in contractual terms with the contractor / private sector consortium (“Project Co”).
Risk allocations for environmental concerns were noted as a significant issue for lenders. Participants agreed that environmental risks would be transferrable (to a certain extent) to Project Co, however, the transfer of risks would impact overall bid prices and contingencies.
Some participants highlighted concerns related to constraints on private sector innovation resulting from environmental approvals and permitting processes. A few participants noted that regulatory approvals would need to be in place in sufficient time ahead of the bid submission deadline, with clear language and processes related to how approvals will be implemented and enforced. Lenders specifically noted that key permits and approvals would need to be in place prior to financial close. As the time of the market sounding, environmental assessments (EAs) for flood protection and naturalization works and for municipal infrastructure (bridges, roads, transit, and services) had been completed and approved.
4.2.3.2 Site condition and contamination
All participants expressed concern over soil contamination, specifically in terms of expectations for the treatment and re-use of soil excavated from the Project site.
The delineation of potential contaminants was identified as a significant concern, with specific questions raised related to soil remediation, treatment, and re-use. Waterfront Toronto noted the potential to include a target for re-use of soil. Some participants stated that it would be possible to conduct soil remediation and treatment on-site, if requested, to minimize costs and delays associated with soil removal and disposal. Other participants cited that geotechnical and environmental risks should remain with the Project owner.
Participants noted that information on the soil properties, specifically related to dredging components, would need to be released with procurement documentation or publicly prior to tendering competition. Inferable risks based on geotechnical and environmental reports would be comfortably accepted by the participants, but unknown risks (not identified or readily inferable) would require a detailed regime for measurement, containment and management and would need to be detailed in the procurement process.
Some participants noted that if information presented in available environmental or geotechnical reports was insufficient, that additional testing or site visits may be requested by bidders.
4.2.3.3 Utilities
Many participants raised concerns related to interfaces or collaboration with utilities during Project delivery. A detailed understanding of risk allocation related to the utilities component would need to be available to bidders ahead of the commitment of any resources. Several participants noted issues in overall schedule delays related to relocation or removal of utility components. Participants noted that the risk appetite associated with utility related requirements would be determined by the level of control that the contractor/Project Co would have over the utility in the completion of the necessary work, as schedule and control were identified as the largest issues. Any Project relationships with utilities would need to be well defined ahead of the procurement phase.

-Confidential- Waterfront Toronto 22 Port Lands Flood Protection and Enabling Infrastructure
4.2.4 Procurement considerations 4.2.4.1 Market capacity and interfaces with other projects in market
All participants asserted that there is currently sufficient market capacity and interest in delivering the Project under either a DBF or more traditional model.
It was noted, however, that the timing of the procurement may parallel other large infrastructure projects projected to be in-market or under development in spring 2017. Most participants indicated that the market is resilient enough to handle several large construction projects within similar timelines, but noted that the procurement timing needs to be well coordinated with releases for other major public infrastructure projects.
Participants also highlighted questions related to the Gardiner Expressway Rehabilitation project, which could share interfaces with the Port Lands project, and may result in unexpected or unplanned issues. Should the Project be delivered under a traditional model with multiple separate construction contracts, additional interface and site access issues may arise between parties, which could lead to schedule delays. Participants also raised issues related to relief for damage caused by third parties, over which the contractor / Project Co has no control.
The boundaries of any adjacent projects or interfaces would need to be well defined and aligned to the final Project scope.
4.2.4.2 Timetable
Waterfront Toronto presented an estimated timeline of spring 2017 through 2023 for construction completion. This timeline was deemed to be achievable by all participants under a traditional delivery model.
Participants noted that under a P3 procurement process, the 2023 completion date would be achievable; however, the construction start date of spring 2017 would need to be extended to allow for a longer Project procurement lead time. Under a P3 (DBF), timelines would need to be adjusted to accommodate approximately two (2) to three (3) months for the request for qualifications (“RFQ”) and at least eight (8) to twelve (12) months for the request for proposals (“RFP”) processes.
Some participants also recommended the use of regular public communications and advance availability of Project information prior to procurement to facilitate teaming decisions.
4.2.4.3 Procurement documentation
Participants recommended the use of established processes and template documentation, should the Project move forward as a P3. Template documentation from Infrastructure Ontario could be used as a basis given its general acceptance and familiarity by the market, however, it was noted that adaptation would be required to suit the unique needs and characteristics of this Project. One participant suggested that current Infrastructure Ontario templates do not promote innovation, and suggested amendments to allow the private sector with more flexibility to allow for

-Confidential- Waterfront Toronto 23 Port Lands Flood Protection and Enabling Infrastructure
and incentivize private sector innovations. Part of this adaptation could include creative opportunities through the procurement process to engage in open dialogue and propose innovative solutions.
One participant also noted that evaluation measures and templates would need to be amended and tailored to the Project, citing that selecting teams based on credit-worthiness would be important, but could limit competition to larger market players. As such, it was recommended that several criteria be applied in the evaluation of bidders.
4.2.4.4 Contractual counterparties
Participants will require clear identification of the contractual counterparty prior to the procurement phase. The contractual counterparty identifies the Project owner who will have the assigned authority and committed funding for the Project. The strength of the contractual counterparty provides comfort to lenders through master agreements or commitment agreements outside of the concession agreements (commercial protections).
4.2.5 Financing considerations 4.2.5.1 Lenders concerns
The long construction period anticipated (2017 through 2023) for the Project could have implications in obtaining construction bonding and financing. The anticipated $800 million Project construction cost is not anticipated to be an issue for Canadian lenders.
Lenders noted that concerns are typically associated with uncertainties surrounding common project elements such as geotechnical risk, permits and approvals. As the scope of this Project is unique, the rating of the contractual counterparty would provide significant comfort to lenders. Lenders may seek a development agreement or funding agreement which would clearly articulate how funds would be received from government sources.
4.2.5.2 Payment structure
The majority of participants affirmed that progress payments and/or substantial completion payment would be better received by the market. Larger substantial completion payments reduce the size of both the debt and equity requirements of the Project and therefore careful consideration should be given to the size of such payments. A few participants noted milestone payments as the preferred structure, with the caveat of allowing Project Co the opportunity to identify the selected milestones.
4.3 Additional Considerations
4.3.1 Adjacent Projects
The Port Lands and adjacent areas could become congested with the construction of several projects within similar timeframes. The development of adjacent projects, including the F.G. Gardiner Expressway Rehabilitation, could have impacts on availability or capacity of the market, including bidder, equipment, and material and resource availability. The mobilization and construction of several projects within the same area could also impact traffic through and into the Port Lands area. These interface risks were cited as a major reason that the recent Eglinton Crosstown project did not attract a large pool (greater than four) bidding parties.

-Confidential- Waterfront Toronto 24 Port Lands Flood Protection and Enabling Infrastructure
Waterfront Toronto should consider scheduling related to tendering, award and construction timeline in relation to other projects of similar size to be completed in the Port Lands area.
-Confidential- Waterfront Toronto 25 Port Lands Flood Protection and Enabling Infrastructure
4.4 Market Sounding Conclusion The thirteen (13) participants provided market perspective on the unique scope and requirements proposed for the Project. Participants noted that a large bundle of Project components would be preferable to many smaller Project bundles, as larger projects tend to generate greater market interest and maximize competition during procurement. The majority of participants also noted that a P3 model, specifically the DBF approach, would be well-suited to delivering the Project scope in its entirety, as the maintenance component in the current Project scope would not be sufficient in providing value to Waterfront Toronto under DBFM or DBFOM delivery models. Participants also noted that the traditional delivery model (CM/GC) would be similarly effective for Project delivery. All participants asserted that there is currently sufficient market capacity and interest in delivering the Project under a DBF or traditional model. It was noted, however, that the timing of the procurement may align or interfere with other large infrastructure projects projected to be in-market or under development in spring 2017. Waterfront Toronto presented an estimated timeline of spring 2017 through 2023 for construction completion. This timeline was deemed to be achievable by all participants under a traditional delivery model. Participants noted that under a P3 procurement process, the 2023 completion date would be achievable; however, the construction start date of spring 2017 would need to be extended to allow for a longer Project procurement lead time. All participants identified permitting and approvals delays, specifically those related to environmental approvals, as high risk items. Environmental and site contamination issues were discussed at length as key Project risks. Allocations for environmental risks were noted as a significant issue for both constructors and lenders and required consideration. Participants also expressed some concerns related to soil contamination, remediation and treatment on the brownfield site for this Project. . Another key Project risk that was highlighted is utilities. A clear understanding of risk allocation related to the utilities component would need to be available to bidders early on in the procurement process. Participants recommend that a clear identification of the contractual counterparty prior to the procurement phase would provide comfort to the market. Should the Project move forward as a P3, participants recommended the use of established P3 procurement processes and template documentation thoughtfully adapted to the specific needs of the Project to minimize bidding costs. Participants noted a keen interest in bidding on the Project given the information provided, regardless of the application of a P3 or traditional model.

-Confidential- Waterfront Toronto 26 Port Lands Flood Protection and Enabling Infrastructure
5. Qualitative Assessment
The qualitative assessment considered the long-listed procurement options against qualitative assessment criteria in order to determine which procurement options should be short-listed for detailed quantitative analysis. The methodology agreed with Waterfront Toronto for carrying out this objective was: 1. To develop a long list of the key procurement options that could be employed to procure the Project;
2. To develop a qualitative evaluation methodology with which to assess the long list of procurement options and reduce the long list to a reasonable number of potential procurement options on which to carry out a more detailed quantitative analysis;
3. To apply the qualitative evaluation methodology to the long list of procurement options, and recommend the most appropriate procurement options to carry forward to the quantitative evaluation phase.
5.1 Long List of Procurement Options
A long list of the key procurement options was developed to highlight potential options which could be employed in order to procure the Project. The long list was developed from:
1. Traditional procurement methods for public infrastructure assets utilized by Waterfront Toronto, City of Toronto and other government and public sector entities across Canada and globally; and
2. Alternative procurement options identified as potential options for the Project covering a broad spectrum of procurement opportunities with varying degrees of private sector involvement, private sector financing and risk transfer.
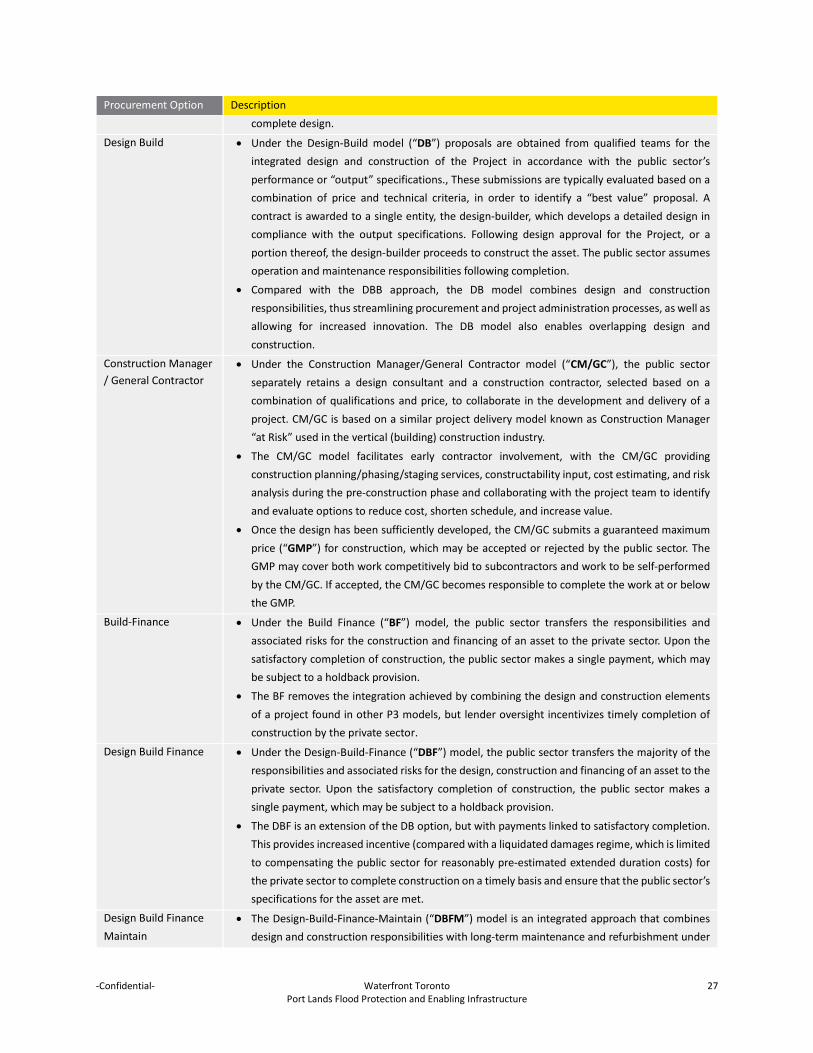
The following long-listed options (the “Procurement Options”) along with a brief description of what each option would entail were agreed at the workshop.
Table 4: Long-list of Procurement Options Procurement Option Description Design Bid Build • Design-Bid-Build (“DBB”) procurement has been the most common method of civil
infrastructure procurement by the public sector. Under this approach, the public sector is fully responsible for the engineering and design of the asset, which is typically undertaken on its behalf by a private sector consultant. The public sector then invites bids from qualified bidders to construct the works as described in the plans and specifications prepared by the consultant. The bids are evaluated and the contract is awarded to the lowest priced, technically compliant bidder.
• Following award, the construction contractor undertakes construction of the works under the general review and administration of the consultant, who owes a duty of care to the public sector to ensure that the contractor follows the plans and specifications and complies with the terms of the construction contract. Following the completion of construction, the asset is commissioned and handed over to the public sector for operation and maintenance.
• This approach is well-suited to recurring, repetitive projects for which the public sector has a desire to specify its exact requirements and obtain firm, competitive prices based on a 100%
-Confidential- Waterfront Toronto 27 Port Lands Flood Protection and Enabling Infrastructure
Procurement Option Description complete design.
Design Build • Under the Design-Build model (“DB”) proposals are obtained from qualified teams for the integrated design and construction of the Project in accordance with the public sector’s performance or “output” specifications., These submissions are typically evaluated based on a combination of price and technical criteria, in order to identify a “best value” proposal. A contract is awarded to a single entity, the design-builder, which develops a detailed design in compliance with the output specifications. Following design approval for the Project, or a portion thereof, the design-builder proceeds to construct the asset. The public sector assumes operation and maintenance responsibilities following completion.
• Compared with the DBB approach, the DB model combines design and construction responsibilities, thus streamlining procurement and project administration processes, as well as allowing for increased innovation. The DB model also enables overlapping design and construction.
Construction Manager / General Contractor
• Under the Construction Manager/General Contractor model (“CM/GC”), the public sector separately retains a design consultant and a construction contractor, selected based on a combination of qualifications and price, to collaborate in the development and delivery of a project. CM/GC is based on a similar project delivery model known as Construction Manager “at Risk” used in the vertical (building) construction industry.
• The CM/GC model facilitates early contractor involvement, with the CM/GC providing construction planning/phasing/staging services, constructability input, cost estimating, and risk analysis during the pre-construction phase and collaborating with the project team to identify and evaluate options to reduce cost, shorten schedule, and increase value.
• Once the design has been sufficiently developed, the CM/GC submits a guaranteed maximum price (“GMP”) for construction, which may be accepted or rejected by the public sector. The GMP may cover both work competitively bid to subcontractors and work to be self-performed by the CM/GC. If accepted, the CM/GC becomes responsible to complete the work at or below the GMP.
Build-Finance • Under the Build Finance (“BF”) model, the public sector transfers the responsibilities and associated risks for the construction and financing of an asset to the private sector. Upon the satisfactory completion of construction, the public sector makes a single payment, which may be subject to a holdback provision.
• The BF removes the integration achieved by combining the design and construction elements of a project found in other P3 models, but lender oversight incentivizes timely completion of construction by the private sector.
Design Build Finance • Under the Design-Build-Finance (“DBF”) model, the public sector transfers the majority of the responsibilities and associated risks for the design, construction and financing of an asset to the private sector. Upon the satisfactory completion of construction, the public sector makes a single payment, which may be subject to a holdback provision.
• The DBF is an extension of the DB option, but with payments linked to satisfactory completion. This provides increased incentive (compared with a liquidated damages regime, which is limited to compensating the public sector for reasonably pre-estimated extended duration costs) for the private sector to complete construction on a timely basis and ensure that the public sector’s specifications for the asset are met.
Design Build Finance Maintain
• The Design-Build-Finance-Maintain (“DBFM”) model is an integrated approach that combines design and construction responsibilities with long-term maintenance and refurbishment under

-Confidential- Waterfront Toronto 28 Port Lands Flood Protection and Enabling Infrastructure
Procurement Option Description a single contract.
• A private sector partner is procured through a competitive tendering process to design, finance, build and maintain the infrastructure in a manner that meets the requirements and specifications of the public sector.
• While some elements of operations may be transferred to the private sector under DBFM, these services are typically limited in scope and the operating responsibilities for the asset are retained by the public sector.
• DBFM should be considered for those projects where there is sufficient logically related maintenance scope that can be transferred to the private sector. Where the project scope involves limited extensions to similar assets that are already being maintained by others, DBFM may not be commercially feasible.
Design Build Finance Operate Maintain
• The Design-Build-Finance-Operate-Maintain (“DBFOM”) model differs from DBFM in that it transfers greater operational responsibilities and related risks to the private sector.
• As with DBFM, where the project scope involves limited extensions to similar assets already being operated and/or maintained by others, DBFOM may not be commercially feasible.
As per Section 4 above, market sounding participants noted that the operations and maintenance components related to the Project scope were relatively small in comparison to total capital costs. As such, it was discussed that there would not be sufficient operations and maintenance scope to create value or efficient risk transfer. Following discussion with Waterfront Toronto, the DBFM and DBFOM delivery options were removed from the long list of options.
5.2 Qualitative Assessment Methodology
In order to evaluate the long list of procurement options through a suitable qualitative process, multi criteria analysis was applied to each of the long listed Procurement Options.
This involved first developing a list of criteria (“Evaluation Criteria”) against which to assess each Procurement Option and applying each criterion to each of the long-list of procurement options agreed in order to determine which procurement options meet the evaluation criteria most closely. The assessment was carried out during a half-day workshop facilitated by EY on May 11, 2016, which included participants from Waterfront Toronto, the City of Toronto, TRCA, IO, and other Project stakeholders and subject matter experts representing various provincial ministries.
The Evaluation Criteria were developed in the following categories:
Alignment with Project, WT, Partner and Stakeholder Objectives Value, Cost, and Schedule Factors Project Delivery Factors
Weighting of the Evaluation Criteria was considered as high (multiplier of 3), medium (multiplier of 2) or low (multiplier of 1) impact items with respect to relative importance to the Project.
-Confidential- Waterfront Toronto 29 Port Lands Flood Protection and Enabling Infrastructure
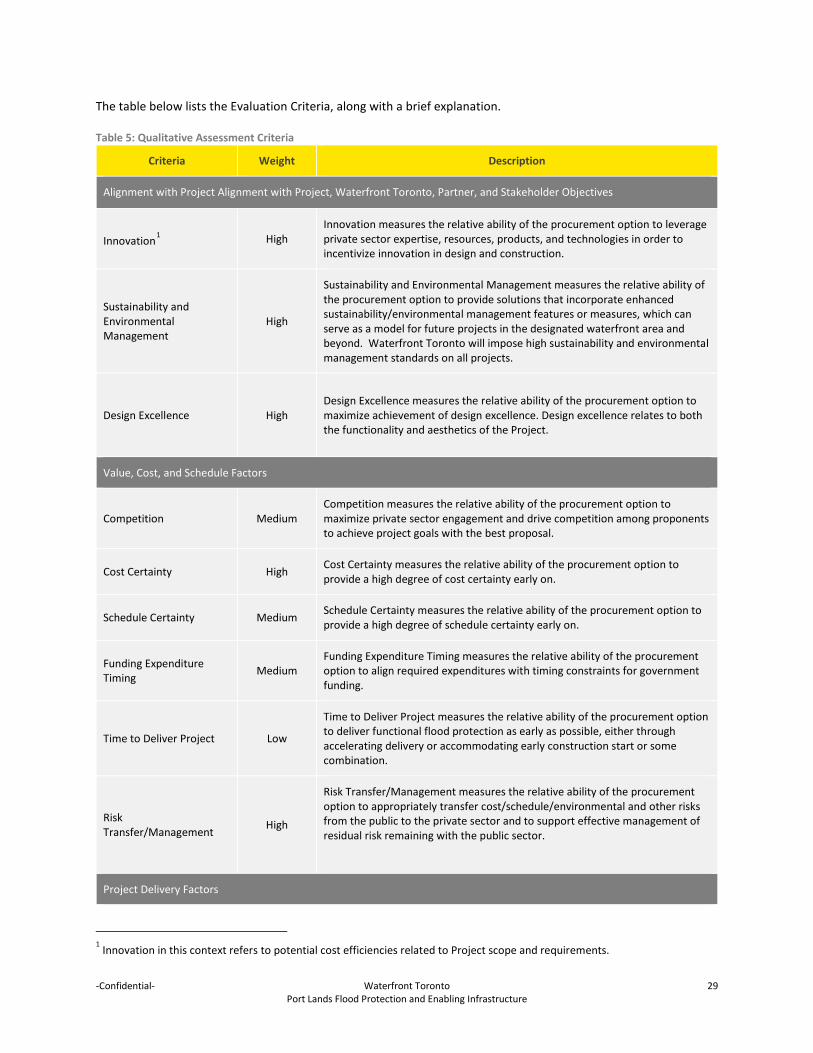
The table below lists the Evaluation Criteria, along with a brief explanation.
Table 5: Qualitative Assessment Criteria
Criteria Weight Description
Alignment with Project Alignment with Project, Waterfront Toronto, Partner, and Stakeholder Objectives
Innovation1 High Innovation measures the relative ability of the procurement option to leverage private sector expertise, resources, products, and technologies in order to incentivize innovation in design and construction.
Sustainability and Environmental Management
High
Sustainability and Environmental Management measures the relative ability of the procurement option to provide solutions that incorporate enhanced sustainability/environmental management features or measures, which can serve as a model for future projects in the designated waterfront area and beyond. Waterfront Toronto will impose high sustainability and environmental management standards on all projects.
Design Excellence High Design Excellence measures the relative ability of the procurement option to maximize achievement of design excellence. Design excellence relates to both the functionality and aesthetics of the Project.
Value, Cost, and Schedule Factors
Competition Medium Competition measures the relative ability of the procurement option to maximize private sector engagement and drive competition among proponents to achieve project goals with the best proposal.
Cost Certainty High Cost Certainty measures the relative ability of the procurement option to provide a high degree of cost certainty early on.
Schedule Certainty Medium Schedule Certainty measures the relative ability of the procurement option to provide a high degree of schedule certainty early on.
Funding Expenditure Timing Medium
Funding Expenditure Timing measures the relative ability of the procurement option to align required expenditures with timing constraints for government funding.
Time to Deliver Project Low
Time to Deliver Project measures the relative ability of the procurement option to deliver functional flood protection as early as possible, either through accelerating delivery or accommodating early construction start or some combination.
Risk Transfer/Management High
Risk Transfer/Management measures the relative ability of the procurement option to appropriately transfer cost/schedule/environmental and other risks from the public to the private sector and to support effective management of residual risk remaining with the public sector.
Project Delivery Factors
1 Innovation in this context refers to potential cost efficiencies related to Project scope and requirements.
-Confidential- Waterfront Toronto 30 Port Lands Flood Protection and Enabling Infrastructure
Criteria Weight Description
Interface Coordination and Flexibility High
Measures the relative flexibility of the procurement option in terms of facilitating coordination/integration with adjacent major projects and accommodating adjustments to scope or functional requirements as may be needed to achieve such integration and/or keep final costs within budget.
Legal Considerations/Precedent Projects
Medium Measures the relative ability of the procurement option to minimize complexity of required legal agreements and to build on existing market precedent.
Logistics Medium
Measures the relative ability of the procurement option to facilitate management and control of the project site, so as to achieve efficient construction staging/operations while simultaneously minimizing access/servicing/traffic/business disruptions.
Collaboration High Measures the relative ability of the procurement option to focus contracting parties on constructive problem-solving in the best interest of the project and to limit non-productive, adversarial interaction.
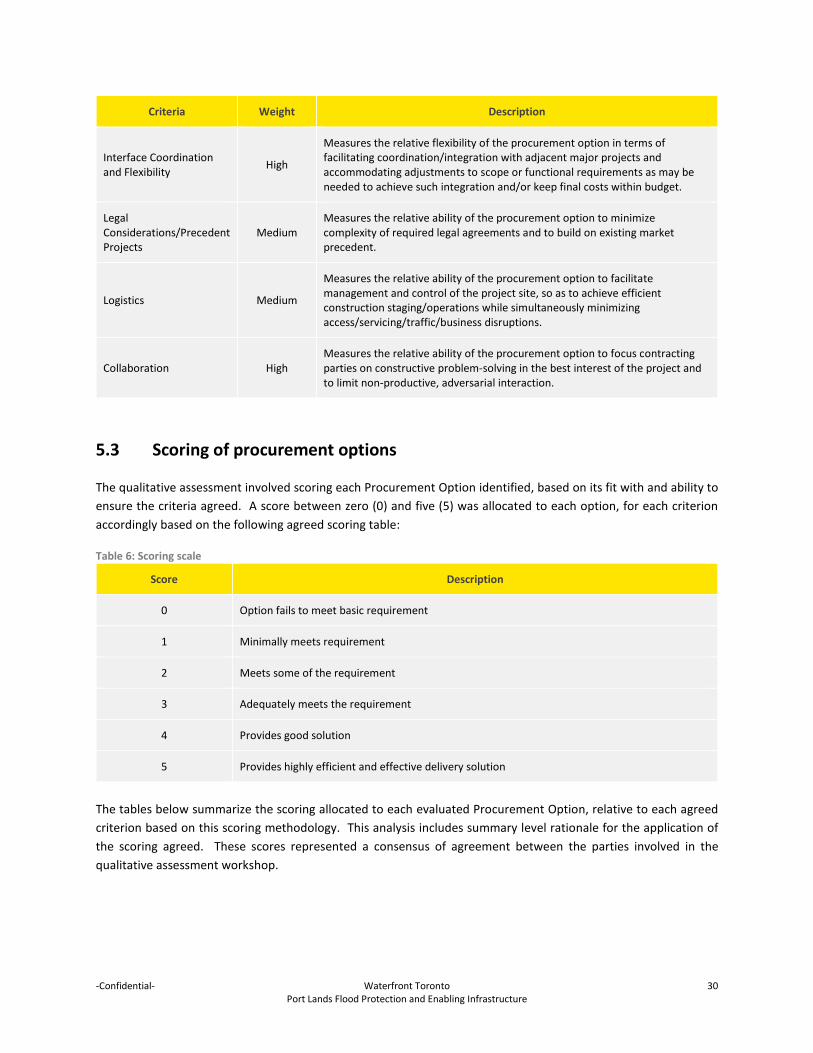
5.3 Scoring of procurement options
The qualitative assessment involved scoring each Procurement Option identified, based on its fit with and ability to ensure the criteria agreed. A score between zero (0) and five (5) was allocated to each option, for each criterion accordingly based on the following agreed scoring table:
Table 6: Scoring scale
Score Description
0 Option fails to meet basic requirement
1 Minimally meets requirement
2 Meets some of the requirement
3 Adequately meets the requirement
4 Provides good solution
5 Provides highly efficient and effective delivery solution
The tables below summarize the scoring allocated to each evaluated Procurement Option, relative to each agreed criterion based on this scoring methodology. This analysis includes summary level rationale for the application of the scoring agreed. These scores represented a consensus of agreement between the parties involved in the qualitative assessment workshop.

-Confidential- Waterfront Toronto 31 Port Lands Flood Protection and Enabling Infrastructure
5.3.1 Alignment with Project, Waterfront Toronto, Partner, and Stakeholder Objectives
5.3.1.1 Innovation
Innovation measures the relative ability of the procurement option to leverage private sector expertise, resources, products, and technologies in order to incentivize innovation in design and construction.
Procurement Option Considerations Score
Design Bid Build (DBB)
Separate, sequential contracts for design, construction, and operational/ maintenance phases limit opportunities to innovate.
Prescriptive specifications required in order to obtain comparable, fixed-price bids.
Procurement process does not lend itself to considering innovation pre-award.
Incorporating value management practices/constructability reviews during design can partially offset limitations posed by contracting structure.
1
Design Build (DB)
Combining design and construction responsibilities into a single contract has potential to drive innovation.
Use of performance-based rather than prescriptive specifications can encourage private sector (design-builder) innovation.
Procurement process (proposal evaluation criteria) can be designed to reward innovation.
3
Construction Manager/General Contractor (CM/GC)
Early retention of CM/GC and resultant collaboration with design team has potential to drive innovation.
CM/GC delivery model facilitates application of value management techniques throughout the design phase.
Owner is at the table and can provide feedback as innovation proposals are developed.
3
Build Finance (BF) Please refer to considerations listed under DBB, as financing add-on alone
would not generally increase opportunities for innovation. Exclusion of design scope limits innovation potential.
2
Design Build Finance (DBF)
Please refer to considerations listed under DB, as the addition of financing alone would not generally drive increased design and construction innovation.
Lender risk tolerance may sometimes inhibit implementation of design and construction innovations perceived as “too high risk”
In Ontario process, commercially confidential meetings intended as forum for discussion of innovation proposals with the Owner.
4
HIGH MED LOW

-Confidential- Waterfront Toronto 32 Port Lands Flood Protection and Enabling Infrastructure
5.3.1.2 Sustainability and Environmental Management
Sustainability and Environmental Management measures the relative ability of the procurement option to provide solutions that incorporate enhanced sustainability/environmental management features or measures, which can serve as a model for future projects in the designated waterfront area and beyond. Waterfront Toronto will impose high sustainability and environmental management standards on all projects.
Procurement Option Considerations Score
Design Bid Build (DBB)
Requirements must be specified in tender documents. Approval agencies can be engaged/consulted during development of
proposals/designs. Limited opportunity to incorporate constructability considerations in the
development of proposals/designs for enhanced sustainability or environmental management measures.
5
Design Build (DB) Desired outcomes must be articulated through performance specifications
in tender documents. 4
Construction Manager/General Contractor (CM/GC)
Facilitates designer, constructor, and Owner collaboration and allows for constructive engagement of regulators in identifying, designing and implementing sustainable solutions.
Provides opportunity to refine and adjust solutions and for the Owner to make cost trade-offs in support of project goals as design development proceeds.
5
Build Finance (BF) Please refer to considerations listed under DBB, as financing add-on alone
would not generally alter outcomes. 5
Design Build Finance (DBF) Please refer to considerations listed under DB, as financing add-on alone
would not generally alter outcomes. 5
5.3.1.3 Design Excellence
Design Excellence measures the relative ability of the procurement option to maximize achievement of design excellence. Design excellence relates to both the functionality and aesthetics of the Project.
Procurement Option Considerations Score
Design Bid Build (DBB) Designers responsible directly to Owner for achieving design excellence. Prescriptive specifications can incorporate and clearly define desired
functional and aesthetic elements. 5
Design Build (DB) May be difficult to unambiguously define what constitutes “design
excellence” via performance specifications. Owner has limited ability to influence design decisions.
4
Construction Manager/General Contractor (CM/GC)
Allows for independent procurement of best design team and constructor. Owner retains control over design and project decisions. Contractor “buy-in” to design more readily achieved in collaborative
environment.
5
Build Finance (BF) Please refer to considerations listed under DBB. 5
HIGH MED LOW
HIGH MED LOW

-Confidential- Waterfront Toronto 33 Port Lands Flood Protection and Enabling Infrastructure
Procurement Option Considerations Score
Design Build Finance (DBF)
May be difficult to unambiguously define what constitutes “design excellence” via output specifications.
Private sector will focus on meeting the output specifications while achieving lowest cost, which may impact the long term quality and maintainability of the project.
4
5.3.2 Value, Cost and Schedule Factors 5.3.2.1 Competition
Competition measures the relative ability of the procurement option to maximize private sector engagement and drive competition among proponents to achieve project goals with the best proposal.
Procurement Option Considerations Score
Design Bid Build (DBB) Scale of project would attract interest from numerous regional and national
firms. Market sounding participants indicated that interest was not tied to a particular delivery model.
3
Design Build (DB)
Please refer to considerations listed under DBB. Market sounding found potential private sector partners had strong desire
to compete by providing innovative solutions, which can be encouraged via DB procurement.
Market sounding participants recommended early contractor involvement, which is inherent in DB.
4
Construction Manager/General Contractor (CM/GC)
Please refer to considerations listed under DBB. Market sounding participants recommended early contractor involvement,
which is a key feature of the CM/GC process. Market sounding found potential private sector partners had strong desire
to provide innovative solutions, which can be realized in the collaborative environment of the CM/GC delivery model.
3
Build Finance (BF) Please refer to considerations listed under DBB. 4
Design Build Finance (DBF) Please refer to considerations listed under DB. DBF model may also attract international players based on project size and
scope. 5
HIGH MED LOW
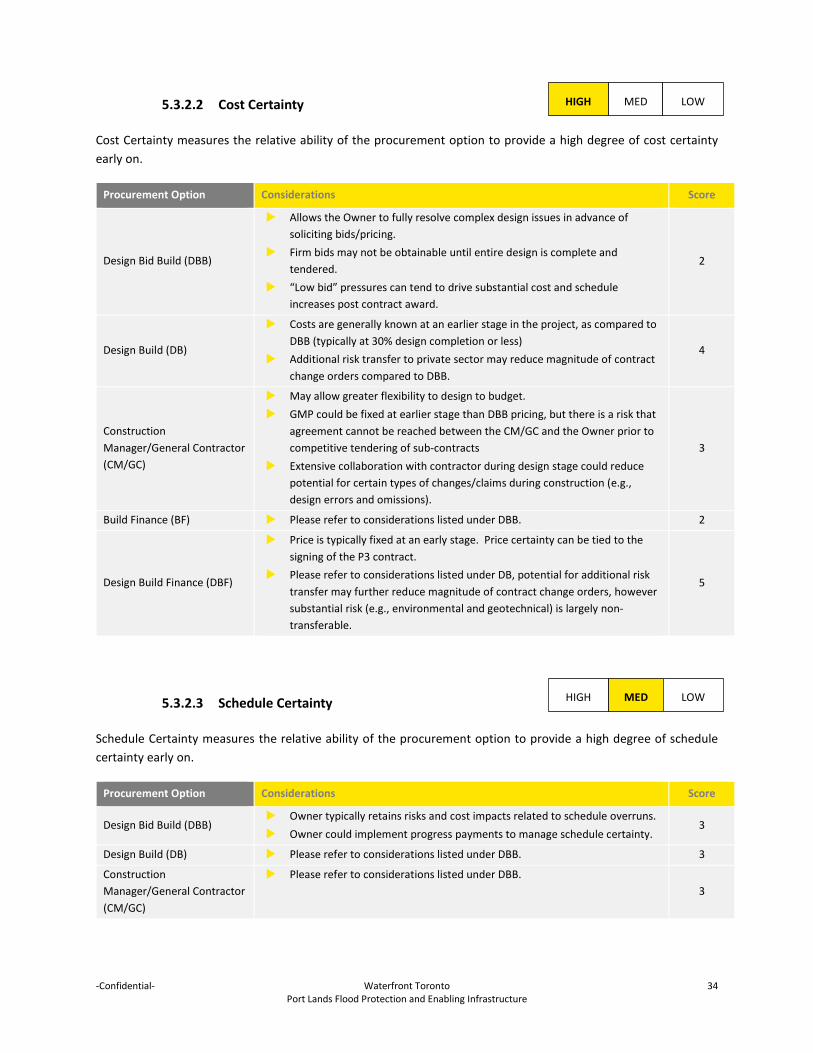
-Confidential- Waterfront Toronto 34 Port Lands Flood Protection and Enabling Infrastructure
5.3.2.2 Cost Certainty
Cost Certainty measures the relative ability of the procurement option to provide a high degree of cost certainty early on.
Procurement Option Considerations Score
Design Bid Build (DBB)
Allows the Owner to fully resolve complex design issues in advance of soliciting bids/pricing.
Firm bids may not be obtainable until entire design is complete and tendered.
“Low bid” pressures can tend to drive substantial cost and schedule increases post contract award.
2
Design Build (DB)
Costs are generally known at an earlier stage in the project, as compared to DBB (typically at 30% design completion or less)
Additional risk transfer to private sector may reduce magnitude of contract change orders compared to DBB.
4
Construction Manager/General Contractor (CM/GC)
May allow greater flexibility to design to budget. GMP could be fixed at earlier stage than DBB pricing, but there is a risk that
agreement cannot be reached between the CM/GC and the Owner prior to competitive tendering of sub-contracts
Extensive collaboration with contractor during design stage could reduce potential for certain types of changes/claims during construction (e.g., design errors and omissions).
3
Build Finance (BF) Please refer to considerations listed under DBB. 2
Design Build Finance (DBF)
Price is typically fixed at an early stage. Price certainty can be tied to the signing of the P3 contract.
Please refer to considerations listed under DB, potential for additional risk transfer may further reduce magnitude of contract change orders, however substantial risk (e.g., environmental and geotechnical) is largely non-transferable.
5
5.3.2.3 Schedule Certainty
Schedule Certainty measures the relative ability of the procurement option to provide a high degree of schedule certainty early on.
Procurement Option Considerations Score
Design Bid Build (DBB) Owner typically retains risks and cost impacts related to schedule overruns. Owner could implement progress payments to manage schedule certainty.
3
Design Build (DB) Please refer to considerations listed under DBB. 3
Construction Manager/General Contractor (CM/GC)
Please refer to considerations listed under DBB. 3
HIGH MED LOW
HIGH MED LOW

-Confidential- Waterfront Toronto 35 Port Lands Flood Protection and Enabling Infrastructure
Procurement Option Considerations Score
Build Finance (BF) Under a P3 model, the contractor has greater incentive to maintain
construction schedule, as risks related to schedule certainty are typically transferred to contractor.
4
Design Build Finance (DBF) Please refer to considerations listed under DB. 5
5.3.2.4 Funding Expenditure Timing
Funding Expenditure Timing measures the relative ability of the procurement option to align required expenditures with timing constraints for government funding.
Procurement Option Considerations Score
Design Bid Build (DBB) Owner required to make progress payments as work is completed. 2
Design Build (DB) Please refer to considerations listed under DBB. 2
Construction Manager/General Contractor (CM/GC)
Please refer to considerations listed under DBB/DB. 2
Build Finance (BF) Finance component allows more or all of the Owner’s payments to the
private sector to be deferred until substantial completion. 5
Design Build Finance (DBF) Please refer to considerations listed under BF. 5
5.3.2.5 Time to Deliver Project
Time to Deliver Project measures the relative ability of the procurement option to deliver functional flood protection as early as possible, either through accelerating delivery or accommodating early construction start or some combination.
Procurement Option Considerations Score
Design Bid Build (DBB) Design and construction must be performed sequentially. Limited ability to build in effective contractual incentives for on-time
completion. 1
Design Build (DB) Overall project schedules can be compressed through some concurrent
design and construction. 2
Construction Manager/General Contractor (CM/GC)
Early contractor involvement helps to achieve schedule goals of the project. Optimal phasing can be considered during the design process and work prioritized accordingly.
Overall project schedules can be compressed through some concurrent design and construction.
4
Build Finance (BF) Please refer to considerations listed under DBB, but lender oversight may
result in additional pressure on constructor to achieve timely completion. 1
Design Build Finance (DBF) Please refer to considerations listed under DB, but lender oversight may
result in additional pressure on designers and constructor to promptly resolve issues and to achieve timely completion.
4
HIGH MED LOW
HIGH MED LOW

-Confidential- Waterfront Toronto 36 Port Lands Flood Protection and Enabling Infrastructure
5.3.2.6 Risk Transfer/Management
Risk Transfer/Management measures the relative ability of the procurement option to appropriately transfer cost/schedule/environmental and other risks from the public to the private sector and to support effective management of residual risk remaining with the public sector.
Procurement Option Considerations Score
Design Bid Build (DBB)
Majority of risks retained by Owner. Requires that most design-related and third party risks be resolved prior to
procurement to avoid costly contractor contingency pricing and magnitude of potential change orders and claims.
1
Design Build (DB)
Greater opportunity for risk transfer possible owing to integration of design and construction responsibilities in a single contract.
Risks allocated to design-builder must be well-defined to minimize contingency pricing of risks.
3
Construction Manager/General Contractor(CM/GC)
Opportunity for parties to discuss, negotiate, allocate, and share risks as the project team collaborates to eliminate or mitigate risk to the extent possible.
Combination of Owner-controlled design and early team formation involving the contractor provides a forum for identifying and minimizing risk, particularly risk associated with innovative and complex design and construction.
May enable risks that are hard to define or quantify up front to be addressed prior to fixing price. Facilitates risk allocation to party best able to manage.
2
Build Finance (BF) Please refer to considerations listed under DB. 2
Design Build Finance (DBF)
Commercially confidential meetings provide forum to discuss proposed risk allocation with short-listed proponents during the procurement period.
Reliance on lender agreements/oversight to ensure appropriate level of risk management effort on the part of the private sector designers and constructor.
Owner will require sufficient capability/resources within its own team to effect appropriate management of retained risk.
4
HIGH MED LOW

-Confidential- Waterfront Toronto 37 Port Lands Flood Protection and Enabling Infrastructure
5.3.3 Project Delivery Factors 5.3.3.1 Interface Coordination and Flexibility
Measures the relative flexibility of the procurement option in terms of facilitating coordination/integration with adjacent major projects and accommodating adjustments to scope or functional requirements as may be needed to achieve such integration and/or keep final costs within budget.
Procurement Option Considerations Score
Design Bid Build (DBB)
As entire design phase is under the control of the Owner, there is a longer period of time available for resolving interface issues and making adjustments to contract documents before scope and price need to be locked down.
3
Design Build (DB) Integrated team has potential to respond more nimbly to accommodate
changed Owner requirements. 2
Construction Manager/General Contractor (CM/GC)
Facilitates designer, constructor, and Owner collaboration and allows for early team engagement with design/delivery teams for adjacent projects for increased likelihood of innovative joint solutions to interface issues.
Increased flexibility to design to budget compared with DBB or DB.
4
Build Finance (BF) Please refer to considerations listed under DBB. Need to consider provisions of lender’s agreement when negotiating
potentially material changes to scope or requirements. 2
Design Build Finance (DBF)
Method designed to minimize changes and predicated on Owner’s ability to generate comprehensive performance specifications up front.
Need to consider provisions of lender’s agreement when negotiating potentially material changes to scope or requirements
2
5.3.3.2 Legal Considerations/Precedent Projects
Measures the relative ability of the procurement option to minimize complexity of required legal agreements and to build on existing market precedent.
Procurement Option Considerations Score
Design Bid Build (DBB)
Owner enters into independent contracts for design and construction. Designers and constructors in turn enter into contracts with sub-consultants and sub-contractors.
Well-established and tested forms of contract available. Prescriptive specifications and reference standards readily available for
most components of work.
5
Design Build (DB)
Similar level of complexity to DBB in terms of overall contractual arrangements.
Precedent performance specifications available for some components of work.
2
HIGH MED LOW
HIGH MED LOW
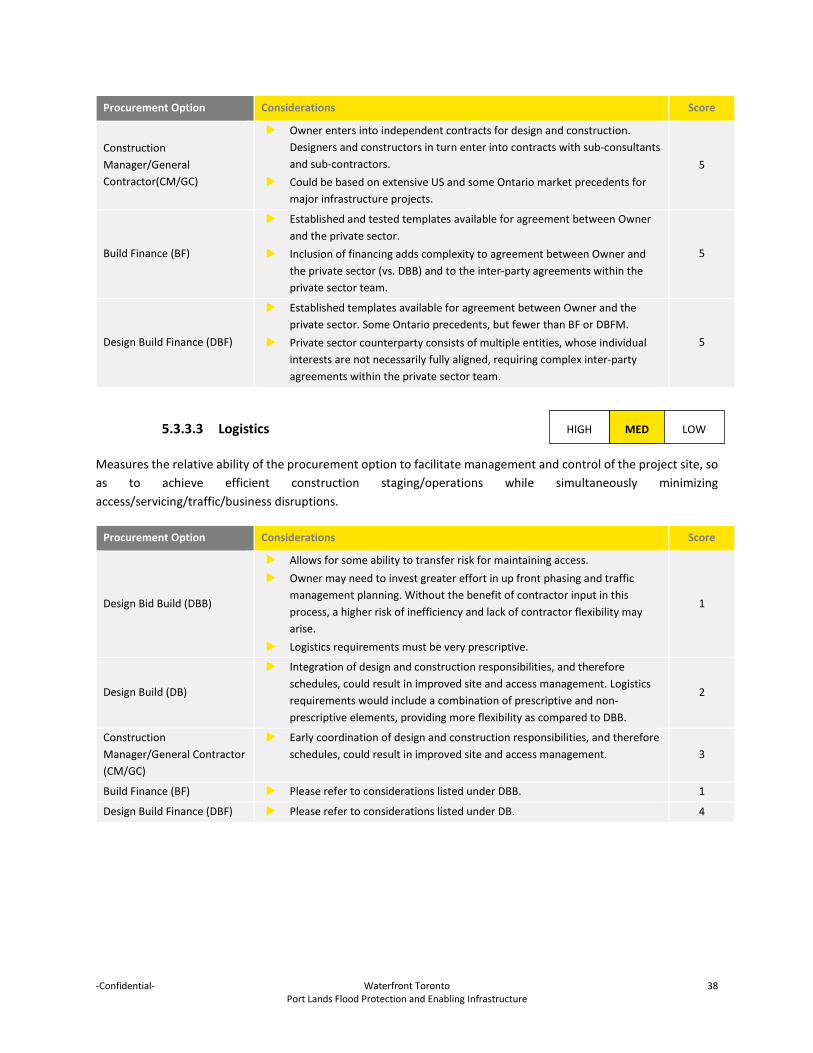
-Confidential- Waterfront Toronto 38 Port Lands Flood Protection and Enabling Infrastructure
Procurement Option Considerations Score
Construction Manager/General Contractor(CM/GC)
Owner enters into independent contracts for design and construction. Designers and constructors in turn enter into contracts with sub-consultants and sub-contractors.
Could be based on extensive US and some Ontario market precedents for major infrastructure projects.
5
Build Finance (BF)
Established and tested templates available for agreement between Owner and the private sector.
Inclusion of financing adds complexity to agreement between Owner and the private sector (vs. DBB) and to the inter-party agreements within the private sector team.
5
Design Build Finance (DBF)
Established templates available for agreement between Owner and the private sector. Some Ontario precedents, but fewer than BF or DBFM.
Private sector counterparty consists of multiple entities, whose individual interests are not necessarily fully aligned, requiring complex inter-party agreements within the private sector team.
5
5.3.3.3 Logistics
Measures the relative ability of the procurement option to facilitate management and control of the project site, so as to achieve efficient construction staging/operations while simultaneously minimizing access/servicing/traffic/business disruptions.
Procurement Option Considerations Score
Design Bid Build (DBB)
Allows for some ability to transfer risk for maintaining access. Owner may need to invest greater effort in up front phasing and traffic
management planning. Without the benefit of contractor input in this process, a higher risk of inefficiency and lack of contractor flexibility may arise.
Logistics requirements must be very prescriptive.
1
Design Build (DB)
Integration of design and construction responsibilities, and therefore schedules, could result in improved site and access management. Logistics requirements would include a combination of prescriptive and non-prescriptive elements, providing more flexibility as compared to DBB.
2
Construction Manager/General Contractor (CM/GC)
Early coordination of design and construction responsibilities, and therefore schedules, could result in improved site and access management. 3
Build Finance (BF) Please refer to considerations listed under DBB. 1
Design Build Finance (DBF) Please refer to considerations listed under DB. 4
HIGH MED LOW

-Confidential- Waterfront Toronto 39 Port Lands Flood Protection and Enabling Infrastructure
5.3.3.4 Collaboration
Measures the relative ability of the procurement option to focus contracting parties on constructive problem-solving in the best interest of the project and to limit non-productive, adversarial interaction.
Procurement Option Considerations Score
Design Bid Build (DBB) Separate contracts with independent designers and constructors coupled
with “low-bid” pressures can lead to adversarial working relationships and greater likelihood of disputes.
1
Design Build (DB)
Collaboration between designer and constructor is incentivized, but typically less opportunity for meaningful Owner collaboration.
Owner must assemble technical oversight team that mirrors capabilities of private sector team.
Contract documents can spell out regime for greater collaboration between Owner and private sector (e.g. Nijmigen example).
2
Construction Manager/General Contractor (CM/GC)
Early retention and alignment of team members usually creates a more collaborative, less adversarial work environment.
Facilitates Owner involvement and timely decision-making. 3
Build Finance (BF) Please refer to considerations listed under DBB. 1
Design Build Finance (DBF)
Typically, the DBF process includes technical and financial commercially confidential meetings (“CCMs”) which allow for the bidders and Project Sponsor to discuss, revise and amend (where required) tender and Project documentation.
4
HIGH MED LOW
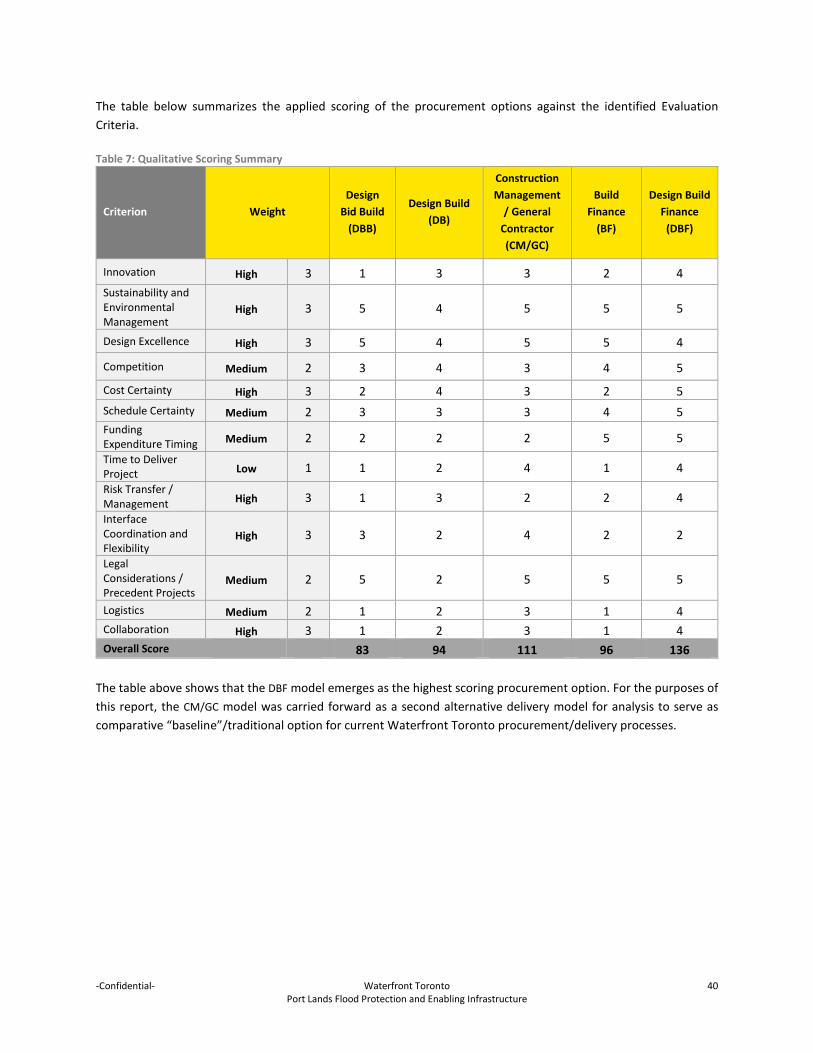
-Confidential- Waterfront Toronto 40 Port Lands Flood Protection and Enabling Infrastructure
The table below summarizes the applied scoring of the procurement options against the identified Evaluation Criteria. Table 7: Qualitative Scoring Summary
Criterion Weight Design
Bid Build (DBB)
Design Build (DB)
Construction Management
/ General Contractor (CM/GC)
Build Finance
(BF)
Design Build Finance
(DBF)
Innovation High 3 1 3 3 2 4 Sustainability and Environmental Management
High 3 5 4 5 5 5
Design Excellence High 3 5 4 5 5 4
Competition Medium 2 3 4 3 4 5
Cost Certainty High 3 2 4 3 2 5 Schedule Certainty Medium 2 3 3 3 4 5 Funding Expenditure Timing Medium 2 2 2 2 5 5 Time to Deliver Project Low 1 1 2 4 1 4 Risk Transfer / Management High 3 1 3 2 2 4 Interface Coordination and Flexibility
High 3 3 2 4 2 2
Legal Considerations / Precedent Projects
Medium 2 5 2 5 5 5
Logistics Medium 2 1 2 3 1 4 Collaboration High 3 1 2 3 1 4 Overall Score 83 94 111 96 136
The table above shows that the DBF model emerges as the highest scoring procurement option. For the purposes of this report, the CM/GC model was carried forward as a second alternative delivery model for analysis to serve as comparative “baseline”/traditional option for current Waterfront Toronto procurement/delivery processes.

-Confidential- Waterfront Toronto 41 Port Lands Flood Protection and Enabling Infrastructure
6. Quantitative Assessment
The purpose of this section of the Report is to summarize the methodology, analysis and results of the detailed quantitative analysis carried out on the short-listed procurement options brought forward from the qualitative analysis – DBB and DBF.
6.1 Value for Money Methodology Value-for-money (“VFM”) is expressed quantitatively as the difference in cost of delivering an infrastructure project using the traditional public sector project procurement model and an alternative delivery model. In the case of the Project, the comparative “traditional” model is assumed to be CM/GC (based on the results of the qualitative analysis and Waterfront Toronto past practice for larger scale municipal infrastructure projects) and the alternative delivery model for consideration is the DBF model. The VFM analysis involves a detailed quantitative assessment of the two (2) procurement options, CM/GC and DBF, with the objective to assess whether the DBF procurement model is likely to achieve greater VFM to the public as compared to the CM/GC procurement model. The methodology for determining VFM for this Project is based on the Infrastructure Ontario VFM methodology. This involves establishing a period by period cash-flow profile for each of the procurement options based on procuring the Project on a “like for like” basis (i.e., assuming consistent timeline,
project scope, etc.)2. For this Project, a consolidated comparative financial model was developed. The financial model
was used to assess VFM by comparing CM/GC delivery to the DBF delivery option. The DBF Model examines Project costs from the start of construction up to the end of construction. The model excludes the long term operations and maintenance components. For the DBF Model, nominal construction cash-flows for each delivery option, CM/GC and DBF, are compared at the substantial completion date or construction completion. The total Project cost is calculated as the sum of the nominal costs during the construction phase, including all relevant financing costs and P3 ancillary costs. The VFM analysis also includes an assessment of risk that is retained by the public sector under each delivery model. This quantified retained risk is added to the cost of each procurement option and then the risk adjusted totals are compared to calculate the VFM using the following formula:
VFM = Nominal ValueCM/GC – Nominal ValueDBF
6.2 Project Costs Preliminary base construction costs for the Project’s Core Scope (as illustrated in Figure 1) have been estimated by Hanscomb. The construction spend profile was developed by HDR based on loading the project schedule with Hanscomb’s component cost estimates. . It should be noted that these estimates exclude contingencies, as a separate probabilistic cost and schedule risk analysis is being undertaken by HDR to support the calculation of an appropriate contingency. Table 8 below summarizes the base case project costs for the core scope of work under the alternative procurement options.
2 The actual timelines for CM/GC and DBF delivery are expected to differ. The project schedule has been developed by Waterfront Toronto based on CM/GC delivery, however, additional up front work would be needed before financial close and the start of construction could occur under a DBF model.

-Confidential- Waterfront Toronto 42 Port Lands Flood Protection and Enabling Infrastructure
A 7.5% Innovation Factor3 adjustment is typically applied to recognize that the base cost under a DBF model is likely to be lower than under a CM/GC model as a result of using output based specifications in DBF projects allowing bidders to optimize the design of the asset and to more effectively integrate design and construction. For the purposes of this analysis, it has been assumed equal net savings due to innovation can be realized when comparing DBF delivery to the CM/GC option. To align the base construction costs of the CM/GC and DBF models, the 7.5%
innovation factor was deducted from the base DBF costs.4 Table 8: Project Cost Assumptions
Project Cost Assumptions
CM/GC DBF
$M $M Project Construction Costs (Nominal) (Nominal)
Base Construction Costs (excluding contingency) 628.93 628.93
Design & Engineering (8%) 50.31 50.31
Construction Costs (Excl. Innovation Factor) 679.24 679.24
Innovation Factor (7.5% deducted from DBF Base Costs) N/A -50.94
Total Construction Costs 679.24 628.30
Other Costs
Transaction Costs (Upfront) 0.50 20.00
Management Costs 22.18 13.68
Total Other Costs 22.68 33.68
6.3 Risk Assessment This section sets out the methodology for estimating the approximate value of risks retained by Waterfront Toronto, transferred to a third party or shared between the parties under each of the highest-ranked P3 and conventional public sector procurement options, as short-listed by the qualitative analysis.
6.3.1 Risk Assessment and Quantification The fundamental principle underlying the VFM analysis is the appropriate allocation of risk between the public and private sectors. The foundation for risk allocation is based on the premise that the party which is able to manage a given risk most efficiently (i.e. at the lowest cost) should assume that risk. Once the identified risks have been quantified, their value (i.e. the expected cost of these risks) is incorporated into the project cash flows in order to compare the procurement models on a risk-adjusted basis. The CM/GC and DBF procurement options being considered for the Project each come with their own inherent risks. In order to quantify the value of risk in the Project under the procurement options, a risk workshop was conducted. This section sets out the methodology adopted and the results from the process.
3 Innovation in this context refers to cost efficiencies or savings resulting from novel approaches or solutions presented by bidders. 4 The innovation factor is based on the Infrastructure Ontario methodology. An innovation factor of 7.5% is applied to DBF projects, while an innovation factor of 12% is typically applied to DBFM or DBFOM projects.

-Confidential- Waterfront Toronto 43 Port Lands Flood Protection and Enabling Infrastructure
6.3.1.1 Overview of the Risk Quantification Process
The process to estimate the risks in the Project under the procurement options is summarized in the diagram below:
Figure 2: Risk Quantification Process
6.3.1.2 Risk Identification and Preliminary Risk Assessment
The Project is unique in its size, scope and complexity. For these reasons, there was not an existing “template” risk matrix which could be easily adapted to the needs of the Project. A base risk matrix was developed based on conservative estimates from several standard IO DBF risk matrices as developed by Altus Group Ltd. and MMM Group, along with consideration to Project risks identified by HDR through the risk sessions previously conducted.
Standard DBF risk matrices represented a spectrum of asset classes from social to civil infrastructure that were refreshed by IO in 2015 following review by the Auditor General;
Conservative probability and impact figures were drawn for all risks carried over from the standard risk matrices for both DBF and CM/GC models;
Additional project-specific risks were added to the base risk matrix for consideration based on the HDR Project risks identified. These Project-specific risks were discussed for applicability during the risk workshop.
Base values for risk probabilities and impacts were determined by taking the average of the most conservative estimates (i.e. highest likelihood of occurrence and highest potential impacts) across the comparable project risk matrices.
This base risk matrix was intended to act as starting point for the Project risk assessment and was slightly amended based on Project-specific information through a risk workshop.
Risk Identification
Ensure a complete list of all major project risks
Risk Quantification
Estimate the likelihood (in percentage terms) of each risk materializing and the impact of the risk if it were to occur
Risk allocation
Allocate risks to the party (Owner or Project Co) best able to manage it
Risk Matrix
Risk Modelling
Risk Adjustment to each Procurement Option(Expected Value, 90% Confidence Interval and 10% Confidence Interval)

-Confidential- Waterfront Toronto 44 Port Lands Flood Protection and Enabling Infrastructure
6.3.1.3 Risk Quantification
A risk workshop was held on February 25, 2016 for further discussion and amendment to the template risk matrix. For each risk identified for further discussion by risk workshop participants, consensus was to be achieved on the following:
Probability of the likely occurrence of the risk; If the risk was to materialize, a best case, worst case and most likely case of financial impact. The allocation
of the risk between the public and private sector under each procurement model (e.g., transferred to the private sector, retained by the public sector, or shared5 between).
For the purposes of this analysis, the best-case impact would be the financial impact that would be exceeded in 90% of occurrences. The worst-case impact would be exceeded in only 10% of occurrences. In this manner, the three (3) data points for each risk can be used to define a triangular distribution with the best-case impact defining the 10th percentile, the most likely impact defining the mode, and the worst-case impact defining the 90th percentile.
6.3.1.4 Risk Allocation
During the risk workshop, the expected allocation of each risk to either the contracting entity or public sector under each procurement option was also discussed and agreed upon for each option. The table below notes the allocation applied to each of the identified risks under the CM/GC and DBF.
Risk # Risk Name Risk Allocation
DBF CM/GC
1. Policy / Strategy
1.01 Government Approvals for Project Retained Retained
1.02 Government Funding Retained Retained
1.03 Project Schedule Retained Retained
2. Transaction and Tender Process
2.01 Due Diligence (by the owner in preparation of tender in RFP) Shared Retained
2.02 Tendering Competition Retained Retained
2.03 Delays in Contract Award/Financial Close Shared Retained
2.04 Termination prior to Contract Award/Financial Close Retained Retained
3. Project Agreement
3.01 Ambiguities In Legal Agreements Shared Shared
3.02 Termination For Convenience During Construction Retained Retained
4. Design
5 For the purposes of the risk quantification exercise, shared risks were assumed to be shared equally (50% of risk retained by public sector, 50% of risk transferred to private sector).

-Confidential- Waterfront Toronto 45 Port Lands Flood Protection and Enabling Infrastructure
Risk # Risk Name Risk Allocation
DBF CM/GC
4.01 Stakeholder Consultation Pre-Financial Close Retained Retained
4.02 Stakeholder Consultation - Post Financial Close and Tender Retained Retained
4.03 Scope Changes initiated by Owner During Design Retained Retained
4.04 Compliance with Codes and Standards - During Design Transferred Retained
5. Site Conditions / Environmental
5.01 Utility/Services Relocations Transferred Shared
5.02 Geotechnical Transferred Retained
5.03 Existing Contamination Shared Retained
5.04 Archaeological Shared Retained
5.05 EA Conditions of Approval Transferred Retained
6. Construction
6.01 Adverse Weather Conditions Transferred Shared
6.02 Construction Management Efficiency / Coordination Transferred Shared
6.03 Resource Availability - Labour, Materials, Equipment Transferred Shared
6.04 Resource Availability - Fill Materials Transferred Retained
6.05 Latent Defects Retained Retained
6.06 Default during Construction Transferred Retained
6.07 Scope Changes During Construction (directed by owner) Retained Retained
6.08 Schedule Adherence Transferred Retained
6.09 Quality Management Transferred Retained
7. Permits and Approvals
7.01 Regulatory Approvals Shared Retained
7.02 Implementation Approvals / Permits Transferred Shared
7.03 Title / Access / Title Encumbrances Retained Retained
8. Completion / Commissioning
8.01 Deficiencies Transferred Shared

-Confidential- Waterfront Toronto 46 Port Lands Flood Protection and Enabling Infrastructure
6.3.1.5 High Impact Risks
Participants from Waterfront Toronto, Infrastructure Ontario, TRCA, the City of Toronto and HDR focused the discussion on the high impact risks that had the greatest potential impact on the VFM outcome based on initial cost estimates. The risks discussed in detail during the risk workshops are described further in the table below.
Table 9: High-Impact Risks Discussed in Risk Workshop
Risk #
Risk Name Risk Definition
1.03 Project Schedule Risk of a longer baseline construction period, resulting in a higher total budgeted program cost.
2.01 Due Diligence (by the Owner in Preparation of Tender in RFP)
Risk that an insufficient level of due diligence is undertaken and communicated to Bidders resulting in reduced tolerance to risk and higher bid prices.
6.07 Scope Changes During Construction (Directed by Owner)
Risk that the scope of work is changed by the Owner during the construction period.
6.08 Schedule Adherence Risk associated with incurring schedule delays and either having to rush construction (quality risk) or add resources (cost risk) to achieve schedule completion.
6.09 Quality Management Risk associated with meeting design standards and codes as they relate to long term asset performance.
Following the risk workshop, EY captured all of the agreed-upon quantification parameters into an updated risk register. Placeholder figures were utilized for the cost base corresponding to each risk, pending completion of the updated cost estimates and schedule under development in parallel. Following completion of HDR’s draft Cost Risk Assessment report in mid-June 2016, the required cash flow and cost base data were supplied to EY by Waterfront Toronto. . A percentage factor was applied to each cost base to accommodate the Project scope elements related to specific risks, for example, a 15% factor was applied the design and construction cost base for Risk 5.04 (Archaeological). This 15% factor was applied to account for the fact the scope of this risk was limited to excavation work only. A final risk matrix is found in Appendix C.
6.3.1.6 Risk Modelling
A risk model was created using the information contained in the final agreed risk register. Specific software for risk modeling, @RISK, was used to perform a Monte Carlo simulation6 with this information. For each risk, the RiskTrigen (a function contained within the @RISK software) distribution was selected into which the values for best, expected and worst outcomes were input. The RiskTrigen distribution was selected as it provides for a triangular distribution defined by three points — one at the most likely value and two at the specified lower and upper percentiles. Given the level of accuracy associated with the inputs, using a more refined distribution model is considered unwarranted. The best and worst outcomes
6 A Monte Carlo analysis is a form of stochastic modeling used to evaluate a probability distribution by performing a simulation of the probability distribution over a large number of iterations (in the case of the feasibility analysis, 10,000). In performing the analysis the Monte Carlo simulation takes randomly selected variables across the range of the probability distribution to provide a range of potential values of the risk. The calculation is repeated a large number of times to obtain the distribution of the expected values of the risks. A sample of 10,000 iterations was used in the simulation to ensure that the results were not adversely impacted by any sampling bias.

-Confidential- Waterfront Toronto 47 Port Lands Flood Protection and Enabling Infrastructure
were set to represent the 10th and 90th percentiles along the RiskTrigen distribution. The objective of the Monte Carlo analysis is to estimate the likely or expected outcome of risks under both procurement models.
6.3.1.7 Risk Analysis Results
Table 10 below presents the expected value of the risk categories for each procurement option. These numbers are carried forward for inclusion in the preliminary VFM analysis within Section 6.4.
Table 10: Expected Value of Risk Expected Value of Risk
($M) CM/GC Risks during Construction 148.89 DBF Risks during Construction 76.65
6.4 Value-for-Money Assessment The results of the DBF procurement option VFM analysis are set out below in addition to sensitivity analysis performed on the results to assess how changes in key variables may affect the VFM achieved by the Project under this delivery option.
6.4.1 Financial Assumptions
The DBF financial model has been prepared as a monthly cash flow model. Cash flows were assumed to occur at the end of the period in which they are incurred. Each financial year was assumed to end on March 31, in line with the Waterfront Toronto’s fiscal year.
Table 11 and Table 12 below provide a summary of the timing and financial assumptions that apply to the Project under the DBF procurement option.
Table 11: Timing Assumptions Timing Assumptions
Date Financial Close Date 01-Apr-17
Design Start Date 01-Apr-17
Construction Start Date 01-Jan-18
Construction period in months 66
Substantial Completion Date 30-Sept-22
Future Value Date 01-Oct-22
Core scope construction period is anticipated to be 57 months (from the January 1, 2018 construction state date). The combined design and construction period (inclusive of the design period beginning in April 2017) is anticipated to total 66 months.

-Confidential- Waterfront Toronto 48 Port Lands Flood Protection and Enabling Infrastructure
Table 12: Financial Assumptions Financial Assumptions
Discount Rate 3.00%
Construction Inflation Rate 2.50%
CM/GC Financing Rate 2.00%
DBF Borrowing Rate 3.50%
DBF Upfront Fees 1.25%
DBF Commitment Fee 1.00%
The discount rate used in the DBF Model represents Waterfront Toronto’s short term cost of borrowing. The year-over-year inflation assumption was aligned with the City of Toronto’s current assumption and EY provided the short term financing assumptions based on recent projects in the market.
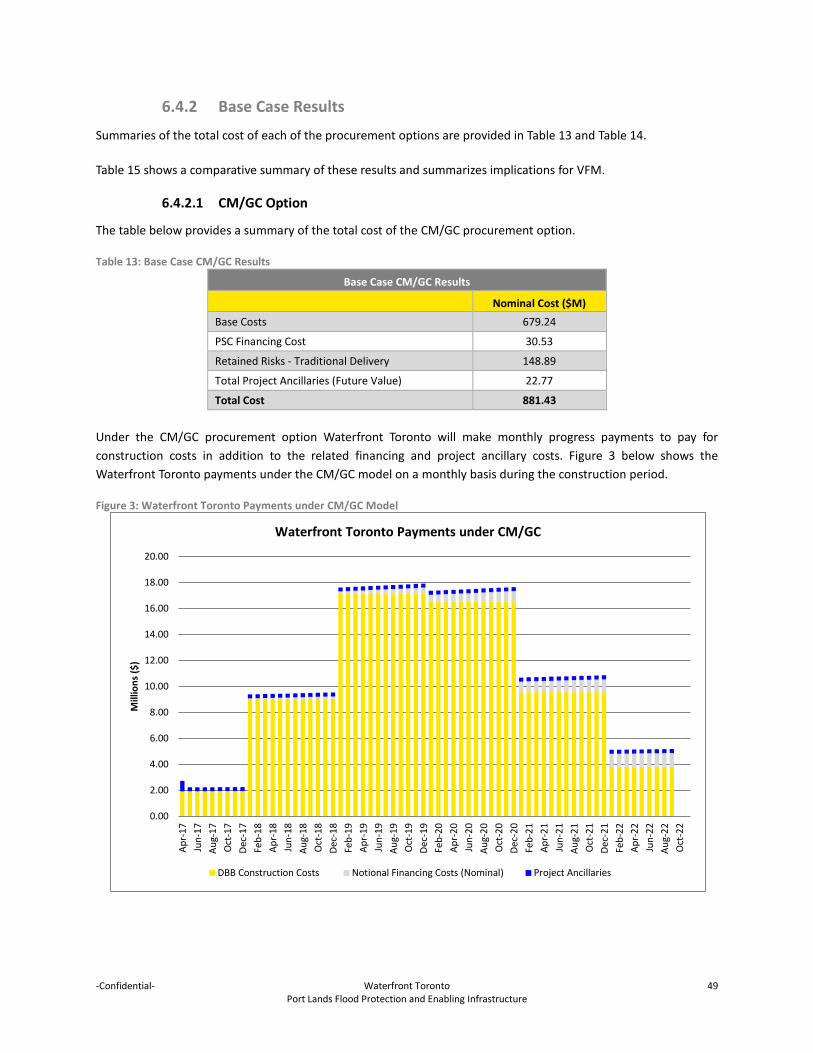
-Confidential- Waterfront Toronto 49 Port Lands Flood Protection and Enabling Infrastructure
6.4.2 Base Case Results
Summaries of the total cost of each of the procurement options are provided in Table 13 and Table 14.
Table 15 shows a comparative summary of these results and summarizes implications for VFM.
6.4.2.1 CM/GC Option
The table below provides a summary of the total cost of the CM/GC procurement option.
Table 13: Base Case CM/GC Results
Base Case CM/GC Results
Nominal Cost ($M) Base Costs 679.24
PSC Financing Cost 30.53
Retained Risks - Traditional Delivery 148.89
Total Project Ancillaries (Future Value) 22.77
Total Cost 881.43
Under the CM/GC procurement option Waterfront Toronto will make monthly progress payments to pay for construction costs in addition to the related financing and project ancillary costs. Figure 3 below shows the Waterfront Toronto payments under the CM/GC model on a monthly basis during the construction period.
Figure 3: Waterfront Toronto Payments under CM/GC Model
0.00
2.00
4.00
6.00
8.00
10.00
12.00
14.00
16.00
18.00
20.00
Apr-
17Ju
n-17
Aug-
17O
ct-1
7De
c-17
Feb-
18Ap
r-18
Jun-
18Au
g-18
Oct
-18
Dec-
18Fe
b-19
Apr-
19Ju
n-19
Aug-
19O
ct-1
9De
c-19
Feb-
20Ap
r-20
Jun-
20Au
g-20
Oct
-20
Dec-
20Fe
b-21
Apr-
21Ju
n-21
Aug-
21O
ct-2
1De
c-21
Feb-
22Ap
r-22
Jun-
22Au
g-22
Oct
-22
Mill
ions
($)
Waterfront Toronto Payments under CM/GC
DBB Construction Costs Notional Financing Costs (Nominal) Project Ancillaries
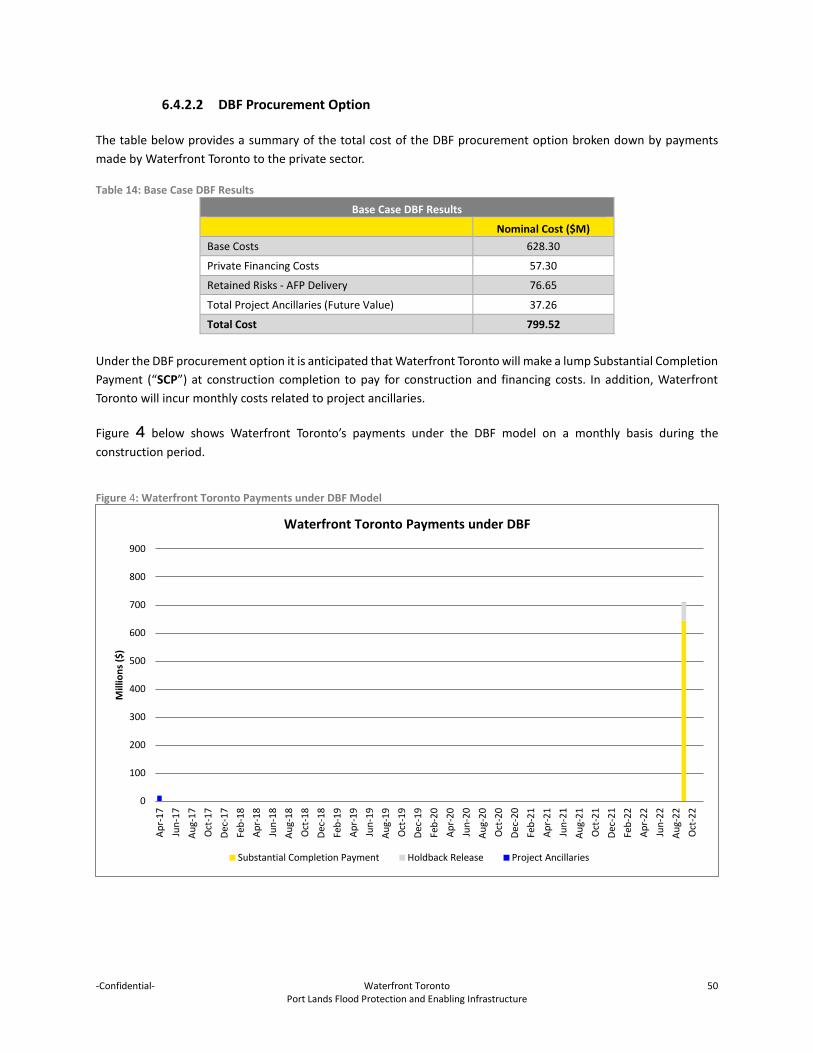
-Confidential- Waterfront Toronto 50 Port Lands Flood Protection and Enabling Infrastructure
6.4.2.2 DBF Procurement Option
The table below provides a summary of the total cost of the DBF procurement option broken down by payments made by Waterfront Toronto to the private sector.
Table 14: Base Case DBF Results
Base Case DBF Results
Nominal Cost ($M) Base Costs 628.30
Private Financing Costs 57.30
Retained Risks - AFP Delivery 76.65
Total Project Ancillaries (Future Value) 37.26
Total Cost 799.52
Under the DBF procurement option it is anticipated that Waterfront Toronto will make a lump Substantial Completion Payment (“SCP”) at construction completion to pay for construction and financing costs. In addition, Waterfront Toronto will incur monthly costs related to project ancillaries.
Figure 4 below shows Waterfront Toronto’s payments under the DBF model on a monthly basis during the construction period.
Figure 4: Waterfront Toronto Payments under DBF Model
0
100
200
300
400
500
600
700
800
900
Apr-
17Ju
n-17
Aug-
17O
ct-1
7De
c-17
Feb-
18Ap
r-18
Jun-
18Au
g-18
Oct
-18
Dec-
18Fe
b-19
Apr-
19Ju
n-19
Aug-
19O
ct-1
9De
c-19
Feb-
20Ap
r-20
Jun-
20Au
g-20
Oct
-20
Dec-
20Fe
b-21
Apr-
21Ju
n-21
Aug-
21O
ct-2
1De
c-21
Feb-
22Ap
r-22
Jun-
22Au
g-22
Oct
-22
Mill
ions
($)
Waterfront Toronto Payments under DBF
Substantial Completion Payment Holdback Release Project Ancillaries
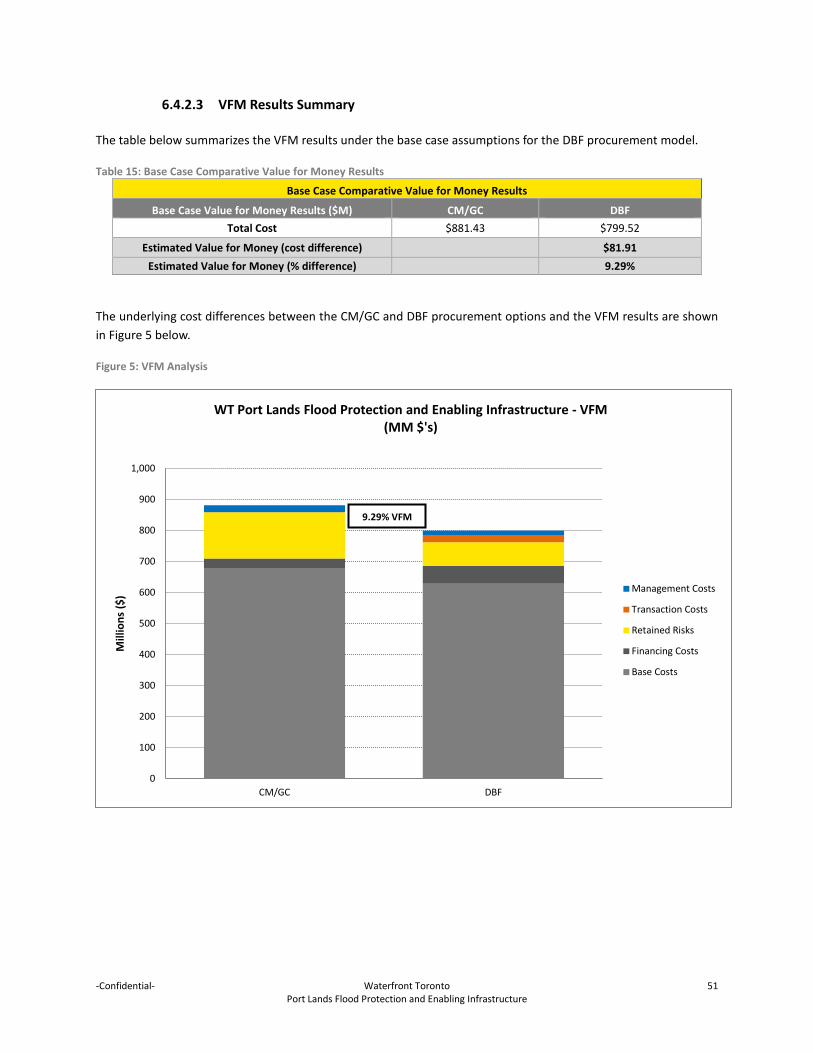
-Confidential- Waterfront Toronto 51 Port Lands Flood Protection and Enabling Infrastructure
6.4.2.3 VFM Results Summary
The table below summarizes the VFM results under the base case assumptions for the DBF procurement model.
Table 15: Base Case Comparative Value for Money Results
Base Case Comparative Value for Money Results
Base Case Value for Money Results ($M) CM/GC DBF Total Cost $881.43 $799.52
Estimated Value for Money (cost difference) $81.91 Estimated Value for Money (% difference) 9.29%
The underlying cost differences between the CM/GC and DBF procurement options and the VFM results are shown in Figure 5 below.
Figure 5: VFM Analysis
0
100
200
300
400
500
600
700
800
900
1,000
CM/GC DBF
Mill
ions
($)
WT Port Lands Flood Protection and Enabling Infrastructure - VFM (MM $'s)
Management Costs
Transaction Costs
Retained Risks
Financing Costs
Base Costs
9.29% VFM
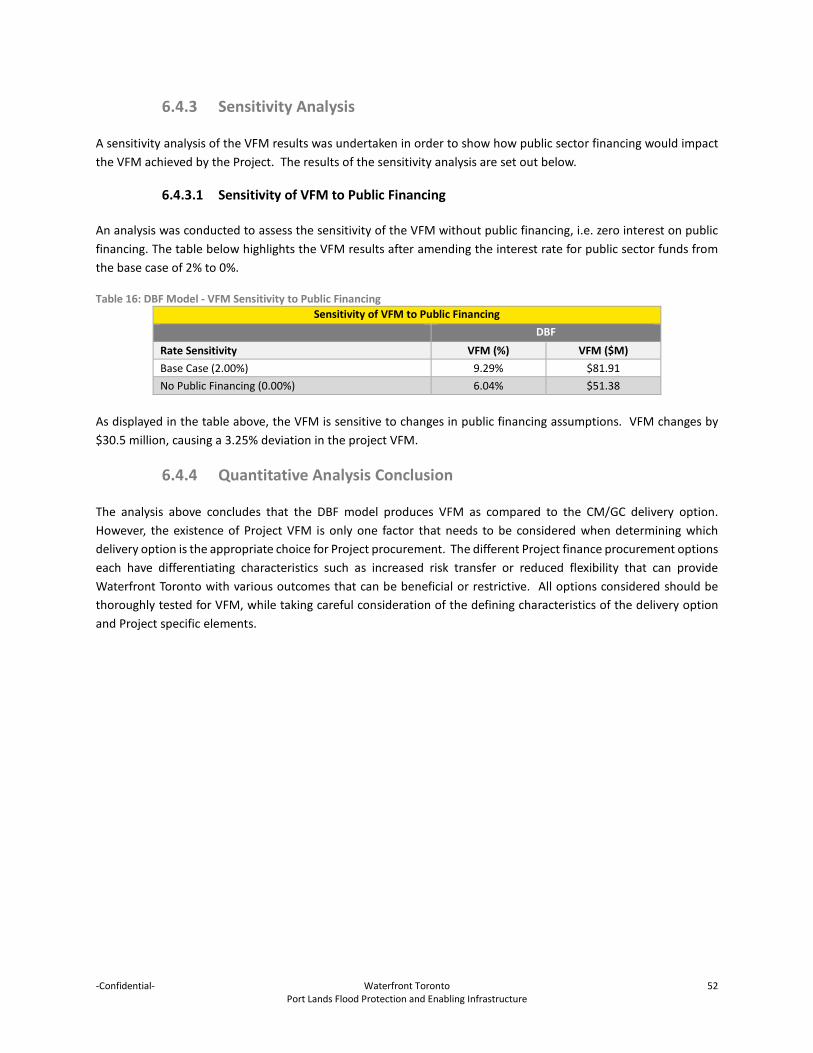
-Confidential- Waterfront Toronto 52 Port Lands Flood Protection and Enabling Infrastructure
6.4.3 Sensitivity Analysis
A sensitivity analysis of the VFM results was undertaken in order to show how public sector financing would impact the VFM achieved by the Project. The results of the sensitivity analysis are set out below.
6.4.3.1 Sensitivity of VFM to Public Financing
An analysis was conducted to assess the sensitivity of the VFM without public financing, i.e. zero interest on public financing. The table below highlights the VFM results after amending the interest rate for public sector funds from the base case of 2% to 0%.
Table 16: DBF Model - VFM Sensitivity to Public Financing Sensitivity of VFM to Public Financing
DBF Rate Sensitivity VFM (%) VFM ($M) Base Case (2.00%) 9.29% $81.91 No Public Financing (0.00%) 6.04% $51.38
As displayed in the table above, the VFM is sensitive to changes in public financing assumptions. VFM changes by $30.5 million, causing a 3.25% deviation in the project VFM.
6.4.4 Quantitative Analysis Conclusion
The analysis above concludes that the DBF model produces VFM as compared to the CM/GC delivery option. However, the existence of Project VFM is only one factor that needs to be considered when determining which delivery option is the appropriate choice for Project procurement. The different Project finance procurement options each have differentiating characteristics such as increased risk transfer or reduced flexibility that can provide Waterfront Toronto with various outcomes that can be beneficial or restrictive. All options considered should be thoroughly tested for VFM, while taking careful consideration of the defining characteristics of the delivery option and Project specific elements.
-Confidential- Waterfront Toronto 53 Port Lands Flood Protection and Enabling Infrastructure
7. Findings and Considerations
7.1 Summary of Findings
In reviewing the procurement options available to Waterfront Toronto, the qualitative analyses combined with the detailed quantitative analyses carried out on the short-listed procurement options yield integrated findings for the assessment of the optimal Project delivery model(s).
7.1.1 Qualitative Assessment and Market Sounding
The qualitative analysis was applied to the long-list of procurement options to determine which were most aligned with the project-specific criteria. The DBF procurement model yielded the highest comparative score. The CM/GC model, which received the second-highest score, was also carried forward through quantitative analyses and serves as a comparative “baseline”/traditional option for current Waterfront Toronto procurement/delivery processes.
In parallel to the qualitative analysis, feedback from the market sounding exercise showed interest in the Project, regardless of delivery model. It was also noted that maintenance scope would be too small to generate any long-term value, relative to Project capital size. Site related conditions, approvals and due diligence requirements were stressed as extremely important components for the delivery of the Project, regardless of the procurement option selected.
Overall, the Project was considered to be a very attractive opportunity for most market players, regardless of the delivery model selected.
7.1.2 Quantitative Analysis
The shortlisted CM/GC and DBF delivery options were further assessed through risk quantification and financial modelling exercises. These analyses were conducted based on costs and detailed information provided by Waterfront Toronto and its consultants.
The DBF model was compared with the traditional (CM/GC) model. The purpose of the quantitative analysis was to determine which delivery option would provide best value for money.
The DBF Model yielded 9.29% VFM savings as compared to the CM/GC model. While the DBF model emerges as offering the greatest value for money to Waterfront Toronto given the applied timing, cost and other assumptions, additional factors should be further considered by Waterfront Toronto in making a decision on the preferred procurement option for the Project.

-Confidential- Waterfront Toronto 54 Port Lands Flood Protection and Enabling Infrastructure
Appendix A: Market Sounding Participants
EY contacted seventeen (17) companies to request participation in the market sounding. Thirteen (13) companies participated in the market sounding, covering a wide array of Project roles, including lenders, construction companies, equity providers, technical and waste specialists.
Company Industry Sector Participated Declined No Response
Cintra / Ferrovial Developer / Constructor
ACS Infrastructure Canada Inc. / Dragados Canada
Developer / Constructor
SNC Developer
Borealis Equity Provider
Macquarie Equity Provider
Plenary Group Equity Provider
PCL Constructor
EllisDon Constructor
Carillion Constructor
Aecon Constructor
Dufferin Constructor
Scotia Bank Lender
BMO Lender
CIBC World Markets Inc. Lender
Waste Management Waste Specialist
GFL Environmental Corp. Waste Specialist
Sevenson Environmental, Services, Inc. Environmental
Remediation and DredgingSpecialist

-Confidential- Waterfront Toronto 55 Port Lands Flood Protection and Enabling Infrastructure
Appendix B: Market Sounding Information Package

Port Lands Flood Protection and Enabling Infrastructure
Market Sounding Information Brief

1 Confidential – All Rights Reserved
Contents
Page
Introduction 2
Project Description 5
Questions for Market Sounding Participants 9
Appendices
Appendix A Site and Project Description 12
Disclaimer
This document has been prepared on behalf of the Toronto Waterfront Revitalization Corporation (“Waterfront Toronto”) solely for the purposes of informing participants in the market sounding exercise (the “Participants”) regarding the Port Lands Flood Protection and Enabling Infrastructure Project.
This document is to be kept confidential by the Participants and those who they engage for this exercise and should not be quoted, referred to, or shown to any other parties unless so required by court order or a regulatory authority, or without the prior written approval of Waterfront Toronto.
This document does not, in any way, present or imply that a Project will materialize, or that a tender will be issued; nor should it be construed to present or imply any similar commitment on behalf of Waterfront Toronto, EY, their affiliates, associates or clients.

Section 1: Introduction

3 Confidential – All Rights Reserved
1. Introduction
Waterfront Toronto is interested in gauging the level of interest, capability, and capacity for delivering the Project under preferred project delivery method(s). As part of this process, EY is facilitating a market sounding exercise in order to:
Provide preliminary information regarding the Project to the market;
Assess the capability and appetite of the market to carry out the Project under different procurement alternatives; and
Obtain feedback to assist with the development of an efficient and effective procurement option.
A number of participants have been invited to provide feedback in this respect with representation from a number of key relevant sectors of the market including:
Equity sponsors and financial investors;
Construction companies;
Operation and maintenance providers; and
Financial institutions.
The purpose of this Market Sounding Information Brief (the “Brief”) is to provide invited participants with a background understanding of the Project and the key features of the Project relevant to the market sounding. The Brief is also intended to set out the key questions and areas of enquiry for which EY and Waterfront Toronto are seeking market feedback so that invited participants may have time to consider their responses prior to the market sounding interviews.
1.1 Background
The Port Lands Flood Protection and Enabling Infrastructure Project (the “Project”) is a comprehensive strategy for protecting the south east district of downtown Toronto – including parts of the Port Lands, South Riverdale, Leslieville, and the First Gulf/Unilever development site – from potential loss of life and costly flood damage associated with a major storm event. Working together over the past decade, Waterfront Toronto, Toronto and Region Conservation Authority (”TRCA”), and the City of Toronto have developed and refined a solution for flood protecting Toronto’s Port Lands and adjacent areas through the creation of a new, naturalized mouth for the Don River and other flood protection measures. Beyond these flood protection measures, the Project also includes the major municipal infrastructure that must be constructed, so as to maintain functional transportation and servicing networks, and the finishing of the floodplain and adjacent upland areas to provide new publicly-accessible green space and parks.
Waterfront Toronto, TRCA, the City of Toronto, and the Toronto Port Lands Company (“TPLC”) (the “Sponsors”) are currently in the midst of conducting a due diligence program and developing a detailed execution plan for the Project. This work includes completing a comprehensive procurement options analysis and establishing a project delivery strategy.
Ernst and Young Orenda Corporate Finance Inc. (“EY”) has been retained by Waterfront Toronto to assist in analyzing the viability of delivering all or part of the Project via a Public-Private Partnership (“P3”) approach, such as Infrastructure Ontario’s Alternative Financing and Procurement (“AFP”) model.
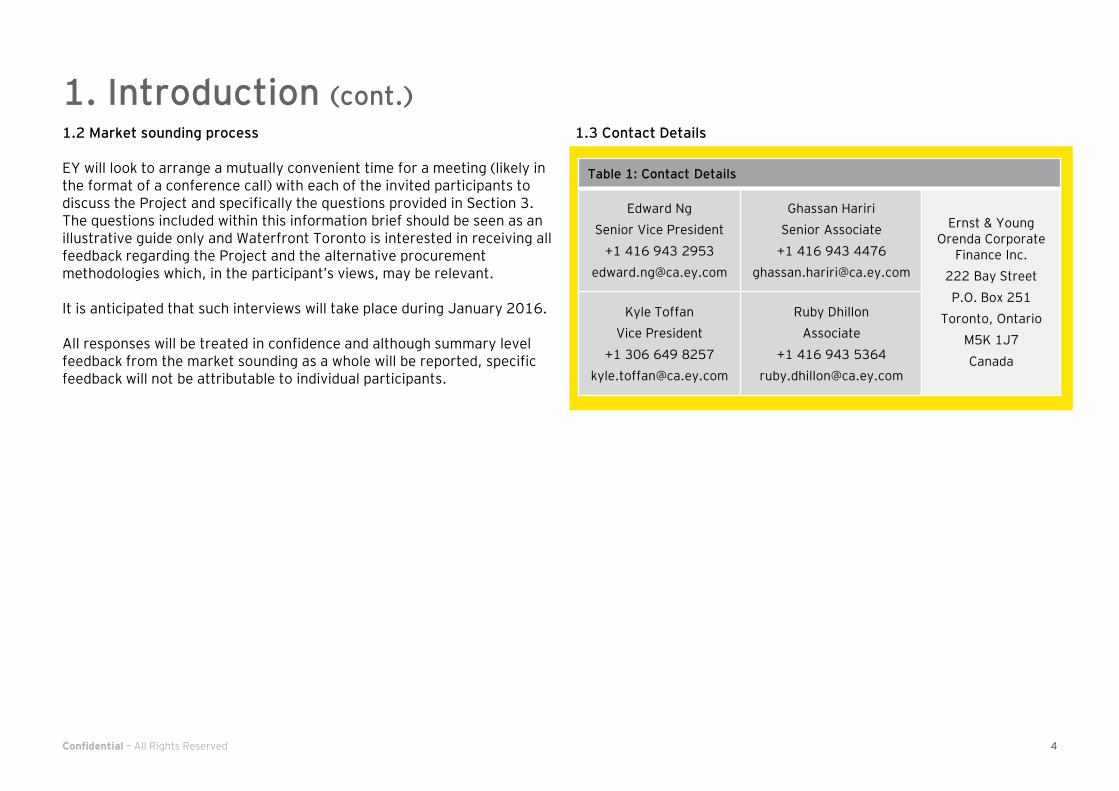
4 Confidential – All Rights Reserved
1. Introduction (cont.) 1.3 Contact Details 1.2 Market sounding process
EY will look to arrange a mutually convenient time for a meeting (likely in the format of a conference call) with each of the invited participants to discuss the Project and specifically the questions provided in Section 3. The questions included within this information brief should be seen as an illustrative guide only and Waterfront Toronto is interested in receiving all feedback regarding the Project and the alternative procurement methodologies which, in the participant’s views, may be relevant.
It is anticipated that such interviews will take place during January 2016.
All responses will be treated in confidence and although summary level feedback from the market sounding as a whole will be reported, specific feedback will not be attributable to individual participants.
Table 1: Contact Details
Edward Ng
Senior Vice President
+1 416 943 2953
Ghassan Hariri
Senior Associate
+1 416 943 4476
Ernst & Young Orenda Corporate
Finance Inc.
222 Bay Street
P.O. Box 251
Toronto, Ontario
M5K 1J7
Canada
Kyle Toffan
Vice President
+1 306 649 8257
Ruby Dhillon
Associate
+1 416 943 5364

Section 2: Project Description
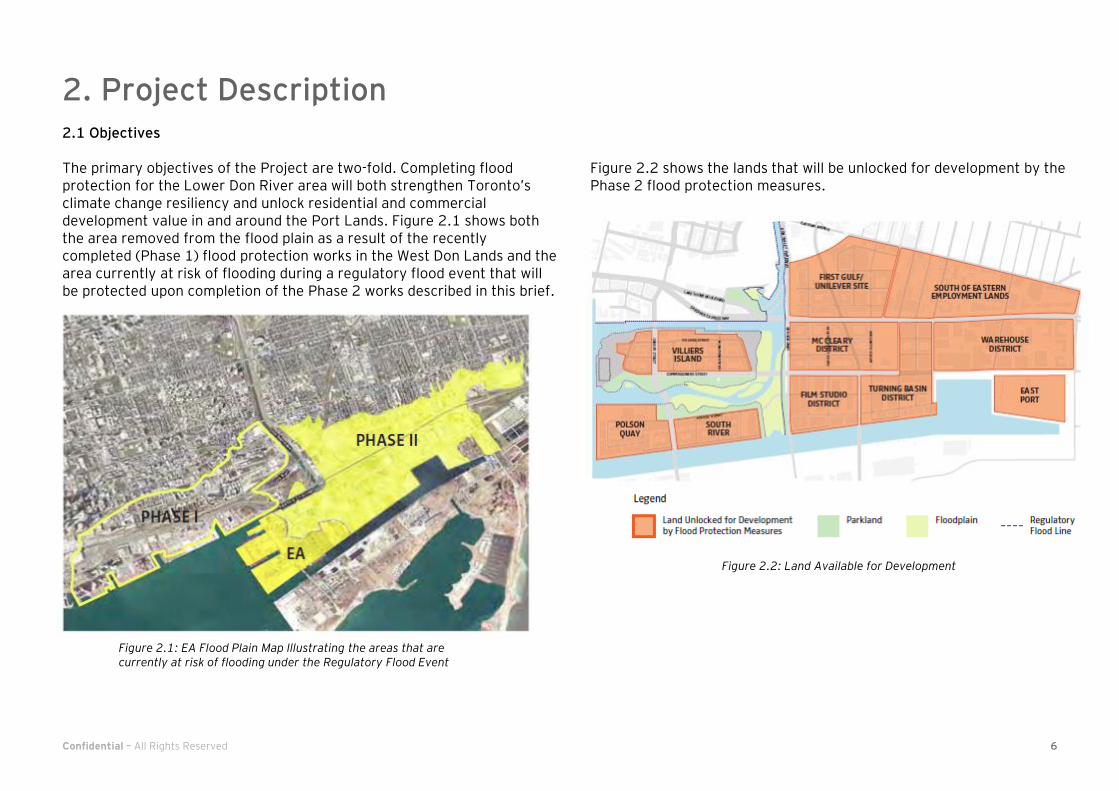
6 Confidential – All Rights Reserved
2. Project Description 2.1 Objectives
The primary objectives of the Project are two-fold. Completing flood protection for the Lower Don River area will both strengthen Toronto’s climate change resiliency and unlock residential and commercial development value in and around the Port Lands. Figure 2.1 shows both the area removed from the flood plain as a result of the recently completed (Phase 1) flood protection works in the West Don Lands and the area currently at risk of flooding during a regulatory flood event that will be protected upon completion of the Phase 2 works described in this brief.
Figure 2.2 shows the lands that will be unlocked for development by the Phase 2 flood protection measures.
Figure 2.1: EA Flood Plain Map Illustrating the areas that are currently at risk of flooding under the Regulatory Flood Event
Figure 2.2: Land Available for Development

7 Confidential – All Rights Reserved
2. Project Description (cont.)
2.2 Project Summary and Components
The Project encompasses flood protection infrastructure, marine works, parks and naturalized areas, and enabling municipal infrastructure (bridges, roads, and services) in the vicinity of the new flood protection works. Figure 2.3 shows the approximate Project boundaries and identifies the major Project components. “Deferred” components are currently outside the scope of the Project for construction and maintenance purposes, but may need to be considered during the design and approval phases. Please refer to Appendix A for further details regarding the Project site, in general, and the specific Project components that may form part of a future P3/AFP Procurement.
An estimated 1.2 million cubic metres of soil excavation and 1.1 million cubic metres of earth fill plus 0.4 million cubic metres of gravel, rock, and other specialized fill materials will be required to complete the Project. In keeping with Waterfront Toronto’s commitment to sustainability, a target of 85% soil re-use has been established.
WT and its partner organizations have been collaborating with the Ministry of the Environment and Climate Change (“MOECC”) to develop a feasible and mutually acceptable approach for the regulatory approval of this unique and complex Project. WT anticipates that the environmental management of the Project site will be effected using a combination of regulatory tools, which include a Community Based Risk Assessment (“CBRA”) process carried out in consultation with MOECC, and site-specific risk assessment (“RA”) processes that may be carried out under Ontario Regulation (O. Reg.) 153/04. The design and construction specifications for the Project will need to incorporate a variety of environmental risk management measures to address the current environmental condition of the site.
Figure 2.3: Project Boundaries and Major Project Components

8 Confidential – All Rights Reserved
2. Project Description (cont.)
2.2 Project Summary and Components (cont.)
The target date for Project completion is the end of 2023. The preliminary Project schedule contemplates construction of early works beginning in Spring 2017. (Note that the preliminary schedule assumes a traditional delivery model, as the analysis of alternative procurement options is still in progress. A detailed time line for a P3 procurement process has yet to be developed).
The indicative construction cost estimate for the full Project is in the range of $800 million.
2.3 Scope of Services
The potential scope of services that may be bundled into a P3/AFP Procurement includes, but is not limited to:
Design and construction of flood protection infrastructure, marine works, parks and naturalized areas, bridge structures, roads, and municipal services;
Maintenance and repair of flood protection infrastructure, including weir and dockwall structures, channel dredging, debris removal, and flood damage restoration; and
Maintenance of parks and trails, bridge structures, roads, and municipal services.
Further details on the site and Project descriptions are provided in Appendix A.

Section 3: Questions for Market Sounding Participants

10 Confidential – All Rights Reserved
Waterfront Toronto would like to receive feedback and views from the market in relation to the following aspects:
Project Scope and Characteristics
1. Are there particular components of the Project (as set out in Appendix A) that are more attractive from a market perspective?
2. What service elements of the Project would you like to see included within / excluded from the scope of work?
Design and construction of flood protection infrastructure, marine works, parks and naturalized areas, bridge structures, roads, and municipal services;
Maintenance and repair of flood protection infrastructure, including weir and dockwall structures, channel dredging, debris removal, and flood damage restoration; and
Maintenance of parks and trails, bridge structures, roads, and municipal services.
3. What are the other areas (e.g., Project components, related services, innovation, etc.) in which the private sector can add value to the Project?
4. Do you have any concerns with any aspects of the Project’s design, regulatory approval/permitting, or construction?
5. Do either the anticipated environmental/geotechnical site conditions or the regulatory approval process/requirements create any issues or risks for Project delivery? To what extent are these risks transferrable under a P3 project model?
Procurement
1. Would your preferred procurement option for this Project be traditional procurement (Design Bid Build or Design Build), P3 (DBF, DBFM, DBFOM),an alternative procurement route (please specify), or a hybrid approach?
2. Do you see any significant risks or challenges with procuring the Project (or specific Project components) under a P3 procurement?
3. Do you believe there is sufficient market capacity and appetite in the construction sector and in the maintenance sector to ensure sufficient competition for the Project?
4. What additional technical details regarding Project requirements or site conditions (e.g., geotechnical, early works, etc.) would you consider essential/beneficial for inclusion in P3/AFP procurement documentation?
5. Do you have any issues with the proposed indicative timetable ?
6. What would you see as the optimal timeframe, including any necessary pre-conditions for Project procurement?
3. Questions for Market Sounding Participants
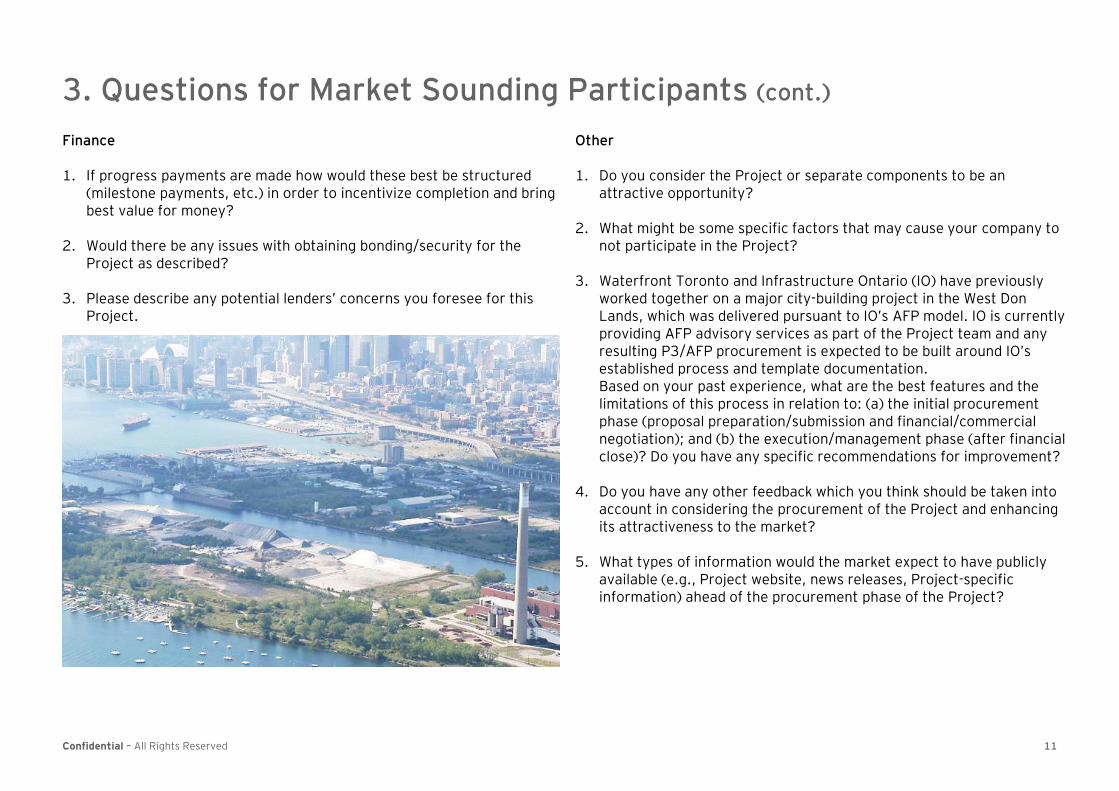
11 Confidential – All Rights Reserved
Finance
1. If progress payments are made how would these best be structured (milestone payments, etc.) in order to incentivize completion and bring best value for money?
2. Would there be any issues with obtaining bonding/security for the Project as described?
3. Please describe any potential lenders’ concerns you foresee for this Project.
Other
1. Do you consider the Project or separate components to be an attractive opportunity?
2. What might be some specific factors that may cause your company to not participate in the Project?
3. Waterfront Toronto and Infrastructure Ontario (IO) have previously worked together on a major city-building project in the West Don Lands, which was delivered pursuant to IO’s AFP model. IO is currently providing AFP advisory services as part of the Project team and any resulting P3/AFP procurement is expected to be built around IO’s established process and template documentation. Based on your past experience, what are the best features and the limitations of this process in relation to: (a) the initial procurement phase (proposal preparation/submission and financial/commercial negotiation); and (b) the execution/management phase (after financial close)? Do you have any specific recommendations for improvement?
4. Do you have any other feedback which you think should be taken into account in considering the procurement of the Project and enhancing its attractiveness to the market?
5. What types of information would the market expect to have publicly available (e.g., Project website, news releases, Project-specific information) ahead of the procurement phase of the Project?
3. Questions for Market Sounding Participants (cont.)

Appendix A: Site and Project Description

13 Confidential – All Rights Reserved
Site Characteristics
The site is located in the northwest quadrant of Toronto’s Port Lands. During construction, it will be necessary to maintain vehicular access to businesses and industry in the balance of the Port Lands, south and east of the site boundaries. WT is currently assessing the feasibility of accommodating existing business operations within the Villiers Island precinct during construction. Adjacent projects that may be under construction concurrently include the proposed reconfiguration of the ramps connecting the Gardiner Expressway and the Don Valley Parkway and the redevelopment of the First Gulf/Unilever site, east of the Lower Don River and north of Lake Shore Boulevard.
The native soils in the area generally consist of layers of poorly graded sand and silt, and extensive areas of peat, organic clays, and other compressible soils, overlain by one to five metres of debris, ash, coal, concrete, wood, brick, and other waste materials intermixed with imported soil (much of it dredged sediments). Much of the material to be excavated for the new river valley (described below) is expected to consist of loose or flowing native sands. A variety of chemical contaminants are present in the soil and groundwater, the most common of which are petroleum hydrocarbons such as oil, gas, and solvents. Typical bedrock depths range from ten (10) to 20 metres below the present ground surface.
Flood Protection Infrastructure and Marine Works
Indicative construction cost estimate, unescalated: $470-520 million (2015$)
This category of work encompasses earthwork (much of it below the water table), marine construction (rock containment structures, revetments, dredging, and construction/modification of dockwall and other concrete structures), and naturalization/habitat enhancement within the floodplain, in the lake, and at the water’s edge.
Anticipated excavation and fill depths across the site are shown in Figure A.1.
Appendix A: Site and Project Description
Figure A1: Anticipated Excavation and Fill Depths
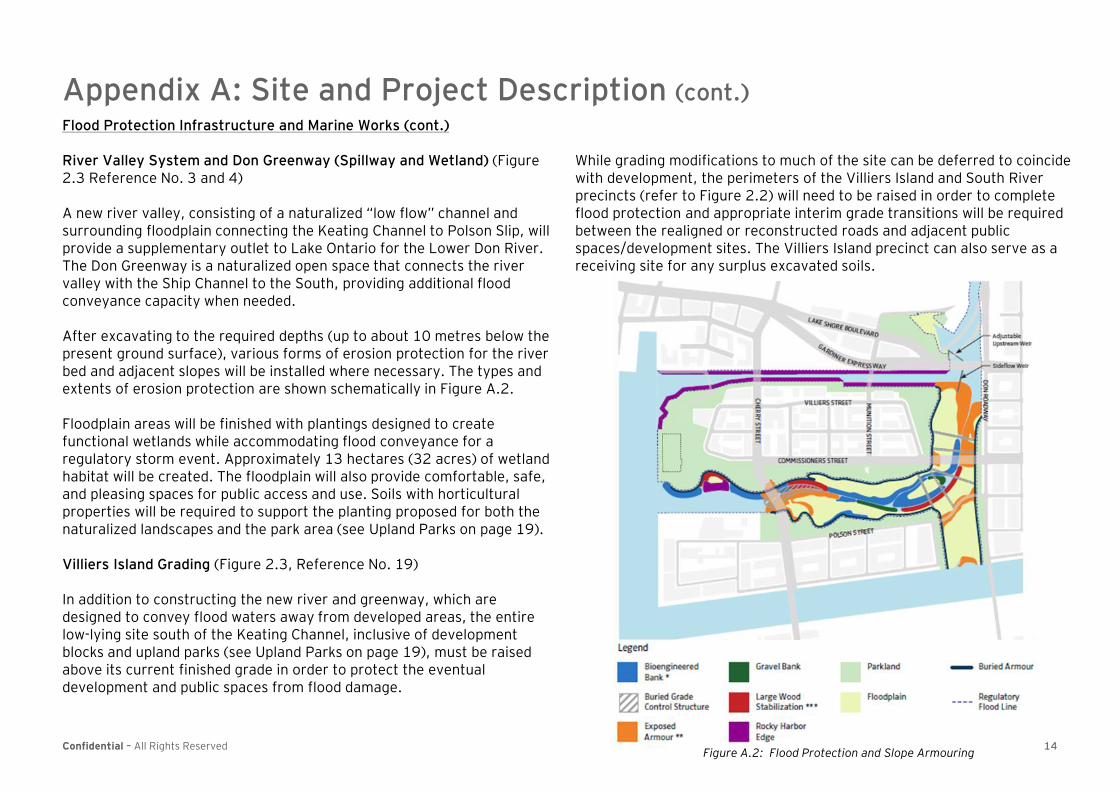
14 Confidential – All Rights Reserved
Flood Protection Infrastructure and Marine Works (cont.)
River Valley System and Don Greenway (Spillway and Wetland) (Figure 2.3 Reference No. 3 and 4)
A new river valley, consisting of a naturalized “low flow” channel and surrounding floodplain connecting the Keating Channel to Polson Slip, will provide a supplementary outlet to Lake Ontario for the Lower Don River. The Don Greenway is a naturalized open space that connects the river valley with the Ship Channel to the South, providing additional flood conveyance capacity when needed.
After excavating to the required depths (up to about 10 metres below the present ground surface), various forms of erosion protection for the river bed and adjacent slopes will be installed where necessary. The types and extents of erosion protection are shown schematically in Figure A.2.
Floodplain areas will be finished with plantings designed to create functional wetlands while accommodating flood conveyance for a regulatory storm event. Approximately 13 hectares (32 acres) of wetland habitat will be created. The floodplain will also provide comfortable, safe, and pleasing spaces for public access and use. Soils with horticultural properties will be required to support the planting proposed for both the naturalized landscapes and the park area (see Upland Parks on page 19).
Villiers Island Grading (Figure 2.3, Reference No. 19)
In addition to constructing the new river and greenway, which are designed to convey flood waters away from developed areas, the entire low-lying site south of the Keating Channel, inclusive of development blocks and upland parks (see Upland Parks on page 19), must be raised above its current finished grade in order to protect the eventual development and public spaces from flood damage.
While grading modifications to much of the site can be deferred to coincide with development, the perimeters of the Villiers Island and South River precincts (refer to Figure 2.2) will need to be raised in order to complete flood protection and appropriate interim grade transitions will be required between the realigned or reconstructed roads and adjacent public spaces/development sites. The Villiers Island precinct can also serve as a receiving site for any surplus excavated soils.
Appendix A: Site and Project Description (cont.)
Figure A.2: Flood Protection and Slope Armouring
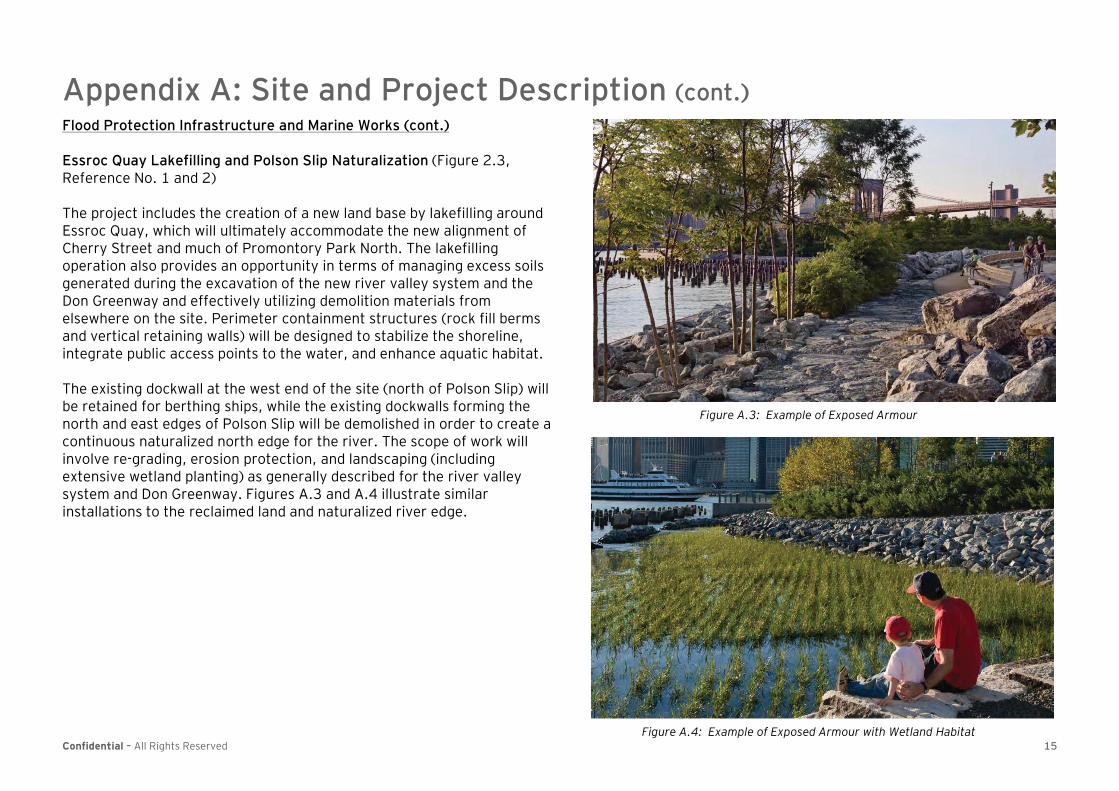
15 Confidential – All Rights Reserved
Flood Protection Infrastructure and Marine Works (cont.)
Essroc Quay Lakefilling and Polson Slip Naturalization (Figure 2.3, Reference No. 1 and 2)
The project includes the creation of a new land base by lakefilling around Essroc Quay, which will ultimately accommodate the new alignment of Cherry Street and much of Promontory Park North. The lakefilling operation also provides an opportunity in terms of managing excess soils generated during the excavation of the new river valley system and the Don Greenway and effectively utilizing demolition materials from elsewhere on the site. Perimeter containment structures (rock fill berms and vertical retaining walls) will be designed to stabilize the shoreline, integrate public access points to the water, and enhance aquatic habitat.
The existing dockwall at the west end of the site (north of Polson Slip) will be retained for berthing ships, while the existing dockwalls forming the north and east edges of Polson Slip will be demolished in order to create a continuous naturalized north edge for the river. The scope of work will involve re-grading, erosion protection, and landscaping (including extensive wetland planting) as generally described for the river valley system and Don Greenway. Figures A.3 and A.4 illustrate similar installations to the reclaimed land and naturalized river edge.
Appendix A: Site and Project Description (cont.)
Figure A.3: Example of Exposed Armour
Figure A.4: Example of Exposed Armour with Wetland Habitat
16 Confidential – All Rights Reserved
Flood Protection Infrastructure and Marine Works (cont.)
Don Roadway Valley Wall Feature (Figure 2.3, Reference No. 8)
The Don Roadway Valley Wall Feature, which is a geographic feature created through fill placement and grading, is required to form the perimeter of the flood zone along the Don Roadway and to eliminate the risk of flooding for lands east of the Project site.
First Gulf/Unilever Site Flood Protection Landform (Figure 2.3, Reference No. 9)
For procurement planning purposes, this component should be considered provisional scope. Ideally, the design and construction of this flood protection landform, to be created through fill placement and grading, will be integrated with the redevelopment of the First Gulf/Unilever site and as such will be performed by others.
Keating Channel Modifications (Figure 2.3, Reference No. 16)
The Keating Channel will be modified by dredging to increase the current depth and by placement of stone slopes (revetments) at the toe of the existing dockwalls, which will serve to stabilize the walls and simultaneously provide additional aquatic habitat. Selected portions of the dockwalls will need to be reinforced, modified, or replaced.
Sediment and Debris Management Area (Figure 2.3, Reference No. 10)
Regular sediment and debris removal will be required to maintain safe navigation and flood protection through the river channel. The scope of work includes excavation to widen the river and provide a sediment trap, construction of an on-shore management area for debris/sediment sorting and processing, and creation of an access road to the facility.
Flow Control Weir System (Figure 2.3, Reference No. 11)
The flow control weir system, which will control the flow split between the Keating Channel and the new naturalized channel, consists of two concrete structures supported on pile foundations driven to bedrock –a multi-segment adjustable weir located immediately north of the Lake Shore Road bridge and a notched side-flow weir on the south side of the bridge. The adjustable weir will likely incorporate inflatable dams with bottom-hinged steel plates and require an accompanying gate control system.
Appendix A: Site and Project Description (cont.)

17 Confidential – All Rights Reserved
Bridges
Indicative construction cost estimate, unescalated: $110-120 million (2015$)
All bridges will be designed to meet the Canadian Highway Bridge Design Code and the Toronto Transit Commission Design Manual. Clearance under the bridges will need to allow for a minimum 2.5 metres above pathways and 0.5 metres freeboard over the regulatory flood high water elevation. Construction of bridge crossings will need to be coordinated with the river valley excavations. For initial planning purposes, it has been assumed that foundations for these crossings will be constructed prior to excavating to the final river valley depths.
Cherry Street Bridge North (Figure 2.3, Reference No. 14b)
The current plan calls for the Cherry Street Bridge (North) over the Keating Channel, which forms the gateway to the Port Lands from the City, to be a signature bridge. While the ultimate configuration of the bridge will need to provide dedicated lanes for motor vehicles, cyclists, pedestrians, and transit vehicles, construction of the transit lanes is excluded from the Project scope.
Cherry Street Bridge South and Commissioners Street Bridge (Figure 2.3, Reference No. 14c and 15b)
The current plan calls for the Cherry Street Bridge (South) and the Commissioners Street Bridge, each of which will span the new river valley, to be Ontario standard highway bridges supported by pre-stressed concrete I-girders. The ultimate configuration of the bridge will need to provide dedicated lanes for motor vehicles, cyclists, pedestrians, and transit, however construction of the transit lanes is excluded from the Project scope.
Old Cherry Street Bridge Demolition (Figure 2.3, Reference No. 14d)
The existing structural steel lift bridge will need to be demolished once the new Cherry Street Bridge North (Reference No. 14c) is complete and the related road realignment has progressed sufficiently to maintain access to Commissioners Street West (Reference No. 15a) and Polson Quay. In conjunction with the demolition, reinforcement and/or rebuilding of the Keating Channel dockwall at both abutment locations is likely to be required.
Lake Shore Road and Rail Bridge Modifications (Figure 2.3, Reference No. 13)
While the current plan contemplates the extension of the existing road and rail bridges to the west by three spans, the final scope of work is dependent upon the outcome of the Gardiner East Environmental Assessment and could become full removal and reconstruction, rather than retention of the existing structures. Traffic staging during construction will be a critical consideration regardless of the final solution adopted.
Basin Street Bridge (Figure 2.3, Reference No. 6)
The current plan calls for the Basin Street Bridge, which will span the Don Greenway, skirting its integral wetland via a curved alignment, to be an Ontario standard highway bridge supported by pre-stressed concrete I-girders. The bridge will be designed to accommodate motor vehicles, cyclists, and pedestrians, but not transit. While it will be necessary to provide for the future structure in the design and construction of the Don Greenway (Reference No. 4), construction of this bridge is excluded from the Project scope.
Appendix A: Site and Project Description (cont.)

18 Confidential – All Rights Reserved
Roads and Municipal Services
Indicative construction cost estimate, unescalated: $130-150 million (2015$)
Cherry Street in the West Don Lands (between King Street and Lake Shore Boulevard) and Queens Quay in the Central Waterfront (between Bay Street and Spadina Avenue) serve as design/material precedents for the Cherry Street realignment and the reconstruction of Commissioners Street and the Don Roadway.
The Cherry Street, Commissioners Street, and the Don Roadway rights-of-way will each be approximately 40 metres wide and will be designed to accommodate vehicular traffic, cyclists, and pedestrians in dedicated lanes, as well as generous streetscaping. Space will be provided to accommodate dedicated, higher-order transit lanes, but the construction of transit-specific elements is outside the scope of this Project, and the future transit lanes will receive an interim grass cover.
Cherry Street Realignment (Figure 2.3, Reference No. 14a)
Cherry Street will be shifted westward both north and south of the Keating Channel, rejoining its present horizontal and vertical alignment south of the new river valley.
Commissioners Street West and East (Figure 2.3, Reference No. 15a and 15c)
Commissioners Street will be reconstructed along its existing alignment, but at a new, higher elevation, tapering down to meet the existing elevation west of the Don Roadway.
Eastern Avenue Flood Protection (Figure 2.3, Reference No. 12)
Modifications to the existing grading of Eastern Avenue, in the vicinity of the CN rail overpass east of Broadview Avenue, are required to eliminate a local low-lying area and complete flood protection.
Site Wide Municipal Infrastructure (Figure 2.3, Reference No. 5)
The Project includes certain linear services (water supply, wastewater collection, and stormwater management) required to support future mixed-use development within the Project boundary and to maintain servicing to private landowners and long-term lessees located on Polson Quay. To minimize temporary infrastructure requirements, the Project includes pre-building portions of the ultimate water, sanitary sewer, and stormwater piping networks as the means of providing interim servicing. Construction of a smaller version of a future sewage pumping station, capable of handling interim flows, and the underground portion of a future stormwater treatment facility also form part of the Project scope.
Municipal services located at shallow depths within the road rights-of-way are expected to be installed in conjunction with road construction. It is anticipated that more deeply buried services will be installed by micro-tunnelling after road construction has been completed. Much of this linear infrastructure is slated to be installed at depth below the water table.
Appendix A: Site and Project Description (cont.)

19 Confidential – All Rights Reserved
Roads and Municipal Services (cont.)
Don Roadway North and South (Figure 2.3, Reference No. 7a and 7b)
The Don Roadway north of Commissioners Street will also be reconstructed along its existing alignment, but at a new higher elevation. This work will need to be coordinated with construction of the Don Roadway Valley Wall Feature (Figure 2.3, Reference No. 8), as well as the reconstruction of Commissioners Street. Extension of the roadway south of Commissioners Street is outside the scope of this Project, as it is expected to be deferred to coincide with development of the adjacent Film Studio precinct.
Hydro One Integration (Figure 2.3, Reference No. 18)
In preparation for constructing the Don Roadway Valley Wall Feature (Reference No. 8) and reconstructing Commissioners Street East (Reference No. 15c) and the Don Roadway North (Reference No. 7a), it will be necessary to relocate portions of Hydro One’s existing overhead transmission line, located within or immediately adjacent to the road rights-of-way. A Hydro One utility bridge that currently crosses the Lower Don River also impedes flood water flows and will be replaced with an alternate crossing.
Upland Parks
Indicative construction cost estimate, unescalated: $60 million (2015$)
River Park North & South and Promontory Park South (Figure 2.3, Reference No. 20, 21 and 17b)
Priority is being given to completing the construction of new upland (above the flood line) parks bordering the new river valley and the naturalized Polson Slip. Park landscaping will include a mix of active recreation spaces, playgrounds, event spaces, public garden areas, passive use lawns, wooded areas, and hard-surfaced esplanades.
Promontory Park North (Figure 2.3, Reference No. 17a)
The Project scope is limited to interim finishing of Promontory Park North as a grassed area. Other elements of the ultimate park program may be added as budget permits.
Appendix A: Site and Project Description (cont.)

20 Confidential – All Rights Reserved
Ernst & Young Assurance | Tax | Transactions | Advisory
About EY
EY is a global leader in assurance, tax, transaction and advisory services. The insights and quality services we deliver help build trust and confidence in the capital markets and in economies the world over. We develop outstanding leaders who team to deliver on our promises to all of our stakeholders. In so doing, we play a critical role in building a better working world for our people, for our clients and for our communities.
EY refers to the global organization, and may refer to one or more, of the member firms of Ernst & Young Global Limited, each of which is a separate legal entity. Ernst & Young Global Limited, a UK company limited by guarantee, does not provide services to clients. For more information about our organization, please visit ey.com.
For more information about our organization, please visit ey.com/ca.
© 2016 Ernst & Young LLP. All Rights Reserved.
A member firm of Ernst & Young Global Limited. All rights reserved.

-Confidential- Waterfront Toronto 56 Port Lands Flood Protection and Enabling Infrastructure
Appendix C: Risk Matrix

Waterfront Toronto Port Lands Flood Protection and Enabling InfrastructureRisk Matrix DBF (P3) Model CM-GMP ModelPost Risk Workshop Allocation Allocation
Probability Probability
Project ID Risk Cost Base Multiple Cost Base ($ millions) Prob. Low Most Likely High Retain Share Transfer Prob. Low Most Likely High Retain Share Transfer
1 Policy / Strategy
1.01 Government Approvals for Project Design & Construction 100.00% $679,244,130 20.00% 5.00% 20.00% 40.00% X 20.00% 5.00% 20.00% 40.00% X
1.02 Government Funding Design & Construction 100.00% $679,244,130 10.00% 2.50% 5.00% 15.00% X 10.00% 2.50% 5.00% 15.00% X
1.03 Project Schedule Design & Construction 100.00% $679,244,130 10.00% 10.00% 20.00% 25.00% X 25.00% 10.00% 20.00% 25.00% X
2 Transaction and Tender Process
2.01 Due Diligence (by the owner in preparation of tender in RFP) Design & Construction 100.00% $679,244,130 25.00% 5.00% 10.00% 20.00% X 25.00% 5.00% 10.00% 20.00% X
2.02 Tendering Competition Design & Construction 100.00% $679,244,130 5.00% 3.00% 5.00% 10.00% X 10.00% 5.00% 10.00% 20.00% X
2.03 Delays in Contract Award/Financial Close Design & Construction 100.00% $679,244,130 5.00% 1.00% 2.00% 5.00% X 10.00% 1.00% 2.00% 5.00% X
2.04 Termination prior to Contract Award/Financial Close Design & Construction 100.00% $679,244,130 5.00% 1.00% 3.00% 5.00% X 10.00% 0.50% 1.50% 2.50% X
3 Project Agreement
3.01 Ambiguities In Legal Agreements Design & Construction 100.00% $679,244,130 7.00% 0.50% 1.00% 2.00% X 10.00% 2.00% 4.00% 8.00% X
3.02 Termination For Convenience During Construction Construction 100.00% $628,929,750 1.00% 5.00% 20.00% 30.00% X 3.00% 5.00% 10.00% 15.00% X
4 Design
4.01 Stakeholder Consultation Pre-Financial Close Design & Construction 100.00% $679,244,130 10.00% 0.50% 1.00% 3.00% X 10.00% 0.50% 1.00% 3.00% X
4.02 Stakeholder Consultation - Post Financial Close and Tender Design & Construction 100.00% $679,244,130 5.00% 1.00% 2.00% 6.00% X 5.00% 0.50% 1.00% 3.00% X
4.03 Scope Changes initiated by Owner During Design Design & Construction 25.00% $169,811,033 10.00% 0.50% 1.00% 3.00% X 15.00% 2.00% 4.00% 10.00% X
4.04 Compliance with Codes and Standards - During Design Design & Construction 25.00% $169,811,033 1.00% 0.50% 1.00% 3.00% X 3.00% 1.00% 3.00% 10.00% X
5 Site Conditions / Environmental
5.01 Utility/Services Relocations Construction 12.00% $75,471,570 15.00% 2.00% 5.00% 10.00% X 30.00% 3.00% 7.50% 15.00% X
5.02 Geotechnical Design & Construction 75.00% $509,433,098 5.00% 1.00% 2.00% 5.00% X 15.00% 2.00% 5.00% 10.00% X
5.03 Existing Contamination Construction 15.00% $94,339,463 5.00% 2.00% 5.00% 15.00% X 5.00% 3.00% 7.00% 20.00% X
5.04 Archaeological Construction 15.00% $94,339,463 5.00% 2.00% 5.00% 10.00% X 5.00% 4.00% 10.00% 20.00% X
5.05 EA Conditions of Approval Design & Construction 8.00% $54,339,530 5.00% 2.00% 5.00% 10.00% X 20.00% 2.00% 5.00% 10.00% X
Pre-Response Risk Quantification Pre-Response Risk QuantificationCost Impact Cost Impact
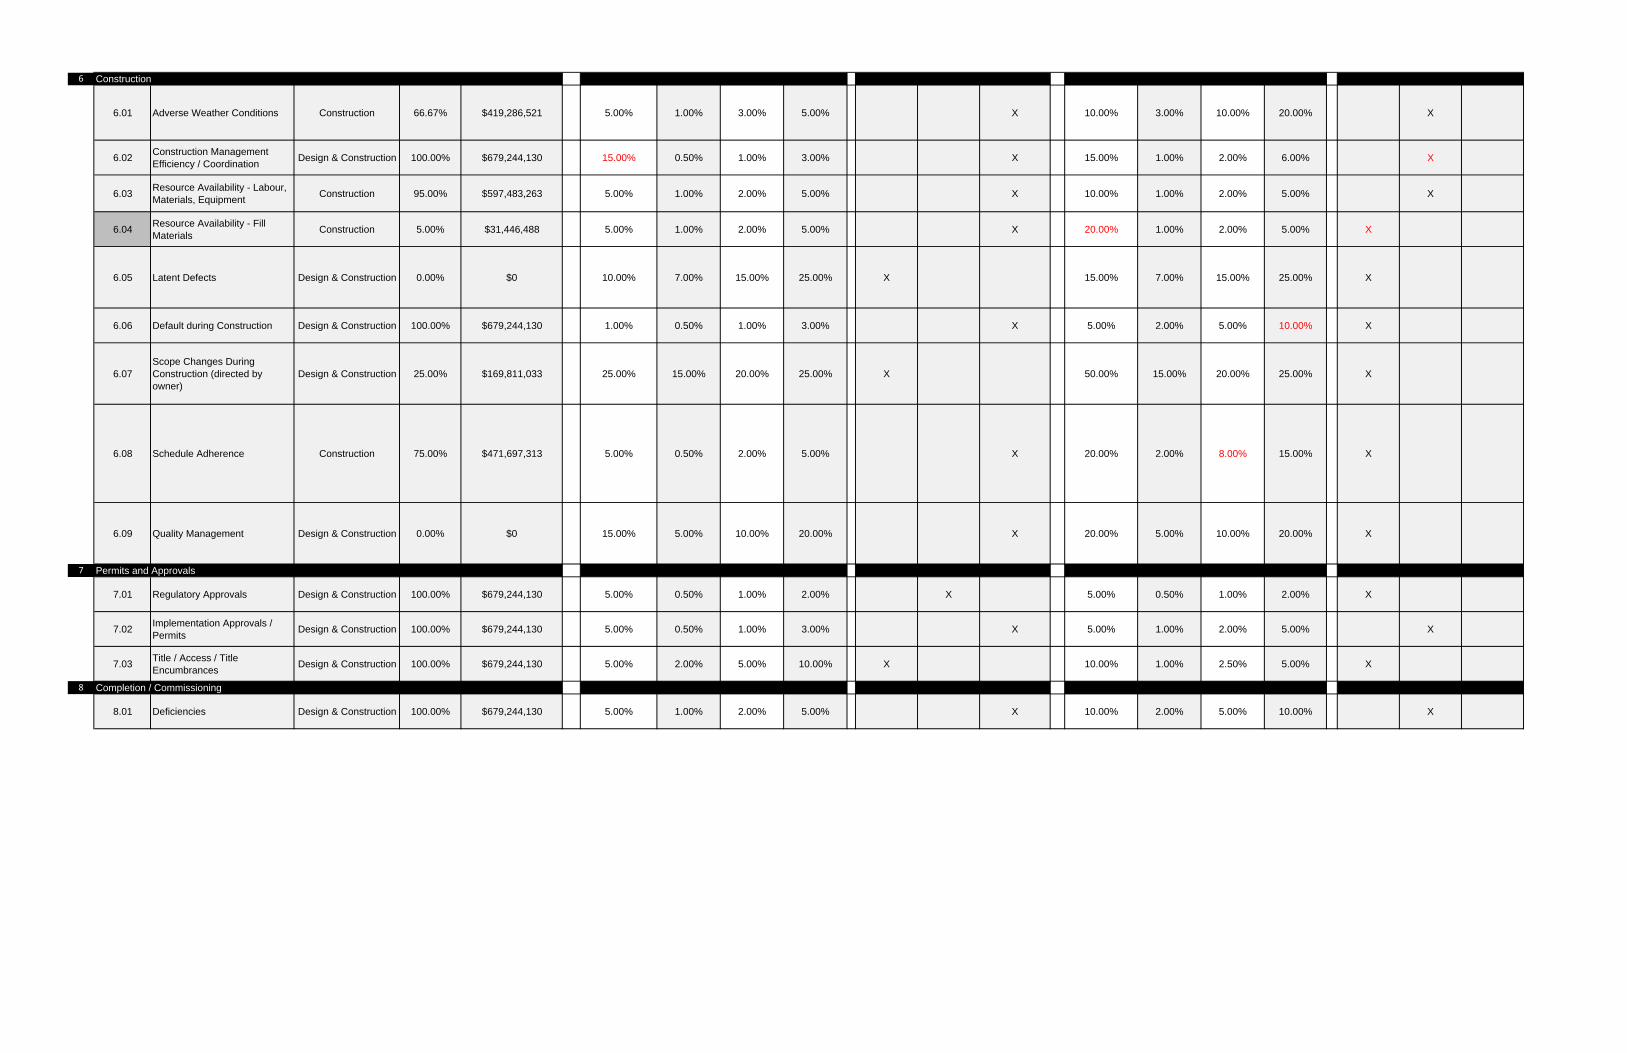
6 Construction
6.01 Adverse Weather Conditions Construction 66.67% $419,286,521 5.00% 1.00% 3.00% 5.00% X 10.00% 3.00% 10.00% 20.00% X
6.02 Construction Management Efficiency / Coordination Design & Construction 100.00% $679,244,130 15.00% 0.50% 1.00% 3.00% X 15.00% 1.00% 2.00% 6.00% X
6.03 Resource Availability - Labour, Materials, Equipment Construction 95.00% $597,483,263 5.00% 1.00% 2.00% 5.00% X 10.00% 1.00% 2.00% 5.00% X
6.04 Resource Availability - Fill Materials Construction 5.00% $31,446,488 5.00% 1.00% 2.00% 5.00% X 20.00% 1.00% 2.00% 5.00% X
6.05 Latent Defects Design & Construction 0.00% $0 10.00% 7.00% 15.00% 25.00% X 15.00% 7.00% 15.00% 25.00% X
6.06 Default during Construction Design & Construction 100.00% $679,244,130 1.00% 0.50% 1.00% 3.00% X 5.00% 2.00% 5.00% 10.00% X
6.07Scope Changes During Construction (directed by owner)
Design & Construction 25.00% $169,811,033 25.00% 15.00% 20.00% 25.00% X 50.00% 15.00% 20.00% 25.00% X
6.08 Schedule Adherence Construction 75.00% $471,697,313 5.00% 0.50% 2.00% 5.00% X 20.00% 2.00% 8.00% 15.00% X
6.09 Quality Management Design & Construction 0.00% $0 15.00% 5.00% 10.00% 20.00% X 20.00% 5.00% 10.00% 20.00% X
7 Permits and Approvals
7.01 Regulatory Approvals Design & Construction 100.00% $679,244,130 5.00% 0.50% 1.00% 2.00% X 5.00% 0.50% 1.00% 2.00% X
7.02 Implementation Approvals / Permits Design & Construction 100.00% $679,244,130 5.00% 0.50% 1.00% 3.00% X 5.00% 1.00% 2.00% 5.00% X
7.03 Title / Access / Title Encumbrances Design & Construction 100.00% $679,244,130 5.00% 2.00% 5.00% 10.00% X 10.00% 1.00% 2.50% 5.00% X
8 Completion / Commissioning
8.01 Deficiencies Design & Construction 100.00% $679,244,130 5.00% 1.00% 2.00% 5.00% X 10.00% 2.00% 5.00% 10.00% X
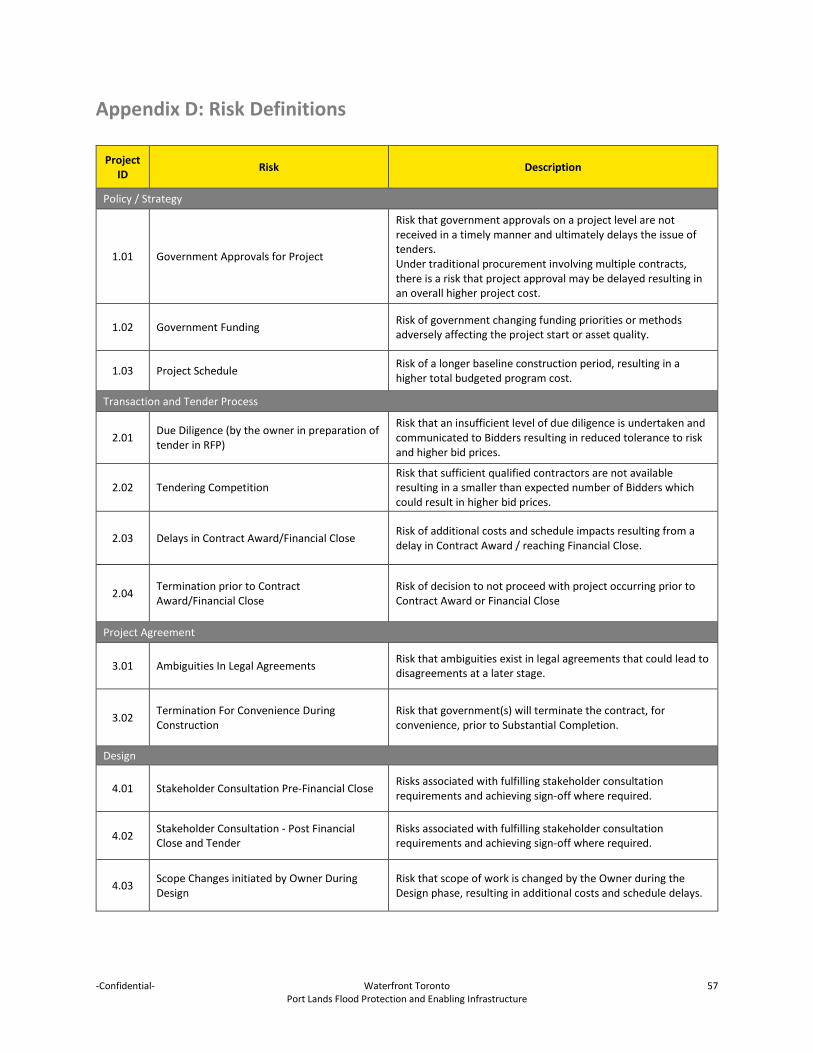
-Confidential- Waterfront Toronto 57 Port Lands Flood Protection and Enabling Infrastructure
Appendix D: Risk Definitions
Project ID Risk Description
Policy / Strategy
1.01 Government Approvals for Project
Risk that government approvals on a project level are not received in a timely manner and ultimately delays the issue of tenders. Under traditional procurement involving multiple contracts, there is a risk that project approval may be delayed resulting in an overall higher project cost.
1.02 Government Funding Risk of government changing funding priorities or methods adversely affecting the project start or asset quality.
1.03 Project Schedule Risk of a longer baseline construction period, resulting in a higher total budgeted program cost.
Transaction and Tender Process
2.01 Due Diligence (by the owner in preparation of tender in RFP)
Risk that an insufficient level of due diligence is undertaken and communicated to Bidders resulting in reduced tolerance to risk and higher bid prices.
2.02 Tendering Competition Risk that sufficient qualified contractors are not available resulting in a smaller than expected number of Bidders which could result in higher bid prices.
2.03 Delays in Contract Award/Financial Close Risk of additional costs and schedule impacts resulting from a delay in Contract Award / reaching Financial Close.
2.04 Termination prior to Contract Award/Financial Close
Risk of decision to not proceed with project occurring prior to Contract Award or Financial Close
Project Agreement
3.01 Ambiguities In Legal Agreements Risk that ambiguities exist in legal agreements that could lead to disagreements at a later stage.
3.02 Termination For Convenience During Construction
Risk that government(s) will terminate the contract, for convenience, prior to Substantial Completion.
Design
4.01 Stakeholder Consultation Pre-Financial Close Risks associated with fulfilling stakeholder consultation requirements and achieving sign-off where required.
4.02 Stakeholder Consultation - Post Financial Close and Tender
Risks associated with fulfilling stakeholder consultation requirements and achieving sign-off where required.
4.03 Scope Changes initiated by Owner During Design
Risk that scope of work is changed by the Owner during the Design phase, resulting in additional costs and schedule delays.

-Confidential- Waterfront Toronto 58 Port Lands Flood Protection and Enabling Infrastructure
Project ID Risk Description
4.04 Compliance with Codes and Standards - During Design
Risk that design does not comply with relevant codes and standards.
Site Conditions / Environmental
5.01 Utility/Services Relocations Risk associated with inaccurate information provided during bid period or delay by third parties in approving or completing necessary relocations.
5.02 Geotechnical Risk associated with incomplete / inaccurate information or delays associated with completing necessary investigations.
5.03 Existing Contamination Risk associated with incomplete / inaccurate information or delays associated with completing necessary investigations and remedial work.
5.04 Archaeological Risk associated with incomplete / inaccurate information or delay to completing necessary clearances.
5.05 EA Conditions of Approval Risk associated with satisfying specific EA Conditions of Approval.
Construction
6.01 Adverse Weather Conditions Risk that unanticipated adverse weather conditions result in schedule delay or increased costs, including localized flooding.
6.02 Construction Management Efficiency / Coordination
Risk that contractor team does not effectively coordinate / manage construction activities to meet project schedule.
6.03 Resource Availability - Labour, Materials, Equipment
Risk that required resources are not available, resulting in delay and increased costs.
6.04 Resource Availability - Fill Materials Risk that required fill resources, either existing on-site (targeted 85% reuse) or new fill, are not available, resulting in delay and increased costs.
6.05 Latent Defects Risk that latent defects result in operational difficulties, additional lifecycle maintenance costs or reduced asset residual value.
6.06 Default during Construction Risk of Project Co / contractor default, and subsequent replacement. This could result in delays and additional costs.
6.07 Scope Changes During Construction (directed by owner)
Risk that the scope of work is changed by the Owner during the construction period.
6.08 Schedule Adherence Risk associated with incurring schedule delays and either having to rush construction (quality risk) or add resources (cost risk) to achieve schedule completion.
6.09 Quality Management Risk associated with meeting design standards and codes as they relate to long term asset performance.
Permits and Approvals
7.01 Regulatory Approvals Risk that there is a delay in obtaining relevant Regulatory Approvals by the Owner, resulting in schedule delays and additional costs.

-Confidential- Waterfront Toronto 59 Port Lands Flood Protection and Enabling Infrastructure
Project ID Risk Description
7.02 Implementation Approvals / Permits Risk that there is a delay in obtaining relevant Permits to the construction contractor, resulting in schedule delays and additional costs.
7.03 Title / Access / Title Encumbrances
Risk that site access is not made available to Contractor within the prescribed timeframe. This may include potential delay and added costs to acquire property from un-willing sellers / pay off leases.
Completion / Commissioning
8.01 Deficiencies Risk that there are deficiencies upon substantial completion resulting in additional cost difficulties.

-Confidential- Waterfront Toronto 60 Port Lands Flood Protection and Enabling Infrastructure
Appendix E: The Guide to the new Building Canada Fund P3 Screen – Suitability Assessment

PPP Canada
The Guide to the new Building Canada Fund P3 Screen – Suitability Assessment


i New Building Canada Fund P3 Screen – Suitability Assessment
About PPP Canada
PPP Canada is the government of Canada’s centre of expertise on P3s. As a federal Crown corporation mandated to improve the delivery of public infrastructure by achieving better value, timeliness and accountability to taxpayers, through P3s. The Corporation was created to deliver more P3s by leveraging incentives, demonstrating success, providing expertise; and promoting best practices and capacity-building.
Increasing the visibility of P3s as a procurement solution for governments is one of the major accomplishments of PPP Canada. The Corporation’s work and the strategies it employs on its three (3) business lines:
P3 Knowledge Development and Sharing: to serve as a source of expertise and advice on public-private partnership matters;
Advancing Federal P3s: as the lead on federal P3 matters with a mandate to assess federal P3 opportunities; and to advise on the execution of federal P3 projects; and
Advancing Provincial, Territorial, Municipal and First Nations P3s: to assess the suitability of P3 projects from provincial, territorial, municipal, and First Nations governments seeking funding from federal infrastructure programs, in particular the P3 Canada Fund.
www.p3canada.ca
ii New Building Canada Fund P3 Screen – Suitability Assessment
TABLE OF CONTENTS
Table of Contents ............................................................................................................................................. ii
Introduction ..................................................................................................................................................... 1
Purpose .................................................................................................................................................... 1
Identifying P3 Potential ................................................................................................................................... 3
The Suitability Assessment......................................................................................................................... 3
How to Approach the Suitability Assessment ............................................................................................. 3
Application of the Screening Criteria .......................................................................................................... 4
Interpreting the Results............................................................................................................................. 12
Next Steps ................................................................................................................................................ 12

1 New Building Canada Fund P3 Screen – Suitability Assessment
INTRODUCTION
Public-private partnerships (P3s) have demonstrated their ability to produce value for taxpayers in the delivery of public infrastructure. By partnering with the private sector to manage many of the risks associated with the construction, financing and operation of infrastructure, governments can build public infrastructure faster and at a lower cost to taxpayers.
In Economic Action Plan 2013, the Government of Canada announced that a new P3 Screen for projects with eligible costs of over $100 million submitted for federal funding under Infrastructure Canada’s New Building Canada Fund (NBCF) to determine whether better Value for Money can be achieved through P3 procurement.
The P3 Screen is divided into two parts: the P3 Screen - Suitability Assessment (SA); and the Procurement Options Analysis (POA).
Should the SA conclude that a project demonstrates P3 potential, Procuring Authorities will be required to develop a POA.
As the Government of Canada’s centre of expertise on P3s, PPP Canada provides advice to jurisdictions in all levels of governments as they consider the P3 suitability of their specific projects.
Purpose
This guide is meant to assist Procuring Authorities who have applied to the NBCF in completing their P3 Screen - SA as instructed by Infrastructure Canada. This guide will walk Procuring Authorities through how to use the P3 Screen – SA and how to apply the screening criteria. PPP Canada’s review of completed P3 Screen – SAs referred to the Corporation by Infrastructure Canada, will take one to two (1-2) weeks. However, PPP Canada will work directly with Procuring Authorities should there be incomplete information or clarifications required. Once complete, PPP Canada will communicate the results of the P3 Screen – SA to Infrastructure Canada
The screening criteria are presented in the form of twelve (12) questions related to project specifics such as: private sector capacity, potential for contract integration, and the potential for competition; market precedence; and asset complexity.
The P3 Screen – SA is designed for use by provinces, territories, and municipalities, regardless of P3 experience and expertise. However, the P3 Screen – SA outcomes can be expected to be more accurate with P3 experience. As such, PPP Canada can assist Procuring Authorities by providing expert advice as they undertake the screening of their proposed capital investments.
For Procuring Authorities required to prepare a POA, PPP Canada has developed The New Building Canada Fund: Procurement Options Analysis Guide to assist with the analytical process of selecting the optimal procurement option. PPP Canada has also developed a Schematic Design Estimate Guide, a guide to preparing cost estimates suitable for quantitative analysis when considering a P3 as an asset delivery option.

2 New Building Canada Fund P3 Screen – Suitability Assessment
Screening Projects for P3 Potential
P3s are currently operating across the country– from bridges and roads to hospitals and fire stations, schools and prisons – and users and taxpayers are reaping the benefits with better service, lower costs, and faster delivery times. However, because the value of P3s is best leveraged in large, complex projects where innovation can reduce lifetime costs and deliver better infrastructure, the P3 market is not boundless. It is estimated that P3s are the better procurement option in only up to 20 per cent of public infrastructure procurements. As a result, P3s are only one tool of many that governments can employ to optimize the value that is being delivered in public infrastructure procurements.
Determining whether an investment could have potential for P3 delivery is only a first step in larger decision making process that concludes with a recommendation regarding the optimal approach to procurement.

3 New Building Canada Fund P3 Screen – Suitability Assessment
IDENTIFYING P3 POTENTIAL
This section provides guidance on the application of the P3 Screen – Suitability Assessment criteria. Identifying the optimal procurement approach for a given asset can be seen as an iterative approach that applies progressively finer filters to the list of viable delivery options until one emerges as the optimum choice.
The purpose of the P3 Screen – Suitability Assessment is to raise the level of awareness and consideration of the P3 model in the procurement of provincial, territorial, and municipal projects seeking funding from federal infrastructure programs, in particular the new Building Canada Fund (NBCF). The objective of the P3 Screen is to ensure that where P3 potential exists, the P3 option is given due consideration.
There is no one overwhelming indicator of P3 suitability. It is also important to note the identification of P3 potential does not imply that the P3 approach will be the final delivery approach. Rather, it means that the P3 option must be carried forward through the next stages of the analytical process, the development of a Procurement Options Analysis (POA).
The Suitability Assessment
The P3 Screen – Suitability Assessment was developed to assist Procuring Authorities requesting federal funding from the NBCF, in assessing the P3 potential for the delivery of their infrastructure projects. The screening matrix asks the user to consider twelve (12) questions and enter a score for each question. Considerable effort has been made to ensure that users are provided with objective indicators for each question.
The evaluation criteria have been developed in order to ensure that the screening can be completed based on readily available information that would be established through the conventional investment planning process. However; some of the criteria may require a more in-depth understanding of a wide spectrum of P3 delivery models and an awareness of the P3 market in Canada. PPP Canada is readily available to provide this additional context and to provide support to Procuring Authorities as they undertake the screening of their proposed capital projects.
How to Approach the Suitability Assessment
For each of the twelve (12) questions in the Suitability Assessment, the user will be presented with a scale from one (1) to five (5). Accompanying this scale will be indicators meant to assist the reader in choosing the appropriate rating.
The user should consider the question in the context of their specific investment, then identify the indicator that best aligns with their assessment, and finally enter the rating associated with that indicator in the rating cell. The user is also asked to provide a brief rationale for their rating.
In the background, the user’s scores will be modified by a weighting factor that reflects the relative importance of that criterion in determining P3 suitability. These weighted ratings are then normalized to a score out of 100, which can range from 1 to 100.
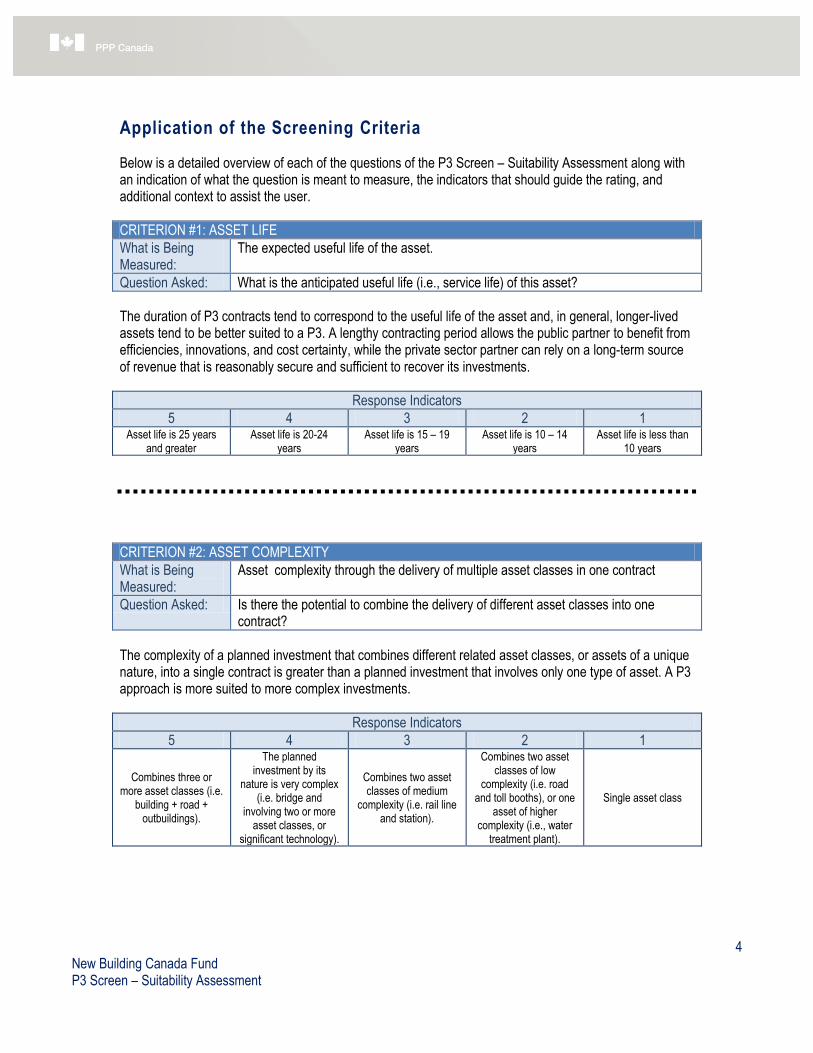
4 New Building Canada Fund P3 Screen – Suitability Assessment
Application of the Screening Criteria
Below is a detailed overview of each of the questions of the P3 Screen – Suitability Assessment along with an indication of what the question is meant to measure, the indicators that should guide the rating, and additional context to assist the user.
CRITERION #1: ASSET LIFE
What is Being Measured:
The expected useful life of the asset.
Question Asked: What is the anticipated useful life (i.e., service life) of this asset?
The duration of P3 contracts tend to correspond to the useful life of the asset and, in general, longer-lived assets tend to be better suited to a P3. A lengthy contracting period allows the public partner to benefit from efficiencies, innovations, and cost certainty, while the private sector partner can rely on a long-term source of revenue that is reasonably secure and sufficient to recover its investments.
Response Indicators
5 4 3 2 1 Asset life is 25 years
and greater Asset life is 20-24
years Asset life is 15 – 19
years Asset life is 10 – 14
years Asset life is less than
10 years
CRITERION #2: ASSET COMPLEXITY
What is Being Measured:
Asset complexity through the delivery of multiple asset classes in one contract
Question Asked: Is there the potential to combine the delivery of different asset classes into one contract?
The complexity of a planned investment that combines different related asset classes, or assets of a unique nature, into a single contract is greater than a planned investment that involves only one type of asset. A P3 approach is more suited to more complex investments.
Response Indicators
5 4 3 2 1
Combines three or more asset classes (i.e.
building + road + outbuildings).
The planned investment by its
nature is very complex (i.e. bridge and
involving two or more asset classes, or
significant technology).
Combines two asset classes of medium
complexity (i.e. rail line and station).
Combines two asset classes of low
complexity (i.e. road and toll booths), or one
asset of higher complexity (i.e., water
treatment plant).
Single asset class

5 New Building Canada Fund P3 Screen – Suitability Assessment
CRITERION #3: OUTPUT AND PERFORMANCE SPECIFICATIONS (CONSTRUCTION)
What is Being Measured:
The availability/accessibility of output and performance specifications for the construction of the asset.
Question Asked: What is the availability of the output specifications for the construction of the asset?
P3s are characterized by the public sector setting their desired outcomes or outputs in the form of measurable technical output/service/performance specifications that provide the basis for performance based contracts.
Output specifications will include performance specifications for the entire concession period, becoming a fundamental part of the Project Agreement between the public partner and the selected private proponent. The development of output specifications for the lifecycle of an asset requires a shift in mindset from the development traditional input specification for a single phase of the asset’s life. Output specifications will allow a supplier maximum flexibility to achieve innovation and efficiency in design of the asset and service delivery, by providing a description of how the asset is to perform in each phase of the lifecycle and the condition of the asset at the end of the concession period. This requires a clear definition of the specifications/standards to be met by the private sector during not only the construction phase but in the longer term operating and maintenance phases. Inaccurate or incomplete output specifications can have lasting negative impact on the performance of an asset and how it is maintained.
Response Indicators
5 4 3 2 1
Output specifications for same type of
asset(s) exist and are available.
Output specifications for similar asset are
available.
Existing conventional specifications can be
converted into output or performance
specifications easily.
Existing conventional specifications can be
converted into output or performance
specifications with some difficulty.
New technical outputs and specifications will have to be developed
CRITERION #4: STABILITY OF OPERATIONAL & MAINTENANCE REQUIREMENTS
What is Being Measured:
Stability and predictability of the operational and maintenance requirements for the asset.
Question Asked: Are the long term operational and maintenance needs of the planned asset relatively stable and predictable?
Being able to forecast the maintenance and operational requirements for an asset over the long-term time is desirable in the context of long-term contracts. Most of infrastructure assets such as buildings and roads have stable and predictable operations and maintenance requirements over their life spans. However, certain types of assets may be more unpredictable in nature due to external factors such as regulatory standards. Risks which are challenging to quantify, tend to command risk premiums associated with the risk transfer and result in increased overall costs.
The relationship between contract duration, asset life-cycling, and the timing of potential external drivers will influence the scoring of this criterion.

6 New Building Canada Fund P3 Screen – Suitability Assessment
Illustrative Example: Assuming the operating permit for a wastewater treatment facility is renewed every 10 years using the standards in force at the time of the renewal, a contract with duration of 10 years or less should score 5. By contrast, if the anticipated contract is longer than 10 years, then the score would be lower in recognition of the uncertainty related to future standards.
Response Indicators
5 4 3 2 1
Operations and maintenance
requirements are predictable and stable
Operation and maintenance
requirements are predictable, but have some instability based
on known factors.
Operations requirements are
unstable, but maintenance
requirements are predictable
Operations requirements are not
stable and maintenance
requirements are somewhat predictable.
Operations and maintenance
requirements cannot be predicted and are unstable over the
useful life of the asset.
CRITERION #5: PERFORMANCE SPECIFICATIONS & INDICATORS (OPERATIONS PERIOD)
What is Being Measured:
The availability of performance specifications and indicators for the operations and maintenance of the asset.
Question Asked: What is the availability of the operations- and maintenance- related performance specifications indicators
Establishing performance specifications and monitoring performance against them using Key Performance Indicators (KPIs) is critical to the management of any performance based contract, including P3s.
The public sector must be able to articulate its required minimum operating and maintenance standards to be met in output or performance-based terms. Measurement against the minimum standards involves the development and monitoring of KPIs. Monitoring performance over the life of the P3 agreement may also necessitate change management initiatives as the public partner moves away from an input-based approach to managing performance.
Response Indicators
5 4 3 2 1 Performance outputs
and indicators for operations and
maintenance activities are available
Performance outputs and indicators exist, but
are not readily available
Performance outputs and indicators for
comparable assets exist and are available
Performance outputs and indicators for
comparable assets exist and are not readily available
Performance outputs and indicators will have
to be developed
CRITERION #6: LIFE-CYCLE COSTS
What is Being Measured:
Whether the public sector has sufficient information to develop a profile of the life-cycle costs associated with the asset.
Question Asked: Can most of the full life-cycle costs of the asset , mainly related to construction and fit-up (i.e., project costs) and long-term operations, including maintenance, be quantified upfront with reasonable assumptions and/or availability of historic data?

7 New Building Canada Fund P3 Screen – Suitability Assessment
Life-cycle costs are very important factor in success of a P3. The public partner will pay for maintenance and/or operation through the P3 Agreement with the expectation that the asset will be maintained in accordance with the performance specifications.
The estimation of life-cycle costs begins with the identification of what has to be analyzed and the time period for the investment life-cycle study along with the appropriate financial criteria. Giving potential bidders as much information as possible will result in more comprehensive bids and ultimately benefit the public partner. A whole-life approach to the delivery of public infrastructure assets generates potential efficiency gains, especially where maintenance and operation of the asset become the responsibility of the private sector. Decisions relating to life-cycle costs are a major consideration for the private sector in preparing a complete and competitive proposal. The cost profile should reflect most activities occurring in technical and non-technical disciplines.
Illustrative Example: If major costs such as design, construction, energy and water, and replacement of mechanical and electrical systems can be documented fairly accurately, then the score should be 5. If costs such as design and construction can be calculated accurately, and energy and equipment replacement costs cannot be easily established due to poor quality of historic data or unpredictable operating conditions over a long term, then a score of 3 could be given.
Response Indicators
5 4 3 2 1
The total asset life-cycle costs are well
understood and accurate estimates can
be developed by the public partner.
The total asset life-cycle costs are understood but estimates, while
accurate are incomplete to some
extent.
The total asset life-cycle costs are well understood, and can
somewhat be accurately estimated by
the public partner.
There is limited understanding of life-cycle costs, but costs cannot be accurately
estimated by the public partner.
The total asset life-cycle costs are not well understood and cannot
be estimated by the public partner.
CRITERION #7: REVENUE GENERATION
What is Being Measured:
Whether the asset could potentially generate revenues and lessen its impact on tax payers.
Question Asked: Does the planned investment have inherent scope to generate any revenue?
Revenue generation is not a requirement for a successful P3. However, where an asset could potentially generate revenue and reduce the burden on public funds, the P3 model is ideally suited to leveraging that potential, particularly where there is scope to transfer the risks associated with that revenue generation to the private partner.
While the proportion of federal assets with revenue generation potential is likely to be small, in some contexts, adjustments to investment scope such as a move from a single-use building to a multi-use building can sometimes create revenue opportunities.

8 New Building Canada Fund P3 Screen – Suitability Assessment
Response Indicators
5 4 3 2 1
The planned investment will
generate revenues and the private sector may be willing to assume
associated revenue risk
The planned investment could generate revenues and private sector may be willing to share revenue risk
The planned investment could
generate revenues and the private sector's
willingness to accept revenue risk is
unknown
The planned investment could generate minimal revenues and the private sector is
unlikely to accept any revenue risk.
It is unlikely that the planned investment will generate any revenues
CRITERION #8: PRIVATE SECTOR EXPERTISE
What is Being Measured:
Whether there is sufficient private sector capacity to deliver the investment and to create a competitive bidding environment
Question Asked: How many private sector firms have the capacity to deliver and maintain this type of asset?
The availability of private sector expertise is critical for two reasons: 1) ensuring a competitive bidding environment; and 2) ensuring that there is private sector capacity to perform the functions and manage the risks associated with the asset.
The success of a P3 is dependent upon the team that the private sector partner assembles to fulfill its obligations to the public partner. There needs to be an adequate pool of private-sector participants who would be interested in and capable of pursuing the opportunity. Currently private sector expertise exists in virtually all areas of public infrastructure, with P3 activity in most sectors including transportation, waste water and correctional facilities. If there are only a limited number of private sector companies that could deliver the investment, then there could be challenges related to a competitive bidding process, regardless of delivery approach.
Response Indicators
5 4 3 2 1 There are more than 5
private sector firms capable of forming
teams with the expertise to design,
construct and maintain/operate this
type of asset
There are more than 5 private sector firms
capable of designing, constructing and
maintaining this type of asset. Operations capability is not yet
determined.
There are 3 to 5 private sector firms capable of forming teams with the
expertise to design, construct and
maintain/operate this type of asset
There are 3-5 private sector firms capable of designing, constructing
and maintaining this type of asset.
Operations capability is not yet determined.
There are fewer than 3 private sector firms capable of forming
teams with the expertise to design,
construct and maintain/operate this
type of asset

9 New Building Canada Fund P3 Screen – Suitability Assessment
CRITERION #9: MARKET PRECEDENTS
What is Being Measured:
Whether the P3 market has experience with investments of a similar nature in all phases of the investment life-cycle.
Question Asked: Have investments with similar requirements and of similar size and scale been delivered through the P3 model?
The existence of P3s for similar assets is a strong indicator of the viability of a P3.
P3s are delivered in a multitude of sectors, across Canada including bridges and roads, hospitals and fire stations, schools and prisons. Alberta, British Columbia, Ontario, and Quebec have undertaken the vast majority of P3 procurements in Canada representing a diverse portfolio of public infrastructure. P3 projects across various infrastructure asset classes such as transit, waste management and broadband have been procured across Canada and internationally.
Information related to P3 projects is available on the website of the provincial and international procurement agencies. A list of resources providing information on the Canadian and international P3 organizations can be found in the PPP Canada website – www.p3canada.ca.
Response Indicators
5 4 3 2 1
Investments of similar size and scope have
been delivered as P3s in Canada
Smaller investments of similar scope or,
projects of similar size but smaller scope have been delivered as P3s
in Canada.
Investments of similar size and scope have
been delivered as P3s internationally
Smaller investments of similar scope or,
projects of similar size but smaller scope have been delivered as P3s
internationally.
Investments of similar size and scope have not been previously
delivered as P3s
CRITERION #10: NATURE OF DEVELOPMENT SITE
What is Being Measured:
Whether the nature of the asset lends itself to the effective transfer of risk owing to the nature infrastructure site.
Question Asked: How much of this investment involves new construction on a previously undeveloped site?
In general, investments involving all new construction on sites not previously developed (greenfield developments) lend themselves to maximizing risk transfer to the private sector. However, investments that involve existing assets are also suitable when they involve reconstruction or very extensive renovations.
Refurbishment, renovation, and facility expansion investments (brownfield developments) offer less potential for risk transfer because it may not be possible to distinguish the defects in new construction from pre-existing or latent defects in the infrastructure. Also, the private sector may be less averse in taking on risks related to existing assets over the long-term of a new P3 contract. Nevertheless, these types of investments may still make viable P3s.

10 New Building Canada Fund P3 Screen – Suitability Assessment
Response Indicators
5 4 3 2 1
Asset is new construction on an undeveloped site.
Asset is new construction on an
already developed site
The planned investment involves at
least 50% new construction and also significant renovations to the existing asset.
The planned investment involves expansion and/or
refurbishment of an existing asset
The planned investment mainly
involves refurbishment, modernization, minor
renovation, or involves integration of new
facilities with existing facilities
CRITERION #11: SCOPE FOR PRIVATE SECTOR INNOVATION GAINS
What is Being Measured:
Whether the public sector’s needs or expectations are compatible with realizing gains from private sector innovation
Question Asked: To what extent will the output-based performance contracts specify deliverables?
The scope for private sector innovation is inversely related to the public sector's need to be prescriptive.
Output-based performance contracts specify deliverables in terms of outcomes (safety, amount of lighting) rather than prescribing the inputs or materials to be used in delivering the outputs. The specifications need to reflect the final requirements of the end-user. These types of contracts encourage innovation by giving the private sector discretion over how it will deliver the required outcomes. Performance-based contracts are viable when the outputs are easily measurable and verifiable using accepted standard measures. Provisions in an output-based contract are not unique to P3s and are already used in some conventional contracts such as operation and maintenance services.
With this in mind, the public sector must consider the extent to which it must express its requirements in terms of inputs.
Illustrative Example: Expressing a requirement in output-based terms could include a statement that high speed internet access should be available 24/7 for all 1000 people in the facility. This would leave the private partner to determine how to best meet that need. By contrast, an input-based approach would involve prescribing type of cable to be used, where it should be laid out, etc. Not only does the input-based approach curtail the opportunities to realize innovation efficiencies, but it also fails to recognize that the specified technologies and approaches may be rendered obsolete by technological advances.
Response Indicators
5 4 3 2 1
The public sector is prepared to use output
specifications for all phases of the
investment life-cycle.
There are very few areas where the public sector feels it must be prescriptive/use input-based specifications.
The planned investment
requirements will be a mix of input-based and
output-based requirements
The planned investment’s design
and construction will be based on input specifications.
The public sector believes it must define
specific input requirements for the majority of the asset.
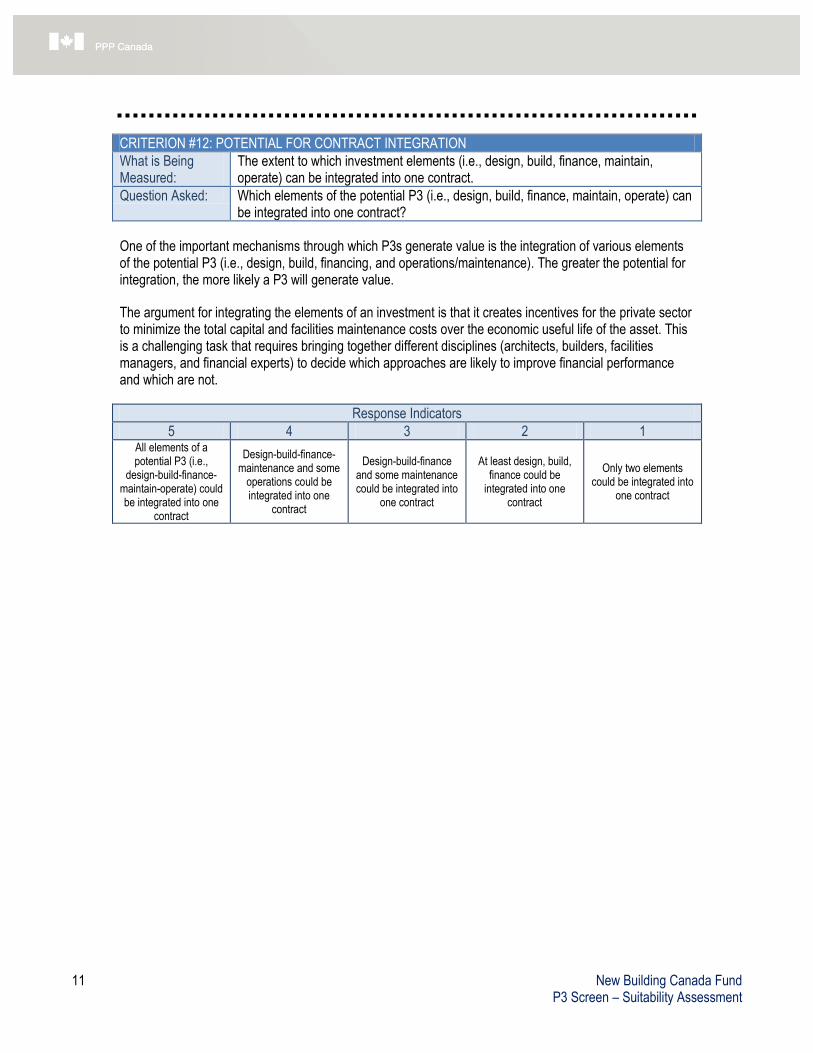
11 New Building Canada Fund P3 Screen – Suitability Assessment
CRITERION #12: POTENTIAL FOR CONTRACT INTEGRATION
What is Being Measured:
The extent to which investment elements (i.e., design, build, finance, maintain, operate) can be integrated into one contract.
Question Asked: Which elements of the potential P3 (i.e., design, build, finance, maintain, operate) can be integrated into one contract?
One of the important mechanisms through which P3s generate value is the integration of various elements of the potential P3 (i.e., design, build, financing, and operations/maintenance). The greater the potential for integration, the more likely a P3 will generate value.
The argument for integrating the elements of an investment is that it creates incentives for the private sector to minimize the total capital and facilities maintenance costs over the economic useful life of the asset. This is a challenging task that requires bringing together different disciplines (architects, builders, facilities managers, and financial experts) to decide which approaches are likely to improve financial performance and which are not.
Response Indicators
5 4 3 2 1 All elements of a potential P3 (i.e.,
design-build-finance-maintain-operate) could be integrated into one
contract
Design-build-finance-maintenance and some
operations could be integrated into one
contract
Design-build-finance and some maintenance could be integrated into
one contract
At least design, build, finance could be
integrated into one contract
Only two elements could be integrated into
one contract
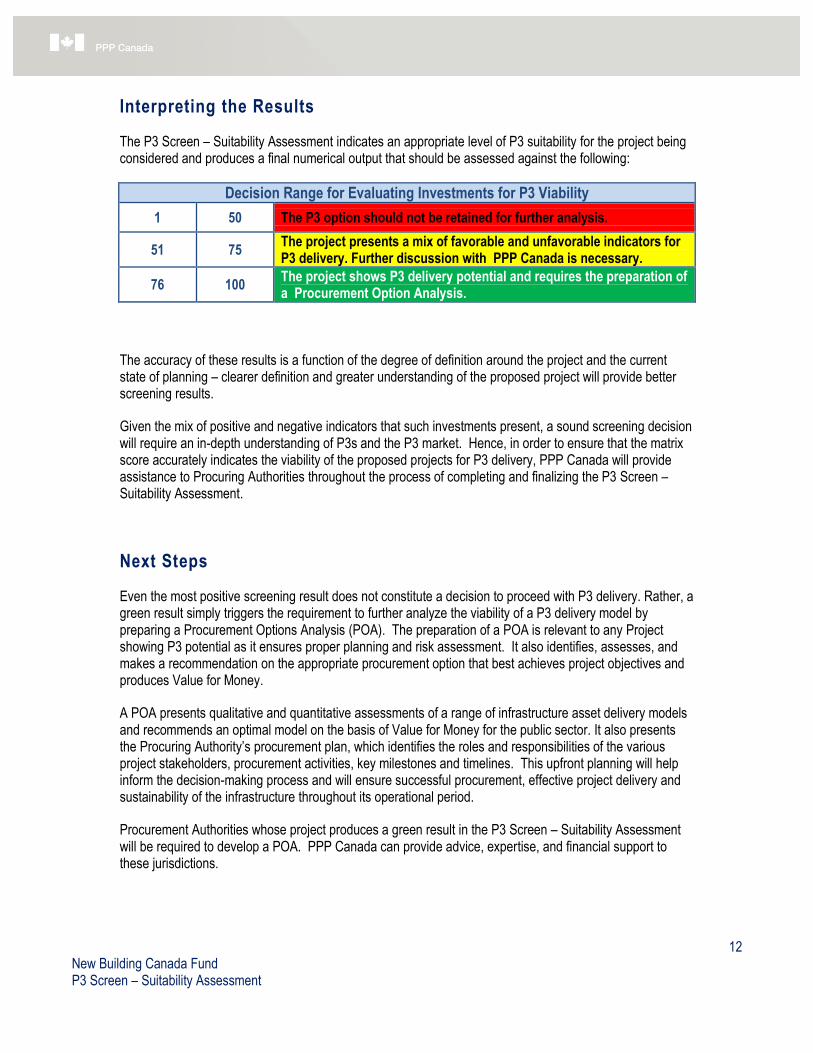
12 New Building Canada Fund P3 Screen – Suitability Assessment
Interpreting the Results
The P3 Screen – Suitability Assessment indicates an appropriate level of P3 suitability for the project being considered and produces a final numerical output that should be assessed against the following:
Decision Range for Evaluating Investments for P3 Viability
1 50 The P3 option should not be retained for further analysis.
51 75 The project presents a mix of favorable and unfavorable indicators for P3 delivery. Further discussion with PPP Canada is necessary.
76 100 The project shows P3 delivery potential and requires the preparation of a Procurement Option Analysis.
The accuracy of these results is a function of the degree of definition around the project and the current state of planning – clearer definition and greater understanding of the proposed project will provide better screening results.
Given the mix of positive and negative indicators that such investments present, a sound screening decision will require an in-depth understanding of P3s and the P3 market. Hence, in order to ensure that the matrix score accurately indicates the viability of the proposed projects for P3 delivery, PPP Canada will provide assistance to Procuring Authorities throughout the process of completing and finalizing the P3 Screen – Suitability Assessment.
Next Steps
Even the most positive screening result does not constitute a decision to proceed with P3 delivery. Rather, a green result simply triggers the requirement to further analyze the viability of a P3 delivery model by preparing a Procurement Options Analysis (POA). The preparation of a POA is relevant to any Project showing P3 potential as it ensures proper planning and risk assessment. It also identifies, assesses, and makes a recommendation on the appropriate procurement option that best achieves project objectives and produces Value for Money.
A POA presents qualitative and quantitative assessments of a range of infrastructure asset delivery models and recommends an optimal model on the basis of Value for Money for the public sector. It also presents the Procuring Authority’s procurement plan, which identifies the roles and responsibilities of the various project stakeholders, procurement activities, key milestones and timelines. This upfront planning will help inform the decision-making process and will ensure successful procurement, effective project delivery and sustainability of the infrastructure throughout its operational period.
Procurement Authorities whose project produces a green result in the P3 Screen – Suitability Assessment will be required to develop a POA. PPP Canada can provide advice, expertise, and financial support to these jurisdictions.

13 New Building Canada Fund P3 Screen – Suitability Assessment
Copyright © 2022 FDOKUMEN