Water security and Egypt,,,,a water-starved country , Egypt depends totally on the flow from the...
83
August 2014 CENTER FOR NATION RECONSTRUCTION AND CAPACITY DEVELOPMENT United States Military Academy West Point, New York 10996 Water As A Conflict Driver: Estimating The Effects Of Climate Change And Hydroelectric Dam Diversion On Nile River Stream Flow During The 21 st Century Water As A Conflict Driver: Estimating The Effects Of Climate Change And Hydroelectric Dam Diversion On Nile River Stream Flow During The 21 st Century Prepared By Bruce Keith, Kevin Epp, Michael Houghton, Jonathan Lee, Stream Flow During The 21 Century Stream Flow During The 21 Century and Robert Mayville Department of Systems Engineering United States Military Academy Prepared For C Coastal Hydrology Laboratory, Engineer Research and Development Center 3909 Halls Ferry Road Vicksburg, MS 39180-6199 Report 2014-4 DTIC: AXXXXXXX DISTRIBUTION A. Approved for public release; distribution is unlimited
-
Upload
independent -
Category
Documents
-
view
1 -
download
0
Transcript of Water security and Egypt,,,,a water-starved country , Egypt depends totally on the flow from the...

August 2014CENTER FOR NATION RECONSTRUCTION AND
CAPACITY DEVELOPMENT
United States Military AcademyWest Point, New York 10996
Water As A Conflict Driver: Estimating The Effects Of Climate Change And Hydroelectric Dam Diversion On Nile River
Stream Flow During The 21st Century
Water As A Conflict Driver: Estimating The Effects Of Climate Change And Hydroelectric Dam Diversion On Nile River
Stream Flow During The 21st Century
Prepared ByBruce Keith, Kevin Epp, Michael Houghton, Jonathan Lee,
Stream Flow During The 21 CenturyStream Flow During The 21 Century
pp gand Robert Mayville
Department of Systems EngineeringUnited States Military Academy
Prepared ForCCoastal Hydrology Laboratory,
Engineer Research and Development Center3909 Halls Ferry Road
Vicksburg, MS 39180-6199
Report 2014-4DTIC: AXXXXXXX
DISTRIBUTION A. Approved for public release; distribution is unlimited

The views and opinions expressed or implied in this publication are solely those of the authors and should not be construed as policy or carrying the official sanction of the US Army, the Department of Defense, United States Military Academy, or
other agencies or departments of the US government.
The cover photo of the Blue Nile Falls in Bahir Dar Ethiopia was provided by Dr. Bruce Keith

Water As A Conflict Driver: Estimating The Effects Of Climate Change And Hydroelectric Dam
Diversion On Nile River Stream Flow During The 21st Century
Page | 1
About Us The Superintendent of the United States Military Academy (USMA) at West Point officially approved the creation of the Center for Nation Reconstruction and Capacity Development (C/NRCD) on 18 November 2010. Leadership from West Point and the Army realized that the United States Army, as an agent of the nation, would continue to grapple with the burden of building partner capacity and nation reconstruction for the foreseeable future. The Department of Defense (DoD), mainly in support of the civilian agencies charged with leading these complex endeavors, will play a vital role in nation reconstruction and capacity development in both pre and post conflict environments. West Point affords the C/NRCD an interdisciplinary and systems perspective making it uniquely postured to develop training, education, and research to support this mission. The mission of the C/NRCD is to take an interdisciplinary and systems approach in facilitating and focusing research, professional practice, training, and information dissemination in the planning, execution, and assessment of efforts to construct infrastructure, networks, policies, and competencies in support of building partner capacity for communities and nations situated primarily but not solely in developing countries. The C/NRCD will have a strong focus on professional practice in support of developing current and future Army leaders through its creation of cultural immersion and research opportunities for both cadets and faculty. The research program within the C/NRCD directly addresses specific USMA needs:
• Research enriches cadet education, reinforcing the West Point Leader Development Systems through meaningful high impact practices. Cadets learn best when they are challenged and when they are interested. The introduction of current issues facing the military into their curriculum achieves both.
• Research enhances professional development opportunities for our faculty. It is important to develop and grow as a professional officer in each assignment along with our permanent faculty.
• Research maintains strong ties between the USMA and Army/DoD agencies. The USMA is a tremendous source of highly qualified analysts for the Army and the DoD.
• Research provides for the integration of new technologies. As the pace of technological advances increases, the Academy's education program must not only keep pace but must also lead to ensure our graduates and junior officers are prepared for their continued service to the Army.
• Research enhances the capabilities of the Army and DoD. The client-based component of the C/NRCD research program focuses on challenging problems that these client organizations are struggling to solve with their own resources. In some cases, USMA personnel have key skills and talent that enable solutions to these problems.
For more information please contact:
Center for Nation Reconstruction and Capacity Development Attn: Dr. John Farr, Director Department of Systems Engineering Mahan Hall, Bldg. 752 West Point, NY 10996 [email protected] 845-938-5206

Water As A Conflict Driver: Estimating The Effects Of Climate Change And Hydroelectric Dam
Diversion On Nile River Stream Flow During The 21st Century
Page | 2
This Page Intentionally Left Blank

Water As A Conflict Driver: Estimating The Effects Of Climate Change And Hydroelectric Dam
Diversion On Nile River Stream Flow During The 21st Century
Page | 3
ABSTRACT
The purpose of this study is to employ estimates of precipitation and temperature changes from a large number of General Circulation Models (GCMs) to determine the potential effect of climate change on the carrying capacity (volume) of the Nile River throughout the 21st Century. We employ estimates from 33 General Circulation Models (GCM), inclusive of Representative Concentration Pathways (RCP) 4.5 and 8.5, within a Vensim model in order to model the dynamic interplay between climate change and river hydrology for the Nile River Basin. We subdivided the time periods into 30-year intervals for 2010-2039 (early century), 2040-2069 (mid century), and 2070-2099 (late century). Our analysis offers several key findings. First, precipitation is likely to increase throughout the Nile River Basin with the possible exception of Egypt. Second, temperature is likely to increase throughout the Nile River Basin with the most pronounced increases in Sudan and Egypt. Third, the effect of climate change on the Nile River is likely to result in a net increase in water within that portion of the region where the Nile originates but a net decrease in water among downstream countries in the region. We use these results to discuss the potential effect of the proposed reservoir fill rate for the Grand Ethiopian Renaissance Dam, which is anticipated to be on-line in 2017.

Water As A Conflict Driver: Estimating The Effects Of Climate Change And Hydroelectric Dam
Diversion On Nile River Stream Flow During The 21st Century
Page | 4
This Page Intentionally Left Blank
Water As A Conflict Driver: Estimating The Effects Of Climate Change And Hydroelectric Dam
Diversion On Nile River Stream Flow During The 21st Century
Page | 5
TABLE OF CONTENTS Chapter Topic Page
1 Introduction 1 1.1 Introduction to Research 1 1.2 Problem Statement 2 1.3 Scope of Work 2 1.4 Client 2 1.5 Nile River Basin 3 1.6 Modeling Approach 4
2 Literature Review 6 2.1 Introduction 6 2.2 Water Resources in the Nile River Basin 7 2.2.1 White Nile 8 2.2.2 Blue Nile 10 2.2.3 Atbara River 10 2.2.4 Other Water Sources 11 2.2.4.1 Egypt 11 2.2.4.2 Sudan 12 2.2.4.3 Ethiopia 13 2.3 Climate Change 15 2.3.1 Precipitation 15 2.3.2 Temperature 16 2.4 The Grand Ethiopian Renaissance Dam 16 2.4.1 Impact on River Flow 17 2.5 Propensity for Conflict 18 2.6 Summary 19
3 Methodology 20 3.1 Data Sources 20 3.2 Model Development 21 3.2.1 Modeling Hydrology 22 3.2.2 Modeling Climate Change 24 3.3 Modeling Assumptions 33
4 Results 34 4.1 Climate Change Model 35 4.2 Impact of the Grand Renaissance Dam 39
5 Discussion 45 5.1 Model Validation 48
5.2 A Note on Population Change and Water Capacity in the Nile River Basin
51
5.2.1 Validation of Demographic Models 56 5.3 Toward the Evolution of Water Management System 58
6 Conclusion 61 7 References 62
Appendix A GCM Models Employed By Study 65 Appendix B GCM Estimates for Precipitation and Temperature 67

Water As A Conflict Driver: Estimating The Effects Of Climate Change And Hydroelectric Dam
Diversion On Nile River Stream Flow During The 21st Century
Page | 6
LIST OF FIGURES Number Figure Title Page
1 Map of the Nile River Basin 7 2 Diagram of Nile River Flow 9 3 Hydrology Model 23 4 Hydrology Estimates for the Nile River Tributaries with Constant
Climate 24
5 Climate Change Model 26 6 Nile River Rainfall Change in the 21st Century 35 7 Temperature Change in the 21st Century 36 8 Effects of Climate Change on Streamflow in the Nile River 38 9 Effects of GERD Fill Rate on Outflow to GERD Reservoir 39
10 Effects of GERD Fill Rate on Streamflow in the Blue Nile River 41 11 Effects of GERD Fill Rate on Streamflow in the Nile River Sudan 42 12 Effects of GERD Fill Rate on Streamflow in the Nile River Egypt 43 13 Validation Comparison Between Historic and Estimated Values 49 14 Egypt Nested Demographic Model 52 15 Projected Population for Egypt, 1994-2100 54 16 Projected Population for Sudan, 1994-2100 55 17 Projected Population for Ethiopia, 1994-2100 56
LIST OF TABLES
Number Table Title Page 1 Modeling Precipitation Change on Streamflow 2 The Impact of the Grand Ethiopian Renaissance Dam 3 Validation of Population Estimates by Country

Water As A Conflict Driver: Estimating The Effects Of Climate Change And Hydroelectric Dam
Diversion On Nile River Stream Flow During The 21st Century
Page | 1
Chapter 1 Introduction
1.1 Introduction to Research
The Nile River Basin is a dynamic system, which represents a potential source of conflict
given its finite water resources, growing population, challenges with food security, and reliance
on hydroelectric power as a major energy source. Within the basin, there is an emerging
consensus that climate change will increase average temperatures, though there is less certainty
about how precipitation may change in the basin; nonetheless, changes in precipitation are not
expected to balance the higher anticipated rates of evaporation associated with higher
temperatures. Thus, climate change is likely to increase competition for water in the region and
potentially exacerbate extant tensions and regional conflict. In the midst of this uncertainty,
Ethiopia is building a large, hydroelectric dam along the Blue Nile, just south of the Ethiopia-
Sudan border. Referred to as the Grand Ethiopian Renaissance Dam (GERD), this facility will
attempt to provide the country with sustainable energy throughout the 21st Century. As Ethiopia
fills the reservoir following the construction of the GERD post 2017, water flow from the Nile
River will inevitably decrease. The result could intensify the propensity for conflict throughout
the region as resource constraints affect the downstream states of Sudan and Egypt.
This study represents a joint interdisciplinary effort undertaken with undergraduate
students at Columbia University and the U.S. Military Academy in an effort to quantify the
extent of these deficits. Students at Columbia University generated data from 33 General
Circulation Models (GCMs) using two scenarios of future greenhouse gas concentrations
(RCPs); West Point cadets incorporated this information into a dynamic systems model that they
specifically designed for the problem area of this study. Together, these teams of students
Water As A Conflict Driver: Estimating The Effects Of Climate Change And Hydroelectric Dam
Diversion On Nile River Stream Flow During The 21st Century
Page | 2
developed an analysis to estimate the potential effect of climate change on the carrying capacity
(volume) of the Nile River throughout the 21st Century, taking into consideration the GERD’s
reservoir fill rate between 2017 and mid-century.
1.2 Problem Statement
The purpose of this study is to examine the impact of human and physical factors on the
streamflow of the Nile River and its subsequent effects on regional stability in the Nile River
Basin. Our model seeks to develop a refined understanding of the dynamic interaction climate
change and water resource utilization on streamflow. Our analysis will provide estimates with
which to consider the propensity for future instability and conflict in the Nile River Basin.
1.3 Scope of Work
This project consists of three phases: First, drawing on data provided by a team of
Columbia University undergraduate (Bower et al. 2013), we model the streamflow of the Nile
River and its use by selected countries within its geographical boundary. Second, we assess the
impact of climate change and the GERD reservoir fill rate on this streamflow. Third, we evaluate
the potential for conflict as a result of changes in resource adequacy associated with the
dynamics of water usage. To simulate hydrological model, we employ VENSIM to assess the
effect of climate change on river streamflow for Ethiopia and downstream countries. Through the
design of nested, stochastic models within the macro-level hydrology model, we can estimate the
confounding effects of these factors on the dynamics of stream flow in the Nile River Basin. We
use our model to assess the propensity for conflict in the region in a manner that can provide our
stakeholders with useful information.

Water As A Conflict Driver: Estimating The Effects Of Climate Change And Hydroelectric Dam
Diversion On Nile River Stream Flow During The 21st Century
Page | 3
1.4 Client
Our primary stakeholder is the Engineer Research and Development Center (ERDC),
headquartered in Vicksburg, Mississippi, who graciously provided funds in support of this
project. A research-oriented laboratory of the Army Corps of Engineers, ERDC’s Coastal
Hydrology Lab has an academic interest in the utilization of forecasting models capable of
informing planning associated with the timing and management of operational services,
distribution, and supplies of water systems. Assessments of regional and local stability require
the development of models capable of incorporating the dynamic interactions between water and
the surrounding physical and social infrastructure. The Nile River Basin is a case study
reflective of these concerns. We envision that our work will provide ERDC with a quantitative
analysis, both short and long-term, of regional stability in the Nile River Basin. Ideally, this
analysis will equip them with models sufficient to inform discussions on the propensity for
regional conflict in the Nile River Basin specifically and the development of models that might
provide templates for contextual analyses in other areas.
1.5 The Nile River Basin
Egypt, Sudan, and Ethiopia, are currently home to over 200 million people who rely heavily
on the Nile River for their survival. Presently, Ethiopia is constructing a large, hydroelectric
dam along the Nile River a few miles south of the Ethiopia–Sudanese border. Although not the
first dam to be built along the Nile River, the Grand Ethiopian Renaissance Dam (GERD) is one
of the largest (Shiferaw 2014). Ethiopia contends that the dam will not impact the streamflow of
the Nile River, though the fill rate of the reservoir, coupled with its subsequent timing, could
drastically attenuate streamflow in downstream countries (Shiferaw 2014). The largest factors in

Water As A Conflict Driver: Estimating The Effects Of Climate Change And Hydroelectric Dam
Diversion On Nile River Stream Flow During The 21st Century
Page | 4
streamflow are the fill rate of the GERD, the predicted climate change in the basin, and
population growth. We will focus on the first two factors in this study with some preliminary
analysis provided on the third.
The GERD is a part of Ethiopia’s recent strategy to invest in renewable energy. The most
prevalent of these investments is hydroelectric power. Ethiopia established a five-year plan to
salvage 10,000 MW of hydroelectric energy within its borders. The largest of these endeavors is
the GERD, which will produce an estimated 6,000 MW upon completion. This dam requires a
reservoir capable of containing 63 billion cubic meters (BCM) of water, which will need to be
filled to maximize the dam’s full capacity Schwartzstein (2013). Impacts of the GERD are
numerous, the most glaring of which is the diversion of water from the Blue Nile for an interval
of several years in order to fill the dam’s reservoir. In using water from the Blue Nile River to
fill the dam’s reservoir, Ethiopia, in principle, violates the 1959 Nile River agreement between
Egypt and Sudan, (from which Ethiopia and other Nile River Basin countries were not included),
and potentially reduces available water to both Sudan and Egypt. The fill rate of the GERD
reservoir will figure heavily in our analysis, a quick fill rate will require more water over a
shorter time interval, which may reduce the streamflow of the Nile River. In drawing more water
from the Nile, downstream countries will have less access to water. Because Sudan and Egypt
rely so heavily on the Nile for survival, the fill rate of the GERD is a key factor in determining
the propensity for conflict within the Nile River region (Schwartzstein 2013).
1.6 Modeling Approach
We are using a dynamic systems approach to model the impact of climate change and the
GERD fill rate on streamflow and its subsequent potential for conflict within the Nile River

Water As A Conflict Driver: Estimating The Effects Of Climate Change And Hydroelectric Dam
Diversion On Nile River Stream Flow During The 21st Century
Page | 5
Basin. System dynamics is an established method for modeling the complex interdependencies,
interactions, and feedback loops found among political, economic, and social systems (Sterman
2000; Forrester 1971). This method leverages computer programs to incorporate specified
relationships and feedback loops in the system. Our study uses a VENSIM software platform to
develop our nested and holistic models.
Building on the model developed by Keith et al. (2013), we incorporate several nested
models to account for changes in climate, precipitation, and river flow from the GERD reservoir.
Through the use of theoretical distributions and data from a team of undergraduate students at
Columbia University, our model accounts for annual temporal changes to these factors. The
VENSIM model uses estimates drawn from historical data from 1994-2012 to generate estimates
on Nile River streamflow through Ethiopia, Sudan and Egypt, for future year 2014-2100.

Water As A Conflict Driver: Estimating The Effects Of Climate Change And Hydroelectric Dam
Diversion On Nile River Stream Flow During The 21st Century
Page | 6
Chapter 2 Literature Review
2.1 Introduction
Three key topics are pertinent to our assessed propensity for conflict within the Nile
River Basin during the 21st Century. First, water resources throughout the region must be
reviewed to account for the hydrology and average annual streamflow of the Nile River. Second,
climate change, specifically with regards to precipitation and temperature, is critical to
understand how and where streamflow is likely to change throughout the 21st Century. Third,
the GERD’s reservoir fill rate, given the potential effects it may have on stream flow, must be
examined after taking into consideration estimates of streamflow. These three topics interact to
establish the conditions for conflict within the Nile River Basin during the 21st Century. We
organize this section to consider each of these topics in turn.
One discussion point necessary to highlight early in this review is Ethiopia’s adherence to
a treaty signed initially in 1929 between Egypt and the United Kingdom, then modified to
include Sudan in 1959. This treaty grants Egypt nearly exclusive rights to water in the Nile
River. When signed, Egypt and Sudan agreed to allot Egypt 75 percent of the Nile River’s water
and Sudan 25 percent (King 2013). Ethiopia, source of the Blue Nile and Atbara Rivers, is
technically prohibited from drawing any water from these two tributaries, which, combined,
account for nearly 85 percent of the streamflow in the Nile River (Ahmed 2008). While
Ethiopia’s national investment in hydropower and the construction of the GERD has threatened
to disturb the status quo within the region, as accorded by this treaty, we will assume throughout
this study that Ethiopia will adhere to the treaty with the sole exception of drawing water from
the Blue Nile to fill the dam’s reservoir.

Water As A Conflict Driver: Estimating The Effects Of Climate Change And Hydroelectric Dam
Diversion On Nile River Stream Flow During The 21st Century
Page | 7
Figure 1: Map of the Nile River Basin1
2.2 Water Resources in the Nile River Basin
The Nile River flows from South to North and draws on three different regional
tributaries: the Blue Nile, White Nile, and Atbara Rivers (Figure 1). All three rivers have
different precipitation and evaporation rates, which constitutes a need to demarcate them within
1 Horton (2013).
Region 1 (Egypt)
Region 2 (Sudan)
Region 3 (Ethiopia)
Region 4

Water As A Conflict Driver: Estimating The Effects Of Climate Change And Hydroelectric Dam
Diversion On Nile River Stream Flow During The 21st Century
Page | 8
our model. By defining each river as a separate system that feeds into an aggregated Nile River,
we can more specifically define the streamflow of the Nile River throughout the Basin, including
how it might be affected by the construction of the GERD. We will assume that water hydrology
in the Nile River occurs exclusively through an interaction between precipitation and
temperature.
Streamflow of the Nile River is depicted in Figure 2, which is drawn from Ahmed
(2008). The White Nile River begins at Lake Victoria and flows northward into Sudan. The Blue
Nile River begins at Lake Tana, located in the Ethiopian Highlands near Bahir Dar, and flows
northeast into Sudan. The Blue and White tributaries join near Khartoum, Sudan; together, these
two tributaries account for 82.5 Billion Cubic Meters (BCM). The Atbara River, which is highly
seasonal, merges with the Nile north of Khartoum, Sudan. As the Nile flows into Egypt through
the Answan Dam, the total streamflow is approximately 84 BCM.
2.2.1 White Nile
Depending on the season, the White Nile contributes roughly 30 percent of the overall
streamflow to the Nile River (Tesemma 2009), with an average annual flow of 29 BCM (Ahmed
2008). Similar to the Blue Nile River, the White Nile is affected by seasonality due to its
location and topography. The wet season of the White Nile Basin runs from April to October.
Moreover, this part of the region experiences more evaporation than rainfall, with 4.5 BCM lost
annually to evaporation (Ahmed 2008). Coupled with the vegetation and swamps that cover the
majority of the basin, the amount of evaporation along the White Nile decreases its streamflow,
leaving it vulnerable to attrition (Tesemma 2009).

Water As A Conflict Driver: Estimating The Effects Of Climate Change And Hydroelectric Dam
Diversion On Nile River Stream Flow During The 21st Century
Page | 9
Figure 2: Diagram of Nile River Flow2
2. Ahmed (2008)

Water As A Conflict Driver: Estimating The Effects Of Climate Change And Hydroelectric Dam
Diversion On Nile River Stream Flow During The 21st Century
Page | 10
The geography of the Blue Nile Basin consists of highlands, hills, and valleys, all of
which factor into the overall precipitation and retention of water in the basin. The Blue Nile
Basin receives an average of 1,394mm of rainfall per year, the most of any sub-basin in the Nile
River Region (Tesemma 2009). The total annual mean runoff of water from the Blue Nile River
is estimated by Awalachew (2007) to be 54.8 Billion Cubic Meters (BCM). Our primary focus
throughout this analysis will be on the Blue Nile, as it is the primary contributor to the Nile River
and the sole tributary affected by the GERD.
2.2.2 Blue Nile
Ethiopia consists of 12 different water basins, with the western basins accounting for the
majority of the water resources in the country. The largest of these water sources is the Blue Nile
Basin, which accounts for roughly 55 percent of the country’s water (King 2013). The Blue
Nile River lies within the Blue Nile Basin and represents the sole provider of streamflow to the
GERD (King 2013). The Blue Nile Basin experiences an average annual rainfall of 1,346 mm
(Ahmed 2008) and is responsible for 60 percent of the Nile River’s streamflow, making the
context of the GERD much more pivotal to potential tensions in the Nile River Basin (King
2013). Furthermore, the aggregated Blue Nile River suffers from frequent dry periods, although
the individual tributaries that supply it do not suffer from such seasonality (Tesemma 2009). The
dry periods resulting from this seasonality can compound the effect of the GERD on downstream
countries, along with the severity of filling the reservoir (King 2013).
2.2.3 Atbara River
The smallest of the three tributaries to the Nile River, the Atbara contributes an average
of 8.2 BCM of streamflow per year (Awalachew 2007). The Atbara Basin experiences the least

Water As A Conflict Driver: Estimating The Effects Of Climate Change And Hydroelectric Dam
Diversion On Nile River Stream Flow During The 21st Century
Page | 11
amount of precipitation of any of the three tributaries of the Nile. With an annual average
rainfall of 553 mm (Ahmed 2008), the Atbara is a non-factor during some months throughout the
year (Awalachew 2007).
2.2.4 Other Water Sources
Insofar as water is a critical resource in the 21st Century for sustainment of the Nile River
region and countries have differential access to the Nile River and its tributaries, water sources
other than the Nile become an important topic for consideration. Although the sheer volume of
the Nile River and its contribution to the sustenance of the region is unmatched by any other
water source, other water sources provide substantial support to the Basin’s population.
2.2.4.1 Egypt
Groundwater resources in Egypt contain 4.8 BCM of water. The majority of this water
originates in the Nubian Sandstone Aquifer, found in the western desert (EO Earth, Egypt 2010).
The Nubian Aquifer contributes three-quarters of the extant groundwater resources in Egypt.
The western region of Egypt, located far from any other major water resource, makes this aquifer
an important resource for water usage in Egypt. Other groundwater sources flow into Egypt from
its western border shared with Libya, contributing 1 BCM annually (EO Earth, Egypt 2010).
Drainage water from Upper Egypt, located south of Cairo, flows back into the Nile at an
annual rate of 4 BCM (EO Earth, Egypt 2010). Further north, drainage water found in the Nile
Delta contributes to an annual overall recharge of 14 BCM(EO Earth, Egypt 2010). In 2002,
treated domestic wastewater was recorded as adding 2.97 BCM to the total annual water sources
in Egypt (EO Earth, Egypt 2010). Currently, desalinization plants located on Egypt’s eastern

Water As A Conflict Driver: Estimating The Effects Of Climate Change And Hydroelectric Dam
Diversion On Nile River Stream Flow During The 21st Century
Page | 12
coastline with the Red Sea and its western coastline with the Mediterranean contribute a mere 0.1
BCM per year (EO Earth, Egypt 2010).
Despite the presence of several water sources in Egypt, nearly all of them, save for the
Nile, are negligible in their contribution to the country’s total annual water capacity. A
significantly reduced streamflow to the Nile River attributed to a one-time shock (e.g., GERD) or
a long-time stressor (e.g., climate change), is likely to destabilize Egypt’s agricultural production
and thereby exacerbate the propensity for conflict within the Nile River region.
2.2.4.2 Sudan
Unlike Egypt to its north, the landmass of Sudan is not dominated by desert. Rather, 42
percent of the country’s total landmass is cultivable and approximately 27 percent is covered by
forest resources (EO Earth, Sudan 2008). Sudan’s water sources are divided among several
basins within its borders. These basins include the Nile Basin, the Northern Interior Basins, the
Lake Chad Basin, the Northeast Coast Basins, and the Rift Valley Basins. Despite having several
different basins for water resource use, 79 percent of the total landmass of Sudan falls within the
Nile Basin (EO Earth, Sudan 2008). Consequently, while other basins in Sudan may provide
water resources to the country, without the Nile, Sudan’s water capacity is at a loss. Although
relatively small in comparison to the Nile, these other basins contribute notably to Sudan’s
aggregate water resources.
Water sources other than the Nile contribute 7km /year to the total water resource
available in Sudan (EO Earth, Sudan 2008). The largest of the alternative water sources include
the Gash and Baraka rivers located near the Mediterranean, though their respective streamflow is

Water As A Conflict Driver: Estimating The Effects Of Climate Change And Hydroelectric Dam
Diversion On Nile River Stream Flow During The 21st Century
Page | 13
highly seasonal. Seasonal volatility in streamflow of internal alternative water sources requires
the Sudanese farmers to rely more heavily on the Nile during dry seasons.
In conjunction with surface water sources, like the Gash and Baraka rivers, Sudan has
access to groundwater resources, including the Nubian Sandstone basin, which it shares with
Egypt, and the Umm Ruwaba Basin. Additionally, Sudan reuses agricultural drainage water,
desalinated water, and reused treated wastewater, though these latter sources contribute
negligibly to Sudan’s overall water resources (EO Earth, Sudan 2008). Sudan’s total renewable
water resources amount to 149km peryear, which is the maximum amount of water annually
available to Sudan. Due to the 1959 Nile River Agreement with Egypt, only 64.5 BCM is
technically available to Sudan; of this amount, only 30 BCM is internally generated (EO Earth,
Sudan 2008).
With such a small portion of renewable water resources generated within its own borders,
Sudan must rely heavily on the Nile River for sustenance. While Sudan’s available water from
the Nile is limited by the 1959 Nile River Agreement, any further reductions may contribute to
national and/or regional destabilization.
2.2.4.3 Ethiopia
Ethiopia sees more precipitation than its Nile River Basin counterparts, and contains
comparatively less desert. Along with having more arable landmass, Ethiopia harbors an
impressive twelve water basins, compared with Sudan’s five. These basins are grouped into four
major regions: The Nile Basin, The Rift Valley, The Shebelli-Juba Basin, and The North East
Coast (EO Earth, Ethiopia 2008). The Nile Basin is located in the north-west portion of Ethiopia,
the Rift Valley Basin in the country’s southern region, the Shebelli-Juba Basin in the country’s

Water As A Conflict Driver: Estimating The Effects Of Climate Change And Hydroelectric Dam
Diversion On Nile River Stream Flow During The 21st Century
Page | 14
southeastern region, and the North East Coast responsible for the north-east portion (EO Earth,
Ethiopia 2008). The total annual runoff from these basins amounts to 122 BCM annually,
roughly 85 of which coming from the Nile Basin. The Rift Valley and Shebelli-Juba Basins
account for 29 BCM and 9 BCM, respectively, with The North East Coast contributing a
negligible amount of water resources (EO Earth, Ethiopia 2008). Similar to Sudan and Egypt,
the majority of Ethiopia’s water resources can be attributed to the Nile.
Seasonal variation in precipitation throughout Ethiopia affects their agriculture and
lifestyle. Of the 122 BCM of annual runoff found within the country, 70 percent of this volume
occurs between the months of June and August, the region’s wet season (EO Earth, Ethiopia
2008). These intense wet seasons can occasionally cause flooding, especially along the Awash
River in the Rift Valley, in the Baro-Akobo river basin found within the Nile Basin, and the
Wabe-Shebelle river basin found within the Shebelle-Juba basin (EO Earth, Ethiopia 2008). This
flooding causes damage to local infrastructures and crops in communities around these areas (EO
Earth, Ethiopia 2008). Although occasionally detrimental to local populations, these wet seasons
also provide the necessary precipitation needed for crop sustainment and population growth.
To control flooding attributable to seasonal fluctuations in streamflow, dams are
extensively utilized throughout Ethiopia. Although water from these dams contributes an
estimated 3.5 BCM to the overall available water resources of Ethiopia (EO Earth, Ethiopia
2008), the vast majority of the dams are located along the Blue Nile River.
Total annual groundwater runoff in Ethiopia is dominated by the Nile River. Dams are
commonly used throughout Ethiopia to generate hydroelectric power, though the Blue Nile River
is the only water resource in Ethiopia large enough to support dams that can significantly impact
the country. While Egypt, and to a lesser extent Sudan, focus on the detrimental effects of these

Water As A Conflict Driver: Estimating The Effects Of Climate Change And Hydroelectric Dam
Diversion On Nile River Stream Flow During The 21st Century
Page | 15
dams on downstream streamflow, Ethiopia acknowledges the critical importance of the Blue Nile
River for its economic and social development.
2.3 Climate Change
We define climate change in the Nile River Basin as the interaction of two variables,
namely, precipitation and temperature. Both variables were modeled by a team at Columbia
University using 33 General Circulation Models (GCMs). Precipitation and temperature have
direct effects on the hydrology of the Nile River. The following sections will focus on the
predicted changes for precipitation and temperature throughout the next century, and how both
will affect the hydrology of countries within the region.
2.3.1 Precipitation
Precipitation differs across the regions depicted in Figure 1 above. Because of these
differences, precipitation change in each country must be analyzed independent of the others in
the Nile River Basin. According to historical data, Egypt receives 43.8mm/year of rainfall on
average (Bower et al. 2013). Throughout the next century, precipitation in Egypt is projected to
decrease by roughly 9.3% (Bower et al. 2013). Sudan receives an annual 91.25 mm of rainfall
which is predicted to increase by 18.7% over the next century (Bower et al. 2013). Ethiopia
receives an average of 839.5 mm in rainfall annually; throughout the 21st Century, it is projected
to have an increase in precipitation of 10.1% (Bower et al. 2013).
The increase in precipitation in Sudan and Ethiopia is promising in potentially lessening
the propensity for conflict within the Nile River Basin. However, the projected loss of 10% of

Water As A Conflict Driver: Estimating The Effects Of Climate Change And Hydroelectric Dam
Diversion On Nile River Stream Flow During The 21st Century
Page | 16
precipitation in Egypt during the same time interval is disconcerting. While Sudan and Ethiopia
will likely receive an increase in precipitation, Egypt will encounter further water scarcity. This
lack of precipitation, compounded with any restriction of water flow due to the construction of
the GERD, will only further exacerbate tensions within the Nile River Basin. If the predicted
precipitation increase in Sudan and Ethiopia can successfully diminish the effect the predicated
precipitation shortage has on Egypt, ensuing tensions that might arise from this climate change
can be potentially mitigated.
2.3.2 Temperature
The second major source of climate change in the Nile River Basin is temperature.
Similar to precipitation, temperature varies between each of the three major countries in the Nile
River Basin. The average historical temperature in Egypt is 22.32 C (72.18 F) and is predicted to
increase by 3.6 C (6.5 F) over the next century (Bower et al. 2013). Sudan’s historical average
temperature is recorded as 27.89 C (82.2 F) and is predicted to increase by 3.0 C (5.4 F) over the
next century (Bower et al. 2013). Ethiopia’s average historical temperature is 23.67 C (74.61 F)
and is predicted to increase by 3.3 C (5.94 F) over the course of the next century (Bower et al.
2013).
All countries within the Nile River Basin are predicted to have an increase in
temperature, which will attenuate stream flow through increased evaporation. Higher evaporation
rates can strain agricultural production.
2.4 The Grand Ethiopian Renaissance Dam
With little access to electricity at the country level, the dam’s hydroelectric power has
tremendous potential to develop infrastructure within Ethiopia specifically and the Nile River

Water As A Conflict Driver: Estimating The Effects Of Climate Change And Hydroelectric Dam
Diversion On Nile River Stream Flow During The 21st Century
Page | 17
Basin in general. With a rated capacity of 5250MW, this dam will help Ethiopia achieve its UN
Millennium Development Goals (MDGs). The dam will give millions of people access to power
in a rapidly expanding population. Furthermore, the state can export hydroelectric power to
neighboring states, thanks in part to China’s nearly $1 billion foreign direct investment in the
transmission lines and generators, both of which are necessary to move the electricity (Perry
2013).
While the hydropower of the GERD appears to be purely beneficial, its payoffs are not
without its pitfalls to the initial economic situation. Capitalizing on this hydropower is
expensive. Despite financing from China, the debt capitalization for the approximately $4.8
billion project calls for a citizen bond buying program to do the bulk of the work; simply put,
this method is failing. Raising taxes, combating inflation, and compulsory bond buying are
indicative of massive financing issues. Furthermore, the dam is very inefficient. At a 33 percent
efficiency rate when used at full capacity, the power this dam produces will be comparatively
expensive; essentially, a smaller dam could have done the job more efficiently, and with lower
impacts socially, politically, and economically (Beyene 2011). In the context of conflict
potential, this inefficiency and its massive reservoir truly stepped up the costs for downstream
states, who will suffer flow reduction at unnecessarily high levels.
Given the hydropower potential of the Grand Renaissance Dam, the implications of its
construction span a multitude of impacts. From power exports and development to hydropower’s
relationship with irrigation and regional agriculture, the social, political, and economic impacts
will certainly play a significant role in the state and on conflict potential with its downstream
neighbors.
2.4.1 Impact on River Flow

Water As A Conflict Driver: Estimating The Effects Of Climate Change And Hydroelectric Dam
Diversion On Nile River Stream Flow During The 21st Century
Page | 18
With a reservoir capacity in excess of 16 trillion gallons, the timing and rate of associated
with the filling of this reservoir will has the potential to reduce stream flow in the Blue Nile
River. Ethiopia has reported fill rates that may vary between five and 25 percent of the
reservoir’s full supply level annually (King 2013). These values translate to an annual flow
reduction range of 3.54-17.7 percent of the entire Nile River, leading some to conclude that
variation in fill rates corresponds to dramatically different effects on downstream countries (King
2013). For example, a fill rate of 25% would reduce stream flow in the Nile River by as much as
17.7 percent; the impact on resource constraints for downstream countries could be disruptive.
Conversely, a 5 percent annual fill rate for the GERD reservoir might reduce power generation
for decades, thereby providing a disincentive to fill the reservoir this slowly. With reduced river
flow for several years, downstream states must turn to other sources, such as ground water, if
they intend on providing their populations with consistent resources for consumption and
agriculture.
While the GERD’s impact on the hydrology of the Nile River seems temporary as
the reservoir fills, the result may introduce major short-term shocks within the region. From
river flow reduction to evaporation and flooding control, the dam must be monitored carefully to
ensure hydrological impacts are within the tolerance interval of regional neighbors.
2.5 Propensity for Conflict
Construction of the GERD may heighten the potential for conflict in several ways. First,
the violation of the 1959 Nile River Agreement will create enhanced tension between Ethiopia
and its downstream neighbors, Sudan and Egypt. Another factor that will increase the potential
for conflict is the annual amount of water the GERD reservoir will take from the downstream

Water As A Conflict Driver: Estimating The Effects Of Climate Change And Hydroelectric Dam
Diversion On Nile River Stream Flow During The 21st Century
Page | 19
flow of the Blue Nile. Siphoning this flow from the Nile will leave less water for downstream
countries and have an immediate effect on their agriculture and water available for daily use. As
the amount of available water flowing to downstream countries decreases through changes in
climate and/or intentional diversion resulting from the GERD, tension in the Nile River Basin is
likely to increase. Clearly needed is a model that can examine the effects of various scenarios on
stream flow in the Nile River. Our proposed model may inform debate through a detailed
examination of the GERD and climate change on stream flow.
2.6 Summary
Current annual stream flow throughout the Nile River Basin is expected to deviate due to
changes in precipitation and temperature. Specifically, Egypt is projected to experience a
decrease in precipitation of 9.3%, Sudan’s precipitation may increase by 18.7%, and Ethiopia
may realize an increase in precipitation of 10.1% (Horton 2013). Likewise, the temperatures of
Egypt, Sudan, and Ethiopia may increase by 6.5F, 5.4F, 5.94F respectively. As the climate
changes throughout the Nile River Basin, the timing and rate of the GERD’s reservoir may
further attenuate the annual stream flow of the Nile to downstream countries by 3-17%.
VENSIM provides a tool with which to assess the dynamic interaction of these factors within the
Nile River Basin.

Water As A Conflict Driver: Estimating The Effects Of Climate Change And Hydroelectric Dam
Diversion On Nile River Stream Flow During The 21st Century
Page | 20
Chapter 3 Methodology
3.1 Data Sources
Four regions were included in this analysis. Collectively, these regions span the Nile
River Basin. Regions 1 and 2 are aligned with Egypt and Sudan/South Sudan respectively.
Region 3 includes most of Ethiopia while Region 4 represents the Lake Victoria area. Ethiopia is
the source of the headwaters of the Blue Nile and Atbara Rivers, which represents approximately
85% of the total volume of the Nile River. Seven other countries, including Burundi, the
Democratic Republic of Congo, Eritrea, Kenya, Rwanda, Tanzania, and Uganda, control, to
varying degrees, the headwaters of the White Nile, which represents 15% of the total flow of the
Nile River. These regions were selected because of hydrological features, approximate
administrative boundaries of nations, and the presence of at least one weather station to support
historical validation of the model.
Water data are drawn from the Food and Agriculture Organization of the United Nations
(2010, http://www.fao.org/nr/water/aquastat/main/index.stm) and the Encyclopedia of the Earth
via the water profiles on Ethiopia, Sudan, and Egypt (http://www.eoearth.org). These sources
provide data on the volume of the Nile in each of the three countries in addition to information
on estimated volumes of aquifers and annual rainfall (Table 1). We converted all water data into
U.S. gallons, which was originally presented using metrics associated with either millimeters per
day or kilometers cubed. We assume that the Nile and its major tributaries are regenerated
annually by rainfall; accordingly, average annual precipitation for Region 3 is 2.68477e+014
(FAO Aquastat data base) while that for Region 4 is set at 7.9146e+012 (Ismail 2010). Annual
renewable surface water produced internally within Region 3 feeds both the Blue Nile and

Water As A Conflict Driver: Estimating The Effects Of Climate Change And Hydroelectric Dam
Diversion On Nile River Stream Flow During The 21st Century
Page | 21
Atbara recharge. Calculation of recharge rates for Region 3 required a two-step process. First,
we summed reported measures of surface and groundwater produced internally using FAO
Aquastat data (http://www.fao.org/nr/wate/aquastat/data/query/results.html), subtracting the
overlap between surface and groundwater from this sum; this figure was then divided by the
long-term average precipitation figure reported by Aquastat. These calculations produced a
rainfall recharge rate for Ethiopia of .13029. Second, the estimated annual streamflow, drawn
from Ahmed (2008) and Awalachew (2007), were used as estimates for the Blue (1.28659e+013
gallons), White (7.9146e+012 gallons), and Atbara (2.99449e+012 gallons) Rivers. Values for
the Blue and Atbara Rivers were divided by the sum of Region 3’s annual average precipitation
and .13029, resulting in an annual estimated recharge rate for these tributaries; estimates for
these recharge rates are .36895 and .085061 for the Blue Nile and Atbara respectively. Thus, the
overall estimated recharge rate from total annual average precipitation in Region 3 is .0481 for
the Blue Nile and .0111 for the Atbara River.
Historical estimates for precipitation were drawn from Beck et al. (2005) for the years
1970-2000. Historical data on temperature were obtained from the University of Delaware based
on NOAA data. Estimates of temperature and precipitation in each of these four regions were
drawn from 33 independent General Circulation Models (GCMs) provided by Daniel Bader at
the Center for Climate Systems Research at Columbia University and reported in Bower et al.
(2013).
3.2 Model Development
Our model is built from the Vensim software platform (Sterman 2000). Vensim is a
visual modeling simulation program that allows for the conceptualization, analysis, and

Water As A Conflict Driver: Estimating The Effects Of Climate Change And Hydroelectric Dam
Diversion On Nile River Stream Flow During The 21st Century
Page | 22
optimization of models of dynamic systems. It provides a simple yet powerful way to build
simulation models from causal loop or stock and flow diagrams based on extant assumptions.3
This platform enables us to combine population growth models at the country level concurrent
with river flow for the region in order to develop an integrated dynamic system model.
3.2.1 Modeling Hydrology Our hydrology model is a simple representation of the Nile River inclusive of its major
tributaries: Blue Nile and Atbara in Ethiopia and the White Nile from Lake Victoria (Figure 2).
Initial values drawn from Ahmed (2008) and Awalachew et al. (2007) are used as estimates for
the Blue (1.28659e+013 gallons), White (7.9146e+012 gallons), and Atbara (2.99449e+012
gallons) Rivers. These rivers are regenerated by rainfall; average annual precipitation for Region
3 is 2.47371e+014 (FAO Aquastat data base) while that for Region 4 is set at 7.9146e+012 (FAO
2005; Ismail 2010). Precipitation changes for Regions 1 and 2 are entered later in the model
when taking into account climate change.
Prior to the introduction of climate change factors, the hydrology model assumes a
constant level of precipitation, which results in no variation in the hydrology of the river from
one year to the next (Figure 4). The three primary tributaries of the Nile River (White, Blue, and
Atbara) transport water from Lake Victoria in Uganda and the Ethiopian Highlands until the
three rivers merge together to form the Nile River near Khartoum, Sudan. Near this location,
the river volume is approximately 94.5km3 or 2.4964e13 gallons (Ahmed 2008). Our model, as
the sum of the river’s three tributaries, is slightly less than this volume as it flows through Sudan.
3 Stock is an amount or quantity of some variable; flow is a rate of change or the carrying capacity of a system capable of adding or subtracting from a stock. Both the carrying capacity (replenishment or decrement) and quantity (stock) are explicitly modeled. See Sterman (2000) on system dynamics in action.

Water As A Conflict Driver: Estimating The Effects Of Climate Change And Hydroelectric Dam
Diversion On Nile River Stream Flow During The 21st Century
Page | 23
Blue Nile
Inflow to BlueNile
Time to OutflowBlue to GERD
Ethiopia AnnualRainfall
EthiopiaPercentage
RainfallCaptured
Nile River Sudan
Blue Outflow toGERD Reservoir
+
-
White NileInflow intoWhite Nile
Renewable Inflowto White Nile
+White Outflow to
Sudan+
Time to OutflowWhite to Sudan
-
Sudan MaxConsumption Nile
+
Nile River EgyptNile Outflow to
Egypt+
Time to Outflowto Egypt
-
Sudan Nile Availablefor Consumption
Sudan TreatyAdherance
++
Nile Outflow toMediterranean
Sea
+
Time to Ouflowto Med
-
Initial ValueBlue Nile
Initial ValueWhite Nile
Sudan NileConsumption
AtbaraInflow to Atbara
Atbara Outflowto Sudan
Time to OutflowAtbara to Sudan
Initial ValueAtbara River
GERD fill rate
<Percent Change in BlueNile Flow as a Percent of
Precipitation Change>
<Percent Change inAtbara River Flow as aPercent of Precipitation
Change>
<Percent Change inWhite Nile Flow as a
Percent of PrecipitationChange>
Ethiopia SurfaceWater Produced
Internally
GERD ReservoirGERD ReservoirOutflow to Sudan
Time to OutflowGERD to Sudan
Blue Outflow toSudan
Time to OutflowBlue to Sudan
GERDDischarge Rate
<Region 3 Percent Change inNile River Flow as a Result of
Absolute Change inTemperature>
<Region 4 Percent Change inNile River Flow as a Result of
Absolute Change inTemperature>
<Region 3Precipitation
Change>
<Region 4Precipitation
Change>
<Region 2 Percent Change inNile River Flow as a Percent
Change of Precipitation Change>
<Region 2 Percent Change inNile River Flow as a Result of
Absolute Change inTemperature>
<Region 1 Percent Change inNile River Flow as a Percent of
Precipitation Change>
<Region 1 Percent Change inNile River Flow As a Result of
Absolute Change inTemperature>

Water As A Conflict Driver: Estimating The Effects Of Climate Change And Hydroelectric Dam
Diversion On Nile River Stream Flow During The 21st Century
Page | 24
Figure 3: Hydrology Model

Water As A Conflict Driver: Estimating The Effects Of Climate Change And Hydroelectric Dam
Diversion On Nile River Stream Flow During The 21st Century
Page | 25
Egypt and Sudan, via a 1959 treaty on the utilization of the Nile waters, prohibited the source
countries from consuming any water from the Nile (Elimam et al. 2008). This treaty, which
was not ratified by the other countries in the Nile River Basin, divide approximately 75% of the
river’s streamflow to Egypt and 25% to Sudan (Carroll 1999). Our model diverts water for
Sudanese consumption (Sudan Treaty Adherence variable) with the rest flowing into Egypt. The
value of “time to outflow” is set at 1 because all streamflow estimates are aggregated as annual
averages, with each streamflow value representing a single year.
Figure 4: Hydrology Estimates for the Nile River Tributaries with Constant Climate.
3.2.2 Modeling Climate Change
Selected Variables
2e+013
1.5e+013
1e+013
5e+012
0
1994 2021 2047 2074 2100Time (Year)
Gal
lon
Atbara : CLIMATE OFFBlue Nile : CLIMATE OFFWhite Nile : CLIMATE OFF

Water As A Conflict Driver: Estimating The Effects Of Climate Change And Hydroelectric Dam
Diversion On Nile River Stream Flow During The 21st Century
Page | 26
The 33 General Circulation Models (GCM), employed by our analysis and described in
Appendix A, were run for Representative Concentration Pathways (RCP) 4.5 and 8.5. RCPs are
emission scenarios reflective of greenhouse gas concentrations with 450 and 850 parts per
million of greenhouse gases such as CO2 and methane. All 33 GCMs were run for both RCP
scenarios, producing 66 estimates per year for each of the four regions under investigation.
Estimates for precipitation and temperature were generated for the years 2010 through 2100. We
subdivided the time periods into 30-year intervals for 2010-2029 (early century), 2040-2069
(mid century), and 2070-2100 (late century). Historical baseline data for 1970-2000 was used to
measure change in precipitation and temperature over time. Means, standard deviations,
minimum and maximum values, and percentiles are presented in Appendix B. While this paper
presents the average across the 33 GCM models and two RCP scenarios, additional analyses may
be undertaken in the future to examine variations among the 33 models and the RCP scenarios.
Climate Change data for absolute temperature and precipitation change was entered into
the Vensim model by region (Figure 5). Our goal was to build variables that were capable of
assessing the potential effect of precipitation and temperature change on the water volume of the
Nile River or its associated tributaries. Each quadrant of Figure 5 represents one of four regions.
Variables for each region were constructed in an identical manner from temperature and
precipitation data drawn from Appendix B. We’ll illustrate this procedure and the rationale
behind the construction of the variables from Region 3, one of the four regions in the model.

Water As A Conflict Driver: Estimating The Effects Of Climate Change And Hydroelectric Dam
Diversion On Nile River Stream Flow During The 21st Century
Page | 27
Figure 5: Climate Change Model
Region 3 Early CenturyPercent Change in Rainfall
Percent Change in Blue Nile Flow as aPercent of Precipitation Change
Percent Change in Atbara River Flow asa Percent of Precipitation Change
Region 3 Mid CenturyPercent Change in Rainfall
Region 4 Mid CenturyPercent Change in Rainfall
Percent Change in White Nile Flow as aPercent of Precipitation Change
<Time>
Region 3 Temp Change Early Century
Region 3 Temp Change Mid Century
Region 3 Temp Change Late Century
Region 4 Early CenturyPercent Change in Rainfall
Region 4 Late CenturyPercent Change in Rainfall
Region 3 Late CenturyPercent Change in Rainfall
Region 4 Temp Change Early Century
Region 4 Temp Change Mid Century
Region 4 Temp Change Late Century
Region 3 PercentRainfall Change
Region 4 AbsoluteTemperature Change
Region 1 Early CenturyPercent Change in Rainfall
Region 1 Mid CenturyPercent Change in Rainfall
Region 1 Late CenturyPercent Change in Rainfall
Region 1 PercentRainfall Change
Climate ChangeToggle Button
Region 2 Early Century PercentChange in Rainfall
Region 2 Mid Century PercentChange in Rainfall
Region 2 Late CenturyPercent Change in Rainfall
Region 2 Percent RainfallChange
Region 3 AbsoluteTemperature Change
Region 4 PercentRainfall Change
Region 3 Percent Change in Nile RiverFlow as a Result of Absolute Change
in Temperature
Region 4 Percent Change in NileRiver Flow as a Result of Absolute
Change in Temperature
Region 3 PrecipitationChange
Region 4 PrecipitationChange
lower regionunit multiplier upper region unit
multiplier
Region 2 TempChange Early Century
Region 2 TempChange Mid Century
Region 2 TempChange Late Century
Region 2 AbsoluteTemperature Change
Region 1 Temp Change Late Century
Region 1 Temp Change Mid Century
Region 1 Temp Change Early CenturyRegion 1 Absolute
Temperature Change
Region 2 Percent Change in NileRiver Flow as a Result of Absolute
Change in Temperature
Region 2 Percent Change in NileRiver Flow as a Percent Change of
Precipitation Change
Region 1 Percent Change in NileRiver Flow As a Result of Absolute
Change in Temperature
Region 1 PercentPrecipitation Change
Region 1 Percent Change inNile River Flow as a Percent
of Precipitation Change
Region 2 PercentPrecipitation Change

Water As A Conflict Driver: Estimating The Effects Of Climate Change And Hydroelectric Dam
Diversion On Nile River Stream Flow During The 21st Century
Page | 28
In calculating variables for temperature, the initial step is to generate estimates in Vensim
based on the minimum and maximum values as well as the mean and standard deviation for each
of the three time intervals. Accordingly, calculated variables for precipitation and temperature
change were developed as follows for Region 3.
Region 3 Temp Change Early Century= IF THEN ELSE (Time <2040, RANDOM NORMAL
(0.416988,1.67915,1.07567,0.283738,1),0)
Region 3 Temp Change Mid Century= IF THEN ELSE (Region 3 Temp Change Early
Century+Region 3 Temp Change Late Century=0, RANDOM NORMAL
(0.739661,3.52847,2.20132,0.617205,1),0)
Region 3 Temp Change Late Century= IF THEN ELSE (Time >=2070, RANDOM NORMAL
(0.712064,5.79721,3.28753,1.24337,1),0)
The variables are constructed in this manner to ensure that each iteration of the Vensim
model produces only one estimate, which corresponds to the appropriate time interval. For
example, if estimates were organized in an Excel spreadsheet with variables in the columns and
time points (fractions of years) in the rows, each cell would contain either a value of 0 or an
estimate so that summing across these four variables (columns) produces a single estimate for
absolute temperature change. The climate change toggle button is simply a dichotomous
variable, coded as either 0 or 1, that permits us to activate or deactivate the effects of climate
change on the hydrology model.

Water As A Conflict Driver: Estimating The Effects Of Climate Change And Hydroelectric Dam
Diversion On Nile River Stream Flow During The 21st Century
Page | 29
Region 3 Absolute Temperature Change=Climate Change Toggle Button * (Region 3 Temp
Change Early Century + Region 3 Temp Change Mid Century + Region 3 Temp Change Late
Century)
To estimate the effect of absolute temperature change on water volume, we draw on the
findings of Elshamy, Seierstad, and Sorteberg (2009). They report, from an analysis of 17
GCMs in the Nile River Basin, a one degree increase in temperature (Celsius) corresponds to a
3.75 percent reduction in the volume of the Nile River. However, because the observed outcome
is non-linear, with larger temperature changes associated with a slightly larger attenuated effect,
we calculate the effect exponentially as follows:
Region 3 Percent Change in Nile River Flow as a Result of Absolute Change in Temperature=
- ((1.0375^Region 3 Absolute Temperature Change)-1)
Estimating the effects of precipitation change on water volume is also calculated through
a series of incremental steps. We first generate estimates in exactly the same manner described
above for temperature.
Region 3 Early Century Percent Change in Rainfall= IF THEN ELSE (Time<2040, RANDOM
NORMAL (-4.93148,23.515,5.17864,5.84869,1),0)
Region 3 Mid Century Percent Change in Rainfall= IF THEN ELSE (Region 3 Early Century
Percent Change in Rainfall+Region 3 Late Century Percent Change in Rainfall=0, RANDOM
NORMAL (-9.41894,42.5032,7.97624,10.3675,1),0)
Region 3 Late Century Percent Change in Rainfall= IF THEN ELSE (Time >=2070, RANDOM
NORMAL (-8.17837,71.3365,12.9634,15.7283,1),0)

Water As A Conflict Driver: Estimating The Effects Of Climate Change And Hydroelectric Dam
Diversion On Nile River Stream Flow During The 21st Century
Page | 30
Elsaeed (2012:339) provides data on the association between changes (as a percent) in
precipitation and the corresponding water volume in the Nile River. Elsaeed acknowledges, the
range of sensitivity of river volume to precipitation differs by region. Using these data reported
by Elsaeed (2012), we ran some regression analyses, presented in Figure 6 below, to determine
the equation best represented by each distribution based on corresponding R2 values. These
equations were incorporated in variables in the Vensim model to capture this range of sensitivity.
Atbara (Ethiopia)
Blue Nile (El Diem, Ethiopia)
Blue Nile(Khartoum, Sudan)
Lake Victoria(Jinja, Uganda)
White Nile (Malakal, Sudan)
Nile Main(Dongla, Sudan)
Percent Change in Rainfall
Percent Change in Water Volume
Percent Change
in Rainfall
Percent Change in Water Volume
Percent Change
in Rainfall
Percent Change in Water Volume
Percent Change
in Rainfall
Percent Change in Water Volume
Percent Change
in Rainfall
Percent Change in Water Volume
Percent Change
in Rainfall
Percent Change in Water Volume
-50 -93 -50 -92 -50 -98 -50 -20 -50 -41 -50 -85-25 -60 -25 -62 -25 -77 -25 -11 -25 -28 -25 -63-10 -24 -10 -24 -10 -31 -10 -4 -10 -11 -10 -2510 34 10 32 10 36 10 6 10 19 10 3025 84 25 78 25 89 25 14 25 48 25 7450 187 50 165 50 149 50 33 50 63 50 130
Atbara (Ethiopia) y = 0.0178x2 + 2.8186x + 2.1885 R² = 0.9997
Blue Nile (El Diem, Ethiopia) y = -0.0001x3 + 0.014x2 + 2.8626x + 1.1369 R² = 0.9997
Blue Nile (Khartoum, Sudan) y = -0.0004x3 + 0.0098x2 + 3.5578x + 0.7986 R² = 0.9998
Lake Victoria (Jinja, Uganda) y = -.00005x3 + 0.0024x2 + 0.4918x + 0.4296 R² = 0.9997
White Nile (Malakal, Sudan) y = -0.0002x3 + 0.0023x2 + 1.6462x + 5.8769 R² = 0.9968
Nile Main (Dongla, Sudan) y = -0.0003x3 + 0.0085x2 + 2.9027x + 0.9994 R² = 0.9998
Table 1: Modeling Precipitation Change on Streamflow for Selected Locations
To illustrate, we incorporated the regression equations for the Blue Nile (El Diem) and
Atbara in the following manner.

Water As A Conflict Driver: Estimating The Effects Of Climate Change And Hydroelectric Dam
Diversion On Nile River Stream Flow During The 21st Century
Page | 31
Percent Change in Blue Nile Flow as a Percent of Precipitation Change= IF THEN ELSE
(Time>=1994,((-0.0001*(Region 3 Percent Rainfall Change^3))+(0.014*(Region 3 Percent
Rainfall Change^2))+(2.8626*Region 3 Percent Rainfall Change)+1.1369)*0.01,0)*lower region
unit multiplier*Climate Change Toggle Button
Percent Change in Atbara River Flow as a Percent of Precipitation Change= IF THEN ELSE
(Time>=2010,((0.0178*(Region 3 Percent Rainfall Change^2))+(2.8186*Region 3 Percent
Rainfall Change)+2.1885)*0.01,0)*lower region unit multiplier*Climate Change Toggle Button
Calculations for the other three regions were generated in a manner identical to the steps
provided for Region 3 above. We provide these estimates below for purposes of replication.
Region 4:
Region 4 Temp Change Early Century= IF THEN ELSE (Time <2040, RANDOM NORMAL
(0.488399,1.55888,1.04436,0.260522,1),0)
Region 4 Temp Change Mid Century= IF THEN ELSE (Region 4 Temp Change Early
Century+Region 4 Temp Change Late Century=0, RANDOM NORMAL
(0.836587,3.46696,2.13465,0.607395,1),0)
Region 4 Temp Change Late Century= IF THEN ELSE (Time >=2070, RANDOM NORMAL
(0.878914,5.59176,3.19166,1.21348,1),0)
Region 4 Absolute Temperature Change= Climate Change Toggle Button*(Region 4 Temp
Change Early Century+Region 4 Temp Change Mid Century+Region 4 Temp Change Late
Century)

Water As A Conflict Driver: Estimating The Effects Of Climate Change And Hydroelectric Dam
Diversion On Nile River Stream Flow During The 21st Century
Page | 32
Region 4 Percent Change in Nile River Flow as a Result of Absolute Change in Temperature=
-((1.0375^Region 4 Absolute Temperature Change)-1)
Region 4 Early Century Percent Change in Rainfall= IF THEN ELSE (Time <2040, RANDOM
NORMAL (-5.24352,15.697,3.69223,4.56407,1),0)
Region 4 Mid Century Percent Change in Rainfall= IF THEN ELSE (Region 4 Early Century
Percent Change in Rainfall+Region 4 Late Century Percent Change in Rainfall=0, RANDOM
NORMAL (-12.3754,30.6257,6.53887,7.98511,1),0)
Region 4 Late Century Percent Change in Rainfall= IF THEN ELSE (Time >=2070, RANDOM
NORMAL (-10.821,44.9604,11.0063,11.0403,1),0)
Region 4 Percent Rainfall Change= Climate Change Toggle Button*((Region 4 Early Century
Percent Change in Rainfall+Region 4 Mid Century Percent Change in Rainfall+Region 4 Late
Century Percent Change in Rainfall))
Percent Change in White Nile Flow as a Percent of Precipitation Change= IF THEN ELSE
(Time>=1994,((-0.0002*(Region 4 Percent Rainfall Change^3))+(0.0023*(Region 4 Percent
Rainfall Change^2))+(1.6462*Region 4 Percent Rainfall Change)+5.8769)*0.01,0)*lower region
unit multiplier*Climate Change Toggle Button
Region 2:
Region 2 Temp Change Early Century= IF THEN ELSE (Time <2040, RANDOM NORMAL
(0.770276,2.21863,1.32074,0.290089,1),0)
Region 2 Temp Change Mid Century= IF THEN ELSE(Region 2 Temp Change Early
Century+Region 2 Temp Change Late Century=0, RANDOM NORMAL
(1.29757,4.1768,2.59315,0.633309,1),0)

Water As A Conflict Driver: Estimating The Effects Of Climate Change And Hydroelectric Dam
Diversion On Nile River Stream Flow During The 21st Century
Page | 33
Region 2 Temp Change Late Century= IF THEN ELSE (Time >=2070, RANDOM NORMAL
(1.42838,6.79775,3.79632,1.3836,1),0)
Region 2 Absolute Temperature Change= Climate Change Toggle Button*(Region 2 Temp
Change Early Century+Region 2 Temp Change Mid Century+Region 2 Temp Change Late
Century)
Region 2 Percent Change in Nile River Flow as a Result of Absolute Change in Temperature=
-((1.0375^Region 2 Absolute Temperature Change)-1)
Region 2 Early Century Percent Change in Rainfall= IF THEN ELSE (Time <2040, RANDOM
NORMAL (-29.4655,92.7039,20.0027,27.2061,1),0)
Region 2 Mid Century Percent Change in Rainfall= IF THEN ELSE (Region 2 Early Century
Percent Change in Rainfall+Region 2 Late Century Percent Change in Rainfall=0, RANDOM
NORMAL (-27.6254,165.421,25.7794,42.2176,1),0)
Region 2 Late Century Percent Change in Rainfall= IF THEN ELSE (Time >=2070, RANDOM
NORMAL (-43.0666,283.378,38.5919,69.4741,1),0)
Region 2 Percent Rainfall Change= (Climate Change Toggle Button*((Region 2 Early Century
Percent Change in Rainfall+Region 2 Mid Century Percent Change in Rainfall+Region 2 Late
Century Percent Change in Rainfall)*0.01))
Percent Change in Nile River Flow as a Percent of Precipitation Change= IF THEN ELSE
(Time>=1994,((-0.0004*(Region 2 Percent Rainfall Change^3))+(0.0098*(Region 2 Percent
Rainfall Change^2))+(3.5578*Region 2 Percent Rainfall Change) + 0.7986) * 0.01,0) * Climate
Change Toggle Button
Region 1:

Water As A Conflict Driver: Estimating The Effects Of Climate Change And Hydroelectric Dam
Diversion On Nile River Stream Flow During The 21st Century
Page | 34
Region 1 Temp Change Early Century= IF THEN ELSE (Time <2040, RANDOM NORMAL
(0.615538,2.15678,1.33971,0.336522,1),0)
Region 1 Temp Change Mid Century= IF THEN ELSE (Region 1 Temp Change Early
Century+Region 1 Temp Change Late Century=0, RANDOM NORMAL
(0.989572,4.19612,2.55795,0.682266,1),0)
Region 1 Temp Change Late Century= IF THEN ELSE (Time >=2070, RANDOM NORMAL
(1.15478,6.5809,3.75401,1.38667,1),0)
Region 1 Absolute Temperature Change= Climate Change Toggle Button*(Region 1 Temp
Change Early Century+Region 1 Temp Change Mid Century
+Region 1 Temp Change Late Century)
Region 1 Percent Change in Nile River Flow as a Result of Absolute Change in Temperature=
-((1.0375^Region 1 Absolute Temperature Change)-1)
Region 1 Early Century Percent Change in Rainfall= IF THEN ELSE (Time <2040, RANDOM
NORMAL (-15.0666,34.0816,0.76817,9.46445,1),0)
Region 1 Mid Century Percent Change in Rainfall= IF THEN ELSE (Region 1 Early Century
Percent Change in Rainfall+Region 1 Late Century Percent Change in Rainfall=0, RANDOM
NORMAL (-30.1275,42.4958,-5.4842,13.4465,1),0)
Region 1 Late Century Percent Change in Rainfall= IF THEN ELSE (Time >=2070, RANDOM
NORMAL (-51.3757,19.871,-10.1646,16.4891,1),0)
Region 1 Percent Rainfall Change= (Climate Change Toggle Button*((Region 1 Early Century
Percent Change in Rainfall+Region 1 Late Century Percent Change in Rainfall+Region 1 Mid
Century Percent Change in Rainfall)))

Water As A Conflict Driver: Estimating The Effects Of Climate Change And Hydroelectric Dam
Diversion On Nile River Stream Flow During The 21st Century
Page | 35
Percent Change in Nile River Flow as a Percent of Precipitation Change= IF THEN
ELSE(Time>=1994,((-0.0003*(Region 1 Percent Rainfall Change^3))+(0.0085*(Region 1
Percent Rainfall Change^2))+(2.902*Region 1 Percent Rainfall Change) +0.9994) *0.01,0) *
Climate Change Toggle Button
3.3 Modeling Assumptions
Our model incorporates the following modeling assumptions:
1. Water hydrology in the Nile River occurs exclusively through an interaction between
precipitation and temperature.
2. The Nile and its major tributaries are regenerated annually by rainfall
3. Ethiopia will adhere to the treaty with the sole exception of drawing water from the Blue
Nile to fill the dam’s reservoir. All other upstream countries will adhere to the treaty and
draw no water from the White Nile River
4. In accordance with treaty adherence, Sudan will draw not more than 25 percent of the
total streamflow from the Nile River Sudan.
5. Per capita water consumption will remain constant throughout the century.
6. Technology will remain constant such that innovations in irrigation systems,
desalinization, and/or farming practices will have no discernible effect on water
utilization.

Water As A Conflict Driver: Estimating The Effects Of Climate Change And Hydroelectric Dam
Diversion On Nile River Stream Flow During The 21st Century
Page | 36
Chapter 4 Results
4.1 Climate Change Model
Average estimates taken across the 33 GCM models and two RCP levels suggest that
three of the four regions will experience a net increase in precipitation throughout the 21st
Century while one (Region 1—Egypt) may experience a net decrease in rainfall (Figure 6). For
example, Region 4, source of the White Nile, may experience an average precipitation increase
of around 35%. Region 3, source of the Blue Nile, may experience an average increase of 30%.
Region 2, Sudan, may see an average increase of approximately 15% during the century.
Figure 6: Nile River Basin Rainfall Change in the 21st Century

Water As A Conflict Driver: Estimating The Effects Of Climate Change And Hydroelectric Dam
Diversion On Nile River Stream Flow During The 21st Century
Page | 37
Similarly, the average estimated temperature value across the 33 GCM models suggests
that all four of the regions will experience a net increase in temperature throughout the 21st
Century (Figure 7). Region 2 (Sudan) may experience the greatest net increase in temperature,
an average of six or seven degrees by mid-century. Region 4, source of the White Nile, may
experience an average increase in temperature of around four degrees Celsius by mid-century.
Regions 3 (Ethiopia) and 1 (Egypt) may experience an average increase in temperature of around
two degrees Celsius by mid-century. However, insofar as these estimates are only averages
across the 33 GCMs, it must be acknowledged that the minimum and maximum estimates
suggest the possibility of a rather wide interval.
Figure 7: Temperature Change in the 21st Century
These results suggest that, on average, the Nile River Basin may experience both
increases in precipitation and temperature throughout the 21st Century. Such outcomes posit

Water As A Conflict Driver: Estimating The Effects Of Climate Change And Hydroelectric Dam
Diversion On Nile River Stream Flow During The 21st Century
Page | 38
differential effects on the Nile River. The big question is to what extent these effects, if
observed, will change the volume of the Nile River.
Figure 8 presents a visual depiction of the estimated effect of climate change on the Nile
River at selected locations. We are particularly interested in the observed trends and not the
estimates for any given year. These trends suggest that streamflow in the Blue Nile (Ethiopia)
may actually increase, perhaps by as much as 20 to 25 percent. Similarly, the other two
tributaries of the Nile River, the Atbara (Ethiopia) and the White Nile (Uganda) may witness
increases in the average annual volume by as much as 13 to 18 percent. The Nile River as it
flows through Sudan (Region 2) may increase by as much as eight percent on average. Indeed,
its decreased volume may have been estimated to be greater were it not for the greater volume in
the Blue Nile. The overall effect of climate change on Egypt (Region 1) may be a net decrease
of upwards of 17 percent of its current carrying capacity.

Water As A Conflict Driver: Estimating The Effects Of Climate Change And Hydroelectric Dam
Diversion On Nile River Stream Flow During The 21st Century
Page | 39
Blue Nile
3e+013
2.5e+013
2e+013
1.5e+013
1e+013
1994 2021 2047 2074 2100Time (Year)
Gal
lon
Blue Nile : CLIMATE ONBlue Nile : CLIMATE OFF
Atbara
5e+012
4.25e+012
3.5e+012
2.75e+012
2e+012
1994 2021 2047 2074 2100Time (Year)
Gal
lon
Atbara : CLIMATE ONAtbara : CLIMATE OFF
White Nile
1e+013
9.25e+012
8.5e+012
7.75e+012
7e+012
1994 2021 2047 2074 2100Time (Year)
Gal
lon
White Nile : CLIMATE ONWhite Nile : CLIMATE OFF
Nile River Sudan
3e+013
2.75e+013
2.5e+013
2.25e+013
2e+013
1994 2021 2047 2074 2100Time (Year)
Gal
lon
Nile River Sudan : CLIMATE ONNile River Sudan : CLIMATE OFF
Nile River Egypt
3e+013
2.25e+013
1.5e+013
7.5e+012
0
1994 2021 2047 2074 2100Time (Year)
Gal
lon
Nile River Egypt : CLIMATE ONNile River Egypt : CLIMATE OFF

Water As A Conflict Driver: Estimating The Effects Of Climate Change And Hydroelectric Dam
Diversion On Nile River Stream Flow During The 21st Century
Page | 40
Figure 8: Effects of Climate Change on Streamflow of Nile River
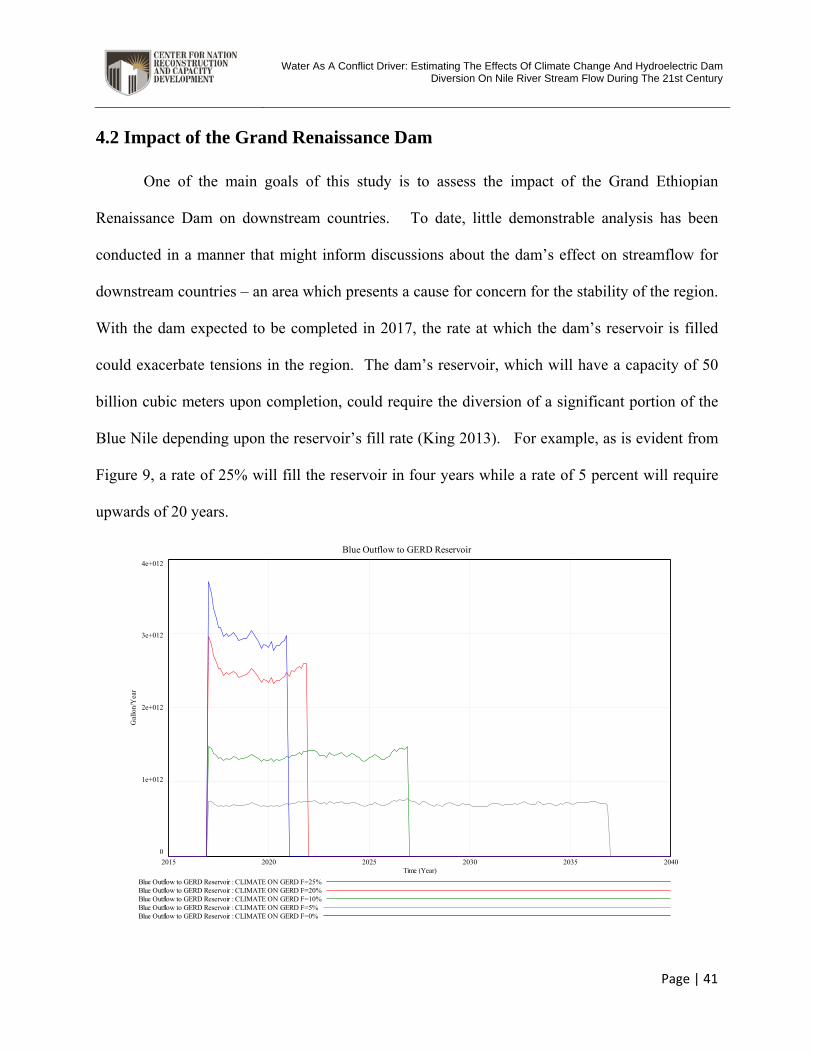
Water As A Conflict Driver: Estimating The Effects Of Climate Change And Hydroelectric Dam
Diversion On Nile River Stream Flow During The 21st Century
Page | 41
4.2 Impact of the Grand Renaissance Dam
One of the main goals of this study is to assess the impact of the Grand Ethiopian
Renaissance Dam on downstream countries. To date, little demonstrable analysis has been
conducted in a manner that might inform discussions about the dam’s effect on streamflow for
downstream countries – an area which presents a cause for concern for the stability of the region.
With the dam expected to be completed in 2017, the rate at which the dam’s reservoir is filled
could exacerbate tensions in the region. The dam’s reservoir, which will have a capacity of 50
billion cubic meters upon completion, could require the diversion of a significant portion of the
Blue Nile depending upon the reservoir’s fill rate (King 2013). For example, as is evident from
Figure 9, a rate of 25% will fill the reservoir in four years while a rate of 5 percent will require
upwards of 20 years.
Blue Outflow to GERD Reservoir
4e+012
3e+012
2e+012
1e+012
0
2015 2020 2025 2030 2035 2040Time (Year)
Gal
lon/
Yea
r
Blue Outflow to GERD Reservoir : CLIMATE ON GERD F=25%Blue Outflow to GERD Reservoir : CLIMATE ON GERD F=20%Blue Outflow to GERD Reservoir : CLIMATE ON GERD F=10%Blue Outflow to GERD Reservoir : CLIMATE ON GERD F=5%Blue Outflow to GERD Reservoir : CLIMATE ON GERD F=0%

Water As A Conflict Driver: Estimating The Effects Of Climate Change And Hydroelectric Dam
Diversion On Nile River Stream Flow During The 21st Century
Page | 42
Figure 9: Effects of GERD Fill Rate on Outflow to GERD Reservoir
Egypt and Ethiopia obviously have competing interests with reference to the dam’s
reservoir fill rate. Previously published reports suggest that the Ethiopian government may
attempt to fill the reservoir quickly, say within four years in order to maximize the dam’s
operational hydroelectric capacity; only a portion of the dam’s turbines can run without
completely filling the dam. Four -years corresponds with a reservoir fill rate of 25% (King
2013). As is evident from Table 3, a lower fill rate spreads the attenuation in streamflow across
a longer time interval, producing something analogous to a long-term stressor than an immediate
system shock of a shorter duration. For example, a 25% fill rate might reduce streamflow by
21% and 5% respectively in the Blue Nile and Nile Egypt; conversely, a 5% fill rate might result
in a four and two percent reduction in streamflow in the Blue Nile and Nile Egypt respectively.
GERD Fill
Rate Years to fill Average Blue
Nile Flow (gallons)
Estimated Percent
Reduction to Blue Nile
Average Streamflow in Egypt (gallons)
Estimated Percent
Reduction to Nile in Egypt
0% N/A 1.4025E+13 0 2.5253E+13 0 5% 2017-2037 1.3434E+13 -4.22 2.4839E+13 -1.64 10% 2017-2027 1.2795E+13 -8.77 2.4348E+13 -3.58 15% 2017-2024 1.2180E+13 -13.15 2.4098E+13 -4.57 20% 2017-2022 1.1644E+13 -16.98 2.4043E+13 -4.79 25% 2017-2021 1.1119E+13 -20.72 2.3982E+13 -5.03
Table 2: The Impact of the Grand Ethiopian Renaissance Dam
Estimated effects are illustrated graphically in Figure 10. Inclusive of climate change,
higher fill rates will create larger short-term systemic shocks while lower fill rates, stretched over
a longer duration, create long-term stressors that may be somewhat more manageable. Of
course, lower fill rates may attenuate hydroelectric capacity attributable to Ethiopia.

Water As A Conflict Driver: Estimating The Effects Of Climate Change And Hydroelectric Dam
Diversion On Nile River Stream Flow During The 21st Century
Page | 43
Figure 10: Effects of GERD Fill Rate on Streamflow in the Blue Nile River
Based on an average Egyptian per capita water consumption of 266,285 gallons, a
reservoir fill rate of 25% equates to the water reduction equivalent to 4,773,000 people. Egypt
already consumes approximately 97% of its internal renewable water resources, so this
additional strain on resources could have devastating effects on the country’s population
(Degefu, 167). Insofar as 94% of Egypt’s per capita water consumption is used for irrigation in
support of crop production, high reservoir fill rates could create systemic shocks in Egypt’s
agricultural economy.
Another way to approach the problem is by examining fill rates in the context of
projected climate change outcomes. Results from our study suggest that precipitation levels in
Blue Nile
2e+013
1.75e+013
1.5e+013
1.25e+013
1e+013
2015 2020 2025 2030 2035 2040Time (Year)
Gal
lon
Blue Nile : CLIMATE ON GERD F=25%Blue Nile : CLIMATE ON GERD F=20%Blue Nile : CLIMATE ON GERD F=10%Blue Nile : CLIMATE ON GERD F=5%Blue Nile : CLIMATE ON GERD F=0%

Water As A Conflict Driver: Estimating The Effects Of Climate Change And Hydroelectric Dam
Diversion On Nile River Stream Flow During The 21st Century
Page | 44
source countries will increase at rates that exceed detrimental effects from higher predicted
temperatures. What this finding suggests is that there will be more water, and perhaps
considerably greater streamflow, than previously existed. Greater streamflow will create
problems with inundation, possibly resulting in episodic flooding of arable lands, which may
result in a reduction in crop yields. To reduce the negative consequences of inundation, one
possible strategy is to systematically divert projected excess water beyond the channel to an area
analogous to a large hole in the ground. The GERD’s reservoir certainly satisfies this condition.
Thus, what is needed is an evaluation of projected excess water brought about by climate change
that is assessed against a baseline to determine what fill rate(s) might retain constancy in
streamflows while diverting excess water. Essentially, we need a controlled water optimization
model that considers fill rates in the context of projected climate change outcomes.
Nile River Sudan
3e+013
2.75e+013
2.5e+013
2.25e+013
2e+013
1994 2021 2047 2074 2100Time (Year)
Gal
lon
Nile River Sudan : CLIMATE ON GERD F=10%Nile River Sudan : CLIMATE ON
Nile River Sudan : CLIMATE OFFNile River Sudan : CLIMATE ON GERD F=25%

Water As A Conflict Driver: Estimating The Effects Of Climate Change And Hydroelectric Dam
Diversion On Nile River Stream Flow During The 21st Century
Page | 45
Figure 11: Effects of GERD Fill Rate on Streamflow in the Nile River Sudan
Figure 11 illustrates variation in fill rates while taking into account the estimated effects
of climate change on streamflow in the Nile River. The green line portrays the baseline
streamflow for the Nile River Sudan without taking into climate change into consideration while
the red line portrays the estimated level of streamflow when accounting for climate change. The
difference between these two lines is the water differential, in this case, a net positive increase in
streamflow. The blue and gray lines represent two extreme fill rates at 10% and 25%
respectively.4 Evident from Figure 11 is the finding that a fill rate of 25% reduces streamflow
below the baseline (i.e., current level) while a rate of 10% is well above the baseline. The
optimal fill rate is found to be in the interval between 12% and 15%.
4 A fill rate denoted by zero is depicted by the red line.

Water As A Conflict Driver: Estimating The Effects Of Climate Change And Hydroelectric Dam
Diversion On Nile River Stream Flow During The 21st Century
Page | 46
Figure 12: Effects of GERD Fill Rate on Streamflow in the Nile River Egypt
Figure 12 presents streamflow in the Nile River Egypt. Evident from this graph is the
finding that a fill rate of 25% reduces streamflow below the baseline. The optimal fill rate for
the Nile River Egypt that minimizes disruption to streamflow in the context of projected climate
change is closer to 10%. Our model suggests that a fill rate of 10% will ensure that the GERD’s
reservoir is operating at full capacity within ten years.
Nile River Egypt
3e+013
2.25e+013
1.5e+013
7.5e+012
0
1994 2021 2047 2074 2100Time (Year)
Gal
lon
Nile River Egypt : CLIMATE ONNile River Egypt : CLIMATE OFF
Nile River Egypt : CLIMATE ON GERD F=25%

Water As A Conflict Driver: Estimating The Effects Of Climate Change And Hydroelectric Dam
Diversion On Nile River Stream Flow During The 21st Century
Page | 47

Water As A Conflict Driver: Estimating The Effects Of Climate Change And Hydroelectric Dam
Diversion On Nile River Stream Flow During The 21st Century
Page | 48
Chapter 5 Discussion
The purpose of our study is to examine the impact of human factors on the streamflow of
the Nile River and its subsequent effects on regional stability in the Nile River Basin. By
incorporating river hydrology, climate change, and the fill rate of the GERD reservoir within our
model, we have sought to develop a refined understanding of the dynamic interaction between
climate changes, water use, and water resource adequacy.
Our results suggest a few key findings. First, climate change presents a relatively mixed
picture of the future water capacity of the Nile River Basin. While rainfall in many of the Basin’s
regions is expected to increase, concurrent increases in temperature will attenuate Nile River
streamflow. The net result is a projected increase in water capacity throughout the 21st Century
in source countries (Regions 3 and 4), a moderately constant capacity, on average, in Sudan, and
declining streamflow in Egypt, particularly post 2050. Throughout the Basin, streamflow is
likely to be at levels equal to or higher than present before 2050 while declining in Sudan and
particularly Egypt during the second half of the century. The anticipated reservoir fill rate of the
Grand Ethiopian Renaissance Dam could present problems; clearly a high fill rate will reduce
streamflow and water capacity in downstream countries. Though, when coupled with projected
effects of climate change, the anticipated increases in streamflow in source countries, particularly
before 2050, may provide strategic opportunities with which to simultaneously provide Ethiopia
with a planned capacity to fill the reservoir while minimizing the potential impact on Egypt. We
estimated that a fill rate of 10 to15 %, given projected increases in streamflow within the Blue
Nile region, would build hydroelectric capacity in Ethiopia while concurrently ensuring a
constant level of streamflow throughout Sudan and Egypt. Additionally, diverting the

Water As A Conflict Driver: Estimating The Effects Of Climate Change And Hydroelectric Dam
Diversion On Nile River Stream Flow During The 21st Century
Page | 49
anticipated increase in streamflow, particularly in Ethiopia, may reduce problems associated
inundation and subsequent flooding of arable land in the vicinity of the Blue Nile.
These findings are bounded by several assumptions. First, climate change is assumed to
operate exclusively through precipitation and temperature. This assumption implies that the
observed effects of climate change will be largely incrementally monotonic rather than episodic
and sporadic. The problem with incorporating this assumption in the model is that it is less
likely capable of capturing the sudden and extreme volatility resulting from dramatic changes in
the climate. For example, a flood, when smoothed over time, is indicative of higher precipitation
that occurs gradually; though, when experienced at a particular point in time, a sudden shock can
devastate an area, undermining other systems that can dramatically and exponentially deplete
resource capacity within the system, such as agricultural production. Incorporation of this
assumption potentially minimizes the actual effect of climate change because of the potential
absence in the model of these interaction effects. Second, we assume that The Nile and its major
tributaries are regenerated annually by rainfall. This assumption does not capture the extant
groundwater present in various aquifers throughout the region. For example, Ethiopia and Sudan
draw water from aquifers that can offset any observed attenuation in streamflow in the Nile
River. Indeed, some sources suggest that Sudan may have tremendous yet untapped potential in
the size and scope of its extant aquifers. Conversely, while most sources seem to agree that
Egypt has relatively few aquifers, thereby maximizing its dependence on Nile river streamflow,
it is developing desalinization plants along the Mediterranean and Red Seas that might offset
some of the anticipated declines in streamflow attributable to climate change. Third, we assume
that Ethiopia will adhere to the1959 water treaty with the sole exception of drawing water from
the Blue Nile to fill the GERD’s reservoir. All other upstream countries are assumed to adhere

Water As A Conflict Driver: Estimating The Effects Of Climate Change And Hydroelectric Dam
Diversion On Nile River Stream Flow During The 21st Century
Page | 50
to the treaty and draw no water from the White Nile River. This assumption is rather dicey and
probably untenable. As population increases throughout the region, demands on water for both
agricultural and domestic consumption are likely to increase. Such increased demand will most
certainly challenge inequity issues associated with the treaty, as is already been seen through
discussions of the Nile River Basin Initiative. Thus, a fourth assumption is also problematic,
namely that per capita water consumption will remain constant throughout the 21st Century.
Fifth, our model assumes that technology will remain constant such that innovations in irrigation
systems, desalinization, and/or farming practices will have no discernible effect on water
utilization. Clearly, this assumption is untenable; technological innovations will occur, though
their effect on water utilization is very difficult to assess.
The net effect of these assumptions on our model estimates, though difficult to assess,
appear to be, on average, negligible. For example, in smoothing shocks, we assume water
capacity is more continuous, than it will most certainly be in reality, thereby, via assumption,
providing for more water capacity to the Basin than it is likely to receive. The same thing is true
when assuming that all countries will adhere to the treaty; this assumption probably provides for
more streamflow than is likely to exist. Similarly, in assuming that per capita water consumption
remains constant in the face of a much larger population, we are artificially providing for more
water capacity than will be present. Taken together, these three assumptions provide a net
positive effect on streamflow. Conversely, our assumption that other water sources, such as
aquifers, do not contribute to water capacity artificially lowers the actual capacity than that
estimated by the model. Similarly, in assuming that technology will not change streamflow, we
artificially eliminate capacity that will certainly evolve throughout the century. Thus, taken

Water As A Conflict Driver: Estimating The Effects Of Climate Change And Hydroelectric Dam
Diversion On Nile River Stream Flow During The 21st Century
Page | 51
together, we believe the net gains and losses assumed by the model will probably result in an
overall capacity that is comparable to that presented in this report.
5.1 Model Validation
In assuming that our modeling assumptions, both positive and negative, are likely to
create a net zero effect on streamflow, the next question concerns validity of our actual findings
with historical observations. Certainly, confidence derived from one’s observed outcomes is
dependent in part on the extent to which they align with historical observations, else the model
risks being disconnected from any realistic anchor. Toward that end, through the Columbia
University team, we obtained data from Paul Block at the University of Wisconsin on historic
streamflow data from 1912 through 1993 from the weather station at the Roseires Dam on the
Blue Nile River. While these data would appear to be sufficient in number to provide some
validation efforts, the number of historic data points available for comparison against estimates
generated by our model is very limited. Recall that estimates from our model are based on the
estimates generated by 33 GCMs over RCP 4.5 and 8.5; recall also that we averaged these
models to essentially create averaged distributions using mean, standard deviation, minimum,
and maximum values. Additionally, our baseline for the assessment of changes in precipitation
and temperature was drawn from estimates generated by the GCMs for years 1970-2009; each of
the successive time points, i.e., 2010-2039, 2040-2069, 2070-2100, were assessed as changes
against this baseline. To validate estimates generated by our model against the historic data from
the Roseires Dam requires us to split the baseline into decades (1970s, 1980s, and 1990s), create

Water As A Conflict Driver: Estimating The Effects Of Climate Change And Hydroelectric Dam
Diversion On Nile River Stream Flow During The 21st Century
Page | 52
distributions for each decade reflective of the averages of the GCM models, and input these
estimates into a revised Vensim model for the Blue Nile River.
We first ran multiple time steps to check for consistency among the outputs, essentially
selecting a time step that was fairly robust in comparison to other time steps. Insofar as system
dynamic models are a set of differential equations, the time step represents the number of
integrations generated per time interval. Our time interval is year, so a time step of 1 is
equivalent to one integration per year, .50 is two per year, while .125 is roughly eight
integrations per time step. We found that time steps at .50, .125, and .0625 produced results that
were moderately to strongly correlated with one another; we ultimately selected .125 because it
appeared to be the most robust time step.
Figure 13: Validation Comparison Between Historic and Estimated Values
Blue Nile
2e+013
1.5e+013
1e+013
5e+012
0
1971 1975 1979 1983 1987 1991 1995Time (Year)
Gal
lon
Blue Nile : CLIMATE ONBlue Nile : Roseires Streamflow data.1971_1993

Water As A Conflict Driver: Estimating The Effects Of Climate Change And Hydroelectric Dam
Diversion On Nile River Stream Flow During The 21st Century
Page | 53
Our validation analysis produced the distributions between historic and estimated values
presented in Figure 13. These two distributions, limited to 14 years within the time interval
1980-1993, are not significantly correlated. Evident from Figure 13 is the observation that our
model produces estimates that are smoother than the historical distribution. Essentially, our
model, based on estimates generated by a set of normal distributions, tends to generate estimates
that regress toward the mean; while the model does not accurately capture the extreme volatility
apparent in the historic data, it does a decent job of following an average trend line that one
might expect to generate based on the manner in which the climate change variables were
constructed. Hence, while our model is not particularly good at capturing the actual volatility of
streamflow, either drought or inundation, it does reflect the general trend of the streamflow over
time. Consequently, we might conclude, based on this observation, that the trend line generated
by our model most likely accurately reflects the general direction of future trends.
A comparison of other studies using multiple methods finds similar outcomes for
estimated changes in temperature while acknowledging considerable variation in precipitation.
For example, the Egyptian Environmental Affairs Agency (1996), based on an analysis of
several GCM models, reports increases in both precipitation and temperature over the next
century, with the net overall effect being probable decreases in streamflow. Such changes could
attenuate streamflow in the Nile River through Egypt by as much as 10 to 90 percent (El Saeed
2012:30). While nearly all GCM experiments project a temperature rise in the 21st Century, the
range of estimates in streamflow throughout the Basin varies significantly. Yates and Strzepek
(1998) found that three of four GCM models project an increase in streamflow at Answan of
more than 50%; conversely. Sayed (2004) predicted considerable variation in streamflow,
ranging between -14 and 32%, with a net positive average increase. El Shamy (2009), in

Water As A Conflict Driver: Estimating The Effects Of Climate Change And Hydroelectric Dam
Diversion On Nile River Stream Flow During The 21st Century
Page | 54
examining 15 GCMs, predicts variation ranging between -15 to +14% precipitation changes and
temperature increases of between 2 and 5 degrees Celsius in the Blue Nile Basin by the end of
the 21st Century.
5.2 A Note on Population Change and Water Capacity in the Nile River Basin
Dynamic populations will play an increasingly relevant role in regional stability,
particularly as they place greater constraints on water capacity in hydrology systems. Through
2100, projected population growth rates for Nile River Basin countries are very high. As
population increases, these countries will naturally consume far greater resources as their
populations increase, including agricultural production, energy, and water. Such growth will
impose greater constraints on resource capacity in the region. Current World Bank (2014)
estimates show Egypt, Ethiopia and Sudan growing by 52 percent, 75 percent, and 108 percent,
respectively, over the next 40 years. This swell in population may lead to scarcity in resource
capacity throughout the region, specifically with respect to water. Furthermore, every country in
the Nile River Basin devotes over three quarters of their per capita water consumption for
agricultural purposes (Keith e al. 2013).
Within Egypt, eighty-six percent of per capita water consumption is devoted to
agricultural use. For Sudan and Ethiopia, this figure is closer to 97 percent. As populations
grow, demands on water will likely increase predominately because of increases in agricultural
production. Among these three countries alone, population in the Nile River Basin will likely
increase by 2050 from 205 to 350 million persons (World Bank 2014), thereby dramatically
increasing demands on the Basin’s water capacity

Water As A Conflict Driver: Estimating The Effects Of Climate Change And Hydroelectric Dam
Diversion On Nile River Stream Flow During The 21st Century
Page | 55
System dynamics provides an excellent analytical tool for modeling the complex
interdependencies associated with human factors and water constraints in Nile River Basin. The
reinforcing feedback of the population creates typical growth until balanced by constraints on
available resources that curtail further growth. Population growth within the system places
increasingly greater demands on resources until depleting the carrying capacity, which results in
an overshoot of the population vice resources and a subsequent collapse of the population.
Consequently, system dynamics provides an effective way to simulate the timing of growth,
overextension of the carrying capacity of extant resources, and decay until reaching a sustainable
equilibrium that balances population growth with available resources (Keith et al. 2013).
As previously noted, we validate our population model by comparing the actual
population data for the years 1994-2012 to the results predicted by our model.
Using water constraints as a determinant of population growth, we further model
projected population growth for selected countries in the Nile Region. Our model assumes that
Figure 14: Egypt Nested Demographic Model

Water As A Conflict Driver: Estimating The Effects Of Climate Change And Hydroelectric Dam
Diversion On Nile River Stream Flow During The 21st Century
Page | 56
population size is driven by the water capacity of each country. Accordingly, population size is a
function of water capacity for agricultural, industrial, and domestic use. Per capita water
requirements feed into a “Population Constraints on Resource Capacity” variable, which divides
required water by available water. Dividing per capita water by available water provides a
measure for each country’s percentage carrying capacity – the population over carrying capacity
or “P/C” – for each country. Carrying capacity, in turn, drives both population birth rates and
death rates in the country. Figure 14 illustrates the demographic model for Egypt.
A high value for P/C indicates that a country is close to reaching its limit in terms of
carrying capacity. As a country approaches its carrying capacity and P/C approaches 1, death
rates increase due to limited resources and birth rates decrease due to inability for families to
provide basic needs for children. Consistent with Sterman’s (2000) illustration of demographic
models, once a country reaches carrying capacity, the birth rate must be equal to death rate and
P/C =1. The models for Ethiopia, Egypt, and Sudan use lookup table functions defined as
“Lookup of Country X Birth/Death Multiplier” to ensure this occurs (as per the example in
figure 4). The lookup function translates a P/C value into a birth or death rate which determines
total births and total deaths for the nation that year based on the current size of the population.
The growth of each country is an iterative process on a yearly basis driven solely by water
resource availability.

Water As A Conflict Driver: Estimating The Effects Of Climate Change And Hydroelectric Dam
Diversion On Nile River Stream Flow During The 21st Century
Page | 57
Figure 15: Projected Population for Egypt, 1994-2100
Population projections for Egypt are run on the assumption that all Nile River Basin
countries adhere to the water treaty versus non-adherence to the treaty. Based on water
constraints, we predict the population of Egypt to plateau in approximately 2040 when it
overshoots its water capacity. Non-adherence to the treaty produces a systemic shock that
potentially attenuates population early in the 2020 decade. Increased migration out of the
country is not reflected in the model but water constraints would likely be associated with a net
increase in migration out of the country, thereby further reducing Egypt’s population.
Egypt Population
100 M
90 M
80 M
70 M
60 M
1994 2021 2047 2074 2100Time (Year)
Peo
ple
Egypt Population : Treaty OFF CLIMATE ONEgypt Population : Treaty ON CLIMATE ON

Water As A Conflict Driver: Estimating The Effects Of Climate Change And Hydroelectric Dam
Diversion On Nile River Stream Flow During The 21st Century
Page | 58
Figure 16: Projected Population for Sudan, 1994-2100
Sudan’s relative abundance of water allows for a continuous population growth rate over
much of the 21st Century. On the assumption that its very high level of per capita water
consumption is maintained, Sudan’s population will likely overshoot its water capacity by 2075.
Sudan Population
200 M
150 M
100 M
50 M
0
1994 2021 2047 2074 2100Time (Year)
Peop
le
Sudan Population : Treaty OFF CLIMATE ONSudan Population : Treaty ON CLIMATE ON

Water As A Conflict Driver: Estimating The Effects Of Climate Change And Hydroelectric Dam
Diversion On Nile River Stream Flow During The 21st Century
Page | 59
Figure 17: Projected Population for Ethiopia, 1994-2100
Projections for Ethiopia suggest that the country’s population will grow unabated
throughout much of the 21st Century. Insofar as the country currently experiences an
overabundance of water resources and is projected to experience an increase in rainfall over
much of the 21st Century, Ethiopia would appear to face few impediments to growth within the
boundaries of this model.
5.2.1 Validation of Demographic Models
While these models inform us on the dynamic interplay between water capacity and
population growth, the assumption that a population can grow infinitely until overshooting water
capacity is clearly untenable. Factors not included in our model, such as finite hectares of arable
land, soil depletion, insect infestation, and weather volatility, could undermine projections
presented above. Nonetheless, within the boundaries of our model, what can be said about the
Ethiopia Population
400 M
300 M
200 M
100 M
0
1994 2021 2047 2074 2100Time (Year)
Peop
le
Ethiopia Population : Treaty OFF CLIMATE ONEthiopia Population : Treaty ON CLIMATE ON

Water As A Conflict Driver: Estimating The Effects Of Climate Change And Hydroelectric Dam
Diversion On Nile River Stream Flow During The 21st Century
Page | 60
validity of the estimates? Barlas (1996:189) deconstructs validation of dynamic systems models
into three main components: direct structure tests, structure oriented behavior tests, and behavior
patterns tests. Direct structure tests compare the model structure with the real system structure
based on mathematical equations and logical relationships.
We use multiple methods to verify the results given by the population model for each
country. Using what can be referred to as “hindcasting,” we examine the populations of each
country from 1994 to 2012 and compare the actual data, as provided by the World Bank (2014),
to the forecasted data. Table 2 provides a comparison of the predicted populations of each
country in 2012 with the actual population, indicating that our model produces estimates
consistent with the most recently available data.
Country Model Produced Estimate of 2012
population
Actual 2012 Population
R-squared: model results vs. actual
results Egypt 79,167,656 80,721,900 0.9933
Ethiopia 90,151,024 91,728,849 0.9997 Sudan 36,631,376 37,195,349 0.9983
Table 3. Validation of Population Estimates by Country
A better test for the consistency of the models is shown in column 4 of Table 2 which
gives the R-squared values for each country’s model. As is evident by the results, all three of the
models produce R-squared values of greater than 0.99, demonstrating a remarkably strong
correlation between estimated and actual population values. Each of the demographic models
slightly underestimates the expected value as evidenced by equation coefficients slightly larger
than 1.
To further verify our results, we conduct a Chi-squared goodness of fit test comparing the
distributions of the actual populations to expected populations based on our model. Breaking the

Water As A Conflict Driver: Estimating The Effects Of Climate Change And Hydroelectric Dam
Diversion On Nile River Stream Flow During The 21st Century
Page | 61
actual population of each country into quartiles, we binned the actual populations and conducted
the Chi-squared test using four bins. The results for all three tests caused us to fail to reject the
null hypothesis that the distribution of the actual population was the same as the model predicted
population. The results of the Chi squared test serve to further verify the accuracy of the
population model for each of the three nations of interest.
The results of our Chi Square test indicate that neither the actual nor model predicted population
distributions are normal, thereby limiting our final test to those of a non-parametric nature. The
final test we use to verify the accuracy of the population models between 1994 and 2012 is the
Wilcox Rank-Sum Test. Comparing the actual population data to the simulated population data
leads us to fail to reject the null hypothesis that the two numbers are the same statistically. Based
on the results of the three tests conducted, statistical evidence
5.3 Toward the Evolution of a Water Management System
Our study finds, much like other studies on the Nile River Basin, that temperature will increase
throughout the Basin during the 21st Century. The net effect of higher temperatures, ceterus
paribus, is lower streamflow. However, source regions of the Nile River are projected to
experience a net increase in precipitation at levels sufficient to provide these regions with a net
increase in streamflow. Sudan and particularly Egypt are likely to see less precipitation
throughout the century, particularly post 2050, resulting in attenuation of streamflow.
Hydroelectric power will become increasingly important to the Basin, particularly as countries
shift to a greater reliance on renewable energy sources. Based on our projections, the time to
invest in hydroelectric energy via dams is early in the century, before the detrimental effects of

Water As A Conflict Driver: Estimating The Effects Of Climate Change And Hydroelectric Dam
Diversion On Nile River Stream Flow During The 21st Century
Page | 62
climate change become pronounced, particularly for Egypt. Sufficient evidence now exists that
Egypt is likely to witness diminished streamflow, particularly post 2050.
The ten countries of the Nile River Basin are linked together by a common factor: water.
Sustainability of the Basin will depend on the willingness of these countries to form cooperative
agreements around the management of water that are capable of enhancing the viability of the
entire region. The current treaty, forged in 1959 between Egypt and Sudan, which allocates the
entire Nile River to these two countries, is not tenable. Upstream countries, though their
precipitation levels are projected to increase throughout the century, will require access to waters
from the tributaries of the Nile for purposes that develop their countries. However, projections
suggest that Egypt and Sudan will experience decreases in streamflow post 2050.
Avoidance of conflict within the region during the 21st Century will require attention to
the development of a comprehensive water management system. This system will have to
account for utilization of water for enhanced energy capacity in the Basin as well as an equitable
distribution of water based on changes in the water capacity of the region. Insofar as the vast
majority of water used annually is earmarked for agricultural production, anticipated changes in
population will have to be regulated and managed within the Basin’s water system. Moreover,
insofar as evidence from this study, as well as others, suggests that precipitation will likely
increase in upstream countries prior to 2050, systemic management of streamflow will be critical
in order to divert water into meaningful uses in order to avoid the negative effects of inundation.
Utilization of this water might best be directed toward the strategically planned diversion toward
the GERD reservoir.
The Nile River Basin Initiative, as a regional forum established for the purpose of
managing resources, has taken an active role in the development of future policy initiatives for

Water As A Conflict Driver: Estimating The Effects Of Climate Change And Hydroelectric Dam
Diversion On Nile River Stream Flow During The 21st Century
Page | 63
the Basin. This group will be critical in the evolution of a water management system for the
Basin. Essential to this group, are policies capable of managing the allocation and utilization of
water in a manner that is equitable and supportive of all ten countries. Such policies will need to
focus on issues associated with the dynamic association between water, crop yield, and
population growth in the contextual realities associated with climate change. Without the
presence of an association that can both establish regional policy around intra-country water
consumption and assess water utilization, the region is likely to become mired in conflicts
associated with winner-take-all strategies. Such actions will most certainly undermine the
Basin’s developmental capacity.

Water As A Conflict Driver: Estimating The Effects Of Climate Change And Hydroelectric Dam
Diversion On Nile River Stream Flow During The 21st Century
Page | 64
Chapter 6 Conclusion
The purpose of our study is to examine the impact of human factors on the streamflow of
the Nile River and its subsequent effects on regional stability in the Nile River Basin. We offer
four key findings. First, temperature is projected to increase continuously in all assessed regions
of the Nile River Basin through the 21st Century. Second, precipitation is projected to increase
water capacity in source countries (Regions 3 and 4), maintain a moderately constant capacity in
Region 2 (Sudan), and declining streamflow in Region 1 (Egypt), particularly post 2050. Third,
a reservoir fill rate of 10 to15%, given projected increases in streamflow within the Blue Nile
region, would build hydroelectric capacity in Ethiopia while concurrently ensuring a constant
level of streamflow throughout Sudan and Egypt. Fourth, increasing population throughout the
Basin during the 21st Century will further strain water capacity.
Presently, the Nile River Basin is on course to overshoot its water capacity. This
scenario will likely intensify over the next 15-20 years with the potential for increased regional
tension by mid-century. Avoidance of conflict within the Basin will require prompt attention to
the development of a comprehensive water management system. This system must account for
utilization of water for enhanced energy capacity in the Basin while maintaining an equitable
distribution of water based on anticipated regional changes in the water capacity of the region.
Post 2050, the systemic management of streamflow will be critical in order to divert water into
meaningful uses in order to avoid the concurrent negative effects of inundation and drought
throughout the Basin. Future work needs to assess plausible scenarios for sustainable water
management systems within the Basin that are capable of incorporating both agricultural and

Water As A Conflict Driver: Estimating The Effects Of Climate Change And Hydroelectric Dam
Diversion On Nile River Stream Flow During The 21st Century
Page | 65
energy production and the creation of new water sources including desalinization in light of
tremendous population growth.

Water As A Conflict Driver: Estimating The Effects Of Climate Change And Hydroelectric Dam
Diversion On Nile River Stream Flow During The 21st Century
Page | 66
Chapter 7 References
Ahmed, A. and Ismail, U. “Sediment in the Nile River System”. UNSECO, January,
2008.
Awalachew, S.Y; Aster, L.M.; Loiskandl, W.; Ayana, M.; Alamirew, T. “Water
Resources and Irrigation Development in Ethiopia”. International Water Management Institute,
2007.
Barlas, Y. Formal Aspects of Model Validity and Validation in System Dynamics.
System Dynamics Review. 12(3). 1996.
Beck, C., J. Grieser, and B. Rudolf. 2005. A New Monthly Precipitation Climatology for
the Global Land Areas for the Period 1951 to 2000. DWD, Klimastatusbericht KSB 2004, ISSN
1437-7691, ISSN 1616-5063 (Internet, ISBN 3-88148-402-7, pp.181-190.
Beyene, Mehari. “How efficient is the Grand Ethiopian Renaissance Dam?.”
International Rivers, 14 July 2011. Web. http://www.internationalrivers.org/files/attached-
files/ethiopiadamsefficiency.pdf (accessed October 8, 2013).
Block, P. and King, A. M. “An Asssessment of Reservoir Filling Policies under a
Changing Climate for Ethiopia's Grand Renaissance Dam”. Thesis. Drexel University, 2013.
Bower, E. N. Krishnan, P. MacDonald, A. O’Hagan, A. Pinelli, and E. Wakjira. 2013.
“An Uncertain Future: Predicting Climate in the Nile River Basin.” Columbia University
Sustainable Development Capstone Workshop.
Christina M. C. “Past and Future Legal Framework of the Nile River Basin.” 12
Georgetown International Environmental Law Review. 1999:269- 270.

Water As A Conflict Driver: Estimating The Effects Of Climate Change And Hydroelectric Dam
Diversion On Nile River Stream Flow During The 21st Century
Page | 67
Degefu, G.T. “The Nile: Historical, Legal, and Developmental Perspectives.” Victoria,
Canada. Trafford Publishing.
Devore, J., “A large sample interval for u,” Probability and Statistics for Engineering and
the Sciences, eight edition, Boston: 2012, 277.
El Saeed. “National Security and Human Health Implications of Climate Change.” edited
by H. J. S. Fernando, Z.B. Klaić, J.L. McCulley p. 339
Elshamy Seierstad and Sorteberg, “Impacts of Climate Change on Blue Nile flows using
bias-corrected GCM scenarios. Hydrology and Earth System Sciences. hydrol-earth-syst-
sci.net/13/551/2009/hess-13-551-2009.pdf p. 563
Encyclopedia of the Earth: Egypt. http://www.eoearth.org/view/article/152375/ .
(accessed September 5, 2013).
Encyclopedia of the Earth: Ethiopia. http://www.eoearth.org/view/article/152674/ .
(accessed September 5, 2013).
Encyclopedia of the Earth: Sudan. http://www.eoearth.org/view/article/156306/ .
(accessed September 5, 2013).
Forrester, Jay Wright. World Dynamics. Cambridge, MA: Wright-Allen, 1971.
"Grand Ethiopian Renaissance Dam Project, Benishangul-Gumuz, Ethiopia." Kable, n.d.
Web. http://www.water-technology.net/projects/grand-ethiopian-renaissance-dam-africa/
(accessed 10 Mar. 2014).
Keith, Bruce. “Limits to Population Growth and Water Resource Adequacy in The Nile
River Basin.” Tech. West Point: United States Military Academy. July 2, 2013.

Water As A Conflict Driver: Estimating The Effects Of Climate Change And Hydroelectric Dam
Diversion On Nile River Stream Flow During The 21st Century
Page | 68
King, Andrew. An Assessment of Reservoir Filling Policies Under a Changing Climate
for Ethiopia’s Grand Renaissance Dam. M.A. Thesis. Department of Environmental
Engineering. Drexel University. May 2013.
Kundell, Jim. "Water Profile of Egypt." The Encyclopedia of Earth .
http://www.eoearth.org/view/article/156938/ (accessed March 4, 2014).
Kundell, Jim. "Water Profile of Sudan." The Encyclopedia of Earth .
http://www.eoearth.org/view/article/51cbef327896bb431f69d04f/ (accessed March 5, 2014).
Kundell, Jim. “Water Profile of Ethiopia.” The Encyclopedia of Earth.
http://www.eoearth.org/view/article/51cbef2c7896bb431f69ce4f/ (accessed March 10, 2014).
Link, M.: Piontek, F.; Scheffran, J.; Schilling, J. "On foes and flows: Water conflict and
cooperation in the Nile River Basin in times of climate change." .
http://web.mit.edu/mission/www/m2017/pdfs/nilebasin.pdf (accessed March 1, 2014).
Perry, Tom, and Alastair Macdonald. "Egypt 'War' talk raises Ethiopia Nile Dam Stakes."
Ed.
Andrew Heavens. Reuters, 10 June 2013. Web.
http://www.reuters.com/article/2013/06/10/us-ethiopia-egypt-nile-war-
idUSBRE95911020130610 (accessed September 3, 2013).
Schwartzstein, Peter. "Water Wars: Egyptian's Condemn Ethiopia's Nile Dam Project."
National Geographic, September 27, 2013.
http://news.nationalgeographic.com/news/2013/09/130927-grand-ethiopian-renaissance-dam-
egypt-water-wars/ (accessed March 18, 2014).
Sherine S. Ismail and Medhat Aziz, “River Nile Natural Inflow Changes, Nile Basin
Water Science and Engineering.” Journal Vol 3 Issue 3, 2010. Suggests that annual river flow

Water As A Conflict Driver: Estimating The Effects Of Climate Change And Hydroelectric Dam
Diversion On Nile River Stream Flow During The 21st Century
Page | 69
follows a normal distribution. The effects of climate change led to this normal distribution,
leading our assumption that climate change, too follows a normal distribution.
Shiferaw, Hiwot. "Hydroelectric Power Burst in Ethiopia." Bailiff Africa, 2014.
http://bailiffafrica.org/hydroelectric-power-burst-in-ethiopia-hiwot-shiferaw/ (accessed March
12, 2014).
Sterman, John D. Business Dynamics: Systems Thinking and Modeling for a Complex
World. Boston: McGraw-Hill (2000).
Tesemma, Zelalem. “Long Term Hydrologic Trends in the Nile Basin”. Thesis. Cornell
University, May, 2009.
The World Bank , “Egypt.” Last modified 2014.
http://www.worldbank.org/en/country/egypt (accessed March 10, 2014).
The World Bank , "Ethiopia." Last modified
2014.http://www.worldbank.org/en/country/ethiopia (accessed March 10, 2014).
The World Bank, “Sudan.” Last modified 2014.
Http://www.worldbank.org/en/country/sudan (accessed March 10, 2014).
Yates, D., and K. Strzepek, Modeling the Nile Basin under climatic change,
J. Hydrol. Eng., 3(2), 98–108, 1998.

Water As A Conflict Driver: Estimating The Effects Of Climate Change And Hydroelectric Dam
Diversion On Nile River Stream Flow During The 21st Century
Page | 70
Appendix A: General Circulation Models Employed By Study
Modeling Center (or Group) Institute ID Model Name Commonwealth Scientific and industrial research organization (CSIRO) and Bureau of Meteorology (BOM), Australia
CSIRO-BOM ACCESS 1.0 ACCESS 1.3
Beijing Climate Center, China Meteorological Administration
BCC BCC-CSM1.1 BCC-CSM1.1(m)
Instituto Nacional de Pesquisas Espaciasis (National Institute for Space Research)
INPE BESM OA 2.3*
College of Global Change and Earth System Science, Beijing Normal University
GCESS BNU-ESM
Canadian Centre for Climate Modelling Analysis CCCMA CanESM2 CanCM4 CanAM4
University of Miami – RSMAS RSMAS CCSM4(RSMAS)*National Center for Atmospheric Research NCAR CCSM4 Community Earth System Model Contributors NSF-DOE-
NCAR CESM1 (BGC)
CESM1 (CAM5) CESM1(CAM5.1,
FV2) CESM1
(FASTCHEM) CESM1(WACCM)
Center for Ocean-Land-Atmosphere Studies and National Centers for Environmental Prediction
COLA and NCEP
CFS v2-2011
Centro Euro-Mediterraneo per | Cambiamenti Climatici CMCC CMCC-CESM CMCC-CM
CMCC-CMS Centre National de Recherches Météorologiques/ Centre Européen de Rescherche et Formation Acancée en Calcul Scientifique
NRM- CERFACS
CNRM-CM5
CNRM-CM5-2
Commonwealth Scientific and Industrial Research Organization in collabroration with Queensland Climate Change Centre of Excellence
CSIRO-QCCCE
CSIRO-Mk3.6.0
EC-Earth consortium EC-EARTH EC-EARTH
LASG, Institute of Atmospheric Physics, Chinese Academy of Sciences and CESS, Tsinghua University
LASG-CESS FGOALS-g2
LASG, Institute of Atmospheric Physics, Chinese Academy of Sciences
LASG-IAP FGOALS-gl FGOALS-s2
The First Institute of Oceanography, SOA, China FIO FIO-ESM
NASA Global Modelling and Assimilation Office NASA GMAO GEOS-5

Water As A Conflict Driver: Estimating The Effects Of Climate Change And Hydroelectric Dam
Diversion On Nile River Stream Flow During The 21st Century
Page | 71
NOAA Geophysical Fluid Dynamics Laboratory NOAA GFDL GFDL-CM2.1 GFDL-CM3
GFDL-ESM2G GFDL-ESM2M GFDL-HIRAM-
C180 GFDL-HIRAM-
C360 NASA Goddard Institute for Space Studies NASA GISS GISS-E2-H
GISS-E2-H-CC GISS-E2-R
GISS-E2-R-CC National Institute of Meteorological Research/Korea Meteorological Administration
NIMR/KMA HadGEM2-AO
Met Office Hadley Centre (additional HadGEM2-ES realizations contributed by Instituto Nacional de Pesquisas Espaciais)
MOHC (additional realizations by INPE)
HadCM3 HadGEM2-CC HadGEM2-ES HadGEM2-A
Institute for Numerical Mathematics INM INM-CM4
Institut Pierre-Simon Laplace IPSL IPSL-CM5A-LR IPSL-CM5A-MR IPSL-CM58-LR
Japan Agency for Marine-Earth Science and Technology, Atmosphere and Ocean Research Institute (The University of Tokyo), and National Institute for Environmental Studies
MIROC MIROC-ESM MIROC-ESM-
CHEM
Atmosphere and Ocean Research Institute (The University of Tokyo), National Institute for Environmental Studies, and Japan Agency for Marine-Earth Science and Technology
MIROC MIROC4h MIROC5
Max-Planck-Institut für Meteorologie (Max Planck Institute for Meteorology)
MPI-M MPI-ESM-MR MPI-ESM-LR MPI-ESM-P

Water As A Conflict Driver: Estimating The Effects Of Climate Change And Hydroelectric Dam
Diversion On Nile River Stream Flow During The 21st Century
Page | 72
Appendix B: GCM Estimates for Precipitation and Temperature by Baseline and Time Interval.
Region 1 Temperature Celsius (absolute change) Mean SD Min Max Baseline (1970-2000) Degrees Celsius 23.51247 0.063135 23.39227 23.63616 2010-2039 1.339714 0.336522 0.615538 2.156777 2040-2069 2.55795 0.682266 0.989572 4.196116 2070-2099 3.754007 1.386669 1.154784 6.580904 Precipitation (pct change as per baseline) Baseline (1970-2000) avg mm per day 0.083676 0.004094 0.075392 0.091388 2010-2039 0.76817 9.464448 -15.0666 34.08161 2040-2069 -5.4842 13.44645 -30.1275 42.49581 2070-2099 -10.1646 16.48913 -51.3757 19.87096 Region 2 Temperature (absolute change) Mean SD Min Max Baseline (1970-2000) Degrees Celsius 28.6879 0.07509 28.50042 28.81471 2010-2039 1.320741 0.290089 0.770276 2.218633 2040-2069 2.593155 0.633309 1.29757 4.176803 2070-2099 3.796322 1.3836 1.42838 6.797748 Precipitation (pct change as per baseline) Baseline (1970-2000) avg mm per day 0.173843 0.01184 0.153503 0.202482 2010-2039 20.0027 27.20607 -29.4655 92.70388 2040-2069 25.77937 42.21757 -27.6254 165.421 2070-2099 38.59188 69.47413 -43.0666 283.3779 Region 3 Temperature Celsius (absolute change) Mean SD Min Max Baseline (1970-2000) Degrees Celsius 24.78143 0.076027 24.61589 24.89654 2010-2039 1.075666 0.283738 0.416988 1.67915 2040-2069 2.201316 0.617205 0.739661 3.528473 2070-2099 3.287525 1.243371 0.712064 5.79721 Precipitation (pct change as per baseline) Baseline (1970-2000) avg mm per day 2.387648 0.0247 2.33719 2.450391 2010-2039 5.178637 5.848689 -4.93148 23.51502 2040-2069 7.976245 10.36755 -9.41894 42.50315 2070-2099 12.96343 15.72835 -8.17837 71.33646 Region 4 Temperature Celsius (absolute change) Mean SD Min Max Baseline (1970-2000) Degrees Celsius 26.46385 0.090793 26.2789 26.61994 2010-2039 1.044355 0.260522 0.488399 1.558883 2040-2069 2.134654 0.607395 0.836587 3.466959 2070-2099 3.191658 1.213483 0.878914 5.591757 Precipitation (pct change as per baseline) Baseline (1970-2000) avg mm per day 3.031168 0.032878 2.955664 3.078317 2010-2039 3.69223 4.564066 -5.24352 15.69697

Water As A Conflict Driver: Estimating The Effects Of Climate Change And Hydroelectric Dam
Diversion On Nile River Stream Flow During The 21st Century
Page | 73
2040-2069 6.538865 7.98511 -12.3754 30.62573 2070-2099 11.00625 11.0403 -10.821 44.96045


Department of Systems Engineering United States Military Academy West Point, New York 10096 www.nrcd.usma.edu