Water Remediation Based on Oil Adsorption Using Nanosilicates Functionalized with a Petroleum Vacuum...
13
Reprinted from Adsorption Science & Technology 2014 Volume 32 Number 2&3 Multi-Science Publishing Co. Ltd. 5 Wates Way, Brentwood, Essex CM15 9TB, United Kingdom Water Remediation Based on Oil Adsorption Using Nanosilicates Functionalized with a Petroleum Vacuum Residue Camilo A. Franco, Maricelly Martínez, Pedro Benjumea, Edgar Patiño and Farid B. Cortés
-
Upload
independent -
Category
Documents
-
view
0 -
download
0
Transcript of Water Remediation Based on Oil Adsorption Using Nanosilicates Functionalized with a Petroleum Vacuum...
Reprinted from
Adsorption Science & Technology2014 Volume 32 Number 2&3
Multi-Science Publishing Co. Ltd.5 Wates Way, Brentwood, Essex CM15 9TB, United Kingdom
Water Remediation Based on Oil AdsorptionUsing Nanosilicates Functionalized with a
Petroleum Vacuum Residue
Camilo A. Franco, Maricelly Martínez,Pedro Benjumea, Edgar Patiño and Farid B. Cortés
197
Water Remediation Based on Oil Adsorption Using Nanosilicates
Functionalized with a Petroleum Vacuum Residue
Camilo A. Franco1, Maricelly Martínez1, Pedro Benjumea1, Edgar Patiño2 and Farid B.Cortés1,* (1) Grupo de Yacimientos de Hidrocarburos, Escuela de Química y Petróleos, Facultad de Minas,
Universidad Nacional de Colombia, Sede Medellín, Colombia. (2) Petroingeniería Regional de Antioquia, Petroraza
S.A.S., Calle 80 Sur N° 47D-88, Sabaneta, Colombia.
(Received date: 16 September 2013; Accepted date: 20 December 2013)
ABSTRACT: Discharging water from oilfields has become one of the major
environmental issues related to the oil industry. This work presents a study on the
adsorption of oil onto nanoparticles of hydrophobic silica and silica nanoparticles
functionalized with a petroleum vacuum residue (VR) at 2 and 4 wt% to reduce
the amount of oil in oil–brine and oil–water emulsions at different pH values (5,
7 and 9). The initial concentration of crude oil in water ranged from 500 to 1500
mg/l. The change in oil concentration after adsorption was determined using a
UV–VIS spectrophotometer. Experimental data on the adsorption kinetics were
fitted to pseudo-first-order and pseudo-second-order models, with better results
being obtained for the latter. Results of the study showed 100% oil removal for
all the systems studied and a better performance was achieved for oil-saltwater
emulsions than the experiments performed using oil-saltwater emulsions. In
addition, the adsorption equilibrium was achieved faster for the oil–water
emulsion using the salty medium. Adsorption velocity was higher for neutral and
basic systems compared with acid ones, and it was improved by increasing the
amount of VR on silica surface.
1. INTRODUCTION
Produced water is the largest by-product generated in the oil and gas industry. This fluid is a
mixture of different inorganic and organic compounds, which can become dangerous substances
upon reacting with certain chemicals. Because of the increase in oil production around the world,
the outcome and effect of discharging produced water into the environment had lately become a
significant issue of environmental concern. In order to meet environmental regulations as well as
to reuse and recycle produced water, many studies have focused their attention on treating oily
saline produced water. The U.S. Environmental Protection Agency classifies oil production by
offshore and coastal regions. The best available technology effluent limitations specify 29 mg/l
(averaged over 30 days) as the maximum limit of oil in the water, whereas offshore best
conventional technology regulations specify 48 mg/l, averaged over 30 days (Alter 1997).
Some factors such as geological location of the field, formation rock type, reservoir lifetime and
oil characteristics can affect the physical and chemical properties of the produced water (Veil et al.
2004). Oil is insoluble in water to a great extent, and therefore most oils form oil–water emulsions
with produced water, hampering their treatment and disposal processes (Elkins et al. 2007). In gas
fields, produced water is a mixture of formation and condensed water. The oil content and salinity
*Author to whom all correspondence should be addressed. E-mail: [email protected] (F.B. Cortés).
of produced water from offshore and onshore activities can be reduced through various physical,
chemical and biological methods (Ahmaun et al. 2009). More recently, nanoparticles appear to be
a new technology positioned as a practical and interesting alternative to explore. Nanotechnology
is a multi-disciplinary field that has recently become a significant tool for industrial developments.
Nanoparticles have promised many benefits through their nano-enabled applications in multiple
sectors (Frank 1985; Randall and Hupp 2004; Appasamy 2010; Rios et al. 2011; Syed et al. 2011).
Nanoadsorbents could be used most effectively not only in a very low concentration range of
pollutant, but also in a very high concentration range where other techniques are ineffective, time
consuming or costly (Nassar 2010). Regarding the adsorption processes, silica nanoparticles have
some unique properties compared with classical adsorbents such as activated carbon (Yang 2003).
By a careful control of precipitation, using either natural or synthetic sources of silica, it is possible
to produce a number of nano-structured silica and silicate materials with specific characteristics,
properties and chemical functionality that are not found in nature (Johnston et al. 1990; Harper et
al. 1992). In this line of research, Wang et al. (2012) studied the kinetic and adsorption equilibrium
of different types of oils (vegetable oil, motor oil and light crude oil) from oil–water emulsions onto
silica aerogel (Cabot nanogel with 16-nm pore diameter and 0.7–1.2-mm size range). Adsorption
of liquid oil onto nanogel depended on the viscous flow through nanogel pores due to capillary
forces. Adsorption capacities of the three oils onto nanogel were all approximately 17 mg/l.
Because of the adsorption process, the nanogel granules come in contact with the oil surface. The
adsorption capacity of aerogel decreased as the amount of surfactant used to stabilize the emulsion
increased. When an industrial oily wastewater sample containing mainly jet fuel was used, an even
lower sorption capacity and slower sorption rate was observed due to the high stability of the oily
wastewater emulsion.
Syed et al. (2011) evaluated the potential of a commercially available hydrophobic nanosilica
(AEROSIL R 812, particle size of 7 nm) as an adsorbent for the treatment of water contaminated
with gasoline and diesel. The surface area of AEROSIL R 812 was 260 m2/g, suggesting a higher
uptake of gasoline and diesel compared with other adsorbents. The authors reported a removal
efficiency of 97% and 99%, which was higher than that of common organic or inorganic materials.
They evaluated the effect of pH changes on oil removal efficiency and showed that first-order
adsorption kinetics accurately described the diesel and gasoline batch-kinetic data. Low removal
efficiency of contaminants was observed at low pH values. Batch-kinetic studies showed that 99%
of gasoline was removed after 5 minutes.
To the best of our knowledge, there are no studies on the oil adsorption mechanisms from oily
water and oily brine at different pH values using silica nanoparticles functionalized with
petroleum vacuum residues (VRs). The aim of this work was to study the adsorption of oil from
freshwater and saltwater onto silica and silica functionalized by VR to obtain more hydrophobic
nanoparticles and improve the kinetics and adsorptive capacities compared with conventional
adsorbents at different temperatures and pH values (5, 7 and 9).
2. EXPERIMENTAL ANALYSIS
2.1. Materials
Oil in freshwater emulsions were prepared by mixing 35°API Colombian crude oil and deionized
water. Various chemicals, including NaCl (99%), KCl (99%), CaCl2 (granular < 7 mm, 93%),
NaHCO3 (99%) and MgCl2 (98%) were used to prepare the synthetic brine; HNO3 (90%) and
NaOH pellets (anhydrous, 98%) were used for varying the pH. All reagents were purchased from
198 Camilo A. Franco et al./Adsorption Science & Technology Vol. 32 No. 2&3 2014
Sigma-Aldrich. Silica nanoparticles were also provided by Sigma-Aldrich. The petroleum VR was
supplied by a local refinery (Barrancabermeja, Colombia), which was used to functionalize silica
nanoparticles with the aim of increasing their affinity for non-polar components, and consequently
improving kinetic and adsorptive capacities in comparison with conventional materials.
2.2. Methods
2.2.1. Preparation of Synthetic Brine and Oil in Brine Emulsions
Oil in water emulsions were prepared by mixing the oil and the deionized water at 6000 rpm for
20 minutes. The initial pH of the oily medium was approximately 7. Synthetic brine was prepared by
mixing the following chemical fractions in 1 liter of distilled water at 200 rpm for 6 hours: 0.63 g of
NaCl, 0.044 g of KCl, 0.13 g of CaCl2, 0.16 g of NaHCO3 and 0.026 g of MgCl2. Neutral emulsions
were converted into acidic ones by adding 2 ml of 0.1N HNO3. Neutral emulsions were converted
into basic emulsions by adding 5 ml of 0.1N NaOH. The properties of crude oil, brine and emulsions
are shown in Table 1. The procedure for preparing the oil in brine emulsions was the same as followed
for the oil in water emulsions (the difference in the preparation being the use of freshwater ‘without
salt’). The emulsions were observed for 48 hours in order to determine their stability.
2.2.2. Preparation of Nanoparticles
Silica nanoparticles were dried at 393 K for 3 hours to eliminate any remaining solvent and water, and
posteriorly impregnated with a solution of toluene + VR at different concentrations (2 and 4 wt%)
using an incipient wetness technique. Further, the hybrid material was dried for 6 hours at 393 K to
remove toluene and any other solvents. Impregnated materials are named in this work with the support
initial letters and the percentage of VR impregnated. As an example, silica nanoparticles with 2% of
VR are named as ‘Si/2VR’.
2.2.3. Characterization of Samples
The samples of nanomaterials were characterized by nitrogen adsorption at 77 K. Nitrogen
adsorption isotherms were obtained using an Autosorb-1 (Quantachrome Instruments) after the
samples were outgassed overnight at 413 K under high vacuum (6–10 mbar). The BET surface
area (SBET) values were calculated using the BET model (Rouquerol et al. 1999).
Water Remediation Based on Oil Adsorption Using Nanosilicates 199
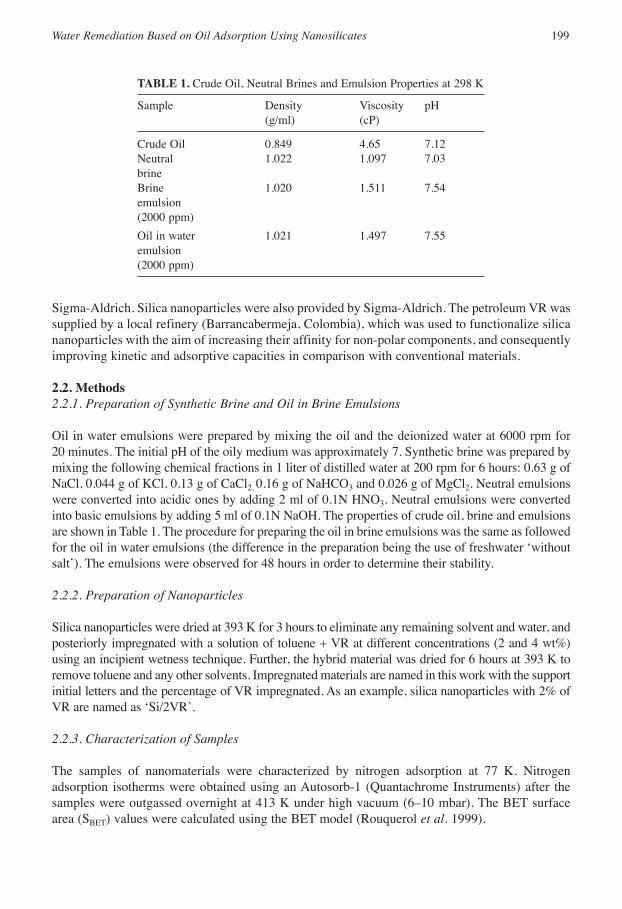
TABLE 1. Crude Oil, Neutral Brines and Emulsion Properties at 298 K
Sample Density Viscosity pH
(g/ml) (cP)
Crude Oil 0.849 4.65 7.12
Neutral 1.022 1.097 7.03
brine
Brine 1.020 1.511 7.54
emulsion
(2000 ppm)
Oil in water 1.021 1.497 7.55
emulsion
(2000 ppm)
2.2.4. Adsorption Experiments
Adsorption studies were conducted at room temperature (298 K) using a 50-ml glass beaker. Batch
isotherm experiments for different samples were performed at different initial oil concentrations
(C0 = 500, 1000 and 1500 mg/l), which were prepared by diluting oil from an initial solution
(2000 mg/l). A calibration curve of UV absorbance against crude concentration was constructed with
solutions at different concentrations using a GENESYS 10S spectrophotometer (Thermo Scientific)
at 310 nm. Synthetic brine and deionized water were used as reference in the respective absorbance
calibration curve (Franco et al. 2012a). Approximately 100 mg of nanoparticles were added to each
emulsion sample (10 ml). The emulsions were stirred at 600 rpm for 2 hours in order to reach
adsorption equilibrium. Concentration measurements were taken at 2-minute intervals during the
initial 10 minutes, and then every 10 minutes until equilibrium was reached. A sample of 3 ml was
taken and the final concentration was measured using a UV–VIS spectrophotometer (Mowla et al.
2013). This alternative to measure the final oil content of the tested emulsions was validated by
comparing several results with concentration values determined by the standard method for oil and
grease and petroleum hydrocarbons in water (ASTM 1995). Results obtained with the UV–VIS
spectrophotometer differed from those obtained according to the ASTM standard by 0.05%.
The adsorbed amount of oil q (milligram of oil/gram of nanoparticles) was determined as
shown in equation (1)
(1)
where C0 is the initial concentration of oil in the saltwater (mg/l), CE is the equilibrium
concentration of oil in the supernatant (mg/l), V is the solution volume (l) and W is the amount of
dry nanoparticles added to the brine emulsion or the oil in water emulsion (g).
3. MODELS
3.1. Kinetic Models
3.1.1. Pseudo-First- and Pseudo-Second-Order Models
Kinetic models were used to analyze the time necessary to reach adsorption equilibrium.
Equations (2) and (3) describe, respectively, the pseudo-first- and pseudo-second-order models
used to fit experimental data (Cortés et al. 2012; Franco et al. 2012b)
qt = qe(1–e–k1t) (2)
(3)
where qt (mg/g) and qe are the amounts of oil adsorbed onto nanoparticles at time t (h) and
equilibrium, respectively; k1 (hour–1) and k2 (hour–1) are the rate constants of the corresponding
kinetic model.
3.2. Adsorption Models
3.2.1. Langmuir Model
In 1916, Langmuir proposed a model which assumes that the adsorption process occurs on a
homogeneous surface by monolayer adsorption (Langmuir 1916). The Langmuir equation can be
expressed as follows:
=−
qC C
WV0 E
=+
qq k t
1 q k tt
e
2
2
e 2
200 Camilo A. Franco et al./Adsorption Science & Technology Vol. 32 No. 2&3 2014
(4)
where qmax is the maximum amount of asphaltenes per unit mass of nanoparticles for complete
monolayer coverage (mg/g) and KL is the Langmuir equilibrium adsorption constant related to the
affinity of binding sites.
3.2.2. Freundlich model
The Freundlich model describes the adsorption process representing the isothermal variation of
adsorption of a quantity of mass adsorbed by unit mass of a solid adsorbent with equilibrium
concentration and assumes that adsorption occurs in sites with non-uniform energy levels
(Freundlich 1906). The Freundlich equation is as follows:
(5)
where KF is the Freundlich constant related to the adsorption capacity [(mg/g)(l/mg)1/n] and 1/n
is the adsorption intensity factor (unitless).
4. RESULTS AND DISCUSSION
4.1. Characterization of Samples
The surface area (SBET) of the silica nanoparticles determined by N2 adsorption at 77 K was
119.1 m2/g. By adding VR at 2 and 4 wt%, the SBET was reduced to 4 and 3 m2/g, respectively. As
expected, the surface area of the samples decreased as the content of VR onto silica surface
increased. This indicates that the deposition of VR onto the silica surface blocked its pore space.
The mean crystallite size of all nanoparticles was 7 nm.
4.2. Oil Removal and Adsorption Isotherm onto Silica Nanoparticles
The adsorption isotherm could be constructed only for adsorption of oil (from the freshwater
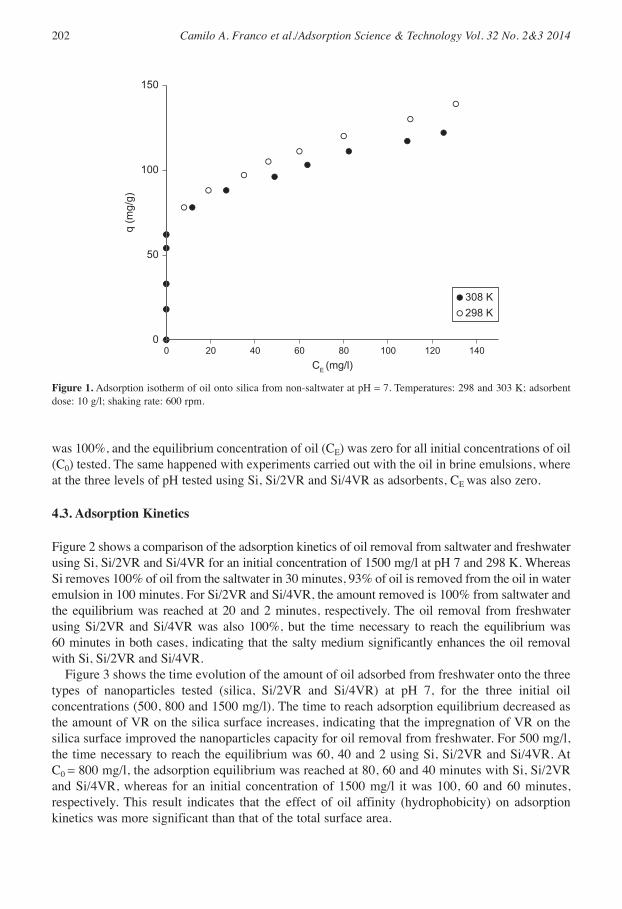
emulsion) onto Si at pH 7. Figure 1 shows the experimental data of adsorption of oil from
freshwater onto Si at pH 7 and at 298 and 303 K. The sorption isotherms follow a Type I
behaviour. By increasing the system temperature, the adsorption capacity decreases for a constant
CE. At 298 K, the maximum adsorption capacity was 138.95 mg/g at an equilibrium concentration
of 130.5 mg/l (i.e. 93% of oil removal), whereas at 308 K with the same equilibrium
concentration, the adsorption capacity was 122 mg/l. Experimental data of the adsorption isotherm
were fitted with the Langmuir and Freundlich models. The parameters obtained for the Langmuir
model were KL = 0.2906 l/mg and qmax = 169.4 mg/g with R2 = 0.98. For the Freundlich model,
KF and 1/n were 32.54 (mg/g)(l/mg)1/n and 0.3106, respectively, with R2 = 0.75. The Langmuir
model had a better fit with the experimental data, indicating that the adsorption of crude oil onto
Si from the oil in water emulsions is an adsorptive phenomenon of monolayer type.
The oil adsorption isotherms for all nanoparticle systems at pH 7 and freshwater using Si/2VR
and Si/4VR could not be plotted because, in these cases, oil removal from the oil in water emulsions
=q K CF E
1/n
=+
q q
K C
1 K Cmax
L E
L E
Water Remediation Based on Oil Adsorption Using Nanosilicates 201
202 Camilo A. Franco et al./Adsorption Science & Technology Vol. 32 No. 2&3 2014
0
50
100
150
0 20 40 60 80 100 120 140
q (m
g/g)
CE (mg/l)
308 K298 K
Figure 1. Adsorption isotherm of oil onto silica from non-saltwater at pH = 7. Temperatures: 298 and 303 K; adsorbent
dose: 10 g/l; shaking rate: 600 rpm.
was 100%, and the equilibrium concentration of oil (CE) was zero for all initial concentrations of oil
(C0) tested. The same happened with experiments carried out with the oil in brine emulsions, where
at the three levels of pH tested using Si, Si/2VR and Si/4VR as adsorbents, CE was also zero.
4.3. Adsorption Kinetics
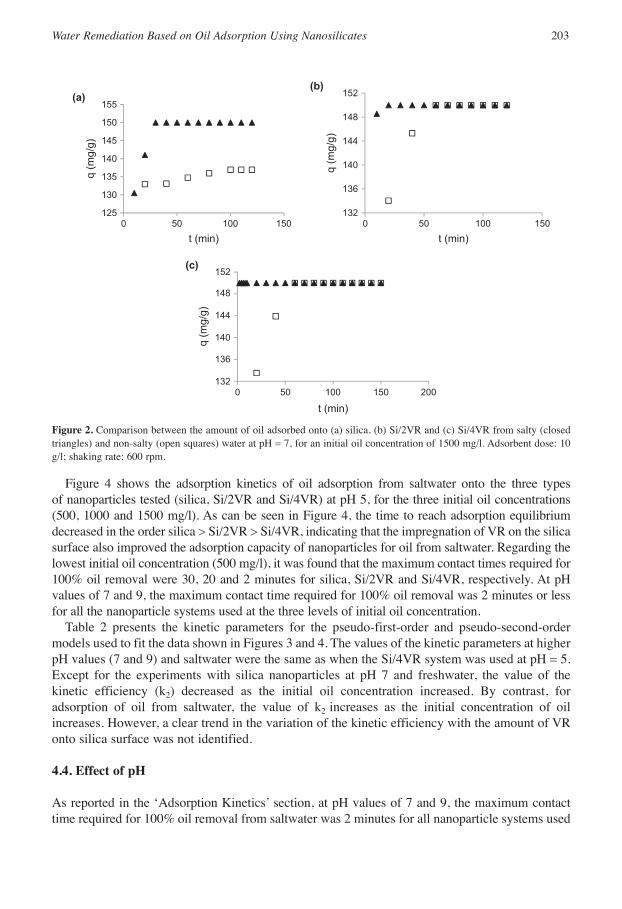
Figure 2 shows a comparison of the adsorption kinetics of oil removal from saltwater and freshwater
using Si, Si/2VR and Si/4VR for an initial concentration of 1500 mg/l at pH 7 and 298 K. Whereas
Si removes 100% of oil from the saltwater in 30 minutes, 93% of oil is removed from the oil in water
emulsion in 100 minutes. For Si/2VR and Si/4VR, the amount removed is 100% from saltwater and
the equilibrium was reached at 20 and 2 minutes, respectively. The oil removal from freshwater
using Si/2VR and Si/4VR was also 100%, but the time necessary to reach the equilibrium was
60 minutes in both cases, indicating that the salty medium significantly enhances the oil removal
with Si, Si/2VR and Si/4VR.
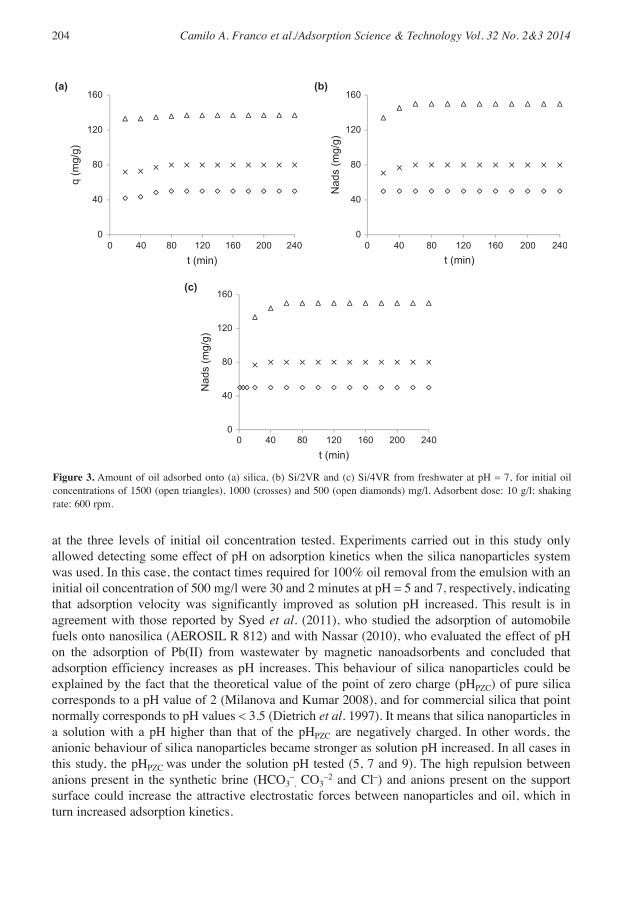
Figure 3 shows the time evolution of the amount of oil adsorbed from freshwater onto the three
types of nanoparticles tested (silica, Si/2VR and Si/4VR) at pH 7, for the three initial oil
concentrations (500, 800 and 1500 mg/l). The time to reach adsorption equilibrium decreased as
the amount of VR on the silica surface increases, indicating that the impregnation of VR on the
silica surface improved the nanoparticles capacity for oil removal from freshwater. For 500 mg/l,
the time necessary to reach the equilibrium was 60, 40 and 2 using Si, Si/2VR and Si/4VR. At
C0 = 800 mg/l, the adsorption equilibrium was reached at 80, 60 and 40 minutes with Si, Si/2VR
and Si/4VR, whereas for an initial concentration of 1500 mg/l it was 100, 60 and 60 minutes,
respectively. This result indicates that the effect of oil affinity (hydrophobicity) on adsorption
kinetics was more significant than that of the total surface area.
Water Remediation Based on Oil Adsorption Using Nanosilicates 203
125
130
135
140
145
150
155
0 50 100 150t (min)
0 50 100 150t (min)
t (min)
(a)(b)
132
136
140
144
148
152
q (m
g/g)
q (m
g/g)
132
136
140
144
148
152(c)
q (m
g/g)
0 50 100 150 200
Figure 2. Comparison between the amount of oil adsorbed onto (a) silica, (b) Si/2VR and (c) Si/4VR from salty (closed
triangles) and non-salty (open squares) water at pH = 7, for an initial oil concentration of 1500 mg/l. Adsorbent dose: 10
g/l; shaking rate: 600 rpm.
Figure 4 shows the adsorption kinetics of oil adsorption from saltwater onto the three types
of nanoparticles tested (silica, Si/2VR and Si/4VR) at pH 5, for the three initial oil concentrations
(500, 1000 and 1500 mg/l). As can be seen in Figure 4, the time to reach adsorption equilibrium
decreased in the order silica > Si/2VR > Si/4VR, indicating that the impregnation of VR on the silica
surface also improved the adsorption capacity of nanoparticles for oil from saltwater. Regarding the
lowest initial oil concentration (500 mg/l), it was found that the maximum contact times required for
100% oil removal were 30, 20 and 2 minutes for silica, Si/2VR and Si/4VR, respectively. At pH
values of 7 and 9, the maximum contact time required for 100% oil removal was 2 minutes or less
for all the nanoparticle systems used at the three levels of initial oil concentration.
Table 2 presents the kinetic parameters for the pseudo-first-order and pseudo-second-order
models used to fit the data shown in Figures 3 and 4. The values of the kinetic parameters at higher
pH values (7 and 9) and saltwater were the same as when the Si/4VR system was used at pH = 5.
Except for the experiments with silica nanoparticles at pH 7 and freshwater, the value of the
kinetic efficiency (k2) decreased as the initial oil concentration increased. By contrast, for
adsorption of oil from saltwater, the value of k2 increases as the initial concentration of oil
increases. However, a clear trend in the variation of the kinetic efficiency with the amount of VR
onto silica surface was not identified.
4.4. Effect of pH
As reported in the ‘Adsorption Kinetics’ section, at pH values of 7 and 9, the maximum contact
time required for 100% oil removal from saltwater was 2 minutes for all nanoparticle systems used
204 Camilo A. Franco et al./Adsorption Science & Technology Vol. 32 No. 2&3 2014
0
40
80
120
160(a) (b)
(c)
0 40 80 120 160 200 240
q (m
g/g)
t (min)
0 40 80 120 160 200 240t (min)
0 40 80 120 160 200 240t (min)
0
40
80
120
160
Nad
s (m
g/g)
0
40
80
120
160
Nad
s (m
g/g)
Figure 3. Amount of oil adsorbed onto (a) silica, (b) Si/2VR and (c) Si/4VR from freshwater at pH = 7, for initial oil
concentrations of 1500 (open triangles), 1000 (crosses) and 500 (open diamonds) mg/l. Adsorbent dose: 10 g/l; shaking
rate: 600 rpm.
at the three levels of initial oil concentration tested. Experiments carried out in this study only
allowed detecting some effect of pH on adsorption kinetics when the silica nanoparticles system
was used. In this case, the contact times required for 100% oil removal from the emulsion with an
initial oil concentration of 500 mg/l were 30 and 2 minutes at pH = 5 and 7, respectively, indicating
that adsorption velocity was significantly improved as solution pH increased. This result is in
agreement with those reported by Syed et al. (2011), who studied the adsorption of automobile
fuels onto nanosilica (AEROSIL R 812) and with Nassar (2010), who evaluated the effect of pH
on the adsorption of Pb(II) from wastewater by magnetic nanoadsorbents and concluded that
adsorption efficiency increases as pH increases. This behaviour of silica nanoparticles could be
explained by the fact that the theoretical value of the point of zero charge (pHPZC) of pure silica
corresponds to a pH value of 2 (Milanova and Kumar 2008), and for commercial silica that point
normally corresponds to pH values < 3.5 (Dietrich et al. 1997). It means that silica nanoparticles in
a solution with a pH higher than that of the pHPZC are negatively charged. In other words, the
anionic behaviour of silica nanoparticles became stronger as solution pH increased. In all cases in
this study, the pHPZC was under the solution pH tested (5, 7 and 9). The high repulsion between
anions present in the synthetic brine (HCO3–, CO3
−2 and Cl–) and anions present on the support
surface could increase the attractive electrostatic forces between nanoparticles and oil, which in
turn increased adsorption kinetics.

Water Remediation Based on Oil Adsorption Using Nanosilicates 205
00 40 80 120
40
80
120
160(a) (b)
(c)
0
40
80
120
160
0
40
80
120
160
q (m
g/g)
q (m
g/g)
q (m
g/g)
t (min)0 40 80 120
t (min)
0 40 80 120t (min)
Figure 4. Amount of oil adsorbed onto (a) silica, (b) Si/2VR and (c) Si/4VR from saltwater at pH = 5, for initial oil
concentrations of 1500 (open triangles), 1000 (open squares), and 500 (open diamonds) mg/l. Adsorbent dose: 10 g/l;
shaking rate: 600 rpm.
TABLE 2. Kinetic Parameters of the Pseudo-First- and Pseudo-Second-Order Models for the Adsorption of
Oil onto Silica, Si/2VR, Si/4VR at pH = 5 and 7
Material C0 (mg/l) Nads.eq* Pseudo-first-order Pseudo-second-order
experimental model model
model (mg/g)
Nads.eq k1 R2 Nads.eq k2 R2
(mg/g) (minute–1) (mg/g) (minute–1)
Silica 500 50.0 N/A N/A N/A 51.00 0.006 0.99
pH = 7 800 80.0 N/A N/A N/A 81.30 0.005 0.99
Freshwater 1500 136.9 15.40 0.0337 0.99 136.90 0.008 1.00
Si/2VR 500 50.0 N/A N/A N/A 50.00 1.333 1.00
pH = 7 800 100.0 N/A N/A N/A 80.60 0.009 0.99
Freshwater 1500 150.0 N/A N/A N/A 151.50 0.006 0.99
Si/4VR 500 50.0 N/A N/A N/A 50.00 1.333 1.00
pH = 7 800 100.0 N/A N/A N/A 80.00 0.043 1.00
Freshwater 1500 150.0 N/A N/A N/A 151.50 0.005 0.99
Silica 500 50.0 69.44 0.012 0.99 52.91 0.132 0.99
pH = 5 1000 100.0 53.60 0.041 0.99 101.01 0.152 0.99
Saltwater 1500 150.0 44.46 0.018 0.99 147.05 0.134 0.99
Si/2VR 500 50.0 74.60 0.62 0.99 54.94 0.014 0.99
pH = 5 1000 100.0 N/A N/A N/A 103.1 0.196 0.99
Saltwater 1500 150.0 N/A N/A N/A 151.5 0.436 0.99
Si/4VR 500 50.0 N/A N/A N/A 49.7 0.156 0.99
pH = 5 1000 100.0 N/A N/A N/A 101.6 0.067 0.99
Saltwater 1500 150.0 N/A N/A N/A 149.3 0.013 0.99
*Nads.eq is the amount of oil adsorbed onto the nanoparticles at equilibrium.
N/A = not applicable, because the equilibrium concentration was equal to zero for all initial oil concentrations.
5. CONCLUSIONS
Oil removal from oil in brine emulsions by adsorption of oil onto nanoparticles of hydrophobic
silica and silica nanoparticles functionalized with petroleum VR was studied. From this
experimental study aiming at analyzing the effect of the percentage of VR, emulsion pH and oil
initial concentration on adsorption efficiency and kinetics, the following conclusions can be
drawn:
• Oil removal from oil in brine emulsions of 100% was achieved with all systems tested.
However, adsorption kinetics was affected by the percentage of VR used, emulsion pH and
initial oil concentration.
• At the lowest pH tested (acid medium), the time to reach adsorption equilibrium decreased as
the percentage of VR used to functionalize the silica nanoparticles increased. This indicates
that the effect of the nanoparticles oil affinity on adsorption velocity was more relevant than
that of their total surface area. According to the experimental results obtained in this study,
functionalized silica nanoparticles constitute a promising candidate for the treatment of
produced water in oilfields.
• The time necessary to reach the adsorption equilibrium is higher for the system evaluated with
freshwater than the system with saltwater.
• At the lowest initial oil concentration tested, the maximum time to reach adsorption
equilibrium in the silica nanoparticles system was significantly reduced (from 30 to 2 minutes)
as the emulsion pH increased from 5 (acid) to 7 (neutral).
• Experimental data of oil adsorption onto all nanoparticle systems tested were accurately fitted
by pseudo-first- and pseudo-second-order kinetic models (R2 ≥ 0.99).
ACKNOWLEDGEMENTS
The authors are grateful to Colciencias and Universidad Nacional de Colombia, for logistics and
financial support.
REFERENCES
Ahmaun, F., Pendashteh, A., Chuah, L., Radiah, D., Siavash, S. and Zainal, Z. (2009) J. Hazard. Mater. 170,
530.
Alter, G.R. (1997) Oil Gas J. 95, 15.
American Society for Testing and Materials (ASTM). (1995) “Standard test method for oil and grease and
petroleum hydrocarbons in water (D3921-85).” Annual Book of ASTM Standards: Water and
Environmental Technology, Water (II), 11.02, West Conshohocken, PA, pp. 370–374.
Appasamy, D. (2010) “Physical and chemical characterization of canal sediments and their potential
remediation using zeolites.” Ph.D. Thesis, University of Wolverhampton, Wolverhampton, West Midlands,
UK.
Cortés, F.B., Mejía, J.M., Ruíz, M.A., Benjumea, P. and Riffel, D.B. (2012) Energy Fuels. 26, 1725.
Dietrich, P.G., Lerche, K.H., Reusch, J. and Nitzsche, R. (1997) Chromatographia. 44, 362.
Elkins, P., Vanner, R. and Firebrace, J. (2007) J. Cleaner Prod. 15, 1302.
Franco, C.A., Giraldo, J., Ruiz, M.A., Rojano, B.A. and Cortés, F.B. (2012a) DYNA. 176, 81.
Franco, C.A., Patiño, E., Benjumea, P., Ruiz, M.A. and Cortés, F.B. (2012b) Fuel. 105, 408.
Frank, L. (1985) Adsorption Technology: A Step-by-Step Approach to Process Evaluation and Application,
Marcel Dekker, New York.
206 Camilo A. Franco et al./Adsorption Science & Technology Vol. 32 No. 2&3 2014

Freundlich, H.M.F. (1906). J. Phys. Chem. 57, 385.
Harper, R.T., Johnston, J.H. and Thain, I.A. (1992) Geothermics. 21, 641.
Johnston, J.H., Harper, R.T. and Wiseman, N. (1990) “The controlled precipitation and use of amorphous
silica from geothermal fluid of aqueous media having a silicic acid concentration.” NZ Patent No
232170/228472, 105.
Langmuir, I. (1916). J. Am. Chem. Soc. 38, 2221.
Milanova, D. and Kumar, R. (2008) J. Heat Transfer. 130, 1.
Mowla, D., Karimi, G. and Salehi, K. (2013) Chem. Eng. J. 218, 116.
Nassar, N.N. (2010). J. Hazard. Mater. 184, 538.
Randall, Q.S. and Hupp, J. (2004) AIChE J. 50, 1090.
Rios, C.A., Appasamy, D., Roberts, C.L. and Williams, C.D. (2011) DYNA. 70, 125.
Rouquerol, F., Rouquerol, J. and Sing, K.S.W. (1999) Adsorption by Powders and Porous Solids, Academic
Press, London, UK.
Syed, S., Alhazzaa, M.I. and Asif, M. (2011) Chem. Eng. J. 167, 99.
Veil, J., Puder, D., Elcock, D. and Redweik, R.J. Jr. (2004) “A white paper describing produced water from
production of crude oil, natural gas, and coal bed methane.” Report No. ANL/EA/RP-112631, Argonne
National Laboratory, Lemont, IL/U.S. Department of Energy, Washington, DC.
Wang, D., Mclaughlin, E., Pfeffer, R. and Lin, Y.S. (2012) Sep. Purif. Technol. 99, 28.
Yang, T.R. (2003) Adsorbents: Fundamentals and Applications, Wiley InterScience, Hoboken, NJ.
Water Remediation Based on Oil Adsorption Using Nanosilicates 207