Water quality monitoring of the Black Ross Basins: 2007/08 Wet Season
60
WATER QUALITY MONITORING OF THE BLACK ROSS BASINS: 2007/08 WET SEASON Report No. 08/04 for the Black Ross WQIP August 2008
Transcript of Water quality monitoring of the Black Ross Basins: 2007/08 Wet Season

WATER QUALITY MONITORING OF THE BLACK ROSS BASINS: 2007/08 WET SEASON
Report No. 08/04
for the Black Ross WQIP
August 2008

Water quality monitoring of the Black Ross Basins:
2007/08 Wet Season.
Interim report for the Black Ross Water Quality Improvement Plan
ACTFR Report No. 08/04
Prepared by Stephen Lewis, Zoe Bainbridge, Jon Brodie, Barry Butler and Mirjam Maughan
Australian Centre for Tropical Freshwater Research James Cook University, Qld, 4811
Phone: (07) 47814262 Fax: (07) 47815589
Email: [email protected]

Executive summary Event-based water quality monitoring was conducted in the Black Ross Water Quality Improvement Plan (WQIP) Region in the 2007/08 wet season as a continuation on the previous 2006/07 campaign reported in Liessmann et al. (2007). The 2007/08 monitoring was designed to build upon the data gathered in the previous wet season in order to examine water quality signals from catchments draining different land uses, to calculate event mean concentrations of the various land uses in the region and to assist water quality model development. The monitoring sites were scaled down in the 2007/08 wet season to target specific land uses (developing urban: hillslopes and coastal plain, established urban and light industrial) in the Black Ross WQIP Region. The major catchments (Black, Bohle and Ross Rivers) were also monitored in the 2007/08 wet season to calculate sediment and nutrient loads. Pesticide samples were collected at the Alligator Creek downstream site to further investigate the presence of endosulfan residues which were detected in the previous 2006/07 wet season. Water quality data from sewage treatment plants (STP) were also obtained to examine their contribution to the total nutrient loads from the Bohle River. Broadly, four rainfall events which triggered catchment flows were sampled in the 2007/08 wet season including two smaller ‘first flush’ events and two large monsoonal rainfall events. Similarly to the previous 2006/07 wet season, catchments draining different land uses displayed strong water quality signals in the Black Ross WQIP Region in the 2007/08 wet season. Catchments draining developing urban sites contained highly elevated suspended sediment concentrations, with exceptionally high concentrations at sampling sites draining hillslope developments. Suspended sediment concentrations were at least 40-50 fold (and up to 130 fold) higher in the developing urban (hillslope) waterways compared to the adjacent comparison sites draining the nearby hillside. The runoff of suspended sediments from developing urban sites is therefore a water quality concern in the Black Ross WQIP Region. High variability in the event mean concentrations (EMC) of suspended sediments were found in the Ross and Bohle Rivers over the two successive wet seasons. Interestingly, the trends in the EMC for particulate nitrogen and phosphorus did not conform to the trends observed for the suspended sediments in these larger catchments. This result is perplexing and may reflect the erosion of different soils within the catchment areas. The EMC for particulate nitrogen were comparable or higher in the established urban sites compared to the developing urban sites. The large difference in the suspended sediment EMC and particulate nitrogen EMC between these two land uses would be related to the runoff of more fertile soils from the established urban lands. The ANNEX model appears to considerably overestimate the loads of particulate nutrients from the major catchments of Black Ross Region; this is probably due to the soils database in the model which does not account for the nutrient poor soils in these broader landscapes. Suspended sediment loads for the major catchments of the Black Ross Region showed interesting trends over the two wet seasons. The Black River loads were comparable over the two wet seasons with 33,000 tonnes and 41,000 tonnes of sediment discharged in the 2006/07 and 2007/08 wet seasons, respectively. The sediment load from the Bohle River was higher in 2007/08 (35,100 tonnes) compared to 2006/07 (22,000 tonnes) while the load from the Ross River in 2007/08 (14,500 tonnes) was much lower than the previous wet season (26,500 tonnes) despite the larger total discharge in 2007/08. The raising of the Ross River Dam spillway which was completed before the onset of the 2007/08 wet season may account for this difference where more sediment is being trapped by the dam. Waterways draining urban lands contained elevated dissolved organic nitrogen (DON) concentrations and may be sourced to the leakage of DON from urban gardens. The light industrial site contained highly elevated dissolved organic phosphorus (DOP) contents; the DOP may be sourced to the runoff of an unknown type of industrial chemical. Water courses draining established urban lands also contained elevated DOP concentrations and could be

linked to the runoff of animal excreta and garden fertilisers. The runoff of DON is a lower water quality concern in the Black Ross WQIP Region as this species of nitrogen is considered to be less bioavailable compared to dissolved inorganic nitrogen. The potential effects of DOP at this stage are unknown as the specific sources of DOP could not be resolved. Waterways draining the urban sites and the rural residential and light industrial lands had high inorganic forms of nitrogen (oxidised nitrogen: NOx and ammonia). This result suggests the use of some fertilisers in these land uses as well as more fertile soils in these areas (e.g. from top dressings). The sites draining urban and light industrial lands had highly elevated filterable reactive phosphorus (FRP) concentrations and are of concern in the Black Ross WQIP Region. The sources of the elevated FRP would include the runoff of industrial effluent (light industry) cleaning detergents (both light industry and urban lands), animal excreta (e.g. dogs), phosphorus-based fertilisers and wastewater (urban lands). The loads calculated for the STP suggest that they may contribute a considerable proportion to the nutrient loads discharged from the Black Ross Region. It is likely that little of these nutrients are transported very far into the marine environment but may pose a risk to the estuarine environment. The residence and cycling times of the nutrient-rich effluent discharge requires further research to evaluate ecological risk. Data from the Cleveland Bay STP show that plant upgrades have the potential to considerably reduce the loads of bioavailable nitrogen and phosphorus discharged from the STP. No pesticide residues were detected in the Alligator Creek site in the 2007/08 wet season. Additional research into the pesticide products applied and their properties (fate, transport potential and half lives) in the Black Ross WQIP Region is required to better assess the risk of pesticide runoff in the region. As there was considerable variability in the loads (and EMC) of sediments and nutrients in the major catchments of the Black Ross WQIP Region over the two successive wet seasons, we recommend that the monitoring of these waterways (Black, Ross and Bohle Rivers, Alligator and Bluewater Creeks) continue into the 2008/09 wet season. The results of this monitoring would further strengthen the water quality dataset and help produce better estimations of catchment loads in the Black Ross WQIP Region. The monitoring of the light industrial site (Hills Street Drain), which was established in the 2007/08 wet season, should also continue into the 2008/09 wet season to obtain two years of monitoring data. We also recommend that this site be monitored into the 2008/09 wet season to determine the constituents of the brown sludge observed in the previous wet season. The fate of nutrients discharged from the STP in the Bohle River would be another valuable study. In particular, the knowledge of residence times of the effluent would be important to evaluate the ecological risk of this discharge.

Water quality monitoring – Black Ross Basins 2007/08. ACTFR Report 08/04
Table of Contents
1. INTRODUCTION .............................................................................................1
2. 2007/08 FLOW EVENTS AND SAMPLING TIMING ...................................2
3. METHODS ........................................................................................................7
3.1 Site Selection .................................................................................................7 3.2 Sampling Methods .........................................................................................7 3.3 Analytical Methods......................................................................................10 3.3.1 Electrical conductivity and salinity..........................................................10 3.3.2 Total suspended solids .............................................................................10 3.3.3 Nutrients...................................................................................................10 3.3.4 Pesticides..................................................................................................11 3.4 Load Calculations ........................................................................................11 3.5 Event Mean Concentration Calculations .....................................................11 4.1 Electrical Conductivity (EC)........................................................................13 4.2 Total Suspended Solids (TSS) .....................................................................13 4.3 Nutrients.......................................................................................................17 4.3.1 Particulate nitrogen and phosphorus........................................................17 4.3.2 Dissolved organic nitrogen and phosphorus ............................................22 4.3.3 Dissolved inorganic nitrogen and phosphorus.........................................26 4.4 Sewage treatment plant contributions..........................................................32 4.5 Pesticide residues in Alligator Creek...........................................................34
5. DISCUSSION..................................................................................................36
6. CONCLUSIONS AND RECOMMENDATIONS ..........................................39
7. REFERENCES ................................................................................................40
APPENDIX A..............................................................................................................42
Box Plot Diagram ........................................................................................................42
APPENDIX B ..............................................................................................................43
Hydrographs of the major watercourses in the Black Ross WQIP Region .................43
APPENDIX C ..............................................................................................................47
Water quality data ........................................................................................................47
i

Water quality monitoring – Black Ross Basins 2007/08. ACTFR Report 08/04
1. INTRODUCTION
Over the last two wet seasons (2006/07 and 2007/08), the Australian Centre for Tropical Freshwater Research (ACTFR) has conducted an event water quality monitoring program for the Black Ross Water Quality Improvement Plan (WQIP). The water quality monitoring undertaken during the first wet season (2006/07) was designed as a pilot investigation to examine the water quality issues from the various catchments in the region and included a suite of parameters such as total suspended sediments, nutrients (full speciation of nitrogen and phosphorus), pesticide residues, trace metals and oil and grease residues. The results from this wet season and a thorough background to the study are reported in Liessmann et al. (2007). A more focused monitoring approach was conducted in the following 2007/08 wet season, which assessed sediment and nutrient runoff from catchments dominated by the established urban, developing urban and light industrial land uses. The three largest waterways in the region (Black River, Bohle River and Ross River) were also monitored in the 2007/08 wet season so that sediment and nutrient loads could be calculated and compared to the previous 2006/07 wet season. One of the key aims of this monitoring approach is to provide event mean concentration (EMC) data for each of these land use types and larger end-of-river sites for use by catchment modellers. In addition, Alligator Creek was monitored to investigate the presence of pesticide residues, particularly endosulfan, which was detected in the previous 2006/07 wet season. This report presents the results from the 2007/08 event water quality monitoring program and builds on the water quality dataset collected in the previous 2006/07 wet season. We present EMC for suspended sediments and nutrients (ammonia, nitrate, nitrite, dissolved organic nitrogen, particulate nitrogen, filterable reactive phosphorus, dissolved organic phosphorus and particulate phosphorus) from the different land uses in the region using the data from both wet seasons and calculate loads for the major catchments in the region. The load data from the major waterways have been adjusted to mean annual flows and compared with the latest SedNet and ANNEX models. We calculate loads for the sewage treatment plants (STP) which discharge into the major rivers of the Black Ross WQIP Region to investigate their relative contribution to the annual loads of nitrogen and phosphorus. Finally, we investigate the analysis of pesticide residues from the Alligator Creek site. The specific objectives of this project are to:
• Obtain data that will aid the identification of sub-catchments and land uses responsible for the fluvial exportation of sediments, nutrients and pesticides from the Black Ross WQIP Region;
• Augment the baseline data that will be needed to support regional and local target-setting, and the Black Ross WQIP;
• Improve the ability to predict loads and concentrations of sediments, nutrients and pesticides being exported to the GBR lagoon; and
• Increase awareness of water quality and aquatic ecosystem issues within the Black Ross WQIP Region.
Australian Centre for Tropical Freshwater Research 1
Water quality monitoring – Black Ross Basins 2007/08. ACTFR Report 08/04
2. 2007/08 FLOW EVENTS AND SAMPLING TIMING
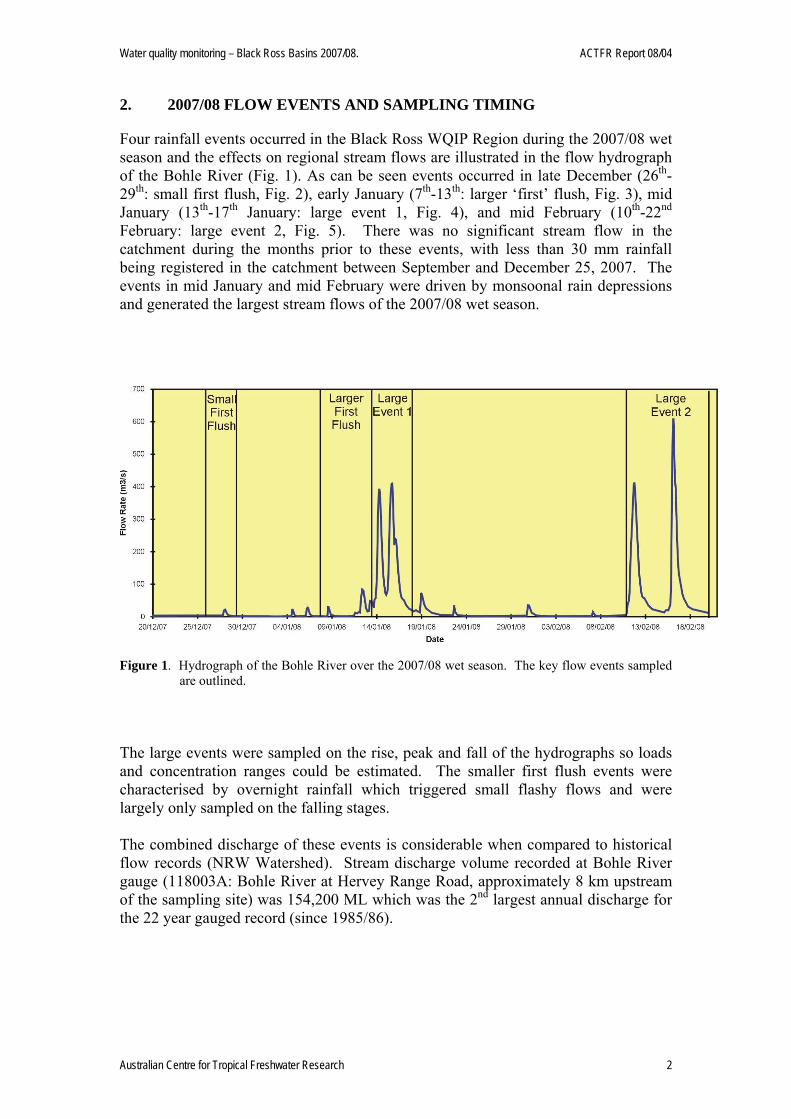
Four rainfall events occurred in the Black Ross WQIP Region during the 2007/08 wet season and the effects on regional stream flows are illustrated in the flow hydrograph of the Bohle River (Fig. 1). As can be seen events occurred in late December (26th-29th: small first flush, Fig. 2), early January (7th-13th: larger ‘first’ flush, Fig. 3), mid January (13th-17th January: large event 1, Fig. 4), and mid February (10th-22nd February: large event 2, Fig. 5). There was no significant stream flow in the catchment during the months prior to these events, with less than 30 mm rainfall being registered in the catchment between September and December 25, 2007. The events in mid January and mid February were driven by monsoonal rain depressions and generated the largest stream flows of the 2007/08 wet season.
Figure 1. Hydrograph of the Bohle River over the 2007/08 wet season. The key flow events sampled
are outlined. The large events were sampled on the rise, peak and fall of the hydrographs so loads and concentration ranges could be estimated. The smaller first flush events were characterised by overnight rainfall which triggered small flashy flows and were largely only sampled on the falling stages. The combined discharge of these events is considerable when compared to historical flow records (NRW Watershed). Stream discharge volume recorded at Bohle River gauge (118003A: Bohle River at Hervey Range Road, approximately 8 km upstream of the sampling site) was 154,200 ML which was the 2nd largest annual discharge for the 22 year gauged record (since 1985/86).
Australian Centre for Tropical Freshwater Research 2

Water quality monitoring – Black Ross Basins 2007/08. ACTFR Report 08/04
Figure 2. Map showing the rainfall distribution during the small first flush event (26th-29th December)
monitored in the 2007/08 wet season.
Australian Centre for Tropical Freshwater Research 3

Water quality monitoring – Black Ross Basins 2007/08. ACTFR Report 08/04
Figure 3. Map showing the rainfall distribution during the larger first flush event (8th-13th January)
monitored in the 2007/08 wet season.
Australian Centre for Tropical Freshwater Research 4

Water quality monitoring – Black Ross Basins 2007/08. ACTFR Report 08/04
Figure 4. Map showing the rainfall distribution during the 1st large event (14th-17th January) monitored
in the 2007/08 wet season.
Australian Centre for Tropical Freshwater Research 5
Water quality monitoring – Black Ross Basins 2007/08. ACTFR Report 08/04
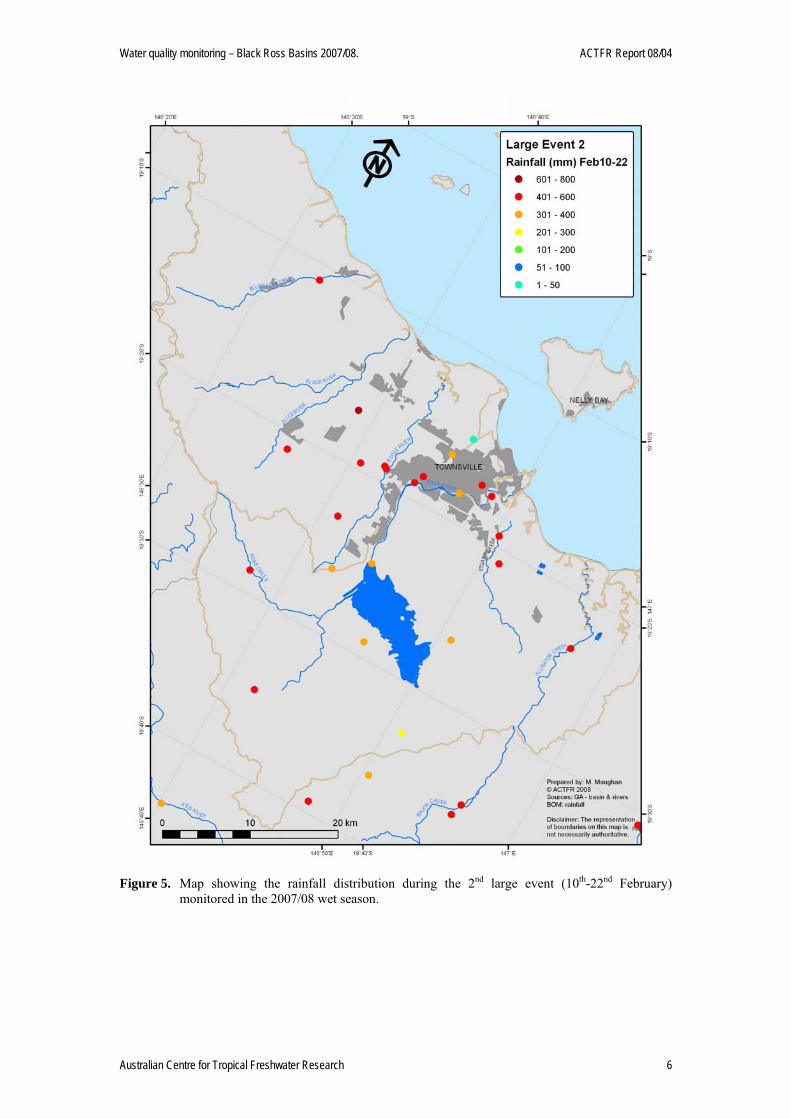
Figure 5. Map showing the rainfall distribution during the 2nd large event (10th-22nd February)
monitored in the 2007/08 wet season.
Australian Centre for Tropical Freshwater Research 6
Water quality monitoring – Black Ross Basins 2007/08. ACTFR Report 08/04
Australian Centre for Tropical Freshwater Research 7
3. METHODS
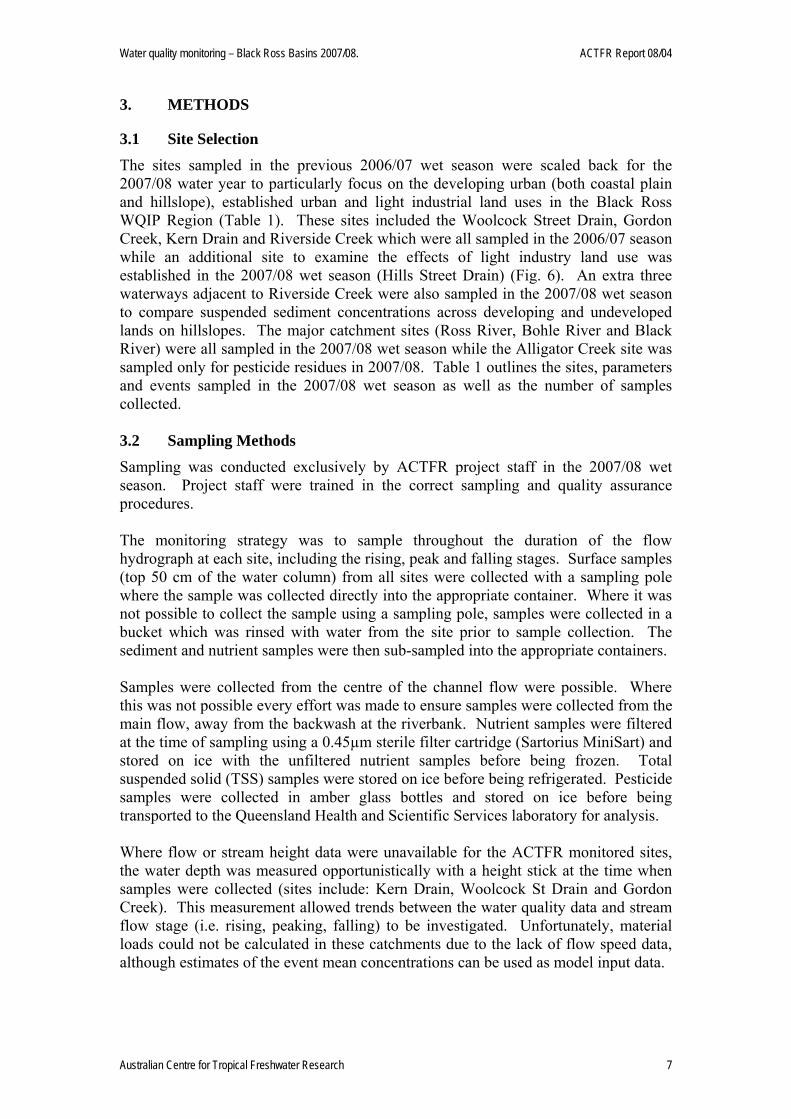
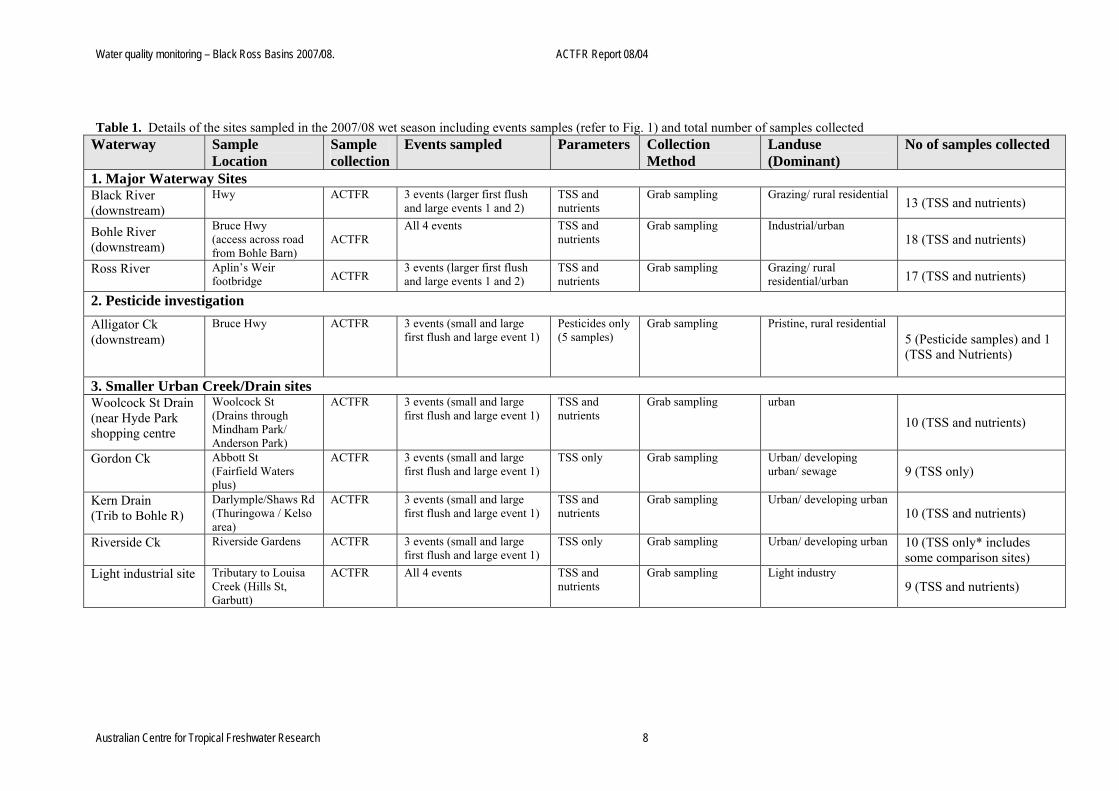
3.1 Site Selection The sites sampled in the previous 2006/07 wet season were scaled back for the 2007/08 water year to particularly focus on the developing urban (both coastal plain and hillslope), established urban and light industrial land uses in the Black Ross WQIP Region (Table 1). These sites included the Woolcock Street Drain, Gordon Creek, Kern Drain and Riverside Creek which were all sampled in the 2006/07 season while an additional site to examine the effects of light industry land use was established in the 2007/08 wet season (Hills Street Drain) (Fig. 6). An extra three waterways adjacent to Riverside Creek were also sampled in the 2007/08 wet season to compare suspended sediment concentrations across developing and undeveloped lands on hillslopes. The major catchment sites (Ross River, Bohle River and Black River) were all sampled in the 2007/08 wet season while the Alligator Creek site was sampled only for pesticide residues in 2007/08. Table 1 outlines the sites, parameters and events sampled in the 2007/08 wet season as well as the number of samples collected. 3.2 Sampling Methods Sampling was conducted exclusively by ACTFR project staff in the 2007/08 wet season. Project staff were trained in the correct sampling and quality assurance procedures. The monitoring strategy was to sample throughout the duration of the flow hydrograph at each site, including the rising, peak and falling stages. Surface samples (top 50 cm of the water column) from all sites were collected with a sampling pole where the sample was collected directly into the appropriate container. Where it was not possible to collect the sample using a sampling pole, samples were collected in a bucket which was rinsed with water from the site prior to sample collection. The sediment and nutrient samples were then sub-sampled into the appropriate containers. Samples were collected from the centre of the channel flow were possible. Where this was not possible every effort was made to ensure samples were collected from the main flow, away from the backwash at the riverbank. Nutrient samples were filtered at the time of sampling using a 0.45µm sterile filter cartridge (Sartorius MiniSart) and stored on ice with the unfiltered nutrient samples before being frozen. Total suspended solid (TSS) samples were stored on ice before being refrigerated. Pesticide samples were collected in amber glass bottles and stored on ice before being transported to the Queensland Health and Scientific Services laboratory for analysis. Where flow or stream height data were unavailable for the ACTFR monitored sites, the water depth was measured opportunistically with a height stick at the time when samples were collected (sites include: Kern Drain, Woolcock St Drain and Gordon Creek). This measurement allowed trends between the water quality data and stream flow stage (i.e. rising, peaking, falling) to be investigated. Unfortunately, material loads could not be calculated in these catchments due to the lack of flow speed data, although estimates of the event mean concentrations can be used as model input data.
Water quality monitoring – Black Ross Basins 2007/08. ACTFR Report 08/04
Table 1. Details of the sites sampled in the 2007/08 wet season including events samples (refer to Fig. 1) and total number of samples collected Waterway Sample
Location Sample collection
Events sampled Parameters Collection Method
Landuse (Dominant)
No of samples collected
1. Major Waterway Sites Black River (downstream)
Hwy ACTFR 3 events (larger first flush and large events 1 and 2)
TSS and nutrients
Grab sampling Grazing/ rural residential 13 (TSS and nutrients)
Bohle River (downstream)
Bruce Hwy (access across road from Bohle Barn)
ACTFR All 4 events TSS and
nutrients Grab sampling Industrial/urban
18 (TSS and nutrients)
Ross River
Aplin’s Weir footbridge ACTFR
3 events (larger first flush and large events 1 and 2)
TSS and nutrients
Grab sampling Grazing/ rural residential/urban 17 (TSS and nutrients)
2. Pesticide investigation Alligator Ck (downstream)
Bruce Hwy ACTFR 3 events (small and large first flush and large event 1)
Pesticides only (5 samples)
Grab sampling Pristine, rural residential 5 (Pesticide samples) and 1 (TSS and Nutrients)
3. Smaller Urban Creek/Drain sites Woolcock St Drain (near Hyde Park shopping centre
Woolcock St (Drains through Mindham Park/ Anderson Park)
ACTFR 3 events (small and large first flush and large event 1)
TSS and nutrients
Grab sampling urban
10 (TSS and nutrients)
Gordon Ck Abbott St (Fairfield Waters plus)
ACTFR 3 events (small and large first flush and large event 1)
TSS only Grab sampling Urban/ developing urban/ sewage 9 (TSS only)
Kern Drain (Trib to Bohle R)
Darlymple/Shaws Rd (Thuringowa / Kelso area)
ACTFR 3 events (small and large first flush and large event 1)
TSS and nutrients
Grab sampling Urban/ developing urban 10 (TSS and nutrients)
Riverside Ck Riverside Gardens ACTFR 3 events (small and large first flush and large event 1)
TSS only Grab sampling Urban/ developing urban 10 (TSS only* includes some comparison sites)
Light industrial site Tributary to Louisa Creek (Hills St, Garbutt)
ACTFR All 4 events TSS and nutrients
Grab sampling Light industry 9 (TSS and nutrients)
Australian Centre for Tropical Freshwater Research 8

Water quality monitoring – Black Ross Basins 2007/08. ACTFR Report 08/04
Figure 6. Map showing the locations of the water quality monitoring sites in the 2007/08 wet season.
Australian Centre for Tropical Freshwater Research 9

Water quality monitoring – Black Ross Basins 2007/08. ACTFR Report 08/04
3.3 Analytical Methods Samples collected for TSS, electrical conductivity and nutrients were analysed at the Australian Centre for Tropical Freshwater Research (ACTFR) Water Quality Laboratory, James Cook University (JCU), Townsville. Samples collected for pesticide analyses were analysed at the Queensland Health Scientific Services (QHSS) laboratory, Brisbane. 3.3.1 Electrical conductivity and salinity Electrical conductivity values were analysed directly using an ATI Orion 130 specific conductivity meter (Analytical Technology, Incorporated, USA), after calibration with reference potassium chloride standards similar to the sample range. A total of 97 samples were analysed for electrical conductivity in the 2007/08 wet season. Three duplicate field samples were collected to investigate analytical precision. These duplicate samples were within 5%. 3.3.2 Total suspended solids Samples that were collected for TSS analysis were filtered through pre-weighed GF/C filter membranes (nominally 1.2µm pore size) and oven dried at 103-105ºC for 24 hours before being re-weighed to determine the dry TSS weight. A total of 97 samples were collected and analysed for TSS throughout the 2007/08 wet season. 10% of all TSS samples were duplicated to assess the repeatability of the analysis. Duplicate determinations were, on average, within 10% of each other. In addition, three duplicate field samples were collected to examine analytical precision. These samples were within 10%. 3.3.3 Nutrients Samples were analysed for total nitrogen (TN) and phosphorus (TP), total filterable nitrogen (TFN) and phosphorus (TFP), ammonia, NOx (nitrate and nitrite) and filterable reactive phosphorus (FRP). Samples for TN and TP, and TFN and TFP were digested in an autoclave using an alkaline persulfate technique (modified from Hosomi and Sudo 1987) and the resulting solution simultaneously analysed for NOx and FRP by segmented flow auto-analysis using an ALPKEM Flow Solution II (Alpkem Corporation, Wilsonville, Oregon, USA). The analyses of NOx, ammonia and FRP were also conducted using standard segmented flow auto-analysis techniques following standard methods (APHA, AWWA and WEF 2005). Particulate nutrient concentrations were calculated by subtracting the total filterable nutrient concentrations from the total nutrient concentrations. Similarly, filterable organic nitrogen or phosphorus (referred to in this report as DON or DOP) was calculated by subtracting of NOx plus ammonia (for nitrogen) or FRP (for phosphorus) from the TFN or TFP concentration. A total of 78 samples were collected for nutrient analysis in the 2007/08 wet season. Three duplicate field samples were collected in the wet season to investigate analytical precision. In general, the samples analysed for ammonia, PN, PP, DON, TN and TP were within 10% of each other while the precision of NOx, DOP and FRP were more variable with some samples outside the 10% range.
Australian Centre for Tropical Freshwater Research 10
Water quality monitoring – Black Ross Basins 2007/08. ACTFR Report 08/04
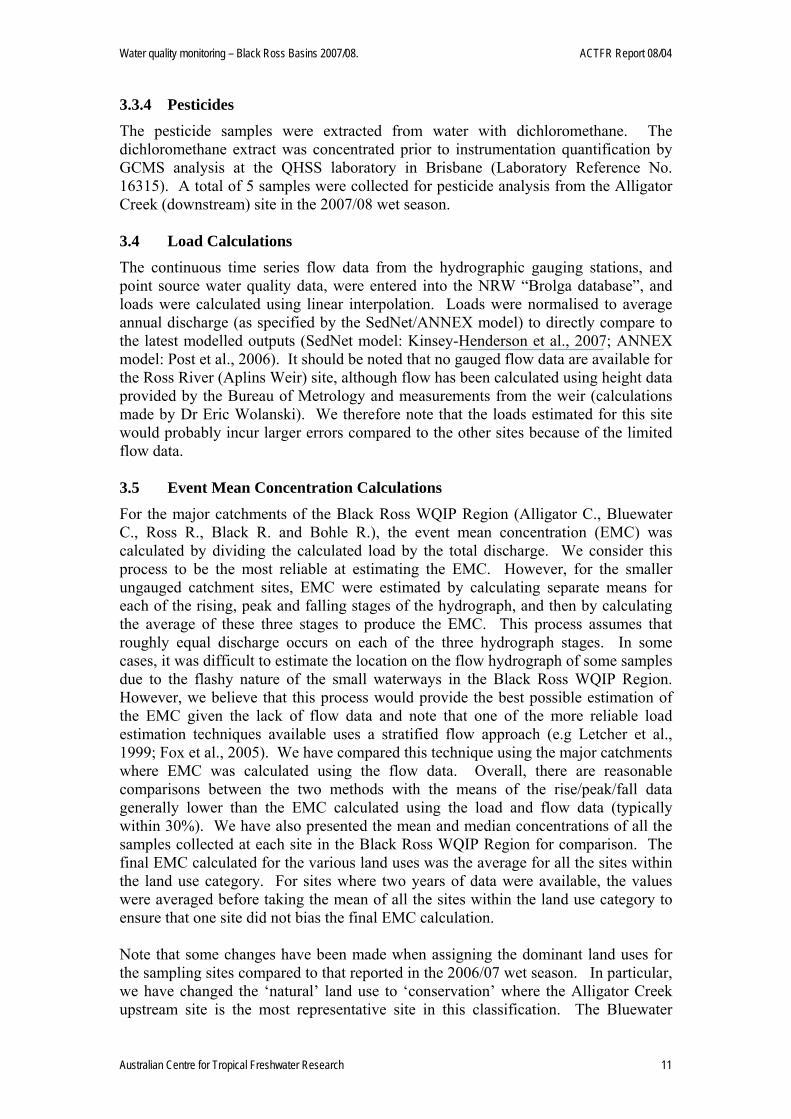
3.3.4 Pesticides The pesticide samples were extracted from water with dichloromethane. The dichloromethane extract was concentrated prior to instrumentation quantification by GCMS analysis at the QHSS laboratory in Brisbane (Laboratory Reference No. 16315). A total of 5 samples were collected for pesticide analysis from the Alligator Creek (downstream) site in the 2007/08 wet season. 3.4 Load Calculations The continuous time series flow data from the hydrographic gauging stations, and point source water quality data, were entered into the NRW “Brolga database”, and loads were calculated using linear interpolation. Loads were normalised to average annual discharge (as specified by the SedNet/ANNEX model) to directly compare to the latest modelled outputs (SedNet model: Kinsey-Henderson et al., 2007; ANNEX model: Post et al., 2006). It should be noted that no gauged flow data are available for the Ross River (Aplins Weir) site, although flow has been calculated using height data provided by the Bureau of Metrology and measurements from the weir (calculations made by Dr Eric Wolanski). We therefore note that the loads estimated for this site would probably incur larger errors compared to the other sites because of the limited flow data. 3.5 Event Mean Concentration Calculations For the major catchments of the Black Ross WQIP Region (Alligator C., Bluewater C., Ross R., Black R. and Bohle R.), the event mean concentration (EMC) was calculated by dividing the calculated load by the total discharge. We consider this process to be the most reliable at estimating the EMC. However, for the smaller ungauged catchment sites, EMC were estimated by calculating separate means for each of the rising, peak and falling stages of the hydrograph, and then by calculating the average of these three stages to produce the EMC. This process assumes that roughly equal discharge occurs on each of the three hydrograph stages. In some cases, it was difficult to estimate the location on the flow hydrograph of some samples due to the flashy nature of the small waterways in the Black Ross WQIP Region. However, we believe that this process would provide the best possible estimation of the EMC given the lack of flow data and note that one of the more reliable load estimation techniques available uses a stratified flow approach (e.g Letcher et al., 1999; Fox et al., 2005). We have compared this technique using the major catchments where EMC was calculated using the flow data. Overall, there are reasonable comparisons between the two methods with the means of the rise/peak/fall data generally lower than the EMC calculated using the load and flow data (typically within 30%). We have also presented the mean and median concentrations of all the samples collected at each site in the Black Ross WQIP Region for comparison. The final EMC calculated for the various land uses was the average for all the sites within the land use category. For sites where two years of data were available, the values were averaged before taking the mean of all the sites within the land use category to ensure that one site did not bias the final EMC calculation. Note that some changes have been made when assigning the dominant land uses for the sampling sites compared to that reported in the 2006/07 wet season. In particular, we have changed the ‘natural’ land use to ‘conservation’ where the Alligator Creek upstream site is the most representative site in this classification. The Bluewater
Australian Centre for Tropical Freshwater Research 11

Water quality monitoring – Black Ross Basins 2007/08. ACTFR Report 08/04
Creek upstream and Campus Creek sites have now been included in the ‘minimal use’ category as the Bluewater Creek upstream site is lightly grazed by cattle and the Campus Creek site is classed as defence lands. Captains Creek has now been classed as an established urban site while the urban land use has been divided into established urban, developing urban on the coastal plain and developing urban on hillslopes. The three major catchment sites (Ross River, Black River and Bohle River) have been removed from classification into land uses and are considered separately. We note that the Stuart Creek downstream site has been retained in the urban/industrial land use although a large proportion of the upstream catchment area is dominated by grazing lands. The water quality of this site exhibits mixed land use signals.
Australian Centre for Tropical Freshwater Research 12

Water quality monitoring – Black Ross Basins 2007/08. ACTFR Report 08/04
4. RESULTS
4.1 Electrical Conductivity (EC)
The electrical conductivity (EC) of the vast majority of samples collected in the 2007/08 were below 200 μS/cm (Fig. 7). This result indicates that these samples are from a freshwater source and derived from the upstream catchment area. However, EC values exceeded 200 μS/cm in some samples from four tidally influenced monitoring sites comprising Gordon Creek, Woolcock St Drain, Bohle River and Hills St Drain. This result suggests a possible influence from seawater intrusion but could also be attributable to runoff from supratidal estuarine soils. Samples with EC values >1,000 μS/cm were collected before the large events in the 2007/08 wet season.
Figure 7. A boxplot summarising electrical conductivity of the samples collected from the Black
Ross WQIP Region over the 2007/08 wet season. 4.2 Total Suspended Solids (TSS) Similarly to the previous 2006/07 wet season, waterways draining the developing urban sites contained elevated total suspended solid (TSS) concentrations with particularly high contents at the developing urban hillslope site which had a peak TSS concentration of 20,000 mg/L (Fig. 8a). This result is comparable to the peak concentration (34,000 mg/L) measured at this site in the previous wet season. Other opportunistic samples were collected at the same time from undeveloped sites
Australian Centre for Tropical Freshwater Research 13

Water quality monitoring – Black Ross Basins 2007/08. ACTFR Report 08/04
adjacent to this developing urban hillslope site for comparison. These samples were all consistently below 100 mg/L (with most samples below 50 mg/L) and were at least 40-50 fold (and up to ~130 fold) below the concentrations measured at similar hillslope sites draining the developing urban lands. The developing urban sites on the coastal plain (Kern Drain and Gordon Creek) also had considerably higher TSS concentrations compared to the established urban site (Woolcock St Drain) in the 2007/08 wet season (Fig. 8b), a result consistent with the previous year (Liessmann et al., 2007).
Figure 8a. A boxplot summarising the total suspended solid concentrations (mg/L) of samples
collected from the Black Ross WQIP Region over the 2007/08 wet season.
Australian Centre for Tropical Freshwater Research 14

Water quality monitoring – Black Ross Basins 2007/08. ACTFR Report 08/04
Figure 8b. Re-scaled boxplot of total suspended solid concentrations (mg/L) of the samples collected
from the Black Ross WQIP Region over the 2007/08 wet season. The summary of the TSS concentrations over the 2006/07 and 2007/08 wet seasons show strong land use signals (Table 2). Interestingly, the TSS EMC calculated for the established urban sites (20 mg/L) is similar to the conservation land use (19 mg/L). The minimal, rural residential, urban industrial (only Stuart C. d/s site) and the light industrial sites had slightly elevated TSS EMC while the developing urban sites all had considerably higher TSS EMC concentrations. The large difference between the TSS EMC for the two urban industrial sites (Stuart C. d/s and Louisa C.) reflects the difference in catchment area and land use. The Stuart Creek d/s site has large upstream catchment area which is largely grazing lands while the Louisa Creek site drains a much smaller catchment area dominated by urban lands.
Australian Centre for Tropical Freshwater Research 15

Water quality monitoring – Black Ross Basins 2007/08. ACTFR Report 08/04
Table 2. Summary of TSS concentrations (mg/L) for the different land uses in the Black Ross WQIP Region over the 2006/07 and 2007/08 wet seasons.
Dominant Land use Site Year
mean (all
data)
median (all
data)
rise (mean)
peak (mean)
fall (mean)
Mean rise,
peak & fall
Mean EMC
(mg/L)
2006/07 22 24 20 29 22 24 Woolcock St Drain 2007/08 15 10 51 17 8.8 26 Established
Urban Captain C. 2006/07 15 15 25 12 7.4 15
20
2006/07 339 278 612 284 185 360 Kern Drain 2007/08 502 445 637 770 389 599
2006/07 409 351 783 444 184 470
Developing Urban
(coastal plain)
Gordon C. 2007/08 662 130 4600 500 123 1741
795
Developing Urban
(Hillslope)
Riverview C.
2006-08 11142 4975 11140*
Light Industrial
Hill St Drain 2007/08 49 43 100 46 26 57 57
Stuart C. (d/s) 2006/07 237 200 257 305 169 244 Urban/
industrial Louisa C. 2006/07 14 12 21 15 7.8 15
130
Sachs C. 2006/07 29 7.1 139 21 5.6 55 Bluewater
C. (d/s) 2006/07 27 8.3 40 45 4.4 30 Rural residential
Alligator C. (d/s) 2006/07 20 19 20 14 24 19
35
Stuart C. (u/s) 2006/07 96 63 41 224 49 105
HenCamp C. 2006/07 27 9.3 46 47 14 36
Campus C. 2006/07 14 3.5 10 49 1.9 20
Minimal use
Bluewater C. (u/s) 2006/07 55 18 130 48 9 62
56
Conservation Alligator C. (u/s) 2006/07 12 7 34 19 4.6 19 19
*This land use was not fully sampled over the hydrograph and most samples were collected over the rise and peak stages. Therefore this mean is probably overestimated. Suspended sediment loads calculated for the major catchments over the monitoring period show mixed comparisons with the latest SedNet model run (Kinsey-Henderson et al., 2007). The flow adjusted sediment loads calculated for the three largest catchments in the Townsville Region (Ross River, Black River and Bohle River) compared reasonably well with the SedNet model (Table 3), although the comparisons for the smaller catchments (Alligator Creek and Bluewater Creek) were poor. This result is expected as the SedNet model is not specifically designed for small, flat coastal catchments of which there would be little/no input data available for the model from these areas. Interestingly, the loads for the Ross River showed high variability over the two wet seasons with the EMC in the 2007/08 wet season (50 mg/L) half that of the previous wet season (100 mg/L). The extension to the Ross River Dam spillway which was completed prior to the 2007/08 wet season may
Australian Centre for Tropical Freshwater Research 16

Water quality monitoring – Black Ross Basins 2007/08. ACTFR Report 08/04
explain the lower suspended sediment EMC as more trapping of sediments may have occurred. Sampling in the 2008/09 wet season may help to investigate this assertion. In contrast, the EMC for the Bohle River was higher in the 2007/08 wet season compared to 2006/07 (Table 3). The EMC for the Black River was consistent over the successive wet seasons. We suggest that the average flow data used by the SedNet/ANNEX model may be underestimated for the Ross River and overestimated for the Bohle River. While the flow events of 2006/07 and 2007/08 have been relatively high in the region for both the Bohle and Ross Rivers, the SedNet models predicts average flows of 204,400 ML and 29,200 ML, respectively. This estimate is 50,000 ML higher than the 2006/07 and 2007/08 flows in the Bohle River which were among the highest flows recorded for this system in the 22 year gauged record (see section 2). In contrast the predicted flow for the Ross River is only around 10% of the discharge recorded in 2006/07 and 2007/08. Therefore the estimate of annual loads of sediments and nutrients by the SedNet/ANNEX model would also be compromised due to these discrepancies in annual flow. Table 3. Suspended sediment loads of the major catchments in the Black Ross WQIP Region over
the 2006/07 and 2007/08 wet seasons. 2006/07 2007/08 Comparison to model
Catchment Sediment load 2007
(tonnes)
Total flow
volume (ML)
EMC (mg/L)
Sediment load 2008
(tonnes)
Total flow volume (ML)
EMC (mg/L)
Load adjusted to
mean annual flow*
(tonnes)
SedNet model** (tonnes)
Alligator Creek 600 41,500 15 530 8,500
Black River 33,000 135,000 240 41,000 180,400 230 17,000 20,200 Bluewater Creek 2,700 63,500 40 1,600 12,500
Bohle River 22,000 147,000 150 35,100 154,200 230 39,000 59,000 Ross River 26,500 261,000 100 14,500 290,000 50 2,500 1,400
*As specified by the SedNet model. **Kinsey-Henderson et al. (2007). 4.3 Nutrients
4.3.1 Particulate nitrogen and phosphorus Particulate nitrogen (PN) concentrations displayed similar variability across sites in the 2007/08 wet season with the Ross River site generally having the lowest concentrations (Fig. 9). The summary EMC for PN (Table 4) show there is little variability in PN across the different land uses of the Black Ross WQIP Region. The established urban sites had higher PN EMC compared to the developing urban sites; this result indicates the runoff of more fertile soils in the established urban lands. Interestingly, the PN loads for Ross River across the 2006/07 and 2007/08 wet seasons display the opposite trend to the TSS loads where the PN EMC was higher in the 2007/08 wet season (Table 5). In addition, the PN load for the Black River was considerably higher in the 2007/08 wet season compared to the previous 2006/07 year. The measured flow-normalised PN loads were consistently much lower than the loads predicted by the ANNEX model (Post et al., 2006).
Australian Centre for Tropical Freshwater Research 17

Water quality monitoring – Black Ross Basins 2007/08. ACTFR Report 08/04
Particulate phosphorus (PP) concentrations followed similar trends to TSS in the 2007/08 wet season (Fig. 10) with elevated PP in the developing urban land use (Kern Drain). The summary EMC (Table 6) for PP also typically follow the TSS EMC with the highest concentrations in the developing urban land use. However, the EMC of PP for the light industrial and urban industrial sites appears to be more elevated relative to TSS. PP loads for the gauged catchments are shown in Table 7. Loads and EMC of PP were similar for the three large catchments over the successive wet seasons and did not conform to the TSS trend. Similarly to the PN, the measured flow-normalised PP loads were considerably much lower than the ANNEX model prediction.
Figure 9. Boxplot of particulate nitrogen concentrations (µg N/L) of the samples collected from the
Black Ross WQIP Region over the 2007/08 wet season.
Australian Centre for Tropical Freshwater Research 18

Water quality monitoring – Black Ross Basins 2007/08. ACTFR Report 08/04
Figure 10. Boxplot of particulate phosphorus concentrations (µg P/L) of the samples collected from
the Black Ross WQIP Region over the 2007/08 wet season.
Australian Centre for Tropical Freshwater Research 19

Water quality monitoring – Black Ross Basins 2007/08. ACTFR Report 08/04
Table 4. Summary of PN concentrations (µg N/L) for the different land uses in the Black Ross WQIP Region over the 2006/07 and 2007/08 wet seasons.
Dominant Land use Site Year
mean (all
data)
median (all
data)
rise (mean)
peak (mean)
fall (mean)
Mean rise,
peak & fall
Average EMC (µg
N/L)
2006/07 144 61 89 419 34 181 Woolcock St Drain 2007/08 256 303 392 261 234 296
Established Urban
Captain C. 2006/07 204 169 150 97 366 204 220
2006/07 175 135 132 79 240 150 Kern Drain
2007/08 264 196 244 483 234 320 Developing
Urban (coastal plain) Gordon C. 2006/07 154 140 209 79 145 144
190
Light Industrial Hill St C. 2007/08 324 215 259 319 360 313 310
Stuart C. (d/s) 2006/07 309 265 382 304 260 315 Urban/
industrial Louisa C. 2006/07 108 95 75 100 136 104
210
Sachs C. 2006/07 121 69 303 123 81 169 Bluewater C.
(d/s) 2006/07 64 40 68 84 47 66 Rural residential
Alligator C. (d/s) 2006/07 110 113 123 107 93 108
120
Stuart C. (u/s) 2006/07 175 138 124 270 136 177
HenCamp C. 2006/07 93 63 124 50 100 91
Campus C. 2006/07 92 91 149 92 7.8 83 Minimal use
Bluewater C. (u/s) 2006/07 211 152 409 95 156 220
150
Conservation Alligator C. (u/s) 2006/07 128 58 500 50 54 201 200
Table 5. Particulate nitrogen loads of the major catchments in the Black Ross WQIP Region over the
2006/07 and 2007/08 wet seasons. 2006/07 2007/08 Comparison to model
Catchment PN load 2007
(kilograms)
Total flow
volume (ML)
EMC (ug N/L)
PN load 2008
(kilograms)
Total flow
volume (ML)
EMC (µg N/L)
Load adjusted to
mean annual flow*
(kilograms)
ANNEX model**
(kilograms)
Alligator Creek 2,200 41,500 53 2,000 37,200 Black River 3,000 135,000 22 41,000 180,400 230 9,200 124,400 Bluewater Creek 2,600 63,500 40 1,500 77,800 Bohle River 20,000 147,000 130 36,000 154,200 240 39,000 288,300 Ross River 36,000 261,000 140 58,000 290,000 200 4,900 17,300
*As specified by the ANNEX model. **Post et al. (2006).
Australian Centre for Tropical Freshwater Research 20

Water quality monitoring – Black Ross Basins 2007/08. ACTFR Report 08/04
Table 6. Summary of PP concentrations (µg P/L) for the different land uses in the Black Ross WQIP Region over the 2006/07 and 2007/08 wet seasons.
Dominant Land use Site Year
mean (all
data)
median (all
data)
rise (mean)
peak (mean)
fall (mean)
Mean rise,
peak & fall
Average EMC
(µg P/L)
2006/07 53 58 52 71 43 55 Woolcock St Drain 2007/08 79 86 135 91 68 98
Established Urban
Captain C. 2006/07 61 46 93 23 67 61 69
2006/07 123 117 161 141 94 132 Kern Drain
2007/08 158 185 188 257 131 192 Developing
Urban (coastal plain) Gordon C. 2006/07 93 84 124 80 79 94
130
Light Industrial Hill St C. 2007/08 124 99 137 93 140 123 120
Stuart C. (d/s) 2006/07 181 122 196 214 147 186 Urban/
industrial Louisa C. 2006/07 42 36 29 27 54 37
110
Sachs C. 2006/07 22 19 33 21 19 24 Bluewater
C. (d/s) 2006/07 12 11 14 21 5.4 13 Rural residential
Alligator C. (d/s) 2006/07 27 22 39 13 15 22
20
Stuart C. (u/s) 2006/07 70 69 53 100 60 71
HenCamp C. 2006/07 13 13 12 8 15 12
Campus C. 2006/07 31 23 29 60 19 36 Minimal use
Bluewater C. (u/s) 2006/07 68 38 87 67 57 70
47
Conservation Alligator C. (u/s) 2006/07 11 10 12 23 7.6 14 14
Table 7. Particulate phosphorus loads of the major catchments in the Black Ross WQIP Region over
the 2006/07 and 2007/08 wet seasons. 2006/07 2007/08 Comparison to model
Catchment PP load 2007
(kilograms)
Total flow volume (ML)
EMC (ug P/L)
PP load 2008
(kilograms)
Total flow volume (ML)
EMC (ug P/L)
Load adjusted to
mean annual flow*
(kilograms)
ANNEX model**
(kilograms)
Alligator Creek 410 41,500 10 360 10,600 Black River 9,200 135,000 68 13,000 180,400 73 5,200 19,900 Bluewater Creek 800 63,500 13 460 16,900 Bohle River 12,600 147,000 86 13,500 154,200 88 18,000 46,200 Ross River 15,000 261,000 57 17,000 290,000 59 1,700 3,100
*As specified by the ANNEX model. **Post et al. (2006).
Australian Centre for Tropical Freshwater Research 21

Water quality monitoring – Black Ross Basins 2007/08. ACTFR Report 08/04
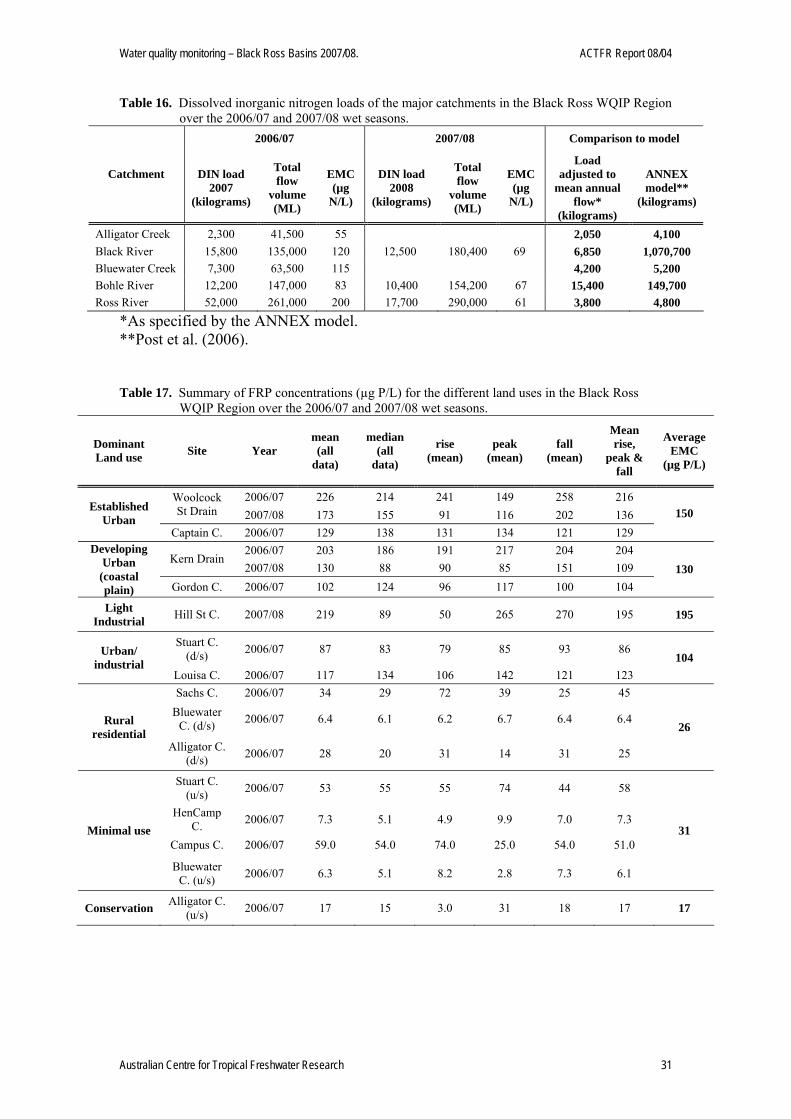
4.3.2 Dissolved organic nitrogen and phosphorus The waterways draining the urban and light industrial lands contained elevated concentrations of both DON and DOP in the 2007/08 wet season (Figs. 11 and 12). The summarised DON EMC across the different land uses in the Black Ross Region also shows elevated concentrations in the urban and light industrial land uses, although all sites displayed a higher EMC than the conservation land use (Table 8). EMC of DON for the three major catchments were similar over successive wet seasons (Table 9). The flow-adjusted loads of DON for the major gauged catchments in the Black Ross WQIP Region show reasonable agreement with the ANNEX model (Table 9). Similarly to DON, the EMC for DOP in the different land uses were all higher than the conservation land use (Table 10). In particular, the urban and light industrial sites had highly elevated DOP EMC with the highest EMC recorded at the light industrial site (130 µg P/L). This EMC was twice that of any other land use in the Black Ross WQIP Region (Table 10). EMC of DOP for the three major catchments were similar over successive wet seasons (Table 11). The flow adjusted loads of DOP were in reasonable agreement with the latest ANNEX model of Post et al. (2006).
Figure 11. Boxplot of dissolved organic nitrogen concentrations (µg N/L) of the samples collected
from the Black Ross WQIP Region over the 2007/08 wet season.
Australian Centre for Tropical Freshwater Research 22

Water quality monitoring – Black Ross Basins 2007/08. ACTFR Report 08/04
Figure 12. Boxplot of dissolved organic phosphorus concentrations (µg P/L) of the samples collected
from the Black Ross WQIP Region over the 2007/08 wet season.
Australian Centre for Tropical Freshwater Research 23

Water quality monitoring – Black Ross Basins 2007/08. ACTFR Report 08/04
Table 8. Summary of DON concentrations (µg N/L) for the different land uses in the Black Ross WQIP Region over the 2006/07 and 2007/08 wet seasons.
Dominant Land use Site Year
mean (all
data)
median (all data)
rise (mean)
peak (mean)
fall (mean)
Mean rise,
peak & fall
Average EMC
(µg N/L)
2006/07 419 426 437 208 537 394 Woolcock St Drain 2007/08 369 334 229 252 422 301
Established Urban
Captain C. 2006/07 380 359 403 369 369 380 365
2006/07 449 399 448 391 475 438 Kern Drain
2007/08 457 417 357 412 498 422 Developing
Urban (coastal plain) Gordon C. 2006/07 382 402 404 294 395 364
400
Light Industrial Hill St C. 2007/08 415 318 301 386 495 394 395
Stuart C. (d/s) 2006/07 281 226 309 308 242 286 Urban/ industrial
Louisa C. 2006/07 362 343 362 273 381 339 315
Sachs C. 2006/07 257 248 286 320 237 281 Bluewater C.
(d/s) 2006/07 183 170 225 199 141 188 Rural residential
Alligator C. (d/s) 2006/07 203 224 192 269 187 216
230
Stuart C. (u/s) 2006/07 270 284 255 298 259 271
HenCamp C. 2006/07 240 211 198 145 269 204
Campus C. 2006/07 245 200 271 199 229 233 Minimal use
Bluewater C. (u/s) 2006/07 210 206 147 169 278 198
225
Conservation Alligator C. (u/s) 2006/07 171 174 164 184 169 172 170
Table 9. Dissolved organic nitrogen loads of the major catchments in the Black Ross WQIP Region
over the 2006/07 and 2007/08 wet seasons. 2006/07 2007/08 Comparison to model
Catchment DON load 2007
(kilograms)
Total flow volume (ML)
EMC (µg N/L)
DON load 2008
(kilograms)
Total flow volume (ML)
EMC (µg N/L)
Load adjusted to
mean annual flow*
(kilograms)
ANNEX model**
(kilograms)
Alligator Creek 4,900 41,500 120 4,300 5,400 Black River 40,900 135,000 300 38,000 180,400 210 19,000 14,500 Bluewater Creek 7,700 63,500 120 4,500 6,700 Bohle River 39,000 147,000 270 37,000 154,200 240 51,400 37,700 Ross River 85,000 261,000 330 74,000 290,000 260 8,500 6,700
*As specified by the ANNEX model. **Post et al. (2006).
Australian Centre for Tropical Freshwater Research 24

Water quality monitoring – Black Ross Basins 2007/08. ACTFR Report 08/04
Table 10. Summary of DOP concentrations (µg P/L) for the different land uses in the Black Ross WQIP Region over the 2006/07 and 2007/08 wet seasons.
Dominant Land use Site Year
mean (all
data)
median (all
data)
rise (mean)
peak (mean)
fall (mean)
Mean rise,
peak & fall
Average EMC
(µg P/L)
2006/07 35 25 15 48 52 38 Woolcock St Drain 2007/08 105 88 86 158 93 112
Established Urban
Captain C. 2006/07 46 18 55 73 8.2 45 60
2006/07 27 18 42 28 19 30 Kern Drain
2007/08 50 55 85 44 39 56 Developing
Urban (coastal plain) Gordon C. 2006/07 18 9 10 10 26 15
19
Light Industrial Hill St C. 2007/08 122 36 173 97 116 129 130
Stuart C. (d/s) 2006/07 14 14 13 16 12 14 Urban/
industrial Louisa C. 2006/07 20 17 28 3.0 18 16 15
Sachs C. 2006/07 9.4 3.9 28 8.6 5.6 14 Bluewater C.
(d/s) 2006/07 4.9 4.4 8.4 2.9 3.7 5.0 Rural residential
Alligator C. (d/s) 2006/07 11 8.6 11 7 14 11
10
Stuart C. (u/s) 2006/07 19 11 9 16 22 16
HenCamp C. 2006/07 5.2 5.5 3.3 4.7 5.5 4.5
Campus C. 2006/07 12 12 14 9.3 11 11 Minimal use
Bluewater C. (u/s) 2006/07 5.3 4.9 6.0 8.0 3.1 5.7
9.3
Conservation Alligator C. (u/s) 2006/07 3.2 3.5 6.4 0.0 3.2 3.2 3.2
Table 11. Dissolved organic phosphorus loads of the major catchments in the Black Ross WQIP
Region over the 2006/07 and 2007/08 wet seasons. 2006/07 2007/08 Comparison to model
Catchment DOP load 2007
(kilograms)
Total flow volume (ML)
EMC (µg P/L)
DOP load 2008
(kilograms)
Total flow
volume (ML)
EMC (µg P/L)
Load adjusted to mean annual
flow* (kilograms)
ANNEX model**
(kilograms)
Alligator Creek 360 41,500 9 320 300 Black River 1,800 135,000 13 2,600 180,400 14 1,000 700 Bluewater Creek 140 63,500 2 81 300 Bohle River 2,100 147,000 14 4,500 154,200 29 4,400 1,800 Ross River 1,600 261,000 6 2,200 290,000 8 200 300
*As specified by the ANNEX model. **Post et al. (2006).
Australian Centre for Tropical Freshwater Research 25

Water quality monitoring – Black Ross Basins 2007/08. ACTFR Report 08/04
4.3.3 Dissolved inorganic nitrogen and phosphorus On average, ammonia concentrations were relatively higher at Woolcock St Drain, although values exceeding 20 µg N/L were also measured at all sites monitored in the 2007/08 wet season (Fig. 13). The EMC for ammonia show that all land uses contain elevated concentrations compared to the conservation land use, with higher concentrations in the established and developing urban sites (Table 12). Ammonia loads were generally low across the major gauged catchments with the exception of the Ross River load in the 2006/07 wet season (27,200 kg) (Table 13). No loads have been predicted for ammonia in the ANNEX model and so no comparisons can be drawn with the flow-adjusted loads. Oxidised nitrogen (NOx: nitrite and nitrate) concentrations were relatively consistent across the sites monitored in the 2007/08, with the lowest concentrations in the Ross River (Fig. 14). Similarly to ammonia, the NOx EMC was higher in all land uses compared to the conservation land use, with particularly elevated EMC for the established urban, developing urban and rural residential sites (Table 14). Lower NOx loads were calculated in the 2007/08 wet season for the Bohle and Ross Rivers compared to the previous 2006/07 water year (Table 15). NOx loads could not be compared with the ANNEX model, although the model performance can be compared to the loads of dissolved inorganic nitrogen (DIN= NOx + ammonia). The flow-adjusted DIN loads for all of the major gauged catchments were all lower than the loads predicted by the ANNEX model (Table 16). In particular, the ANNEX loads for the Bohle and Black Rivers were much higher than the monitoring data. This result suggests there is an error in the ANNEX model where the land uses in these catchment areas may have been incorrectly assigned. However, the loads of nitrogen discharged from the sewage treatment plants, which discharge below the catchment monitoring sites for both the Bohle and Black Rivers, may account for some of these discrepancies (see section 4.4). Filterable reactive phosphorus concentrations were elevated at the Woolcock St Drain, Kern Drain, Hills St Drain and the Bohle River sites compared to the Black and Ross Rivers in the 2007/08 wet season (Fig. 15). Waterways draining the urban and industrial lands had considerably elevated FRP EMC, with the highest EMC found at the light industrial site (Table 17). Loads for FRP over the 2006/07 and 2007/08 wet seasons for the major gauged catchments are presented in Table 17. The loads show little variation in the FRP EMC over the two monitored wet seasons at the Bohle and Ross Rivers. Flow-adjusted loads for FRP were lower than those predicted by the ANNEX model (Table 18), although the influence of the sewage treatment plants have not been considered in the flow adjusted loads (see section 4.4).
Australian Centre for Tropical Freshwater Research 26

Water quality monitoring – Black Ross Basins 2007/08. ACTFR Report 08/04
Figure 13. Boxplot of ammonia-N concentrations (µg N/L) of the samples collected from the Black
Ross WQIP Region over the 2007/08 wet season.
Figure 14. Boxplot of oxidised nitrogen-N concentrations (µg N/L) of the samples collected from the
Black Ross WQIP Region over the 2007/08 wet season.
Australian Centre for Tropical Freshwater Research 27

Water quality monitoring – Black Ross Basins 2007/08. ACTFR Report 08/04
Figure 15. Boxplot of filterable reactive phosphorus concentrations (µg P/L) of the samples collected
from the Black Ross WQIP Region over the 2007/08 wet season.
Australian Centre for Tropical Freshwater Research 28

Water quality monitoring – Black Ross Basins 2007/08. ACTFR Report 08/04
Table 12. Summary of Ammonia-N concentrations (µg N/L) for the different land uses in the Black Ross WQIP Region over the 2006/07 and 2007/08 wet seasons.
Dominant Land use Site Year
mean (all
data)
median (all
data)
rise (mean)
peak (mean)
fall (mean)
Mean rise,
peak & fall
Average EMC
(µg N/L)
2006/07 39 24 21 15 81 39 Woolcock St Drain 2007/08 33 32 39 26 34 33
Established Urban
Captain C. 2006/07 22 16 17 7.0 43 22 29
2006/07 40 36 37 54 35 42 Kern Drain 2007/08 25 16 34 11 24 23
Developing Urban
(coastal plain) Gordon C. 2006/07 49 42 32 35 62 43
38
Light Industrial Hill St C. 2007/08 17 18 25 9.0 18 17 17
Stuart C. (d/s) 2006/07 3.4 <0.2 2.0 8.4 0.7 3.7 Urban/
industrial Louisa C. 2006/07 12 5.5 9.3 7.0 14 10
6.9
Sachs C. 2006/07 2.4 2.0 8.0 2.5 1.1 3.9 Bluewater
C. (d/s) 2006/07 4.4 1.7 9.0 4.8 0.8 4.9 Rural residential
Alligator C. (d/s) 2006/07 27 7.0 47 7.0 6.0 20
9.6
Stuart C. (u/s) 2006/07 22 5.0 44 25 17 29
HenCamp C. 2006/07 9.7 3.0 42 1.5 7.8 17
Campus C. 2006/07 3.3 2.0 5.3 2.0 1.0 2.8 Minimal use
Bluewater C. (u/s) 2006/07 3.9 2.0 9.0 1.0 2.3 4.1
13
Conservation Alligator C. (u/s) 2006/07 4.0 1.0 2.0 6.0 4.0 4.0 4.0
Table 13. Ammonia-N loads of the major catchments in the Black Ross WQIP Region over the
2006/07 and 2007/08 wet seasons. 2006/07 2007/08 Comparison to model
Catchment Ammonia load 2007
(kilograms)
Total flow
volume (ML)
EMC (µg N/L)
Ammonia load 2008
(kilograms)
Total flow
volume (ML)
EMC (µg N/L)
Load adjusted to mean
annual flow* (kilograms)
ANNEX model**
(kilograms)
Alligator Creek 140 41,500 3 120 N/A Black River 1,800 135,000 13 1,500 180,400 8 800 N/A Bluewater Creek 330 63,500 5 190 N/A Bohle River 1,200 147,000 8 2,800 154,200 18 2,700 N/A Ross River 27,000 261,000 100 8,000 290,000 28 1,900 N/A
*As specified by the ANNEX model. **Post et al. (2006).
Australian Centre for Tropical Freshwater Research 29

Water quality monitoring – Black Ross Basins 2007/08. ACTFR Report 08/04
Table 14. Summary of NOx-N concentrations (µg N/L) for the different land uses in the Black Ross WQIP Region over the 2006/07 and 2007/08 wet seasons.
Dominant Land use Site Year
mean (all
data)
median (all
data)
rise (mean)
peak (mean)
fall (mean)
Mean rise,
peak & fall
Average EMC
(µg N/L)
2006/07 114 114 106 82 146 111 Woolcock St Drain 2007/08 135 115 110 145 135 130
Established Urban
Captain C. 2006/07 134 72 62 97 242 134 130
2006/07 103 87 78 101 119 99 Kern Drain
2007/08 84 81 109 81 76 89 Developing
Urban (coastal plain) Gordon C. 2006/07 161 140 113 147 192 151
120
Light Industrial Hill St C. 2007/08 102 89 99 107 100 102 100
Stuart C. (d/s) 2006/07 81 95 79 78 84 80 Urban/ industrial
Louisa C. 2006/07 90 92 96 146 80 107 94
Sachs C. 2006/07 188 181 204 41 218 154 Bluewater C.
(d/s) 2006/07 152 142 196 148 122 155 Rural residential
Alligator C. (d/s) 2006/07 92 55 30 297 82 136
150
Stuart C. (u/s) 2006/07 165 131 75 136 191 134
HenCamp C. 2006/07 57 52 38 22 67 42
Campus C. 2006/07 107 54 127 12 125 88 Minimal use
Bluewater C. (u/s) 2006/07 104 87 107 164 61 111
94
Conservation Alligator C. (u/s) 2006/07 28 28 33 30 26 30 30
Table 15. Oxidised nitrogen-N loads of the major catchments in the Black Ross WQIP Region over
the 2006/07 and 2007/08 wet seasons. 2006/07 2007/08 Comparison to model
Catchment NOx-N load 2007
(kilograms)
Total flow
volume (ML)
EMC (µg N/L)
NOx load 2008
(kilograms)
Total flow
volume (ML)
EMC (µg
N/L)
Load adjusted to
mean annual flow*
(kilograms)
ANNEX model**
(kilograms)
Alligator Creek 2,200 41,500 52 1,900 N/A Black River 14,000 135,000 100 11,000 180,400 59 6,000 N/A Bluewater Creek 7,000 63,500 110 4,050 N/A Bohle River 11,000 147,000 73 7,600 154,200 49 12,500 N/A Ross River 25,000 261,000 97 9,700 290,000 33 1,900 N/A
*As specified by the ANNEX model. **Post et al. (2006).
Australian Centre for Tropical Freshwater Research 30
Water quality monitoring – Black Ross Basins 2007/08. ACTFR Report 08/04
Table 16. Dissolved inorganic nitrogen loads of the major catchments in the Black Ross WQIP Region over the 2006/07 and 2007/08 wet seasons.
2006/07 2007/08 Comparison to model
Total flow
volume (ML)
EMC (µg
N/L)
DIN load 2008
(kilograms)
Total flow
volume (ML)
EMC (µg
N/L)
Load adjusted to
mean annual flow*
(kilograms)
ANNEX model**
(kilograms)
Catchment DIN load 2007
(kilograms)
Alligator Creek 2,300 41,500 55 2,050 4,100 Black River 15,800 135,000 120 12,500 180,400 69 6,850 1,070,700 Bluewater Creek 7,300 63,500 115 4,200 5,200 Bohle River 12,200 147,000 83 10,400 154,200 67 15,400 149,700 Ross River 52,000 261,000 200 17,700 290,000 61 3,800 4,800
*As specified by the ANNEX model. **Post et al. (2006). Table 17. Summary of FRP concentrations (µg P/L) for the different land uses in the Black Ross
WQIP Region over the 2006/07 and 2007/08 wet seasons. Mean rise,
peak & fall
Dominant Land use Site Year
mean (all
data)
median (all
data)
rise (mean)
peak (mean)
fall (mean)
Average EMC
(µg P/L)
2006/07 226 214 241 149 258 216 Woolcock St Drain Established
Urban 2007/08 173 155 91 116 202 136 150 Captain C. 2006/07 129 138 131 134 121 129
2006/07 203 186 191 217 204 204 Kern Drain
2007/08 130 88 90 85 151 109 Developing
Urban (coastal plain) Gordon C. 2006/07 102 124 96 117 100 104
130
Light Industrial Hill St C. 2007/08 219 89 50 265 270 195 195
Stuart C. (d/s) 2006/07 87 83 79 85 93 86 Urban/
industrial Louisa C. 2006/07 117 134 106 142 121 123
104
Sachs C. 2006/07 34 29 72 39 25 45 Bluewater
C. (d/s) 2006/07 6.4 6.1 6.2 6.7 6.4 6.4 Rural residential
Alligator C. (d/s) 2006/07 28 20 31 14 31 25
26
Stuart C. (u/s) 2006/07 53 55 55 74 44 58
HenCamp C. 2006/07 7.3 5.1 4.9 9.9 7.0 7.3
Campus C. 2006/07 59.0 54.0 74.0 25.0 54.0 51.0 Minimal use
Bluewater C. (u/s) 2006/07 6.3 5.1 8.2 2.8 7.3 6.1
31
Conservation Alligator C. (u/s) 2006/07 17 15 3.0 31 18 17 17
Australian Centre for Tropical Freshwater Research 31

Water quality monitoring – Black Ross Basins 2007/08. ACTFR Report 08/04
Table 18. Filterable reactive phosphorus loads of the major catchments in the Black Ross WQIP Region over the 2006/07 and 2007/08 wet seasons.
2006/07 2007/08 Comparison to model
Catchment
FRP load 2007
(kilograms)
Total flow
volume (ML)
EMC (µg P/L)
FRP load 2008
(kilograms)
Total flow
volume (ML)
EMC (µg P/L)
Load adjusted to
mean annual flow*
(kilograms)
ANNEX model**
(kilograms)
Alligator Creek 770 41,500 19 680 1,300 Black River 4,200 135,000 31 2,300 180,400 13 1,600 2,900 Bluewater Creek 300 63,500 5 170 900 Bohle River 8,300 147,000 56 6,300 154,200 41 9,900 34,900 Ross River 4,200 261,000 16 3,100 290,000 11 390 3,300
*As specified by the ANNEX model. **Post et al. (2006). 4.4 Sewage treatment plant contributions Water quality data (total nitrogen and total phosphorus) from the outflows of the three sewage treatment plants (STP) which discharge into the Bohle River (Condon, Deeragun and Mt St John STP) were obtained from the Townsville City Council. We note that the Deeragun STP discharges into a tributary of the Bohle River, Saunders Creek, while the Mt St John STP discharges into a drain before entering the lower reaches of the Bohle River. The discharge from these two STP enters the Bohle River below the water quality monitoring site; the Condon STP discharges upstream of the monitoring site. Annual loads of total nitrogen (TN) and total phosphorus (TP) for these three STP have been estimated by GHD (2007). Loads for the Condon and Deeragun STP were recalculated using the data obtained from the Townsville City Council and by assuming constant outflows of 1 ML/day and 0.6 ML/day, respectively as specified in the GHD (2007) report. Our calculations suggest that the previous load estimates may be too high (Table 19). However, the accuracy of the load estimates for both studies may be compromised due to the high variability and the sparseness of the water quality data for these relatively small STP (samples typically collected fortnightly). Loads for the Mt St John STP were calculated using both flow and concentration (ammonia-N, nitrate-N, TN, phosphate-P and TP) data obtained by the Townsville City Council. We consider these loads to be more accurate than for the Condon and Deeragun STP due to the higher resolution dataset and the greater consistency in the concentration data over time. Our loads for the Mt St John STP were higher than the GHD (2007) estimate (Table 20) which is probably due to the underestimation of the flow discharge by GHD (2007). GHD (2007) estimated a flow discharge of 5.5 ML per day; however, flow data obtained from the Townsville City Council which was used in this study had an average of 10.5 ML/day (estimated outflow to the Bohle River). The Mt St John STP data show that high proportions of the TN and TP load consist of the dissolved inorganic fractions including DIN (~85% of TN) and phosphate (~75% of TP) (Table 20). The TN and TP loads for the Bohle River (at the monitoring site) in the 2006/07 wet season were 70,600 and 23,000 kilograms, respectively, compared to the loads of 1,700 and 2,300 kilograms of TN and TP, respectively, calculated for the Condon STP. Therefore we estimate that the Condon STP contributed about 2% of the annual
Australian Centre for Tropical Freshwater Research 32

Water quality monitoring – Black Ross Basins 2007/08. ACTFR Report 08/04
2006/07 Bohle River TN load and approximately 10% of the total TP load at the monitoring site. The TN and TP loads calculated for the Bohle River monitoring site in 2007/08 were 83,400 and 24,300 kilograms, respectively. Therefore, the Condon STP would have contributed a similar proportion to the TN and TP load in 2007/08. The Deeragun and Mt St John STPs combined have the potential to contribute another 130,000 and 21,000 kilograms of TN and TP respectively to the annual load of the Bohle River. Therefore these two STPs may collectively contribute up to ~60% of TN and ~45% of TP to the total end of catchment load of the Bohle River. Because a higher proportion of the TN and TP discharged from the STP are made up of the more bioavailable forms including DIN and phosphate, respectively (see Table 20), we estimate that the Deeragun and Mt St John STP may contribute up to 90% of the total DIN load and 60% of the total phosphate load from the Bohle River. In addition, the discrepancies in the dissolved nitrogen and phosphorus loads between the calculated loads and the ANNEX model for the Bohle River may be explained by the STP. When the STPs are factored into the calculated DIN (120,000 kg) and FRP (25,700 kg) loads for the Bohle River, they closely match those predicted by the ANNEX model (149,700 kg and 34,900 kg, respectively). The Mt Low STP discharges into the lower reaches of the Black River below the monitoring site and also contributes a considerable proportion of TN and TP to the end-of-catchment discharge. Similarly to the Bohle River, a close comparison between the FRP load from the Black River predicted by the ANNEX model (2,900 kg) and the calculated flow-adjusted load (2,600 kg) is achieved when the contribution of the STP is considered. However, the model prediction of the annual DIN load for the Black River is considerably overestimated even with the STP contribution. The Cleveland Bay STP discharges into the lower reaches of Sandfly Creek and would contribute considerable amounts of bioavailable nitrogen and phosphorus to the catchment load (Table 20). This STP is probably factored into the ANNEX model for the Ross River discharge and so may explain the discrepancies for DIN and FRP between the flow adjusted load (sampling site is upstream of the STP) and the model. A marked reduction in the loads of nitrogen and phosphorus discharged from the Cleveland Bay STP occurs in 2007/08. During the time, the plant was upgraded incorporating a biological component to remove DIN and phosphate from the effluent. This result shows that the upgrade of STP can considerably reduce end-of-catchment loads particularly for DIN and phosphate. However, we note that the constant discharge of STPs throughout the year during low flow conditions is a different water quality issue than water quality associated with event flow conditions (see discussion).
Australian Centre for Tropical Freshwater Research 33

Water quality monitoring – Black Ross Basins 2007/08. ACTFR Report 08/04
Table 19. Estimated loads (kilograms) for the Condon, Deeragun and Mt Low STP and the comparison with the GHD (2007) estimate.
Condon STP Deeragun STP Mt Low STP Water year
TN TP TN TP TN TP
1998/99 2,110 1,920 1,300 1,490 1,160 1,000
1999/00 1,980 1,740 1,560 1,350 2,290 1,460
2000/01 1,320 2,090 1,400 1,460 2,770 1,270
2001/02 2,150 2,640 1,550 1,710 1,800 1,640
2002/03 2,480 2,620 1,890 1,920 1,850 1,410
2003/04 1,190 2,470 2,250 2,050 1,620 1,590
2004/05 1,760 2,590 2,590 1,700 1,430 1,600
2005/06 950 2,310 3,250 1,680 2,400 1,090
2006/07 1,550 2,710 1,370 1,560 1,520 1,020
Average 1,721 2,343 1,907 1,658 1,871 1,342 GHD (2007) estimate 4,380 2,920 2,847 1,971 N/A N/A
Table 20. Estimated loads (kilograms) for the Cleveland Bay and Mt St John STP and the comparison with the GHD (2007) estimate.
Water year Ammonia-N (kg)
Nitrate-N (kg) TN (kg) Phosphate-P
(kg) TP (kg)
Cleveland Bay STP 2004/05 69,600 33,500 125,000 2,900 41,000 2005/06 73,500 26,900 126,000 2,600 39,200 2007/08 620 16,700 27,300 460 5,900 Average (2004-2006)
71,550 30,200 125,500 2,750 40,100
Mt St John STP
2004/05 36,000 58,800 107,000 16,000 22,800 2005/06 55,000 68,000 136,000 18,000 21,900 2006/07 66,000 55,300 136,000 13,000 18,200 2007/08 51,000 69,800 139,000 10,000 14,200 Average 52,000 62,975 129,500 14,250 19,275
GHD (2007) estimate
68,255
12,045
4.5 Pesticide residues in Alligator Creek Five samples were collected at the Alligator Creek downstream site (Bruce Hwy) for pesticide analysis in the 2007/08 wet season to determine if the endosulfan residues detected in the previous 2006/07 wet season were persistent across the two monitored years. Endosulfan residues (or any other pesticide residues analysed by the GCMS method) were not detected in any of the samples collected in 2007/08.
Australian Centre for Tropical Freshwater Research 34

Water quality monitoring – Black Ross Basins 2007/08. ACTFR Report 08/04
Australian Centre for Tropical Freshwater Research 35

Water quality monitoring – Black Ross Basins 2007/08. ACTFR Report 08/04
5. DISCUSSION
The monitoring results from the 2007/08 wet season show similar trends to the previous 2006/07 water year and support the strong water quality signals observed in Liessmann et al. (2007). The developing urban monitoring sites had the highest suspended sediment concentrations, with particularly high sediment concentrations recorded at the developing urban site on a hillslope. Improved management strategies (e.g. timing of development in dry season, develop/clear land in smaller areas at a time, placement of silt curtains) in developing urban lands will help reduce sediment runoff from these sites. These strategies should also reduce the runoff of the associated particulate nutrient phases, although while the established urban sites had considerably lower suspended sediment EMC than the developing urban sites, the established sites had higher particulate nitrogen EMC. This result indicates that the soils of the established urban lands are more fertile. The average and range of suspended sediment concentrations across the three major catchments of the Black Ross WQIP Region (Black, Bohle and Ross Rivers) were comparable to other coastal catchments adjacent to the region (e.g. Haughton River; see Bainbridge et al., 2007b). The EMC at the major catchment sites for particulate nitrogen were variable across wet seasons and did not conform to the trends observed in the TSS. In comparison, the EMC for particulate phosphorus displayed uniformity over the two successive wet seasons at the large catchment sites but did not conform to the TSS trends for the Ross and Bohle Rivers. These findings are perplexing and may be related to the erosion of different catchment areas which have different proportions of nitrogen and phosphorus. The comparisons between the flow-adjusted loads and the ANNEX model for PN and PP were poor; this model does not account for the nutrient-poor soils in these dry tropical coastal catchments (see Bainbridge et al., 2007a). Another possibility is that the proportions of erosion mechanisms (hillslope, gully and streambank) assigned to these catchments are incorrect. Waterways draining the urban land uses (both developing and established) contained slightly elevated dissolved organic nitrogen (DON) concentrations and are probably linked to runoff from urban gardens. DON is generally not highly bio-available and hence of lesser ecological importance than DIN which is 100% bio-available (Brodie and Mitchell, 2005). Dissolved organic phosphorus (DOP) concentrations were elevated in the urban sites and may be sourced to cleaning products, animal excreta and phosphorus-based fertilisers. The light industrial site produced the highest DOP EMC and is probably sourced to cleaning products such as detergents. The potential environmental impacts of elevated DOP runoff are unknown at this stage. Ammonia concentrations were elevated in the waterways draining urban lands and may be linked to sewage effluent, animal excreta and fertiliser runoff. Water courses draining rural residential, urban and light industry land uses had elevated concentrations of oxidised nitrogen compared to the conservation sites; this result may reflect some use of fertilisers as well more fertile soils in these areas (e.g. from top dressings). Watercourses draining urban and light industrial lands had highly elevated filterable reactive phosphorus (FRP) concentrations. These high concentrations are probably sourced to phosphorus-based fertilisers (e.g. blood and bone), cleaning products (e.g.
Australian Centre for Tropical Freshwater Research 36

Water quality monitoring – Black Ross Basins 2007/08. ACTFR Report 08/04
detergents), wastewater, industrial effluent and animal excreta (e.g. dogs). We consider the runoff of FRP to be of high concern in the Black Ross WQIP region. The particularly high concentrations of FRP at the light industrial site indicates that industrial effluent and detergent-based products probably provide the main source of inorganic phosphorus in this land use. In addition, a brown sludge was observed at this site consistently through the 2007/08 wet season and it is recommended that sampling should continue in the upcoming wet season to identify the source of this material (which may also be linked to the high FRP concentrations). Similarly to the previous 2006/07 wet season, the comparisons of the loads from the major catchment sites to the current SedNet and ANNEX model runs were generally poor. This result highlights the need for a more detailed modelling approach (i.e. tailored to the urbanised landscape) in the Black Ross WQIP Region before models can be used as a tool for management decision making, such as the setting of end of catchment pollutant targets. Most of the nutrient load associated with rainfall runoff would be expected to pass through the river estuary quite quickly. Some of the coarser sediment may be deposited within the tidal wetland systems but virtually all of the fine and highly bio-available dissolved contaminants will probably be discharged from the river mouth in a matter of hours during large storm events. The hydrographs for this year suggest that high concentrations of stormwater contaminants would have been resident in the estuary for no more than about 20 days during this wet season. Moreover, due to the combined effects of elevated turbidity (which limits photosynthesis to the very surface of the water column), elevated flows (which wash away plankton biomass) and low salinity (which imposes osmoregulatory stresses on estuarine organisms) it is highly unlikely that there would be much biological uptake of nutrients within the estuary during this time. Some of the fine sediment would be expected to flocculate and settle outside the river mouth once the river plume has dispersed sufficiently to reach salinities greater than about 10 psu or so. This sediment will be remobilised by tidal currents and some could eventually be carried back into the river where it would be incorporated into estuary muds, potentially contributing to the systems productivity. The sediments would also gradually be carried up the coast and deposited in other estuaries to the north. The results from the sewage treatment plant water quality data show that they collectively contribute a high proportion of total nitrogen and phosphorus to the annual load from the major rivers in the Black Ross WQIP Region (Black, Bohle and Ross Rivers). The available data suggest that planned upgrades to these plants have the potential to significantly reduce N and P loads and may help to improve ambient water quality conditions in the estuaries of these rivers. Indeed, the Bohle River estuary and lower catchment area contains consistently high NOx, ammonia and filterable reactive phosphorus concentrations throughout the dry season making it one of the more polluted rivers in Queensland (Cox et al., 2005). These high nutrient concentrations have been linked to sewage effluent, although nutrient levels have declined over a 10 year period due to improvements in sewage treatment (Cox et al., 2005).
Australian Centre for Tropical Freshwater Research 37

Water quality monitoring – Black Ross Basins 2007/08. ACTFR Report 08/04
The nutrients contained in sewage effluent probably enter the system constantly over the whole year. Moreover, floodtides would be expected to carry a lot of the effluent back upstream into the upper estuary and associated inter-tidal wetland systems, where tidal flushing can be quite inefficient and water residence times can be quite high. This maximises opportunities for uptake by biota and virtually ensures that the ecosystem detains a significant proportion of the nutrients for a long time. It is likely that little of these nutrients are transported very far into the marine environment during the dry season. The residence and cycling times of the nutrient-rich effluent discharge requires further research to evaluate the ecological risk to instream, estuarine and marine ecosystems. A lot of the nutrients that do reach the marine environments outside of the river mouth will have already been incorporated into the food web and will arrive there in the form of living organisms. Theoretically the planktonic portion of this living nutrient pool is captured in water samples and is therefore concomitantly taken into account in ambient water quality data (although since plankton are not always homogenously distributed through the water column, major sampling errors can occur). However, the nektonic and benthic portions of this nutrient export (i.e. fish and crustacea, etc) are seldom factored into load calculations, even though they are potentially a significant pathway by which the nutrients contained in STP effluents actually reach the GBR lagoon. The potential ecological implications of this kind of nutrient export have not been studied and are extremely difficult to gauge. Given how significant the STP loads are, a detailed investigation of potential impacts on the estuary, and especially the initial receiving environments is warranted. Endosulfan residues (or any other pesticide residues) were not detected in the 2007/08 wet season at the Alligator Creek site. This result may reflect a number of different possibilities and it should be noted that this was only a preliminary study, and the widespread presence of agricultural and urban activities across the Townsville Region (e.g. mango plantations, cane and pineapple) suggests pesticides may be present in the landscape. Currently there is little known about the products and quantities of pesticides applied, and therefore the potential for off-site transport of these pesticides into local waterways during either low flow or flood event conditions is also poorly constrained.
Australian Centre for Tropical Freshwater Research 38

Water quality monitoring – Black Ross Basins 2007/08. ACTFR Report 08/04
6. CONCLUSIONS AND RECOMMENDATIONS
The results from the 2007/08 water quality monitoring program further support the conclusions drawn from the 2006/07 results and strengthen the water quality dataset available for urban and industrial land uses in dry tropical environments. Moreover, this dataset that contains event mean concentrations (EMC) for the major land uses of the region and provides the basis for detailed modelling activities to be undertaken for target setting and other catchment management exercises. The data gathered from these two wet seasons provide a valuable resource to help develop catchment models and provide a baseline to compare with future monitoring efforts. The latest data from 2007/08 show two of the key water quality concerns identified in the previous 2006/07, namely suspended sediment in the developing urban sites and FRP in the urban and industrial land uses, are consistent over the two monitored wet seasons. The addition of the light industrial site in the 2007/08 monitoring program showed very high levels of FRP and DOP from this land use and helped to highlight the possible main sources of dissolved phosphorus in the Black Ross WQIP Region. Loads from the sewerage treatment plants show that they may contribute a high proportion of bioavailable nitrogen and phosphorus exported from the Black Ross Region. However, plant upgrades have the potential to considerably reduce the loads of N and P. Endosulfan residues were not detected in Alligator Creek in the 2007/08 wet season. We recommend that monitoring continue into the 2008/09 wet season with a particular focus on the main catchment sites where sediment and nutrient loads can be calculated. These sites include: Black River, Bohle River, Ross River, Alligator Creek and Bluewater Creek. The variability in the loads especially in the Bohle and Ross Rivers over the two successive wet seasons shows that additional data are required to better constrain the EMC for the major waterways of the Black Ross WQIP Region. In addition, we also recommend that the light industrial site be monitored in the 2008/09 wet season for sediments and nutrients. This site contained highly elevated concentrations of phosphorus species and a brown sludge was observed at this site throughout the monitoring program. We recommend that the Hills Street Drain site be monitored into the 2008/09 wet season to determine the constituents of this brown sludge. The monitoring of this site into 2008/09 will also provide two wet seasons of data for the light industrial land use. Finally we recommend a scoping study to review the operations of the local STPs (and previous works), determine the residence times of sewage effluent (cycling of nutrients) in the Bohle River estuary and to assess the ecological risk of STP discharge.
Australian Centre for Tropical Freshwater Research 39

Water quality monitoring – Black Ross Basins 2007/08. ACTFR Report 08/04
7. REFERENCES
APHA, AWWA and WEF 2005. Standard methods for the examination of water and wastewater. 20th edition, eds LS Clesceri, AE Greenberg & AD Eaton, American Public Health Association, American Water Work Association, Water Environment Federation, Washington DC. Bainbridge, Z.T. Lewis, S.E. Brodie, J. E. 2007a. Sediment and nutrient exports for the Burdekin River catchment, north Queensland: A comparison of monitoring and modelling data. In Oxley, L. and Kulasiri, D. (eds) MODSIM 2007 International Congress on Modelling and Simulation. Modelling and Simulation Society of Australia and New Zealand, December 2007, pp. 874-880. ISBN: 978-0-9758400-4-7. http:/www.mssanz.au/modsim07/Papers/DegreeofSite_s37_Bainbridge_.pdf Bainbridge, Z. Lewis, S. Brodie, J. 2007b. Event-based community water quality monitoring in the Burdekin Dry Tropics Region: 2006-2007 (2 volumes). ACTFR Report No. 07/22 for the Burdekin Dry Tropics NRM. Australian Centre for Tropical Freshwater Research, James Cook University, Townsville. Brodie, J.E. Mitchell, A.W. 2005. Nutrients in Australian tropical rivers: changes with agricultural development and implications for receiving environments. Marine and Freshwater Research, 56: 279-302. Cox, M.E. Moss, A. Smyth, G.K. 2005. Water quality condition and trend in north Queensland waterways. Marine Pollution Bulletin, 51: 89-98. Fox, D.R. Etchells, T. Tan, K.S. (2005), Protocols for the optimal measurement of nutrient loads, A report to West Gippsland Catchment Management Authority, Australian Centre for Environmetrics, July 2005. GHD. 2007. Thuringowa water: report for Condon WPP upgrade, preliminary sustainability assessment, June 2007. Hosomi, M. Sudo, R. 1987. Simultaneous determination of total nitrogen and total phosphorus in freshwater samples using persulfate digestion. International Journal of Environmental Studies, 27: 267-275. Kinsey-Henderson, A. Sherman, B. Bartley, R. 2007. Improved SedNet modelling of grazing lands in the Burdekin catchment. CSIRO Land and Water Science Report 63/07 for the Burdekin Dry Tropics NRM, September 2007. Letcher, R.A. Jakeman, A.J. Merritt, W.S. McKee, L.J. Eyre, B.D. Baginska, B. (1999), Review of techniques to estimate catchment exports, Environmental Protection Authority Technical Report, EPA, Sydney. ISBN: 0731327098. Liessmann, L. Lewis, S. Bainbridge, Z. Brodie, J. Faithful, J. Maughan. M. 2007. Event-based water quality monitoring of the Ross and Black River Basins during the 2006/07 wet season. ACTFR Report No. 07/09 for the Creek to Coral Black Ross WQIP.
Australian Centre for Tropical Freshwater Research 40

Water quality monitoring – Black Ross Basins 2007/08. ACTFR Report 08/04
Post, D., Bartley, R., Corfield, J., Nelson, B., Kinsey-Henderson, A., Hawdon, A., Gordon, I., Abbott, B., Berthelsen, S., Hodgen, M., Keen, R., Kemei, J., Vleeshouwer, J., MacLeod, N. and Webb, M. 2006. Sustainable grazing for a healthy Burdekin catchment. CSIRO Land and Water Science Report 62/06. 220pp.
Australian Centre for Tropical Freshwater Research 41

Water quality monitoring – Black Ross Basins 2007/08. ACTFR Report 08/04
APPENDIX A
Box Plot Diagram
Appendix A: Box plot diagram showing major features of the plot
*
*
Box Plots: Summary plot based on the median, quartiles, and extreme values. The box represents the inter-quartile range which contains the 50% of values. The whiskers are lines that extend from the box to the highest and lowest values, excluding outliers. A line across the box indicates the median.
Australian Centre for Tropical Freshwater Research 42
Water quality monitoring – Black Ross Basins 2007/08. ACTFR Report 08/04
APPENDIX B
Hydrographs of the major watercourses in the Black Ross WQIP Region
Australian Centre for Tropical Freshwater Research 43

Water quality monitoring – Black Ross Basins 2007/08. ACTFR Report 08/04
Summary of the water quality data over the hydrograph for the Black River site including total suspended sediment concentrations (A), nitrogen (B) and phosphorus (C) species.
Australian Centre for Tropical Freshwater Research 44

Water quality monitoring – Black Ross Basins 2007/08. ACTFR Report 08/04
Summary of the water quality data over the hydrograph for the Bohle River site including total suspended sediment concentrations (A), nitrogen (B) and phosphorus (C) species.
Australian Centre for Tropical Freshwater Research 45

Water quality monitoring – Black Ross Basins 2007/08. ACTFR Report 08/04
Summary of the water quality data over the hydrograph for the Ross River site including total suspended sediment concentrations (A), nitrogen (B) and phosphorus (C) species.
Australian Centre for Tropical Freshwater Research 46

Water quality monitoring – Black Ross Basins 2007/08. ACTFR Report 08/04
Australian Centre for Tropical Freshwater Research 47
APPENDIX C
Water quality data
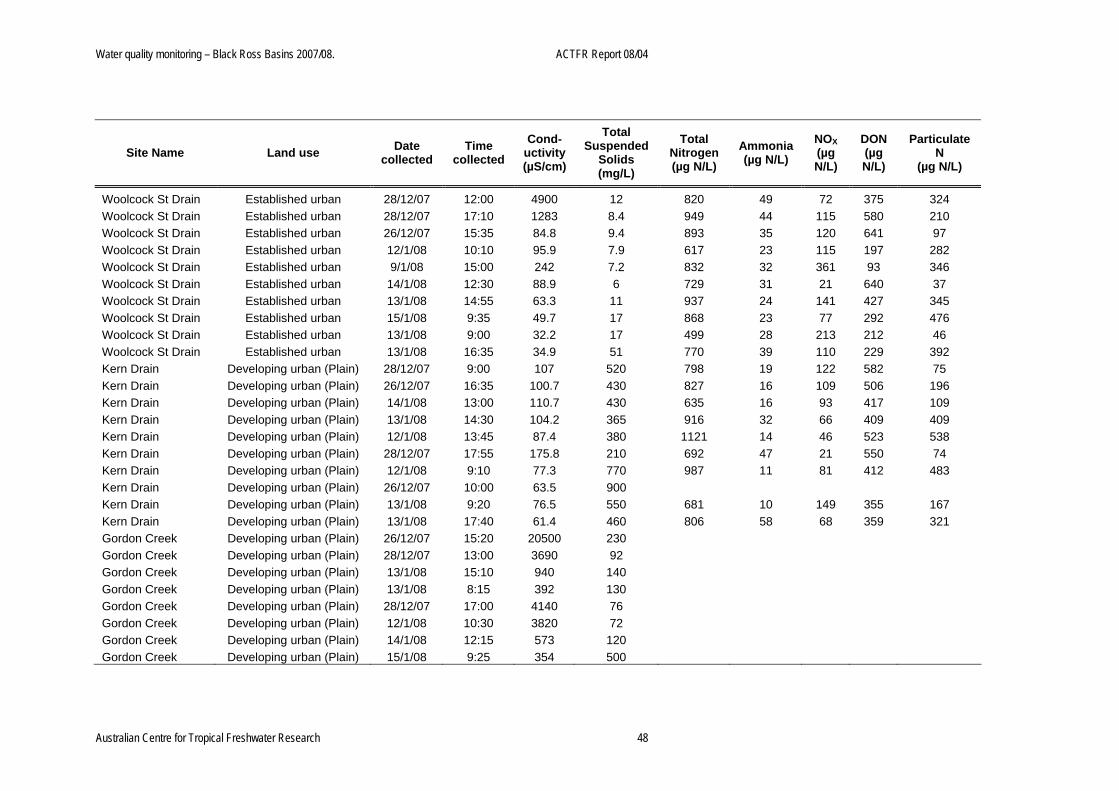
Water quality monitoring – Black Ross Basins 2007/08. ACTFR Report 08/04
Site Name Land use Date collected
Time collected
Cond- uctivity (µS/cm)
Total Suspended
Solids (mg/L)
Total Nitrogen (µg N/L)
Ammonia (µg N/L)
NOX (µg N/L)
DON (µg N/L)
Particulate N
(µg N/L)
Woolcock St Drain Established urban 28/12/07 12:00 4900 12 820 49 72 375 324 Woolcock St Drain Established urban 28/12/07 17:10 1283 8.4 949 44 115 580 210 Woolcock St Drain Established urban 26/12/07 15:35 84.8 9.4 893 35 120 641 97 Woolcock St Drain Established urban 12/1/08 10:10 95.9 7.9 617 23 115 197 282 Woolcock St Drain Established urban 9/1/08 15:00 242 7.2 832 32 361 93 346 Woolcock St Drain Established urban 14/1/08 12:30 88.9 6 729 31 21 640 37 Woolcock St Drain Established urban 13/1/08 14:55 63.3 11 937 24 141 427 345 Woolcock St Drain Established urban 15/1/08 9:35 49.7 17 868 23 77 292 476 Woolcock St Drain Established urban 13/1/08 9:00 32.2 17 499 28 213 212 46 Woolcock St Drain Established urban 13/1/08 16:35 34.9 51 770 39 110 229 392 Kern Drain Developing urban (Plain) 28/12/07 9:00 107 520 798 19 122 582 75 Kern Drain Developing urban (Plain) 26/12/07 16:35 100.7 430 827 16 109 506 196 Kern Drain Developing urban (Plain) 14/1/08 13:00 110.7 430 635 16 93 417 109 Kern Drain Developing urban (Plain) 13/1/08 14:30 104.2 365 916 32 66 409 409 Kern Drain Developing urban (Plain) 12/1/08 13:45 87.4 380 1121 14 46 523 538 Kern Drain Developing urban (Plain) 28/12/07 17:55 175.8 210 692 47 21 550 74 Kern Drain Developing urban (Plain) 12/1/08 9:10 77.3 770 987 11 81 412 483 Kern Drain Developing urban (Plain) 26/12/07 10:00 63.5 900 Kern Drain Developing urban (Plain) 13/1/08 9:20 76.5 550 681 10 149 355 167 Kern Drain Developing urban (Plain) 13/1/08 17:40 61.4 460 806 58 68 359 321 Gordon Creek Developing urban (Plain) 26/12/07 15:20 20500 230 Gordon Creek Developing urban (Plain) 28/12/07 13:00 3690 92 Gordon Creek Developing urban (Plain) 13/1/08 15:10 940 140 Gordon Creek Developing urban (Plain) 13/1/08 8:15 392 130 Gordon Creek Developing urban (Plain) 28/12/07 17:00 4140 76 Gordon Creek Developing urban (Plain) 12/1/08 10:30 3820 72 Gordon Creek Developing urban (Plain) 14/1/08 12:15 573 120 Gordon Creek Developing urban (Plain) 15/1/08 9:25 354 500
Australian Centre for Tropical Freshwater Research 48

Water quality monitoring – Black Ross Basins 2007/08. ACTFR Report 08/04
Site Name Land use Date collected
Time collected
Cond- uctivity (µS/cm)
Total Suspended
Solids (mg/L)
Total Nitrogen (µg N/L)
Ammonia (µg N/L)
NOX (µg N/L)
DON (µg N/L)
Particulate N
(µg N/L)
Gordon Creek Developing urban (Plain) 13/1/08 16:25 921 4600 Riverside Creek Developing urban (Slope) 27/12/07 19:45 89.1 3200 Riverside Creek Developing urban (Slope) 27/12/07 19:45 110.5 20000 Riverside Creek Developing urban (Slope) 5/1/08 1:00 1200 Riverside Creek Developing urban (Slope) 5/1/08 1:00 17000 Riverside Creek Developing urban (Slope) 13/1/08 17:00 72.3 4050 Riverside Creek Developing urban (Slope) 13/1/08 17:00 57.7 5900 Riverside Creek Developing urban (Slope) 13/1/08 18:10 97.5 545 Freshwater Dr Ck Comparison site (Slope) 13/1/08 18:00 73.6 25 Campus Creek Comparison site (Slope) 13/1/08 17:40 52.9 82 Campus Creek 2 Comparison site (Slope) 13/1/08 17:50 52.5 46 Hill St Drain Light industrial 28/12/07 17:40 134.4 8.5 479 20 69 305 85 Hill St Drain Light industrial 9/1/08 14:45 376 43 975 18 86 521 350 Hill St Drain Light industrial 14/1/08 12:45 131.7 36 527 13 123 318 73 Hill St Drain Light industrial 13/1/08 14:40 738 18 1906 22 120 834 930 Hill St Drain Light industrial 13/1/08 8:40 124 25 1574 11 66 768 729 Hill St Drain Light industrial 15/1/08 10:35 37.8 43 243 12 59 132 40 Hill St Drain Light industrial 11/2/08 9:05 76.9 71 648 4 196 259 189 Hill St Drain Light industrial 13/1/08 17:00 31.2 110 776 29 108 336 303 Hill St Drain Light industrial 11/2/08 15:20 52.6 89 589 20 89 265 215 Ross River Major catchment 11/2/08 8:45 114.1 29 432 15 41 252 124 Ross River Major catchment 13/2/08 10:35 66.4 69 606 40 29 247 290 Ross River Major catchment 13/2/08 10:35 63.8 71 581 36 45 226 274 Ross River Major catchment 14/2/08 8:30 72.1 33 585 69 38 260 218 Ross River Major catchment 15/2/08 15:00 45.8 17 599 16 15 421 147 Ross River Major catchment 18/2/08 14:45 45.4 20 524 22 9 311 182 Ross River Major catchment 18/2/08 14:45 45.5 20 543 23 13 321 186 Ross River Major catchment 22/2/08 13:05 59.5 4.1 551 67 27 291 166
Australian Centre for Tropical Freshwater Research 49

Water quality monitoring – Black Ross Basins 2007/08. ACTFR Report 08/04
Site Name Land use Date collected
Time collected
Cond- uctivity (µS/cm)
Total Suspended
Solids (mg/L)
Total Nitrogen (µg N/L)
Ammonia (µg N/L)
NOX (µg N/L)
DON (µg N/L)
Particulate N
(µg N/L)
Ross River Major catchment 16/2/08 13:00 44.2 65 486 24 18 278 166 Ross River Major catchment 17/2/08 12:00 45 31 480 18 21 275 166 Ross River Major catchment 12/2/08 9:00 45.9 220 736 7 125 143 461 Ross River Major catchment 11/2/08 16:45 75.8 69 528 2 55 193 278 Ross River Major catchment 17/1/08 14:20 63.7 58 449 14 67 162 206 Ross River Major catchment 14/1/08 13:25 101.3 43 462 18 43 312 89 Ross River Major catchment 15/1/08 9:00 123.3 19 448 56 46 291 55 Ross River Major catchment 13/1/08 18:10 132.1 6.3 434 11 28 262 133 Ross River Major catchment 13/1/08 10:40 142.8 3.2 TBC 7 30 261 Black River Major catchment 29/11/07 12:05 120.9 4.6 595 29 425 141 0 Black River Major catchment 8/1/08 16:50 29.8 300 1038 6 48 275 709 Black River Major catchment 15/1/08 16:35 40.3 220 416 22 86 234 74 Black River Major catchment 15/1/08 11:15 30.9 360 775 4 51 258 462 Black River Major catchment 13/1/08 10:05 65.3 100 775 8 88 404 275 Black River Major catchment 8/1/08 11:30 27 960 1118 8 85 232 793 Black River Major catchment 14/1/08 9:00 38.8 210 842 9 69 407 357 Black River Major catchment 9/1/08 16:00 98.9 26 450 17 31 217 185 Black River Major catchment 11/2/08 9:35 38.6 490 787 12 41 343 391 Black River Major catchment 16/2/08 12:10 35.2 210 516 4 31 277 204 Black River Major catchment 16/2/08 12:10 36.7 230 568 10 59 219 280 Black River Major catchment 11/2/08 16:05 31.7 520 882 10 137 221 514 Black River Major catchment 12/2/08 9:40 62.5 89 500 7 119 223 151 Bohle River Major catchment 28/12/07 18:30 248 290 864 57 149 551 107 Bohle River Major catchment 29/12/07 12:30 387 180 778 49 78 600 51 Bohle River Major catchment 28/12/07 11:40 163.8 320 1404 40 164 582 618 Bohle River Major catchment 17/1/08 13:40 101.8 49 489 19 84 327 59 Bohle River Major catchment 8/1/08 16:30 90.3 330 875 14 84 342 435 Bohle River Major catchment 15/1/08 10:50 40.3 270 350 17 60 254 19
Australian Centre for Tropical Freshwater Research 50

Water quality monitoring – Black Ross Basins 2007/08. ACTFR Report 08/04
Site Name Land use Date collected
Time collected
Cond- uctivity (µS/cm)
Total Suspended
Solids (mg/L)
Total Nitrogen (µg N/L)
Ammonia (µg N/L)
NOX (µg N/L)
DON (µg N/L)
Particulate N
(µg N/L)
Bohle River Major catchment 15/1/08 16:20 38.3 220 337 12 51 187 87 Bohle River Major catchment 12/1/08 9:30 62.3 1150 1568 25 112 409 1022 Bohle River Major catchment 14/1/08 9:20 33.2 320 645 12 8 316 309 Bohle River Major catchment 13/1/08 17:05 70.9 710 1318 22 601 Bohle River Major catchment 12/1/08 14:10 63.8 415 1181 26 101 351 703 Bohle River Major catchment 13/1/08 9:40 78.5 325 957 19 68 423 447 Bohle River Major catchment 11/2/08 9:20 44.8 440 652 7 59 372 214 Bohle River Major catchment 13/2/08 11:00 87.1 58 674 20 52 354 248 Bohle River Major catchment 16/2/08 11:45 20.1 110 522 18 37 146 321 Bohle River Major catchment 17/2/08 12:30 56.4 64 519 7 60 308 144 Bohle River Major catchment 11/2/08 15:50 35.6 310 569 50 50 200 269 Bohle River Major catchment 12/2/08 9:25 43.9 95 530 6 71 205 248
Australian Centre for Tropical Freshwater Research 51

Water quality monitoring – Black Ross Basins 2007/08. ACTFR Report 08/04
Site Name Land use Date collected
Time collected
Total Phosphorus
(µg P/L)
Filterable Reactive P
(µg P/L)
DOP (µg P/L)
Particulate P
(µg P/L)
Woolcock St Drain Established urban 28/12/07 12:00 300 186 4 110 Woolcock St Drain Established urban 28/12/07 17:10 347 194 90 63 Woolcock St Drain Established urban 26/12/07 15:35 579 490 49 40 Woolcock St Drain Established urban 12/1/08 10:10 246 89 71 86 Woolcock St Drain Established urban 9/1/08 15:00 227 69 72 86 Woolcock St Drain Established urban 14/1/08 12:30 366 188 175 3 Woolcock St Drain Established urban 13/1/08 14:55 473 196 190 87 Woolcock St Drain Established urban 15/1/08 9:35 438 124 147 167 Woolcock St Drain Established urban 13/1/08 9:00 290 107 168 15 Woolcock St Drain Established urban 13/1/08 16:35 312 91 86 135 Kern Drain Developing urban (Plain) 28/12/07 9:00 287 214 18 55 Kern Drain Developing urban (Plain) 26/12/07 16:35 353 271 11 71 Kern Drain Developing urban (Plain) 14/1/08 13:00 316 88 73 155 Kern Drain Developing urban (Plain) 13/1/08 14:30 387 87 77 223 Kern Drain Developing urban (Plain) 12/1/08 13:45 405 82 55 268 Kern Drain Developing urban (Plain) 28/12/07 17:55 177 163 0 14 Kern Drain Developing urban (Plain) 12/1/08 9:10 386 85 44 257 Kern Drain Developing urban (Plain) 26/12/07 10:00 Kern Drain Developing urban (Plain) 13/1/08 9:20 362 83 94 185 Kern Drain Developing urban (Plain) 13/1/08 17:40 363 97 75 191
Gordon Creek Developing urban (Plain) 26/12/07 15:20 Gordon Creek Developing urban (Plain) 28/12/07 13:00 Gordon Creek Developing urban (Plain) 13/1/08 15:10 Gordon Creek Developing urban (Plain) 13/1/08 8:15 Gordon Creek Developing urban (Plain) 28/12/07 17:00 Gordon Creek Developing urban (Plain) 12/1/08 10:30 Gordon Creek Developing urban (Plain) 14/1/08 12:15 Gordon Creek Developing urban (Plain) 15/1/08 9:25
Australian Centre for Tropical Freshwater Research 52

Water quality monitoring – Black Ross Basins 2007/08. ACTFR Report 08/04
Site Name Land use Date collected
Time collected
Total Phosphorus
(µg P/L)
Filterable Reactive P
(µg P/L)
DOP (µg P/L)
Particulate P
(µg P/L)
Gordon Creek Developing urban (Plain) 13/1/08 16:25 Riverside Creek Developing urban (Slope) 27/12/07 19:45 Riverside Creek Developing urban (Slope) 27/12/07 19:45 Riverside Creek Developing urban (Slope) 5/1/08 1:00 Riverside Creek Developing urban (Slope) 5/1/08 1:00 Riverside Creek Developing urban (Slope) 13/1/08 17:00 Riverside Creek Developing urban (Slope) 13/1/08 17:00 Riverside Creek Developing urban (Slope) 13/1/08 18:10 Freshwater Dr Ck Comparison site (Slope) 13/1/08 18:00 Campus Creek Comparison site (Slope) 13/1/08 17:40 Campus Creek 2 Comparison site (Slope) 13/1/08 17:50 Hill St Drain Light industrial 28/12/07 17:40 182 146 11 25 Hill St Drain Light industrial 9/1/08 14:45 199 64 36 99 Hill St Drain Light industrial 14/1/08 12:45 138 41 36 61 Hill St Drain Light industrial 13/1/08 14:40 1587 829 382 376 Hill St Drain Light industrial 13/1/08 8:40 1021 536 244 241 Hill St Drain Light industrial 15/1/08 10:35 134 68 29 37 Hill St Drain Light industrial 11/2/08 9:05 209 191 18 0 Hill St Drain Light industrial 13/1/08 17:00 420 89 175 156 Hill St Drain Light industrial 11/2/08 15:20 299 11 170 118 Ross River Major catchment 11/2/08 8:45 36 16 20 0 Ross River Major catchment 13/2/08 10:35 112 4 16 92 Ross River Major catchment 13/2/08 10:35 103 3 16 84 Ross River Major catchment 14/2/08 8:30 82 6 14 62 Ross River Major catchment 15/2/08 15:00 72 13 5 54 Ross River Major catchment 18/2/08 14:45 58 9 2 47 Ross River Major catchment 18/2/08 14:45 54 5 1 48 Ross River Major catchment 22/2/08 13:05 49 15 8 26
Australian Centre for Tropical Freshwater Research 53

Water quality monitoring – Black Ross Basins 2007/08. ACTFR Report 08/04
Site Name Land use Date collected
Time collected
Total Phosphorus
(µg P/L)
Filterable Reactive P
(µg P/L)
DOP (µg P/L)
Particulate P
(µg P/L)
Ross River Major catchment 16/2/08 13:00 78 15 6 57 Ross River Major catchment 17/2/08 12:00 48 12 4 32 Ross River Major catchment 12/2/08 9:00 173 16 5 152 Ross River Major catchment 11/2/08 16:45 121 10 21 90 Ross River Major catchment 17/1/08 14:20 140 42 18 80 Ross River Major catchment 14/1/08 13:25 103 18 18 67 Ross River Major catchment 15/1/08 9:00 59 16 15 28 Ross River Major catchment 13/1/08 18:10 51 7 13 31 Ross River Major catchment 13/1/08 10:40 TBC 1 11 Black River Major catchment 29/11/07 12:05 51 45 6 0 Black River Major catchment 8/1/08 16:50 376 32 21 323 Black River Major catchment 15/1/08 16:35 84 21 18 45 Black River Major catchment 15/1/08 11:15 185 18 11 156 Black River Major catchment 13/1/08 10:05 132 18 35 79 Black River Major catchment 8/1/08 11:30 207 32 28 147 Black River Major catchment 14/1/08 9:00 195 23 25 147 Black River Major catchment 9/1/08 16:00 86 15 11 60 Black River Major catchment 11/2/08 9:35 36 12 24 0 Black River Major catchment 16/2/08 12:10 151 14 9 128 Black River Major catchment 16/2/08 12:10 171 24 6 141 Black River Major catchment 11/2/08 16:05 193 7 28 158 Black River Major catchment 12/2/08 9:40 96 8 19 69 Bohle River Major catchment 28/12/07 18:30 518 366 81 71 Bohle River Major catchment 29/12/07 12:30 538 367 142 29 Bohle River Major catchment 28/12/07 11:40 690 522 29 139 Bohle River Major catchment 17/1/08 13:40 114 56 31 27 Bohle River Major catchment 8/1/08 16:30 488 141 140 207 Bohle River Major catchment 15/1/08 10:50 71 53 13 5
Australian Centre for Tropical Freshwater Research 54

Water quality monitoring – Black Ross Basins 2007/08. ACTFR Report 08/04
Australian Centre for Tropical Freshwater Research 55
Site Name Land use Date collected
Time collected
Total Phosphorus
(µg P/L)
Filterable Reactive P
(µg P/L)
DOP (µg P/L)
Particulate P
(µg P/L)
Bohle River Major catchment 15/1/08 16:20 142 62 23 57 Bohle River Major catchment 12/1/08 9:30 594 81 40 473 Bohle River Major catchment 14/1/08 9:20 252 53 46 153 Bohle River Major catchment 13/1/08 17:05 407 71 75 261 Bohle River Major catchment 12/1/08 14:10 477 76 35 366 Bohle River Major catchment 13/1/08 9:40 350 84 57 209 Bohle River Major catchment 11/2/08 9:20 67 46 21 0 Bohle River Major catchment 13/2/08 11:00 116 18 27 71 Bohle River Major catchment 16/2/08 11:45 116 13 7 96 Bohle River Major catchment 17/2/08 12:30 116 33 8 75 Bohle River Major catchment 11/2/08 15:50 128 1 49 78 Bohle River Major catchment 12/2/08 9:25 128 21 24 83