Water Quality Characteristics for the Snake River, North Fork of the Snake River, Peru Creek, and...
52
Water Quality Characteristics for the Snake River, North Fork of the Snake River, Peru Creek, and Deer Creek in Summit County, Colorado: 2001 to 2002 Andrew S. Todd 1 , Diane M. McKnight 1 , and Sabre M. Duren 1 1 Institute of Arctic and Alpine Research, University of Colorado, Boulder, CO 80309, U.S.A. Institute of Arctic and Alpine Research University of Colorado, Boulder, Colorado 80309 2005 University of Colorado Institute of Arctic and Alpine Research Occasional Paper 57 INSTAAR/OP-57 ISSN 0069-6145
-
Upload
independent -
Category
Documents
-
view
1 -
download
0
Transcript of Water Quality Characteristics for the Snake River, North Fork of the Snake River, Peru Creek, and...
Water Quality Characteristics for the Snake River, North Fork of the Snake River, Peru Creek, and Deer Creek in Summit
County, Colorado: 2001 to 2002
Andrew S. Todd1, Diane M. McKnight1, and Sabre M. Duren1 1Institute of Arctic and Alpine Research, University of Colorado, Boulder, CO 80309, U.S.A.
Institute of Arctic and Alpine Research
University of Colorado, Boulder, Colorado 80309
2005
University of Colorado Institute of Arctic and Alpine Research
Occasional Paper 57
INSTAAR/OP-57 ISSN 0069-6145

ii
iii
TABLE OF CONTENTS ACKNOWLEDGMENTS ................................................................................................V
DISCLAIMER...................................................................................................................V
ABSTRACT....................................................................................................................... 1
INTRODUCTION............................................................................................................. 2
SITE DESCRIPTION....................................................................................................... 3
METHODS ........................................................................................................................ 7
WATER QUALITY CHARACTERISTICS .................................................................. 8
UPPER SNAKE RIVER, DEER CREEK AND MONTEZUMA................................................................................... 8 PENNSYLVANIA MINE, CINNAMON GULCH AND PERU CREEK ........................................................................ 9 BEYOND THE HEADWATERS.................................................................................................................................. 11 COMPARISON WITH PREVIOUS WATER QUALITY MEASUREMENTS ............................................................ 11 RISKS TO AQUATIC ECOSYSTEMS ........................................................................................................................ 14
CONCLUSIONS ............................................................................................................. 18
PENNSYLVANIA MINE AND CINNAMON GULCH ARE MAJOR SOURCES OF TRACE METALS IN PERU CREEK ........................................................................................................................................................................ 18 INSTREAM PRECIPITATION OF METAL OXIDES IS A DOMINANT PROCESS ................................................ 18 LOW-FLOW CONDITIONS DURING DROUGHT YEARS AND WINTER MONTHS YIELD HIGH AQUEOUS METALS CONCENTRATIONS .................................................................................................................................. 19 ZN AND CD ARE PRIMARY METALS OF SNAKE RIVER WATERSHED-WIDE ECOLOGICAL CONCERN. 19
REFERENCES CITED .................................................................................................. 21
APPENDIX A: TABLES ................................................................................................ 23
LIST OF FIGURES FIGURE 1. LOCATION MAP OF SAMPLING SITES WITHIN THE SNAKE RIVER WATERSHED..................................................................................................... 4
FIGURE 2: SNAKE RIVER HYDROGRAPH FROM 4 NOVEMBER 2001 THROUGH 21 SEPTEMBER 2002 ................................................................................ 6
FIGURE 3: MEASURED DISSOLVED ALUMINUM CONCENTRATIONS AT THE DEER CREEK/SNAKE RIVER CONFLUENCE ............................................... 9
FIGURE 4: MEASURED DISSOLVED ZINC CONCENTRATIONS AT THE DEER CREEK/SNAKE RIVER CONFLUENCE ...................................................... 10
FIGURE 5: DISSOLVED ALUMINUM CONCENTRATIONS ALONG PERU CREEK AND THE SNAKE RIVER MEASURED ON THREE DATES IN 2002 .. 11
FIGURE 6: DISSOLVED ZINC CONCENTRATIONS ALONG PERU CREEK AND THE SNAKE RIVER MEASURED ON THREE DATES IN 2002 ................. 12
iv
FIGURE 7: DISSOLVED ALUMINUM CONCENTRATIONS ALONG THE SNAKE RIVER MEASURED ON FOUR DATES IN 2002 ....................................... 12
FIGURE 8: DISSOLVED ZINC CONCENTRATIONS ALONG THE SNAKE RIVER MEASURED ON FOUR DATES IN 2002...................................................... 13
FIGURE 9: MEASURED DISSOLVED ZINC CONCENTRATIONS AT THE NORTH FORK/SNAKE RIVER CONFLUENCE...................................................... 14
LIST OF TABLES TABLE 1: DISSOLVED METAL CONCENTRATIONS AT THREE COMMON POINTS (DAS, SAD, AND SBD) IN THE UPPER SNAKE RIVER WATERSHED........................................................................................................................................... 15
TABLE 2: DISSOLVED METAL CONCENTRATIONS AT TWO COMMON SAMPLING POINTS IN THE PERU CREEK DRAINAGE .................................... 16
TABLE 3: ORIGINAL PERU CREEK (AND TRIBUTARIES) WATER CHEMISTRY DATA FROM MCKNIGHT AND BENCALA (1990) ...................... 17
TABLE 4: SUMMARY TABLE OF ACUTE AQUATIC ECOSYSTEM RISK CALCULATIONS IN THE SNAKE RIVER WATERSHED.................................... 19
TABLE 5: SUMMARY TABLE OF CHRONIC AQUATIC ECOSYSTEM RISK CALCULATIONS IN THE SNAKE RIVER WATERSHED.................................... 20
v
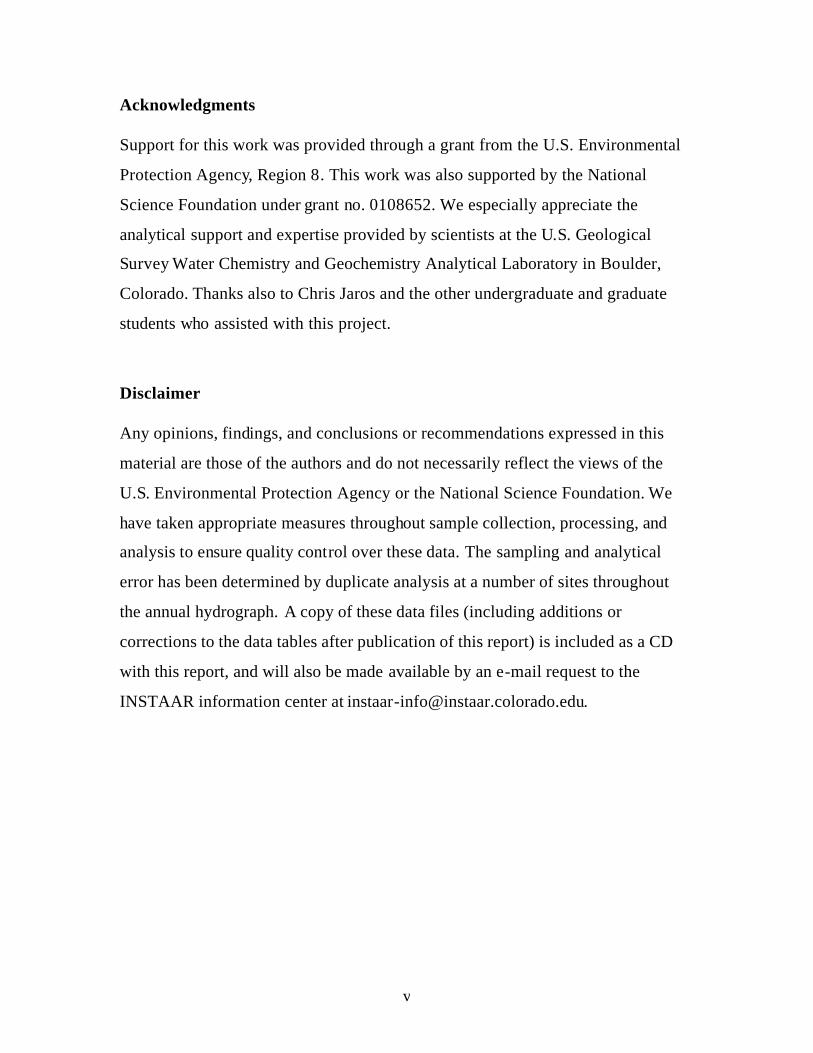
Acknowledgments Support for this work was provided through a grant from the U.S. Environmental
Protection Agency, Region 8. This work was also supported by the National
Science Foundation under grant no. 0108652. We especially appreciate the
analytical support and expertise provided by scientists at the U.S. Geological
Survey Water Chemistry and Geochemistry Analytical Laboratory in Boulder,
Colorado. Thanks also to Chris Jaros and the other undergraduate and graduate
students who assisted with this project.
Disclaimer Any opinions, findings, and conclusions or recommendations expressed in this
material are those of the authors and do not necessarily reflect the views of the
U.S. Environmental Protection Agency or the National Science Foundation. We
have taken appropriate measures throughout sample collection, processing, and
analysis to ensure quality control over these data. The sampling and analytical
error has been determined by duplicate analysis at a number of sites throughout
the annual hydrograph. A copy of these data files (including additions or
corrections to the data tables after publication of this report) is included as a CD
with this report, and will also be made available by an e-mail request to the
INSTAAR information center at [email protected].

vi
1
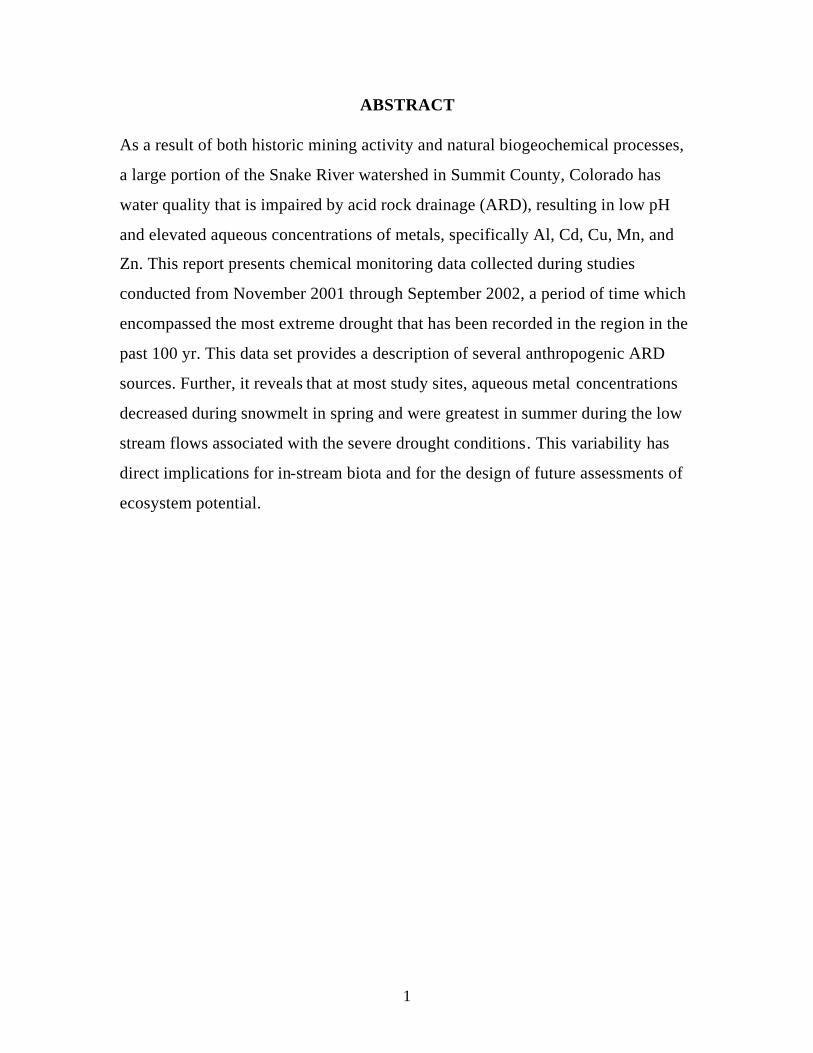
ABSTRACT As a result of both historic mining activity and natural biogeochemical processes,
a large portion of the Snake River watershed in Summit County, Colorado has
water quality that is impaired by acid rock drainage (ARD), resulting in low pH
and elevated aqueous concentrations of metals, specifically Al, Cd, Cu, Mn, and
Zn. This report presents chemical monitoring data collected during studies
conducted from November 2001 through September 2002, a period of time which
encompassed the most extreme drought that has been recorded in the region in the
past 100 yr. This data set provides a description of several anthropogenic ARD
sources. Further, it reveals that at most study sites, aqueous metal concentrations
decreased during snowmelt in spring and were greatest in summer during the low
stream flows associated with the severe drought conditions. This variability has
direct implications for in-stream biota and for the design of future assessments of
ecosystem potential.
2
INTRODUCTION
Acid rock drainage (ARD) is a common feature of watersheds in the Rocky
Mountain region of the United States and Canada, and in many other regions of
the world. Although natural weathering of pyrite contributes to ARD in some
Rocky Mountain watersheds, pyrite weathering associated with past mining
activities, called acid mine drainage (AMD), typically has a more significant
impact on water quality. During the initial wave of mining and European
expansion into the West, miners excavated veins of minerals and exposed sulfidic
minerals (such as pyrite) to atmospheric oxygen, greatly accelerating their
weathering through microbially mediated reactions. As a result of the large spatial
extent of this mining legacy, AMD has been referred to as the greatest water
quality problem facing the Western United States (Mineral Policy Center, 1997).
The weathering and oxidation of pyrite occurs in three steps, and the
process becomes autocatalytic in nature. Weathering of pyrite increases the
concentrations of trace metals through the co-weathering of other sulfidic minerals
associated with pyrite, as well as of other minerals in the vicinity of the pyrite due
to the acidic conditions. Water quality of streams receiving AMD is typically
acidic with high concentrations of dissolved metals such as zinc, copper,
cadmium, iron, and aluminum. Additionally, AMD streambeds are characterized
by bright orange and white colored deposits that indicate iron hydroxide and
aluminum hydroxide deposition, respectively (Theobald et al., 1963; McKnight et
al., 1992). High metal ion concentrations, low pH, and hydroxide deposition limit
stream biota, including microbes, algae, invertebrates, and fish, for many
kilometers of streams in Colorado (McKnight and Feder, 1984; Niyogi , 1999).
This report focuses on the Snake River of Colorado and several of its
primary tributaries, including Deer Creek, Peru Creek, and the North Fork of the
Snake River. In April 1999, the Snake River Task Force (SRTF) was formed,
bringing together multiple parties in the watershed. The mission of the Task Force
3
is to improve water quality in the watershed, with an emphasis on identifying,
evaluating, and implementing opportunities to reduce trace metal concentrations in
the Snake River. Within the SRTF, primary informational needs toward
developing AMD remediation strategies in the Snake River Basin were identified,
including the identification of major sources of AMD and the characterization of
the variation in concentration of trace metals in the stream throughout the year,
with a focus on spring snowmelt. Responding to this need, this report is the
product of research conducted to address these informational needs. Here we
present chemical monitoring data collected during these studies, conducted from
November 2001 through September 2002.
SITE DESCRIPTION
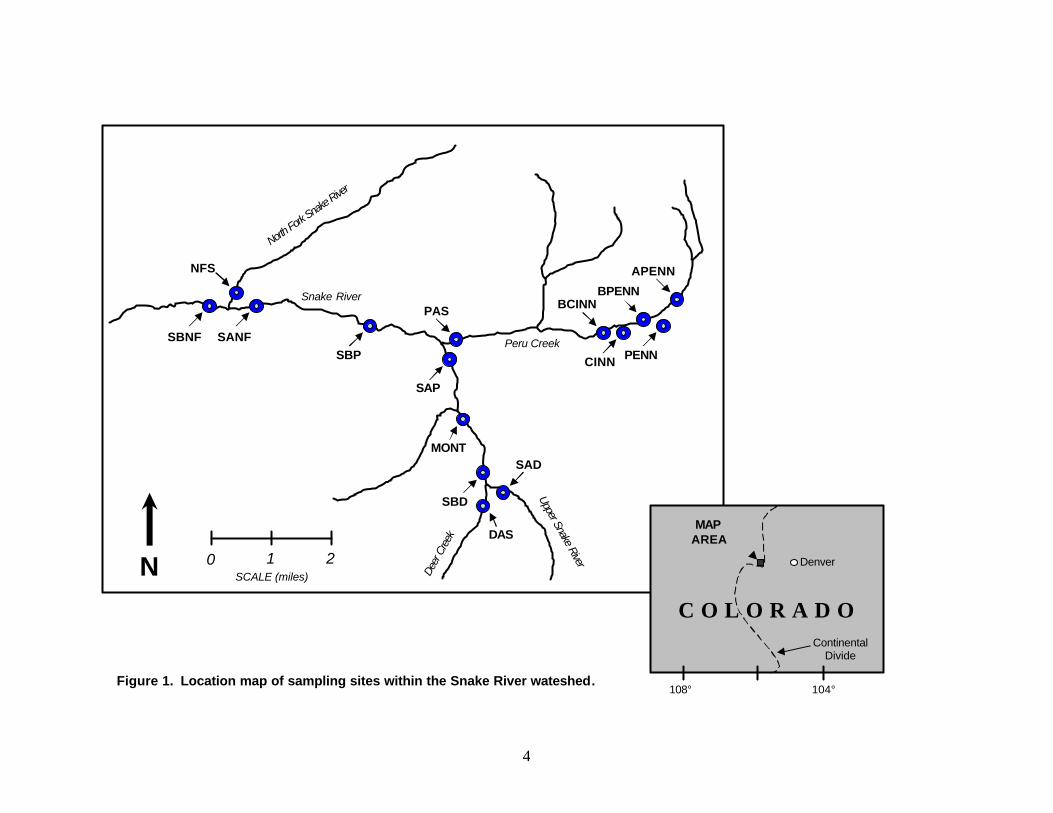
The Snake River watershed is located in central Colorado’s Rocky
Mountains immediately west of the Continental Divide (Fig. 1). As a result of both
historic mining activity and natural biogeochemical processes, a large percentage
of the basin is impacted by acid rock drainage. The Snake River and Peru Creek
are identified on Colorado’s 2000 303(d) list of impaired water bodies due to high
concentrations of zinc, cadmium, copper, lead, and manganese. The headwaters of
the Snake River receive inflow from acidic and metal-enriched tributaries and
groundwater on the eastern side of the watershed, where disseminated pyrite is
abundant in the country rock (Theobald et al., 1963). This headwater reach also
runs through a naturally occurring bog iron ore deposit. The inflow of Deer Creek,
a pristine tributary of approximately equal flow, raises the pH and causes
precipitation of aluminum and iron hydroxides.
The next substantial tributary, Peru Creek, receives inflow from numerous
abandoned mines. The Pennsylvania Mine, located on the Peru Creek tributary,
has been found to be one of largest sources of metals and acidity within this
watershed (McKnight and Bencala, 1990). As in the confluence with Deer Creek,
large sections of the Snake River and Peru Creek are coated in metal hydroxides—
4
C O L O R A D O
Denver
ContinentalDivide
MAPAREA
108° 104°
Upper Snake River
Deer
Cre
ek
Peru Creek
Snake River
North Fork
Snake R
iver
N 0 1 2SCALE (miles)
SBNF SANF
NFS
SBP
SAP
PAS BCINNBPENN
APENN
CINN PENN
MONT
SBD
DAS
SAD
Figure 1. Location map of sampling sites within the Snake River wateshed.
5
primarily iron and aluminum hydroxides—which precipitate out of solution as
flow from pristine tributaries raises the pH of the stream water. The Snake River,
joined by the tributaries Keystone Gulch (not shown) and the North Fork of the
Snake River, flows into Dillon Reservoir, which is a major water supply for the
city of Denver. Keystone and A-Basin ski resorts are located within the basin and
use water from these streams for snowmaking.
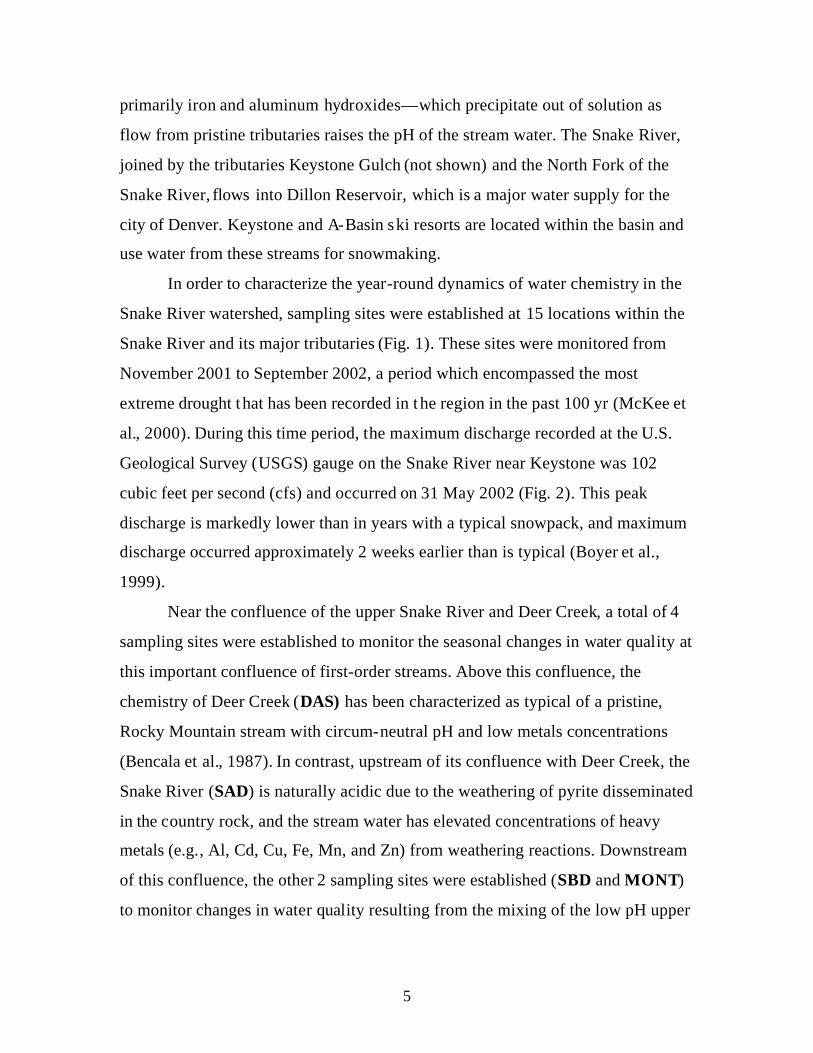
In order to characterize the year-round dynamics of water chemistry in the
Snake River watershed, sampling sites were established at 15 locations within the
Snake River and its major tributaries (Fig. 1). These sites were monitored from
November 2001 to September 2002, a period which encompassed the most
extreme drought t hat has been recorded in t he region in the past 100 yr (McKee et
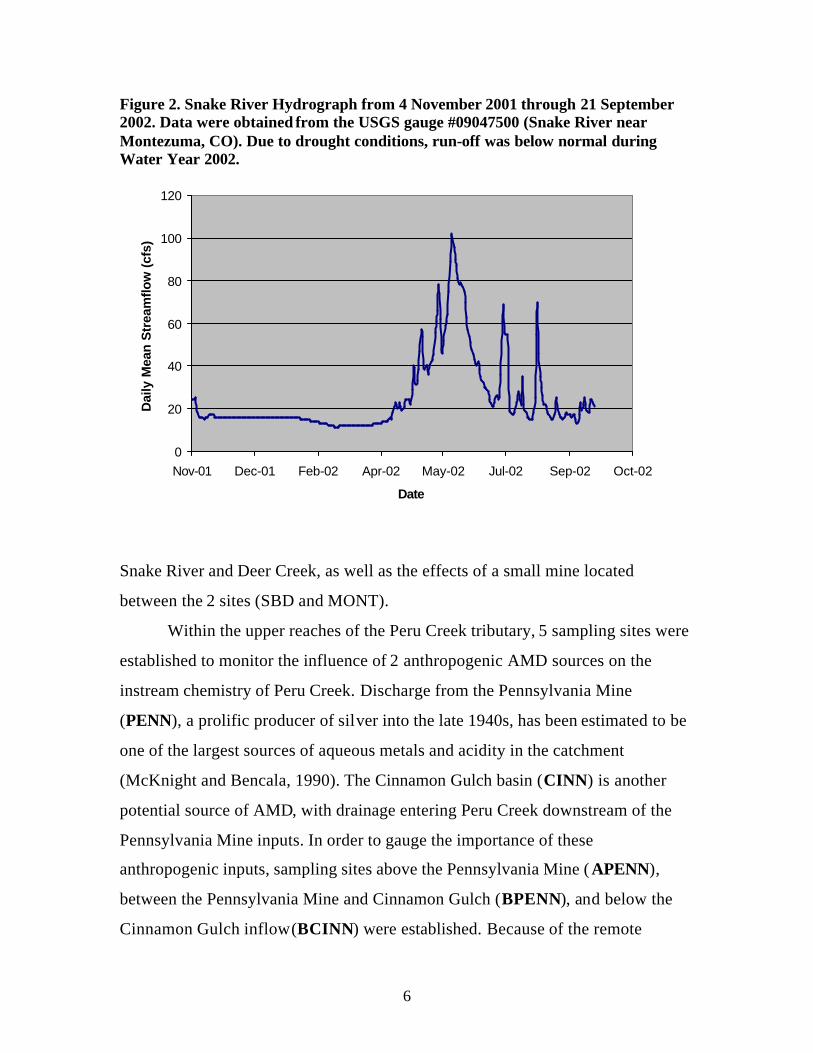
al., 2000). During this time period, the maximum discharge recorded at the U.S.
Geological Survey (USGS) gauge on the Snake River near Keystone was 102
cubic feet per second (cfs) and occurred on 31 May 2002 (Fig. 2). This peak
discharge is markedly lower than in years with a typical snowpack, and maximum
discharge occurred approximately 2 weeks earlier than is typical (Boyer et al.,
1999).
Near the confluence of the upper Snake River and Deer Creek, a total of 4
sampling sites were established to monitor the seasonal changes in water quality at
this important confluence of first-order streams. Above this confluence, the
chemistry of Deer Creek (DAS) has been characterized as typical of a pristine,
Rocky Mountain stream with circum-neutral pH and low metals concentrations
(Bencala et al., 1987). In contrast, upstream of its confluence with Deer Creek, the
Snake River (SAD) is naturally acidic due to the weathering of pyrite disseminated
in the country rock, and the stream water has elevated concentrations of heavy
metals (e.g., Al, Cd, Cu, Fe, Mn, and Zn) from weathering reactions. Downstream
of this confluence, the other 2 sampling sites were established (SBD and MONT)
to monitor changes in water quality resulting from the mixing of the low pH upper
6
Figure 2. Snake River Hydrograph from 4 November 2001 through 21 September 2002. Data were obtained from the USGS gauge #09047500 (Snake River near Montezuma, CO). Due to drought conditions, run-off was below normal during Water Year 2002.
0
20
40
60
80
100
120
Nov-01 Dec-01 Feb-02 Apr-02 May-02 Jul-02 Sep-02 Oct-02
Date
Dai
ly M
ean
Str
eam
flow
(cf
s)
Snake River and Deer Creek, as well as the effects of a small mine located
between the 2 sites (SBD and MONT).
Within the upper reaches of the Peru Creek tributary, 5 sampling sites were
established to monitor the influence of 2 anthropogenic AMD sources on the
instream chemistry of Peru Creek. Discharge from the Pennsylvania Mine
(PENN), a prolific producer of silver into the late 1940s, has been estimated to be
one of the largest sources of aqueous metals and acidity in the catchment
(McKnight and Bencala, 1990). The Cinnamon Gulch basin (CINN) is another
potential source of AMD, with drainage entering Peru Creek downstream of the
Pennsylvania Mine inputs. In order to gauge the importance of these
anthropogenic inputs, sampling sites above the Pennsylvania Mine ( APENN),
between the Pennsylvania Mine and Cinnamon Gulch (BPENN), and below the
Cinnamon Gulch inflow (BCINN) were established. Because of the remote
7
location and inaccessibility of these 5 sites during winter months due to avalanche
risk, frequency of sampling was limited to snow-free periods within the
monitoring period.
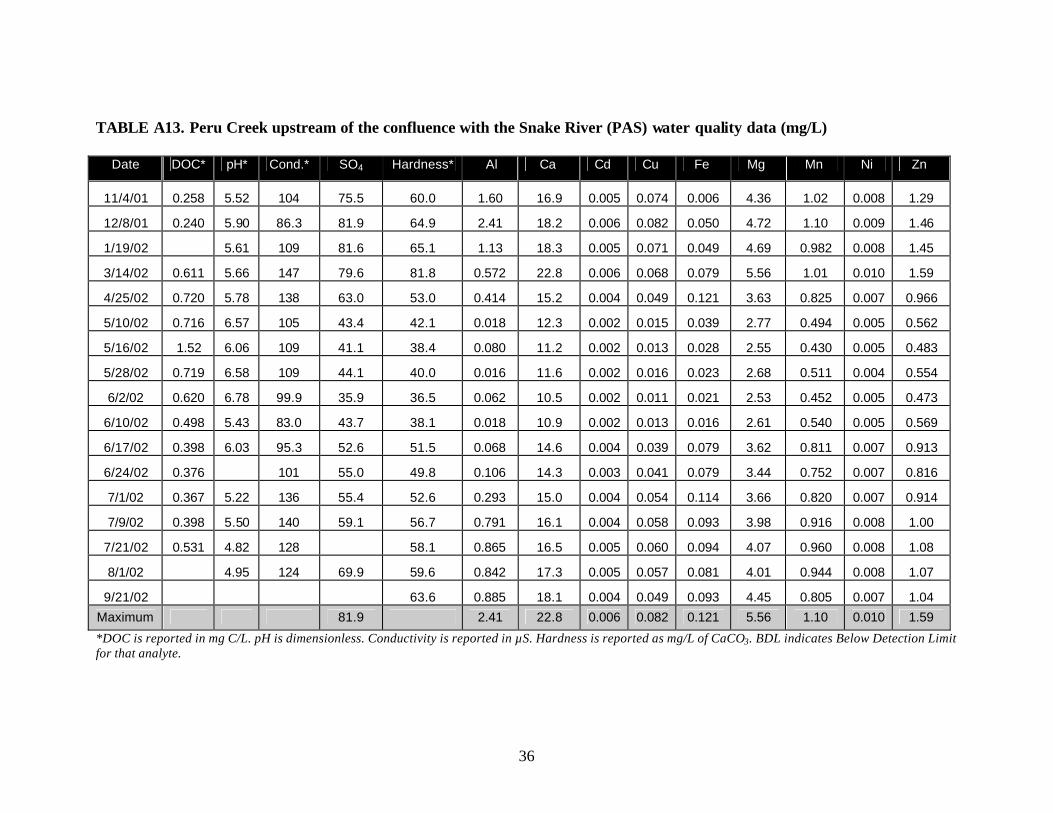
The confluence of the Snake River and Peru Creek was monitored at 3
sampling sites, including the Snake River upstream of Peru Creek (SAP), Peru
Creek upstream of the Snake River (PAS), and the Snake River downstream of
this confluence (SBP). The downstream sampling location was sited
approximately 1.6 km below this confluence to allow for complete mixing.
Finally, sampling sites were established within the North Fork of the Snake
River (NFS), the Snake River upstream of the North Fork (SANF), and
downstream of the confluence of these two streams (SBNF). All of these sites
were located within close proximity of the resort town of Keystone.
METHODS
During the period from November 2001 through September 2002, water
quality samples and associated measurements were t aken approximately once per
month during fall and winter months, and once per week thereafter.
Grab samples for inorganic analyses were collected in acid-washed 1-L
plastic bottles that had been rinsed three times with stream water. pH and
conductivity were measured at field sites using a YSI 63 multimeter. Samples
were filtered, either on-site (weather permitting) or in the laboratory, through 0.4-
µm Nucleopore filters using an Antlia pneumatic hand pump filtering apparatus.
Samples were filtered into cleaned 120-mL plastic bottles. Samples for cation and
dissolved metals analysis were acidified using 0.5-mL concentrated Ultrex nitric
acid. Sulfate concentrations were measured using a Dionex Ion Chromatograph,
and cation and metal concentrations were measured using a Jarrel-Asch
Inductively Coupled Plasma (ICP) spectrometer. Detection limits for the three ICP
runs are presented in Appendix A, Table A1. Detection limits for individual ICP
runs vary slightly due the unique conditions of each run, and were determined
8
using measurement of experimental blanks. Error calculated for duplicate samples
in this study are presented in Table A2. Percent error was found to be consistently
low (ranging from an average of 1.8% to 13%), and so the measured values are
reported without adjustments for error. The error range was typically higher for
trace metals measured at low concentrations (e.g., Cd, Cu, and Ni).
Dissolved organic carbon (DOC) samples were collected in the field in pre-
combusted glass bottles, and were filtered through Fisherbrand pre-combusted
glass-fiber filters (GF-C) into amber-colored glass bottles that had been cleaned
and combusted in the laboratory prior to sampling. Following filtration, DOC
samples were kept refrigerated. DOC was analyzed within 2 weeks of sample
collection using a Shimadzu TOC-5050A total organic carbon analyzer.
WATER QUALITY CHARACTERISTICS
Water quality characteristics from this study in the Snake River watershed
are presented as data Tables A3–A17 in Appendix A of this report. Measurements
for DOC, pH, conductivity, sulfate, hardness (as mg/L calcium carbonate), and a
suite of cations and trace metals (Al, Ca, Cd, Cu, Fe, Mg, Mn, Ni, and Zn) are
reported.
Upper Snake River, Deer Creek and Montezuma
Tables A3–A7 include water quality data for the 5 stream sampling sites
(SAD , DAS, SBD, and MONT, SAP ) that describe the chemistry of the Upper
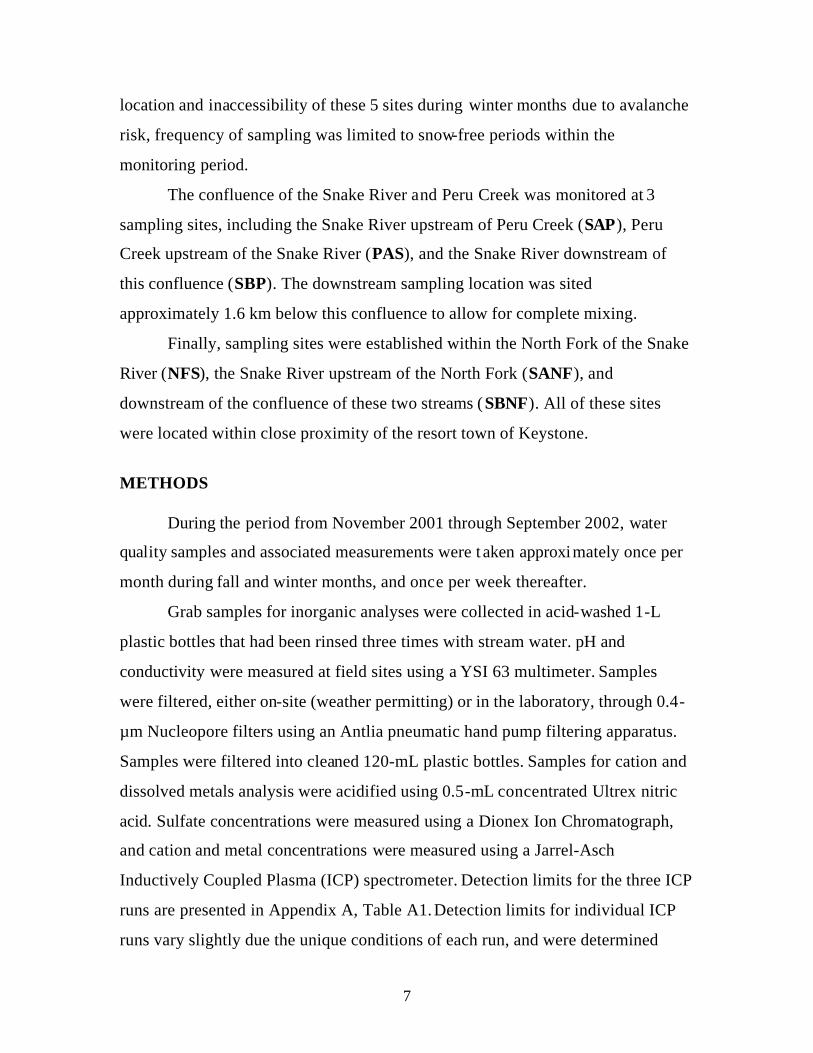
Snake River/Deer Creek confluence. As demonstrated in previous studies within
this watershed, reactive aqueous metals (such as Al) are soluble in highly acidic
waters, and less soluble at the higher pH values characteristic of spring runoff
(Brooks et al., 2001; McKnight and Bencala, 1990; Boyer et al., 1999).
Precipitation of hydrous aluminum oxides is evident in the consistent differences
in Al concentration between SAD and SBD. Decreases in aluminum concentration
occurred during the snowmelt period of late-May through mid-June when
9
increased pH values caused decreases in aluminum solubility (Fig. 3). In contrast,
Zn, which is less reactive because its solubility does not decrease in the neutral pH
range occurring below the confluence, demonstrated behavior primarily reflecting
dilution by snowmelt in the spring (Fig. 4) (Filipek et al., 1987).
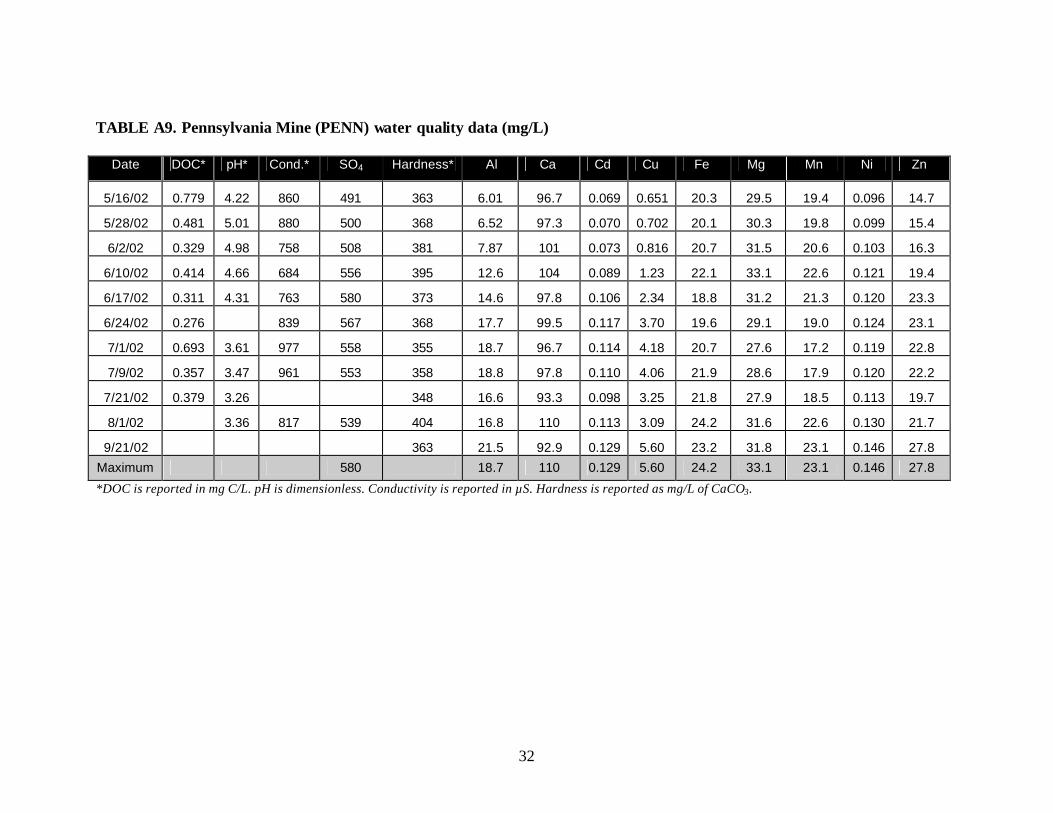
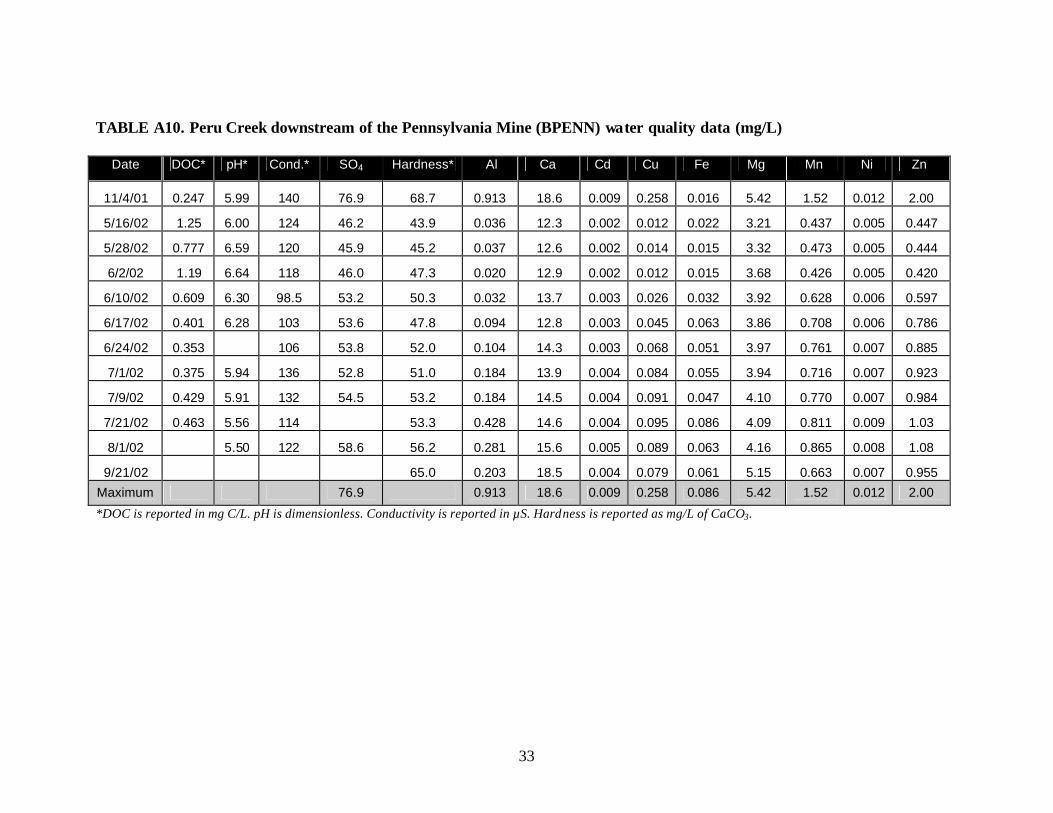
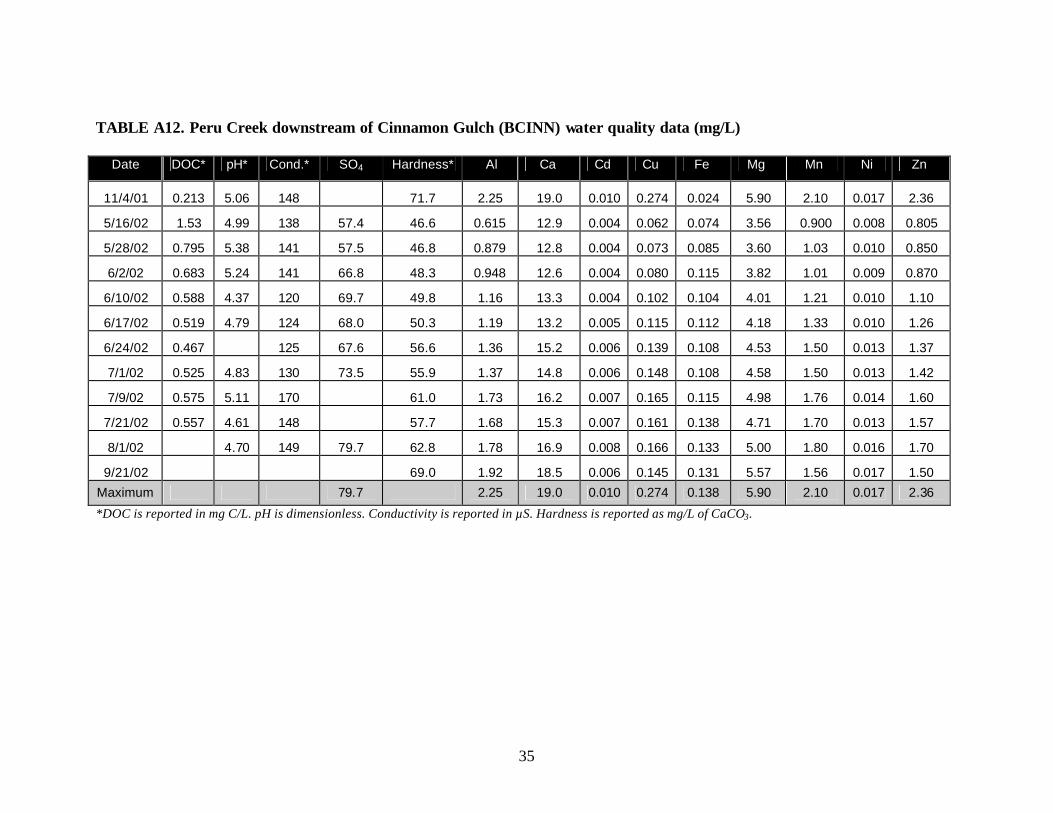
Pennsylvania Mine, Cinnamon Gulch and Peru Creek
Tables A8–A13 report water quality data for the 6 stream sampling sites
(APENN, PENN, BPENN, CINN, BCINN, and PAS) within the Peru Creek
drainage. In contrast to natural pyrite weathering in the upper Snake River basin,
the Pennsylvania Mine and other abandoned mines in this drainage have been
identified as the major sources of trace metals and acidity to the stream (McKnight
and Bencala, 1990). The year-round influx of trace metals from the Pennsylvania
Mine, and from the mine-rich Cinnamon Gulch drainage (Tables A8 and A10),
plays a dominant role in determining the downstream chemistry of Peru Creek and
Figure 3. Measured dissolved aluminum concentrations at the Deer Creek/Snake River confluence.
0.00
1.00
2.00
3.00
4.00
5.00
6.00
7.00
8.00
Nov
-01
Dec
-01
Jan-
02
Feb-
02
Mar
-02
Apr
-02
May
-02
Jun-
02
Jul-0
2
Aug
-02
Sep
-02
Date
[Al]
(mg
/L)
3
3.5
4
4.5
5
5.5
6
6.5
7
pH
DAS SAD SBD pH (SBD)
10
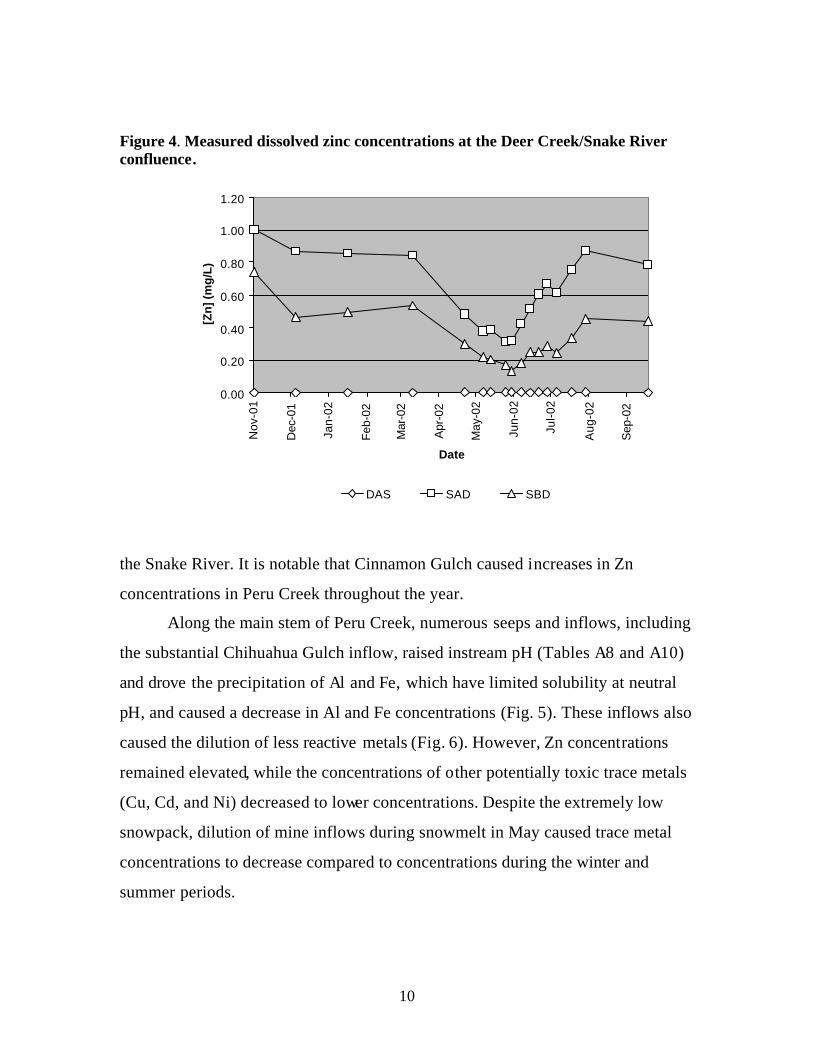
Figure 4. Measured dissolved zinc concentrations at the Deer Creek/Snake River confluence.
0.00
0.20
0.40
0.60
0.80
1.00
1.20
Nov
-01
Dec
-01
Jan-
02
Feb-
02
Mar
-02
Apr
-02
May
-02
Jun-
02
Jul-0
2
Aug
-02
Sep
-02
Date
[Zn
] (m
g/L
)
DAS SAD SBD
the Snake River. It is notable that Cinnamon Gulch caused increases in Zn
concentrations in Peru Creek throughout the year.
Along the main stem of Peru Creek, numerous seeps and inflows, including
the substantial Chihuahua Gulch inflow, raised instream pH (Tables A8 and A10)
and drove the precipitation of Al and Fe, which have limited solubility at neutral
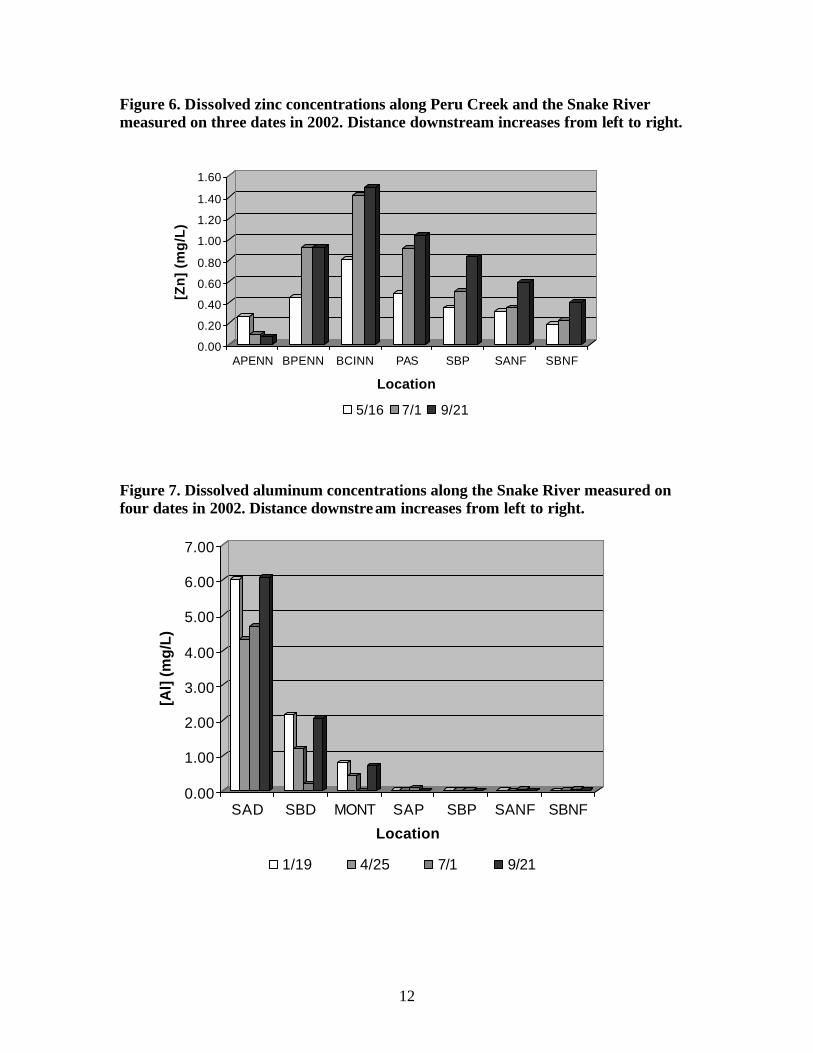
pH, and caused a decrease in Al and Fe concentrations (Fig. 5). These inflows also
caused the dilution of less reactive metals (Fig. 6). However, Zn concentrations
remained elevated, while the concentrations of other potentially toxic trace metals
(Cu, Cd, and Ni) decreased to lower concentrations. Despite the extremely low
snowpack, dilution of mine inflows during snowmelt in May caused trace metal
concentrations to decrease compared to concentrations during the winter and
summer periods.
11
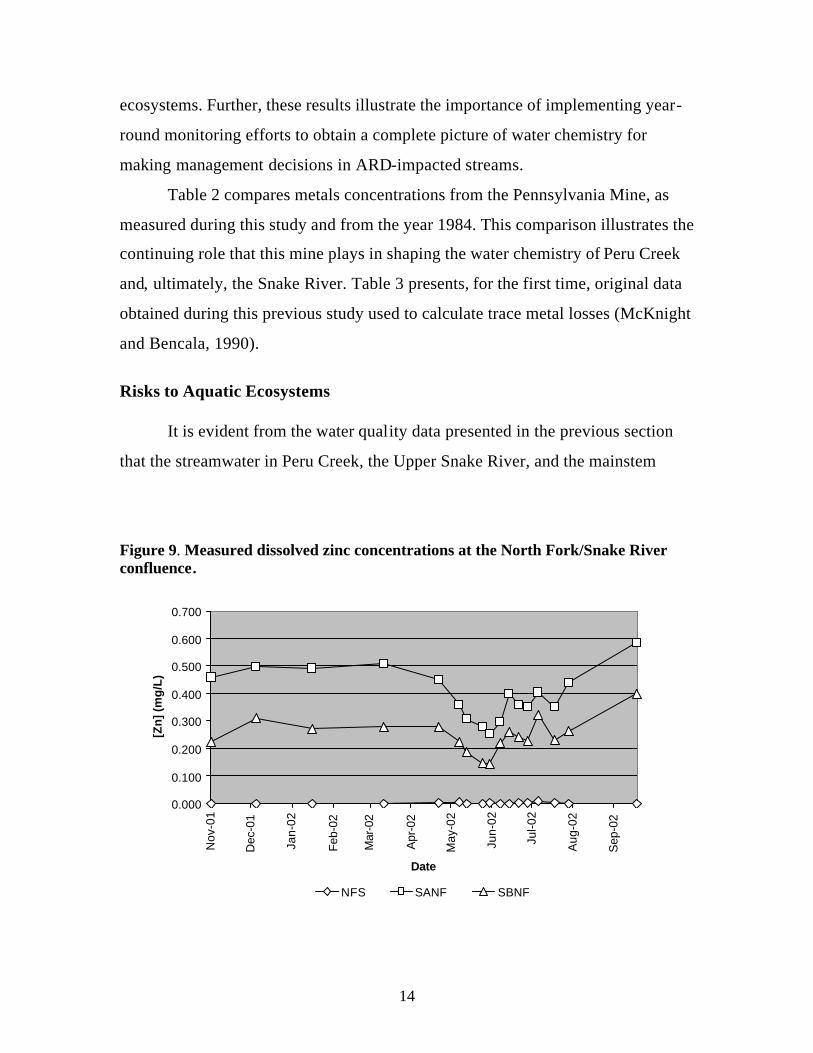
Beyond the Headwaters
Below its confluence with Peru Creek, the Snake River and the quality of
its stream water have become issues of great concern for a diverse range of local,
state, and federal interests (Todd et al., 2003). Tables A14–A17 report water
quality data for the 4 stream sampling sites (SBP, SANF, NFS, and SBNF)
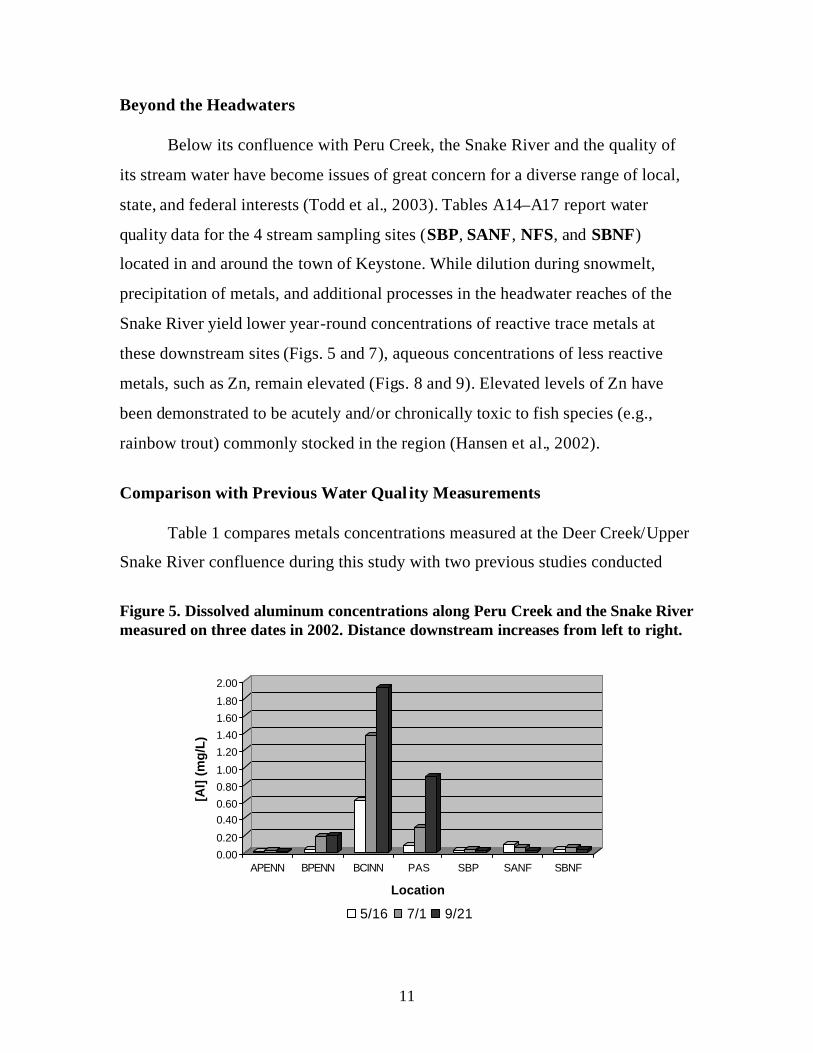
located in and around the town of Keystone. While dilution during snowmelt,
precipitation of metals, and additional processes in the headwater reaches of the
Snake River yield lower year-round concentrations of reactive trace metals at
these downstream sites (Figs. 5 and 7), aqueous concentrations of less reactive
metals, such as Zn, remain elevated (Figs. 8 and 9). Elevated levels of Zn have
been demonstrated to be acutely and/or chronically toxic to fish species (e.g.,
rainbow trout) commonly stocked in the region (Hansen et al., 2002).
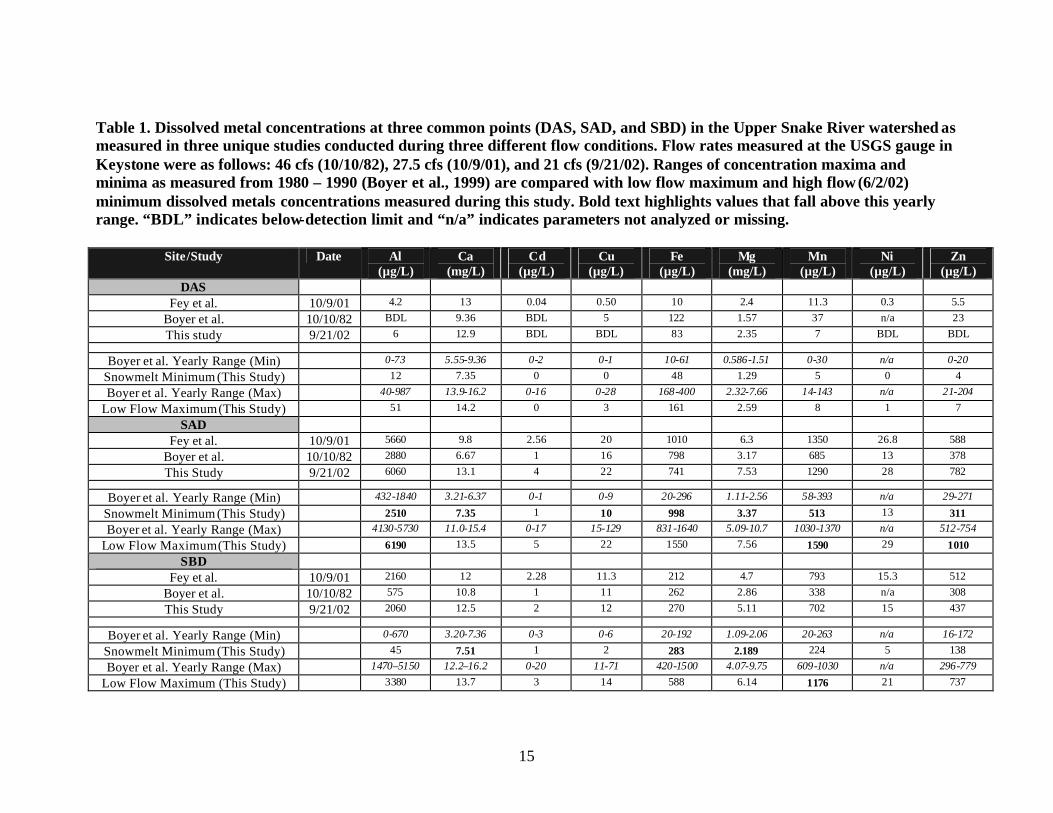
Comparison with Previous Water Qual ity Measurements
Table 1 compares metals concentrations measured at the Deer Creek/Upper
Snake River confluence during this study with two previous studies conducted
Figure 5. Dissolved aluminum concentrations along Peru Creek and the Snake River measured on three dates in 2002. Distance downstream increases from left to right.
0.00
0.20
0.400.60
0.80
1.00
1.20
1.40
1.60
1.80
2.00
[Al]
(m
g/L
)
APENN BPENN BCINN PAS SBP SANF SBNF
Location
5/16 7/1 9/21
12
Figure 6. Dissolved zinc concentrations along Peru Creek and the Snake River measured on three dates in 2002. Distance downstream increases from left to right.
0.00
0.20
0.40
0.60
0.80
1.00
1.20
1.40
1.60[Z
n]
(mg
/L)
APENN BPENN BCINN PAS SBP SANF SBNF
Location
5/16 7/1 9/21
Figure 7. Dissolved aluminum concentrations along the Snake River measured on four dates in 2002. Distance downstream increases from left to right.
0.00
1.00
2.00
3.00
4.00
5.00
6.00
7.00
[Al]
(mg
/L)
SAD SBD MONT SAP SBP SANF SBNF
Location
1/19 4/25 7/1 9/21
13
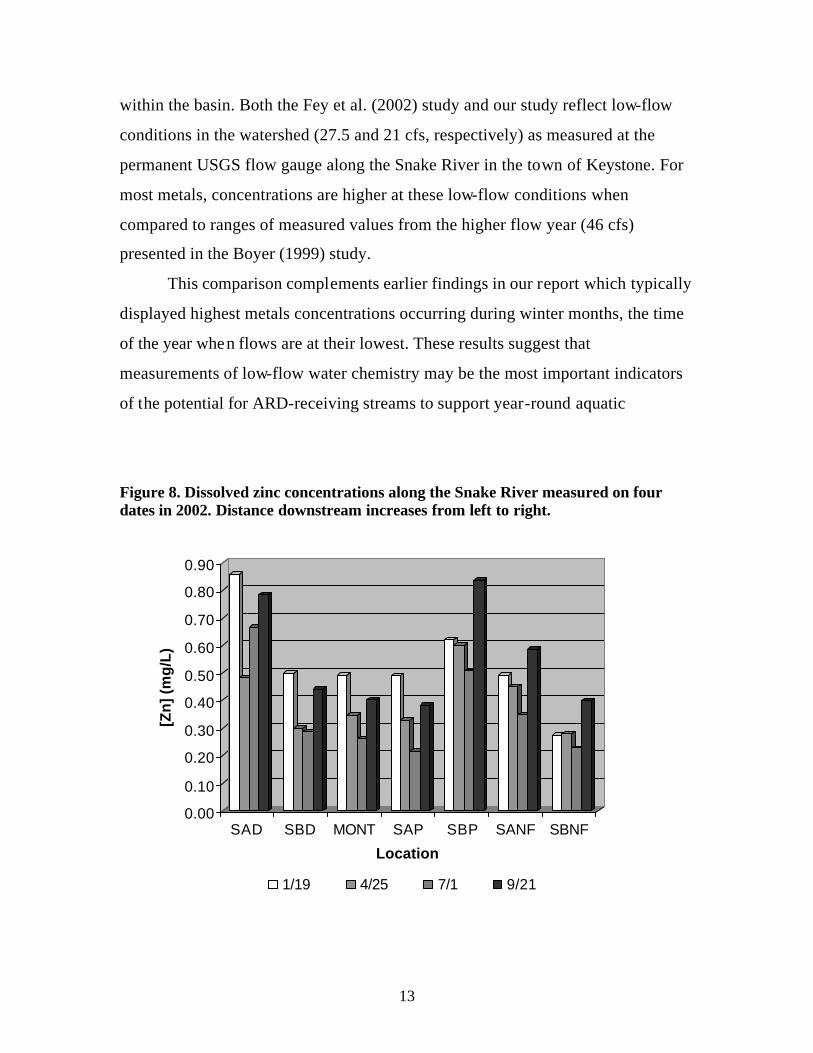
within the basin. Both the Fey et al. (2002) study and our study reflect low-flow
conditions in the watershed (27.5 and 21 cfs, respectively) as measured at the
permanent USGS flow gauge along the Snake River in the town of Keystone. For
most metals, concentrations are higher at these low-flow conditions when
compared to ranges of measured values from the higher flow year (46 cfs)
presented in the Boyer (1999) study.
This comparison complements earlier findings in our report which typically
displayed highest metals concentrations occurring during winter months, the time
of the year when flows are at their lowest. These results suggest that
measurements of low-flow water chemistry may be the most important indicators
of the potential for ARD-receiving streams to support year-round aquatic
Figure 8. Dissolved zinc concentrations along the Snake River measured on four dates in 2002. Distance downstream increases from left to right.
0.00
0.10
0.20
0.30
0.40
0.50
0.60
0.70
0.80
0.90
[Zn
] (m
g/L
)
SAD SBD MONT SAP SBP SANF SBNF
Location
1/19 4/25 7/1 9/21
14
ecosystems. Further, these results illustrate the importance of implementing year-
round monitoring efforts to obtain a complete picture of water chemistry for
making management decisions in ARD-impacted streams.
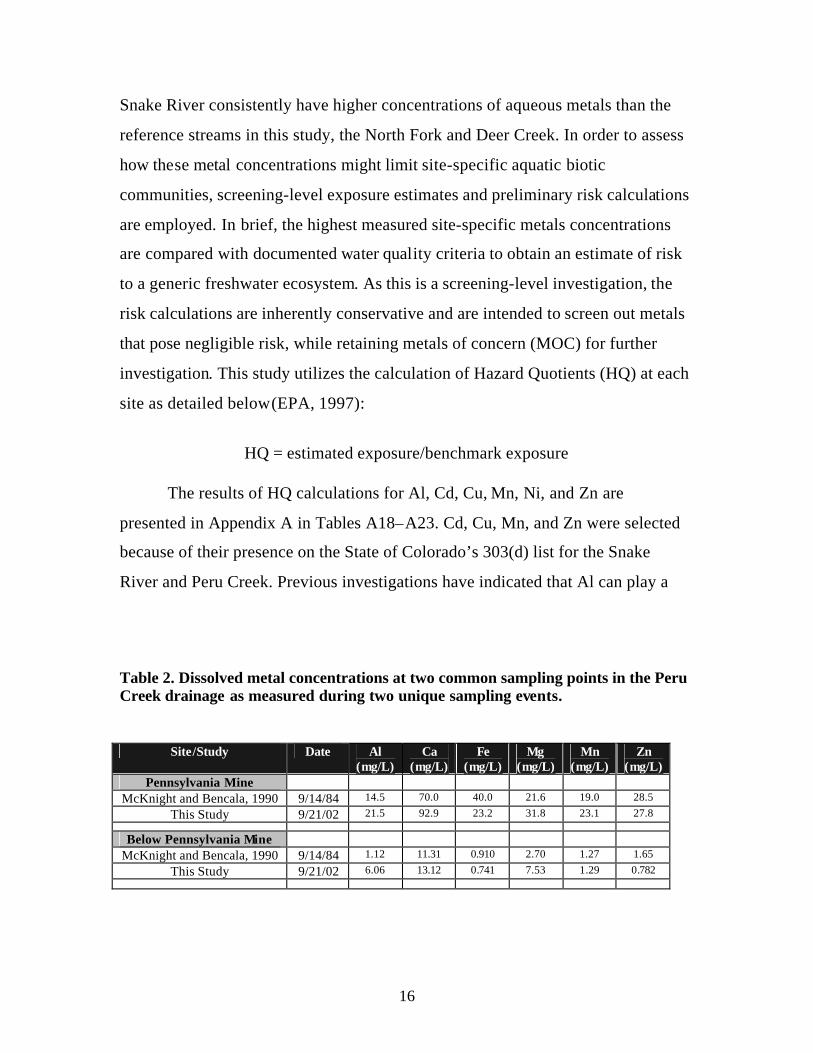
Table 2 compares metals concentrations from the Pennsylvania Mine, as
measured during this study and from the year 1984. This comparison illustrates the
continuing role that this mine plays in shaping the water chemistry of Peru Creek
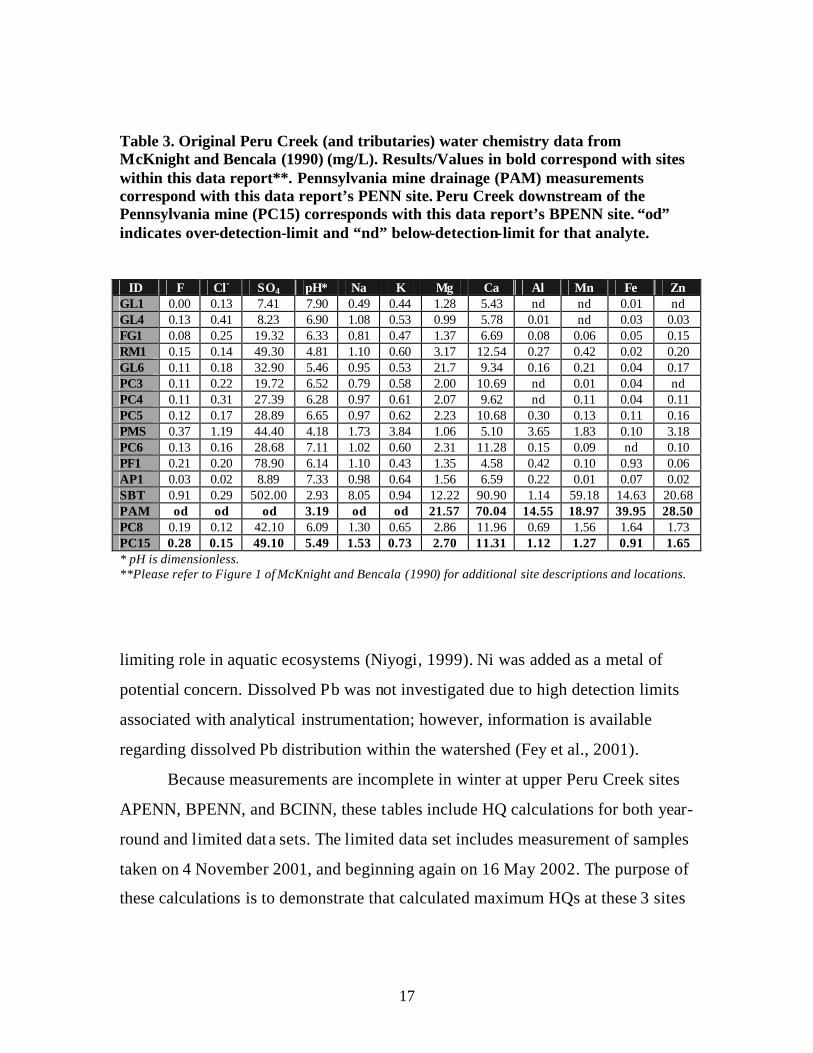
and, ultimately, the Snake River. Table 3 presents, for the first time, original data
obtained during this previous study used to calculate trace metal losses (McKnight
and Bencala, 1990).
Risks to Aquatic Ecosystems
It is evident from the water quality data presented in the previous section
that the streamwater in Peru Creek, the Upper Snake River, and the mainstem
Figure 9. Measured dissolved zinc concentrations at the North Fork/Snake River confluence.
0.000
0.100
0.200
0.300
0.400
0.500
0.600
0.700
Nov
-01
Dec
-01
Jan-
02
Feb-
02
Mar
-02
Apr
-02
May
-02
Jun-
02
Jul-0
2
Aug
-02
Sep
-02
Date
[Zn
] (m
g/L
)
NFS SANF SBNF
15
Table 1. Dissolved metal concentrations at three common points (DAS, SAD, and SBD) in the Upper Snake River watershed as measured in three unique studies conducted during three different flow conditions. Flow rates measured at the USGS gauge in Keystone were as follows: 46 cfs (10/10/82), 27.5 cfs (10/9/01), and 21 cfs (9/21/02). Ranges of concentration maxima and minima as measured from 1980 – 1990 (Boyer et al., 1999) are compared with low flow maximum and high flow (6/2/02) minimum dissolved metals concentrations measured during this study. Bold text highlights values that fall above this yearly range. “BDL” indicates below-detection limit and “n/a” indicates parameters not analyzed or missing.
Site/Study Date Al (µg/L)
Ca (mg/L)
Cd (µg/L)
Cu (µg/L)
Fe (µg/L)
Mg (mg/L)
Mn (µg/L)
Ni (µg/L)
Zn (µg/L)
DAS Fey et al. 10/9/01 4.2 13 0.04 0.50 10 2.4 11.3 0.3 5.5
Boyer et al. 10/10/82 BDL 9.36 BDL 5 122 1.57 37 n/a 23
This study 9/21/02 6 12.9 BDL BDL 83 2.35 7 BDL BDL
Boyer et al. Yearly Range (Min) 0-73 5.55-9.36 0-2 0-1 10-61 0.586-1.51 0-30 n/a 0-20
Snowmelt Minimum (This Study) 12 7.35 0 0 48 1.29 5 0 4
Boyer et al. Yearly Range (Max) 40-987 13.9-16.2 0-16 0-28 168-400 2.32-7.66 14-143 n/a 21-204
Low Flow Maximum (This Study) 51 14.2 0 3 161 2.59 8 1 7
SAD
Fey et al. 10/9/01 5660 9.8 2.56 20 1010 6.3 1350 26.8 588
Boyer et al. 10/10/82 2880 6.67 1 16 798 3.17 685 13 378
This Study 9/21/02 6060 13.1 4 22 741 7.53 1290 28 782
Boyer et al. Yearly Range (Min) 432-1840 3.21-6.37 0-1 0-9 20-296 1.11-2.56 58-393 n/a 29-271
Snowmelt Minimum (This Study) 2510 7.35 1 10 998 3.37 513 13 311
Boyer et al. Yearly Range (Max) 4130-5730 11.0-15.4 0-17 15-129 831-1640 5.09-10.7 1030-1370 n/a 512-754
Low Flow Maximum (This Study) 6190 13.5 5 22 1550 7.56 1590 29 1010
SBD
Fey et al. 10/9/01 2160 12 2.28 11.3 212 4.7 793 15.3 512
Boyer et al. 10/10/82 575 10.8 1 11 262 2.86 338 n/a 308
This Study 9/21/02 2060 12.5 2 12 270 5.11 702 15 437
Boyer et al. Yearly Range (Min) 0-670 3.20-7.36 0-3 0-6 20-192 1.09-2.06 20-263 n/a 16-172
Snowmelt Minimum (This Study) 45 7.51 1 2 283 2.189 224 5 138
Boyer et al. Yearly Range (Max) 1470–5150 12.2–16.2 0-20 11-71 420-1500 4.07-9.75 609-1030 n/a 296-779
Low Flow Maximum (This Study) 3380 13.7 3 14 588 6.14 1176 21 737
16
Snake River consistently have higher concentrations of aqueous metals than the
reference streams in this study, the North Fork and Deer Creek. In order to assess
how these metal concentrations might limit site-specific aquatic biotic
communities, screening-level exposure estimates and preliminary risk calculations
are employed. In brief, the highest measured site-specific metals concentrations
are compared with documented water quality criteria to obtain an estimate of risk
to a generic freshwater ecosystem. As this is a screening-level investigation, the
risk calculations are inherently conservative and are intended to screen out metals
that pose negligible risk, while retaining metals of concern (MOC) for further
investigation. This study utilizes the calculation of Hazard Quotients (HQ) at each
site as detailed below (EPA, 1997):
HQ = estimated exposure/benchmark exposure
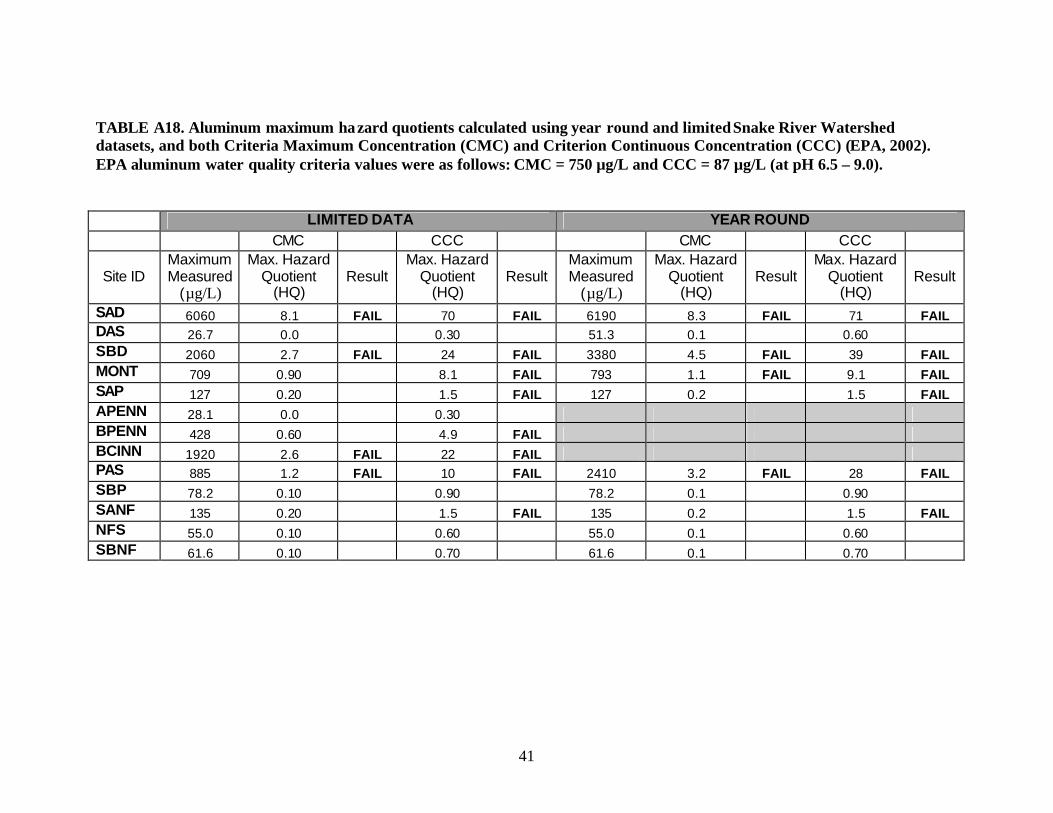
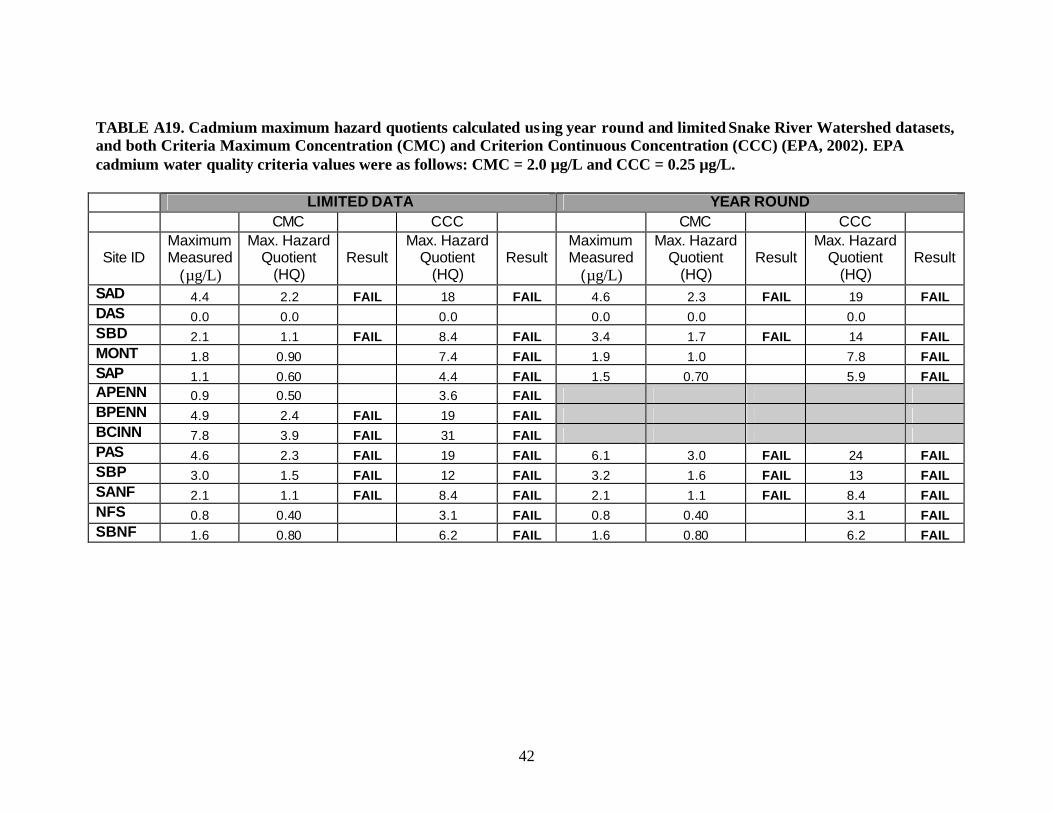
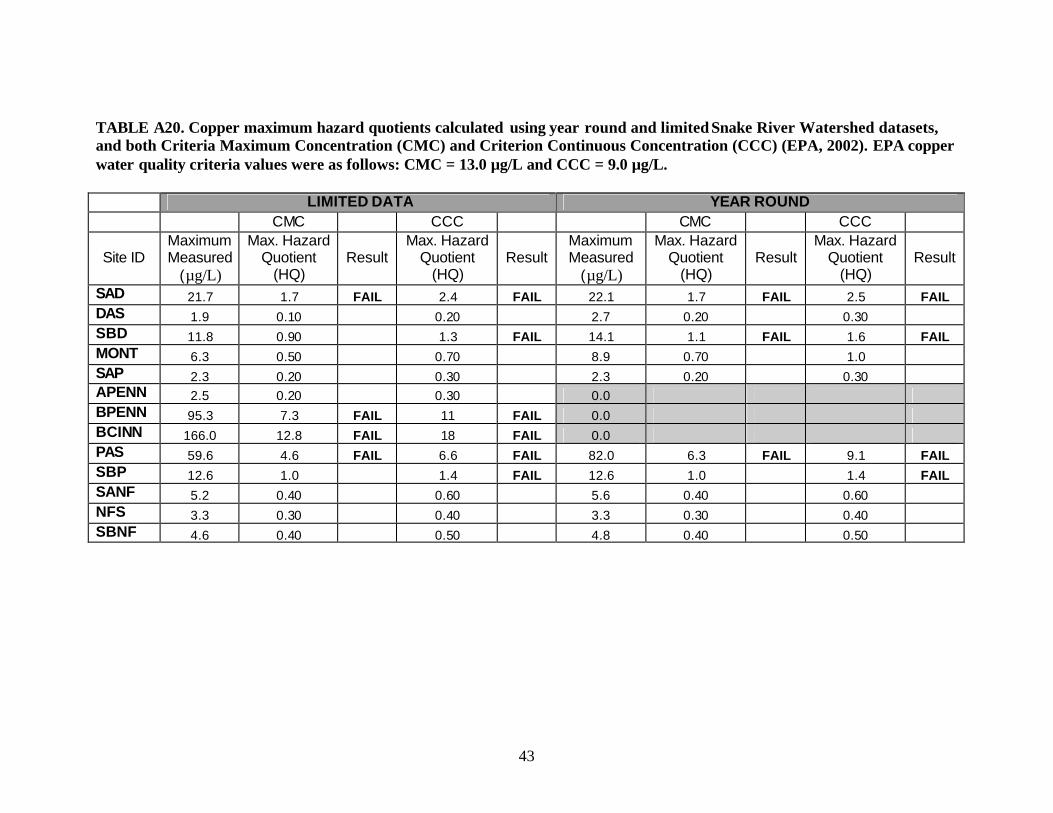
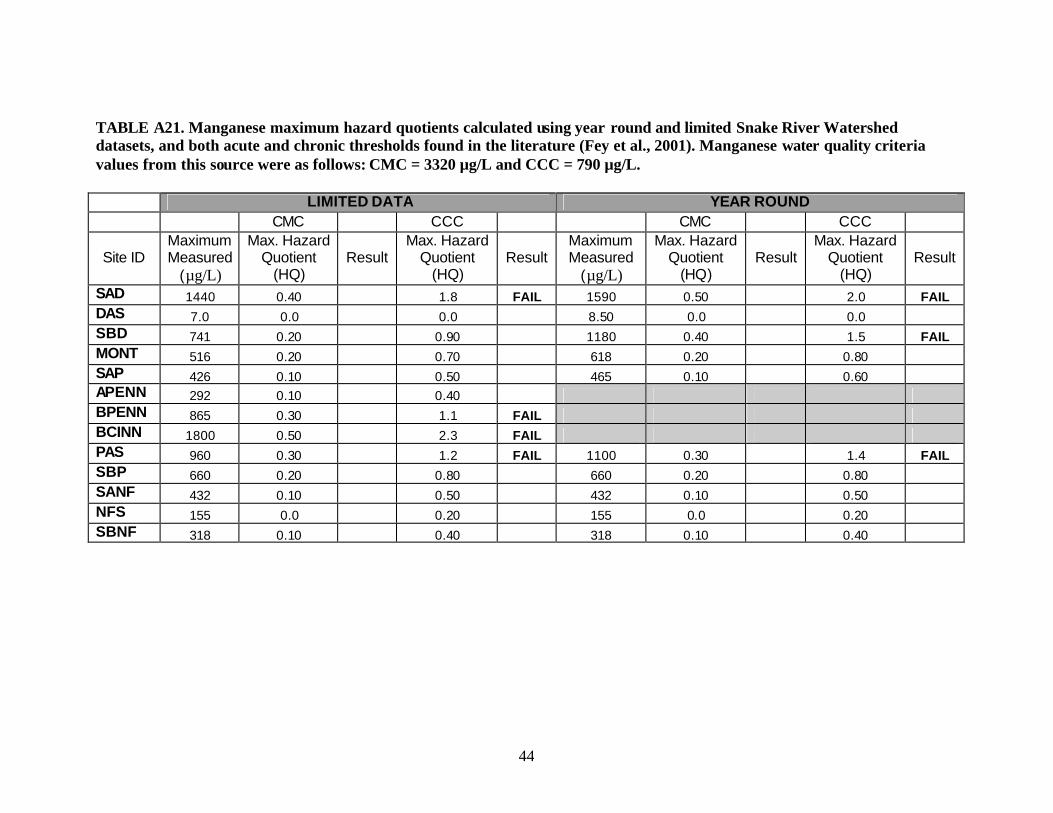
The results of HQ calculations for Al, Cd, Cu, Mn, Ni, and Zn are
presented in Appendix A in Tables A18–A23. Cd, Cu, Mn, and Zn were selected
because of their presence on the State of Colorado’s 303(d) list for the Snake
River and Peru Creek. Previous investigations have indicated that Al can play a
Table 2. Dissolved metal concentrations at two common sampling points in the Peru Creek drainage as measured during two unique sampling events.
Site/Study Date Al (mg/L)
Ca (mg/L)
Fe (mg/L)
Mg (mg/L)
Mn (mg/L)
Zn (mg/L)
Pennsylvania Mine
McKnight and Bencala, 1990 9/14/84 14.5 70.0 40.0 21.6 19.0 28.5
This Study 9/21/02 21.5 92.9 23.2 31.8 23.1 27.8
Below Pennsylvania Mine
McKnight and Bencala, 1990 9/14/84 1.12 11.31 0.910 2.70 1.27 1.65
This Study 9/21/02 6.06 13.12 0.741 7.53 1.29 0.782
17
Table 3. Original Peru Creek (and tributaries) water chemistry data from McKnight and Bencala (1990) (mg/L). Results/Values in bold correspond with sites within this data report**. Pennsylvania mine drainage (PAM) measurements correspond with this data report’s PENN site. Peru Creek downstream of the Pennsylvania mine (PC15) corresponds with this data report’s BPENN site. “od” indicates over-detection-limit and “nd” below-detection-limit for that analyte.
ID F Cl- SO4 pH* Na K Mg Ca Al Mn Fe Zn
GL1 0.00 0.13 7.41 7.90 0.49 0.44 1.28 5.43 nd nd 0.01 nd GL4 0.13 0.41 8.23 6.90 1.08 0.53 0.99 5.78 0.01 nd 0.03 0.03 FG1 0.08 0.25 19.32 6.33 0.81 0.47 1.37 6.69 0.08 0.06 0.05 0.15 RM1 0.15 0.14 49.30 4.81 1.10 0.60 3.17 12.54 0.27 0.42 0.02 0.20 GL6 0.11 0.18 32.90 5.46 0.95 0.53 21.7 9.34 0.16 0.21 0.04 0.17 PC3 0.11 0.22 19.72 6.52 0.79 0.58 2.00 10.69 nd 0.01 0.04 nd PC4 0.11 0.31 27.39 6.28 0.97 0.61 2.07 9.62 nd 0.11 0.04 0.11 PC5 0.12 0.17 28.89 6.65 0.97 0.62 2.23 10.68 0.30 0.13 0.11 0.16 PMS 0.37 1.19 44.40 4.18 1.73 3.84 1.06 5.10 3.65 1.83 0.10 3.18 PC6 0.13 0.16 28.68 7.11 1.02 0.60 2.31 11.28 0.15 0.09 nd 0.10 PF1 0.21 0.20 78.90 6.14 1.10 0.43 1.35 4.58 0.42 0.10 0.93 0.06 AP1 0.03 0.02 8.89 7.33 0.98 0.64 1.56 6.59 0.22 0.01 0.07 0.02 SBT 0.91 0.29 502.00 2.93 8.05 0.94 12.22 90.90 1.14 59.18 14.63 20.68 PAM od od od 3.19 od od 21.57 70.04 14.55 18.97 39.95 28.50 PC8 0.19 0.12 42.10 6.09 1.30 0.65 2.86 11.96 0.69 1.56 1.64 1.73 PC15 0.28 0.15 49.10 5.49 1.53 0.73 2.70 11.31 1.12 1.27 0.91 1.65 * pH is dimensionless. **Please refer to Figure 1 of McKnight and Bencala (1990) for additional site descriptions and locations.
limiting role in aquatic ecosystems (Niyogi, 1999). Ni was added as a metal of
potential concern. Dissolved Pb was not investigated due to high detection limits
associated with analytical instrumentation; however, information is available
regarding dissolved Pb distribution within the watershed (Fey et al., 2001).
Because measurements are incomplete in winter at upper Peru Creek sites
APENN, BPENN, and BCINN, these tables include HQ calculations for both year-
round and limited data sets. The limited data set includes measurement of samples
taken on 4 November 2001, and beginning again on 16 May 2002. The purpose of
these calculations is to demonstrate that calculated maximum HQs at these 3 sites
18
are likely artificially low, as winter-time aqueous metals concentrations are often
higher than summertime levels.
Summary information of risk estimates to both acute and chronic aqueous
metal exposure is presented in Tables 4 and 5. Each tables is divided into three
sections; the first represents Upper Snake River sites, the second represents Peru
Creek sites, and the third represents Lower Snake River sites downstream of the
confluence with Peru Creek.
CONCLUSIONS
This occasional paper presents data collected during a year-long sampling
effort in the Snake River watershed, and we have described our findings on trends
in the data set. The following conclusions were made during this investigation.
Pennsylvania Mine and Cinnamon Gulch Are Major Sources of Trace Metals in Peru Creek
The data collected during our study show that drainage from both the
Pennsylvania Mine and the Cinnamon Gulch catchment drastically change the
downstream water chemistry of Peru Creek. There are many other mines within
the Peru Creek watershed, but it is evident that these two measured inflows to Peru
Creek are major anthropogenic sources of trace metals.
Instream Precipitation of Metal Oxides Is a Dominant Process
Water chemistry data from key confluences in this study illustrate the
important role that precipitation of metal oxides plays in determining downstream
water chemistry. Toxic levels of dissolved Al in low pH, ARD inflows are
dramatically reduced on merging with higher pH receiving streams. In contrast,
due to differences in pH-dependent solubility, high levels of Zn and Cd are only
diluted downstream of these confluences.
19
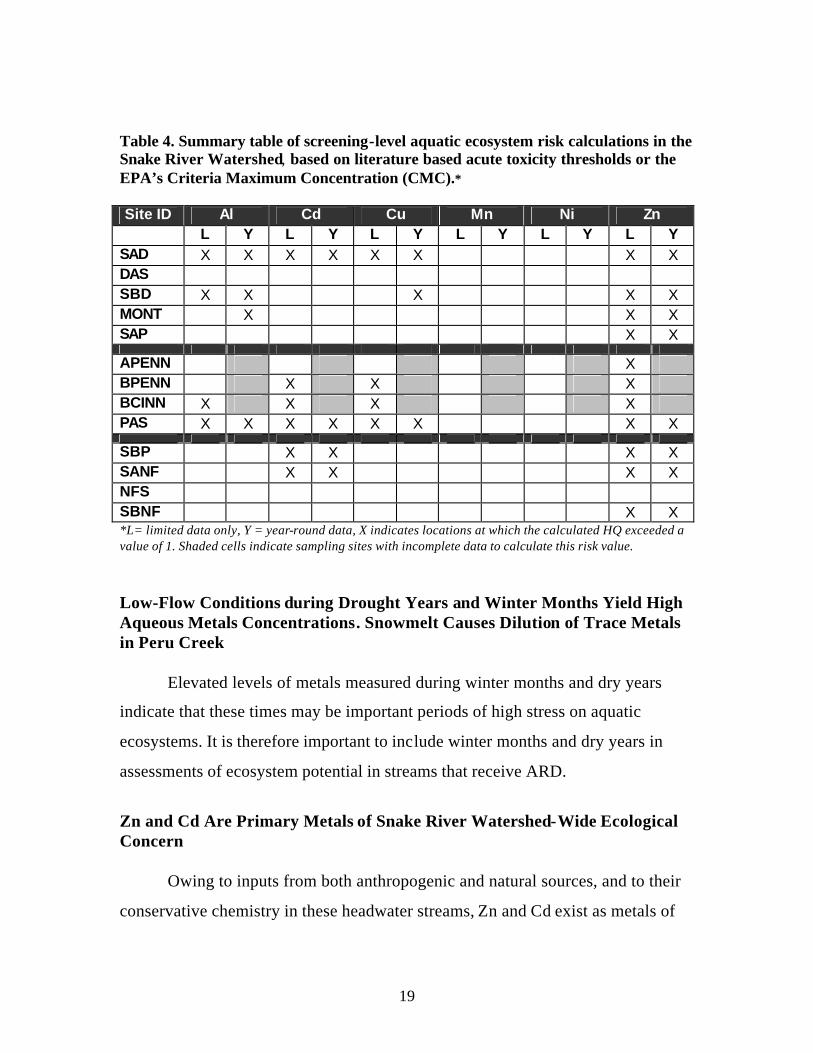
Table 4. Summary table of screening-level aquatic ecosystem risk calculations in the Snake River Watershed, based on literature based acute toxicity thresholds or the EPA’s Criteria Maximum Concentration (CMC).*
Site ID Al Cd Cu Mn Ni Zn
L Y L Y L Y L Y L Y L Y SAD X X X X X X X X DAS SBD X X X X X MONT X X X SAP X X APENN X BPENN X X X BCINN X X X X PAS X X X X X X X X SBP X X X X SANF X X X X NFS SBNF X X *L= limited data only, Y = year-round data, X indicates locations at which the calculated HQ exceeded a value of 1. Shaded cells indicate sampling sites with incomplete data to calculate this risk value. Low-Flow Conditions during Drought Years and Winter Months Yield High Aqueous Metals Concentrations. Snowmelt Causes Dilution of Trace Metals in Peru Creek
Elevated levels of metals measured during winter months and dry years
indicate that these times may be important periods of high stress on aquatic
ecosystems. It is therefore important to include winter months and dry years in
assessments of ecosystem potential in streams that receive ARD.
Zn and Cd Are Primary Metals of Snake River Watershed-Wide Ecological Concern
Owing to inputs from both anthropogenic and natural sources, and to their
conservative chemistry in these headwater streams, Zn and Cd exist as metals of
20
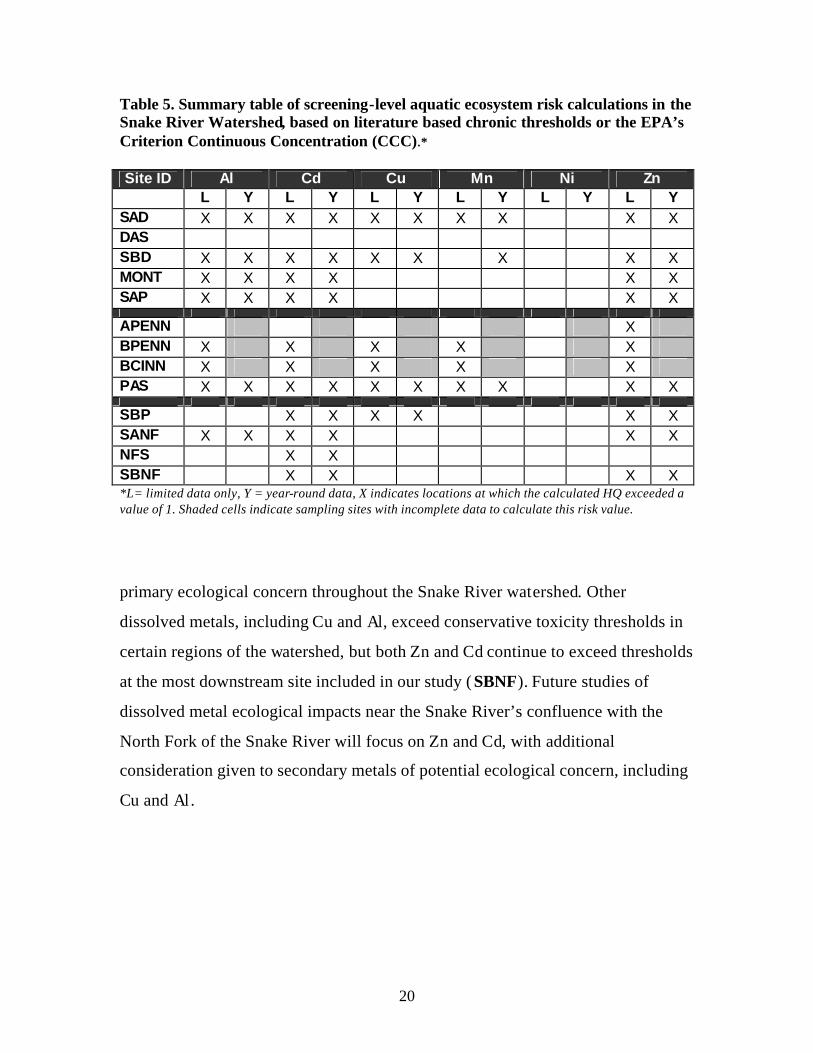
Table 5. Summary table of screening-level aquatic ecosystem risk calculations in the Snake River Watershed, based on literature based chronic thresholds or the EPA’s Criterion Continuous Concentration (CCC).*
Site ID Al Cd Cu Mn Ni Zn
L Y L Y L Y L Y L Y L Y SAD X X X X X X X X X X DAS SBD X X X X X X X X X MONT X X X X X X SAP X X X X X X APENN X BPENN X X X X X BCINN X X X X X PAS X X X X X X X X X X SBP X X X X X X SANF X X X X X X NFS X X SBNF X X X X *L= limited data only, Y = year-round data, X indicates locations at which the calculated HQ exceeded a value of 1. Shaded cells indicate sampling sites with incomplete data to calculate this risk value. primary ecological concern throughout the Snake River watershed. Other
dissolved metals, including Cu and Al, exceed conservative toxicity thresholds in
certain regions of the watershed, but both Zn and Cd continue to exceed thresholds
at the most downstream site included in our study ( SBNF). Future studies of
dissolved metal ecological impacts near the Snake River’s confluence with the
North Fork of the Snake River will focus on Zn and Cd, with additional
consideration given to secondary metals of potential ecological concern, including
Cu and Al.
21
REFERENCES CITED Bencala, K. E., McKnight, D. M., and Zellweger, G. W., 1987: Evaluation of na tural
tracers in an acidic and metal-rich stream. Water Resources Research, 23: 827–836.
Boyer, E. W., 1999: Streamflow and Water-quality Characteristics for the Upper Snake River and Deer Creek Catchments in Summit County, Colorado: Water Years 1980 to 1990. Institute of Arctic and Alpine Research Occasional Paper No. 53, 81 pp.
Brooks, P. D., McKnight, D. M., et al., 2001: Annual maxima in Zn concentrations during spring snowmelt in streams impacted by mine drainage. Environmental Geology, 40(11–12): 1447–1454.
Fey, D. L., Church, S. E., Unruh, D. M., and Bove, D. J., 2001: Water and Sediment Study of the Snake River Watershed, Colorado, Oct. 9–12, 2001. U.S. Geological Survey Open-File Report 02-0330, 41 pp.
Filipek, L. H., Nordstrom, D. K., et al., 1987: Interaction of acid-mine drainage with waters and sediments of West Squaw Creek in the West Shasta Mining District, California. Environmental Science & Technology, 21(4): 388–396.
Hansen, J. A., Welsh, P. G., et al., 2002: Relative sensitivity of bull trout (Salvelinus confluentus) and rainbow trout (Oncorhynchus mykiss) to acute exposures of cadmium and zinc. Environmental Toxicology and Chemistry, 21(1): 67–75.
McKee, T. B., et al., 2000: A History of Drought in Colorado. Fort Collins, Colorado, Colorado Water Resources Research Institute.
McKnight, D. M., and Bencala, K. E., 1990: The chemistry of iron, aluminum, and dissolved organic material in 3 acidic, metal-enriched, mountain streams, as controlled by watershed and in-stream processes. Water Resources Research, 26(12): 3087–3100.
McKnight, D. M., Bencala, K. E., et al., 1992: Sorption of dissolved organic-carbon by hydrous aluminum and iron-oxides occurring at the confluence of Deer Creek with the Snake River, Summit County, Colorado. Environmental Science & Technology, 26(7): 1388–1396.
McKnight, D. M., and Feder, G. L., 1984: The ecological effect of acid conditions and precipitation of hydrous metal-oxides in a Rocky-Mountain stream. Hydrobiologia, 119(2): 129–138.
Mineral Policy Center, 1997: Golden Dreams, Poisoned Streams. Washington, D.C.
Niyogi, D. K., 1999: Effects of stress from mine drainage on ecosystem functions in Rocky Mountain streams. Ph.D. dissertation. Boulder, University of Colorado, 181 pp.
Theobald, P. K., Lakin, H. W., and Hawkins, D. B., 1963: The precipitation of aluminum, iron, and manganese at the junction of Deer Creek with the Snake River in Summit County, Colorado. Geochimica et Cosmochimica Acta, 27(2): 121-132.
22
Todd, A. S., McKnight, D. M, and Wyatt, L., 2003: Abandoned mines, mountain sports, and climate variability: implications for the Colorado tourism economy. Eos, 84(38): 377, 386.
U.S. Environmental Protection Agency, 1997: Ecological Risk Assessment for Superfund: Process for Designing and Conducting Ecological Risk Assessments. U.S. Environmental Protection Agency, EPA-540-R-97-006.
U.S. Environmental Protection Agency, 2002: National Recommended Water Quality Criteria: 2002. U.S. Environmental Protection Agency, EPA-822-R-02-047.

23
APPENDIX A: Tables

24
25
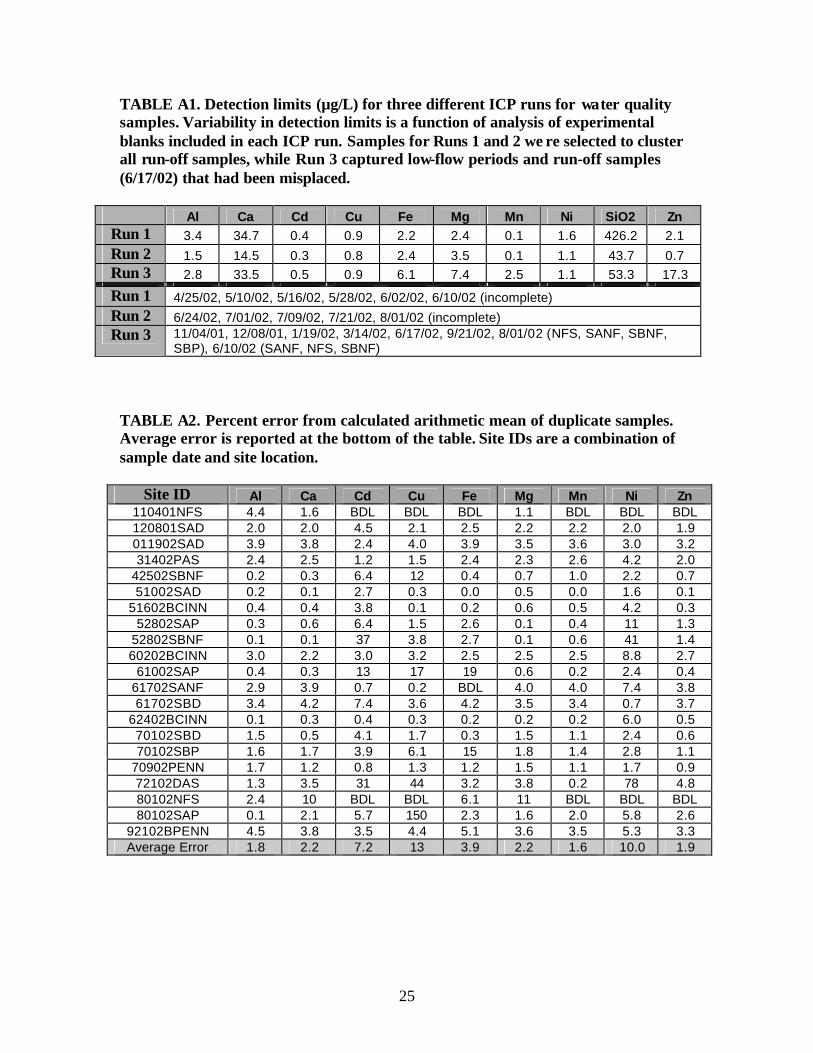
TABLE A1. Detection limits (µg/L) for three different ICP runs for water quality samples. Variability in detection limits is a function of analysis of experimental blanks included in each ICP run. Samples for Runs 1 and 2 we re selected to cluster all run-off samples, while Run 3 captured low-flow periods and run-off samples (6/17/02) that had been misplaced.
Al Ca Cd Cu Fe Mg Mn Ni SiO2 Zn Run 1 3.4 34.7 0.4 0.9 2.2 2.4 0.1 1.6 426.2 2.1 Run 2 1.5 14.5 0.3 0.8 2.4 3.5 0.1 1.1 43.7 0.7 Run 3 2.8 33.5 0.5 0.9 6.1 7.4 2.5 1.1 53.3 17.3
Run 1 4/25/02, 5/10/02, 5/16/02, 5/28/02, 6/02/02, 6/10/02 (incomplete) Run 2 6/24/02, 7/01/02, 7/09/02, 7/21/02, 8/01/02 (incomplete) Run 3 11/04/01, 12/08/01, 1/19/02, 3/14/02, 6/17/02, 9/21/02, 8/01/02 (NFS, SANF, SBNF,
SBP), 6/10/02 (SANF, NFS, SBNF) TABLE A2. Percent error from calculated arithmetic mean of duplicate samples. Average error is reported at the bottom of the table. Site IDs are a combination of sample date and site location.
Site ID Al Ca Cd Cu Fe Mg Mn Ni Zn 110401NFS 4.4 1.6 BDL BDL BDL 1.1 BDL BDL BDL 120801SAD 2.0 2.0 4.5 2.1 2.5 2.2 2.2 2.0 1.9 011902SAD 3.9 3.8 2.4 4.0 3.9 3.5 3.6 3.0 3.2 31402PAS 2.4 2.5 1.2 1.5 2.4 2.3 2.6 4.2 2.0
42502SBNF 0.2 0.3 6.4 12 0.4 0.7 1.0 2.2 0.7 51002SAD 0.2 0.1 2.7 0.3 0.0 0.5 0.0 1.6 0.1
51602BCINN 0.4 0.4 3.8 0.1 0.2 0.6 0.5 4.2 0.3 52802SAP 0.3 0.6 6.4 1.5 2.6 0.1 0.4 11 1.3
52802SBNF 0.1 0.1 37 3.8 2.7 0.1 0.6 41 1.4 60202BCINN 3.0 2.2 3.0 3.2 2.5 2.5 2.5 8.8 2.7
61002SAP 0.4 0.3 13 17 19 0.6 0.2 2.4 0.4 61702SANF 2.9 3.9 0.7 0.2 BDL 4.0 4.0 7.4 3.8 61702SBD 3.4 4.2 7.4 3.6 4.2 3.5 3.4 0.7 3.7
62402BCINN 0.1 0.3 0.4 0.3 0.2 0.2 0.2 6.0 0.5 70102SBD 1.5 0.5 4.1 1.7 0.3 1.5 1.1 2.4 0.6 70102SBP 1.6 1.7 3.9 6.1 15 1.8 1.4 2.8 1.1
70902PENN 1.7 1.2 0.8 1.3 1.2 1.5 1.1 1.7 0.9 72102DAS 1.3 3.5 31 44 3.2 3.8 0.2 78 4.8 80102NFS 2.4 10 BDL BDL 6.1 11 BDL BDL BDL 80102SAP 0.1 2.1 5.7 150 2.3 1.6 2.0 5.8 2.6
92102BPENN 4.5 3.8 3.5 4.4 5.1 3.6 3.5 5.3 3.3 Average Error 1.8 2.2 7.2 13 3.9 2.2 1.6 10.0 1.9
26
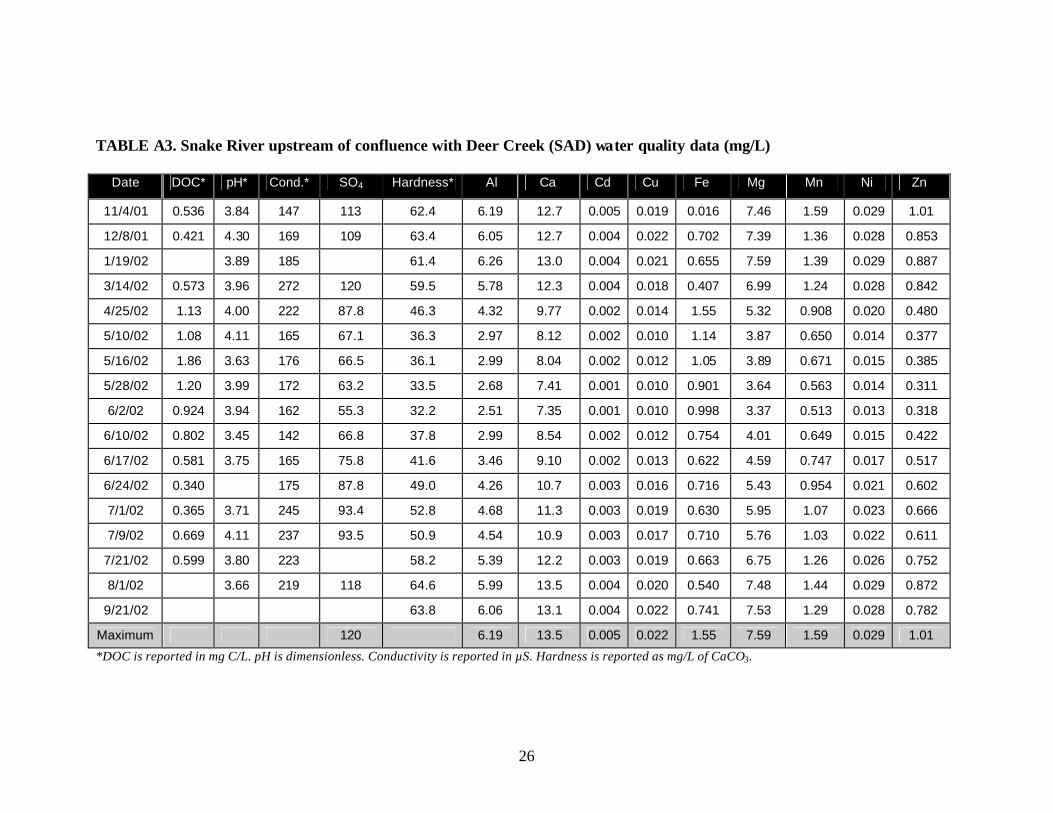
TABLE A3. Snake River upstream of confluence with Deer Creek (SAD) water quality data (mg/L)
Date DOC* pH* Cond.* SO4 Hardness* Al Ca Cd Cu Fe Mg Mn Ni Zn
11/4/01 0.536 3.84 147 113 62.4 6.19 12.7 0.005 0.019 0.016 7.46 1.59 0.029 1.01
12/8/01 0.421 4.30 169 109 63.4 6.05 12.7 0.004 0.022 0.702 7.39 1.36 0.028 0.853
1/19/02 3.89 185 61.4 6.26 13.0 0.004 0.021 0.655 7.59 1.39 0.029 0.887
3/14/02 0.573 3.96 272 120 59.5 5.78 12.3 0.004 0.018 0.407 6.99 1.24 0.028 0.842
4/25/02 1.13 4.00 222 87.8 46.3 4.32 9.77 0.002 0.014 1.55 5.32 0.908 0.020 0.480
5/10/02 1.08 4.11 165 67.1 36.3 2.97 8.12 0.002 0.010 1.14 3.87 0.650 0.014 0.377
5/16/02 1.86 3.63 176 66.5 36.1 2.99 8.04 0.002 0.012 1.05 3.89 0.671 0.015 0.385
5/28/02 1.20 3.99 172 63.2 33.5 2.68 7.41 0.001 0.010 0.901 3.64 0.563 0.014 0.311
6/2/02 0.924 3.94 162 55.3 32.2 2.51 7.35 0.001 0.010 0.998 3.37 0.513 0.013 0.318
6/10/02 0.802 3.45 142 66.8 37.8 2.99 8.54 0.002 0.012 0.754 4.01 0.649 0.015 0.422
6/17/02 0.581 3.75 165 75.8 41.6 3.46 9.10 0.002 0.013 0.622 4.59 0.747 0.017 0.517
6/24/02 0.340 175 87.8 49.0 4.26 10.7 0.003 0.016 0.716 5.43 0.954 0.021 0.602
7/1/02 0.365 3.71 245 93.4 52.8 4.68 11.3 0.003 0.019 0.630 5.95 1.07 0.023 0.666
7/9/02 0.669 4.11 237 93.5 50.9 4.54 10.9 0.003 0.017 0.710 5.76 1.03 0.022 0.611
7/21/02 0.599 3.80 223 58.2 5.39 12.2 0.003 0.019 0.663 6.75 1.26 0.026 0.752
8/1/02 3.66 219 118 64.6 5.99 13.5 0.004 0.020 0.540 7.48 1.44 0.029 0.872
9/21/02 63.8 6.06 13.1 0.004 0.022 0.741 7.53 1.29 0.028 0.782
Maximum 120 6.19 13.5 0.005 0.022 1.55 7.59 1.59 0.029 1.01
*DOC is reported in mg C/L. pH is dimensionless. Conductivity is reported in µS. Hardness is reported as mg/L of CaCO3.
27
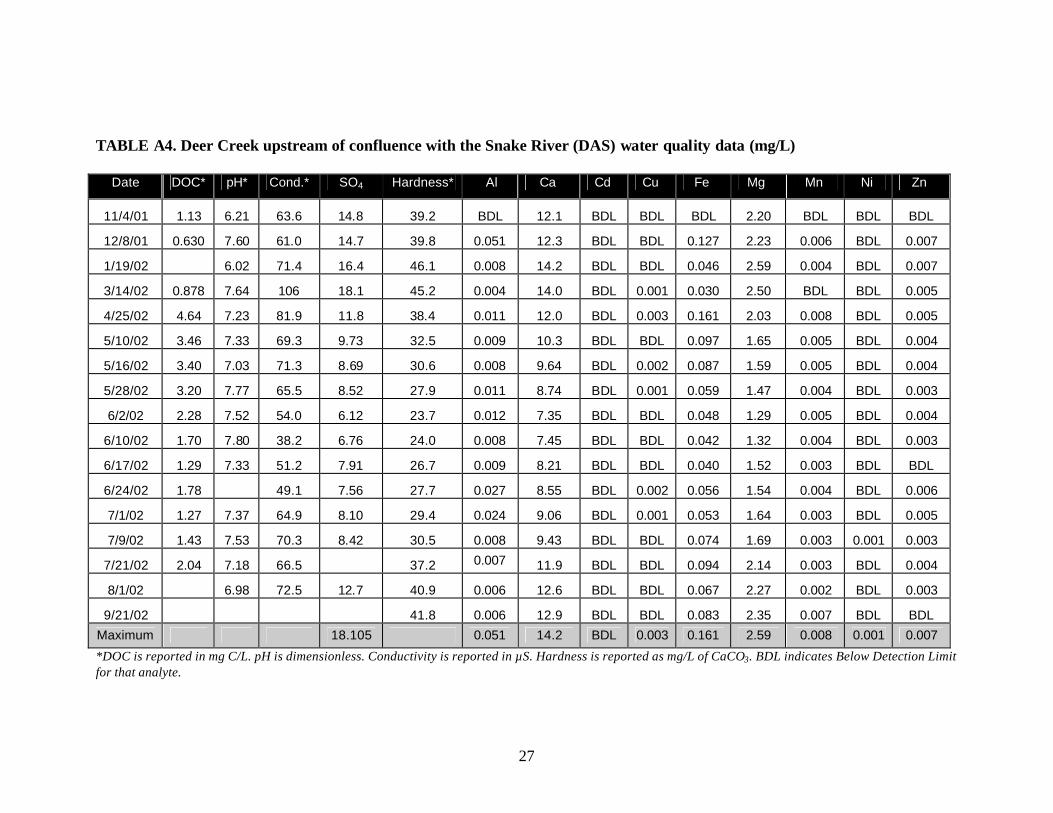
TABLE A4. Deer Creek upstream of confluence with the Snake River (DAS) water quality data (mg/L)
Date DOC* pH* Cond.* SO4 Hardness* Al Ca Cd Cu Fe Mg Mn Ni Zn
11/4/01 1.13 6.21 63.6 14.8 39.2 BDL 12.1 BDL BDL BDL 2.20 BDL BDL BDL
12/8/01 0.630 7.60 61.0 14.7 39.8 0.051 12.3 BDL BDL 0.127 2.23 0.006 BDL 0.007
1/19/02 6.02 71.4 16.4 46.1 0.008 14.2 BDL BDL 0.046 2.59 0.004 BDL 0.007
3/14/02 0.878 7.64 106 18.1 45.2 0.004 14.0 BDL 0.001 0.030 2.50 BDL BDL 0.005
4/25/02 4.64 7.23 81.9 11.8 38.4 0.011 12.0 BDL 0.003 0.161 2.03 0.008 BDL 0.005
5/10/02 3.46 7.33 69.3 9.73 32.5 0.009 10.3 BDL BDL 0.097 1.65 0.005 BDL 0.004
5/16/02 3.40 7.03 71.3 8.69 30.6 0.008 9.64 BDL 0.002 0.087 1.59 0.005 BDL 0.004
5/28/02 3.20 7.77 65.5 8.52 27.9 0.011 8.74 BDL 0.001 0.059 1.47 0.004 BDL 0.003
6/2/02 2.28 7.52 54.0 6.12 23.7 0.012 7.35 BDL BDL 0.048 1.29 0.005 BDL 0.004
6/10/02 1.70 7.80 38.2 6.76 24.0 0.008 7.45 BDL BDL 0.042 1.32 0.004 BDL 0.003
6/17/02 1.29 7.33 51.2 7.91 26.7 0.009 8.21 BDL BDL 0.040 1.52 0.003 BDL BDL
6/24/02 1.78 49.1 7.56 27.7 0.027 8.55 BDL 0.002 0.056 1.54 0.004 BDL 0.006
7/1/02 1.27 7.37 64.9 8.10 29.4 0.024 9.06 BDL 0.001 0.053 1.64 0.003 BDL 0.005
7/9/02 1.43 7.53 70.3 8.42 30.5 0.008 9.43 BDL BDL 0.074 1.69 0.003 0.001 0.003
7/21/02 2.04 7.18 66.5 37.2 0.007 11.9 BDL BDL 0.094 2.14 0.003 BDL 0.004
8/1/02 6.98 72.5 12.7 40.9 0.006 12.6 BDL BDL 0.067 2.27 0.002 BDL 0.003
9/21/02 41.8 0.006 12.9 BDL BDL 0.083 2.35 0.007 BDL BDL
Maximum 18.105 0.051 14.2 BDL 0.003 0.161 2.59 0.008 0.001 0.007
*DOC is reported in mg C/L. pH is dimensionless. Conductivity is reported in µS. Hardness is reported as mg/L of CaCO3. BDL indicates Below Detection Limit for that analyte.
28
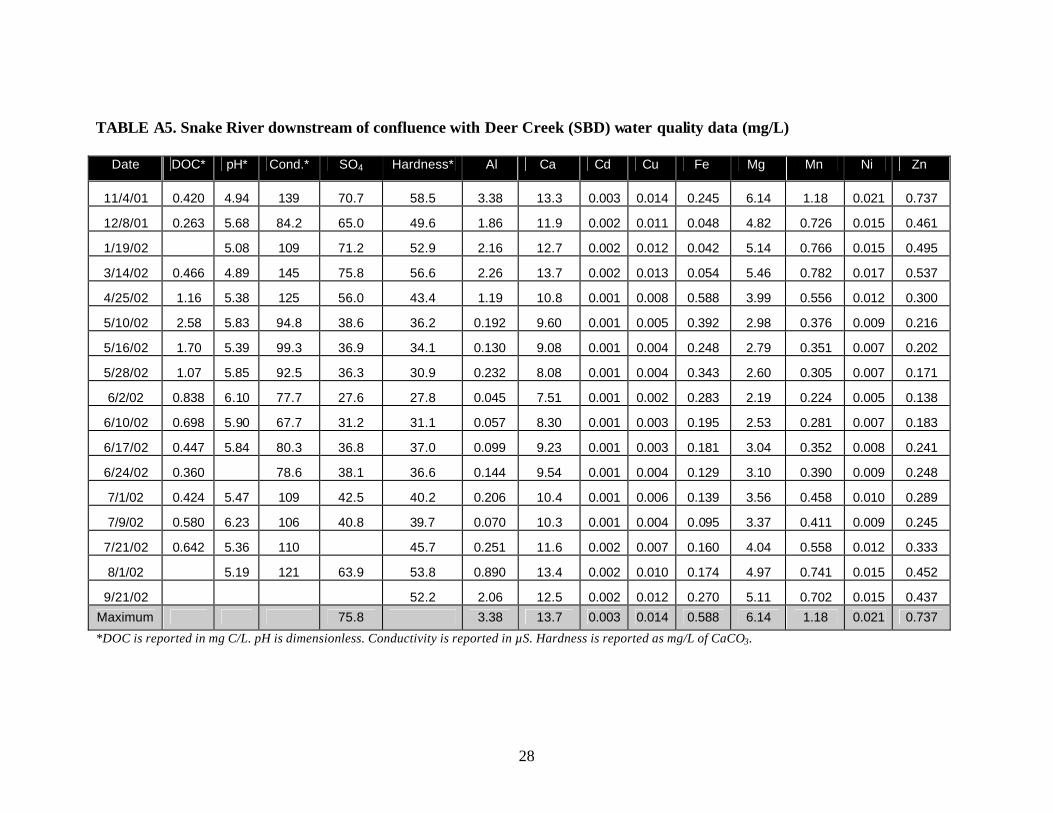
TABLE A5. Snake River downstream of confluence with Deer Creek (SBD) water quality data (mg/L)
Date DOC* pH* Cond.* SO4 Hardness* Al Ca Cd Cu Fe Mg Mn Ni Zn
11/4/01 0.420 4.94 139 70.7 58.5 3.38 13.3 0.003 0.014 0.245 6.14 1.18 0.021 0.737
12/8/01 0.263 5.68 84.2 65.0 49.6 1.86 11.9 0.002 0.011 0.048 4.82 0.726 0.015 0.461
1/19/02 5.08 109 71.2 52.9 2.16 12.7 0.002 0.012 0.042 5.14 0.766 0.015 0.495
3/14/02 0.466 4.89 145 75.8 56.6 2.26 13.7 0.002 0.013 0.054 5.46 0.782 0.017 0.537
4/25/02 1.16 5.38 125 56.0 43.4 1.19 10.8 0.001 0.008 0.588 3.99 0.556 0.012 0.300
5/10/02 2.58 5.83 94.8 38.6 36.2 0.192 9.60 0.001 0.005 0.392 2.98 0.376 0.009 0.216
5/16/02 1.70 5.39 99.3 36.9 34.1 0.130 9.08 0.001 0.004 0.248 2.79 0.351 0.007 0.202
5/28/02 1.07 5.85 92.5 36.3 30.9 0.232 8.08 0.001 0.004 0.343 2.60 0.305 0.007 0.171
6/2/02 0.838 6.10 77.7 27.6 27.8 0.045 7.51 0.001 0.002 0.283 2.19 0.224 0.005 0.138
6/10/02 0.698 5.90 67.7 31.2 31.1 0.057 8.30 0.001 0.003 0.195 2.53 0.281 0.007 0.183
6/17/02 0.447 5.84 80.3 36.8 37.0 0.099 9.23 0.001 0.003 0.181 3.04 0.352 0.008 0.241
6/24/02 0.360 78.6 38.1 36.6 0.144 9.54 0.001 0.004 0.129 3.10 0.390 0.009 0.248
7/1/02 0.424 5.47 109 42.5 40.2 0.206 10.4 0.001 0.006 0.139 3.56 0.458 0.010 0.289
7/9/02 0.580 6.23 106 40.8 39.7 0.070 10.3 0.001 0.004 0.095 3.37 0.411 0.009 0.245
7/21/02 0.642 5.36 110 45.7 0.251 11.6 0.002 0.007 0.160 4.04 0.558 0.012 0.333
8/1/02 5.19 121 63.9 53.8 0.890 13.4 0.002 0.010 0.174 4.97 0.741 0.015 0.452
9/21/02 52.2 2.06 12.5 0.002 0.012 0.270 5.11 0.702 0.015 0.437
Maximum 75.8 3.38 13.7 0.003 0.014 0.588 6.14 1.18 0.021 0.737
*DOC is reported in mg C/L. pH is dimensionless. Conductivity is reported in µS. Hardness is reported as mg/L of CaCO3.
29
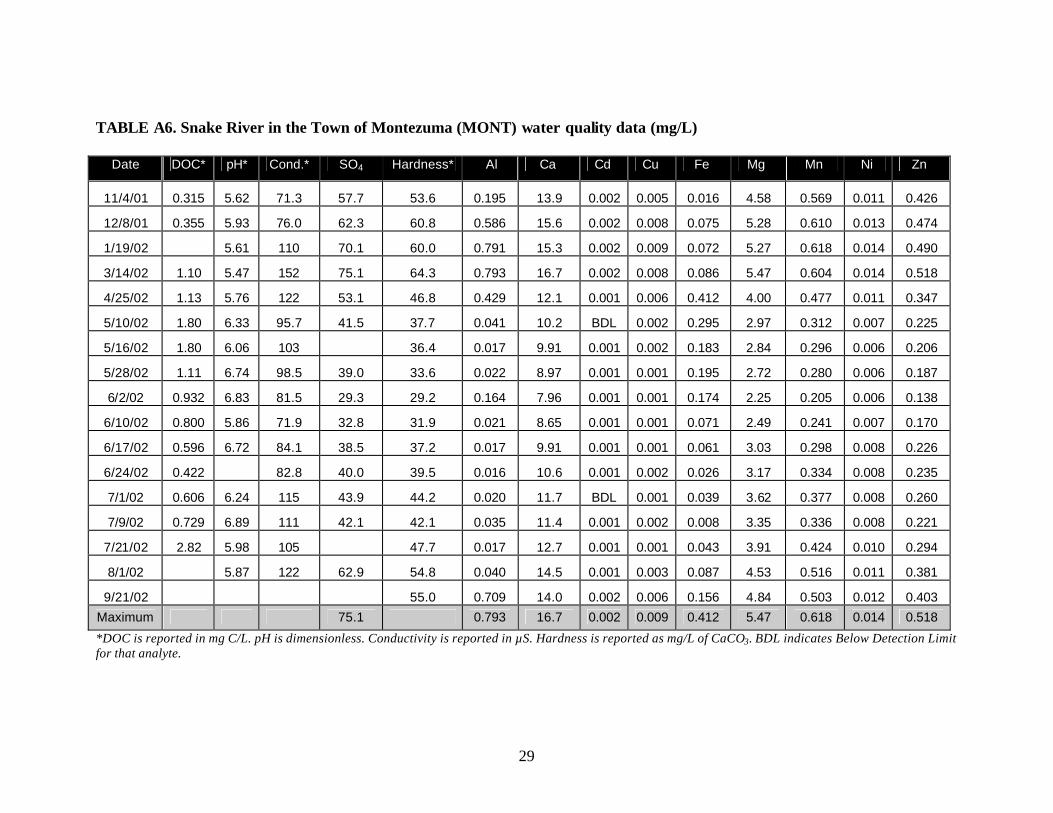
TABLE A6. Snake River in the Town of Montezuma (MONT) water quality data (mg/L)
Date DOC* pH* Cond.* SO4 Hardness* Al Ca Cd Cu Fe Mg Mn Ni Zn
11/4/01 0.315 5.62 71.3 57.7 53.6 0.195 13.9 0.002 0.005 0.016 4.58 0.569 0.011 0.426
12/8/01 0.355 5.93 76.0 62.3 60.8 0.586 15.6 0.002 0.008 0.075 5.28 0.610 0.013 0.474
1/19/02 5.61 110 70.1 60.0 0.791 15.3 0.002 0.009 0.072 5.27 0.618 0.014 0.490
3/14/02 1.10 5.47 152 75.1 64.3 0.793 16.7 0.002 0.008 0.086 5.47 0.604 0.014 0.518
4/25/02 1.13 5.76 122 53.1 46.8 0.429 12.1 0.001 0.006 0.412 4.00 0.477 0.011 0.347
5/10/02 1.80 6.33 95.7 41.5 37.7 0.041 10.2 BDL 0.002 0.295 2.97 0.312 0.007 0.225
5/16/02 1.80 6.06 103 36.4 0.017 9.91 0.001 0.002 0.183 2.84 0.296 0.006 0.206
5/28/02 1.11 6.74 98.5 39.0 33.6 0.022 8.97 0.001 0.001 0.195 2.72 0.280 0.006 0.187
6/2/02 0.932 6.83 81.5 29.3 29.2 0.164 7.96 0.001 0.001 0.174 2.25 0.205 0.006 0.138
6/10/02 0.800 5.86 71.9 32.8 31.9 0.021 8.65 0.001 0.001 0.071 2.49 0.241 0.007 0.170
6/17/02 0.596 6.72 84.1 38.5 37.2 0.017 9.91 0.001 0.001 0.061 3.03 0.298 0.008 0.226
6/24/02 0.422 82.8 40.0 39.5 0.016 10.6 0.001 0.002 0.026 3.17 0.334 0.008 0.235
7/1/02 0.606 6.24 115 43.9 44.2 0.020 11.7 BDL 0.001 0.039 3.62 0.377 0.008 0.260
7/9/02 0.729 6.89 111 42.1 42.1 0.035 11.4 0.001 0.002 0.008 3.35 0.336 0.008 0.221
7/21/02 2.82 5.98 105 47.7 0.017 12.7 0.001 0.001 0.043 3.91 0.424 0.010 0.294
8/1/02 5.87 122 62.9 54.8 0.040 14.5 0.001 0.003 0.087 4.53 0.516 0.011 0.381
9/21/02 55.0 0.709 14.0 0.002 0.006 0.156 4.84 0.503 0.012 0.403
Maximum 75.1 0.793 16.7 0.002 0.009 0.412 5.47 0.618 0.014 0.518
*DOC is reported in mg C/L. pH is dimensionless. Conductivity is reported in µS. Hardness is reported as mg/L of CaCO3. BDL indicates Below Detection Limit for that analyte.
30
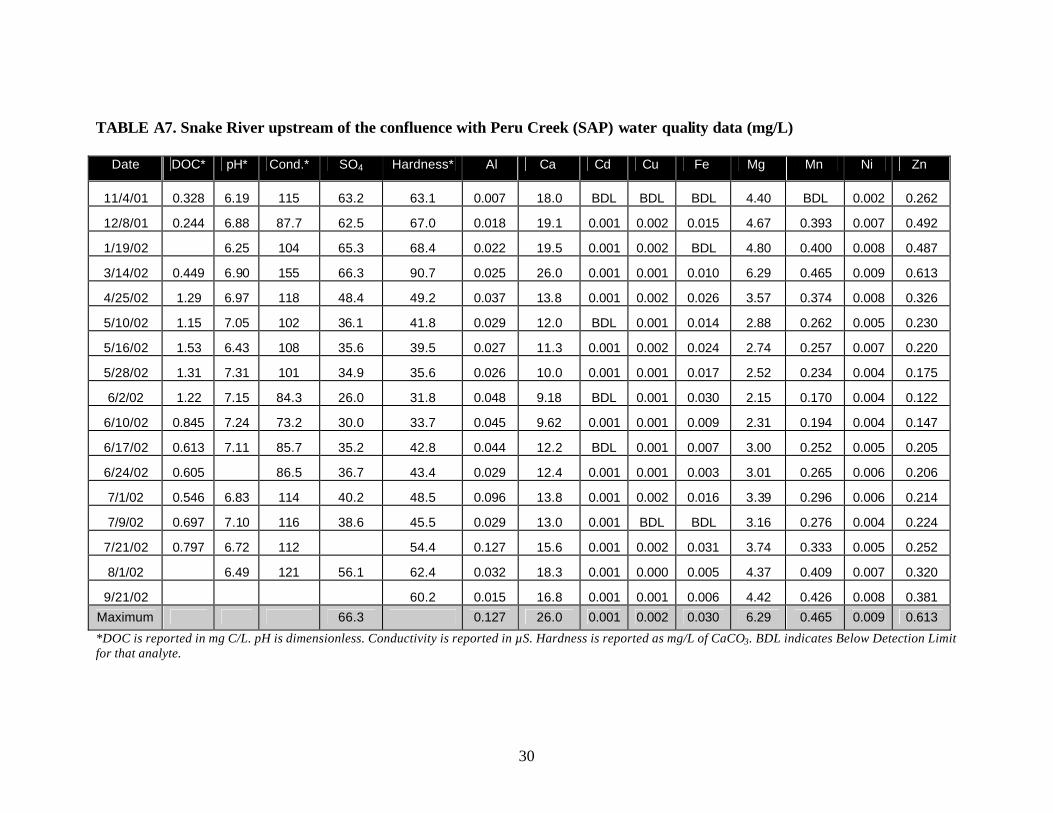
TABLE A7. Snake River upstream of the confluence with Peru Creek (SAP) water quality data (mg/L)
Date DOC* pH* Cond.* SO4 Hardness* Al Ca Cd Cu Fe Mg Mn Ni Zn
11/4/01 0.328 6.19 115 63.2 63.1 0.007 18.0 BDL BDL BDL 4.40 BDL 0.002 0.262
12/8/01 0.244 6.88 87.7 62.5 67.0 0.018 19.1 0.001 0.002 0.015 4.67 0.393 0.007 0.492
1/19/02 6.25 104 65.3 68.4 0.022 19.5 0.001 0.002 BDL 4.80 0.400 0.008 0.487
3/14/02 0.449 6.90 155 66.3 90.7 0.025 26.0 0.001 0.001 0.010 6.29 0.465 0.009 0.613
4/25/02 1.29 6.97 118 48.4 49.2 0.037 13.8 0.001 0.002 0.026 3.57 0.374 0.008 0.326
5/10/02 1.15 7.05 102 36.1 41.8 0.029 12.0 BDL 0.001 0.014 2.88 0.262 0.005 0.230
5/16/02 1.53 6.43 108 35.6 39.5 0.027 11.3 0.001 0.002 0.024 2.74 0.257 0.007 0.220
5/28/02 1.31 7.31 101 34.9 35.6 0.026 10.0 0.001 0.001 0.017 2.52 0.234 0.004 0.175
6/2/02 1.22 7.15 84.3 26.0 31.8 0.048 9.18 BDL 0.001 0.030 2.15 0.170 0.004 0.122
6/10/02 0.845 7.24 73.2 30.0 33.7 0.045 9.62 0.001 0.001 0.009 2.31 0.194 0.004 0.147
6/17/02 0.613 7.11 85.7 35.2 42.8 0.044 12.2 BDL 0.001 0.007 3.00 0.252 0.005 0.205
6/24/02 0.605 86.5 36.7 43.4 0.029 12.4 0.001 0.001 0.003 3.01 0.265 0.006 0.206
7/1/02 0.546 6.83 114 40.2 48.5 0.096 13.8 0.001 0.002 0.016 3.39 0.296 0.006 0.214
7/9/02 0.697 7.10 116 38.6 45.5 0.029 13.0 0.001 BDL BDL 3.16 0.276 0.004 0.224
7/21/02 0.797 6.72 112 54.4 0.127 15.6 0.001 0.002 0.031 3.74 0.333 0.005 0.252
8/1/02 6.49 121 56.1 62.4 0.032 18.3 0.001 0.000 0.005 4.37 0.409 0.007 0.320
9/21/02 60.2 0.015 16.8 0.001 0.001 0.006 4.42 0.426 0.008 0.381
Maximum 66.3 0.127 26.0 0.001 0.002 0.030 6.29 0.465 0.009 0.613
*DOC is reported in mg C/L. pH is dimensionless. Conductivity is reported in µS. Hardness is reported as mg/L of CaCO3. BDL indicates Below Detection Limit for that analyte.
31
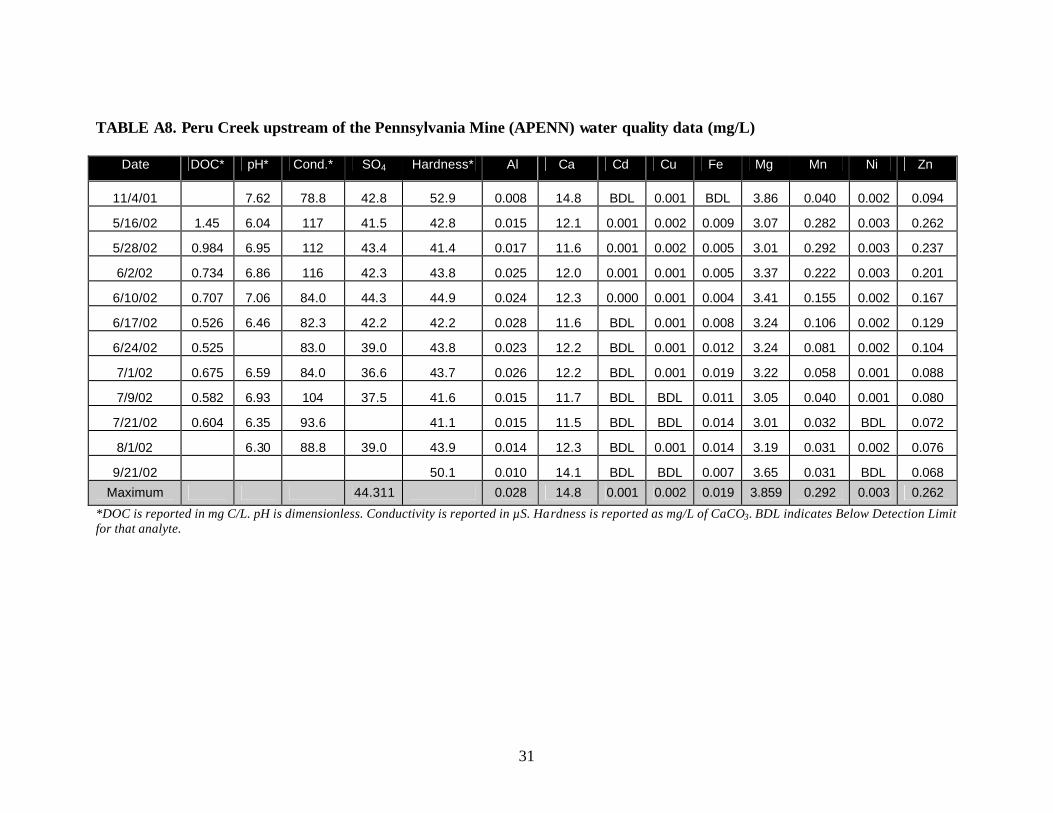
TABLE A8. Peru Creek upstream of the Pennsylvania Mine (APENN) water quality data (mg/L)
Date DOC* pH* Cond.* SO4 Hardness* Al Ca Cd Cu Fe Mg Mn Ni Zn
11/4/01 7.62 78.8 42.8 52.9 0.008 14.8 BDL 0.001 BDL 3.86 0.040 0.002 0.094
5/16/02 1.45 6.04 117 41.5 42.8 0.015 12.1 0.001 0.002 0.009 3.07 0.282 0.003 0.262
5/28/02 0.984 6.95 112 43.4 41.4 0.017 11.6 0.001 0.002 0.005 3.01 0.292 0.003 0.237
6/2/02 0.734 6.86 116 42.3 43.8 0.025 12.0 0.001 0.001 0.005 3.37 0.222 0.003 0.201
6/10/02 0.707 7.06 84.0 44.3 44.9 0.024 12.3 0.000 0.001 0.004 3.41 0.155 0.002 0.167
6/17/02 0.526 6.46 82.3 42.2 42.2 0.028 11.6 BDL 0.001 0.008 3.24 0.106 0.002 0.129
6/24/02 0.525 83.0 39.0 43.8 0.023 12.2 BDL 0.001 0.012 3.24 0.081 0.002 0.104
7/1/02 0.675 6.59 84.0 36.6 43.7 0.026 12.2 BDL 0.001 0.019 3.22 0.058 0.001 0.088
7/9/02 0.582 6.93 104 37.5 41.6 0.015 11.7 BDL BDL 0.011 3.05 0.040 0.001 0.080
7/21/02 0.604 6.35 93.6 41.1 0.015 11.5 BDL BDL 0.014 3.01 0.032 BDL 0.072
8/1/02 6.30 88.8 39.0 43.9 0.014 12.3 BDL 0.001 0.014 3.19 0.031 0.002 0.076
9/21/02 50.1 0.010 14.1 BDL BDL 0.007 3.65 0.031 BDL 0.068
Maximum 44.311 0.028 14.8 0.001 0.002 0.019 3.859 0.292 0.003 0.262
*DOC is reported in mg C/L. pH is dimensionless. Conductivity is reported in µS. Hardness is reported as mg/L of CaCO3. BDL indicates Below Detection Limit for that analyte.
32
TABLE A9. Pennsylvania Mine (PENN) water quality data (mg/L)
Date DOC* pH* Cond.* SO4 Hardness* Al Ca Cd Cu Fe Mg Mn Ni Zn
5/16/02 0.779 4.22 860 491 363 6.01 96.7 0.069 0.651 20.3 29.5 19.4 0.096 14.7
5/28/02 0.481 5.01 880 500 368 6.52 97.3 0.070 0.702 20.1 30.3 19.8 0.099 15.4
6/2/02 0.329 4.98 758 508 381 7.87 101 0.073 0.816 20.7 31.5 20.6 0.103 16.3
6/10/02 0.414 4.66 684 556 395 12.6 104 0.089 1.23 22.1 33.1 22.6 0.121 19.4
6/17/02 0.311 4.31 763 580 373 14.6 97.8 0.106 2.34 18.8 31.2 21.3 0.120 23.3
6/24/02 0.276 839 567 368 17.7 99.5 0.117 3.70 19.6 29.1 19.0 0.124 23.1
7/1/02 0.693 3.61 977 558 355 18.7 96.7 0.114 4.18 20.7 27.6 17.2 0.119 22.8
7/9/02 0.357 3.47 961 553 358 18.8 97.8 0.110 4.06 21.9 28.6 17.9 0.120 22.2
7/21/02 0.379 3.26 348 16.6 93.3 0.098 3.25 21.8 27.9 18.5 0.113 19.7
8/1/02 3.36 817 539 404 16.8 110 0.113 3.09 24.2 31.6 22.6 0.130 21.7
9/21/02 363 21.5 92.9 0.129 5.60 23.2 31.8 23.1 0.146 27.8
Maximum 580 18.7 110 0.129 5.60 24.2 33.1 23.1 0.146 27.8
*DOC is reported in mg C/L. pH is dimensionless. Conductivity is reported in µS. Hardness is reported as mg/L of CaCO3.
33
TABLE A10. Peru Creek downstream of the Pennsylvania Mine (BPENN) water quality data (mg/L)
Date DOC* pH* Cond.* SO4 Hardness* Al Ca Cd Cu Fe Mg Mn Ni Zn
11/4/01 0.247 5.99 140 76.9 68.7 0.913 18.6 0.009 0.258 0.016 5.42 1.52 0.012 2.00
5/16/02 1.25 6.00 124 46.2 43.9 0.036 12.3 0.002 0.012 0.022 3.21 0.437 0.005 0.447
5/28/02 0.777 6.59 120 45.9 45.2 0.037 12.6 0.002 0.014 0.015 3.32 0.473 0.005 0.444
6/2/02 1.19 6.64 118 46.0 47.3 0.020 12.9 0.002 0.012 0.015 3.68 0.426 0.005 0.420
6/10/02 0.609 6.30 98.5 53.2 50.3 0.032 13.7 0.003 0.026 0.032 3.92 0.628 0.006 0.597
6/17/02 0.401 6.28 103 53.6 47.8 0.094 12.8 0.003 0.045 0.063 3.86 0.708 0.006 0.786
6/24/02 0.353 106 53.8 52.0 0.104 14.3 0.003 0.068 0.051 3.97 0.761 0.007 0.885
7/1/02 0.375 5.94 136 52.8 51.0 0.184 13.9 0.004 0.084 0.055 3.94 0.716 0.007 0.923
7/9/02 0.429 5.91 132 54.5 53.2 0.184 14.5 0.004 0.091 0.047 4.10 0.770 0.007 0.984
7/21/02 0.463 5.56 114 53.3 0.428 14.6 0.004 0.095 0.086 4.09 0.811 0.009 1.03
8/1/02 5.50 122 58.6 56.2 0.281 15.6 0.005 0.089 0.063 4.16 0.865 0.008 1.08
9/21/02 65.0 0.203 18.5 0.004 0.079 0.061 5.15 0.663 0.007 0.955
Maximum 76.9 0.913 18.6 0.009 0.258 0.086 5.42 1.52 0.012 2.00
*DOC is reported in mg C/L. pH is dimensionless. Conductivity is reported in µS. Hardness is reported as mg/L of CaCO3.

34
TABLE A11. Cinnamon Gulch (CINN) water quality data (mg/L)
Date DOC* pH* Cond.* SO4 Hardness* Al Ca Cd Cu Fe Mg Mn Ni Zn
11/4/01 0.404 4.26 196 89.2 58.9 4.44 15.1 0.007 0.151 0.011 5.14 2.37 0.018 1.51
5/16/02 1.41 3.95 190 75.8 45.7 3.25 12.1 0.005 0.114 0.333 3.76 1.83 0.015 1.08
5/28/02 1.18 4.79 176 66.3 38.2 2.83 9.93 0.005 0.113 0.322 3.25 1.61 0.012 0.969
6/2/02 0.756 4.20 175 63.3 36.5 3.21 9.34 0.005 0.133 0.413 3.21 1.60 0.015 0.998
6/10/02 0.732 3.95 128 71.8 41.6 3.26 10.9 0.005 0.138 0.311 3.47 1.64 0.015 1.04
6/17/02 0.558 3.94 131 74.2 44.7 3.05 11.7 0.005 0.129 0.223 3.76 1.67 0.013 1.03
6/24/02 0.471 138 72.8 47.5 3.15 12.7 0.005 0.135 0.240 3.85 1.84 0.015 1.05
7/1/02 0.633 4.17 169 74.5 46.1 3.15 12.2 0.005 0.137 0.261 3.80 1.88 0.015 1.10
7/9/02 0.529 4.39 188 77.2 49.9 3.49 13.1 0.006 0.143 0.274 4.16 2.12 0.016 1.19
7/21/02 0.704 4.03 149 48.5 3.26 12.8 0.006 0.137 0.335 4.01 2.07 0.016 1.18
8/1/02 4.03 151 79.0 53.0 3.43 14.2 0.007 0.140 0.369 4.27 2.28 0.018 1.29
9/21/02 74.7 5.20 19.5 0.008 0.201 0.283 6.30 2.77 0.021 1.65
Maximum 89.2 5.20 19.5 0.008 0.201 0.413 6.30 2.77 0.021 1.65
*DOC is reported in mg C/L. pH is dimensionless. Conductivity is reported in µS. Hardness is reported as mg/L of CaCO3.
35
TABLE A12. Peru Creek downstream of Cinnamon Gulch (BCINN) water quality data (mg/L)
Date DOC* pH* Cond.* SO4 Hardness* Al Ca Cd Cu Fe Mg Mn Ni Zn
11/4/01 0.213 5.06 148 71.7 2.25 19.0 0.010 0.274 0.024 5.90 2.10 0.017 2.36
5/16/02 1.53 4.99 138 57.4 46.6 0.615 12.9 0.004 0.062 0.074 3.56 0.900 0.008 0.805
5/28/02 0.795 5.38 141 57.5 46.8 0.879 12.8 0.004 0.073 0.085 3.60 1.03 0.010 0.850
6/2/02 0.683 5.24 141 66.8 48.3 0.948 12.6 0.004 0.080 0.115 3.82 1.01 0.009 0.870
6/10/02 0.588 4.37 120 69.7 49.8 1.16 13.3 0.004 0.102 0.104 4.01 1.21 0.010 1.10
6/17/02 0.519 4.79 124 68.0 50.3 1.19 13.2 0.005 0.115 0.112 4.18 1.33 0.010 1.26
6/24/02 0.467 125 67.6 56.6 1.36 15.2 0.006 0.139 0.108 4.53 1.50 0.013 1.37
7/1/02 0.525 4.83 130 73.5 55.9 1.37 14.8 0.006 0.148 0.108 4.58 1.50 0.013 1.42
7/9/02 0.575 5.11 170 61.0 1.73 16.2 0.007 0.165 0.115 4.98 1.76 0.014 1.60
7/21/02 0.557 4.61 148 57.7 1.68 15.3 0.007 0.161 0.138 4.71 1.70 0.013 1.57
8/1/02 4.70 149 79.7 62.8 1.78 16.9 0.008 0.166 0.133 5.00 1.80 0.016 1.70
9/21/02 69.0 1.92 18.5 0.006 0.145 0.131 5.57 1.56 0.017 1.50
Maximum 79.7 2.25 19.0 0.010 0.274 0.138 5.90 2.10 0.017 2.36
*DOC is reported in mg C/L. pH is dimensionless. Conductivity is reported in µS. Hardness is reported as mg/L of CaCO3.
36
TABLE A13. Peru Creek upstream of the confluence with the Snake River (PAS) water quality data (mg/L)
Date DOC* pH* Cond.* SO4 Hardness* Al Ca Cd Cu Fe Mg Mn Ni Zn
11/4/01 0.258 5.52 104 75.5 60.0 1.60 16.9 0.005 0.074 0.006 4.36 1.02 0.008 1.29
12/8/01 0.240 5.90 86.3 81.9 64.9 2.41 18.2 0.006 0.082 0.050 4.72 1.10 0.009 1.46
1/19/02 5.61 109 81.6 65.1 1.13 18.3 0.005 0.071 0.049 4.69 0.982 0.008 1.45
3/14/02 0.611 5.66 147 79.6 81.8 0.572 22.8 0.006 0.068 0.079 5.56 1.01 0.010 1.59
4/25/02 0.720 5.78 138 63.0 53.0 0.414 15.2 0.004 0.049 0.121 3.63 0.825 0.007 0.966
5/10/02 0.716 6.57 105 43.4 42.1 0.018 12.3 0.002 0.015 0.039 2.77 0.494 0.005 0.562
5/16/02 1.52 6.06 109 41.1 38.4 0.080 11.2 0.002 0.013 0.028 2.55 0.430 0.005 0.483
5/28/02 0.719 6.58 109 44.1 40.0 0.016 11.6 0.002 0.016 0.023 2.68 0.511 0.004 0.554
6/2/02 0.620 6.78 99.9 35.9 36.5 0.062 10.5 0.002 0.011 0.021 2.53 0.452 0.005 0.473
6/10/02 0.498 5.43 83.0 43.7 38.1 0.018 10.9 0.002 0.013 0.016 2.61 0.540 0.005 0.569
6/17/02 0.398 6.03 95.3 52.6 51.5 0.068 14.6 0.004 0.039 0.079 3.62 0.811 0.007 0.913
6/24/02 0.376 101 55.0 49.8 0.106 14.3 0.003 0.041 0.079 3.44 0.752 0.007 0.816
7/1/02 0.367 5.22 136 55.4 52.6 0.293 15.0 0.004 0.054 0.114 3.66 0.820 0.007 0.914
7/9/02 0.398 5.50 140 59.1 56.7 0.791 16.1 0.004 0.058 0.093 3.98 0.916 0.008 1.00
7/21/02 0.531 4.82 128 58.1 0.865 16.5 0.005 0.060 0.094 4.07 0.960 0.008 1.08
8/1/02 4.95 124 69.9 59.6 0.842 17.3 0.005 0.057 0.081 4.01 0.944 0.008 1.07
9/21/02 63.6 0.885 18.1 0.004 0.049 0.093 4.45 0.805 0.007 1.04
Maximum 81.9 2.41 22.8 0.006 0.082 0.121 5.56 1.10 0.010 1.59
*DOC is reported in mg C/L. pH is dimensionless. Conductivity is reported in µS. Hardness is reported as mg/L of CaCO3. BDL indicates Below Detection Limit for that analyte.
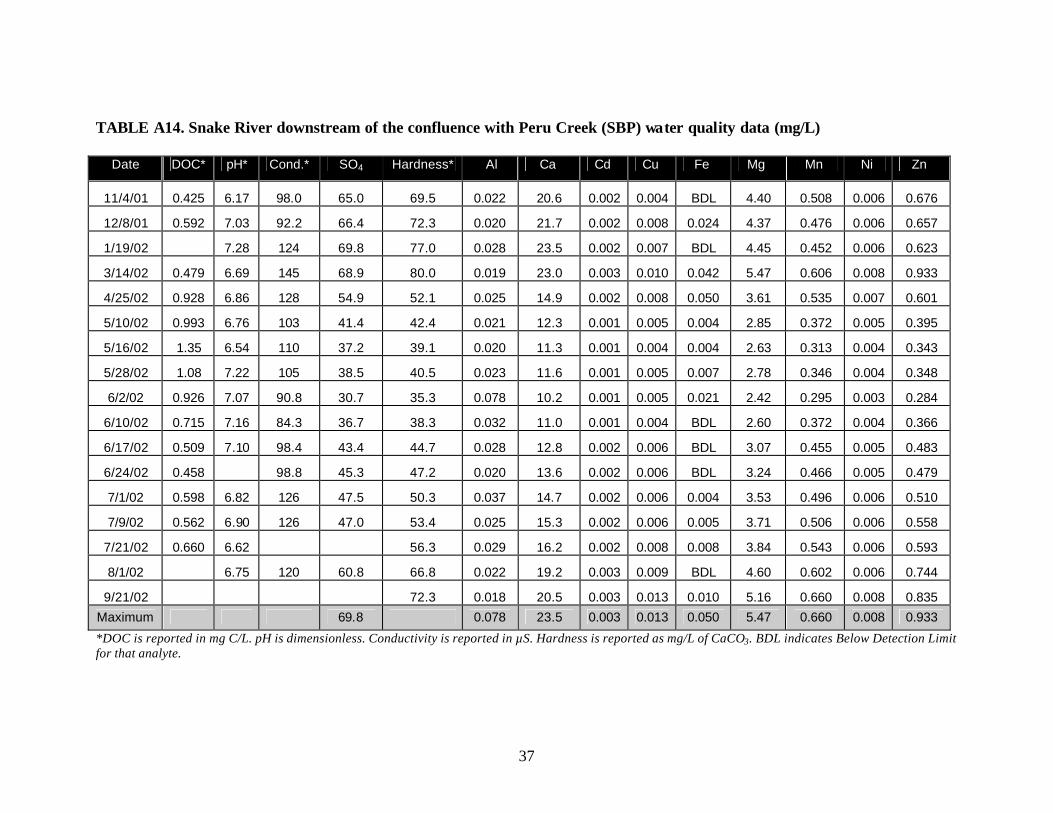
37
TABLE A14. Snake River downstream of the confluence with Peru Creek (SBP) water quality data (mg/L)
Date DOC* pH* Cond.* SO4 Hardness* Al Ca Cd Cu Fe Mg Mn Ni Zn
11/4/01 0.425 6.17 98.0 65.0 69.5 0.022 20.6 0.002 0.004 BDL 4.40 0.508 0.006 0.676
12/8/01 0.592 7.03 92.2 66.4 72.3 0.020 21.7 0.002 0.008 0.024 4.37 0.476 0.006 0.657
1/19/02 7.28 124 69.8 77.0 0.028 23.5 0.002 0.007 BDL 4.45 0.452 0.006 0.623
3/14/02 0.479 6.69 145 68.9 80.0 0.019 23.0 0.003 0.010 0.042 5.47 0.606 0.008 0.933
4/25/02 0.928 6.86 128 54.9 52.1 0.025 14.9 0.002 0.008 0.050 3.61 0.535 0.007 0.601
5/10/02 0.993 6.76 103 41.4 42.4 0.021 12.3 0.001 0.005 0.004 2.85 0.372 0.005 0.395
5/16/02 1.35 6.54 110 37.2 39.1 0.020 11.3 0.001 0.004 0.004 2.63 0.313 0.004 0.343
5/28/02 1.08 7.22 105 38.5 40.5 0.023 11.6 0.001 0.005 0.007 2.78 0.346 0.004 0.348
6/2/02 0.926 7.07 90.8 30.7 35.3 0.078 10.2 0.001 0.005 0.021 2.42 0.295 0.003 0.284
6/10/02 0.715 7.16 84.3 36.7 38.3 0.032 11.0 0.001 0.004 BDL 2.60 0.372 0.004 0.366
6/17/02 0.509 7.10 98.4 43.4 44.7 0.028 12.8 0.002 0.006 BDL 3.07 0.455 0.005 0.483
6/24/02 0.458 98.8 45.3 47.2 0.020 13.6 0.002 0.006 BDL 3.24 0.466 0.005 0.479
7/1/02 0.598 6.82 126 47.5 50.3 0.037 14.7 0.002 0.006 0.004 3.53 0.496 0.006 0.510
7/9/02 0.562 6.90 126 47.0 53.4 0.025 15.3 0.002 0.006 0.005 3.71 0.506 0.006 0.558
7/21/02 0.660 6.62 56.3 0.029 16.2 0.002 0.008 0.008 3.84 0.543 0.006 0.593
8/1/02 6.75 120 60.8 66.8 0.022 19.2 0.003 0.009 BDL 4.60 0.602 0.006 0.744
9/21/02 72.3 0.018 20.5 0.003 0.013 0.010 5.16 0.660 0.008 0.835
Maximum 69.8 0.078 23.5 0.003 0.013 0.050 5.47 0.660 0.008 0.933
*DOC is reported in mg C/L. pH is dimensionless. Conductivity is reported in µS. Hardness is reported as mg/L of CaCO3. BDL indicates Below Detection Limit for that analyte.
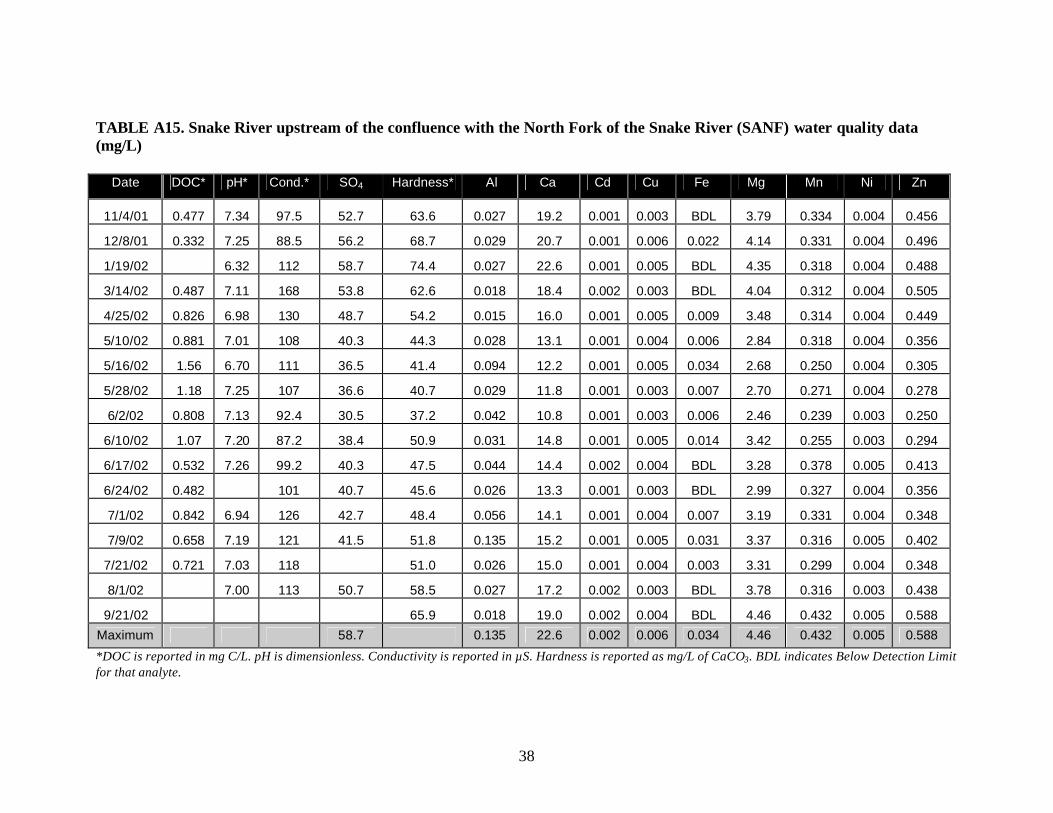
38
TABLE A15. Snake River upstream of the confluence with the North Fork of the Snake River (SANF) water quality data (mg/L)
Date DOC* pH* Cond.* SO4 Hardness* Al Ca Cd Cu Fe Mg Mn Ni Zn
11/4/01 0.477 7.34 97.5 52.7 63.6 0.027 19.2 0.001 0.003 BDL 3.79 0.334 0.004 0.456
12/8/01 0.332 7.25 88.5 56.2 68.7 0.029 20.7 0.001 0.006 0.022 4.14 0.331 0.004 0.496
1/19/02 6.32 112 58.7 74.4 0.027 22.6 0.001 0.005 BDL 4.35 0.318 0.004 0.488
3/14/02 0.487 7.11 168 53.8 62.6 0.018 18.4 0.002 0.003 BDL 4.04 0.312 0.004 0.505
4/25/02 0.826 6.98 130 48.7 54.2 0.015 16.0 0.001 0.005 0.009 3.48 0.314 0.004 0.449
5/10/02 0.881 7.01 108 40.3 44.3 0.028 13.1 0.001 0.004 0.006 2.84 0.318 0.004 0.356
5/16/02 1.56 6.70 111 36.5 41.4 0.094 12.2 0.001 0.005 0.034 2.68 0.250 0.004 0.305
5/28/02 1.18 7.25 107 36.6 40.7 0.029 11.8 0.001 0.003 0.007 2.70 0.271 0.004 0.278
6/2/02 0.808 7.13 92.4 30.5 37.2 0.042 10.8 0.001 0.003 0.006 2.46 0.239 0.003 0.250
6/10/02 1.07 7.20 87.2 38.4 50.9 0.031 14.8 0.001 0.005 0.014 3.42 0.255 0.003 0.294
6/17/02 0.532 7.26 99.2 40.3 47.5 0.044 14.4 0.002 0.004 BDL 3.28 0.378 0.005 0.413
6/24/02 0.482 101 40.7 45.6 0.026 13.3 0.001 0.003 BDL 2.99 0.327 0.004 0.356
7/1/02 0.842 6.94 126 42.7 48.4 0.056 14.1 0.001 0.004 0.007 3.19 0.331 0.004 0.348
7/9/02 0.658 7.19 121 41.5 51.8 0.135 15.2 0.001 0.005 0.031 3.37 0.316 0.005 0.402
7/21/02 0.721 7.03 118 51.0 0.026 15.0 0.001 0.004 0.003 3.31 0.299 0.004 0.348
8/1/02 7.00 113 50.7 58.5 0.027 17.2 0.002 0.003 BDL 3.78 0.316 0.003 0.438
9/21/02 65.9 0.018 19.0 0.002 0.004 BDL 4.46 0.432 0.005 0.588
Maximum 58.7 0.135 22.6 0.002 0.006 0.034 4.46 0.432 0.005 0.588
*DOC is reported in mg C/L. pH is dimensionless. Conductivity is reported in µS. Hardness is reported as mg/L of CaCO3. BDL indicates Below Detection Limit for that analyte.
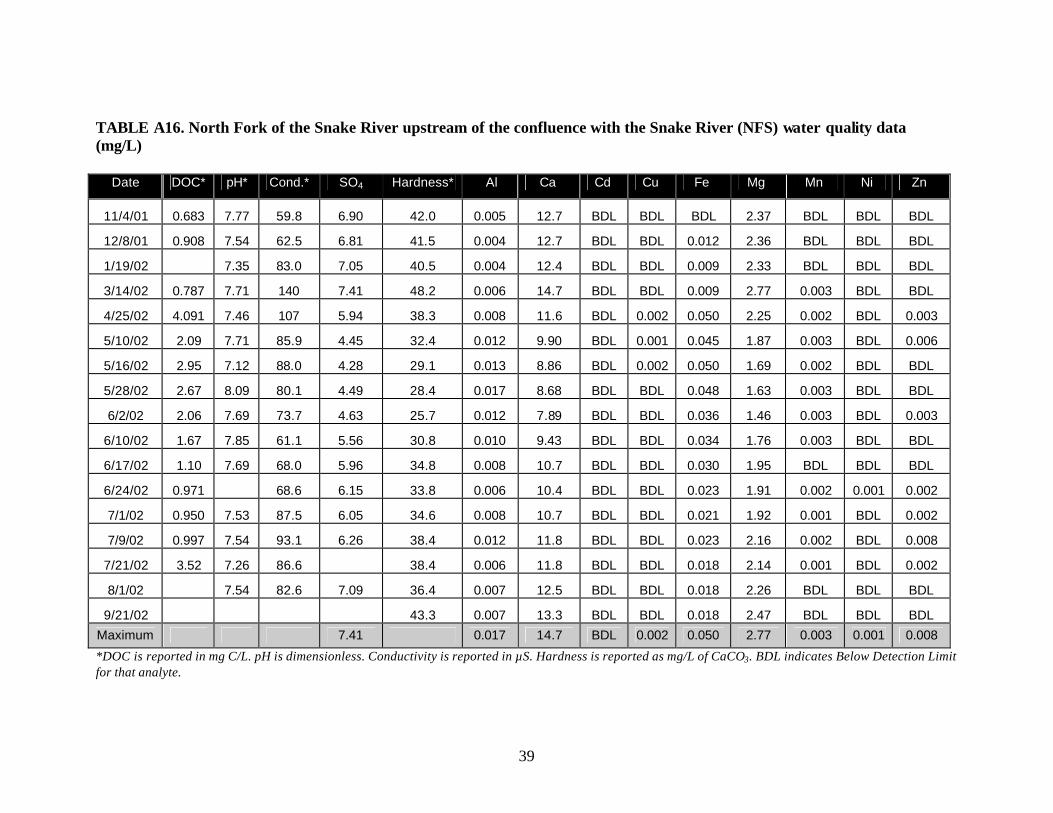
39
TABLE A16. North Fork of the Snake River upstream of the confluence with the Snake River (NFS) water quality data (mg/L)
Date DOC* pH* Cond.* SO4 Hardness* Al Ca Cd Cu Fe Mg Mn Ni Zn
11/4/01 0.683 7.77 59.8 6.90 42.0 0.005 12.7 BDL BDL BDL 2.37 BDL BDL BDL
12/8/01 0.908 7.54 62.5 6.81 41.5 0.004 12.7 BDL BDL 0.012 2.36 BDL BDL BDL
1/19/02 7.35 83.0 7.05 40.5 0.004 12.4 BDL BDL 0.009 2.33 BDL BDL BDL
3/14/02 0.787 7.71 140 7.41 48.2 0.006 14.7 BDL BDL 0.009 2.77 0.003 BDL BDL
4/25/02 4.091 7.46 107 5.94 38.3 0.008 11.6 BDL 0.002 0.050 2.25 0.002 BDL 0.003
5/10/02 2.09 7.71 85.9 4.45 32.4 0.012 9.90 BDL 0.001 0.045 1.87 0.003 BDL 0.006
5/16/02 2.95 7.12 88.0 4.28 29.1 0.013 8.86 BDL 0.002 0.050 1.69 0.002 BDL BDL
5/28/02 2.67 8.09 80.1 4.49 28.4 0.017 8.68 BDL BDL 0.048 1.63 0.003 BDL BDL
6/2/02 2.06 7.69 73.7 4.63 25.7 0.012 7.89 BDL BDL 0.036 1.46 0.003 BDL 0.003
6/10/02 1.67 7.85 61.1 5.56 30.8 0.010 9.43 BDL BDL 0.034 1.76 0.003 BDL BDL
6/17/02 1.10 7.69 68.0 5.96 34.8 0.008 10.7 BDL BDL 0.030 1.95 BDL BDL BDL
6/24/02 0.971 68.6 6.15 33.8 0.006 10.4 BDL BDL 0.023 1.91 0.002 0.001 0.002
7/1/02 0.950 7.53 87.5 6.05 34.6 0.008 10.7 BDL BDL 0.021 1.92 0.001 BDL 0.002
7/9/02 0.997 7.54 93.1 6.26 38.4 0.012 11.8 BDL BDL 0.023 2.16 0.002 BDL 0.008
7/21/02 3.52 7.26 86.6 38.4 0.006 11.8 BDL BDL 0.018 2.14 0.001 BDL 0.002
8/1/02 7.54 82.6 7.09 36.4 0.007 12.5 BDL BDL 0.018 2.26 BDL BDL BDL
9/21/02 43.3 0.007 13.3 BDL BDL 0.018 2.47 BDL BDL BDL
Maximum 7.41 0.017 14.7 BDL 0.002 0.050 2.77 0.003 0.001 0.008
*DOC is reported in mg C/L. pH is dimensionless. Conductivity is reported in µS. Hardness is reported as mg/L of CaCO3. BDL indicates Below Detection Limit for that analyte.
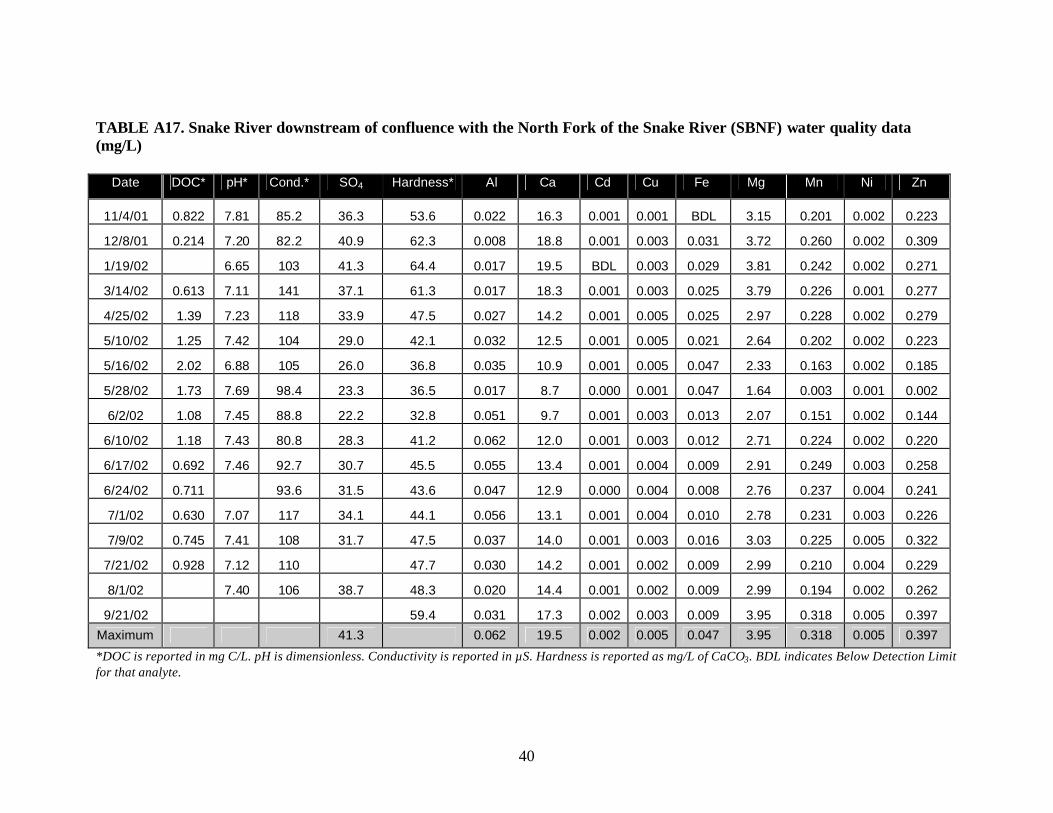
40
TABLE A17. Snake River downstream of confluence with the North Fork of the Snake River (SBNF) water quality data (mg/L)
Date DOC* pH* Cond.* SO4 Hardness* Al Ca Cd Cu Fe Mg Mn Ni Zn
11/4/01 0.822 7.81 85.2 36.3 53.6 0.022 16.3 0.001 0.001 BDL 3.15 0.201 0.002 0.223
12/8/01 0.214 7.20 82.2 40.9 62.3 0.008 18.8 0.001 0.003 0.031 3.72 0.260 0.002 0.309
1/19/02 6.65 103 41.3 64.4 0.017 19.5 BDL 0.003 0.029 3.81 0.242 0.002 0.271
3/14/02 0.613 7.11 141 37.1 61.3 0.017 18.3 0.001 0.003 0.025 3.79 0.226 0.001 0.277
4/25/02 1.39 7.23 118 33.9 47.5 0.027 14.2 0.001 0.005 0.025 2.97 0.228 0.002 0.279
5/10/02 1.25 7.42 104 29.0 42.1 0.032 12.5 0.001 0.005 0.021 2.64 0.202 0.002 0.223
5/16/02 2.02 6.88 105 26.0 36.8 0.035 10.9 0.001 0.005 0.047 2.33 0.163 0.002 0.185
5/28/02 1.73 7.69 98.4 23.3 36.5 0.017 8.7 0.000 0.001 0.047 1.64 0.003 0.001 0.002
6/2/02 1.08 7.45 88.8 22.2 32.8 0.051 9.7 0.001 0.003 0.013 2.07 0.151 0.002 0.144
6/10/02 1.18 7.43 80.8 28.3 41.2 0.062 12.0 0.001 0.003 0.012 2.71 0.224 0.002 0.220
6/17/02 0.692 7.46 92.7 30.7 45.5 0.055 13.4 0.001 0.004 0.009 2.91 0.249 0.003 0.258
6/24/02 0.711 93.6 31.5 43.6 0.047 12.9 0.000 0.004 0.008 2.76 0.237 0.004 0.241
7/1/02 0.630 7.07 117 34.1 44.1 0.056 13.1 0.001 0.004 0.010 2.78 0.231 0.003 0.226
7/9/02 0.745 7.41 108 31.7 47.5 0.037 14.0 0.001 0.003 0.016 3.03 0.225 0.005 0.322
7/21/02 0.928 7.12 110 47.7 0.030 14.2 0.001 0.002 0.009 2.99 0.210 0.004 0.229
8/1/02 7.40 106 38.7 48.3 0.020 14.4 0.001 0.002 0.009 2.99 0.194 0.002 0.262
9/21/02 59.4 0.031 17.3 0.002 0.003 0.009 3.95 0.318 0.005 0.397
Maximum 41.3 0.062 19.5 0.002 0.005 0.047 3.95 0.318 0.005 0.397
*DOC is reported in mg C/L. pH is dimensionless. Conductivity is reported in µS. Hardness is reported as mg/L of CaCO3. BDL indicates Below Detection Limit for that analyte.
41
TABLE A18. Aluminum maximum hazard quotients calculated using year round and limited Snake River Watershed datasets, and both Criteria Maximum Concentration (CMC) and Criterion Continuous Concentration (CCC) (EPA, 2002). EPA aluminum water quality criteria values were as follows: CMC = 750 µg/L and CCC = 87 µg/L (at pH 6.5 – 9.0).
LIMITED DATA YEAR ROUND CMC CCC CMC CCC
Site ID Maximum Measured
(µg/L)
Max. Hazard Quotient
(HQ) Result
Max. Hazard Quotient
(HQ) Result
Maximum Measured
(µg/L)
Max. Hazard Quotient
(HQ) Result
Max. Hazard Quotient
(HQ) Result
SAD 6060 8.1 FAIL 70 FAIL 6190 8.3 FAIL 71 FAIL DAS 26.7 0.0 0.30 51.3 0.1 0.60 SBD 2060 2.7 FAIL 24 FAIL 3380 4.5 FAIL 39 FAIL MONT 709 0.90 8.1 FAIL 793 1.1 FAIL 9.1 FAIL SAP 127 0.20 1.5 FAIL 127 0.2 1.5 FAIL APENN 28.1 0.0 0.30 BPENN 428 0.60 4.9 FAIL BCINN 1920 2.6 FAIL 22 FAIL PAS 885 1.2 FAIL 10 FAIL 2410 3.2 FAIL 28 FAIL SBP 78.2 0.10 0.90 78.2 0.1 0.90 SANF 135 0.20 1.5 FAIL 135 0.2 1.5 FAIL NFS 55.0 0.10 0.60 55.0 0.1 0.60 SBNF 61.6 0.10 0.70 61.6 0.1 0.70
42
TABLE A19. Cadmium maximum hazard quotients calculated us ing year round and limited Snake River Watershed datasets, and both Criteria Maximum Concentration (CMC) and Criterion Continuous Concentration (CCC) (EPA, 2002). EPA cadmium water quality criteria values were as follows: CMC = 2.0 µg/L and CCC = 0.25 µg/L.
LIMITED DATA YEAR ROUND CMC CCC CMC CCC
Site ID Maximum Measured
(µg/L)
Max. Hazard Quotient
(HQ) Result
Max. Hazard Quotient
(HQ) Result
Maximum Measured
(µg/L)
Max. Hazard Quotient
(HQ) Result
Max. Hazard Quotient
(HQ) Result
SAD 4.4 2.2 FAIL 18 FAIL 4.6 2.3 FAIL 19 FAIL DAS 0.0 0.0 0.0 0.0 0.0 0.0 SBD 2.1 1.1 FAIL 8.4 FAIL 3.4 1.7 FAIL 14 FAIL MONT 1.8 0.90 7.4 FAIL 1.9 1.0 7.8 FAIL SAP 1.1 0.60 4.4 FAIL 1.5 0.70 5.9 FAIL APENN 0.9 0.50 3.6 FAIL BPENN 4.9 2.4 FAIL 19 FAIL BCINN 7.8 3.9 FAIL 31 FAIL PAS 4.6 2.3 FAIL 19 FAIL 6.1 3.0 FAIL 24 FAIL SBP 3.0 1.5 FAIL 12 FAIL 3.2 1.6 FAIL 13 FAIL SANF 2.1 1.1 FAIL 8.4 FAIL 2.1 1.1 FAIL 8.4 FAIL NFS 0.8 0.40 3.1 FAIL 0.8 0.40 3.1 FAIL SBNF 1.6 0.80 6.2 FAIL 1.6 0.80 6.2 FAIL
43
TABLE A20. Copper maximum hazard quotients calculated using year round and limited Snake River Watershed datasets, and both Criteria Maximum Concentration (CMC) and Criterion Continuous Concentration (CCC) (EPA, 2002). EPA copper water quality criteria values were as follows: CMC = 13.0 µg/L and CCC = 9.0 µg/L.
LIMITED DATA YEAR ROUND CMC CCC CMC CCC
Site ID Maximum Measured
(µg/L)
Max. Hazard Quotient
(HQ) Result
Max. Hazard Quotient
(HQ) Result
Maximum Measured
(µg/L)
Max. Hazard Quotient
(HQ) Result
Max. Hazard Quotient
(HQ) Result
SAD 21.7 1.7 FAIL 2.4 FAIL 22.1 1.7 FAIL 2.5 FAIL DAS 1.9 0.10 0.20 2.7 0.20 0.30 SBD 11.8 0.90 1.3 FAIL 14.1 1.1 FAIL 1.6 FAIL MONT 6.3 0.50 0.70 8.9 0.70 1.0 SAP 2.3 0.20 0.30 2.3 0.20 0.30 APENN 2.5 0.20 0.30 0.0 BPENN 95.3 7.3 FAIL 11 FAIL 0.0 BCINN 166.0 12.8 FAIL 18 FAIL 0.0 PAS 59.6 4.6 FAIL 6.6 FAIL 82.0 6.3 FAIL 9.1 FAIL SBP 12.6 1.0 1.4 FAIL 12.6 1.0 1.4 FAIL SANF 5.2 0.40 0.60 5.6 0.40 0.60 NFS 3.3 0.30 0.40 3.3 0.30 0.40 SBNF 4.6 0.40 0.50 4.8 0.40 0.50
44
TABLE A21. Manganese maximum hazard quotients calculated using year round and limited Snake River Watershed datasets, and both acute and chronic thresholds found in the literature (Fey et al., 2001). Manganese water quality criteria values from this source were as follows: CMC = 3320 µg/L and CCC = 790 µg/L.
LIMITED DATA YEAR ROUND CMC CCC CMC CCC
Site ID Maximum Measured
(µg/L)
Max. Hazard Quotient
(HQ) Result
Max. Hazard Quotient
(HQ) Result
Maximum Measured
(µg/L)
Max. Hazard Quotient
(HQ) Result
Max. Hazard Quotient
(HQ) Result
SAD 1440 0.40 1.8 FAIL 1590 0.50 2.0 FAIL DAS 7.0 0.0 0.0 8.50 0.0 0.0 SBD 741 0.20 0.90 1180 0.40 1.5 FAIL MONT 516 0.20 0.70 618 0.20 0.80 SAP 426 0.10 0.50 465 0.10 0.60 APENN 292 0.10 0.40 BPENN 865 0.30 1.1 FAIL BCINN 1800 0.50 2.3 FAIL PAS 960 0.30 1.2 FAIL 1100 0.30 1.4 FAIL SBP 660 0.20 0.80 660 0.20 0.80 SANF 432 0.10 0.50 432 0.10 0.50 NFS 155 0.0 0.20 155 0.0 0.20 SBNF 318 0.10 0.40 318 0.10 0.40
45
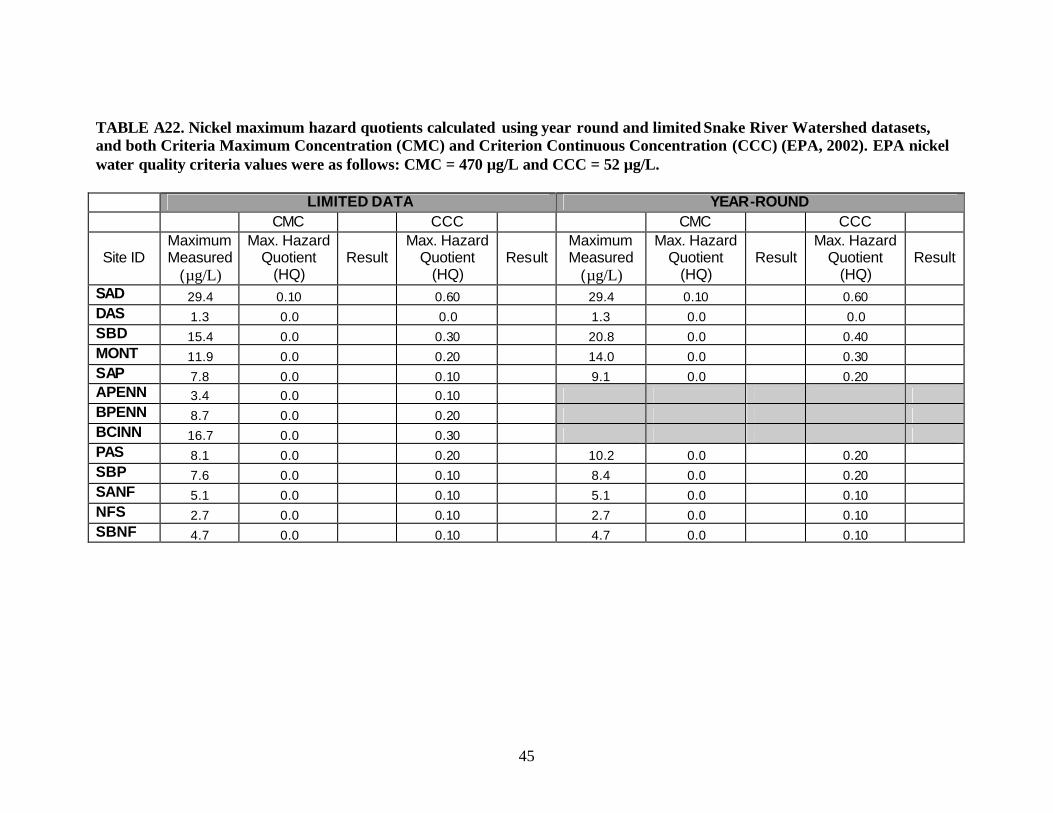
TABLE A22. Nickel maximum hazard quotients calculated using year round and limited Snake River Watershed datasets, and both Criteria Maximum Concentration (CMC) and Criterion Continuous Concentration (CCC) (EPA, 2002). EPA nickel water quality criteria values were as follows: CMC = 470 µg/L and CCC = 52 µg/L.
LIMITED DATA YEAR-ROUND CMC CCC CMC CCC
Site ID Maximum Measured
(µg/L)
Max. Hazard Quotient
(HQ) Result
Max. Hazard Quotient
(HQ) Result
Maximum Measured
(µg/L)
Max. Hazard Quotient
(HQ) Result
Max. Hazard Quotient
(HQ) Result
SAD 29.4 0.10 0.60 29.4 0.10 0.60 DAS 1.3 0.0 0.0 1.3 0.0 0.0 SBD 15.4 0.0 0.30 20.8 0.0 0.40 MONT 11.9 0.0 0.20 14.0 0.0 0.30 SAP 7.8 0.0 0.10 9.1 0.0 0.20 APENN 3.4 0.0 0.10 BPENN 8.7 0.0 0.20 BCINN 16.7 0.0 0.30 PAS 8.1 0.0 0.20 10.2 0.0 0.20 SBP 7.6 0.0 0.10 8.4 0.0 0.20 SANF 5.1 0.0 0.10 5.1 0.0 0.10 NFS 2.7 0.0 0.10 2.7 0.0 0.10 SBNF 4.7 0.0 0.10 4.7 0.0 0.10
46
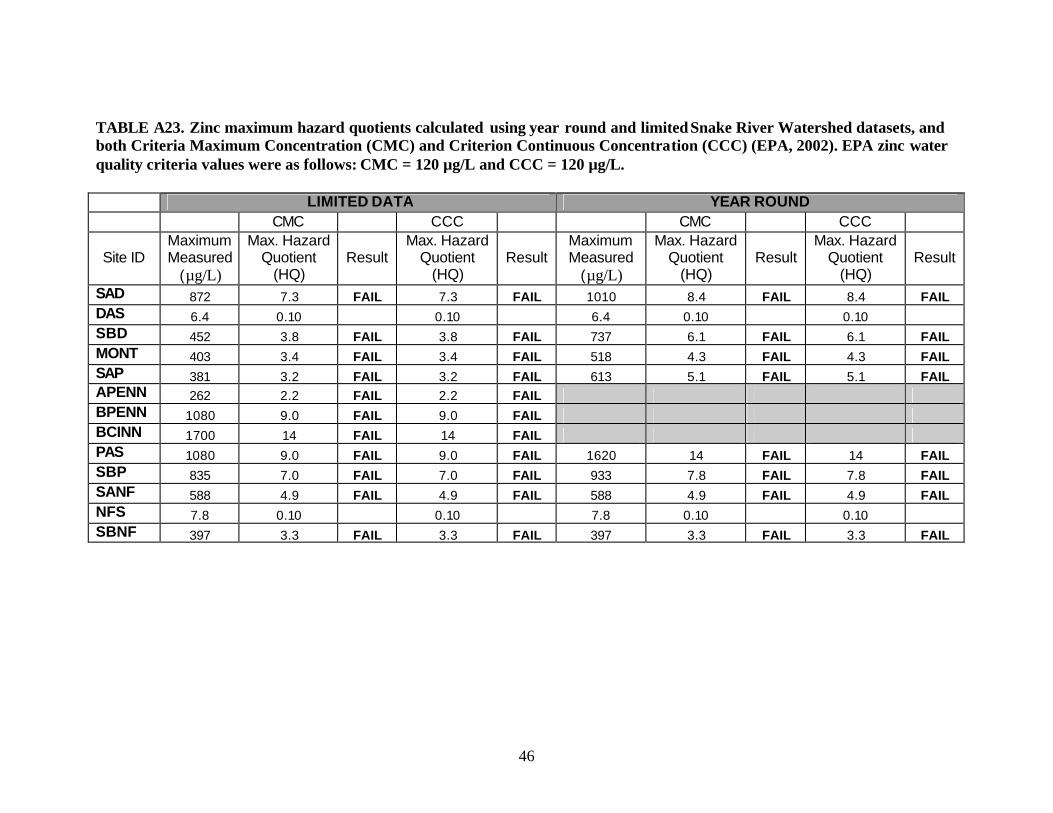
TABLE A23. Zinc maximum hazard quotients calculated using year round and limited Snake River Watershed datasets, and both Criteria Maximum Concentration (CMC) and Criterion Continuous Concentration (CCC) (EPA, 2002). EPA zinc water quality criteria values were as follows: CMC = 120 µg/L and CCC = 120 µg/L.
LIMITED DATA YEAR ROUND CMC CCC CMC CCC
Site ID Maximum Measured
(µg/L)
Max. Hazard Quotient
(HQ) Result
Max. Hazard Quotient
(HQ) Result
Maximum Measured
(µg/L)
Max. Hazard Quotient
(HQ) Result
Max. Hazard Quotient
(HQ) Result
SAD 872 7.3 FAIL 7.3 FAIL 1010 8.4 FAIL 8.4 FAIL DAS 6.4 0.10 0.10 6.4 0.10 0.10 SBD 452 3.8 FAIL 3.8 FAIL 737 6.1 FAIL 6.1 FAIL MONT 403 3.4 FAIL 3.4 FAIL 518 4.3 FAIL 4.3 FAIL SAP 381 3.2 FAIL 3.2 FAIL 613 5.1 FAIL 5.1 FAIL APENN 262 2.2 FAIL 2.2 FAIL BPENN 1080 9.0 FAIL 9.0 FAIL BCINN 1700 14 FAIL 14 FAIL PAS 1080 9.0 FAIL 9.0 FAIL 1620 14 FAIL 14 FAIL SBP 835 7.0 FAIL 7.0 FAIL 933 7.8 FAIL 7.8 FAIL SANF 588 4.9 FAIL 4.9 FAIL 588 4.9 FAIL 4.9 FAIL NFS 7.8 0.10 0.10 7.8 0.10 0.10 SBNF 397 3.3 FAIL 3.3 FAIL 397 3.3 FAIL 3.3 FAIL