Waste Management in the Coastal Areas of the ASEAN Region
217
Waste Management in the Coastal Areas of the ASEAN Region Roles of Governments, Banking Institutions, Donor Agencies, Private Sector and Communities ~. \ ... ' ~.>r. i 'I. Edited by Chua Thia-Eng Len R. Garces II ....-
-
Upload
khangminh22 -
Category
Documents
-
view
3 -
download
0
Transcript of Waste Management in the Coastal Areas of the ASEAN Region

Waste Management in the Coastal Areasof the ASEAN Region
Roles of Governments, Banking Institutions, DonorAgencies, Private Sector and Communities
~.\ ... ' ~.>r.i 'I.
Edited by
Chua Thia-EngLen R. Garces
II
....-

ste Management in the Coastal Areas of the ASEAN Region
Roles of Governments, Banking Institutions, Donor Agencies, Private Sector and Communities
Edited by
Association of Southeast Asian Nations/United States Coastal Resources Management Project
Conference Proceedings 10

SEP 0 3 1992 Waste Management in the Coastal Ateas of the MEAN Region: Roles of Governments, Banking Institutions, Donor Agencies, Private Sector and Communities
Proceedings of the Conference on Waste Management in the Coastal Areas of the ASEAN Region Singapore 28-30 June 1991
EDITED BY CHUA THIA-ENG AND LEN R. GARCES
Published by the: Ministry of the Environment, and Canada-MEAN Centre, Singapore; Asian Development Bank, and International Center for Living Aquatic Resources Management on behalf of the Association of Southeast Asian Nations/United States Coastal Resources Management Project, Philippines
Printed in Manila, Philippines.
Chua, T.-E. and L.R Garces, editors. 1992. Waste management in the coastal areas of the ASEAN region: roles of govern- ments, banking institutions, donor agencies, private sector and communities. ICLARM Conference Proceedings 33, 2 18 p. Ministry of the Environment, and Canada-ASEAN Centre, Singapore; Asian Development Bank, and International Center for Living Aquatic Resources Management, Philippines.
Cover: The conference logo, designed by Aque.
ISSN 01 15-4435 ISBN 971-8709- 10-x
ICLARM Contribution No. 740

Contents
Preface v Foreword vii Foreword ix
Opening Ceremonies Waste management in the ASEAN region: challenges and directions. T.-E. Chua 1 Singapore's efforts in toxic waste management. A. Mattar 5 Waste management in coastal zones: the role of multilateral development banks. I.Y. Chung 9
Session 1: Waste Management in the MEAN Region: Status, Trends and Problems
Waste management in the coastal area of Brunei Darussalarn. M.W.R.N. De Silva. Hj. Samat bin Hj. Abas, Hj. MOM. Zakaria bin Hj. Serudin and C.V. Agbayani 13
Environmental impact management in Indonesia. N. Makarlm 33 Wastewater management in Malaysia. A.B. Jaafar 37 Solid and hazardous waste management in the Philippines. D.J. Ganapin, Jr. 41 Status and trends of waste management in Singapore. E.G. Tan 57 Problems and trends of waste management in Thailand. P. Taranatham 71
Session 2: Waste Management Options Solid waste management in developing countries. D.C. Wilson and C. NaZr 77 Ecological impacts of waste disposal in the coastal and marine environment.
H.D. V a n Veldhuizen and N. Aragones 91 Solid waste management in Singapore. H.S. Lim and D. Tan 99 Assessment of waste management in the ASEAN region. K.B. Lee and S. Troxler 103 Incineration technology and refuse disposal. T.K. Rarnstetter and P. Phua 139
Session 3: Economic Implications and the Role of Political Leadership in Waste Management
The role of political leadership in improving the environment. F.S. Factoran, Jr. 143 The economics of coastal waste management. K.D. Russell 149 The role of government in waste management: the Metro Manila experience. J. Binay 165
Session 4: Role of Donor/International Agencies, International Banking Institutions and the Private Sector in Waste Management
The implementation constraints in waste management in Malaysia. H.D. Law 169

Coastal waste management and the United Nations Conference on Environment and Development 1992. J.P. Bell 173
The privatization of waste treatment and management facilities. T.G. Smith 179
Session 5: Community Awareness and Participation in Waste Management
Local government initiatives in waste management. C. Phromlert 185 Public awareness and education towards waste management. M.S. Satorre, Jr. 189 The role of nongovernmental organizations in waste management. R. Senthirqjah 193
Summary and Recommendations Waste management in the coastal areas of the ASEAN region: a need for action.
T.-E. Chua, L.R. Garces and C.J. Edmonds 197 Singapore resolution on waste management in the coastal areas of the ASEAN region. 207
Closing Ceremonies Note of Appreciation. R.T. DakQn 21 1 Closing Remarks. T.-E. Chua 212
Appendices Program of Activities 2 13 List of Participants and Resource Persons 215

Preface
Every year. the world produces millions of tons of household garbage, industrial waste and sewage, the disposal of which has now become a major environmental problem. In industrial- ized nations, each consumer throws out an estimated 1.6 kg of garbage every day. As a result, sanitary landfills are filling up at an alarming rate. New disposal sites are scarce.
In developing nations. the average consumer produces a relatively lesser amount of garbage. i.e.. about 0.45-0.90 kg daily, but these countries have great financial difficulty in collecting all of it properly. In Manila, for example, only 70% of the garbage is being collected.
Furthermore, because environmental regulations are not as stringent or as well enforced as those in the developed nations, most garbage is dumped directly into the sea, typically in nearshore waters. The refuse, however. is eventually deposited in wetlands, coral reefs and seagrass beds. In some cases, these ecologically fragile habitats are used as disposal sites. The refuse clogs up water conveyance structures and litters tourist beaches causing aesthetic losses.
In some nations, sewage undergoes primary treatment before its release into the sea. Yet. organic pollution has been obvious in many nations in Asia, especially those with dense popu- lations along their coasts. Eutrophication in coastal waters due to nutrient enrichment has led to increased blooms of toxic phytoplankton and altered benthic communities, posing serious risks to ecosystems and public health.
Current trade and investment policies in many developing nations favor accelerated indus- trial development, which has led to the increasing discharge of untreated industrial waste into the coastal waters. Toxic chemicals such as cadmium, arsenic, mercury, lead, zinc, polychlori- nated biphenyls, acids, alkalis and oily waste enter the coastal systems through the waterways. The inexorable buildup of poisons, if unchecked, will soon become a serious environmental and public health crisis. In Hong Kong alone, close to 101,000 t of chemical waste are discharged directly into the sea by over 10,000 factories.
Industrial waste management has always been a serious technical problem even in industri- alized nations. The main issue in developing nations is the lack of financial resources to deal with it. Most decisionmakers are aware of the need to protect the environment, but consider it a low priority compared to the pressing need for food production, employment generation and foreign exchange earning. Political leaders usually do not want to take the risk of losing votes by imposing taxes for services such as sewage treatment and garbage disposal; neither is there a strong political will to implement environmental regulations and invoke the "polluter pays" principle. As a result, the problem of environment and human health loss resulting from improper waste disposal is quite high in many developing nations.
While many Asian countries are facing critical environmental problems, newly industrialized nations are prepared to spend a considerable amount of their national budget in cleaning their waters. This is partly due to increased public pressure for a healthier environment and mainly because waste management presents a newly emerging industry which provides opportunity for economic growth and sustainability. Hong Kong already has a thriving export trade in waste materials; in 1988, it exported HK$2.17 billion worth of waste metals and papers. Taiwan. Hong Kong and South Korea are expected to spend US$5 billion in the next five years for waste management. This will provide more opportunities for Western and Japanese companies to sell

their technologies and equipment. In other developing nations, public pressure for clean envi- ronment and an awakening to current environmental crises have made policymakers aware of their responsibility to address these issues seriously. Waste disposal has become a serious environmental issue that national governments can no longer avoid or ignore.
Waste management was one of the issues raised at the Conference on Managing MEAN'S Coastal Resources for Sustainable Development in Baguio, Philippines, on 4-7 March 1990, which led to the Conference on Waste Management in the Coastal Areas of the ASEAN Region held in Singapore on 28-30 June 1991.
This conference aimed to assess the severity of environmental threats of waste disposal to the region's coastal zone; demonstrate technologies in waste management; explore ways in which international banking institutions and donor agencies could assist in waste manage- ment: and solicit the commitment of ASEAN political leadership in the effective enforcement of waste management schemes.
The highlights of the conference were the adoption of the Singapore Resolution on Waste Management in the Coastal Areas of the ASEAN Region. the stronger commitment from policy- makers, and the participation of private sectors in present and future waste management activities.
Organized under the auspices of the MEAN/US Coastal Resources Management Project (CRMP) of the International Center for Living Aquatic Resources Management (ICLAFZM), the conference was co-organized by the Singapore Ministry of the Environment (ENV). It was sponsored by the United States Agency for International Development. Asian Development Bank and the Canada-MEAN Centre. We appreciate the full cooperation of the session chair- men and coordinators, resource speakers and discussants, and the Secretariat, namely, Mr. Lim Chuan Poh and Mr. Eng Tiang Seng and their staff at ENVI. Our special thanks to Maylene Loo and Beverly Goh of the National University of Singapore, and Cory Guerrero, Len Garces and Rachel Josue of ICLAFZM. We acknowledge the ICLARM editorial staff who provided support in the preparation of these proceedings: Marie Sol M. Sadorra, Pamela P. del Rosario and Katherine I. Chua assisted in the editing; Rachel Josue and Teresa Cruz typed the manuscript: Rachel Atanacio and Reynaldo Silvestre prepared the figures and layout.
Chua Thia-Eng Project Coordinator ASEAN/US CRMP and Director Coastal Area ~ a G g e m e n t Program. ICLARM

Foreword
Concerns about the environment have emerged as a global preoccupation. They coexist with the continuing, huge requirement for development through the concept of sustainable development.
Nowhere in the world does the confluence of environment and development occur more dramatically than in the MEAN region. Its rapid economic growth is the envy of the world, but the people and governments of ASEAN know that these advances can only be maintained and continued if the development takes place in an environmentally sustainable manner.
With its thousands of kilometers of shoreline, ASEAN is directly concerned with the question of waste management in coastal areas. Canada is concerned with the same issues; we too have a huge coastline and archipelago.
We are therefore pleased to be co-sponsors of this conference. Its findings are important not only to the ASEAN region itself, but also to Canada and all other countries which share a commitment to sustainable development.
Ian B. Robertson Executive Director Canada-MEAN Centre

Foreword
The rapid economic and demographic growth taking place in the coastal areas of many Asian countries has been accompanied in recent years by heightened awareness of its environmental repercussions. Overfishing, destructive fishing and indiscriminate conversion of mangroves to aquaculture have lowered the productivity of rural coastal environments. In urban coastal areas, household and industrial waste disposal demand has typically outstripped the ability of municipal systems to prevent environmental deterioration and increased public health risk.
These problems have been recognized by the Asian Development Bank (ADB) for some time. The design of ADB projects has come to pay greater attention also to the growing interdepen- dence of economic activities within coastal zones as well as the links between the environmen- tal condition of coastal areas and economic activities taking place at some distance from the coast.
The ADB's interest in this complex subject is a reflection of the concerns of its member- countries, many of which have long coastlines or are island nations. Among ADB's developing member-countries, those of the ASEAN have been active in their search for best responses to the conflict between rapid economic growth and coastal environmental degradation.
We are pleased to have been associated with the preparation of the Conference on Waste Management in the Coastal Areas of the ASEAN Region and to have provided funding support and some of the technical inputs for the conference.
We wish to express our appreciation to the Ministry of the Environment of the Republic of Singapore for the generous support it extended to the conference organizers and to our co- sponsors, the United States Agency for International Development and the Canada-MEAN Centre.
K.F. Jalal Chief Office of the Environment Asian Development Bank

Opening Ceremonies
Waste Management in the AsEAN Region: Challenges and ~irections*
CHUA THIA-ENG International Center for Living
Aquatic Resources Management MC P.O. Baw 1501
Makati, Metro M d Philippines
CHUA, T.-E. 1992. Waste management in the ASEAN region: challenges and directions, p. 1-3. In T.-E. Chua and L.R Garces [eds.) Waste management in the coastal areas of the ASEAN region: roles of gov- ernments, banking institutions, donor agencies, pri- vate sector and communities. ICLARM Conference Proceedings 33, 218 p. Ministry of the Environment, and Canada-ASEAN Centre, Singapore; Asian Devel- opment Bank, and International Center for Living Aquatic Resources Management, Philippines.
ABSTRACT
Waste and pollution problems not only pose ecological risks but also have far-reaching socioeconomic implica- tions which governments in the ASEAN region should conslder seriously. Efforts in waste management require political will, public support and multilateral coopera- tion. In addition, low-cost technologies need to be explored, and reuse and recycling promoted as viable waste management methods.
It gives me great pleasure to welcome all of you on behalf of the conference organizers. the Ministry of the Environment of the Republic of Singapore and the ASEAN/US Coastal Resources Management Project of the
International Center for Living Aquatic Resources Management. I am glad to see among us ministers, governors, parllarnen- tarians and senior government officials of the MEAN region and representatives of multi- lateral banking institutions, donor agencies, nongovernmental organizations and the pri- vate sector.
This conference, which also has the finan- cial support of the Asian Development Bank and the Canada-MEAN Centre, aims for an interchange of information and ideas on the pressing issue of waste management. Specifl- cally, this gathering has a fourfold objective, namely:
assess the severity of the environ- mental threats posed by waste disposal, especially to the coastal zone in the ASEAN region; explore and demonstrate the avail- ability of technologies (especially low- cost ones) and methods in waste management that are appropriate for developing nations; explore ways in which international banking institutions and donor agen- cies could assist the region in devel- oping and implementing waste man- agement schemes; and
Welcome Address delivered during the Opening Ceremonies of the Conference on Waste Management in the Coastal Ateae of the ASEAN Region on 28 June 1991 at the Marina Mandsrtn, Singapore. ICLARM Conhibutton No. 823.

solicit the commitment of ASEAN political leadership in the effective implementation of environmental reg- ulations and waste management schemes.
Incidentally, this conference is the offshoot of the successful ASEAN/US Policy Confer- ence on Managing ASEAN's Coastal Resources for Sustainable Development held last year in Baguio. Philippines.
Waste management in the coastal zone is imperative because this zone is the most vul- nerable and most heavily utilized among the major resource systems. This is a result of the ever-increasing coastal population and the attendant economic pressures. Roughly 70% of the region's population lives in and depends on the coastal areas for their liveli- hood.
The current rates of population growth and industrialization, consumption lwel and inadequate waste disposal methods all con- spire to make garbage mountains a common spectacle in some coastal areas in the region. A typical resident of the region disposes of on average, approximately 0.5 to 1 kg of solid waste every day.
Wastes can be classified according to ori- gin. The domestic front produces solid and liquid waste which are disposed of in landfills and in the seas. The high concentration of industries along the coast gives rise to serious pollution problems which heavily degrade the environment. Because the rivers, streams and seas are being used as the cheapest and easiest disposal sites, many of them are either dying or dead.
Experts recognize a solid waste manage- ment hierarchy that has source reduction at the top of the list. They believe that one of the best and the most difficult of solutions to the garbage problem is avoiding garbage genera- tion in the first place. Next is direct reuse of products and then recycling which is simply the recovery and conversion of waste materi- als into new products. The fourth option is incineration or the burning of waste. And the last resort is supposed to be landfilling, ironi- cally the most popular in the world.
Waste and pollution are not just national or regional problems. Wastewater pollution. for example, does not recognize national boundaries. It also aEects waters of neigh- boring nations. Clearly, the issues are
transnational in scope as we live in one world, a world that will give up on us unless we have an agenda for change particularly in the field of waste management.
The waste problem is not only an ecological risk. It has also far-reaching socioeconomic implications that governments today should consider seriously. Degrading environmental quality threatens public health. The cost of mitigating measures are prohibitive. One of the major problems encountered in many developing nations is the large cost needed to implement effective waste management pro- grams. A developing country with 60 million people may need as much as US$1 billion a year to clean both solid and liquid wastes and to maintain their infrastructure. This will have a far-reaching political implication if public funds are used. The problem of unpopular government measures to levy taxes often compels lawmakers to make waste management a low priority in the hier- archy of national concerns.
As we examine the country situations and issues during this conference, measures to curb the problems will be discussed and applied, if feasible.
The agenda for waste management requires strong political will, public support and mul- tilateral cooperation. Governments can build a framework of initiatives to reduce the amount of waste requiring disposal. They can promote source reduction. reuse and recy- cling as viable management strategies that cut waste and foster more resilient, diverse, self-reliant and sustainable economies. National recycling plans should be adopted. with convenient facilities for collection and exchange of used goods. Decentralized col- lection and processing of secondary materials can create new industries and jobs. Markets for "recyclables" should be consistently avail- able for the success of recycling programs. The public and private sectors should support recycling by buying materials recov- ered from waste. The concept of "polluter pays" must be examined more carefully regarding its implementation in the develop- ing nations.
Low-cost technologies have to be explored and adopted. Some technologies may even turn waste management into a profitable enterprise. ,Other potential benefits include reduction in pollution and imports, ernploy-

ment generation, and the conservation of raw materials and energy. In other words, we should now look at the issue of waste man- agement not only from the standpoint of social obligation but also as an economic opportunity. On this note, the private sector can play a significant role.
The government cannot handle waste man- agement by itself. Its efforts should be com- plemented by the joint forces of the media and the nongovernmental organizations to educate the public on limiting waste genera- tion and disposal and effective recycling as an added source of income. The public aware- ness campaign should be geared toward the
mobilization of mass commitment to sound waste management.
International cooperation is also important. The invaluable support of multilateral bank- ing institutions and donor agencies is there- fore sought especially in financing innovative solutions to waste management problems. Adequate funding and attention can help develop alternatives to traditional landfills and dumpsites as well as upgrade waste storage, collection and disposal for environ- mental safety in the developing countries.
I welcome you once again to what promises to be a fruitful conference.
Thank you.

Singapore's Efforts in Toxic Waste Management*
AHMAD MATTAR Ministry of the h w f r o ~ n e n t
~ironme~BBufldlng 40ScottsRoad Singapore 0922
MATTAI?, A. 1992. Singapore's efforts in toxic waste management, p. 5-7. In T.-E. Chua and L.R Garces [eds.) Waste management in the coastal areas of the ASEAN region: mles of governments, banking institu- tions, donor agencies, private sector and communities. ICLARM Conference Proceedings 33, 218 p. Ministry of the Environment, and Canada-ASEAN Centre, Sin- gapox; Asian Development Bank, and International Center for Living Aquatic Resources Management, Philippines.
ABSTRACT
Because of the growing concern for environmental degradation, the need for international cooperation in pmtecting the environment has become more urgent. However, efforts to safeguard the environment must begin in each nation. In Singapore, for example, current efforts are towards managing toxic wastes. By June 1992, the sale of zinc carbon and alkaline batteries with more than 0.001% and 0.025% mercury by weight per cell, respectively, will be prohibited. In addition, impor- tation of batteries containing mercuric oxide will be banned by January 1992.
Let me first extend a warm welcome to all participants to this conference jointly orga- nized by my ministry and the International Center for Living Aquatic Resources Man- agement (ICLARM). For any coastal country, successful waste management is an impor-
tant step toward safeguarding coastal resources. I am glad that in cooperation with ICLARM, we are able to bring together many experienced policymakers, experts and mem- bers of financial institutions here today to exchange views on this important subject.
The world's first conference on the envi- ronment was held in Stockholm. Sweden, in 1972. It was then that the issues of global environmental degradation were first brought to the attention of the international commu- nity. Unfortunately. the follow-up warnings by scientists and environmentalists went unheeded for more than a decade. It was not until the 1980s that the world community began to show its concern for the future of our planet earth.
The publication of Our Common Future in 1987 by the World Commission on Envi- ronment and Development acted a s a catalyst for a concerned worldwide effort to preserve the environment. It is indeed encouraging that 20 years after Stockholm, the world community will meet in Rio de Janeiro, Brazil, to deal with the threat of environ- mental degradation.
Preparations for the Brazil conference con- tinues to produce many interesting ideas in response to the various environmental con- cerns. Whether or not mankind can effec- tively implement these ideas will depend on
'Opening Remarks delivered during the Opening Ceremonies of the Conference on Waste Management in the Coastal Areas of the ASEAN Region on 28 June 199 1 a t the Marina Mandarin, Singapore.
5

whether a consensus can be forged among nations. This is indeed not an easy task
Till today, there remains a general lack of agreement at the international level on how countries should cooperate. The differences in perception between the North and the South on issues such as accountability. fmancial responsibility and technology transfer continue to plague negotiations for global solutions.
The solutions will inevitably require a global partnership of the developed and developing countries. This partnership can only be effective if the developed countries which have the technical expertise and finan- cial capability assist developing countries in participating in programs to halt global envi- ronmental threats.
Growth and development in any country cannot be sustained if the environment is not properly managed and protected. Developed countries must to this end see that it is also in their interest to help the developing world achieve sustainable growth if they wish to count on them as long-term trading partners. In this regard, developing countries must cooperate between and among themselves. sharing experiences, expertise and technolo- gies in dealing with environment and devg- opment .
The need for international cooperation in protecting the environment is critical. Yet efforts to safeguard the environment must begin at home.
Many countries today face problems of urban drift. People are attracted to the cities which promise better-paying jobs and excit- ing lifestyles. As a result, cities have often grown at a pace unmatched by the slow devel~pment of facilities and systems needed to protect the environment, e.g., systems for wastewater collection and treatment and solid waste management. Without these, urban pollution finds its way into rivers and subsequently into the sea, threatening marine and coastal habitats as well as resources.
We are fortunate in Singapore to have developed systems for comprehensive sewer- age and solid waste management which have helped prevent pollution. These have cleaned up Singapore and Kallang Rivers, once major conveyors of pollution to the sea.
According to the report of the Co-ordinating Body on the Seas of East Asia-United Nations Environment Programme Seminar on the Assessment and Environmental Impact of Pollution from Land-based Sources in ASEAN held in Singapore on 25-27 January 1989. land-based sources of pollution indeed contribute greatly to pollution in the sea. This conference is therefore timely.
Waste management has become more com- plicated as our society becomes more depen- dent on modem technology. A greater variety of materials and products is produced in this consumer age and many inevitably end up as waste. Unfortunately, some pose environ- mental problems.
Take the example of batteries. Seemingly harmless, batteries in all shapes and sizes are widely used today. If not properly dis- posed of, batteries can pose a threat to the environment because of their toxic chemicals. Recycling used batteries is the best way, pro- vided suitable facilities and technologies are available. The only other alternative is dis- posal by controlled landfd.
Toxic chemicals commonly found in bat- teries are mercury and cadmium. The mer- cury content of batteries, however, is being considerably reduced by advances in technol- ogy and the establishment of standards in Japan, the European Community and Nordic countries. Cadmium in rechargeable batteries will soon be reduced and recycled with the broad support of the public.
In this respect. Singapore has these devel- opments. Starting 1 June 1992. the sale of the following will be prohibited: zinc carbon batteries with more than 0.001% mercury by weight per cell and alkaline batteries (except those in button form) with more than 0.025% mercury by weight per cell.
Imported mercuric oxide batteries will not be allowed in Singapore after 1 January 1992 and existing stocks will have to be sold before 1 June 1992. Their use. however. for special medical equipment such as hearing aids shall be allowed until alternatives are found.
The Ministry of the Environment will work closely with local dealers and distributors on a scheme to recover nickel cadmium batteries for recycling. We hope the scheme could be in place by January 1992.
Singapore is committed to the protection of the environment at the local, regional and

international levels. We see economic devel- opment and good quality environment as the means to a better quality of life. It has now become clear that we must now add to this the need for a safe global environment if we are to leave behind a heritage of value to our future generations.
This conference is important as it brings into focus a key problem in the region. We are blessed with a very rich natural environ-
7
ment on land and at sea. We must ensure these are preserved for our children and our children's children.
I wish you all a fruitful and productive round of discussions over the next three days. I look forward to your forthcoming rec- ommendations.
On this note, it is my pleasure to declare open the Conference on Waste Management in the Coastal Areas of the ASEAN Region.

Waste Management in Coastal Zones: The Role of Multilateral Development Banks*
IN YONG CHUNG Asian Development Bank
6 ADB Avenue 150 1 Mandaluyong, Metro Manila
Philippines
CHUNG, I.Y. 1992. Waste management in coastal zones: the role of multilateral development banks, p. 9- 12. In T.-E. Chua and L.R. Garces (eds.) Waste management in the coastal areas of the ASEAN region: roles of gov- ernments, banking institutions, donor agencies, pri- vate sector and communities. ICLARM Conference Proceedings 33, 218 p. Ministry of the Environment, and Canada-ASEAN Centre, Singapore; Asian Devel- opment Bank, and International Center for Living Aquatic Resources Management, Philippines.
ABSTRACT
This paper discusses the role of multilateral banks such as the Asian Development Bank (ADB) in promoting economic and social development in the ASEAN region. The ADB looks into technological solutions a s well as legislative and policy approaches that can deal effectively with urban and industrial waste in coastal areas. It helps the environmental cause through investment support and policy agenda.
It is a pleasure for me to address this important and timely conference.
Growing populations and rapidly changing economies are having severe effects on coastal and marine resources of the Asia- Pacific region. In many countries, fisheries
resources are being rapidly depleted. In others, estuaries and mangroves are being seriously threatened. Damage to coral reefs, meanwhile, has become a matter of grave concern. Many of these problems are related to existing practices of natural resources management along the coasts.
Of the ADB's 51 member-countries. only five are landlocked. All 'be rest have direct access to the sea and several are island nations with coastlines that are second to none. Among ADB's developing members, the countries of ASEAN stand out. Proximity to the sea and a long history of using similar marine and coastal resources are features that unite ASEAN member-nations.
It is no surprise, therefore, that a sense of "shared resource endowments" has devel- oped. Or, that the growing threat to coastal areas has begun to raise deep concern. ASEAN's interest in the future of its coastline is common to all its members. This conf'er- ence is good proof of this. The productivity and value of these resources, with and with- out proper coastal management, will depend on the course of action governments take now. Your discussions during this conference can affect the outcome when decisions reached at this meeting find their way home.
Xeynote Address delivered during the Opening Ceremonies of the Conference on Waste Management in the Coastal Areas of the ASEAN Region on 28 June 199 1 at the Marina Mandarin, Singapore.
9

Headquartered in one of ASEAN's capital cities, ADB has had ample opportunity to witness changes in the coastal environments. Moreover, its strategic location allows for a better understanding of existing environ- mental conditions.
ASEAN member-countries have been among ADB's largest borrowers. Most ADB assistance has little to do with coastal areas and their management. However, many loans are related directly or indirectly to coastal and marine resources on the one hand, and to waste disposal on the other.
The ADB helps to promote economic and social development in the region. We rely on our developed member-countries for capital. technologies and experience. For example. coastal resources management (CRM) in Japan and Holland. where population densi- ties are high and economic activity is con- centrated along the coast. is highly relevant for several ASEAN coasts. The need for sound management of the northern coast of Java, Thailand's eastern seaboard and Manila Bay comes to mind.
In drawing lessons from these and other developed countries, ADB looks for techno- logical solutions and legislative and policy approaches that can deal effectively with urban and industrial waste in coastal areas. two of the most pressing problems in the region.
MEAN member-nations, like most of our developing member-countries, face a host of other problems which damage coastal resources. The ADB is trying hard to respond to these problems.
When ADB first opened its doors for busi- ness 25 years ago, the main development tasks in most ASEAN member-countries were to increase agricultural productivity and to use the region's underutilized resources bet- ter, especially its labor force. Agro-processing and industrial activities were promoted.
Rapid population growth brought heavy concentrations of people along the coast. The strains and pressures of these increases were felt acutely in coastal zones. even though their impact on the resources were less visi- ble than the impact of population growth on forests, for example.
Early environmental concerns in coastal areas centered on declining fisheries produc- tivity and on destructive fishing practices.
During the 1970s and 1980s. environmental pressure on coastal resources increased alongside the rapid growth of coastal aqua- culture, especially within ASEAN. It soon reached a point at which the benefits of greater use of coastal resources were out- weighed by indirect losses caused by the large-scale disappearance of mangrove and other original habitats. Associated problems quickly emerged, reminding policymakers and development banks of the fragile interde- pendence between natural habitats and resources.
Environmental inquiry increased in range and intensity. Institutions like ADB began to examine more closely the effects of economic activities on coastal environments. Con- tributing factors, both in and outside coastal zones, came to be better understood.
In studying the destruction of coral reefs, it would be normal for ADB today to consider both destructive fshing methods and silta- tion caused by rapid deforestation in nearby watersheds.
Similarly, threats to coastal environments can no longer be discussed without referring to toxic effluents that originate long distances from the coast.
Nowadays, it is also more readily accepted that substantially changed river hydrology, linked as it is to increasing irrigation, land reclamation and inland hydroelectric projects ' can have unintended consequences for coastal areas.
Recognizing this crucial interdependence, policymakers are forced to reassess both the methodology behind their approach to envi- ronmental problems in coastal areas and the policies designed to keep these areas produc- tive and safe.
Today. the concept of CRM has become widely accepted among the developing coun- tries of the region which now evaluate the adequacy of existing institutions that resolve the problems affecting coastal areas.
Unfortunately, the environmental problems of urban coastal areas are too often either ignored or treated separately from pressing inner-city problems. The assumption, per- haps, is that coastal populations near urban areas are somehow immune to the conse- quences of environmental degradation. This kind of thinking is wrong.

Poor air quality and pollution of urban stretches of rivers, both more "visible." then tend to be much higher on the list of con- cerns than the effects of the combined urban and industrial pollution load on coastal areas. In the absence of sound industrial waste disposal legislation and its enforce- ment, the disposal of untreated waste into the sea usually emerges as the most accept- able interim solution. This problem is com- mon to many ASEAN urban-industrial cen- ters.
Up until now, plans to develop urban pub- lic health infrastructure in coastal areas have largely ignored the link between various waste disposal alternatives and the deterio- rating coastal environment. The tendency to treat the sea as a bottomless dumping ground may, in the short term, make up for weak waste disposal policies. But, in the long run, this thinking is short-sighted and must be reversed. It has already created public health problems and has detracted from the search for promising new alternatives which would treat coastal areas as an integral part of the broader urban landscape.
The links that exist among different types of ADB-financed activities and their impact on coastal environments are, admittedly, somewhat complex. This is particularly true for urban/industrial coastal zones.
The ADB activities are designed to promote sustainable income growth through projects that improve social infrastructure and pro- vide irrigation, power generation and trans- mission, etc. Our standard practice is to subject all projects particularly those that might harm the environment to a rigorous environmental impact assessment to estab- lish clearly a balance between project benefits and potential environmental costs, though many environmental impacts remain impre- cisely quantified or even unquantified.
A grcnnring proportion of ADB lending has been earmarked to "directly" improve the state of the environment where deterioration is most serious. We do this through invest- ment support, e.g.. to control industrial pol- lution and through policy agenda. The policy agenda aims to help our developing member- governments modify the economic behavior of environmental polluters so that environ- mental targets can be reached at the lowest possible resource cost to society. This assis-
tance may include an enforcement or legisla- tive component.
The ADB experience points to at least three important conclusions.
First, whether in an urban/industrial or rural development context, coastal areas can no longer be treated in isolation from inland economic activities.
Second, eliminating altogether waste dis- posal in the sea is probably not a realistic option. It is urgent to eliminate "unmanaged waste disposal. The choice of the quantity or the kind of disposal is ours. This will depend not only on a better understanding of the physical interdependence between coastal resources and inland economic activities, but also on a more complete quantification of the economic consequences of continued coastal zone deterioration. This enlarged under- standing would make policy choices easier.
Third, the standards applied to the practice of waste disposal in the sea cannot be dis- cussed independently of environmental legislation and each country's environmental policy emphasis. Certain types of waste dis- posal in the sea might be socially or even globally superior to forms of disposal on land or vice versa. I hasten to add that waste minimization may be the best option of all. The important principle to defend is that of objective inquiry based on a balanced evalu- ation of all the alternatives.
While the extent of waste disposal into the sea must be considered a policy variable of changing economic parameters, the practice of coastal zoning for conservation or specific uses must remain an important part of the overall policy approach. Various coastal landfill options also deserve our attention. These become particularly interesting once the questions of financing and cost recovery are introduced.
The success in managing wastes along ASEAN coastlines will also depend a great deal on the policies and institutional support directed at small-scale industries which tend to be no less polluting than the large-scale industrial units. The small-scale industrial sector is, perhaps, the most difficult to mon- itor and regulate.
Indeed, for most ASEAN cities, more satis- factory solutions to the problem of coastal pollution will be possible once coherent

industrial strategies for small- and medium- sized industries are put into place.
Coastal and marine resources provide cru- cial economic support along ASEAN coasts and in the hinterland. Degradation of ASEAN coastal environments can no longer be ignored. The severity of the threat is known to all of us. That's why we are here. The ADB, for its part, is prepared to do more to help
ASEAN member-nations develop schemes to preselve coastal ecosystems and to ensure that coastal areas realize their development potential and be productive for generations to come.
I wish you success in this important con- ference and look fonvard to the results of your deliberations.

Session 1: Waste Management in the ASEAN Region: Status, Trends and Problems
Waste Management in the Coastal Area of Brunei Darussalam
M.W.R.N. DE SILVA Department 0jFlsherie.S
Ministry ojlndustry and Primary Resources P.O. Box2161
Bandar Seri Begawan 2068 Brunei Darussalam
H.H.A. SAMAT Public Works Department Ministry of Development
Old Air Port Bandar Seri Begawan
Brunei D a r u s s h
H.M.H.S. ZAKARIA Department ojTown and Country Planning
Ministry of Development Old Air Port
Bandar Seri Begawan Brunei D a r u s s h
C.V. AGBAYANI ASEAN/US Coastal Resources Management Project
Department 0jFiShelies Ministry of Industy and Primary Resources
P.O. Box 2161 Bandar Seri Begawan 1921
Brunei Darussalam
DE SILVA, M.W.RN., H.H.A. SAMAT, H.M.H.S. ZAKARIA and C.V. AGBAYANI. 1992. Waste management in the coastal area of Brunei Darussalam, p. 13-31. In T.-E. Chua and L.R Garces (eds.) Waste management in the coastal areas of the ASEAN region: roles of gov- ernments, banking institutions, donor agencies, pri- vate sector and communities. ICLARM Conference Proceedings 33, 218 p. Ministry of the Environment, and Canada-ASEAN Centre, Singapore; Asian Devel- opment Bank, and International Center for Living Aquatic Resources Management, Philippines.
ABSTRACT
Waste management problems in the coastal area of Brunei Darussalam are considered minimal. Specid concerns include the dumping of solid waste into Sungai (Sg., which means river) Brunei in Kampong (Kg., which means village) Ayer and the indiscriminate disposal of abandoned vehicles. The solid waste generation rate is estimated at 1 kg/capita/day. Waste collection and disposal is done by municipal boards (MBs) and district offices (DOs). The Public Works Department (PWD) is

Temburong
Fig. 1. Negara Brunei Darussalam and its districts (Chou and Halidi 1987).

responsible for road cleanliness. The common waste disposal systems are open burning dumpsites and sani- tary landfills. Main sewerage is provlded only in urban areas, which have 13 sewage treatment works (STWs). Outside the sewered catchments, septic tanks are used. Recommendations include the zonation of industries for toxic waste and pollution control, new sewage treatment plants (STPs) and sewer lines for sewerage efficiency. Plans for Kg. Ayer include an extensive communal bin system and transfer stations for solid waste management (SWM) and a vacuum sewer system.
BACKGROUND
Brunei Darussalam is situated on the northwestern coast of the island of Borneo. between east longitudes 1 14" 23' and 1 15" 23' and between north latitudes 4" and 5" 5'. It shares a common border with the eastern Malaysian state of Sarawak, which cuts across Brunei (Fig. 1).
The country's high per capita income esti- mated at US$17,000, the favorable balance of payment and the relatively small population has enabled the country to enjoy a high stan- dard of living. Since the discovery of oil in 1929, the country has gradually moved towards an economy based on petroleum exploitation which reached its zenith in the late 1970s. With the government's consema- tion policy on petroleum extraction and the interest in diversifying the economy, attention has begun to focus on the industrial devel- opment of other resources. Rapid industrial- ization, urbanization and population increases are bound to make additional demands on all services, including those of waste management. In anticipation of the country's future needs, the government has taken several steps to alleviate the waste management problems. The recomrnenda- tions of several commissioned studies on solid and liquid waste management have been implemented or are being studied for implementation.
Geology, drainage, soils, climate, demogra- phy, activity patterns in the coastal area and other factors need to be considered because they directly or indirectly affect waste man- agement in the coastal area.
In this paper. the term coastal area is defined as "1 krn landward from shore extending out seawards to the 20-fathom
isobath (Chou and Halidi 1987). In addition. the estuaries of important rivers--Sg. Temburong, Brunei, Tutong and Belait--and areas reached by tides are considered part of the coastal area (Fig. 2). Coastal area management is vital for the protection and conservation of the coastal environment.
The significance of the Brunei Darussalam coastal area
Brunei Darussalam is a relatively small coastal state in Southeast Asia with a 130- km coastline bordering the South China Sea (DOTCP 1987a). Its urban centers are coastal and more than 85% of its population lives in the coastal zone. Much of the economic activities, including the country's most important economic activity, oil and gas exploitation, occurs in this zone.
Economic and Social Benefits of the Coastal Area. Many social and economic benefits are derived from the coastal area which includes the urban towns of Bandar Seri Begawan (the capital city), Seria-Belait, Muara and Tutong.
Gross domestic product (GDP). In 1988, economic contributions from the coastal area constituted more than 90% of the total GDP (at 1974 constant prices). The highest contri- bution (59.5%) came from the oil and gas industry. Other contributions came from fisheries, mangrove harvesting, water trans- portation, beach sand mining, agriculture, other industries and services.
Employment. Employment generated by economic activities in the coastal area is approximately 81% of the total private sector employment. But, the government remains the most important source of employment in the country.
Food. Approximately one-half of the fresh fish and shrimp consumed in Brunei Darus- salam come from the local fisheries industry. Vegetables, fruits, poultry and eggs (where self-sufficiency has been attained) are pro- duced in the coastal area.
Foreign exchange. In 1986. oil and gas contributed 97.18% of the total exports with a total value of B$3.877 billion (EPU 1988).1 This has exceeded the import of food, goods and services.

Aquatic coastal area boundary
Terrestrial coastal area EEI reefs E oil structures
Fig. 2. The coastal area of Brunei Darussalam.
IndustriaI ckvebprnenf sites LIDS). All the IDS are located within the coastal area (Fig. 3). De Silva et al. (1990) proposed that industries be categorized into light [nonpollutive), general (pollutkve) and special (highly pollutive) industries based on the degree of pollution which they can cause prior to any treatment or control. Other recommendations include (1) prohibiting pollutive industries within the catchment areas of Sg. Brunei, Inner Brunei Bay and other estuarine environments; (2) assess- all pollutive industries for environmental impacts and pollutant treatment facilities; and (3) siting these industries in IDS which are in less sensitive environments.
Physical environment
Geology. The coastal lowlands encompass most of Brunei-Muara District. The interiors
of Belait and Tutong Districts are underlaid by synclinal basins. The rims of the basins gradually rise from groups of low hills, surrounded by swamps, to distinctive hill ridges of considerable heights.
Most of the coastal areas, particularly in Temburong, are occupied by flat swampy alluvium, which extends as broad belts up the valleys of Belait and Tutong Rivers. AZmost all the alluvial plains are covered by peat except near the riverbanks and in the vicinity of hills. Thin clay or sandy alluvium is usually located in these areas. Terraces, usually of unconsolidated sand and gravel, are found in the main river valleys and also along the coastal land between Tutong and Muara (Loo et al. 1987).
hzlinage and basin areas. The four main river systems in Brunei Darussalam are Belait, Tutong. Brunei and Temburong. These are tidal for long distances inland, especially

during low flow and drought periods. Salinity could be high, up to 90 km inland,
Temburong Basin. which drains nearly the whole of Temburong District, is the smallest, with an area of some 1.100 k d . Sg. Tem- burong has two tributaries flowing into its estuary. Sg. Batu Apoi which has a moun- tainous catchment and Sg. Labu, which is a coastal swamp river. Both divide the basin into two, with Sg. Temburong flowing into the head of Brunei Bay.
Belait Basin is the largest, having an area of some 2,700 -2. The lower catchment comprises an extensive area of peat swamp forest.
Tutong Basin covers around 1,300 kmz, and the river is contiguous with that of Sg. Belait on the west. Sg. Tutong discharges to
the sea between two sand spits which form an elaborate estuarine system. Two branches extend parallel to the coast and cover a dis- tance of about 15 km. The western end of the basin is drained by Sg. Telisai. From the head of the estuary and over its full length, the river channel is extremely sinuous, and like Sg. Belait, is tidal to a distance upstream.
The watershed of Sg. Brunei is low-lying and swampy. The catchment is characterized by broken high ground with deeply incised valleys forming the three major subcatch- ments, Sg. Kedayan, Sg. Damuan and Sg. Imang. Each of the subcatchment rivers enters Sg. Brunei at different points. Sg. Kedayan includes a high proportion of urban development and enters Sg. Brunei at Bandar Seri Begawan. Sg. Damuan enters about 3
0 Light industries
Hmvy industries
@ Polktive industries
8 Timber loading
I I I I I
15' 30' 45' 115O 15'
Fig. 3. The IDS in Brunei Darussalam (De Sihra et al. 1990).

krn upstream from that of Sg. Kedayan. The headwaters of Sg. Brunei are Sg. Imang and its tributaries. The main catchment adjoins that of Sg. Tutong on the western side, and to the north, is defined by an irregular ridge parallel to the coast. The watershed boundary moves southeastwards and continues along the ridge parallel to Brunei Estuary back to Bandar Seri Begawan (Loo et al. 1987).
Soils. In some low-lying coastal areas formerly occupied by brackish, organic-rich mangrove swamps, potential acid sulfate soils are present. Oxidation by aeration or leaching with oxygen-charged water of these soils converts iron sulfides into sulfates and sulfuric acid. The soils will, thus, have very low pH, releasing large amounts of aluminum which are toxic to plants.
In most of the estuarine areas of the major rivers, alluvio-marine soils predominate. These soils are gleysols which are usually poorly drained and which have potential acid sulfate layers beneath (Loo et al. 1987).
Climate. The country has an equatorial climate characterized by uniformly high temperature and rainfall throughout the year. There is no distinct seasonality, but the climate is governed by two monsoon winds generated by a low pressure trough called Inter-Tropical Convergence Zone (ITCZ) and the trade winds. The northeast monsoon blows from November to March and the southwest monsoon. from April to October. The two stations with the longest weather records are the Agricultural Research Station at Kilanas and the Brunei Shell Petroleum (BSP) Co. Head Office at Seria.
RainfalL The annual rainfall is generally high, with an average of aver 280 cm. It exceeds 230 cm throughout Brunei Darus- salam and can be as high as over 400 cm further inland in many parts of Temburong (Fig. 4). The higher rainfall toward the interior is due to the geographic effect of an increased amount of precipitation with altitude.
Air Temperature. The air temperature is uniform throughout the year, with little vari-
Fig. 4. Annual rainfall (in mm) distribution in Brunei Darussalam (Loo et al. 1987).

ation in seasonality and in different parts of Brunei Darussalam (Fig. 5). The annual mean temperature is 27.5OC occasionally (DOTCP 1986b).
Relative Humidity and Evaporation. Relative humidity is high throughout the year because of high temperatures and rainfall. The annual mean is 92.6% with a range of 89.3-95.6% (Fig. 6).
The rate of evaporation depends on the air temperature, relative humidity and wind velocity. Evaporation is higher during the hot dry months, March to May (Fig. 7).
Population
Demography. The population of Brunei Darussalam in 1981 was 192,832 (EPU 1983). By mid-1985. the population was
J F M A M J J A S O N D
Month
Fig. 5. Monthly mean temperature based on data from Kilanas, 1976- 1982 (Loo et al. 1987).
Month
Fig. 6. Relative humidity from data recorded at Kilanas (Loo et al. 1987).
estimated to have reached 22 1.900. Table 1 shows the distribution of 1981 and mid- 1985 population by administrative districts. The latter did not change much compared to the former.
The mid-1985 estimates indicate that Brunei-Muara was the most populous coastal district, comprising 60% of the country's population. Kuala Belait District was next with 26%. Tutong and Temburong Districts together comprised under 15% of the total population.
Majority of the population was concen- trated in the urban areas around the capital city of Bandar Seri Begawan in the Brunei- Muara District and Kuala Belait/Seria in the Belait District.
The population density variations through- out the country (Fig. 8) reflect these observa- tions. The density in most of the inland rural areas was below 10 persons/W. The coastal area between Seria and Sg. Liang in the Belait District also showed a low population density.
The total population in Brunei Darussalam increased 42% (about 57,000) from 1971 (136,256) to 1981 (192,832) implying an annual growth rate (AGR) of 3.5%. From 1981 to mid- 1985, the population was estimated to be about 22 1.900; an increase of 28.068 from 1981. Projections based on available infor- mation indicate a population of 367,300 by the year 2005. Table 2 summarizes the pop- ulation distribution by district from 1985 to 2005.
Health The National Health Policy of Brunei Darussalam emphasizes health- oriented, preventive and promotive care for the whole community rather than disease- oriented, curative services for the sick. The
Month
Fig. 7. Potential evaporation from data recorded at Kilanas (Loo et al. 1987).

Table 1. Population by district in 1981 and mid- 1985.
District 1981a Mid- 1986 % %
Bandar Seri Begawan 49.902 25.9 133.600 60.2
Brunei-Muara 64.329 33.4 Belait Tutong Temburong
Brunei Darussalam 192,832 100.0 221.900 100.0
aunpubbhed 198 1 Census. bEPU estimates. Source: Kuntjoro (1987).
I I- I Muao
South China Sea
n Under I0 100 - 199 mK)-49 ~ 2 0 0 - 4 9 9
H 5 0 - 9 9 5 0 0 p l u s 0 10 20 30 km 'x
I I I I I I 15' 30' 45@ 115O 1 5'
Fig. 8. Population density, 1981 ,(Kunqoro 1987).
Table 2. Urban and rural population by district. 1985-2005.
District 1985
Urban Rural Total
Brunei-Muara 136,000 - 136,000 Belait 51,350 3.150 54.500 Tutong 9,- 14.400 23.900 Temburong 1.650 4.950 6.600
2005 Urban Rural Total
241,000 - 241.000 71.470 3.830 75,300 23.W 19,710 42,800 1760 5.440 8.200
1985-2005 Urban
population growth (% p.a.1
2.9 1.7 4.5 2.6
Total 198,500 22,500 221,000
=Including military personnel. Source: DOTCP (19864.
338,320 28.980 367,300 2.7

target is the avoidance of disease and dis- ability by the year 2000. Primary health care is stressed. Identifled requirements include a sound, physical infrastructure, basic utilities. health information, logistic support, adequate supplies to remote areas, better comrnunica- tion facilities and training of community nursing st&. The improvement of sanitation and epidemiological surveillance to eliminate major health hazards is also important. This plan of action involves the community and is intersectoral (Kuntjoro 1987).
Water- and seafood-related communicable diseases were reported mostly in Kuala Belait but these were not serious. The general health condition of the coastal population is very good. There is no report of malnutrition among coastal communities. In 1990, the number of people afflicted with common water- and food-related communicable diseases as recorded by the Medical and Health Department was:
Cholera 16 m h o i d 17 Dysentery 18 Hepatitis 1,163 Gastroenteritis 7,155
WASTE MANAGEMENT IN THE COASTAL AREA OF BRUNEI DARUSSALAM
The waste management problems of Brunei Darussalam are relatively minor at present. The pressures of urbanization, industrial growth and population increase, however. demand that existing systems and services be improved. Thus. the government has com- missioned several studies and implemented some of the recommendations (DOTCP 1986e. 1986g; DOTCP 1987 and FWD 1987a/c, 1989).
Some areas of concern are: (1) solid waste, which includes abandoned vehicles; (2) sew- age; and (3) industrial and toxic wastes. A special concern is the waste management in Kg. Ayer, a unique residential development built over the shallower areas of the Sg. Brunei Estuary, near Bandar Serf Begawan.
Solid waste
Except for the dumping of solid waste into Sg. Brunei in Kg. Ayer and the indiscriminate
disposal of abandoned vehicles, the solid waste problem in Brunei Darussalzm is rela- tively minor.
Waste Generatian and Composition The solid waste sampling at various disposal sites throughout the country indicated that the typical waste generation rate was 1.0 kg/capita/day (PWD 1987b). It is well within the range of 0.7-1.8 kg/capita/day. which the World Bank reports for industrialized coun- tries. The typical domestic solid waste com- position (%) in Brunei Darussalam was:
Food waste 37 Paper/cardboard 26 Rubber/leather 1 Cloth 2 wood 2 Plastic 13 Metal 11 Glass 6 Others 2 -
100
The average heat value of the waste (1 1.000 kJ/kg or 4,800 BTU/lb) is adequate to sus- tain combustion. The waste can be com- posted but moisture and nitrogen will have to be added to optimize the reaction. Waste Collection. At present, solid waste
collection and disposal is done by MBs and DOs, except for Seria in the Belait District, the population of which is served largely by BSP. The army camps have their own collec- tion system, but they use the disposal sites operated by MBs and DOs. The FWD Road Section is responsible for roadside cleanliness and has recently established an extensive communal bin system.
The MBs collect the refuse generated within their jurisdiction while DOs are responsible for areas outside municipal boundaries. The MBs, which have extensive collection man- power and equipment as in the Brunei-Muara District, often serve both the municipal and district service areas. This practice. however, should be discontinued and routes reorga- nized for the maximal use of available resources (PWD 1987b).
For municipal service areas, revenue comes from house assessments. Monthly rates of B$15.00 and B$45.00 are charged per resi- dential and commercial unit, respectively.? The same rates apply for district areas served
218 September 1991: B11.70 = US$1.00.

by MBs. These rates, however, should be reviewed for possible adjustment so all mem- bers of the community are served (PWD 1987b). Free collection service is provided to all government premises and staff quarters.
Government premises have standard gal- vanized steel or rubber refuse containers while most of the private premises use con- tainers of their choice, e.g., bulky 200-1 drums which require at least two laborers to empty into the collection vehicle. Large. commercial-sized containers are recom- mended for communal bin systems as well as commercial zones, parks and recreation areas. Suitable collection vehicles equipped to handle these containers should also be used (PWD 1987b).
In most residences, the containers are located near the road curb so the refuse is loaded directly into the collection vehicle. Rattan baskets are used to transfer refuse from containers that are located some dis- tance from the road.
Most of the high-rise apartments have refuse chutes with inlets on each floor. The chutes discharge to a vault at ground level where there are wheeled steel containers. For smaller apartments, the refuse is usually deposited by individual households to a des-
ignated storage area located near the road. Door-to-door collection, however. should be made available to those who are willing to pay for it (PWD 198%).
The communal bin system, which is used in Brunei-Muara and Belait Districts, is rec- ommended for Tutong District. It should also be the minimum requirement for squatter areas (PWD 1987b). In addition, transfer stations should be constructed in Brunei- Muara District to lessen transportation costs and traffic congestion [PWD 198713).
A collection system should be designed for the rural and outlying areas as many private residences do not enjoy solid waste collection sewices (PWD 1989).
Clearly, the overall collection system for Brunei Darussalam can be made more effi- cient. The privatization of collection services should be considered (PWD 1987131.
Waste Disposal. The common waste dis- posal practice in the country is the open burning dump. The dumpsites come in diger- ent sizes, with large dumps posing greater problems. Fig. 9 shows the solid waste dis- posal sites in Brunei Darussalam. Those in Kuala Belait in the Belait District and Muara in the Brunei-Muara District are now closed.
. , - i.. ,f '. 0 Potentla1 ate
L.. /' .' -...'
I I I I
1 5' 30' 45, 115- 15'
FYg. 9. Present and potential landfill sites in Brunei Darussalam ( d e d from PWD 198%).

The Belait District uses a disposal site in Anduki. The high groundwater in the district, however, dictates landfilling in a specially constructed borrow pit (PWD 198713).
Because of the lack of soil cover on site, the Muara disposal site was closed. It is also near the Sg. Akar Sanitary Landfill which is now in use. While this Sg. Akar site and the adjacent Sengkurong clay pits can provide for the dis- trict's disposal needs through the year 2005, the clay pits should be conserved in case of changes in land use patterns or ewiron- mental conditions. An alternate disposal system is thus recommended: an area method sanitary landfill in the jungle for which a site-specific environmental assess- ment is needed (PWD 198713).
The Tutong and Temburong Districts have small disposal sites which resemble sanitary landfills in that the burned refuse is periodi- cally covered with soil. To make these clis- posal sites environmentally acceptable. burning should be stopped and soil cover applied more frequently. Specifically, the Tutong landfill should be covered daily while that of Temburong should be covered weekly with fly and rodent controls (PWD 198713).
Sanitary landfiis are recommended for all districts. Another waste management option is incineration which is technically feasible but more costly than lan-g. It also requires more sophisticated operational pro- cedures.
In addition, solid waste disposal in the rural and outlying areas needs upgrading (PWD 1989).
Abandoned uehicles. An effective disposal program for abandoned vehicles will include the following: (1) a vehicle collection program implemented by government or private con- tractors; (2) a car flattener or crusher; (3) a privately operated used parts salvage yard; and (4) scrap metal exportation.
Toxic waste disposal. At present, toxic waste in Brunei Darussalam primady con- sists of small quantities of pesticides, sol- vents and waste produced by BSP. The country's industriakation and diversification program, however, will certainly increase toxic waste quantity. Hence, these recom- mendations. Both old and existing toxic waste disposal
sites need to be investigated. Records will have to be searched and interviews con-
ducted to determine the type and quantity of waste disposed of at the sites. Ground- and surface water sampling may be necessary to check for adverse environmental Impacts.
A spill response program that trains per- sonnel for chemical emergencies has to be developed. Private waste management companies can be considered for toxic waste disposal and technical assistance.
Facilities for toxic waste management include: (1) small-scale disposal pits; (2) treatment, incinerating and/or recycling facilities; and (3) a secure landflll for sludge. ash and stabilized waste disposal (PWD 198713).
Legislation. The Minor Offenses Act. Chap- ter 30 of the Laws of Brunei Darussalam is a comprehensive legislation for litter and indis- criminate dumping. The violation of the act carries a penalty of B$1,000 for the first offense and B$3.000 thereafter. It also includes a section on abandoned vehicles in public lands. This act, however, should be strengthened: (1) it should provide for the control of abandoned vehicles on pllhrate property and for toxic waste disposal; and (2) DOs should be given specific authority to enforce this act (PWD 198713).
Administration. No single government department, however, has sole responsibility over SWM. Although it monitors public health, the Medical and Health Department only advises MBs and DOs as it has no administrative role in SWM. While the PWD conducts studies, implements projects and sets up SWM facilities such as disposal sites. it is not involved in day-to-day collection and management except for the communal bin system and cleanliness along major roads. A single authority with full operational respon- sibility is therefore necessary (PWD 198713). Its tasks should include refuse collection; operation of transfer stations and landfills as well as administration of the abandoned vehicle program.
Sewage
Main sewerage is provided in urban areas only. In 1987. it accounted for more than 5 W of the total sanitation in, Kuala Belait- Seria, 35% in Tutong and 13% in Bandar Sent Begawan. including Berakas and Kg. Ayer

Tutong STW rn Prlnoipal rwoga treatment worko dlocharge point8
River boain boundado8
11,0001 Populatlon In rural orwr
Swemge utility amumod point load, awroge flow - ~h
66:7 3.0 28.4 @ Pewhalon Sibabou @ Welfore Home Kg. Pubie @ isfano Nwullrnan
5,000 300
16,000 4z 4
@ Larnbok Ki i
@ Sg. Kcbun School 1.000
452.0 @ Rirnbo
11.570 40.2
@ Pintu Molirn sw'oo JOB. 0
P. 6 @ 38,000 Jerudong Volley I
f2.0 @ Jerudong Volley 2
10,000 AA n
I I I I I I 5' 30'
I
45' 115' 15'
Fig. 10. Existing, committed and potential SlWs in Brunei Darussalarn fPWD 1987a).

(DOTCP 1987a). A new STP in Muara was completed in 1990 with an initial capacity of 10,000 equivalent population. Other STPs completed in 1990 in the Brunei-Muara District were Pengkalan Sibabau, Lambak Kiri, Mata Mata, Bukit Beruang and Rataie, all of which are land-for-the-landless projects.
A new STP in Gadong near Bandar Seri Begawan is expected to be completed by December 1991. It is designed to relieve the existing load at the Pintu Malim Treatment PIant from the two principal catchments within Gadong including the area to the northwest of the airport which encompasses the proposed New University Campus and Rirnba Resettlement site. Its initial capacity is 25,000 equivalent population with an ulti- mate capacity of 75,000 equivalent popuIa- tlon. The STP at Kg. Pandan, Kuala Belait in the Belait District will be operational by September 1991 with an initial capacity of 18,000 equivalent population.
Under the current Five-Year National Development Plan (1991-1995). two new STPs, each with an initial capacity of 18,000 equivalent population. will be constructed in Kuala Belait and Seria in the Belait District.
The completion of the new SWs and sewer lines is expected to increase sewerage effi- ciency in Kuala Belait-Seria to 70%; Tutong, 50%; and Brunei-Muara, 60% by 1995.
Sewered Areas. The PWD Sewerage Section has 13 STWs under its jurisdiction and management. Fig. 10 shows the locations of the existing, committed and potential STWs. The largest is the Pintu Malim Treatment Plant which only had primary treatment until sludge digesters were installed for a capacity of 72,000 equivalent population.
But, the quality of sewage effluent from Pintu Malim is generally lower than those discharged by the other STWs (Table 3) (PWD 1987a). Also, the Escherichia coli levels are quite high in Kg. Ayer and the confluence of Sg. Kedayan and Sg. Kianggeh near the open market (Lim 1990a).
Nonsewered Areas. In areas outside the sewered catchments, different flush and non- flush sanitation systems are used. Most of the urban fringe areas of the districts use the flush system (mainly septic tank) while rural areas have nonflush latrines or other less hygienid systems.
Septic tanks are common where piped water is available, i.e., in the urban fringe areas of Bandar Seri Begawan, Muara, Tutong. Kuala Belait and Seria as well as in the high standard housh~g in the rural areas. Generally designed as "all-purpose" tanks. these are capable of accepting all household wastes including water closet (WC) and sul- lage wastes.
Table 3. Annual average laboratory analysis of effluents, 1989.
'IW BOD TSS VSS pH DO TC FC (41) (mgll) (41) (mg/l) (CI 100 ml)
Pintu h4alim PS 78.5 65.14 39.5 6.69 0.73 2.17348 7.14E+07 Sixth Form Centre EA 16.6 37.2 23.3 6.16 5.61 7.333+07 1.773+06 Istana N u d Iman EA 8.3 23.6 14.3 6.60 5.01 2.263+06 1.60E+05 Lambak Kanan EA 18.1 40.5 26.5 6.49 2.17 7.453+07 9.80E+05 RBA Hangar PEA 11.9 24.0 13.58 6.91 4.62 1.643+07 5.983+06 Welfare Home PEA 5.5 46.2 27.2 7.27 6.16 7.963+06 3.61345 Sungai Kebun PEA 13.5 36.3 26.9 7.05 4.49 2.14E+07 1.00E+06 Sengkarai PEA 9.3 21.6 12.4 6.68 3.55 8.433+06 3.12E+05 Tutong Camp FSP 19.1 73.8 53.1 8.35 6.09 9.913+06 2.503+04 Penanjong Camp FSP 22.1 54.0 35.9 7.03 4.42 1.50347 6.40E+04 Berakas Camp FSP 22.2 56.8 37.1 6.77 2.94 2.24348 5.21E- Mulaut Abattoir FSP 17.9 66.2 33.2 7.47 3.72 7.20- 2.98E+06 Lambak Kiri FSP 2.64 13.6 7.14 4.23 6.42 102000 nil
Source: PWD Sewerage Section (1989). TW - treatment works. E+03- 1 x 1,000. DO - dissolved oxygen. PS - primary settlingTW. TSS - total suspended solids. EA - extended aerationTW. VSS - volatile suspended solids. PEA - package EATW. TC - totalcollform. - facultative stabilization pond. FC - fecal colifonn.

Septic tanks accounted for 71% of sanita- tion in Muara, 42% in Bandar Seri Begawan. including Berakas and Kg. Ayer. 40% in Tutong, and 2O?h in Kuala Belait-Seria (DOTCP 1987a). Septic tank desludging ser- vices are available on request.
New dwellings and buildings in areas with- out a piped sewerage system are required to have a septic tank system. The government exercises control over septic tank usage and design through DOTCP in development con- trol areas @CAs) inside and outside urban centers. In municipal areas, the PWD Sewer- age Section checks: (1) tank design against UK-based standard designs (e.g., concrete construction with dual compartments); (2) plumbing stack designs; and (3) proposed construction materials, on behalf of DOTCP. Outside these areas, no follow-up inspection or construction quality control is undertaken Septic tank design and construction in areas not covered by the Development Control Leg- islation are not monitored nor controlled.
The principal problems with septic tank efnuent disposal are:
difficulties in the enforcement of design, construction and operation controls which results in poor tank performance and high f l u e n t biologi- cal oxygen demand (BOD), suspended solids (SS), grease and bacterial con- centrations; lack of soil absorption systems which leads to organic and bacterial pollu- tion of the watercourses and monsoon drains; absence of an administrative system for the regular desludging of tanks; and installation of tanks in inappropriate areas, i.e.. frequently flooded areas or those with high groundwater or river levels, like Kuala Belait-Seria.
INDUSTRIAL WASTE
At present, the major producer of industrial waste in the country is the petroleum indus- try. Nonetheless, industrial waste manage- ment is a necessity, considering the country's projected non-oil industrial development and diversification.
Available information does not indicate any adverse environmental impacts on the coastal zone of Brunei Darussalam due to waste dis- posal from already established industries other than perhaps BSP's activities in Seria b o n g et al. 1987; PWD 1987a; De las Alas and Bentillo 1992; Lai et al. 1992; Lim 1990 and Juliano et al. 1991).
Environmental baseline studies of the rnac- robenthos in the vicinity of the BSP crude oil terminal in Seria (Leong et al. 1987 and 1990) indicate some hydrocarbon con- tamination in Sg. Bera and Sg. Seria by the operations of BSP oil facilities. The BSP oily waste treatment plant was then installed after the first study of Leong et al. in 1987. While it has improved the water quality of the rivers concerned, it has yet to reach acceptable levels. The BSP has set a self- imposed limit of 35 ppm of hydrocarbon for its eiTluents in the near future. Further, it has developed an Environmental Manage- ment Plan (BSP 1989) which covers all aspects of in-house waste management. including the improvement of the quality of the waterways into which BSP discharges its wastewater.
To minimize the degradation of the coastal water quality. the zonation of new industries on the basis of their pollutive nature is pro- posed @e Silva et al. 1990). This calls for the exclusion of pollutive industries, wherever practical, from IDS located in the catchment areas of the major river systems that feed the Inner Brunei Bay and other estuarine envi- ronments. The recommendations for National Water Quality Standards (PWD 1987a and Lim 1990a) are being studied for implemen- tation.
The disposal of oily wastes from vehicle service stations and households remains an area of concern that requires further atten- tion.
Waste management in Kampong Ayer
Built over the shallower areas of the Sg. Brunei Estuary. Karnpong Ayer (literally 'Water Village") is a unique residential devel- opment of several smaller component kurnpongs. Located close to the center of Bandar Seri Begawan, access to much of the village is only by water transport.

Its 300-year history has seen its substan- tial growth and decline. The 1981 census recorded 27,125 persons in 2,826 dwellings. The current population is estimated at 25.000.
Except for an experimental pilot project for solid waste disposal, there is no waste dis- posal service in Kg. Ayer. The traditional method involves dumping all refuse, into the surrounding waters of Sg. Brunei and Sg. Kedayan. In the absence of a sewerage sys- tem, raw sewage (toilet waste and sullage) is discharged directly into the rivers. This waste discharge is a major pollutant load on the receiving waters and a potential health haz- ard, human excreta being a principal vehicle for the transmission of communicable dis- eases.
Solid Waste Disposal and Management. Solid waste in Kg. Ayer is composed of household or domestic refuse (food waste. plastic containers, etc.); household junk (discarded furniture, apphances, etc.) and builder's waste (old timber piles, etc.).
The annual total waste generation of Kg. Ayer is estimated at 3.77 million kg (Goh 1991). Table 4 shows the average waste gen- eration b y component) per household (Goh 1991).
Solid waste disposal into its waterways has aggravated environmental problems. Although much of the floating refuse is removed by tidal currents, a considerable quantity is stranded, creating aesthetic and some odor problems in many parts of Kg. Ayer. The lower reaches of the rivers are also adversely affected. A govemment-commis- sioned study indicated that it would be prac- tical to provide a regular solid waste collec- tion service comparable with the land-based service (PWD 1986).
A pilot project for solid waste disposal was undertaken in three component kampongs of Kg. Ayer which had a total of 377 houses (approximately 10% of the total number of houses in Kg. Ayer). The ongoing project commenced on 3 1 March 1989.
The project objectives are to: a. establish a demonstration project; b. effect a regular solid waste service in
the three selected kampongs; c. cleanup the selected kampongs; and d. provide a basis for the extension of
Table 4. Mean garbage production (by component) per household per week.
lSrpe Weight (kg) %
Organic 17.28 71.3 Cloth 2.80 11.5 Metal 0.46 1.9 Paper 0.69 2.8 Plastics 0.23 1.0 Wood 0.3 1 1.3 Rubber 0.59 2.4 Glass 1.87 7.7
Total 24.23 100.0
Source: Goh (1991).
the solid waste disposal service to the rest of Kg. Ayer.
The two options considered for solid waste disposal in Kg. Ayer are shown in Figs. 11 and 12.
System 1 involves boat transporters with large containers, jetty crane and roll-on/roll- off truck. System 2 uses boat transporters with small wheelable containers, jetty ramp and compactor truck.
The ongoing project uses System 1 with encouraging results: the kampongs appear to be cleaner. The cleanup of waste accumu- lated over a long period would require more time, as much of the work needs to be done manually, particularly under residences.
The total solid waste collected from March 1989 to January 1990 is summarized below:
Household waste 376 1 m3 or 88 m3/week Household junk/ 4736 m3 or 110 m3/week builder's waste/cleanup
Total 7349 m3 or 198 m3/week
A recent survey of the residences in the collection area indicated that the residents are very positive about the project and an overwhelming majority want it continued and expanded to the whole of Kg. Ayer (PWD 1990).
The extension of the pilot project, which will cover the entire Kg. Ayer, will be imple- mented under the current Five-Year National Development Plan (199 1- 1995).
Sewage Disposal. Raw sewage from Kg. Ayer is basically composed of toilet waste
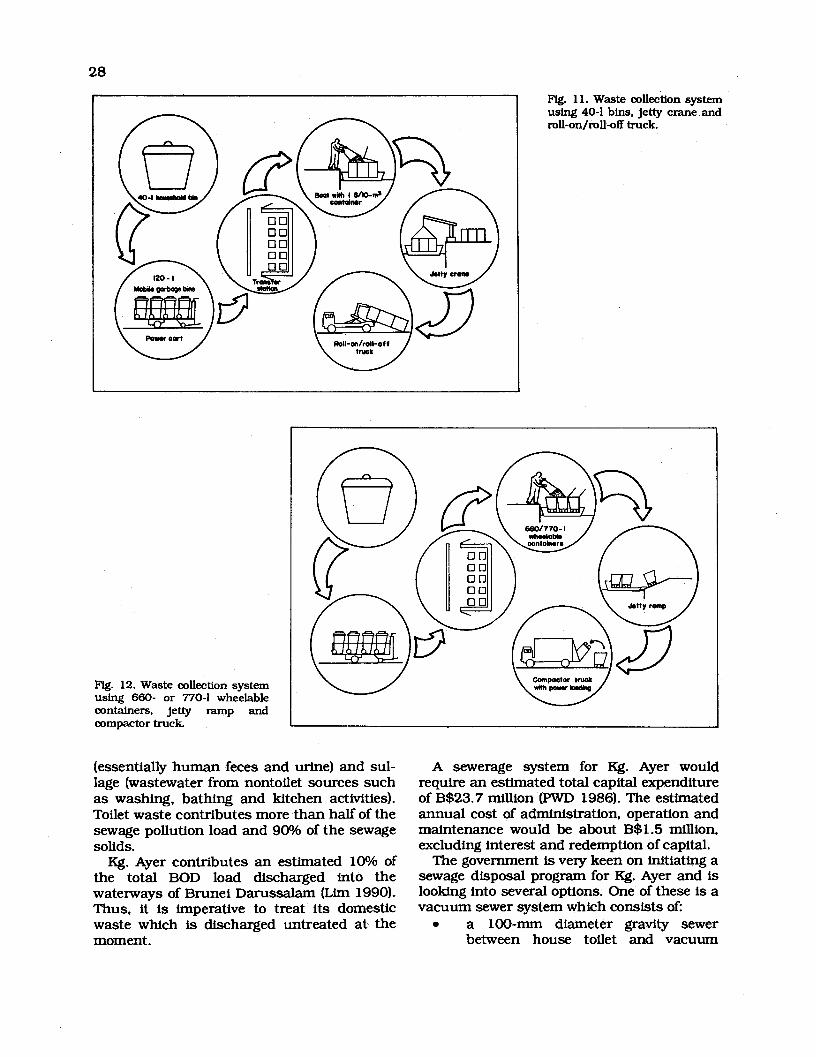
Fig. 12. Waste collection system using 660- or 770-1 wheelable containers, jetty ramp and compactor truck.
Fig. 1 1. Waste collection system using 40-1 bins, jetty crane and roll-on/roll-off truck.
(essentially human feces and urine) and sul- lage (wastewater from nontoilet sources such as washing, bathing and kitchen activities). Toilet waste contributes more than half of the sewage pollution load and 90% of the sewage solids.
Kg. Ayer contributes an estimated 10Vo of the total BOD load discharged into the waterways of Brunei Darussalarn (Lim 1990). Thus, it is imperative to treat its domestic waste which is discharged untreated at the moment.
A sewerage system for Kg. Ayer would require an estimated total capital expenditure of B$23.7 million (PWD 1986). The estimated annual cost of administration, operation and maintenance would be about B$1.5 million. excluding interest and redemption of capital.
The government is very keen on initiating a sewage disposal program for Kg. Ayer and is looking into several options. One of these is a vacuum sewer system which consists of:
a 100-rnrn diameter gravity sewer between house toilet and vacuum

chamber laid at a gradient of 1 in 40 and with a maximum length of 70 m; collection chambers with vacuum valves servicing 2-5 houses and situ- ated close to the vacuum sewer so long as the gravity sewer run is able to be commanded; vacuum sewer mains laid along the alignment of the walkways connected to collection chambers; a shore-based vacuum pumping sta- tion and a conventional lowhead sewage pumping station; a short rising main up to the low ridge; and a gravity sewer connected to the town systems near the Abdul Razak Build- ing (Fig. 13).
A pilot sewerage project, which will involve the use of this system will be implemented initially in five component kumpongs of Kg. Ayer, namely Kg. Bendahara, Kg. Pg. Kerma Indra, Kg. Pg. Tajuddin Hitam. Kg. Tamoi Tengah and Kg. Tamoi Ujong. An efficient sewerage system in Kg. Ayer will halt the dis- charge of untreated toilet waste into Sg, Brunei and Sg. Kedayan. This will: (1) improve the water quality of the rivers con- cerned; (2) reduce the potential health problems associated with water-based activi- ties such as boating, bathing and swimming;
and (3) have a positive impact on the tourist trade and fishing activities in the area.
CONCLUSION
At present, waste management problems in the coastal area of Brunei Darussalam can be considered relatively minor. The waste dis- posal problem of Kg. Ayer is being addressed by the government. The solid waste collection techniques used in the component karnpongs will be extended to cover all of Kg. Ayer. A sewerage system pilot project for Kg. Ayer will also commence.
Brunei Darussalam aspires to have "a clean and healthy environment." The gov- ernment plans to initiate the enforcement of the anti-litter law which will carry a fine of up to B$1.000 for the first offense and B$3,000 for the second offense under the Minor Offenses Act. Its enforcement has been delayed until a nationwide cleanliness edu- cation campaign is completed. Several cleanup projects involving towns, villages, office compounds and streets were carried out during the campaign.
Commissioned studies and projects focus- ing on existing and anticipated problems as well as the recent upgrading of systems and
Gravtty sewr 1 40
Vacuum sewr (latd to sawtooth prattle)
Concrete pal on ptles
Fig. 13. A schematic layout of the vacuum sewer system.

facilities for waste collection, treatment and disposal attest to the government's commit- ment to waste management.
ACKNOWLEDGEMENTS
We wish to thank Director of Fisheries Hj. Matdanan bin Hj. Jaafar and Deputy Director of Fisheries Pg. Sharifuddin bin Pg. Hj. Yusof for their advice and support. We are also grateful to Assistant District Omcer (Brunei- Muara District) Hj. Ahmad bin Hj. Abd. Raman and Municipal Board Acting Secretary Rarnli bin Zulkifli for reviewing this manuscript .
REFERENCES
BSP (Brunei Shell Petroleum Co.) 1989. Management Plan 1989- 1993. BSP 89/3. Brunei Shell Petroleum Co.,
Environmental Environ. Rep. Seria, Brunei
Darussalam. Chou. L.M. and A.M.S. Halidi. 1987. Introduction, p. 1-4.
In T.-E. Chua, L.M. Chou and M.S.M. Sadorra (eds.) The coastal environmental profle of Brunei Darus- salam resource assessment and management issues. ICLARM Technical Reports 18, 193 p. Fisheries Department, Ministry of Development, Brunei Darussalam and international Center for Living Aquatic Resources Management, Manila, Philippines.
De las Alas, J. and I.G. Bentillo. 1992. Simulation of oil slick movement in Brunei Darussalam, p. 127- 135. In G. Silvestre, H.J.H. Matdanan, Pg. Sharihddin Pg. Hj. Yusof, M.W.RN. De Silva and T.-E. Chua (eds.) The coastal resources of Brunei Darussalam: status, uti- lization and management. ICLARM Conference Proceedings 34, 214 p. Department of Fisheries, Min- istry of Industry and Primary Resources, Bandar Seri Begawan, Brunei Darussalam, and International Center for Living Aquatic Resources Management, Philippines.
De Sihra, M.W.RN., H.J.H. Matdanan and H.M.T. Sabri. 1992. Zonation of industrial activities to minimize environmental and coastal water quality degradation in Brunei Darussalam, p. 155-163. In G. Silvestnz, H.J.H. Matdanan, Pg. Sharifuddin Pg. Hj. Yusof, M.W.RN. De Silva and T.-E. Chua (eds.) The coastal resources of Brunei Darussalam: status, utilization and management. ICLARM Conference Proceedings 34. 214 p. Department of Fisheries, Ministry of Industry and Primary Resources, Bandar Seri Begawan, Brunei Darussalam, and International Center for Livlng Aquatic Resources Management, Philippines.
DOTCP (Department of Town and Counhy Planning). 1986a. Negara Brunei Darussalam Management Plan Background Paper No. 2: Population. Department of
Town and Country Planning, Ministry of Development, Brunei Darussalam.
DOTCP (Department of Town and Country Planning). 1986b. Negara Brunei Darussalam Management Plan Background Paper No. 5: Fisheries and Aquaculture. Department of Town and Country Planning. Ministry of Development, Brunei Darussalam.
DOTCP (Department of Town and Country Planning). 1986~. Negara Brunei Darussalarn Management Plan Background Paper No. 9: Geology and Mineral Resources. Department of Town and Country Plan- ning, Ministry of Development, Brunei Darussalam.
DOTCP (Department of Town and Country Planning). 1986d. Negara Brunei Darussalam Management Plan Background Paper No. 11: Solid Waste Management. Department of Town and Country Planning, Ministry of Development, Brunei Darussalam.
DOTCP (Department of Town and Country Planning). 1986e. Negara Brunei Darussalam Management Plan Background Paper No. 16: Sanitation and Sewerage. Department of Town and Country Planning, Ministry of Development. Brunei Darussalam.
DOTCP (Department of Town and Country Planning). 1987. Negara Brunei Darussalam Management Plan: Main Volume. Draft Final Report. Department of Town and Country Planning. Ministry of Development, Brunei Darussalam.
EPU (Economic Planning Unit). 1983. Brunei Darus- salarn statistical yearbook 1981/82. Statistics Divi- sion, Economic Planning Unit, Ministry of Finance, Negara Brunei Darussalam.
EPU (Economic Planning Unit). 1988. Brunei Darus- salarn statistical yearbook 1988. Statistics Division, Economic Plannipg Unit, Ministry of Finance. Negara Brunei Darussalam
Goh. K. C. 1991. Garbage production and disposal in Kampong Ayer and environmental implications. Uni- versity of Brunei Darussalam, Ministry of Education, Brunei Darussalarn.
Juliano. RO., T.-E. Chua, J. De las Alas and H.C. Lai. 1991. The probable impact of offshore oilfield spill landfall in the coastal zones of Brunei Darussalam. Department of Fisheries, Ministry of Industry and Primary Resources. Brunei Darussalam and ASEAN/US Coastal Resources Management Project, International Center for Living Aquatic Resources Management, Manila, Philippines.
Kuntjoro. K.D. 1987. Population, p. 67-78. In T.-E. Chua, L.M. Chou and M.S.M. Sadorra (eds.) The coastal environmental proffle of Brunei Darussalam: resource assessment and management issues. ICLARM Technical Reports 18. 193 p. Fisheries Department, Ministry of Development, Brunei Darussalam and International Center for Living Aquatic Resources Management, Manila, Philippines.
Lai, H.C., B. Ong, AO. Kessler and M.W.RN. ~k Silva. 1992. A composite sensitivity index for the coastal zones of Brunei Darussalam, p. 109-126. In G. Shestre, H.J.H. Matdanan, Pg. Sharifuddin Pg. Hj. Yusof, M.W.RN. De Silva and T.-E. Chua (eds.) The coastal resources of Brunei Darussalarn: status, uti- lization and management. ICLARM Conference Proceedings 34, 214 p. Department of Fisheries, Min- istry of Industry and Primary Resources, Bandar Serf Begawan. Brunei Darussalam, and International Center for Living Aquatic Resources Management, Philippines.

Leong, T.S., K.H. Khoo, T.M. Wong, M.C. Feng and P.E. Lim. 1990. An Environmental Study of the Mac- robenthos in Sungai Lumut, Sungai Bera and Sungai Seria, Brunei Darussalam. Universiti Sains Malaysia, Penang, Malaysia and Brunei Shell Petroleum Co., Seria. Brunei Darussalam.
Leong, T.S., Y.K. Leong, S.C. Ho. K.H. Khoo, S.P. Kam, S. Hanapi. T.M. Wong, RS. Legore, W. de Ligny and G.T. Tan. 1987. Effects of a crude oil terminal on tropical benthic communities in Brunei. Mar. Pollut. Bull. 18(1): 31-35.
Lim, P.E. 1990. Water Quality Study for Brunei Darus- dam. Department of Fisheries, Ministry of Industry and Primary Resources, Brunei Darussalam and ASEAN/US Coastal Resources Management Project, International Center for Living Aquatic Resources Management, Manila, Philippines.
Lim, P.E. 1992. Water quality in the coastal areas of Brunei Darussalam: status, management issues and recommendations, p. 91-108. In G. Silvestre, H.J.H. Matdanan, Pg. Sharifuddin Pg. Hj. Yusof, M.W.RN. De Silva and T.-E. Chua (eds.) The coastal resources of Brunei Darussalam: status, utilization and manage- ment. ICLARM Conference Proceedings 34, 214 p. Department of Fisheries, Ministry of Industry and Primary Resources, Bandar Seri Begawan, Brunei Darussalam, and International Center for Living Aquatic Resources Management, Philippines.
Loo, M., L. Hsu and J. Paw. 1987. Physical environment. p. 5-27. InT.-E. Chua, L.M. Chou and M.S.M. Sadorra (eds.) The coastal environmental profile of Brunei
Darussalam: resource assessment and management issues. ICLARM Technical Reports 18, 193 p. Fisheries Department, Ministry of Development Brunei Darussalam and International Center for Living Aquatic Resources Management, Manila, Philippines.
PWD (Public Works Department). 1986. Kampong Air Waste Management Study. Scott and Furphy Con- sulting Group and Public Works Department, Ministry of Development, Brunei Darussalam.
PWD (Public Works Department). 1987a. National Water Quality Standards Study. Watson and Hawksley Asia (consultants) and Public Works Department, Ministry of Development, Brunei Darussalam.
PWD (Public Works Department). 1987b. Solid Waste Management Master Plan, Vol. 2. Engineering-Science and Langdon Every and Seah (consultants) and Public Works Department, Ministry of Development, Brunei Darussalam.
PWD (Public Works Department). 1987c. Sungai Brunei Water Quality and Pollution Study. Syed Muhammad and Hooi (consultants) and Public Works Department, Ministxy of Development, Brunei Darussalam.
PWD (Public Works Department). 1989. Rural Sanitation Study. Syed Muhammad and Hooi (consultants) and Public Works Department, Ministry of Development, Brunei Darussalam.
PWD (Public Works Department). 1990. Kampong Air Solid Waste Pilot Study. Eval. Rep. No. 3. Scott and Furphy Consulting Group and Public Works Depaft- ment, Ministry of Development, Brunei Darussalam.

Environmental Impact Management in Indonesia
NABIEL MAKARIM State Mfnlstry for Population
and Ehvironment Jln Merdeka Barat 15
Jakarta 101 10 Indo~esia
MAKAEUM, N. 1992. Environmental impact management in Indonesia, p. 33-36. In T.-E. Chua and L.R Garces (eds.) Waste management in the coastal areas of the S E A N region: roles of governments, banking institu- tions, donor agencies, private sector and communities. ICLARM Conference Proceedings 33, 2 18 p. Ministry of the Environment, and Canada-ASEAN Centre, Sin- gapore; Asian Development Bank, and International Center for Living Aquatic Resources Management, Philippines.
ABSTRACT
This paper presents Indonesia's experience in envi- ronmental management, including structure and strat- egy transformations like the formation of the Agency for the Management of Environmental Impacts (BAPEDAL). The BAPEDAL has 14 strategic management units (SMUs) in seven priority programs which tackle sea, coastal, surface- and groundwater pollution; air pollution from stationary and nonstationary sources; environ- mental damage from mining and quarrying; small-scale industry pollution; environmental impact assessment (EM) and emergency response system management; noise pollution; and management of sewage, solid and hazardous waste.
Program success factors include a committed and credible leadership; institutional control and regional cooperation; an adequate budget and well-developed support services; specific objectives that can be achieved within a short time-frame; and public awareness of and participation in efforts to relieve environmental stress.
and negative environmental impacts. To con- trol these impacts, governments create insti- tutions which often are not very effective. The foremost cause is the inherent conflict between resource use (development) and resource management (specifically, environ- mental and natural resource management) which makes for a halfhearted leadership and inadequate institutional support.
Another is the management approach. Textbooks and examples from more advanced countries offer attractive concepts, such as "one river. one management" for water resource management and *'bubble concept" for air pollution control. While these concepts are undoubtedly good, they require a certain degree of sophistication in institutional sup- port. Adopting such approaches in the early stages of management development presages failure.
The purpose of this paper is to share Indonesia's experience in environmental impact management, especially the structure and strategy transformations that came with the adoption of a pragmatic approach in 1989.
ENVIRONMENTAL MANAGEMENT APPROACH
INTRODUCTION In 1978, the State Ministry of Population and Environment (KLH) was created for the
The multidimensional nature of develop- national coordination of environmental man- ment brings about socioeconomic progress agement. Its functions are to protect, develop.

and manage the living, natural, socioeco- nomic and human environment of Indonesia. Provincial coordination is the responsibility of the Bureau of Population and Environment (BKLH). Operations are managed by sectoral ministers and governors at the central gov- ernment and provincial levels. respectively. In the 1970s. tasks were performed by ad hoc interinstitution teams which were replaced later by permanent teams.
A s expected, this system was relatively ineffective since the institutions and their personnel were not related directly to man- agement. While it was tolerable in the first ten years when the emphasis was on increasing public awareness, it became inad- equate when the management strategy increasingly involved law enforcement.
In 1990, BAPEDAL was created at the cen- tral government level to assist the President of Indonesia in formulating policies for the implementation of environmental pollution control; implement hazardous waste man- agement; monitor and control activities which have important environmental impacts; develop a reference laboratory and handle information on pollution control; increase public participation in impact control; and implement other tasks assigned by the Presi- dent.
The MEDAL head reports directly to the President and is assisted by two deputies. The Deputy for Pollution Control is responsi- ble for pollution control, domestic and haz- ardous waste management, and the control of environmental degradation due to mining and quarrying activities. The Deputy for Develop- ment implements EIAs and develops support systems, i.e., for information, training and reference laboratory management. Institu- tions related to MEDAL were formed immediately at provincial and municipal lev- els.
In the first months of operation. MEDAL'S immediate tasks were to recruit st&, decide on the right management strat- egy and create a working environment. The fcst batch of staff was from KLH, later sup- plemented by personnel from other ministries (e.g., Industry. Public Works, etc.). Strategic planning and management (SPM) was adapted from private corporations for use in the public sector.
To determine the BAPEDAL strategies, internal and external environmental assess- ments were done in conjunction with the mission of BAPEDAL and the national policy for environmental management. The strate- gies are:
1. strengthen the commitment of deci- sionmakers and community leaders;
2. increase public participation through: training and education of target groups like the press and non- governmental organizations (NGOs); information availabjlity; and increasing newsworthiness of envi- ronmental impact management.
3. develop the internal management of BAPEDAL, provincial and municipal institutions, and trainings, and infor- mation systems; and
4. win public confidence as a short-term gain in selected areas.
Due to limited resources, the choice of pri- ority areas was critical. The programs focused on: (1) surface water pollution; (2) air pollu- tion from mobile sources; (3) urban area san- itation; (4) control of environmental damage; (5) environmental impact analysis; (6) haz- ardous waste management; and (7) small- scale activities. These were divided into 14 areas called SMUs (Fig. 1). These units have separate systems for input, management and output headed by a responsible manager.
Next, SMUs were plotted in a modified "industry attractiveness-business strength matrix" or General Electric (GE) matrix (Fig. 1). Priority decisions were then made. In Area A, priority SMUs must "produce", i.e.. win public confidence as a short-term gain. Regulations and support systems for opera- tion have to be prepared for Area B. In Area C, concept papers need to be developed first.
In addition to SPM application, the organi- zational culture was developed in the staff. The values are: responsibility and teamwork; the ability to deliver at the right time with the right quality; personal development; and open management.
Long-term approach
The ten-year plan of BAPEDAL includes the development of an effective and efficient

Area A Area B Area C
SMUs in BAPEDAL
- Strategic importance
Fig. 1. The GE math for BAPEDAL's SMUs.
working system by the year 2000. These are the four channels:
Institution-building. Consists of BAPEDAL internal management; training and education; and the development of (1) institutions oper- ating at provincial and municipal lev- els, (2) an information system. (3) a reference laboratory, and (4) regula- tion and economic incentives, among others. Program development. Includes the implementation of focused programs with short-term gains. Using a bottom-up development approach, these will be extended and refined to achieve the desired management sys- tem by the year 2000. Market mechanism development. An emphasis of program development which proceeds from a feasibiiity study. Public participation. Consists of the development of the tripartite system and emphasis on the external control function which includes strategy- sharing with NGOs.
Surface water pollution control Groundwater pollution control Coastal water pollution control Sea pollution control Air pollution control: stationary
sources Air pollution control: nonsta-
tionary sources Environmental damage control
[mi- and quanyind Small-scale industry pollution
control Solid waste management Environmental impact assess-
ment Hazardous waste management Emergency response system
management Sewage management Noise pollution control
A B m M - U P DEVELOPMENT APPROACH: PROKASIH
One of the seven J3APEDAL programs, PROKASIH aims to achieve clean water qual- ity by eliminating pollution sources. Its goal: unpolluted rivers by the year 2000. This ten- year goal is divided into short-term subgoals and expansion stages.
Some of the features which PROKASIH shares with the other programs are:
1. The program must be focused on a particular area, and then expanded. In its first year. PROKASIH controlled the discharge of industrial waste to 20 rivers in 8 provinces by requiring tar- get factories to sign agreements to achieve effluent standards in 6-10 months. By the second year, the pro- gram was expanded to 11 provinces and followed by implementing sanc- tions.
2. It must have a simple but strong name like PROKASIH.
3. The manager must be the highest ranking ofncial in the province. The

overall management of PROKASIH is the responsibility of the provincial governor and the daily activities are managed by vice governors. It must provide institutional support, like PROKASIH teams which will lay the groundwork. These will be super- seded by provincial and municipal institutions which will function as BAPEDAL extensions. It must maintain a high profile: PROKASIH has an attractive packag- ing with a high recall value. A marketing (not a public relations) manager is essential, at least at the central level. Quality control is important. In the provinces. PROKASIH gives guidelines and does performance checks regu- larly. The BAPEDAL staff hold con- sultation meetings and make routine visits to the provinces. A competitive spirit must be instilled in the program participants. Thus. every September, the province with the best achievements is recognized by the President of Indonesia. Creat- ing a sense of togetherness is also important. Last year, the vice gover- nors of PROKASIH provinces were
sent to Canada for a six-week training that also helped create camaraderie among them. Enforcement, either legal or adrninis- trative. must be a program function. (The PROKASIH is prosecuting three violators soon.) Trainings for technical managers and engineering consultants must also be conducted.
Program success factors
One of the key factors that contributes to the success of a program is a committed and credible leadership with excellent manage- ment skills. Institutional control and regional cooperation are also necessary. Some of the program objectives must be specific so as to show results within a short period, e.g., to reduce pollution load or take pollution cases to court. Budgets at the central and regional levels must be raised to cope with the work demands. Support services have to be devel- oped as well. More importantly, public awareness and participation must be har- nessed to help improve the general environ- mental quality.

Wastewater Management in Malaysia
ABU BAKAR JAAFAR Department ofEnvironment
Mfntstry ofscfertce, Techndogy and the Enufrmvnent 13th Floor, Wkma Sime Darby
Jalan R e Laut, 50662 Kuala Lumpur Malaysia
JAAFAR, A.B. 1992. Wastewater management in Malaysia, p. 37-40. In T.-E. Chua and L.R Garces (eds.) Waste management in the coastal areas of the ASEAN region: roles of governments, banking institu- tions, donor agencies, private sector and communities. ICLARM Conference Proceedings 33, 218 p. Ministry of the Environment, and Canada-ASEAN Centre, Sin- gapox; Asian Development Bank, and International Center for Living Aquatic Resources Management, Philippines.
ABSTRACT
Water pollution sources in Malaysia are agro-based and manufacturing industries, animal husbandry and sewage. Through regulations and enforcement mecha- nisms such as licensing, the Environmental Quality Act of 1974 (EQA) sets water pollution control. The gig&- cant investment in research and development (R & D) of waste treatment technology and the compliance with effluent standards by industries have led to considemble success in water pollution control. But cumulative loads of various polluting sources may eventually exceed the assimilative capacity of rivers and other water bodies. Thus, the dwelopment of water quality criteria and stan- dards, river classification, and the establishment of appropriate effluent standards are recommended.
INTRODUCTION
In Malaysia, the management of water resources invokes essentially a number of agencies and three major functions, i.e..
assessment, protection and development. Its underlying basis are the state and federal lists of the Constitution. The State List includes rivers, canals, water supplies. riparian reserves and silt control. Water- works, power supply and matters relating to factories, machinery and health are in the Federal List. Although wastewater in partic- ular and pollution in general are not listed, they are covered under EQA of 1974. The purpose of EQA is twofold: pollution preven- tion, abatement and control as well as envi- ronment enhancement.
SOURCES OF WATER POLLUTION
The four water pollution sources in the country are agm-based Industries, manu- facturing industries, animal husbandry and sewage. The implementation of EQA regula- tions has made substantial progress in con- trolling both agro-based and manufacturing industries. In terms of organic pollution load, both these sectors contributed only 7% (32 t/day) of biological oxygen demand (BOD) in 1989 in contrast to 13% (60 t/day) and 80% (366 t/day) of BOD loads from animal hus- bandry and sewage, respectively [Table 1). The success of industrial pollution control is evident in the case of palm oil mills--100% of

Table 1. Organic pollution load by sector in Malaysia, 1986-1989.
1986 Sector BOD % Population
lo& equlvalentb
1987 BOD % Population load equivalent
Agro-based industries 11 2.7 0.22 (palm oil and rubber) Manuhcturing industries 30 7.3 0.60 Agriculture (animal husbandry) 55 13.4 1.10 Population (sewage) 314 76.7 6.28 Total 4 10 8.20
Agro-based industries 11 2.5 0.22 (palm oil and rubber) Manufacturing industries 19 4.3 0.38 Agriculture (animal husbandry) 55 12.4 1.10 Population (sewage) 358 80.8 7.16 Total 443 8.86
11 2.5 0.22
20 4.6 0.40 55 12.7 1.10
348 80.2 7.16 434 8.68
1988 Sector BOD % Population
loold equivalent
aIn t/day. bIn million, using a BOD load of 0.05 g/capita/day. Source: Department of Environment, Malaysia
1989 BOD % Population load equivalent
those discharging onto land and 83% of those discharging into watercourses comply with effluent standards.
Partially treated or untreated waste, both human and animal. is a national problem. Notwithstanding the National Agriculture Policy of 1983. the available technology and adequate financial resources, organic waste from animal husbandry is still a problem. This is because of land tenure issues. lack of political support and society's low regard for animal husbandry as a backyard activity rather than a modem industry. The difficulty in overcoming the sewage problem is proba- bly due to the lack of political will and poor siting of good sewage projects.
Water pollution also arises due to intensive land clearance, uncontrolled earthworks, and mining and logging activities in water catchment areas. Soil erosion causes sus- pended solids as well as river siltation and sedimentation. There are no spedfic regula- tions to control erosion and siltation and the existing laws are not enforced strictly by rele- vant authorities.
POLICY ON WATER POLLUTION CONTROL
Policies relating to wastewater treatment and disposal are found in various laws, reg- ulations and enactments, at least ten of which provide statutory powers to control pollution (Tables 2 and 3). The most compre- hensive legislation is EQA. To date, it has six sets of regulations which include Ewiron- mental Quality Regulations (EQRs):
EQR (Prescribed Premises [PP]) 1977: Crude palm oil; EQR (PP) 1978: Raw natural rubber; EQR 1979: Sewage and industrial efnuents; Environmental Quality Order (PP) 1989: Scheduled wastes treatment and disposal facilities; EQR 1979: Scheduled wastes; and EQR (PP) 1989: Scheduled wastes treatment and disposal facilities.
Similar sets of extensive regulations have yet to be widely introduced and enforced under other laws.

Table 2. Federal legislation on water pollution control in Malaysia.
Legislation Provision
1. Fisheries Act (1963) Protection of any fishery and flsh culti- vation in maritime and estuarbe waters.
2. Environmental Quality Act (1974) Control of water pollution largely from industrial sources.
3. National Forestry Act (1984) Prohibition of water pollution in penna- nent forest reserves.
4. Atomic Energy Licensing Act (1984) Prohibition of unauthorized radioactive waste disposal.
5. Exclusive Economic Zone Act (1984) Prohibition of oil or pollutant discharge into the marine environment.
Table 3. State legislation on water pollution control in Malaysia.
Legislation Provision
Waters Enactment (1920) Mining Enactment (1929)
Province Wellesley Piggery By-Laws (1956) Land Conservation Act (1960)
Street, Drainage and Building Act (1974)
Local Government Act (1974)
Rearing of Pigs Enactments Johore (1975) Trengganu ( 1976) Malacca and Negeri Sembilan (1980) Selangor (1984)
Prohibition of water pollution. Control of effluent water from any mining area. Control of pig rearing. Control of silt and erosion from land use activity. Regulation of waste disposition, sew- erage works, drainage and water- courses, cleansing and emptying sew- ers, and discharge of sewage or waste- water; control of earthworks. Prohibition of stream pollution and pro- vision of sanitary services. Control of pig rearing.
The underlying principles adopted in the formulation of EQA are:
a pollution should be controlled at source;
a polluters must pay or bear the costs of their waste or wastewater treatment or disposal;
a discharge standards should be uni- form for a particular source, type of industry or activity; uniform discharge standards should be contravened for polluters whose discharge does not adversely affect receiving waters, i.e.. waters stffl have the required "carrying capacity"; so- called "polluters" must bear the costs of investigative studies required by the relevant authorities; and
variable discharge standards ought to be introduced by the Minister of the Environment should the uniform standards imposed on every discharge point and all polluting sources within a water body be inadequate to main- tain the conditions necessary to sup- port the intended use of the water body.
The principles of equity, cost-effectiveness, efficiency and maintenance of uniform quality within a water body have yet to be adopted. Any policy taking these into account would entail a formal declaration of water body or river classification according to various bene- ficial uses. Its implementation would require technical support and trained manpower of the highest order.

PRESENT STRATEGY
The Department of Environment (DOE). which implements EQA, has adopted licens- ing as one of its enforcement mechanisms. Its purpose is to provide "incentives" for pol- luters to comply with imposed discharge standards as quickly as possible and to allow polluters to "buy" the necessary time for fur- ther R & D or for proper design and installa- tion of wastewater treatment or disposal facilities.
Significant investment in R & D of waste treatment technology resulted in pollution control from agro-based industries. Palm oil industries, for example, have developed sev- eral systems, the most common and efficient of which are those for ponding, open tank digester and extended aeration as well a s closed tank digester with biogas recovery and land application.
Types of licenses
The DOE issues two kinds of licenses: the annual license for prescribed premises and the contravention license. Under EQA Section 18(1), the annual license requires both palm oil and rubber processing mills to comply with discharge standards specifled under EQR (PP) 1977: (amended 1982) and EQR (PP) 1978: (amended 1980). respectively.
Issued under EQA Section 25(l), the con- travention license for other manufacturing industries contravenes discharge standards specified in EQR 1979.
FUTURE STRATEGY AND CONCLUSION
Regulatory control has its limitations in water quality protection and enhancement. Despite compliance with discharge stan- dards, the pollution sources' cumulative loads may eventually exceed the assimilative capacity of rivers and other water bodies. River water quality criteria and standards need to be developed. Rivers and other water bodies should be classified for the review of existing effluent discharge standards. Appro- priate effluent standards can then be estab- lished. These strategies will certainly accord better protection for the country's water resources.
ACKNOWLEDGEMENT
The author wishes to thank Encik Hashim Daud, Puan Mariana Mohd. Noor, Encik Noorberi Mohd. Yusof and Puan Faridah Arnir for assistance in the preparation of this paper. Views expressed are not necessarily those of DOE.

Solid and Hazardous Waste Management in the Philippines
DELFIN J. GANAPIN, JR. Department of Environment and Natural Resources
Visayas Avenue, Diliman Quezon City Philippines
GANAPIN. D.J., J R 1992. Solid and hazardous waste management in the Philippines, p. 41-55. In T.-E. Chua and L.R Garces (4s . ) Waste management in the coastal areas of the ASEAN region: roles of gov- ernments, banking institutions, donor agencies, pri- vate sector and communities. ICLARM Conference Proceedings 33, 2 18 p. Ministry of the Environment, and Canada-ASEAN Centre, Singapore; Asian Devel- opment Bank, and International Center for Living Aquatic Resources Management, Philippines.
ABSTRACT
This paper presents available information on solid waste and hazardous waste management in the Philip- pines. About 3,673 t of refuse is generated daily, only 85% of which is collected. The rest is indiscriminately burned, thrown in estuaries and canals, or dumped into sewers. Each year, industrial and manufacturing plants discharge about 80-100 million 1 of hazardous waste. These are disposed of by direct discharge to water- courses; on-site storage or burial; collection by tanker and discharge to domestic waste dumpsites or sewer; recycling; and incineration. Hospital waste, i.e., general, infectious and pathological waste, is thrown in open dumps or incinerated.
Present government efforts include the formation of the Presidential Task Force on Waste panagement, strict pollution monitoring and management, and implementa- tion of the rivers revival programs and those on solid and industrial wastes.
Demographic and socioeconomic concerns
The population of the Philippines in 1990 is estimated at well over 60 million with an
annual growth rate (AGR of 2.4%. This means that about 1.4 million people are added to the country's population every year, or that the population doubles in just one generation. The Philippines is the 14th most populated country in the world and 8th in Asia. The population density is about 196 persons/kmz, which is higher than the pop- ulation densities of Indonesia and Malaysia combined.
About 43% of the total population is con- sidered urban and is expected to increase to 48% by the year 2000. With an AGR of 3.6%, Metropolitan Manila has the highest popula- tion with about 8 million residents and 2 mil- lion commuters.
In the rural areas, upland population is of great concern. It is estimated at 18 million with an AGR of 2.6%. The increase of upland population has caused rapid forest clearing for farming and has thus led to serious silta- tion of lakes, rivers and coastal areas. Pro- jections imply an upland population of about 24-26 million and densities of 160-175 per- sons/k& by the year 2000.
Labor statistics show rates of unemploy- ment and underemployment at 9.2% and 32%, respectively. Other estimates, however, put unemployment at 20%.
In 1988. poverty incidence in the National Capital Region (Metro Manila mostly) was pegged at 31.8%. and that of the national population. at 60%. Rural poverty has caused a rapid growth in squatters in Metro Manila, estimated in 1990 at more than 400,000 peo- ple. Other data, however, show that more

than a million people, some nonsquatters, live in slum areas.
From 1986 to 1989, the gross national product (GNP) in real terms had a n AGR of 5%. In 1989, however. inflation grew to 10.9% so that by 1990, the real GNP went down to 3.4%. This is due to drought. power outages and political instability caused by the 1989 coup d'etat. The country has a US$29.7-billion foreign debt and an expected trade deficit of US$3.46 billion.
Existing and planned land and water use in the coastal zone
The Philippines is an archipelago of 7.107 islands with a total coastline of 17.460 km. Thus, 80% of the country's provinces and 66% of all municipalities are along the coast.
The coastal zone is the residence of 70% of the population. There are some 10.000 coastal barangay (villages). The ten most highly populated urban centers along the coast are Metro Manila, Metro Cebu. Davao. Zamboanga. Bacolod, Iloilo, Cagayan de Oro, Angeles, Butuan and Iligan. Only 12% of Metro Manila is properly sewered. The coastal zone is the end repository of urban sewage and garbage. In these cities, riverbanks and shorelines have very dense squatter colonies.
Agriculture
Agriculture is a major activity along the flatlands adjacent to coasts. One of the largest contributors to the national economy, it generates 36% of the country's export earnings and 28% of GNP. It is the livelihood of about 3/* of the country's population and I / , of the labor force. Of the country's 30 million ha, about 43% or more than 13 mil- lion ha are croplands. About 7.086 million ha are planted to rice and corn: 4.72 1 million ha to other food crops. i.e., coconut. sugarcane. coffee, cacao, fruits, nuts and vegetables; and 1.235 million ha to nonfood crops.
Forestry
The two types of forestry activities that have an impact on the coastal zone are man-
grove cutting for fuelwood, housing materials and conversion to fishponds as well as log- ging of the more inland dipterocarp forests. The latter, however, has started to decline with the dwindling of the timber resources. From estimates of more than 12 million ha of forest in 1981, there are only about 6 million left with less than 900,000 ha of old growth forest. Thus, while logging represented 2.2% of gross domestic product (GDP) in 1984. it slumped to 1.6% especially with restrictive government policies in 1986. In real terms, forest-based outputs contracted from B3.170 billion in 1970 to P1.998 billion in 1988.' While log exports earned more than US$200- 300 million annually in the 1960s and 1970s. these have been banned by the government.
The contribution of forestry is still sub- stantial. "orestry-related industries still pro- vide jobs to about 274.000 people. Farming in forest lands is done by about 1.2 million households. About 64% of the country's households use wood from forest lands. It has been estimated that in 1990, 3 1 million m3 of fuelwood will have been consumed by households, and 7.7 million m3 by industries.
Industry
Industrial development in the Philippines has been generally sited along the coastal zone. The industrial sector ranges from the petroleum industry which is virtually monop- olistic and large-scale but has a low employ- ment contribution to the food industry which involves considerable numbers of small to big establishments and accounts for the largest manufacturing employment.
As of January 1990, the major groups pro- viding the largest employment are: agricul- ture, fishing and forestry (44.62%); services (39.56%); comgmnity, social and personal services (18.23%); industry (15.98%); and wholesale and retail trade (14.59%).
The economic growth of the industry sector was 8.97% in 1988 which dipped to 6.91% in 1989 and about 2.10% in 1990.
There are 15.000 industrial firms in the country with 69% situated in Metro Manila. Industrial estate development, however, is

being aggressively pursued outside Metro Manila. Four export processing zones and 17 industrial estates operate in the country. Rapid developments are occurring in CALABARZON (Cavite, Laguna, Batangas and R i d ) with three more large developments in the advanced planning stage: the Samar Island Development Project (US$9.9 million), the Panay-Negros Agro-industrial Project (US$400 million) and the General Santos Agro-industrial Project (US$55.04 million). Industrial development is expected to increase with the passage of laws and policies providing greater incentives to local and for- eign investors.
A major industry affecting the coastal zone is mining. The total mineral ore reserves was estimated at 3 1.27 billion metric tons (BMT), with 6.1 1 and 25.6 BMT, respectively for metallic and nonmetallic ores. An important nonmetallic mining activity is silica sand mining.
Of special consideration is small-scale mining. The disorganized, opportunistic and gold-rush nature of small-scale mining results in landslides, erosion, mercury pollution and overcrowding, which are envi- ronmentally destructive.
There are 37 major mining compa- nies/operations for gold, silver, copper, chrornite and nickel all over the country. From 1980 to 1988, the mining industry's GDP contribution averaged P1.852.22 million annually.2 It also employed an average of 12 1,750 people.
Tourism
Small islands are being developed for tourism, particularly the relatively remote El Nido and Calamianes Islands of northern Palawan. Designed to be exclusive resorts. these tend to be high priced. The relatively small Ten Knots Resort in El Nido, for exam- ple, has an estimated P40-million annual gross revenue. Resort development also pro- vides a more lucrative livelihood to traditional fishermen who feny and guide tourists or
part of their staff to generate community support for the resort.
In 1990, private investment in tourism development amounted to W.5 16 billion.2 The projected manpower involved in the industry is more than 11,000 over 1.218 licensed and accredited establishments.
Fisheries
Fisheries is a major industry in the Philip- pines. k o m 1973 to 1986, overall fisheries production increased from 1.205 to 2.089 million t/year. About half of the annual take comes from municipal fisheries. The 1990 figures put fisheries production at 2.1 million t/year. Municipal fisheries and aquaculture account for increased production. Commercial fisheries has remained relatively constant at 0.5 million t/year. Fisheries con- tribute 5.1% of GNP and P4.47 billion in annual foreign exchange earnings.
Fisheries employs an estimated 1 million people or 3-4% of the national labor force, not including secondary fisheries activities. Municipal fisheries accounts for 75% of the employment, followed by aquaculture and commercial fishing with 21% and 4%. respectively.
The number of fisherfolk has increased by 50% over the last ten years. The catch per fisherman. however. has declined by 42% over the same period in Regions 5, 7, 8 and 11. Except for Regions 4. 6, 9 and 10, the average catch per fisherman in the other eight regions c-ot raise the economic level of fishermen. About 80% of the municipal fishing families live below the official poverty -
line. Apart from dynamite and cyanide fishing,
one of the most serious negative impacts of fisheries on the coastal zone is the conversion of mangrove areas into fish- and shrirnp- ponds. The average annual conversion rate is about 5.000 ha until the early 1980s to about 3.500 ha thereafter. Ninety-five percent of the more than 288,000 ha of fishponds can be ascribed to mangrove conversion.
supply seafood to the resort. Resort develop- ers tend to recruit community members as Infrastructure
New ports and roads are being planned and constructed for increases in population and

demand for development. Many of the pro- posed industrial estates. as in General San- tos City, South Cotabato. include ports. As cities expand, new ports will be built or old ones expanded.
The building of coastal roads has substan- tial impacts. Business establishments or squatter colonies displace fishermen. Some new roads will inadvertently provide access to hitherto isolated resources, e.g., a proposed road along the western side of Palawan is adjacent to the few remaining thousand hectares of virgin mangrove forests. Roads built more inland eventually impact on the coastal zone as they cause inmigration into unsettled areas which result in erosion and eventual siltation of rivers and bays.
The three large fish processing zones also have negative impacts on the coastal zone. The Iloilo Fishport has been issued a cease- and-desist order by the Pollution Adjudica- tion Board (PAB) prompting the Philippine Fisheries Development Authority to commit to the establishment of wastewater treatment systems for that facility as well as the ones in Navotas, Metro Manila and in Zarnboanga in the island of Mindanao.
Of special concern, too, are planned hydro- electric dams and mine tailings dams of mining companies. The latter helps control pollution but causes changes in river hydrol- ogy and eventually. on the ecology of bays.
ENVIRONMENTAC INVENTORY
Climate
The climate of the Philippines varies according to location and time. Topography also affects climate. The terrain varies a great deal with extensive mountain chains across Luzon and Mindanao to the land-sea mix of the Visayas. The country's proximity to the Asiatic continent and the surrounding large bodies of water gives rise to seasonal varia- tion of the wind system.
The first semester rainfall covers the main summer period from April to September. Rainfall greater than 2.000 rnrn is found in the western sections of Luzon and Panay islands while Cagayan Valley, the interior
portions of the Visayas and southern part of Mindanao have rainfall less than 1,000 mm. The second semester rainfall covers the main winter monsoon months from October to March. Rainfall greater than 2.000 rnm is found in eastern Philippines which is more exposed to the prevailing northeasterlies.
The northern tip of Luzon, Southern L w n . Bicol Region and Samar-Leyte are prone to typhoons. The country is also known to expe- rience droughts associated with the El Nmo phenomenon.
Topography
The Philippines is an archipelago of hilly and mountainous islands. Of the 30 million ha of land, some 16.8 million ha or 56% have a slope of above 18%. The watershed areas. especially in the smaller islands (only about 450 of the 7,107 islands have areas larger than 2.6 lun2). are very susceptible to flash floods and drought, once denuded.
Water quality
The quality of the country's coastal waters along growth centers has deteriorated due to sewage, garbage, industrial d u e n t s , mine tailings, oil from shipping operations and agricultural runoff. Coastal areas adjacent to denuded watersheds are also silted. More than half of the area of at least 21 provinces has been eroded.
In Manila Bay, bacterial counts have exceeded acceptable standards, rendering its eastern beaches unfit for bathing. fisheries and aquaculture. Calancan Bay and Taflon Strait are major waterbodies seriously affected by mine tailings. About 113 million t have been discharged into Calancan Bay from 1975 to 1986.
The country's inland waters of 421 rivers. 58 natural lakes and more than 100.000 ha of freshwater swamps have also suffered environmental degradation brought about by developments and the destruction of adjacent ecosystems. All five rivers in Metro Manila are biologically dead. In highly urbanized Cebu. rivers have registered high coliform bacteria counts of 5,000-170.000 MPN/ 100 ml. The 90,000-ha lake. Laguna de Bay, is already considered hypereutrophic.

Deforestation and mine tailings have silted many rivers. The lead content of Pantalan, Dagupan and Agno Rivers range from 1.0 to 5.4 mg/l, exceeding the 0.05-mg/l standard for Class C waters. Rivers along small-scale gold mining areas have mercury levels higher than the 0.002-mg/l standard.
As far back as 1984, saltwater intrusion has aected approximately 480.082 ha of waters outside of Metro Manila whose afTected areas cover 19.61 1 ha.
Biodiversity
The archipelagic nature of the country cre- ates considerable richness in flora and fauna. Recent short-term botanical surveys are still discoverfng plant species new to science. Plant endemism is about 27%. For birds. 39% of residents are endemic. The diversity of marine organisms in the coral reef ecosys- tems is also high, considering the 34,000 k& of reefs within the country.
The rare and endangered species that must be protected include the Philippine eagle, tamaraw. Calamian deer, tarsier, Palawan peacock pheasant, dugong. various marine turtles, and freshwater and estuarine crocodiles.
ENVIRONMENTAL CHALLENGES IN THE COASTAL ZONE
Use conflicts in the coastal zone are expected to heighten over the years. Fisher- men, competing with their own highly increased population for limited resources, have become active in pollution control efforts to increase the productivity of fishing grounds. The growth of the shrimp- and fish- pond industry, which is sensitive to pollution stresses, has created a counterpoint to the traditional use of the rivers as industrial dis- posal systems. There is a stronger demand for a steady domestic water supply in growth centers. In Metro Manila, the adjacent Laguna de Bay can be tapped, but this will mean stopping more than 900 industrial firms from disposing of their effluents into the lake or forcing them to treat their waste
within water quality standards appropriate for drinking water supply.
In the rural areas, there is greater vigilance among fanners against the siltation and pol- lution of their irrigation waters from mine tailings. Farming, however, also creates coastal pollution problems in its heavy use of chemical fertilizers and pesticides. The hypereutrophic state of Laguna de Bay is partly due to this.
Because rivers are traditional sources of water for drinking and washing in the rural areas, housewives are the first on many occa- sions to complain against pollution. At pre- sent, pollution complaints filed by rural communities are mostly related to piggery and sugar mill waste.
Rivers are also used for navigation. Resi- dents of Metro Manila at first were not too concerned about the pollution problem and navigation. Now. however, that a Metro ferry service plies the Pasig River to help solve the city's serious public transport problem, peo- ple have taken notice. No one wishes to ride on a feny that moves along a garbage-strewn and malodorous river.
Solid waste pollution of the rivers causes serious flooding in the streets. Polluted floodwaters at knee- or waist-level are health hazards as have been proven by increased gastrointestinal cases during the rainy sea- son.
Tourism resort owners and developers have recently joined efforts to control river and coastal pollution. No tourist would want to go to a beach where the colifonn bacteria count is high nor to a place where polluted water can be seen. Tourist resorts that cater to spe- cialized activities such as scuba diving have been particularly concerned about coastal pollution.
Tourism, however, can be the source of coastal pollution especially in areas of too much development. Improper garbage and sewage systems have resulted in plastic bags lodged between corals and high coliforrn counts in bathing areas. More specialized tourism development of the remote small islands is expected to have negative impacts on ecologically sensitive species such as marine turtles.
Oil spills and oily waste from passing ships are of special concern because these damage water resources. Fortunately, the oil spills in

the Philippines, although many, are relatively small. Ports development, however, is being intensified. Oily wastes from docked and passing ships will, in time, render shellfish culture inadvisable.
Energy development also bears watching. A geothermal plant in Tiwi, Albay disposes of its waste stearnwater into a bay, against which there have been protests. Future geothermal development should develop designs for re- injection or closed systems of emuent man- agement. Coal-fired power plants are also being checked for both air and water pollution.
Should population trends continue, there could be more coastal zone reclamation with serious negative environmental impacts, i.e., the flooding in the Navotas-Malabon area. Seagrass communities along Manila Bay dis- appeared because of the construction of the Cultural Center of the Philippines Complex on reclaimed land.
CURRENT WASTE MANAGEMENT ISSUES
Metro Manila is the center of edncation, industrialization and commercial growth in the Philippines. In effect, the influx of people to the region is continuous. The current pop- ulation, estimated at about 8 million. is expected to reach 10 million by the end of the century.
Consequently, environmental degradation has been one of the major problems of the region. Air pollution is caused mainly by transport and industry, contributing approximately 60 and 40% of the total pollu- tion load, respectively.
Water pollution in Metro Manila is caused by increased domestic and industrial dis- charges. Today, most major rivers are consid- ered biologically dead. All urban areas in the Philippines have no efficient sewage collection and treatment system although some affluent residential communities have sewage treat- ment facilities. Only about 12% of Metro Manila's population is served by a sewerage system. The rest contributes about 70% of all biodegradable organic pollutants in the river systems. Industrial activities contribute majority of the toxic pollutants with some biodegradable pollutants.
Estimates of the biological oxygen demand (BOD) generated by an average Filipino are
35-70 g/person/day as sewage and 640- 1,600 g/person/day as solid waste. For Metro Manila, estimates of BOD loading @/year) to the rivers and estuaries in the mid-1980s were:
Sewage 25,550 Food processing industry 1,849 Textile industry 313 Piggeries 298 Others 204
Solid waste management
A number of feasibility studies have been conducted regarding solid waste management in Metro Manila. The findings of the most recent study (DPWH 1990) were:
solid waste generation varies from one city or municipality to another, depending on income levels and the predominance of commercial and industrial activities. In terms of per capita generation, the municipality of Makati is the highest at 0.623 kg/ capita/day while the municipality of Taguig is the lowest at 0.320 kg/ capita/day. Of the estimated 3.673 t/day of garbage generated in Metro Manila. government operators collect about 71% and private haulers, 14%. About 300 t/day or 8% is recycled and the remaining 7% is believed to be indis- criminately burned, thrown in estu- aries and canals or dumped into sew- ers. Waste collection is undertaken by a combination of 43 private contractors with a total of 432 open dump trucks and government operators with 139 vehicles. The contractors' fleet is sub- ject to frequent breakdowns mainly because most of these trucks are about 20 years old; this results in inadequate refuse collection. The two- year old government vehicles are more reliable. The seven open dumpsites in Metro Manfla are not used simultaneously because of these basic problems: (a) health and safety of scavengers; (b) leachate runoff, blowing debris, odor. vermin and rodent infestation; (c) air pollution; and (d) poor access road, especially during the rainy season.
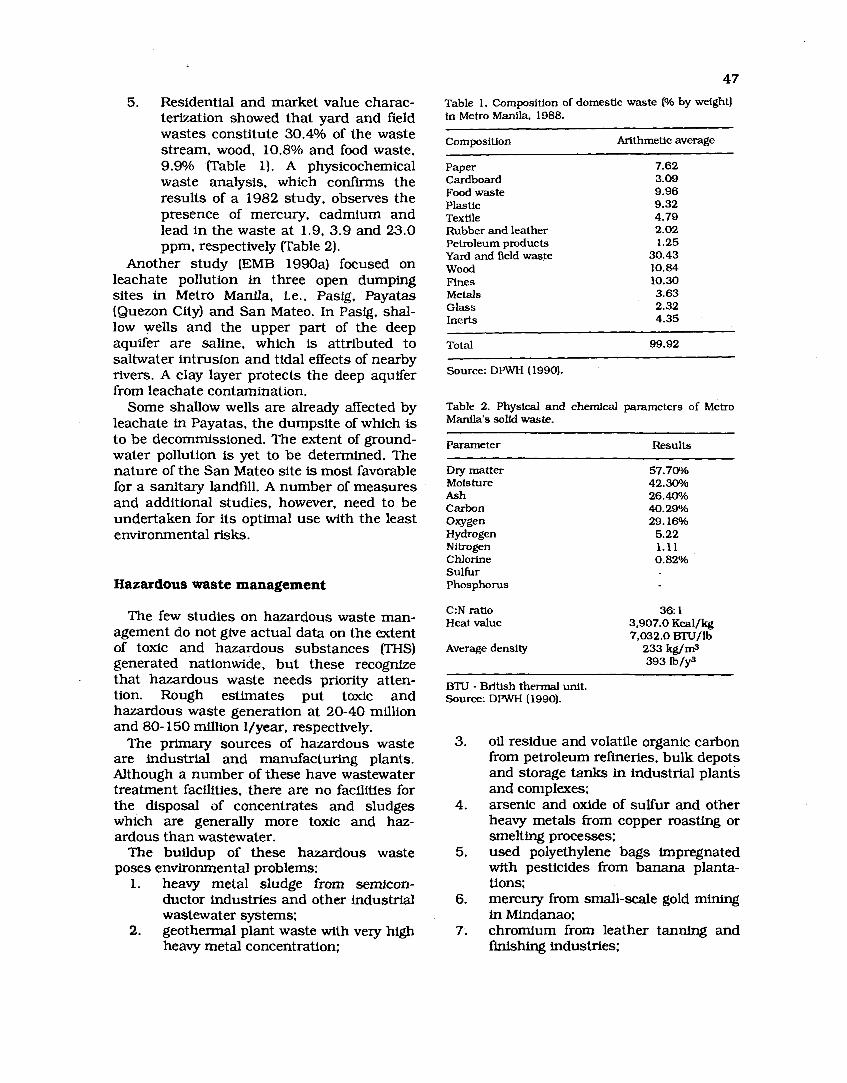
5. Residential and market value charac- terlzation showed that yard and field wastes constitute 30.4Oh of the waste stream, wood, 10.8% and food waste, 9.9% (Table 1). A physicochemical waste analysis, which confirms the results of a 1982 study, observes the presence of mercury, cadmium and lead in the waste at 1.9, 3.9 and 23.0 ppm, respectively (Table 2).
Another study (EMB 1990a) focused on leachate pollution in three open dumping sites in Metro Manila, i.e., Pasig. Payatas (Quezon City) and San Mateo. In Pasig, shal- low wells and the upper part of the deep aquifer are saline, which is attributed to saltwater intrusion and tidal effects of nearby rivers. A clay layer protects the deep aquifer from leachate contamination.
Some shallow wells are already affected by leachate in Payatas, the dumpsite of which is to be decommissioned. The extent of ground- water pollution is yet to be determined. The nature of the San Mateo site is most favorable for a sanitary landfill. A number of measures and additional studies, however, need to be undertaken for its optimal use with the least environmental risks.
Hazardous waste management
The few studies on hazardous waste man- agement do not give actual data on the extent of toxic and hazardous substances (THS) generated nationwide, but these recognize that hazardous waste needs priority atten- tion. Rough estimates put toxic and hazardous waste generation at 20-40 million and 80- 150 million l/year. respectively.
The primary sources of hazardous waste are industrial and manufacturing plants. Although a number of these have wastewater treatment facilities, there are no facilities for the disposal of concentrates and sludges which are generally more toxlc and haz- ardous than wastewater.
The buildup of these hazardous waste poses environmental problems:
1. heavy metal sludge from semicon- ductor industries and other industrial wastewater systems;
2. geothermal plant waste with very high heavy metal concentration;
Table 1. Composition of domestic waste ( O h by weight) in Metro Manila, 1988.
Composition Arithmetic average
Paper 7.62 Cardboard 3.09 Food waste 9.96 Plastic 9.32 Textile 4.79 Rubber and leather 2.02 Petroleum products 1.25 Yard and field waste 30.43 Wood 10.84 Fines 10.30 Metals 3.63 Glass 2.32 Inerts 4.35
Total 99.92
Source: DPWH (1990).
Table 2. Physical and chemical parameters of Metro Manila's solid waste.
Parameter Results
Dry matter 57.70% Moisture 42.30% Ash 26.40% Carbon 40.29% Oxygen 29.160/0 Hydrogen 5.22 Nitrogen 1.11 Chlorine 0.82% Sulfur Phosphorus
C:N ratio Heat value
Average density
--
BTU - British thermal d t . Source: DPWH (1990).
3. oil residue and volatile organic carbon from petroleum refineries, bulk depots and storage tanks in industrial plants and complexes;
4. arsenic and oxide of sulfur and other heavy metals from copper roasting or smelting processes;
5. used polyethylene bags impregnated with pesticides from banana planta- tions;
6. mercury from small-scale gold mining in Mindanao;
7. chromium from leather tanning and finishing industries;

8. waste from agricultural chemical industries;
9. heavy metals such as cadmium, chromium, zinc, nickel and copper from metal plating and finishing plants; and
10. hospital and laboratory waste con- taining radioisotopes, pathologic and infectious agents, and other toxic chemicals.
Because of the lack of a centralized facility for treatment and disposal, industries used these disposal methods:
1. direct discharge of dilute washwaters from drains into watercourses;
2. on-site storage and/or burial or on other lands owned or leased by the industry;
3. collection by tanker and discharge to domestic waste dumpsites. open lands and sewer or drain;
4. recycling; and 5. incineration. Most of these are inadequate. Thus.
industries (especially the multinationals), which are becoming aware of the hazards of their waste, conduct research and pilot stud- ies. A recent study of hazardous waste was conducted in Laguna Lake for estimates of selected chemical constituent pollutant loads from 5 1 industry and land-use category types (LLDA 1989). Table 3 shows the industrial and land-use categories while Table 4 is a list of THS considered as well as the total loads and estimates for the next 20 years. In addi- tion, there were estimates of these nonpoint sources: deforestation; agricultural runofi; urbanized-area runofX leachate from solid waste dumps; and runoff from mines and quarries.
The findings were: 1. Of the 908 registered industries in the
Laguna Lake area. 65% contributed significantly to the lake's pollution load with varied and increasing pollu- tive and/or hazardous waste.
2. The 41 industry types discharged an increasing number of THS which exceeds the chronic criteria for the protection of aquatic life. More than 90% generated waste contaminated with varying concentrations of trace metallic elements like chromium, cadmium, lead and zinc. Less than
Table 3. Industrial and land-use categories in Laguna Lake Basin.
Adhesive and sealant Battery manufacturing Coal/ofl petroleum products/rehery Dye manufacturing and formulation Electrlc generation plants/dismbution Electroplating/metal finishing Equipment manufacturing and assembly Unsecured sanitary landfills Fertilizer manufacture Food/food by-product processing Industrial/commercial laundries Ink manufacture and formulation Inorganic chemical manufacture Iron/steel manufacture/forming Laboratories/hospitals Leather tanning/flnishtng Misc. chemical formulation Motor vehicle services Nonferrous metals forming Nonferrous metals manufacturing Organic chemical manufacturing Paint manufacturlng/formulation Pesticides manufacture Pharmaceuticals manufacture Photo chemical and film manufacture Plastics molding/forrning Plastics/nxins/synthetic fibers Porcelain enamel Prlnting/publishing Pulp/paper mills Rubber manufacture/processing
Source: LLDA (1989).
half of the types had nonmetallic pol- lutants like cyanide, phenol. toluene and dichlorobenzene (Table 5).
A lot still has to bz done about hazardous waste management. Some of the needed mea- sures are standards development, research. inventories, a regulatory and monitoring system and technical staff training.
A special concern is the increasing number of countries which want to bring their indus- trial and hazardous wastes and scraps to the Philippines. The pretext is that the move will help improve the Philippine economy through no-dollar importation, technology transfer, increased employment and income. The import of toxic waste has to be guarded against, so the government has been rejecting these offers.
Hospital waste
A hospital solid waste management study, which was confined to those with bed capaci- ties of 100-5.200. was undertaken by the

Table 4. Total THS loads (kg/day) in Laguna Lake Basin.
THS 1989 1995 2000 20 10
Acrolein Benzene Carbon tetrachloride Chlorobenzene 1,2,4-Trichlorobenzene 1.2-Dichloroethane 1 , 1 , 1 -Trichloroethane Hexachloroethane 1, l -Dichloroethane 1,1,2-Trichloroethan 1.1.2.2-Tetrachloroethane Chloroethane 2,4,6-Mchlorophenol Chloroform 1,2-Dichlorobenzene 1.3-Dichlorobenzene 1,4-Dichlorobenzene 1, l -Dichloroethylene 1,2-Trans-dichloroethylene 2,4-Dichlorophenol 1,2-Dichloropropane 2.4-Dimethylphenol Ethylbenzene Bis (2-chloroethoxy) methane Methylene chloride Methyl chloride Naphthalene Pentachlorophenol Phenol Bis (2-ethyhexyl) Phthlate Butyl Benzyl Phthalate Di-n-Butyl Phthalate Di-n-octyl Phthalate Diethyl Phthalate Dimethyl Phthalate Tetrachloroethylene Toluene Trichloroethylene Vinyl chloride PCB Antimony Arsenic Cadmium Chromium (hexavalent) Copper Cyanide Lead Mercury Nickel Selenium Silver zinc Acetone Barium Bmmoform Cresols Cumene Dichlomdinuorornethane Ethyl acetate Ethyl ether Formaldehyde Isobutyl alcohol
Continued

Table 4. (continued)
THS 1989 1995 2000 2010
Methyl alcohol 816.0 Methyl ethyl ketone 2.55 Methyl isobutyl ketone 1.21 N-Butyl alcohol 40.7 P-Chloro-M-Cresol 4.84 Tetrahydrofuran 16.1 Trkhloromonofluoromethane 1.97 Xylene 43.4
Source: LLDA (1989).
Table 5. Percentage of industry types in Laguna Lake that exceeds the THS chronic criteria.
THS Industries exceeding criterion (%)
Metallic Chromium Lead Copper Cadmium Zinc Mercury Silver Nickel Arsenic Selenium Antimony
Nonmetallic Cyanide Phenol Toluene 1.2 Dichlombenzene Tetrachloroethylene 2,4 Dichlomphenol 1,3 Dichlombenzene 2.4.6 Trichlomphenol l,2 Dichloroethane 1.4 Dichlorobenzene Pentachlomphenol Carbon Tetrachloride 1.1.1 Trichlomethane 2,4 Dimethyl Phenol Chloroform Acrolein 1.2.4 Trichlorobenzene
Source: LLDA (1989).
Department of Health (DOH) with the assis- tance of the Department of Environment and Natural Resources (DEW (DOH 1988). Sig- nificant findings include:
1. Of the 64 government and private hospitals surveyed, 92% dispose of their general, i.e.. domestic. noninfec- tious and packaging waste, in the open dumps. About 16 and 31%
include their pathological and infec- tious waste, respectively. Only 27% disinfect their infectious waste before disposal with the general waste. Sharps are also usually disposed of in dumpsites. Other methods include open burning and dumping. burying within hospital compounds and flushing through the hospital plumbing system. Thirteen hospitals utilize incineration for their general, pathological and infectious waste. Only six of these. however, have incinerators that com- pletely destroy the waste.
PRESENT GOVERNMENT EFFORTS AND PROGRAMS
Pollution control and management is vested upon DENR The Environmental Man- agement Bureau (EMB) is the unit tasked with environmental pollution concerns.
Pollution monitoring as well as implemen- tation of orders and projects are the responsibility of regional ofllces under the function of the Regional Technical Directors for ~nvkonment. The adjudication of pollu- tion cases, however, is still in a central PAB, composed of seven members with the DENR Secretary as Chairman. The PAB has exparte powers to issue cease-and-desist orders to pollutive firms.
Pollution control and management. how- ever, cannot be implemented properly by one agency alone. In fact. in the Metro Manila area. of the metropolis comprising the watersheds and water bodies of Laguna de

Bay falls under the jurisdiction of the Laguna Lake Development Authority (LLDA) .
The DENR works with the Department of Trade and Industry on an Industrial Em- ciency and Pollution Control Project, indus- trial pollution issues and environmental con- cerns related to industrial estate develop- ment. For public education, DENR works with the Department of Education, Culture and Sports on integrating environmental education in the school curricula. For the informal sector. DENR cooperates with the Public Information Agency, various non- governmental organizations (NGOs) and media.
The government follows a sustainable development approach regarding industry because industries are important to employ- ment and the economy, and poverty causes environmental degradation. Thus, PAB has made it a policy to close polluting firms immediately, allowing temporary operations if they meet three requisites:
submit a detailed pollution control and management program for the fum complete with computations, work schedules, engineering designs, proof of contracts and budget; file in favor of government a perfor- mance bond equivalent to 25% of the total cost of implementing the pollu- tion control program; and commit to interim measures (i.e.. pro- duction reduction, temporary lagoons. etc.) that will reduce pollution sub- stantially until the pollution control facilities are finished.
The government also plans to improve zoning and land-use planning systems in the country. To evaluate the accomplishments of its regional offices, DENR made ecoprofiling a key result area.
Also, the government, through Cabinet Resolution No. 37, has passed a Philippine Strategy for Sustainable Development (PSSD) which lays out ten basic strategies (DENR 1990):
1. integrate environmental considera- tions in decisionmaking;
2. price natural resources properly; 3. reform property rights; 4. establish an Integrated Protected
Areas System; 5. rehabilitate degraded ecosystems;
6. strengthen residuals management in industry;
7. integrate population concerns and social welfare in development plan- ning;
8. induce growth in rural areas; 9. promote environmental education;
and 10. strengthen citizens' participation and
constituency building. These strategies are general but they pro-
vide the comprehensive framework for envi- ronmental concerns like solid and hazardous waste management. There are ongoing efforts at translating these strategies into opera- tional terms for the synchronized medium- term planning and budgeting exercise of all government agencies and for the 1992 Philip- pine Report to the United Nations Conference on Environment and Development.
Solid waste programs
Solid Waste Management Assistance and Development Program Ongoing for 1 1 years, the Solid Waste Management and Subsidy Program aims to assist local government units in their solid waste management prob- lems. As of the end of 1990. 124 local gov- ernment units in the country have been given subsidies of P30.000. Solid Waste Management Programs for
Metro Manila. In 1987. solid waste manage- ment became a presidential concern through Memorandum Circular No. 30 which created the Presidential Task Force on Waste Man- agement. Composed of government agencies such as the Department of Transportation and Communication, Metro Manila Authority, Department of Public Works and Highways (DPWH), DOH and D E W the task force aims to find better solutions to the solid waste problems in Metro Manila.
Among its major decisions were the opera- tion of two sanitary landfills (in Carmona, Cavite and San Mateo, R i d ) and five transfer stations; and the closure and rehabilitation of all open dumpsites.
Although this is a major government pro- ject in need of immediate operation. DENR ensures that all environmental protection measures are being done.

Hospital waste program
The government. through DOH. is prepar- ing a Hospital Waste Management Program. Recommendations include the operation of centralized incinerators in regions where the majority of hospitals are located, establish- ment of written policies on waste handling and disposal, and legal accountability of the hospital management for their waste man- agement practices.
In addition, Senate Bill No. 1581 requires all hospitals, medical centers and clinics to provide their own waste disposal system. The bffl is entitled "An Act Regulating the Waste Disposal System of All Government and Pri- vate Hospitals. Medical Centers and Clinics. Prescribing Penalties for Violations thereof and for Other Purposes".
Toxic and hazardous waste programs
Toxic Substances and Hazardous and Nuclear Wastes Conb-01 Act of 1990. On 26 October 1990. Philippine President Corazon C. Aquino signed into law the act controlling THS and nuclear waste and providing penal- ties for violations thereof. Specifically, it cov- ers "the importation. manufacture, process- ing, handling, storage, transportation. sale, distribution, use and disposal of all unregu- lated chemical substances and mixtures in the Philippines, including the entry. even in mere transit, as well as the keeping or storage and disposal of hazardous and nuclear wastes into the country for whatever purpose." Currently preparing the rules and regulations for its implementation is an inter- agency committee coordinated by EMB.
Philippfne Inventory of Chemicals and Chemical Substances (PICCS). Initially con- ceptualized as the data bank system for information storage and retrieval of identified toxic chemicals. PICCS will also serve as the repository of information and notifications received by the EMB from international and national organizations like the United Nations Environment Programme (UNEP) . World Health Organization ("WHO), United States Environment h-otection Agency, International Register of Potentially Toxic Chemicals and International Pn,grarnme on Chemical Safety.
Containing around 4.000 chemicals man- ufactured in or imported into the country.
PICCS is also an important document in preparing the regulations for the Toxic Sub- stances and Hazardous and Nuclear Wastes Control Act.
Training Programs on Hazardous Waste Management. One of the constraints of both government and industrial sectors is the lack of technical know-how in hazardous waste management. The EMB, through the assis- tance of the US Agency for International Development (USAID). East-West Center, World Environment Center. Carl Duisberg Gesellschaft South East Asia Program Office, WHO and UNEP, has promulgated these training workshops for 199 1 :
1. overall safety and control of toxic chemicals and hazardous wastes (national level);
2. hazardous waste management for government engineers and industrial technical personnel;
3. pilot programs for the development of a national hazardous waste survey and inventory system;
4. reduction of waste and disposal of metal sludges for the electronics industry; and
5. reduction of waste and management of organic solvents for metal finishing and chemical industries.
Industrial waste program
Indusbial Waste Exchange (Philippines) (n;yEP). Started in 1987, the IWEP project is expected to reduce environmental impacts from industrial waste disposal through the promotion of waste transfer and utilization between and among firms as a practical alternate to waste management schemes. Also, it aims to generate economic returns on both waste generators and users through savings on disposal costs and raw materials, etc.
As the clearinghouse and link of partici- pating industries, EMB has, thus far, issued four Waste Exchange Bulletins containing a directory of available and wanted waste mate- rials. Around nine actual exchanges have been made. including waste recycling.
Regional Monitoring. The DENR regional offices also conduct regular monitoring of industrial firms and potentially pollutive

activities. Potentially pollutive industries are required under law to have their own pollu- tion control officer to implement their moni- toring programs. The regional office, however, validates the regular reports submitted by the company especially if there are pollution complaints.
Examples of special programs are the mer- cury pollution monitoring program in the gold rush areas of Mindanao and the water quality monitoring and ecological assessment of selected priority bays, which is being done by DENR as part of a major Fisheries Sector Program.
DENR Planned Investment Programs. To support residuals management in industry. DENR has drawn up these programs and projects:
Toxic Chemicals and Hazardous Waste Management Program; Air and Water Quality Monitoring Network; Developing Air, Water and Soil Quality Standards; Economic Incentives for Pollution Control; Pollution Control Technologies and Industrial Efficiency; Reduction of Pollution from Toxic Materials Used in Small-Scale Mining; and Environmental Impact Assessment (EIA) of Major Mines.
The DENR is also discussing the possibility of a US$100-million environmental sector loan and a US$20-million ''brown ecology" or a sustainable urban and industrial environ- mental management program with the Asian Development Bank and USAID, respectively.
River revival programs
There are two ongoing river revival programs in the country. The first involves the interorganizational Navotas-Malabon- Tullahan-Tenejeros Rivers project: govern- ment and nongovemment efforts include actual river cleanup, dredging, closure of pollutive factories and public education. Slum/squatter resettlement or improvement is still being planned.
The second is on the historic Pasig River, the planning and studies of which were sup-
ported by the Danish International Develop- ment Agency (DANIDA) . Recommendations to be implemented include the formation of an interagency Secretariat; cleanup by flushing; slum/squatter management; control of fac- tory pollution; and proper sewage and solid waste management.
The DENR regional offices have already been tasked to identify major rivers requiring rehabilitation in their areas of jurisdiction. The experience and expertise gained from the Navotas-Malabon-Tullahan-Tenejeros Rivers and Pasig River revival programs will be used.
Recent DENR initiatives
The DENR focus has shifted from regula- tory to developmental. Conflict resolution processes allow development initiatives to proceed without sacrificing environmental protection. The DENR initiatives include:
a "Dirty Dozen" program that targets the biggest twelve polluters in each region to maximize limited resources and send the message that DENR is serious in its efforts; rigorous implementation of the public hearing process in the EIA system and giving importance to the resolution of community concerns before any Envi- ronmental Compliance Certifkate (ECC) is given; initiating multipartite monitoring, that includes NGOs and community lead- ers, to later on be set up in a nation- wide citizens environmental monitor- ing network; agreements with the National Eco- nomic Development Authority (NEDAJ as well as major funding institutions that no endorsement will be given to major projects without these going through the EIA system and receiving an ECC; setting up an Environmental Guar- antee Fund or a sharing of royalties for environmental protection purposes from proceeds of the utilization of natural resources to finance multi- partite monitoring, immediate com- pensation for damages, community environmental projects and later rehabilitation of utilized areas; and

initiating the institutionalization of an Awareness and Preparedness for Emergencies at the Local Level WELL) system for industries; a workshop with related government agencies and supporting industrial firms has been held, and piloting of the system with selected firms is ongoing.
NONGOVERNMENTAL INITIATIVES
Waste management is one of the concerns of the nongovernmental sector. Due to lack of funds and technical expertise, however, many NGOs have been content with issuing com- plaints or leading protests against polluters. Some NGOs, however, have joined the gov- ernment's systematic monitoring of pollutive industries through multipartite programs which are being expanded. Monitoring is presently being done at the Marcopper mines in Marinduque. Leyte Industrial Development Estate, and Grand Antamok Mines in Benguet. The Nationwide Coalition of Fisherfolk for Aquatic Reforms has agreed to a training of their leaders on pollution monitoring in key fishing grounds all over the country.
With NGOs as part of the overall monitor- ing system, the Philippines can then easily move into direct community participation for monitoring and regulation in waste manage- ment. The actual implementation, however, has not gone beyond public information and recruitment of key leaders.
In the cities. NGOs have been quite active in the solid waste recycling campaigns. They have also naturally handled the public edu- cation campaign for proper garbage manage- ment. Enterprising NGOs have started "money from garbage" projects to help provide livelihood for the needy. Some are discussing joint efforts with plastic companies for easier recycling of waste plastics.
The IWEP is ongoing for the polluter industry group. Many polluter industries. however, still need to join this program. Some organized themselves into the Voluntary Organizations of Industries for a Cleaner Environment (VOICE) which focuses on envi- ronmental education of their own members;
improves channels of communication between industries and regulatory agencies, especially DENR; and lobbies for greater incentives for industries that spend for pollu- tion control systems.
Big companies have decided to do it on their own. Benguet Corporation, one of the biggest mining companies, has recently put up its own high-level environmental unit. San Miguel Corporation, another giant of Philip- pine industry, has invested substantial funds for pollution control of their activities and for environmental projects outside of the com- pany's profit-making businesses. The coun- try's "greening of business" is on its way as the Philippine Chamber of Commerce and Industry makes environment a concern in one of its major committees.
CONSTRAINTS, PROBLEMS AND CONSEQUENCES
Most Filipinos today realize the connection among health, the quality of life and the con- dition of their environment. There is a grow- ing concern about the increasing environ- mental degradation and a call for more effec- tive and efficient policies to cope with the problems.
The country, however, has to contend with these constraints:
lack of trained and expert government technical st& for hazardous waste; unavailability of monitoring and ana- lytical equipment; polluter industries' lack of knowledge of their hazardous waste or deliberate noncompliance with govemment restrictions; unavailability of approved treatment facility and disposal sites for haz- ardous waste; conflict between economic develop- ment and environmental protection. The strict requirements of the envi- ronmental protection agency some- times turns investors off. On the other hand, the importers of hazardous materials and waste believe that they are boosting the economy, notwith- standing the serious environmental consequences.

6. the growing "not-in-my-backyard (NIMBY) syndrome among the people; and
7. lack of public information and the people's negative attitude towards waste management efforts.
The resources needed are enormous. For Metro Manila alone, environmental improve- ment in the next five years will cost at least US$710 million. An integrated solid waste management program and sewerage projects need US$134.22 and ' US$128.20 million, respectively over the next five years. For starters, at least US$100 million is needed to support efforts at industrial efficiency. pollu- tion control and waste reduction improve- ments. Billions of dollars are needed for the proper waste management of all the growth centers in the country.
Delays in the establishment of waste man- agement programs are believed to result in the degradation of the natural resources. Because majority of the people depend directly on these resources, the loss of liveli- hood spawns resentment that is being trans- lated into violent action.
While there are no q u a n w g studies yet, many sectors believe that production losses due to illnesses and medical costs are higher due to the deteriorating environment. Other costs redound to activities dependent on the quality of the environment. Tourism, seen as a dollar-earning industry, will be lost unless the trend is reversed.
CONCLUSION
Planning for solid and hazardous waste management should be done in close liaison among the concerned government authori- ties. industries and communities. Coopera- tion that generates a very strong political will is needed to attain the objectives of a national waste management policy.
While developing countries like the Philip- pines may not have the financial resources for modem pollution control facilities, they can resort to solid and hazardous waste management options that focus on waste reduction and recycling processes or on non- and low-waste technologies.
Under present efforts, the situation is one of a close tug-of-war between complex prob- lems and proper policies complemented by increasing concern and effort. Also, the country is rushing both its environmental protection and industrial development efforts. The balancing of these two traditionally con- flicting directions requires not only technical expertise but also a restructuring of socio- economic structures, values and attitudes. This is the challenge of waste management in the Philippines.
REFERENCES
DENR (Department of Environment and Natural Resources). 1989. 1989 annual report. Department of Environment and Natural Resources, Quezon City, Philippines.
DENR (Department of Environment and Natural Resources). 1990. Philippine strategy for sustainable development. Department of Environment and Natural Resources, Quewn City, Philippines.
DOH (Department of Health). 1988. Hospital Solid Waste Management Study in Metro Manila Area. Department of Health, Manila, Philippines.
DPWH (Department of Public Works and Highways). 1990. Solid Waste Feasibility Study for Metropolitan Manila. Consoer, Townsend and Associates for the Department of Public Works and Highways, Manila, Philippines.
EMF3 (Environmental Management Bureau). 1990a Pre- study report Leachage Pollution from Open Dumping Sites in Metro Manila. VIAK Consulting Engineers for the Environmental Management Bureau, Quezon City, Philippines.
EMB (Environmental Management Bureau). 1990b. Manila Metropolitan Region Environmental Improve- ment Study Report. JMM Consulting Engineers, Inc. for the Environmental Management Bureau, Quewn City, Philippines.
LLDA (Laguna Lake Development Authority). 1989. Laguna Lake Toxic and Hazardous Waste Manage- ment Feasibility Study Report. URS International, Inc. for Laguna Lake Development Authority, Pasig, Metro Manila, Philippines.
NEDA (National Economic Development Authority). 1990. Medium-term public investment program: 1990- 1994. National Economic Development Authority. Pasig, Metro Ma&, Philippines.

Status and Trends of Waste Management in Singapore
TAN ENG GEE Sewerage Department
Ministry of the Environment 40 Scotts Road Singapore 0922
TAN, E.C. 1992. Status and trends of waste management in Singapore, p. 57-70. 1nT.-E. Chua and L.R Garces (eds.) Waste management in the coastal areas of the ASEAN region: roles of governments, banking institu- tions, donor agencies, private sector and communities. ICLARM Conference Proceedings 33, 218 p. Ministry of the Environment, and Canada-ASEAN Centre, Sin- gapore: Asian ~ e v & o ~ m e n t Bank, and ~nternational Center for Living Aquatic Resources Management, Philippines.
ABSTRACT
Highly urbanized and industrialized Singapore has a relatively small land area that needs properly planned land use and pollution control.
The bulk of solid waste comes from domestic and trade sources. Collection of refuse is done by government and private contractors. Disposal is by sanitary landfill or incineration. Refuse incineration is the most cost- effective method for solid waste disposal in Singapore.
Around 90% of the wastewater is derived from domes- tic and industrial sources. To control discharges that pollute watercourses, the government has provided an extensive sewerage system. To date, it comprises 2,240 km of sewers. 132 sewage pumping stations and 6 cen- tral sewage treatment works (SIW). These STW produce sludge which has been used as soil conditioner and top- soil for reclaimed land.
Proper legislation and law enforcement will result in more effective waste management. Future directions include the construction of another incineration plant. development of an offshore disposal site, extension of sewerage infrastructure and rehabilitation of existing sewerage facilities. A compact-cum-covered STW design will be also adopted.
BACKGROUND
Singapore consists of the island of Singa- pore and some 58 islets within its territorial waters. The main island is about 42 km long and 23 km wide, covering an area of 573.1 kmz. Its coastline is 137.7 km. The total land area. including the islets. is 625.6 kmz.
Singapore has a relatively uniform temper- ature, high humidity and abundant rainfall due to the marine exposure of the island and its proximity to the equator. The average daily temperature is 26.6 "C and the average daily relative humidity is 84.5%. The mean annual rainfall is 2.369 mm (MOCI 1989).
Population
Singapore's 1990 population is 3 million. Rising standards of living, health and hygiene have reduced the infant mortality rate from 82.2 per 1.000 live births in 1950. 34.9 in 1960. 20.5 in 1970, 11.7 in 1980. to 7 in 1988.
The national life expectancy has also increased from 62.5 years in 1957.67.3 years in 1970 to 71.2 years in 1980. The popula- tion growth rate was 1.7 % in 1970, 1.2 % in 1978 and 1.5% in 1988.
Singapore's ultimate population is expected to reach 4 million (MOCI 1989).

Table 1. Employed persons by occupation.
Occupation Employed persons '
[thousands)
Professional and technical workers Administrative. managerial
and executive workers Clerical and related workers Sales workers Services workers Production and related workers Not classikhble
Total 1,238.5 100.0
Table 2. Employed persons by gross monthly income.
Omea monthly income Employed persons % (s$) (thousands)
Under 200 200-399 400-599 600-799 800-999
1,000-1,499 1,500 a d over
Total 1,216.e 100.0
aExcluding unpaid family workers.
Employment data
In June 1988, Singapore's population aged 15 and over totalled 2.037.200. Of this. 1.281.400 (62.9%) made up the total labor force. The unemployment rate was 3.3%.
Of the 1,238,500 employed, there were 1.057.400 employees, 6 1.000 employers, 98.400 own-account workers and 21.700 unpaid family workers. Majority worked in the manufacturing (352.600); commerce (283,600); community, social and personal services (27 1.600); and transport, storage and communications (120.200) sectors.
Tables 1 and 2 show the distribution of employed persons by occupation and gross monthly income, respectively.
The per capita indigenous Gross National Product in 1988 was S$15,999 (MOCI 1989h1
Land use
Land use in highly urbanized and industri- alized Singapore is for housing, industrial, commercial, agricultural and recreational purposes as well as for water catchments (Table 3). Its relatively small land area makes proper management and pollution control necessary.
Housing and Industry. About 48.6% (3W.2 km2) of the land is taken up by housing and industry. The Housing and Development Board (HDB), the public housing authority, is the biggest housing developer in Singapore. By 1988, HDB had developed 95 new town and housing estates, and succeeded in housing 87% of the population in Singapore (Fig. 1). The remaining 13% live in private housing.
The largest industrial estate is the Jurong Industrial Estate at the western part of Sin- gapore. Smaller industrial estates are scat- tered across the country (Fig. 2).

Table 3. Land use in Singapore.
Land use - - --- - - -
Built-up amas (housing and 304.2 48.6 industrial)
Fannholding areas (of licensed 20.4 3.3 farms, excluding pure rubber and coconut plantations)
Forest 28.6 4.6 Marsh and tidal waste 15.7 2.5 Others (inland waters, open spaces, 256.7 41.0
public gardens, cemeteries, nonbuilt-up amas in military
establishments, quarries, rubber and coconut plantations and unused land]
Total land area (main island 625.6 100.0 and oflkhore islets)
Fig. 1. Major housing estates in Singapore.
The major manufacturing industries in Singapore are: electronic, electrical, machin- ery and fabricated metal products, transport equipment. printing and publishing, wearing apparel, and petroleum industries.
The industrial estates have 3,900 factories employing 230,000 workers. Their gross fixed assets amount to -18 billion.
Farmland and Other Uses. Farmland occu- pies only about 3% of the total land area. But
the fanning sector has been a steady and substantial source of essential fresh farm produce such as poultry, eggs, vegetables and fish. In 1988. 2.076 licensed farms. occupying 2,036 ha. produced an estimated -361-million worth of farm produce.
Forest, marsh and tidal wasteland occupy about 7% of the land. Inland waters, open spaces, public gardens, cemeteries, quarries and unused land comprise the rest (41%) (MOCI 1989).
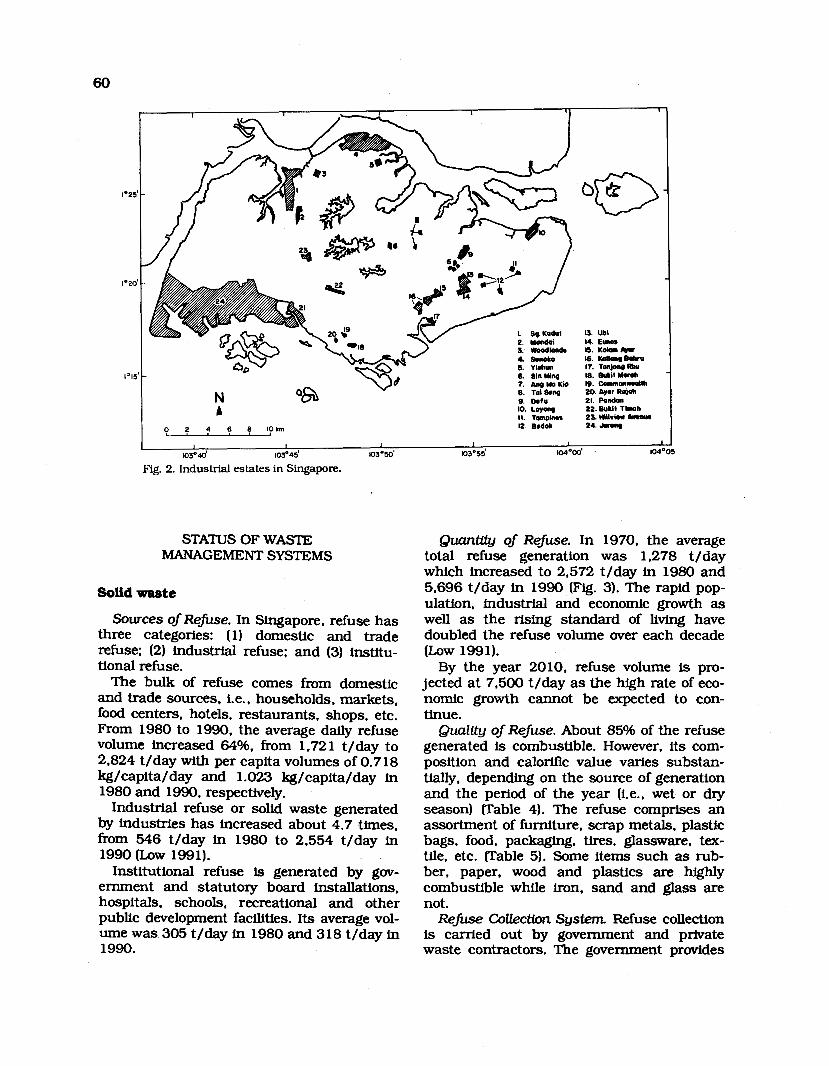
W. Ubi 14. Em08 rs. Kololn m M. Kollmq Baku IT. Tanjong Rhu 10. BuLit M m h IS. ~ o n * . o N h 20. Ayw Rajah 21. Pondan 22. Rukit Tinah 23.lUUv*r &mnw 24. JvM10
I I I I I I 1
103~40' 103~45' 103~50' 103~55' 104~00' 104
Fig. 2. Industrial estates in Singapore.
STATUS OF WASTE MANAGEMENT SYSTEMS
Solid waste
Sources of Refuse. In Singapore, refuse has three categories: (1) domestic and trade refuse; (2) industrial refuse; and (3) institu- tional refuse.
The bulk of refuse comes from domestic and trade sources, i.e., households, markets. food centers. hotels, restaurants, shops, etc. From 1980 to 1990, the average daily refuse volume increased 64%. from 1.72 1 t/day to 2.824 t/day with per capita volumes of 0.7 18 kg/capita/day and 1.023 kg/capita/day in 1980 and 1990, respectively.
Industrial refuse or solid waste generated by industries has increased about 4.7 times. from 546 t/day in 1980 to 2.554 t/day in 1990 (Low 199 1).
Institutional refuse is generated by gov- ernment and statutory board installations. hospitals, schools, recreational and other public development facilities. Its average vol- ume was 305 t/day in 1980 and 318 t/day in 1990.
Quantity of Refuse. In 1970, the average total refuse generation was 1.278 t/day which increased to 2,572 t/day in 1980 and 5.696 t/day in 1990 (Fig. 3). The rapid pop- ulation. industrial and economic growth as well as the rising standard of living have doubled the refuse volume over each decade (Low 1991).
By the year 2010, refuse volume is pro- jected at 7,500 t/day as the high rate of eco- nomic growth cannot be expected to con- tinue.
Quality of Refuse. About 85% of the refuse generated is combustible. However, its com- position and calorific value varies substan- tially, depending on the source of generation and the period of the year (i.e.. wet or dry season) (Table 4). The refuse comprises an assortment of furniture, scrap metals, plastic bags, food, packaging, tires, glassware, tex- tile, etc. (Table 5). Some items such as rub- ber. paper, wood and plastics are highly combustible while iron, sand and glass are not.
Refuse CoUection System. Refuse collection is carried out by government and private waste contractors. The government provides

Year
----- Domestic and Trade ------ Industrial Institutional -.-.- Total
Fig. 3. Total daily refuse generation in Singapox, 1970-2010.
Table 4. Properties of refuse in Singapore.
Net calorific value (kJ/kd 4,000-9,000 Water content (% by weight) 40-65 Incombustible (% by weight) 7.5-22.5
Source: Low (1991).
Table 5. R e f b e composition in Singapore.
Constituents %by weight
Fruits, vegetables, garden and food waste Paper. cardboard and wood Plastics Textile, leather and rubber Metals Glass Ceramics Resfdue
Source: Low (1991).

daily collection service to domestic house- holds and trade premises while the private waste contractors collect refuse from mainly industrial premises, commercial and shop- ping complexes, and construction sites.
In private housing estates and shophouses. the refuse collection crew travels from premises to premises, emptying refuse from individual bins into the vehicles. Direct col- lection is unproductive because it is labor- intensive and tirne-consuming.
In high-rise apartment blocks, shopping and commercial complexes, markets, food centers, condominiums and flatted factories, refuse is collected. conveyed and stored in bin centers. The collection crew then removes the refuse from the bin centers to disposal sites. This indirect collection method is more efficient as refuse from many sources is col- lected from one location. Another set of work- ers, however, is needed to collect refuse from individual premises or blocks of premises to the bin centers, resulting in double-handling of refuse.
For refuse collection from domestic house- holds and trade premises, the government operates a fleet of 209 collection vehicles fit-
ted with compaction and hydraulically oper- ated bin-lifting devices. Their capacity varies from 1.5 to 7 t. The fleet composition is:
Number of collection Vehicle capacity vehicles
1.5 t 4.0 t 7.0 t Total
The government provides both direct and indirect refuse collection services. Routes where both services are applied are known as mixed collection routes.
In 1990, private waste contractors removed and disposed of 2.554 t/day of refuse or 45% of the total refuse volume of 5.696 t/day (Low 1991).
Refuse Disposed Systems
Refuse incineration plants. The Ministry of the Environment (ENV) operates two inciner- ation plants at Ulu Pandan and Tuas with a combined refuse capacity of 3,600 t/day (Fig. 4).
@ UIU Pondon mclnerotlon plant
@ TUOS mcln*rotlon Plonl
@ Senoko mc~neration plant
@ Kim Chuon tronsfar station
@ Lorong Haius tipping ground
@ Lim Chu Kong tipping ground
Fig. 4. Refuse disposal sites and transfes station in Singapore.

1. The Ulu Pandan Refuse Incineration Plant. which was built in 1979. has a rated capacity of 1,600 t/day. In 1990, it incinerated 488.742 t which amounted to 23% of the total refuse generated in Singapore.
The plant also generated 85.4 mil- lion kwh of electricity in 1990, 20.7 million kwh of which were consumed by the plant. The surplus electricity of 64.7 million kwh were sold. Alto- gether. 6,237 t of scrap metal were recovered and sold.
The average dust concentration in the flue gas disposed to the atmo- sphere via a 150-m high chimney was 24.3 mg/Nm3. well within the limit of 200 mg/Nm3 stipulated in the Clean Air Act. A total of 84,863 t of inciner- ation ash was disposed of at the san- itary landfill at Lim Chu Kang.
2. The Tuas Incineration Plant (TIP), which was constructed in 1986, has a rated capacity of 2,000 t/day. In 1990, it incinerated 699,994 t which represented 34% of the total refuse generated in Singapore.
The plant generated 230.6 million kwh of electricity. 54.4 million kwh of which were used for plant operation. The surplus of 176.2 million kwh were sold. About 12,112 t of scrap metal were recovered and sold.
The average dust concentration in the flue gas was 28 mg/Nm3, well within the Clean Air Act limits. Incin- eration ash amounting to 116.414 t was disposed of at the sanitary lanclflll site at Lim Chu Kang.
3. The Kim Chuan Transfer Station. which was built in 1986. has a capacity of 1,500 t/day (Fig. 4). The refuse unloaded at this station is brought by collection vehicles from the eastern half of Singapore. Refuse is then compacted into 20-t container- trailers, which travel across the island to TIP in the west for refuse disposal.
This station improves the efnciency of collection vehicles servicing the eastern part of Singapore as well as the overall collection productivity. With the use of large container-trail-
ers, there is no need for more collec- tion vehicles or manpower.
In 1990, the station handled a refuse average of 1.430 t/day. Its fleet of 40 prime movers and 60 container- trailers averaged 69 trips/day (Low 1991).
Sanitary landfll In 1990, a total of 890,379 t of refuse was disposed of at the two sanitary landf111s. Lorong Halus and Lim Chu Kang Tipping Grounds (Fig. 4). This repre- sents about 43% of the total refuse generated in Singapore.
Refuse is weighed before being discharged at the landfills. A covering of approximately 150 mm of earth is placed over each day's layer of tipped refuse to prevent public health hazards like scavenging and fly breeding (Low 1991).
Costs and Revenue. The capital costs (S$ million) for the construction of the various refuse installations are (ESD-ENV 1990):
Ulu Pandan Incineration Plant 130 Tuas Incineration Plant 200 Kim Chuan Transfer Station 30 Lorong Halus Tipping Ground 32
Operation costs (including manpower. depreciation and other costs) per ton of refuse in 1989 are?
Refuse collection 27.63 Disposal at landfills 3.43 Disposal by incineration 24.83
Solid waste revenue comes mainly from fees charged to households and trade premises. and sales of surplus electricity and scrap metal recovered from the refuse. For example, in 1989, the total revenue was S$84.17 million, the breakdown of which is:
Refuse collection fee 59.73 Disposal fee at lancuills 8.74 Disposal fee at incineration plants 3.39 Sales of electricity 10.93 Sales of scrap metal 1.38 Total 84.17

Liquid waste Sector Water consumption % (million m3)
Sources of Wastewater. The three main sources of wastewater in Singapore are domestic, industrial and farm waste.
Domestic wastewater comprises mainly sewage and sullage water generated by human activities such as cooking and wash- ing. It comes from households, food centers and commercial premises such as hotels. restaurants, shops, etc. It consists mainly of organic matter in solution or suspension. and other substances including silt, grit, salts and microorganisms.
Industrial wastewater is effluent generated by the factories in their manufacturing pro- cesses. Effluent content depends on the raw materials and other chemicals used in the manufacturing processes. It may contain large amounts of organic matter as well as nonbiodegradable and toxic materials such as heavy metals, acids and other corrosive chemicals and synthetic organic compounds. It may also contain volatile and flammable chemicals which could be fire and explosion hazards.
In the past, the major sources of farm waste used to be pig and poultry farms. To minimize pollution in watercourses. cesspits for waste treatment were installed in pig farms. About 600m of the biological axygen demand (BOD) and suspended solids (SS) were removed from the wastewater. The solids that accumulated in the cesspits were taken to STW at regular intervals for further treatment. Moreover, the government decided to phase out pig farming in 1985. In 1990, this was successfully completed.
To control waste from poultry farms, farm- ers were required to rear poultry in covered sheds and remove dung in solid form. Poultry rearing in batteries makes for simple and effective collection and disposal of pollution loads. The amount of waste that finds its way into the drain is insignificant. Quantity of Wastewater. Population growth
and rapid industrialization programs have increased wastewater quantity substantially over the years. In 1950. water consumption was 52 million m3. In 1980 and 1989. this increased to 2 15 and 305 million m3, respec- tively.
The approximate breakdown of water con- sumption in 1989 (PUB 1989) is:
Residential 160 52.5 Industrial/comme~~ial, etc. 115 37.7 Others 30 9.8
Clearly, about 90% of the wastewater gen- erated comes from domestic and industrial sources. To control wastewater discharge and prevent watercourse pollution, the govern- ment has provided an extensive sewerage system to ensure that all wastewater is col- lected and treated before final discharge into the sea. Table 6 shows the total volume of wastewater collected and treated yearly from 1985 to 1990. The total volume of wastewater to be collected and treated is expected to reach 620 million m3 by the year 2025.
Table 6. Total volume (in d o n d) of treated wastewater, 1985- 1990.
Year Volume
1985 244 1986 258 1987 283 1988 301 1989 318 1990 320
Source: SD-ENV (1990).
Sewerage Infastructure. Over the last two decades, the government has invested heavily in constructing and extending sewerage infrastructure. To date, the sewerage network comprises 2.240 km of sewers, 132 sewage pumping stations and 6 central STW.
These STW, which provide secondary wastewater treatment. have a total capacity of 955,000 m3/day (Table 7 and Fig. 5). Using an activated sludge process, wastewater is treated to the Royal Commission Standard of 20:30 (B0D:SS) before it is discharged to the sea. The process removes 90-95s of BOD and SS. In 1990. these STW treated a total daily average flow of 877,000 ms. The quality of wastewater received at the works is shown in Table 8.
All new developments in Singapore are required to have modern sanitation, i.e., these are to be connected to the public sewer

Table 7. Treatment capacity of STW.
Year Capacity commissioned (m3/day)
Ktm Chuan 1948 256,000 Ulu Pandan 1961 286,000 Bedok 1979 116,000 Kranji 1980 76,000 Seletar 198 1 57.000 Jurong 198 1 164,000
Total 955,000
Fig. 5. The STWs and the catchments.
Table 8. Range of analytical results of wastewater before and after treatment in 1990.
Parameters Crude Final SeWage effluent
Solids Total Suspended
Oxygen demand BOD, (20°C) COD
Nitrogen NHJ-N TKN
C1 pH Total allcallnity (as CaCo3) Total PO-4 (as P) Detergent (as LAS) Oil and grease Color (as HU)
Source: SD-ENV (1990). All results are expressed in mg/l except pH and color. COD - chemical oxygen demand. TKN - total Kjeldahl nitrogen. HU - Hazen unit.

where it is available or the developers them- selves provide sewage treatment plants. Composed of a p h a r y settling tank and a biological or trickling filter, a treatment plant has a capacity varying from 10 to 5,000 per- sons. In 1990. the government maintained 526 sewage treatment plants serving an esti- mated population of 85.000. These plants will be diverted to the public sewer when it becomes economical for the government to extend the public sewerage schemes to their areas.
Today, almost 1000h of the population in Singapore enjoys modem sanitation com- pared with 75Oh in 1980 and 51% in 1970.
Industries that discharge their wastewater into the sewerage network are required to ensure that the quality of the industrial wastewater complies with the stipulated lim- its listed under the Trade Effluent Regula- tions of 1976. Otherwise. they have to install treatment plants at their factories to pretreat effluents before discharging them into the sewer. Sludge Disposal. The STW produce sludge
that is used as a soil conditioner for land- scaping and tree planting. In the 1970s and early 1980s. the sludge demand was so high
it exceeded production. Towards the mid- 1980s. however, the demand dropped. At the same time, production climbed from 1 10,000 t in 1985 to 180,000 t in 1990. This resulted in a growing surplus.
In 1984, disposal options for the sludge surplus were reviewed. One solution was the use of sludge as the topsoil of reclaimed lands which were not yet marked for development. This was done by removing the top layer of the reclaimed land, then spread- ing a thin layer of sludge and finally covering the sludge with the excavated top layer. A s many land reclamation projects were in progress then, this method was found to be the most economical and practical in the short term. Since 1985. 350,000 t of surplus sludge have been disposed of in this manner Fig. 6).
Water Reclamation. In the 1960s it was recognized that the increasing domestic and industrial demand for water would strain Singapore's limited water resources. The Jurong Industrial Water Works (JTWW) was therefore constructed in 1966 to reclaim water from sewage effluent. It supplied low- grade water to meet industry's demand for such purposes as washing and cooling.
Q. 6. Reclaimed land for sludge disposal in Singapore.

The JIWW treats the effluent from the nearby Ulu Pandan STW by chemical coagu- lation and sand filtration before distributing the industrial water to factories in Jurong Industrial Estate. Industries using industrial water include paper. textile and steel mills: chemical plants, shipyards and a petroleum refinery. The quality of industrial water is given in Table 9.
The industrial water is currently supplied to industries. at a charge of 28 cents/m3. about one-fourth the charge for use of potable water at S$1.10/m3.3
The JIWW is currently being expanded to increase its production capacity from 45,000 m3/day to 65.000 m3/day.
Capital and Recurrent Expenditure. The construction of sewerage infrastructure requires heavy capital investment. The gov- ernment invested about S$1.8 billion to keep pace with the rapid housing and industrial developments over the past two decades. About S$72 million was spent in 1990. excluding the sewer construction costs of HDB for their housing estates.4
In 1990, the recurrent expenditure in liq- uid waste management amounted to S$76 million, including manpower and other oper- ating costs, and depreciation of fixed assets.
The capital and recurrent expenditures incurred by the government for 1986-1990 is shown in Table 10.
In 1990, the operating costs (S$) per 1,000 m3 of sewage are:
Before After depreciation depreciation
Sewage treatment 84 134 Collection and treatment 153 239
Revenue. The main sources of liquid waste revenue are the Sanitary Appliances Fee and the Waterborne Sewage Removal Fee. A fee of S$3.00 per sanitary fitting per month is charged to premises connected to the sewer- age system. The Waterborne Fee is pegged against water consumption. A fee of 10 and 22 cents/m3 of water consumed is charged on top of the water bills to domestic and industrial premises, respectively. Table 11 shows the revenue collected for 1986- 1990.
-
315 October 1991: S1.70 = US1.00. 41990: S$1.75 = US$1.00.
Table 9. Quality of industrial water.
Color (HU) Turbidity (mul BODS (20 OC) COD Dissolved oxygen Free ammonia (as N) TKN Nitrite nitrogen (as N) Nitrate nitrogen (as N) PH SS Total solids Chloride (as C1) Total hardness (as CaCo3) Sulfate (as S042-) Detergent (as LAS) Phosphate (as P) W t y (as CaCo3)
7-11 1-3
less than 5 21-41 3.9-6.5 9-17 11-19
0.1-0.4 5-9
6.5-7.1 less than 5 370- 1,200 170-430 95-250 60-180 0.1-0.3
1-4 70-120
All values are expressed in mg/l except color, turbidity and pH. NTU - Nephelometric turbidity unit.
Table 10. Capital and recurrent expenditures, 1986- 1990.
Expenditure Year @ $ d o n ) 1986 1987 1988 1989 1990
Capital 94 79 74 60 72 Recurrent 68 67 69 74 76
Source: SD-ENV (1990).
Table 11 . Revenue collec- tion (S$ million), 1986- 1990.
Year Revenue
1986a 94 1987b 97 1988 103 1989 110 1990 112
Source: SD-ENV (1990). -2.15 = US$l.OO bS$2.18 = US$1.00
The breakdown of the 1990 total revenue of about S$112 million is: Sanitary Appliances Fee. S$58.39 million; Waterborne Sewage Removal Fee. S$47.72 million; and others. S$6.38 million.

LEGISLATION AND CONTROL
Legislation
In the 1970s and 1980s. the legislation to protect and improve the environment included those for pollution control:
Water Pollution Control and Drainage Act, Chapter 348; Trade Effluent Regulations (1976); Trade Effluent [Amendment) Regula- tions (1977); Poisons Act, Chapter 234; Poisons (Hazardous Substances) Rules ( 1986); Environmental Public Health Act (1987); and Prevention of Pollution of the Sea Act (1971).
The Water Pollution Control and Drainage Act. Chapter 348. empowers the director of Water Pollution Control and Drainage to control the wastewater discharge from domestic, industrial, agricultural and other premises. All wastewater is to be discharged into the public sewer where it is available. The act provides for severe penalty and pun- ishment for offenses that result in serious water pollution. A subsequent offense of dis- charging a toxlc substance into the inland water is punishable by a mandatory jail sen- tence of at least a month and a fine not exceeding S$20.000.
The Trade Effluent Regulations (1976) stip- ulate the discharge limits of trade effluents into the public sewer and watercourses. The Trade Effluent (Amendmendment) Regulations (1977) were passed to allow the discharge of trade effluents which exceed the stipulated limits of biodegradable pollutants as mea- sured by BOD and SS. Industries can discharge into the public sewer on payment of a tariff or treat their biodegradable waste.
The Poisons (Hazardous Substances) Rules (1986) control the storage, transport and use of hazardous chemicals. The Poisons Act, Chapter 234, lists the hazardous chemicals which require a license for their importation.
The Environmental Public Health Act (1987) and subsidiary regulations provide for the control and disposal of toxic wastes.
The Prevention of Pollution of the Sea Act (197 1) covers marine pollution from ships at sea.
Control and enforcement
The most effective pollution control mea- sure is proper planning. Planntng Control ensures that new developments and their activities are environmentally compatible with the surrounding land use. Specifically. it keeps out pollutive activities from sensitive areas such as water catchments.
Although the government encourages industrial developments in Singapore, activi- ties which pose serious environmental haz- ards are not permitted. Also, wherever possi- ble, all factories are sited in areas where public sewers are available so that the trade effluent, after pretreatment if necessary. is discharged to sewers to minimize pollution.
Nearly 50°h of the land area in Singapore is used as water catchments for potable water supply as well as agricultural, residential and even industrial uses. Planning Control ensures that industries that use or store large quantities of chemicals or produce large amounts of toxic waste are not sited within these unprotected catchments. This will minimize the risk of contamination of the water resources during an accidental dis- charge of chemicals or toxic wastes.
Technical requirements on pollution con- trol are incorporated into the planning and design of a building or plant when building plans are submitted for approval. Enforce- ment officers inspect the completed develop- ment to ensure that the requirements are complied with. Regular inspections of indus- trial and trade premises are also carried out to ensure that pollution control facilities are properly maintained and operated. Such inspections deter indiscriminate wastewater discharge into watercourses; violators are prosecuted.
In spite of the heavy penalty, littering is still a problem in Singapore. Further efforts in public education are being made to solve it. Engineering measures like the slabbing over of drains, installation of drain gratings, mechanical canal screening and deployment of float booms to trap and remove litter have also been implemented to prevent refuse from getting into the sea. Refuse that enter the estuary of the river would then have to be removed by workboats known as water witches.

FUTURE PLANS AND DIRECTIONS
Solid waste
Before 1979, solid waste was disposed of mainly by sanitary landfill, a relatively simple but land-intensive method. As land is scarce in Singapore, alternative methods such as composting. pulverization, high-density com- paction and incineration were studied in the early 1970s. Refuse incineration, which reduces volume by as much as 90%. was found to be the most cost-effective. The gov- ernment's solid waste management strategy is, therefore, to incinerate all incinerable wastes.
The first incineration plant at Ulu Pandan was constructed in 1979, followed by TIP in 1989. These plants are incinerating about 57% of the refuse generated each day. A third plant. with a capacity of 2,400 t/day. is being constructed at Senoko and is expected to be operational by 1992. Its completion will give Singapore a total incineration capacity of 6,000 t/day, which will enable the govern- ment to incinerate all incinerable refuse till the turn of the century. By 2025. a fourth plant may be necessary.
Phase lV of the Lorong Halus Tipping Ground has recently been constructed. To prevent leachate from polluting the coastal water, impermeable liners have been installed. A leachate treatment system will also be constructed.
The landfills at Lorong Halus and Lirn Chu Kang will be able to cope with the nonincin- erable refuse and incineration as3 till 1997. Expected to be operational in 1997- 1998 is a 350-ha offshore sanitary landfill being devel- oped east of Pulau Semakau. Costing over S$600 million, it will be able to meet Singa- pore's disposal needs beyond 2025.
To reduce the demand for landfill space and incineration capacity. the government has exerted more effort to educate the public on reducing waste through resource recy- cling. A pilot waste recycling project covering three housing estates was recently intro- duced. Residents were encouraged to divert certain readily recyclable materials from the
waste stream. Recycling will be extended to cover more households and workplaces. Reuse of materials which would otherwise be discarded will help to moderate the rise in waste disposal cost and consenre natural resources. The government will also encour- age industries to minimize waste at source.
Liquid waste
In the 1970s and 1980s. the government embarked on an accelerated sewerage devel- opment program to provide basic sewerage infrastructure to the population and indus- tries. Today, almost 100% of the population enjoys modem sanitation.
The provision of sewerage infrastructure in Singapore started in the 1910s. The old sew- ers will progressively require rehabilitation to cut down inflow and infiltration, prevent structural failure, and ensure the adequacy and reliability of the sewerage network. Also, the older sewage treatment works will require phased reconstruction when they reach the end of their economic lives. The sewerage network will continue to be extended to serve new public and private developments.
Sludge disposal on reclaimed land is an economical short-term solution, currently costing the government only about S$6 per ton. It is unlikely, however, that this method can be used beyond 1997. Thereafter. off- shore disposal at the new sanitary landfill to be developed at Pulau Sernakau will become necessary. Eventually, however, sludge incin- eration will have to be adopted.
The STW will also be expanded to cope with the projected flow increase from 320 million m3 in 1990 to 620 million m3 in 2025. The STW have a conventional design, i.e., open tanks sprawled over a large area. The government is now looking into the proposal to adopt the compact-cum-covered STW design. This requires less land since the treatment units are rectangular and are compactly laid out to facilitate covering up which would contain the foul air to be extracted for treatment.
These ongoing and long-term programs will cover the period beyond the year 2025. An estimated S$1.5 billion will be needed to implement these over the next ten years.

REFERENCES on Solid and Hazardous Waste Management, June 199 1. Singapore.
MOCI (Ministry of Communication and Information). 1989. Singapore facts and pictures 1989. Ministry of
ESD-ENV (Engineering Services Department-Ministry of Communication and Information, Singapore. the Environment). 1990. Annual Reports 1989- 1990. PUB (Public Utilities Board). 1989. Annual Report 1989. Engineering Services Department-Ministry of the Public Utilities Board, Singapore. Environment, Singapore. SD-ENV (Sewerage Department-Ministry of the Environ-
Low, F.H. 1991. Solid waste management in Singapore. ment). 1990. Annual Reports 1985- 1990. Sewerage Paper presented at the Environworld 199 1 Conference Department-Ministry of the Environment, Singapore.

Problems and Trends of Waste Management in Thailand
PORNCHAI TARANATHAM Environmental Quality Standards Division Ofwe o j the National Environment Board
60/ 1 Soi Phibun Watthana 7, Rama Vl Road Bangkok 10400
Thailand
TARANATHAM, P. 1992. Problems and trends of waste resources, including a 2,614-km coastline management in Thailand, p. 71-76. In T.-E. Chua and L.R. Garces (eds.) Waste management in the coastal areas of the ASEAN rcgion: roles of governments, banking institutions, donor agencies, private sector and communities. ICLARM Conference Proceedings 33, 218 p. Ministry of the Environment, and Canada- ASEAN Centre, Singapore; Asian Development Bank, and International Center for Living Aquatic Resources Management, Philippines.
ABSTRACT
Water pollution and solid waste disposal are the most serious environmental problems of Thailand. Many canals and rivers, especially those near large settle- ments, are heavily polluted because they serve a s sinks of domestic and industrial wastewater. Only 4.200 t of the 5,000 t/day of solid waste in Bangkok are collected and disposed of. The rest is left in areas inaccessible to collection trucks or thrown into canals and rivers.
To solve existing problems and prevent new ones, water resources have to be protected. Measures include (1) laws on pollution control and development planning; (2) a pollution monitoring system; (3) reduced pollution loads; (4) government and private investment in pollution prevention and control; and (5) public awareness and participation. Also, water quality standards have been established, and duty fees reduced for antipollution equipment.
INTRODUCTION
and natural rivers a i d canals Rapid population growth and industrializa-
tion, however, have brought about resource degradation and a declining environmental quality. Water pollution and solid waste dis- posal are the most serious environmental problems of the country. Many rivers are contaminated with untreated wastewater from factories and large settlements such as Bangkok, Chiang Mai and Khon Kaen as well a s chemicals from fertilizers and pesticides used on commodity crops. In many regions of the country, both the surface- and ground- water are contaminated with toxic substances such a s heavy metals.
The solid waste problem is becoming acute. In Bangkok, for example, more than 6 million people generate 5,000 t of refuse each day, only 4,200 t of which are collected. The rest is left in areas inaccessible to collection trucks or thrown into canals and rivers.
These problems will definitely pose a threat to the economy of Thailand unless adequate planning is done and appropriate technology and strict control measures are applied.
WATER POLLUTION AND SOLID WASTE PROBLEMS
One of the ASEAN member-countries, Water pollution Thailand has a total land area of 513,115 k m 2 and a population of nearly 60 million. Its In Thailand, surface waters include rivers, unique geographical terrain is rich in natural oceans. lakes, ponds and reservoirs. Four

72
major rivers, namely, Chao Phraya, Tha Chin. Table 1. The major rivers of Thailand and their sinks. Mae Klong and Bangpakong, discharge into the Gulf of Thailand. The other rivers dis- charge into other bays (Table 1).
An extensive monitoring program under- taken by various agencies such as the Office of the National Environment Board (ONEB). Department of Public Health and Department of Public Works, concluded that many canals and rivers, especially those near large settlements, are heavily polluted.
Most of the natural watemays serve as sinks of domestic and industrial wastewater. A study of the Bangkok Metropolitan Area (BMA) estimated the quantity of domestic and industrial organic waste reaching the lower Chao Phraya River at 76% and 24%. respec- tively. Table 2 and Fig. 1 show the biological oxygen demand (BOD) load from the major coastal zones of Thailand: central basin. eastern seaboard, eastern south and western south. The central basin contributes the highest BOD load with 34,376 t/year, of
River Sink
Chao Phraya Gulf of Thatland Tha Chin Gulf of Thailand Mae Klong Gulf of Thailand Bangpakong Gulf of Thailand Chi Mae Kong River Moon Mae Kong River Tapi-Phum Duang Ban Don Bay Phangnga Phangnga Bay
Table 2. The BOD load from the major coastal zones of Thailand in 1986.
Zone BOD load (t/year) Industrial Domestic Total
---
Central basin 5,343 29,033 34.376 Eastern seaboard 1,207 1,207 Eastern south 208 45 1 659 Western south 1,384 1,384
which 29,033 t/year are from domestic dumped in natural waterways and leachate sources and 5.343 t/year are industrial. from open dumps cause water pollution.
Solid waste
According to an ONEB survey, the overall average waste generation rate is 0.66
POLLUTION CONTROL POLICY AND MEASURES
kg/capita/day. ~ndividual community rates - - range from 0.40 0.56 Wcapitaiday for water pollution pou~y and programs regional cities. Table 3 shows the estimated generation rates formulated by the Regional City Development Project.
The vegetable/putrescible waste and paper make up the largest and second largest por- tions of sample weight, respectively. Moisture content is about 55% of the total wet weight, with little Werence observed between dry and wet seasons.
The most common waste disposal method in the cities is open dumping. Typically, waste is burned on-site during the dry season to reduce volume and control vectors. During the rainy season, insecticide is sprayed on- site. Three disposal facilities with a combined capacity of 5.7 million m3 operate in Bangkok
The solid waste collection system in Thai- land is inemcient because it is inadequate. Uncollected garbage is an eyesore and a pub- lic health hazard. In addition, garbage
There is no clear policy or programs to control water pollution in Thailand. The Sixth National Plan (1 986- 1990). however, recog- nized the need for the treatment of waste- water from communities and a master plan to control water pollution and maintain urban development.
For water pollution, 13 activities and 11 projects under 5 main categories, namely studies and research, improvement of laws and regulations, investment, administration. and monitoring, were identified. These cost 102 million baht.'
In October 1989, the Prime Minister appointed an ad hoc committee to prepare the policy and guidelines on water, air and noise pollution. The committee was chaired --
11989: 25.70 baht = US$1.00.
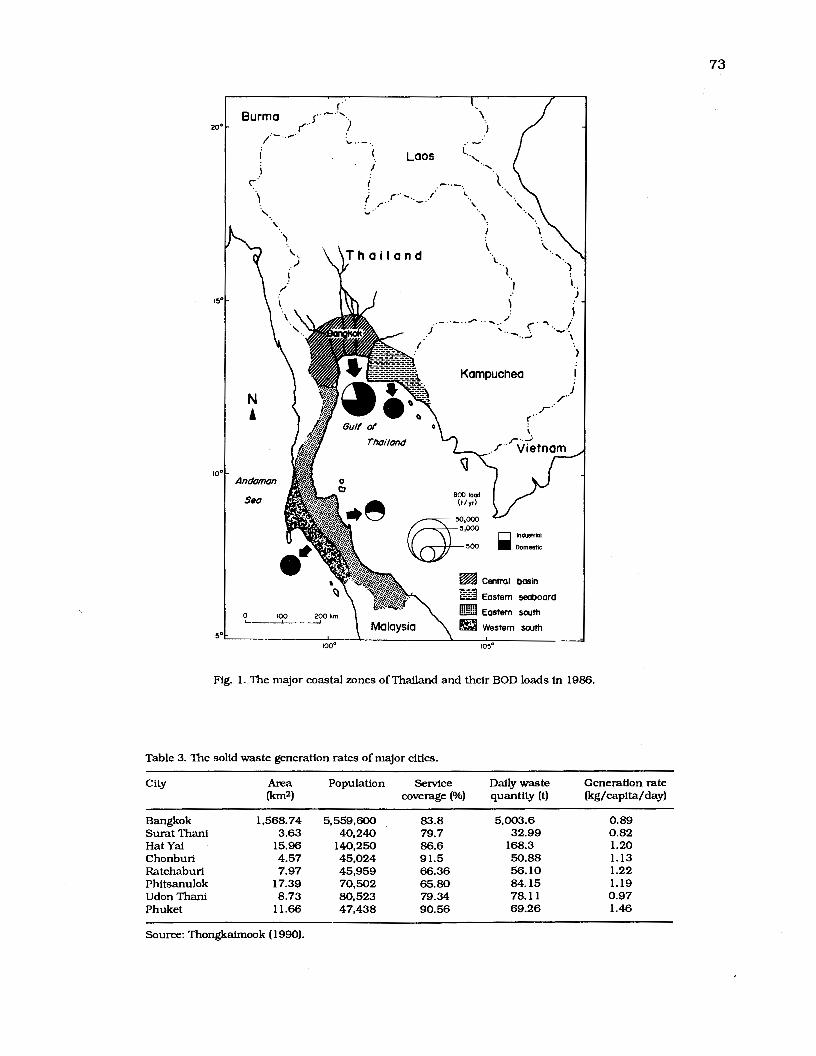
Burma
I"-,
I \
7.' '., ' .
Kampuchea ! /"
i J-"
r " ,-..-'
. . f " Vietnam
BOO load
-50,000 -.-
a Central basin
Eastern seaboard
Eastern south
\ Western Jouth
0 100 200 krn \ Malaysia
Fig. 1. The major coastal zones of Thailand and their BOD loads in 1986.
Table 3. The solid waste generation rates of major cities.
City Area Population Service Daily waste Generation rate (km2) covenge (%) quantity (t) (kg/capita/day)
Bangkok 1,568.74 5,559,600 83.8 5,003.6 0.89 Surat Thani 3.63 40,240 79.7 32.99 0.82 Hat Yai 15.96 140,250 86.6 168.3 1.20 Chonburi 4.57 45,024 91.5 50.88 1.13 Ratchaburi 7.97 45,959 66.36 56.10 1.22 Phitsanulok 17.39 70,502 65.80 84.15 1.19 Udon Thani 8.73 80,523 79.34 78.1 1 0.97 Phuket 11.66 47,438 90.56 69.26 1.46
Source: ThongkaLmook (1990).

by the Permanent Secretary of the Ministry of Science. Technology and Energy with ONEB as its secretariat. The recommendations were approved by the govemment in early 1990. A working group, chaired by the Prime Minister was then formed to monitor the implementa- tion of the activities.
To solve the existing problems and prevent new ones. the main objective is to protect and restore water resources so that water quality is suitable for human uses and corresponds to the social and economic development of the nation.
The guidelines to control water pollution are:
Strictly apply extsting laws on pollu- tion control and development plan- ning, including land use control. Establish an efficient monitoring sys- tem to enforce compliance with envi- ronmental quality standards and envi- ronmental impact assessment (EIA) procedures. Reduce pollution loads at source and treat them to meet effluent standards by developing management plans and investing in wastewater treatment systems. Encourage and support more govern- ment and private investment in pollu- tion prevention and control. Motivate the public to understand the issues and participate in the fight against environmental pollution.
For the short term. 6 legal measures. 15 investment measures. 10 other measures. and a campaign and public relations measure were identified, with a total budget estimated at more than 6.000 million baht.2 The measures related to solid and wastewater management in urban areas were estimated to cost 1.400 million baht. The year 199 1 was declared the 'Year for Wastewater Treatment".
Policies for solid waste have been estab- lished. namely: (1) the solid waste problem is the principal responsibility of the government and (2) manpower, budget and technology must be made available to the local government.
21990: 25.19 baht = USB1.00.
In addition, the following measures have been developed to control the problems asso- ciated with solid waste:
1. An effective waste management sys- tem that includes storage, collection. transportation, disposal, processing and recycling has to be developed for implementation by local authorities.
2. Recycling activities should be encour- aged.
3. Local staff should be given technical training.
4. Laws and regulations must be enforced.
5. Public awareness and cooperation must be promoted.
Cabinet resolutions
At least six cabinet resolutions concern water pollution control in urban areas:
Resolution on Restricted Zone for the Protection of Water as the Source of Water Supply for BMA (1 7 April 1979); Resolution on the Expansion of the Restricted Zone for the Protection of Water as the Source of Water Supply for the Bangkok Metropolitan Region (BMN (12 January 1988); Resolution on the Action Plan for the Correction of Water Quality Degrada- tion of the Chao Phraya River (29 August 1988); Resolution on the Guidelines for the Correction of Water Pollution in Pat- taya Bay (22 November 1988); Resolution on Measures for the Cor- rection of Water Pollution due to Domestic Wastes from BMA (2 Jan- uary 1989). The four main measures are to: (a) construct a wastewater col- lection and treatment system for the Rattanahsin area; (bl develop a master plan for the treatment of wastewater from BMR; (c) require new hotels to have wastewater treatment; and (d) speed up the improvement of the water treatment system at the Sirirach Hospital;
0 Resoliltion on the Urgent Measure for the Correction of Problems from Wastewater in BMR (19 September 1989) stipulates the investment in the

construction of a wastewater treat- ment system for BMR according to the master plan of the 2 January 1989 resolution.
Laws and regulations
At present. there are no laws and regula- tions on water pollution control. However, many existing laws and regulations relating to public health and safety as well as the environment have been indirectly applied. Public Health Act (1 94 1, 1 984). Enacted by
the Ministry of Public Health (MOPH), this law aims to protect public health. It autho- rizes local govemments to issue ordinances to ensure proper collection and disposal of human and other solid wastes and to prevent adverse effects to public health. This act. however, does not require adequate treatment of sewage and wastewater generated by com- munities. Also, considering that this act was passed almost 50 years ago, the penalties and service fees specified are not enough to provide for adequate services and effective enforcement. The limited budget and man- power of the local governments and the lack of clear guidelines on enforcement make this act less effective. The MOPH is currently revising it to increase its effectiveness in water pollution control and other areas.
National Environment Quality Act (1975). This act aims to protect and conserve the quality of the nation's environment. It estab- lished ONEB. EIA requirements for specific projects, and standards of water quality and domestic effluents. But it does not provide for water pollution control and for financial and legal instruments to ensure enforcement. Clearly, these limitations do not help achieve the main objectives of the act and the national policy for water pollution control which is to preserve and enhance the quality of the nation's waters.
Factory Act (1 969). Enacted by the Ministry of Industry (MOI), this act aims to control the waste discharges from industrial activities. Enforcement, however. is ineffective because the small and household industries in many urban areas are not monitored. Also, this act does not control the discharge from gas sta- tions which are major contributors to water pollution in urban areas.
Building Code (1 936. 1979). Enacted by the Ministry of Interior (MOInt), this code con- trols building construction in urban areas. Its main purpose is to ensure (1) structural safety; (2) protection of public health and environment; (3) accessibility to fire protec- tion and traffic; and (4) conformity with town planning and architectural beauty. It requires the installation of a proper collection and treatment system for human waste, i.e., a leaching pit with soakway for houses and a septic tank with a cesspool for large build- ings. The lack of monitoring to ensure proper construction of the treatment system reduces the effectiveness of this code. The MOInt is currently revising the code to effectively con- trol wastewater discharges from buildings.
Navigation fn Thai Waters Act (1913). This law aims to control construction along public watercourses and pollution that affects living resources as well as prevent sedimentation that obstructs navigation. It prohibits the dumping of rocks, gravel, silt, soil, mud. detritus, solid waste, sewage, oil and cherni- cals into public water and courses such as rivers, canals, swamps, reservoirs and lakes that are used for navigation or other pur- poses. The constraints are the lack of enforcement due to the limited personnel and budget, the low priority given by the Harbor Department, and other social and political complications.
Provincial Authority Act, Municipal Govem- ment Act, Sanitary District Act, City of Pattaya Act, Bangkok Metropolitan Act. Under these acts, local governments are assigned compul- sory functions such as providing water sup- ply and drainage as well as optional functions such as providing public utilities. These acts, however, lack specific authority or control over sewage and wastewater collection or treatment.
All these, however, are ineffective due to budget and staff limitations as well as the lack of enforcement.
Standards
Standards are established to control and maintain the levels of water quality to protect public health as well as to conserve national resources and environment.

The drinking water standards cover the quality of drinking water, bottled drinking water and groundwater for drinking pur- poses.
The effluent standards are for industrial effluents, water discharged into deep wells and effluents from buildings. There are regu- lations for industrial pollution control feasi- bilities and guidelines for domestic effluents.
Regulations also exist for water channel- ization in relation to waste dumping. There are water quality classification and objectives for coastal and surface water as well as water quality standards for Chao Phraya. Tha Chin. Bangpakong, Mae Klong Rivers and coastal waters.
As an incentive, the government has reduced duty fees on all imported pollution control equipment. A committee was formed to consider the machinery. materials and equipment for energy and environmental con- servation.
REFERENCES
Kajornatiyudh, S. and N. Nugranad. 1989. State of water pollution and water quality management strategy in Thailand. Paper presented at the Australian Society for Limnology Congress. 7-9 July 1989. Australia.
Kositratana, N., k Nuntapatidech, S. Supatanasinkasern and A. Ittharatana. 1989. The assessment of pollution from land-based sources and their impact on the envi- ronment. Country paper presented at the COBSEA Seminar on the Assessment of Pollution fmm Land- based Sources and Their Impact on the Environment, 3- 13 May 1988. Singapore.
Kritiporn. P., T. Panayotou and K. Charnprateep. 1990. The greening of Thai industry: producing more and polluting less. Res. Rep. No. 5. Thailand Development Research Institute, Bangkok, Thailand.
Panswas, T. 1987. Domestic wastewater and water pol- lution problems in Bangkok and its vicinity. Office of the National Environment Board, Bangkok, Thailand.
Thongkaimook, k 1990. Solid waste management system in Thailand. Office of the National Environ- ment Board, Bangkok, Thailand.

Session 2: Waste Management Options
Solid Waste Management in Developing Countries
DAVID C. WILSON Environmental Resources Ltd 0
106 Gloucester Place London Wl H 308
England
CHANDRAN NAIR ERL &Isfa) Limited
1 1 th Floor, Hecny Tower 9 Chatham Road
Tslm Sha Tsuf Hans Kong
WILSON, D.C. and C. NAIR 1992. Solid waste manage- ment in developing countries, p. 77-89. 1nT.-E. Chua and L.R Garces (eds.) Waste management in the coastal areas of the ASEAN region: roles of govern- ments, banking institutions, donor agencies, private sector and communities. ICLARM Conference Pro- ceedings 33, 218 p. Ministry of the Environment, and Canada-ASEAN Centr Singapore: Asian Development Bank, and Internatio h a1 Center for Living Aquatic Resources Management, Philippines.
ABSTRACT
In developing countries, solid waste management needs to be recognized as being essential to proper pub- lic health and environmental control, particularly in urban areas. A key priority in the ASEAN region is effi- cient and effective refuse collection and disposal, the provision of which is both acceptable and affordable
Informal recycling systems which are generally well established in ASEAN member-countries should be rein- forced. In addition, intermediate technologies should be developed and implemented instead of importing sophis- ticated western technology. Hazardous waste controls must also be developed alongside long-tcrm programs for upgrading solid waste management.
INTRODUCTION
Solid waste management is a n integral part of public health and environmental control, particularly in highly populated urban areas.
In the industrial cities of 19th-century Europe, epidemics of cholera and other inlectious diseases led to the control of open sewers, sewage discharges to rivers that sup- ply drinking water, and refuse accumulation in the streets (Wilson 1988). Specifically. in the United Kingdom (UK), the Public Health Act of 1875 empowered local authorities to remove house refuse; cleanse earth closets. privies, ash pits and cesspools; and cleanse streets. In addition, it gave the Local Gov- ernment Board the power to require a local authority to carry out these services, if necessary.
From the 19th century through the 1950s. the primary focus in solid waste management (or public cleansing as it was then known) in Europe and North America was on improving the standards of street cleaning, refuse col- lection and storage. This became an accepted municipal service in all industrialized coun- tries, the financial support of which was pro- vided a s a matter of course.
Waste disposal standards tend to lag behind waste collection, on the principle of "out of sight, out of mind. It was not until the 1950s and 1960s that open dumping was gradually replaced by modern landfilling (originally known a s "controlled tipping" in the UK and as "sanitary landfill" in the US).
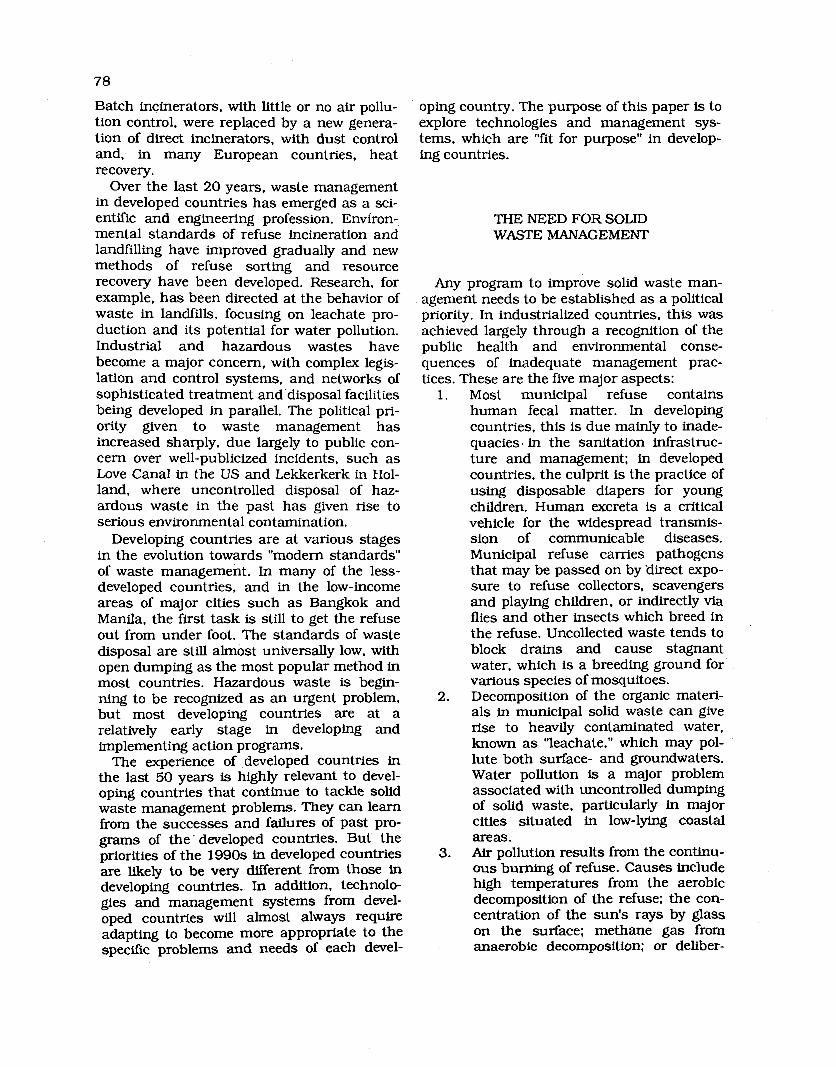
Batch incinerators, with little or no air pollu- tion control, were replaced by a new genera- tion of direct incinerators, with dust control and, in many European countries, heat recovery.
Over the last 20 years, waste management in developed countries has emerged as a sci- entific and engineering profession. Environ- mental standards of refuse incineration and landfilling have improved gradually and new methods of refuse sorting and resource recovery have been developed. Research, for example, has been directed at the behavior of waste in landfills, focusing on leachate pro- duction and its potential for water pollution. Industrial and hazardous wastes have become a major concern, with complex legis- lation and control systems, and networks of sophisticated treatment and disposal facilities being developed in parallel. The political pri- ority given to waste management has increased sharply. due largely to public con- cern over well-publicized incidents, such as Love Canal in the US and Lekkerkerk in Hol- land, where uncontrolled disposal of haz- ardous waste in the past has given rise to serious environmental contamination.
Developing countries are at various stages in the evolution towards "modern standards" of waste management. In many of the less- developed countries, and in the low-income areas of major cities such as Bangkok and Manila, the first task is still to get the refuse out from under foot. The standards of waste disposal are still almost universally low. with open dumping as the most popular method in most countries. Hazardous waste is begin- ning to be recognized as an urgent problem, but most developing countries are at a relatively early stage in developing and implementing action programs.
The experience of developed countries in the last 50 years is highly relevant to devel- oping countries that continue to tackle solid waste management problems. They can learn from the successes and failures of past pro- grams of the' developed countries. But the priorities of the 1990s in developed countries are likely to be very different from those in developing countries. In addition, technolo- gies and management systems from devel- oped countries will almost always require adapting to become more appropriate to the specific problems and needs of each devel-
oping country. The purpose of this paper is to explore technologies and management sys- tems, which are "fit for purpose" in develop- ing countries.
THE NEED FOR SOLID WASTE MANAGEMENT
Any program to improve solid waste man- agement needs to be established as a political priority. In industrialized countries, this was achieved largely through a recognition of the public health and environmental conse- quences of inadequate management prac- tices. These are the five major aspects:
1. Most municipal refuse contains human fecal matter. In developing countries, this is due mainly to inade- quacies in the sanitation infrastruc- ture and management; in developed countries, the culprit is the practice of using disposable diapers for young children. Human excreta is a critical vehicle for the widespread transmis- sion of communicable diseases. Municipal refuse carries pathogens that may be passed on by 'direct expo- sure to refuse collectors, scavengers and playing children, or indirectly via flies and other insects which breed in the refuse. Uncollected waste tends to block drains and cause stagnant water, which is a breeding ground for various species of mosquitoes.
2. Decomposition of the organic materi- als in municipal solid waste can give rise to heavily contaminated water, known as "leachate." which may pol- lute both surface- and groundwaters. Water pollution is a major problem associated with uncontrolled dumping of solid waste, particularly in major cities situated in low-lying coastal areas.
3. Air pollution results from the continu- ous burning of refuse. Causes include high temperatures from the aerobic decomposition of the refuse; the con- centration of the sun's rays by glass on the surface; methane gas from anaerobic decomposition; or deliber-
ate combustion by scavengers. What- ever the cause, a burning refuse dump is almost impossible to extin- guish.
4. The uncontrolled discharge of toxic waste into watercourses may pollute drinking or irrigation water supplies. Its uncontrolled disposal with other urban wastes in open dumps exacer- bates all the previous problems, e.g., posing a health risk to scavengers and others who are in direct contact with the refuse. polluting groundwater resources and adding to the air pollution risk.
5. An area of particular currknt concern is the uncontrolled disposal of clinical waste, given the reports of Acquired Immune Deficiency Syndrome (AIDS) and hepatitis epidemics threatening cities such as Manila and Bangkok.
AID RESPONSE
International development agencies have been providing more funds over the last two decades for urban infrastructure and health improvement projects in developing coun- tries. Their initial thrust was towards water supply and drainage projects, with solid waste management as a subsidiary problem.
Many international aid projects have attempted to solve the solid waste problem by importing western technology and equipment, sometimes by means of "turnkey" contracts where the equipment supplier is allowed to specify equipment needs. In many parts of the world, there are sophisticated incinera- tion or composting plants which have been abandoned. sometimes without commencing operations, because the recipient country lacks the necessary financial and manpower resources for their operation and mainte- nance; in other words, they are not "fit for purpose".
Over the last few years, an encouraging consensus has emerged that locally sustain- able solutions must be based on intermediate level technologies appropriate to the local sit- uation (Cointreau 1982: Jackson 1988). A Japanese study committee recommends that [Sakurai 1987):
... international cooperation projects in the field of. .. solid waste manage- ment should be formed carefully taking into account the technical and management capacity of recipi- ent countries, using appropriate technologies and paying special attention to operation and maintenance.
Thus, technical assistance studies under- taken by consultants must always focus on what is appropriate to the local situation. In this context, early training of local staff is important to enable overseas consultants to be managed properly, and to develop the local capability to assess and implement their rec- ommendations. It may be preferable to have a series of short-term consultancies on specific well-defined topics, rather than a single mas- sive study. Again, there are Southeast Asian cities where a series of major consultants' reports have been prepared, often funded by bilateral aid programs, and have never been implemented.
Three factors can help make consultancy studies more applicable:
1. The terms of reference should be drawn up in such a way that there is a parallel focus on not only the long- term but also a series of imple- mentable initial steps, as part of a short-term action plan.
2. Local counterpart staff should be identified and incorporated as far as possible into the consultants' team. An example of explicit training was a study carried out by ERL in Bangkok in 1987. under the Commission of the European Communities-ASEAN coop- eration agreement, where nominees from four ASEAN member-countries joined the team for a four-month period.
3. Technical assistance from experts of a developed country should be balanced by a "horizontal corporation." i.e., per- sonnel from one developing country help those from another. An example is a recent project team mobilized by ERL for a Japanese technical assis- tance project on hazardous waste and emergency response to chemical acci- dents in Southern Jiangsu Province in

China, where the project team included experts from Europe, Canada, India and the Philippines.
ADAPTING WESTERN TECHNOLOGIES AND MANAGEMENT SYSTEMS
These are some of the reasons for adapting western technologies and management sys- tems to the local situation in a developing country:
1. nature of the solid waste; 2. climate and geographical situation; 3. institutional constraints; and 4. nature of industry and other differ-
ences specific to hazardous waste.
The nature of waste
The focus of this section is municipal solid waste which includes waste from households, commercial premises and institutions such as schools and hospitals (but excluding clini- cal waste); market waste and street sweepings.
Waste Generation Rates. Measurement of waste generation rates in developing coun- tries is both uncommon and difficult (Cointreau 1982). Rates are often quoted in the range of 1-2 kg/capita/day in developed countries and perhaps 0.4-0.8 kg/capita/day in developing countries.
But there is no substitute for local mea- surement. An ERL study in Uganda showed an average generation rate from households of around 0.8 kg/capita/day. On further investigation, this relatively high rate turned out to be due almost entirely to the con- sumption of a seasonal vegetable, matoke. A variety of plantain, its consumption rate is 1.2 kg/capita/day, 50% of it being waste.
Waste Density. Density values from municipal solid waste vary widely. Generally, however, waste tends to have a lower density in industrialized countries than in developing countries, due to the predominance of non- putrescible components such as paper, plas- tics and other packaging materials. Typical waste densities in North America or Europe are between 100 and 150 kg/m3, while in
Southeast Asia, the typical densities at the point of collection vary between 250 and 500 kg/m3. Densities tend to be higher at com- munal collection points, due to self- compaction.
Waste Composition. Refuse composition also varies enormously, between locations in the same country, from season to season and from day to day. 'Typical" values for industri- alized, middle- and low-income countries are shown in Fig. 1. Of particular importance is the content of vegetable and putrescible matter, which is typically in the range of 20- 40% in industrialized countries and 40-80% in low-income developing countries.
Moisture Content. The moisture content of waste is directly related to its putrescible content, so that it is lowest in industrialized countries (20-30%) and highest in low-income developing countries (40-80%).
Size Distribution of Waste Materials. The average particle size of solid waste in devel- oping countries tends to be significantly smaller than in industrialized countries. This means, for example, that many modem mechanized methods for resource recovery from developed countries, which rely on size reduction as a preliminary step. are often inappropriate to developing countries.
Climate and geographical situation
The geographical setting of a city is irnpor- tant in designing an appropriate waste man- agement system. Many cities in developing countries are characterized by:
hot climate, some wi;h high seasonal rainfall; a high population growth rate. due to continuing rural-urban drift; cramped living conditions with little or no space for waste storage receptacles; slum and shanty dwellings, accessible only by narrow walkways or unpaved lanes; slow moving traffic because of the great number of bicycles, animal carts or cars for the available road network; limited availability of suitable sites for waste disposal within a reasonable travel time; and low-lying land with a high water table.

Industrialized country Middle-income country Low-income country ( e . ~ . , UK) (e.g, Bangkok) (e.g., India)
1.3 kg/copita/doy 0.9 kg/copito/doy 0.5 kWcopito/day
I
Fig. 1. Comparative solid waste composition in industrialized, middle- and low-income countries.
where groundwater pollution is a major constraint to waste disposal.
A direct consequence of the combination of a hot climate, limited storage space in living premises and a high putrescible content of the refuse, is that the refuse collection fre- quency in densely populated areas in devel- oping countries is often every day, or at most every other day.
Institutional constraints
Many planning efforts in developing coun- tries have emphasized technology at the expense of management support systems. An acceptable level of service for waste manage- ment depends critically on well-planned management, operating within an adequate institutional arrangement, and capable of generating the financial resources required to meet operating, maintenance and investment costs.
Among the common weaknesses in existing institutional systems are untrained staff, poor pay scales, the lack of incentives to do a good job and corruption. Related key prob- lems are inadequate supervision of workers and poor maintenance of vehicles. Industrialized countries have 1 supervisor for every 5-7 collection vehicles, whereas devel- oping countries have 1 per 10-30 vehicles. In addition, supervisors in developirqj countries
often have no means of moving about within their service areas.
Similarly, while average downtime for vehicles might be around 10% in an industri- alized country, typical figures in the cities of developing countries vary from 20 to 50%. Maintenance is often reactive, repairing vehi- cles after they have broken down, rather than preventive, i.e., regular servicing and routine maintenance in well-equipped workshops. This problem is often exacerbated by inade- quate funds for vehicle repair and the lack of spare parts.
In many cities in developing countries, the solid waste management service is by far the largest employer of labor and user of trans- port, and spends the largest proportion of the revenue budget of the city; yet it is relatively uncommon to find at senior management level an individual with direct line responsi- bility for all aspects of solid waste manage- ment operations. There is often a small Cleansing Department at City Hall, with all laborers and supervisors managed on a decentralized basis in city districts. Fre- quently, there is no planning unit, and records which are essential to monitor and improve service performance are poor or nonexistent.
Providing adequate funds for solid waste management on a n ongoing basis is a major problem in many cities of developing coun- tries. As it takes up a large proportion of the

total city budget, solid waste manageant implies an effort to improve the overall municipal administration system. This is because the money for running the service usually comes from the general municipal revenue. Direct user charges for refuse ser- vices are relatively uncommon, and where they do exist, collection rates are often very low. Three particular problems with direct charges are: those who can afford to pay live in better-income areas; there is usually no viable means of shutting off service to a resi- dent with unpaid bills; and a direct charge encourages indiscriminate dumping.
The objective of solid waste management in developing countries is to provide an ade- quate and affordable service, through the use of viable low-cost techniques. The objective of minimum cost, however, is subject to con- straints such as employment objectives, the real cost of imports, limitations on capital expenditure, shortage of skilled labor for operation and maintenance, and the avail- ability and affordability of spare parts.
Differences specific to hazardous waste
These are some of the factors to be consid- ered in adapting hazardous waste manage- ment methods to the local needs and circum- stances of developing countries (Wilson and Balkau 1990):
Climatic differences may require changes in waste handling and the design and location of facilities. For example, air drying of sludges is diffi- cult in wet tropical climates. The sit- ing and design of landfills in a dry region may require less strict stan- dards to achieve the same objectives than in a wetter clirnate (Wilson and Vreeland 1988). Transport network inadequacies may require local or regional more than national solutions. Unsophisticated government bureau- cracy may mean that complex "cradle- to-grave" control systems are difficult to implement. A major priority is finding simpler and more imple- mentable systems.
In addition, there are significant differences in the nature of hazardous waste generators.
For example, in industrialized countries. effluents from the metal finishing industry are normally pretreated on site, with sludge going to a centralized treatment facility for further processing. In many Southeast Asian countries, however, this is impractical. because the majority of generators are small and operate in cramped quarters.
One difference which can be turned into an advantage is that many developing countries are actively encouraging new industry. Most countries have a licensing system for new factories that should be extended to include explicit provision for industrial and haz- ardous waste minimization, recycling. treat- ment and, as a last resort, proper disposal. An attractive option is to provide industrial estates for a particular type of waste- producing industry. e.g., electronics, where the provision of centralized waste treatment facilities at an economic (shared) cost could encoufage investment.
Nonindustrial sources of hazardous waste may also be relatively more important in some developing countries which are at an early stage of industrialization. Ubiquitous problems include stocks of unusable agri- cultural chemicals accumulated over many years, hospital waste, waste oils from trans- portation and dry cleaning solvents.
SOLID WASTE STORAGE AND COLLECTION
In many cities of developing countries, the first priority is literally to get the refuse out from under foot. In Bangkok and Manila. around 20-30% of solid waste are uncol- lected, providing breeding grounds for disease vectors, both directly and indirectly. The low- est level of service, because inaccessible, is inevitably in the slum and shanty neighborhoods.
A number of studies have also addressed the selection of appropriate technology and management systems for refuse storage and collection (Flintoff 1976; Cointreau 1982: Lohani 1988). Factors to be considered include:
0 the need for daily collection in many countries due to the hot clirnate; a primary storage and collection sys-

tem which results in single-handling of waste. (Present collection systems often involve double-handling or. when nontipping trucks, trailers or trolleys are used, even triple-handling of waste. The principle of picking up waste once only can be applied using simple indigenous equipment such as handcarts or pedal rickshaws working in conjunction with tractors, trailers, or container-handling equipment); the improvement of existing pushcarts and other low technology methods for primary collection in slum and shanty neighborhoods; the use of tractors or animal-powered collection vehicles where t r a c speed is typically under 40 km/hour; the use of low-technology transfer stations for pushcarts and small vehicles; the use of compaction trucks more suited to the high waste density in developing countries; the improvement of vehicles for man- ual loading (In a number of cities. compaction vehicles appear to be used primarily because of the low loading height of the hopper rather than the need for compaction. Refuse collectors in sideloading vehicles used in Bangkok, for example, discharge containers at higher than head height. These vehicles can be designed to allow loading at a more reasonable chest height.); and the need for an appropriate manage- ment structure and workshop facili- ties for routine servicing and rapid repair of vehicles.
The experience of developing countries has shown that simple changes in collection sys- tems, using indigenous, low-cost and low- maintenance equipment, can provide improved senrices to more people at no increase in cost.
RECYCLING
Recycling systems are often well estab- lished in developing countries. A schematic representation of the recycling systems in
Bangkok is shown in Fig. 2 (Wilson et al. 1988) :
Newspapers, cardboard and metals are collected from door to door in 3- wheeler bicycle carts. Waste collectors spend perhaps 30- 50% of their time sorting saleable materials from the refuse. both at the collection point and (in the case of sideloading vehicles) during transport. Communities of 200-500 families liv- ing on each of the dumpsites scavenge for their livelihood. They sell to middlemen who often perform some simple sorting and cleaning. The middlemen sell to wholesalers and hence, back to primary industries.
Although the health conditions of scav- engers living on open dumps are obviously poor (Kungskulniti 1990), it is not possible to dismiss the current informal recycling sys- tems. Many people choose to work as scav- engers on the dumps rather than in factories because: (1) unemployment is high, so the value of jobs to the economy is considerable; (2) the level of income from scavenging is competitive with that from other forms of employment, and indeed, refuse collectors in Bangkok often more than double their income through scavenging; and (3) the sav- ings in both raw materials and energy costs through recycling make an important contri- bution to economies and environments.
Existing informal recycling systems, how- ever, could be improved. One possibility is to increase the proportion of waste which is se~arated at source by the householder. eiploying more scavengers in the initial stage of collecting separated materials from door to door (Lohani 1988). Paying house- holders for these preseparated items makes for much higher participation rates than those often achieved in industrialized coun- tries for such "source separation" schemes. A major constraint, however. can be lack of space in households for storage of separated refuse, even with frequent collection. Never- theless, pilot schemes along these lines should be encouraged. One advantage of source separation is the possibility of sepa- rating a clean organic fraction to serve as an input to composting.

Waste
An alternative or complementary approach to separation at source is to improve the effectiveness of current manual separation systems. Ideally, such separation should take place at a number of centralized points, such as transfer stations or disposal sites. Refuse collection can be more efficient and effective if scavenging by waste collectors can be elimi- nated through their participation in a time- saving, centralized recycling scheme, the profits of which can provide them with a realistic basic wage.
A number of studies have shown that a combination of manual and mechanical sorting can make recycling more effective. An early ERL study in Bangkok showed that a low-technology approach that utilizes the skills of the scavenger community could increase resource recovery (excluding the ini- tial separation at source) from around 7 to 16% by weight. In addition, a sorting plant would produce an organic-rich fraction for cornposting and a residual stream for use as a potential fuel. One of the major attractions of such a system is that the local private
Industry d
sector could be encouraged to invest in it because of the revenue that would be gener- ated (Wilson et al. 1988).
Further research and pilot schemes to demonstrate these and other ideas that build on the informal recycling sector should be strongly encouraged. In doing so, the socio- economic aspects of the scavenger comrnuni- ties must be considered.
SOLID WASTE TREATMENT AND DISPOSAL
Landfilling
The present disposal method for solid waste in developing countries is generally open dumping, with associated water pollu- tion and public health problems. Upgrading open dumps into properly managed, envi- ronmentally acceptable landfills must be the first priority. In practice, however, this can be very difficult due to the lack of suitable sites.

potential water pollution problems, shortage of cover material and the presence of scav- enger communities who depend on the waste for their livelihood.
The ASEAN member-countries urgently need demonstration projects to show that upgrading of existing dumps into (partially controlled) landfills is possible and that establishment of properly controlled new landfill sites is feasible. Such projects are needed to address both technical (e.g.. pre- venting water pollution) and institutional problems (i.e.. gaining public acceptance for new sites and displacing scavenger communities).
Moreover, the difficulties in achieving proper landfilling standards, particularly water pollution control, should not be under- estimated. However, considerable improve- ments over current open dumping practices, can be made at a relatively low cost. There should be proper site selection and manage- ment of the site, i.e., the cellular method whereby the waste is brought to its final level in one area as quickly as possible, rather than being spread in a thin layer over all of the site; this way, there will be less rainwater being transformed into contaminated leachate. The shortage of cover materials may make it difficult to cover the waste every day, but the relatively small particle size of waste in developing countries, together with the possibility of making cover material from the composted organic fraction of the waste, should make this problem manageable. Ade- quate compaction of the waste to eliminate void spaces and discourage rats and other vermin should be possible without the use of sophisticated landfill compactors used in developed countries.
Incineration and composting
Traditional aid-funded solutions for solid waste disposal have often involved the export of western technology, i.e., incineration or composting. In many cities, the moisture content of the refuse is too high to bum with- out the addition of expensive support fuel. unless stringent measures are taken to pre- vent the recycling of paper and plastics. In our opinion. recycling is a preferable method of waste management to waste treatment, so that any such prohibition would be a retro-
grade step. Given the extremely high capital cost of incineration, the need for skilled labor. and the high cost of imported spare parts, we believe that the potential for incineration in developing countries is extremely limited, outside of special situations such a s that in Singapore, and of particular specialist appli- cations such a s for clinical and selected hazardous wastes.
Composting appears to be a more promis- ing option because of the high organic con- tent of refuse in developing countries. Many projects have failed, however, because of the sophistication of the plant. In addition, the use of pulverizers for size reduction has re- sulted in a compost product which is con- taminated with finely ground glass and small pieces of plastic. Even without concerns about contamination with heavy metals (originating from batteries and urban air pollution), their presence in the compost have made it extremely difficult to market in many countries.
Intermediate technologies
An intermediate technology approach to refuse treatment and disposal is a combined transfer station and sorting plant that uses a blend of manual and mechanical methods for refuse sorting. Such a plant could increase the efficiency of separating materials for recy- cling, while providing both an organic-rich fraction and a possible feedstock for incineration.
Separation of a clean organic fraction for composting, either from such a plant or at source, could feed directly into a series of simple facilities to produce compost using the traditional windrow system. This would eliminate the need for sophisticated imported technology and could also provide a valuable plant growth medium for soil lacking organic content.
A clean organic fraction could also be used a s a feedstock for anaerobic digestion, pro- ducing biogas. Indeed, a landfill may be viewed under favorable circumstances as the simplest form of such a digester. While this idea has certain attractions, and could qualify as "intermediate technology," experi- ence in industrialized countries has thus far not been particularly positive.

PUBLIC VERSUS PRIVATE SECTOR OPERATION
Collection and disposal of solid waste within an urban area has traditionally been perceived as the responsibility of the local municipal government. Provision of these services is expensive, even when the most primitive methods are employed. Usually, the cost comprises 20-40% of a municipal bud- get, 70-80% of which goes to collection and transportation, with disposal comprising the remainder.
In industrialized countries, the private sector is becoming more involved in refuse collection and disposal. In Europe, the service is still the responsibility of the local govern- ment who contracts the private sector for its operation. The local government collects the appropriate fees and supervises service provi- sion. In the US, the private sector works directly with and collects a user fee from the householder. In both Europe and the US. industrial waste services are provided directly to industry by the private sector.
The "Hong Kong model" has two refuse transfer stations and a centralized hazardous waste treatment service (including collection) which have so far been "privatized. The gov- ernment retains responsibility. but has con- tracted the private sector for the detailed design, construction and the first 15 years of facility operation.
There is currently considerable interest in introducing the private sector to solid waste management services in developing countries. While this is potentially cost-saving, it is certainly not a panacea for all problems. Two particular pitfalls need to be avoided.
First, a direct service, where a householder pays the waste collector directly, would tend to serve mainly the middle- and upper- income levels, as low-income people could not afford the expense. Similarly, if the private collectors are performing the service to make a profit from the recyclables, they would again tend to serve only those residents with "rich waste. In either case. a substantial proportion of the city's refuse would be left uncollected.
Second, the lowest bid from the private sector could mean poor service. An interest- ing case study is provided by three refuse
collection contracts operating in Bangkok In 1987. These contracts were causing problems due to the "unsatisfactory" performance of the contractor. An ERL study examined these and suggested that a number of deficiencies in the contract or the contracting system be corrected:
improve prequallfication procedures to eliminate companies without the resources or experience to support their tenders; improve the quality of contract docu- mentation, with particular reference to the specification of services, penalty clauses and bills of quantity; extend the contract period from two to five or seven years. and require the contractor to purchase purpose-built refuse collection vehicles (one com- plaint was that the contractors were all using flat-bodied trucks): increase the responsibility of local district officers in supervising con- tractors (e.g., in inspection works and the approval of contractors' invoices, which was then handled centrally by the Department of Public Cleansing); expand contracts to include all cleansing services within the con- tracted area (refuse collection. streetsweeping, drain cleaning, etc.) to reduce overlap and possible conflict of responsibility with parallel city services; insist that contractors improve their image (e.g., by use of uniforms), to enable both the city and the public to distinguish easily between contracted and city services; and insist that contractors maintain a staff office in the contract area to improve liaison among the contractor, the city and the public.
HAZARDOUS AND OTHER SPECIAL WASTES
Hazardous waste management in develop- ing countries has received increasing atten- tion from international and other organiza- tions over the last ten years. But it is still not high on the political agenda in many coun-

tries. A 1986 workshop in Singapore orga- nized jointly by the Uriited Nations Environ- ment Programme (UNEP) and Association of Southeast Asian Nations (ASEANI resulted in "Guidelines for establishing policies and strategies for hazardous waste management in Asia and the Pacific" (UNEP 1986). The World Bank. World Health Organization and UNEP published a technical manual, 'The safe disposal of hazardous waste: the special needs and problems of developing countries" (Batstone et al. 1989).
As well a s being involved with both of these initiatives, one of the authors had the privi- lege of chairing the developing country pro- gram of the International Solid Waste Associ- ation's (ISWAI Working Group on Hazardous Wastes, which organized the Workshop on Adapting Hazardous Waste Management to the Needs of Developing Countries (Dean and Wilson 1990). This brought together a series of 16 case studies. mainly drawn from Southeast Asia, illustrating aftempted or specific local solutions, and more generic reference material on approaches to a specific aspect of the overall hazardous waste problem.
Recent publicity has been given to attempts to export hazardous waste from developed to developing countries. The publications show that developing countries also need to develop control systems to deal with the haz- ardous waste being generated within the country. Currently, there is uncontrolled waste disposal on land and in watercourses. Short-term public health risks may ensue through pollution of water supplies for drinking or for irrigation, or to scavengers who work on open dumps. In the longer term, uncontrolled dumping on land may pollute groundwater resources and cause hazards when the land is reused in the future. Cleaning up is much more expensive than correct management in the first place.
Developing countries can learn much from the experience and mistakes of industrialized countries in controlling hazardous wastes [Tables 1 and 2). Sophisticated control meth- ods and technologies cannot simply be transferred, since adaptation to local needs and circumstances is necessary. Moving from a situation of little or no control to one of absolute control is not possible; in most developed countries, the control system has
Table 1. Common elements in the successful implementation of hazardous waste controls.
a "package" of actions and measures, not a single technical or regulatory initiative: support-building for waste control measures among the public and government officials: a cooperative and a coercive exercise which ultimately relies on contributions from a range of government ministries, industrial bodies and individual companies; practical implementation and enforcement programs within the limits of available resources and skills; gradual building up of successive measures over immediate implementation of grandiose master plans; and immediate implementation of short-term actions and a phased approach to implementing long- term actions.
Source: Wilson and Balkau (1990).
Table 2. Common constraints and dificulties in implementing hazardous waste controls.
inadequate early identification and quantilication of waste arisings and of the extent of environmental problems; insufficient enforcement of existing pollution and solid waste Iaws, that keeps much of the hazardous waste problem hidden; the long delay between recognizing the need for both facilities and competent personnel and act- ually providing them which tends to encourage indiscriminate dumping and waste export;
0 loss of public coddence in technical solutions due to poor performance of earlier disposal facilities; and the complexity of the administrative response needed to control all parts of the waste cycle. Fre- quently, resources for enforcement are inadequate and administrative responsibilities are fragmented.
Source: Wilson and Balkau (1990).

evolved gradually over a period of perhaps 20 years.
A major recommendation from the ISWA workshop is to develop a two-part strategy that will implement a short-term action plan for hazardous waste control (Wilson and Balkau 1990). It includes interim arrange- ments for hazardous waste treatment and disposal which should not be underestimated because they reduce risks considerably and immediately. Equally, these interim solutions should be recognized for what they are, as a first step toward more permanent measures.
Examples of these include [Wilson and Balkau 1990):
codisposal in municipal waste landfill sites of asbestos waste (suitably pack- aged and handled), treatment plant sludges or organic chemicals of mod- erate toxicity (Safe codisposal is only possible at a controlled landfill, not on an open dump.) ; solidification of selected hazardous waste prior to landfill; chemical treatment off-site of electro- plating and textile effluents. as in Bangkok; coincineration of combustible oily waste, pesticides or similar materials in cement kilns; export to approved overseas facilities of difncult wastes such as polychlo- rinated biphenyls (PCBs) for incineration; or concrete entombment of nontreatable toxic wastes.
CONCLUSIONS
Solid waste management is an essential component of proper environmental man- agement, particularly in urban areas. The environmental and public health implications of inadequate solid waste management are considerable.
A historical chronology of waste manage- ment in industrialized countries shows that the first priority is to get the refuse out from under foot. An efficient and effective refuse collection service needs to be extended to all sections of the community, including slum
and shanty neighborhoods. Perhaps the most important single factor in improving efficiency is to substitute single-handling (picking up the waste once only) for the double- and even triple-handling systems still commonly found in the cities of developing countries.
The second priority is to provide an accept- able standard of service at an affordable price, through the use of viable low-cost techniques. Evaluation criteria should include not only the least cost but also employment objectives, the real cost of imports. the ease of maintenance and limita- tions on capital.
Waste reduction and recycling is environ- mentally preferable to waste treatment and disposal. Some developing countries, how- ever, tend to discourage the existing, and often extremely efficient, informal recycling systems, for example, to allow the introduc- tion of high technology (e.g.. Western incineration plants).
These systems make an important contri- bution to national economies, as they provide employment, reduce consumption of raw materials and energy, and reduce the quanti- ties of waste to be transported and disposed of. Municipalities should encourage recycling and reinforce the informal recycling sector by providing adequate services to protect the workers' health, facilitating the marketing of recycled materials, and developing and demonstrating schemes to improve workers' productivity through the use of simple technology.
Short-term improvements to the standards of waste disposal are most likely to come through the introduction of controlled land- fills. Upgrading existing open dumps and developing new landfills are very real prob- lems, the solutions of which can involve demonstration projects. These projects can show municipal officials that controlled land- filling is possible under their own particular constraints and circumstances.
In many industrialized countries, it was nearly 100 years from recognition of the pub- lic health problems of uncollected solid waste to that of hazardous industrial waste. Given the pace of industrialization in some developing countries, it is simply not possible to wait to solve one problem completely before tackling the next. Thus, alongside a program for solid waste management. it is important

for all developing countries to lay the founda- tions for hazardous waste management. Emphasis here is on taking a number of first steps towards solving the problem, rather than simply investigating it. Among these steps is the development of interim arrange- ments for hazardous waste treatment and disposal, pending the development of perma- nent disposal facilities.
REFERENCES
Batstone, R, J.E. Smith and D.C. Wilson, editors. 1989. The safe disposal of hazardous wastes: the special needs and problems of developing countries. 3 vols. World Bank Tech. Pap. 93. World Bank, Washington.
Cointreau, S.J. 1982. Environmental management of urban solid wastes in developing countries: a project guide. World Bank. Washington.
Dean, RB. and D.C. Wilson, editors. 1990. Adapting hazardous waste management to the needs of devel- oping countries. Waste Manage. Res. 8(2): 85-174.
Flintoff, F. 1976. Management of solid waste in develop- ing countries. Reg. Pubi. South-east Asia Ser. 1. World Health Organization.
Jackson, D.W. 1988. Waste management aid pro- grammes: are the priorities correct?, p. 414. In
Proceedings of the 1988 International Solid Waste Association Workshop. Academic Press. London.
Kungskulniti, N. 1990. Public health aspects of a solid waste scavenger community in Thatland. Waste Man- age. Res. 8(2): 167-171.
Lohani, B.N. 1988. Solid waste management in hot cli- mate: issues, constraints, problems in management strategies in developing countries in Asia, p. 393-408. In Proceedings of the 1988 International Solid Waste Association Workshop. Academic Press, London.
Sakurai. 1987. Japanese aid in solid waste management. Paper presented at the International Solid Waste Association Hazardous Waste Symposium, 22-24 June 1987. Tokyo, Japan.
UNEP (United Nations Environment Programme). 1986. Guidelines for establishing policies and strategies for hazardous waste management in Asia and the Pacific. UNEP Regional Office, Bangkok.
Wilson, D.C. 1988. Priorities for waste management in the 1990s. p. 10- 15. In Pollution in Urban Environ- ment. Vol. 2. POLMET 1988 Conference. Hong Kong.
Wilson. D.C. and F. Balkau. 1990. Adapting hazardous waste management to the needs of developing coun- tries: an overview and guide to action. Waste Man- age.&~. 8(2): 87-97.
Wilson, D.C. and W.J. Vreeland. 1988. Development of a national toxic waste disposal facility in the State of Bahrain. Waste Manage. Res. 6: 379-389.
Wilson, D.C., J.M. Bourgeois and T. Vicharangsan. 1988. Innovation in solid waste management for developing country cities, p. 16-21. In Pollution in Urban Envi- ronment. Vol. 2. POLMET 1988 Conference. Hong Kong.

Ecological Impacts of Waste Disposal in the Coastal and Marine Environment
HARVEY D. VAN VELDHUIZEN NANIEL ARAWNES
Dames and Moore International Adamson Center Buflding
Suite A, 5 th Floor 12 1 AIfam St, Salcedo Village
Makatf, Metro Manila Philippines
VAN VELDHUIZEN, H.D. and N. ARAGONES. 1992. Ecological impacts of waste disposal in the coastal and marine environment, p. 91-98. 1nT.-E. Chua and L.R Garces (eds.) Waste management in the coastal areas of the ASEAN region: roles of governments, banking institutions, donor agencies, private sector and communities. ICLARM Conference Proceedings 33, 218 p. Ministry of the Environment, and Canada- ASEAN Centre, Singapore; Asian Development Bank, and International Center for Living Aquatic Resources Management, Philippines.
ABSTRACT
In the coastal zone, pollution from improper disposal of waste is known to cause adverse ecological impacts on coastal resources. Successful solutions require public support and adequate funding. A preliminary risk assessment should consider public perception and resource use; critical habitats and species; fate of pollu- tants; toxic hazard, persistence and natural detoxifica- tion mechanisms; and exposure.
Discharges of mercury and chlorinated hydrocarbons have adverse effects on human health. Mercury, pesti- cides, and polychlorinated biphenyls (PCBs) are, clearly, priority pollutants in view of their toxicity and detoxifica- tion mechanisms, persistence and the assimilative capacity of the marine environment.
INTRODUCTION
The driving force in coastal resources man- agement (CRM) is the public. Failure to rec-
ognize this will doom most programs designed to protect coastal resources. Long before modem governments were established and regulatory programs were enacted, peo- ple had already established through common practice what and how coastal resources would be used for their personal benefit. In one form or another, these beneficial uses remain.
The objectives of CRM are to minimize resource use conflicts and maintain sustain- able resource use. Efforts to solve ecological problems caused by waste disposal in the coastal zone will be fruitless unless resource managers consider both public and scientific inputs as to the important issues. If public input is not obtained or is ignored, it is highly probable that management approaches will be unimplementable. or that management priorities will not coincide with the public's priorities. If scientific input is not obtained, management approaches will most probably be ineffective because they violate natural laws or overlook key ecological processes.
Effective resource management. therefore. nurtures the interaction between public and scientific Input. This interaction gives birth to effective policies. regulations and enforce- ment measures. Fig. 1 illustrates the interaction between public and scientific inputs in the management of resources for

Public interests
Fig. 1. In
Management tools 1 I Propored studies
Public education Planning
Regulatory , Environmental Public participation - Ongoing studies
agencies Standards
data
Grants Permits Past studies Enforcement
lction among beneficial uses of resources, regulatory agencies, management tools and environmental data.
the benefit of society. Public perceptions and interests produce the laws that authorize and govern resource management decisions, but scientific data must be used by resource managers to educate the public so that reasonable laws are enacted and public support is obtained for effective enforcement. Similarly, public perceptions and the needs of the resource manager influence the type of scientific research that must be undertaken.
Rural coastal people seem to be more aware of the state of their environment, per- haps because their means of livelihood are most susceptible to degradation and resource use conflicts. On the other hand. their con- cerns are least often heard, perhaps because their voices are few and distant from deci- sionmakers.
Nongovernmental organizations (NGOs) with particular interest in the environment are now increasing in number and slowly beginning to pressure government authorities to stop environmental degradation. The NGOs are potentially valuable in conducting educa- tional seminars and workshops on environ- mental issues. These potential roles of NGOs should be actively encouraged because a community that is aware of its environment is the best protection from environmental degradation. Hence, active participation of the public is needed for the success of resource management thrusts.
RISK ASSESSMENT
When decisions are made to address pollu- tion problems in the coastal zone and bud-
gets are limiting, the public and the environ- ment are best served when the limited funds are used to address those issues that have the highest risk of adverse effects on public health and livelihood.
The factors to consider in establishing pri- orities include public perception and resource use; critical habitats and species; fate of pol- lutants; toxic hazard. persistence and natural detoxification mechanisms: and exposure.
In the decisionmaking process, a matrix approach may be useful in establishing pri- orities. In other words, a pollution situation in which three or four different factors rate high in degree of concern may be classified as higher priority over a situation in which only one or two factors rate high. The remainder of this paper focuses on these factors and offers ideas that may be valuable in risk assess- ments.
Public perception and resource use
In most Southeast Asian nations, primary uses of coastal resources include fisheries and coastal tourism. Public perceptions of pollution problems in the coastal zone vary from place to place, but it is safe to say that the most common concerns are those that are visible. Thus, improper disposal of solid waste (garbage) and high rates of discharge of sediments, including mine tailings, are likely to rank high in public perceptions of significant pollution problems. This is not only because of visible turbidity in the water column but also because of the smothering effect of the discharges on coral reefs. In

addition to dead coral reefs, dead fish and birds bobbing in the surf zone are sure to attract public concern.
Habitats and species
The occurrence of critical habitats and species varies. In Southeast Asia, however, a few general principles apply. Mangroves and coral reefs are recognized as critical habitats. Both protect shorelines from erosion and are important spawning and nursery areas for coastal fish and shellfish species and other marine organisms. Healthy stands of both habitats are rapidly disappearing from the region. The tropical coral reef is the marine environment's analog to the terrestrial envi- ronment's tropical rain forest: both habitats support the highest abundance and diversity of species on the planet. When corals die, the wide variety of reef fish and other animals on which reef fish feed also die. The overall cumulative effect is a great reduction in the productivity of marine fisheries in the coastal zone, and a potentially significant loss to the planet's biodiversity as well as people's liveli- hood. Fisheries, tourism and coastal recre- ation are not compatible with industrial or urban pollution that destroys coral reefs. Tourists in the coastal zone usually come for clean beaches, swimmable water and healthy coral reefs with lots of beautiful tropical fish. Tourists will go elsewhere if any one of these is lacking.
Based on literature from a wide range of conditions, it is widely acknowledged that various groups of organisms are more sensi- tive to certain types of pollutants than others. At the risk of oversimpl@ing the findings. the following appears to be the general trends.
Plankton Plankton refers to the group of plants and animals found drifting or floating in the water column, unable to swim against currents for significant distances. Phyto- plankton are planktonic organisms capable of manufacturing their own food, i.e., usually single-celled algae. Phytoplankton are adversely affected by suspended sediments (turbidity) and toxic chemicals in the water column. Turbidity reduces the penetration of light into the water column, thus, hampering their photosynthetic activity. Toxic chemicals of most concern to phytoplankton appear to be biocides (used in cooling water systems).
heavy metals (especially copper) and dis- solved petroleum hydrocarbons. Sewage dis- charges that are neither turbid nor toxic are typically beneficial to phytoplankton for their nutrient supply.
Detecting effects of pollutants on phyto- plankton in the field is diflFicult because cur- rents constantly move phytoplankton into and out of impacted areas. Furthermore, populations vary in abundance and distribu- tion on very small spatial and temporal scales.
Zooplankton are planktonic animals. They include animals that spend their entire life cycle as plankton and the eggs, larvae or juveniles of other organisms which as adults are capable of swimming against the current for significant distances. Zooplankton are adversely afTected by turbidity. low oxygen supply and toxic chemicals in the water col- umn. Turbidity interferes with feeding and fouls respiratory structures (gills). Generally, zooplankton, especially the larvae of most organisms, tend to be most sensitive to low oxygen supply and toxic chemicals. Effects. however, are as difIicult to detect in the field as with phytoplankton.
Benthos. Benthic species live near. on or in the bottom sediments of the sea. Broadly, they include bottom-dwelling fish. Benthic species, many of them nearly immobile, are most likely to be aected by the persistent aspects of waste discharges.
Benthos are most susceptible to deposition of sediments, high organic enrichment of the sediments, and the uptake of toxic chemicals and heavy metals that are discharged and settle at the bottom with particulate matter. Lethal environmental effects include smoth- ering by sediments or suffocation due to con- sumption of oxygen by organically enriched sediments. In areas receiving only light depo- sition of sediments, suspension feeders such as corals, crinoids, ophiuroids and some bivalves and polychaetes are often the first to suffer (Rhoads 1974). Reef Flsh and Other Pelagic Biota. Reef fish
tend to stay near the coral reefs that provide them with food and shelter. Although reef fish may not be particularly susceptible to sus- pended sediments and toxic chemicals, the corals upon which they depend are very sen- sitive. Oil spills may also have sublethal toxic effects on not only the fish but also the reefs.

Pelagic biota includes species that feed and swim primarily in the water column. These include marine animals and fish species that typically do not associate themselves with reefs. Because of their mobility, these species are likely to avoid adverse water quality con- ditions or suffer only brief exposure to waste discharges. Detecting effects of toxic con- stituents or turbidity in the field may be dmi- cult because of the mobility of these species.
Marine Birds. Marine birds are most sus- ceptible to the adverse effects of oil spills. They are likely to forage over a large area. minimizing the risk of long-term exposure to a polluted area. However, once exposed to spilled oil, most marine birds rapidly lose body heat because the oil destroys the insu- lative capacity of feathers, and the birds die of hypothermia. Lightly oiled birds may sur- vive the exposure, but in the process of preening the oil from their feathers they ingest sufficient quantities to reduce egg- laying capacity or cause other detrimental physiological effects.
Fate of pollutants
The fate of pollutants is closely tied to the environment into which they are discharged. In particular, the degree of mixing and flushing of the receiving water affects the rate at which pollutants are diluted, dispersed and deposited. Their potential for building up to levels that affect ecological conditions, therefore, also depends on the degree of flushing and mixing.
Pollutants can be broadly classified according to their fate in the environment: biodegradable pollutants, nonpersistent pollutants and persistent pollutants.
Biodegradable Pollutants. The most com- mon biodegradable pollutants include sewage and putrescible solid waste. Their pollution potential in the marine environment is mea- sured by the amount of oxygen (biological oxygen demand or BOD) that is required by bacteria to metabolize them. In well-flushed marine environments. BOD can be readily assimilated with little ecological harm because the oxygen content of the seawater is rapidly replenished by algal photosynthesis. mixing and circulation. Poorly flushed or confined water bodies such as estuaries and
shallow embayments, however, are often highly susceptible to oxygen depletion.
Gonzales and Fernandez (1988) identified BOD as the pollutant of greatest concern in the Philippines with reference to volume of waste and its impact on rivers, estuaries and the coastal zone. Estimates show that the average Filipino generates 35-70 g BOD/ person/day as sewage and 640-1.600 BOD/ person/day as solid waste (Gonzales and Fernandez 1988). Assuming seawater con- tains approximately 7 mg/l dissolved oxygen (DO), then the untreated organic waste pro- duced every day by each individual is poten- tially capable of depleting oxygen from 100 to 240 m3 of seawater each day. Although these numbers are ridiculously high because they do not account for various natural mecha- nisms for replenishing DO in seawater, the impact of thousands or millions of people in a coastal urban area dumping essentially untreated waste into rivers or estuaries in the coastal zone is potentially significant.
Nonpersistent PoUutants. Some pollutants are not readily biodegradable but are not per- sistent in the marine environment. For exarn- ple, high or low pH wastewater discharges and high temperature may have adverse eco- logical effects in the immediate vicinity of the discharge point, but these effects rapidly dis- appear outside this limited zone. Seawater has a high buffering capacity, so significant changes to pH are only likely to be observed in confined or poorly flushed water bodies. Similarly, the ocean's immense heat sink capacity makes temperature changes difficult to induce except in water masses with poor circulation or of relatively low volume com- pared to the volume of discharge.
The viruses and pathogens in sewage and solid waste exert potentially adverse effects on public health. They are eventually killed by the bactericidal effect of sunlight or by consumption by microorganisms in seawater. Because it is difficult to detect viruses and pathogens in the environment, fecal coliform bacteria are used as an indicator of the presence of human waste and the viruses and pathogens associated with them. For the protection of public health, a variety of gov- ernments and international health organiza- tions have recommended guidelines or stan- dards for fecal coliform contamination of seawater. As tourist developments increase

around desirable waterfront locations, inade- quate sewage treatment and solid waste management facilities destroy their recre- ational values (clean beaches and swimmable water).
Persistent Pollutants. Persistent pollutants are not degraded in the environment or are degraded very slowly. The most common pollutants of this type include silt and sedi- ments, heavy metals, and chlorinated hydro- carbons (e.g., PCBs and pesticides). Silt and sediments reduce productivity of marine ecosystems by reducing the penetration of sunlight for algal photosynthesis and smoth- ering benthic bottom-dwelling) organisms, particularly corals. Heavy metals and certain persistent chlorinated hydrocarbons, includ- ing some pesticides, are known to be toxic to marine biota at low concentrations.
The discharge of large volumes of silt and sediments (including mine tailings) in shallow water usually has adverse impact over an area much larger than the primary area of sediment deposit. In shallow water, winds and waves often keep the water column well mixed, and winds and tides effectively move water masses over large distances. Thus. silt and sediments are likely to remain in the water column for longer periods of time and transported farther away from the discharge point before settling. Finer silt is subject to frequent resuspension by waves and currents and advection to another location.
There is a substantial body of information on the toxic effects of pollution in urbanized and industrialized harbors. bays and coast- lines from all over the world (Johnston 1976; Bryan 1979; Macek et al. 1979; Sinderman 1979; Young et al. 1980; Sherwood 1982; Young 1982a; 1982b; Brown et al. 1986; and Anderson et al. 1987). But. when most people think about toxic effects of pollutants on marine life, they think about dead fish and dead corals. Toxicity, however, also refers to effects that decrease prospects for survival. growth or reproduction. In short, toxic sub- stances are poisons. but they do not neces- sarily result in death. Other harmful effects include: reduction in growth rates and repro- ductive success. and increase in susceptibil- ity to disease or parasites, but these are often difficult to observe in the marine environ- ment.
Heavy metals and most persistent organic compounds are readily absorbed by particu- late matter. These pollutants usually settle at the sea bottom along with associated partic- ulates and gradually build up concentrations in the sediments as long as the source of the discharge remains. Because benthic organ- isms tend to have little or no mobility, it is much easier to observe toxic effects in corals, clams, sea urchins, sea stars, worms and bottom-dwelling fishes.
The appearance of potentially toxic cherni- cals in fish and shellfish tissues is commonly accepted as proof that a variety of pollutants bioaccumulate in organisms and eventually will adversely affect human health. Concern about bioaccumulation is fueled by well- publicized harmful effects such as the effect, of mercury on humans (Minamata disease), who have consumed contaminated fish and shellfish, the linkage between PCBs and can- cer in humans and the effect of dichlorodiphenyltrichloroethane (DDT) on eggshells of predatory birds (i.e., eagles. ospreys and pelicans).
The terms "bioconcentration," "bio- accumulation" and "biomagnification" are frequently used. Unjustified fears arise partly because of misuse of these terms. Macek et al. (1979) have recommended the use of the terms as defined in one of the leading refer- ence texts in aquatic toxicology. Bioaccumu- lation is the uptake of chemicals via both bio- concentration (uptake through external tis- sues) and from food sources (i.e., through the intestinal wall). Biomagnification is the pro- cess by which the concentrations of contami- nants in the tissues substantially increase as these contaminants move up the food chain to higher trophic levels. For example, if the concentration of DDT in the tissues of a car- nivore were 10-100 times higher than the concentration of DDT in the tissues of its main food source in the same contaminated body of water, biomagnification of DDT occurred in that food chain.
Few chemicals are known to biomagnify in the aquatic food chain, but those that are known to do so lead to adverse effects on higher trophic levels, including human con- sumers of seafood. Thus, chemicals that have high potential for biomagnification are of concern to the marine environment.

Macek et al. (1979) suggested that only DDT was likely to biomagnifjr in food chains. However. Thomann (1981) showed that PCBs also biomagnifjr. Data from southern California suggest that methyl mercury, DDT and PCBs have biomagnification potential (Young et al. 1980). They found no evidence of increase in concentrations in nine of the ten metals investigated, methyl mercury being the exception. Bryan (1979) also con- cluded that the more persistent chlorinated hydrocarbons such as DDT and its metabo- lites and methyl mercury show appreciable biomagnification.
Once in the aquatic environment, mercury tends to be absorbed rapidly by organic and inorganic materials. Thus, suspended solids and bottom sediments rapidly scavenge mer- cury from the water column. Bottom sedi- ments develop high concentrations of mer- cury relative to the water column. In anaero- bic bottom sediments, the mercury rapidly reacts with sulfides to form cinnabar. In oxy- genated sediments, bacteria will slowly transform inorganic mercury into methyl mercury, which is highly reactive with organic matter and is rapidly taken up by biota.
Toxic hazard and persistence
Toxicity and bioaccumulation alone are not useful measures for assessing risk to biologi- cal communities or human health. Many chemicals undergo some degree of biocon- centration and bioaccumulation; but when organisms are transferred to a clean envi- ronment, many of these chemicals are rapidly excreted. Macek et al. (1979) noted that a hazard of bioaccumulated contaminants is their persistence in tissues.
Both the toxicity and bioaccumulation potential of a toxic compound are greatly affected by the rate of elimination from the organism. Common processes by which organisms can cleanse themselves of con- taminants include excretion, defecation, dif- fusion, body secretions (e.g.. mucus) and molting (in the case of crustaceans) (Bryan 1979). In most cases, self-cleansing (depuration) implies that the organism is exposed to reduced external levels of con- tamination. This is the case. for example, of a
pelagic fish species that might briefly stay in an area contaminated by wastewater, but then moves on to a cleaner area.
Some marine organisms are capable of regulating tissue levels of certain metals while still in the contaminated environment. Polychaetes, decapod crustaceans and fish show some evidence of regulation of metals in tissues, whereas bivalve mollusks do not (Bryan 1979). Most animals that have been examined harbor a group of proteins of the metallothionein type (Brown et al. 1985). These proteins bind metals, thereby making the metals nontoxic (Sanders et al. 1983). Research suggests that metallothioneins are effective detoxification mechanisms for metals unless the metal levels in the environment are so high or increase so rapidly as to exceed the body's capacity to manufacture and store these proteins.
When present in the human body in high concentrations, methyl mercury compounds produce irreversible damage to the brain and nervous tissues (Hammond and Beliles 1980). Usually, the first sign is impairment of the peripheral sensory nerves, i.e., vision, and later, of the sense of touch, hearing and bal- ance. Loss of intellectual ability is associated with methyl mercury poisoning. Damage to the brain structure occurs long before signs of mercury toxicity appear. Minamata disease (mercury poisoning) was discovered and diagnosed 20 years after the discharge of 220 t of mercury into Minarnata Bay (Japan) over a 4-year period. Thus, methyl mercury poi- soning is particularly deadly because the vic- tims suffer irreparable harm long before the symptoms appear. Furthermore, the syrnp- toms may appear long after exposure.
Data from a wide range of polluted estuar- ies, harbors and coastal areas in industrial- ized countries indicate that PCBs and DDT are directly implicated in sublethal toxic effects on the health of fish populations (Sindermann 1979). These are synthetic compounds of comparatively modem (post- World War 11) origin against which most organisms have had no time to evolve detoxi- fication mechanisms.
Exposure
Highly mobile organisms such as pelagic fish species. birds and mammals often are

able to avoid areas of poor water quality. If exposed to a wastewater plume or a contami- nated area, the duration of exposure may be short, with a quick return to a cleaner envi- ronment.
Benthic biota, in particular, may be more susceptible to urban and industrial waste discharges because they are unable to avoid adverse water conditions and are more likely to be exposed to high levels pollutants.
CONCLUSIONS
Waste management in the involves knowledge of public
coastal zone concerns and
their interactions with ecological research. A preliminary risk assessment indicates that benthic species, including coral reefs and reef fish, are highly susceptible to pol- lution. particularly high rates of sedirnent- ation, organic loading and discharge of persistent toxic chemicals. Biodegradable pollutants are probably insignificant except in poorly flushed water bodies or shallow embayments. Viruses and pathogens from poorly treated domestic wastewater pose threats to users of coastal recreation areas. Discharges of mercury and chlorinated hydrocarbons have adverse effects on human health. Pollutants that persist in the environment are significant in terms of long-term build- up to harmful levels in sediments or biota. Chlorinated hydrocarbons (including pest- icides and PCBs) and mercury are clearly priority pollutants from the standpoint of toxicity and detoxification mechanisms and the assimilative capacity of the marine environment.
REFERENCES
Anderson, J., W. Birge, J. Gentile, J. Lake, J. Rogers. Jr., and R Swartz. 1987. Biological effects, bioaccumula- tion, and ecotoxicology of sediment-associated chemi- cals, p. 267-296. In K.L. Dickson, A.W. Maki and W.A. runi is (eds.) Fate and effects of sediment-bound
chemicals in aquatfc systems. Proceedings of the Sixth Pellston Workshop, Florissant, CO. S E W Spec. Publ. Ser., Pergamon Press, New York.
Brown, D.A.. S.M. Bay and RW. Cossett. 1985. Using the natural detoxification capacities of marine organ- isms to assess assimilative capacity, p. 364-382. In RD. Cardwell, R Purdy and RC. Bahner (eds.) Aquatic toxicology and hazard assessment: Seventh Symposium ASTM STP 854. American Society of Testing and Materials, Philadelphia, PA.
Brown, D.A., RW. Cossett. G.P. Hershelman, C.F. Ward, A.M. Westcott and J.N. Cross. 1986. Municipal wastewater contamination in the Southern California Bight: Part I - Metal and organic contaminants in sediments and organisms. Mar. Environ. Res. 18: 291- 3 10.
Bryan, G.W. 1979. Bioaccumulation of marine pollu- tants. Philos. Trans. R Soc. Lond. (Biol. Sci.) 286: 483-505.
Gonzales, E.A. and RO. Fernandez. 1988. Country report on the assessment of pollution from land-based sources and their impact on the environment. Annex VII. In Report of COBSEA-UNEP Seminar on the Assessment and Environmental Impact of Pollution from Land-based Sources. Coordinating Body for the Seas of East Asia and United Nations Environment Programme.
Hamrnond, P.B. and RP. Beliles. 1980. Metals. In J. Doull et al. (4s.) Casarett and DouUs Toxicology. 2nd ed. Macmillan Publishing Company, New York.
Johnston, RV. 1976. Mechanisms and problems of marine pollution in relation to commercial fisheries. p. 3-156. In R Johnston (4.) Marine pollution. Aca- demic Press Inc.. London.
Macek, K.J., S.R Petrocelli and B.H. Sleight 111. 1979. Considerations in assessing the potential for, and sig- nifkance of, biomagnification of chemical residues in aquatic food chains, p. 251-268. In L.L. Marking and RA. Kimerle (eds.) Aquatic toxicology. ASTM STP 667. American Society of Testing and Materials, Philadel- phia, PA.
Rhoads, D.C. 1974. Organism-sediment relations on the muddy sea floor. Oceanogr. Mar. Biol. Annu. Rev. 12: 262-300.
Sanders, B.M., K.D. Jenkins, W.G. Sunda and J.D. Cost- low. 1983. Free cupric ion activity in seawater: effects on metallothionein and growth in crab larvae. Science 222: 53-55.
Sherwood, M.J. 1982. Fin erosion. liver condition, and trace contaminant exposure in fishes h m three coastal regions, p. 359-377. In G.F. Mayer (ed.) Eco- logical stress and the New York Bight: science and management. Estuarine Research Federation, Columbia, SC.
Sinderrnann, C.J. 1979. Pollution-associated diseases and abnormalities of fish and shellfish: a review. Fish. Bull. 76: 717-749.
Thomann, RV. 1981. Equilibrium model of fate of micro- contaminants in diverse aquatic food chains. Can. J. Fish. Aquat. Sci. 38: 280-296.
Young, D.R 1982a. A comparative study of trace metal contamination in the Southern California and New York Bights, p. 249-262. In G.F. Mayer (ed.) Ecological stress and the New York Bight: science and manage- ment. Estuarine Research Federation, Columbia, SC.
Young, D.R 198213. Chlorinated hydrocarbon contami- nants in the Southern California and New York

Bights, p. 263-276. In G.F. Mayer (ed.) Ecological stress and the New York Bight: science and management. Estuarine Research Federation, Columbia, SC.
Young, D.R. AJ. Mearns, T.K. Jan, T.C. Heesen, M.D. Moore, RP. Eganhouse, G.P. Hershelman and RW. Gossett. 1980. Trophic structure and pollutant con- centrations in marine ecosystems of Southern Califor- nia CalCOFI Rep. 21: 197-206.

Solid Waste Management in Singapore
LIM HUNG SIANG DAN TAN
Singapore Erwfronrnental Management and Engheerhg Semites Pte. Ltd.
5 PorLsdown Road Singapore 05 13
LIM, H.S. and D. TAN. 1992. Solid waste management in Singapore, p. 99-101. In T.-E. Chua and L.R Games (eds.) Waste management in the coastal areas of the ASEAN region: roles of governments, banking institu- tions, donor agencies, private sector and communities. ICLARM Conference Proceedings 33, 2 18 p. Ministry of the Environment, and Canada-ASEAN Centre, Sin- gapore; Asian Development Bank, and International Center for Living Aquatic Resources Management, Philippines.
ABSTRACT
The reputation of Singapore as a "clean and green city" is a testimony to the effectiveness of the solid waste management system. Important factors which contribute to this are sound planning, advanced technology, a well- trained workforce, and effective legislation and enforce- ment.
INTRODUCTION
Proper refuse collection and disposal is one of the most visible challenges in environ- mental management.
In the early 1960s. Singapore faced an increasing population and rapid industrial- ization which produced more and more refuse each day. An effkient waste management system became imperative. To meet this challenge, the Environmental Public Health Division was formed in the early 1960s to provide refuse collection and disposal ser-
vices. These duties were transferred to the Ministry of the Environment (ENV) in 1972.
Today, the reputation of Singapore as a "clean and green city" is a testimony to the effectiveness of its solid waste management system.
One of the first things Singapore did was to tighten its legislation. The laws against lit- tering were improved (e.g., fines were enhanced). A "Keep Singapore Clean" carn- paign was launched in 1968 to educate the public on the importance of a clean environ- ment.
SOLID WASTE MANAGEMENT
Public cleansing
The ENV now operates a fleet of 56 mechanical sweepers. As part of E W s ongoing program to mechanize its operation. 25 "Billy Goats" have been deployed to sweep roads and walkways. There are also beach cleaning machines. Manual sweeping is done in areas which are not amenable to mechanization.
Refuse collection
Singapore is one of the few countries in the world where refuse is collected daily. For

effective control, the country is divided into seven collection areas, each of which is rnan- aged by an Environmental Health Ofnce (EHO) .
The amount of refuse collected in Singa- pore increased from 1.5 million t in 1985 to 2.1 million t in 1990. The ENV collects wastes from households and commercial areas. These wastes forrn nearly 50% of refuse collected in the country. Refuse from industrial and institutional premises are normally handled by private waste collectors licensed by ENV.
The ENV uses rear-loading compaction trucks fitted with hydraulic lifting mecha- nisms to handle refuse contained in bulk and small bins. Whenever road condition permits, bigger compaction trucks are used to improve efBciency of collection. Also, roll-off com- pactors have been used in large bin centers to improve productivity and reduce odor nui- sance at the bin centers.
Refuse collection trucks are deployed daily from the seven EHOs early in the morning and again in the afternoon. The ENV operates and maintains a fleet of 209 trucks.
The two basic types of collection are: 1. Direct collection - refuse is directly
discharged from the houseowners' bins into the truck by manual labor.
2. Indirect collection - refuse from high- rise apartment blocks is transferred to bulk bins and roll-off compactors. The trucks collect refuse stored in bulk bins at the bin centers.
Items that are too bulky to be collected by trucks are removed by special scowl-end crane tippers.
New public housing blocks are also designed to have centralized refuse chutes. The refuse collected will be directly dis- charged into a dust-screw compactor at the bottom of the chute. This will dispense with the need for bin centers for refuse storage and collection.
A centralized vehicle workshop repairs and maintains E W s fleet of refuse trucks and mechanical sweepers. With computerized stores and maintenance systems, mechanized tools and precision-testing equipment, the workshop ensures a quick turnaround time. A computerized "waste management system" provides on-line monitoring of status perfor- mance of each refuse collection vehicle.
Over the years, ENV has acquired sub- stantial experience in the planning and man- agement of refuse collection. Its engineers have continuously improved equipment to suit local conditions. For example, the refuse collection vehicles supplied by foreign com- panies were found to be unsuitable for tropi- cal weather. Unlike those in temperate coun- tries, our refuse has higher water content. Using in-house expertise, the engineers were able to mod@ the specifications of the vehi- cles to solve the leaking and corrosion problems.
Disposal by sanitary landfill
Before 1979, solid waste was disposed of by sanitary lanclfi in swampy areas. The two landfills in Singapore are at Lorong Halus (Tampines) and Lim Chu Kang. At these landfills, the refuse is first weighed at the weighbridges. The ENV computer system records the weight, source and type of refuse upon insertion of an account holder's mag- netic card. The refuse disposal charge is also computed automatically.
The ENV has acquired substantial exper- tise in the design and management of land- fills. These are lined with impermeable liners to prevent leachate from contaminating the ground- and seawater.
Incineration
Although landfill disposal is relatively sim- ple and satisfactory, land is scarce in Singa- pore. Hence, alternative methods of solid waste disposal were studied in the early 1970s. Incineration was found to be the most cost-effective as it reduces the volume of solid waste by 90%. The first incineration plant at Ulu Pandan was commissioned in 1979 with an initial capacity of 1.200 t/day which increased to 1,600 t/day in 1982. A second incineration plant at Tuas was completed in late 1986 with a capacity of 2.000 t/day. About 60% of the total collected solid waste is burned in the two incineration plants.
A third plant with a capacity of 2,400 t/day is under construction in Senoko. It is expected to be commissioned in 1992. Together, the three incineration plants would

be able to handle the incinerable waste till the turn of the century. As about 85% of the refuse is incinerable, the remaining 15% has to be disposed of by sanitary landfill.
Similarly, refuse collection vehicles enter- ing the incineration plants are weighed at the weighbridges. The refuse is then emptied into refuse bunkers through discharge bays at the reception hall. Overhead grab cranes operat- ing from a control room feed the refuse into the incinerators. After incineration, the residue goes through overhead magnetic sep- arators which pick up scrap metal. The ash is later transported to the dumping ground for disposal while the recovered scrap metal is sold to a steel mill for recycling.
The heat from incinerators is used to gen- erate steam which in turn drives a turbine generator to produce electricity. Part of the electricity generated is used to operate the plant, and the surplus is sold to the Public Utilities Board.
To prevent air polution, equipment such as electrostatic precipitators have been installed to control dust and smoke emis- sions. This ensures that the gases discharged through the chimney into the atmosphere is clean.
Years of experience in the operation and maintenance of two incineration plants have equipped ENV engineers with the expertise to ensure that the new plant will have all the necessary features to suit our tropical conditions.
Transfer station
The Kim Chuan Transfer Station was built in 1986 following an ENV operational research study on the collection of refuse.
Refuse collected from the eastern half of the island is compacted into 20-t container- trailers at the transfer station. These container-trailers are then driven to Tuas for refuse disposal. This method has resulted in better utilization of refuse trucks as well as reduced manpower requirements and haulage cost. Total cost savings amount to S$l9.5 million per year. 1
CONCLUSION
Sound planning, advanced technology, a well-trained workforce. and effective legisla- tion and enforcement are important factors contributing to an effective solid waste man- agement system in Singapore.
Armed with solid expertise, ENV drives forward to make the country a model envi- ronment city. This expertise can now be tapped by overseas parties through E W s newly formed private subsidiary company. the Singapore Environmental Management and Engineering Services Pte. Ltd. (SEMES).
September 199 1: S$1.69 = US$1.00.

Assessment of Waste Management in the ASEAN Region
KEN BECK LEE SUZANNE TROXLER
UMA Engineering Ltd 3030 Gilmore Diversion
Bumaby, B.C. Canada V5G 3B4
LEE, K.B. and S. TROXLER 1992. Asscssment of waste It is suggested that the ASEAN make progress by management in the ASEAN region, p. 103- 138. I n T.- taking "bite-size chunks" to avoid being overwhelmed by E. Chua and L.R Garces (eds.) Waste management in the waste management crisis, which could induce a lack the coastal areas of the ASEAN region: roles of gov- of focus and direction. ernments, banking institutions, donor agencies, A menu of possible technical solutions and sugges- private sector and communities. ICLARM Conference tions under varying circumstances for each nation is Proceedings 33, 218 p. Ministry of the Environment, presented. and Canada-ASEAN Centre, Singapore: Asian Devel- opment Bank, and International Center for Living Aquatic Resources Management, Philippines.
THE ASEAN REGION: AN OVERVIEW
ABSTRACT
This paper presents a general survey of the nature and physical extent of waste collection and disposal problems confronting the coastal areas of the six ASEAN member-countries. Current management practices for domestic, agricultural and industrial wastes are also summarized. Estimations of present and future waste generation and pollution loading rates are based on current and projected populations, rate and type of industrialization, and the level of pollution control in each nation.
Domestic sewage is a major source of organic pollu- tants in the region's coastal waters. Except in Singapore and Brunei Darussalam, sewage undergoes little or no treatment before being discharged into rivers and the sea. Agricultural waste, mostly fi-om livestock farms, pesticides and fertilizers, is also a major cause of organic pollution, except in those two countries. Solid tvaste, on the other hand, is often dumped in unauthorized loca- tions due to lack of proper disposal sites. Untreated industrial effluents are discharged into the waters, except for Singapore and Malaysia. Hazardous waste, which has been a major problem in more industrialized nations, is just beginning to cause concern in the ASEAN region.
The geographic, socioeconomic and demo- graphic features and the general environ- mental conditions of the individual ASEAN member-countries are summarized in Tables 1 and 2.
Negara Brunei Darussalam
Brunei Darussalam is a small coastal country bordering the South China Sea. More than 85% of the population lives in the coastal zone, in urban areas around the cap- ital (Bandar Seri Begawan) and in Kuala Belait-Seria. Residents have a high per capita income of over US$12,000 and a corre- sponding high standard of livlng (Chua et al. 1987; De Silva et al., this vol).'
Wosts are in US$ unless otherwise specified.

104 Table 1. Physical and climatic features of MEAN member-countries.
-
Count~y Land area W) Land use (%) Physical features Vegetation Climate
B ~ n d 5.765 Cultivated 0.3 Darussalam Forest 85
Pasture 1
Indonesia 1,904,569 Culthrated 31 Forest 31 Pasture 6
Malaysia 329,758
Philippines 300.000
Singapore
Cultivated 15 Forest 80 Pasture 2
Cultivated 41 Forest 53 Pasture 1.4
626 Cultivated 3.2 Forest 4.6 Pasture -
Thailand 513,115 Cultivated 50 Forest 29 Pasture 8
Rugged and hilly except for 8 Covered by tropical forest narrow caastai plains with large variety of hardwood Mountain territoq heights species of 300 m Highest point is Bukit Pago at 1,841 m
Consists of 13.600 islands Variable dense tropical forests 6,000 inhabited islands and tidal swamps. normal low- Pronounced mountain ranges and lands and savannah extensive lowlands on larger Forests thinner towards the islands east Little coastal plains on smaller islands that rise steeply from the sea Volcanic eruptions common
Mountain ranges reach 2,lM) m and Equatorial forest cover run north to south, swampy forests More dense and continuous and lowlands to the east of Penin- on Sabah and Sarawak than sular Malaysia, Sabah and Sarawak in the peninsula Wider lowlands and longer rivers in Sabah and Sara* outstanding feature is Mt Kinabalu at 4,101 m
Conslsts of 7,107 islands Both hard- and softwood More than one dozen active spedes in forest cover volcanoes Interior mountain ranges reach 2.400 m in larger islands Extensive lowlands in a few islands
Island's granite core Remabingrainforests reach heights of 100 m being preserved Surrounded by marshy lowland Height rarely exceeds 15 m
Mainly narrow coastal lowlands Includes tropical monsoon backed by low mountain ranges forests in Peninsular Thailand Denser in the uplands. North consists of uplands at thinning in the lowlands varying heights sumunding a large central plain
Govemed by quatoria! monsoons Hot and humid Heavy rainfall (2.500 mm on coast: 5.000 In interior) Heaviest rafnfallin November and March Average temperature is 270C
0 Heavy rainfall all year- round with peak periods in the west and greatest amounts from December to March Little variation in high temperatures (26-27T) Dry season in the south &June-October) Marftimequatoria! climate
Variable rainfall in Sabah and Sarawak Rainfall avelage 2,540 =/year in the peninsula Average temperature is 21-32T Equatorial climate
Regional va!iation in rainfall Mean annual temperature is 2 7 T More exposed parts of country subject to typhoons Maritime tropical climate
Hot and humid 0 No defined seasons
Average rainfall is 2,367 m d y -
0 Average temperature is 2PC
Tropical temperature range of 24-3WC throughout the year . Raidall below 1.500 -/year Hot and dry season from October to February
0 Rainy season from May to September
Sources: Compiled from EPL (1990) and The New Encyclopedia Britannlca (199 1).
The country's economy is based on its petroleum resources. Most of the economic activities, including the petroleum-based industry, are found in the coastal zone, with only a small area devoted to agriculture (Chua et al. 1987; EPL 1990 and De Silva et al., this vol.).
There appears to be no major pollution problems along the coast, other than the potential pollution from oil and gas explo- ration activities, and some discharges of partially treated and untreated domestic sewage, especially from water villages. Brunei
Darussalam has antipollution legislation, but enforcement has yet to be improved (Chua et al. 1987).
Indonesia
Indonesia is an archipelago of some 13.600 islands, of which around 6,008 are inhabited. Its coasts face the Indian Ocean on the west and south, and the Strait of Malacca and the South China Sea on the north. Indonesia has the second longest shoreline in the world.

Table 2. Some ASEAN socioeconomic data.
Regional performance Brunei Indonesia Malaysia Philippines Singapore Thailand figures Darussalam
Population Total 1989 (million) 1989 density (person/ha) % average annual growth
1981 - 1985 Projected year 2000
(million) Urban population (%) Infant mortality
(per 1,000) Life expectancy (year)
Workforce Total (million) O h Commerce/se~ces % Manufacturing O h Agriculture/fishing % Construction % Government and public
authorities
Social Person per hospital bed Person per doctor Car (thousands)
Production and prices (1988) GDP a t market prices
(US$ billion) Per capita income (US$) GDP, real growth (%) Agriculture a s GDP Manufacturfng as GDP Consumer prices (46 rise)
a 1987. b1986. Source: FEER (199 1).
More than 60% of its 180 million people live in rapidly growing cities in the coastal zone (Salim 1985; EPL 1990).
The country faces major challenges in envi- ronmental management because of the large and very fragmented land area, low per capita income (below $500) and uneven distribution of resources and population. Most of the industries are concentrated on the islands of Java, Madura and Bali, which represent only 7% of the country's land base but have 65% of the country's population. Most financial and technical resources are also concentrated in Java and Jakarta.
Oil and gas exploration is a significant component of the economy. Oil is mainly pro- duced and processed in Sumatra, the largest exclusively Indonesian island. Other activities
are tin mining, onshore and offshore agri- culture (rice, rubber and coc~nut) and aqua- culture (EPL 1990). Although manufacturing forms a small percentage of the country's economic activity, the discharges from palm oil industries and coconut processing plants affect the quality of coastal waters. The recent government initiative to add value to domes- tically produced raw materials and move from small-scale agricultural and forestry pro- cessing to large-scale petrochemical plants and hard-metal processing units has compounded the water pollution problem.
Coastal resources use will increase as the population grows. Because of coastal and upland activities, the marine and coastal environment is subjected to stress and degradation, including pollution from oil

spills, siltation, pesticides, fertilizers and other untreated wastes (NDPA 1988).
The major constraints to improving envi- ronmental quality are the lack of adequate training facilities and technical manpower as well as insufficient financial resources. Establishing an environmental control pro- gram can address the problem.
Malaysia
Malaysia comprises Peninsular Malaysia, which includes a number of islands, and the states of Sarawak and Sabah, which form Eastern Malaysia. Peninsular Malaysia is bordered by the Strait of Malacca on the west and the South China Sea on the east. The latter also abuts Eastern Malaysia.
Most large cities like Kuala Lumpur, the capital, are located in the peninsula, which has 65% of the total population (EPL 1990). In addition, Peninsular Malaysia accounts for approximately 90% of the country's manu- facturing output.
The country has the largest tin deposits in the world, but one of its main economic resources is petroleum. Recent government policies promote diversification of manufac- turing industries into electronics and trans- portation equipment. Agriculture's major produce are rubber and palm oil (EPL 1990).
Rapid economic growth (seen in the per capita income of about $2,000) and political stability have contributed to the implementa- tion of good environmental programs. A water quality monitoring program, which can doc- ument the state of the environment and the performance of pollution control measures. has been implemented (DOE 1989). The country also has institutions of higher education which provide excellent training in environmental science.
Philippines
The Philippines' total population of more than 60 million inhabits only 880 of the country's 7,107 islands, with 70?! living in coastal areas (EPL 1990). Increasing urban- ization is seen in the concentration of 40% of the populace in urban areas. Metro Manila alone is home to approximately 8 million
people and 69% of the industries (DENR 1990).
The economy depends mostly on the pri- mary sector (agriculture/fishing/forestry). In spite of government efforts during the 1980s toward import substitution, the manufactur- ing sector is weak.
The country has developed environmental laws and regulations which form the essential framework for future progress, but geo- graphical fragmentation, low per capita income (around $7001, political instability and division of responsibilities among numerous government agencies, hinder pollution control efforts.
Singapore
Singapore is a large urban center, densely populated and highly industrialized. It is located on a major international sea-lane for commercial shipping and is the world's busi- est port in terms of shipping tonnage (Chia et al. 1988; EPL 1990). The low but stable pop- ulation growth and rapidly growing economy (around $10.000 per capita income. a close second to Brunei Darussalam) have resulted in a relatively affluent population.
In the 1960s. Singapore's textile-, clothing- and electronics-dominated industry was characterized as labor-intensive. In the 1970s and 1980s. it moved towards more skill- intensive, high-technology enterprises such as the manufacture of petrochemical prod- ucts. precision instruments and transporta- tion equipment (including shipbuilding and aerospace manufacturing), and biotech- nology. This new orientation towards indus- tries that require higher skill levels and tech- nology has resulted in higher value-added industries in Singapore's economy.
Coastal water pollution is not considered a serious problem because of the dynamic pol- lution control program and the good flushing effect of strong tides and currents in the south of Singapore Island (Chia et al. 1988; EPL 1990). Johore Strait. however. has become polluted due to the partial restriction on water circulation created by the causeway linking Singapore to Malaysia, and the urban and industrial developments on both sides of the strait.

The country has a well-developed legal infrastructure and well-trained technical and administrative personnel for waste manage- ment. It has an excellent wastewater collec- tion/treatment system and the most strin- gent environmental standards and proce- dures in the region. Waste management measures, which include the "polluter pays" principle, are strictly enforced.
Thailand
The greater part of Thailand lies on the north of Bangkok, its capital. Peninsular Thailand, which extends south to Malaysia, is bordered by the Gulf of Thailand and Andaman Sea.
The country's limited degree of urbaniza- tion is shown in the relatively even socio- geographic distribution of its 55 million people (with a per capita income of $1,000). An estimated 17% of the population lives in urban areas, 10% of which lives in Bangkok.
The main natural resources are provided by agriculture, although there are some natu- ral gas reserves, tin deposits and small quantities of petroleum (EPL 1990). The Thai industry is no longer dominated by primary resource processing, particularly agricultural (e.g., rice milling). The textile industry, how- ever, was the largest export earner for 1986. The manufacturing trend is towards more high-technology industry such as electronics.
Climatic and demographic features and environmental status of the region
The region's climate, with year-round high temperatures (average of 27°C) and heavy rainfall (2,000-5.000 mm/year) is a signifi- cant factor in waste management. For exam- ple, solid waste, which has a high moisture content, has to be collected daily, not weekly, as is the case in most industrialized nations. Ground disposal of wastewater may be in- appropriate in many parts of the region due to a high groundwater table.
The region's population density is approxi- mately 325.5 million people on a total land area of 3.05 million k&. The projected ASEAN population is 400 million by the year 2000. Thus. proper management of domestic
sewage and solid waste is crucial, especially in major urban centers.
The income level is known to correspond with the waste generation rate of each nation. It is also an indication of the health care system, life expectancy and infant mortality rates (Table 2), which may be affected by the prevailing waste disposal system. Singapore and Brunei Darussalam provide good medical systems and thus, show higher life expectancy and lower infant mortality rates. Indonesia has the lowest life expectancy and the highest infant mortality rates.
The lack of agricultural waste management has drastically affected the environmental quality of nations with dominant agricultural and fisheries sectors, particularly Thailand, Indonesia and Malaysia (Table 2). The rela- tively small percentage of gross domestic products (GDPs) from the manufacturing industry in each nation means that hazardous waste does not yet pose a major threat. but this situation will change with rapid industrialization.
Singapore is the only nation in the region whose waste management activities are cen- tralized within the Ministry of Environment. The others have yet to consolidate waste management activities, for which responsi- bility is still fragmented among many agen- cies. Singapore has skilled manpower and good laboratory facilities for monitoring, enforcing and implementing waste manage- ment regulations and plans. In others, budget constraints and the lack of skilled manpower and laboratory facilities impose waste management difficulties. Compliance with existing legislation is seldom monitored or enforced. There are waste management plans, but their implementation has been very slow.
STATUS OF WASTE MANAGEMENT SYSTEMS
Sewage
The major source of organic pollutants in ASEAN coastal waters is domestic sewage from both rural and urban centers. The increasing population density in coastal and

urban areas has further worsened the envi- ronmental condition of marine waters, due to the lack of services, policies and plans for the prevention, management, collection, treat- ment and disposal of waste. The level of domestic sewage pollution is high, particu- larly in the Upper Gulf of Thailand, Manila Bay, Strait of Malacca, West Coast of Penin- sular Malaysia. North Coast of Java Island and Jakarta Bay.
Sewage collection is a basic problem in countries with few piped sewer systems. Sewage treatment plants (STPs) are generally lacking. The most common method of wastewater disposal is direct discharge into rivers or the sea.
The majority of the populations in Indone- sia. Malaysia, the Philippines and Thailand use the individual septic tank system, which is also widely used in Brunei Darussalam. The septic tank drain fields are often installed in inappropriate soil and groundwater condi- tions, and effluent is often discharged into street drains or the nearest stream. House- hold wastewater, other than excreta, is also often disposed of in drains.
Most urban areas in Brunei Darussalam have sewers that lead to STPs, where sewage is given secondary treatment. An exception is the Pintu Mabim plant, which gives only primary treatment (De Silva et al.. this vol.).
There are places which are not yet served by STPs (e.g.. Kuala Belait). A particular problem area is Kampong Air, a water village on the Sungai Brunei Estuary. Its approxi- mately 25,000 inhabitants throw their sewage and garbage into the surrounding waters, contributing about lo?! of the total biological oxygen demand (BOD) to the country's waterways (PWD 1990; De Silva et al.. this vol.).
A two-pronged approach has been consid- ered: relocate residents and improve waste disposal facilities for the remaining residents, i.e.. install gravity and vacuum sewer systems with central treatment (PWD 1990).
Around 5% of the population of Malaysia is served by sewers. and about 70% of house- holds use either septic or Imhoff tanks. Up to 44E-6 of the inhabitants do not reside within a municipality or a district. and thus receive no organized sanitation service.
Penang has sewers which collect waste from approximately 60% of its households.
Raw sewage is disposed of through an ocean outfall. As a result, fecal coliform levels near the outfall are high enough to prohibit shell- fish farming or fishing in the vicinity. Aqua- culture farms have also experienced diseases from fecal microbial contamination (Sivalingam 1984).
Jakarta, Indonesia's capital, lacks sewer systems. Most household sewage that has not been in contact with excreta is discharged through open channels into rivers. This poses a health problem, since gray water can still have high fecal coliform levels. In about 60% of households, human waste is disposed of in septic tanks and septage is pumped for disposal. Other households do not have a septic tank system or an adequate sanitation facility (Ruddle 198 1).
The Jakarta Sewerage and Sanitation Pro- ject plans to provide comprehensive sanita- tion management to the Setiabudi area in the center of Jakarta. The pilot project will ser- vice 400,000 people, which is about 10% of the city's population. It will provide conven- tional sewers to areas that have the ability to pay, and experimental sewers to less affluent areas. The existing subsurface disposal systems of the nonsewered areas will also be improved. Because much of the collected sewage will be discharged untreated, there are plans for sewage treatment facilities (SEATEC 1988).
In the Philippines, only about 12% of Metro Manila's population is served by a sewer system (DENR 1990; Matmodjo 1990). A central collection system conveys sewage to the Tondo pumping station, and then to a 2.7-krn outfall into Manila Bay. Sewage is discharged untreated. Communal septic tanks are also used in parts of Metro Manila (e.g., Quezon City).
Manila Bay's bacterial counts have reached unacceptable levels, and eastern beaches are unfit for bathing, fishing and aquaculture. All five rivers of Metro Manila are biologically dead.
The provision of sanitary sewerage services for other Philippine cities is not a high prior- ity because the need to develop water supply systems is more urgent (SEATEC 1988).
Almost 90% of Singapore's population is served by a system of sanitary sewers and STPs. There is no provision for stormwater treatment, although parking lots have oil and

grease traps while construction sites are required to install silt traps.
A11 slx central STPs in Singapore have acli- vated sludge systems, which provide secondary treatment, and more than 500 government STPs have been built to senrice individual developments. Sludge produced at the STPs is used in development projects and land reclamation sites (Tan, this vol.). The treated effluent is discharged into the sea. approximately 1.15 km from the shore. Some of the effluent is treated further at the Jurong Industrial. Water Works to produce industrial water (Triatmodjo 1990; Tan, this vol.).
The estimated sewage generation rate in Singapore is 140 l/capita/day (lcd) from public housing, and 240 lcd from private housing. Average flow to the sewerage system is approximately 300 lcd, including non- domestic contributions. This flow rate is comparable to industrialized nations'.
Almost 95% of urban households in Thai- land have modem pour-flush or cistern toilets, although fewer than 100,000 people are served by conventional sewerage or centralized STPs (UNDP-WE3 1991).
In Bangkok, for instance, there is a lack of conventional sewerage since groundwater supply is considered more important. Because of growing concern with pollution, however, the government plans to design and construct large STPs in and near Bangkok (SEATEC 1988; UNDP-WB 1991). The Bangkok Metropolitan Authority ( B W is planning to privatize these facilities.
At present, seven Thai cities operate wastewater treatment plants. The Public Works Department has identified 67 cities where wastewater treatment systems are to be built over the next 12 years (UNDP-WE3 1991).
Phuket Island, a popular tourist destina- tion, is greatly affected by organic pollution. To reduce the severe environmental impacts caused in part by sewage contamination of the major watersheds. an STP was built in Patong and has been in operation since 1989. Plans are being developed for another STP in Karon/Kata (Branan 1990).
Solid waste
The dumping of municipal solid waste [MSW) has become a serious environmental
problem in the region due to increasing pop- ulation densities and the absence of adequate collection and disposal facilities. Some MSW are buried, some are open-burned and a lot are dumped directly or indirectly into the river systems or the sea. These also accumu- late in some unauthorized dumping locations. They enter and clog surface drains and are flushed into coastal waters. In Metro Manila, solid waste deposited in rivers has caused floods, creating serious health hazards as in increased gastrointestinal cases during the rainy season.
The typical MSW in the region consists mostly of putrescible vegetable matter with a high moisture content. The second largest component is paper, which cannot be burned easily without the addition of another type of fuel (e.g., gas).
Collection In Brunei Darussalam, collec- tion services are available in urban and surrounding areas. Soon, Kampong Air will be serviced, based on the positive results of a pilot project for solid waste collection here in 1989 (PWD 1990; De Silva et al.. this vol.). Twenty-five percent of Indonesia's MSW is collected as often as once a day in some areas (Sicular 1989; Sri Bebassari et al.. n.d.). In Malaysia, 90% of urban solid waste is col- lected by municipal crews and private contractors; 80%. in incorporated rural areas. The high percentage of the municipal budget allotted to solid waste management (about 20-80%) must be partly the reason for its MSW collection efficiency. In the Philippines. about 80% of the MSW in urban areas is col- lected (DENR 1990). In 1987. 80% of Bangkok's households received MSW collec- tion services [Mvichien 1988; Thongkaimook 1990). Singapore has daily collection senrices. so illegal dumping is rare.
Land DisposaL Generally, collected MSW is deposited in open dumps, but other disposal methods are now becoming more common.
One is the sanitary landfill. Singapore has two landfills, with another under construc- tion. Indonesia, Thailand and the Philippines (near Metro Manila) have their own, too; one is being planned in Brunei Darussalam (in Muara District) (De Silva et al., this vol.).
Another means is dumping it in low-lying areas for land reclamation. This practice, however, can result in the production of

leachate, which may contain heavy metals that may contaminate the groundwater and affect the water supply. It can also result in floating debris along coastlines. Malaysia has recently dumped MSW for land reclamation near Penang, and water quality monitoring in the area indicates that heavy metals are rapidly leaching out into the coastal waters (Sivalingam 1984).
Recycling. Uncontrolled and widespread scavenging takes place in the collection areas and open dumps of the region. In 1990, an estimated 300 t/day, or 8% of the total solid waste generated in Metro Manila. was recy- cled by scavengers and MSW collection crews, Recychg programs are being established in Singapore for paper and cans, and in Malaysia for paper, through a National Coun- cil for Recycling. In 1990, Singapore recov- ered 18.500 t of scrap metal. about 3.8% of the country's total solid waste, at two incin- eration plants. The recovered scrap metal was sold at $0.82 million the same year (Tan, this vol.) .
Composting. Indonesia and Thailand are operating formal public composting facilities with limited success. In both countries, use of the facilities is not maximized, and pro- duces a high percentage of rejects. Thailand's composting installations. which operate at about 50% capacity, work in conjunction with small incinerators which bum the com- posters' rejects. Composting operations in the country are not economically viable, as the cost of hauling compost to the agricultural lands exceeds the market value of the compost (Trivichien 1988). Nevertheless, a new 100-t/day composting plant is scheduled for construction in 199 1 (Thongkairnook 1990).
Incineration Incinerators are in use in Indonesia, Malaysia, Singapore and Thailand. Singapore disposes of 57% of its MSW as it produces surplus electricity that can be sold. Another incinerator is being built, so all com- bustible solid waste (apprordmately 90% of the total solid waste) can be burned (Tan, this vol.). The high cost involved is justified because of the value of land in Singapore. Incinerators have been rejected in Brunei Darussalam because they have not been found to be cost-effective (De Silva, et al.. this vol.).
Agricultural waste
Agricultural waste is the second most important source of organic pollutants in the region. The three main components of agri- cultural pollution entering the rivers and coastal waters are: organic refuse from live- stock farms; fertilizers and pesticides; and siltation from erosion.
There is no evidence of agricultural pollu- tion problems in Singapore and Brunei Darussalam. In Brunei Darussalam, however, stormwater runoff carries substantial amounts of silt due to the presence of highly erodible soils.
Livestock F a r m . Although most livestock manure is merely recycled by spreading it on agricultural land, poultry and pig wastes are produced in large quantities constituting a significant source of pollution in the marine environment, except in Singapore and Brunei Darussalam (Leong 1988; Tan. this vol.).
In Malaysia, an estimated 10-25% of the agricultural organic wasteload to the coastal waters is from livestock effluents, particularly from pig farms located beside rivers. Due to the government's current stringent environ- mental regulations, livestock wastes have to undergo primary treatment in oxidation ponds prior to disposal (Sivalingam 1984). Singapore, on the other hand, has phased out pig farms entirely and placed controls on poultry farms (Leong 1988; Tan, this vol.).
In Thailand. 50% of the agricultural solid waste is sold as soil conditioner and approximately 10% is discharged into fish- ponds. Solid waste from other agro-industries is often recycled as fuel or composted. Fertilizers and Pesticides. Synthetic fertiliz-
ers and pesticides are widely used in agri- culture (Table 3). Several countries, recog- nizing the dangers these substances pose to the environment, have taken regulatory and enforcement steps to control their use. Indonesia formulated new policies which ban some pesticides and remove government subsidies for ferlllizer. Thailand also elimi- nated financial grants for the purchase of chemicals and instituted government training programs for fanners to help them reduce or eliminate the use of chemical fertilizers and pesticides.
In Indonesia, pests and diseases cause estimated yield losses of 20-30% in rice and

Table 3. Fertilizer and pesticide use in the ASEAN region.
Total cropland Ha/capita Irrigated Fertilizer Pesticide Country area (ha) (1989) landa (96) use Whal useb (t)
Indonesia 21,200 0.12 34 100 16,344 Malaysia 4,380 0.26 8 154 9,730 Philippines 7,930 0.13 18 4,415 Thailand 20,050 0.37 20 26 22,289
a1985- 1987. bActive ingredient. Source: WRI (1990).
10-20% in other crops. Agricultural pesti- cides, which are used in small farms and large estates. are propineb, carbofuran, butylphenyl-n-methylcarbamate (BPMC), dalapon and phenthoate. Of the total pesti- cide use in the country, insecticides account for 75%. with application on rice crops making up 75% of the total insecticide use (ADB 1987).
The principal pesticides used in Malaysian agriculture are paraquat, dalapon, diuron, 2.4-D, metharnidophos, permethrin, cyper- methrin, malathion and carbaryl. Three crops, i.e., rubber, oil palm and rice, account for 90% of the annual pesticide use. Seventy- five percent of the pesticides are herbicides for rubber and oil palm plantations. Insecti- cides, however, are more commonly used on vegetable. rice and tobacco crops (ADB 1987).
In the Philippines, the main pesticides used are monocrotophos, phenamiphos, tride- morph, butachlor, chlorothalonil, mancozeb, endosulfan, azinphos-ethyl, chlorpynfos + BPMC and parathion-methyl. Insecticides are most extensively used, at 55% of the total. Rice production is the largest consumer of all insecticides at 46% of the total, and vegetable crops at 20% (ADB 1987).
Pesticides are the most popular means of crop protection in Thailand, particularly for rice, vegetable and cotton crops. Generally. insecticides are used in vegetable and rice production; herbicides, in rubber. palm oil and sugar cane production; and fungicides, on vegetables and fruit crops. Key pesticides in Thailand are: 2.4-D, paraquat, dalapon, parathion-methyl, copper oxychloride, atra- zine, monocrotophos, dimethoate, diuron and ametryne (ADB 1987).
The ASEAN member-countries have similar health and environmental concerns with
respect to pesticide use in agriculture. Some of these concerns are: potential toxic residue on locally consumed foods and exported crops; possible adverse effects on fish and other marine life, soil and water bodies; pest resistance; and occupational and accidental poisoning due to indiscriminate farm use and careless handling during manufacturing. toxic waste disposal and effluent discharge by pesticide manufacturers.
Siltation from Erosion Deforestation. land- clearing and agricultural practices without proper erosion control and protection of watersheds have resulted in increased silt and sediment deposition in rivers and coastal waters. This accelerated sedimentation is sometimes considered one of the most dangerous forms of pollution in the coastal waters of Southeast Asia. Sediment accu- mulation can smother coral reefs, change the characteristics of the surrounding waters and block navigation channels. The mining in- dustry also contributes to increased siltation. but its effect is not as widespread or as dam- aging as that of poor agricultural activities.
In the Philippines, almost 30% of the total land area is subject to major soil erosion caused by deforestation and farming prac- tices (Ruddle 1981). This is aggravated by the presence of 50% of the operating mines in the coastal vicinity which use the sea as the final disposal site of mine tailings. Aside from the high solid content, mine tailings contain metals and toxic chemicals used in metal extraction processes, which have reportedly smothered coral reefs, particularly in South- em Philippines (Deocadiz 19901.
In Thailand, poor agricultural practices and the lack of reforestation schemes are causing silt from eroded soil (1.5 million t/year) to be deposited at the mouth of rivers that empty

into the northern part of the Gulf of Thailand. This has resulted in a delta (measuring 3,700 k&) and turbid inner gulf waters. In Malaysia, a combination of fanning, forestry and mining operations has also led to high sediment loads in most rivers, particularly in Peninsular Malaysia.
Agricultural practices and the inadequate protection of watersheds have been blamed for the accelerated sediment deposition in the waters of the urbanized Indonesian coast. The forest industry and tin mining operations account for sedimentation in rural coastal areas.
Industrial waste
The major industries in the region involve palm oil, rubber, tapioca, pulp and paper, sugar cane and petroleum processes, which are not concentrated in urban centers. The agro-industries, a significant fraction of the industrial base in the region. are distributed in remote rural areas.
More than half of the manufacturing industries are located along riverbanks or in coastal areas. Coastal waters, in effect, are made convenient "wastebaskets" of untreated industrial wastewaters. Industrial waste control is the responsibility of individual plant systems, but industries tend to use less advanced technologies, which result in marine contamination by undesirable sub- stances in these wastewaters.
The introduction of waste treatment stan- dards is perceived to increase production costs and thus, make industries less competitive. In Singapore, for example, some industries such as tanning, moved out because of the added cost for wastewater treatment due to the strict regulations on effluent limits of wastewater discharging into municipal sewers. Singapore's policy is to attract more value-added, rather than pol- lution-causing industries.
Singapore and Malaysia have been leaders in the establishment of industrial waste treatment standards. Both have implemented pollution control regulations specifying discharge limits and a licensing system based on the "polluter pays" principle. As a result, a large number of medium and large industries have installed pollution control and waste- water treatment facilities. Industrial parks
have been established and the sharing of a central waste treatment facility encouraged.
Petroleum and Natural Gas Industry. A principal concern is oil pollution, which results from oil spills that occur in Southeast Asian waters (particularly the Strait of Singa- pore and the Strait of Malacca), in the trans- port of petroleum and natural gas (Chia et al. 1988). It is also caused by oil exploration activities, deballasting and tank cleaning, and discharges from bilge, bunker and dry dock. Refineries, petrochemical plants, oil ports and coastal oil fields also produce wastewater with high concentrations of phe- nols, ammonia. salts and heavy metals. Their discharge can cause long-term, low-level contamination.
In Brunei Darussalarn, hydrocarbon con- tamination of the coastal waters from Brunei Shell Petroleum (BSP) activities has been observed in Seria. The BSP now has a treat- ment plant for oily wastes and has developed an Environmental Management Plan to address in-house waste management prac- tices (De Silva et al., this vol.).
In Indonesia, oil pollution from spillage, blowouts, disposal of brine, deballasting operations, uncontrolIed cleaning and acci- dents have affected some delicate estuarine areas and mangrove swamps (Wisaksono and Bilal 1985; ENRM 1989).
In Malaysia, sea-based pollution prevention measures have been taken for the Strait of Malacca. These include: standard operational procedures; local, national and regional con- tingency plans; and a set of environmental criteria, established by the international oil industry. Malaysia also prosecutes for delib- erate oil discharges (DOE 1989).
In the Philippines, effluents from petro- leum-based industries and ship discharges have resulted in chronic localized petroleum hydrocarbon pollution, particularly on the east shore of Manila Bay. Oily wastes from docked or passing ships are expected to ren- der shellfish growing in the bay inadvisable.
Singapore has five major oil refineries on its coast which discharge oil-wastewaters. Treatment of slop, sludge, dirty ballast and tank washings is available at the Slop and Sludge Treatment Centre (Ruddle 198 1; Chia et al. 1988).
The oil and gas industry is not a major activity in Thailand, although tar balls along

the water's edge have been reported. Because of the oil spill frequency in the Gulf of Thai- land, oil companies have formed a consor- tium to handle cleanup operations.
Palm 011 Industry. The palm oil industry is one of the major agro-industries in Southeast Asia, with Malaysia and Indonesia as primary producers.
Producing approximately 60% of the world's supplies of palm oil. Malaysia has established regulations for the control of effluent from palm oil industries (DOE 1989). Effective methods of treating palm oil wastewater were developed and implemented and by 1980, approximately 50% of the mills had installed some form of treatment. The enforcement of regulations has resulted in high compliance levels (83% of palm oil industries) with increasingly stringent efflu- ent standards (DOE 1989). There had been a significant reduction (97%) of the net organic load of effluent from 1985 to 1990, even though the industry has expanded. But its wastewater effluent is still known to cause significant organic pollution in ASEAN coastal waters. The combined wastewater discharges from the palm oil and rubber industries amount to 0.5 million &/day BOD. Approximatdy 2.5 t of effluent is dis- charged for every 1 t of palm oil produced.
Indonesia has been producing substantial amounts of palm oil (over 2 million t in 1988). Most mills are located in northern Sumatra, often in rural areas beside oil palm planta- tions. Because of poor water quality (i.e., high BOD concentrations) near milling operations, standards for BOD, chemical oxygen demand (COD), suspended solids (SS), oil, grease, pH and temperature have been established by the government. Enforcement, however, has not been as efficient as in Malaysia.
The best treatment methods for high strength palm oil wastewater involve anae- robic and facultative ponds. Although their overall performance is good, the resulting effluent still does not satisfy SS and nitrogen standards. The technology is land-intensive: thus, it may not always be practical outside rural areas. Malaysian authorities have set up a program to research further on palm oil wastewater treatment (ESCAP l982b).
Rubber Industry. The rubber industry is another significant source of organic waste. Rubber processing plants continuously
discharge high BOD and SS concentrations. Highly contaminated latex concentrates or large quantities of block-rubber effluent are produced, depending on the processing method.
In Malaysia, industrial effluent standards have been established and treatment sys- tems, installed. As a result, the net organic load from rubber effluents in Malaysia has been reduced by 80% between 1980 and 1985. Majority of rubber plants now comply with the standards, but pollution from rubber remains high, because of the uncontrolled discharges from a significant number of smallholdings.
Rubber plants in Indonesia, which pro- duced 1.2 million t in 1988, are also major dischargers of organic pollutants. Govern- ment standards have been established for parameters such as pH, BOD, COD, SS and ammonia nitrogen for both latex concentrate and dry-rubber processing. Although the pollution control technology is available and relatively inexpensive, mechanisms have been underdeveloped (SEATEC 1990). As with palm oil mills, most plants are located in rural areas near the rubber plantations.
Most rubber factories in Thailand are equipped with wastewater treatment facilities. The treatment technology for latex effluents. which are still thought to pose a serious envi- ronmental threat, is more sophisticated than for other types of rubber (SEATEC 1990). Waste from rubber plants, on the other hand. is treated biologically, mostly using anaerobic and facultative ponds. This system can reduce the organic load effectively and in- expensively, but it is limited to locations where land is available. There is ongoing research into mechanical treatment processes for use where land is scarce. Anaerobic filter beds, ratating biodiscs and aerated lagoons are currently being evaluated.
Sugar Industry. Sugar refineries and asso- ciated liquor distilleries are also major industrial sources of organic pollution. The manufacture of sugar produces large volumes of wastewater, which contains high SS and BOD levels. Sugar mills, which are located in rural areas, discharge untreated wastes into surface waters, or spread them on land with or without pretreatment to remove SS, oil and grease.

A notable exception is the sugar mill wastewater treatment facility in Thailand. Thirteen mills on the Inner Gulf of Thailand discharge their wastes into a centralized industrial treatment plant, which has an- aerobic and aerated lagoons as well as oxidation/polishing ponds. This centralized approach is effective; particularly since the sugar industry is seasonal. Plant wastes from other sugar mills are handled by local treat- ment systems, consisting of anaerobic ponds. followed by aerobic lagoons with mechanical mixing, and a polishing pond. The treatment capacity, however, is inadequate for condenser cooling water waste from cane sugar mills (Frankel et al. 1978; ESCAP l982a).
Traditionally, the sugar industry has been of major importance to the economy of the Philippines. Sugar cane production has been concentrated on the island of Negros, where close to 70°h of sugar-growing land in the country is located. Due to a mid-1980s drop in sugar prices, sugar land cultivation and mill operations have declined. The Philippines still produces over 1 million t of sugar, somewhat less than the total production of Thailand.
Intensive research has led to practical and economical approaches to sugar mill waste- water treatment. Although the availability and cost of land are a constraint, anaerobic digestion and/or aerobic treatment by acti- vated sludge have been found to be effective and economical (ESCAP l982a).
Mining. Various pollutants are released from mining operations. Cationic polymers are often added into settling ponds,'which lessen siltation problems from open rnines. ~lthough excessive polymer use can be toxic to fish, research has identifled effective poly- mer combinations that are not very haz- ardous (e.g., anionic polymers).
Pyritic hosting rocks in mines may generate sulfuric acid, the major cause of acid mine drainage. Acidic conditions promote leaching of heavy metals. Ore processing (e.g., flota- tion) uses toxic chemicals which can be released from the site. Nutrients (phosphorus from overburden and nitrogen from excessive use of explosives such as ammonium nitrate fuel oil [ANFO]) can also be released from mine operatio'ns.
Tin and gypsum mining usually involves hydropower washing and, therefore, releases extensive amounts of fine silts. To control silt release from mining operations, a series of settling ponds with long retention times are often installed, and wastewater recycling is sometimes also attempted.
Table 4 summarizes the major mining activities of four ASEAN member-countries in 1989. The quantity of rnine tailings varies widely, depending on site conditions. The order of magnitude of rnine tailings is shown as a percentage of production. Some items (e.g., tin and gypsum) are very difficult to estimate without knowing the site conditions and nature of mining operations.
Mine tailings are frequently disposed of in marine waters, e.g., in the Philippines, 50% of operating mines are located in the vicinity of coastal areas and use the sea as the final disposal site of mine tailings (Deocadiz 1990). Approximately 300,000 t/day of mine tailings are generated and about half are disposed of directly into marine waters. Some mining companies have established mine tailings dams which help control pollution, but these dams change river hydrology and eventually afTect the ecology of bays.
Offshore tin mining in Malaysia results in significant pollution because it releases excessive fine silts. Thailand also exploits off- shore tin deposits in its coastal waters. The concern over the high SS concentrations has led the government to establish water quality standards for Karon Bay (Paw et al. 1988). In Indonesia, coal-mining, which is expected to increase operations, causes pollution through solid waste discharges and siltation from erosion.
Other Industries. The lighters senring the ships off the coast of Singapore have been a major source of coastal riverine water pollu- tiop. They have been prohibited in Rochore, Kallang and Telok Ayer basins, and in Singa- pore River and Marina Bay (Chia et al. 1988).
Along the coast of the Inner Gulf of Thai- land, a number of factories discharge efflu- ents with high BOD. Tapioca flour mills alone are estimated to contribute 35% of the total BOD load reaching the Gulf of Thailand.
In Malaysia, the metal finishing industry poses severe pollution problems with dis- charges containing heavy metals. Although

Table 4. Major mining activities.
Tailings Indonesia Malaysia Philippines Thailand Item (t) (% of production) (1988) (1 987) (1988) (1989)
Bauxite 10 Coal 20 Copper 90 Iron 60 Gypsum Lignite 10 Nickel 90 Tln zinc 80 Gold= 100 S i l v e ~ 100
.In kg. Source: EPL (1990).
effluent standards are in place, the industry has displayed poor compliance (DOE 1989).
Old, abandoned car bodies are also a solid waste management problem in Brunei Darussalam because on average, each person in the workforce owns a car (Table 2).
Hazardous waste
The problem posed by hazardous wastes in Southeast Asia is not of the same magnitude as that in highly industrialized nations. Still, it is beginning to cause concern in concen- trated industrial zones such as Jakarta, Bangkok, Metro Manila, Kuala Lumpur and Singapore. The production rate of non- recyclable hazardous waste in the region is expected to grow rapidly with the current economic growth and increased industrial sophistication. All ASEAN member-countries are now preparing hazardous waste man- agement planning studies and formulating policies and strategies.
In Brunei Darussalam, small quantities of toxic wastes such as pesticides, spent sol- vents and oil production wastes are produced from current industrial and agricultural activities (De Silva et al.. this vol.). While some biomedical wastes are merely incinerated, most wastes may have been deposited in the completed or currently operating disposal sites; but their type and quantity are not known, nor how well- contained these wastes are.
Hazardous waste in Indonesia is becoming a serious concern, with the country's indus-
trialization and poor existing management practices. Authorities have been experiencing difficulty in imposing standards to control industrial hazardous waste (DOE 1989).
Regulations for hazardous waste control in Malaysia were drafted in 1988. As in other ASEAN member-countries, biomedical waste collection from small clinics and doctors' offices is a problem. Biomedical wastes from major hospitals are incinerated. These wastes were recently found to be responsible for the contamination of Juru River Estuary, which resulted in fish kill. Malaysla has been con- sidering centralized treatment and disposal facilities under private initiatives. The propo- nents of privatization, however, want to have government guarantee on the quantity of waste to be processed and disposed of at the facilities.
There are no centralized facilities for industrial hazardous waste treatment in the Philippines. These wastes are usually burned or incinerated, buried at the site where they are generated, or collected, then disposed of at municipal dumps, in drains or on open land. Waste exchange has been promoted by concerned agencies. The quality of the hazardous and toxic wastes produced is generally unknown, although the total annual generation is estimated at 100-190 million 1.
Some hazardous wastes and their sources include: heavy metal sludge from semi- conductor industries; high heavy metal con- centrations from geothermal plants; oil residues/volatile organic carbons from petro- leum industries; arsenic/sulfur oxides/other

heavy metals from copper roasting or smelt- ing processes; pesticide-loaded polyethylene bags from banana plantations; mercury from small-scale gold mining; chromium and other heavy metals from leather tanning and fin- ishing industries; wastes from agrochemical industries; and radioisotopes, patho- logic/infectious agents and other toxic chemicals from hospital/laboratory wastes.
In Singapore, hazardous waste manage- ment facilities are in operation at two landfill disposal sites and an incinerator plant. A number of chemical waste disposal contrac- tors process and treat hazardous wastes. Larger industries have in-house treatment, and some carry out hazardous waste recy- cling and recovery. Biomedical wastes from hospitals are disposed of in a dedicated incinerator, while the collection of those from small clinics is currently being studied.
The primary generators of hazardous waste in Thailand are manufacturing industries. electrical utilities, hospitals and laboratories. and coal/lignite-based industries. The pro- jected total volume of waste collected for 1991 was 1.99 million t (Thongkaimook 1990). In Bangkok, there has been a suc- cessful pilot project for the centralized treat- ment of spent chemicals, hydroxide sludges. mercury wastes and other hazardous wastes from small industries such as dyeing and electroplating factories. Yet, some problems with transportation and disposal sites are still unresolved (Phantumvanit et al. 1990). The BMA is planning to build an incinerator for biomedical waste disposal.
DISCUSSION
The current geographic, socioeconomic and waste management conditions of each coun- try are the bases of these conclusions:
1. Singapore's current and planned waste management practices are comparable with those of any indus- trialized nation. New initiatives have been considered to further improve efficiency and to deal with new chal- lenges. These include the Geographic Information System (GIs)-based tracking of hazardous waste move- ment; solid waste collection system
optimization; a centralized hazardous waste treatment and disposal facility; operation and maintenance (O&M) cost monitoring system for waste management facilities and activities; control of inflow and infiltration to sewerage systems; and stormwater runoff quality management.
2. Brunei Darussalarn has made good progress in sewage collection and treatment, but solid waste collection and disposal require further improvement. Solid waste collection activities are fragmented among sev- eral agencies. Landfill siting, design and operation do not meet the stan- dards of modem sanitary landfilling. A management plan for biomedical and other hazardous wastes has not been prepared. Since the country intends to diversw its industrial base, the envi- ronmental impact assessment (EIAI process for new industrial establish- ments needs to be streamlined and the implementation of EIA findings closely monitored.
3. Malaysia has been a leader in agro- industrial waste management in the region. Plans are largely in place and water quality monitoring programs have been established. The imple- mentation of plans, however, has been slow due mainly to insufficient funds. Sewage treatment in urban areas is urgently required.
4. In Thailand, 10% of the national pop- ulation and the major portion of industries are based in the Metro Bangkok area. Therefore, adequate waste management in this area is most important. Numerous studies have been completed but the imple- mentation of their recommendations has also been hampered by the lack of public funds. The BMA is contem- plating privatization of the required facilities.
5. In the Philippines, waste management in Metro Manila has been studied and some of the needed facilities have been installed (e.g., sanitary landfill). A number of other major urban cen- ters should be given attention, e.g.. Davao, Cebu. Cagayan De Oro, Iloilo

and Iligan. Wastewater treatment and prevention of unauthorized waste dumping are urgently required.
6. Indonesia's challenges are similar to those of the Philippines'. A national waste management plan needs to be developed.
In general, there is little or no sewage treatment at all in the region, except in Singapore and Brunei Darussalam. Solid wastes are often disposed of at open dumps. Proper sewage treatment and solid waste dis- posal should be a high priority in the gov- ernment agenda, considering the large exist- ing population and its projected growth.
Industrial waste management is neglected in rural and nontourist areas, as little or no data are available on the quantity or charac- teristics of either hazardous or nonhazardous wastes. Management should begin with a compilation of inventory data through waste audits. An industrial waste discharge permit system, which can identlfy the need for cen- tral facilities for industrial waste treatment and disposal, must be established and enforced. Such a centralized treatment dis- posal system should be considered for the region and subregions. Any nation hosting the facility could be compensated by user- nations.
Impact of sewage disposal on coastal areas
The impact of sewage disposal may be pre- sented in terms of the five-day biological oxygen demand (BOD,). Laboratory analysis results at Singapore STPs indicate that BOD, of raw sewage before treatment is in the range of 250 mg/l to 560 mg/l(405 mg/l on average) (Tan, this vol.). Average flow to the STPs has been measured at 300 lcd. Thus, average per capita BOD, loading of sewage generated in Singapore is 120 g/day or 43.8 @/year, the value also used in Brunei Darussalam. This is comparable to that of other industrialized nations. On the other hand, measurements taken of Malaysia's sewage show an average per capita BOD, loading of 50 g/day or 18.25 kg/year (PWD 1986). This value is used for Indonesia, the Philippines and Thailand.
The BOD, removal efficiencies for the two levels of treatment available in the region are
assumed to be 30% for primary (including functioning septic tanks), and 90% for secondary.
Table 5 presents estimates of the daily BOD, loading from sewage discharges in the ASEAN coastal areas in 1989 and 2000. Although further concentration of population in coastal urban areas and expanded sewage treatment senrices are expected in the year 2000, the current ratios are used to project the future impact. That is, the scenario shown in Table 5 for the year 2000 assumes that there will be no large increase in the amount or level of sewage treatment provided.
Solid waste generation and composition in the ASEAN region
Fig. 1 compares per capita waste genera- tion rates of various nations, including those of ASEAN. As shown. Singapore's waste gen- eration rate ranks second, next to Canada's. Brunei Darussalam's rate is also comparable to that of other industrialized nations, while the Philippines and Indonesia generate much lower amounts of waste than the rest. These rates, however, have been derived from the amount received at authorized waste disposal sites. As much as 35% of the solid waste gen- erated in some parts of the region is reported to be disposed of at unauthorized sites, and many areas do not have collection services.
Table 6 estimates the daily amount of solid waste arriving at authorized disposal sites. The waste generation rate in Singapore can be reduced through implementation of waste reduction and recycling programs. It will increase in other nations with expanded collection services and increased personal income. Nevertheless, the same rates are assumed to project the waste quantities in the year 2000.
The population in coastal urban areas is expected to increase faster than in other areas. But the current percent population in coastal areas is assumed to be maintained in the year 2000. Daily solid waste quantities received at authorized disposal sites in coastal areas in the year 2000 have been estimated under this assumption.
Like sewage and solid waste generation rates, the solid waste composition varies with

Table 5. Estimated BOD5 loading from sewage discharges in coastal areas.
Year/loading Brunei Indonesia Malaysia Philippines Singapore Thailand Total Darussalam
1989 Population (million) 0.25 184.60 17.40 64.90 2.70 55.60 325.45 Total daily BOD5 loading (t) 30 9,230 870 3.245 324 2,780 16,479 Population in coastal area (%I 85 60 65 70 100 40 Coastal population (million) 0.2 1 110.76 11.31 45.43 2.70 22.24 192.65 Daily BOD5 loading in coastal
areas ftl 26 5.538 565 2,272 324 1,112 9,837 second& treatment (%] Primary treatment (%) Daily BOD5 removal by
treatment (t) Residual daily BOD5 disposal (t)
2000 Population (million) Total daily BOD5 loading (t) Coastal population (million) Daily BOD5 loading in coastal
areas (t) Daily BODs removal by
treatment (t) Residual daily BOD5 disposal (t]
Source: Authors' estimates based on information obtained from country papers (this vol.) and interviews with local contacts.
Table 6. Estimated daily solid waste tonnage arriving at authorized disposal sites in coastal areas.
Brunei Indonesia Malaysia Philippines Singapore Thailand Total Darussalam
Per capita daily rate (kd 1.00 0.40 0.75 0.46 2.00 0.66 Population (million) 1989 0.25 184.60 17.40 64.90 2.70 55.60 325.45
2000 0.29 222.00 20.90 85.50 2.90 65.50 397.09 Daily quantity (t) 1989 250 73,840 13,050 29,854 5,400 36,696 159,090
2000 290 88,800 15,675 39,330 5,800 43,230 193,125 Daily quantity in coastal areas (t) 1989 213 44,304 8,483 20,898 5,400 14,678 93,976
2000 247 53,280 10,189 27,531 5,800 17,292 114,339
Source: Authors' estimates based on country papers (this vol.) and interviews.

United States
Australia
Canada.
Singapore
West Germany I I
1
Switzerland
Netherlands
Brunei Darussalam Japan
United Kingdom 1 7 Sweden
Malaysia
Thailand
China
Fig. 1. Solid waste quantities (kg/person/day) received at authorized disposal
Philippines
Indonesia
sites.
1 1
the disposable income level. More affluent societies tend to generate more paper and less organics. The composition data supplied by local authorities in Canada and the ASEAN member-countries have been regrouped into six common categories (Table 7).
Tables 8 and 9 present an increase in the estimated average daily quantities of the most common solid waste types received at autho- rized disposal sites in coastal areas in 1989 and 2000. These also show that the solid waste composition is dominated by organic (putrescible) materials and paper.
Apparently, opportunities exist for recycling of paper and composting of organics. although solid waste composting in various nations, including Thailand, has not been very successful. Separation of recyclables and compostables at the generation sources and securing markets are two key elements in developing successful programs, although sufficient subsidization is also required.
Substantial amounts of plastics are dis- carded as waste in the region, although they are retrieved by scavengers in the less afflu- ent member-nations. As the wastes have been sampled at authorized disposal sites only for composition analyses, plastic content in Table 7 does not include amounts blown
away or carelessly thrown in streets. water- courses and beaches.
BOD loading of industrial waste
In 1989, the Malaysian government esti- mated national organic pollutant loading from various sources in terms of BOD (t/day). as follows:
Domestic sewage 366 Animal husbandry 60 13% Manufacturing industry 2 1 5% Agro-based industry 11 2%
- Total 458 100%
A recent study in Thailand which estimated annual BOD loading from various industries is shown in Table 10.
The study could not obtain necessary data on other high BOD-loading industrial facili- ties such as noodle and soy sauce factories; palm mills; and fruit processing. monosodium glutamate and textile indus- tries. Thus, the actual industrial BOD loading would be higher than the estimates. Never- theless, the study projected that the BOD loading in the year 2000 would be more than twice the estimated 1990 loading due to the expected industrial growth in Thailand.

Table 7. Solid waste composition (%) of ASEAN member-countries and Canada.
Component Brunei Indonesia Malaysia Philippines Singapore Thailand Canada Darussalam
Paper 26 2 25 10 28 19 38 Glass 6 1 3 2 4 6 5 Metals 11 4 6 3 5 4 5 PIastics 13 3 8 9 12 10 9 Organics 41 87 56 70 44 55 34 Others 3 3 2 6 7 6 9
Source: Country papers and UNDP (1987).
Table 8. Estimated average daily quantity of solid wastes (t) received at authorized disposal sites in coastal areas in 1989.
Component Brunei Indonesia Malaysia Philippines Singapore Thailand Total Darussalam
Paper 55 886 2,121 2,090 1,512 2,789 9,453 Glass 13 443 254 418 216 881 2,225 Metals 23 1,772 509 627 270 587 3,788 Plastics 28 1,329 679 1,881 648 1,468 6,033 Organics 87 38,544 4,750 14,628 2,376 8,073 68.458 Others 6 1,329 170 1,254 378 881 4,018
Total 212 44,303 8,483 20,898 5,400 14,679 93,975
Source: Authors' estimates
Table 9. Estimated average daily quantity of solid wastes (t) received at authorized disposal sites in coastal areas in 2000.
Component Brunei Indonesia Malaysia Philippines Singapore Thailand Total Darussalam
Paper 64 1,066 2,547 2,753 1,624 3,285 11,339 Glass 15 543 306 55 1 232 1,038 2,675 Metals 27 2,131 61 1 826 290 692 4,577 Plastics 32 1,598 815 2,478 696 1,729 7,348 Organics 101 46,354 5,706 19,272 2,552 9,511 83,496 Others 7 1,598 204 1,652 406 1,038 4,905
Total 246 53,290 10,189 27,532 5, mo 17,293 114,340
Source: Authors' estimates
Table 10. Estimated industrial BOD loading (t) in Thailand.
1989 1990 2000 Industry Establishments Workers Loading
Sugar 508 30,443 140,700 302,200 Pulp and paper 234 17,849 93,200 217,900 Rubber 44 10,381 89.700 169,600 Beverages 3 1 17,376 84,000 163,000 Tapioca 142 14,249 36,700 81,300 Slaughter 57 5,018 14,900 19,400 Canned fish and crustaceans 50 5,902 10,100 19,400 Tannery 143 1,627 9,600 35,400 Canned h i t s and vegetables 13 1 51,597 3,500 5,200
Total 1,340 154,442 482,400 1,013,400
Source: Kritlpom et al. (1990).

In addition. 60% of registered industries are located in coastal areas in Thailand (i.e.. Bangkok Metropolitan Region and South Region). Thus, industrial BOD loading in these areas, estimated at 793 t/day in 1990. would be 1,665 t/day in 2000. This means that it would exceed the domestic sewage BOD loading in the year 2000 (Table 51. Sirn- ilar rapid growth in industrial BOD loading is expected in Indonesia and the Philippines. although the quantification is Wicult with- out the existing and projected data on high BOD-loading industrial activities. Therefore, the removal of BOD and other pollutants from industrial effluent should be required.
Hazardous waste
Table 1 P shows the results of a study com- pleted in 1989 on hazardous waste quantities in Thailand, which vary with the type of industry (MSTE 1989). It indicates that:
1. Over 60% of the total national haz- ardous waste is generated by the ba&c metal industry.
2. Over 95% of the total national hazardous waste is generated by industries, especially manufacturing.
3. The total quantity in the year 2001 would be about 5 times the 1986 quantity due to the projected rapid industrial growth.
4. Infectious wastes from hospitals and laboratories would increase by about 4.3 times the 1986 level in 2001 due to the improved health care system.
5. The hazardous waste generation rate of households would be greater than the projected population growth rate as the society becomes more affluent due to economic growth.
Singapore has discouraged hazardous waste-producing industrial establishments by imposing stringent waste disposal require- ments and hazardous waste transportation manifests. The countries' requirements have not been as stringent nor their enforcements as effective. Therefore, it is quite conceivable that Singapore's industrial hazardous waste generation rate would be less than that of Thailand.
Due to the lack of available data, the haz- ardous waste generation in the region has been estimated under these assumptions:
1. The industrial hazardous waste gen- eration rate per industrial manufac- turing GDP of other ASEAN member- countries, including Singapore, would be the same as that of Thailand.
2. The infectious hazardous waste gen- eration rate per doctor of other ASEAN member-countries would be the same as that of Thailand.
Table 11. Estimated hazardous waste quantity (t) in Thailand.
Industry 1986 2001
Basic metal 732,508 4,070,027 Fabricated products 132,868 393,896 Transport equipment 63,993 31,147 Electrical machinery 50,990 282,699 Chemical products 37,9 16 217,566 Machinery 30,158 166,627 Textiles 17,362 100,432 Printing/publishing 14,867 95,558 Rubber/rubber products 8,273 58,159 Paper/paper products 2,737 16,462 Petroleum products 1,978 12,431 Miscellaneous/necessities 1,821 11,861 Furniture/fixtures 1,092 11,381 Wood/cork 515 3,324
Total industrial waste 1,097,078 5,471,570 Hospital and laboratory waste 46,674 200,699 Household hazardous waste 11,787 3 1,093
Total hazardous waste 1,155,539 5,703,362
Source: MSTE (1989).

3. The household hazardous waste gen- eration rate per person would be pro- portional to per capita income.
4. Other MEAN member-countries would experience the same economic growth as Thailand.
Table 1 2 presents the estimated hazardous waste quantities generated in the region under the above assumptions. The required data for estimation are derived from Tables 2 and 11.
TECHNICAL OPTIONS FOR WASTE MANAGEMENT
Adequate policies and technologies for waste management in the region are those which lead towards sustainable development and which must be implementable and affordable.
Speciflc pollution problems have been identified and research effort has been focused on local technologies, which are cost- effective in the context of developing coun- tries. But the approach has been to adopt the standards and systems of more industrialized countries. A sustainable plan must first be defined to meet standards and objectives which are achievable within the locd condi- tions and circumstances. More stringent standards can then be established as the treatment and disposal technology is dev- eloped and tested.
The decision to apply a certain technology should depend on the following criteria:
the need to control pollution and the public's desire to obtain a certain service; its capability to meet the required standard; its affordability; the availability of the other required infrastructure. such as power, water supply and roads; operational capability of the user based on the thorough understanding of the technology; local availability of parts and materi- als for O&M and repair; and cultural conditions.
Domestic sewage
On-site Tredtment and Sewage Collection. Domestic sewage management consists of collection, treatment and disposal. Since the introduction of the first waterborne under- ground sewerage system in England in the 1840s. this system has become the standard collection practice in urban areas on the basis of overall economic, social and health benefits. It is, however, very expensive to build. The unit capital cost is estimated at. on average, $350/capita of service popula- tion, varying widely with the size of the facil- ity, local labor costs, terrain, construction material costs, etc. The cost, regardless of the local conditions, is onerous to most develop- ing nations, which is why only a few water- borne sewerage systems exist in the region.
The first step towards sewage management in a less aMuent society should be improve- ments to sanitation and the limitation of human exposure to waste. Appropriate indi- vidual or shared household systems include ventilated improved pit latrines, composting toilets and pour-flush toilets combined with septic tanks.
The advantages of these systems over tra- ditional latrines and sewerage systems are:
they are simple, reliable, hygienic and affordable (as low as 5% of the cost of a sewerage system); they can be constructed using local materials rather than imported ones. require little technical expertise for design and construction, and can be constructed by individuals or com- munities with only moderate pro- fessional help; they occupy little space, making them ideal for congested slum and squatter areas; they require little or no water (e.g., pour-flush toilets require around 2 1 per flush); central sewage treatment can be delayed; they can be upgraded to more elabo- rate systems; and they have proven to be acceptable to the people using them (e.g., India) (Kalbermatten and Middleton 199 1).
As water usage increases, especially when running water becomes available within

Table 12. Estimated annual hazardous waste generation (t).
Brunei Indonesia Malaysia Philippines Singapore Thailand Total Year/waste source Darussalam
1989 Manufacturing 121.793 716.212 502,689 788,594 59 1.053 1,097,100 3,817,441 Hospital and laboratories 646 104.201 27.064 40.881 13,547 46,700 Household
233,039 4 14 9.297 4,070 5.404 2,749 7.200 29,134
Total 122,853 829.710 533,823 834,879 607,349 1.151,000 4.079.6 14
2000 Manufacturing 572,498 3.366.605 2.362.928 3,706,843 2,778,286 Hospital and laboratories
5.157.000 17,944,160 2,518 406.093 105,476 159.324 52,796 182.000 908,207
Household 1,611 36,156 15,828 21,014 10,692 28.000 Total 113,301
576.627 3,808,854 2,484,232 3,887,181 2,841,774 5.367.000 18.965.668 --.--- Source: Authors' estimates based on MSTE (1989).
dwellings, the quantity of domestic sewage will increase to 200 &/day compared with 1- 2 kg of human waste without water supply connections. This increase will require more elaborate on-site treatment in the form of septic tanks and septic fields (underground soakaways). This type of treatment has encountered failures due mainly to inappro- priate design for adverse conditions (e.g.. high groundwater table and dense popula- tion) and inadequate desludging, wherein septic tank sludge is not pumped out on a regular basis and not properly treated in a central location prior to disposal. As a result, poorly treated effluent is discharged into open drains or forms pools on the ground surface. On-site treatment generally services a limited population and can be applied only where appropriate site conditions exist. It can also contaminate groundwater supply, if irn- properly designed.
Such situations can be corrected by installing a solid-free sewerage (SFS) system. This is a network of small bore pipes (often plastic) laid to carry the effluent from septic tanks to some point where it can be dis- charged into a trunk sewer or treatment plant. The SFS system can also be used with a simple interceptor tank to give primary treatment to ensure that all solids are broken down. This may not be significantly cheaper than conventional sewerage, but it is much more flexible or capable of adapting to changing circumstances. It can also be an option to a conventional sewerage system.
Highly polluted watercourses in the ASEAN metropolitan areas can be converted into combined trunk sewers by enclosing them. Interceptors can then be built to direct dry- weather flows to STPs. The enclosed water-
courses can be used as roadways to relieve traffic congestion, as in Korea. Chung-Gyae Creek in Seoul has been converted into a major trunk sewer and two level highways with 12 combined lanes.
A simplified version of the conventional sewerage system, pioneered in Brazil, can be considered as well. By allowing fewer man- holes, shorter design periods, smaller mini- mum pipe size and shallower cover, a capital cost savings of 40-50% can be realized over the conventional version, but it would have increased maintenance costs and a shorter life span (Kalbermatten and Middleton 199 1).
Lastly, an appropriate collectton tech- nology, which is important to limit human exposure to waste, should be selected to suit local conditions. Treatment. The collected sewage from large
service populations should always be treated. whatever collection system is used. This is because the amount of sewage that the envi- ronment can receive without the creation of objectionable conditions is limited. Estab- lishing those limits is of primary importance in determining sewage treatment and disposal requirements.
Treatment reduces the contaminant level of sewage so that it can be disposed of safely without significant environmental impact on either land or receiving waters such as rivers. lakes and the sea. Treated sewage undergoes further modification by natural purification processes.
An inexpensive treatment method is the use of natural or engineered wetlands (or marshes). Engineered marshes are self- contained water pollution control systems that use natural biological and physico- chemical processes to treat liquid wastes.

Plants and microorganisms growing in the aquatic media provide biological oxidation and adsorption of waste components using oxygen from the atmosphere through dis- solution at the surface and photosynthetic processes.
Aerated and facultative (aerobic-anaerobic) lagoon systems can be highly effective in treating sewage prior to disposal. These con- sist of large ponds created to retain sewage until it is biologically stabilized. They are designed either to achieve aeration through mechanical or diffused means (aerobic), or to obtain the necessary amount of oxygen from the surface adsorption and photosynthetic activity (facultative). When organic matter is biologically oxidized and SS start to settle, eflluent can be easily disinfected. Operation does not require high technological cap- ability.
Still, lagoon systems have disadvantages. These require more land than do fully mech- anized (activated sludge) plants. Also, facul- tative ponds give rise to odors.
Mechanical STPs are more expensive than other methods. These include all or part of pretreatment, primary, secondary and ter- tiary treatment processes, and disinfection (Fig. 2).
Raw waste 4 woter
Pretreatment consists of the screening out or comminution of solids such as paper, plastic, rags and wood as well as grit removal to protect mechanical equipment. Preliminary treatment alone has been considered sum- cient in some ocean disposal situations where a long outfall to deep waters removes the wastewater from the shoreline and where adequate mixing and dispersion exist. Float- ables such as oil, however, are not removed.
Primay treatment. A primary treatment plant generally provides preliminary treat- ment and clarification for the removal of floating and settleable solids. The solids so removed may be digested anaerobically or aerobically to improve their dewaterability. reduce their volume and make them relatively innocuous before ultimate disposal. Other primary sludge treatment methods include partial dewatering by filtration or centrifuga- tion followed by composting, incineration or burying.
Secondary treatment. Secondary treatment is mainly BOD removal from large sewage flows. A common method involving land and technological support is the activated sludge system. As shown in Fig. 2, the effluent from the primary settling unit enters an aeration tank where the organic component is bio-
Preliminary Primary Secondary
7-1 Grit removal I I Aeration Settling , tank Settling rank I I tank lank /
Screen ond/or
Waste sludge for treatment
Disinfection by ond dieposal
chlorination Tertiary
Fig. 2. Examples of wastewater treatment systems.
Effluent to -rece~ving
waters or lond
Chlorinator
a w 5 pJil;l, 1
Chlorine contoct tonk
A -

degraded by a culture of microorganisms. The effluent then goes to a secondary settling tank where the biological solids are allowed to settle. A fraction of the settled solids, or acti- vated sludge, is returned to the aeration tank. This sludge recycle is the key to build- ing up a large population of microorganisms (1,500- 10,000 mg/l).
The fixed bed contactor, trickling filter or rotating biological contactor (RBC) are alter- natives to the activated sludge system. The biological contactor contains natural or plas- tic media over which sewage flows. Biological growth forms on the surface of the media and oxidizes wastewater organics, which provide food for synthesizing additional biomass. Excess biomass sloughs from the media and is carried with the liquid to a final clarifier. Although more land-intensive than the acti- vated sludge process, the contactor is consid- ered a robust method because it is relatively easy to operate and it is less subject to pro- cess refinement to meet waste variations.
Some typical activated sludge processes and fixed media contactors are compared in Table 13.
Tertiary treatment. The effluent discharge from primary or secondary treatment plants into a river or lake can result in an increase in the concentration of nutrients which pro- motes growth of nuisance organisms. This is especially critical with respect to lakes, since these tend to age and accumulate nutrients through natural processes, and the introduc- tion of waste may greatly increase the rate of aging and enrichment. When lake enrichment
Table 13. Comparison of some reliable secondary treatment methods.
reaches critical levels. very abundant algae growths can rapidly turn the water into a green soupy slime, thus becoming aestheti- cally unacceptable and losing their recre- ational appeal. Tertiary treatment involves chemical feeding, rapid mixing, flocculation and sedimentation of the secondary effluent (Fig. 2). The chemicals commonly used are lime, alum or ferric chloride. Sometimes, a small amount of polyelectrolyte is added to improve the settling characteristics of the chemical precipitate. Most of the recent developments, however, have centered around removal of nutrients, particularly phosphorus and nitrogen.
Recently, biological means of nitrogen and phosphorus reduction have been successfully implemented in South Africa and Canada. This technology relies on the production of nitm@ng bacteria and bacteria capable of internally storing phosphorus. Removal of the phosphorus-storing bacteria and production of denitrification conditions reduce nutrient levels. Biological nutrient removal is usually achieved within the secondary treatment process.
Disinfection. Treated sewage, which may contain pathogens, is disinfected as a public health measure. For the routine disinfection of municipal wastewaters, chlorine has proven to be both effective and reasonably inexpensive. Chlorination, however, may make the effluent toxic to aquatic life, and dechlorination to reduce toxicity may be nec- essary. Ozone and ultraviolet (W) radiation are also effective but more expensive than
Criterion - - -
Acttvated sludge alternatives Air-activated sludge Oxygen-activated sludge RBC Trickling Glter
(Coarse bubble) (Fine bubble) (Surface aeration) (Cr~ogedc)
Energy consumption (kWh/kg BOD removed) Complexity of operation
Maintenance requirements Aerosol generaton
Technological sophistication
Relattve capital cost ratio Annual O&M cost ratlo
Moderate Moderate
Moderate Moderate to high Moderate Moderate
Proven technology Pmven technology: increasing use of low-maintenance dffiser with lower energy requirements
Moderate High (oxygen plant1
Moderate High High Nil (with gas
collection and combustion)
Proven technology Proven technology; pamcularly applicable to high- strength wastes
Low Low
Moderate Low Low Low
Proven technology; Proven technology particularly applicable to s m d - and medium-size plants (0.5-50 d o n l/day)
27 17 0.45 0.55
Source: Data h m UMA Engineerlng. Ltd.

chlorine because exceptionally low SS con- centrations are required for these processes to be effective. Table 14 compares various disinfection alternatives, and Table 15 com- pares the typical efficiency and relative costs of sewage treatment at different levels. Disposal. The STP effluent can be disposed
of on land or in receiving waters. The degree of treatment applied prior to disposal depends on the disposal location. The mini- mum treatment requirements for each method are typically:
spray irrigation or lakes after sec- ondary treatment: subsurface land disposal, rivers or streams after primary treatment: and open marine waters after preliminary treatment.
In many cases, a degree of treatment higher than the minimum is required for environmental or public health protection.
The most common and widespread land disposal method consists of subsurface drains laid in gravel trenches, preceded by a septic tank or small mechanical treatment plant. The success of these systems depends on the presence of permeable soils and low water tables, but even then, these are accept- able only for low population densities.
Another is irrigation by spraying or surface spreading at sufficiently low rates to prevent surface runoff and ensure that the applied effluent is purified by a combination of physicochernical and biological processes. Effluent irrigation is only possible when net evapotranspiration exceeds net precipitation. For the rest of the year, the effluent must be stored.
The STP effluent is commonly discharged into rivers and lakes, following a treatment level dictated by the degree of dilution and natural treatment available. and the existing and intended use of the receiving waters (e.g.. domestic water supply, shellfish harvesting. recreation, etc.).
Marine disposal through outfalls equipped with diffusers is often used in coastal areas. The successful design of a submarine outfall depends on the lmowledge of the characteris- tics and behavior of the receiving waters. The measurement and evaluation of the influence of tide, wind. wave and current should permit accurate prediction of any possible adverse
effects on recreational areas, bathing waters and shellfish growing areas.
Municipal solid waste
Minimization through the four Rs. Compared with those of industrialized nations, the solid waste generation rates of some ASEAN member-countries are lower and can still be decreased further (Table 7).
The focus of solid waste management in the region should be minimization of disposal needs through the four Rs: reduction, reuse. recycling and labor-intensive (not mechani- cal) resource recovery.
Reduction should be government-initiated. which may include: surtax on excessive packaging and problematic waste materials (e.g., plastic. tires and car batteries); ban on the sale of products using nonrefillable containers; subsidy for waste exchange; and consumer education.
The government should also create market- driven reduction programs to facilitate the participation of the industry and consumer market. But mechanized waste processing facilities for recycling and resource recovery should be avoided due to high costs and O&M dif3liculties.
The government and nongovernmental organizations (NGOs) should work together to organize community- or institution-based reduce/reuse/recycle /recover programs and educational campaigns. In Manila, for exam- ple. the World Ecologists Foundation has ini- tiated a recycling program for squatters along Pasig River.
Organic waste composting can be carried out by individual households or communities. With community-based composting, co-com- posting of sewage sludge and septage is pos- sible. For large-scale composting. markets for the recycled or recovered materials have to be secured. Subsidies for creating such markets should also be considered.
Incineration is an expensive reduction option. But the scarcity of land and public opposition to landfill siting (i.e., "not-in-my- backyard" syndrome) have made incinerators imperative in countries like Singapore. Fac- tors for consideration include: air emission quality: ash toxicity and disposal site; amount of noncombustible waste; energy
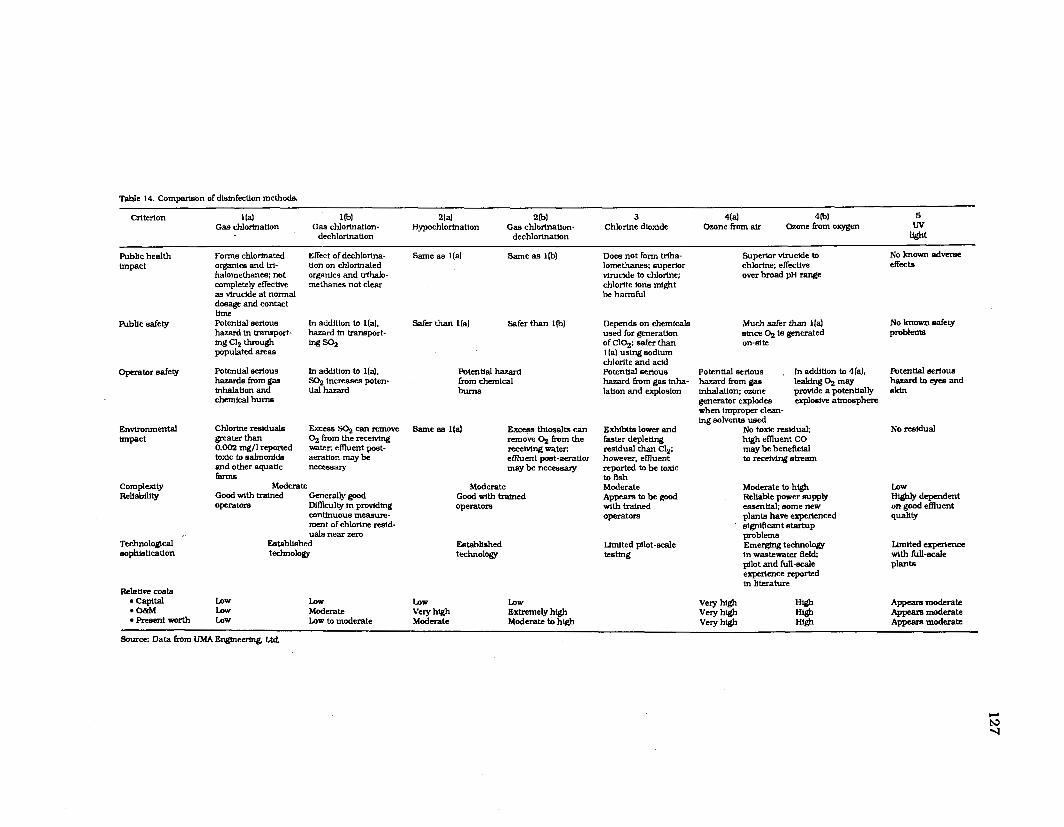
n h l e 14. Comparison of disinfection methods.
Criterion l(a) 1 bl 214 2bI 3 4(a) 4b1 5
Gas chlorination Gas chlorination- Hypochlorination Gas chlorination- Chlorine dioxide Ozone from air Ozone from oxygen W dechlorlnation dechlorination light
Public health Forms chlorinated Effect of dechlorina- Same as l(a) Same as l b ) impact organics and trl- tion on chlorinated
halomethanes; not organics and hlhalo- completely effective methanes not clear as vlrucide at normal dosage and contact time Potential serious In addition to l(a]. Safer than I(aj Safer than I@] hazard in transport- hazard in transport- ing C12 thmugh ing so2 populated areas
Public safety
Operator safety Potential serious In addition to lla). hazards from gas SOz increases poten- inhalation and tial hazard chemical bums
Environmental Chlorine residuals Excess FQ can remove impact greater than 0, from the receiving
0.002 mg/l reported water; emuent post- toxic to sahnonids aeration may be and other aquatic necessary f m s
Complexity Moderate Reliability Good with trained Generally good
operatom Mmculty ln providing continuous meamre- ment of chlorine resid- uals near zem
Technologlcd Established sophistication technology
Potential hazard from chemical burns
Same as l(a1 Excess thimalts can m o v e 02 from the receiving water, effluent past-aeratioi may be necessary
Moderate Good with trained operators
Established technology
Relative costs Captal Low
*o&M Low Present worth Low
Low Low Low Moderate very high Extremely high Low to moderate Moderate Moderate to high
Does not form trlha- lomethanes; superior virucide to chlorine; chlorite ions might be harmful
Depends on chemicals used for generation of C102; safer than l(a) using sodium chlorite and acid Potential serious hazard from gas inha- lation and explosion
Exhibits lower and faster deplethg residual than C12; however, emuent reported to be toxic to Rsh Moderate Appe- to be good with trained operators
Limited pilot-scale testing
Superior vlrucide to chlorine; effective over broad pH range
Much safer than Ila) since O2 is generated on-site
No known adverse effects
No known safety problerns
Potential serious . In addition to 4(a). PDtenUd serious hazard from gas leaking O2 may hazard to eyes and inhalation; ozone provide a potentially skin generator explodes explosive atmosphere when improper clean- ing solvents used
No toxic residual; No residual high effluent CO may be beneRdal to receiving stream
Moderate to high Loar Reliable power supply Highly dependent essential; some new on good effluent plants have experienced quality significant startup problems Emerglng technology Limited wcpe~lnrce in wastewater fleld; with full-scale plot and full-scale plants experience reported in literature
Appears moderate Appears moderate Appears moderate
S o w : Data from UMA Engineering, Ud.

Table 15. ?Lp)cal efflclency and mlatlve mst of different sewage treatment processes.
Degree of Recess SS Sewage treatmmt efticiency (% mmoval) Relatk cost ratlo tMtment components No chlorination With chlorination Total Total Capital Annual
BOD Collform BOD Collform phosph~ms nltfWen O&M
kmnar~ Screening, mmmhution and/or degritting 2 2 15-30 90-99
- a r ~ Sedimentation for settle- able solid removal 40-65 25-35 45-55 40-48 99.9+ 5-15 5-20 32 1.7
Secondary Primary treatment + mnven- tlonal acUvated sludge 85-95 85-95 90-99 88-96 99.99+ 20-40 20-50 55 1.4
Tertiary Conventional acthated sludge + post-semnd.xy tertiarymrks 90-95 90-95 95.99.9+ 92-96 99.999+ 80-95 25-55 65 1.6
Source: Data from UMA Engineering Ltd.
recovery in terms of electricity or steam; and O&M requirements. Residue Disposal. For some wastes, ocean
disposal may be economical and acceptable. But it should be taken as a last resort because waste is difficult to control in the mobile aquatic environment. Landfilling then becomes one of the more viable final disposal options.
Landfilling considerations include: prudent siting and impact prediction; modem opera- tion and monitoring; and engineering measures.
To avoid human health hazards and envi- ronmental concerns, the highest priority should be given to prudent siting, which can also substantially reduce the capital and O&M costs. A site underlain by natural impervious soils (e.g., clay) could eliminate the need for a leachate liner system. Wide natural buffer areas around a landfill could lessen problems associated with landfill gas, odor, aesthetics, noise and dust. Landfill owners should protect the buffer areas from being developed.
Modem landfii operation techniques (e.g.. maintaining a small working force and fre- quent covering) will allay worries regarding birds and rodents that scavenge in the sites, odor and litter. Also. a steady source of cover material and a dust/litter control program are part of the landfill operational plan.
To detect possible environmental problems, regular monitoring is necessary. It may trig- ger operational improvements and engineer- ing measures for environmental protection. These measures are to: extend a communal water distribution system to replace supply sources affected by landfill operation; con- struct surface- or groundwater barriers to reduce leachate production; provide a
leachate collection/treatment/disposal sys- tem; extend sanitary sewers to transmit leachate to an STP; install landfi gas vents, a gas collection and flaring system or an energy recovery system; establish erosion, sediment and surface water management systems to protect downstream water quality; and install noise berms and sight/wind screens.
Clearly, the shortcomings of a landfill site can be overcome by engineering measures but these entail an increase in capital and operating costs. There is no ideal or perfect landfill site, and trade-offs among potential sites must be weighed. The suggested siting and EIA process has four steps (Fig. 3):
The study area is screened using existing land use information to iden- tify "candidate areas." These areas are assessed to identlfy "potential sites" using aerial photo- graph interpretation and site capacity considerations. A short list of "candidate sites" is developed by eliminating those which have severe constraints relative to human health and the environment. The short list of sites is evaluated for social and economic considerations. To facilitate site selection, a frame- work is developed and the pros and cons of each candidate site are identi- fied. The site comparison is a qualita- tive assessment using a logic matrix based on risk assessment techniques.
Collection The most obvious MSW man- agement problem is not disposal or recycling but collection. The failure to collect the garbage in the first place results in "unaccounted-for garbage" (the difference between the amount of generated MSW and

Fig. 3. Landfill site selection process.
Study b o u n d a r y ~ area
....................... .................. :.:.:I%.,.. ....... ........ ............... Candidate
~ x t e r n o l 2 oreas Opportunities
Airphoto interpretation
Step 2 ( Identify ) Dotential
Site she
Potential sites
Step 3 Select Humon ha l th and
candidate safety concorns
Site life and capacity
what is collected), which is usually over 30% of the total. It accumulates in front of houses, on the streets, in side alleys, storm drains and open spaces. This attracts more rodents and insects, and obstructs drainage, which leads to flooding in monsoon climates. It contributes to the atmosphere of pervasive squalor which discourages people from mak- ing any attempt to help themselves, because the situation seems hopeless.
Attempts by developing countries to adopt the MSW collection system of industrialized nations have been generally unsuccessful. The technology is eventually found to be unsustainable, i.e., it suffers from high initial equipment costs, lack of skilled operators and maintenance mechanics, difficulties in obtaining spare parts, weak management and insdicient operating budgets. The region's
MSW contains a high proportion of organic materials and a high moisture content (even reaching a density of 400 kg/m3 in some countries as against the typical 100 kg/m3 in industrialized countries) (Kalbermatten and Middleton 199 1). The wet, dense waste is too heavy for compactor trucks designed for bulky, lightweight waste. In addition, a large number of people live in slum or squatter areas where road access is poor or non- existent.
The benefits of a low-cost, labor-intensive collection system should not be overlooked. It could include informal recycling that brings social, environmental and economic benefits to the community. Instead of being discour- aged, the ubiquitous private sector collection and scavenger activities in the region's cities should be given assistance. Comrnunity-

managed collection and recycling projects should be encouraged especially in inacce- sible squatter areas. These are means to improve environmental and health conditions within the community and to raise funds (through voluntary service) for the benefit of the community as a whole.
Collection systems (including equipment. vehicle routings and transfer points) can be optimized and monitored easily and inexpen- sively using personal computer (PC)-based GIs Software. Solid waste management expenditures can also be planned, monitored and controlled by simple and inexpensive PC software.
Agricultural and industrial waste
Singapore's "polluter pays" principle should be considered in industrial waste manage- ment. In Malaysia, it has been effective in substantially reducing pollution caused by agro-industries, which abided by a series of interim requirements through a phased pro- gram of pollution control measures (EMDI 1990). Table 16 shows gradual changes in palm oil mill effluent standards since 1978 (EMDI 1990). A similar approach has been taken for rubber plant effluent.
Industrial projects at the siting stage should be subjected to an EIA. Upon approval, monitoring and environmental law enforcement are essential. Thus, adequate agencies with skilled manpower and laborato- ries must be established.
Table 16. Malaysia palm oil mill effluent standards.
Sharing of common treatment facilities among industries should be encouraged for economy of scale. A successful example is the industrial treatment facility for sugar mills in Thailand. Nonhazardous Waste. Agro-industrial facil-
ities such as palm oil processing plants, sugar refineries and rubber plants produce high-strength organic liquid wastes. Some ASEAN member-countries, particularly Malaysia, have developed treatment technolo- gies that are relatively inexpensive and efficient.
Palm oil mill effluent is given p a a r y treatment by physicochemical methods (e.g.. gravity settling followed by air flotation) to remove oil, grease and SS as well as biologi- cal treatment to reduce BOD. The most com- monly used biological process in Malaysia consists of anaerobic and facultative ponds in series, which provides a retention time of 75- 120 days (EMDI 1990). This process. how- ever, requires that land be available. An alternative cost-effective method that is not as land-intensive is anaerobic digestion in a closed digester followed by oxidation in a deep oxidation ditch. In-house measures for water conservation and good housekeeping for the prevention of spillages and leakages are essential to reduce the pollution load from palm oil mills and other agro-industries.
Sugar cane mill effluent can be used for irrigation. The effluent, pretreated to correct the pH and remove oil and SS, can be applied on land used for sugar cane cultivation. Inadequately pretreated effluent, however. gives off odors (EMDI 1990).
Parameter Year enacted 1978 1979 1980 1981 1982 1984
BOD (3-day 30°C) 5,000 2,000 1,OOo 500 250 100 COD 10,000 4,000 2,000 1,000 Total solids 4,000 2,500 2,000 1,500 SS 1,200 800 600 400 400 400 Oil and grease 150 100 75 50 50 50 Ammonia nitrogen 25 15 15 10 150a lo@ Organic nitrogen 200 100 75 50 Total nitrogen 300 200a PH 5.0 5.0 5.0 5.0 5.0 5.0
9.0 9.0 9.0 9.0 9.0 9.0 Temperature ("C) 45 45 45 45
aDenotes the value of filtered sample. All units (except pH and temperature) are in @I. Source: EMDI (1990).

Because of the seasonal nature of the sugar industry, anaerobic ponds and an oxi- dation pond can be an economical treatment for effluent before discharge into surface water. In Thailand, a centralized treatment facility for effluent from 13 sugar mills (average flow of 3,000 m3/day) uses this approach to meet an effluent objective of 60 mg/l BOD (Frankel et al. 1978; EMDI 1990 and ESCAP 1982a). The facility has a total area of 155 acres, and is reported to have cost $1.6 million in 1979 (excluding land costs), with annual O&M costs of approxi- mately $425,000.
Where land is scarce and expensive, alter- native effluent treatment processes are closed digesters and/or direct aerobic treatment using the activated sludge process. The effi- cacy of the aerobic treatment is improved by the addition of phosphorus and nitrogen to the wastewater.
Rubber industries in Malaysia have imple- mented treatment facilities that comply almost fully with regulations. Anaerobic and facultative ponds are most commonly used. Alternatively, oxidation ditches are selected by factories with insufficient land, with higher operating costs. The capital and oper- ating costs of a pond system for a 20-t/day rubber plant were $27,600 million in 1975, and $120 million/month, respectively (EMDI 1990). Research into mechanical treatment processes is ongoing. Being evaluated are anaerobic filter beds, rotating biodiscs and aerated lagoons.
A recent study by the Asian Development Bank on agricultural waste recycling indi- cates that forced aeration cornposting is feasible for the treatment of animal manure, (e.g., from pig farms). Composting destroys pathogens and can be economically viable in developing countries. The compost can then be applied on high-value vegetable crops.
The biogas process, however, has not been found to reduce pathogens adequately. based on the experience of 600 backyard piggeries with biogas units ,in the Philippines. The O&M problems and the fact that methane gas cannot be stored, resulted in the resumption of commercial cooking gas use in almost all pig farms. Treatment systems that involve biogas production will likely be more suc- cessful in large facilities where all the gas produced is consumed.
The reduction of the load of toxic chemicals discharged into the environment from agri- cultural practices can be achieved by pro- moting the use of organic fertilizers and reducing or removing subsidies on chemical pesticides and fertilizers.
To minimize erosion and subsequent silta- tion in watercourses and coastal waters, land-clearing practices should be controlled and monitored. Guidelines and standards for erosion and siltation prevention should be developed and implemented.
Petroleum refineries in the region should provide adequate oil separation as a mini- mum treatment requirement. This is gener- ally considered the baseline treatment level in highly industrialized countries and may be the only treatment in others. To control other effluent components, secondary treatment may be required. Biological treatment can be used to remove phenols and BOD. There are more advanced treatment such as filtration, carbon adsorption and metals removal, depending on the uses of the receiving water (e.g., shellfish production and drinking water supply).
Hazardous waste
The first step towards hazardous waste management (I-WM) is to deflne hazardous waste through legislation. It can be based on its characteristics (i.e.. ignitable, reactive. corrosive, infectious and radioactive) or its sources (e.g.. primary metal industry; organic chemicals, pesticides and explosives indus- try; electroplating and metal surface finishing industry; inorganic chemical industry, etc.). The former approach requires extensive labo- ratory work for accurate characterization. The latter is simpler to administer, but it does not exclude outright the nonhazardous waste from some sources. A practical definition of hazardous waste in ASEAN member- countries with limited laboratory facilities can be formed based on lists of hazardous wastes originating from nonspecific sources (e.g., wastes containing polychlorinated biphenyl [PCB]) and specific sources (e.g.. sludges from re-refining used oil products). For example, Malaysia uses a list called "scheduled wastes." The onus of proving that a sched- uled waste from a specific source is non-

hazardous should be placed on the waste generators.
The HWM methods include: reduce waste through a change of process and primary materials; separate and concentrate wastes into manageable quantities; exchange wastes among industries; recover energy or material; use chemical. biological or physical treatment i . . high temperature incineration, neutralization, oxidation, reduction, disinfection, etc.); and install a secured landfill.
The cooperation of government agencies and private industries is necessary for HWM. Centralized treatment and disposal facilities, which may be owned and operated by a qual- ified member of the private sector, is more efficient than a fragmented system. For its part, the government must demonstrate its strong will to establish and enforce the necessary regulations.
Mobile processing/destruction technologies for hazardous waste have been developed and tested in highly industrialized nations. These would be an attractive option for the region. considering the small amounts of hazardous waste generated in scattered areas. In addi- tion, tracking of hazardous materials move- ment should be carried out on an interna- tional level. Singapore's manifest system for hazardous material generation and trans- portation, which may be further improved by applying GIs technologies, may be adopted for this purpose.
CONCLUSION
. The relative magnitude of the environmen- tally related social and economic problems in MEAN member-countries may be greater than those in more industrialized countries. Nevertheless, both have dealt (or are still dealing) with waste management dilemmas that are no difTerent from each other in many respects. The tasks that await ASEAN waste management are to:
establish the right priorities for waste management actions and where lim- ited resources should be assigned;
develop strategies that are most likely to be effective; enact and implement specific legisla- tion, in light of social and economic conditions that will make strategies work; source the funds or financial struc- ture that will support the strategies; and search for the expertise and technol- ogy to construct, operate and main- tain physical waste management facilities.
These challenges should be pursued in "bite-size chunks" to avoid being intimidated by the problems, which could induce lack of focus and direction.
GENERAL RECOMMENDATIONS
The coastal areas of the region have been adversely affected by inadequate waste man- agement practices. Many coastal locations have become unsafe for water contact recre- ation, and the resource base for coastal area inhabitants (e.g.. fisheries and tourism) has also suffered. These areas are expected to deteriorate further due to population growth, increased urbanization and industrialization.
Recognizing challenges resulting from increasing waste generation rates. ASEAN member-countries have developed waste management plans for priority areas (e.g.. metropolitan areas, water villages, etc.) or on a national basis.
To facilitate plan implementation, skilled manpower should be developed (e.g., through more practical on-the-job training programs) and laboratory facilities updated.
Governments should create favorable envi- ronmental market conditions by banning problem products or imposing a surtax on them and providing subsidies for environ- mentally friendly products and services.
Governments should work hand in hand with environmental groups and other NGOs to promote public education and participa- tion, which could result in waste minimi- zation.
The effluent quality criteria should be technically achievable and economically

affordable. These should vary with the type of establishment (e.g.. landfills, STPs, the differ- ent industrial plants, etc.) and the quality of the receiving water. Inappropriate criteria can be counterproductive and tend to discredit the government's regulatory operations. Thus, a series of interim criteria with an ultimate goal would be ideal, as in the suc- cessful effluent control for palm oil mills and rubber factories in Malaysia.
Finally. ASEAN should consider achieving the same quality criteria among nations, sharing resources for training and research on waste management, developing coastal zoning for specific uses, regularly sharing experiences in waste management and mon- itoring the state of coastal zones afTected by urban, industrial and agricultural activities.
So far, ASEAN waste management plan implementation has been hampered by finan- cial, institutional and policy constraints. For instance, some political leaders still consider waste management and environmental pro- tection to be in conflict with industrial devel- opment and economic growth; thus, budget allocations are limited (only a small fraction of the budget is alloted for power, cornmu- nication and transportation).
Sewage
A well-planned staged implementation can restore deteriorated environmental conditions as long as there are strong political commit- ment and public support.
Although the benefits and total costs (over $400 million direct costs plus unknown indi- rect costs) of the Singapore River Cleanup Program have not been quantified, it appears that sufficient gains have been achieved to compensate expenditures made over the ten- year period between 1977 and 1987 (Leong 1988). The benefits include land value appre- ciation, increased confidence of foreign investors and reduced downtime of labor forces due to clean environment. The pro- gram also helped eliminate or minimize, the sources of pollution in Singapore (e.g.. squatters, street hawkers, lighters, pig farms and small industrial establishments).
A less aggressive approach, such as Korea's Han River Cleanup Program, can also be taken. In this case. many polluted river trib-
utaries were enclosed and converted into major combined trunk sewers. Interceptors were built to direct low flows to STPs. The top portion of the enclosed watercourses has been used as roadways. easing traffic con- gestion. In highly polluted areas such as Bangkok, Jakarta and Manila, this approach may be more cost-effective than that of Singapore's.
Low-cost sewer systems as tested in Brazil, combined with inexpensive and easy mainte- nance systems such as sewage lagoons and wetlands, are viable collection and treatment alternatives. A plan should be developed to secure lands at strategic locations for the construction of these land-intensive but effective options while they are still available at reasonable prices.
A s shown in Table 15, primary treatment is cost-effective (i.e., high pollutant removal per dollar spent). Progressive upgrading of sewage treatment should be considered to achieve high return for the limited funds available. A "triage" approach should be con- sidered to prioritize sewage treatment loca- tion and technology. Rivers and coastal waters should be categorized into three groups: problem-free, hopeless and recover- able. Treatment efforts should be concen- trated on watercourses with recovery poten- tial. Some may require more than primary treatment to achieve the desired level of recovery.
Sewage collection and treatment, or appro- priate on-site systems. depending on the density of development, should be required for any new development on a local area basis. Developers and facility users should be responsible for capital and O&M costs, respectively.
The use of the septic tank design standards should be strictly enforced for new installa- tions. A licensing system for contractors should be considered to impose accountabil- ity (e.g., cancellation of a contractor's license due to tank malfunction from improper design/installation). Regular removal of sep- tage from septic tanks, services of which should be paid for by owners. should be mandatory. The removal services can be pro- vided by a government agency or private companies under a contract with the agency. But septage disposal methods should be specified. While existing STPs frequently

receive such wastes, composting, incineration or land disposal are alternatives.
In rural areas, improved latrines or pour- flush toilets should be installed. The sewage lagoon or wetland treatment can be consid- ered for densely developed rural settlements.
In urban areas, phased sewerage systems should be installed as follows:
improve existing septic tanks, main- tain and impose tight control over new installations (Brunei Darussalam, Indonesia. Malaysia, Philippines and Thailand); install an SFS system for septic tank effluent where feasible (Brunei Darus- salam, Indonesia. Malaysia. Philip- pines and Thailand) ; enclose highly polluted urban water- courses and use them as trunk sew- ers where appropriate (Indonesia, Philippines and Thailand); construct interceptor sewers (Indonesia. Malaysia, Philippines and Thailand) ; install primary treatment facilities. including engineered marshes and wetlands (Indonesia, Malaysia, Philip- pines and Thailand); and convert primary to secondary treat- ment (Brunei Darussalam).
Solid waste
Waste minimization should be promoted, specifically through low-technology and labor-intensive means as well as the expan- sion of recycling industries in the region.
The installation of incinerators and mecha- nized resource recovery plants producing refuse-derived fuel or compost should be examined carefully, especially with respect to operational difficulties and the market for recovered energy and materials.
Collection systems adapted to local physi- cal and socioeconomic conditions (e.g.. roads. scavenging) should be developed. For instance, collection equipment may be locally manufactured. Collection services can also be improved using inexpensive PC-based GIs software. Landfill sites should be identifled system-
atically (Fig. 3). Good landfill sites, including adequate buffer zones, should be secured when they are available at reasonable costs.
Industrial and agricultural waste
Effective and practical technologies for the treatment of wastewaters from the main industries in Southeast Asia have been locally developed. These, however, are not extensively used. Partially treated or untreated wastewaters are still discharged into rivers and marine waters. Existing efflu- ent standards are not strictly enforced.
The implementation of waste management plans proposed in EIA documents for new industries should be monitored closely. Sharing of facilities and waste exchange among industries should be encouraged. This can be facilitated by actively pursuing the relocation of existing industries and estab- lishment of the new ones in industrial estates.
Centralized facilities for hazardous waste treatment and disposal should be considered for ASEAN member-countries, which should work together to promote waste exchange and keep track of hazardous materials movement. The host nation of such a facility should be compensated by user-nations on the basis of a preagreed formula. The privatization of such facilities would be possible only after demonstrating political will to enforce control regulations. An industrial waste discharge system, which should be established to quantify the type and amount of waste, can identify the need for a central industrial waste treatment and disposal system. Mobile processing and/or destruction units can be used when dealing with small amounts of hazardous waste in scattered areas.
The use of toxic chemicals in agriculture should be lhnited, Soil testing should be done to determine the need for fertilizers.
Lastly, preventive measures for erosion and siltation should be developed and enforced for all land-clearing activities.
COUNTRY-SPECIFIC RECOMMENDATIONS
Brunei Darussalam
Continue to expand sewerage services to less urbanized areas. Streamline the responsibilities of vari- ous agencies in solid waste man- agement.

Secure landfill sites in advance and control the land use in the sur- rounding areas. Implement erosion and siltation con- trol measures at all land-clearing sites. Closely monitor the implementation of the BSP environmental management plan. Improve waste management of water villages (e .g., Kampong Air). Consider the development of aban- doned autobody recycling industries.
Indonesia
Malaysia
Prepare a national plan for waste management, incorporating low-cost and easy-operation technologies. Prioritize the waste management plan with emphasis on major urban cen- ters such as Jakarta, Bandung and Surabaj a. Consider a phased implementation of the plan to ease the financial burden. Develop skilled manpower in the field of waste management. Build laboratory facilities for moni- toring purposes. Enhance public education programs for environmental awareness.
Continue to implement the national solid waste management plan called "ABC" (Action Plan for a Beautiful and Clean Malaysia). Develop a similar plan for wastewater management. Share the success in agro-industrial waste management with the other ASEAN member-countries. Pursue centralized hazardous waste treatment and disposal facilities as well as consider mobile units. Increase the budget for local govern- ments with respect to waste manage- ment by revising revenue-sharing formulae. Implement erosion and siltation con- trol measures at mining, land-clearing and construction sites.
Implement a PC-based management system for municipal O&M activities on a national basis. Improve waste management con- ditions in water villages.
Philippines
Prepare a national plan for waste management, incorporating phased implementation of low-cost, easy- operation technologies. Assign high priorities to waste man- agement in major urban centers such as Metro Manila and Cebu. Enforce industrial waste management regulations, even on those industries found in rural and nontourist areas (e.g., mining and agro-industries) . Develop and implement a public edu- cation program for environmental awareness.
Thailand
Concentrate on the improvement of waste management in Metro Bangkok and surrounding areas. Closely monitor the waste manage- ment practices in large industrial estates and major tourist resort sites. Improve law enforcement capabilities.
Singapore
Singapore's waste management practices compare well with any industrialized nation. Nevertheless. further improvements on their efficiency should be considered.
Reduce inflow/infitration (I/I) to san- itary sewer systems through a sys- tematic rehabilitation program. Optimize solid waste collection sys- tems, including routing, equipment selection/replacement, crew size determination, etc. Track hazardous materials movement using computers. Monitor stormwater runoff quality for possible treatment.
ACKNOWLEDGEMENTS
The authors are grateful to Dr. Chua Thia- Eng of ICLARM and Mr. Ivan Ruzicka of ADB for the opportunity to prepare this paper. Dr. Chua's guidance and comments have been valuable in completing the paper. The fol- lowing individuals provided local data and opinions on waste management: Brunei Darussalam: Hj. Matdanan bin Hj. Jaafar and Dr. Ranjith de Silva, Department of Fish- eries. Ministry of Industry and Primary Resources; Hj. Samat bin Hj. Abas, Public Works Department. Ministry of Development; Hj. Mohd. Zakaria bin Hj. Serudin, Town and Country Planning, Ministry of Development; and Ms. Cynthia V. Agbayani, ASEAN/US CRMP. Indonesia: Dr. Charil A. Rasahan. Mr. Sukotjo Adisukresno, Mr. Boy Salirn and Mr. Ben Malik, Ministry of Agriculture. Malaysia: Mr. Tan Hoo. Ministry of Health; Mr. Kazal Sinha, Ministry of Housing and Local Gov- ernment; Mr. Zainal Rashid, Ministry of Rural Development; Mr. Hashim Darud and Ms. Zubaidah Abdullah, Department of Environ- ment. Ministry of Science, Technology and Environment. Philippines: Dr. Delfin Ganaph, Jr., Department of Environment and Natural Resources (DENR); Ms. Beta Balagot. Ms. Angie Brabante and Ms. Leza Alix Acorda, Environmental Management Bureau. DENR; Mr. Rogelio Oranza, Metropolitan Manila Authority; and Mr. Mario M. Fuentes, Metro Manila Waterworks and Sewerage System. Singapore: Mr. Koh Hee Song. Mr. Chia Kee Koon, Mr. Richard Lim, Mr. Loh Ah Tuan, Mr. Tan Eng Gee and Mr. Eng Tiang Sing. Ministry of the Environment. Thailand: Dr. Saksit Mdech, Mr. Sonthi Vannasaeng, Mr. Pomchai Taranatham, Mr. Adisak Thongkaimook, Dr. Sitiporn Kajor- natiyudh and Dr. Arnpan Pintukanok. Office of the National Environment Board.
The existing literature search and review has been assisted by: Mr. Len Garces. ICLARM; Dr. Clinton Edrnonds. Mr. Teny Higo, Mr. Pat Given, Mr. Tom Lidkea. Mr. Chris Lowe. Ms. Ann Wagener and Ms. Darylann Perry. UMA Engineering Ltd.; Mr. Grant Anderson. Mr. David Osmond, Mr. Paul Murray and Ms. Claudia Kauffman. Gartner Lee Ltd.; Dr. Peter Victor, Principal, VHB Research & Consulting Inc., Toronto.
Canada; Dr. Christine Furedy. York Univer- sity, Halifax, Canada; Dr. Shirley Conover, Dalhousie University. Halifax. Canada; and Mr. David Marshall, GLOBE '92, Vancouver. Canada.
Finally, the paper has been proofread and edited by Ms. Kathleen Callow and Ms. Carol Semeniuk. UMA Engineering Ltd. and Ms. Jane Shoemaker, Gartner Lee Ltd., Bumaby, Canada.
REFERENCES
ADB (Asian Development Bank). 1987. Handbook on the use of pesticides in the Asia-Pacific mgion. Asian Development Bank, Manila, Philippines.
BCME (British Columbia Ministry of Environment). 199 1. prog&un for participation: how B.C. is managing solid waste. British Columbia Ministry of Environment, Canada.
Branan, W.V. 1990. Management of coastal areas in Thailand: the Phuket special area management project in coastal management, desert &orestation and eco- logical farming: striving for sustainable development. Exchange of Environmental Experience Series 3. United Nations Environment Programme, Nairobi.
Chia, L.S., K. Habibullah and L.M. Chou. 1988. The coastal environmental profile of Singapore. ICLARM Technical Reports 21, 92 p. International Center for Living Aquatic Resources Management, Manila, Philippines.
Chua T.-E., L.M. Chou and M.S.M. Sadorra, editors. 1987. The coastal environmental proffle of Brunei Darussalam: resource assessment and management issues. ICLARM Technical Reports 18, 193 p. Fish- eries Department, Ministry of Development, Brunei Darussalam and International Center for Living Aquatic Resources Management, Manila, Philippines.
Cointreau, S. 1982. Environmental management of urban solid wastes in developing countries: a project guide. The World Bank, Washington, D.C., USA.
Coutrier, P.L. 1985. The environmental impact of marine and offshore activities in the Strait of Malacca, p. 142- 153. In P.R Burbridge, Koesoebiono, H. Dirschl and B. Patton (eds.) Proceedings of the Symposium on Environmental Research and Coastal Zone Manage- ment in the Strait of Malacca, 11- 13 November 1985. Medan, Indonesia.
DENR (Department of Environment and Natural Resources). 1990. Philippine strategy for sustainable development. Department of Environment and Natural Resources, Quezon City, Philippines.
Deocadiz, E.S. 1990. Status of marine pollution research in the Philippines, p. 145-158. In H.T. Yap, M. Bohle- Carbonell and E.D. Gomez (eds.) Oceanography and marine pollution: an MEAN-EC perspective. Pro- ceedings of the ASEAN-EC Serninar/Workshop on Marine Sciences, 12- 16 April 1987, Manila, Philip- pines. Marine Science Institute, University of the Philippines, Quezon City, Philippines.
DOE (Department of Environment). 1989. Environmental quality report. Department of Environment, Malaysia.
Dormer, W. 1987. Land use and environment in Indone- sia. C. Hurst & Co. and Institute of Asian Affairs, Hamburg.
Elkington, J. and J. Shopley. 1989. Cleaning up: U.S. waste management technology and third world devel- opment. World Resources Institute Report New York.
EMDI (Environmental Management Development in Indonesia Proiect). 1990. Indonesia industrial waste standards pGject. SEATEC International Company Ltd. for the Environmental Management Development in Indonesia Project. EMDI ~nviGnmental ~ e ~ o r t s 4. Dalhousie University Printing Center, Halifax, Nova Scotia.
ENRM (Environment and Natural Resource Manage- ment). 1989. Water resource management in Java. Indonesia Reports. Business and Economy Supple- ment No. 27.
EPL (Europa Publications Ltd.). 1990. The Far East and Australasia. 21st edition. Europa Publications Ltd., London.
ESCAP (Economic and Social Commission for Asia and the Pacific). 1982a. Industrial pollution control guide- lines 11: sugar industry. ESCAP Environment and Development Series, Bangkok, Thailand.
ESCAP (Economic and Social Commission for Asia and the Pacific). 1982b. Industrial pollution control guide- lines IV: palm oil industry. ESCAP Environment and Development Series. Bangkok, Thailand.
ESCAP (Economic and Social Commission for Asia and the Pacific). 1982c. Industrial pollution control guide- lines V: tapioca industry. ESCAP Environment and Development Series, Bangkok, Thailand.
FEER (Far Eastern Economic Review). 1991. Asia year- book 199 1. Far Eastern Economic Review, Hong Kong.
Frankel, RJ., H.J. Ludwig and C. Tongkasame. 1978. Case studies of agro-industrial wastewater pollution control in Thailand. In E.A.R Ouano, B.N. Lohani and N.C. Thanh (eds.] Water pollution control in develop- ing countries. Proceedings of the International Confer- ence on Water Pollution Control in Developing Coun- tries. 21-25 February 1978, Bangkok, Thailand. Asian Institute of Technology, Bangkok, Thailand.
Comez. E.D.. M. Hungspreugs. A.A. Jothy. K.J. Kuan, RS.S. Wu, A. Soegiarto and E. Deocadiz. 1988. Report on the state of the marine environment in the East Asian Seas region. UNEP Reg. Seas Rep. Stud., M a . . Philippines.
Kalbermatten J.M. and RN. Middleton. 1991. Future directions in water supply and waste disposal. Kalbermatten Associates, Inc., Washington, D.C. (Draft.)
Kent, G. and M.J. Valencia, editors. 1985. Marine policy in Southeast Asia. University of California Press, USA
Kritipom, P., T. Panayotou, and K. Charnprateep. 1990. The greening of Thai industry: producing more and polluting less. TDRI Res. Rep. No. 5.
Leong. F.C. 1988. Cleaning up the Singapore River: a Singapore experience in environmental protection and preservation. Ministry of the Environment, Singapore.
Loh. AT. 1988. Solid waste management in Singapore: a case study. Paper presented at the International Expert Group Seminar on Improving Solid Waste Management in the Context of Metropolitan Develop- ment and Management in Asian Countries, 5-9 September 1988. Beijing, China.
Lohani, B.N and N.C. Thanh. 1978. Water pollution con- trol in developing countries. In E.A.R Ouano, B.N. Lohani and N.C. Thanh (eds.) Water pollution control in developing countries. Proceedings of the Interna- tional Conference on Water Pollution Control in Devel- oping Countries, 2 1-25 February 1978, Bangkok, Thailand. Asian Institute of Technology, Bangkok, Thailand.
Ludwig. H.F., J.W. Evans and A. Pramunik. 1988. Swamp reclamation in tropical monsoon regions by appropriate refuse landfilling. The Environmentalist 8(4).
Maheswaran, A 1985. The food processing industry and the environment with emphasis on palm oil produc- tion. Ind. Environ. 8[4).
Manschot, C.A. 1991. Urban solid waste management systems for the city of Jakarta. York University, Ontario, Canada.
MSTE (Ministry of Science, Technology and Energy). 1989. National hazardous waste management plan. Engineering-Science Inc., Thai Doi Co., Ltd. and Sys- tems Engineering Co., Ltd. for Ministry of Science, Technology and Energy, Thailand.
NDPA (National Development Planning Agency). 1988. Action plan for sustainable development of Indonesia's marine and coastal resources. Canada/Indonesia Medium Term Planning Support Project. National Development Planning Agency, Indonesia.
Ouano, E.A.R. B.N. Lohani and N.C. Thanh, editors. 1978. Water pollution control in developing countries. Proceedings of the International Conference on Water Pollution Control in Developing Countries, 21-25 February 1978, Bangkok, Thailand. Asian Institute of Technology, Bangkok, Thailand.
Paw, J.N.. S. Bunpapong, A.T. White and M.S.M. Sadorra, editors. 1988. The coastal environmental profile of Ban Don Bay and Phangnga Bay, Thailand. ICLARM Technical Reports 20, 78 p. International Center for Living Aquatic Resources Management, Philippines.
Phang, S.-M. 1990. Algal production from agro-industrial and agricultural wastes in Malaysia. Arnbio 19(8): 4 15.
Phantumvanit, D., P. Kritipom and T. Soponkanaporn. 1990. Business and environment in Thailand. Thai- land Development Research Institute, Thailand.
PWD (Public Works Department). 1986. Kampong Air Waste Management Study. Scott & Furphy Consulting Group for Public Works Department, Ministry of Development, Brunei Darussalarn.
PWD (Public Works Department). 1990. Kampong Air Solid Waste Pilot Profect. Eval. Rep. No. 3. Scott & Furphy Consulting Group for Public Works Depart- ment. Ministry of Development, Brunei Darussalam.
Ruddle, K. 1981. Pollution in the marine coastal envi- ronment of ASEAN countries, p. 136- 176. In L.S. Chia and C. MacAndrews (eds.) Southeast Asian seas: fron- tiers for development. McGraw-Htll, Singapore.
Sakurai, K. 1990. Improvement of solid waste manage- ment in developing countries. Japan International Cooperation Agency, Japan.
S a h , E. 1985. Towards sustainable development of aquatic resources, p. 3-7. In P.R Burbridge, Koesw- biono, H. Dfrschl and B. Patton (eds.) Coastal zone management in the Strait of Malacca. Proceedings of a Symposium on Environmental Research and Coastal

Zone Management in the Strait of Malacca. 11 - 13 November 1985. Medan, Indonesia.
SEATEC (SEATEC International Company, Ltd.) 1988. Environmental technology in developing countries. 1st ed. SEATEC International Company Ltd., Bangkok, Thailand.
Sicular, D.T. 1989. Scavengers and the development of solid waste management in Indonesian cities. Univer- sity of California at Berkeley, USA. Ph.D. dissertation.
Sicular, D.T., H. Poerbo and V. Supardi. 1985. Materials recovery as an alternative for solid waste management in Indonesia. Discussion paper.
Sivalingam, P.M. 1978. Biodegradation of palm oil sludge and its waste recovery as an energy source for animals and soil amendment. In E.A.R Ouano, B.N. Lohani and N.C. Thanh (eds.) Water pollution control in developing countries. Proceedings of the International Conference on Water Pollution Control in Developing . Countries, 2 1-25 February 1978, Bangkok, Thailand. Asian Institute of Technology, Bangkok, Thailand.
Sivalingam, P.M. 1984. Ocean disposal and land recla- mation problems of Penang, Malaysia. Conserv. Recycl. 7(2-4): 85-98
Soegiarto. A. 1989. The status of marine and coastal pollution in Southeast Asia, p. 71-75. In T.-E. Chua and D. Pauly (eds.) Coastal area management in Southeast Asia: policies, management strategies and case studies. ICLARM Conference Proceedings 19, 254 p. Ministry of Science, Technology and the Environ- ment, Kuala Lumpur; Johor State Economic Planning Unit, Johore Bahru, Malaysia; and International Center for Living Aquatic Resources Management, Manila, Philippines.
Soerjani, Mohd. 1984. Present waste management in cities in Indonesia. Conserv. Recycl. 7(2-4): 14 1- 148.
Sri Bebassari et al. n.d. Preliminary study of a waste dis- posal system for Central Jakarta. Agency for the Assessment and Application of Technology (BPPT). Indonesia.
Thongkaimook, A. 1990. Solid waste management sys- tem in Thailand. Ministry of Science, Technology and Energy, Thailand.
Triatmodjo, M. 1990. Regional approaches to controlling land-based marine pollution: the possible role of ASEAN in Southeast Asia. Dalhousie University. LL.M. thesis. Halifax, Nova Srotia, Canada.
Trivichien, S. 1988. Case study on composting of municipal solid waste in Bangkok. Paper presented at the International Expert Group Seminar on Improving Solid Waste Management in the Context of Metropoli- tan Development and Management in Asian Coun- tries, 5-9 September 1988. Beijing, China.
UNCHS (United Nations Centre for Human Settlements). 1991. Integrated planning and management of coastal zones. Paper presented at the Intergovernmental Meeting of Experts on Land-based Sources of Marhe Pollution, 6-10 May 1991. Halifax, Nova Scotia, Canada.
UNDP (United Nations Development Programme). 1987. The need for solid waste management. ASEAN Report. United Nations Development Programme, Thailand.
UNDP-WB (United Nations Development Programme- World Bank). 199 1. Sewage and wastewater manage- ment for urban areas in Thailand: sector development, May 199 1. Vol. 1. Main Report. United Nations Devel- opment Programme-World Bank, Thailand.
WE3 (World Bank). 1988. Indonesia: adjustment, growth and sustainable development, environment and natu- ral resource management, water resource manage- ment in Java. Business and Economy Supplement No 27.
White, AT., P. Martosubroto and M.S.M. Sadorra, edi- tors. 1989. The coastal environmental profile of Segara Anakan-Cilacap, South Java, Indonesia. ICIARM Technical Reports '4, 82 p. International Center for Living Aquatic Resources Management, Philippines.
Wisaksono. W. and J. Bilal. 1985. Oil contamination in the Straits of Malacca and Singapore. p. 154-164. In P.R Burbridge, Koesoebiono, H. Dirschl and B. Patton (eds.) Coastal zone management in the Strait of Malacca. Proceedings of a Symposium on Environ- mental Research and Coastal Zone Management in the Strait of Malacca, 11- 13 November 1985. Medan, Indonesia.
WRI (World Research Institute). 1990. World resources 1990-9 1. World Research Institute, United Nations Environment Programme and United Nations Devel- opment Programme, Oxford University Pmss, New York.

Incineration Technology and Refuse Disposal
THOR K. RAMSTETTER PAUL PHUA
fihtner (Asia) Pte. Ltd 36 Dructon Hill
Singapore 0208
RAMSTETTER, T.K. and P. PHUA. 1992. Incineration technology and refuse disposal, p. 139-141. In T.-E. Chua and L.R Garces (eds.) Waste management in the coastal areas of the MEAN region: roles of gov- ernments, banking institutions, donor agencies, pri- vate sector and communities. ICLARM Conference Proceedings 33, 218 p. Ministry of the Environment, and Canada-BEAN Centre, Singapore; Asian Devel- opment Bank, and International Center for Living Aquatic Resources Management, Philippines.
Households also generated hazardous waste such as polyvinyl chloride (PVC). batteries, fluorescent tubes, thermometers. solvents, paints and pesticides.
Large amounts of these refuse can be disposed of either by direct landfii or incin- eration with subsequent landfii of ash and other residues. But the method that is both environmentally acceptable and economically feasible is incineration.
ABSTRACT
INCINERATION TECHNOLOGY This paper focuses on incineration technology for
refuse disposal. Incineration reduces refuse volume. concentrates pollutants in refuse for safe processing and disposal, and generates energy. If properly implemented and complemented by recycling and source reduction, it would be the best method in solid waste disposal.
INTRODUCTION
Refuse disposal is a problem as old as civi- lization itself. Until recently, it was assumed to have disappeared as soon as the refuse went out of sight. With rapid industrializa- tion, however, some refuse became less disposable by natural means and toxic or environmentally risky in other ways. Their concentration grew with the size of industrial units and the complex specialization of the industrial sector.
The minimum req~irements for the proper combustion of organic materials are a furnace and a boiler. Regulations require that particles and gas streams be exposed at least 1 second at temperatures of 850°C and above.
About 6 t of refuse per hour and unit, or ideally, a minimum size of 10 t/hour is needed for workable relations among length. width and height in the combustion chamber of the incinerator. This capacity requirement, however.
excludes practically all so-called compact incinerators, the dimensions of which are too small to meet the minimum safe combustion requirements.
Where large amounts of refuse are not available, it is advisable for neighboring municipalities to join forces to build a regular plant rather than a compact one.

A well-founded feasibility study should therefore be undertaken before decisions regarding the main parameters of an inciner- ation plant are made. Factors include:
amount of refuse to be incinerated; projection of amounts over the lifetime; heating value of refuse; projection of heating value; present and future flue gas cleaning requirements; site location and infrastructure; and traffic schemes, etc.
Baseline information is always more accu- rate than projections, so refuse composition should be investigated thoroughly as it may vary substantially between different areas. When projecting refuse parameters into the future, potentials of source reduction and residue recycling should also be considered. At this stage, learning from the experience of others can help avoid mistakes which other- wise can be corrected at high cost during project implementation.
POLLUTANTS AND RESIDUES
In recent years, the discussion on refuse incineration has generated heated arguments that are not very well substantiated. A look at the pollutants in the refuse and their status after incineration is thus in order. Their average values are as follows:
Chlorine Sulfur zinc Lead Copper Nickel Cadmium Mercury
All these are still
0.5-1.0% approx. 0.1% 0.3-0.4% 0.2-0.3% approx. 0.1% approx. 100 ppm approx. 20 ppm 3-5%
found in the residue of the incineration process. Heavy metals are concentrated in the combustion residue. Chromium, copper, nickel, lead and zinc are found in the bottom ash; cadmium, zinc and lead in the fly ash. Mercury is concentrated in the reaction products of the flue gas treatment process like halogens which take
the form of salts, mainly chlorine, sulfur and fluorine.
Incineration is the best known method that concentrates the pollutants in refuse so they can be safely processed and disposed of.
Bottom ash that is free from fly ash and ferrous metals may be used as a base material for road construction or landscap- ing. Leachate tests however have shown that freeing heavy metals is very slow and takes place only to a minor degree.
Fly ash has to be disposed of at controlled landfills or stabilized by mixing with cement to control the leaching out of heavy metals. Another method now under trial in pilot plants is the vitrification of fly ash at temper- atures of 1,400 to 1,600°C. This destroys all potential organic pollutants and transforms heavy metals into salts for recycling and pro- cessing. The vitrified ash may also be utilized as construction material.
Using recently developed pilot plants to produce sodium chloride or chlorine from the reaction products of the flue gas treatment plants will reduce even further the residue from incineration. Using all methods avail- able can bring the ratio of residue to be landfilled down to 1% of the original waste volume.
Untreated organic pollutants, most promi- nent being dioxines and furanes. are reduced by about 80-90% during combustion. Using additional activated coke filters in the flue gas stream as tested in Europe will bring the reduction efficiency to near 95Oh and above.
ENERGY RECOVERY
Another aspect of incineration is energy. Many environmentalists considered the mass burning of plastic refuse a waste of resources. So they developed costly processes to recycle plastic waste. They also burned valuable fuel oil in power stations instead of using energy recovered in the incineration process. Energy from refuse is just as valu- able as that from fuel oil and it can provide between 3 and 5% of the energy demand of a society. Energy generated from food waste and waste paper is energy utilizing renewable resources.

IMPLEMENTATION SCHEDULE
Refuse incineration plants are large investments for municipalities concerned with refuse disposal. Therefore, the feasibility study as the initial stage should be done very carefully. It will take between six and nine months including data collection, depending on the availability of basic information.
Another six to nine months will be needed for the conceptual and detailed project design as well as the preparation of specifications for tendering.
Contract periods for incineration plants depend on size and conditions for the con- struction and vary between 30 and 42 months, exclusive of the periods for evalua- tion and decisionmaking, which are subject to administrative and political procedures.
However, once the need for an incineration plant is established, it requires a minimum implementation period of about five years from feasibility study to start of operations.
REFUSE MINIMIZATION AND DISPOSAL: THE GERMAN EXPERIENCE
In an attempt to curb the ever increasing amounts of refuse, the German anti-pollution law requires processes that generate waste (e.g., industrial and commercial) to submit to a series of questions before they are granted a license to commence or continue operations.
First, is it technically feasible or economi- cally viable to recover the refuse and can it be recycled properly and safely into other pro- cesses? If so, there will be no refuse since the residue becomes a resource for some other downstream process.
Second, if recycling is not possible, is it technically and economically feasible to avoid waste generation? If so, there will be no refuse.
Many processes, however, cannot control waste generation. But resource recovery and source reduction are also possible, within limits: some components of the refuse can be separated for recycling and reuse, thereby reducing its volume and toxicity.
In some cities of the Federal Republic of Germany, households separate recyclable products from domestic refuse, reducing the total household refuse from 15 to 32%.
Recycling, however, has technical and eco- nomical constraints. For instance, not all paper can be manufactured using recycled paper, nor can all glass be produced from recycled glass.
Clearly, the volume of refuse can be reduced by recycling and reuse, but there always will be a part that will have to be disposed of in a conventional way.
Third, can the refuse be disposed of with- out threatening present and future public well-being? If a safe and acceptable refuse disposal is not possible, the government refuses to grant the license to operate, or revokes it.
Incineration is one of the options that is both safe and acceptable. It treats refuse to reduce toxicity and the volume that goes into landfills, thereby minimizing the use of valu- able land for refuse disposal.
The future German law on refuse, for instance, intends to require refuse pretreat- ment before landfill disposal. Likewise, in other growing cities of the world where refuse transport and storage is extremely difficult. pretreatment is becoming more of a necessity.
CONCLUSION
Considering the present and future waste management needs, there is no way "back to nature". We must move "forward to nature" with a technology adequate for the protection of man and environment. Incineration, if properly implemented and complemented by recycling and source reduction, is the best available method today.

Session 3: Economic Implications and the Role of Political Leadership
in Waste Management
The Role of Political Leadership in Improving the Environment
FUUZENCIO S. FACTORAN, JR. Office o j the Secretary
Department ojEmfronment and Natural Resources Visayas Avenue, Diliman. Quezon City
Philippines
FACTORAN, F.S., JR 1992. The role of political leadcr- ship in improving the environment, p. 143-148. In T.- E. Chua and L.R. Carces (eds.) Waste management in the coastal areas of the ASEAN region: roles of gov- ernments, banking institutions, donor agencies, pri- vate sector and communities. ICLARM Conference Proceedings 33, 218 p. Ministry of the Environment, and Canada-ASEAN Centre, Singapore; Asian Devel- opment Bank, and International Center for Living Aquatic Resources Management, Philippines.
ABSTRACT
This paper discusses the importance of political will in improving the state of the environment. Laws, rules and regulations are strictly enforced by the government through the Department of Environment and Natural Resources (DENR). Using the Philippine Strategy for Sustainable Development (PSSD) as a framework, DENR irrplements programs to rehabilitate forest ecosystems as well as urban and coastal environments. Some of these are the National Forestation Program (NFP) and the River Revival Program, which use a multisectoral approach.
INTRODUCTION
The success of any human endeavor is often measured in terms of how much resis- tance an individual has to overcome to attain a given goal. More often than not, the triumph of hurdling the obstacles is as grandly celebrated as the object of success itself.
This is especially true in the Philippine set- ting, with its pluralism, newfound democratic space, institutions and the social ills that continue to haunt it. It was against this set- ting that environmentalism regained a voice. But even with its small number of advocates, it was a rough start for Philippine environmentalism.
First, environmentalism did not always dovetail what the working class thought their priorities then were. For many, these were as simple as bread on the table and a roof over their heads. To be sure, fresh air, clean rivers and lush forests were nice to smell and behold, but if these meant losing jobs due to plant closures or to timber concession can- cellations, then, environmentalism did not seem very appealing at all.
Second, environmentalism was still a novel concept in the legislative branch of govern- ment. Although it was seen as an undeniable virtue, it rarely made first cut when it came to determining budgets and prioritizing out- lays. In the light of these realities, it became clear that environmental rehabilitation and protection, at least in our country, could not be left to the edict of laws.
Further, our democratic and pluralistic traditions made it even clearer that the envi- ronment and natural resources sector needed a leadership to reassess and improve on envi- ronmental laws and create a climate conducive to their implementation, imple- ment them in no uncertain terms, and at the

same time, manage the changes that the enforcement of these laws would surely bring.
In short, it became evident that the progress of environmentalism in our country needed a political will that would try to pro- mote the concept among our people, despite conflicts of interest, general ignorance and an advanced state of environmental despoilation.
THE PHILIPPINE EXPERIENCE
The major concern of the new DENR in 1987 was the rapid destruction of the envi- ronment particularly evident in the state of the tropical rain forests. Consider these scenarios:
Logging has become a venue for graft and corruption since the end of World War 11, with every administration adding its own list of bootleggers to the roster of timber concession holders. Although there were responsible log- gers, the industry itself showed little sign of being policed by government, or by its own administrative body. After all, many of the loggers repre- sented the economic and political elite; and the industry could not be expected to muster enough will to reform itself. The former administration relied heavily on natural resource exports. especially timber, to sustain a mismanaged economy. The virgin forests were indiscrirni- nately being cut, with no apparent effort to conserve them for biodiversity and environmental management purposes.
from the problems of the timber industry. the uplands were also plagued by the massive migration of lowlanders due to the interaction of these prevalent socio- economic factors: the lack of a genuine land reform program, the persistence of feudalistic relationships in the rural areas and the general neglect of agriculture and croplands. By 1987, around 18 million Filipinos were already living in classified upland and forest areas, most of whom practised slash-and- bum agriculture or kaingin and gathered timber and other forest products.
Similarly, it was a case of inequities, num- bers and a lack of resources in congested urban areas. Squatters multiplied as a result of waves of migration from the impoverished rural areas. Shanty towns mushroomed and were often coddled because they were rich sources of votes. These settlements only served to tax the already stretched carrying capacities of the country's major urban cen- ters, resulting in such environmental crises as biologically dead rivers, heavy air pollu- tion, and solid waste disposal problems. In short, the situation in the urban areas por- trayed the classic dilemma of development versus environment.
Thus, the Aquino administration inherited not only a devastated economy but also a ravaged environment. Unfortunately, it also inherited a government machinery that was not equipped to deal with the realities of a despoiled environment nor to effect the badly needed immediate rehabilitation. The old Ministry of Natural Resources (MNR] was largely a regulatory organization. Environ- mental law enforcement, which is its princi- pal function, was left to an inefficient pollu- tion control commission. Moreover, environ- ment and natural resources were perceived to be two mutually exclusive concerns, which reflects a lack of understanding of the dynamics between them.
The old bureaucracy was also saddled with a highly centralized system of decision- making, command and resource allocation. which upheld the primacy of Metro Manila over the larger number of Filipinos living in the rural and upland areas. Thus, decisions that affected the lives of Filipinos living in a province a thousand miles away were still made in Manila by bureaucrats who were not necessarily familiar with that province.
These problems were so evident that among the first acts of the new administration was the reorganization of the executive line agencies.
CURRENT EFFORTS AND FUTURE DIRECTIONS
The reorganization of MNR into DENR was inspired, in large measure, by the Brundtland Commission Report, which called for sustain- able development. For its broader acceptance

by a high-consumption and natural resource- dependent society, DENR translated sustain- able development into the Filipino context, with its unique needs, problems, culture, resources and ecosystems. The DENR was then set to become one of the first imple- mentors of the principle of sustainable development in a third world developing country.
The Philippine Strategy for Sustainable Development
The rise of Philippine environmentalism provided the impetus for the rapid develop- ment of PSSD. Developed through the efforts of DENR and the broad cooperation of the private sector and the growing network of environmental nongovernmental organiza- tions (NGOs), PSSD provides a blueprint for the rehabilitation and development of the country's resource bases and ecosystems. This document represents the fmt triumph of political will as applied to environmental problems.
Decentralization
Another direct consequence of the reorga- nization was the decentralization of DENR to make it more accessible to the public. Thus. 85% of its funds were reallocated away from the central to the regional offices. Most of its better management and technical st& were deployed in the field. Provincial and commu- nity offices were created to extend the reach of the department. Also, the regional offices assumed many of the developmental and regulatory functions of the central office.
Policies and physical movement of person- nel and resources, however, are of little help if these do not support a vision. which should be carried through with the force of will. After all, the previous administration did not lack studies and policy initiatives, but it failed to move its policy agenda beyond paper, and on to the field.
Rehabilitation of upmd and forest ecosystems
Priority was given to the rehabilitation of upland and forest ecosystems. Considered the most important resource base. the forests
directly provide livelihood for at least 18 million Filipinos and indirectly affect the rest of the population through other related ecosystems such as croplands and coastal areas.
With PSSD, DENR began the systematic clampdown on illegal loggers, especially those hiding under the guise of legal timber conces- sionaires, and timber poachers. To begin with, checkpoints were established in areas where illegally cut logs may be transported to processing and marketing centers. Likewise. DENR monitored these centers for signs of illegal trafficking of timber from illegitimate sources.
Initial success prompted DENR to enjoin the citizenry to become watchdogs against illegal loggers, through an innovative and generous reward system. Further, illegally sourced timber being sold in the market were also confiscated. Overall, DENRs message was that illegal logging would not be a prof- itable undertaking in the long term.
The next step was the purging of unscrupulous logging concessionaires from the industry. In 1987. 36% of classified forest lands was under timber license agreements (TLAs). The number of large TLAs indicates that access to natural resources, then, was biased toward the elite. There were 137 TLA holders, some of whom were violating the terms and conditions of their respective licenses. Erring licenses were suspended or cancelled outright by DENR.
Consequently, in 1991, only 20?! of forest lands is under 63 TLAs. The number of TLAs is expected to decline further, with the shift of focus to the development of resource access and opportunities to upland dwellers.
At the same time, DENR paid close atten- tion to policy aspects that would help slow down the decimation of the remaining old- and secondary-growth forests. For example, a log export ban has been enforced to eliminate one of the principal reasons behind illegal logging and timber smuggling. Later, a lum- ber export ban would also be implemented to encourage the downstream processing of lumber into finished wood products within the country.
Policy initiatives in TLA regulation were also pursued. For example, the annual allow- able cut of these concessions was reduced by an average of 50%. to reflect the shrinking

timber resource base. With the advent of a Philippine Master Plan for forestry develop- ment, the policy of shifting timber production from old- to secondary-growth forests was also adopted to preserve the 900.000 ha of remaining virgin forests and their biodiversity.
Because loggers have started taking new environmental regulations more seriously, logging operations have slowed down to pave the way for resource base rehabilitation through reforestation.
The National Forestation Program
Political will was needed to implement reforestation for the following reasons. First. the government needed to borrow funds externally for such an undertaking. Second. the bias for government reforestation had to be overcome in favor of contract reforestation. Third, uplanders had to be convinced that contract reforestation was not another gov- emment scam or propaganda vehicle, but a genuine effort to improve their environment and give them better livelihood opportunities. Fourth, a constituency had to be built upon which the future of these restored forests can depend.
Thus, DENR's NFP, which is the primary vehicle for all reforestation activities, had to be reasonably successful in all four counts. On the first count, DENR's developmental efforts would be worthless without environ- mental integrity and natural resource sum- ciency. Consequently, the Asian Development Bank (ADB) was tapped for funding. Fortu- nately, ADB was. at that time, already recep- tive to the idea of funding environment- related projects, because of the growing political strength of environmentalism in the developed countries that fund ADB. Further, the Overseas Economic Cooperation Fund of Japan matched the commitment of ADB for this program.
Simultaneously, DENR had to promote the concept of contract reforestation (as against administrative reforestation) within the department and outside. Administrative reforestation, the strategy that has been used for the last half-century. was found wanting because it did not involve uplanders who could have been given interest in and stew-
ardship of the plantations. Contract refor- estation, on the other hand, had been tried on a limited scale, with mixed success.
With the funding and the strategy in place, the next step was to convince the uplanders that the program was sensitive to their requirements. The decentralization of DENR greatly helped in convincing them of tfie pro- gram's viability and in facilitating program participation, training and instruction, and the distribution of materials, the mobilization fund and other payments.
Lastly, the citizens themselves had to be convinced that planting trees is needed to secure the future of the nation. Thus, a con- stituency for the forests, and to a greater sense, for the environment could be built. The DENR started by launching a massive information, education and communication campaign for the restoration and protection of our forests and the environment as a whole. The NGOs which had effective grass- roots networks were tapped to spread the word rapidly in the hinterlands. The media had to be convinced that environment could sell newspapers and air time; nontraditional publics like the clergy and civic organizations had to be approached. Also. DENR had to sell the idea of NFP and good environment to offi- cials in the national government and the legislature.
In 1990, NFP reforested 191,663 ha of denuded forest area. resulting in net foresta- tion in the last two years--a feat achieved for the first time in Philippine development his- tory. In terms of employment, NFP has gener- ated an equivalent of one job for every hectare planted. This fact alone has enabled NFP to gain further credibility as a potent vehicle for upland development in the eyes of the uplanders, the government and the donor institutions. To prove this, the second NFP. which will have more resources. is under negotiation with ADB.
Of course, the problems in the uplands are far from over. Poverty, fflegal logging and kaingin are still around. This is why con- stituency-building is an important dimension in the palitics of environment and sustainable development. Since changes cannot be effected overnight, or even in five years, there is a need to develop a body politic that will continue to push the national leadership for the needed reforms, and the required will to

pursue them. This solid group of people will push for better environment with their votes. voices and checkbooks.
The NFP and the uplands, however, repre- sent only some of DENR's areas of concern. Others are the rapid growth of urban areas and coastal settlements, which have pres- sured DENR to apply the lessons of its upland experience to solving coastal and brown environment problems.
Urban and coastal environments
The problems in the urban and coastal environments represent the interplay of the same dynamics found in the uplands. This time, however, technology plays a major role. for the rehabilitation of these environments require major technological inputs which are often capital-intensive.
Many of the problems in urban and coastal areas are rooted in high population concen- tration and growth rate: the coastal cities. towns and villages contain nearly two-thirds of the population. Pressure on the coastal zone resources mounts as the demands of people that depend on them for life and liveli- hood multiply, as population levels increase and because of domestic sewage and indus- trialization in these areas.
As the ultimate repository of wastes, sedi- ments and other waterborne debris, the coastal zone represents a complex manage- ment challenge. Clearly, a common property management system must be created. The history of the deterioration of mangroves and coral reefs clearly illustrates the failure to define and implement an integrated man- agement system in these areas. In the early 1900s. mangroves covered an estimated 450,000 ha. The 1987-1988 spot satellite survey indicated that only about 149.000 ha of mangroves remain, or 33Oh of what they were at the turn of the century. Further, only about 40,000 ha can be classified as old- growth mangroves; the rest is residual.
The rapid destruction of mangrove resources reflects the past emphasis on the release of such areas for fishpond develop- ment. Like the forest resources, many of these fishponds are controlled by the economic and political elite.
The wave of environmentalism, however, has resulted in a more serious assessment of the ecological and commercial value of the mangrove resources. Adding pressure is the reduced viability of the municipal fishing grounds resulting from overfishing, pollution and the loss of breeding areas due to the destruction of coral reefs and coastal mangroves.
In response to the growing coastal crisis. the government created in 1988 an inter- agency coastal resources management com- mittee with NGO representation tasked with coordinating the rehabilitation, development and use of the country's coastal resources. Its positive developments include the:
ban on the conversion of thickly veg- etated mangrove areas into fishponds; ban on the cutting and debarking of mangroves for commercial purposes except those found in fishponds and commercial plantations; automatic reversion of abandoned or underdeveloped fishponds to public domain; issuance of certificates of stewardship over mangrove areas; and establishment of communal mangrove forests.
Moreover. DENR is undertaking mangrove reforestation through a component of NFP and the Fisheries Sector Program. which is also ADB-funded. There are also aquasilvi- culture pilot projects being launched with the Department of Agriculture.
As in the uplands, DENRs work is harn- pered by a general lack of public appreciation for the importance of maintaining sound coastal ecosystems. Therefore, a lot of exten- sion work, education and community orga- nizing has to be done before community management of resources like mangroves can be fully implemented.
In the urban areas, focus has been directed toward the ellmination of industrial and domestic waste discharge in major urban waterways. Priority has been given to the River Revival Wograrn, a cleanup of Metro Manila's heavily polluted waterways.
The flrst cleanup project involves the Navotas-Malabon-Tullahan-Tenej eros system. the largest river system in northern Manila that empties directly into Manila Bay. Similar

to the multisectoral approach used in imple- menting NFP. DENR sought the cooperation of local groups such as the citizenry, civic organizations like the Rotary Club, industrial plants situated on the river banks and large corporate sponsors whose interests also lie in the river system.
Again, DENR was able to get broad support from these groups, even when it was ordering the closure of polluting firms in the area. resulting in a temporary loss of jobs among local residents. The acceptance was, again. due to the full force of laws, rules and regu- lations behind the closure. Thus, none of the firms could complain, since it was obvious that DENR was determined to carry out its job. In fact, even the main corporate sponsor of the program had one of its plants in the area closed, after it was found to be a major polluter of the river system.
Because a moral basis was established for the implementation of the program and the will to implement laws, rules and regulations was manifested. support began to well from unexpected quarters. The most noteworthy example is the banding together of local
industrial finns into an environmental NGO that will police industrial users of the river system for compliance with antipollution regulations.
CONCLUSION
The achievement of such self-policing speaks volumes for the potency of political will in moving environmentalism forward across many traditional social, cultural and economic barriers, which represent society's resistance to change. After all, environrnen- talism and sustainable development repre- sent new ideas, fresh conflicts. displacement and sacrifices. Thus, it is important to show through strength of will and the virtue of moral ground that the planned changes are imperative. As in any successful process of social transition and movement, the key ingredient is managing change. That, in sum, is what the use of political will is all about.

The Economics of Coastal Waste Management
K. DALE RUSSELL UMA Engineering Ltd
P.O. Box 655 5 14 Staord Dr. N. Lethbridge, Alberta Canada TI J 324
RUSSELL, K.D. 1992. The economics of coastal waste management, p. 149-163. In T.-E. Chua and L.R Games (eds.) Waste management in the coastal areas of the ASEAN region: roles of governments, banking institutions, donor agencies, private sector and com- munities. ICLARM Conference Proceedings 33, 218 p. Ministry of the Environment, and Canada-ASEAN Centre, Singapore: Asian Development Bank, and International Center for Living Aquatic Resources Management, Philippines.
ABSTRACT
This paper reviews the economic implications of waste collection and disposal practices in key coastal areas of the ASEAN region. Current financial commitments to waste management in urban centers are estimated, along with potential societal returns associated with increased commitments. Financial expenditures relative to the gross domestic product (GDP) are compared among countries.
Three beneficiaries of improved waste management practices, public health, fisheries and tourism, were con- sidered. Singapore is used as a standard of expected beneficial impacts. Although the trend in fish landings and tourist arrivals is increasing within the region, in- adequate programs will limit the potential of these acti- vities. Increases in income associated with the develop- ment of the manufacturing/service sectors, and the associated increase in urban populations, continue to pressure coastal resources at the expense of lower- income traditional sectors such as fishing.
The relative commitments of GDP to waste management programs indicate that governments have placed a higher priority on waste management than is apparent from current pollution loads. The solution to effective coastal waste management. therefore, is the
development of programs which will effectively utilize funds to reverse the continued deterioration of coastal resources. This paper includes a cost comparison of alternative solid waste and sewage treatment programs in the region.
INTRODUCTION
Proper disposal of household garbage. industrial waste and sewage is a major envi- ronmental problem in the world, particularly in the coastal areas of the member-countries of the Association of Southeast Asian Nations (ASEAN). Concerns vary from the identifica- tion of suitable land for disposal sites to the indiscriminate dumping of wastes into the seas or coastal wetlands. Further, increasing concentrations of urban population release sewage and nondegradable plastic refuse into coastal waters. The result is rapid coastal degradation, particularly adjacent to urban centers.
The purpose of this paper is to estimate the economic and financial aspects of waste col- lection and disposal practices in ASEAN key coastal areas as well as evaluate the eco- nomic merits of various waste management or mitigation strategies to identify the most socially costly problems and the most cost- effective interventions.

This paper should be read in conjunction with "Assessment of waste management in the A S W region" ( h e and Troxler, this vol.), which presents the existing waste manage- ment practices, issues, and alternative approaches to the resolution of the issues. This paper highlights their major findings and conclusions. Much of the information in this paper was generated through consulta- tion with various A S W country experts.
SOCIOECONOMIC OVERVIEW
Resources overview
The ASEAN region is highly oriented to its coastal resources, with approximately 70% of all human activities and, consequently. eco- nomic activities, existing within the coastal areas (Chua and Scum 1991). The total land area is 2.64 million km2 with 106,179 km of shoreline.
There are 325 million people living in the region with population densities ranging from 500 persons per hectare in Malaysia to 43.000 per hectare in Singapore. Currently
to of the ASEAN population is consid- ered to be in the workforce. Population growth rates vary from 1 to 3% per year.
Nearly one-half (46%) of the workforce is engaged in agriculture and fishing. In Indonesia, the proportion is 56%; in Malaysia. 31% and in Thailand, 57%. The GDP generated by agriculture, flshing and forestry is 26. 21 and 17%. respectively. and 19% for the MEAN region. These industries thus give a relatively low return, which, given the large number of people engaged, partially explains the income disparities within the region (Fig. 1). For example, 20% of the lower- income households in the Philippines account for 5% of all household income gen- erated, while 20% of the higher-income households account for 37% of all household income in the country. Typically, where income distribution is not as equitable as in industrialized countries', the lower-income sectors reflect agricultural, fishing and forestry incomes which contribute propor- tionately less to national income than the lower-income sectors in industrialized coun- tries. Consequently, there is implicit pressure to continue industrial development at the expense of these more traditional sectors.
- Jopon h Thailand
----- PhilippinedMalaysia j'
. . . . . . . . . . Indonesia
Singapore --+-- Conodo
0'- I I I I'
0-20 20-40 40-60 60-80 80-100%
Household income groups ( in quintile 1
Fig. 1. Income distribution in ASEAN member-countries, Japan and Canada
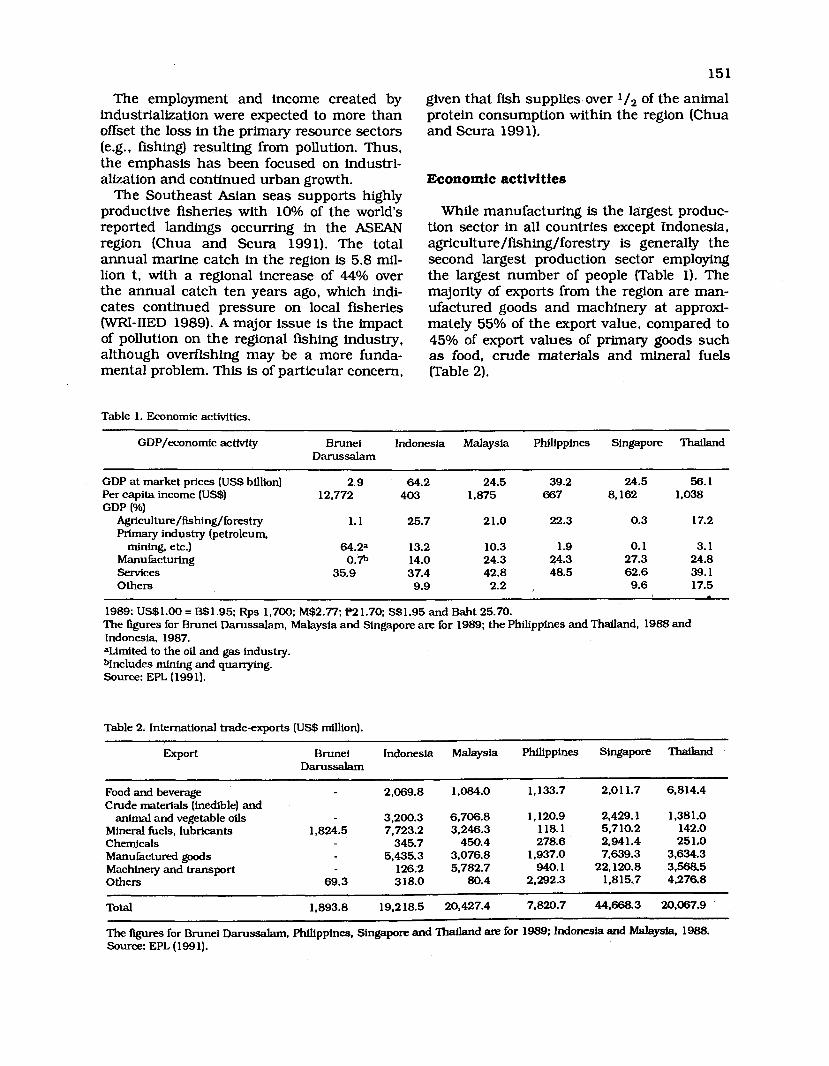
The employment and income created by industrialization were expected to more than offset the loss in the primary resource sectors (e.g.. fishing) resulting from pollution. Thus, the emphasis has been focused on industri- alfiation and continued urban growth.
The Southeast Asian seas supports highly productive fisheries with 10% of the world's reported landings occurring in the ASEAN region (Chua and Scura 1991). The total annual marine catch in the region is 5.8 rnil- lion t, with a regional increase of 44% over the annual catch ten years ago, which indi- cates continued pressure on local fisheries WRI-IIED 1989). A major issue is the impact of pollution on the regional fishing industry, although overfishing may be a more funda- mental problem. This is of particular concern,
given that fish supplies over I/ , of the animal protein consumption within the region (Chua and Scura 199 1).
Economic activities
While manufacturing is the largest produc- tion sector in all countries except Indonesia, agriculture/fishing/forestry is generally the second largest production sector employing the largest number of people (Table 1). The majority of exports from the region are man- ufactured goods and machinery at approxi- mately 55% of the export value. compared to 45% of export values of primary goods such as food, crude materials and mineral fuels (Table 2).
Table 1. Economic activities.
GDP/economic activity Brunei Indonesia Malaysia Philippines Singapore Thailand Darussalam
GDP at market prices (US$ billion) 2.9 64.2 24.5 39.2 24.5 56.1 Per capita income (US$) 12,772 403 1,875 667 8,162 1,038 GDP (%)
Agriculture/fishing/forestry 1.1 25.7 21.0 22.3 0.3 17.2 Primary industry (petroleum,
mining, etc.) 64.2a 13.2 10.3 1.9 0.1 3.1 Manufacturing O.* 14.0 24.3 24.3 27.3 24.8 Services 35.9 37.4 42.8 48.5 62.6 39.1 Others 9.9 2.2 9.6 17.5
1989: US$1.00 = B$1.95: Rps 1,700: M$2.T7; P21.70; S$1.95 and Baht 25.70. The figures for Brunei Darussalam, Malaysia and Singapore are for 1989; the Philippines and Thailand, 1988 and Indonesia 1987. aLimited to the oil and gas industry. bIncludes mining and quarrying. Source: EPL (199 1).
Table 2. International trade-exports (US$ million).
Export Brunei Indonesia Malaysia Philippines Singapore Thailand Darussalam
Food and beverage 2,069.8 1,084.0 1,133.7 2,011.7 6,814.4 Crude materials (inedible) and
animal and vegetable oils 3,200.3 6,706.8 1,120.9 2.429.1 1,381.0 Mineral fuels, lubricants 1,824.5 7.723.2 3,246.3 118.1 5.710.2 142.0 Chemicals 345.7 450.4 278.6 2,941.4 25 1 ,O Manufactured goods 5,435.3 3,076.8 1.937.0 7,639.3 3.634.3 Machinery and transport 126.2 5,782.7 940.1 22,120.8 3,568.5 Others 69.3 3 18.0 80.4 2,292.3 1,815.7 4,276.8
Total 1,893.8 19,218.5 20,427.4 7,820.7 44,668.3 20.067.9
The figures for Brunei Darussalam, Philippines. Singapore and Thailand anz for 1989; Indonesia and Malaysia. 1988. Source: EPL (199 1).

ECONOMIC AND FINANCIAL IMPACT OF WASTE MANAGEMENT
The continued environmental deterioration in the region is a result of urbanization. industrial development. excessive use of agri- cultural chemicals, inadequate design of intensive livestock facilities, overfishing and clear-cutting of forests. Given that the detri- mental impact of these activities is best miti- gated at their origin, waste generating sources are categorized as urbanization, agri- culture and industrialization. Approximately 80% of coastal waste problems in Malaysia are associated with domestic waste. Assum- ing similar conditions exist in other coun- tries, domestic waste is given emphasis in this analysis.
Urbanization
Urbanization promotes the concentration of people in small areas, which results in the generation of sewage, domestic solid waste and surface runoff from extensive roofs and paving. All major urban centers are located in coastal regions where large amounts of untreated sewage are either disposed of directly into coastal waters, or deposited into costal streams in such proximity to the coast that it precludes the possibility of streams assimilating the polluted discharges to acceptable levels before entering coastal waters. Currently, 80% of biological oxygen demand (BOD) loads are deposited in the coastal areas, although residual loads are expected to be reduced to 50% by the year 2000. Solid waste is incinerated. deposited in landfills, accumulated in the urban centers or, in some circumstances, dumped directly into coastal waters. Solid waste impacts on the coastal area by leaching from improperly designed inland landfill sites, stormwater runoff carrying debris from streets and vacant lots (e.g., 30% of Jakarta's coastal stream BOD loads are from solid wastes) and. obviously. from direct dumping into coastal waters. Currently 82% of the 94.000 t of solid waste generated annually in the coastal region is received at authorized disposal sites.
The current waste disposal practice in sev- eral urban areas of the region has an impact
on the immediate coastal waters which is significant, although limited to a radius of several kilometers from the urban centers.
Solid waste costs
Brunei Darussalarn currently spends US$1.3 million per year for operation and maintenance (0&M) of solid waste disposal programs for approximately 25% of the solid waste generated in the c0untry.l Other waste services such as the military, Brunei Shell and hospitals attend to the other 75%. Anticipated sanitary landfill costs over the next five years are $8.3 million and $14.6 million per year for capital and operating costs, respectively.
Indonesia collects about 80% of its solid waste. Approximately 30% of the organic load in surface waters within Jakarta is attributed to solid waste from direct dumping or leach- ing. Private collectors receive $8.50. $5.60 or $O.lO/month/household, depending on the nature of the household, for solid waste col- lection and disposal.
Most solid waste collection in Malaysia is through private contractors in the major urban centers. One of the problems is obtaining the financial commitment of urban squatters and rural residents. Total annual costs for solid waste management in 1974 were estimated at $4.00/capita in Irian Jaya. Incineration costs for waste disposal are $28/t and higher, with improved air emission controls, and $4/t for landfill disposal. Because of the solid waste composition, 30% by weight is unbumable; incinerated material would generate 10% of the current landfill volume. Consequently, 50% still requires landfilling, even with the incinerator program. Malaysia has rejected incineration because of the relatively high costs. The sum of $1.8 million/year is budgeted over the next five years to develop landfill sites, weighbridges and others for Kuala Lumpur.
The major problem facing urban centers in the Philippines, particularly Manila, is inade- quate roads, thus requiring small vehicles for collection and transfer of solid waste to land- fill sites (Gomez et al. 1990). The issue is one
Wosts are in US$ unless otherwise specified.

of improving the transportation system or increasing the number of landfill sites. Obvi- ously, improving the roads requires a much more comprehensive program than direct investment in waste disposal systems. Increasing the number of dumping locations creates the problems of "not-in-my-backyard syndrome, plus the increased costs associ- ated with landfill construction, operation and monitoring.
In Thailand, only 20% of total solid waste is collected for the entire country, with no col- lection services in the rural area and 84% collection in Bangkok. Costs for sanitary landfill and compost are estimated at $5 and $35/t, respectively. Estimated compost prod- uct value is $18/t at the compost site. Because of the technical nature of the com- posting machinery and the relatively high operating costs, the composting plants are currently operating at 50% of capacity. Total waste collection and disposal costs are esti- mated at $10/t. yet the householder pays $2.70/t or a total of $1 .%/year.
Singapore has developed a highly effective waste management system. Approximately 85% of solid waste is incinerated, with 28% of incinerator costs recovered from sales of electricity and recyclables. The rest of the solid waste and the incinerator ash are land- filled. Operating costs in excess of sales rev- enues amount to $47 million/year, or $17/capita/year. The capital investment in the incineration plants, transfer station and landfill sites is $200 million. Assuming a 15- year depreciation period. this is $13 rnil- lion/year. Efficient transportation systems and planned housing developments allow for large, emcient state-of-the-art collection, transfer and disposal systems.
Table 3 summarizes these statistics.
Table 3. Solid waste management statistics.
Sewage
Proper sewage disposal is a major concern in the region. Gomez et al. (1990) have stated that:
The most pronounced biological effects in the region are those resulting from organic pollution and eutrophication. Biological effects resulting from other types of pollution are much less obvious.
The major source of organic pollution in the region is sewage. much of which is discharged raw into coastal waters whether directly or through rivers and waterways.
All urban areas in Brunei Darussalam receive secondary treatment except Kuala Belait which has primary treatment and Kampong Air which has none. The new treatment plant planned for Kuala Belait will cost approximately $15 million (PWD 1986). Capital costs to collect and treat Kampong Air sewage are estimated at $13.5 million. A further $1.5 million is estimated for annual O&M costs.
To bring sewage services in Jakarta to North American standards will cost around $4 to 10 billion, which is $530 to $1,330/ capita. Indonesia is currently focusing on on- site industrial treatment and, of those industries contacted to implement it, 60% have voluntarily complied. Its progress. how- ever. is hampered by lack of registration. Of the estimated 25.000 industries in Metro Jakarta. only 3,000 are registered or have licenses to operate.
It will cost $738 million to implement sewage collection and treatment in major Malaysian urban centers, which will serve 40
Brunei Indonesia Malaysia Philippines Singapore Thailand Darussalam
Urban population (million) .17 48.0 6.1 26.6 2.7 9.5 Generation per capita
Per day (kg) 1.0 .4 .8 .4 2.0 .7 % collected 95 80 85 83 100 84 Current annual cost
per capita ($1 17 3 8 4 22 3
Sources: Lee and Troxler (this vol.) and in-country interviews.

to 50% of the population. The cost to retrofit an older area with sewer services is five times that of incorporating services into an area during construction. Capital investment estimates for septic services for rural areas and water villages are $185-370/household.
Metro Manila Sewage and Sanitation Pro- ject estimates are for expenditures of $726 million over the next ten years, or $72.6 mil- lion/year. Projected services are to upgrade and expand sewage collection and disposal from 745.000 to 875,000 people by the year 2000. Current annual O&M costs for 745.000 people is $2.6 million.
In 1976, at the start of the Singapore River cleanup program. 80% of the population was served by sewage collection and treatment facilities, and the services budget was approximately $5 million/year. In the last 20 years, Singapore has spent $46 million on capital investments and $40 million for O&M annually. The sewerage system now serves 97% of the households. This intensive pro- gram will continue to require high capital investments as older collection systems are replaced and facilities expanded to meet a projected population of 3.4 million by the year 2030.
Table 4 is a synopsis of sewage collection and treatment statistics.
POTENTIAL BENEFICIARIES OF IMPROVED COASTAL WASTE MANAGEMENT
Pollution costs are often considered a nec- essary cost of the industrialization/urban-
Table 4. Sewage collection and treatment statistics.
ization process. However, benefits, although often not readily measurable, do exkt such that effective waste management policies must be considered.
Ideally. the aim would be for a univer- sal catalogue of costs of potential pollu- tants, and for an inventory of all pollu- tion-generating activities as well as of the value of the benefits derived from them. However. there are only estimates of some costs in some circumstances, and somewhat subjective views of the bene- fits. The long-term, widespread effects in the marine environmerlt are not always evident, and this has led to the still not uncommon practice of using it as a "free" service with no defined limit to its capac- ity to accept wastes (GESAMP 1990).
Although the idealistic condition of quan- tifiable impacts on the various beneficiaries are not readily available, these categories indicate beneficial impacts of effective coastal waste management policies in the urban areas: fishing, tourism and health. Sustained biodiversity has not been included, as this analysis concentrates on urban activities which impact on localized coastal regions and, therefore, universal destruction of unique biota is unlikely.
Fishing industry
The region's bountiful coastal areas have, in the past, provided a resource base for an
Cost Brunei Indonesia Malaysia Philippines Singapore Thailand [$/capita) Darussalam
% population with access to sanitation services
Urban 85 33 100 83 100 78 Rural 38 60 56 46
Current annual costs (capital and O&M for metro center^)^ 7 28
Projected annual costs for the next 5-year perioda 25b 22 17 32
Total investment required to serve urban population within North American standards 100 930 120 0
aPer population sewed. bEstimated. Source: WFU-IIED (1989).

extensive fishing industry. Fish are directly consumed and bartered or sold commercially. Local concern is increasing as fish popula- tions in these areas have declined by as much as one quarter from precommercial fish population levels. A combination of increased human populations concentrated in urban areas and their associated pollutive actions. industrialization, and increased commercial fishing have led to this decrease. Manila Bay. which has been subjected to all these pres- sures, has just been closed to commercial fishing. Although this study focuses on the impacts of improper waste management practices, exploitative commercial fishing is a significant factor in the overall loss equation. Gomez et al. (1990) noted "a general decline in fmhery resources in the ASEAN region as a whole, mainly due to overexploitation."
Increased total revenues accruing to fish production is not an accurate measure of total societal gain from improved waste man- agement practices, as many costs, including purchased imports such as equipment and possibly fuel, are required to produce the harvest. Consequently, only returns to a country's basic resources of land, labor and capital as measured by GDP are used to measure the societal returns from fisheries.2
Estimated GDP associated with the marine fishing industry for the region is $4.891 million (Table 51.
Although the reduction in marine fishery adjacent to urban centers is significant, over- all, a small proportion of a country's coastline is affected by inadequate waste management in these centers. If coastal conditions were to improve, an increase of 10% in coastal
2See Appendix for GDP methodology.
Table 5. Fishing industry.
fisheries potential may be realized. Total GDP gain to the region would be $490 mfflion. There is no expected increase in fishing opportunities in the Singapore and Brunei Darussalam coastal areas associated with improved coastal waste management prac- tices.
Tourism
The region is a prime location for tourist development. Factors such as predictably warm weather, particularly during the north- em hemisphere's cool seasons; beautiful beaches; unique flora, fauna, wildlife and fish; and distinctive cultures are conducive to a strong tourism industry. The tourist, how- ever, is an elusive customer who is easily frightened off. For example, the Middl6 East war and the recent airline crash in Thailand have resulted in a large number of tourist cancellations. The tourist is also health-con- scious, as demonstrated by an incident in Malaysia. As a result of a press report of a cholera outbreak in a Malaysian tourist area last year, approximately 50% of local reser- vations by foreign tourists were immediately cancelled. Although there is an extensive coastal area to attract tourists within the region. much advertising and physical investment goes into developing an area for tourism. Good reputations come slowly and leave quickly. If an area becomes fouled, the recreation site cannot be automatically relo- cated. Instead, tourists are attracted to other competing geographic regions.
The number of annual visitors to the region is 20.4 1 million (Table 6). Visitors expected to utilize coastal/marine resources are 10.1 rnillion/year and they will spend $3 billion.
Brunei Indonesia Malaysia Philippines Singapore Thailand Darussalam
GDP ($ d o n ) 3 1,474 55 1 1.132 19 1,712 Length of coastline (kda 161 80,716 4.675 17,460 132 2.960 Average annual marine catch (thousand t)b 3 1.732 670 1,330 22 2.012
% increase in fisheriesc 73 73 33 14 31 42
Whua and Scura (199 1). bWRI-IIED (1989). c1983- 1985 compared with 1974- 1976.

Table 6. Tourism information.
Brunei Indonesia Malaysia Philippines Singapore Thailand Darussalarn
Number of visitors per year (million) .01 1.6 7.9 1.2 4.9 4.8
Coastal/marine tourists per year (million) .006 1.6 3.3 0.4 3.2 1.6
Expenditures by marine coastal tourists ($ million) 0 423 679.2 247 1,050 650
GDP ($ million) 0 224 360 131 557 345
Sources: WRI-IIED (1989) and Chua and Scum (1991).
The GDP associated with it is $1.6 billion, which represents 1% of regional GDP.3
Over 50 % of respondents to visitor surveys in the Philippines rank friendly people and beautiful scenery as its most favorable attractions, and 40% of respondents ranked dirty environment and poor traffic conditions as the conditions disliked most (DOT 1989).
Given the tourists' aversion to poor envi- ronmental conditions and attendant health risks, a decrease of 20% in coastal/marine- based tourism may not be unrealistic. This would represent an annual loss of $610 mil- lion in tourist expenditures and $323 million in GDP for the region. Coastal waste man- agement practices do not limit tourism potential in Singapore or Brunei Darussalam and, therefore, losses have not been included for these countries.
Health
The oft-quoted factor influencing the need to manage waste is public health and safety.
sFor estimate of GDP coefficient, see Appendix.
It is also one of the most elusive factors to quantify. Four infectious diseases were selected as indicative of the environmental impact on human health, i.e.. cholera. dysentery, hepatitis and typhoid. Only their incidence is selected as an exposure indicator rather than the associated number of deaths. since death may reflect the subsequent health care rather than exposure. Other pop- ular health indicators such as expected life spans and infant mortality are considered as health care factors, rather than exposure indicators. Unfortunately, the incidence of these diseases is not available for some countries and only for the urban centers in others. Thus, data was extrapolated to reflect incidence throughout the respective coun- tries' populace (Table 7).
Caution must be used in cross-country comparisons of disease incidence, insofar as data were not derived from a common survey technique and the basis of reporting diseases will vary by country. However, the informa- tion has been included in this analysis as an indicator of regional gains to be realized through proper coastal zone waste manage- ment.
Table 7. Disease incidence per 100,000 urban population per year.
Disease Brunei Indonesia Malaysia Philippines Singapore Thailand Darussalam
Cholera 6.4 1 2a 6 6 . 5 1.1 6.3 Dysentery 7.2 200a 4 1 lOa 2 103 Hepatitis 20p lW 26 60a 4.5 50 m h o i d 6.8 loop 20 60a 4 50
aAuthor's estimates. Sources: In-country interviews: MHLG (1988) and De Silva et d. (this vol.).

The quantification of the costs of these dis- eases is further complicated by the fact that the incidence of exposure is higher among children than adults. Lost adult earnings would be one measure of detrimental health impacts, however, lost time by school chil- dren, costly medical services and adult home care are also important economic factors. Because of the extra health services required for children and the interruption in the edu- cational process, no differentiation was established for the economic consequences of disease exposure among various ages. It was also assumed that all socioeconomic levels of the population have a similar incidence of exposure.
Given the above assumptions, the national per capita GDP can be utilized as a measure of a person's contribution to the national economy. Arbitrary lost time allowances (year) made for each disease are as follows: cholera. .006; hepatitis, .loo; typhoid. .040; and dysentery, .006.
All reported incidence cannot be attributed to coastal waste management practices. although through comprehensive waste man- agement programs, countries such as Singa- pore have minimized exposure to disease. It is assumed that the regional disease inci- dence could eventually be reduced to that of Singapore, because of proper waste manage- ment. As exposure to disease is a result of a multitude of factors, the Singapore standard would be the maximum that could be reason- ably attributable to proper coastal waste management programs (Table 8).
Regional GDP associated with the reduc- tion in disease exposure can be up to $4.757
million/year. Much of Singapore's disease incidents are imported from the local region. Thus it is expected that the incidence in Sin- gapore will also decrease.
Multiplier impacts
Direct gains from improved waste man- agement practices in the urban centers in fishing, tourism and personal health are measured as increased GDP. Direct gains, however, underestimate the national impacts. as there are spinoff benefits from increased productivity, particularly in underemployed economics. The multiplier concept measures the extended impact as expanded fisheries purchase more boats and nets, and hire more employees. The multiplier is a measure of these increased economic activities. The GDP multiplier in more developed countries is 1.3 to 1.7 for primary sectors such as fishing, and 2.0 to 2.5 for manufacturing and service sectors which cater mainly to tourism activi- ties (SC 1987). For example. if GDP within the fishing sector increased by $1.00. total GDP within the country will increase by $1.30 to $1.70. which includes the $1.00 increase from the fishing sector plus $0.30 to $0.70 for GDP realized in the fishing supply sectors. Conversely, a loss in GDP will have the reverse multiplier impact.
If GDP multipliers of 1.5, 2.25 and 2.0 are assumed for fishing, tourism and health. respectively, total GDP increases associated with improved coastal management practices are increased from $702 to $1.2 17 million for the region (Table 9).
Table 8. Lost regional GDP due to disease incidence in urban population ($ million/year).
Disease Brunei Indonesia Malaysia Philippines Thailand Total Darussalam
Cholera 0.001 0.001 0.003 0.005 0.003 0.022 Hepatitis 0.03 1 1.595 0.185 0.892 0.436 3.138 Qphoid 0.002 0.641 0.055 0.360 0.176 1.235 Dysentery 0.001 0.198 0.001 0.104 0.058 0.362
-- -- - - - - -
Total 0.035 2.435 0.244 1.361 0.673 4.757
The above figures were computed as follows:
Per capita GDP urban population incidence time lost
100.000

158
Table 9. Multiplier impact on increased GDP ($ million).
GDP Brunei Indonesia Malaysia Philippines Singapore Thailand Darussalarn .
Fishing DI MI
Tourism DI MI
Health DI MI
Direct increase Multiplier impact
DI - direct impact Derived from Tables 5,6 and 8. MI - multiplier impact. This is a product of DIs and multipliers of 1.5. 2.25 and 2 for fishing, tourism and health, respectively .
Comparison of benefits and costs
Both costs and benefits are measured on an annual flow basis, i.e., what are the annual benefits accruing to waste manage- ment strategies and what are the annual costs of these programs? This approach is consistent with Singapore's experience. Singapore had invested heavily in waste management facilities prior to the 1976 Clean Rivers campaign. Investments for program maintenance and improvement at the conclusion of the project remain high. An overview of Singapore's national accounts and government expenditures does not indi- cate a significant increase in overall expen- ditures, government debt, nor a major shift in ministry budgets during the river cleanup campaign. The program was rather a focus of existing budgets to accomplish a specific goal.
Applying this concept of continued invest- ments to other countries, improvements in coastal waste management practices cannot be viewed as a lump sum investment, but rather as an ongoing change in philosophy with continual attention and investment in the coastal environment.
In keeping with the above philosophy, and using Brunei Darussalarn per capita expen- ditures as a regional standard, solid waste collection costs would increase for the other countries from current levels to $17/capita. Total annual increased costs would be $1,093 million for the region (Table 10).
Data for sewage collection and treatment costs are not complete. However, if average
increased expenditures of Singapore are extrapolated to Indonesia and Thailand. increased regional expenditures for sewage collection and treatment facilities will cost around $828 million. Total regional costs for solid waste and sewage collection and treat- ment facilities similar to that in Brunei Darussalarn for solid waste and Singapore for sewage treatment will cost $1.92 1 million.
The full impact from improved coastal waste management practices will not be seen immediately. In time, however, annual bene- fits for protection from loss of tourism. increased fisheries potential and reduced exposure to disease will be realized (Table 11).
Care must be used in interpreting the above, as not all benefits are quantifiable. e.g.. quality of life and environmental obliga- tion intangibles. The $1.2 17 million in poten- tial benefits cannot be ignored and cost- effective programs must be incorporated for some of these potential gains.
Affordability
Programs that. in the long term. are in the best interests of society often are impossible to initiate because of lack of finances. This is demonstrated by comparing per capita GDP with waste management expenditures. The per capita GDP for Singapore is $9,074, and current solid waste management and sewage treatment programs are costing $60/capita or approximately 0.67% of GDP.

Table 10. Increased waste management costs ($1.
Waste management cost Brunei Indonesia Malaysia Philippines Thailand Darussalam
Urban population (million] .2 4 1 5.7 26 9.3 Solid waste net costs per
capita (per year)a 0 14 9 13 14 Total increased costs to
serve urban population 0 574 51 338 130 Sewage collection and
treatment net costs per capita (urban) [per yea@ 3 6 11
Total increased costs to service urban population 1 413 34 286 94
a$17 less current expenditures per Table 3. b$28 less current expenditures per Table 4.
Table 11. Regional benefits (GDP $ million] from improved waste management.
Benefit Health Fishing Tourism Total
Direct annual benefits 5 486 212 703 Direct plus multiplier
benefits to local economy 9 73 1 477 1,217
Table 12. Percentage expenditures in GDP ($1.
GDP/expenditure Brunei Indonesia Malaysia Philippines Singapore Thailand Darussalam
Per capita GDPa 1 1,600 348 1,408 604 9,074 1,009 Current per capita
expenditure for waste managementb 42 2 1 30 2 1 60 21
% in GDP 0.4 6.0 2.1 3.5 .7 2.1
aEstirnated h m Lee and Troxler (this vol.). bPer Tables 3 and 4.
Estimated waste management programs in other countries, with the exception of Brunei Darussalam, vary from $21-30/capita; however. these programs are costing from 2.1 to almost 6% of per capita GDP (Table 12).
The answer to the affordability dilemma is to seek low cost, but effectite alternative waste management programs. Given the high rate of real growth, industrialization and urbanization in the region, a further delay of effective waste management programs will require more expensive solutions as the problems intensify. Therefore, the emphasis is to create aordable programs now.
Alternative waste management program costs
Alternatives for solid waste management in the region include open landfills, sanitary landfills, incineration and a composting pro- cess. Each of these options is not available to all countries as it would be impractical, for example, for Singapore to compost solid waste as extensive agricultural land to receive the compost is nonexistent. In other coun- tries where suitable land is available for san- itary landfills, incineration is comparatively expensive.

Since each country is not experienced in all forms of solid waste disposal, relative costs are extrapolated to other countries (Table 13).
Costs for sewage collection and treatment facilities will vary by population densities, zoning policies for urban development, whether the sanitation system is retrofitted to an established area or is incorporated into a new development. Table 14 demonstrates the relative costs of various treatment facilities.
The effect on the coastal environment of the several solid waste management pro-
Table 13. Annual solid waste management costs ($/capita).
grams presented in Table 13 is similar in all cases except open landfill. The most effective program for each country, therefore, is the most practical and least-cost alternative which can be incorporated into local condi- tions. The efficacy of the sewage treatment alternatives a s presented in Table 14, on the other hand, varies and consideration must be given not only to costs but also to the ability of the various processes to achieve national effluent standards. Given the increasing rate of urbanization in the various countries and
Cost Brunei Indonesia Malaysia Philippines Singapore Thailand Darussalam
Waste generation [kg/day] 1.00 0.40 0.80 0.40 2.00 0.70 Collection ($14/t) 5.10 2.00 4.10 2.00 10.20 3.60 Disposal
Open landfill ($3.50/t) 1.30 0.50 1.00 0.50 2.60 0.90 Sanitary landfill ($4.00/t) 1.50 0.60 1.20 0.60 2.90 1.00 Incineration ($20.00/t)a 7.30 2.90 5.80 2.90 13.60 5.10 Compost ($17.50/t)b 6.40 2.60 5.10 2.60 12.80 4.50
Total annual costs Open landfill 6.40 2.50 5.10 2.50 12.80 4.50 Sanitary landw 6.60 2.60 5.30 2.60 12.90 4.60 Incineration 12.40 4.90 9.90 4.90 24.60 8.70 Compost 11.50 4.60 9.20 4.60 23.00 8.10
aNet after electricity sales. bNet after compost sales.
Table 14. Estimated cost ($/capita) of sewage treatment facilities (annual costs including investment costs).
Cost Brunei Indonesia Malaysia Philippines Singapore Thailand Darussalam
BOD generation (tons per million population) Sewage treatments
Capital primary Secondary Tertiary
O&M Primary Secondary Tertiary septic
Sewage collection Capital Annual 0 & M
Annual totalb Primary Secondary Tertiary septic=
aIncludes outfall. bhcludes depreciation. cDoes not include collection.

the associated accumulative impacts on coastal resources, the selection of appropriate treatment facilities should be based on affordability and not on least-cost criteria.
RECOMMENDATIONS
Recommendations have been made within the engineering study component, given the various financial limitations faced by individ- ual countries.
Brunei Darussalam
Brunei Darussalarn's financial commitment to the waste management sector is sufficient and waste management is becoming more effective. Budgets for waste management for Karnpong Air were included in projected costs over the next five years. These facilities can be handled within the overall capital and O&M budget commitments for the continual upgrading of facilities. Other recommenda- tions are administrative-oriented and should be implementable without significant budget increases.
Indonesia
An all-out program to implement a waste management program equal to Singapore standards is cost-prohibitive. Current prac- tices and expenditures indicate a lower prior- ity to waste management programs such that coastal conditions are deteriorating rather than improving. Alternative practices, as described by Lee and Troxler (this vol.), should be investigated and financial com- mitments increased, although Indonesia's current commitment to waste management appears to be the highest in the region in terms of percent GDP. Alternative funding sources are required to stem the continued environmental deterioration around the urban areas.
Malaysia
Waste management budgets in Malaysia indicate progress in alleviating coastal waste
management concerns. Intergovernmental responsibilities and budgets. however, need to be correlated such that budgets are allo- cated more efficiently. If funds are effectively allocated, adequate standards of urban waste can be achieved.
Philippines
Although the Philippines has a waste improvement plan for limited areas, with projections of $90/capita/year over the next five years, this will only serve 10% of the Metro Manila population. The problem of coastal waste management will still continue to grow. More cost-effective and comprehen- sive waste management programs must be implemented. These programs need to access a larger proportion of the urban population and must address other limits within the urban infrastructure, e.g., transportation for efficient waste removal. The Philippines also has to pay a high proportion of national income for waste management programs. The required investment to reverse the continued deterioration in coastal resources appears to be beyond the capacity of current in-country financial resources.
Singapore
Singapore's budget commitment to sanitary services indicates a continued upgrading of current state-of-the-art programs.
Thailand
Thailand's accelerated economic growth is quickly outpacing investments and improve- ments in waste management, particularly regarding domestic sewage in the Bangkok area. Reprioritization of funds and long-term comprehensive programs are required to off- set continuing coastal resource deterioration. One option is to capitalize on the aggressive private investments occurring in the region to include more of the waste management costs associated with increased economic activities.

REFERENCES
Chua T.-E. and L.F. Scura, editors. 1991. Mana@ng ASEAN coastal resources for sustainable development: roles of policymakers, scientists, donors, media and communities. ICLARM Conference Proceedings 6, 125 -
p. Department of Science and Technology; Department of Agriculture; Department of EnWnment and Natu- ral Resources; and Deparment of Tourism, Philip- pines; and International Center for Living Aquatic Resources Management, Philippines.
DOT (Department of Tourism). 1989. Executive sum- mary. Oface of Product Research and Development, Department of Tourism, Manila, Philippines.
EPL (Europe Publications Ltd.). 1991. The Far East and Australasia 199 1. 22d ed. Europa Publications Ltd., London.
GESAMP (Group of Experts on the Scientific Aspects of Marine Pollution). 1990. The state of the marine envi- ronment. UNEP Reg. Seas Rep. Stud. No. 115.
Gomez, E.D., M. Hungspreugs, AA. Jothy, K.J. Kuan, RS.S. Wu, A Soegiarto and D. Deocadiz. 1990. State
of the marine environment in the East Asian Seas. UNEP Reg. Seas Rep. Stud. No. 126.
MHLC (Ministry of Housing and Local Government). 1988. ~ction-plan for a beautiful and clean Malaysia. Technical Section, Local Government Division, Min- istry of Housing and Local Government, Malaysia.
PWD (Public Works Department). 1986. Kampong Air Waste Management Study. Scott and Furphy Consulting Group and Public Works Department, Minishy of Development, Brunei Darussalam.
SC (Statistics Canada). 1984. Interprovincial input- output model 1984. Input-Output Division, Statistics Canada, Ottawa, Canada.
SC (Statistics Canada). 1987. Economic transaction tables. Input-Output Division, Statistics Canada, Ottawa, Canada.
WFU-IIED (World Resources ~ns~tute- he International Institute for Environment and Dwelopment). 1989. World resources 1988-89. World Resources Institute and the International Institute for Environment and Development in collaboration with the United Nations Environment Programme. Basic Books, Inc., New York.
Appendix
Tourism and Fishing Gross Domestic Product
The GDP measures the value added or returns to primary resources within an econ- omy. Measures of gross sales or total expen- ditures overstate societal gains, as this mea- sure records the value of a commodity several times as it progresses through the production process. For example, a fish caught by a fish- erman is sold to a processor, then to a retailer and eventually to the consumer. If the total sale is recorded as a societal gain for each of the three sales, the same fish would have been counted thrice. Rather. GDP is the net increase in value, i.e., the initial value of the fish plus the value added by catching. processing and marketing the fish.
Touris111 values to a country are often recorded as total tourist expenditures. These values are used to indicate the relative importance of tourism to the country, but
because of the requirement to include only .
the value added to an economy in an eco- nomic analysis, total expenditures need to be converted to a GDP measure.
Appropriate GDP measures of tourism activities, and their relationship to total tourist expenditures for the region, are not readily available. An approximation for local use was developed based on North American economic accounts.
Expenditure patterns of tourists entering the region are estimated for four industry types: accommodation, 37%; food and bever- age, 20%; local transportation and travel services, 4%; and shopping and souvenirs, 39%.
The ratios of GDP of the four industries to total sales are: restaurants and hotels. 56; local transportation and travel services. 59; and shopping and souvenirs. 42 (SC 1984).
The weighted average of total tourism expenditures to GDP ratios yields a factor of .53 (i.e., for every tourist dollar spent in a

particular country. its GDP will increase by .53 of a dollar).
Fishing
The Philippines is the only country reporting GDP for the fishing industry. Fish- ing GDP for all other countries is aggregated with the agriculture and forestry industries. As fishing is one of the direct beneficiaries of coastal waste management, approximations of marine fishing GDP are necessary. The proportion of fish tonnage to GDP in the Philippines is extended to the other five countries and to the marine fishery in the Philippines.
In 1988, the marine and inland fish ton- nage was 2.0124 million. Its GDP in 1989 was $1,713 million, generating $85 1 per ton of fish.
Average annual GDP marine catch ($ million)
(million t) 1983- 1985'
Brunei Darussalam 3 3 Indonesia 1,732 1,474 Malaysia 670 570 Philippines 1,330 1.132 Singapore 22 19 Thailand 2,012 1,712
aSource: WRI-IIED (1989).

The Role of Government in Waste Management: The Metro Manila Experience
JEJOMAR BINAY Metropolitan Manila Authority
c /o Offie of the Mayor Makati Municipal Offire
J.P. Rizal, Makati, Metro Manila Philippines
BINAY, J. 1992. The role of government in waste man- agement: the Metro Manila experience, p. 165- 168. In T.-E. Chua and L.R. Garces (eds.) Waste management in the coastal areas of the ASEAN region: roles of gov- ernments, banking institutions, donor agencies, pri- vate sector and communities. ICLARM Conference Proceedings 33, 218 p. Ministry of the Environment, and Canada-ASEAN Centre, Singapore; Asian Devel- opment Bank, and International Center for Living Aquatic Resources Management, Philippines.
ABSTRACT
The government's role in waste management is to coordinate the involved sectors of society; issue regula- tions; monitor compliance and establish and implement effective and efficient management systems. This paper highlights the role of the Metropolitan Manila Authority (MMA) in waste management in the Philippines.
BACKGROUND
Global ecology, a movement to protect. consene and properly utilize the earth has gained great momentum and an increasing number of supporters. Its adherents include not only enthusiastic private organizations but also increasingly involved national gov- ernments and regional governmental organi- zations. Hence, it has become a legal and a
policy concern. This paper focuses on the role of government in waste management in the coastal areas of the ASEAN region.
Presidential Proclamation No. 824 issued on 7 November 1975 created the Metropolitan Manila Commission now MMA. It is the administering agency of a geopolitical unit called Metropolitan Manila--an integration of four cities (Manila, Quezon City. Pasay City and Caloocan City) and thirteen municipali- ties of the provinces of Rizal and Bulacan (Las PMas, Makati. Mandaluyong, Marikina. Malabon, Muntinlupa, Navotas. Parafiaque, Pasig, Pateros, San Juan. Taguig and Valen- zuela) .
The MMA is a manager-council type of organization tasked with the delivery of basic urban services requiring coordination and direction, e .g., solid waste management.
The MMA's implementing arm for cleanli- ness, beautification, and garbage collection and disposal is the Environment Sanitation Center (ESC), then known as the Refuse and Znvironmental Sanitation Center. The ESC is headed by an executive director and is com- posed of five sector offices and two deputy directors, one for finance and administration, and one for solid waste management.
The major task of ESC is land-based clean- up services. In 1990, the estimated waste generation rate is 459 kg/capita. Metro Manila generates an average of 13.1 10 m3

daily with an average density of 330 kg/m3. For the period 1988- 199 1, waste generation increased by an average of 5.4%. The compo- sition of Metro Manila's waste, excluding commercial and industrial, fall into 13 major classifications. These are paper, cardboard. food waste, plastic, textile, rubber and leather. petroleum products, yard and field waste, wood, fines, metals, glass and inerts. The bulk of waste is composed of yard waste (35.5%), wood (1 1.5%) and food waste (1 1.0%).
THE WASTE MANAGEMENT CONCEPT
Waste management is considered as the most efficient and sanitary means of throw- ing, collecting, segregating and disposing of leftovers, refuse, discards, by-products and other garbage. It is a cycle, a system, a pro- cess or simply a task. In the sense that it is a never-ending occurrence which always returns to the first step, it is a cycle. It is a system in that it is a unified, coherent and correlated set of procedures geared towards a specific goal that is environmental sanitation and beautification. It is a process when it is made up of a set of actions in a given logical order. It is a task considering that it is a duty of all sectors of society.
The waste management cycle is made up of five component processes. These are waste generation, packing/storage, collection, seg- regation/sorting and disposal.
THE ROLE OF GOVERNMENT IN WASTE MANAGEMENT
Waste management, a s a task, is the collective responsi5ility of all sectors of society comprising govemments, banking institutions, donor agencies, private sector and communities. The input of one sector is vital to the whole such that if any sector fails to do its part or performs it in a substandard manner, the whole task suffers and the qual- ity of output declines.
The role of the government in the system is one of management, i. e., planning, organiz- ing, staffhg, directing and controlling.
The government plans when it determines the specific work to be done and the proper sequence for the successful cleanup of the environment. Done in consultation with the lower-level officials and the field officers, it is repeated during the yearend or early year planning workshop and during the prepara- tion of the annual work program of each department. The top management then orga- nizes and assigns tasks for all parties involved, including MMA personnel and vol- unteers from the private sector. Staffing includes task formation for special projects and reshuffling of personnel assignment.
Directing is primarily the job of the political leaders, chiefly the head of the agency and, to some extent, his subordinate officials. The head synthesizes all the efforts of the various groups involved. Also, he liaises with the public and private sectors through personal dialogues, press releases and TV appear- ances. A better understanding of the issues makes for the least resistance to MMA pro- jects. Moreover, conflicting interests are unearthed, threshed out and resolved. Moti- vating the involved sectors is also important. Towards this end, top management uses the incentive system to get results.
Finally, controlling is done by the political leadership when it sets the minimum accept- able standard of performance, issues imple- menting rules and regulations, evaluates periodic performance, monitors program effectiveness and efficiency, and corrects deviations.
THE METROPOLITAN MANILA AUTHORITY EXPERIENCE
Since the MMA's inception in 1975 until the present, environmental contamination caused by improper waste disposal is still a problem. Notwithstanding the regular clean- up by metro aides (Metro Manila streetsweepers), the maintenance of a garbage-free environment is yet to be attained. Public awareness of the importance of cleanliness is still very low a s shown in the littering in the streets and waterways of Metro Manila.

Cell-based collection
For a more systematic and efficient garbage collection, the cities and municipalities were divided into collection cells/routes. A cell is a fixed area consisting of one or more streets with a n estimated waste generation of 12 m3 daily, also the average load capacity of a col- lection truck. The 1.099 cells are classified as regular, major thoroughfare or stationary. The area coverage of each cell/route is updated on a regular basis to conform with the latest volume generation and load capac- ity of collection equipment.
Regular cells (door-to-door collection) are covered at least thrice a week. Major thor- oughfares and stationary cells (markets and other high-refuse generating areas/institu- tions) are covered daily.
Except in rare cases, collection is sched- uled on a two-shift basis to avoid traffic con- gestion and inaccessibility of some residential neighborhoods:
First shift: 6:00 P.M. - 12:OO midnight Second shift 12:OO midnight - 6:00 A.M.
Collection time varies in different neigh- borhoods. In high-income areas where garbage contains more recyclable items, col- lectors segregate garbage, thereby increasing collection time. The average collection rate in high-income areas is low at 4.5 m3/hour compared with 5.3 m3/hour in middle- income and 8.3 m3/hour in low-income areas. The average collection rate is 6 m3/ hour.
From 1988 to 1990, the volume of collected garbage increased by an average of 10.38% at an average collection rate of 80%.
Monitoring system
Ocular inspection is done to monitor levels of cleanliness, especially of garbage-prone streets [so-called because of the recurrence of uncollected or indiscriminately dumped garbage). These are identified and docu- mented.
The monitoring of the level of cleanliness is cell-based. From a given set of criteria, evalu- ation considers the volume of garbage moni- tored and the manner in which garbage is stored. An area is rated from a scale of one to five, with one as the lowest.
The results are submitted to the area man- agers for use as a tool in planning operational strategies. Furthermore, a list of the identi- fied problem areas may be recommended to Pook Kalinisan (Cleanliness Area) for moni- toring and maintenance by a community or nongovernmental organization.
Collection equipment
Garbage collection is undertaken by ESC and private contractors.
On the average, MMA contracts 397 6- wheeler trucks and 45 10-wheeler trucks with a minimum capacity of 12 m3 and 18 m3 of garbage, respectively. Service contracts are renewed monthly or quarterly.
Rental cost ranges from P505.96 to 8832.7 1 for the 6-wheeler trucks and P l , l85 to 11,220.12 for the 10-wheeler trucksa. A contractor-supplied palero (laborer) is paid P34/trip in Manila and the South Sector, and f56.66 in the other areas. Three palero are allowed for the 6-wheeler and four for the 10- wheeler trucks.
At 100% availability, 100% load efficiency and operating on two shifts, the estimated collection capability of the trucks is 1 1,148 m3 or 85.03% of the estimated daily waste generation. At 80% availability, 83% load effi- ciency and operating on two shifts, the esti- mated collection capability is 7.427.68 m3 or 56.65%.
The MMA has also its own garbage collect- ing equipment: 5 15-m3 compactors, 5 13-m3 compactors, 6 arm roll trucks complemented with 15 arm roll containers and 85 2-m3 containers for compactor trucks. These were acquired in 1986 through the World Bank Loan for Solid Waste Improvement Program.
Equipment acquired in 1987 from the Japanese government were 26 15-m3 com- pactors, 51 8-m3 compactors. 39 5-m3 com- pactors; and in 199 1, 40 compactors.
Of the 156 compactors. 40 are not yet in use. Ninety-one are distributed to the sectors and 25 to the Special Project Division (SPD) of ESC. The units retained at SPD are dis- patched to the areas requesting backup.

Transport system Streetsweeping
The transport system being used in ESC operations is completely primary haul, i.e., the direct transport of garbage by collection vehicles to the disposal sites. Average haul distances from the end of the collection route to the disposal sites vary from 3 to 25 krn depending on the proximity of the existing disposal sites (except the sanitary landfill sites) to the collection site being served.
Travel time ranges from 7 minutes to 1 hour with an overall average of 30 minutes. It is adversely affected by heavy traffic, heavy rainfall that cause flash floods or poorly maintained dumpsite roads.
Waste disposal
Except for the newly opened Metro Manila Landfill I at San Mateo, Rizal, the present disposal system is open dumping.
The open dumpsites are Balut or Smokey Mountain. Aroma, Catmon, Pasig and Payatas. Landfill sites include Fort Bonifacio and San Pedro.
Preparatory to the phaseout and closure of the open dumpsites. MMA has started to develop sanitary landfill sites (a technically prepared disposal area with engineering devices to treat garbage scienfifically) which shall meet the total disposal requirements. At present, two sites are being developed. These are the Metro Manila Sanitary Landfill I and the Metro Manila Landfill Site I1 in Carmona, Cavite.
Transfer station
The Las PMas Transfer Station was designed to complement the operation of the Metro Manila Sanitary Landfill II. Instead of direct haul, collection trucks will deliver their loads to the station where these will be transferred to trailers which will transport the same to the landfill. For this purpose, MMA has already acquired 20 transfer trail- ers with prime movers. The station is 70% complete as of 31 December 1990.
Metro aides totalling 4.853 maintain the cleanliness of Metro Manila's main thor- oughfares, and secondary and tertiary streets.
The collection capability of MMA equipment at 100% availability, 80% load efficiency and operating on two shifts (a 5-m3 canter makes 4 trips a day) is 5,941.6 m3 or 45.32% of the estimated daily generation.
Cleaning of canals and waterways
The ESC Waterways Sanitation Services is tasked with the clean-up of refuse and vege- tation in small bodies of water such as rivers, estuaries and canals. Its scope of operations does not include coastal areas for which it has no facilities.
Solid waste management support projects
Subsidiary projects in support of the solid waste management function are:
~ e t r 6 Clean and Green - a tree planting project; Balik-Gamif (Return to Use) - redemp- tion centers that collect reusables to limit waste disposal; Pook Kalinisan (Cleanliness Areal - a multisector group that helps maintain cleanliness by monitoring problem areas; Sanitary Enforcement - an anti-illegal dumping and littering campaign that deputizes policemen to strictly enforce sanitation ordinances; Grass-cutting - at center islands, parks and government areas; and Garbage-free Zones - a formal decla- ration of an organization in a certain area signifying a commitment to implementing the above activities with a sustained monitoring system to maintain a beautiful, clean and healthy environment.

Session 4: Role of Donor/International Agencies, International Banking Institutions and the
Private Sector in Waste Management
The Implementation Constraints in Waste Management in Malaysia
LAW HIENG DING Ministry ofscience, Technology and the Environment
Wisrna Sime Darby Jalan Raja Laut, 50662 Kuala Lumpur
Malaysia
LAW, H.D. 1992. The implementation constraints in waste management in Malaysia, p. 169-172. In T.-E. Chua and L.R Garces (eds.) Waste management in the coastal areas of the ASEAN region: roles of gov- ernments, banking institutions, donor agencies, pri- vate sector and communities. ICLARM Conference Proceedings 33, 218 p. Ministry of the Environment, and Canada-ASEAN Centre, Singapore; Asian Devel- opment Bank, and International Center for Living Aquatic Resources Management, Philippines.
ABSTRACT
This paper highlights the current constraints in waste management in the ASEAN region, particularly in Malaysia. The major constraints include lack of funds, land limitations, inadequate legislation, lack of law enforcement by the relevant local authorities, and a low degree of coordination and planning among government agencies.
INTRODUCTION
The year 1991 marks not only the end of the New Economic Policy of Malaysia but also the beginning of the Second Outline Perspec- tive Plan 1991-2000 and the National Devel- opment Policy. Both the plan and policy were recently launched by the Prime Minister of Malaysia, the Rt. Honorable Dr. Mahathir
Mohamad, on 18 June 1991. The plan pro- vides a firm basis for the country to move ahead towards achieving the status of a developed nation by the year 2020.
In the last two decades, the country has witnessed a high rate of economic growth despite the many challenges it had to face internally and from abroad. However, this accelerated rate of development has also brought numerous environmental problems such as overexploitation of natural resources and pollution that threatens human well- being, thus, negating some benefits of socio- economic development.
To address fully the range of environmental problems, the government made legal and institutional arrangements in 1970. It set up an Environmental Law Drafting Committee in 1971; prepared a Country Report for the United Nations Conference on Human Envi- ronment in 1972; enacted the Environmental Quality Act (EQA) of 1974; set up the Division of Environment and later, the Department of Environment (DOE); and prepared the chap- ter "Development and the Environment" in the Third Malaysian Plan 1976-1980 which outlined Malaysia's environmental policy objectives. The government also wrote the Amendment to the EQA of 1974 in 1985. making environmental impact assessment (EIA) mandatory in 1987. The EIA has been enforced since 1 April 1988. Under the EQA of 1974, the DOE has strictly implemented a

series of regulations for the control of smoke- free emissions in 1977, of palm oil and rub- ber effluents in 1978, of industrial air emis- sions in 1978. of industrial effluents in 1979. of lead content in petrol in 1985, and of toxic and hazardous wastes in 1989.
The full implementation of these regula- tions has effectively controlled pollution gen- erated by the agro-based and manufacturing industries. But it has not addressed water pollution caused by partially treated or untreated human and animal wastes. The proper handling of animal waste, in particu- lar piggery waste, depends to a large extent on the private sector's response to the gov- ernment policy on the reconsolidation of ani- mal farms, the majority of which are not only small but also widely dispersed throughout the populated parts of the country. Sewerage treatment, however. depends largely on the multilateral agencies' support of waste man- agement projects.
This paper highlights the current con- straints in the management of human and organic waste, particularly. agro-based and other industrial waste, sewage and solid waste, silt, pesticides and hazardous waste.
IMPLEMENTATION CONSTRAINTS
Agro-based industrial waste
Malaysia's management of waste from the agro-based industries has been very suc- cessful. From 1986 to 1989, agro-based industries contributed only 2.7% of the total biological oxygen demand (BOD) load in Malaysia (Table 1). The pollution loads of the palm oil mills and natural rubber factories were reduced by over 98% and 95%. respec- tively, maMng these factories insignificant contributors to inland water pollution in the country. This success is attributed to the substantial investment in research and development in waste treatment technology by plantation industries as well as by the Palm Oil Research Institute of Malaysia and the Rubber Research Institute of Malaysia.
Other industrial waste
Efforts to control industrial waste have not been as rewarding. The organic pollution load of the manufacturing sector in 1989 was 21
Agro-based industries 11 2.7 0.22 (palm oil and rubber) Manufacturing industries 30 7.3 0.60 Agriculture (animal husbandry) 55 13.4 1.10 Population (sewage) 314 76.7 6.28 Total 4 10 8.20
Table 1. Organic pollution load by sector b~ Malaysia, 1986-1989.
Sector
1986 Sector BOD % Population
loada equivalentb
1988 BOD % load
1987 BOD % Population load equivalent
Agro-based industries 11 2.5 (palm oil and rubber) Manufacturing industries 19 4.3 Agriculture (animal husbandry) 55 12.4 Population (sewage) 358 80.8 Total 443
Population equivalent
0.22
0.38 1.10 7.16 8.86
1989 BOD % load
Population equivalent
0.22
=In t/day. bIn million, using a BOD load of 0.05 g/capita/day. Source: Department of Environment, Malaysia.

t/day (4.6%) of BOD compared to only 11 t/day (2.4%) of the agro-based industrial sector (Table 1). This was because 90% of the industries in Malaysia were small-scale. For instance, the electroplating industries lacked land, funds. technical know-how and skilled operators for the treatment facilities. The tapioca and sago processing industries required an extensive area for ponding, the lack of which reduced their total pollution load by only 40%.
Animal waste
Since the late 1980s. organic waste from animal husbandry has been a major problem. Although technology and financial resources are available, the waste problem remains unsolved because of land tenure issues and the lack of political support, i.e.. the inade- quate land allocation for modernizing this activity. Society's low regard for animal hus- bandry as a backyard activity rather than a modem industry also needs to be overcome.
Partially treated or untreated sewage
Partially treated or untreated domestic sewage contributed around 80% of the total pollution load in 1986-1989, making it the major polluter of both inland and coastal waters in Malaysia (Table 1). This is because many coastal towns in the country lack proper sewage disposal systems. More often than not, raw sewage is discharged directly into the sea. A number of river stretches are also contaminated in areas with dense popu- lations and inadequate sewage treatment facilities. The worsening sewage problem is aggravated by the lack of financial and politi- cal support to develop sewage treatment and sewerage facilities. poor siting of good sewer- age projects and the inability of the average household to pay for the provision of com- munity sewerage services.
Garbage and solid waste
Rapid urbanization in the country and the significant population increase have made solid waste management the most serious
urban environmental problem. In Malaysia, solid waste management is a local authority function under the Ministry of Housing and Local Government. The two critical functions. namely, collection and disposal, take up a substantial portion of the total revenue col- lected by the local authority. Solid waste col- lection is the most costly, as many existing dumpsites have become not only inadequate but also too close for comfort to the residen- tial areas. New sites are also increasingly dif- ficult to find, due in part to the high cost and scarcity of land in urban areas, and the "not- in-my-backyard" (NIMBY) syndrome that still prevails among the majority of local resi- dents.
Soil erosion and siltation
Silt (or mineral solids) polluting the waters originates from intensive land clearing and development, mining and logging activities in water catchment areas. and tin mining efflu- ents. Although the discharge of tin mining effluent is prohibited, it is nevertheless allowed particularly during heavy rainstorms. But the industrial discharge limit enforced by the Department of Mines is by far in excess of the limit set by DOE.
Further, there are no specific regulations for the other sources of silt pollution. While there are established laws, there is also a lack of enforcement by the relevant local authorities. Compounding the implementa- tion problem is Malaysia's three-tiered government .system. i.e.. federal, state and local. For example, land is strictly a state matter. therefore pollution arising from land development activities is entirely within the state's jurisdiction but beyond the federal government agencies'.
Pesticides
Pesticide use or abuse is extensive, and the number of pesticides in the market is large. The Pesticides Act of 1974 regulates the importation, manufacture, sale and storage of pesticides as well as the presence of pesticide residue in food. It also provides for the inves- tigation and reporting of pesticide-related accidents, deaths and personal injuries.

Restrictions, however, have to be imposed on the sale of pesticides hazardous to human health and the environment. Also, educa- tional programs for persons working with pesticides need to be enhanced and a pesti- cide exposure limit established.
Toxic and hazardous waste
Since May 1989, regulations on "scheduled waste" have been enforced. The "cradle-to- grave" management concept is used for toxic and hazardous waste, i.e., waste is tracked from its generation point to its storage. transportation, treatment at offsite facilities and finally to its disposal or repository sites. Because fund availability is crucial in man- aging toxic waste, the government decided that the private sector participate fully in the establishment of an integrated central waste treatment facility. Initially, however, the main constraint was the lack of political commit- ment at the state level. Nonetheless, at least one of two private firms appointed by the Ministry of Science. Technology and Envi- ronment has been making progress recently.
by relevant local authorities, and a low degree of coordination and planning among state and local government agencies. One of the challenges then, is to secure the funds for the adoption of technologies, the concessional rates of which the majority of the households can afford.
The country has noted the current scope of the Global Environment Funding Facility established by the World Bank with the sup- port of the United Nations Environment Programme and the United Nations Develop- ment Programme. The facility, however, has yet to address the protection of both inland and coastal waters. It is, therefore, our hope that the multilateral funding agencies, such a s the Asian Development Bank, look into the prospects of establishing a Regional Envi- ronment Funding Facility that is sensitive and responsive to the pressing needs of Asians, particularly those in the ASEAN region.
ACKNOWLEDGEMENT
The author wishes to thank the Director- CONCLUSION AND RECOMMENDATIONS General of DOE, Dr. Abu Bakar Jaafar, and
his staff, namely. Encik Hashim Daud, Puan Karirnah Yunus. Puan Aishah Md. Yusoff and
Thus, the implementation constraints in Puan Fuziah Mansor for their assistance in waste management in Malaysia include the the preparation of this paper. lack of funds, land limitations, inadequate Views expressed are not necessarily those legislation in some areas, lack of enforcement of the Government of Malaysia.

Coastal Waste Management and the United Nations Conference on Environment and Development 1992
JOHN P. BELL Environment and Energy Division
Department ojExternal Affairs and International Trade c/o Cannda-ASEAN Centre
80 Amon Road # 15-02 IBM Towers
Singapore 0207
BELL, J.P. 1992. Coastal waste management and the United Nations Conference on Environment and Development 1992, p. 173-178. In T.-E. Chua and L.R Garces (eds.) Waste management in the coastal areas of the ASEAN region: roles of governments, banking institutions, donor agencies, private sector and communities. ICLARM Conference Proceedings 33, 218 p. Ministry of the Environment, and Canada- ASEAN Centre, Singapore; Asian Development Bank, and International Center for Living Aquatic Resources Management, Philippines.
ABSTRACT
This paper discusses the conclusions and recommen- dations of the Halifax meeting of experts on land-based pollution on 6-10 May 1991 and the decision of the First Preparatory Committee for the United Nations Confer- ence on Environment and Development (UNCED) in Nairobi in August 1990. It also attempts to describe the important connections among the Halifax meeting, the Waste Management Conference and UNCED 1992. Future global steps/actions that can be taken to address marine pollution concerns before, during and after UNCED 1992 are also presented.
Canada's Minister for External Affairs, I am familiar with the types of threats that improperly managed waste can pose to coastal regions. Similarly. I am acutely aware of the magnitude of the challenges we face in developing and implementing better ways to reduce, reuse, recycle and safely dispose of waste products.
Despite my growing store of knowledge in this field, I have not come here today with definitive solutions. In fact, I have come to Singapore both to learn from you who have hands-on knowledge of waste management problems and to pass on to you the results of related discussions held recently on this same issue.
Most notably, I would like to discuss the conclusions of the Intergovernmental Meeting of Experts on Land-based Sources of Marine Pollution, hosted recently by the Government of Canada in the coastal city of Halifax. In addition, I plan to explain the importance of the issue of land-based sources of pollution. including coastal waste management, within the context of UNCED 1992.
INTRODUCTION THE HALIFAX MEETING
May I open my remarks by saying how grateful I am to have the opportunity to address this most important conference. A s the Special Advisor on the Environment to
The Halifax meeting of experts on land- based marine pollution was convened on 6- 10 May 1991 in response to a decision taken

at the First Preparatory Committee for UNCED in Nairobi in August 1990. which endorsed the offer made by Canada to host such a meeting.
Canada's interest in this meeting was based on two facts. The first was the conclu- sion of the 1990 State of the Marine Envi- ronment report of the Group of Experts on the Scientific Aspects of Marine Pollution that 80% of marine pollution comes from land- based sources. The second was the acknowl- edged inadequacy of existing legal regimes to address land-based sources. Canada felt the need to bring together the world's experts on land-based sources of marine pollution to focus on the challenges this issue presents and the need for action.
More than 90 experts from 35 countries attended the Halifax meeting, including a strong representation from the ASEAN region. As chairman of the meeting, I set out the fol- lowing goals in my opening remarks
develop principles for protection of the marine environment from land-based sources of pollution; study the various scientific, social. economic and legal elements to be addressed for a concerted global attack on the problem; and develop a recommended strategy and action plan for consideration at the Third UNCED 1992 Preparatory Committee in August 1992.
I also emphasized the need to maintain a broad perspective on ocean pollution and the close relationship among land-based sources. atmospheric pollution and living marine resources conservation.
After four days of fruitful and lively discus- sion. the meeting adopted a set of conclu- sions and recommendations and issued a statement. The recommendations in brief are:
Current global, regional, national and local efforts are inadequate to halt and reverse the deterioration of the marine environment and conse- quently, action is needed at all levels. A comprehensive and coordinated approach should be taken involving all sectors and looking at air, land and water interactions. Experts strongly urge the adoption of an anticipatory, rather than a reactive
approach to marine pollution prob- lems. The existing legal regime does not address adequately the problem of land-based sources, and an umbrella strategy or framework is needed. While views difTered aver the precise nature of such a strategy, it was widely agreed that a convention by the time of UNCED 1992 was not feasible. Instead, a declaration of principles and an action plan should be put for- ward for adoption at UNCED. A follow-on Meeting of Experts should be held in late 1991 to develop a dec- laration for signature by heads of gov- ernments at the 1992 conference and the specific elements of a strate@ and action plan that would form an important chapter in Agenda 2 1, one of UNCED's key outcomes. Both of these would draw on the Halifax con- clusions and relevant UNCED docu- ments. Future work should focus on strengthening existing cooperative instruments, mechanisms and insti- tutional responsibilities as well as developing new programs relating to major global land-based sources and the application of policies to develop- ment activities.
Some of the more substantive scientific conclusions are:
Human activities on land are a major polluter of the marine environment. contaminants reach the sea from rivers, through the atmosphere and from more direct or point-source inputs in the coastal zone. All economic sectors are involved, including agriculture, industry, fish- eries, maritime activities, tourism and, of course, human settlement. In keeping with the anticipatory approach, clean production and minimal waste is the way to proceed.
The Halifax meeting devoted considerable attention to the economic and developmental aspects of marine pollution, going beyond purely environmental issues. The UNCED process then presents an opportunity to link solutions with other agenda items such as

hazardous waste, air pollution, land and agriculture, and fresh water as well as cross- sectoral issues such as poverty, public health, human settlement and economics.
The Halifax experts concluded that there is a close connection between good waste man- agement practices and marine pollution. specifically sewage, nutrients and synthetic organic compounds. Of the many significant land-based sources of pollution, these three were felt to be "of greatest concern on a global scale considering future trends."
Sewage discharge to the coastal marine environment is directly related to human population pressure. Over half of the world's population lives on or near the coast and continues to grow, especially in developing regions. Many developing countries do not have sewage treatment facilities. Statistics show that the construction of waste treat- ment facilities has not kept pace with popu- lation growth in recent years. Hence. pollution associated with sewage discharge will continue to increase unless more efficient management strategies are implemented.
Nutrients are being mobilized and trans- ported to the marine environment as a result of man's activities at a pace exceeding natu- ral rates. Growing world fertilizer consump- tion will lead to increased inputs in the future along with those associated with sewage dis- charge. The development and use of new organic compounds is increasing rapidly. Coupled with growing pesticide use, this is cause for concern.
CONCEPTUAL MANAGEMENT STRATEGY
The Halifax experts accepted two working assumptions for a management strategy that could significantly reduce land-based sources of pollution.
First. the measures to be taken should fol- low a comprehensive and coordinated approach involving all sectors and recogniz- ing the interaction among air, land and water. It is both ethically wrong and scientifi- cally unsound to take measures to protect one sector of the environment without con- sidering the implications of that action on other sectors or the costs and benefits involved.
175
Second, while there is still a need for more scientific information, current deficiencies in the scientific understanding of a problem should not be an obstacle to initiating man- agement action.
Keeping these assumptions in mind, what then constitutes a good waste management s t ratem The ten key elements are:
Any management framework, whether local, national or regional must involve planning, assessment and adequate legislative and financial arrangements. Measures to reduce and prevent emissions must be part of a broader strategy which integrates management of individual practices with policies for human settlement. and economic development covering coastal lands, watersheds and adja- cent seas. Pollution control requires a "cradle-to- grave" approach to chemical and resource use, involving clean produc- tion, recycling and excellent control processes, more efficient production and distribution systems, and the careful management of harmful by- products. There is a need for active and ongoing waste minimization and management strategies including waste audits. optimum use of recycling opportuni- ties and selection of the least harmful disposal options. The precautionary approach is fun- damental to waste minimization and integrated pollution control. Manage- ment strategies must try to predict and preclude damage, thus, reducing inputs of persistent, toxic and bioac- cumulative chemical substances. whenever possible. Certain particular toxic, bioaccumu- lative and persistent substances should be subject to either a global ban or severe restriction. Formulating specific goals and envi- ronmental quality criteria and emis- sion standards should be basic proce- dures. Information and education campaigns help to raise the awareness of the general public and decisionmakers as

to their role in causing and solving problems. Standardized and continuous base- lines must be established for mea- surement and monitoring programs. Partnership should be established between developed and developing countries, either bilateral or multilat- eral, covering a wide range of relevant areas. Effective and long-lasting programs depend on stable and well-staffed institutions which rely on good train- ing. Ideally, these should be developed locally.
These suggest a hierarchy of activities ranging through scientific research and dis- semination; public awareness and acceptance. of the need to address potential problems; and environmentally conscious decision- making at all levels of society and imple- mentation of effective strategies to avoid the problems.
Satisfactory action depends upon identify- ing the pollutant sources; determining appropriate control strategies and actions; ensuring the necessary institutional arrangements for their implementation; and identifying and dealing with problems that prevent or delay effective solutions.
THE SEWAGE PROBLEM
The example of sewage will be explored briefly to illustrate the type of approach to taking action that might be applied to a par- ticular waste management problem. The sources of sewage are obvious enough and many management techniques are available. The strategies might include using sewage for beneficial purposes, treatment processes, and setting water quality goals and standards.
Necessary action might include better planning in urban and industrial develop- ment, application of water quality goals and standards, and establishment of treatment facilities. These actions depend upon ade- quate institutional arrangements for plan- ning, development and application of stan- dards and allocation of funds, taking place at local, national, regional or even global levels.
The key problems to be overcome include a lack of local recognition of and concern for sewage, high initial costs and a lack of local or regional technological capacity. There is no scientific mystery to handling sewage. The challenge lies in management, technology implementation, adequate financing and political will.
A lot of discussion in HaMax focused on sewage because it is universal and the inter- relationship between its environmental and developmental aspects is strong.
The sewage problem is by no means limited to developing countries. In Canada, we are still working towards implementing adequate sewage management policies. For a number of years. Canada has been going through a process of tackling sewage and industrial waste. The real challenge is less the handling of the waste already in the sewerage system than the reducing of the amount created at the point of production. This involves a sig- nificant investment at the industrial level to capture and sometimes recycle waste. thereby reducing the amount entering the system. The limited funds for sewage and waste treatment has increased its privatiza- tion.
As a result, Canada has developed consid- erable technological expertise in industrial wastewater treatment, including a unique "sludge-to-oil" conversion process. This has given rise to the opportunity to work with other countries to facilitate technological cooperation and partnership.
A COHERENT STRATEGY
~ e ~ a r d l e s s of the level (local, national or regional) at which pollution from land-based sources manifests itself, a coherent strategy is necessary to tackle the problem. Based on a commonly accepted set of principles. a strategy for action must also contain a set of goals situated within a managerial frame- work. The framework requirements will vary depending on the type of environmental problem and its geographical scope. From their close consideration of the priority prob- lems of nutrients, synthetic organic com- pounds and sewage, the Halifax experts drew

the conclusion that a national managerial framework should contain at least the fol- lowing elements:
appropriate environmental regulation; effective licensing and control mecha- nisms; sufficient managerial and administra- tive competence to implement and enforce legislation and other actions; linkage between economic develop- ment activity and environmental management; information provision to the public. professionals and politicians; public education starting at an early age; and infrastructure capacity including management, engineering. mainte- nance and communication.
ECONOMIC, SOCIAL AND LEGAL MEASURES
A final aspect of marine pollution problems addressed at Halifax is especially applicable to the topic of waste management and to the many environment and development issues to be examined by UNCED. It involves the selection and implementation of appropriate economic, social and legal measures. The Halifax conclusions are:
Priority should be given to integrated coastal and marine planning and management, with special attention to sewage treatment and possibilities for concessional financing. Adequate financial resources, innova- tive fmancing mechanisms and tech- nology transfer are essential for devel- oping countries. Similarly, develop- ment aid funds should consider seri- ously land-based marine pollution objectives. New and more pragmatic concepts and operational tools should be devel- oped for a better assessment of envi- ronmental protection. The use of envi- ronmental indicators should be pro- moted for this purpose. The use of economic instruments can often be very efficient and effective in
backing up regulatory measures and achieving pollution control objectives. These include better resource pricing, taxes, user fees and tradeable emis- sions permits, among others. Efforts should be strengthened in the areas of education, training and pub- lic awareness, and responsibility to promote better understanding of both the problems and preventive mea- sures.
FUTURE PROGRAMS
While the Halifax meeting did not recom- mend one preferred international mechanism, it did identify the following basic require- ments for future action:
1. build upon the principles of the 1985 Montreal Guidelines for the Protection of the Marine Environment Against Land-based Sources;
2. assign responsibility for coordinating catalytic functions;
3, strengthen regional mechanisms and encourage countries to enter into regional agreements;
4. provide for the exchange of informa- tion and the transfer of technology and other resources;
5 provide for more effective data collec- tion and monitoring; and
6. develop a timetable for the imple- mentation of the selected interna- tional mechanism.
With the Halifax options in mind, subse- quent meetings of the United Nations Envi- ronment Programme (UNEP) Governing Council and the UNCED Working Party on Oceans have developed a general momentum towards completing a declaration of princi- ples and an action plan for consideration at UNCED 1992. The declaration consisted of a set of principles and a strategy, both of which were virtually completed at Halifax.
A separate action plan is to be developed by a UNEP Intergovernmental Meeting of Experts in 1991. The Halifax Meeting Statement should provide considerable guidance in this endeavor.

In conclusion. I would like to briefly look past UNCED 1992 to the need for a new. comprehensive and integrated approach to the protection and sustainable use of the marine environment and its resources. We feel it is only consistent with global concerns and ongoing initiatives for the international community to begin considering a conference after 1992 which will tackle the broader issues of marine pollution and coastal zone management.
In the meantime. however, we must keep our feet on the ground and continue to work towards improving our ability to manage waste in coastal areas and to control and alleviate land-based marine pollution in gen- eral. If we can help to advance this work, while at the same time keeping in mind the broader marine pollution issues, then we will all be much closer to a solution.

The Privatization of Waste Treatment and Management Facilities
THOMAS G. SMITH Pac& Waste Management Limited
9 1 7 Sun Hung Kai Centre 30 Harbour Road
Wanchat Hong Kong
SMITH, T.G. 1992. The privatization of waste treatment and management facilities, p. 179- 184. In T.-E. Chua and L.R Garces (eds.) Waste management in the coastal areas of the ASEAN region: roles of govern- ments, banking institutions, donor agencies, private sector and communities. ICLARM Conference Pro- ceedings 33, 2 18 p. Ministry of the Environment, and Canada-ASEAN Centre, Singapore; Asian Development Bank, and International Center for Living Aquatic Resources Management, Philippines.
ABSTRACT
This paper reviews the reasons why municipalities have opted to engage private companies for environ- mental services such as waste management. Privatiza- tion benefits include efficiency and consistency in refuse collection, improved quality of services and cost savings. Some control and evaluation systems for the selection of private companies are also discussed.
INTRODUCTION
Today, as demonstrated clearly by this conference, there can be few more important issues than the need for care and preserva- tion of our environment. A key element of environmental care is the provision of envi- ronmental services which involves determin- ing by whom and how to implement these services in a practical and logical way.
Environmental services include the collec- tion, treatment, resource recovery and dis- posal of municipal, industrial and other types of wastes. Increasingly, government officials are looking to the private sector to provide these services. The trend toward the privati- zation of various environmental services con- tinues for a variety of valid and important reasons.
The purpose of this paper is to review some of the reasons why municipalities and other government entities around the world are more frequently opting for contracting private companies for environmental services. Some key considerations for government officials selecting a private contractor will also be identified.
There are municipal-owned and operated companies which do a splendid job of pro- viding environmental services. There are undoubtedly a few private contractors who fail to live up to their promises or the client's expectations. In many cases, however, the proper selection of a private contractor has inherent financial advantages to the cornmu- nity and substantial gains in environmental quality.
PRIVATIZATION TRENDS
The trend toward privatization is definite. tangible and strong around the world. The

extent to which it has been carried out varies, however, by country.
The United States. Canada and several European countries including Germany, France and Spain, have the highest percent- age of cities contracting private companies. Moreover, many other countries like Japan, Argentina. Venezuela, Hong Kong and Saudi Arabia have active private companies provid- ing contracted environmental services to their major cities.
In the United States, two-thirds of all cities use private companies for refuse collection services. In Los Angeles County alone, the number of cities issuing contracts to private companies increased from 339 in 1973 to 496 in 1982. an increase of 43%. For solid waste disposal, the increase was even more dra- matic-- 143 cities in 1973 compared to 342 in 1982. an increase of 240%.
Private refuse collection contractors serve 80% of the cities of Canada; 70% of West Germany, including 50% of its cities, and almost 50% of the population of France. More than 200 municipal governments in Japan also use private contractors.
Hong Kong is in the process of privatizing its waste collection, transfer, treatment and disposal services. In the past three years, it has contracted private companies to con- struct and operate two solid waste transfer stations, and an integrated chemical waste treatment center. It also plans to privatize the construction and operation of four transfer stations, three solid waste landfills and a special waste incinerator.
Such long-running experiences have served as good examples for responsible authorities elsewhere to decide to use private contractors for environmental senrices in cities such as Buenos Aires, Caracas. Brisbane, Barcelona, New Orleans. Riyadh and Jeddah. Although each has its own cultural personality, these world metropolitan centers share a concern for environmental protection and the quality of life.
PRIVATIZATION BENEFITS
These are the advantages of contracting private companies for environmental services:
signifcant cost savings for the gov- ernment; more consistent and effective service from proper equipment and personnel management for a cleaner and more beautiful city or region; better returns on a community's envi- ronmental investment and improved government management and service; private investment in plant and equipment and a more manageable government budget; and access to the best available technology for environmental problems.
Cost savings
Numerous studies have confirmed that governments can achieve significant cost savings through privatization. Studies by Columbia University in New York, the U.S. Department of Housing and Urban Develop- ment and others indicate that in the United States, private contractors are on the average about 30% less expensive than municipal crews.
In Canada, a study for the University of Victoria's School of Public Administration concluded that "exclusive public sector [refuse] collection is 50.9% more expensive per household than purely private collection." Likewise, in Japan, research indicates that the 200 municipalities that contracted private companies have saved an average of 124% in their waste collection and disposal costs.
In 1980, Buenos Aires contracted Manliba. a private company to provide cleaning ser- vices for about 60% of the city of 2 million people. The city crews cleaned the remaining area. After one year of service, the city's Envi- ronmental Authority reported that Manliba reduced the city's costs by more than 50% per ton. The annual services involved collec- tion of over 700,000 t of refuse and the sweeping of more than 300.000 curb miles of streets. The cost reduction at that time equated to a savings of US$40 million in the first year alone.
As governments make their own cost com- parisons, it is essential that they record the true cost of the service. The governmental budgetary process can be complicated, so that service costs may be put into different

departments or are spread across several budgets.
Any environmental service incurs the fol- lowing costs:
acquisition and amortization of equipment; financing; direct and indirect labor; maintenance labor and spare parts inventory; administration and supervision; insurance; facility and equipment overhead; and consumable items like fuel. oil, uni- forms and tires.
Well-delineated service requirements tighten the control process and the budget quickly and visibly. The true cost is there for everyone to see and monitor on a monthly basis.
Better service
Apart from lower costs, service is better in all respects. In Canada, for exarnple, the average number of weekly collections went from 1.08 to 1.13 pickups after private companies became responsible for collection services. In addition, the pickup location became more convenient for the residents.
Two separate evaluations were done for Buenos Aires after the city privatized collec- tion and related services for about half of the city. A Gallup Poll indicated that 69% of the people felt service had eflnitely improved over services provided previously by the municipality.
In the evaluation of quality of services based on a mardnnum score of 10096, the municipality-serviced sector scored 39.1% ag-t the private contractor's 87.7%. Further. the private contractor used 1.500 workers to clean streets and collect 3.000 t of waste per day compared with the 4,000 city employees needed to collect 900 t per day.
In France, a survey sf 381 commumties showed that 213 (56%) served by private contractors who collect und 20,000 t of refuse per day. This % of the total 225,000 t generated p The rest is cof- lected by municipal crews.
Other benefits
Other benefits of privatization include improved management by government administrators, a more manageable govern- ment budget process and access to the best available technology.
By engaging private companies, areas of responsibility and lines of authority are clearly established and thus become man- ageable. The govemment contract specifies the contractor's operating responsibilities and performance requirements. The government officials' responsibilities then go from opera- tional to managerial.
A s Mr. Herb Kidd, head of Knoxville. Ten- nessee's Department of Public Services, said:
We've been able to do more with the public service personnel we have. It has allowed me. personally, to work better as a manager. I don't have to spend hours anymore working to resolve personnel problems and equipment problems in the refuse area. In addition, we're getting better productivity now from our remaining public service workers.
Under privatization. the budget process becomes more manageable as the annual costs for the service are well-defined and pre- dictable. The contractor can take on the bur- den of the large capital investments required in dealing with today's environmental prob- lems. Equipment and facilities costs can be spread over several years of a contract.
The Hong Kong Government, for example. has contracted the design, construction and operation of a chemical waste treatment facility. Its capital cost is about US$125 mil- lion, which the govemment will pay on a monthly basis over a number of years, com- mencing after the acceptance of the facility.
Finally, given the complexity of today's environmental problems including industrial and hazardous waste, access to technology is critical to obtaining environmental benefits. Selecting a private company with a broad operating and geographical base gives the government access to the most advanced technology applicable to their environmental problems.

IMPLEMENTING PRI'VATIZATION
Behind the decision to use a private con- tractor for environmental services is usually a farsighted public official who supports an important if controversial policy to improve the quality of life of the people.
Once the decision to privatize has been made, the specifkation preparation and con- tractor qualification processes become important. The city's (or other government unit) objectives must be clear to all. Besides describing the services, considerations like the contractual and legal aspects of the ten- dering process also need to be reviewed carefully to ensure the best cost advantages for the city.
For example, it is important that the con- tractor be given exclusive rights and respon- sibilities to render service in a specified con- tract area of function. This will result in lower costs, and better and more consistent service to the city.
A contract should be of sufficient duration to enable the contractor to recover its capital investment over a reasonable period of time.
Where operation of a facility (e.g.. a waste- to-energy incinerator) is involved, the design. construction and operation should be the responsibility of a single contractor. Other- wise, the city will be unable to enforce spe- cific operating or environmental performance guarantees.
A facility with split contracts for design/construction and operation poses a major problem. In case of failure or inade- quate performance, the facility supplier can claim it is an operational problem gnd the operator can say it is a design or construction defect. Without enforceable responsibilities, governments are often faced with unexpected and substantial costs to remedy the problem.
Payment for services should also be in common quantifiable unit criteria such as payment per ton for collection and disposal or per mile for sweeping services. They provide an accurate measure by volume of the work actually performed.
A successful tender process requires that bidders supply sufficient details in their ten- der documents so that municipal officials can have a precise idea of the work that the bid price encompasses. It is also vital that they
are able to compare equitably prices for ser- vices to be provided with those in the specifi- cations. Other tariffs or additional services should also be made clear. By doing this, the city has the flexibility to decide, on a cost basis, what and when special services are necessary.
In addition, these definable services allow the city to control and supervise the con- tractor closely and fairly and to concentrate on the service deemed most critical.
Next, the city must p r e q u w the bidding contractors on the basis of experience and years of service in relevant environmental service activities. This way, it will get the best value for its money and the necessary per- formance reliability.
The two recommended methods are:
A two-envelope bidding process to ensure that only qualified contractors are considered. In this way, the con- tracting agency avoids unwarranted pressures to accept a low bid proposal from an unqualified contractor or an unresponsive operating plan. A valid and thorough contractor pre- qualification process prior to price submission.
Properly quahfjmg contractors is probably the single most critical decision the city will have to make before actually selecting the contractor.
The city should establish clearly the credi- bility of its potential contractors and form an opinion on each. Individual bidders' approaches may vary, so it is critical that evaluation of the bids is made on a direct comparative basis.
The use of a highly detailed and compre- hensive checklist is suggested. The list must be clear, precise and concise. For city clean- ing contracts, for example, the use of maps. tables, graphs and charts in defining service areas and services to be performed should provide sufficient information to choose the best contractor.
One recommended method of evaluating the bid is on the basis of 100 maximum pos- sible points for each of the key elements of the proposal. These maximum points are then compared with those actually awarded to each contractor, allowing each to be put on equal footing and weight.

Several criteria to be measured include experience in these fields:
servicing densely populated cities or other clients with characteristics sirn- ilar to the city's own; providing each environmental service required under the contract; different types of waste disposal, treatment and resource recovery; large-scale project mobilizations; and giving details of the operating plan and the facilities or equipment which may ultimately be owned by the city.
These weigh bidders' total experience and capability.
Evaluating the size of the bidders' business is also important. For example, a bidder should be able to demonstrate financial strength and resources to ensure perfomance by both the local and parent companies. Net worth and total revenues are excellent indi- cators.
The bidder should also possess the most modern technology and backup support.
References from other municipalities and contracting authorities will also give an excellent insight into the bidder's ability to perform consistently, honestly and reliably over extended periods of time.
Actually, with this or a similar type of rat- ing system, differences in price can also be compared on a n equal basis with the scope of services. Through such an evaluation, the city will be spending its money wisely.
A low price on its own may look very attractive, but it is important to confirm and compare the services the bidder says it will provide with the experience and probability of performance. Through this evaluation pro- cess, the city authorities can feel assured that they have chosen the most qualified contractor with the best plan.
Once the contract is underway, there must be a means of supervising the contractor. This verification may come from either inter- nal or external sources, but it must ensure that the services are fulfilled according to the programmed guidelines and specifications.
The contract should provide for financial penalties if services are not provided accord- ing to the specification. In the case of gross negligence or repeated performance deficien- cies, the city should have the ability to call on
the guarantee provided by the contractor or its parent company.
In providing environmental services, it is vital to promote citizen awareness of and cooperation in the overall environmental effort. The degree of success of an environ- mental program may well depend on citizen support.
The contractor should be able to demon- strate its experience in establishing detailed and tailor-made programs to generate the interest and involvement of residents and community officials alike in making their city or area a cleaner and healthier place to live in.
The purpose of the programs is threefold:
to instill confidence in the people about the service they will be receiv- ing; to develop the private citizen's aware- ness in keeping his city clean; and to demonstrate to the people how their cooperation is the key to main- taining a clean environment.
The methods will vary by city and country, but some general examples include:
school programs to teach young peo- ple the importance of environmental protection; neighborhood and volunteer organi- zations; the media to publicize improvements and activities; working openly with political groups to show them the extent of the activi- ties and their benefit to all; and special events which call attention to keeping the city clean.
CONCLUSION
Privatization of environmental services brings substantial and important benefits that accrue with the competition inherent in contracting the services of private companies. Competition is beneficial in that it forces effi- ciency, innovation. creativity, investment and ultimately, improved results.

When a government decides to ask private contractors to bid on its environmental ser- vices needs, it has taken the first step in cre- ating a competitive environment.
Through a tender process modeled on the points raised, experienced and professional contractors will present bids which reflect the competitive nature of the entire bidding pro- cess. This will ensure that the contracting authority receives the best value for its money.
Using responsible and experienced private contractors for environmental services rang- ing from refuse collection to construction and operation of complex chemical waste disposal facilities has produced clean, healthy and
more enjoyable environments for countless cities worldwide.
The competitive atmosphere created by far- sighted government authorities contracting private companies results in more efficient, thorough and productive services at a lower cost. Moreover, it frees the government authorities from the difficulties of operations and allows them to devote their energies to supervising, managing and establishing poli- cies--the true challenges of governing.
Privatization of environmental services is an ongoing and growing activity because the concept is well tested and proven. Govern- ment authorities should consider this attrac- tive alternative to public provision of services.

Session 5: Community Awareness and Participation in Waste Management
Local Government Initiatives in Waste Management
CHALERM PHROlWWERT 0 ) of the Governor
Phuket ~ i l a n d
PHROMLEm, C. 1992. Local government initiatives in waste management, p. 185- 188. In T.-E. Chua and L.R Garces (eds.) Waste management in the coastal areas of the ASEAN region: roles of governments, banking institutions, donor agencies, private sector and communities. ICLAFW Conference Proceedings 33, 218 p. Ministry of the Environment, and Canada- ASEAN Centre. Singapore; Asian Development Bank, and International Center for LiYing Aquatic Resources Management, Philippines.
ABSTRACT
Waste management is an important element of resource management. To solve water pollution and garbage problems in Phuket, Thailand, officials at the provincial, district and community levels strictly enforce environmental regulations and encourage the building of people's awareness and participation, as well as cooper- ation between government and private sectors.
INTRODUCTION
The province of Phuket, southwest of Thailand, is composed of 39 small islands with a total land area of about 570 lanz. The main island. Koh Phuket is the biggest and is located in the Andaman Sea in the Indian Ocean. About 867 krn from Bangkok by road. it is 49 km long and 21.3 Irm at its widest spot. The terrain is mostly hilly slopes cover- ing about 33% of the island.
Administratively. Phuket is divided into three amphoes (districts): Muang. Thalang and Katu. These are further divided into 17 tarnbons (subdistricts) and 107 villages. The
local administration is composed of a provin- cial organization, a municipality and five sanitation districts. The provincial capital is the town of Phuket, which has a population of approximately 48,340 in 1990 and a land area of 12 W . It serves mainly as a local housing and commercial complex.
The islands possess a rich variety of resources including clear ocean waters. a uniquely beautiful landscape, white powdery beaches. mineral deposits and an abundant marine life. These have provided the people with a vigorous and diversified economy and a high standard of living.
Faced with the pressures of rapid modern- ization. the government and the people are thus challenged to sustain their growing economy without degrading their natural resources. An important issue that must be considered is waste management.
WASTE MANAGEMENT ISSUES AND PROBLEMS
Water pollution
The Office of the National Environment Board reported that in 1989, the general water quality was good. Thus, maintaining it is a priority.
The major sources of pollution include sil- tation caused by land-based cut-and-fill operations, tin mining and poorly treated domestic sewage as well as the industrial outfalls from rubber and seafood processing facilities.

The only water treatment plant on Phuket is found at Patong Beach in Katu District, 14 km from the provincial capital. At present, Patong Beach is the island's most developed beach, with cabin and bungalow complexes. hotels, bars, nightclubs and discotheques. But one treatment plant cannot handle the beach's polluted waters.
Hotels which are being expanded along the west coast beaches of Rawai. Kata. Karon and Bangthao, are a potential source of pollution which needs careful monitoring.
Garbage
Inappropriate development and improper land use are evident in the huge quantity of garbage--about 120 t--that is buried in sani- tary landfills each day. The rest of the garbage collected from other parts of the island is dumped in a deserted mangrove area near the town of Phuket. The island is running out of dumpsites and new disposal sites have become quite scarce. This is aggra- vated by the cabinet resolution which pro- hibits the use of existing disposal sites for the protection of the environment.
W m MANAGEMENT POLICIES AND STRATEGIES
Because waste management is part of resources management, the provincial gov- ernment follows policy guidelines to: (1) get the commitment of local leaders and resi- dents to waste management by malung them aware of the severity of environmental threats to their own community; and (2) explore ways and means to effectively enforce environ- mental regulations. These are essential to programs designed to improve the manage- ment of resources and waste, and minimize the negative environmental impacts of devel- opment.
Various management programs and pro- jects being implemehted employ these strate- gies:
restore damaged or overdeveloped areas; preserve areas untouched by devel-
opment for the benefit of future gen- erations; develop sound management princi- ples; and enforce strictly environmental laws and regulations.
Specifically, sewage treatment plants shall be constructed in residential and commercial areas. Facilities for collection, treatment and drainage will be installed, a s needed. In the pipeline are sewage and water treatment plants for the town of Phuket and the beaches of Katu and Karon.
Provincial authorities are also submitting new proposals for the cabinet's reconsidera- tion of its resolution to prohibit the use of existing disposal sites. They are also seriously exploring modem methods in waste man- agement (e.g.. incineration) that are suitable for Phuket.
LOCAL GOVERNMENT EFFORTS IN WASTE MANAGEMENT
At present, waste mwagement in Phuket is a crucial environmental issue. The local gov- ernment has started taking measures to solve waste disposal problems. Apart from the con- struction of sewage treatment plants in well- developed areas, hotels are required to have on-site treatment facilities, especially for water that will be discharged into public sew- ers. Individual homes are required by law to install modem septic systems. Government inspectors have been deployed to enforce regulations and punish violators to forestall environmental hazards.
Local participation is a virtue highly prized in dealing with waste management problems. The involvement of the community folk indi- cates that needs are more accurately expressed. and services and technologies are more widely disseminated and used. The suc- cessful management of several development schemes has usually involved local leaders and communities in various aspects of pro- gram design and implementation. Several government programs are based on local par- ticipation which is an important success factor. Civic groups such as the Lions Club. Red Cross and women's clubs organize

cleanup campaigns in cooperation with the government. To complement these efforts, public senrice messages are aired frequently over local TV and radio stations.
The ability to elicit full cooperation from local residents depends primarily on the attitudes and the personal effort of leaders from the provincial, district and down to the village levels. They must involve residents in the decisionmaking regarding local issues. The degree of involvement varies, too, with the level at which it is practiced.
The respective roles of local leaders
1. The provincial governor is: chairman of the provincial develop- ment committee and the joint com- mittee of government and private sectors which are responsible for the formulation of policy guidelines for natural resources development and environmental protection schemes throughout the province; head of all government agencies responsible for dealing with the problems of the people, which includes maintaining law and order; and project director and coordinator of various programs of the central govemment.
2. The district governor is: chairman of the district develop- ment committee responsible for the planning, coordination and moni- toring of activities of all programs/ projects in his district, and super- vision of policies set at the provin- cial level; chief inspector and protector of all natural resources in the district; and head officer of all govemment agen- cies in the district. He is responsi- ble for local services and keeping law and order.
3. The village headman: assists the provincial and district administrators and other decision- makers in analyzing community problems; acts as a conduit between these
officials and the people who tend to district or ignore government prog- rams with complex procedures or requirements; and encourages grass roots participa- tion.
The public-private linkage
Cooperation between public and private sectors is essential in the execution of gov- ernment-sponsored programs. For waste management, the private sector's compliance with new regulations is essential. In addition. there have been several meetings between representatives from concerned government agencies and the private business sector to discuss and seek solutions to garbage collec- tion and water treatment problems. The pri- vate sector has agreed to finance waste man- agement facilities. the construction of which has been delayed due to insufficient govern- ment funds.
CONCLUSION
Clearly, attaining the goal of economic growth with social equity demands that closer attention be paid to the condition of the bio- logical and physical environment. Both natu- ral and human resources must be appropri- ately developed to satisfy basic human needs and sustain a higher standard of living.
In Phuket, efforts to address waste man- agement issues imply a reorientation of social goals and a reduction of the demands placed on natural resources. The extravagance that has characterized the island's production and consumption patterns must be replaced with conservation (e.g., through recyclingl and innovative technologies.
In summary, these are the guidelines tack- ling waste management problems in Phuket:
1. Special attention must go to the natu- ral resources development planning at each level. The environmental impact of development and waste manage- ment problems must be clarified in both short and long terms.
2. The local populace must be encour- aged to participate in planning and

implementation processes because they will be affected by modernization and change.
3. People's awareness should be pro- moted in the community because an informed public can make intelligent decisions on waste management options. The media can be used for information campaigns and other instructional materials.
4. Preconditions for community devel- opment should be established through appropriate planning strategies.
5. Joint ventures between the govern- ment and private sectors should be promoted.
6. Rules and regulations on resources management that will lead to improved waste management must be strictly enforced.
Public Awareness and Education Towards Waste Management
MANUEL 6. SATORRE, JR. PhiZippfne Environmental Jownal[sts, Inc.
c/o Newstfnae, Newstime Building D. Jakosalem Street Cebu City 6000
Phuippines
SATORRE, M.S., J R 1992. Public awareness and educa- tion towards waste management, p. 189- 19 1. In T. -E. Chua and L.R Garces (eds.) Waste management in the coastal areas of the ASEAN region: roles of gov- ernments, banking institutions, donor agencies, pri- vate sector and communities. ICLARM Conference Proceedings 33, 218 p. Ministry of the Environment, and Canada-ASEAN Centre, Singapore; Asian Devel- opment Bank, and International Center for Living Aquatic Resources Management, Philippines.
ABSTRACT
Public awareness and education is a prerequisite to good environmental quality and effective waste manage- ment. Thus, the Philippine Environmental Journalists, Inc. (PEJI) has an ongoing environmental awareness pro- gram since 1987. An informed public is capable of prompt action that can help reduce and control waste generation.
Other ways of increasing public awareness and edu- cation include integrating environmental concepts in the educational system, particularly at the elementary and secondq levels, and training village communicators (VCs) who can link up with journalists for environmental awareness programs.
Waste management in the Philippines is a relatively new concept. Thus. it is not sur- prising that sanitary landfills, incinerators, sewerage systems, water treatment plants, recycling plants and other waste management facilities are practically unheard of in many of the country's 74 provinces. 61 cities and hundreds of towns.
A semblance of waste management is found in industrial zones and some affluent resi- dential communities. But in many areas. collected solid waste is thrown in open dumps. some of which are located in coastal areas. Small town residents either bum and bury their garbage in the& backyards or dump it into rivers, creeks, and estuaries. These polluted waterways lead to the sea. practically making it a big wastebasket.
Metro Manila has the country's only public sewage collection and water treatment sys- tem. which serves a mere 12% of Metro Manila's population. The rest relies on septic tanks. Untreated and partially treated domestic and industrial wastewater are discharged into waterways, accounting for about 30% of the organic pollutants that are degrading Metro Manila's water resources.
The disposal of hazardous and toxic waste is another problem. In the province of Cebu, some firms at the Mactan Export Processing Zone export their hazardous and toxic waste because these cannot be handled locally.
The government's waste management options are limited by the lack of financial resources. Billions of pesos are needed to provide every town, city and province with proper waste disposal and treatment facilities.
This is where public awareness and educa- tion can prove vital, as the limited financial resources can be compensated for by the people's prompt action to control waste buildup.

Public awareness and education may also help decisionmakers both in the government and private sectors to initiate waste manage- ment programs funded by aid agencies and private groups. An informed public can also be encouraged to raise funds for the needed waste management system.
In the Philippines today, more people are becoming aware of the need to manage waste through the government and education sec- tors, nongovernmental organizations and the media.
Media's all-out campaign involves a daily barrage of environmental reminders and sto- ries on print, radio and television. The PEJI. a journalists' group affiliated with the Asia- Pacific Forum of Environmental Journalists, has been undertaking a massive environ- mental awareness program since 1987.
The PEJI members, who come from print, broadcast and television media undergo training workshops on environmental reporting and contribute to Tlerra, the P E . newsletter. Every journalist-member is encouraged to write environmental articles in their own media outlets. Copies of such sto- ries or clippings are sent to the PEJI office in Cebu where they are reproduced for distribu- tion to members and other interested groups. Materials on environmental issues and reports are distributed to members all over the country now numbering close to 100. These have become the bases of many advo- cacy reports calling for environmental ' conservation and waste management. Some of the reports are directed at the government which is believed to have the resources, albeit limited, to implement such programs.
The membership of PEJI is not concen- trated in highly urbanized areas such as Metro Manila. Metro Cebu or Metro Davao; it covers even the remotest parts of the country. Environmental articles and advertisements in national newspapers and major radio stations often find their way in weekly community papers and small town radio stations.
In recent years, the impact of the aware- ness program has been very encouraging. Some of the reports have resulted in actual community action. Since waste management facilities are expensive, c o m i t i e s are being mobilized to reduce the amount of waste being discharged into the environment. Urban communities recycle bottles and tin
cans, and fanning communities compost biodegradable matter. Cleanliness drives have become a common measure to prevent indis- criminate waste disposal. Such campaigns are now ongoing in practically all major cities and towns in the country.
In Metro Cebu. for instance, continued media prodding has prompted the govern- ment to plan the construction of a sanitary landfill and an incineration plant which will cost millions of pesos. Undertaken by the Metro Cebu Development Program, the project will involve the construction of similar facilities in the Central Visayas cities of Tagbilaran in Bohol and Dumaguete in Negros Oriental. Funding is from the Over- seas Economic Cooperation Fund of Japan.
The larger goal of a national environmental education is now being studied carefully by the govemment. There is a move to integrate environmental concepts in the elementary and secondary school curricula. Such con- cepts can also be incorporated in the tertiary and graduate courses in ecology, environ- mental science, resource management and resource economy, including research and development.
Schools are also being tapped to take the lead in the development of folk media as a means of propagating environmental mes- sages. Environmental themes can be woven into the performing arts such as drama, folk song and dance, and in the visual arts like painting and sculpture.
Many environmentalists in the Philippines. more particularly those in media, are seri- ously studying the possibility of training VCs who can link up with the regular journalists for environmental awareness and education programs. The PEJI, for instance. is prepar- ing a module to implement this concept in small villages.
The prospective VC will have to undergo mass communication and basic ecology training which will help him identify envi- ronmental concerns in his own community. He should have sufficient knowledge of the forests, wetlands, river systems and lakes within his area. He should also know how waste is managed in his community. Thus. environmental problems needing immediate attention can be brought to the attention of a greater number of people, including deci- sionmakers. Solutions to these problems can

then be found and conservation programs can be carried out more effectively.
Clearly, public education and awareness is necessary for good environmental quality and effective waste management. It can eventually develop a stronger political will to do some- thing about the country's present environ- mental problems.

The Role of Nongovernmental Organizations in Waste Management
R. SENTHIRAJAH Environmental Protection Society Malaysla
KE Minconsult S.B. Level5 Blk. G. Central, Pusat Bandar DamanSara
50350 Kuala Lumpur Malaysia
SENTHIRAJAH, R 1992. The role of nongovernmental organizations in waste management, p. 193-195. In T.-E. Chua and L.R Garces (eds.) Waste management in the coastal areas of the ASEAN region: roles of gov- ernments, banking institutions, donor agencies, pri- vate sector and communities. ICLARM Conference Proceedings 33, 218 p. Ministry of the Environment, and Canada-ASEAN Centre, Singapore; Asian Devel- opment Bank, and International Center for Living Aquatic Resources Management, Philippines.
ABSTRACT
Nongovernmental organizations (NGOs) have been known to provide the main channel for public participa- tion in the govemment policymaking process. In waste management, they can be categorized as waste or non- waste generators. This paper discusses the role of NGOs that are nonwaste generators and of those that are con- cerned with environmental and conservation issues.
BACKGROUND
There has been considerable public interest in environment and pollution in the last few years in the ASEAN region. This trend has corresponded closely with the shift toward and emphasis on industrialization in the region. Recent demonstrations in industrial- ized countries indicate that a significant
percentage of the citizenry regards environ- mental issues as of major social importance and as warranting firm governmental com- mitment. This interest also reflects the citi- zens' general knowledge of the extent to which the environment has been and is being damaged.
Consequently. the environmental issue has emerged as a major political one. Hence there is a need for greater sensitivity to the public's views on the decisionmaking process by the government and the public sectors.
The NGOs, specifically the public interest groups, provide the main channel for public participation in the government's policy- making process. The NGO system is actually more important as a channel in environmental politics than in other areas of social concern because the political parties tend to neglect the environmental issue "anchored as they are to the interests of industry."
In waste management, NGOs can be cate- gorized as waste generators or nonwaste gen- erators. In the following discussion. NGOs refer to nonwaste generators that operate for the benefit of society, specifically, environ- mental and consenration organizations. These NGOs also belong to social action groups which are generally concerned with the society. The Environmental Protection Society of Malaysia (EPSM) , Sahabat Alam Malaysia

and the Malayan Nature Society (Malaysia) are examples of such groups.
THE ROLE OF ENVIRONMENTAL/ CONSERVATION NGOS
As public watchdog
Environmental/conservation NGOs sexve as public watchdogs. They continuously monitor alarming situations which could result in loss of life and/or have adverse impact on the environment.
News is usually obtained from print and broadcast media, and from affected individu- als or groups. The NGO then resorts to the following options:
initiate dialogue or open debate with the concerned government or private agency for explanations; organize public forums and/or cam- paigns; represent the affected individual or group; and take direct action (as is possible in some countries).
The media plays a vital role in information dissemination. It alerts the public and mobi- lizes it for support. It provides background information on the waste problem or situa- tion. Unfortunately, the media is also known to reverse its role unpredictably. It could "blackout" important and sensitive issues or simply reduce a highly sensitive issue into a low-key, mundane one.
Public awareness
While the media is a vital element in rais- ing public awareness, it cannot be depended upon as allies of NGOs at all times.
As an issue drags on and becomes less sensational, the media drops the coverage. It is the NGOs who pursue the issue to its res- olution. In EPSM. we keep track of the out- standing issues and flag them in seminars, conferences and dialogues with government departments, etc. A s long as these issues are unresolved, they remain outstanding items in our records.
To maintain independent of the mass media, NGOs organize seminars, forums and exhibitions as well as periodicals. In EPSM. we give out "polluter/preventer" awards as a way of drawing public attention to the con- cerned individuals or organizations.
Environmental network
The NGOs circulate magazines, bulletins and books among themselves to be up-to- date on environmental issues and developments. Recently, environmental networks have been organized for updating purposes, too.
The Malaysian Environmental and Conser- vation Network (MECN) and the Regional Environmental Network for Asia-Pacific have the potential to exchange news and collabo- rate in mobilizing support in a short period. PEGASUS, a database system on environ- mental/conservation matters based in Aus- tralia, is also available to the network organi- zations.
This system and other facilities enable the ASEAN NGOs to interact with their counter- parts regarding experience and technical expertise. For instance. NGOs representing the public have access to an independent expert's viewpoint on coastal resources management issues in evaluating the motives or reasons of the government/private agencies concerned.
Ideally, environmental and conservation NGOs should rely on their local scientific and engineering counterparts for primary data and other resources. But this is not the case in Malaysia.
SUSTAINING AN NGO
In the ASEAN region, an NGO has to oper- ate and sustain itself in an unfriendly atmo- sphere. There are numerous, little-known obstacles which hinder its functions and sometimes threaten its very existence. It operates at a major disadvantage in relation to the defenders of the status quo.
These obstacles, which vary d th in the region, include low membership, ineffective

sanction. hostile political conditions, funding difficulty and activist burnout syndrome.
Although an NGO, as a vanguard of envi- ronmental issues, represents the public, it remains unattractive in terms of membership mainly because it does not bring direct bene- fits. Without a large membership, it is thus difficult to pose as a credible and representa- tive organization.
An NGO generally lacks the very effective sanctions which the more powerful economic sectoral groups possess. It does not have the power exercised by a trade union that rests upon its indispensability, i.e.. a union provides services without which society cannot operate. Strikes or boycotts quickly get the public's serious attention.
The hostile political condition in some ASEAN member-countries serves to prevent spontaneous public articulation and sup- press NGO activism. There are varying degrees of democratic space, however. In the Philippines for instance. NGOs have the power to take direct legal action on a pollut- ing factory. Official Secrets Act and the Inter- nal Security Acts are some of the glaring manifestations of limited democratic space in other countries where detention-without-trial and bans on environmentalists are not unknown.
THE MALAYSIAN EXPERIENCE
Between 197 1- 1975, Karnpong Kuala Juru experienced siltation and pollution of the river mouth which feed the Strait of MaIacca (Malaysia). This issue was widely publicized by the Consumers Association of Penang. By 1975, the river was severely polluted and the fishermen's livelihood destroyed. These were caused by essentially poor planning and uncontrolled emuent discharge from factories located along the river.
The refusal of the governrnent/private sec- tor to respond to NGOs has been consistent. The ongoing massive tourist project in Pulau Redang is a glaring case.
Pulau Redang, an island 45 krn off the coast of Kuala Trengganu, is acclaimed as having the most beautiful marine life in Malaysia and is comparable to the Great Bar-
rier Reef in Australia. In 1970, concerned environmental groups and local scientists recommended that Pulau Redang be set aside as a national park. Thus, it was gazetted as a marine park in 1985. In 1989. the Depart- ment of Fisheries commissioned the Malayan Nature Society to prepare guidelines for the establishment of a Pulau Redang State Park.
At present, however, this island marine park is being threatened by a M$342-million tourist project which will include a golf- course, hotels, condominiums, holiday villas. bungalows and chalets1
This project commenced even before the preliminary environmental impact assess- ment was approved by the Department of Environment. Eventually, erosion and silta- tion due to this project will invariably kill the corals and aquatic flora and fauna; degrade the mangrove ecosystem; and finally destroy the paradise-like island.
CONCLUSION
Clearly, a coastal zone management pro- gram cannot be treated in isolation. It cannot confine its attention to coastal areas only because the source of waste lies in the hin- terland and offshore.
Application of the proverbial "prevention as a better cure" is recommended as a startmg p o i n t i n a waste management program. Emphasis should therefore be placed on the use of low and nonwaste technology; "pollution prevention pays" technology, and "womb-to-tomb" concept (where a polluter has total responsibility).
It is extremely important to note also that this conference will be reduced to a mere academic exercise if an implementation pro- gram is not realized. The enforcement of this program will, in the long run, give more meaning to this conference.
September 199 1: M$2.75 = US$1.00.

Summary and Recommendations
Waste Management in the Coastal Areas of the ASEAN Region: A Need for Action
CHUA THIA-ENG LEN R. GARCES
International Centerfor Living Aquatic Resources Management
M.C.P.O. Box 1501 Makati Metro ManUa
Philfppines
CLINTON J. EDMONDS UMA Engineering Ltd 5080 Commerce Blvd. Missisauga, Ontario
Canada
CHUA. T.-E., L.R GARCES and C.J. EDMONDS. 1992. Waste management in the coastal areas of the ASEAN region: a need for action, p. 197-205. In T.-E. Chua and L.R Games (4s . ) Waste management in the coastal areas of the ASEAN region: roles of govern- ments, banking institutions, donor agencies, private sector and communities. ICLARM Conference Pro- ceedings 33, 2 18 p. Ministry of the Environment, and Canada-MEAN Centre, Singapore; Asian Development Bank, and International Center for Living Aquatic Resources Management. Philippines.
ABSTRACT
The continuing degradation of the MEAN coastal environment is the result of population growth, urban- ization, industrialization and inadequate waste manage- ment practices. The realization that coastal zone use is not sustainable has brought about several multilateral initiatives in marine pollution control.
The key elements in integrated waste management include: cooperation among the ASEAN members in the development of waste management strategies, tech- nology, manpower and information exchange; a multi- sectoral approach to environmental projects; a strong political will; and public awareness and community participation.
INTRODUCTION
The Conference on Waste Management in the Coastal Areas of the ASEAN Region
assessed the severity of the environmental threats posed by waste disposal, especially to the coastal zone in the ASEAN region; explored and demonstrated the availability of technologies (especially low-cost ones) and methods in waste management appropriate for developing nations; explored ways in which international banking institutions and donor agencies could assist the ASEAN region in developing and implementing waste management schemes; and solicited the commitment of ASEAN political leadership in the effective implementation of environmental regulations and waste management schemes. Substantial recommendations for action were then made.
This paper summarizes the salient points discussed during the conference and the holistic, institutional and legal bases on which the "Singapore Resolution on Waste Management in the Coastal Areas of the ASEAN Region" was formulated.
ENVIRONMENTAL IMPACTS OF WASTE DISPOSAL ON MEAN COASTAL AREAS
General
In 1989, the total population of the MEAN region was 325 million, which is expected to

Table 1. Estimated BOD Wing of sewage discharges and daily solld waste disposal in coastal arras of the MEAN rcglon.
Brunei Moncsia Malaysia Phillpplnes Sfngaporr ?hailand Total Dawsalam
Total populaUon [milllonl 1989 Annual growth rate l9b) 1966-1990 EsUmatcd populatbn /ndlHonl#XX) % population in coastal arca Coastline length 0
Soura: Adapted from Lec thls voL
reach 397 million in the year 2000 (Table 1). Roughly 70% lives in and depends on the coastal areas for livelihood.
The coastal areas of the region have been adversely affected by inadequate waste man- agement practices. The resource base of the coastal area inhabitants (e.g.. fisheries) is deteriorating. Also, many of the coastal areas are now unsafe for water contact recreation. These areas will deteriorate further due to population growth, urbanization and indus- trialization.
The major pollution sources are land-based activities, i.e.. municipal, agricultural and industrial, and activities at sea such as ship- ping and oil development and production.
Domestic sewage
The most extensive municipal sewage pollution is found in the Upper Gulf of Thailand. Manila Bay. Strait of Malacca, West Coast of Peninsular Malaysia, West Coast of East Malaysia. North Coast of Java Island and Jakarta Bay.
In 1989, the estimated biological oxygen demand (BOD) loading in the coastal areas of
the region was 9,800 t/day (Table 1). only 2.000 t of which are treated. It is expected to reach 14.000 t/day in the year 2000.
Inadequately treated domestic wastes may introduce pathogens to the coastal receiving waters, which are of potential h a m to human and other living organisms; reduce oxygen in the waters from BOD loading; and result in poisoning of aquatic life by heavy metals and organic toxins.
Typically, extensive collection systems are few. Almost all major metropolises in the region, except in Singapore, lack sewage treatment systems. In many metropolitan areas, especially those outside the affluent core and newly developed districts, construc- tion of piped sewerage installation would be extremely difficult and disruptive because of traditional settlement patterns. Most house- holds have individual subsurface disposal systems which sometimes malfunction. sending sewage to surface drainage channels. The situation is aggravated during the rainy season.
In the Philippines, only Metro Manila has a sewerage system. It serves only the more densely populated areas (12% of the popula- tion). Sewage is discharged untreated into Manila Bay.

In Jakarta, Indonesia. conventional sewers are to be installed in selected areas; and in less affluent areas, experimental sewers. The subsurface disposal systems for approxi- mately 1Wh of the population are to be improved.
In Singapore, almost 90% of the population is sewered, and sewage is treated before being discharged into the sea. Effluent is also used as a processed water supply by industries and factories.
Seven cities in Thailand operate wastewater treatment plants. The Public Works Depart- ment plans to build wastewater treatment systems in 67 cities over the next 12 years. Almost 95% of the urban households have modem pour-flush or cistern toilets.
Solid waste
Increasing population densities and the absence of adequate collection and disposal facilities for municipal solid waste have also resulted in increasing the refuse entering and clogging surface drains, and eventually being flushed into coastal waters.
The per capita solid waste generation esti- mates in the region range from 0.5 to 2.0 kgJday (Table 1). In 1989, roughly 94,000 t/day were disposed of in designated disposal sites. This excludes uncollected garbage that was disposed of directly or indirectly into watercourses or coastal areas.
Municipal refuse has also been used for land reclamation in these areas. This has resulted in leachate containing heavy metals and plastics dispersion in the marine environment and destruction of sensitive ecosystems.
Solid waste management studies have been undertaken and plans have been developed for Brunei Darussalam, Jakarta, Bangkok. the eastern seaboard of Thailand. Manila and parts of Malaysia. The existing disposal systems are open dumpsites, landfills and incineration.
Industrial and agricultural wastes
More than 50% of manufacturing indus- tries in the region are located along river banks or in coastal regions. They are found mainly in the Manila Bay area. the inner Gulf
of Thailand, along the Strait of Malacca and the west coast of East Malaysia, and on the north coast of Java Island (particularly in Jakarta Bay and off Surabaya). Most indus- trial plants in Southeast Asia also lack waste treatment facilities.
Most of the industrial wastes originate from food and beverage processing, palm oil and rubber manufacturing, pig and livestock farming, tapioca starch industries, commer- cial fertilizer production, textile manufactur- ing, pulp and paper industries, tanneries and sugar refineries.
As early as 1976 and 1980, experts have identified oil pollution as a principal concern of the region. Pollution originates from both exploration activities and the transport of oil through the Southeast Asian seas. Oil spills have occurred, particularly in the Strait of Singapore and the Strait of Malacca.
The coasts of the region are contaminated with oil, particularly in areas of major oil exploration activities. In the Philippines and elsewhere, chronic localized petroleum hydrocarbon pollution problems ensue due to weak law enforcement and discharges from\ small vessels and oil terminals. Although tar balls are frequently considered a significant problem, chronic oil spills are much more significant biologically.
In Singapore, waste from oil tankers is treated at the Slop and Sludge Treatment Centre. Other harbors do not have oily water receiving and treatment facilities.
Other pollution sources include agricul- tural runoff, halogenated hydrocarbons in pesticides, and heavy metals. Siltation due to a variety of unsound management practices, including dumping of mine tailings, is a sig- nificant waste management problem. Table 1 presents the usage level of fertilizers and pesticides in some of the ASEAN members. Clearly, the Philippines and Thailand are the major users of fertilizers and pesticides. respectively.
Heavy metals. i.e., lead, mercury. cadmium and silver, are discharged by mining opera- tions and other industries.
Hazardous waste problems are beginning to emerge in concentrated industrial zones such as in Jakarta. Bangkok. Manila and Kuala Lumpur, although these are not as serious as those of many industrialized countries.

PRESENT WASTE MANAGEMENT INrnTIVES
International initiatives
The essential linkage among terrestrial, aquatic and marine components of the envi- ronment is clearly seen in the coastal zone. Through water movement and the mobility of biological resources, the contiguous nature of coastal zones, seas and oceans supersedes political and national boundaries: each nation can detrimentally affect the environ- ment and coastal resources of its neighbors. Thus, several multilateral initiatives have been taken to cooperate at the global and regional levels in the control of marine pollu- tion from land-based and other sources. A n estimated 80% of marine pollution is derived from land-based sources.
An effective resolution for coastal environ- mental quality will depend upon international or regional cooperation in achieving common minimum principles, guidelines and stan- dards. To date, these are the precedents:
1. Recommendations adopted by the United Nations Conference on the Human Environment (June 1972)
Principle 21: "States have ... the responsibility to ensure that activi- ties within their jurisdiction or control do not cause damage to the environment of other States or of areas beyond the limits of national jurisdiction". The Action Plan adopted at Stock- holm includes Recommendation 86(0 which urges governments to strengthen national controls over land-based sources of marine pol- lution. Recommendation 92(b) urges gov- ernments to adopt national mea- sures for the control of "all signifi- cant sources of marine pollution. including land-based sources" and coordinate their actions regionally and where appropriate on a wider international basis.
2. 1982 Convention on the Law of the Sea Drawing upon the Stockholm docu- ments, the convention lays down the
fundamental obligation of States to protect and preserve the marine envi- ronment (Art. 192):
States are required to take all mea- sures to prevent, reduce and control pollution of the marine environment (Art. 1951 11). States are obliged to take measures against causing pollution damage to other States and their environment. (Art. 194121). These measures must include those designed to minimize the release of toxic, harmful or noxious substances from land-based sources, from or through the atmosphere, or by dumping (Art. 194 [31[al). States must: - adopt laws and regulations; - endeavor to harmonize policies
at the regional level; - endeavor to establish global and
regional rules, standards, rec- ommended practices and pro- cedures.
All these must take into account the economic capacity of develop- ing States.
Although no global, legally binding instru- ment has been adopted, nine regions have concluded general conventions covering all sources of marine pollution and three regions have specific agreements on land-based marine pollution (Table 2). The control of sea- borne sources of pollution has been addressed (Table 3). Also, a set of recom- mended actions, the Montreal Guidelines, has been drafted under the sponsorship of the United Nations Environment Programme (UNEP) for the protection of the marine envi- ronment against land-based sources of pollution (UNEP 1985).
Some of the common elements of the four instruments with specific requirements are:
The defmition of land-based sources needs clarification, particularly with regard to fvred and mobile offshore sources; some specific sources should be identified for regulation. Two categories have been developed for the control of noxious and harmful substances based on toxicity, persis- .tence and bioaccumulation:

Table 2. Regional agreements related to the prwention and control of marine pollution.
?Srpe/characteristics Name Application
Comprehensive with specific rules Helsinki Convention (1974) Baltic Sea area covering all sources of marine pollution
UNEP Regional Seas Programme Oslo Convention (1972) Frameworks with general principles Helsinki Convention (1974) and rules applicable to various Paris Convention (1974) sources of pollution including Barcelona Convention (1976) land-based sources Kuwait Convention (1978)
Abidjan Convention (198 1) East Asian Seas Action Plan (198 1) Noumea Convention ( 1986)
NE Atlantic & N. Sea Baltic Sea area NE Atlantic Mediterranean Sea Persian Gulf West and Central Africa ASEAN region South Pacific region
Specific to regulation of land- Paris Convention (1 974) NE Atlantic b*ed sources of marine pollution Athens Protocol to the Barcelona Mediterranean Sea
Convention (1980) Quito Protocol to the Lima SE Pacific
Convention (1981)
Table 3. International agreements relating to sea-borne sources of pollutants affecting coastal zone resources.
International Convention for the Control of operational discharges of ships of Pievention of Pollution from a. oil (Annex 1) Ships 1973 (Modified by MARPOL 73/78) b. noxious liquid substances (Annex 11)
c. harmful substances (Annex 111) d. sewage (Annex IV) e. garbage (Annex VJ
London Dumping Convention (1972) Control of disposal a t sea of wastes loaded for that purpose
- Hazardous (Black List). Parties are required to endeavor to prevent. control, reduce and eliminate substances on this list.
- Others (Grey List). Parties are required to progressively reduce or, in some cases, strictly limit the substances.
The question of the need for a uni- versal Black List is raised. Relative to the development of control programs and measures. the agree- ments vary from States being obliged to cooperate in the development and adoption of specific programs, guide- lines, standards or regulations regarding grey substances. to States elaborating and implementing the necessary programs.
Monitoring, however, to assess sys- tematically the pollution levels and evaluate the effects of measures taken, is a more complex operation. Each instrument notes the duty of States to act so as not to transfer directly or indirectly, damage or haz- ards from one area to another, or transform such pollution into another type of pollution.
The majority of existing regional framework areas have no instruments containing spe- cific regulatory standards. These instruments exist mainly in the regions where the required technologies and resources are available. Recent developments that open up new opportunities for coastal States to implement further measures are:
. - -
Emphasis is on cooperation in science the firm establishment of the exclu- and technology. which is taking place. sive economic zone (EEZ) or fishery

zone, giving the impetus for States to protect their resources and the widespread acceptance of the con- cept of integrated coastal zone man- agement, enabling the integration of waste management into the wider concept of resources management.
Regional initiatives
An ASEAN Experts Group on Environment was established in 1978 under the ASEAN Committee on Science and Technology to deal with environmental matters in the region. Of particular relevance to waste management is a project dealing with technology transfer in the treatment of effluent from rubber and palm oil indus- tries. The ASEAN Experts Group on Marine Pol- lution has prepared a contingency plan for the control and mitigation of marine pol- lution. The MEAN Subcommittee on Marine Sci- ence, also established in 1978. is coordi- nating and implementing three major cooperative programs, which are on: - tides and tidal phenomena which will
provide valuable information on water movement that could be used in the optimum location of ouffalls;
- living coastal resources which will assist in establishing criteria for the maintenance of environmental quality; and
- the ASEAN-Canada Cooperative Programme on Marine Science, Phase I1 which will, in part, assist in the development of criteria for protecting the marine environment. Established in 198 1, the Coordinating Body on the Seas of East Asia (COBSEA) aims to assess the state of the marine environment and to protect and manage the marine resources in the MEAN region. In 1982. COBSEA in collaboration with UNEP, drew up the East Asian Seas Action Plan involving research, prevention and control of marine pollution and monitoring in the seas surrounding the region. This plan also aims to promote the management of coastal activities that affect the
marine environment and the sustainable use of marine resources as well as to implement specific plans. The matters proposed by this plan directly relevant to waste management are: - regional advisory services for oil spill
control; - guideline setting for discharge of
wastes into coastal waters; and - marine dumping site selection for
hazardous waste. A major weakness of the plan is reported to be its uncertain financial basis.
In 1989, a workshop on the methodolo- gies of assessment of pollution from land-based sources was held in Singapore. The ASEAN Council on Petroleum (ASCOPE) was established to deal with the environmental consequences of the exploration for petroleum and natural gas. In 1990, the MEAN Senior Officials on the Environment (ASOEN) was esta- blished.
National initiatives
Table 4 indicates the extent of legislation enacted within the ASEAN region which is relevant to waste management in the coastal zone. National policies have also been pro- mulgated, environmental institutions estab- lished, training courses developed and attended, studies made, and science and technology applied, to waste management.
LESSONS LEARNED AND ?TIE NEED FOR ACTION
Waste management concerns
The three major aspects of waste manage- ment problems in the region are finances, policy and planning.
Most developing countries are beset by financial constraints. The lack of financial resources of most developing countries for modern pollution control facilities results in

203 Table 4. Summary of ASEAN legislation pertinent to waste management.
Nation Legislation Commentary
Brunei Darussalam Solid Waste Management Plan (1987) National Water Quality Standards
Study (1987)
Indonesia
Malaysia
Philippines
Singapore
Thailand
Public Water Law (1936)
Nuisance Ordinance ( 1926) (Amended 1940)
PD 7 (1973)
Ministry of Agriculture Directives (1973-1975)
Environmental Management Act (1982)
PROKASIH (1989)
Land Conservation Act (1960) Waters Enactment Act (Amended 1970) Mining Enactments 146/ 147 Street Drainage and Building Act (1974)
Local Government Act (1976) Rearing of Pigs Enactments (1975, 1980) Environmental Quality Act (1974)
(Amended 1985)
Republic Act 393 1 (Amended by Presidential Decree (PD) 984 (1964)
PD 1586 (June 1978/June 1982) PD 1 12 1 (1977)
Several other PDs
Prevention of Pollution of the Sea Act (1971)
Water Pollution Control and Drainage Act (1975)
Trade Effluent Regulations (1976) (Amended 1977)
Singapore Port Regulations (1977) Environmental Publtc Health Act (1978)
Fishery Act (1947) Toxic Substance Act (1967) Environmental Quality Act (1975) Sec 17 National Environment Promotion Bill
of 1976 (Amended 1978) Public Health Act (1941) and Factories Act (1969) (Amended 1975 and 1979)
Solid waste disposal
Disposal of industrial wastes into public streams
Industrial control standards and disposal of harmful wastes
Regulation of pesticide distribution, storage and use of pesticides
Registration, handling and use of pesticides
Basic provisions for the manage- ment of the living environment
Cleanup of rivers in various pro- vinces
Silt and erosion River pollution Effluent waters Trade effluent and domestic wastes
into rivers
Waste treatment required Environmental impact assessment Licences for polluting activities
(land, air and noise) with regula- tions for crude palm oil, raw nat- ural rubber, sewage and industrial effluents
National Pollution Control Commis- sion with powers to establish and enforce standards
Philippine Coast Guard responsible for preventing and controlling marine pollution
Disposal of mine tailings Philippine Environment Policy Philippine Environment Code (Sup-
plements PD 1 15 1) Environmental impact assessment National Environmental Protection Council
Provisions for protection of the environment and creation of agen- cies
Control of oil pollution and other contaminants
Control of effluent discharge from industrial, commercial, domestic and agricultural sources
Control of trade efluent discharges into sewers and watercourses
Protection of harbor environment Conirol of solid waste dumping
Protection of aquatic habitats Control of toxic substances Environmental impact assessment Omce of the National Environ-
ment Board Industrial efluent standards/pollu-
lion control facilities

inadequate collection systems, lack of man- power and technical capabilities, etc.
Although many countries have developed waste management master plans at the national or local level, particularly in sewage treatment, the question of policy arises. The implementation will require tax imposition which most policymakers would like to avoid. Multilateral or bilateral bank loans are possi- ble but waste management projects are not considered national priority.
Inadequate funding, legislation and enforcement by local authorities and a low degree of coordination among the different sectors and agencies concerned have con- strained waste management programs. particularly in Malaysia (Jaafar, this vol.).
Enabling legislation is largely in place in most countries but compliance is seldom monitored or enforced (Lee, this vol.).
Lack of public support is also considered a major obstacle in solving pollution problems. Thus, a preliminary risk assessment should consider public perception and resource uses; critical habitats and species; fate of pollutants; toxic hazard, persistence and natural detoxification mechanisms; and exposures (Van Veldhuizen and Aragones. this vol ).
Lack of public support could be attributed to insufficient attention to community par- ticipation in waste management. The key to successful waste management may not be funding alone but the energies and resources of the community.
Lessons learned
The experiences of Singapore (e.g.. the solid waste disposal scheme and the Singapore River project) and Malaysia (e.g., the treat- ment of palm oil and rubber effluents) can serve as examples of how capabilities can be developed, existing models modified and new technologies and management strategies adopted to suit local conditions and thus achieve a higher level of self-sufficiency.
Refuse incineration has been found to be a cost-effective waste disposal method of Singapore (Lim and Tan, this vol.; Ramstetter and Phua, this vol.). The contributing factors are sound planning, advanced technology. a well-trained workforce, and effective legisla-
tion and enforcement (Lim and Tan, this vol.). The government also encourages industries to minimize waste at source to cut down on materials use and waste disposal cost (Tan, this vol.) .
Singapore and many other countries have opted to engage private companies for envi- ronmental services such as waste manage- ment. The benefits of privatization include efficiency and consistency in refuse collec- tion. improved quality of services and cost savings (Smith, this vol.).
Singapore is the only nation in the region with centralized and coordinated waste man- agement activities in the Ministry of Envi- ronment. Among the rest of the ASEAN members, the responsibility is fragmented among many agencies. Thus, a central authority for waste management is recommended.
On the other hand, more emphasis should be given to waste reduction, recycling pro- cesses and the adoption of low- and nonwaste technologies. Recycling and resource recov- ery, which are generally well established in the region, should be reinforced. In addition. intermediate technologies should be devel- oped and implemented instead of improving sophisticated technologies (Wilson and Nair, this vol.).
The problem of environmental pollution is embedded in other more basic processes (e.g., urbanization) which require integrated and long-term solutions. The key elements of integrated waste management are a multi- sectoral approach to project implementation, a strong political will in moving environmen- talism across social, cultural and economic structures, and public awareness and participation.
The need for action
These are some directions the ASEAN members can take:
1. Cooperate among themselves to develop, harmonize and coordinate their waste management strategies and measures, including technology. manpower and information exchange.
2. Strengthen regional and national goals for environmental quality of coastal zones based on integrated

coastal resources management strategies. Undertake practical steps to prevent, control. reduce or eliminate the dis- charge into the coastal zone of sub- stances harmful to humans, marine and other living resources or that damage amenities associated with the coastal environment. Encourage the participation of com- munity and nongovernmental organi- zations (NGOs) in the development and implementation of integrated waste management. A s part of a global responsibility for sustainable development, encourage multilateral and bilateral funding agencies. including international and regional development banks, to develop more and vigorous technical and financial assistance programs and policies for waste management. These agencies could also be urged to integrate environmental concerns into development programs and projects, especially those that help protect the marine environment and coastal living resources.
Various sectors should undertake specific functions.
The Political Leadership. The political leadership must be strong enough to meet objections, forceful enough to harness all units involved in waste management, and imaginative enough to develop livelihood pro- grams out of garbage (Binay, this vol.). In addition, the government should encourage the participation of all sectors in waste man- agement, particularly in planning priorities.
The m-ivate Sector. Private sectors could provide services for waste collection, pro- cessing and treatment. Privatization of envi- ronmental services can mean more savings, improved reliability. better return on invest-
ments, eMcient budgetary management and greater access to technology.
Donor Agencies. Banking institutions could help ASEAN in environmental programs especially for technology transfer, technical manpower training, institutional strengthen- ing, policy reforms and investments. The spe- cifk beneficiaries of such assistance could be the national and provincial governments. universities (research and development), NGOs and the private sector (e.g., consulting firms).
The NGOs. The NGOs should serve as the public watchdog and continuously monitor situations which would adversely affect the environment. The media and NGOs should also be responsible for raising public aware- ness by organizing seminars, forums, exhibi- tions and using their periodicals. In addition, organizing village communicators who could link up with journalists would help in the awareness and education programs on the environment (Satorre, this vol.).
Community Leaders. Community leaders should give special attention to natural resources in development planning, creation of people's awareness in every community, participation of the local people in planning and implementation, and promotion of activi- ties that would lead to cooperation between the government and the private sector (Phromlert, this vol.).
REFERENCES
GESAR4P (Joint Group of Experts on the Scientific Aspects of Marine Pollution). 1990. The state of the m&e environment. UNEP Reg. Seas Rep. Stud. No. 115.
UNEP (United Nations Environment Programme). 1985. Montreal Guidelines for the Protection of the Marine Environment Against Pollution from Land-Based Sources. (Decision 13/ 18/11 of the Governing Council of UNEP of 24 May 1985).
ICLARM Contribution No. 824.

Singapore Resolution on Waste Management in the Coastal Areas of the ASEAN Region
issued bu The Conference on W& Management fn the Coastal Areas of the ASEAN Region
28-30 June 1991 Singapore
RATIONALE
Pursuant to statements made on different occasions in support of conserving and pro- tecting the environment and achieving sus- tainable development to secure the well-being of the people of the ASEAN today and in the future, including:
1. Policy Recommendations for Coast-. a1 Area Management in the MEAN Region (October 1988). 3.
The most serious management of issues are the following: ... declining water quality and pollution.
Setting of water quality standards is needed Integration of river and watershed management should be made, if possible, with water quality zones aflected by upland activities. Sampling and monitoring must be stan- dardized for the region or at least, on a national basis. Industries and sectors that violate standards should be close- ly monitored ... Kitakyushu Declaration regarding solid waste management in Asian Metropolises (October 1989). ... recognizing the need to consider SWM problems and issues in the broader context of rapid urbanization and its associated problems .... SWM systems should be deueloped withflex- ibility to accommodate preuailing local
socioeconomic conditions in Asian metropolises which are fast changing; should be extended to areas regard- less of affordability; governments have to be more committed.. to formulate national action programmes; ensure adequacy of financial base and avail- ability of basic laws: promote active community involvement; recognize the need for recycling; strengthen technical cooperation.. . . The Langkawi Declaration on the Environment (October 1989).
We, the Heads of Government of the Commonwealth are deeply concerned at the serious deterioration in the envi- ronment and the threat this poses to the well-being of present and future generations; ... The main environmental problems facing the world are... marine pollution, land degradation .... We ... commit ourselves to the following prog- ramme of action advance policies and programmes which help achieve sus- tainable development (development that meets the needs of the present without compromising the ability of future generations to meet their own needs--Brundtland Cornmiss ion)... strengthen and support the develop- ment of international funding mecha- nisms ... which will include assisting developing countries to obtain access to and transfer of needed environment- al technologies.. . support efforts to pre-

vent marine pollution induding curbing of toxic wastes ....
4. Baguio Resolution on Coastal Resources Management (March 1990).
Whereas, much of Southeast Asia's population lives in coastal areas... many coastal environments within the Association of Southeast Asian Nations (ASEAN. have become seriously degraded .... we, the participants of the Policy Conference, hereby resolve and further recommend that the ASEAN member-countries, donor agencies and all other groups and organizations give emphasis to the protection of these resources for the primary benefit of coastal communities by: endorsing pol- icies that promote and enhance sus- tainable development of coastal resources.. .
5. The Kuala Lumpur Accord on Envi- ronment and Development (June 1990).
Aware, that the management of the environment and the pursuit of sus- tainable development are imperative to secure the well-being of the people of the ASEAN today and in the future .... We, the ASEAN Ministers for the Envi- ronment ... agree to initiate efforts lead- ing towards concrete steps pertaining to environmental management, including:
a. the formulatbn of an ASEAN strat- egy for sustainable development and a corresponding action pro- gramme,
b. the hannonisation of environ- mental quality standards,
c. the harmonisation of transbound- a y pollution prevention and abatement practices.
d the undertaking of research and development and the promotion of the use of clean technologies.
and the following considerations:
WHEREAS, the ASEAN peoples have a right to use the coastal zone for the necessities of
life and to improve conditions for society as a whole;
WHEREAS, some environmental changes as a result of human activity are inevitable;
WHEREAS, social and economic develop- ment should be pursued in a way that does not prejudice use of the coastal zone by future generations in meeting their social and economic needs:
WHEREAS, the Montreal Guidelines for the Protection of the Marine Environment Against Pollution from Land-Based Sources (1985) note that: "States should, directly and/or through competent international organiza- tions, promote programmes of assistance to developing countries in the fields of educa- tion, environmental and pollution awareness, training, scientific research, transfer of tech- nology and know-how, for the purpose of improving the capacity of the developing countries to prevent, reduce and control pol- lution from land-based sources and to assess its effects on the marine environment";
WHEREAS, the introductory statement of the United Nations Conference on Environ- ment and Development's (UNCED) Secretary General at the flrst session of the Preparatory Committee(s) included ". .. of these issues, the need of developing countries for access to the new and additional financial resources they will require to enable them to participate fully in international environmental cooperation and integrate the environmental dimension into their own development policies and programmes undoubtedly poses the greatest challenge.. . ";
WHEREAS, the governments of ASEAN nations have demonstrated their concerns and responsibilities in resolving national and regional environmental problems that affect sustainability of economic development in the region through the establishment of the ASEAN Committee of Senior Ofncials on the Environment (ASOENI to develop common measures and collaborative environment pro- g-.
RECOMMENDATIONS
The participants at this conference agree that environmentally sound waste manage- ment strategies are vital to the sustainable development of coastal areas. As residents of the global commons and as citizens with clear opportunities to shape our nations' future, we recommend the following principles be incorporated into the environmental policies of MEAN.
1. MEAN nations should cooperate to:
a. develop, harmonize and coordi- nate their waste management strategies and measures, includ- ing technology, manpower and information exchange;
b. monitor and assess the creation and disposal of waste that may afTect their regional neighbors;
c. enhance the effectiveness of existing regional mechanism con- cerned with transboundary pol- lution of coastal areas;
d. establish legal, financial, social and technical structures and capability which recognize the different economies of nations and which will eventually reduce dependency on external financ- ing; and
e. ensure the availability of the nec- essary technical and financial assistance and manpower devel- opment objectives.
. Regional and national goals for environmental quality of coastal zones should be based on integrated coastal resources management strategies and should be defined in order to establish:
a. communication with the peoples of MEAN regarding to the importance of appropriate waste management strategies to mobi- lize public support and participa- tion;
b. priorities for waste management measures, including those
addressing sewage. garbage, industrial and agricultural waste, toxic substances, hazardous waste and environmental emer- gency planning and response;
c. efficient use of financial resources;
d. measurable objectives for desired uses of coastal areas;
e. scientific and other environmen- tal quality criteria needed to sustain these uses; and
f. standards for environmental quality or environmental plan- ning, as appropriate.
Proposed activities or waste man- agement measures that may adversely affect the environmental quality of coastal zones, or the resources that depend upon that quality, should be subject to prior environment assessments that will determine the impacts on the envi- ronmental and socioeconomic sec- tors. Such assessments should include mitigating measures and a requirement for subsequent moni- toring to assess compliance and effectiveness.
4. Waste management strategies and measures should be guided by the following principles:
there should be no transfer of damage or hazards from one area to another, directly or indirectly. or transformation of such pollu- tion into another type of pollu- tion; a 'Precautionary Principle' should be applied to selected substances as a goal wherever feasible. This means the reduction of contami- nant discharges, irrespective of the probable impacts on envi- ronmental quality, to account for the uncertainty of scientific knowledge of those impacts on coastal resources now or in the future; innovative processes for waste treatment and disposal that are
applicable to the economic, socio- cultural and physiographic char- acteristics of the region; effective participation of the pri- vate sector in the implementation of waste management programs through appropriate legislation, flscal policy, resource use policy and incentives; and adoption of practices and encour- agement of the use of technolo- gies that minimize the use of space, raw materials, energy, and the generation of waste;
5. The ASEAN nations should take all practical steps to prevent, control, reduce, or eliminate the discharge of substances to the coastal zone that cause harm to humans, marine life and other living resources, or that damage amenities associated with coastal environments. They should:
a. develop a "Black List" and a "Grey List" of polluting substances based on their persistence, toxic- ity or other noxious properties and their tendency to bioaccu- mulate. Measures should be taken to eliminate those sub- stances on the "Black List" and to limit and reduce the discharge of those on the "Grey List";
b. develop mechanisms in accor- dance with their legal systems for prompt and adequate compensa- tion or relief, as well as rehabilita- tion, in respect of damage caused by pallution of coastal areas under their jurisdiction;
c. introduce effective programs to recycle and reuse waste;
d. promote the use of science and technology to develop cleaner technologies and innovative waste management strategies; to define the linkages between waste dis- charges and environmental
impacts; and to assess the risks and uncertainties associated with waste management practices or the lack thereof;
e. encourage education of the pub- lic, policymakers and the produc- ers of waste, in the public and private sectors, about the oppor- tunities for social and economic benefits to be derived from effec- tive waste management strategies as well as the detrimental effects of inadequate or inappropriate management;
f. adopt programs that require pol- kters to bear the costs of pollu- tion prevention, abatement and compensation; and
g. develop institutional arrange- ments that integrate waste man-. agement into development pro- grams and projects.
6. The participation of nongovern- mental and community organiza- tions should be encouraged in the development and implementation of waste management strategies in order to promote the wider partici- pation of the public, especially women and children.
7. As part of a global responsibility for sustainable development, bilateral and multilateral funding agencies, including regional and international development banks, should develop more and vigorous technical assis- tance, financing programs and poli- cies for waste management pro- jects, including the integration of environmental concerns into devel- opment programs and projects, especially those that help protect the coastal living resources and the marine environment.
ADOPTED by resolution at the Conference on Waste Management in the Coastal Areas of the ASEAN Region, 30 June 1991, Singa- pore.

Closing Ceremonies
Note of Appreciation
ROBERTDAKAN United States Agency
for International Development USAID-Thailand
37 Soi Somprasong 3 Petchburi Road, Bangkok
Thailand
This conference certainly covered a wide range of issues that we are all growing with. I feel that we all have moved another step toward solving our mutual problems but rec- ognize from the discussions that there are many steps yet to be taken before the envi- ronmental threats caused by waste disposal to the coastal zone in the ASEAN region are resolved. USAID continues to give assistance to ASEAN through the ongoing ASEAN/US Coastal Resources Management Project (CRMP), which has recently been extended for one year until December 1992. The main purpose of the extension is to complete the six site-specific coastal area development plans and important technical publications. I urge the ASEAN governments to find the funds necessary to implement the plans upon completion.
Our USAID/ASEAN office is very interested in supporting both public and private sector efforts to solve environmental problems which are really everybody's problem.
Also, we have recently started the Private Investment and Trade Opportunity Project which holds office in each of the ASEAN cap- itals. Joyce Rasmussen, together with the Chamber of Commerce here in Singapore.
heads this office. This is essentially a trade promotion project. This year. the flrst trade mission for US Environmental Technologies sponsored by the project will bring US com- panies to Thailand, Indonesia and Singapore. This will be followed by other trade missions in early 1992 to the other MEAN countries.
At present, we are designing a new project. the ASEAN Environmental Improvement Pro- ject. It addresses the need of MEAN nations to resolve the damaging environmental effects of rapid industrialization and urbanization through policy and institutional development, technical assistance and training technology, and commercial and investment promotion. We plan to start in early 1992.
I thank all those involved with this suc- cessful conference. especially the organizers: the Ministry of the Environment of the Republic of Singapore and the ASEAN/US CraMP of the International Center for Living Aquatic Resources Management. Finally. I have been especially pleased to sponsor this conference with the Asian Development Bank and my colleagues at the Canada-ASEAN Centre.
Thank you all for attending.

Closing Remarks
CHUA THLA-ENG International Centerfor U v h g
Aquatic Resources Management MC P.O. Box 1501
MakatL Metro Manila Philippines
As this conference comes to a close, allow me to mention our accomplishments. Build- ing from a spirit of cooperation and under- standing, we have successfully defined the roles of the sectors vital to waste manage- ment. The ASEAN governments ably repre- sented here by key policy- and decisionmak- ers have affirmed their commitment to work- ing toward a sound waste management pro- gram. Complementing the governments are the donor agencies and multilateral banking institutions who have committed their finan- cial assistance. We can expect their greater involvement in the future. The nongovern- mental organizations have pledged their efforts and resources to educating the public on viable waste management strategies such as source reduction, reuse and recycling. The community leaders have also promised their collaboration and commitment. Clearly.
simultaneous initiatives on all these fronts will make waste management a success in the region.
More importantly, we have come up with a resolution that not only recognizes the urgent need for an integrated approach to the waste problem but also underscores a course of action for effective waste management. This regional agreement outlines the overall strat- egy for waste management in the name of environmental protection and economic development. This will be our guide in for- mulating our future actions.
It is up to all of us now to take up the challenge of the conference recommenda- tions. May this conference and its landmark resolution be the start of coordinated efforts toward a more effective waste management in the coastal areas of our region.
Thank you.

Appendices
Program of Activities
Friday, 28 June Capricorn Room Marina Mandarin Hotel A.M.
Opening Ceremonies Address: Waste Management in the ASEAN Region: Challenges and Directions. Dr. C h u a Thia-
Eng Opening Remarks: Singapore's Efforts in Toxic Waste Management. T h e Honorable Dr. Ahrnad
Magar Keynote Address: Waste Management in Coastal Zones: The Role of Multilateral Development
Banks. Mr. In Yong Chung
Session 1: Waste Management in the ASEAN Region: Status, Trends and Problems Chairman and Moderator: Mr. Theng C h y e Yam Waste Management in the Coastal Area of Brunei Darussalam. M o h d SaUeh bin Hj. Mohiddin Environmental Impact Management in Indonesia. Mr. Nabiel Makarim
P.M.
Wastewater Management in Malaysia. Dr. Abu Bakar Jaafar Solid and Hazardous Waste Management in the Philippines. Dr. Delffn J. Ganapin. Jr. Status and Trends of Waste Management in Singapore. Mr. T a n Eng Gee Problems and Trends of Waste Management in Thailand. Mr. Pornchai Taranatham Exhibit tour to the World Trade Centre Cocktails hosted by Enviro-World '9 1
Saturday. 29 June A.M.
Session 2: Waste Management Qptions Chairman and Moderator: Mr. Suvi t Yodman i Solid Waste Management in Developing Countries. Dr. David C. Wilson a n d Mr. Chandran Nair Ecological Impacts of Waste Disposal in the Coastal and Marine Environment. Dr. Harvey D.
Van Veldhuizen Solid Waste Management in Singapore. Mr. Lim Hung Siang Assessment of Waste Management in the ASEAN Region. Mr. K e n B. Lee
P.M.
Discussion Discussants: Dr. Abu Bakar J a a f m , Dr. Del& J . Ganapin, Jr. a n d Dr. Khoo Chin H e a n

Session 3: Economic Implications and the Role of Political Leadership in Waste Management
Chairman and Moderator: Mr. I a n B. Robertson The Role of Political Leadership in Improving the Environment. The Honorable Fulgencio S.
Factoran, Jr. The Economics of Coastal Waste Management. Dr. K. Dale Russell Discussion Discussants: The Honorable Jejomar Binay, Dr. Chia Lfn Sfen Reception and dinner hosted by Canada-ASEAN Centre
Sunday. 30 June A.M.
Session 4: Role of Donor/International Agencies, International Banking Institutions and the Private Sector in Waste Management Chairman and Moderator: Dr. Aprilani Soegiarto The Implementation Constraints in Waste Management in Malaysia. The Honorable Law Hieng
Ding Coastal Waste Management and the United Nations Conference on Environment and
Development 1992. Mr. John P. Bell The Privatization of Waste Treatment and Management Facilities. Mr. Thomas G. Smith Discussion Discussants: Mr. Goh Kiam Seng and Mr. George Green
P.M.
Session 5: Community Awareness and Participation in Waste Management Chairman and Moderator: The Honorable Senator Heherson Alvarez Local Government Initiatives in Waste Management. The Honorable Chalerm Phromlert Public Awareness and Education Towards Waste Management. Atty. Manuel S. Satorre, Jr. The Role of Nongovernmental Organizations in Waste Management. R. Senthirajah Discussion Discussants: Mr. T a n W e e Kiat, Mr. Muhamad S. ZuUcarnaen, Mr. Suvit Yodmani
Summary and Recommendations
Closing Ceremonies Note of Appreciation. Mr. Robert T. Dakan Closing Remarks. Dr. Chua Thia-Eng

List of Participants and Resource Persons
BRUNEI DARUSSALAM MALAYSIA
Ms. Hadijah Hj. Mohd. Idris Officer Ministry of Foreign Affairs
Dato Paduka Hj. Ibrahim bin Hj. Mat Yassin Commissioner Department of Town and Country Planning
Hj. Matdanan bin Hj. Jaafar Director Department of Fisheries Ministry of Industry and Primary Resources
Mr. Mohd. Salleh bin Hj. Mohiddin Administrative Officer Ministry sf Development
Mr. Sabri bin Hj. Mohd. Taha Fishery Officer Department of Fisheries
INDONESIA
Mr. Nabiel Makarirn Assistant Minister State Ministry for Population and Environment
Dr. Aprilani Soegiarto Chairman. MEAN Subcommittee on Marine Sciences Deputy Chairman for Natural Sciences, Indonesian Institute of Sciences-LIP1
Mr. Sukotjo Adisukresno Director Fisheries Resources Management Directorate General of Fisheries Ministry of Agriculture
Dr. Abu Bakar Jaafar Director-General Department of Environment Ministry of Science, Technology and the Environment
Ms. Ch'ng Kim Looi National Coordinator ASEAN/US CRMP Malaysia Head. MEAN Secretariat for COST
The Honorable Law Hieng Ding Minister Ministry of Science, Technology and
the Environment
Mr. Low Chee Choy Press Secretary to the Minister Ministry of Science. Technology and
the Environment
Mr. Patrick Tan State Director of Environment State Government of Johore
PHILIPPINES
The Honorable Senator Heherson Alvarez Chairman. Senate Committee on
Environment
The Honorable Mayor Jejomar Binay Chairman. Metropolitan Manila Authority

The Honorable Fulgencio S. Factoran, Jr. Secretary Department of Environment and
Natural Resources
Atty. Glenn Fax Legislative Staff Ofncer
and Executive Assistant Office of Senator Alvarez Senate of the Philippines
Dr. Delfin J. Ganapin, Jr. Assistant Secretary and OIC-Undersecretary Department of Environment and
Natural Resources
Dr. Rafael D. Guerrem 111 Chairman Project Steering Committee, ASEANIUS
Coastal Resources Management Project and Executive Director. Philippine Council on Aquatic and Marine Research and Development (PCAMRD)
The Honorable Vicente Mayo Governor Batangas City
SINGAPORE
Mr. Cheong Quee Wah Permanent Secretary Ministry of the Environment
Dr. Chia Lin Sien Associate Professor Department of Geography National University of Singapore
Mr. Eng Tiang Sing International Environment and
Policy Department Ministry of the Environment
Mr. Khoo Chin Hean Director Environment and Policy Institute Ministry of the Environment
Mr. Lee Yuen Tong Director Fisheries Division Primary Production Department Ministry of National Development
Mr. Lirn Lian Chuan Senior Primary Production Ofncer Primary Production Department Ministry of National Development
The Honorable Dr. Ahmad Mattar Minlster Ministry of the Environment
Dr. Ngiam Tong Tau Director Primary Production Department Ministry of National Development
Mr. Peter Tam Nam Song Chief Engineer Engineering Services Department Ministry of the Environment
Mr. Tan Eng Gee Chief Engineer (Planning and Design) Sewerage Department Ministry of the Environment
Dr. Tan Wee Kiat Committee Member National Council on the Environment
The Honorable Chalerm Phrornlert Governor Phuket Province
Mr. Siwa Sirisoawaluk Chief of Phuket Governor's Omce Phuket Province
Mr. Songphon Sukijbumrung Environmentalist Omce of the National Environment Board

Mr. Pornchai Taranatham Director of Environment Quality
Standards Division Office of the National Environment Board
Mr. Suvit Yodmani Deputy Secretary General to the
Prime Minister for Political Affairs Government House
CANADA
Mr. Rex P. Annstead Vice Chairman Globe '92
Mr. John P. Bell Senior Advisor on the Environment Environment and Energy Division Department of External Affairs and
International Trade, and Ambassador to UNCED
Mr. James P. Melanson First Secretary Canadian High Commission
MULTILATERAL BANKING INSTITUTIONS/DONOR AGENCIES
Mr. In Yong Chung a
Vice President Asian Development Bank Manila
Mr. Ivan Ruzicka Natural Resource Economist Office of the Environment Asian Development Bank Manila
Mr. Ian B. Robertson Executive Director Canada-ASEAN Centre Singapore
Mr. George Greene Director Environment and Development Policy
Division Canada International Development Agency (CIDA)
Hull, Quebec. Canada
Mr. Goh Kiam Seng Director and Regional Representative Regional Office for Asia and the Pacific United Nations Environment Programme
(UNEP) Bangkok. Thailand
Mr. Robert T. Dakan Deputy AID Representative to ASEAN USAID-Bangkok Thailand
NONGOVERNMENTAL ORGANIZATIONS (NGOs)
Atty. Manuel S. Satorre. Jr. President Philippine Environmental Journalists, Inc. Philippines
Mr. R. Senthirajah Vice President Environmental Protection Society, Malaysia Malaysia
Mr. Muhamad Syifaudin Zulkamaen Executive Director WALHI Indonesia
PRIVATE SECTOR
Dr. Clinton J. Edmonds Director Environmental Engineering UMA Engineering Ltd. Canada
Mr. Anthony P. Kortegast Director Environmental Engineering Group Tonkin and Taylor International Ltd. New Zealand
Mr. Ken Beck Lee Director Computer Applications UMA Engineering Ltd. Canada
Mr. Chandran Nair Resident Associate Environmental Resources (Asia) Ltd. Hong Kong

ICLARM Mr. David S. Osmond Director Gartner Lee Ltd. Canada
Mr. Thor K. Ramstetter Executive Director Fichtner (Asia) Re. Ltd. Singapore
Ms. Joyce Rasmussen Country Coordinator Private Investment and Trade
Opportunity Project Singapore
Dr. K. Dale Russell Senior Resource Economist UMA Engineering Ltd. Canada
Mr. Thomas G. Smith Director of Corporate Development Waste Management International Hong Kong
Ms. Jasmine Tarnbyah Assistant Treasurer Economic Research Department DBS Bank Singapore
Mr. Dan Tan Business Development Manager Singapore Environmental Management and
Engineering Services Re. Ltd. (SEMES) Singapore
Dr. Harvey D. Van Veldhuizen Senior Environmental Scientist Dames and Moore International USA
THE ASEAN SECRETARIAT
Dr. Chua Thia-Eng Director. Coastal Area Management Program Project Coordinator, ASEAN/US Coastal
Resources Management Project
Mr. Len Garces Project Specialist ASEAN/US Coastal Resources
Management Project
CONFERENCE SECRETARIAT
Mr. R a p e r Au Communications International Associates
Re. Ltd.
Dr. Chua Thia-Eng ICLARM
Mr. Eng Tiang Sing Ministry of the Environment
Mr. Len Garces ICLARM
Ms. Beverly Goh National University of Singapore
Ms. Cory Guerrero ICLARM
Ms. Rachel Josue ICLARM
Mr. Lirn Chuan Poh Ministry of the Environment
Mq. Maylene Loo National University of Singapore
Ms. Sharon Quah Ministry of the Environment
Mr. Theng Chye Yam Director I11 The ASEAN Secretariat Jakarta. Indonesia

ICLARM PUBLICATIONS ON COASTAL AREA MANAGEMENT
Conference Proceedings
Towards sustainable development of the coastal resources ofLingayen Gulf, Philippines. G. Silvestre, E.Miclatand T.-E. Chua, editors.1989. No. 17,200 p. US$9 surface; $15 airmail. .
Coastal area management in Southeast Asia: policies, management strategies and case studies. T.-E. Chua and D. Pauly, editors. 1989.No. 19,254 p. Out of print - available at cost in photocopied form only.
Towards an integrated management of tropical coastal resources. L.M. Chou, T.-E. Chua, H.W. Khoo, P.E. Urn, J.N. Paw, G.T. Silvestre,M.J. Valencia, AT. White and P.K. Wong, editors. 1991. No. 22,455 p. $5 surface; $23 airmail.
Urban coastal area management: the experience of Singapore. L.S. Chia and L.M. Chou, editors. 1991. No. 25, 128 p. $9 surface; $15airmail.
Coastal area management education in the ASEAN region. T.-E. Chua, editor. 1991. No. 29, 92 p. $9 surface; $15 airmail.Managing ASEAN' s coastal resources for sustainable development: roles of policymakers, scientists, donors, media and communities.
T.-E. Chua and L.F. Scura, editors. 1991. No. 30, 125 p. $9 surface; $15 airmail.Waste management in the coastal areas of the ASEAN region: roles of governments, banking institutions, donor agencies, private
sector and communities. T.-E. Chua and L.R. Garces, editors. 1992. No. 33, 218 p. $2 surface; $10 airmail:The coastal resources of Brunei Darussalam: status, utilization and management. G. Silvestre, H.J.H. Matdanan, P.H.Y. Sharifuddin,
M.W.R.N. De Silva and T.-E. Chua, editors. 1992. No. 34, 214 p. $2 surface; $10 airmail.
Technical RqJOrts
The coastal environmental profile of Brunei Darussalam: resource assessment and management issues. T.-E. Chua, L.M. Chou andM.S.M. Sadorra, editors. 1987. No. 18, 193 p. Out of print - available at cost in photocopied form only.
The coastal environmental profile of Ban Don Bay and Phangnga Bay, Thailand. IN. Paw, S. Bunpapong, AT. White and M.S.M.Sadorra, editors. 1988. No. 20, 79 p. Out of print - available at cost in photocopied form only. .
The coastal environmental profile of Singapore. L.S. Chia and L.M. Chou. 1988. No. 21,92 p. $1 surface; $5 airmail.The coastal environmental profile of Lingayen Gulf, Philippines. L.T. McManus and T.-E. Chua, editors. 1990. No. 22, 69 p. $1 surface;
$5 airmail.The coastal environmental profile of South Johore, Malaysia. ASEAN/US CRMP. 1991. No. 24, 65 p. $1 surface; $5 airmail.The coastal environmental profile of Segara Anakan-Cilacap, South Java, Indonesia. AT. White, P. Martosubroto and M.S.M. Sadorra,
editors. 1989. No. 25, 82 p. $1 surface; $5 airmail.
Education Series
Coral reefs: valuable resources of Southeast Asia. AT. White. 1987. No.1, 36 p. Out of print - available at cost in photocopied form only.Marine parks and reserves: management for coastal environments in Southeast Asia. AT. White. 1988. No.2, 36 p. $1.50 surface; $5
airmail.
May pangako mula sa dagat (comics on blast fishing, in Pilipino). L.M. Cabrera. 1988. No.3, 26 p. Free upon request.There is still hope (comics on marine parks). 1989. No.4, 14 p. Out of print - available at cost in photocopied form only.Seagrasses: a resource unknown in the ASEAN region. M.D. Fortes. 1989. No.5, 46 p. $1.50 surface; $5 airmail.Artificial reefs for marine habitatenhancementin Southeast Asia. AT. White, L.M. Chou,M.W.RN. DeSilva and F.Y.Guarin.1990.No.
11, 45 p. $1.50 surface; $5 airmail.Coastal tourism in Southeast Asia. P.P. Wong. 1991. No. 13.40 p. $1.50 surface; $5 airmail.Mangroves must live poster. ASEAN IUS CRMP in cooperation with Asian Wetland Bureau and WWF Malaysia. 1988. 44.5 x 59.5 em.
$1.25 surface; $3.50 airmail.
Director:]!
Directory of institutions and scientists in the ASEAN region involved in research and/or management related to coastal areas. T.-E.Chua, M.AA Agulto, F.Y. Guarin and S.c. Guerrero, compilers. 1989.373 p. $2 surface; $10 airmail.
Mail orders and inquiries to:. International Specialized Book Services, P.o. Box 1632, Beaverton, Oregon 97075, USA (for North America). Airmail Rrice must beed
. ~us .. S. Toeche-Mittler GmbH, Versandbuchhandlung, Hindenburgstrasse 33, D-6100Darmstadt, Federal Republic of Germany (for"Europe). Airmail price must be used. ~. The Editor, ICLARM, MC P.O. Box 1501, Makati, 1299 Metro Manila, Philippines (for inquiries elsewhere). Send US$by internat~onal '
money order, bankdraft or UNESCO coupons payable to ICLARM. We can accept US$ checks only if from a US-based bank due to high f
clearance fees of other banks.Airmail is strongly recommended due to delays of up to 6 months and occasional losses experienced with surface mail.
-~