Washington Mutual 10K - IIS Windows Server
166
UNITED STATES SECURITIES AND EXCHANGE COMMISSION WASHINGTON, D.C. 20549 FORM 10-K/A Amendment No. 1 ANNUAL REPORT PURSUANT TO SECTION 13 OR 15(d) OF THE SECURITIES EXCHANGE ACT OF 1934 FOR THE FISCAL YEAR ENDED DECEMBER 31, 2003 Commission File Number 1-14667 WASHINGTON MUTUAL, INC. (Exact name of registrant as specified in its charter) Washington 91-1653725 (State or other jurisdiction of (I.R.S. Employer incorporation or organization) Identification Number) 1201 Third Avenue, Seattle, Washington 98101 (Address of principal executive offices) (Zip Code) Registrant’s telephone number, including area code: (206) 461-2000 Securities registered pursuant to Section 12(b) of the Act: Title of each class Name of each exchange on which registered Common Stock New York Stock Exchange Securities registered pursuant to Section 12(g) of the Act: Title of each class Name of each exchange on which registered Litigation Tracking Warrants TM NASDAQ Indicate by check mark whether the registrant (1) has filed all reports required to be filed by Section 13 or 15(d) of the Securities Exchange Act of 1934 during the preceding 12 months (or for such shorter period that the registrant was required to file such reports), and (2) has been subject to such filing requirements for the past 90 days. Yes ፤ No អ. Indicate by check mark if disclosure of delinquent filers pursuant to Item 405 of Regulation S-K is not contained herein, and will not be contained, to the best of registrant’s knowledge, in definitive proxy or information statements incorporated by reference in Part III of this Form 10-K or any amendment to this Form 10-K. អ Indicate by check mark whether the registrant is an accelerated filer (as defined in Rule 12b-2 of the Act). Yes ፤ No អ. The aggregate market value of voting stock held by non-affiliates of the registrant as of June 30, 2003: Common Stock—$37,362,586,793 (1) (1) Does not include any value attributable to 17,100,000 shares held in escrow. The number of shares outstanding of the issuer’s classes of common stock as of February 27, 2004: Common Stock—868,397,759 (2) (2) Includes 6,000,000 shares held in escrow. Documents Incorporated by Reference Portions of the definitive proxy statement for the Annual Meeting of Shareholders to be held April 20, 2004, are incorporated by reference into Part III.
-
Upload
khangminh22 -
Category
Documents
-
view
0 -
download
0
Transcript of Washington Mutual 10K - IIS Windows Server

UNITED STATESSECURITIES AND EXCHANGE COMMISSION
WASHINGTON, D.C. 20549
FORM 10-K/AAmendment No. 1
ANNUAL REPORT PURSUANT TO SECTION 13 OR 15(d) OF THE SECURITIES EXCHANGE ACT OF1934 FOR THE FISCAL YEAR ENDED DECEMBER 31, 2003
Commission File Number 1-14667
WASHINGTON MUTUAL, INC.(Exact name of registrant as specified in its charter)
Washington 91-1653725(State or other jurisdiction of (I.R.S. Employerincorporation or organization) Identification Number)
1201 Third Avenue, Seattle, Washington 98101(Address of principal executive offices) (Zip Code)
Registrant’s telephone number, including area code: (206) 461-2000
Securities registered pursuant to Section 12(b) of the Act:Title of each class Name of each exchange on which registered
Common Stock New York Stock Exchange
Securities registered pursuant to Section 12(g) of the Act:Title of each class Name of each exchange on which registered
Litigation Tracking WarrantsTM NASDAQ
Indicate by check mark whether the registrant (1) has filed all reports required to be filed by Section 13 or15(d) of the Securities Exchange Act of 1934 during the preceding 12 months (or for such shorter period that theregistrant was required to file such reports), and (2) has been subject to such filing requirements for the past90 days. Yes � No �.
Indicate by check mark if disclosure of delinquent filers pursuant to Item 405 of Regulation S-K is notcontained herein, and will not be contained, to the best of registrant’s knowledge, in definitive proxy orinformation statements incorporated by reference in Part III of this Form 10-K or any amendment to thisForm 10-K. �
Indicate by check mark whether the registrant is an accelerated filer (as defined in Rule 12b-2 of the Act).Yes � No �.
The aggregate market value of voting stock held by non-affiliates of the registrant as of June 30, 2003:Common Stock—$37,362,586,793(1)
(1) Does not include any value attributable to 17,100,000 shares held in escrow.
The number of shares outstanding of the issuer’s classes of common stock as of February 27, 2004:Common Stock—868,397,759(2)
(2) Includes 6,000,000 shares held in escrow.
Documents Incorporated by Reference
Portions of the definitive proxy statement for the Annual Meeting of Shareholders to be held April 20,2004, are incorporated by reference into Part III.

WASHINGTON MUTUAL, INC.2003 ANNUAL REPORT ON FORM 10-K/A
TABLE OF CONTENTS
Page
PART I . . . . . . . . . . . . . . . . . . . . . . . . . . . . . . . . . . . . . . . . . . . . . . . . . . . . . . . . . . . . . . . . . . 1Item 1. Business . . . . . . . . . . . . . . . . . . . . . . . . . . . . . . . . . . . . . . . . . . . . . . . . . . . . . . . 1
Overview . . . . . . . . . . . . . . . . . . . . . . . . . . . . . . . . . . . . . . . . . . . . . . . . . . . . . 1Business Segments . . . . . . . . . . . . . . . . . . . . . . . . . . . . . . . . . . . . . . . . . . . . . . 1Available Information . . . . . . . . . . . . . . . . . . . . . . . . . . . . . . . . . . . . . . . . . . . . 4Employees . . . . . . . . . . . . . . . . . . . . . . . . . . . . . . . . . . . . . . . . . . . . . . . . . . . . 5Factors That May Affect Future Results . . . . . . . . . . . . . . . . . . . . . . . . . . . . . . 5Taxation . . . . . . . . . . . . . . . . . . . . . . . . . . . . . . . . . . . . . . . . . . . . . . . . . . . . . . 7Environmental Regulation . . . . . . . . . . . . . . . . . . . . . . . . . . . . . . . . . . . . . . . . 7Regulation and Supervision . . . . . . . . . . . . . . . . . . . . . . . . . . . . . . . . . . . . . . . . 8Executive Officers . . . . . . . . . . . . . . . . . . . . . . . . . . . . . . . . . . . . . . . . . . . . . . 12
Item 2. Properties . . . . . . . . . . . . . . . . . . . . . . . . . . . . . . . . . . . . . . . . . . . . . . . . . . . . . . 14Item 3. Legal Proceedings . . . . . . . . . . . . . . . . . . . . . . . . . . . . . . . . . . . . . . . . . . . . . . . . 15Item 4. Submission of Matters to a Vote of Security Holders . . . . . . . . . . . . . . . . . . . . . . . 15
PART II . . . . . . . . . . . . . . . . . . . . . . . . . . . . . . . . . . . . . . . . . . . . . . . . . . . . . . . . . . . . . . . . . 15Item 5. Market for our Common Stock and Related Stockholder Matters . . . . . . . . . . . . . . 15Item 6. Selected Financial Data . . . . . . . . . . . . . . . . . . . . . . . . . . . . . . . . . . . . . . . . . . . . 23Item 7. Management’s Discussion and Analysis of Financial Condition and Results of
Operations . . . . . . . . . . . . . . . . . . . . . . . . . . . . . . . . . . . . . . . . . . . . . . . . . . . . 16Controls and Procedures . . . . . . . . . . . . . . . . . . . . . . . . . . . . . . . . . . . . . . . . . . 16Overview . . . . . . . . . . . . . . . . . . . . . . . . . . . . . . . . . . . . . . . . . . . . . . . . . . . . . 16Critical Accounting Policies . . . . . . . . . . . . . . . . . . . . . . . . . . . . . . . . . . . . . . . . 18Recently Issued Accounting Standards . . . . . . . . . . . . . . . . . . . . . . . . . . . . . . . . 21Five-Year Summary of Selected Financial Data . . . . . . . . . . . . . . . . . . . . . . . . . 23Ratios and Other Supplemental Data . . . . . . . . . . . . . . . . . . . . . . . . . . . . . . . . 24Earnings Performance from Continuing Operations . . . . . . . . . . . . . . . . . . . . . . 25Review of Financial Condition . . . . . . . . . . . . . . . . . . . . . . . . . . . . . . . . . . . . . 35Operating Segments . . . . . . . . . . . . . . . . . . . . . . . . . . . . . . . . . . . . . . . . . . . . . 38Off-Balance Sheet Activities . . . . . . . . . . . . . . . . . . . . . . . . . . . . . . . . . . . . . . . 44Asset Quality . . . . . . . . . . . . . . . . . . . . . . . . . . . . . . . . . . . . . . . . . . . . . . . . . . 45Liquidity . . . . . . . . . . . . . . . . . . . . . . . . . . . . . . . . . . . . . . . . . . . . . . . . . . . . . 54Capital Adequacy . . . . . . . . . . . . . . . . . . . . . . . . . . . . . . . . . . . . . . . . . . . . . . . 56Market Risk Management . . . . . . . . . . . . . . . . . . . . . . . . . . . . . . . . . . . . . . . . . 57Maturity and Repricing Information . . . . . . . . . . . . . . . . . . . . . . . . . . . . . . . . . 62Tax Contingency . . . . . . . . . . . . . . . . . . . . . . . . . . . . . . . . . . . . . . . . . . . . . . . . 67Goodwill Litigation . . . . . . . . . . . . . . . . . . . . . . . . . . . . . . . . . . . . . . . . . . . . . 67
Item 7A. Quantitative and Qualitative Disclosures about Market Risk . . . . . . . . . . . . . . . . . 57Item 8. Financial Statements and Supplementary Data . . . . . . . . . . . . . . . . . . . . . . . . . . . 70Item 9. Changes in and Disagreements with Accountants on Accounting and Financial
Disclosure . . . . . . . . . . . . . . . . . . . . . . . . . . . . . . . . . . . . . . . . . . . . . . . . . . . . 70Item 9A. Controls and Procedures . . . . . . . . . . . . . . . . . . . . . . . . . . . . . . . . . . . . . . . . . . . 16
PART III . . . . . . . . . . . . . . . . . . . . . . . . . . . . . . . . . . . . . . . . . . . . . . . . . . . . . . . . . . . . . . . . 70Item 10. Directors and Executive Officers of the Registrant . . . . . . . . . . . . . . . . . . . . . . . . . 70Item 11. Executive Compensation . . . . . . . . . . . . . . . . . . . . . . . . . . . . . . . . . . . . . . . . . . . 70Item 12. Security Ownership of Certain Beneficial Owners and Management and Related
Stockholder Matters . . . . . . . . . . . . . . . . . . . . . . . . . . . . . . . . . . . . . . . . . . . . . 70Item 13. Certain Relationships and Related Transactions . . . . . . . . . . . . . . . . . . . . . . . . . . . 70Item 14. Principal Accounting Fees and Services . . . . . . . . . . . . . . . . . . . . . . . . . . . . . . . . . 70
PART IV . . . . . . . . . . . . . . . . . . . . . . . . . . . . . . . . . . . . . . . . . . . . . . . . . . . . . . . . . . . . . . . . . 71Item 15. Exhibits, Financial Statement Schedules and Reports on Form 8-K . . . . . . . . . . . . . 71
i

Explanatory Note
Washington Mutual, Inc. (‘‘Washington Mutual’’ or the ‘‘Company’’) is filing this Amendment No. 1on Form 10-K/A to amend its Annual Report on Form 10-K for the year ended December 31, 2003 tocorrect the funds transfer pricing methodology applied to the 2001 financial results of the Company’soperating segments. Such information had no effect on previously reported 2001 consolidated results ofoperations or any other period presented in this report.
This Amendment No. 1 on Form 10-K/A amends:
• Item 7 (Management’s Discussion and Analysis of Financial Condition and Results of Operations)solely to reflect the changes to segment information reported for 2001 in the tables and narrativediscussion of Operating Segments on pages 40 through 44; and
• Item 8 (Financial Statements and Supplementary Data) to reflect, in Notes 2—‘‘Restatements ofFinancial Statements’’ and 25—‘‘Operating Segments’’ to the Consolidated Financial Statements,the changes to segment information reported in the table for the year ended December 31, 2001contained in Note 25, and to include the reissued report of the Company’s independent auditors.
While this Amendment No. 1 also sets forth the complete text of each other item of the Company’sForm 10-K for the year ended December 31, 2003, it does not change any information contained in theseother items as originally filed on March 15, 2004. This Amendment No. 1 also does not reflect events thathave occurred after the original filing of the Form 10-K.
ii

PART I
BUSINESS
Overview
With a history dating back to 1889, Washington Mutual, Inc. (together with its subsidiaries,‘‘Washington Mutual,’’ or the ‘‘Company’’) is a financial services company committed to serving consumersand small- to mid-sized businesses. Based on our consolidated assets at December 31, 2003, we were thelargest thrift holding company in the United States and the eighth largest among all U.S.-based bank andthrift holding companies.
Company Growth
Our assets have grown over the last eight years primarily through the following significantacquisitions:
Acquisition Name Date Acquired Loans Deposits Assets
(in millions)
Keystone Holdings, Inc. . . . . . . . . . . . . . . . . . . . . . . . . Dec. 20, 1996 $14,563 $12,815 $21,894Great Western Financial Corporation . . . . . . . . . . . . . . July 1, 1997 32,448 27,785 43,770H.F. Ahmanson & Company(1) . . . . . . . . . . . . . . . . . . . . Oct. 1, 1998 33,939 33,975 50,355Mortgage operations of The PNC Financial Services
Group, Inc.(2) . . . . . . . . . . . . . . . . . . . . . . . . . . . . . . Jan. 31, 2001 3,352 – 7,307Bank United Corp. . . . . . . . . . . . . . . . . . . . . . . . . . . . . Feb. 9, 2001 14,983 8,093 19,034Fleet Mortgage Corp.(2) . . . . . . . . . . . . . . . . . . . . . . . . June 1, 2001 4,378 – 7,813Dime Bancorp, Inc. . . . . . . . . . . . . . . . . . . . . . . . . . . . Jan. 4, 2002 21,660 15,171 31,305
(1) Includes loans, deposits and assets acquired by Ahmanson from Coast Savings Financial, Inc.(2) This was an acquisition of selected assets and/or liabilities.
Our mission is to become the nation’s leading retailer of consumer financial services. Our strategy isto focus primarily on middle-market consumers in the largest metropolitan areas. Through advertising,branding and positioning we build customer awareness of our home lending products and encouragehouseholds to conduct business with Washington Mutual. In selected metropolitan markets, we thenoverlay our retail banking operations and cross-sell key products, including checking accounts, depositaccounts and home equity products. Store expansion was a priority in 2003 and will continue to be apriority in 2004. We plan to achieve our mission principally through organic growth of our retail bankingfranchise and by driving efficiencies in our operations.
Business Segments
In the fourth quarter of 2003 we realigned our business segments and we now manage and reportinformation concerning the Company’s activities, operations, products and services around our twocustomer categories: consumers and commercial customers. Our realigned business segments are theConsumer Group and the Commercial Group. The Consumer Group separately reports information fortwo distinct reporting segments: the Retail Banking and Financial Services segment and the MortgageBanking segment.
We manage interest rate risk, liquidity, capital, funding and securities held for general asset andliability management purposes on an enterprise-wide basis through our Treasury Division.
Consumer Group
The Consumer Group offers products and services to consumers and manages activities andoperations affecting consumers. The Group serves approximately 11.6 million households through multiple
1

distribution channels, including 1,776 retail banking stores, 432 retail home loan stores, 2,990 ATMs, 39wholesale home loan centers, correspondent lenders, telephone call centers and online banking.
The Consumer Group’s primary objectives in 2004 are to increase the number of the Group’s productsand services used by consumers, thus increasing profitability, and to drive efficiencies in its operations. TheGroup plans to achieve its objective by cross-selling products and services to its existing customers and byestablishing and enlarging its customer base in selected markets.
Retail Banking and Financial Services
The principal activities of the Retail Banking and Financial Services segment include:
• Offering a comprehensive line of deposit and other retail banking products and services toconsumers;
• Holding the Company’s portfolio of home loans held for investment;
• Managing and servicing the home equity and consumer loan portfolios; and
• Providing investment advisory and brokerage services, sales of annuities, mutual fund managementand other financial services.
The segment’s expansion of its national retail banking franchise is an integral element of theConsumer Group’s strategy for achieving its 2004 objective. In 2004, the segment plans to openapproximately 250 new retail banking stores, primarily in the Tampa, Chicago and New York metropolitanareas. In 2003, the segment opened 260 stores primarily in the Chicago, Houston, Dallas and New Yorkmetropolitan areas. New retail banking stores are configured on an award-winning and innovative retailbanking platform that serves customers in an open, free-flowing retail environment.
Deposit products offered by the segment include the Company’s signature free checking and Platinumaccounts as well as other personal checking accounts, savings accounts, money market deposit accountsand time deposit accounts. The segment also offers home equity loans and lines of credit and consumerloans. Home equity loans and lines of credit accounted for 16% of loans held in portfolio at the end of2003, up from 11% at the end of 2002. Home equity loans and lines of credit generally provide highermargins than home loans. As such, the Company believes they represent an attractive opportunity to growthe loan portfolio.
The segment holds loans in portfolio that are originated by the Mortgage Banking segment. Throughour specialty mortgage finance program, the segment also purchases and re-underwrites loans to higherrisk borrowers; such loans, while held in portfolio, are serviced by third parties.
Investment advisory and securities brokerage services are provided by approximately 600 financialconsultants of WM Financial Services, Inc., a licensed broker-dealer. In addition, fixed annuities areoffered to the public by approximately 1,300 licensed banking employees. The Company’s mutual fundmanagement business, WM Advisors, Inc., offers investment advisory and mutual fund distribution servicesand had assets under management at December 31, 2003 of $17.87 billion.
Mortgage Banking
The principal activities of the Mortgage Banking segment include:
• Originating and servicing home loans;
• Buying and selling home loans in the secondary market; and
• Providing insurance-related products.
The Mortgage Banking segment’s primary objectives in 2004 are to drive significant efficiencies byfully integrating the mortgage banking companies we acquired in 2001 and 2002 and to increase the
2

number of the Company’s products and services used by customers. The segment is transitioning to a singlenon-proprietary servicing platform for home loans in 2004 and is also consolidating its origination systemsand loan fulfillment centers.
In 2003 Washington Mutual was a leading originator and servicer of mortgage loans and expanded itsdistribution channel with the opening of 93 new retail home loan centers.
Through its multiple lending channels, the segment offers a diverse set of home loan productsincluding:
• Fixed-rate home loans;
• Adjustable-rate home loans (where the interest rate may be adjusted as frequently as every month);
• Hybrid home loans (where the interest rate is fixed for a predetermined time period, typically 3 or5 years, and then reprices monthly or annually, depending on the product); and
• Government insured or guaranteed home loans.
Home loans are either originated or purchased and are either held in portfolio by the Retail Bankingand Financial Services segment or sold by the Mortgage Banking segment to institutional investors in thesecondary market or to the housing government-sponsored enterprises. In general, the Retail Banking andFinancial Services segment holds in portfolio purchased loans made to higher-risk borrowers andadjustable-rate mortgages, and the Mortgage Banking segment sells fixed-rate home loans, generally to theFederal National Mortgage Association (‘‘Fannie Mae’’), a government-sponsored enterprise. Asconditions warrant, the Mortgage Banking segment may securitize adjustable-rate loans intoavailable-for-sale securities to be held by the Treasury Division as part of the Company’s overall asset andliability management strategy. In the future, the segment may securitize and sell adjustable-rate loans inthe secondary market as part of the Company’s capital management process.
Mortgage servicing involves the administration and collection of home loan payments. The MortgageBanking segment performs most home loan servicing activities, including the servicing of loans held inportfolio by the Retail Banking and Financial Services segment. When loans are sold into the secondarymarket, the Company generally retains the right to service those loans and hence retains the customerrelationship. The Company intends to use these customer relationships to cross-sell additional productsand services.
All loans, whether originated or purchased, are subject to the same nondiscriminatory underwritingstandards. When originating home loans, the Company follows established lending policies and proceduresthat require consideration of an applicant’s credit profile relative to the size and characteristics of the loan.When purchasing home loans, the Company normally delegates the underwriting responsibility to thecorrespondent lenders that originate the loans. The Company requires correspondent lenders to complywith its underwriting and appraisal standards and performs quality control procedures to ensure thatcompliance occurs.
The Mortgage Banking segment makes insurance products available to its customers that complementthe mortgage lending process including private mortgage insurance, mortgage life insurance, flood,homeowners’, earthquake and other property and casualty insurance. Other types of insurance productsmade available include accidental death and dismemberment, and term and whole life insurance. TheMortgage Banking segment also manages the Company’s captive reinsurance activities.
See Note 25 to the Consolidated Financial Statements—‘‘Operating Segments’’ for financialinformation regarding the two operating segments of the Consumer Group and refer to Management’sDiscussion and Analysis—‘‘Operating Segments’’ for a description of the principal differences between theprevious and newly aligned segment structures.
3

Commercial Group
The principal activities of the Commercial Group include:
• Providing financing to developers, investors, mortgage bankers and homebuilders for theacquisition or construction of multi-family dwellings, other commercial properties and new homes;
• Originating and servicing multi-family and other commercial real estate loans and either holdingsuch loans in portfolio as part of its commercial asset management business or selling them in thesecondary market;
• Originating, selling and servicing home loans to higher-risk borrowers through the Company’ssubsidiary, Long Beach Mortgage Company; and
• Offering a full array of commercial banking products and services.
The Group’s primary objectives in 2004 are to improve productivity by consolidating operations and toincrease market share in the highly fragmented multi-family, commercial real estate and commercialbanking markets through organic growth. The Group expects to integrate approximately 80 commercialbanking centers and small business centers with its existing multi-family and commercial real estateoperations. Additional productivity improvements should result from centralizing servicing operations andautomating and streamlining the underwriting and loan closing processes.
The multi-family lending business, which accounts for a majority of the Group’s revenues, iscomprised of three key activities: originating and managing loans retained in the loan portfolio, servicingloans and providing ancillary banking services to enhance customer retention. Combining these threeactivities into one integrated business model has allowed the Group to become a leading originator andholder of multi-family loans. The Group’s multi-family lending program has a dominant market share ofmore than 20% in certain key cities along the west coast and is building market share on the east coast withrecent office openings in Boston, Washington, D.C., and Miami.
As part of the Company’s specialty mortgage finance program, the Group originates home loans tohigher-risk borrowers through Long Beach Mortgage, which it then sells to secondary market participants,retaining the servicing relationship.
The Group also offers a full array of commercial banking products and services, including lines ofcredit, receivables and inventory financing, equipment loans, real estate financing, government-guaranteedloans, international trade financing, cash management and merchant bankcard services.
The Company completed the sale of Washington Mutual Finance Corporation, its consumer financesubsidiary, which was formerly part of the Commercial Group, on January 9, 2004. Washington MutualFinance’s operations are reported as discontinued operations elsewhere in this report on Form 10-K unlessotherwise noted.
See Note 25 to the Consolidated Financial Statements—‘‘Operating Segments’’ for financialinformation regarding the Commercial Group and refer to Management’s Discussion and Analysis—‘‘Operating Segments’’ for a description of the principal differences between the previous and newlyaligned segment structures.
Available Information
We make our annual report on Form 10-K, quarterly reports on Form 10-Q, current reports onForm 8-K, and all amendments to such reports filed pursuant to Section 13(a) or 15(d) of the ExchangeAct, available free of charge on or through our website located at www.wamu.com/ir as soon as reasonablypracticable after filing with the United States Securities and Exchange Commission.
The Company’s Code of Conduct, which applies to all officers, directors and employees of theCompany, and the Code of Ethics for Senior Financial Officers, which applies to the Company’s Chief
4

Executive Officer, Chief Financial Officer, Controller, and each business segment or business line chieffinancial officer and controller, as well as any waiver of our Code of Conduct and amendment to or waiverof the Code of Ethics for Senior Financial Officers, are disclosed on our website located atwww.wamu.com/ir.
Employees
At December 31, 2003, we had 63,720 employees, compared with 55,200 at December 31, 2002 and41,901 at December 31, 2001, which included 2,346, 2,330 and 2,717 employees related to the Company’sdiscontinued operations. During 2003, our number of employees increased substantially to accommodatethe high refinancing activity in the earlier part of the year and the opening of new retail banking stores.The increase in 2002 over the same period in 2001 was primarily due to the acquisitions of Dime andHomeSide Lending, Inc., which was acquired in two transactions in 2002. We believe that we have beensuccessful in attracting quality employees and that our employee relations are good.
Factors That May Affect Future Results
Our Form 10-K and other documents that we file with the Securities and Exchange Commission haveforward-looking statements. In addition, our senior management may make forward-looking statementsorally to analysts, investors, the media and others. Forward-looking statements can be identified by the factthat they do not relate strictly to historical or current facts. They often include words such as ‘‘expects,’’‘‘anticipates,’’ ‘‘intends,’’ ‘‘plans,’’ ‘‘believes,’’ ‘‘seeks,’’ ‘‘estimates,’’ or words of similar meaning, or futureor conditional verbs such as ‘‘will,’’ ‘‘would,’’ ‘‘should,’’ ‘‘could’’ or ‘‘may.’’
Forward-looking statements provide our expectations or predictions of future conditions, events orresults. They are not guarantees of future performance. By their nature, forward-looking statements aresubject to risks and uncertainties. These statements speak only as of the date they are made. We do notundertake to update forward-looking statements to reflect the impact of circumstances or events that ariseafter the date the forward-looking statements were made. There are a number of factors, many of whichare beyond our control, that could cause actual conditions, events or results to differ significantly fromthose described in the forward-looking statements.
Some of these factors are described below.
General business and economic conditions may significantly affect our earnings.
Our business and earnings are sensitive to general business and economic conditions. Theseconditions include short-term and long-term interest rates, inflation, money supply, fluctuations in bothdebt and equity capital markets, the strength of the U.S. economy, and of the local economies in which weconduct business. Changes in these conditions may adversely affect our business and earnings. Forexample, if short-term interest rates rise faster than mortgage rates, our net interest income, which is ourlargest component of net income, could be adversely affected. A prolonged economic downturn couldincrease the number of customers who become delinquent or default on their loans, or a rising interest rateenvironment could decrease the demand for loans. An increase in delinquencies or defaults could result ina higher level of charge-offs and provision for loan and lease losses, which could adversely affect ourearnings.
In addition, our business and earnings are significantly affected by the fiscal and monetary policies ofthe federal government and its agencies. We are particularly affected by the policies of the Federal ReserveBoard, which regulates the supply of money and credit in the United States. The Federal Reserve Board’spolicies directly and indirectly influence the yield on our interest-earning assets and the cost of ourinterest-bearing liabilities. Changes in those policies are beyond our control and difficult to predict.
5

If we are unable to effectively manage the volatility of our mortgage banking business, our earnings couldbe adversely affected.
Changes in interest rates significantly affect the mortgage banking business. One of the principal risksof declining interest rates on the mortgage banking business is the acceleration of prepayments whichreduce the fair value of our mortgage servicing rights (‘‘MSR’’). One of the ways we mitigate this risk is bypurchasing financial instruments, such as fixed-rate investment securities, interest rate contracts andforward commitments to purchase mortgage-backed securities, which tend to increase in value whenlong-term interest rates decline. The success of this strategy, however, is dependent on management’sjudgments regarding the amount, type and mix of MSR risk management instruments that we select tomanage the changes in fair value of our mortgage servicing asset. If this strategy is not successful, our netincome could be adversely affected. Moreover, many of our interest rate and MSR risk managementstrategies depend on liquidity in mortgage-related financial instruments traded in the secondary market. Ifperiods of illiquidity develop in these markets, our ability to effectively implement our MSR riskmanagement strategies could be adversely affected. Another significant risk to the mortgage bankingbusiness is the effect of interest rates on loan volume and gain from mortgage loans. In rising interest rateenvironments, loan volume is generally lower and, accordingly, the overall amount of gain from mortgageloans is lower. Due to the high levels of salable fixed-rate loan volume in 2002 and 2003 that resulted fromhistorically low mortgage interest rates, our gain from mortgage loans in 2003 and 2002 was higher than itis likely to be when mortgage interest rates rise above their historical low points for a sustained period oftime. For further discussion of how interest rate risk, basis risk and MSR prepayment risk are managed,see ‘‘Market Risk Management.’’
If we are unable to fully realize the operational and systems efficiencies sought to be achieved from ourrecently announced business segment realignment, our earnings could be adversely affected.
In the fourth quarter of 2003 we realigned our operating segment structure according to products andservices that are grouped into two primary categories—those offered to retail consumers and those offeredto commercial customers—in order to create a more highly integrated and unified retailing strategy and tostreamline and simplify operations. To accomplish these goals we are eliminating redundancies throughoutthe organization, completing the integration of the mortgage banking companies we acquired in 2001 and2002, transitioning to a single non-proprietary platform for the servicing of home loans, consolidating ourmortgage origination systems and loan fulfillment centers and integrating call centers. We anticipate thatthese initiatives will result in operating efficiencies.
If we experience difficulties, such as a prolonged interruption of our service, as we realign ourbusiness segments and continue to integrate our systems and operations, including those of the acquiredmortgage companies, we could experience higher than anticipated administrative costs and the loss ofcustomers, among other things. These events could adversely affect our operations and financial condition.
The financial services industry is highly competitive.
We are subject to significant competition in attracting and retaining deposits and making loans as wellas in providing other financial services in all of our market areas. We face pricing competition for loan anddeposit products. In addition, customer convenience and service capabilities, such as product lines offeredand the accessibility of services are significant competitive factors.
Our most direct competition for loans comes from commercial banks, other savings institutions,national mortgage companies and government-sponsored enterprises. Our most direct competition fordeposits comes from commercial banks, other savings institutions, and credit unions doing business in ourmarket areas. As with all banking organizations, we have also experienced competition from nonbankingsources, including mutual funds, corporate and government debt securities and other investmentalternatives offered within and outside of our primary market areas.
6

Changes in the regulation of financial services companies and housing government-sponsored enterprisescould adversely affect our business.
Proposals for further regulation of the financial services industry are continually being introduced inCongress. Proposals that are now receiving a great deal of attention include consumer protection initiativesrelating to the Real Estate Settlement Procedures Act, predatory lending, credit reporting and privacy. Theagencies regulating the financial services industry also periodically adopt changes to their regulations. It ispossible that one or more legislative proposals may be adopted or regulatory changes may be made thatwould have an adverse effect on our business. For further discussion of the regulations of financial services,see ‘‘Regulation and Supervision.’’
The Federal National Mortgage Association (‘‘FNMA’’ or ‘‘Fannie Mae’’), the Federal Home LoanMortgage Corporation (‘‘FHLMC’’ or ‘‘Freddie Mac’’) and the Federal Home Loan Banks are housinggovernment-sponsored enterprises (‘‘GSEs’’) which play a powerful role in the mortgage industry. We havesignificant business relationships with these GSEs. Proposals are being considered in Congress and byvarious regulators which would affect the manner in which these GSEs conduct their business. Theseproposals include establishing a new independent agency to regulate GSEs, requiring GSEs to registertheir stock with the United States Securities and Exchange Commission, and reducing or limiting certainbusiness benefits GSEs receive from the federal government. The enactment of any of these proposalscould increase the costs incurred by, or otherwise adversely affect the business of, the GSEs, which in turncould have an adverse impact on our business. For discussion of the Federal Home Loan Bank System andthe regulation of financial services, see ‘‘Regulation and Supervision.’’
Taxation
General
For federal income tax purposes, we report income and expenses using the accrual method ofaccounting on a calendar year basis. We are subject to federal income tax under existing provisions of theInternal Revenue Code of 1986, as amended, in generally the same manner as other corporations.
State Income Taxation
Many of the states in which we do business impose corporate income taxes on companies doingbusiness in those states. The State of Washington does not currently have a corporate income tax, but has abusiness and occupation tax on gross receipts. Currently, the tax does not apply to interest received onloans secured by first mortgages or deeds of trust on residential properties.
Assistance Agreement
In connection with the acquisition of Keystone Holdings, Inc. in 1996, we succeeded to the rights andobligations of Keystone Holdings and certain of its affiliates under a number of continuing agreementswith the predecessor to the Federal Deposit Insurance Corporation (‘‘FDIC’’), including an AssistanceAgreement. The Assistance Agreement provides, in part, for the payment to the Federal Savings & LoanInsurance Corporation Resolution Fund over time of 75% of most of the federal tax savings and 19.5% ofmost of the California tax savings (in each case computed in accordance with specific provisions containedin the Assistance Agreement) attributable to the utilization of certain tax loss carryforwards. The provisionfor such payments is reflected in the Consolidated Financial Statements as ‘‘Income Taxes.’’
See Note 14 to the Consolidated Financial Statements—‘‘Income Taxes’’ for further discussion.
Environmental Regulation
Our business and properties are subject to federal and state laws and regulations governingenvironmental matters, including the regulation of hazardous substances and wastes. For example, under
7

the federal Comprehensive Environmental Response, Compensation, and Liability Act and similar statelaws, owners and operators of contaminated properties may be liable for the costs of cleaning uphazardous substances without regard to whether such persons actually caused the contamination. Suchlaws may affect us both as an owner of properties used in or held for our business, and as a secured lenderon property that is found to contain hazardous substances or wastes. Our general policy is to obtain anenvironmental assessment prior to foreclosing on commercial property. The existence of hazardoussubstances or wastes on such property may cause us to elect not to foreclose on the property, therebylimiting, and in some instances precluding, our realization on such loans.
Regulation and Supervision
The following discussion describes elements of the extensive regulatory framework applicable tosavings and loan holding companies, federal savings associations and state savings banks and providessome specific information relevant to us. This regulatory framework is primarily intended for theprotection of depositors, federal deposit insurance funds and the banking system as a whole rather than forthe protection of shareholders and creditors.
To the extent that this section describes statutory and regulatory provisions, it is qualified in itsentirety by reference to those provisions. Those statutes and regulations, as well as related policies, aresubject to change by Congress, state legislatures and federal and state regulators. Changes in statutes,regulations or regulatory policies applicable to the Company, including interpretation or implementationthereof, could have a material effect on the Company’s business.
General
Washington Mutual, Inc. is a Washington state corporation. It owns two federal savings associationsand one Washington state-chartered savings bank, as well as numerous nonbank subsidiaries. Because ourstate bank has elected to be treated as a savings association for purposes of federal holding company law,Washington Mutual, Inc. is a savings and loan holding company. As a savings and loan holding company,Washington Mutual, Inc. is subject to regulation by the Office of Thrift Supervision (the ‘‘OTS’’).
Our federal savings associations are subject to extensive regulation and examination by the OTS, theirprimary federal regulator, as well as the FDIC. Our state bank is subject to regulation and supervision bythe Director of Financial Institutions of the State of Washington (the ‘‘State Director’’) and by the FDIC.Our nonbank financial subsidiaries are also subject to various federal and state laws and regulations.
All of our banking subsidiaries are under the common control of Washington Mutual, Inc. and areinsured by the FDIC. If an insured institution fails, claims for administrative expenses of the receiver andfor deposits in U.S. branches (including claims of the FDIC as subrogee of the failed institution) havepriority over the claims of general unsecured creditors. In addition, the FDIC has authority to require anyof our banking subsidiaries to reimburse it for losses it incurs in connection either with the failure ofanother of our banking subsidiaries or with the FDIC’s provision of assistance to one of our bankingsubsidiaries that is in danger of failure.
Payment of Dividends
Washington Mutual, Inc. is a legal entity separate and distinct from its banking and other subsidiaries.Its principal sources of funds are cash dividends paid by those subsidiaries, investment income, andborrowings. Federal and state laws limit the amount of dividends or other capital distributions that abanking institution, such as our federal associations and our state bank, can pay. Each of our bankingsubsidiaries has a policy to remain well-capitalized and, accordingly, would not pay dividends to the extentpayment of the dividend would result in it not being well-capitalized. In addition, our federal associationsmust file a notice with the OTS at least 30 days before they can pay dividends to their parent companies.
8

See Note 19 to the Consolidated Financial Statements—‘‘Regulatory Capital Requirements and DividendRestrictions’’ for a more detailed description of the limits on the dividends our subsidiary banks can pay.
Capital Adequacy
Washington Mutual, Inc. is not currently subject to any regulatory capital requirements, but each of itssubsidiary depository banking institutions is subject to various capital requirements. Our state bank issubject to FDIC capital requirements, while our federal associations are subject to OTS capitalrequirements. An institution’s capital category depends upon where its capital levels are in relation torelevant capital measures, which include a risk-based capital measure, a leverage ratio capital measure, atangible equity ratio measure, and certain other factors.
Federal law and regulations establish minimum capital standards, and under the OTS and FDICregulations, an institution (that is not in the most highly-rated category) is required to have a leverage ratioof at least 4.00%, a Tier 1 risk-based ratio of 4.00% and a total risk-based ratio of 8.00%. In addition, ourfederal associations are required to have a tangible capital ratio of 1.50%. Federal law and regulations alsoestablish five capital categories: well-capitalized, adequately capitalized, undercapitalized, significantlyundercapitalized and critically undercapitalized. An institution is treated as well-capitalized if its ratio oftotal capital to risk-weighted assets is 10.00% or more, its ratio of Tier 1 capital to risk-weighted assets is6.00% or more, its leverage ratio is 5.00% or more, and it is not subject to any federal supervisory order ordirective to meet a specific capital level. In order to be adequately capitalized, an institution must have atotal risk-based capital ratio of not less than 8.00%, a Tier 1 risk-based capital ratio of not less than 4.00%,and (unless it is in the most highly-rated category) a leverage ratio of not less than 4.00%. Any institutionthat is neither well-capitalized nor adequately capitalized will be considered undercapitalized. Anyinstitution with a tangible equity ratio of 2.00% or less will be considered critically undercapitalized.
As of December 31, 2003 each of our banking subsidiaries met all capital requirements to which it wassubject and satisfied the requirements to be treated as well-capitalized. See Note 19 to the ConsolidatedFinancial Statements—‘‘Regulatory Capital Requirements and Dividend Restrictions’’ for an analysis ofour regulatory capital.
Holding Company Status and Acquisitions
Washington Mutual, Inc. is a multiple savings and loan holding company, as defined by federal law,because it owns more than one savings association. Washington Mutual, Inc. is regulated as a unitarysavings and loan holding company, however, because the OTS deems our federal associations to have beenacquired in supervisory transactions. Therefore, we are exempt from certain restrictions that wouldotherwise apply under federal law to the activities and investments of a multiple savings and loan holdingcompany. These restrictions will apply to Washington Mutual, Inc. if any of our three banking institutionsfails to meet a qualified thrift lender test established by federal law. As of December 31, 2003, theCompany’s three banking subsidiaries were in compliance with qualified thrift lender standards.
Washington Mutual, Inc. may not acquire control of another savings association unless the OTSapproves. Washington Mutual, Inc. may not be acquired by a company, other than a bank holdingcompany, unless the OTS approves, or by an individual unless the OTS does not object after receivingnotice. Washington Mutual, Inc. may not be acquired by a bank holding company unless the Board ofGovernors of the Federal Reserve System (the ‘‘Federal Reserve’’) approves. In any case, the public musthave an opportunity to comment on the proposed acquisition, and the OTS or Federal Reserve mustcomplete an application review. Without prior approval from the OTS, Washington Mutual, Inc. may notacquire more than 5% of the voting stock of any savings institution that is not one of its subsidiaries.
9

The Gramm-Leach-Bliley Act generally restricts any non-financial entity from acquiring WashingtonMutual, Inc. unless such non-financial entity was, or had submitted an application to become, a savings andloan holding company as of May 4, 1999. Since Washington Mutual, Inc. was treated as a unitary savingsand loan holding company prior to that date, Washington Mutual, Inc. may engage in non-financialactivities and acquire non-financial subsidiaries.
Federal Home Loan Bank System
The primary purpose of the Federal Home Loan Banks (the ‘‘FHLBs’’) is to provide funding to theirmembers for making housing loans as well as for affordable housing and community development lending.The FHLBs are generally able to make advances to their member institutions at interest rates that arelower than could otherwise be obtained by such institutions. The FHLB System consists of twelve regionalFHLBs; each is federally chartered but privately owned by its member institutions. The Federal HousingFinance Board (‘‘Finance Board’’), a government agency, is generally responsible for regulating the FHLBSystem.
One of our federal savings associations, Washington Mutual Bank, FA, currently is a member only ofthe San Francisco FHLB. Our state bank, Washington Mutual Bank, and our other federal association,Washington Mutual Bank fsb, are members of the Seattle FHLB.
Proposals have been made recently which would affect the operations and structure of the FHLBSystem. The Finance Board has proposed a regulation that would require each FHLB to register its stockwith the United States Securities and Exchange Commission and provide more public disclosure. Congressis considering proposals which would establish a new regulator for the FHLB System, as well as for otherhousing government-sponsored entities. We cannot predict at this time which, if any, of these proposalsmay be adopted or what effect they would have on the business of the Company.
Deposit Insurance
The FDIC insures the deposits of each of our banking subsidiaries to the applicable maximum in eachinstitution, and such insurance is backed by the full faith and credit of the United States government. TheFDIC administers two separate deposit insurance funds, the Bank Insurance Fund (the ‘‘BIF’’) and theSavings Association Insurance Fund (the ‘‘SAIF’’). The BIF is a deposit insurance fund for commercialbanks and some federal and state-chartered savings banks. The SAIF is a deposit insurance fund for mostsavings associations. Our state bank is a member of the BIF, but a substantial portion of its deposits isinsured through the SAIF. Our federal associations are members of the SAIF, but a small portion ofWashington Mutual Bank, FA’s deposits are insured through the BIF.
The FDIC has established a risk-based system for setting deposit insurance assessments. Under therisk-based assessment system, an institution’s insurance assessments vary according to the level of capitalthe institution holds and the degree to which it is the subject of supervisory concern. During 2003, theassessment rate for both SAIF and BIF deposits ranged from zero to 0.27% of assessable deposits. Ourbanking subsidiaries qualified for the lowest rate on their deposits in 2003 and paid no deposit insuranceassessments.
Affiliate Transaction Restrictions
Our three banking subsidiaries are subject to the same affiliate and insider transaction rulesapplicable to member banks of the Federal Reserve System as well as additional limitations imposed by theOTS. These provisions prohibit or limit a banking institution from extending credit to, or entering intocertain transactions with, affiliates (such as Washington Mutual, Inc.), principal stockholders, directors andexecutive officers of the banking institution and its affiliates. Each of our banking subsidiaries currently isin material compliance with all of these limitations.
10

Federal Reserve, Consumer and Other Regulation
Numerous regulations promulgated by the Federal Reserve Board affect the business operations ofour banking subsidiaries. These include regulations relating to equal credit opportunity, electronic fundtransfers, collection of checks, truth in lending, truth in savings and availability of funds.
Under Federal Reserve Board regulations, each of our banking subsidiaries is required to maintain areserve against its transaction accounts (primarily interest-bearing and noninterest-bearing checkingaccounts). Because reserves must generally be maintained in cash or in noninterest-bearing accounts, theeffect of the reserve requirements is to increase an institution’s cost of funds.
The Gramm-Leach-Bliley Act included provisions that give consumers new protections regarding thetransfer and use of their nonpublic personal information by financial institutions. In addition, states arepermitted under the Gramm-Leach-Bliley Act to have their own privacy laws, which may offer greaterprotection to consumers than the Gramm-Leach-Bliley Act. Numerous states in which the Company doesbusiness have enacted such laws.
The four federal banking agencies, including our regulators, have jointly issued expanded examinationand supervision guidance relating to two areas affecting our activities—subprime lending and, mostrecently, mortgage banking and mortgage servicing rights.
The USA PATRIOT Act, which was enacted following the events of September 11, 2001, includednumerous provisions designed to fight international money laundering and to block terrorist access to theU.S. financial system. We have established policies and procedures to ensure compliance with the Act’sprovisions, and the impact of the Act on our operations has not been material.
Community Reinvestment Act
The Community Reinvestment Act (‘‘CRA’’) requires that our banking subsidiaries ascertain and helpmeet the credit needs of the communities we serve, including low- to moderate-income neighborhoods,while maintaining safe and sound banking practices. We maintain a CRA file that is available for publicviewing. The file includes copies of our most recent CRA Public Evaluations, descriptions of our productsand services, delivery outlet information, and public comments.
In September 2001, we announced a new ten-year $375 billion community commitment, effectiveJanuary 2002. This commitment replaced prior ones made by us and the companies we acquired. As ofDecember 31, 2003, we had exceeded our yearly targets for lending in low- to moderate-incomeneighborhoods and underserved market areas.
Regulatory Enforcement
The OTS, FDIC and the State Director may take regulatory enforcement actions against any of theirregulated institutions that do not operate in accordance with applicable regulations, policies and directives.Proceedings may be instituted against any banking institution, or any institution-affiliated party, such as adirector, officer, employee, agent, or controlling person, who engages in unsafe and unsound practices,including violations of applicable laws and regulations. Each of the OTS, the FDIC and the State Directorhas authority under various circumstances to appoint a receiver or conservator for an insured institutionthat it regulates, to issue cease and desist orders, to obtain injunctions restraining or prohibiting unsafe orunsound practices, to revalue assets and to require the establishment of reserves. The FDIC has additionalauthority to terminate insurance of accounts, after notice and hearing, upon a finding that the insuredinstitution is or has engaged in any unsafe or unsound practice that has not been corrected, is operating inan unsafe or unsound condition, or has violated any applicable law, regulation, rule, or order of, orcondition imposed by the FDIC.
11

Regulation of Nonbanking Affiliates
As broker-dealers registered with the Securities and Exchange Commission and as members of theNational Association of Securities Dealers, Inc., our broker-dealer subsidiaries are subject to variousregulations and restrictions imposed by those entities, as well as by various state authorities. As aregistered investment advisor, WM Advisors is subject to various federal and state securities regulationsand restrictions. Our specialty mortgage finance subsidiary is subject to various federal and state laws andregulations, including those relating to truth-in-lending, equal credit opportunity, fair credit reporting, realestate settlement procedures, debt collection practices and usury. Our insurance subsidiaries are subject toregulation by various state insurance regulators. Some of our subsidiaries are subject to various statelicensing and examination requirements.
Executive Officers
The following table sets forth certain information regarding the executive officers of WashingtonMutual:
Employee ofCompany
Executive Officers Age Capacity in Which Served Since
Kerry K. Killinger . . . . . . . 54 Chairman of the Board of Directors, President and 1983Chief Executive Officer
Thomas W. Casey . . . . . . . 41 Executive Vice President and Chief Financial Officer 2002Craig J. Chapman . . . . . . . 47 President, Commercial Group and Chief 1998
Administrative OfficerFay L. Chapman . . . . . . . . 57 Senior Executive Vice President and General Counsel 1997Daryl D. David . . . . . . . . . 49 Executive Vice President, Human Resources 2000Jeremy V. Gross . . . . . . . . 46 Executive Vice President and Chief Information 2001
OfficerWilliam A. Longbrake . . . . 61 Vice Chair 1996Robert H. Miles . . . . . . . . 47 Senior Vice President and Controller 1999Deanna W. Oppenheimer . 45 President, Consumer Group 1985Craig E. Tall . . . . . . . . . . . 58 Vice Chair, Corporate Development 1985James G. Vanasek . . . . . . . 60 Executive Vice President and Chief Enterprise Risk 1999
Officer
Mr. Killinger established the Executive Committee in 1990 to facilitate and coordinate decisionmaking by and communication among the most senior executive officers of the Company who, as acommittee, determine the Company’s strategic direction. The President’s Council, established byMr. Killinger in December 2002 and comprised of the Chief Financial Officer, the Chief AdministrativeOfficer and the Group Presidents, is focused on operational efficiency, operational decision-making andstrategic execution, with particular emphasis on operations and execution across business segments. Theexecutive officers serving on these committees at December 31, 2003 are indicated below.
Mr. Killinger is Chairman, President and Chief Executive Officer of Washington Mutual. He wasnamed President and Director in 1988, Chief Executive Officer in 1990 and Chairman in 1991.Mr. Killinger joined Washington Mutual as an Executive Vice President of Washington Mutual Bank in1983. He has been a member of the Executive Committee since its formation in 1990.
Mr. Casey is Executive Vice President and Chief Financial Officer of Washington Mutual. As amember of the Executive Committee and the President’s Council, he oversees all aspects of WashingtonMutual’s corporate finance, strategic planning and investor relations functions. Prior to joining WashingtonMutual, Mr. Casey was with GE Capital Corp. from 1992 through 2002 where he held advising,
12

controllership and analyst positions prior to becoming a vice president of GE and Senior Vice Presidentand CFO of GE Financial Assurance in 1999.
Mr. Chapman is President of the Commercial Group and Chief Administrative Officer. He isresponsible for overseeing multi-family lending, commercial real estate, homebuilder finance, mortgagebanker finance, Long Beach Mortgage Company, and commercial banking. As Chief AdministrativeOfficer, Mr. Chapman oversees operational excellence, acquisition integration, corporate property servicesand strategic sourcing. After joining Washington Mutual in 1998 as President and Chief Executive Officerof Washington Mutual Finance Corporation, he became a member of the Executive Committee in 2001and a member of the President’s Council in 2002. Previously, Mr. Chapman served as President ofAMRESCO Residential Mortgage Corporation from 1996 to 1997.
Ms. Chapman is Washington Mutual’s General Counsel and has been Senior Executive Vice Presidentsince 1999. She became Executive Vice President, General Counsel and a member of the ExecutiveCommittee in 1997. Prior to joining Washington Mutual, she was a partner at the Seattle law office ofFoster Pepper & Shefelman PLLC from 1979 to 1997.
Mr. David joined Washington Mutual in 2000 as Executive Vice President, Human Resources. He isresponsible for talent acquisition, organizational capabilities, leadership development and rewards andbenefits. Mr. David became a member of the Executive Committee in 2001. He joined Washington Mutualfrom Amazon.com where he was Vice President of Strategic Growth and Human Resources from 1999 to2000. Previously, he served as Executive Vice President and Chief Administrative Officer of SangaInternational from 1998 to 1999.
Mr. Gross joined Washington Mutual in 2001 as Executive Vice President and Chief InformationOfficer and became a member of the Executive Committee at that time. He is responsible for directing theCompany’s corporate technology strategy. Mr. Gross joined Washington Mutual from Sydney, Australia-based Westpac Banking Corp. where he was Group Executive of Technology, Operations and eCommercefrom 1999 to 2001. From 1992 to 1999, he was Managing Director and Chief Technology Officer atCountrywide Credit Industries.
Mr. Longbrake has been Vice Chair since 1999 and a member of the Executive Committee since 1996.He serves as the Company’s primary executive liaison with regulators, legislators, industry tradeorganizations, and government-sponsored enterprises. Mr. Longbrake was an Executive Vice Presidentfrom 1996 to 1999 and served as the Company’s Chief Financial Officer from 1996 to 2002.
Mr. Miles has been Senior Vice President and Controller since January 2001. He serves as WashingtonMutual’s principal accounting officer. Mr. Miles joined the Company as Senior Vice President, CorporateTax in June 1999. Prior to joining the Company, Mr. Miles was Director, Domestic Taxes of the formerBankBoston, N.A. from 1996 to 1999.
Ms. Oppenheimer is President of the Consumer Group. She is responsible for two of the Company’sreporting segments, Retail Banking and Financial Services, and Mortgage Banking. Additionally,Ms. Oppenheimer oversees corporate relations and the Company’s Corporate Innovation and ResearchCenter. Ms. Oppenheimer became Executive Vice President in 1993, has been a member of the ExecutiveCommittee since its formation in 1990, and became a member of the President’s Council in 2002. She hasbeen an officer of the Company since 1985.
Mr. Tall is Vice Chair of Corporate Development. He is responsible for overseeing the Company’scorporate development, including acquisitions and divestitures. He is also Chairman of WashingtonMutual’s Strategic Capital Fund Investment Committee. Mr. Tall became an Executive Vice President in1987 and Vice Chair in 1999. He has been a member of the Executive Committee since its formation in1990.
13

Mr. Vanasek is Executive Vice President and Chief Enterprise Risk Officer. He is responsible foroverseeing credit risk management for the Company, as well as compliance, market and operational risk,internal audit and business continuity. Mr. Vanasek became a member of the Executive Committee in2001. Prior to joining Washington Mutual in 1999, he spent eight years at the former Norwest Bank, in avariety of lending risk management positions including Chief Credit Officer.
Properties
The Company’s headquarters are located at 1201 Third Avenue, Seattle, Washington 98101. As ofDecember 31, 2003, we conducted business in 47 states through approximately 2,913 physical distributioncenters.
The Company, in a joint venture with the Seattle Art Museum, is constructing a new headquartersbuilding in downtown Seattle. On completion of the building, the Company will own approximately900,000 square feet and will lease from the Seattle Art Museum an additional 250,000 square feet for aperiod of up to 25 years. The lessor has the right to cancel the lease, in whole or in part, at any time afterthe tenth year of the lease. Occupancy and the term of the lease are expected to commence concurrently in2006.
Additionally, significant facilities that we owned or leased were as follows:
Approximate Termination orLocation Leased/Owned Square Footage Renewal Date(1)
1201 3rd Ave., Seattle, WA . . . . . . . . . . . . . . . . . . . . . . . Leased 400,000 2006-20101111 3rd Ave., Seattle, WA . . . . . . . . . . . . . . . . . . . . . . . Leased 249,000 2004-20171191 2nd Ave., Seattle, WA . . . . . . . . . . . . . . . . . . . . . . . Leased 238,000 2015999 3rd Ave., Seattle, WA . . . . . . . . . . . . . . . . . . . . . . . . Leased 158,000 2004-20061301 5th Ave., Seattle, WA . . . . . . . . . . . . . . . . . . . . . . . Leased 130,000 2005-20081501 4th Ave., Seattle, WA . . . . . . . . . . . . . . . . . . . . . . . Leased 112,000 2005-20102500 & 2530 223rd St. SE, Bothell, WA . . . . . . . . . . . . . . Leased 106,000 2005-200818525 36th Ave. S, SeaTac, WA . . . . . . . . . . . . . . . . . . . . Owned 106,000 n/aChatsworth, CA(2) . . . . . . . . . . . . . . . . . . . . . . . . . . . . . . Leased 454,000 2005-2015Chatsworth, CA(2) . . . . . . . . . . . . . . . . . . . . . . . . . . . . . . Owned 343,000 n/aIrvine, CA(2) . . . . . . . . . . . . . . . . . . . . . . . . . . . . . . . . . . Owned 421,000 n/aIrvine, CA(2) . . . . . . . . . . . . . . . . . . . . . . . . . . . . . . . . . . Leased 176,000 2004-2010Northridge, CA(2) . . . . . . . . . . . . . . . . . . . . . . . . . . . . . . Leased 348,000 2005-2006Stockton, CA(2) . . . . . . . . . . . . . . . . . . . . . . . . . . . . . . . . Owned 329,000 n/a3883 Airway Drive, Santa Rosa, CA . . . . . . . . . . . . . . . . Owned 106,000 n/aJacksonville, FL(2) . . . . . . . . . . . . . . . . . . . . . . . . . . . . . . Leased 423,000 2004-20091501 Yamato Rd., Boca Raton, FL . . . . . . . . . . . . . . . . . Owned 167,000 n/a7301 Baymeadows Way, Jacksonville, FL . . . . . . . . . . . . . Owned 145,000 n/a2601 10th Ave. N., Lake Worth, FL . . . . . . . . . . . . . . . . . Owned 102,000 n/aVernon Hills, IL(2) . . . . . . . . . . . . . . . . . . . . . . . . . . . . . Leased 419,000 2004-20063050 Highland Pkwy, Downers Grove, IL . . . . . . . . . . . . . Leased 176,000 2013Houston, TX(2) . . . . . . . . . . . . . . . . . . . . . . . . . . . . . . . . Leased 352,000 2004-20089601 McAllister Fwy, San Antonio, TX . . . . . . . . . . . . . . Leased 159,000 2005Florence, SC(2) . . . . . . . . . . . . . . . . . . . . . . . . . . . . . . . . Leased 245,000 2005-200811200 W. Parkland Ave., Milwaukee, WI . . . . . . . . . . . . . Owned 230,000 n/a231 E. Ave., Albion, NY . . . . . . . . . . . . . . . . . . . . . . . . . Leased 221,000 2009-2011EAB Plaza, Uniondale, NY . . . . . . . . . . . . . . . . . . . . . . . Leased 109,000 2007
(1) The Company has options to renew leases at most locations.(2) Multiple locations.
14

Legal Proceedings
In the ordinary course of business, the Company and its subsidiaries are routinely defendants in orparties to a number of pending and threatened legal actions and proceedings, including actions brought onbehalf of various classes of claimants. In certain of these actions and proceedings, claims for substantialmonetary damages are asserted against the Company and its subsidiaries. Certain of these actions andproceedings are based on alleged violations of consumer protection, banking and other laws.
See Note 15 to the Consolidated Financial Statements—‘‘Commitments, Guarantees andContingencies’’ for a further discussion of pending and threatened litigation action and proceedingsagainst the Company.
Submission of Matters to a Vote of Security Holders
No matters were submitted to shareholders during the fourth quarter of 2003.
PART II
Market for our Common Stock and Related Stockholder Matters
Our common stock trades on The New York Stock Exchange under the symbol WM. As ofFebruary 27, 2004, there were 868,397,759 shares issued and outstanding (including 6 million shares held inescrow) held by 51,293 shareholders of record. The information regarding high and low quarterly salesprices of the Company’s common stock, and the quarterly cash dividends declared thereon, is set forth inthis Form 10-K/A in the ‘‘Quarterly Results of Operations’’ table included under Supplementary Data onpage 151 and is expressly incorporated herein by reference.
15

MANAGEMENT’S DISCUSSION AND ANALYSIS OF FINANCIAL CONDITION AND RESULTS OFOPERATIONS
Restatements of Financial Statements
During the fourth quarter of 2003, the Company concluded that the inclusion of certain components(i.e. deferred acquisition costs and claims stabilization reserves) in the cash surrender value of itsbank-owned life insurance policies was incorrect. The accounting policy the Company previously usedresulted in the overstatement of the cash surrender value of the policies and, accordingly, other noninterestincome. This restatement also decreased other assets, and correspondingly, retained earnings by$73 million, $38 million and $28 million as of December 31, 2002, 2001 and 2000. The restatement onlyaffects periods commencing with the second quarter of 2000 when the policies were first acquired and hadno tax effect. The Company has corrected its accounting for all affected prior reporting periods.
During the first quarter of 2004 and subsequent to the original filing of the Company’s Annual Reporton Form 10-K, the Company corrected the funds transfer pricing methodology applied to the financialresults of the Company’s operating segments for the year ending December 31, 2001. The correctionrevises certain operating segment information, including net interest income and net income, of itsoperating segment results reported for that year. The corrected information is included in the operatingsegment tables presented herein and in Note 25 to the Consolidated Financial Statements—‘‘OperatingSegments.’’ Such information had no effect on previously reported 2001 consolidated results of operationsor any other period presented in this report.
Discontinued Operations
On November 24, 2003 the Company announced a definitive agreement to sell its subsidiary,Washington Mutual Finance Corporation, to CitiFinancial, a subsidiary of Citigroup, for approximately$1.25 billion in cash. This sale was completed on January 9, 2004. Accordingly, Washington Mutual Financeis presented in this report as a discontinued operation with the results of operations and cash flowssegregated from the Company’s results of continuing operations for all periods presented on theConsolidated Statements of Income, Cash Flows and Notes to the Consolidated Financial Statements aswell as the tables presented herein, unless otherwise noted. Likewise, the assets and liabilities ofWashington Mutual Finance have each been combined and presented as separate captions on theConsolidated Statements of Financial Condition.
Controls and Procedures
Disclosure Controls and Procedures
The Company’s management, under the direction of the Company’s Chief Executive Officer andChief Financial Officer, has evaluated the effectiveness of the Company’s disclosure controls andprocedures as of the end of the period covered by this report. Based on such evaluation, the Company’sChief Executive Officer and Chief Financial Officer have concluded that, as of the end of such period, theCompany’s disclosure controls and procedures are effective in recording, processing, summarizing andreporting, on a timely basis, information required to be disclosed by the Company in the reports that it filesor submits under the Securities Exchange Act of 1934.
We review and evaluate the design and effectiveness of our disclosure controls and procedures on anongoing basis and improve our controls and procedures over time and correct any deficiencies that we maydiscover. While we believe the present design of our disclosure controls and procedures is effective, futureevents affecting our business may cause us to modify our disclosure controls and procedures.
16

Internal Control Over Financial Reporting
There have not been any changes in the Company’s internal control over financial reporting duringthe fourth quarter of 2003 that have materially affected, or are reasonably likely to materially affect, theCompany’s internal control over financial reporting.
Overview
Net income increased to $3.88 billion or $4.21 per diluted share in 2003, from $3.86 billion or $4.02per diluted share in 2002, an increase of 5% on a per share basis. The increase in earnings per share waspredominantly due to share repurchase activity that occurred during the year. During 2003, the Companyrepurchased a total of 65.9 million shares, as compared with 38.0 million shares repurchased in 2002.Largely in response to a favorable change in the federal income tax treatment of dividends and ourfinancial performance, the Company’s common stock dividend payout ratio increased from 25.92% in 2002to 32.63% in 2003.
Net interest income declined to $7.63 billion in 2003, a decrease of $500 million from $8.13 billion in2002. This decrease was attributable to a 30 basis point decline in the net interest margin year-over-year.We expect the margin to contract further in 2004 as yields on our debt securities and loans continue toreprice downward to current market levels.
Home loan mortgage banking income was $1.97 billion in 2003, an increase of $1.27 billion from$707 million in 2002. During the first part of 2003, the anemic recovery in the U.S. economy pressuredhome loan mortgage lending rates to historical lows. This, in turn, fueled an industry-wide mortgagerefinance boom, and led to extremely high loan volume, an increase in gain from mortgage loans and highlevels of noninterest-bearing custodial deposits (collected from loan payoff activity) during the first half of2003. In the third quarter of 2003, the monthly average of the U.S. mortgage refinance index (seasonallyadjusted) declined by 31%, which was caused by a sharp increase in mortgage interest rates. As a result,customer preferences began to shift from fixed-rate, salable production to adjustable-rate, portfolioactivity, which resulted in a decline in gain from mortgage loans and lower levels of custodial balances.Market volatility and operational issues exacerbated the decrease in gain from mortgage loans during thethird quarter of 2003. Refinancing activity diminished further in the fourth quarter of 2003 as mortgageinterest rates remained above their historical low points and thus caused gain from mortgage loans toremain well below the levels recorded during the first half of the year. The volatility in mortgage interestrates in 2003 also caused significant fluctuations in the anticipated prepayment speeds of the Company’sloans serviced for others portfolio and, as a result, led to significant changes in the amortization level andthe fair value of the Company’s MSR. The performance of the Company’s MSR risk managementinstruments during the year, which consist of derivative financial instruments and available-for-salesecurities, mitigated the financial effects of prepayment speed volatility.
Additional strides were made in retail banking market penetration as there was a net increase of over800,000 retail checking accounts during the year, including over 180,000 during the fourth quarter, bringingthe Company’s total to more than 8 million accounts. The year produced depositor and other retailbanking fees of $1.82 billion, an increase of $184 million from $1.63 billion in 2002. At year end, theaverage mature retail banking household maintained 5.59 products and services with the Company, anincrease from 5.28 at year end 2002. A total of 260 new retail banking stores were opened in 2003, bringingthe total number of retail banking stores nationwide to 1,776 at the end of the year. The build out of ournational retail banking franchise will continue in 2004, as we expect to open approximately 250 new storesand deepen existing relationships by cross-selling additional products to customers.
Noninterest expense was $7.41 billion, an increase of $1.22 billion from $6.19 billion in 2002 due tohigher personnel costs to accommodate the high refinancing activity in the earlier part of the year and theopening of new retail banking stores. With the refinancing boom over, the Company announced its costcontainment initiative in the fourth quarter of 2003. The Company intends to reduce expenses in thoseareas of operations that are not integral to the Company’s planned expansion of the retail banking
17

franchise. The savings realized from this cost containment initiative will be used to facilitate this expansion.The recent realignment of the Company’s operations into two major categories—retail consumers andcommercial customers—will support this initiative by eliminating redundant operations and processes. TheCompany expects that the impact of this initiative, which is not scheduled to be completed until the middleof 2005, coupled with the costs to be incurred in 2004 from the continuing expansion of the retail bankingfranchise, will result in an increase in noninterest expense of no more than 5% in 2004, as compared with2003.
Credit quality of the Company’s loan portfolio improved in 2003 as the Company benefited from thestrengthening U.S. economy during the latter part of the year and continued to take advantage of marketopportunities to reduce specific credit risk exposures. At December 31, 2003, nonperforming assets as apercentage of total assets were 0.70 percent versus 0.93 percent at December 31, 2002. Totalnonperforming assets were down $546 million to $1.94 billion at December 31, 2003, as compared with$2.48 billion at December 31, 2002. The improved credit risk profile resulted in the recording of a$202 million reversal in the allowance for loan and lease losses in the fourth quarter of 2003 and aprovision for loan and lease losses of $42 million for the year ended December 31, 2003.
In the fourth quarter of 2003, the Company entered into a definitive agreement to sell WashingtonMutual Finance Corporation, a subsidiary of the Company, to CitiFinancial, a subsidiary of Citigroup, forapproximately $1.25 billion. The sale was completed on January 9, 2004 and resulted in a pre-tax gain ofapproximately $660 million, to be recorded in the first quarter of 2004.
Critical Accounting Policies
The preparation of financial statements in accordance with accounting principles generally acceptedin the United States of America requires management to make a number of judgments, estimates andassumptions that affect the reported amount of assets, liabilities, income and expenses in our ConsolidatedFinancial Statements and accompanying notes. We believe that the judgments, estimates and assumptionsused in the preparation of our Consolidated Financial Statements are appropriate given the factualcircumstances as of December 31, 2003.
Various elements of our accounting policies, by their nature, are inherently subject to estimationtechniques, valuation assumptions and other subjective assessments. In particular, we have identified fouraccounting policies that, due to the judgments, estimates and assumptions inherent in those policies, andthe sensitivity of our Consolidated Financial Statements to those judgments, estimates and assumptions,
18
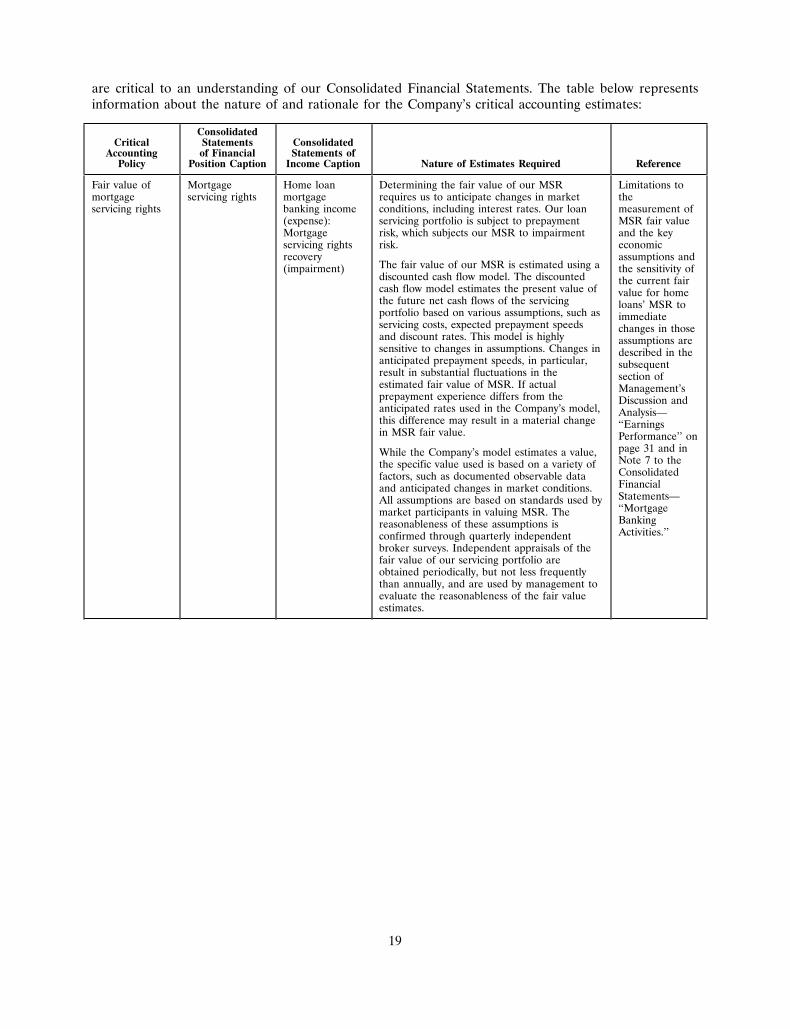
are critical to an understanding of our Consolidated Financial Statements. The table below representsinformation about the nature of and rationale for the Company’s critical accounting estimates:
ConsolidatedCritical Statements Consolidated
Accounting of Financial Statements ofPolicy Position Caption Income Caption Nature of Estimates Required Reference
Fair value of Mortgage Home loan Determining the fair value of our MSR Limitations tomortgage servicing rights mortgage requires us to anticipate changes in market theservicing rights banking income conditions, including interest rates. Our loan measurement of
(expense): servicing portfolio is subject to prepayment MSR fair valueMortgage risk, which subjects our MSR to impairment and the keyservicing rights risk. economicrecovery assumptions and
The fair value of our MSR is estimated using a(impairment) the sensitivity ofdiscounted cash flow model. The discounted the current faircash flow model estimates the present value of value for homethe future net cash flows of the servicing loans’ MSR toportfolio based on various assumptions, such as immediateservicing costs, expected prepayment speeds changes in thoseand discount rates. This model is highly assumptions aresensitive to changes in assumptions. Changes in described in theanticipated prepayment speeds, in particular, subsequentresult in substantial fluctuations in the section ofestimated fair value of MSR. If actual Management’sprepayment experience differs from the Discussion andanticipated rates used in the Company’s model, Analysis—this difference may result in a material change ‘‘Earningsin MSR fair value. Performance’’ on
page 31 and inWhile the Company’s model estimates a value,Note 7 to thethe specific value used is based on a variety ofConsolidatedfactors, such as documented observable dataFinancialand anticipated changes in market conditions.Statements—All assumptions are based on standards used by‘‘Mortgagemarket participants in valuing MSR. TheBankingreasonableness of these assumptions isActivities.’’confirmed through quarterly independent
broker surveys. Independent appraisals of thefair value of our servicing portfolio areobtained periodically, but not less frequentlythan annually, and are used by management toevaluate the reasonableness of the fair valueestimates.
19

ConsolidatedCritical Statements Consolidated
Accounting of Financial Statements ofPolicy Position Caption Income Caption Nature of Estimates Required Reference
Rate lock Other assets Home loan The Company enters into commitments to See furthercommitments mortgage originate or purchase loans whereby the discussion in the
banking income interest rate on the loan is set prior to funding subsequent(expense): Gain (rate lock commitments). The fair value of section offrom mortgage salable rate lock commitments includes the Management’sloans value of the anticipated retained servicing Discussion and
income, which is calculated using the same Analysis—valuation methodologies used to value the ‘‘EarningsCompany’s MSR, adjusted for an anticipated Performance’’ onfallout factor for loan commitments not page 31.expected to be funded. This valuation policyhas the effect of recognizing the gain frommortgage loans before the loans are sold.However, in a recently released Securities andExchange Commission (‘‘SEC’’) StaffAccounting Bulletin, the SEC ruled that theamount of the anticipated servicing incomeshould not be included when determining thefair value of derivative interest rate lockcommitments. In anticipation of this Bulletin,the Company prospectively changed itsaccounting policy for derivative rate lockcommitments on January 1, 2004. Under thenew policy, the expected servicing rights thathad previously been recorded at the initiationof the rate lock are not recognized until theunderlying loans are sold.
Allowance for Allowance for Provision for The allowance for loan and lease losses The estimatesloan and lease loan and lease loan and lease represents management’s estimate of credit and judgmentslosses losses losses losses inherent in the Company’s loan and are described in
lease portfolios as of the balance sheet date. further detail inThe estimation of the allowance is based on a the subsequentvariety of factors, including past loan loss section ofexperience, adverse situations that have Management’soccurred but are not yet known that may affect Discussion andthe borrower’s ability to repay, the estimated Analysis—‘‘Assetvalue of underlying collateral and general Quality’’ on pageeconomic conditions. The Company’s 49 and in Note 1methodology for assessing the adequacy of the to theallowance includes the evaluation of three Consolidateddistinct components: the formula allowance, the Financialspecific allowance and the unallocated Statements—allowance. As the process for determining the ‘‘Summary ofadequacy of the allowance requires subjective Significantand complex judgment by management about Accountingthe effect of matters that are inherently Policies.’’uncertain, subsequent evaluations of the loanportfolio, in light of the factors then prevailing,may result in significant changes in theallowance for loan and lease losses.
20

ConsolidatedCritical Statements Consolidated
Accounting of Financial Statements ofPolicy Position Caption Income Caption Nature of Estimates Required Reference
Net periodic Other assets Compensation The net periodic benefit cost is actuarially The impact tobenefit cost and benefits determined using assumed discount rates, compensation
assumed rates of compensation increase and and benefitsexpected return on assets. These assumptions expense ifare ultimately determined by management. certain
assumptions areThe discount rate is determined using Moody’s changed isAa spot rate as of year end. The compensation discussed in therate is determined by reviewing the Company’s subsequentsalary increases each year along with reviewing section ofindustry averages. The expected long-term Management’sreturn on plan assets represents management’s Discussion andexpectation of the average rate of earnings on Analysis—the funds invested to provide for the benefits ‘‘Liquidity’’ onincluded in the projected benefit obligation. page 56.
Management has discussed the development and selection of these critical accounting policies withthe Audit Committee of our Board of Directors. In addition, there are other complex accounting standardsthat require the Company to employ significant judgment in interpreting and applying certain of theprinciples prescribed by those standards. These judgments include, but are not limited to, thedetermination of whether a financial instrument or other contract meets the definition of a derivative inaccordance with Statement of Financial Accounting Standards (‘‘Statement’’) No. 133, Accounting forDerivative Instruments and Hedging Activities, and the applicable hedge accounting criteria. These policiesand the judgments, estimates and assumptions are described in greater detail in subsequent sections ofManagement’s Discussion and Analysis and in Note 1 to the Consolidated Financial Statements—‘‘Summary of Significant Accounting Policies.’’
Recently Issued Accounting Standards
In December 2003, the Financial Accounting Standards Board (‘‘FASB’’) issued InterpretationNo. 46R (‘‘FIN 46R’’), Consolidation of Variable Interest Entities, an interpretation of Accounting ResearchBulletin No. 51. FIN 46R is a revision to the original FIN 46 that addresses the consolidation of certainvariable interest entities (e.g., non-qualified special purpose entities). The revision clarifies how variableinterest entities should be identified and evaluated for consolidation purposes. FIN 46R must be appliedno later than March 31, 2004. The Company adopted FIN 46 as of July 1, 2003. The Company is still in theprocess of studying and evaluating the impact of FIN 46R. However, at this time the Company does notexpect the impact of FIN 46R to have a significant effect on the results of operations or financialcondition.
In December 2003, the Accounting Standards Executive Committee of the AICPA issued Statementof Position No. 03-3 (‘‘SOP 03-3’’), Accounting for Certain Loans or Debt Securities Acquired in a Transfer.SOP 03-3 addresses the accounting for differences between the contractual cash flows and the cash flowsexpected to be collected from purchased loans or debt securities if those differences are attributable, inpart, to credit quality. SOP 03-3 requires purchased loans and debt securities to be recorded initially at fairvalue based on the present value of the cash flows expected to be collected with no carryover of anyvaluation allowance previously recognized by the seller. Interest income should be recognized based on theeffective yield from the cash flows expected to be collected. To the extent that the purchased loansexperience subsequent deterioration in credit quality, a valuation allowance would be established for anyadditional cash flows that are not expected to be received. However, if more cash flows subsequently areexpected to be received than originally estimated, the effective yield would be adjusted on a prospectivebasis. SOP 03-3 will be effective for loans and debt securities acquired after December 31, 2004. Althoughthe Company anticipates that the implementation of SOP 03-3 will require significant loan system and
21

operational changes to track credit related losses on loans purchased starting in 2005, it is not expected tohave a significant effect on the Consolidated Financial Statements.
In March 2004, Securities and Exchange Commission (‘‘SEC’’) Staff Accounting Bulletin No. 105 wasissued, which provides guidance regarding loan commitments that are accounted for as derivativeinstruments under FASB No. 133 (as amended), Accounting for Derivative Instruments and HedgingActivities. In this Bulletin, the SEC ruled that the amount of the expected servicing rights should not beincluded when determining the fair value of derivative interest rate lock commitments. This guidance mustbe applied to rate locks initiated after March 31, 2004. In anticipation of this Bulletin, the Companyprospectively changed its accounting policy for derivative rate lock commitments on January 1, 2004.Under the new policy, the expected servicing rights that had previously been recorded at the initiation ofthe rate lock are not recognized until the underlying loans are sold. The impact that this new policy willhave on the Company’s results of operations in the first quarter of 2004 will be significantly influenced bythat quarter’s amount of salable rate lock volume and by the timing of when loan sales are executed. Asrate lock volume is highly sensitive to changes in interest rates and the timing of loan sales may be affectedby market conditions, the Company cannot provide a reliable estimate of the impact this change will haveto its future results of operations.
22

Five-Year Summary of Selected Financial Data
December 31,
2003 2002 2001 2000 1999
(in millions, except per share amounts)
Income Statement Data (for the year ended)Net interest income . . . . . . . . . . . . . . . . . . . . . . $ 7,629 $ 8,129 $ 6,492 $ 3,952 $ 4,127Provision for loan and lease losses . . . . . . . . . . . 42 404 426 77 67Noninterest income . . . . . . . . . . . . . . . . . . . . . . 5,850 4,469 3,176 1,925 1,479Noninterest expense . . . . . . . . . . . . . . . . . . . . . 7,408 6,188 4,416 2,970 2,775Net income . . . . . . . . . . . . . . . . . . . . . . . . . . . . 3,880 3,861 3,104 1,871 1,817Basic earnings per common share(1):
Income from continuing operations . . . . . . . . . 4.20 4.01 3.57 2.24 2.03Income from discontinued operations, net . . . . 0.09 0.08 0.07 0.09 0.09
Net income . . . . . . . . . . . . . . . . . . . . . . . . . . 4.29 4.09 3.64 2.33 2.12Diluted earnings per common share(1):
Income from continuing operations . . . . . . . . . 4.12 3.94 3.51 2.23 2.02Income from discontinued operations, net . . . . 0.09 0.08 0.07 0.09 0.09
Net income . . . . . . . . . . . . . . . . . . . . . . . . . . 4.21 4.02 3.58 2.32 2.11Dividends declared per common share(1) . . . . . . . 1.40 1.06 0.90 0.76 0.65
Balance Sheet Data (at year end)Securities . . . . . . . . . . . . . . . . . . . . . . . . . . . . . $ 36,707 $ 43,905 $ 58,233 $ 58,547 $ 60,663Loans held for sale . . . . . . . . . . . . . . . . . . . . . . 20,343 38,782 27,574 3,404 794Loans held in portfolio . . . . . . . . . . . . . . . . . . . 175,644 143,869 126,396 115,898 110,684Mortgage servicing rights . . . . . . . . . . . . . . . . . . 6,354 5,341 6,241 1,017 643Goodwill . . . . . . . . . . . . . . . . . . . . . . . . . . . . . . 6,196 6,213 2,116 919 1,007Assets . . . . . . . . . . . . . . . . . . . . . . . . . . . . . . . . 275,178 268,225 242,468 194,688 186,514Deposits . . . . . . . . . . . . . . . . . . . . . . . . . . . . . . 153,181 155,516 106,946 79,384 80,940Securities sold under agreements to repurchase . . 28,333 16,717 39,447 29,756 30,163Advances from Federal Home Loan Banks . . . . . 48,330 51,265 61,072 57,698 56,978Other borrowings . . . . . . . . . . . . . . . . . . . . . . . 15,483 14,712 9,925 7,734 4,207Stockholders’ equity . . . . . . . . . . . . . . . . . . . . . . 19,742 20,061 14,025 10,138 9,053
Supplemental DataLoan volume:
Home:Adjustable rate . . . . . . . . . . . . . . . . . . . . . . $ 99,899 $ 84,627 $ 37,224 $ 37,286 $ 33,114Fixed rate . . . . . . . . . . . . . . . . . . . . . . . . . . 263,604 180,745 108,105 6,631 10,678Specialty mortgage finance(2) . . . . . . . . . . . . 20,678 14,077 10,333 7,549 5,008
Total home loan volume . . . . . . . . . . . . . . . . . 384,181 279,449 155,662 51,466 48,800Total loan volume . . . . . . . . . . . . . . . . . . . . . 432,245 309,419 172,951 62,973 56,844Home loan refinancing(3) . . . . . . . . . . . . . . . . 269,442 183,788 97,555 14,853 11,792Total refinancing(3) . . . . . . . . . . . . . . . . . . . . . 277,717 188,807 99,207 16,409 12,586
(1) Restated for all stock splits.(2) Represents purchased subprime loans and mortgages originated by Long Beach Mortgage.(3) Includes loan refinancing entered into by both new and pre-existing customers.
23

Ratios and Other Supplemental Data
Year Ended December 31,
2003 2002 2001
(dollars in millions,except per share amounts)
ProfitabilityReturn on average assets(1) . . . . . . . . . . . . . . . . . . . . . . . . . . . . 1.37% 1.42% 1.38%Return on average common stockholders’ equity(1) . . . . . . . . . . . 18.85 19.34 23.51Net interest margin . . . . . . . . . . . . . . . . . . . . . . . . . . . . . . . . . . 3.11 3.41 3.19Efficiency ratio(2)(3) . . . . . . . . . . . . . . . . . . . . . . . . . . . . . . . . . . 54.96 49.12 44.29
Asset QualityNonaccrual loans(4)(5) . . . . . . . . . . . . . . . . . . . . . . . . . . . . . . . . . $1,626 $2,155 $1,920Foreclosed assets(5) . . . . . . . . . . . . . . . . . . . . . . . . . . . . . . . . . . 311 328 216
Total nonperforming assets(5) . . . . . . . . . . . . . . . . . . . . . . . . . 1,937 2,483 2,136Nonperforming assets/total assets(5) . . . . . . . . . . . . . . . . . . . . . . 0.70% 0.93% 0.88%Restructured loans(5) . . . . . . . . . . . . . . . . . . . . . . . . . . . . . . . . . $ 111 $ 98 $ 118
Total nonperforming assets and restructured loans(5) . . . . . . . . 2,048 2,581 2,254Allowance for loan and lease losses(5) . . . . . . . . . . . . . . . . . . . . . 1,250 1,503 1,278Allowance as a percentage of total loans held in portfolio(5) . . . . 0.71% 1.04% 1.01%Net charge-offs . . . . . . . . . . . . . . . . . . . . . . . . . . . . . . . . . . . . . $ 309 $ 248 $ 177
Capital Adequacy(5)
Stockholders’ equity/total assets . . . . . . . . . . . . . . . . . . . . . . . . . 7.17% 7.48% 5.78%Tangible common equity(6)/total tangible assets(6) . . . . . . . . . . . . . 5.26 5.26 5.13Estimated total risk-based capital/risk-weighted assets(7) . . . . . . . . 10.94 11.53 12.84
Per Common Share Data(8)
Number of common shares outstanding at end of period (inthousands) . . . . . . . . . . . . . . . . . . . . . . . . . . . . . . . . . . . . . . 880,986 944,047 873,089
Common stock dividend payout ratio . . . . . . . . . . . . . . . . . . . . . 32.63% 25.92% 24.73%Book value per common share(5)(9) . . . . . . . . . . . . . . . . . . . . . . . $22.56 $21.66 $16.40Market prices:
High . . . . . . . . . . . . . . . . . . . . . . . . . . . . . . . . . . . . . . . . . . . 46.55 39.45 42.69Low . . . . . . . . . . . . . . . . . . . . . . . . . . . . . . . . . . . . . . . . . . . 32.98 28.41 28.56Year end . . . . . . . . . . . . . . . . . . . . . . . . . . . . . . . . . . . . . . . . 40.12 34.53 32.70
(1) Includes income from continuing and discontinued operations.(2) Based on continuing operations.(3) The efficiency ratio is defined as noninterest expense, excluding amortization of goodwill (applicable only to 2001), divided by
total revenue (net interest income and noninterest income).(4) Excludes nonaccrual loans held for sale.(5) As of year end.(6) Excludes unrealized net gain/loss on available-for-sale securities and derivatives, goodwill and intangible assets, but includes
MSR.(7) Estimate of what the total risk-based capital ratio would be if Washington Mutual, Inc. was a bank holding company that is
subject to Federal Reserve Board capital requirements.(8) Restated for all stock splits.(9) Excludes 6 million shares at December 31, 2003, and 18 million shares at December 31, 2002 and 2001, held in escrow.
24

Earnings Performance from Continuing Operations
Net Interest Income
For 2003, net interest income was $7.63 billion, a decrease of $500 million, or 6%, compared with2002. The decrease resulted from contraction of the net interest margin, which declined to 3.11% for theyear ended December 31, 2003 from 3.41% for the same period in 2002, as yields on loans and debtsecurities continued to reprice downward from the higher interest rate environment of 2002. The decline inthe net interest margin was partially offset by decreases in the rates paid on interest-bearing deposits. Inparticular, the average rate paid on interest-bearing checking (Platinum) accounts decreased to 1.83%from 2.94% on an average balance of $57.10 billion and $34.02 billion for 2003 and 2002. The free fundingimpact of noninterest-bearing sources that resulted from high average custodial balances also partiallyoffset the contraction in the margin for 2003 when compared with 2002. These balances, which peakedshortly after the midpoint of 2003, declined sharply during the latter part of the year as refinancing activitydiminished.
For 2002, net interest income increased $1.64 billion, or 25% compared with 2001. Most of thisincrease was attributable to the growth in average interest-earning assets, which increased primarily as aresult of the Dime acquisition, and the expansion of the net interest margin, which increased 22 basispoints during the year. The margin benefited from the full effect that the 475 basis point reduction in theFederal Funds rate in 2001 had on our wholesale borrowings, which reprice to market interest levels morequickly than our interest-earning assets. After peaking in the first quarter of 2002, the net interest margindeclined throughout the remainder of that year, largely due to the downward repricing of loans and debtsecurities.
Interest rate contracts, including embedded derivatives, held for asset/liability interest rate riskmanagement purposes decreased net interest income by $622 million in 2003. Interest rate contracts,including embedded derivatives, decreased net interest income by $424 million in 2002 and increased netinterest income by $1 million in 2001.
25

Certain average balances, together with the total dollar amounts of interest income and expense andthe weighted average interest rates, were as follows:
Year Ended December 31,
2003 2002 2001
Average Interest Average Interest Average InterestBalance Rate Income Balance Rate Income Balance Rate Income
(dollars in millions)AssetsInterest-earning assets:
Federal funds sold and securitiespurchased under resale agreements . $ 2,570 1.45% $ 37 $ 2,352 1.70% $ 40 $ 335 4.46% $ 15
Available-for-sale securities(1):Mortgage-backed securities . . . . . . 20,977 4.91 1,030 24,654 5.46 1,345 41,423 6.94 2,875Investment securities . . . . . . . . . . 18,742 3.77 708 32,387 4.96 1,606 13,033 5.26 685
Loans held for sale(2) . . . . . . . . . . . 44,832 5.54 2,483 30,954 6.19 1,917 18,010 6.68 1,203Loans held in portfolio(2)(3):
Loans secured by real estate:Home . . . . . . . . . . . . . . . . . . 86,443 4.77 4,124 86,039 5.90 5,077 81,686 7.23 5,908Purchased specialty mortgage
finance . . . . . . . . . . . . . . . . 10,794 5.43 586 9,028 6.27 566 6,936 7.63 529
Total home loans . . . . . . . . . 97,237 4.84 4,710 95,067 5.94 5,643 88,622 7.26 6,437Home equity loans and lines of
credit . . . . . . . . . . . . . . . . . 21,163 4.98 1,053 13,382 5.91 790 7,248 7.72 560Home construction:
Builder(4) . . . . . . . . . . . . . . 1,084 4.79 52 1,316 5.93 78 1,826 7.72 141Custom(5) . . . . . . . . . . . . . . 978 7.13 70 906 8.19 74 905 8.96 81
Multi-family . . . . . . . . . . . . . . 19,409 5.30 1,029 17,973 6.01 1,081 16,480 7.72 1,273Other real estate . . . . . . . . . . . 7,243 6.35 460 8,368 6.83 572 5,913 7.98 472
Total loans secured by realestate . . . . . . . . . . . . . . . 147,114 5.01 7,374 137,012 6.01 8,238 120,994 7.41 8,964
Consumer . . . . . . . . . . . . . . . . . 1,208 8.87 107 2,340 9.41 220 1,804 11.17 201Commercial business . . . . . . . . . . 4,771 4.31 205 4,223 5.14 217 3,973 7.15 284
Total loans held in portfolio . . . 153,093 5.02 7,686 143,575 6.04 8,675 126,771 7.45 9,449Other . . . . . . . . . . . . . . . . . . . 5,109 4.27 219 4,513 6.04 272 4,052 6.03 244
Total interest-earning assets . . . 245,323 4.96 12,163 238,435 5.81 13,855 203,624 7.11 14,471Noninterest-earning assets:
Mortgage servicing rights . . . . . . . . . 5,721 6,650 5,276Goodwill . . . . . . . . . . . . . . . . . . . 6,198 5,996 1,839Other(6) . . . . . . . . . . . . . . . . . . . . 25,877 20,339 14,802
Total assets . . . . . . . . . . . . . $283,119 $271,420 $225,541
(This table is continued on next page.)
(1) The average balance and yield are based on average amortized cost balances.(2) Nonaccrual loans are included in the average loan amounts outstanding.(3) Interest income for loans held in portfolio includes amortization of net deferred loan origination costs of $314 million,
$246 million and $158 million for the years ended December 31, 2003, 2002 and 2001.(4) Represents loans to builders for the purpose of financing the acquisition, development and construction of single-family
residences for sale.(5) Represents construction loans made directly to the intended occupant of a single-family residence.(6) Includes assets of continuing and discontinued operations.
26

Year Ended December 31,
2003 2002 2001
Average Interest Average Interest Average InterestBalance Rate Expense Balance Rate Expense Balance Rate Expense
(dollars in millions)LiabilitiesInterest-bearing liabilities:
Deposits:Interest-bearing checking . . . . . . . . $ 62,723 1.69% $1,057 $ 40,338 2.55% $1,028 $ 7,540 1.58% $ 119Savings accounts and money market
deposit accounts . . . . . . . . . . . . 28,196 0.93 263 31,529 1.48 466 35,828 3.17 1,134Time deposit accounts . . . . . . . . . 31,416 2.69 845 37,253 3.13 1,167 36,324 5.03 1,828
Total interest-bearing deposits . . . 122,335 1.77 2,165 109,120 2.44 2,661 79,692 3.87 3,081Federal funds purchased and
commercial paper . . . . . . . . . . . . 3,158 1.18 37 2,976 1.90 57 4,428 4.01 177Securities sold under agreements to
repurchase . . . . . . . . . . . . . . . . . 22,318 2.44 545 34,830 2.31 804 29,582 4.05 1,197Advances from Federal Home Loan
Banks . . . . . . . . . . . . . . . . . . . . 49,441 2.62 1,296 59,369 2.82 1,676 63,732 4.58 2,918Other . . . . . . . . . . . . . . . . . . . . . 13,315 3.68 491 12,172 4.34 528 10,705 5.66 606
Total interest-bearing liabilities . . 210,567 2.15 4,534 218,467 2.62 5,726 188,139 4.24 7,979
Noninterest-bearing sources:Noninterest-bearing deposits . . . . . . . 41,250 25,396 16,613Other liabilities(7) . . . . . . . . . . . . . . 10,724 7,624 7,614Stockholders’ equity . . . . . . . . . . . . 20,578 19,933 13,175
Total liabilities andstockholders’ equity . . . . . . . $283,119 $271,420 $225,541
Net interest spread and net interestincome . . . . . . . . . . . . . . . . . . . . 2.81 $7,629 3.19 $8,129 2.87 $ 6,492
Impact of noninterest-bearing sources . . 0.30 0.22 0.32Net interest margin . . . . . . . . . . . . . . 3.11 3.41 3.19
(7) Includes liabilities of continuing and discontinued operations.
27
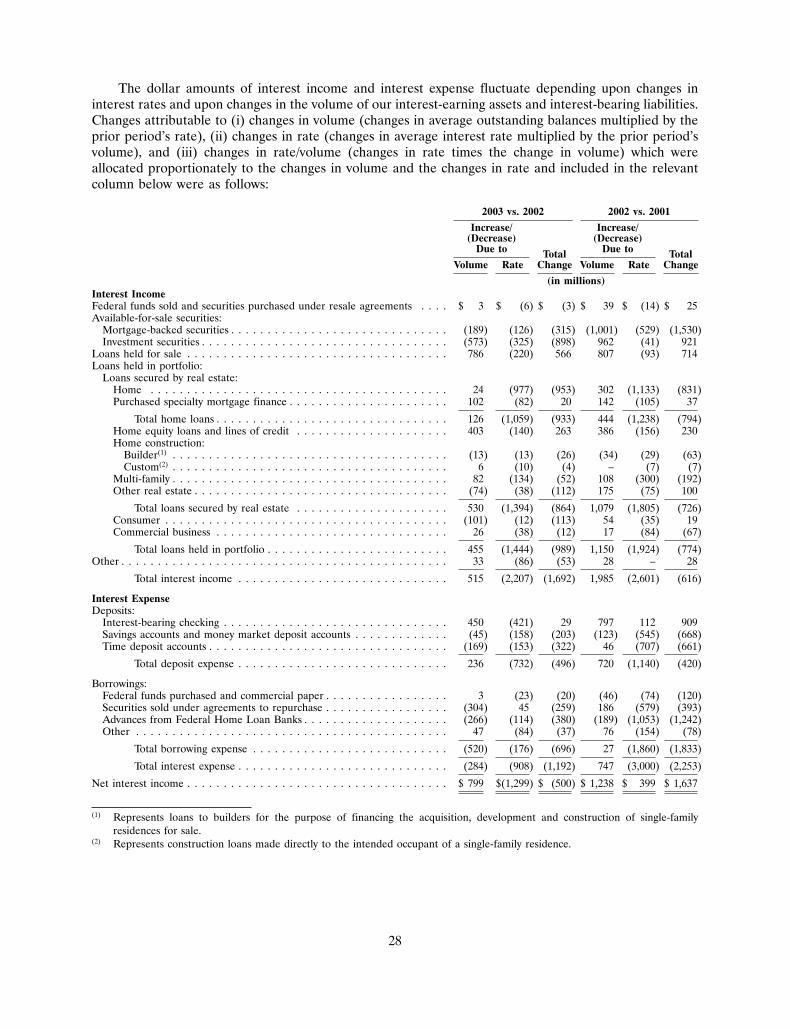
The dollar amounts of interest income and interest expense fluctuate depending upon changes ininterest rates and upon changes in the volume of our interest-earning assets and interest-bearing liabilities.Changes attributable to (i) changes in volume (changes in average outstanding balances multiplied by theprior period’s rate), (ii) changes in rate (changes in average interest rate multiplied by the prior period’svolume), and (iii) changes in rate/volume (changes in rate times the change in volume) which wereallocated proportionately to the changes in volume and the changes in rate and included in the relevantcolumn below were as follows:
2003 vs. 2002 2002 vs. 2001
Increase/ Increase/(Decrease) (Decrease)
Due to Due toTotal TotalVolume Rate Change Volume Rate Change
(in millions)Interest IncomeFederal funds sold and securities purchased under resale agreements . . . . $ 3 $ (6) $ (3) $ 39 $ (14) $ 25Available-for-sale securities:
Mortgage-backed securities . . . . . . . . . . . . . . . . . . . . . . . . . . . . . . (189) (126) (315) (1,001) (529) (1,530)Investment securities . . . . . . . . . . . . . . . . . . . . . . . . . . . . . . . . . . (573) (325) (898) 962 (41) 921
Loans held for sale . . . . . . . . . . . . . . . . . . . . . . . . . . . . . . . . . . . . 786 (220) 566 807 (93) 714Loans held in portfolio:
Loans secured by real estate:Home . . . . . . . . . . . . . . . . . . . . . . . . . . . . . . . . . . . . . . . . . 24 (977) (953) 302 (1,133) (831)Purchased specialty mortgage finance . . . . . . . . . . . . . . . . . . . . . . 102 (82) 20 142 (105) 37
Total home loans . . . . . . . . . . . . . . . . . . . . . . . . . . . . . . . . 126 (1,059) (933) 444 (1,238) (794)Home equity loans and lines of credit . . . . . . . . . . . . . . . . . . . . . 403 (140) 263 386 (156) 230Home construction:
Builder(1) . . . . . . . . . . . . . . . . . . . . . . . . . . . . . . . . . . . . . . (13) (13) (26) (34) (29) (63)Custom(2) . . . . . . . . . . . . . . . . . . . . . . . . . . . . . . . . . . . . . . 6 (10) (4) – (7) (7)
Multi-family . . . . . . . . . . . . . . . . . . . . . . . . . . . . . . . . . . . . . . 82 (134) (52) 108 (300) (192)Other real estate . . . . . . . . . . . . . . . . . . . . . . . . . . . . . . . . . . . (74) (38) (112) 175 (75) 100
Total loans secured by real estate . . . . . . . . . . . . . . . . . . . . . 530 (1,394) (864) 1,079 (1,805) (726)Consumer . . . . . . . . . . . . . . . . . . . . . . . . . . . . . . . . . . . . . . . (101) (12) (113) 54 (35) 19Commercial business . . . . . . . . . . . . . . . . . . . . . . . . . . . . . . . . 26 (38) (12) 17 (84) (67)
Total loans held in portfolio . . . . . . . . . . . . . . . . . . . . . . . . . 455 (1,444) (989) 1,150 (1,924) (774)Other . . . . . . . . . . . . . . . . . . . . . . . . . . . . . . . . . . . . . . . . . . . . . 33 (86) (53) 28 – 28
Total interest income . . . . . . . . . . . . . . . . . . . . . . . . . . . . . 515 (2,207) (1,692) 1,985 (2,601) (616)
Interest ExpenseDeposits:
Interest-bearing checking . . . . . . . . . . . . . . . . . . . . . . . . . . . . . . . 450 (421) 29 797 112 909Savings accounts and money market deposit accounts . . . . . . . . . . . . . (45) (158) (203) (123) (545) (668)Time deposit accounts . . . . . . . . . . . . . . . . . . . . . . . . . . . . . . . . . (169) (153) (322) 46 (707) (661)
Total deposit expense . . . . . . . . . . . . . . . . . . . . . . . . . . . . . 236 (732) (496) 720 (1,140) (420)
Borrowings:Federal funds purchased and commercial paper . . . . . . . . . . . . . . . . . 3 (23) (20) (46) (74) (120)Securities sold under agreements to repurchase . . . . . . . . . . . . . . . . . (304) 45 (259) 186 (579) (393)Advances from Federal Home Loan Banks . . . . . . . . . . . . . . . . . . . . (266) (114) (380) (189) (1,053) (1,242)Other . . . . . . . . . . . . . . . . . . . . . . . . . . . . . . . . . . . . . . . . . . . 47 (84) (37) 76 (154) (78)
Total borrowing expense . . . . . . . . . . . . . . . . . . . . . . . . . . . (520) (176) (696) 27 (1,860) (1,833)
Total interest expense . . . . . . . . . . . . . . . . . . . . . . . . . . . . . (284) (908) (1,192) 747 (3,000) (2,253)
Net interest income . . . . . . . . . . . . . . . . . . . . . . . . . . . . . . . . . . . . $ 799 $(1,299) $ (500) $ 1,238 $ 399 $ 1,637
(1) Represents loans to builders for the purpose of financing the acquisition, development and construction of single-familyresidences for sale.
(2) Represents construction loans made directly to the intended occupant of a single-family residence.
28

Noninterest Income
Noninterest income from continuing operations consisted of the following:
Year Ended December 31, Percentage Change
2003 2002 2001 2003/2002 2002/2001
(in millions)
Home loan mortgage banking income (expense):Loan servicing income (expense):
Loan servicing fees . . . . . . . . . . . . . . . . . . . . . . . $2,273 $2,237 $1,375 2% 63%Amortization of mortgage servicing rights . . . . . . . (3,269) (2,616) (1,054) 25 148Mortgage servicing rights recovery (impairment) . . 712 (3,219) (1,701) – 89Other, net . . . . . . . . . . . . . . . . . . . . . . . . . . . . . . (592) (271) (141) 118 92
Net home loan servicing expense . . . . . . . . . . . . (876) (3,869) (1,521) (77) 154Revaluation gain from derivatives . . . . . . . . . . . . . . . 338 2,517 – (87) –Net settlement income from certain interest-rate
swaps . . . . . . . . . . . . . . . . . . . . . . . . . . . . . . . . . 543 382 – 42 –Gain from mortgage loans . . . . . . . . . . . . . . . . . . . . 1,250 1,375 936 (9) 47Loan related income . . . . . . . . . . . . . . . . . . . . . . . . 399 268 156 49 72Gain from sale of originated mortgage-backed
securities . . . . . . . . . . . . . . . . . . . . . . . . . . . . . . . 320 34 117 841 (71)
Total home loan mortgage banking income(expense) . . . . . . . . . . . . . . . . . . . . . . . . . 1,974 707 (312) 179 –
Depositor and other retail banking fees . . . . . . . . . . . . 1,818 1,634 1,290 11 27Securities fees and commissions . . . . . . . . . . . . . . . . . 395 362 303 9 19Insurance income . . . . . . . . . . . . . . . . . . . . . . . . . . . . 188 155 71 21 118Portfolio loan related income . . . . . . . . . . . . . . . . . . . 439 349 193 26 81Gain from other available-for-sale securities . . . . . . . . . 676 768 600 (12) 28Gain (loss) on extinguishment of securities sold under
agreements to repurchase . . . . . . . . . . . . . . . . . . . . (129) 282 621 – (55)Other income . . . . . . . . . . . . . . . . . . . . . . . . . . . . . . . 489 212 410 131 (48)
Total noninterest income from continuingoperations . . . . . . . . . . . . . . . . . . . . . . . . . $5,850 $4,469 $3,176 31 41
Home Loan Mortgage Banking Income (Expense)
In 2003, loan servicing fees increased slightly due to the acquisition of HomeSide Lending, Inc.(‘‘HomeSide’’) in the fourth quarter of 2002, which added approximately $130 billion to the Company’sportfolio of loans serviced for others. This increase was substantially offset by a decline in the aggregateweighted average servicing fee. The weighted average servicing fee decreased from 40 basis points atDecember 31, 2002 to 34 basis points at December 31, 2003 primarily due to the Company’s continuingprocess of selling a portion of the future contractual servicing cash flows to third parties. This processdecreased the net MSR balance by $628 million but had no impact on the unpaid principal balance of theloans serviced for others portfolio. Additionally, the Company has entered into loan sales andsecuritizations with certain government-sponsored and private enterprises in which it has retained asmaller servicing fee than is common in the industry. The smaller servicing fee leads to a lower value forthe resulting MSR and greater cash income when the loans or securities are sold.
During the first half of 2003, we recorded an other than temporary MSR impairment of $1.11 billion.The amount of the other than temporary impairment was determined by selecting an appropriate interestrate shock to estimate the amount of MSR fair value that we might expect to recover in the foreseeable
29

future. To the extent that the gross carrying value of the MSR exceeded the estimated recoverable amount,that portion of the gross carrying value was written off as an other than temporary impairment. Althoughthe writedowns had no impact on our results of operations or financial condition, they did reduce the grosscarrying value of the MSR, which is used as the basis for MSR amortization. The results of similar analysesperformed during the third and fourth quarters of 2003 concluded that no further recording of an otherthan temporary impairment was necessary.
The Company recognized a recovery of $712 million during 2003 in its MSR impairment valuationallowance. This recovery was primarily due to an increase in mortgage rates during the second half of 2003,which decreased the expected prepayment rate on the Company’s servicing portfolio. Although thisdecrease in expected prepayment rates and the recording of an other than temporary impairment also hadthe effect of lowering the amortization rate on the servicing portfolio, total amortization expense in 2003was higher than 2002 due to the very high levels of prepayment activity that occurred during the first halfof 2003, and the acquisition of HomeSide in the fourth quarter of 2002, which added approximately$1 billion to the amortization base of the MSR. A continued decrease in long-term mortgage rates in 2002and 2001 led to higher expected prepayment rates, which resulted in MSR impairment of $3,219 millionand $1,701 million for 2002 and 2001. Continued high volumes of prepayment activity during 2002, coupledwith the growth in the MSR portfolio, resulted in higher amortization, as compared with 2001.
The increase in other home loan servicing expense in 2003 and 2002 resulted from higher loan poolexpenses due to significant refinancing activity. Loan pool expenses represent the amount of interestexpense that the Company incurs for the elapsed time between the borrower payoff date and the nextmonthly investor pool cutoff date.
In measuring the fair value of MSR, we stratify the loans in our servicing portfolio based on loan typeand coupon rate. We measure MSR impairment by estimating the fair value of each stratum. A valuationallowance for a stratum is recorded when, and in the amount by which, its fair value is less than its grosscarrying value. A recovery of the valuation allowance for a stratum is recorded when its fair value exceedsits net carrying value. However, a recovery in any particular stratum cannot exceed its valuation allowance.At December 31, 2003, we stratified the loans in our servicing portfolio as follows:
December 31, 2003
Gross NetCarrying Valuation Carrying Fair
Rate Band Value Allowance Value Value
(in millions)
Primary Servicing:Adjustable . . . . . . . . . . . . . . . . . . . . . All loans $1,606 $ 566 $1,040 $1,040Government-sponsored enterprise . . . . 6.00% and below 2,462 211 2,251 2,251Government-sponsored enterprise . . . . 6.01% to 7.49% 1,785 755 1,030 1,030Government-sponsored enterprise . . . . 7.50% and above 301 127 174 174Government . . . . . . . . . . . . . . . . . . . 6.00% and below 420 20 400 400Government . . . . . . . . . . . . . . . . . . . 6.01% to 7.49% 705 291 414 414Government . . . . . . . . . . . . . . . . . . . 7.50% and above 346 120 226 226Private . . . . . . . . . . . . . . . . . . . . . . . 6.00% and below 504 114 390 390Private . . . . . . . . . . . . . . . . . . . . . . . 6.01% to 7.49% 312 142 170 170Private . . . . . . . . . . . . . . . . . . . . . . . 7.50% and above 131 39 92 92
Total primary servicing . . . . . . . . . . 8,572 2,385 6,187 6,187Master servicing . . . . . . . . . . . . . . . . . . All loans 116 50 66 66Specialty home loans . . . . . . . . . . . . . . . All loans 75 – 75 105Multi-family . . . . . . . . . . . . . . . . . . . . . All loans 26 – 26 28
Total . . . . . . . . . . . . . . . . . . . . . . . $8,789 $2,435 $6,354 $6,386
30

The value of our MSR asset is subject to prepayment risk. Future expected net cash flows fromservicing a loan in our servicing portfolio will not be realized if the loan pays off earlier than anticipated.Moreover, since most loans within our servicing portfolio do not contain penalty provisions for earlypayoff, we will not receive a corresponding economic benefit if the loan pays off earlier than expected.MSR represent the discounted present value of the future net cash flows we expect to receive from ourservicing portfolio. Accordingly, prepayment risk subjects our MSR to impairment risk.
We estimate fair value of each MSR stratum using a discounted cash flow model. The discounted cashflow model estimates the present value of the future net cash flows of the servicing portfolio based onvarious factors, such as servicing costs, expected prepayment speeds and discount rates, about whichmanagement must make assumptions based on future expectations. While the Company’s model estimatesa value, the specific value used is based on a variety of factors, such as documented observable data andanticipated changes in market conditions. All the assumptions are based on standards used by marketparticipants in valuing MSR. The reasonableness of management’s assumptions about these factors isconfirmed through quarterly independent broker surveys. Independent appraisals of the fair value of ourservicing portfolio are obtained periodically, but not less frequently than annually, and are used bymanagement to evaluate the reasonableness of the fair value conclusions.
Our methodology for estimating the fair value of MSR is highly sensitive to changes in assumptions.For example, our determination of fair value uses anticipated prepayment speeds. Actual prepaymentexperience may differ and any difference may have a material effect on the MSR fair value. Changes in fairvalue based on a variation in assumptions generally cannot be extrapolated because the relationship of thechange in assumption to the change in fair value may not be linear. Thus, any measurement of MSR fairvalue is limited by the conditions existing and assumptions made as of a particular point in time. Thoseassumptions may not be appropriate if they are applied to a different point in time. Refer to ‘‘Market RiskManagement’’ for discussion of how MSR prepayment risk is managed and to Note 1 to the ConsolidatedFinancial Statements—‘‘Summary of Significant Accounting Policies’’ for further discussion of how MSRimpairment is measured. For a quantitative analysis of key economic assumptions used in measuring thefair value of MSR, and a sensitivity analysis based on changes to those assumptions, see Note 7 to theConsolidated Financial Statements—‘‘Mortgage Banking Activities.’’
As part of its mortgage banking activities, the Company enters into commitments to originate orpurchase loans whereby the interest rate on the loan is set prior to funding (rate lock commitments). Ratelock commitments on mortgage loans that are intended to be sold are considered to be derivatives.Therefore, they are recorded at fair value on the Consolidated Statements of Financial Condition withchanges in fair value recorded in gain from mortgage loans on the Consolidated Statements of Income. Inmeasuring the fair value of rate lock commitments, the amount of the expected servicing rights is includedin the valuation. This value is calculated using the same methodologies as are used to value the Company’sMSR, adjusted for an anticipated fallout factor for loan commitments that are not expected to be funded.When funding occurs, the value of the rate lock commitment becomes part of the cost basis of the loan.The aggregate fair value of these assets on the Consolidated Statements of Financial Condition atDecember 31, 2003 and 2002 was $247 million and $961 million.
A new SEC Staff Accounting Bulletin regarding the accounting for interest rate lock commitmentswill delay the Company’s recognition of the value of the expected servicing rights until the loans are sold.The Company adopted and prospectively applied this new accounting guidance to all commitments forloans originated for sale that were initiated after December 31, 2003. Refer to ‘‘Recently IssuedAccounting Standards’’ for further discussion of this Staff Accounting Bulletin.
High levels of loan refinancing activity during the first half of 2003, which occurred due to historicallylow long-term mortgage rates that were in effect during that period, resulted in rate lock commitmentvolume of $290.77 billion for the year, compared with $236.05 billion in 2002. Although this increase alsoresulted in strong levels of salable home loan volume, gain from mortgage loans in 2003 decreased by
31

$125 million, or 9%, from 2002. The decrease was largely the result of losses sustained during the thirdquarter of 2003. These losses stemmed from various market volatility and operational issues, includingunhedged rate lock extensions granted to customers, a diminished level of market liquidity for certaininstruments used to manage interest rate risk on rate locks and loans held for sale, and system issues thatcaused data interruptions during the period. The Company undertook numerous actions to correct theseissues and to mitigate their financial effects, including the sale of originated mortgage-backed securities,which resulted in a gain of $258 million in the third quarter of 2003, and the sale of other available-for-salesecurities, which produced a gain of $381 million during that period.
In accordance with regulatory guidance issued in December of 2003, the Company’s buyouts ofdelinquent mortgages contained within Government National Mortgage Association (‘‘GNMA’’) loanpools that it services must now be classified as loans on the Consolidated Statements of FinancialCondition. As the Company sells most of these repurchased loans to secondary market participants, theyare classified as loans held for sale on the Consolidated Statements of Financial Condition. Accordingly,gains that are generated from the subsequent resale of these delinquent mortgages, which had beenrecorded as part of other home loan mortgage banking income on the Consolidated Statements of Incomein prior periods, are now classified as gain from mortgage loans. Prior periods have been restated. In onepart of the Company’s program, loans that have been 30 days past due for three consecutive months(referred to as ‘‘rolling 30 loans’’) are repurchased from GNMA and then resold in the secondary market.In the other, loans that have missed three consecutive payments are likewise purchased and resold. Theseloans are collectively referred to as Early Buy-Out Loans. Gain from the sale of these loans was$369 million and $126 million in 2003 and 2002. The Company does not have the option of repurchasing‘‘rolling 30 loans’’ from pools created after January 1, 2003, but continues to make such purchases frompreviously created pools. Over time, we expect gains from the repurchase of ‘‘rolling 30 loans’’ to diminishas the pools that are eligible for repurchase are depleted.
The following tables separately present the MSR, loans held for sale and the other risk managementactivities included within noninterest income in 2003 and 2002.
Year Ended December 31, 2003
Loans HeldMSR Risk for Sale Risk Other Risk
Management Management Management Total
(in millions)
Revaluation gain (loss) from derivatives . . . . . . . . . . . . . . . . $ 526 $(188) $ – $ 338Net settlement income from certain interest-rate swaps . . . . 514 29 – 543Gain from other available-for-sale securities . . . . . . . . . . . . 305 – 371 676Loss on extinguishment of securities sold under agreements
to repurchase . . . . . . . . . . . . . . . . . . . . . . . . . . . . . . . . . – – (129) (129)
Total . . . . . . . . . . . . . . . . . . . . . . . . . . . . . . . . . . . . . . $1,345 $(159) $ 242 $1,428
Year Ended December 31, 2002
Loans HeldMSR Risk for Sale Risk Other Risk
Management Management Management Total
(in millions)
Revaluation gain (loss) from derivatives . . . . . . . . . . . . . . . . $2,645 $(128) $ – $2,517Net settlement income from certain interest-rate swaps . . . . 382 – – 382Gain (loss) from other available-for-sale securities . . . . . . . . 795 – (27) 768Gain on extinguishment of securities sold under agreements
to repurchase . . . . . . . . . . . . . . . . . . . . . . . . . . . . . . . . . 257 – 25 282
Total . . . . . . . . . . . . . . . . . . . . . . . . . . . . . . . . . . . . . . $4,079 $(128) $ (2) $3,949
32

Revaluation gain (loss) from derivatives is the earnings impact of the changes in fair value fromcertain derivatives where the Company either has not attempted to achieve, or has attempted but did notachieve, hedge accounting treatment under Statement No. 133. Derivatives that were used for MSR riskmanagement purposes produced a revaluation gain of $526 million for the year ended December 31, 2003,compared with a gain of $2,645 million for 2002. The total notional amount of these MSR riskmanagement derivatives at December 31, 2003 and December 31, 2002 was $65.42 billion and$41.97 billion with a combined net fair value of $669 million and $3.03 billion.
The fair value changes in loans held for sale and the offsetting changes in the derivative instrumentsused as fair value hedges are recorded within gain from mortgage loans when hedge accounting treatmentis achieved. Loans held for sale where hedge accounting treatment is not achieved (‘‘nonqualifying’’ loansheld for sale) are not recorded at fair value and are instead recorded at the lower of aggregate cost ormarket value. Due to net decreases in the fair value of derivatives acquired to mitigate the risk of fair valuechanges to these nonqualifying loans, net losses of $188 million and $128 million were recognized asrevaluation losses from derivatives in 2003 and 2002. A gain may be recognized when the loans aresubsequently sold if the fair value of those loans is higher than the carrying amount. As of December 31,2003, both the fair value and carrying amount of loans held for sale were $20.34 billion, and as ofDecember 31, 2002, the fair value was $38.84 billion with a carrying amount of $38.78 billion.
Net settlement income from certain interest-rate swaps consisted of receive-fixed swaps, which wereused predominantly as MSR risk management derivatives. At December 31, 2003, the total notionalamount of these receive-fixed swaps was $32.54 billion, compared with $17.92 billion at December 31,2002.
Gain from other available-for-sale securities of $305 million and $795 million for the years endedDecember 31, 2003 and December 31, 2002 resulted from sales of mortgage-backed securities andinvestment securities of approximately $6.57 billion in 2003 and $17.83 billion in 2002, all of which weredesignated as MSR risk management instruments.
Loan related income increased during 2003 and 2002 primarily due to increased fees charged to ourcorrespondent lenders and higher levels of late charges on the loans serviced for others portfolio.
All Other Noninterest Income Analysis
The increase in depositor and other retail banking fees in 2003 and 2002 was primarily due to higherlevels of checking fees that resulted from an increase in the number of noninterest-bearing checkingaccounts and an increase in debit card and ATM related income. The number of noninterest-bearingchecking accounts at December 31, 2003 totaled approximately 6.5 million, compared with approximately5.8 million at December 31, 2002 and 4.9 million at December 31, 2001.
Insurance income increased during 2003 and 2002 largely due to the continued growth in our captivereinsurance programs.
The growth in portfolio loan related income in 2003 and 2002 was mostly due to increased late chargeson the loan portfolio and high levels of loan prepayment fees as a result of refinancing activity.
Several securities sold under agreements to repurchase (‘‘repurchase agreements’’) that containedembedded pay-fixed swaps were restructured during 2003, resulting in a loss on extinguishment ofrepurchase agreements of $129 million for the year. The restructured repurchase agreements also containembedded pay-fixed swaps with the same terms, but with a lower pay rate. Gain on extinguishment ofrepurchase agreements decreased in 2002 compared with 2001 largely due to lower gains recognized onterminations of certain repurchase agreements with embedded interest rate floors. The gains in 2001 wererecognized to partially offset MSR impairment incurred during that year. Beginning in 2002, the Companyaltered its MSR risk management strategy by decreasing its reliance on embedded interest rate contractsand, instead, shifted to a blend of available-for-sale securities and derivative financial instruments.
33

Other noninterest income increased in 2003 compared with 2002 partially due to fees paid to theCompany by the Federal Home Loan Mortgage Corporation (‘‘FHLMC’’ or ‘‘Freddie Mac’’). TheCompany received $100 million in nonrefundable fees to induce the Company to swap approximately$6 billion of multi-family loans for 100% of the beneficial interest in those loans in the form of mortgage-backed securities issued by Freddie Mac. Since the Company has the unilateral right to collapse thesecurities after one year, the Company has effectively retained control over the loans. Accordingly, theassets continue to be accounted for and reported as loans. This transaction was undertaken by FreddieMac in order to facilitate fulfilling its 2003 affordable housing goals as set by the Department of Housingand Urban Development. In addition, the Company completed the sale of the Ahmanson Ranch propertyto the Mountains Recreation and Conservation Authority of California for $150 million in the fourthquarter of 2003. The sale resulted in a gain of $77 million. During the third quarter of 2002, the Company’sremoval of the cash flow hedge designation on certain payor swaptions resulted in the reclassification of a$112 million loss from accumulated other comprehensive income to other income.
Noninterest Expense
Noninterest expense from continuing operations consisted of the following:
Year Ended December 31, Percentage Change
2003 2002 2001 2003/2002 2002/2001
(in millions)
Compensation and benefits . . . . . . . . . . . . . . . . . . . . . $3,304 $2,813 $1,829 17% 54%Occupancy and equipment . . . . . . . . . . . . . . . . . . . . . 1,592 1,136 776 40 46Telecommunications and outsourced information
services . . . . . . . . . . . . . . . . . . . . . . . . . . . . . . . . . 554 507 436 9 16Depositor and other retail banking losses . . . . . . . . . . . 201 204 144 (1) 42Amortization of goodwill . . . . . . . . . . . . . . . . . . . . . . –(1) –(1) 134 – (100)Amortization of other intangible assets . . . . . . . . . . . . 61 67 33 (9) 103Advertising and promotion . . . . . . . . . . . . . . . . . . . . . 278 234 176 19 33Professional fees . . . . . . . . . . . . . . . . . . . . . . . . . . . . . 267 201 189 33 6Postage . . . . . . . . . . . . . . . . . . . . . . . . . . . . . . . . . . . 220 192 131 15 47Loan expense . . . . . . . . . . . . . . . . . . . . . . . . . . . . . . . 253 211 126 20 67Travel and training . . . . . . . . . . . . . . . . . . . . . . . . . . . 149 137 108 9 27Reinsurance expense . . . . . . . . . . . . . . . . . . . . . . . . . . 61 51 13 20 292Other expense . . . . . . . . . . . . . . . . . . . . . . . . . . . . . . 468 435 321 8 36
Total noninterest expense from continuingoperations . . . . . . . . . . . . . . . . . . . . . . . . . . . . $7,408 $6,188 $4,416 20 40
(1) The Company adopted Statement No. 142 on January 1, 2002, and no longer amortizes goodwill.
The increase in employee base compensation and benefits expense in 2003 over 2002 was substantiallydue to higher personnel costs to accommodate the high refinancing activity in the earlier part of the yearand the opening of new retail banking stores. For the year, 260 new retail banking stores were opened,bringing the total number of retail banking stores nationwide to 1,776. The increase in 2002 over 2001 wasprimarily due to the acquisitions of Dime and HomeSide, the hiring of additional staff to support ourexpanding operations and an increase in incentive compensation. The number of employees was 61,374 atDecember 31, 2003 compared with 52,870 at December 31, 2002 and 39,184 at December 31, 2001.
The increase in occupancy and equipment expense in 2003 resulted primarily from higher equipmentdepreciation expense and building rent expense. These increases occurred primarily due to the completionof technology projects that were placed into service in 2003 and the expansion of the Company’sdistribution network. Additionally, as part of the realignment of its operating segment structure in the
34

fourth quarter of 2003, the Company wrote off approximately $150 million of capitalized costs as a result ofits decision to discontinue the development of a loan origination system and to migrate and consolidate itsloan origination fulfillment activities onto a smaller complex of preexisting systems. The increase inoccupancy and equipment expense in 2002 resulted from rent, maintenance and depreciation expense dueto the acquisitions of Dime and HomeSide.
Professional fees increased in 2003 over 2002, primarily as a result of increased technology andcorporate services-related projects.
The increase in loan expense in 2003 and 2002 was primarily due to higher loan closing costs andmortgage payoff expenses, which were attributable to an overall increase in loan originations, purchasesand refinancing activity.
Other expense increased in 2003 primarily due to higher foreclosed asset expense, outside services,and charitable contributions. A significant portion of the increase in other expense during 2002 was due toincreases in foreclosed assets expense, business taxes and office supplies.
Review of Financial Condition
Assets
At December 31, 2003, our assets were $275.18 billion, an increase of $6.95 billion or 3% from$268.23 billion at December 31, 2002. This increase was predominantly attributable to an increase in loansheld in portfolio largely as a result of higher adjustable-rate loan production and an increase in investmentsecurities. This increase was mostly offset by a decrease in loans held for sale and mortgage-backedsecurities.
Securities
Securities consisted of the following:
December 31,
2003 2002
(in millions)
Available-for-sale securities, total amortized cost of $36,858 and $42,528:Mortgage-backed securities . . . . . . . . . . . . . . . . . . . . . . . . . . . . . . . . . . . . . . . . $10,695 $28,375Investment securities . . . . . . . . . . . . . . . . . . . . . . . . . . . . . . . . . . . . . . . . . . . . 26,012 15,530
Total available-for-sale securities . . . . . . . . . . . . . . . . . . . . . . . . . . . . . . . . . . $36,707 $43,905
Our mortgage-backed securities portfolio declined $17.68 billion to $10.70 billion at December 31,2003 from $28.38 billion at December 31, 2002. Substantially all of this decrease resulted from the sale of$12.24 billion of mortgage-backed securities during 2003 and prepayments that occurred from refinancingactivity. The Company sold mortgage-backed securities during the latter part of 2003 to mitigate the effectsof market volatility and operational issues experienced in the third quarter. Our investment securitiesincreased $10.48 billion to $26.01 billion at December 31, 2003 from $15.53 billion at December 31, 2002,predominantly due to the purchase of U.S. Government and agency bonds. Refer to Note 5 to theConsolidated Financial Statements—‘‘Securities’’ for additional information on securities, classified bysecurity type.
35

Loans
Total loans consisted of the following:
December 31,
2003 2002 2001 2000 1999
(in millions)
Loans held for sale . . . . . . . . . . . . . . . . . . . . $ 20,343 $ 38,782 $ 27,574 $ 3,404 $ 794Loans held in portfolio:
Loans secured by real estate:Home . . . . . . . . . . . . . . . . . . . . . . . . . . . 100,043 82,842 79,624 80,181 80,234Purchased specialty mortgage finance . . . . 12,973 10,128 8,209 5,541 3,124
Total home loans . . . . . . . . . . . . . . . 113,016 92,970 87,833 85,722 83,358Home equity loans and lines of credit . . . . 27,647 16,168 7,970 5,772 4,404Home construction:
Builder(1) . . . . . . . . . . . . . . . . . . . . . . . 1,052 1,017 1,623 440 338Custom(2) . . . . . . . . . . . . . . . . . . . . . . . 1,168 932 979 991 905
Multi-family(3) . . . . . . . . . . . . . . . . . . . . . 20,324 18,000 15,608 15,657 15,261Other real estate(4) . . . . . . . . . . . . . . . . . 6,649 7,986 6,089 3,920 3,585
Total loans secured by real estate . . . . 169,856 137,073 120,102 112,502 107,851Consumer . . . . . . . . . . . . . . . . . . . . . . . . . 1,028 1,663 2,009 1,669 1,438Commercial business . . . . . . . . . . . . . . . . . . 4,760 5,133 4,285 1,727 1,395
Total loans held in portfolio . . . . . . . $175,644 $143,869 $126,396 $115,898 $110,684
(1) Represents loans to builders for the purpose of financing the acquisition, development and construction of single-familyresidences for sale.
(2) Represents construction loans made directly to the intended occupant of a single-family residence.(3) Includes multi-family construction balances of $325 million in 2003, $491 million in 2002, $385 million in 2001, $90 million in
2000, and $52 million in 1999.(4) Includes other commercial real estate construction balances of $382 million in 2003, $469 million in 2002, $608 million in 2001,
$177 million in 2000 and $185 million in 1999.
During most of 2003, loans held for sale remained at elevated levels due to the high volume offixed-rate mortgage refinancing activity, which the Company generally sells to secondary mortgage marketparticipants. As refinancing activity subsided in the latter part of the year, loans held for sale declinedsharply, ultimately resulting in a decline in the year-end spot balance, as compared with the spot balance atDecember 31, 2002. The increase in loans held for sale in 2002 was primarily the result of the addition ofthe mortgage operations through the acquisitions of Dime and HomeSide in 2002, which coincided with aperiod of high fixed-rate loan refinancing activity.
Our loans held in portfolio increased $31.77 billion to $175.64 billion at December 31, 2003 from$143.87 billion at December 31, 2002. This increase was predominantly due to an increase in total homeloans and home equity loans and lines of credit. As refinancing activity declined during the latter part of2003, loan volume began to shift away from salable fixed-rate production and into short-termadjustable-rate mortgages, which the Company generally retains in its portfolio. In particular, the portfoliobalance of U.S. Treasury-indexed short-term adjustable-rate loans increased from $39.95 billion atSeptember 30, 2003 to $51.49 billion at December 31, 2003. Also contributing to home loan portfoliogrowth in 2003 was the retention of certain medium-term adjustable-rate mortgages originated during thethird quarter of 2003. These products, also referred to as ‘‘hybrid’’ loans, offer fixed interest rates duringtheir initial term, which is typically three or five years, and then convert to an adjustable rate for theirremaining life. The increase in the loan portfolio in 2002 was primarily due to the Dime acquisition,partially offset by high levels of loan prepayment activity.
36

Home, multi-family and other commercial real estate construction loans and commercial businessloans by maturity date were as follows:
December 31, 2003
Due After OneWithin But Within After
One Year Five Years Five Years Total
(in millions)
Home construction:Adjustable rate . . . . . . . . . . . . . . . . . . . . . . . . . . . . . . . . . $ 449 $ 871 $ 56 $1,376Fixed rate . . . . . . . . . . . . . . . . . . . . . . . . . . . . . . . . . . . . 187 50 607 844
Multi-family construction:Adjustable rate . . . . . . . . . . . . . . . . . . . . . . . . . . . . . . . . . – 244 36 280Fixed rate . . . . . . . . . . . . . . . . . . . . . . . . . . . . . . . . . . . . – 27 18 45
Other commercial real estate construction:Adjustable rate . . . . . . . . . . . . . . . . . . . . . . . . . . . . . . . . . 3 201 128 332Fixed rate . . . . . . . . . . . . . . . . . . . . . . . . . . . . . . . . . . . . – 34 16 50
Commercial business:Adjustable rate . . . . . . . . . . . . . . . . . . . . . . . . . . . . . . . . . 1,032 2,574 829 4,435Fixed rate . . . . . . . . . . . . . . . . . . . . . . . . . . . . . . . . . . . . 5 132 188 325
Total . . . . . . . . . . . . . . . . . . . . . . . . . . . . . . . . . . . . . $1,676 $4,133 $1,878 $7,687
Deposits
Deposits consisted of the following:
December 31,
2003 2002
(in millions)
Checking accounts:Noninterest bearing . . . . . . . . . . . . . . . . . . . . . . . . . . . . . . $ 27,906 $ 35,730Interest bearing . . . . . . . . . . . . . . . . . . . . . . . . . . . . . . . . . 68,318 56,132
Total checking accounts . . . . . . . . . . . . . . . . . . . . . . 96,224 91,862Savings accounts . . . . . . . . . . . . . . . . . . . . . . . . . . . . . . . . . . 11,029 10,313Money market deposit accounts . . . . . . . . . . . . . . . . . . . . . . . 17,971 19,573Time deposit accounts . . . . . . . . . . . . . . . . . . . . . . . . . . . . . . 27,957 33,768
Total deposits(1) . . . . . . . . . . . . . . . . . . . . . . . . . . . . $153,181 $155,516
(1) Includes custodial/escrow deposits related to loan servicing activities of $14.99 billion as of December 31, 2003 and $25.90 billionas of December 31, 2002. Substantially all custodial/escrow balances reside in noninterest bearing checking accounts.
Deposits decreased to $153.18 billion at December 31, 2003 from $155.52 billion at December 31,2002. After remaining at extremely high levels throughout most of 2003, custodial balances declinedsharply during the latter part of the year due to a marked decline in refinancing activity, which reduced thevolume of loan payoffs within the servicing portfolio. Time deposit accounts decreased by $5.81 billionfrom year end 2002 predominantly as a result of decreases in certificates of deposit accounts. Thesedecreases were substantially offset by increases in interest-bearing checking (Platinum) accounts. Platinumaccounts totaled $62.89 billion at December 31, 2003, compared with $50.20 billion at December 31, 2002.During 2003, the number of Platinum accounts increased by more than 300,000.
37

Checking accounts, savings accounts and money market deposit accounts increased to 82% of totaldeposits at December 31, 2003, compared with 78% at year end 2002. These products generally have thebenefit of lower interest costs, compared with time deposit accounts. Even though checking, savings andmoney market deposits are more liquid, we consider them to be the core relationship with our customers.At December 31, 2003, deposits funded 56% of total assets, compared with 58% at year end 2002.
Borrowings
Our borrowings predominantly take the form of repurchase agreements from financial intermediariesand advances from the Federal Home Loan Banks of Seattle, San Francisco, Dallas and New York. Theexact mix of these two types of wholesale borrowings at any given time is dependent upon the marketpricing of the individual borrowing sources.
Our wholesale borrowings increased by $10.19 billion at December 31, 2003 compared with year end2002 predominantly due to an increase in repurchase agreements and federal funds purchased, which waspartially offset by a decrease in advances from FHLBs. Other borrowings increased by $771 million during2003 substantially due to an increase in outstanding secured lines of credit. Refer to ‘‘Liquidity’’ for furtherdiscussion of funding sources at December 31, 2003, compared with year end 2002.
Operating Segments
The Company uses various methodologies, and continues to enhance those methodologies, to assigncertain balance sheet and income statement items to the responsible operating segment. Methodologiesthat are applied to the measurement of segment profitability include: (1) a funds transfer pricing system,which matches assets and liabilities with the approximate market benchmark of the Company’s cost offunds. It is based on the maturities and interest rate sensitivities of assets and liabilities and is designed toextract interest rate risk from the business units and concentrate it in the Treasury Division, where it ismanaged. This system measures the interest margin that is contributed by individual products, customersand organizational units; (2) a calculation of the provision for loan and lease losses based onmanagement’s current assessment of the long-term, normalized net charge-off ratio for loan productswithin each segment, which differs from the ‘‘losses inherent in the loan portfolio’’ methodology that isused to measure the allowance for loan and lease losses under accounting principles generally accepted inthe United States of America. This methodology is used to provide segment management with provisioninformation for strategic decision making; (3) the utilization of an activity-based costing approach tomeasure allocations of certain operating expenses that were not directly charged to the segments; (4) theallocation of goodwill and other intangible assets to the operating segments based on benefits receivedfrom each acquisition; (5) capital charges for goodwill as a component of an internal measurement ofreturn on the goodwill allocated to the operating segment; and (6) an economic capital model which is theframework for assessing business performance on a risk-adjusted basis. Changing economic conditions,further research and new data may lead to the update of the capital allocation assumptions.
On September 30, 2003, the Company announced the realignment of its operating segment structure.As a result of this realignment, the Company’s products and services are now grouped into two primarycategories—those marketed to retail consumers and those marketed to commercial customers. Thefinancial information reported for the Company’s operating segments is presented under this recentlyrealigned structure. Historical periods have been restated to conform to this new presentation.
38

The following table presents the operating segments, under both the previous and newly alignedsegment structure:
Previous Segment Structure Current Segment StructureConsumer Group
Banking Home Retailand Loans and Banking
Financial Insurance Specialty andServices Services Finance Financial Mortgage Commercial
Product or Service Group Group Group Services Banking Group
Deposit and other retail banking products andservices to consumers X X
Home equity loan products and consumerlending X X
Investment advisory and brokerage services X X
Business banking X X
Originating(1) and servicing home loans X X
Originating(1) and selling home loans on thesecondary market X X
Home loan portfolio X X
Insurance products and services X X
Specialty mortgage finance: purchased subprimehome loan portfolio X X
Specialty mortgage finance: Long BeachMortgage X X
Loans to developers and investors for theconstruction and purchase of multi-familydwellings, other commercial properties andnew homes X X
Servicing multi-family and other commercialreal estate loans X X
(1) Includes home loans purchased from correspondents.
The Consumer Group provides access to customers through a wide range of channels, whichencompass a network of retail banking stores, retail and wholesale home loan centers and ATMs.Additionally, 24-hour service is provided through telephone call centers and online banking. TheConsumer Group consists of two distinct operating segments for which separate financial reports areprepared: the Retail Banking and Financial Services segment, and the Mortgage Banking segment.
The Retail Banking and Financial Services segment offers a diversified set of products and financialservices to individual consumers. These products and services include deposit products such as theCompany’s signature free checking and Platinum accounts, savings accounts, money market depositaccounts and time deposit accounts. Loan products include home loans, home equity loans and lines ofcredit and consumer loans. This segment also holds those home loans originated and serviced by theMortgage Banking segment for retention in the Company’s loan portfolio, and purchased subprime homeloans. Financial services offered by this segment include the Company’s mutual fund managementbusiness, WM Advisors, Inc., which provides investment advisory and mutual fund distribution services,
39

and investment advisory and securities brokerage services that are offered by WM Financial Services, Inc.,a licensed broker-dealer. Fixed annuities are also offered to the public through licensed bankingemployees.
The Mortgage Banking segment originates and services home loans that are sold to secondary marketparticipants and loans that are held in portfolio by the Retail Banking and Financial Services segment.Costs incurred by the Mortgage Banking segment for servicing the Company’s home loan portfolio arecharged to the Retail Banking and Financial Services segment. Insurance services that complement themortgage process, such as private mortgage insurance and property and casualty insurance policies, arealso offered by this segment. This segment also manages the Company’s captive reinsurance activities andoffers a variety of life insurance policies.
The Commercial Group’s activities are managed as one operating segment. This group’s products andservices include loans made to developers and investors of multi-family and other commercial real estateproperties, commercial real estate loan servicing, selling commercial real estate loans to secondary marketparticipants, mortgage banker financing and loans made to small- and mid-sized businesses. The Groupalso provides financing to builders for the construction of new homes. Through Long Beach Mortgage, awholly-owned subsidiary of the Company and a component of the Company’s specialty mortgage financeprogram, the Commercial Group originates and services home loans made to higher-risk borrowers thatare sold to private and other secondary market participants.
Consumer Group
Retail Banking and Financial Services
Year Ended December 31, Percentage Change
2003 2002 2001 2003/2002 2002/2001
(in millions)
Condensed income statement:Net interest income . . . . . . . . . . . . . . . . . . . . $ 4,018 $ 3,813 $ 2,743 5% 39%Provision for loan and lease losses . . . . . . . . . 146 282 218 (48) 29Noninterest income . . . . . . . . . . . . . . . . . . . . 2,497 2,243 1,817 11 23Inter-segment revenue . . . . . . . . . . . . . . . . . . 179 96 62 86 55Noninterest expense . . . . . . . . . . . . . . . . . . . 3,950 3,562 2,551 11 40
Income before income taxes . . . . . . . . . . . . . 2,598 2,308 1,853 13 25Income taxes . . . . . . . . . . . . . . . . . . . . . . . . 996 880 694 13 27
Net income . . . . . . . . . . . . . . . . . . . . . . . . $ 1,602 $ 1,428 $ 1,159 12 23
Performance and other data:Efficiency ratio(1) . . . . . . . . . . . . . . . . . . . . . . 51.27% 49.79% 52.64% 3 (5)Average loans . . . . . . . . . . . . . . . . . . . . . . . . $121,119 $114,149 $ 98,364 6 16Average assets . . . . . . . . . . . . . . . . . . . . . . . 133,004 125,682 107,556 6 17Average deposits . . . . . . . . . . . . . . . . . . . . . . 125,440 112,034 81,194 12 38
(1) The efficiency ratio is defined as noninterest expense, excluding a cost of capital charge on goodwill, divided by total revenue(net interest income and noninterest income).
Net income increased to $1,602 million in 2003, compared with $1,428 million in 2002 and$1,159 million in 2001. Net interest income increased to $4,018 million in 2003 from $3,813 million in 2002and $2,743 million in 2001. The increase in net interest income was the result of growth experienced ininterest-bearing checking balances, predominantly consisting of Platinum accounts, which increased theamount of credits received through the funds transfer pricing process. Also contributing to the increase
40

was a decrease in interest rates paid to customers holding Platinum checking accounts. This increase waspartially offset by a decrease in interest income received from loans, as a result of the continued downwardpricing of the loan portfolio to current market levels. The overall increase in net interest income for 2002was driven mostly by higher home equity loans and lines of credit balances.
Noninterest income increased to $2,497 million in 2003, compared with $2,243 million in 2002 and$1,817 million in 2001. These increases in noninterest income were primarily a result of an increase indepositor and other retail banking fees due to higher levels of checking fees, resulting from an increase inthe number of noninterest-bearing checking accounts and an increase in debit card and ATM relatedincome.
Noninterest expense increased to $3,950 million in 2003, compared with $3,562 million in 2002 and$2,551 million in 2001. The increase in noninterest expense was primarily a result of an increase inemployee base compensation and benefits expense, which was due to higher personnel costs toaccommodate the opening of 260 new retail banking stores during the year. Also contributing to theincrease was an increase in occupancy and equipment expense resulting from the expansion of theCompany’s distribution network. The increase in 2002 was primarily the result of an increase in thegoodwill cost of capital allocation and an increase in higher employee compensation and benefits expensedue to the Dime and HomeSide acquisitions.
Total average assets increased by 6%, or $7,322 million in 2003 and increased 17%, or $18,126 millionin 2002. The increase in 2003 was substantially due to an increase in home equity loans and lines of creditand an increase in the purchased subprime portfolio. The increase in 2002 was primarily driven by anincrease in home equity loans and lines of credit and home loan mortgages.
Total average deposits increased by 12%, or $13,406 million in 2003 and by 38%, or $30,840 million in2002. These increases were substantially driven by the growth in Platinum accounts, partially offset bydecreases in money market and time deposit accounts.
Mortgage Banking
Year Ended December 31, Percentage Change
2003 2002 2001 2003/2002 2002/2001
(in millions)
Condensed income statement:Net interest income . . . . . . . . . . . . . . . . . . . . . . $ 2,462 $ 1,774 $ 828 39% 114%Noninterest income . . . . . . . . . . . . . . . . . . . . . . 2,980 2,365 1,288 26 84Inter-segment expense . . . . . . . . . . . . . . . . . . . . 179 96 62 86 55Noninterest expense . . . . . . . . . . . . . . . . . . . . . . 3,105 2,293 1,134 35 102
Income before income taxes . . . . . . . . . . . . . . . . 2,158 1,750 920 23 90Income taxes . . . . . . . . . . . . . . . . . . . . . . . . . . . 827 655 357 26 83
Net income . . . . . . . . . . . . . . . . . . . . . . . . . . $ 1,331 $ 1,095 $ 563 22 94
Performance and other data:Efficiency ratio(1) . . . . . . . . . . . . . . . . . . . . . . . . 55.03% 51.67% 51.77% 7 –Average loans . . . . . . . . . . . . . . . . . . . . . . . . . . $42,626 $28,666 $18,169 49 58Average assets . . . . . . . . . . . . . . . . . . . . . . . . . . 69,900 48,560 26,356 44 84Average deposits . . . . . . . . . . . . . . . . . . . . . . . . 27,112 13,583 7,591 100 79
(1) The efficiency ratio is defined as noninterest expense, excluding a cost of capital charge on goodwill, divided by total revenue(net interest income and noninterest income).
41

Net income increased to $1,331 million in 2003, compared with $1,095 million in 2002 and$563 million in 2001. Net interest income increased to $2,462 million in 2003 from $1,774 million in 2002and $828 million in 2001. These increases in net interest income were primarily the result of the higherlevels of loans held for sale due to extremely high refinancing activity which resulted in a large increase insalable loan volume.
Noninterest income increased to $2,980 million in 2003, compared with $2,365 million in 2002 and$1,288 million in 2001. The increase in noninterest income was primarily due to a recovery, net of changesin risk management instruments, in the MSR impairment valuation allowance during 2003. This recoverywas largely the result of an increase in mortgage rates during the second half of the year, which decreasedthe expected prepayment rate on the Company’s servicing portfolio. The increase in 2003 was partiallyoffset by an increase in MSR amortization. MSR amortization increased due to high levels of prepaymentactivity in the first half of 2003, and from the purchase of HomeSide in the fourth quarter of 2002, whichincreased the amortization base of the MSR. The increase in 2002 was largely due to increases in loanservicing fees, revaluation gain from derivatives and gain from other available-for-sale securities. Thisincrease was partially offset by an increase in MSR impairment.
Noninterest expense increased to $3,105 million in 2003, compared with $2,293 million in 2002 and$1,134 million in 2001. The increase in noninterest expense was primarily the result of an increase inemployee base compensation and benefits expense, which was due to higher personnel costs toaccommodate the refinancing activity during the year. Also contributing to the increase was higheroccupancy and equipment expense resulting from a write down of capitalized technology costs and theexpansion of the Company’s distribution network. The increase in 2002 was primarily driven by increases incompensation and benefits and occupancy and equipment expense related to the Dime and HomeSideacquisitions. The goodwill cost of capital charge related to the Dime acquisition also contributed to theincrease in 2002.
Total average assets increased by 44%, or $21,340 million in 2003 and increased by 84%, or$22,204 million in 2002. These increases were primarily due to the elevated levels of loans held for sale thatresulted from high levels of fixed-rate mortgage refinancing activity during 2003 and 2002, which theCompany generally sells to secondary mortgage market participants. After remaining at high levelsthroughout much of 2003, loans held for sale sharply declined towards the latter part of the year due to adecline in refinancing activity.
Total average deposits increased by 100%, or $13,529 million in 2003 and by 79%, or $5,992 million in2002. These increases were substantially due to elevated levels in refinancing activity during both years,which resulted in high levels of custodial deposits from prepayment activity in the loan servicing portfolio.After remaining at high levels throughout much of 2003, custodial balances sharply declined towards thelatter part of the year due to a decline in refinancing activity.
42

Commercial Group
Year Ended December 31, Percentage Change
2003 2002 2001 2003/2002 2002/2001
(in millions)
Condensed income statement:Net interest income . . . . . . . . . . . . . . . . . . . . . . $ 1,323 $ 1,179 $ 892 12% 32%Provision for loan and lease losses . . . . . . . . . . . 115 202 119 (43) 70Noninterest income . . . . . . . . . . . . . . . . . . . . . . 476 508 429 (6) 18Noninterest expense . . . . . . . . . . . . . . . . . . . . . . 561 514 373 9 38
Income from continuing operations beforeincome taxes . . . . . . . . . . . . . . . . . . . . . . . . . 1,123 971 829 16 17
Income taxes . . . . . . . . . . . . . . . . . . . . . . . . . . . 405 352 302 15 17
Income from continuing operations . . . . . . . . . . . 718 619 527 16 18Income from discontinued operations, net of
taxes . . . . . . . . . . . . . . . . . . . . . . . . . . . . . . . 87 72 61 21 18
Net income . . . . . . . . . . . . . . . . . . . . . . . . . . $ 805 $ 691 $ 588 16 18
Performance and other data:Efficiency ratio(1) . . . . . . . . . . . . . . . . . . . . . . . . 24.68% 23.76% 23.31% 4 2Average loans . . . . . . . . . . . . . . . . . . . . . . . . . . $35,695 $33,106 $29,061 8 14Average assets . . . . . . . . . . . . . . . . . . . . . . . . . . 44,376 40,171 35,176 10 14Average deposits . . . . . . . . . . . . . . . . . . . . . . . . 5,407 4,014 3,855 35 4
(1) The efficiency ratio is defined as noninterest expense, excluding a cost of capital charge on goodwill, divided by total revenue(net interest income and noninterest income).
Net income increased to $805 million in 2003, compared with $691 million in 2002 and $588 million in2001. Net interest income increased to $1,323 million in 2003, from $1,179 million in 2002 and $892 millionin 2001. These increases were mostly due to lower funding costs resulting from reduced interest rates andhigher average balances of home loans held for sale and multi-family loans.
Noninterest income decreased to $476 million in 2003, compared with $508 million in 2002 and$429 million in 2001. This decrease was predominantly due to lower gain from mortgage loans, partiallyoffset by nonrefundable fees received as consideration for swapping approximately $6 billion of multi-family loans with Freddie Mac and receiving beneficial interests in those loans in the form of mortgage-backed securities. Higher loan prepayment fees during 2003 also offset the decrease. The increase in 2002was mostly due to higher loan related income and revaluation adjustments on residual interests incollateralized mortgage obligations.
Noninterest expense was $561 million in 2003, compared with $514 million in 2002 and $373 million in2001. A significant portion of the increase in noninterest expense was due to an increase in employee basecompensation and benefits which was due to higher personnel costs to accommodate the increase in multi-family and other commercial real estate refinancing activity during the year. Also contributing to theincrease was higher occupancy and equipment expense resulting from the expansion of the Company’sdistribution network. This increase was partially offset by lower allocated overhead expense. The increasein 2002 was mostly due to increased compensation and benefits expense and an increase in the goodwillcost of capital allocation from the Dime acquisition in 2002.
Total average assets increased by 10%, or $4,205 million in 2003 and increased 14%, or $4,995 millionin 2002. The increase in average assets in 2003 was largely due to higher levels of home loans held for saleand growth in multi-family loans held in portfolio. The increase in 2002 was driven mostly by higher multi-family and other commercial real estate loans held in portfolio.
43

Corporate Support/Treasury and Other
Year Ended December 31, Percentage Change
2003 2002 2001 2003/2002 2002/2001
(in millions)
Condensed income statement:Net interest income (expense) . . . . . . . . . . . . . . . $ (530) $ 1,068 $ 1,765 –% (39)%Provision for loan and lease losses . . . . . . . . . . . 3 3 7 – (57)Noninterest income (expense) . . . . . . . . . . . . . . . 649 (76) (74) – 3Noninterest expense . . . . . . . . . . . . . . . . . . . . . . 635 635 610 – 4
Income (loss) before income taxes . . . . . . . . . . . (519) 354 1,074 – (67)Income taxes (benefit) . . . . . . . . . . . . . . . . . . . . (192) 131 397 – (67)
Net income (loss) . . . . . . . . . . . . . . . . . . . . . . $ (327) $ 223 $ 677 – (67)
Performance and other data:Average loans . . . . . . . . . . . . . . . . . . . . . . . . . . $ (255) $ (435) $ (20) (41) –Average assets . . . . . . . . . . . . . . . . . . . . . . . . . . 37,920 58,824 57,875 (36) 2Average deposits . . . . . . . . . . . . . . . . . . . . . . . . 5,626 4,885 3,665 15 33
Corporate Support/Treasury and Other had a net loss of $327 million in 2003, compared with netincome of $223 million in 2002 and $677 million in 2001. Net interest expense was $530 million in 2003,compared with net interest income of $1,068 million in 2002 and $1,765 million in 2001. The decrease innet interest income was predominantly due to decreases in the average balances of available-for-salesecurities resulting from sales of mortgage-backed and investment securities and prepayments ofmortgage-backed securities that occurred from refinancing activity. The decrease was also attributable tothe impact of the funds transfer pricing process. This decrease was partially offset by a reduction in interestexpense from borrowed funds, as a result of lower interest rates and higher levels of lower-costing averagedeposit balances. The decrease in 2002 was primarily due to the impact of the funds transfer pricingprocess to the results of our Treasury operations.
Noninterest income was $649 million in 2003, compared with noninterest expense of $76 million in2002 and $74 million in 2001. The increase in 2003 was predominantly due to gain on sale of mortgage-backed and investment securities.
Off-Balance Sheet Activities
Asset Securitization
We transform loans into securities, which are sold to investors—a process known as securitization.Securitization involves the sale of loans to a qualifying special-purpose entity (‘‘QSPE’’), typically a trust.The QSPE, in turn, issues interest-bearing securities, commonly called asset-backed securities, which aresecured by future collections on the sold loans. The QSPE sells securities to investors, which entitle theinvestors to receive specified cash flows during the term of the security. The QSPE uses proceeds from thesale of these securities to pay the Company for the loans sold to the QSPE. These QSPEs are notconsolidated within our financial statements since they satisfy the criteria established by StatementNo. 140, Accounting for the Transfers and Servicing of Financial Assets and Extinguishments of Liabilities. Ingeneral, these criteria require the QSPE to be legally isolated from the transferor (the Company), belimited to permitted activities, and have defined limits on the assets it can hold and the permitted sales,exchanges or distributions of its assets.
When we sell or securitize loans, we generally retain the right to service the loans and may retainsenior, subordinated, residual, and other interests, all of which are considered retained interests in the sold
44

or securitized assets. Retained interests may provide credit enhancement to the investors and, absent theviolation of representations and warranties, generally represent the Company’s maximum risk exposureassociated with these transactions. Retained interests were $2.36 billion at December 31, 2003, of which$2.34 billion have either a AAA credit rating or are agency insured. See Note 7 to the ConsolidatedFinancial Statements—‘‘Mortgage Banking Activities’’ for additional information concerning securitizationtransactions.
Contractual Obligations
The following table presents, as of December 31, 2003, the Company’s significant fixed anddeterminable contractual obligations, within the categories described below, by payment date orcontractual maturity. These contractual obligations, except for the operating lease and purchaseobligations, are included in the Consolidated Statements of Financial Condition. The payment amountsrepresent those amounts contractually due to the recipient.
Payments Due by Period (in millions)
1 but less 3 but less 5 yearsLess than than 3 than 5 or
Contractual Obligations Total 1 year years years more
Debt obligations(1) . . . . . . . . . . . . . . . . . . . . . . . . . $91,558 $58,489 $16,101 $11,337 $5,631Capital lease obligations . . . . . . . . . . . . . . . . . . . . . 76 10 15 12 39Operating lease obligations(2) . . . . . . . . . . . . . . . . . . 2,158 442 688 410 618Purchase obligations(3) . . . . . . . . . . . . . . . . . . . . . . . 502 138 254 86 24
Total contractual obligations . . . . . . . . . . . . . . . . . . $94,294 $59,079 $17,058 $11,845 $6,312
(1) Excludes debt obligations of $2.43 billion from discontinued operations.(2) Excludes operating lease obligations of $16 million from discontinued operations.(3) Purchase obligations are defined as legally binding agreements whereby the Company commits to a minimum purchase amount
of $1 million or more over a specified period of time. Estimated payments for contracts that may be terminated early withoutpenalty are shown through the first termination date, all others are shown through the date of contract termination. Excludedfrom the table are purchase obligations expected to be settled in cash within 90 days of the end of the reporting period.
The Company enters into derivative contracts under which the Company is required to either receivecash or pay cash to counterparties depending on changes in interest rates. Derivative contracts are carriedat fair value on the Consolidated Statements of Financial Condition with the fair value representing thenet present value of expected future cash receipts or payments based on market interest rates as of thebalance sheet date. The fair value of the contracts changes daily as market interest rates change. Furtherdiscussion of derivative instruments is included in Note 1—‘‘Summary of Significant Accounting Policies’’and Note 22—‘‘Derivative Financial Instruments’’ to the Consolidated Financial Statements.
Commitments, Guarantees and Contingencies
The Company may incur liabilities under certain contractual agreements contingent upon theoccurrence of certain events. A discussion of these contractual agreements under which the Company maybe held liable is included in Note 15—‘‘Commitments, Guarantees and Contingencies’’ to theConsolidated Financial Statements. In addition, the Company has commitments and obligations underpension and other postretirement benefit plans as described in Note 21—‘‘Employee Benefits Programsand Other Expense’’ to the Consolidated Financial Statements.
Asset Quality
Nonaccrual Loans, Foreclosed Assets and Restructured Loans
Loans are generally placed on nonaccrual status when they are 90 days or more past due. Additionally,loans in non-homogeneous portfolios are placed on nonaccrual status prior to becoming 90 days past due
45

when payment in full of principal and interest is not expected. Management’s classification of a loan asnonaccrual or restructured does not necessarily indicate that the principal or interest of the loan isuncollectible in whole or in part.
Nonaccrual loans and foreclosed assets (‘‘nonperforming assets’’) and restructured loans fromcontinuing operations consisted of the following:
December 31,
2003 2002 2001 2000 1999
(dollars in millions)
Nonperforming assets and restructured loans:Nonaccrual loans:
Loans secured by real estate:Home . . . . . . . . . . . . . . . . . . . . . . . . . . . . . . . . . $ 736 $1,068 $1,010 $ 509 $ 572Purchased specialty mortgage finance . . . . . . . . . . . 597 438 292 127 23
Total home nonaccrual loans . . . . . . . . . . . . . . 1,333 1,506 1,302 636 595Home equity loans and lines of credit . . . . . . . . . . 47 36 34 27 22Home construction:
Builder(1) . . . . . . . . . . . . . . . . . . . . . . . . . . . . . . 25 42 26 16 15Custom(2) . . . . . . . . . . . . . . . . . . . . . . . . . . . . . 10 7 10 2 3
Multi-family . . . . . . . . . . . . . . . . . . . . . . . . . . . . . 19 50 56 10 21Other real estate . . . . . . . . . . . . . . . . . . . . . . . . . . 153 413 376 35 33
Total nonaccrual loans secured by real estate . . 1,587 2,054 1,804 726 689Consumer . . . . . . . . . . . . . . . . . . . . . . . . . . . . . . . . 8 22 16 14 12Commercial business . . . . . . . . . . . . . . . . . . . . . . . . 31 79 100 12 10
Total nonaccrual loans held in portfolio . . . . . . 1,626 2,155 1,920 752 711Foreclosed assets . . . . . . . . . . . . . . . . . . . . . . . . . . . . . 311 328 216 144 195
Total nonperforming assets . . . . . . . . . . . . . . . $1,937 $2,483 $2,136 $ 896 $ 906As a percentage of total assets . . . . . . . . . . . . 0.70% 0.93% 0.88% 0.46% 0.49%
Restructured loans . . . . . . . . . . . . . . . . . . . . . . . . . . . . $ 111 $ 98 $ 118 $ 120 $ 117
Total nonperforming assets and restructuredloans . . . . . . . . . . . . . . . . . . . . . . . . . . . $2,048 $2,581 $2,254 $1,016 $1,023
(1) Represents loans to builders for the purpose of financing the acquisition, development and construction of single-familyresidences for sale.
(2) Represents construction loans made directly to the intended occupant of a single-family residence.
Home loan nonaccruals totaled $736 million at December 31, 2003, down 31% from December 31,2002. The Company continued its program of selling packages of nonperforming loans that it holds inportfolio. During 2003, the Company sold $619 million of nonperforming loans that it held in portfolio,incurring $38 million in related charge-offs. We will periodically evaluate nonperforming loan sales as partof our ongoing portfolio management strategy.
Nonaccrual loans held for sale, which are excluded from the nonaccrual balances presented above,were $66 million, $119 million, $123 million, $32 million and $30 million at December 31, 2003, 2002, 2001,2000 and 1999. Valuation changes on loans held for sale are reflected as gains or losses within gain frommortgage loans in noninterest income.
Purchased specialty mortgage finance nonaccrual loans totaled $597 million at December 31, 2003, anincrease of $159 million from December 31, 2002 primarily reflecting the seasoning and growth of this loanportfolio.
46

Nonaccrual home equity loans and lines of credit totaled $47 million at December 31, 2003, anincrease of $11 million from December 31, 2002. However, the percentage of nonaccruals to total loans inthis portfolio totaled 0.17% at December 31, 2003, down from 0.22% at December 31, 2002.
At December 31, 2003, other real estate loans on nonaccrual totaled $153 million, down from$413 million at December 31, 2002. Much of the year-to-date improvement was due to reinstatements,payoffs, transfers to foreclosed assets, and other dispositions in the commercial portfolios, including theCompany’s exit from the franchise-oriented finance business, which accounted for $132 million ofnonaccrual loans at December 31, 2002.
The multi-family portfolio continued to exhibit strong performance, with nonaccrual loans in thiscategory representing 0.09% of total multi-family loans at December 31, 2003, compared with 0.28% atDecember 31, 2002.
Commercial business nonaccrual loans decreased $48 million during the year ended December 31,2003 to $31 million. During 2003, the Company aggressively disposed of or charged-off distressed assets inthis portfolio.
At December 31, 2003, foreclosed assets were $311 million, compared with $328 million atDecember 31, 2002. The Company’s foreclosed assets include residential and commercial real estate aswell as a small amount of personal property. While residential secured properties increased $16 millionduring 2003, declines in commercial and personal property totaled $27 million and $5 million.
If interest on nonaccrual loans under the original terms had been recognized, such income isestimated to have been $86 million in 2003, $118 million in 2002 and $92 million in 2001.
Loans held in portfolio (exclusive of the allowance for loan and lease losses) and nonaccrual loans bygeographic concentration at December 31, 2003 were as follows:
California Washington/Oregon New York/New Jersey
Portfolio Nonaccrual Portfolio Nonaccrual Portfolio Nonaccrual
(dollars in millions)Loans secured by real estate:
Home . . . . . . . . . . . . . . . . . . . . . . . . . . . $48,447 $172 $ 6,132 $ 99 $ 9,736 $ 85Purchased specialty mortgage finance . . . . . 3,102 62 362 21 1,659 79
Total home loans . . . . . . . . . . . . . . . . 51,549 234 6,494 120 11,395 164Home equity loans and lines of credit . . . . 14,070 14 4,242 10 1,618 4Home construction:
Builder(1) . . . . . . . . . . . . . . . . . . . . . . . 278 – 77 – 75 –Custom(2) . . . . . . . . . . . . . . . . . . . . . . . 556 1 323 5 28 1
Multi-family . . . . . . . . . . . . . . . . . . . . . . . 15,589 5 1,258 6 1,885 2Other real estate . . . . . . . . . . . . . . . . . . . . 1,648 2 1,422 12 1,399 3
Total loans secured by real estate . . . . 83,690 256 13,816 153 16,400 174Consumer . . . . . . . . . . . . . . . . . . . . . . . . . . 358 1 391 3 63 –Commercial business . . . . . . . . . . . . . . . . . . 621 4 1,698 9 533 –
Total loans held in portfolio (exclusiveof the allowance for loan and leaselosses) . . . . . . . . . . . . . . . . . . . . . . $84,669 $261 $15,905 $165 $16,996 $174
Loans and nonaccrual loans as a percentageof total loans and total nonaccrual loans . . 48% 16% 9% 10% 10% 11%
(1) Represents loans to builders for the purpose of financing the acquisition, development and construction of single-familyresidences for sale.
(2) Represents construction loans made directly to the intended occupant of a single-family residence.
47

Florida Texas
Portfolio Nonaccrual Portfolio Nonaccrual
(dollars in millions)Loans secured by real estate:
Home . . . . . . . . . . . . . . . . . . . . . . . . . . . . . . . . . . . . . . $ 7,612 $ 60 $1,523 $ 28Purchased specialty mortgage finance . . . . . . . . . . . . . . . 1,064 38 795 47
Total home loans . . . . . . . . . . . . . . . . . . . . . . . . . . . 8,676 98 2,318 75Home equity loans and lines of credit . . . . . . . . . . . . . . . 1,448 2 3,188 6Home construction:
Builder(1) . . . . . . . . . . . . . . . . . . . . . . . . . . . . . . . . . . 126 9 273 12Custom(2) . . . . . . . . . . . . . . . . . . . . . . . . . . . . . . . . . . 45 – 11 –
Multi-family . . . . . . . . . . . . . . . . . . . . . . . . . . . . . . . . . 57 – 241 2Other real estate . . . . . . . . . . . . . . . . . . . . . . . . . . . . . . 152 4 491 55
Total loans secured by real estate . . . . . . . . . . . . . . . 10,504 113 6,522 150Consumer . . . . . . . . . . . . . . . . . . . . . . . . . . . . . . . . . . . . . 47 – 35 –Commercial business . . . . . . . . . . . . . . . . . . . . . . . . . . . . . 434 2 421 15
Total loans held in portfolio (exclusive of theallowance for loan and lease losses) . . . . . . . . . . . $10,985 $115 $6,978 $165
Loans and nonaccrual loans as a percentage of total loansand total nonaccrual loans . . . . . . . . . . . . . . . . . . . . . . . 6% 7% 4% 10%
(1) Represents loans to builders for the purpose of financing the acquisition, development and construction of single-familyresidences for sale.
(2) Represents construction loans made directly to the intended occupant of a single-family residence.
Other(3) Total
Portfolio Nonaccrual Portfolio Nonaccrual
(dollars in millions)Loans secured by real estate:
Home . . . . . . . . . . . . . . . . . . . . . . . . . . . . . . . . . . . . . $26,593 $292 $100,043 $ 736Purchased specialty mortgage finance . . . . . . . . . . . . . . 5,991 350 12,973 597
Total home loans . . . . . . . . . . . . . . . . . . . . . . . . . 32,584 642 113,016 1,333Home equity loans and lines of credit . . . . . . . . . . . . . . 3,081 11 27,647 47Home construction:
Builder(1) . . . . . . . . . . . . . . . . . . . . . . . . . . . . . . . . . 223 4 1,052 25Custom(2) . . . . . . . . . . . . . . . . . . . . . . . . . . . . . . . . . 205 3 1,168 10
Multi-family . . . . . . . . . . . . . . . . . . . . . . . . . . . . . . . . 1,294 4 20,324 19Other real estate . . . . . . . . . . . . . . . . . . . . . . . . . . . . . 1,537 77 6,649 153
Total loans secured by real estate . . . . . . . . . . . . . . 38,924 741 169,856 1,587Consumer . . . . . . . . . . . . . . . . . . . . . . . . . . . . . . . . . . . 134 4 1,028 8Commercial business . . . . . . . . . . . . . . . . . . . . . . . . . . . . 1,053 1 4,760 31
Total loans held in portfolio (exclusive of theallowance for loan and lease losses) . . . . . . . . . . $40,111 $746 $175,644 $1,626
Loans and nonaccrual loans as a percentage of total loansand total nonaccrual loans . . . . . . . . . . . . . . . . . . . . . . 23% 46% 100% 100%
(1) Represents loans to builders for the purpose of financing the acquisition, development and construction of single-familyresidences for sale.
(2) Represents construction loans made directly to the intended occupant of a single-family residence.(3) Of this category, Illinois had the largest portfolio balance of approximately $5.24 billion and the largest nonaccrual amount of
$90 million.
48

90 or More Days Past Due
The amount of loans held in portfolio which were 90 or more days contractually past due and stillaccruing interest were $46 million, $60 million, $86 million, $45 million and $60 million at December 31,2003, 2002, 2001, 2000 and 1999. The majority of these loans are either VA- or FHA-insured with little orno risk of loss of principal or interest.
In prior periods, our held for sale portfolio included an immaterial amount of loans which were 90 ormore days contractually past due and still accruing interest. However, as a result of regulatory guidelinesissued in December of 2003, delinquent mortgages contained within GNMA loan servicing pools that arerepurchased or are eligible to be repurchased by the Company must be reported as loans on theConsolidated Statements of Financial Condition. As the Company sells most of these repurchased loans tosecondary market participants, they are classified as loans held for sale on the Consolidated Statements ofFinancial Condition. Substantially all of these loans are either guaranteed or insured by agencies of thefederal government and, therefore, do not expose the Company to significant risk of loss. Our held for saleportfolio contained $2.50 billion, $3.22 billion and $692 million of such loans which were 90 or more dayscontractually past due and still accruing interest at December 31, 2003, 2002 and 2001. We did notparticipate in this program prior to 2001.
Provision and Allowance for Loan and Lease Losses
The allowance for loan and lease losses represents management’s estimate of credit losses inherent inthe Company’s loan and lease portfolios as of the balance sheet date. The estimation of the allowance isbased on a variety of factors, including past loan loss experience, adverse situations that have occurred butare not yet known that may affect the borrower’s ability to repay, the estimated value of underlyingcollateral and general economic conditions. The Company’s methodology for assessing the adequacy of theallowance includes the evaluation of three distinct components: the formula allowance, the specificallowance (which includes the allowance for loans deemed to be impaired by Statement No. 114,Accounting by Creditors for Impairment of a Loan) and the unallocated allowance. The formula allowanceand the specific allowance collectively represent the portion of the allowance for loan and lease losses thatis allocated to the various loan portfolios. As the process for determining the adequacy of the allowancerequires subjective and complex judgment by management about the effect of matters that are inherentlyuncertain, subsequent evaluations of the loan portfolio, in light of the factors then prevailing, may result insignificant changes in the allowance for loan and lease losses.
The allowance considers losses that are inherent in loan portfolios, but have not yet been realized.Losses are recognized when (a) available information indicates that it is probable that a loss has beenincurred and (b) the amount of the loss can be reasonably estimated. Generally, the Company believes thatborrowers are impacted by events that result in loan default and eventual loss well in advance of a lender’sknowledge of those events. The time frame between the occurrence of such events and the resultingdefault and loss realization is referred to as the loss emergence period. Examples of such loss-causingevents for home loans are borrower job loss, divorce and medical crisis. An example for commercial realestate loans would be the loss of a major tenant.
The formula allowance is calculated by applying loss factors against all loans in what are consideredhomogeneous portfolios (such as home loans, home equity loans and lines of credit, and purchasedspecialty mortgage finance loans). Loss factors are based on an analysis of the historical loss experience ofeach loan category and an assessment of portfolio trends and conditions, as well as specific risk factorsimpacting the loan and lease portfolios. These factors may be adjusted for external factors that, inmanagement’s judgment, affect the collectibility of the portfolio as of the evaluation date. Such externalfactors include, but are not limited to, the interest rate environment and housing prices.
For non-homogeneous loans such as commercial real estate, larger commercial business loans andbuilder home construction loans, loss factors are assigned based on risk ratings that are ascribed to the
49

individual loans. A specific allowance may be assigned to these loans if they have been individuallydetermined to be impaired.
Loans, other than those included in homogeneous portfolios, are considered impaired when it isprobable that we will be unable to collect all amounts past due, including interest payments. For loans thatare determined to be impaired, the amount of impairment is measured by a discounted cash flow analysis,using the loan’s effective interest rate, except when it is determined that the only source of repayment forthe loan is the operation or liquidation of the underlying collateral. In such cases, the current fair value ofthe collateral, reduced by estimated disposal costs, will be used in place of discounted cash flows. Inestimating the fair value of collateral, we evaluate various factors, such as occupancy and rental rates in ourreal estate markets and the level of obsolescence that may exist on assets acquired from commercialbusiness loans.
Loans that are determined to be impaired are excluded from the formula allowance analysis so as notto double-count the loss exposure.
In estimating the amount of credit losses inherent in the Company’s loan and lease portfolios, variousassumptions are made. For example, when assessing the condition of the overall economic environment,assumptions are made regarding current economic trends and their impact on the loan and lease portfolio.In the event the national economy were to sustain a prolonged downturn, the loss factors applied to ourportfolios may need to be revised, which may significantly impact the measurement of the allowance forloan and lease losses. For impaired loans that are collateral-dependent, the estimated fair value of thecollateral may deviate significantly from the proceeds received when the collateral is sold. To mitigate theimprecision inherent in most estimates of expected credit losses, the allocated component of the allowanceis supplemented by an unallocated component. The unallocated component reflects our judgmentalassessment of the impact that various factors have on the overall measurement of credit losses. Thesefactors include, but are not limited to, general economic and business conditions affecting the key lendingareas of the Company, credit quality and collateral value trends, loan concentrations, specific industryconditions within portfolio segments, recent loss experience in particular segments of the portfolio,duration of the current business cycle, the impact of new product initiatives and other such variables forwhich recent historical data do not provide a high level of precision for risk evaluation, the results ofregulatory examinations and findings from the Company’s internal credit review function.
Refer to Note 1 to the Consolidated Financial Statements—‘‘Summary of Significant AccountingPolicies’’ for further discussion of the Allowance for Loan and Lease Losses.
50

Changes in the allowance for loan and lease losses were as follows:
Year Ended December 31,
2003 2002 2001 2000 1999
(dollars in millions)
Balance, beginning of year . . . . . . . . . . . . . . . . . . . . . . . . $1,503 $1,278 $ 909 $ 942 $ 987Allowance transferred to loans held for sale . . . . . . . . . . . . (3) (31) – (36) (1)Allowance acquired through business combinations . . . . . . . – 148 120 – –Allowance for certain loan commitments . . . . . . . . . . . . . . 17 (48) – – –Provision for loan and lease losses . . . . . . . . . . . . . . . . . . . 42(1) 404 426 77 67
1,559 1,751 1,455 983 $1,053Loans charged off:
Loans secured by real estate:Home . . . . . . . . . . . . . . . . . . . . . . . . . . . . . . . . . . . . (65) (52) (29) (19) (38)Purchased specialty mortgage finance . . . . . . . . . . . . . (39) (33) (25) (4) –
Total home loan charge-offs . . . . . . . . . . . . . . . . . . (104) (85) (54) (23) (38)Home equity loans and lines of credit . . . . . . . . . . . . . (14) (14) (4) (3) –Home construction(2) . . . . . . . . . . . . . . . . . . . . . . . . . (2) (1) – (1) –Multi-family . . . . . . . . . . . . . . . . . . . . . . . . . . . . . . . (5) (1) – (2) (15)Other real estate . . . . . . . . . . . . . . . . . . . . . . . . . . . . (97) (60) (35) (4) (24)
Total loans secured by real estate . . . . . . . . . . . . . . (222) (161) (93) (33) (77)Consumer . . . . . . . . . . . . . . . . . . . . . . . . . . . . . . . . . . . (69) (70) (51) (41) (46)Commercial business . . . . . . . . . . . . . . . . . . . . . . . . . . . (79) (73) (49) (9) (3)
Total loans charged off . . . . . . . . . . . . . . . . . . . . . . (370) (304) (193) (83) (126)Recoveries of loans previously charged off:
Loans secured by real estate:Home . . . . . . . . . . . . . . . . . . . . . . . . . . . . . . . . . . . . 10 2 2 1 4Purchased specialty mortgage finance . . . . . . . . . . . . . 3 – – 1 –
Total home loan recoveries . . . . . . . . . . . . . . . . . . . 13 2 2 2 4Home equity loans and lines of credit . . . . . . . . . . . . . 1 1 1 – –Multi-family . . . . . . . . . . . . . . . . . . . . . . . . . . . . . . . 1 1 – 1 3Other real estate . . . . . . . . . . . . . . . . . . . . . . . . . . . . 17 12 3 1 4
Total loans secured by real estate . . . . . . . . . . . . . . 32 16 6 4 11Consumer . . . . . . . . . . . . . . . . . . . . . . . . . . . . . . . . . . . 15 13 4 4 3Commercial business . . . . . . . . . . . . . . . . . . . . . . . . . . . 14 27 6 1 1
Total recoveries of loans previously charged off . . . . 61 56 16 9 15
Net charge-offs . . . . . . . . . . . . . . . . . . . . . . . . . . (309) (248) (177) (74) (111)
Balance, end of year . . . . . . . . . . . . . . . . . . . . . . . . . . . . . $1,250 $1,503 $1,278 $ 909 $ 942
Net charge-offs as a percentage of average loans held inportfolio . . . . . . . . . . . . . . . . . . . . . . . . . . . . . . . . . . . . 0.20% 0.17% 0.14% 0.07% 0.10%
Allowance as a percentage of total loans held in portfolio . . 0.71% 1.04% 1.01% 0.78% 0.85%
(1) Includes a $202 million reversal of provision for loan and lease losses recorded in the fourth quarter.(2) Represents loans to builders for the purpose of financing the acquisition, development and construction of single-family
residences for sale and construction loans made directly to the intended occupant of a single-family residence.
Charge-offs and recoveries applicable to Washington Mutual Finance Corporation are not includedfor the years presented in this table due to its status as a discontinued operation. Prior to this change in
51

status, this business unit had accounted for approximately one-third of the total net charge-offs reported bythe Company in prior periods.
During 2003, there were several key events that resulted in a significant improvement in theCompany’s overall credit quality. First, the Company has been aggressively managing its inventory ofnonperforming assets through regular sales of loans. Second, the Company sold its portfolio of franchisefinance loans. Finally, the general economic conditions improved significantly in the latter part of the year.
The Company sold $619 million of nonperforming single-family residential loans during 2003. Theresulting charge-offs related to these sales were $38 million. We believe these sales are a more efficient andeffective means of dealing with potentially troubled assets than solely managing these assets through thecollection and foreclosure process.
During the fourth quarter, management also achieved a significant improvement in the risk profile ofits loan portfolio by entering into sales transactions to dispose of the remaining $385 million portfolio offranchise finance loans. The transaction resulted in a net charge-off of $39 million and a reversal in theamount of the remaining specific reserve of $82 million.
Beginning in the second half of 2001 and continuing through 2002, the Company provisioned for loanand lease losses in amounts that were in excess of the net charge-offs incurred during those periods. Thosedecisions reflected management’s judgment in response to declining credit quality trends observed in theCompany’s residential and commercial loan portfolios, growth in its nonperforming loan balance, and thegeneral downturn of the domestic economy. Among other effects, the economic weakness triggered higherlevels of unemployment and uncertain implications for real estate values in a number of markets—keyfactors which affect the Company’s estimate of inherent losses within its major loan portfolios. Beginningin 2003, signs of a stabilizing credit environment began to appear, including a favorable shift in certaineconomic indicators. However, a discernable, positive trend in these indicators was not evident until therelease of data in the fourth quarter. This information showed significant growth in the national economyduring the third quarter, complementing the ongoing trends of stable housing prices, strong residentialconstruction rates and a continued low interest rate environment.
In response to the positive implications of these factors—a growing national economy, a significantreduction in nonperforming loans (down $529 million, or 25%, for the year, including a $187 millionreduction in the fourth quarter) and the disposition of its highest risk asset portfolio in the fourthquarter—the Company determined that a reduction in the overall size of the allowance was appropriate.Accordingly, a $120 million reversal of the allowance for loan and lease losses was recorded in the fourthquarter of 2003, in addition to the reversal of the remaining franchise finance portfolio specific reserve of$82 million.
52

An analysis of the allowance for loan and lease losses was as follows:
December 31,
2003 2002 2001
Allowance Allocated Loan Allowance Allocated Loan Allowance Allocated Loanfor Loan Allowance Category for Loan Allowance Category for Loan Allowance Category
and as a % as a % and as a % as a % and as a % as a %Lease of Loan of Total Lease of Loan of Total Lease of Loan of TotalLosses Category Loans(1) Losses Category Loans(1) Losses Category Loans(1)
(dollars in millions)Specific and allocated allowances:
Loans secured by real estate:Home . . . . . . . . . . . . . . $ 321 0.32% 56.95% $ 251 0.30% 57.58% $ 290 0.36% 63.00%Purchased specialty
mortgage finance . . . . . . 84 0.65 7.39 169 1.67 7.04 97 1.18 6.49
Total home loans . . . . . 405 0.36 64.34 420 0.45 64.62 387 0.44 69.49Home equity loans and lines
of credit . . . . . . . . . . . . 82 0.30 15.74 46 0.29 11.24 27 0.34 6.31Home construction:
Builder(2) . . . . . . . . . . . 10 0.95 0.60 15 1.48 0.71 28 1.73 1.28Custom(3) . . . . . . . . . . . 8 0.68 0.66 7 0.75 0.65 4 0.41 0.77
Multi-family . . . . . . . . . . . 139 0.68 11.57 146 0.81 12.51 138 0.88 12.35Other real estate . . . . . . . . 110 1.65 3.79 296 3.71 5.55 161 2.64 4.82
Total allocatedallowance secured byreal estate . . . . . . . 754 0.44 96.70 930 0.68 95.28 745 0.62 95.02
Consumer . . . . . . . . . . . . . 49 4.77 0.59 70 4.21 1.15 71 3.53 1.59Commercial business . . . . . . . 72 1.51 2.71 116 2.26 3.57 92 2.15 3.39
Total allocatedallowance held inportfolio . . . . . . . . . 875 0.50 100.00 1,116 0.78 100.00 908 0.72 100.00
Unallocated allowance . . . . . . . 375 0.21 – 387 0.26 – 370 0.29 –
Total allowance for loanand lease losses . . . . $1,250 0.71% 100.00% $1,503 1.04% 100.00% $1,278 1.01% 100.00%
(Continued on next table.)
(1) Excludes loans held for sale.(2) Represents loans to builders for the purpose of financing the acquisition, development and construction of single-family
residences for sale.(3) Represents construction loans made directly to the intended occupant of a single-family residence.
53

December 31,
2000 1999
Allowance Allocated Loan Allowance Allocated Loanfor Loan Allowance Category for Loan Allowance Category
and as a % as a % and as a % as a %Lease of Loan of Total Lease of Loan of TotalLosses Category Loans(1) Losses Category Loans(1)
(dollars in millions)Specific and allocated allowances:
Loans secured by real estate:Home . . . . . . . . . . . . . . . . . . . . . . . . . . . . . . . . . . . $250 0.31% 69.18% $ – –% 72.49%Purchased specialty mortgage finance . . . . . . . . . . . . . . . 52 0.94 4.78 – – 2.82
Total home loans . . . . . . . . . . . . . . . . . . . . . . . . . 302 0.35 73.96 – – 75.31Home equity loans and lines of credit . . . . . . . . . . . . . . . 20 0.35 4.98 – – 3.98Home construction:
Builder(2) . . . . . . . . . . . . . . . . . . . . . . . . . . . . . . . . 4 0.91 0.38 5 1.48 0.30Custom(3) . . . . . . . . . . . . . . . . . . . . . . . . . . . . . . . 3 0.30 0.86 – – 0.82
Multi-family . . . . . . . . . . . . . . . . . . . . . . . . . . . . . . . 138 0.88 13.51 59 0.39 13.79Other real estate . . . . . . . . . . . . . . . . . . . . . . . . . . . . 100 2.55 3.38 – – 3.24
Total allocated allowance secured by real estate . . . . . . 567 0.50 97.07 64 0.06 97.44Consumer . . . . . . . . . . . . . . . . . . . . . . . . . . . . . . . . . . 70 4.19 1.44 – – 1.30Commercial business . . . . . . . . . . . . . . . . . . . . . . . . . . . 33 1.91 1.49 18 1.29 1.26
Total allocated allowance held in portfolio . . . . . . . . . 670 0.58 100.00 82 0.07 100.00Unallocated allowance . . . . . . . . . . . . . . . . . . . . . . . . . . . 239 0.20 – 860 0.78 –
Total allowance for loan and lease losses . . . . . . . . . . $909 0.78% 100.00% $942 0.85% 100.00%
(1) Excludes loans held for sale.(2) Represents loans to builders for the purpose of financing the acquisition, development and construction of single-family
residences for sale.(3) Represents construction loans made directly to the intended occupant of a single-family residence.
During 2000, in conjunction with our continued expansion of our lending activity beyond traditionalhome loans, management enhanced its methodology for determining the allocated components of theallowance. This enhancement resulted in an allocation of previously unallocated allowance amounts toindividual loan categories.
Liquidity
The objective of liquidity management is to ensure the Company has the continuing ability tomaintain cash flows that are adequate to fund operations and meet obligations and other commitments ona timely and cost-effective basis. The Company establishes liquidity guidelines for its principal operatingsubsidiaries as well as for the parent holding company, Washington Mutual, Inc.
Banking Subsidiaries
The principal sources of liquidity for our banking subsidiaries are customer deposits, wholesaleborrowings, the maturity and repayment of portfolio loans, securities held in our available-for-saleportfolio and mortgage loans designated as held for sale. Among these sources, transaction deposits andwholesale borrowings from FHLB advances and repurchase agreements continue to provide the Companywith a significant source of stable funding. During 2003, those sources funded 72% of average total assets.Our continuing ability to retain our transaction deposit base and to attract new deposits depends onvarious factors, such as customer service satisfaction levels and the competitiveness of interest ratesoffered on our deposit products. We expect to continue to have the necessary assets available to pledge ascollateral to obtain FHLB advances and repurchase agreements to offset any potential declines in depositbalances.
54

In 2003, the Company’s proceeds from the sales of loans held for sale were approximately$325.00 billion. These proceeds were, in turn, used as the primary funding source for the origination andpurchases of approximately $315.11 billion of loans held for sale during the same period. As this cyclicalpattern of sales and originations/purchases repeats itself during the course of a period, the amount offunding necessary to sustain our mortgage banking operations does not significantly affect the Company’soverall level of liquidity resources.
To supplement our funding sources, our banking subsidiaries also raise funds in domestic andinternational capital markets. In August 2003, the Company established a new $20 billion Global BankNote Program for Washington Mutual Bank, FA (‘‘WMBFA’’) and Washington Mutual Bank (‘‘WMB’’) toissue senior and subordinated notes in the United States and in international capital markets in a variety ofcurrencies and structures. This program replaced the $15 billion program established in April 2001. Underthis program, WMBFA will be allowed to issue up to $15 billion in notes, of which $5 billion can be issuedas subordinated notes subject to regulatory approval. WMB will be allowed to issue up to $5 billion insenior notes. The maximum aggregate principal amount of notes with maturities greater than 270 daysfrom the date of issue offered by WMBFA may not exceed $7.5 billion. At December 31, 2003, theCompany had $20 billion available for issuance under this program.
Washington Mutual, Inc. and Non-banking Subsidiaries
Liquidity for Washington Mutual, Inc. is generated through its ability to raise funds in various capitalmarkets and through dividends from subsidiaries, commercial paper programs and lines of credit.
Washington Mutual, Inc.’s primary funding source during 2003 was from dividends paid by ourbanking subsidiaries. Although we expect Washington Mutual, Inc. to continue to receive bankingsubsidiary dividends during 2004, various regulatory requirements related to capital adequacy and retainedearnings limit the amount of dividends that can be paid by our banking subsidiaries. For more informationon dividend restrictions applicable to our banking subsidiaries, refer to ‘‘Business—Regulation andSupervision’’ and Note 19 to the Consolidated Financial Statements—‘‘Regulatory Capital Requirementsand Dividend Restrictions.’’
In February 2003, Washington Mutual, Inc. filed a shelf registration statement with the Securities andExchange Commission to register $2 billion of debt securities, preferred stock and depositary shares in theUnited States and in international capital markets in a variety of currencies and structures. The shelfregistration statement was declared effective on April 15, 2003. In November 2003, WashingtonMutual, Inc. issued $1.65 billion of fixed- and adjustable-rate debt securities. As of December 31, 2003,Washington Mutual, Inc. had $350 million available for issuance under this shelf registration statement.
In addition, in October 2003, Washington Mutual, Inc. filed with the Securities and ExchangeCommission an additional shelf registration statement under which Washington Mutual, Inc. will bepermitted to issue in the United States and in international capital markets in a variety of currencies andstructures up to $5 billion of debt securities, preferred stock and depositary shares. This registrationstatement became effective in November 2003. At December 31, 2003, Washington Mutual, Inc. had$5 billion available under this shelf registration.
Washington Mutual, Inc. and its non-banking subsidiaries also have various other credit facilities andagreements that are sources of liquidity, including a revolving credit facility totaling $800 million whichprovides back-up for certain commercial paper programs of Washington Mutual, Inc. and WashingtonMutual Finance as well as funds for general corporate purposes. At December 31, 2003, there was$333 million available under this facility for purposes other than back-up of commercial paper.Additionally, Washington Mutual Finance had agreements to participate in a $600 million asset-backedcommercial paper conduit program. Subsequently, the Company sold Washington Mutual Finance toCitiFinancial, a subsidiary of Citigroup. The sale was closed on January 9, 2004. Washington MutualFinance was removed from the $800 million revolving credit facility agreement at that date and the whole
55

amount is now available to Washington Mutual, Inc. The $600 million asset-backed commercial paper waspaid off on the closing date. Washington Mutual Finance, now a subsidiary of Citigroup, continues to beresponsible for its outstanding unsecured commercial paper and notes.
Long Beach Mortgage has revolving credit facilities with non-affiliated lenders totaling $4 billion thatare used to fund loans held for sale. At December 31, 2003, Long Beach had borrowed $2.7 billion underthese credit facilities.
The Company maintains a noncontributory cash balance defined benefit pension plan (the ‘‘PensionPlan’’) for substantially all eligible employees. In measuring the variables that determine the funded statusof the Pension Plan, three of the more significant assumptions that must be estimated are the expectedlong-term rate of return on the plan’s assets, the discount rate and the compensation rate increase that areused to calculate the accumulated benefit obligation. Due to the improvement in the equity market in 2003we exceeded our long-term rate of return on plan assets of 8%. Additionally, due to the extremely lowinterest rate environment that has existed throughout 2003, the assumed discount rate for 2003 was lowerthan 2002, which increased the present value of the December 31, 2003 estimated accumulated benefitobligation. The Company contributed additional funding of $85 million to the Pension Plan during 2003,which was sufficient to prevent the recognition of a pension liability.
The Company has used an assumed discount rate of 6.50%, an assumed rate of compensation increaseof 5.50% and an expected long-term return on plan assets of 8.00% to calculate a net periodic benefit costof $68 million for 2003. An assumed discount rate of 6.00% and an assumed rate of compensation increaseof 5.50% were used to calculate the Company’s projected benefit obligation of $1.28 billion as ofDecember 31, 2003. Refer to Note 21 to the Consolidated Financial Statements—‘‘Employee BenefitsPrograms and Other Expense’’ for further discussion.
The table below illustrates the potential impact of 50 basis point increases and decreases in the keyassumptions outlined above to the 2004 projected net periodic benefit cost and the December 31, 2003projected benefit obligation (50 basis points is equivalent to one-half of one percent). The 50 basis pointincreases and decreases represent the Company’s estimate of the changes which may occur over a twelvemonth period.
Projected 2004Net Periodic ProjectedBenefit Cost Benefit
Basis Points Impact Obligation Impact
(dollars in millions)
Discount rate increase . . . . . . . . . . . . . . . . . . . . . . . . . . +50 $(12.7) $(84.9)Discount rate decrease . . . . . . . . . . . . . . . . . . . . . . . . . . �50 13.8 94.8Rate of compensation decrease(1) . . . . . . . . . . . . . . . . . . �50 (4.9) (9.6)Return on assets increase . . . . . . . . . . . . . . . . . . . . . . . . +50 (6.4) n/aReturn on assets decrease . . . . . . . . . . . . . . . . . . . . . . . . �50 6.4 n/a
(1) Only the rate of compensation decrease is provided because, due to the current economic conditions, it is not anticipated thatthe assumed rate of compensation increase will be greater than 5.50%.
Capital Adequacy
Reflecting the increases in loans held in portfolio and investment securities and a decrease instockholders’ equity during 2003, the ratio of stockholders’ equity to total assets decreased to 7.17% atDecember 31, 2003 from 7.48% at December 31, 2002.
56

The regulatory capital ratios of WMBFA, WMB and Washington Mutual Bank fsb (‘‘WMBfsb’’) andminimum regulatory ratios to be categorized as well-capitalized were as follows:
December 31, 2003 Well-CapitalizedWMBFA WMB WMBfsb Minimum
Tier 1 capital to adjusted total assets (leverage) . . . . . . . . . . 5.50% 5.82% 10.34% 5.00%Adjusted tier 1 capital to total risk-weighted assets . . . . . . . . 8.72 9.10 16.36 6.00Total risk-based capital to total risk-weighted assets . . . . . . . 10.80 11.23 17.04 10.00
Our federal savings bank subsidiaries, WMBFA and WMBfsb, are also required by Office of ThriftSupervision regulations to maintain tangible capital of at least 1.50% of assets. WMBFA and WMBfsbboth satisfied this requirement at December 31, 2003.
Our broker-dealer subsidiaries are also subject to capital requirements. At December 31, 2003, bothof our broker-dealer subsidiaries were in compliance with their applicable capital requirements.
During 2003, the Company repurchased 65.9 million shares of our common stock at an average priceof $40.93 as part of our share repurchase program. Effective July 15, 2003, the Company adopted a newshare repurchase program approved by the Board of Directors. Under the new program, the Company isauthorized to repurchase up to 100 million shares of its common stock, as conditions warrant. ThisProgram replaces the Company’s previous share repurchase program. From January 1, 2004 throughFebruary 27, 2004, the Company repurchased an additional 16.1 million shares. Management may engagein future share repurchases as liquidity conditions permit and market conditions warrant.
Market Risk Management
Market risk is defined as the sensitivity of income, fair market values and capital to changes in interestrates, foreign currency exchange rates, commodity prices and other relevant market rates or prices. Theprimary market risk to which we are exposed is interest rate risk. Substantially all of our interest rate riskarises from instruments, positions and transactions entered into for purposes other than trading. Theyinclude loans, MSR, securities, deposits, borrowings, long-term debt and derivative financial instruments.
We manage interest rate risk within a consolidated enterprise risk management framework thatincludes an assessment of interest rate risk within our Asset/Liability Management process, which includesthe measurement and management of specific portfolios (MSR and Other Mortgage Banking) discussedbelow. The principal objective of asset/liability management is to manage the sensitivity of net income tochanging interest rates. Asset/liability management is governed by a policy reviewed and approved annuallyby our Board. The Board has delegated the oversight of the administration of this policy to the FinanceCommittee.
Overview of Interest Rate Risk
Increases or decreases in interest rates can cause changes in net income, fluctuations in the fair valueof assets and liabilities, such as MSR, investment securities and derivatives, and changes in noninterestincome and noninterest expense, particularly gain from mortgage loans, loan servicing fees and theamortization of MSR. Our interest rate risk arises because assets and liabilities reprice, mature, prepay ordecay at different times or in accordance with different indices as market interest rates change.
Types of Interest Rate Risk
We are exposed to different types of interest rate risks. These include lag, repricing, basis,prepayment, lifetime cap and volatility risk.
57

Lag/Repricing Risk
Lag risk results from the inherent timing difference between the repricing of adjustable-rate assetsand liabilities. Repricing risk is caused by the mismatch in the maturities between assets and liabilities. Forexample, if our assets reprice slower than our liabilities, the effect of this timing difference, or ‘‘lag,’’ will befavorable during a period of declining interest rates and unfavorable during a period of rising interestrates. Lag/repricing risk can produce short-term volatility in net interest income during periods of interestrate movements even though the effect of this lag generally balances out over time.
Basis Risk
Basis risk occurs when assets and liabilities have similar repricing frequencies but are tied to differentmarket interest rate indices.
Prepayment Risk
Prepayment risk results from the ability of customers to pay off their loans prior to maturity.Generally, prepayments increase in falling interest rate environments and decrease in rising interest rateenvironments.
Lifetime Cap Risk
The lifetime interest rate caps on adjustable-rate loans limits, or ‘‘caps,’’ the interest rate at acontractually determined level. In periods of dramatically rising rates, adjustable-rate loans that havereached lifetime caps will no longer reprice upward.
Volatility Risk
Volatility risk is the change to the fair value of an option, or a fixed income instrument containingoptions (such as mortgages) from changes in the implied market level of future volatility (‘‘impliedvolatility’’). Implied volatility is a key determinant of option value with higher volatility generally increasingoption value and lower volatility generally decreasing option value. Mortgage loans generally containembedded written options so increases in volatility generally decreases their value and decreases involatility generally increases their value.
MSR Risk Management
We manage potential impairment in the fair value of MSR and increased amortization levels of MSRthrough a comprehensive risk management program. Our intent is to offset the changes in fair value andamortization levels of MSR with changes in the fair value of risk management instruments. The riskmanagement instruments include interest rate contracts, forward purchase commitments andavailable-for-sale securities.
The available-for-sale securities generally consist of fixed-rate debt securities, such as U.S.Government and agency obligations and mortgage-backed securities, including principal-only strips. Theinterest rate contracts typically consist of interest rate swaps, interest rate swaptions, interest rate floorsand forward commitments to purchase mortgage-backed securities. These forward purchase commitmentsgenerally consist of agreements to purchase 15- and 30-year fixed-rate mortgage-backed securities. Fromtime to time, we may choose to embed interest rate contracts into our borrowing instruments, such asrepurchase agreements.
As derivatives, the interest rate swaps, interest rate swaptions, stand alone interest rate floors andforward commitments are marked-to-market through earnings. Changes in the fair value of MSR riskmanagement instruments are recorded as components of noninterest income.
58

We measure on a daily basis the fair value and risk profile of the MSR and, when appropriate, adjuston a daily basis the instruments we use to manage MSR fair value changes. The fair value of MSR isprimarily affected by changes in prepayments that result from shifts in mortgage rates. Changes in thebehavior of how MSR risk management instruments respond to changes in interest rates vary based on thespecific instrument. The difference in market indices between the MSR and the risk managementinstruments results in basis risk. For example, changes in the fair value of interest rate swaps are driven byshifts in interest rate swap rates while the fair value of U.S. Treasury bonds is based on changes in U.S.Treasury rates. Mortgage rates may move more or less than the rates on Treasury bonds or interest rateswaps. This could result in a change in the fair value of the MSR that differs from the change in fair valueof the MSR risk management instruments.
Additionally, changes in long-term rates impact the fair value and the amortization rate of MSR. Thefair value of MSR decreases and the amortization rate increases in a declining long-term interest rateenvironment due to the higher prepayment activity, resulting in the potential for impairment and areduction in net loan servicing income. During periods of rising long-term interest rates, the amortizationrate of MSR decreases and the fair value of MSR increases, resulting in the potential recovery of the MSRvaluation allowance and an increase in net loan servicing income. The timing and amount of any potentialMSR recovery cannot be predicted with absolute precision because of its dependency on the timing andmagnitude of future interest rate increases and the amount of the valuation allowance within each interestrate strata of our loans serviced for others portfolio at the time of the increase.
We manage the MSR daily against our risk tolerance limits and adjust the mix of instruments used tomanage MSR fair value changes as interest rates and market conditions warrant. The objective is tomaintain an efficient and fairly liquid mix as well as a diverse portfolio of risk management instrumentswith maturity ranges that correspond well to the anticipated behavior of the MSR. The mix of instrumentswe use to manage MSR fair value changes is predicated, in part, on the requirement that we account forMSR at the lower of cost or market value, whereby each interest rate stratum within our servicing portfoliois recorded at the lower of its aggregate fair value or its aggregate amortized cost. This could have resultedin increases in the fair value of MSR that are not marked-to-market through earnings. The Company ispoised to apply fair value hedge accounting treatment, as prescribed by Statement No. 133, to a significantportion of its mortgage servicing assets. For that portion which qualifies for hedge accounting treatment,all changes in fair value to the MSR, including situations when the fair value is higher than amortized cost,will be recorded through earnings. We believe this overall risk management strategy is the most efficientapproach to managing MSR fair value risk.
We also manage the size and risk profile of the MSR asset. Depending on market conditions and ourdesire to expand customer relationships, we may periodically sell or purchase additional servicing. We alsomay structure loan sales to control the size of the MSR asset. Our net income could be adversely affected ifwe are unable to effectively implement, execute or manage this strategy.
Other Mortgage Banking Risk Management
We also manage the risks associated with our mortgage warehouse and pipeline. The mortgagewarehouse consists of funded loans, which are primarily fixed-rate home mortgages to be sold in thesecondary market. The pipeline consists of commitments to originate or purchase fixed-rate and, to a lesserdegree, adjustable-rate home loans to be sold in the secondary market. The risk associated with themortgage pipeline and warehouse is the potential change in interest rates between the time the customerlocks in the rate on the loan and the time the loan is sold. Generally, loans in the mortgage warehouse aresold within 60 to 120 days after the initial recognition of the rate lock commitment.
We measure the risk profile of the mortgage warehouse and pipeline daily against our established risktolerance limits. As needed to manage the warehouse and pipeline risk, we execute forward salescommitments, interest rate contracts, mortgage option contracts and interest rate futures. A forward sales
59
commitment protects us in a rising interest rate environment, since the sales price and delivery date arealready established. A forward sales commitment is different, however, from an option contract in that weare obligated to deliver the loan to the third party on the agreed-upon future date. We also estimate thefallout factor, which represents the percentage of loans that are not expected to be funded, whendetermining the appropriate amount of our pipeline and warehouse risk management instruments.
Asset/Liability Risk Management
The asset/liability risk management process oversees the aggregate risk profile of the consolidatedCompany. Asset/liability risk analysis combines the MSR and Other Mortgage Banking activities withsubstantially all the other remaining interest rate risk positions inherent in the Company’s operations.
To analyze net income sensitivity, we project net income over a twelve month horizon based onparallel shifts in the yield curve. Management also employs other analyses and interest rate scenarios toevaluate interest rate risk. For example, we project net income and net interest income under a variety ofinterest rate scenarios, including non-parallel shifts in the yield curve and more extreme non-parallel risingand falling rate environments. These scenarios also capture the net income and net interest incomesensitivity due to changes in the slope of the yield curve and changes in the spread between Treasury andLIBOR rates. Additionally, management measures the sensitivity of asset and liability fair value changes tochanges in interest rates to analyze risk exposure over longer periods of time.
The projection of the sensitivity of net income requires numerous behavioral assumptions.Prepayment, decay rate (the estimated runoff of deposit accounts that do not have a stated maturity) andloan and deposit volume and mix projections are the most significant assumptions. Prepayments affect thesize of the balance sheet, which impacts net interest income, and is also a major factor in the valuation ofMSR. The decay rate assumptions also impact net interest income by altering the expected deposit mix andrates in various interest rate environments. The prepayment and decay rate assumptions reflectmanagement’s best estimate of future behavior. These assumptions are derived from internal and externalanalysis of customer behavior.
The sensitivity of new loan volume and mix to changes in market interest rate levels is also projected.Generally, we assume loan production increases in falling interest rate scenarios with an increasedproportion of salable fixed-rate production. We generally assume a reduction in total loan production inrising interest rate scenarios with a shift towards a greater proportion of adjustable-rate production, whichwe generally hold in our loan portfolio. The gain from mortgage loans also varies under different interestrate scenarios. Normally, the gain from mortgage loans increases in falling interest rate environmentsprimarily from high fixed-rate mortgage refinancing activity. Conversely, the gain from mortgage loanstends to decline when interest rates increase as salable loan volume declines and loan pricing becomesmore competitive.
In addition to gain from mortgage loans, the sensitivity of noninterest income and expense alsoinvolves estimates. The impairment and recovery of MSR is the most significant element of sensitivity inthe projection of noninterest income. Management analyzes MSR on a daily basis and adjusts the riskmanagement instruments based on this daily analysis. The analysis also assumes that mortgage and interestrate swap spreads remain constant in all interest rate environments. Changes in these spreads could resultin significant changes in projected net income sensitivity.
The other components of noninterest income and expense, such as deposit and loan fees andexpenses, generally increase or decrease in conjunction with depositor and loan volumes. Loan servicingfees and the amortization of MSR are also dependent on prepayment expectations.
To manage interest rate sensitivity, management first utilizes the interest rate risk characteristics ofour balance sheet assets and liabilities to offset each other as much as possible. Balance sheet productshave a variety of risk profiles and sensitivities. Some of the components of our interest rate risk arecountercyclical. We may adjust the amount or mix of risk management instruments based on thecountercyclical behavior of our balance sheet products.
60

The slope of the yield curve, current interest rate conditions and the speed of changes in interest ratesaffect our sensitivity to changes in interest rates. Our deposits and borrowings typically reprice faster thanour mortgage loans and securities. In addition, a lag effect is inherent in our adjustable-rate loans andmortgage-backed securities indexed to the 12-month average of the annual yields on actively traded U.S.Treasury securities adjusted to a constant maturity of one year (‘‘MTA’’) and to the 11th District FHLBmonthly weighted average cost of funds index (‘‘COFI’’).
In periods of rising interest rates, the net interest margin normally contracts since the repricing periodof liabilities is shorter than the repricing period of assets. Also, in periods of relatively high interest ratesthe lifetime cap feature on adjustable-rate loan products may adversely impact net interest income.Typically, the lifetime cap is 300 to 500 basis points above the fully indexed initial rate. The lifetime caps onour existing loan and mortgage-backed security portfolios would not have a material adverse effect on netinterest income unless interest rates increased substantially from current levels. The net interest margingenerally expands in periods of falling interest rates as borrowing costs reprice downward faster than assetyields.
When the countercyclical behavior inherent in portions of our balance sheet composition do not resultin an acceptable risk profile, management utilizes investment securities and interest rate contracts tomitigate this situation. The interest rate contracts used for this purpose are classified as asset/liability riskmanagement instruments. These contracts are often used to modify the repricing period of our interest-bearing funding sources with the intention of reducing the volatility of changes in net interest income. Thetypes of contracts used for this purpose consist of interest rate swaps, interest rate corridors, interest rateswaptions and certain derivatives that are embedded in borrowings. We also use receive-fixed swaps as partof our asset/liability risk management strategy to help us modify the repricing characteristics of certainlong-term liabilities to match those of our assets. Typically, these are swaps of long-term fixed-rate debt toa short-term adjustable-rate which more closely resembles our asset repricing characteristics.
January 1, 2004 and January 1, 2003 Sensitivity Comparison
The table below indicates the sensitivity of net income and net interest income to interest ratemovements. The comparative scenarios assume a parallel shift in the yield curve with interest rates rising200 basis points in even quarterly increments over the twelve month periods ending December 31, 2004and December 31, 2003 and interest rates decreasing by 50 basis points in even quarterly increments overthe first six months of the twelve month periods. The net income and net interest income simulationsperformed for the one year period beginning January 1, 2004 include the effects of securities that were soldduring the first quarter of 2004, which had the effect of mitigating both sensitivity measurements. No otheractions were taken after December 31, 2003 that would materially change the sensitivities shown in thetable. The projected net income and net interest income profile may not be realized and may not bepresent for non-parallel shifts in the yield curve or changes in the spreads between mortgage, Treasury andLIBOR rates.
Gradual Change in Rates
�50 basis points +200 basis points
Net income change for the one-year period beginning:January 1, 2004 . . . . . . . . . . . . . . . . . . . . . . . . . . . . . . . . . . . . . . 2.45% (1.96)%January 1, 2003 . . . . . . . . . . . . . . . . . . . . . . . . . . . . . . . . . . . . . . 5.24 3.98
Net interest income change for the one-year period beginning:January 1, 2004 . . . . . . . . . . . . . . . . . . . . . . . . . . . . . . . . . . . . . . 3.01 (2.57)January 1, 2003 . . . . . . . . . . . . . . . . . . . . . . . . . . . . . . . . . . . . . . 2.32 (5.91)
The change in the profile of the MSR and related hedges occurred due to the substantial prepaymentactivity that occurred throughout 2003. This prepayment activity caused a significant decline in theweighted average rate paid on the loans underlying the MSR; which, in turn, significantly altered the riskprofile of the MSR (since the rate paid on the underlying loan is a primary driver of the prepayment risk of
61

the loan). The higher long term rates at year end 2003 compared to year end 2002 additionally affected therisk profile of the MSR.
Net interest income sensitivity changed since year end 2002 mainly due to changes to the assumptionsconcerning the repricing of our Platinum checking accounts. Net income sensitivity changed primarily dueto changes in the profile of the MSR and related hedge instruments.
Maturity and Repricing Information
We use interest rate risk management contracts and available-for-sale securities as tools to manageour interest rate risk profile. The following tables summarize the key contractual terms associated withthese contracts and available-for-sale securities. Interest rate risk management contracts that areembedded within certain adjustable- and fixed-rate borrowings, while not accounted for as derivativesunder Statement No. 133, have been included in the tables since they also function as interest rate riskmanagement tools. Substantially all of the pay-fixed swaps, receive-fixed swaps, payor swaptions, floors andembedded derivatives at December 31, 2003 are indexed to three-month LIBOR.
The following estimated net fair value amounts from continuing operations have been determined bythe Company using available market information and appropriate valuation methodologies:
December 31, 2003
Maturity Range
Net TotalFair Notional After
Value Amount 2004 2005 2006 2007 2008 2008
(dollars in millions)Interest Rate Risk Management Contracts:
Asset/Liability Risk ManagementPay-fixed swaps: . . . . . . . . . . . . . . . . . . . . $(748)
Contractual maturity . . . . . . . . . . . . . . . . $21,894 $9,083 $3,288 $4,745 $3,700 $ 553 $ 525Weighted average pay rate . . . . . . . . . . . . 4.30% 3.97% 4.13% 4.38% 5.02% 5.00% 4.66%Weighted average receive rate . . . . . . . . . . 1.18% 1.17% 1.16% 1.22% 1.17% 1.15% 1.17%
Receive-fixed swaps: . . . . . . . . . . . . . . . . . 401Contractual maturity . . . . . . . . . . . . . . . . $ 6,440 $ 200 $ 180 $1,000 $ 750 $ 750 $3,560Weighted average pay rate . . . . . . . . . . . . 1.41% 1.38% 0.29% 1.18% 3.43% 1.15% 1.16%Weighted average receive rate . . . . . . . . . . 5.44% 6.75% 5.35% 6.81% 4.91% 3.71% 5.47%
Interest rate corridors: . . . . . . . . . . . . . . . . –Contractual maturity . . . . . . . . . . . . . . . . $ 254 $ 191 $ 63 – – – –Weighted average strike rate—long cap . . . . 7.60% 8.14% 5.94% – – – –Weighted average strike rate—short cap . . . 8.98% 9.48% 7.44% – – – –
Payor swaptions(1): . . . . . . . . . . . . . . . . . . 1Contractual maturity (option) . . . . . . . . . . $ 41 – $ 41 – – – –Weighted average strike rate . . . . . . . . . . . 5.89% – 5.89% – – – –Contractual maturity (swap) . . . . . . . . . . . – – – – – – $ 41Weighted average pay rate . . . . . . . . . . . . – – – – – – 5.89%
Embedded pay-fixed swaps: . . . . . . . . . . . . . (99)Contractual maturity . . . . . . . . . . . . . . . . $ 2,500 – – – $2,500 – –Weighted average pay rate . . . . . . . . . . . . 4.09% – – – 4.09% – –Weighted average receive rate . . . . . . . . . . 1.16% – – – 1.16% – –
Embedded caps: . . . . . . . . . . . . . . . . . . . . –Contractual maturity . . . . . . . . . . . . . . . . $ 500 $ 500 – – – – –Weighted average strike rate . . . . . . . . . . . 7.75% 7.75% – – – – –
Embedded payor swaptions(1): . . . . . . . . . . . –Contractual maturity (option) . . . . . . . . . . $ 500 $ 500 – – – – –Weighted average strike rate . . . . . . . . . . . 6.21% 6.21% – – – – –Contractual maturity (swap) . . . . . . . . . . . – – – – – – $ 500Weighted average pay rate . . . . . . . . . . . . – – – – – – 6.21%
Total asset/liability risk management . . . . $(445) $32,129
(1) Interest rate swaptions are only exercisable upon maturity.
(This table is continued on the next page.)
62

(Continued from the previous page.)December 31, 2003
Maturity Range
Net TotalFair Notional After
Value Amount 2004 2005 2006 2007 2008 2008
(dollars in millions)Interest Rate Risk Management Contracts:
Other Mortgage Banking Risk ManagementForward purchase commitments: . . . . . . . . $ 15
Contractual maturity . . . . . . . . . . . . . . $ 5,556 $ 5,556 – – – – –Weighted average price . . . . . . . . . . . . 100.88 100.88 – – – – –
Forward sales commitments: . . . . . . . . . . . (122)Contractual maturity . . . . . . . . . . . . . . $16,795 $16,795 – – – – –Weighted average price . . . . . . . . . . . . 101.08 101.08 – – – – –
Interest rate futures: . . . . . . . . . . . . . . . . –Contractual maturity . . . . . . . . . . . . . . $12,874 $ 1,851 $1,542 $2,255 $2,002 $5,224 –Weighted average price . . . . . . . . . . . . 96.17 98.34 96.79 95.64 94.81 94.40 –
Mortgage put options: . . . . . . . . . . . . . . . –Contractual maturity . . . . . . . . . . . . . . $ 100 $ 100 – – – – –Weighted average strike price . . . . . . . . 99.07 99.07 – – – – –
Receive-fixed swaps: . . . . . . . . . . . . . . . . 44Contractual maturity . . . . . . . . . . . . . . $ 1,950 – – – – $ 250 $1,700Weighted average pay rate . . . . . . . . . . 1.17% – – – – 1.17% 1.17%Weighted average receive rate . . . . . . . . 4.79% – – – – 3.90% 4.92%
Floors(2): . . . . . . . . . . . . . . . . . . . . . . . 1Contractual maturity . . . . . . . . . . . . . . $ 250 – $ 250 – – – –Weighted average strike rate . . . . . . . . . 1.56% – 1.56% – – – –
Payor swaptions: . . . . . . . . . . . . . . . . . . 52Contractual maturity (option) . . . . . . . . $ 3,195 $ 1,050 $2,145 – – – –Weighted average strike rate . . . . . . . . . 6.48% 5.94% 6.74% – – – –Contractual maturity (swap) . . . . . . . . . – – – – – – $3,195Weighted average pay rate . . . . . . . . . . – – – – – – 6.48%
Receiver swaptions: . . . . . . . . . . . . . . . . 8Contractual maturity (option) . . . . . . . . $ 300 $ 300 – – – – –Weighted average strike rate . . . . . . . . . 4.84% 4.84% – – – – –Contractual maturity (swap) . . . . . . . . . – – – – – – $ 300Weighted average receive rate . . . . . . . . – – – – – – 4.84%
Total other mortgage banking riskmanagement . . . . . . . . . . . . . . . . $ (2) $41,020
(2) These floors became effective during December 2003.
(This table is continued on the next page.)
63

(Continued from the previous page.)December 31, 2003
Maturity Range
Net TotalFair Notional After
Value Amount 2004 2005 2006 2007 2008 2008
(dollars in millions)Interest Rate Risk Management Contracts:
MSR Risk ManagementReceive-fixed swaps: . . . . . . . . . . . . . . $201
Contractual maturity . . . . . . . . . . . . . $ 30,588 $ 243 $10,500 $ 500 $1,800 $4,135 $13,410Weighted average pay rate . . . . . . . . . 1.33% 1.16% 1.35% 1.66% 2.77% 1.17% 1.17%Weighted average receive rate . . . . . . . 3.78% 5.34% 2.19% 4.18% 4.27% 3.76% 4.93%
Constant maturity mortgage swaps: . . . . . 1Contractual maturity . . . . . . . . . . . . . $ 100 – – – – $ 100 –Weighted average pay rate . . . . . . . . . 5.24% – – – – 5.24% –Weighted average receive rate . . . . . . . 5.41% – – – – 5.41% –
Payor swaptions: . . . . . . . . . . . . . . . . . 226Contractual maturity (option) . . . . . . . $ 13,800 $ 2,800 $ 6,000 $5,000 – – –Weighted average strike rate . . . . . . . . 7.12% 6.66% 7.32% 7.14% – – –Contractual maturity (swap) . . . . . . . . – – – – – – $13,800Weighted average pay rate . . . . . . . . . – – – – – – 7.12%
Forward purchase commitments: . . . . . . . 241Contractual maturity . . . . . . . . . . . . . $ 20,935 $20,935 – – – – –Weighted average price . . . . . . . . . . . 98.52 98.52 – – – – –
Total MSR risk management . . . . . . $669 $ 65,423
Total interest rate risk managementcontracts . . . . . . . . . . . . . . . . $222 $138,572
December 31, 2003
NetAmortized Unrealized
Cost Gain/Loss Fair Value
(in millions)Available-For-Sale Securities:
MSR Risk ManagementMortgage-backed securities(1):
U.S. Government and agency . . . . . . . . . . . . . . . . . . . . . . . . . . . . . . . . . $ 486 $ (14) $ 472Investment securities(1):
U.S. Government and agency . . . . . . . . . . . . . . . . . . . . . . . . . . . . . . . . . 6,275 (156) 6,119
Total MSR risk management . . . . . . . . . . . . . . . . . . . . . . . . . . . . . . . . $6,761 $(170) $6,591
(1) Mortgage-backed securities and investment securities mature after 2008.
64

December 31, 2002
Maturity Range
Net TotalFair Notional After
Value Amount 2003 2004 2005 2006 2007 2007
(dollars in millions)Interest Rate Risk Management Contracts:
Asset/Liability Risk ManagementPay-fixed swaps: . . . . . . . . . . . . . . . . . . . . . . . . . . $(1,151)
Contractual maturity . . . . . . . . . . . . . . . . . . . . . . $29,842 $ 8,416 $8,834 $3,310 $4,709 $3,700 $ 873Weighted average pay rate . . . . . . . . . . . . . . . . . . 3.93% 2.92% 4.03% 4.13% 4.39% 5.02% 4.68%Weighted average receive rate . . . . . . . . . . . . . . . . 1.56% 1.56% 1.53% 1.56% 1.58% 1.66% 1.37%
Receive-fixed swaps: . . . . . . . . . . . . . . . . . . . . . . . 564Contractual maturity . . . . . . . . . . . . . . . . . . . . . . $ 5,555 $ 825 $ 200 $ 180 $1,000 – $3,350Weighted average pay rate . . . . . . . . . . . . . . . . . . 1.41% 1.21% 1.65% 0.46% 1.40% – 1.49%Weighted average receive rate . . . . . . . . . . . . . . . . 5.83% 5.40% 6.75% 5.35% 6.81% – 5.62%
Interest rate caps: . . . . . . . . . . . . . . . . . . . . . . . . . –Contractual maturity . . . . . . . . . . . . . . . . . . . . . . $ 181 $ 181 – – – – –Weighted average strike rate . . . . . . . . . . . . . . . . . 7.13% 7.13% – – – – –
Interest rate corridors: . . . . . . . . . . . . . . . . . . . . . . –Contractual maturity . . . . . . . . . . . . . . . . . . . . . . $ 345 $ 90 $ 191 $ 64 – – –Weighted average strike rate—long cap . . . . . . . . . . 7.86% 8.63% 8.14% 5.94% – – –Weighted average strike rate—short cap . . . . . . . . . 9.11% 9.50% 9.48% 7.44% – – –
Payor swaptions(1): . . . . . . . . . . . . . . . . . . . . . . . . . –Contractual maturity (option) . . . . . . . . . . . . . . . . $ 5,000 $ 5,000 – – – – –Weighted average strike rate . . . . . . . . . . . . . . . . . 6.12% 6.12% – – – – –Contractual maturity (swap) . . . . . . . . . . . . . . . . . – – – – $1,000 $ 750 $3,250Weighted average pay rate . . . . . . . . . . . . . . . . . . – – – – 6.05% 6.26% 6.11%
Embedded pay-fixed swaps: . . . . . . . . . . . . . . . . . . . (207)Contractual maturity . . . . . . . . . . . . . . . . . . . . . . $ 2,750 – – – – $2,750 –Weighted average pay rate . . . . . . . . . . . . . . . . . . 4.73% – – – – 4.73% –Weighted average receive rate . . . . . . . . . . . . . . . . 1.74% – – – – 1.74% –
Embedded caps: . . . . . . . . . . . . . . . . . . . . . . . . . . –Contractual maturity . . . . . . . . . . . . . . . . . . . . . . $ 641 $ 141 $ 500 – – – –Weighted average strike rate . . . . . . . . . . . . . . . . . 7.64% 7.25% 7.75% – – – –
Embedded payor swaptions(1): . . . . . . . . . . . . . . . . . 4Contractual maturity (option) . . . . . . . . . . . . . . . . $ 6,400 $ 5,900 $ 500 – – – –Weighted average strike rate . . . . . . . . . . . . . . . . . 6.14% 6.13% 6.21% – – – –Contractual maturity (swap) . . . . . . . . . . . . . . . . . – – – – $3,750 – $2,650Weighted average pay rate . . . . . . . . . . . . . . . . . . – – – – 5.99% – 6.34%
Total asset/liability risk management . . . . . . . . . . $ (790) $50,714Other Mortgage Banking Risk Management
Forward purchase commitments: . . . . . . . . . . . . . . . . $ 101Contractual maturity . . . . . . . . . . . . . . . . . . . . . . $10,193 $10,193 – – – – –Weighted average price . . . . . . . . . . . . . . . . . . . . 102.38 102.38 – – – – –
Forward sales commitments: . . . . . . . . . . . . . . . . . . (662)Contractual maturity . . . . . . . . . . . . . . . . . . . . . . $41,238 $41,238 – – – – –Weighted average price . . . . . . . . . . . . . . . . . . . . 102.34 102.34 – – – – –
Mortgage put options: . . . . . . . . . . . . . . . . . . . . . . 7Contractual maturity . . . . . . . . . . . . . . . . . . . . . . $ 7,150 $ 7,150 – – – – –Weighted average strike price . . . . . . . . . . . . . . . . 99.28 99.28 – – – – –
Total other mortgage banking risk management . . . $ (554) $58,581
(1) Interest rate swaptions are only exercisable upon maturity.
(This table is continued on the next page.)
65

(Continued from the previous page.)
December 31, 2002
Maturity Range
Net TotalFair Notional After
Value Amount 2003 2004 2005 2006 2007 2007
(dollars in millions)Interest Rate Risk Management Contracts:
MSR Risk ManagementPay-fixed swaps: . . . . . . . . . . . . . . . . . . . . . . . . . . . $ (50)
Contractual maturity . . . . . . . . . . . . . . . . . . . . . . . $ 2,903 – – – – $1,950 $ 953Weighted average pay rate . . . . . . . . . . . . . . . . . . . 3.77% – – – – 3.41% 4.52%Weighted average receive rate . . . . . . . . . . . . . . . . . 1.41% – – – – 1.40% 1.42%
Receive-fixed swaps: . . . . . . . . . . . . . . . . . . . . . . . . . 2,176Contractual maturity . . . . . . . . . . . . . . . . . . . . . . . $ 17,915 – $ 561 $ 500 $ 700 $1,250 $14,904Weighted average pay rate . . . . . . . . . . . . . . . . . . . 1.57% – 1.80% 1.41% 1.42% 1.50% 1.58%Weighted average receive rate . . . . . . . . . . . . . . . . . 5.65% – 4.35% 4.54% 5.31% 4.33% 5.86%
Floors(2): . . . . . . . . . . . . . . . . . . . . . . . . . . . . . . . . 249Contractual maturity . . . . . . . . . . . . . . . . . . . . . . . $ 3,900 – – – – $3,900 –Weighted average strike rate . . . . . . . . . . . . . . . . . . 6.09% – – – – 6.09% –
Receiver swaptions: . . . . . . . . . . . . . . . . . . . . . . . . . 415Contractual maturity (option) . . . . . . . . . . . . . . . . . $ 4,000 $ 300 $ 800 $2,900 – – –Weighted average strike rate . . . . . . . . . . . . . . . . . . 6.21% 5.42% 5.73% 6.43% – – –Contractual maturity (swap) . . . . . . . . . . . . . . . . . . – – – – – – $ 4,000Weighted average receive rate . . . . . . . . . . . . . . . . . – – – – – – 6.21%
Forward purchase commitments: . . . . . . . . . . . . . . . . . 236Contractual maturity . . . . . . . . . . . . . . . . . . . . . . . $ 13,250 $13,250 – – – – –Weighted average price . . . . . . . . . . . . . . . . . . . . . 100.35 100.35 – – – – –
Total MSR risk management . . . . . . . . . . . . . . . . $3,026 $ 41,968
Total interest rate risk management contracts . . . . $1,682 $151,263
(2) At December 31, 2002, none of these floors were effective. These contracts became effective during May and July 2003.
December 31, 2002
NetAmortized Unrealized
Cost Gain/Loss Fair Value
(in millions)Available-For-Sale Securities:
MSR Risk ManagementMortgage-backed securities(1):
U.S. Government and agency . . . . . . . . . . . . . . . . . . . . . . . . . . . . . . . . . $ 583 $ 20 $ 603Investment securities(1):
U.S. Government and agency . . . . . . . . . . . . . . . . . . . . . . . . . . . . . . . . . 7,268 212 7,480
Total MSR risk management . . . . . . . . . . . . . . . . . . . . . . . . . . . . . . . . $7,851 $232 $8,083
(1) Mortgage-backed securities and investment securities mature after 2007.
Derivative Counterparty Credit Risk
Derivative financial instruments expose the Company to credit risk in the event of nonperformance bycounterparties to such agreements. This risk consists primarily of the termination value of agreementswhere the Company is in a favorable position. Credit risk related to derivative financial instruments isconsidered and provided for separately from the allowance for loan and lease losses. The Companymanages the credit risk associated with its various derivative agreements through counterparty creditreview, counterparty exposure limits and monitoring procedures. With the exception of forward purchase
66

and sale commitments, the Company obtains collateral from the counterparties for amounts in excess ofthe exposure limits and monitors its exposure and collateral requirements on a daily basis. The fair value ofcollateral received from a counterparty is continually monitored and the Company may request additionalcollateral from counterparties or return collateral pledged as deemed appropriate. The Company’sagreements generally include master netting agreements whereby the counterparties are entitled to settletheir positions ‘‘net.’’ At December 31, 2003 and 2002, the gross positive fair value of the Company’sderivative financial instruments was $1.34 billion and $3.76 billion. The Company’s master nettingagreements at December 31, 2003 and 2002 reduced the Company’s derivative counterparty credit risk by$646 million and $1.10 billion. The Company’s collateral against derivative financial instruments was $323million and $1.74 billion at December 31, 2003 and 2002.
Tax Contingency
From 1981 through 1985, Ahmanson acquired thrift institutions in six states through Federal Savingsand Loan Insurance Corporation-assisted transactions. The position was that assistance received from theFederal Savings and Loan Insurance Corporation included out-of-state branching rights valued atapproximately $532 million. Prior to December 31, 1998, Ahmanson had sold its deposit-taking businessesand abandoned such branching rights in five states, the first of which was Missouri in 1993. Our financialstatements do not contain any benefit related to our determination that we are entitled to deductions forthe amount of our tax bases in certain state branching rights when we sold our deposit-taking businesses inthose states, thereby abandoning such branching rights. Our position is that the tax bases result from thetax treatment of property received as assistance from the Federal Savings and Loan Insurance Corporationin conjunction with Federal Savings and Loan Insurance Corporation-assisted transactions. The potentialtax benefit related to these abandonments as of December 31, 2003 could approach $200 million.
The Internal Revenue Service has completed its examination of the Ahmanson federal income taxreturns for the years 1990 through 1998. The return for 1993 included the proposed adjustment related tothe abandonment of the Missouri branching rights. A tentative settlement offer has been issued by theAppeals Branch of the Internal Revenue Service. In accordance with accounting principles generallyaccepted in the United States of America, we do not believe it is appropriate at this time to reflect any taxbenefit for this matter in our Consolidated Financial Statements.
In addition, losses have been claimed for amounts capitalized as supervisory goodwill for acquisitionsmade by companies we acquired. The deductions claimed for these total $1.45 billion. Our position is thattax bases resulted from the tax treatment of property received as assistance from the Federal Savings andLoan Insurance Corporation in the same manner as branching rights, and that the tax bases becamedeductible losses by virtue of new regulatory standards imposed by Congress. The potential tax benefitrelated to these assets as of December 31, 2003 could approach $550 million.
The Internal Revenue Service has established a coordinated position and settlement guidelines inopposing the deductibility of the tax loss for supervisory goodwill. Further review by the Appeals Branch ofthe Internal Revenue Service is expected regarding the position and arguments for deduction of the lossesincurred. In accordance with accounting principles generally accepted in the United States of America, wedo not believe it is appropriate at this time to reflect any tax benefits for these matters in our ConsolidatedFinancial Statements.
Goodwill Litigation
On August 9, 1989, the Financial Institutions Reform, Recovery and Enforcement Act was enacted.Among other things, the Act raised the minimum capital requirements for savings institutions and requireda phase-out of the amount of supervisory goodwill that could be included in satisfying certain regulatorycapital requirements. The exclusion of supervisory goodwill from regulatory capital led many savingsinstitutions to either replace the lost capital by issuing new qualifying debt or equity securities or to reduceassets.
67
To date, trials have been concluded and opinions have been issued in a number of actions in theUnited States Court of Federal Claims in which savings institutions and investors in savings institutionssought damages from the U.S. Government based on breach of contract and other theories. Generally, incases in which these opinions on the merits have been issued by the federal claims court, either theplaintiff(s), the defendant (U.S. Government), or both the plaintiff(s) and the defendant, have opted toappeal the federal claims court’s decision. Of those appeals, some are now pending before the UnitedStates Court of Appeals for the Federal Circuit and others have been decided. Generally, the appeals haveresulted in the cases being remanded to the federal claims court for further trial proceedings. In one case,California Federal Bank v. United States, the plaintiff petitioned and the defendant cross petitioned theUnited States Supreme Court for a writ of certiorari, both of which were denied.
Home Savings
WMBFA, as successor to Home Savings, has continued to pursue a favorable outcome in the lawsuitfiled by Home Savings in September 1992 against the U.S. Government for damages from the exclusionfrom regulatory capital of supervisory goodwill resulting from Home Savings’ acquisitions of savingsinstitutions in Florida, Missouri, Texas, Illinois, and Ohio, and of Century Federal Savings of New York,over the period from 1981 to 1985.
In the Home Savings goodwill litigation, Home Savings and Ahmanson (the parent of Home Savingsprior to its acquisition by WMBFA) alleged breaches of contract as well as certain other claims. All claimsother than the breach of contract claims have been dismissed by the federal claims court, and proceedingsto adjudicate the breach of contract claims were bifurcated into two stages. In the first stage of theproceedings which was concluded in May 2001, the federal claims court held the government to be liable indamages for the breaches of contract alleged by Home Savings and Ahmanson. In the second stage of theproceedings, the court sought to fix the amount of damages, if any, to which WMBFA was entitled incompensation for the breaches of contract. After holding a three-week trial in February 2003, the court onSeptember 3, 2003 entered judgment in favor of Home Savings and Ahmanson and awarded damages ofapproximately $134 million, which has not been recorded as of December 31, 2003.
The United States has sought review of this judgment of both liability and damages by the Court ofAppeals. As a result of this review, the Court of Appeals could uphold the judgment of the federal claimscourt or could reverse part or all of the judgment resulting in a reduction in the amount of damages towhich WMBFA is entitled or a determination that WMBFA is entitled to no damages. After the Court ofAppeals completes its review, the government, or WMBFA, or both may seek further review by the UnitedStates Supreme Court, and WMBFA will become entitled to payment of any portion of the damages thatultimately may be affirmed only after all such appeals have been exhausted or the period of time in whichappeals may be sought has expired without any appeal being filed. Moreover, the courts could hold thatWMBFA is not entitled to receive interest on any principal amount of the judgment that ultimatelybecomes due.
American Savings Bank, F.A.
In December 1992, American Savings Bank, Keystone Holdings and certain related parties brought alawsuit against the U.S. Government, alleging, among other things, that in connection with the acquisitionof American Savings Bank they entered into a contract with agencies of the United States and that the U.S.Government breached that contract. As a result of the Keystone acquisition, we succeeded to all of therights of American Savings Bank, Keystone Holdings and such related parties in such litigation and willreceive any recovery from the litigation.
In connection with the Keystone acquisition, we placed 8 million shares of our common stock into anescrow. As of December 19, 2002, as a result of stock splits, there were 18 million shares in the escrow.Under the escrow arrangement, upon our receipt of net cash proceeds from a judgment in or settlement ofthe litigation, all or part of the escrow shares were to be released, 64.9% to investors in Keystone Holdings
68

or their assigns, and 35.1% to the FDIC as manager of the Federal Savings and Loan InsuranceCorporation Resolution Fund or its assigns. The number of escrow shares to be released was to be equal tothe case proceeds, reduced by certain tax and litigation-related costs and expenses, divided by $18.4944.The escrow would by its terms automatically expire on December 20, 2002, absent the occurrence ofcertain circumstances that would extend it.
In December, 2002, we contended that these circumstances had not occurred and we notified theescrow agent that the escrow had expired. Accordingly, we instructed the escrow agent to return to us the18 million shares of our common stock held in escrow, together with the dividends paid on those sharesand the interest earned on the cash while in escrow. The Keystone Holdings’ investors and the FDICobjected to such release, contending, among other matters, that the circumstances that would extend theescrow had occurred.
During much of 2003, we were in discussion with the Keystone Holdings’ investors and the FDICabout a possible resolution of our disagreement relating to the escrow. In the third quarter of 2003, theFDIC agreed to sell its contingent interest in the escrow to Escrow Partners, L.P., a partnership owned byinvestors in Keystone Holdings. In the fourth quarter, we resolved our disagreement with KeystoneHoldings and Escrow Partners by agreeing that six million shares of our common stock will remain in theescrow, together with the accumulated dividends and interest earned on the cash, under substantially thesame terms as set forth in the original escrow agreement, except that the expiration date of the escrow hasbeen extended to December 20, 2008, subject to certain limited extensions. As a result, in 2003, a total of12 million shares of common stock were returned to us from the escrow together with $73 million in cash.Approximately $68 million of that cash amount represented dividends paid on the returned shares, whichincluded $53 million paid prior to 2003 and $15 million paid during 2003. Also included was approximately$5 million in interest earned on the cash while in escrow.
Bank United Corp.
Prior to its acquisition, Bank United had a similar lawsuit against the U.S. Government. Securitiesrepresenting interests in this lawsuit were issued to Bank United shareholders. These securities, calledcontingent payment rights certificates, are currently traded on the NASDAQ Stock Market under thesymbol BNKUZ. We do not own a significant number of these securities.
Dime Bancorp, Inc.
In January 1995, Anchor Savings Bank FSB, filed suit against the U.S. Government for unspecifieddamages involving supervisory goodwill related to its acquisition of eight troubled savings institutions from1982-1985. Four of the acquisitions involved financial assistance from the U.S. Government, and four didnot. The Dime Savings Bank of New York, FSB acquired Anchor Savings Bank shortly after the case wasbrought and Dime Savings Bank assumed the rights under the litigation against the government. DimeBancorp distributed a Litigation Tracking Warrant� (an ‘‘LTW’’) for each share of its common stockoutstanding on December 22, 2000 to each of its shareholders on that date. In January 2002, Dime SavingsBank and Dime Bancorp merged into WMBFA and the Company. As a result of these mergers, weassumed the litigation against the government and the LTWs are now exercisable for shares of ourcommon stock. For additional information concerning the Dime goodwill litigation and the LTWs, see theCompany’s Current Report on Form 8-K, dated March 12, 2003, File No. 1-14667.
In a series of decisions issued in 2002, the Court of Federal Claims granted our summary judgmentmotions as to contract liability with respect to the four acquisitions involving financial assistance, butgranted the government’s motions with respect to the four unassisted acquisitions. On September 29, 2003,the Court denied the government’s motion for summary judgment with respect to the claim for theCompany’s lost profits, but granted the government’s motion with respect to the Company’s alternativeclaims for reliance damages and for the value of the lost supervisory goodwill. Trial on the lost profits claimis expected sometime in 2004.
69

Financial Statements and Supplementary Data
For financial statements, see Index to Consolidated Financial Statements on page 73.
Changes in and Disagreements with Accountants on Accounting and Financial Disclosure
None.
PART III
Items 10, 11, 12, 13 and 14 are incorporated by reference from our definitive proxy statement issued inconjunction with our Annual Meeting of Shareholders to be held April 20, 2004, except ‘‘EquityCompensation Plans Information’’ of Item 12, which is disclosed below. Certain information regarding ourexecutive officers is set forth in ‘‘Business—Executive Officers.’’
Equity Compensation Plans Information
The following table sets forth information regarding the Common Stock that may be issued upon theexercise of options, warrants and other rights granted to employees, directors or consultants under all ofthe Company’s existing equity compensation plans, as of December 31, 2003.
(a) (b) (c)
Number of securitiesremaining available for
Number of securities Weighted-average issuance under equityto be issued upon exercise price of compensation plans
exercise of outstanding options, (excluding securitiesoutstanding options, warrants and rights reflected in
Plan Category warrants and rights (in dollars) column (a))
Equity compensation plans approved bysecurity holders . . . . . . . . . . . . . . . . . 42,290,572 $32.95 37,551,678(2)(3)(4)
Equity compensation plans not approvedby security holders . . . . . . . . . . . . . . . 10,176,185(1) 36.20(1) 1,607,663(5)
Total . . . . . . . . . . . . . . . . . . . . . . 52,466,757 33.58 39,159,341
(1) Represents WAMU Shares Stock Option Plan grants approved by the Company’s Board of Directors. Does not include stockoptions that were assumed in connection with the Company’s acquisition of certain companies. The assumed options are for thepurchase of 2,615,378 shares of Common Stock and have a weighted-average exercise price of $17.47 per share. In the event thatany assumed option is not exercised, no further option to purchase shares of Common Stock will be issued in place of suchunexercised option.
(2) Includes 3,355,062 shares of Common Stock remaining available for purchase under the Company’s Amended and Restated 2002Employee Stock Purchase Plan and 32,154,546 shares of Common Stock remaining available for issuance under the 2003 EquityIncentive Plan (‘‘2003 EIP’’).
(3) The 2003 EIP provides that each of the Company’s nonemployee directors who is a nonemployee director on the third Tuesdayof each December receives an automatic stock option grant to purchase 5,000 shares of Common Stock (as adjusted inconnection with a stock split). See Note 20 to the Consolidated Financial Statements—‘‘Stock-Based Compensation Plans andShareholder Rights Plans.’’
(4) Under the Company’s 2003 EIP, the Company may grant restricted stock or stock units, including performance shares. SeeNote 20 to the Consolidated Financial Statements—‘‘Stock-Based Compensation Plans and Shareholder Rights Plan.’’
(5) Includes shares cancelled and available for issuance under the WAMU Shares Stock Option Plans.
Non-Shareholder Approved Plan
WAMU Shares Stock Option Plans
From time to time, the Board of Directors approves grants of nonqualified stock options to certaingroups of employees. The grants have been made pursuant to a series of plans, collectively known as‘‘WAMU Shares.’’ In 1997, the Board of Directors approved a plan under which eligible employees weregranted nonqualified options to purchase the Company’s common stock. On December 15, 1998, the
70

Board adopted a new plan to grant additional nonqualified stock options to eligible employees (‘‘1999WAMU Shares’’). On February 13, 2001, the Board adopted a third plan and granted nonqualified optionsto eligible employees (‘‘2001 WAMU Shares’’). On September 17, 2002, the Board amended the 2001WAMU Shares Plan to provide for an additional grant of nonqualified options to eligible employeeseffective September 3, 2002. The aggregate number of shares authorized by the Board of Directors forgrants under the WAMU Shares Plans was 14,511,900. On October 16, 2002, the Board amended the 1999WAMU Shares and the 2001 WAMU Shares plans to allow grants to a broader group of employees,including management, so that some of the authorized but unissued options could be granted to eligibleemployees as part of the annual grant in December 2002. Generally, eligible full-time and part-timeemployees on the award dates were granted options to purchase shares of Washington Mutual commonstock. The exercise price for all grants is the fair market value of Washington Mutual’s common stock ondesignated dates, and all options vest one to three years after the award date and expire five to ten yearsfrom the award date.
PART IV
Exhibits, Financial Statement Schedules and Reports on Form 8-K
(a) (1) Financial Statements
See Index to Consolidated Financial Statements on page 73.
(2) Financial Statement Schedules
All financial statement schedules are omitted because they are not applicable or not required, orbecause the required information is included in the Consolidated Financial Statements or the Notesthereto.
(b) Reports on Form 8-K:
Washington Mutual filed the following reports on Form 8-K during the fourth quarter of 2003:
1. Report filed on October 21, 2003. Items included: Item 7. Exhibits, and Item 12. Results ofOperations and Financial Condition. The report included a press release announcing Washington Mutual’sthird quarter 2003 financial results and unaudited Consolidated Financial Statements for the three andnine months ended September 30, 2003.
2. Report filed on October 27, 2003. Items included: Item 7. Financial Statements, Pro FormaFinancial Information and Exhibits. The report included an Underwriting Agreement dated October 27,2003 between Washington Mutual, Inc. and The Bank of New York, as trustee, for the Company to issueSenior Debt Securities totaling $400 million bearing a floating rate and due on November 3, 2005,$250 million bearing a fixed rate of 2.40% and due on November 3, 2005 and $1 billion bearing a fixed rateof 4.00% and due January 15, 2009.
3. Report filed on November 13, 2003. Items included: Item 9. Regulation FD Disclosure. Thereport included a press release announcing that its Form 10-Q for the period ended September 30, 2003contained the correction of an error in its previous accounting for certain components of bank owned lifeinsurance.
4. Report filed on December 9, 2003. Items included: Item 7. Exhibit, and Item 9. Regulation FDDisclosure. The report included a press release giving revised earnings guidance for 2003 and 2004.
(c) Exhibits:
The exhibits filed as part of this report and exhibits incorporated herein by reference to otherdocuments are listed in the Index of Exhibits to this Annual Report on Form 10-K/A (pages E-1 throughE-7).
71

SIGNATURES
Pursuant to the requirements of Section 13 or 15(d) of the Securities Exchange Act of 1934, theCompany has duly caused this report to be signed on its behalf by the undersigned, thereunto dulyauthorized on March 19, 2004.
WASHINGTON MUTUAL, INC.
/s/ THOMAS W. CASEY
Thomas W. CaseyExecutive Vice President and Chief Financial Officer(Principal Financial Officer)
72

Financial Statements and Supplementary Data
INDEX TO CONSOLIDATED FINANCIAL STATEMENTS
Page
Independent Auditors’ Report . . . . . . . . . . . . . . . . . . . . . . . . . . . . . . . . . . . . . . . . . . . . . . . . . 74Consolidated Statements of Income for the years ended December 31, 2003, 2002 and 2001
(Restated) . . . . . . . . . . . . . . . . . . . . . . . . . . . . . . . . . . . . . . . . . . . . . . . . . . . . . . . . . . . . . . 75Consolidated Statements of Financial Condition at December 31, 2003 and 2002 (Restated) . . . . 77Consolidated Statements of Stockholders’ Equity and Comprehensive Income for the years ended
December 31, 2003, 2002 and 2001 (Restated) . . . . . . . . . . . . . . . . . . . . . . . . . . . . . . . . . . . . 78Consolidated Statements of Cash Flows for the years ended December 31, 2003, 2002 and 2001
(Restated) . . . . . . . . . . . . . . . . . . . . . . . . . . . . . . . . . . . . . . . . . . . . . . . . . . . . . . . . . . . . . . 79Notes to Consolidated Financial Statements . . . . . . . . . . . . . . . . . . . . . . . . . . . . . . . . . . . . . . . 81Supplementary Data (Unaudited) . . . . . . . . . . . . . . . . . . . . . . . . . . . . . . . . . . . . . . . . . . . . . . . 151
73

12MAR200420435425
INDEPENDENT AUDITORS’ REPORT
To the Board of Directors and Shareholdersof Washington Mutual, Inc.:
We have audited the accompanying consolidated statements of financial condition of WashingtonMutual, Inc. and subsidiaries (the Company) as of December 31, 2003 and 2002, and the relatedconsolidated statements of income, stockholders’ equity and comprehensive income, and of cash flows foreach of the three years in the period ended December 31, 2003. These consolidated financial statementsare the responsibility of the Company’s management. Our responsibility is to express an opinion on theseconsolidated financial statements based on our audits.
We conducted our audits in accordance with auditing standards generally accepted in the UnitedStates of America. Those standards require that we plan and perform the audit to obtain reasonableassurance about whether the financial statements are free of material misstatement. An audit includesexamining, on a test basis, evidence supporting the amounts and disclosures in the financial statements. Anaudit also includes assessing the accounting principles used and significant estimates made bymanagement, as well as evaluating the overall financial statement presentation. We believe that our auditsprovide a reasonable basis for our opinion.
In our opinion, such consolidated financial statements present fairly, in all material respects, thefinancial position of the Company as of December 31, 2003 and 2002, and the results of its operations andits cash flows for each of the three years in the period ended December 31, 2003, in conformity withaccounting principles generally accepted in the United States of America.
As discussed in Note 1 to the consolidated financial statements, the Company adopted Statement ofFinancial Accounting Standards (SFAS) No. 142, Goodwill and Other Intangible Assets, on January 1, 2002;and SFAS No. 147, Acquisitions of Certain Financial Institutions, on October 1, 2002.
As discussed in Note 2 to the consolidated financial statements, the accompanying 2002 and 2001financial statements have been restated.
Seattle, WashingtonFebruary 16, 2004(March 19, 2004 as to the effects of the restatement discussed in Note 2(b))
74

WASHINGTON MUTUAL, INC. AND SUBSIDIARIES
CONSOLIDATED STATEMENTS OF INCOME
Year Ended December 31,
(Restated) (Restated)2003 2002 2001
(in millions, except per shareamounts)
Interest IncomeLoans held for sale . . . . . . . . . . . . . . . . . . . . . . . . . . . . . . . . . . . . . . . . . . . . $ 2,483 $ 1,917 $ 1,203Loans held in portfolio . . . . . . . . . . . . . . . . . . . . . . . . . . . . . . . . . . . . . . . . . 7,686 8,675 9,449Available-for-sale securities . . . . . . . . . . . . . . . . . . . . . . . . . . . . . . . . . . . . . . . 1,738 2,951 3,560Other interest and dividend income . . . . . . . . . . . . . . . . . . . . . . . . . . . . . . . . . 256 312 259
Total interest income . . . . . . . . . . . . . . . . . . . . . . . . . . . . . . . . . . . . . . . . . 12,163 13,855 14,471Interest Expense
Deposits . . . . . . . . . . . . . . . . . . . . . . . . . . . . . . . . . . . . . . . . . . . . . . . . . . . 2,165 2,661 3,081Borrowings . . . . . . . . . . . . . . . . . . . . . . . . . . . . . . . . . . . . . . . . . . . . . . . . . 2,369 3,065 4,898
Total interest expense . . . . . . . . . . . . . . . . . . . . . . . . . . . . . . . . . . . . . . . . . 4,534 5,726 7,979
Net interest income . . . . . . . . . . . . . . . . . . . . . . . . . . . . . . . . . . . . . . . . . . 7,629 8,129 6,492Provision for loan and lease losses . . . . . . . . . . . . . . . . . . . . . . . . . . . . . . . . . . 42 404 426
Net interest income after provision for loan and lease losses . . . . . . . . . . . . . . . . 7,587 7,725 6,066Noninterest Income
Home loan mortgage banking income (expense):Loan servicing fees . . . . . . . . . . . . . . . . . . . . . . . . . . . . . . . . . . . . . . . . . . 2,273 2,237 1,375Amortization of mortgage servicing rights . . . . . . . . . . . . . . . . . . . . . . . . . . . . (3,269) (2,616) (1,054)Mortgage servicing rights recovery (impairment) . . . . . . . . . . . . . . . . . . . . . . . . 712 (3,219) (1,701)Revaluation gain from derivatives . . . . . . . . . . . . . . . . . . . . . . . . . . . . . . . . . 338 2,517 –Net settlement income from certain interest-rate swaps . . . . . . . . . . . . . . . . . . . . 543 382 –Gain from mortgage loans . . . . . . . . . . . . . . . . . . . . . . . . . . . . . . . . . . . . . . 1,250 1,375 936Other home loan mortgage banking income, net . . . . . . . . . . . . . . . . . . . . . . . . 127 31 132
Total home loan mortgage banking income (expense) . . . . . . . . . . . . . . . . . . . 1,974 707 (312)Depositor and other retail banking fees . . . . . . . . . . . . . . . . . . . . . . . . . . . . . . . 1,818 1,634 1,290Securities fees and commissions . . . . . . . . . . . . . . . . . . . . . . . . . . . . . . . . . . . . 395 362 303Insurance income . . . . . . . . . . . . . . . . . . . . . . . . . . . . . . . . . . . . . . . . . . . . . 188 155 71Portfolio loan related income . . . . . . . . . . . . . . . . . . . . . . . . . . . . . . . . . . . . . 439 349 193Gain from other available-for-sale securities . . . . . . . . . . . . . . . . . . . . . . . . . . . . 676 768 600Gain (loss) on extinguishment of securities sold under agreements to repurchase . . . . . (129) 282 621Other income . . . . . . . . . . . . . . . . . . . . . . . . . . . . . . . . . . . . . . . . . . . . . . . 489 212 410
Total noninterest income . . . . . . . . . . . . . . . . . . . . . . . . . . . . . . . . . . . . 5,850 4,469 3,176Noninterest Expense
Compensation and benefits . . . . . . . . . . . . . . . . . . . . . . . . . . . . . . . . . . . . . . . 3,304 2,813 1,829Occupancy and equipment . . . . . . . . . . . . . . . . . . . . . . . . . . . . . . . . . . . . . . . 1,592 1,136 776Telecommunications and outsourced information services . . . . . . . . . . . . . . . . . . . . 554 507 436Depositor and other retail banking losses . . . . . . . . . . . . . . . . . . . . . . . . . . . . . . 201 204 144Amortization of goodwill . . . . . . . . . . . . . . . . . . . . . . . . . . . . . . . . . . . . . . . . – – 134Amortization of other intangible assets . . . . . . . . . . . . . . . . . . . . . . . . . . . . . . . 61 67 33Advertising and promotion . . . . . . . . . . . . . . . . . . . . . . . . . . . . . . . . . . . . . . . 278 234 176Professional fees . . . . . . . . . . . . . . . . . . . . . . . . . . . . . . . . . . . . . . . . . . . . . . 267 201 189Other expense . . . . . . . . . . . . . . . . . . . . . . . . . . . . . . . . . . . . . . . . . . . . . . . 1,151 1,026 699
Total noninterest expense . . . . . . . . . . . . . . . . . . . . . . . . . . . . . . . . . . . . . . . 7,408 6,188 4,416
Income from continuing operations before income taxes . . . . . . . . . . . . . . . . . . . . 6,029 6,006 4,826Income taxes . . . . . . . . . . . . . . . . . . . . . . . . . . . . . . . . . . . . . . . . . . . . . . . . 2,236 2,217 1,783
Income from continuing operations, net of taxes . . . . . . . . . . . . . . . . . . . . . . . . . . . 3,793 3,789 3,043
(This table is continued on the next page.)
See Notes to Consolidated Financial Statements.
75

WASHINGTON MUTUAL, INC. AND SUBSIDIARIES
CONSOLIDATED STATEMENTS OF INCOME (Continued)
(This table is continued from the previous page.)
Year Ended December 31,
(Restated) (Restated)2003 2002 2001
(in millions, except per shareamounts)
Discontinued OperationsIncome from discontinued operations . . . . . . . . . . . . . . . . . . . . . . . . . . . . . . . . 137 113 96Income taxes . . . . . . . . . . . . . . . . . . . . . . . . . . . . . . . . . . . . . . . . . . . . . . . . 50 41 35
Income from discontinued operations, net of taxes . . . . . . . . . . . . . . . . . . . . . . . . . . 87 72 61
Net Income . . . . . . . . . . . . . . . . . . . . . . . . . . . . . . . . . . . . . . . . . . . . . . . . . . $ 3,880 $ 3,861 $ 3,104
Net Income Attributable to Common Stock . . . . . . . . . . . . . . . . . . . . . . . . . . . . . . $ 3,880 $ 3,856 $ 3,097
Basic earnings per common share:Income from continuing operations . . . . . . . . . . . . . . . . . . . . . . . . . . . . . . . . . . $ 4.20 $ 4.01 $ 3.57Income from discontinued operations, net . . . . . . . . . . . . . . . . . . . . . . . . . . . . . 0.09 0.08 0.07
Net Income . . . . . . . . . . . . . . . . . . . . . . . . . . . . . . . . . . . . . . . . . . . . . . . . . 4.29 4.09 3.64
Diluted earnings per common share:Income from continuing operations . . . . . . . . . . . . . . . . . . . . . . . . . . . . . . . . . . $ 4.12 $ 3.94 $ 3.51Income from discontinued operations, net . . . . . . . . . . . . . . . . . . . . . . . . . . . . . 0.09 0.08 0.07
Net Income . . . . . . . . . . . . . . . . . . . . . . . . . . . . . . . . . . . . . . . . . . . . . . . . . 4.21 4.02 3.58
Dividends declared per common share . . . . . . . . . . . . . . . . . . . . . . . . . . . . . . . . . 1.40 1.06 0.90Basic weighted average number of common shares outstanding (in thousands) . . . . . . . . 903,666 943,905 850,245Diluted weighted average number of common shares outstanding (in thousands) . . . . . . . 921,757 960,152 864,658
See Notes to Consolidated Financial Statements.
76

WASHINGTON MUTUAL, INC. AND SUBSIDIARIES
CONSOLIDATED STATEMENTS OF FINANCIAL CONDITION
December 31,
(Restated)2003 2002
(dollars in millions)
AssetsCash and cash equivalents . . . . . . . . . . . . . . . . . . . . . . . . . . . . . . . . . . . . . . . $ 7,018 $ 7,084Federal funds sold and securities purchased under agreements to resell . . . . . . 19 2,015Available-for-sale securities, total amortized cost of $36,858 and $42,528:
Mortgage-backed securities (including assets pledged of $3,642 and $6,570) . 10,695 28,375Investment securities (including assets pledged of $19,353 and $10,679) . . . . 26,012 15,530
Total available-for-sale securities . . . . . . . . . . . . . . . . . . . . . . . . . . . . . 36,707 43,905Loans held for sale . . . . . . . . . . . . . . . . . . . . . . . . . . . . . . . . . . . . . . . . . . . . 20,343 38,782Loans held in portfolio . . . . . . . . . . . . . . . . . . . . . . . . . . . . . . . . . . . . . . . . . 175,644 143,869Allowance for loan and lease losses . . . . . . . . . . . . . . . . . . . . . . . . . . . . . . . . (1,250) (1,503)
Total loans held in portfolio, net of allowance for loan and lease losses . 174,394 142,366Investment in Federal Home Loan Banks . . . . . . . . . . . . . . . . . . . . . . . . . . . 3,462 3,703Mortgage servicing rights . . . . . . . . . . . . . . . . . . . . . . . . . . . . . . . . . . . . . . . 6,354 5,341Goodwill . . . . . . . . . . . . . . . . . . . . . . . . . . . . . . . . . . . . . . . . . . . . . . . . . . . 6,196 6,213Assets of discontinued operations . . . . . . . . . . . . . . . . . . . . . . . . . . . . . . . . . 4,184 3,864Other assets . . . . . . . . . . . . . . . . . . . . . . . . . . . . . . . . . . . . . . . . . . . . . . . . . 16,501 14,952
Total assets . . . . . . . . . . . . . . . . . . . . . . . . . . . . . . . . . . . . . . . . . . . . $275,178 $268,225
LiabilitiesDeposits:
Noninterest-bearing deposits . . . . . . . . . . . . . . . . . . . . . . . . . . . . . . . . . . . $ 29,968 $ 37,515Interest-bearing deposits . . . . . . . . . . . . . . . . . . . . . . . . . . . . . . . . . . . . . . 123,213 118,001
Total deposits . . . . . . . . . . . . . . . . . . . . . . . . . . . . . . . . . . . . . . . . . . . 153,181 155,516Federal funds purchased and commercial paper . . . . . . . . . . . . . . . . . . . . . . . 2,011 507Securities sold under agreements to repurchase . . . . . . . . . . . . . . . . . . . . . . . 28,333 16,717Advances from Federal Home Loan Banks . . . . . . . . . . . . . . . . . . . . . . . . . . 48,330 51,265Other borrowings . . . . . . . . . . . . . . . . . . . . . . . . . . . . . . . . . . . . . . . . . . . . . 15,483 14,712Liabilities of discontinued operations . . . . . . . . . . . . . . . . . . . . . . . . . . . . . . . 3,578 3,330Other liabilities . . . . . . . . . . . . . . . . . . . . . . . . . . . . . . . . . . . . . . . . . . . . . . 4,520 6,117
Total liabilities . . . . . . . . . . . . . . . . . . . . . . . . . . . . . . . . . . . . . . . . . . 255,436 248,164Stockholders’ Equity
Common stock, no par value: 1,600,000,000 shares authorized, 880,985,764 and944,046,787 shares issued and outstanding . . . . . . . . . . . . . . . . . . . . . . . . . – –
Capital surplus—common stock . . . . . . . . . . . . . . . . . . . . . . . . . . . . . . . . . . . 3,682 5,961Accumulated other comprehensive (loss) income . . . . . . . . . . . . . . . . . . . . . . (524) 175Retained earnings . . . . . . . . . . . . . . . . . . . . . . . . . . . . . . . . . . . . . . . . . . . . . 16,584 13,925
Total stockholders’ equity . . . . . . . . . . . . . . . . . . . . . . . . . . . . . . . . . . 19,742 20,061
Total liabilities and stockholders’ equity . . . . . . . . . . . . . . . . . . . . . . . . $275,178 $268,225
See Notes to Consolidated Financial Statements.
77

WASHINGTON MUTUAL, INC. AND SUBSIDIARIES
CONSOLIDATED STATEMENTS OF STOCKHOLDERS’ EQUITYAND COMPREHENSIVE INCOME
Capital AccumulatedNumber Surplus— Other
of Common Comprehensive RetainedShares Stock Income (Loss) Earnings Total
(in millions)BALANCE, December 31, 2000 (previously reported) . . 809.8 $1,425 $ (54) $ 8,795 $10,166
Restatement adjustment (see Note 2) . . . . . . . . . . . . – – – (28) (28)BALANCE, December 31, 2000 (restated) . . . . . . . . . . 809.8 1,425 (54) 8,767 10,138Comprehensive income:
Net income—2001 (restated) . . . . . . . . . . . . . . . . . . – – – 3,104 3,104Other comprehensive income (loss), net of tax:
Net unrealized loss from securities arising during theyear, net of reclassification adjustments . . . . . . . . . – – (191) – (191)
Net unrealized gain from cash flow hedginginstruments . . . . . . . . . . . . . . . . . . . . . . . . . . . . – – 3 – 3
Minimum pension liability adjustment . . . . . . . . . . . . – – (1) – (1)Total comprehensive income . . . . . . . . . . . . . . . . . . . 2,915Cash dividends declared on common stock . . . . . . . . . . – – – (774) (774)Cash dividends declared on redeemable preferred stock . – – – (7) (7)Common stock repurchased and retired . . . . . . . . . . . . (7.3) (231) – – (231)Common stock warrants issued, net of issuance costs . . . – 398 – – 398Common stock issued to acquire Bank United Corp. . . . 63.9 1,389 – – 1,389Common stock issued . . . . . . . . . . . . . . . . . . . . . . . . 6.7 197 – – 197BALANCE, December 31, 2001 (restated) . . . . . . . . . . 873.1 3,178 (243) 11,090 14,025Comprehensive income:
Net income—2002 (restated) . . . . . . . . . . . . . . . . . . – – – 3,861 3,861Other comprehensive income (loss), net of tax:
Net unrealized gain from securities arising duringthe year, net of reclassification adjustments . . . . . – – 1,123 – 1,123
Net unrealized loss from cash flow hedginginstruments . . . . . . . . . . . . . . . . . . . . . . . . . . – – (703) – (703)
Minimum pension liability adjustment . . . . . . . . . . – – (2) – (2)Total comprehensive income . . . . . . . . . . . . . . . . . . . 4,279Cash dividends declared on common stock . . . . . . . . . . – – – (1,021) (1,021)Cash dividends declared on redeemable preferred stock . – – – (5) (5)Common stock repurchased and retired . . . . . . . . . . . . (38.0) (1,303) – – (1,303)Common stock issued for acquisitions . . . . . . . . . . . . . 96.4 3,672 – – 3,672Fair value of Dime stock options . . . . . . . . . . . . . . . . – 90 – – 90Common stock issued to redeem preferred stock . . . . . . 4.3 102 – – 102Common stock issued . . . . . . . . . . . . . . . . . . . . . . . . 8.2 222 – – 222BALANCE, December 31, 2002 (restated) . . . . . . . . . . 944.0 5,961 175 13,925 20,061Comprehensive income:
Net income—2003 . . . . . . . . . . . . . . . . . . . . . . . . . – – – 3,880 3,880Other comprehensive income (loss), net of tax:
Net unrealized loss from securities arising during theyear, net of reclassification adjustments . . . . . . . . – – (965) – (965)
Net unrealized gain from cash flow hedginginstruments . . . . . . . . . . . . . . . . . . . . . . . . . . – – 270 – 270
Minimum pension liability adjustment . . . . . . . . . . – – (4) – (4)Total comprehensive income . . . . . . . . . . . . . . . . . . . 3,181Cash dividends declared on common stock . . . . . . . . . . – – – (1,274) (1,274)Cash dividends returned(1) . . . . . . . . . . . . . . . . . . . . . – – – 53 53Common stock repurchased and retired . . . . . . . . . . . . (65.9) (2,699) – – (2,699)Common stock returned from escrow . . . . . . . . . . . . . (12.0) – – – –Common stock issued . . . . . . . . . . . . . . . . . . . . . . . . 14.9 420 – – 420BALANCE, December 31, 2003 . . . . . . . . . . . . . . . . . 881.0 $3,682 $ (524) $16,584 $19,742
(1) Represents accumulated dividends on shares returned from escrow.
See Notes to Consolidated Financial Statements.
78

WASHINGTON MUTUAL, INC. AND SUBSIDIARIES
CONSOLIDATED STATEMENTS OF CASH FLOWS
Year Ended December 31,
(Restated) (Restated)2003 2002 2001
(in millions)
Cash Flows from Operating ActivitiesNet income . . . . . . . . . . . . . . . . . . . . . . . . . . . . . . . . . . . . . . . $ 3,880 $ 3,861 $ 3,104(Income) from discontinued operations, net of taxes . . . . . . . . . (87) (72) (61)
Income from continuing operations . . . . . . . . . . . . . . . . . . . . 3,793 3,789 3,043Adjustments to reconcile income from continuing operations tonet cash provided (used) by operating activities:Provision for loan and lease losses . . . . . . . . . . . . . . . . . . . . . 42 404 426Gain from mortgage loans . . . . . . . . . . . . . . . . . . . . . . . . . . . (1,250) (1,375) (936)Gain from securities . . . . . . . . . . . . . . . . . . . . . . . . . . . . . . . (996) (802) (717)Revaluation gain from derivatives . . . . . . . . . . . . . . . . . . . . . (338) (2,517) –Loss (gain) on extinguishment of securities sold under
agreements to repurchase . . . . . . . . . . . . . . . . . . . . . . . . . 129 (282) (621)Depreciation and amortization . . . . . . . . . . . . . . . . . . . . . . . . 3,864 3,197 1,620Mortgage servicing rights (recovery) impairment . . . . . . . . . . . (712) 3,219 1,701Stock dividends from Federal Home Loan Banks . . . . . . . . . . (113) (191) (216)Origination and purchases of loans held for sale, net of
principal payments . . . . . . . . . . . . . . . . . . . . . . . . . . . . . . (315,106) (228,199) (134,101)Proceeds from sales of loans held for sale . . . . . . . . . . . . . . . 324,999 220,856 118,389(Increase) decrease in other assets . . . . . . . . . . . . . . . . . . . . . (770) (695) 1,454(Decrease) increase in other liabilities . . . . . . . . . . . . . . . . . . (1,038) 2,457 (1,141)
Net cash provided (used) by operating activities . . . . . . . . . 12,504 (139) (11,099)Cash Flows from Investing Activities
Purchases of securities . . . . . . . . . . . . . . . . . . . . . . . . . . . . . . . (41,052) (54,197) (60,066)Proceeds from sales and maturities of mortgage-backed securities . . 12,740 8,929 20,202Proceeds from sales and maturities of other available-for-sale
securities . . . . . . . . . . . . . . . . . . . . . . . . . . . . . . . . . . . . . . . 28,425 65,811 31,614Principal payments on securities . . . . . . . . . . . . . . . . . . . . . . . . 9,422 9,056 11,830Purchases of Federal Home Loan Bank stock . . . . . . . . . . . . . . (336) (4) (8)Redemption of Federal Home Loan Bank stock . . . . . . . . . . . . . 719 798 –Proceeds from sale of mortgage servicing rights . . . . . . . . . . . . . 638 997 174Origination and purchases of loans held in portfolio . . . . . . . . . . (114,828) (76,777) (42,907)Principal payments on loans held in portfolio . . . . . . . . . . . . . . . 83,815 66,098 41,493Proceeds from sales of foreclosed assets . . . . . . . . . . . . . . . . . . 479 333 257Net decrease (increase) in federal funds sold and securities
purchased under resale agreements . . . . . . . . . . . . . . . . . . . . 1,996 466 (2,416)Net cash used for acquisitions . . . . . . . . . . . . . . . . . . . . . . . . . . – (3,185) (13,818)Purchases of premises and equipment, net . . . . . . . . . . . . . . . . . (1,053) (1,030) (746)Proceeds from sale of real estate held for investment . . . . . . . . . 149 – –Purchases of bank-owned life insurance . . . . . . . . . . . . . . . . . . . – (600) –
Net cash (used) provided by investing activities . . . . . . . . . . (18,886) 16,695 (14,391)
(The Consolidated Statements of Cash Flows are continued on the next page.)
See Notes to Consolidated Financial Statements.
79

WASHINGTON MUTUAL, INC. AND SUBSIDIARIES
CONSOLIDATED STATEMENTS OF CASH FLOWS (Continued)
(Continued from the previous page.)
Year Ended December 31,
(Restated) (Restated)2003 2002 2001
(in millions)
Cash Flows from Financing Activities(Decrease) increase in deposits . . . . . . . . . . . . . . . . . . . . . . . . . . (2,335) 33,400 19,463Increase (decrease) in short-term borrowings . . . . . . . . . . . . . . . . 17,440 (17,058) 24,448Proceeds from long-term borrowings . . . . . . . . . . . . . . . . . . . . . . . 10,761 34,672 11,484Repayments of long-term borrowings . . . . . . . . . . . . . . . . . . . . . . (13,087) (44,184) (24,304)Proceeds from advances from Federal Home Loan Banks . . . . . . . 91,973 35,827 135,015Repayments of advances from Federal Home Loan Banks . . . . . . . (94,885) (53,458) (139,255)Cash dividends paid on preferred and common stock . . . . . . . . . . . (1,274) (1,026) (781)Cash dividends returned . . . . . . . . . . . . . . . . . . . . . . . . . . . . . . . 68 – –Repurchase of common stock . . . . . . . . . . . . . . . . . . . . . . . . . . . . (2,699) (1,303) (231)Common stock warrants issued . . . . . . . . . . . . . . . . . . . . . . . . . . . – – 398Other . . . . . . . . . . . . . . . . . . . . . . . . . . . . . . . . . . . . . . . . . . . . . 354 200 169
Net cash provided (used) by financing activities . . . . . . . . . . . . . 6,316 (12,930) 26,406
(Decrease) increase in cash and cash equivalents . . . . . . . . . . . . (66) 3,626 916Cash and cash equivalents, beginning of year . . . . . . . . . . . . . . . 7,084 3,458 2,542
Cash and cash equivalents, end of year . . . . . . . . . . . . . . . . . . . $ 7,018 $ 7,084 $ 3,458
Noncash ActivitiesLoans exchanged for mortgage-backed securities . . . . . . . . . . . . . . . . $ 2,854 $ 12,274 $ 2,399Real estate acquired through foreclosure . . . . . . . . . . . . . . . . . . . . . 479 447 345Fair value of Bank United Corp. assets acquired . . . . . . . . . . . . . . . . – – 19,034Fair value of Bank United Corp. liabilities acquired . . . . . . . . . . . . . – – 17,374
Cash Paid During the Year ForInterest on deposits . . . . . . . . . . . . . . . . . . . . . . . . . . . . . . . . . . . . 2,193 2,660 3,057Interest on borrowings . . . . . . . . . . . . . . . . . . . . . . . . . . . . . . . . . . 2,427 2,960 5,199Income taxes . . . . . . . . . . . . . . . . . . . . . . . . . . . . . . . . . . . . . . . . . 2,829 3,201 1,438
See Notes to Consolidated Financial Statements.
80

WASHINGTON MUTUAL, INC. AND SUBSIDIARIES
NOTES TO CONSOLIDATED FINANCIAL STATEMENTS
Note 1: Summary of Significant Accounting Policies
Basis of Presentation
Washington Mutual, Inc. (together with its subsidiaries, ‘‘Washington Mutual’’ or the ‘‘Company’’) is afinancial services company committed to serving consumers and small- to mid-sized businesses. TheCompany accepts deposits from the general public, originates, purchases, services and sells home loans,makes consumer, home equity and commercial real estate loans (primarily loans secured by multi-familyproperties), and engages in certain commercial banking activities such as providing credit facilities andcash management and deposit services. The Company originates, purchases from correspondents, sells andservices loans to higher-risk borrowers through its specialty mortgage finance program. The Company alsomarkets annuities and other insurance products, offers full service securities brokerage services and acts asthe investment advisor to, and the distributor of, mutual funds.
The Consolidated Financial Statements include the accounts of Washington Mutual, Inc. and itsmajority-owned subsidiaries. Other affiliates in which there is at least 20% ownership are generallyaccounted for by the equity method; those in which there is less than 20% ownership and which do nothave readily determinable market values are generally carried at cost. Assets that are accounted for byeither the equity or cost method are reported in other assets. Certain reclassifications have been made tothe 2002 and 2001 Consolidated Financial Statements to conform to the 2003 presentation. Allintercompany transactions and balances have been eliminated.
The Company has a concentration of operations in California. At December 31, 2003, 46% of theCompany’s loans held for sale and loans held in portfolio and 55% of the Company’s deposits wereconcentrated in California.
Use of Estimates
The preparation of financial statements in conformity with accounting principles generally accepted inthe United States of America requires management to make estimates and assumptions that affect thereported amounts of assets and liabilities and disclosure of contingent assets and liabilities at the date ofthe financial statements and the reported amounts of revenues and expenses during the reporting period.Actual results could differ from those estimates.
Cash and Cash Equivalents
For the purpose of reporting cash flows, cash and cash equivalents include cash on hand, amounts duefrom banks, U.S. Treasury bills, overnight investments and commercial paper with an initial maturity ofthree months or less.
Available-for-Sale Securities
Securities not classified as held to maturity or trading are considered to be available for sale and arereported at their fair value, with unrealized gains and losses calculated using the specific identificationmethod, and reported, net of applicable taxes, as a component of accumulated other comprehensiveincome. Gains and losses realized on the sale of these securities are recorded in noninterest income. Otherthan temporary declines in fair value are recognized in the income statement as loss from securities.
Loans Held for Sale
Loans held for sale include loans originated or purchased from correspondent lenders that theCompany intends to sell in the secondary market. The Company enters into forward sales agreements,
81

WASHINGTON MUTUAL, INC. AND SUBSIDIARIES
NOTES TO CONSOLIDATED FINANCIAL STATEMENTS (Continued)
interest rate contracts, mortgage option contracts and interest rate futures to manage interest rate riskassociated with loans held for sale. Loans held for sale are accounted for at the lower of cost or marketvalue. To the extent that the hedging of those loans qualifies for fair value hedge accounting underStatement of Financial Accounting Standards (‘‘Statement’’) No. 133 (as amended), Accounting forDerivative Instruments and Hedging Activities, they are recorded at fair value.
Loans Held in Portfolio
Loans held in portfolio are recorded at the principal amount outstanding, net of deferred loan costs orfees and any discounts received or premiums paid on purchased loans. Deferred costs or fees, discountsand premiums are amortized using the interest method over the contractual term of the loan adjusted foractual prepayments.
Allowance for Loan and Lease Losses
The allowance for loan and lease losses represents management’s estimate of credit losses inherent inthe Company’s loan and lease portfolios as of the balance sheet date. The estimation of the allowance isbased on a variety of factors, including past loan loss experience, adverse situations that have occurred butare not yet known that may affect the borrower’s ability to repay, the estimated value of underlyingcollateral, and general economic conditions. The Company’s methodology for assessing the adequacy ofthe allowance includes the evaluation of three distinct components: the formula allowance, the specificallowance (which includes the allowance for loans deemed to be impaired by Statement No. 114,Accounting by Creditors for Impairment of a Loan) and the unallocated allowance. The formula allowanceand the specific allowance collectively represent the portion of the allowance for loan and lease losses thatis allocated to the various loan portfolios. The allowance considers losses that are inherent in the loanportfolios but have not yet been realized. Losses are recognized when (a) available information indicatesthat it is probable that a loss has been incurred and (b) the amount of the loss can be reasonably estimated.
The formula allowance is calculated by applying loss factors against all loans in what are consideredhomogeneous portfolios (such as home loans, home equity loans and lines of credit, and purchasedspecialty mortgage finance loans). Loss factors are based on an analysis of the historical loss experience ofeach loan category and an assessment of portfolio trends and conditions, as well as specific risk factorsimpacting the loan and lease portfolios. These factors may be adjusted for external factors that, inmanagement’s judgment, affect the collectibility of the portfolio as of the evaluation date. Such externalfactors include, but are not limited to, the interest rate environment and housing prices.
For non-homogeneous loans such as commercial real estate, larger commercial business loans andbuilder home construction loans, loss factors are assigned based on risk ratings that are ascribed to theindividual loans. A specific allowance may be assigned to these loans if they have been individuallydetermined to be impaired.
Loans, other than those included in homogeneous portfolios, are considered impaired when it isprobable that the Company will be unable to collect all amounts past due, including interest payments. Forloans that are determined to be impaired, the amount of impairment is measured by a discounted cash flowanalysis, using the loan’s effective interest rate, except when it is determined that the only source ofrepayment for the loan is the operation or liquidation of the underlying collateral. In such cases, thecurrent fair value of the collateral, reduced by estimated disposal costs, will be used in place of discountedcash flows.
Loans that are determined to be impaired are excluded from the formula allowance analysis so as notto double-count the loss exposure.
82

WASHINGTON MUTUAL, INC. AND SUBSIDIARIES
NOTES TO CONSOLIDATED FINANCIAL STATEMENTS (Continued)
The unallocated component of the allowance reflects management’s judgmental assessment of theimpact that various factors have on the overall measurement of credit losses. These factors include, but arenot limited to, general economic and business conditions affecting the key lending areas of the Company,credit quality and collateral value trends, loan concentrations, specific industry conditions within portfoliosegments, recent loss experience in particular segments of the portfolio, duration of the current businesscycle, the impact of new product initiatives and other such variables for which recent historical data do notprovide a high level of precision for risk evaluation, the results of regulatory examinations and findingsfrom the Company’s internal credit review function.
When available information confirms that specific loans or portions thereof are uncollectible, theseamounts are charged off against the allowance for loan and lease losses. The existence of some or all of thefollowing conditions will generally confirm that a loss has been incurred: the loan is significantly delinquentand the borrower has not demonstrated the ability or intent to bring the loan current; the borrower hasinsufficient assets to repay the debt; or the fair value of the loan collateral is significantly below the currentloan balance and there is little or no prospect for improvement.
Consumer loans are entirely charged off when they are determined to be uncollectible or when theyreach a predetermined number of days past due, depending upon loan product and other factors. Homeloans secured by real estate are written down to the fair value of the underlying collateral (less projectedcost to sell) when they are 180 days past due.
The ultimate recovery of all loans is susceptible to future market factors beyond the Company’scontrol. These factors may result in losses or recoveries differing significantly from those provided for inthe Consolidated Financial Statements.
Nonaccrual Loans
Loans for which interest is not being accrued are referred to as loans on nonaccrual status. Generally,loans are placed on nonaccrual status when the loan becomes 90 days past due. Additionally, loans innon-homogeneous portfolios, such as commercial real estate, commercial business loans and builder homeconstruction loans, are placed on nonaccrual status prior to becoming 90 days past due when payment infull of principal and interest is not expected. When a loan is placed on nonaccrual status, all interestaccrued, but not collected, is reversed.
Loans in homogeneous portfolios are returned to accrual status when the borrower brings the loan toless than 30 days past due. Additionally, loans in the non-homogeneous portfolio are returned to accrualstatus when, in management’s opinion, projected cash proceeds are sufficient to repay both principal andinterest.
Restructured Loans
In cases where a borrower experiences financial difficulties and the Company makes certainconcessionary modifications to contractual terms, the loan is classified as a restructured (accruing) loan.Loans restructured at a rate equal to or greater than that of a new loan with comparable risk at the timethe contract is modified are not considered to be impaired loans in the calendar years subsequent to therestructuring.
Generally, restructured loans in the non-homogeneous portfolios remain on nonaccrual for a periodof six months to demonstrate that the borrower can meet the restructured terms. However, performanceprior to the restructuring, or significant events that coincide with the restructuring, are included inassessing whether the borrower will be able to comply with the new terms and may result in the loan being
83

WASHINGTON MUTUAL, INC. AND SUBSIDIARIES
NOTES TO CONSOLIDATED FINANCIAL STATEMENTS (Continued)
returned to accrual at the time of restructuring or after a shorter performance period. If the borrower’sability to meet the revised payment schedule is uncertain, the loan remains classified as a nonaccrual loan.
Foreclosed Assets
Foreclosed assets are accounted for at the lower of fair value (less estimated costs to sell) or cost. The amount the Company ultimately recovers from foreclosed assets may differ substantially from the netcarrying value of these assets because of future market factors beyond the Company’s control or because ofchanges in the Company’s strategy for sale of the property.
Investment in Federal Home Loan Banks
The Company’s investment in the stock of the Federal Home Loan Banks (‘‘FHLBs’’) is carried atcost since it is not a readily marketable security.
Transfers and Servicing of Financial Assets
Washington Mutual securitizes, sells and services interests in residential home loans and commercialreal estate loans. When the Company sells or securitizes loans, it generally retains the right to service theloans and may retain senior, subordinated, residual, or other interests, all of which are considered retainedinterests in the securitized assets. Gain on sale of the assets depends, in part, on the Company’s allocationof the previous carrying amount of the assets to the retained interests. Previous carrying amounts areallocated in proportion to the relative fair values of the assets sold and the interests retained.
Quoted market prices, if available, are used to obtain fair values of senior, subordinated and residualinterests. Generally, quoted market prices for subordinated and residual interests are not available;therefore, the Company estimates the fair values based upon the present value of the associated expectedfuture cash flows. In determining the fair value of subordinated and residual interests, management isrequired to make assumptions about future prepayment rates, discount rates, expected credit losses, andother factors that impact the value of retained interests. See Note 7 to the Consolidated FinancialStatements—‘‘Mortgage Banking Activities.’’
The fair value of the mortgage servicing rights (‘‘MSR’’) is determined by reference to internallydeveloped estimates of fair value primarily based on the following characteristics:
• Product type (i.e. conventional, government, balloon)
• Fixed or adjustable rate of interest
• Interest rate
• Term (i.e. 15 or 30 years)
The Company records MSR when the expected future cash flows from servicing are expected to bemore than adequate compensation for such services. Adequate compensation refers to the condition thatexists when a mortgage servicer is able to make a level of profit that is considered reasonable by secondarymarket participants. The projected cash flows that exceed this adequate compensation level are capitalizedas MSR.
The Company stratifies its MSR based on the predominant characteristics of the underlying financialassets. The effect of changes in market interest rates on estimated rates of loan prepayments is thepredominant risk characteristic of the MSR. For purposes of measuring impairment, the Company hasdetermined that three interest rate bands are adequate to create strata of loans that will have similar
84
WASHINGTON MUTUAL, INC. AND SUBSIDIARIES
NOTES TO CONSOLIDATED FINANCIAL STATEMENTS (Continued)
prepayment characteristics. Loans are also grouped according to other characteristics such as whether theyhave fixed or adjustable rates, whether they have been securitized through government-sponsoredenterprises or in private transactions and whether or not they are loans to higher risk borrowers, asdiscount rates, costs to service, and other important valuation factors differ according to those features.
The following is a summary of the MSR strata used by the Company to assess impairment:
Loan Type Rate Band at December 31, 2003
Adjustable . . . . . . . . . . . . . . . . . . . . . . . . . . . . . . . . . . All loansGovernment-sponsored enterprises . . . . . . . . . . . . . . . . 6.00% and belowGovernment-sponsored enterprises . . . . . . . . . . . . . . . . 6.01% to 7.49%Government-sponsored enterprises . . . . . . . . . . . . . . . . 7.50% and aboveGovernment . . . . . . . . . . . . . . . . . . . . . . . . . . . . . . . . 6.00% and belowGovernment . . . . . . . . . . . . . . . . . . . . . . . . . . . . . . . . 6.01% to 7.49%Government . . . . . . . . . . . . . . . . . . . . . . . . . . . . . . . . 7.50% and abovePrivate . . . . . . . . . . . . . . . . . . . . . . . . . . . . . . . . . . . . 6.00% and belowPrivate . . . . . . . . . . . . . . . . . . . . . . . . . . . . . . . . . . . . 6.01% to 7.49%Private . . . . . . . . . . . . . . . . . . . . . . . . . . . . . . . . . . . . 7.50% and aboveMaster servicing . . . . . . . . . . . . . . . . . . . . . . . . . . . . . All loansSpecialty home loans . . . . . . . . . . . . . . . . . . . . . . . . . . All loansMulti-family . . . . . . . . . . . . . . . . . . . . . . . . . . . . . . . . All loans
Impairment is recognized through a valuation allowance for each individual stratum. The valuationallowance is adjusted to reflect the amount, if any, by which the cost basis of the MSR for a given stratumexceeds its fair value. Any fair value in excess of the cost basis of MSR for a given stratum is notrecognized.
The Company records an other than temporary impairment of the MSR for any loss in value that isnot expected to recover in the foreseeable future. The amount of the other than temporary impairment isdetermined by selecting an appropriate interest rate shock to estimate the amount of MSR fair value thatmight be expected to recover in the foreseeable future. To the extent that the gross carrying value of theMSR exceeds the estimated recoverable amount, that portion of the gross carrying value of MSR and therelated portion of valuation reserve would be written off as other than temporary impairment.
Because quoted market prices from active markets are not readily available, a present value cash flowmodel is used to estimate the value that the MSR could be sold for in the open market as of the valuationdate. The most important assumptions used in the MSR valuation model are the anticipated rate of loanprepayments and discount rates. Other assumptions such as the cost to service the underlying loans,foreclosure costs, ancillary income and float rates are also used in determining the value of the MSR.
All of the assumptions are based on standards used by market participants in valuing MSR. Thereasonableness of these assumptions is confirmed through surveys conducted with independent brokers.They are reviewed and approved on a quarterly basis. In addition, independent broker appraisals of thefair value of the MSR portfolio are obtained at least annually to confirm the reasonableness of the valuegenerated by the MSR valuation model.
Premises and Equipment
Land, buildings, leasehold improvements and equipment are carried at amortized cost. Buildings andequipment are depreciated over their estimated useful lives using the straight-line method. The estimated
85

WASHINGTON MUTUAL, INC. AND SUBSIDIARIES
NOTES TO CONSOLIDATED FINANCIAL STATEMENTS (Continued)
useful life of newly constructed buildings is 40 years and the lives of new assets that are added to existingbuildings are based on the remaining life of the original building. The estimated useful life for equipmentis 3-10 years. Leasehold improvements are amortized over the shorter of their useful lives or lease terms.The Company reviews buildings, leasehold improvements, and equipment for impairment whenever eventsor changes in circumstances indicate that the asset may not generate enough income to recover its carryingvalue. Impairment exists when, and in the amount by which, the carrying amount exceeds its fair value.
Goodwill and Other Intangible Assets
Goodwill and other intangible assets represent the excess of the purchase price over the fair value ofnet assets acquired in business combinations under the purchase method of accounting. Other intangibleassets include core deposit intangibles and other finite-life intangible assets; these assets are amortizedover their estimated useful lives ranging from 7-10 years. Goodwill is not amortized, but instead is testedfor impairment at the reporting unit level annually or more frequently if the presence of certaincircumstances indicates that impairment may have occurred. Impairment testing is also performedperiodically on amortizing intangible assets. Other intangible assets are classified as other assets on theConsolidated Statements of Financial Condition.
Securities Sold Under Agreements to Repurchase
The Company enters into agreements under which it sells securities subject to an obligation torepurchase the same or similar securities (‘‘repurchase agreements’’). Under these arrangements, theCompany transfers legal control over the assets but still retains effective control through an agreement thatboth entitles and obligates the Company to repurchase the assets. As a result, repurchase agreements areaccounted for as collateralized financing arrangements and not as a sale and subsequent repurchase ofsecurities. The obligation to repurchase the securities is reflected as a liability in the ConsolidatedStatements of Financial Condition while the securities underlying the agreements remain in the respectiveasset accounts. These securities are classified as pledged.
Stock-Based Compensation
In December 2002, the Financial Accounting Standards Board (‘‘FASB’’) issued Statement No. 148,Accounting for Stock-Based Compensation—Transition and Disclosure, which amends Statement No. 123,Accounting for Stock-Based Compensation. This Statement provides alternative methods of transitioning,on a voluntary basis, from the intrinsic value method of accounting prescribed by Accounting PrinciplesBoard (‘‘APB’’) Opinion No. 25, Accounting for Stock Issued to Employees, to the fair value method ofaccounting for stock-based employee compensation. Effective January 1, 2003 and in accordance with thetransitional guidance of Statement No. 148, the Company elected to prospectively apply the fair valuemethod of accounting for stock-based awards granted subsequent to December 31, 2002. For such awards,fair value is estimated using a binomial option pricing model, with compensation expense recognized inearnings over the required service period. Stock-based awards granted prior to January 1, 2003, and notmodified after December 31, 2002, will continue to be accounted for under APB Opinion No. 25, and thepro forma presentation of what the impact to the financial statements would be if these awards wereaccounted for on the fair value basis will continue to be disclosed in the Notes to Consolidated FinancialStatements until the last of those awards vest in 2005.
Had compensation cost for the Company’s stock-based compensation plans been determined usingthe fair value method consistent with Statement No. 123 for all periods presented, the Company’s net
86

WASHINGTON MUTUAL, INC. AND SUBSIDIARIES
NOTES TO CONSOLIDATED FINANCIAL STATEMENTS (Continued)
income attributable to common stock and net income per common share would have been reduced to thepro forma amounts indicated below:
Year Ended December 31,
2003 2002 2001
(dollars in millions,except per share amounts)
Net income attributable to common stock . . . . . . . . . . . . . . . . . . . . . . . . . . $3,880 $3,856 $3,097Add back: Stock-based employee compensation expense included in reported
net income, net of related tax effects . . . . . . . . . . . . . . . . . . . . . . . . . . . 56 28 18Deduct: Total stock-based employee compensation expense determined
under the fair value method for all awards, net of related tax effects . . . . (127) (87) (46)
Pro forma net income attributable to common stock . . . . . . . . . . . . . . . . . . $3,809 $3,797 $3,069
Net income per common share:Basic:
As reported . . . . . . . . . . . . . . . . . . . . . . . . . . . . . . . . . . . . . . . . . . . . . . $ 4.29 $ 4.09 $ 3.64Pro forma . . . . . . . . . . . . . . . . . . . . . . . . . . . . . . . . . . . . . . . . . . . . . . . 4.21 4.03 3.61
Diluted:As reported . . . . . . . . . . . . . . . . . . . . . . . . . . . . . . . . . . . . . . . . . . . . . . 4.21 4.02 3.58Pro forma . . . . . . . . . . . . . . . . . . . . . . . . . . . . . . . . . . . . . . . . . . . . . . . 4.13 3.96 3.55
The weighted average grant-date fair values of the options granted during 2003, 2002 and 2001 werecalculated using the following assumptions:
Year Ended December 31,
2003 2002 2001
Dividend yield . . . . . . . . . . . . . . . . . . . . . . . . . . . 2.53 - 3.50% 2.71 - 3.00% 2.33 - 2.58%Expected volatility . . . . . . . . . . . . . . . . . . . . . . . . 30.41 - 35.02 30.92 - 35.30 31.03 - 35.66Risk free interest rate . . . . . . . . . . . . . . . . . . . . . 2.45 - 3.60 2.25 - 5.15 3.50 - 4.91Expected life . . . . . . . . . . . . . . . . . . . . . . . . . . . . 4 - 7.5 years 2.75 - 7.5 years 5 - 7 years
Income Taxes
Income taxes are accounted for using the asset and liability method. Under this method, a deferredtax asset or liability is determined based on the enacted tax rates which will be in effect when thedifferences between the financial statement carrying amounts and tax bases of existing assets and liabilitiesare expected to be reported in the Company’s income tax returns. The comprehensive deferred taxprovision for the year is equal to the change in the deferred tax asset or liability from the beginning to theend of the year. The effect on deferred taxes of a change in tax rates is recognized in the tax provision inthe period that the change is enacted.
For tax reporting purposes, the Company reports income and expenses using the accrual method ofaccounting and files a consolidated tax return on that basis as well. The Company’s federal tax filingsgenerally include all subsidiaries.
Earnings Per Share
Earnings per share are presented under two formats: basic EPS and diluted EPS. Basic EPS iscomputed by dividing net income (after deducting dividends on preferred stock) by the weighted average
87

WASHINGTON MUTUAL, INC. AND SUBSIDIARIES
NOTES TO CONSOLIDATED FINANCIAL STATEMENTS (Continued)
number of common shares outstanding during the year. Diluted EPS is computed by dividing net income(after deducting dividends on preferred stock) by the weighted average number of common sharesoutstanding during the year, plus the impact of dilutive potential common shares, such as stock options.
Derivatives and Hedging Activities
The Company enters into derivative contracts to manage the various risks associated with certainassets, liabilities, or probable forecasted transactions. On the date the Company enters into a derivativecontract, the derivative instrument is designated as: (1) a hedge of the fair value of a recognized asset orliability or of an unrecognized firm commitment (a ‘‘fair value’’ hedge); (2) a hedge of the variability inexpected future cash flows associated with an existing recognized asset or liability or a probable forecastedtransaction (a ‘‘cash flow’’ hedge); or (3) held for other risk management purposes (‘‘risk managementderivatives’’).
In a fair value hedge, changes in the fair value of the hedging derivative are recognized in earningsand offset by recognizing changes in the fair value of the hedged item attributable to the risk being hedged.To the extent that the hedge is ineffective, the changes in fair value will not offset and the difference isreflected in earnings.
In a cash flow hedge, the effective portion of the change in the fair value of the hedging derivative isrecorded in accumulated other comprehensive income and is subsequently reclassified into earnings duringthe same period in which the hedged item affects earnings. The change in fair value of any ineffectiveportion of the hedging derivative is recognized immediately in earnings.
The changes in fair value of the risk management derivatives held for other risk managementpurposes are recorded in revaluation gain from derivatives or gain (loss) from mortgage loans if thederivatives are home loan mortgage banking related, or are recorded in other income for derivativesrelated to other types of asset/liability interest rate risk management.
The Company formally documents the relationship between the hedging instruments and hedgeditems, as well as its risk management objective and strategy before undertaking the hedge. To qualify forhedge accounting, the derivatives and related hedged items must be designated as a hedge. For hedgingrelationships in which effectiveness is measured, the correlation between the hedging instruments andhedged items are assessed at inception of the hedge and on an ongoing basis, which includes determiningwhether the hedge relationship is expected to be highly effective in offsetting changes in fair value or cashflows of hedged items. If it is determined that the derivative instrument is not highly effective as a hedge,hedge accounting is discontinued.
The Company discontinues hedge accounting prospectively when (1) it determines that the derivativeis no longer effective in offsetting changes in the fair value or cash flows of the designated hedged item;(2) the derivative expires or is sold, terminated, or exercised; (3) the derivative is de-designated as a fairvalue or cash flow hedge; or (4) it is probable that the forecasted transaction will not occur by the end ofthe originally specified time period.
If the Company determines that the derivative no longer qualifies as a fair value or cash flow hedgeand therefore hedge accounting is discontinued, the derivative (if retained) will continue to be recorded onthe balance sheet at its fair value with changes in fair value included in current earnings. For adiscontinued fair value hedge, the previously hedged item no longer is adjusted for changes in fair value.
When hedge accounting is discontinued because it is probable that a forecasted transaction will notoccur, the derivative will continue to be recorded on the balance sheet at its fair value with changes in fairvalue included in current earnings, and the gains and losses in accumulated other comprehensive income
88

WASHINGTON MUTUAL, INC. AND SUBSIDIARIES
NOTES TO CONSOLIDATED FINANCIAL STATEMENTS (Continued)
will be recognized immediately in earnings. When hedge accounting is discontinued because the hedginginstrument is sold, terminated or de-designated as a hedge, the amount reported in accumulated othercomprehensive income through the date of sale, termination, or de-designation will continue to bereported in accumulated other comprehensive income until the forecasted transaction impacts earnings.
The Company occasionally purchases or originates financial instruments that contain an embeddedderivative instrument. At inception of the financial instrument, the Company determines whether anembedded derivative is required to be accounted for separately as a derivative. This is determined byassessing whether the economic characteristics and risks of the embedded derivative instrument are clearlyand closely related to the economic characteristics of the financial instrument (host contract). UnderStatement No. 133, Accounting for Derivative Instruments and Hedging Activities, an embedded derivative isrequired to be accounted for separately as a derivative if the embedded derivative instrument isdetermined not to be clearly and closely related to the host contract, the host contract is not currentlymeasured at fair value with changes in fair value reported in earnings and the embedded derivativeinstrument separately would qualify as a derivative instrument. As of December 31, 2003, 2002 and 2001,all of the Company’s embedded derivatives were considered clearly and closely related to the host contractand therefore were not required to be separated from their host contracts.
The Company enters into commitments to make loans whereby the interest rate on the loan is setprior to funding (rate lock commitments). The Company also enters into commitments to purchasemortgage loans through its correspondent channel (purchase commitments). Both rate lock and purchasecommitments on mortgage loans that are intended to be sold are considered to be derivatives. In addition,purchase commitments for mortgage loans that will be held for investment purposes can qualify asderivatives. Those types of loan commitments are evaluated under the definition of a derivative todetermine whether Statement No. 133 is applicable. Rate lock and purchase commitments that areconsidered to be derivatives are recorded, at fair value, in other assets on the Consolidated Statements ofFinancial Condition with changes in fair value recorded in gain from mortgage loans on the ConsolidatedStatements of Income. In measuring the fair value of rate lock and purchase commitments, the amount ofthe expected servicing rights is included in the valuation. This value is calculated using the samemethodologies as are used to value the Company’s MSR, adjusted using an anticipated fallout factor forloan commitments that are not expected to be funded. This policy of recognizing the value of the derivativehas the effect of recognizing the gain from mortgage loans before the loans are sold. Both rate lock andpurchase commitments expose the Company to interest rate risk. The Company manages that risk byentering into various interest rate contracts that are recorded at fair value with changes in fair valuereported in gain from mortgage loans.
Recently Issued Accounting Standards
In December 2003, the FASB issued Interpretation No. 46R (‘‘FIN 46R’’), Consolidation of VariableInterest Entities, an interpretation of Accounting Research Bulletin No. 51. FIN 46R is a revision to theoriginal FIN 46 that addresses the consolidation of certain variable interest entities (e.g., non-qualifiedspecial purpose entities). The revision clarifies how variable interest entities should be identified andevaluated for consolidation purposes. FIN 46R must be applied no later than March 31, 2004. TheCompany adopted FIN 46 as of July 1, 2003. The Company is still in the process of studying and evaluatingthe impact of FIN 46R. However, at this time the Company does not expect the impact of FIN 46R to havea significant effect on the results of operations or financial condition.
In December 2003, the Accounting Standards Executive Committee of the AICPA issued Statementof Position No. 03-3 (‘‘SOP 03-3’’), Accounting for Certain Loans or Debt Securities Acquired in a Transfer.SOP 03-3 addresses the accounting for differences between the contractual cash flows and the cash flows
89

WASHINGTON MUTUAL, INC. AND SUBSIDIARIES
NOTES TO CONSOLIDATED FINANCIAL STATEMENTS (Continued)
expected to be collected from purchased loans or debt securities if those differences are attributable, inpart, to credit quality. SOP 03-3 requires purchased loans and debt securities to be recorded initially at fairvalue based on the present value of the cash flows expected to be collected with no carryover of anyvaluation allowance previously recognized by the seller. Interest income should be recognized based on theeffective yield from the cash flows expected to be collected. To the extent that the purchased loansexperience subsequent deterioration in credit quality, a valuation allowance would be established for anyadditional cash flows that are not expected to be received. However, if more cash flows subsequently areexpected to be received than originally estimated, the effective yield would be adjusted on a prospectivebasis. SOP 03-3 will be effective for loans and debt securities acquired after December 31, 2004. Althoughthe Company anticipates that the implementation of SOP 03-3 will require significant loan system andoperational changes to track credit related losses on loans purchased starting in 2005, it is not expected tohave a significant effect on the Consolidated Financial Statements.
In March 2004, Securities and Exchange Commission (‘‘SEC’’) Staff Accounting Bulletin No. 105 wasissued, which provides guidance regarding loan commitments that are accounted for as derivativeinstruments under FASB No. 133 (as amended), Accounting for Derivative Instruments and HedgingActivities. In this Bulletin, the SEC ruled that the amount of the expected servicing rights should not beincluded when determining the fair value of derivative interest rate lock commitments. This guidance mustbe applied to rate locks initiated after March 31, 2004. In anticipation of this Bulletin, the Companyprospectively changed its accounting policy for derivative rate lock commitments on January 1, 2004.Under the new policy, the expected servicing rights that had previously been recorded at the initiation ofthe rate lock are not recognized until the underlying loans are sold. The impact that this new policy willhave on the Company’s results of operations in the first quarter of 2004 will be significantly influenced bythat quarter’s amount of salable rate lock volume and by the timing of when loan sales are executed. Asrate lock volume is highly sensitive to changes in interest rates and the timing of loan sales may be affectedby market conditions, the Company cannot provide a reliable estimate of the impact this change will haveto its future results of operations.
Recently Adopted Accounting Standards
In June 2001, the FASB issued Statement No. 143, Accounting for Asset Retirement Obligations.Statement No. 143 addresses the accounting and reporting for obligations associated with the retirement oftangible, long-lived assets. The Statement became effective January 1, 2003 and did not have a materialimpact on the results of operations or financial condition of the Company.
In June 2002, the FASB issued Statement No. 146, Accounting for Costs Associated with Exit orDisposal Activities. This Statement requires that a liability for costs associated with an exit or disposalactivity be recognized when the liability is incurred and be measured at fair value and adjusted for changesin estimated cash flows. Existing generally accepted accounting principles provide for the recognition ofsuch costs at the date of management’s commitment to an exit plan. Under Statement No. 146,management’s commitment to an exit plan would not be sufficient, by itself, to recognize a liability. TheStatement is effective for exit or disposal activities initiated after December 31, 2002 and did not have amaterial impact on the results of operations or financial condition of the Company.
In November 2002, the FASB issued Interpretation No. 45 (‘‘FIN 45’’), Guarantor’s Accounting andDisclosure Requirements for Guarantees, Including Indirect Guarantees of Indebtedness of Others, whichexpands on the accounting guidance of Statements No. 5, 57 and 107 and incorporates without change theprovisions of FASB Interpretation No. 34, which is being superseded. This Interpretation requires aguarantor to recognize, at the inception of the guarantee, a liability for the fair value of the obligationundertaken in issuing the guarantee. The recognition requirements of FIN 45 apply prospectively to
90

WASHINGTON MUTUAL, INC. AND SUBSIDIARIES
NOTES TO CONSOLIDATED FINANCIAL STATEMENTS (Continued)
guarantees issued or modified after December 31, 2002. Refer to Note 15 to the Consolidated FinancialStatements—‘‘Guarantees’’ for discussion on significant guarantees that have been entered into by theCompany.
In January 2003, the FASB issued Interpretation No. 46 (‘‘FIN 46’’), Consolidation of Variable InterestEntities. This Interpretation provides guidance on how to identify a variable interest entity and determinewhen the assets, liabilities, noncontrolling interests and results of operations of a variable interest entityshould be consolidated by the primary beneficiary. The primary beneficiary is the enterprise that willabsorb a majority of the variable interest entity’s expected losses or receive a majority of the expectedresidual returns as a result of holding variable interests. The Company adopted the provisions of FIN 46for variable interest entities formed on or after February 1, 2003, which did not have a material effect onthe Consolidated Financial Statements. The Company adopted the provisions of FIN 46 for existingvariable interest entities on July 1, 2003, which did not have a material effect on the ConsolidatedFinancial Statements.
In April 2003, the FASB issued Statement No. 149, Amendment of Statement 133 on DerivativeInstruments and Hedging Activities. Statement No. 149 provides clarification on the definition of derivativeinstruments within the scope of FASB Statement No. 133. Generally, this Statement is effective forcontracts entered into or modified after June 30, 2003 and for hedging relationships designated afterJune 30, 2003, and did not have a material impact on the Consolidated Financial Statements.
In May 2003, the FASB issued Statement No. 150, Accounting for Certain Financial Instruments withCharacteristics of both Liabilities and Equity. Statement No. 150 establishes standards for how an issuerclassifies and measures certain financial instruments with characteristics of both liabilities and equity. ThisStatement, which was effective for financial instruments entered into or modified after May 31, 2003 andfor all financial instruments on July 1, 2003, did not have a material impact on the Consolidated FinancialStatements.
In December 2003, the FASB issued a revised version of Statement No. 132, Employers’ Disclosuresabout Pensions and Other Postretirement Benefits. The revised Statement requires companies to providemore details about plan assets, benefit obligations, cash flows, benefit costs, and other relevantinformation. Companies are required to provide (1) a breakdown of plan assets by category (e.g. equityand debt), (2) a description of investment policies and strategies and target allocation percentages orranges, (3) projections of future benefit payments, and (4) an estimate of contributions to be made in thenext year. In addition, companies are required to provide various elements of pension and otherpostretirement benefit costs on a quarterly basis. Statement No. 132 is effective as of December 31, 2003.The new disclosures are reflected in Note 21 of the Consolidated Financial Statements—‘‘EmployeeBenefits Programs and Other Expense’’.
Note 2: Restatements of Financial Statements
(a) During the fourth quarter of 2003, the Company concluded that the inclusion of certaincomponents (i.e. deferred acquisition costs and claims stabilization reserves) in the cash surrender value ofits bank-owned life insurance policies was incorrect. The accounting policy the Company previously usedresulted in the overstatement of the cash surrender value of the policies and, accordingly, other noninterestincome. This restatement also decreased other assets, and correspondingly, retained earnings by$73 million and $38 million as of December 31, 2002 and 2001. The Company has corrected its accounting
91

WASHINGTON MUTUAL, INC. AND SUBSIDIARIES
NOTES TO CONSOLIDATED FINANCIAL STATEMENTS (Continued)
for all affected prior reporting periods. The table below shows the impact of the restatements on netincome and basic and diluted earnings per share for those periods:
Year EndedDecember 31,
2002 2001
(in millions,except per
share amounts)
Net income:Net income as previously reported . . . . . . . . . . . . . . . . . . . . . . . . . . . . . . . . . . . . $3,896 $3,114Restatement adjustment . . . . . . . . . . . . . . . . . . . . . . . . . . . . . . . . . . . . . . . . . . . (35) (10)
Net income as restated . . . . . . . . . . . . . . . . . . . . . . . . . . . . . . . . . . . . . . . . . . . . $3,861 $3,104
Basic earnings per share:Net income attributable to common stock as previously reported . . . . . . . . . . . . . . $ 4.12 $ 3.65Restatement adjustment . . . . . . . . . . . . . . . . . . . . . . . . . . . . . . . . . . . . . . . . . . . (0.03) (0.01)
Net income attributable to common stock as restated . . . . . . . . . . . . . . . . . . . . . . 4.09 3.64
Diluted earnings per share:Net income attributable to common stock as previously reported . . . . . . . . . . . . . . 4.05 3.59Restatement adjustment . . . . . . . . . . . . . . . . . . . . . . . . . . . . . . . . . . . . . . . . . . . (0.03) (0.01)
Net income attributable to common stock as restated . . . . . . . . . . . . . . . . . . . . . . 4.02 3.58
(b) During the first quarter of 2004 and subsequent to the original filing of the Company’s AnnualReport on Form 10-K, the Company corrected the funds transfer pricing methodology applied to thefinancial results of the Company’s operating segments for the year ending December 31, 2001. Thecorrection revises certain operating segment information, including net interest income and net income, ofits operating segment results reported for that year. The corrected information is included in Note 25—‘‘Operating Segments.’’ Such information had no effect on previously reported 2001 consolidated results ofoperations or any other period presented in the Company’s financial statements.
Note 3: Discontinued Operations
On November 24, 2003 the Company announced a definitive agreement to sell its subsidiary,Washington Mutual Finance Corporation, to CitiFinancial, a subsidiary of Citigroup, for approximately$1.25 billion in cash. This sale was completed on January 9, 2004, resulting in a pre-tax gain ofapproximately $660 million to be recorded in discontinued operations on the Consolidated Statements ofIncome in the first quarter of 2004. Washington Mutual Finance Corporation was included in theCommercial Group operating segment.
Washington Mutual Finance Corporation is accounted for as a discontinued operation and therefore,the results of operations and cash flows have been removed from the Company’s results of continuingoperations for all periods presented on the Consolidated Statements of Income, Cash Flows and Notes tothe Consolidated Financial Statements, unless otherwise noted. Likewise, the assets and liabilities ofWashington Mutual Finance Corporation have each been combined and presented as separate captions onthe Consolidated Statements of Financial Condition.
92

WASHINGTON MUTUAL, INC. AND SUBSIDIARIES
NOTES TO CONSOLIDATED FINANCIAL STATEMENTS (Continued)
Results of operations for Washington Mutual Finance Corporation were as follows:
Year EndedDecember 31,
2003 2002 2001
(in millions)
Net interest income . . . . . . . . . . . . . . . . . . . . . . . . . . . . . . . . . . . . . . . . . . . . . $433 $405 $387Provision for loan and lease losses . . . . . . . . . . . . . . . . . . . . . . . . . . . . . . . . . . . 153 191 148Noninterest income . . . . . . . . . . . . . . . . . . . . . . . . . . . . . . . . . . . . . . . . . . . . . . 24 63 29Noninterest expense . . . . . . . . . . . . . . . . . . . . . . . . . . . . . . . . . . . . . . . . . . . . . 167 164 172Income taxes . . . . . . . . . . . . . . . . . . . . . . . . . . . . . . . . . . . . . . . . . . . . . . . . . . 50 41 35
Net income . . . . . . . . . . . . . . . . . . . . . . . . . . . . . . . . . . . . . . . . . . . . . . . . . . . $ 87 $ 72 $ 61
Assets and liabilities of Washington Mutual Finance Corporation have been reclassified to assets andliabilities of discontinued operations on the Consolidated Statements of Financial Condition.
The following is summarized financial information for Washington Mutual Finance Corporation:
December 31,
2003 2002
(in millions)
AssetsCash and cash equivalents . . . . . . . . . . . . . . . . . . . . . . . . . . . . . . . . . . . . . . . . . . $ 64 $ 125Available-for-sale investment securities . . . . . . . . . . . . . . . . . . . . . . . . . . . . . . . . . 130 67Loans held in portfolio, net . . . . . . . . . . . . . . . . . . . . . . . . . . . . . . . . . . . . . . . . . 3,847 3,508Goodwill . . . . . . . . . . . . . . . . . . . . . . . . . . . . . . . . . . . . . . . . . . . . . . . . . . . . . . 57 57Other assets . . . . . . . . . . . . . . . . . . . . . . . . . . . . . . . . . . . . . . . . . . . . . . . . . . . . 86 107
Total assets . . . . . . . . . . . . . . . . . . . . . . . . . . . . . . . . . . . . . . . . . . . . . . . . . . . $4,184 $3,864
LiabilitiesCommercial paper . . . . . . . . . . . . . . . . . . . . . . . . . . . . . . . . . . . . . . . . . . . . . . . . $1,067 $ 739Other borrowings . . . . . . . . . . . . . . . . . . . . . . . . . . . . . . . . . . . . . . . . . . . . . . . . 2,431 2,390Other liabilities . . . . . . . . . . . . . . . . . . . . . . . . . . . . . . . . . . . . . . . . . . . . . . . . . . 80 201
Total liabilities . . . . . . . . . . . . . . . . . . . . . . . . . . . . . . . . . . . . . . . . . . . . . . . . . $3,578 $3,330
Note 4: Business Combinations
The business combinations consummated by Washington Mutual, Inc., and its consolidatedsubsidiaries (the ‘‘Company’’), during 2001 and 2002 have been accounted for using the purchase method.Accordingly, the purchase price of each acquisition was first allocated to the tangible assets and liabilitiesand identifiable intangible assets based on their estimated fair values as of the closing date of thetransaction, with the excess purchase price over the fair values recorded as goodwill. Results of operationsfor the business combinations are included from the date of acquisition.
On January 31, 2001, the Company acquired PNC Mortgage for approximately $7 billion in cash. Withthis acquisition, the Company acquired approximately $3 billion in loans held for sale and $2 billion inMSR. This acquisition resulted in the recognition of goodwill of approximately $350 million. On
93

WASHINGTON MUTUAL, INC. AND SUBSIDIARIES
NOTES TO CONSOLIDATED FINANCIAL STATEMENTS (Continued)
January 16, 2003, the Company reached a settlement with PNC Bank on the final purchase price of PNCMortgage, which resulted in an increase of goodwill of approximately $19 million.
On February 9, 2001, the Company acquired Texas-based Bank United, for a purchase price ofapproximately $1.4 billion. With this acquisition, the Company acquired approximately $12 billion in loansheld in portfolio, $1 billion in securities, $8 billion in deposits and $8 billion in FHLB advances. Thisacquisition resulted in the recognition of goodwill and other intangible assets of approximately$980 million. The Company issued 63.9 million shares of its common stock to acquire Bank United.
On June 1, 2001, the Company acquired Fleet Mortgage, a unit of FleetBoston Financial Corp., forapproximately $7.5 billion in cash. With this acquisition, the Company acquired approximately $4 billion inloans held for sale and $3 billion in MSR. This acquisition resulted in the recognition of goodwill ofapproximately $140 million.
On January 4, 2002, the Company acquired by merger Dime Bancorp, Inc. for a total purchase priceof approximately $5.3 billion, which included approximately $1.5 billion in cash, approximately 96.4 millionshares of common stock valued at $37.74 per share, the conversion of 111 million Dime Litigation TrackingWarrants�, valued at $0.33 per warrant, into the contingent right to receive the Company’s common stock,and the conversion of Dime stock options, valued at approximately $90 million, into options to purchasethe Company’s common stock. With this acquisition, the Company acquired approximately $16 billion inloans held in portfolio, $6 billion in loans held for sale, $1 billion in MSR and $15 billion in deposits. Thisacquisition resulted in the recognition of goodwill of approximately $4 billion.
In two transactions during 2002, the Company purchased for cash HomeSide Lending, Inc., the U.S.mortgage unit of National Australia Bank Limited. The aggregate purchase price of HomeSide was$2.45 billion. The acquisition of HomeSide added approximately $1 billion in loans held for sale,approximately $960 million in net MSR and approximately $130 billion to the Company’s portfolio of loansserviced for others. The Company also acquired a proprietary loan servicing platform. In addition theCompany assumed $760 million in long-term debt and $750 million in other liabilities.
94

WASHINGTON MUTUAL, INC. AND SUBSIDIARIES
NOTES TO CONSOLIDATED FINANCIAL STATEMENTS (Continued)
Note 5: Securities
The amortized cost, unrealized gains, unrealized losses, and fair value of securities as of the datesindicated were as follows:
December 31, 2003
Amortized Unrealized Unrealized FairCost Gains Losses Value
(in millions)
Available-for-sale securitiesMortgage-backed securities:
U.S. Government and agency . . . . . . . . . . . . . . . . . . . . . $ 8,687 $140 $ (26) $ 8,801Private issue . . . . . . . . . . . . . . . . . . . . . . . . . . . . . . . . . 1,849 46 (1) 1,894
Total mortgage-backed securities . . . . . . . . . . . . . . . . . 10,536 186 (27) 10,695Investment securities:
U.S. Government and agency . . . . . . . . . . . . . . . . . . . . . 25,950 5 (340) 25,615Other debt securities . . . . . . . . . . . . . . . . . . . . . . . . . . . 247 17 (2) 262Equity securities . . . . . . . . . . . . . . . . . . . . . . . . . . . . . . 125 11 (1) 135
Total investment securities . . . . . . . . . . . . . . . . . . . . . 26,322 33 (343) 26,012
Total available-for-sale securities . . . . . . . . . . . . . . . $36,858 $219 $(370) $36,707
December 31, 2002
Amortized Unrealized Unrealized FairCost Gains Losses Value
(in millions)
Available-for-sale securitiesMortgage-backed securities:
U.S. Government and agency . . . . . . . . . . . . . . . . . . . . . $19,649 $ 583 $ (5) $20,227Private issue . . . . . . . . . . . . . . . . . . . . . . . . . . . . . . . . . 7,940 216 (8) 8,148
Total mortgage-backed securities . . . . . . . . . . . . . . . . . 27,589 799 (13) 28,375Investment securities:
U.S. Government and agency . . . . . . . . . . . . . . . . . . . . . 14,546 580 (4) 15,122Other debt securities . . . . . . . . . . . . . . . . . . . . . . . . . . . 259 14 – 273Equity securities . . . . . . . . . . . . . . . . . . . . . . . . . . . . . . 134 3 (2) 135
Total investment securities . . . . . . . . . . . . . . . . . . . . . 14,939 597 (6) 15,530
Total available-for-sale securities . . . . . . . . . . . . . . . $42,528 $1,396 $(19) $43,905
95

WASHINGTON MUTUAL, INC. AND SUBSIDIARIES
NOTES TO CONSOLIDATED FINANCIAL STATEMENTS (Continued)
December 31, 2001
Amortized Unrealized Unrealized FairCost Gains Losses Value
(in millions)
Available-for-sale securitiesMortgage-backed securities:
U.S. Government and agency . . . . . . . . . . . . . . . . . . . . . $17,780 $441 $ (23) $18,198Private issue . . . . . . . . . . . . . . . . . . . . . . . . . . . . . . . . . 10,117 264 (11) 10,370
Total mortgage-backed securities . . . . . . . . . . . . . . . . . 27,897 705 (34) 28,568Investment securities:
U.S. Government and agency . . . . . . . . . . . . . . . . . . . . . 30,409 41 (1,143) 29,307Other debt securities . . . . . . . . . . . . . . . . . . . . . . . . . . . 202 5 (3) 204Equity securities . . . . . . . . . . . . . . . . . . . . . . . . . . . . . . 159 2 (7) 154
Total investment securities . . . . . . . . . . . . . . . . . . . . . 30,770 48 (1,153) 29,665
Total available-for-sale securities . . . . . . . . . . . . . . . $58,667 $753 $(1,187) $58,233
The unrealized losses and fair value of securities that have been in a continuous unrealized lossposition for less than 12 months and 12 months or greater were as follows:
December 31, 2003
12 months orLess than 12 months greater Total
Unrealized Fair Unrealized Fair Unrealized FairLosses Value Losses Value Losses Value
(in millions)
Available-for-sale securitiesMortgage-backed securities:
U.S. Government and agency . . . . . . . . . . . . . . $ (23) $ 1,759 $(3) $163 $ (26) $ 1,922Private issue . . . . . . . . . . . . . . . . . . . . . . . . . . (1) 79 – 36 (1) 115
Total mortgage-backed securities . . . . . . . . . . (24) 1,838 (3) 199 (27) 2,037Investment securities:
U.S. Government and agency . . . . . . . . . . . . . . (340) 23,536 – – (340) 23,536Other debt securities . . . . . . . . . . . . . . . . . . . . (2) 1 – – (2) 1Equity securities . . . . . . . . . . . . . . . . . . . . . . . – – (1) 7 (1) 7
Total investment securities . . . . . . . . . . . . . . (342) 23,537 (1) 7 (343) 23,544
Total available-for-sale securities . . . . . . . . $(366) $25,375 $(4) $206 $(370) $25,581
The realized gross gains and losses of securities as of the dates indicated were as follows:
Year Ended December 31,
2003 2002 2001
(in millions)
Available-for-sale securitiesRealized gross gains . . . . . . . . . . . . . . . . . . . . . . . . . . . . . . . . . . . . . . . . . . . $1,171 $1,424 $911Realized gross losses . . . . . . . . . . . . . . . . . . . . . . . . . . . . . . . . . . . . . . . . . . (175) (622) (194)
Realized net gain . . . . . . . . . . . . . . . . . . . . . . . . . . . . . . . . . . . . . . . . . $ 996 $ 802 $717
96
WASHINGTON MUTUAL, INC. AND SUBSIDIARIES
NOTES TO CONSOLIDATED FINANCIAL STATEMENTS (Continued)
Proceeds from sales of securities in the available-for-sale portfolio during 2003, 2002 and 2001 were$40.92 billion, $74.66 billion and $51.80 billion.
Fair value of debt securities by contractual maturity was as follows:
December 31, 2003
Due After AfterWithin One But Five But After
Total One Within Within TenAmount Yield(1) Year Yield(1) Five Years Yield(1) Ten Years Yield(1) Years Yield(1)
(dollars in millions)Available-for-sale debt securitiesMortgage-backed securities(2):
U.S. Government and agency . . . $ 8,801 4.05% $29 5.05% $ 6 4.53% $ 398 5.21% $ 8,368 3.99%Private issue . . . . . . . . . . . . . . 1,894 3.66 – – 3 11.51 23 12.11 1,868 3.58
Total mortgage-backed securities . 10,695 3.98 29 5.05 9 6.87 421 5.46 10,236 3.91Investment securities:
U.S. Government and agency . . . 25,615 3.91 23 6.39 10,243 2.91 13,468 4.31 1,881 6.46Other debt securities . . . . . . . . . 262 5.53 2 5.21 14 5.53 39 5.62 207 5.51
Total investment securities . . . . 25,877 3.93 25 6.27 10,257 2.91 13,507 4.32 2,088 6.37
Total fair value of debtsecurities . . . . . . . . . . . . $36,572 3.94 $54 5.61 $10,266 2.91 $13,928 4.35 $12,324 4.35
(1) Weighted average yield at end of year is based on the amortized cost of the securities. The weighted average yield excludesprincipal-only strips.
(2) Mortgage-backed securities were allocated based on contractual principal maturities assuming no prepayments.
Pledged securities having a fair value of $23.00 billion and an amortized cost of $23.20 billion aresubject to certain agreements which may allow the secured party to either sell, rehypothecate or otherwisepledge the securities. In addition, the Company pledged securities with a fair value of $3.17 billion and anamortized cost of $3.29 billion under agreement whereby the secured party does not have the right to sellor repledge the securities. At December 31, 2003, the Company has accepted as collateral, with rights torepledge, securities with a fair value of $413 million.
At December 31, 2003, there were no securities of any single issuer, other than U.S. Government andagency securities, which exceeded 10% of stockholders’ equity.
97

WASHINGTON MUTUAL, INC. AND SUBSIDIARIES
NOTES TO CONSOLIDATED FINANCIAL STATEMENTS (Continued)
Note 6: Loans Held in Portfolio
Loans held in portfolio consisted of the following:
December 31,
2003 2002
(in millions)
Loans secured by real estate:Home . . . . . . . . . . . . . . . . . . . . . . . . . . . . . . . . . . . . . . . . . . . . . . . . . . . . . $100,043 $ 82,842Purchased specialty mortgage finance . . . . . . . . . . . . . . . . . . . . . . . . . . . . . . 12,973 10,128
Total home loans . . . . . . . . . . . . . . . . . . . . . . . . . . . . . . . . . . . . . . . . . . 113,016 92,970Home equity loans and lines of credit . . . . . . . . . . . . . . . . . . . . . . . . . . . . . . 27,647 16,168Home construction:
Builder(1) . . . . . . . . . . . . . . . . . . . . . . . . . . . . . . . . . . . . . . . . . . . . . . . . . 1,052 1,017Custom(2) . . . . . . . . . . . . . . . . . . . . . . . . . . . . . . . . . . . . . . . . . . . . . . . . . 1,168 932
Multi-family(3) . . . . . . . . . . . . . . . . . . . . . . . . . . . . . . . . . . . . . . . . . . . . . . . 20,324 18,000Other real estate(4) . . . . . . . . . . . . . . . . . . . . . . . . . . . . . . . . . . . . . . . . . . . . 6,649 7,986
Total loans secured by real estate . . . . . . . . . . . . . . . . . . . . . . . . . . . . . . 169,856 137,073Consumer . . . . . . . . . . . . . . . . . . . . . . . . . . . . . . . . . . . . . . . . . . . . . . . . . . . . 1,028 1,663Commercial business . . . . . . . . . . . . . . . . . . . . . . . . . . . . . . . . . . . . . . . . . . . . 4,760 5,133
Total loans held in portfolio(5) . . . . . . . . . . . . . . . . . . . . . . . . . . . . . . . . . $175,644 $143,869
(1) Represents loans to builders for the purpose of financing the acquisition, development and construction of single-familyresidences for sale.
(2) Represents construction loans made directly to the intended occupant of a single-family residence.(3) Includes multi-family construction balances of $325 million in 2003 and $491 million in 2002.(4) Includes other commercial real estate construction balances of $382 million in 2003 and $469 million in 2002.(5) Includes net unamortized deferred loan origination costs of $1.01 billion at December 31, 2003 and $587 million at December 31,
2002.
The amount of impaired loans and the related specific or formula allowances were as follows:
December 31,
2003 2002
(in millions)
With allowances . . . . . . . . . . . . . . . . . . . . . . . . . . . . . . . . . . . . . . . $107 $ 418Without allowances . . . . . . . . . . . . . . . . . . . . . . . . . . . . . . . . . . . . 758 899
$865 $1,317
Allowance for impaired loans . . . . . . . . . . . . . . . . . . . . . . . . . . . . . $ 16 $ 216
The average balance of impaired loans and the related interest income recognized were as follows:
Year Ended December 31,
2003 2002 2001
(in millions)
Average balance of impaired loans . . . . . . . . . . . . . . . . . . . $1,193 $1,248 $910Interest income recognized . . . . . . . . . . . . . . . . . . . . . . . . 57 67 76
98

WASHINGTON MUTUAL, INC. AND SUBSIDIARIES
NOTES TO CONSOLIDATED FINANCIAL STATEMENTS (Continued)
Loans totaling $79.44 billion and $75.20 billion at December 31, 2003 and 2002 were pledged to secureadvances from FHLBs.
Changes in the allowance for loan and lease losses were as follows:
Year Ended December 31,
2003 2002 2001
(in millions)
Balance, beginning of year . . . . . . . . . . . . . . . . . . . . . . . . . . . . . . . . . . . . . $1,503 $1,278 $ 909Allowance transferred to loans held for sale . . . . . . . . . . . . . . . . . . . . . . . . (3) (31) –Allowance acquired through business combinations . . . . . . . . . . . . . . . . . . . – 148 120Allowance for certain loan commitments . . . . . . . . . . . . . . . . . . . . . . . . . . 17 (48) –Provision for loan and lease losses . . . . . . . . . . . . . . . . . . . . . . . . . . . . . . . 42(1) 404 426
1,559 1,751 1,455Loans charged off:
Loans secured by real estate:Home . . . . . . . . . . . . . . . . . . . . . . . . . . . . . . . . . . . . . . . . . . . . . . . . (65) (52) (29)Purchased specialty mortgage finance . . . . . . . . . . . . . . . . . . . . . . . . . . (39) (33) (25)
Total home loan charge-offs . . . . . . . . . . . . . . . . . . . . . . . . . . . . . . . (104) (85) (54)Home equity loans and lines of credit . . . . . . . . . . . . . . . . . . . . . . . . . (14) (14) (4)Home construction(2) . . . . . . . . . . . . . . . . . . . . . . . . . . . . . . . . . . . . . (2) (1) –Multi-family . . . . . . . . . . . . . . . . . . . . . . . . . . . . . . . . . . . . . . . . . . . . (5) (1) –Other real estate . . . . . . . . . . . . . . . . . . . . . . . . . . . . . . . . . . . . . . . . (97) (60) (35)
Total loans secured by real estate . . . . . . . . . . . . . . . . . . . . . . . . . . . (222) (161) (93)Consumer . . . . . . . . . . . . . . . . . . . . . . . . . . . . . . . . . . . . . . . . . . . . . . . (69) (70) (51)Commercial business . . . . . . . . . . . . . . . . . . . . . . . . . . . . . . . . . . . . . . . (79) (73) (49)
Total loans charged off . . . . . . . . . . . . . . . . . . . . . . . . . . . . . . . . . . (370) (304) (193)Recoveries of loans previously charged off:
Loans secured by real estate:Home . . . . . . . . . . . . . . . . . . . . . . . . . . . . . . . . . . . . . . . . . . . . . . . . 10 2 2Purchased specialty mortgage finance . . . . . . . . . . . . . . . . . . . . . . . . . . 3 – –
Total home loan recoveries . . . . . . . . . . . . . . . . . . . . . . . . . . . . . . . 13 2 2Home equity loans and lines of credit . . . . . . . . . . . . . . . . . . . . . . . . . 1 1 1Multi-family . . . . . . . . . . . . . . . . . . . . . . . . . . . . . . . . . . . . . . . . . . . . 1 1 –Other real estate . . . . . . . . . . . . . . . . . . . . . . . . . . . . . . . . . . . . . . . . 17 12 3
Total loans secured by real estate charged off . . . . . . . . . . . . . . . . . . 32 16 6Consumer . . . . . . . . . . . . . . . . . . . . . . . . . . . . . . . . . . . . . . . . . . . . . . . 15 13 4Commercial business . . . . . . . . . . . . . . . . . . . . . . . . . . . . . . . . . . . . . . . 14 27 6
Total recoveries of loans previously charged off . . . . . . . . . . . . . . . . . 61 56 16
Net charge-offs . . . . . . . . . . . . . . . . . . . . . . . . . . . . . . . . . . . . . . (309) (248) (177)
Balance, end of year . . . . . . . . . . . . . . . . . . . . . . . . . . . . . . . . . . . . . . . . . $1,250 $1,503 $1,278
(1) Includes a $202 million reversal of provision for loan and lease losses recorded in the fourth quarter.(2) Represents loans to builders for the purpose of financing the acquisition, development and construction of single-family
residences for sale and construction loans made directly to the intended occupant of a single-family residence.
99

WASHINGTON MUTUAL, INC. AND SUBSIDIARIES
NOTES TO CONSOLIDATED FINANCIAL STATEMENTS (Continued)
The total amount of loans held in portfolio which were 90 days or more contractually past due and stillaccruing interest was $46 million and $60 million at December 31, 2003 and 2002.
The total amount of nonaccrual loans held in portfolio at December 31, 2003 and 2002 was$1.63 billion and $2.16 billion. The total amount of nonaccrual loans held for sale at December 31, 2003and 2002 was $66 million and $119 million.
Note 7: Mortgage Banking Activities
Securitization of Assets
During 2003, 2002 and 2001, the Company sold mortgage loans and servicing rights in securitizationtransactions and retained servicing responsibilities as well as senior and subordinated interests. TheCompany receives annual servicing fees equal to a percentage of the outstanding principal balance of theloans being serviced and rights to cash flows remaining after the investors in the securitization trust havereceived their contractual payments. The allocated carrying values of loans securitized and sold during theyears ended December 31, 2003, 2002 and 2001 were $252.39 billion, $165.02 billion and $103.17 billion.Investors and securitization trusts have recourse of $1.66 billion and $501 million to the Company for loanssecuritized and sold during the years ended December 31, 2003 and 2002. The Company realized pretaxgains of $2.32 billion, $1.57 billion and $901 million on these securitizations for 2003, 2002 and 2001.During 2003, 2002 and 2001, the Company sold $9.00 billion, $516 million and $5.75 billion allocatedcarrying value of loans securitized in prior years and recorded pretax gains of $272 million, $6 million and$103 million from these sales.
Key economic assumptions used in measuring the value of retained interests (excluding MSR)resulting from securitizations completed during the years ended December 31, 2003, 2002 and 2001, andaccounted for as sales at the date of securitization, were as follows (rates are per annum and are weightedbased on the principal amounts securitized):
Fixed-Rate Adjustable-RateMortgage Loans Mortgage Loans
Government-Sponsored PrivatelyEnterprise Issued
Year Ended December 31, 2003(1)
Constant prepayment rate(2) . . . . . . . . . . . . . . . . . . . . . . . . . . . . . . . – –Expected weighted-average life (in years) . . . . . . . . . . . . . . . . . . . . . – –Discount rate(3) . . . . . . . . . . . . . . . . . . . . . . . . . . . . . . . . . . . . . . . . – –
Year Ended December 31, 2002Constant prepayment rate(2) . . . . . . . . . . . . . . . . . . . . . . . . . . . . . . . 35.84% 24.26%Expected weighted-average life (in years) . . . . . . . . . . . . . . . . . . . . . 5.3 3.3Discount rate(3) . . . . . . . . . . . . . . . . . . . . . . . . . . . . . . . . . . . . . . . . 6.29% 3.87%
Year Ended December 31, 2001Constant prepayment rate(2) . . . . . . . . . . . . . . . . . . . . . . . . . . . . . . . – 23.22%Expected weighted-average life (in years) . . . . . . . . . . . . . . . . . . . . . – 3.6Discount rate(3) . . . . . . . . . . . . . . . . . . . . . . . . . . . . . . . . . . . . . . . . – 5.45%
(1) The Company did not acquire retained interests resulting from securitizations completed in 2003.(2) Represents the expected lifetime average.(3) Represents the return of U.S. Treasury instruments of a particular duration plus an estimate of the incremental rate of return
over those instruments demanded by investors taking into consideration the additional risks (e.g., credit or liquidity) associatedwith a particular security.
100

WASHINGTON MUTUAL, INC. AND SUBSIDIARIES
NOTES TO CONSOLIDATED FINANCIAL STATEMENTS (Continued)
Static pool losses are calculated by summing the actual and projected future credit losses and dividingthem by the original balance of each pool of assets. As of December 31, 2003, static pool losses for allprivately issued assets and specialty home loan assets that were valued using specific credit lossassumptions were not material.
At December 31, 2003, key economic assumptions and the sensitivity of the current fair value ofretained interests (excluding MSR) to immediate changes in those assumptions were as follows:
December 31, 2003
Fixed-Rate Adjustable-RateMortgage Loans Mortgage Loans
Government-Sponsored PrivatelyEnterprise Issued
(dollars in millions)
Fair value of retained interests . . . . . . . . . . . . . . . . . . . . . . . . . . . . . . $ 813 $1,541Expected weighted-average life (in years) . . . . . . . . . . . . . . . . . . . . . . . 3.9 1.8
Constant prepayment rate(1) . . . . . . . . . . . . . . . . . . . . . . . . . . . . . . . . 50.95% 41.72%Impact on fair value of 25% decrease . . . . . . . . . . . . . . . . . . . . . . . . $ 8 $ (2)Impact on fair value of 50% decrease . . . . . . . . . . . . . . . . . . . . . . . . 20 (5)Impact on fair value of 50% increase . . . . . . . . . . . . . . . . . . . . . . . . (10) 4Impact on fair value of 100% increase . . . . . . . . . . . . . . . . . . . . . . . (16) 8
Discount rate . . . . . . . . . . . . . . . . . . . . . . . . . . . . . . . . . . . . . . . . . . . 5.44% 2.83%Impact on fair value of 10% decrease . . . . . . . . . . . . . . . . . . . . . . . . $ 23 $ 8Impact on fair value of 25% decrease . . . . . . . . . . . . . . . . . . . . . . . . 61 21Impact on fair value of 25% increase . . . . . . . . . . . . . . . . . . . . . . . . (50) (19)Impact on fair value of 50% increase . . . . . . . . . . . . . . . . . . . . . . . . (93) (38)
(1) Represents the expected lifetime average.
Key economic assumptions used in measuring the value of all capitalized MSR created during theyears ended December 31, 2003, 2002 and 2001, including securitizations recorded as sales, securitizationsentirely retained, and whole loan sales, were as follows:
Fixed-Rate Adjustable-RateMortgage Loans Mortgage Loans
Government andGovernment- Specialty
Sponsored Privately HomeEnterprise Issued All Types Loans
(rates per annum)
Year Ended December 31, 2003Constant prepayment rate(1) . . . . . . . . . . . . . . . . 18.64% 29.46% 30.66% 38.39%Discount rate . . . . . . . . . . . . . . . . . . . . . . . . . . . 8.34 9.23 9.53 19.41
Year Ended December 31, 2002Constant prepayment rate(1) . . . . . . . . . . . . . . . . 14.75 26.00 28.25 40.00Discount rate . . . . . . . . . . . . . . . . . . . . . . . . . . . 9.00 10.25 11.50 14.25
Year Ended December 31, 2001Constant prepayment rate(1) . . . . . . . . . . . . . . . . 9.50 10.50 24.50 32.00Discount rate . . . . . . . . . . . . . . . . . . . . . . . . . . . 9.75 13.50 15.50 14.00
(1) Represents the expected lifetime average.
101

WASHINGTON MUTUAL, INC. AND SUBSIDIARIES
NOTES TO CONSOLIDATED FINANCIAL STATEMENTS (Continued)
At December 31, 2003, key economic assumptions and the sensitivity of the current fair value forhome loans MSR to immediate changes in those assumptions were as follows:
December 31, 2003
Fixed-Rate Adjustable-RateMortgage Loans Mortgage Loans
Government andGovernment- Specialty
Sponsored Privately HomeEnterprise Issued All Types Loans
(dollars in millions)
Fair value of home loan MSR . . . . . . . . . . . . . . . . $ 4,495 $ 652 $1,040 $ 105Expected weighted-average life (in years) . . . . . . . . 3.8 3.8 3.6 2.2
Constant prepayment rate(1) . . . . . . . . . . . . . . . . . . 19.69% 20.54% 25.29% 39.00%Impact on fair value of 25% decrease . . . . . . . . . $ 850 $ 145 $ 239 $ 26Impact on fair value of 50% decrease . . . . . . . . . 2,048 352 591 64Impact on fair value of 25% increase . . . . . . . . . (631) (107) (172) (19)Impact on fair value of 50% increase . . . . . . . . . (1,118) (190) (306) (34)
Discount rate . . . . . . . . . . . . . . . . . . . . . . . . . . . . 8.34% 9.84% 10.01% 19.77%Impact on fair value of 10% decrease . . . . . . . . . n/a n/a n/a $ 3Impact on fair value of 25% decrease . . . . . . . . . $ 312 $ 52 $ 70 9Impact on fair value of 50% decrease . . . . . . . . . 674 113 152 n/aImpact on fair value of 25% increase . . . . . . . . . (272) (44) (61) (8)Impact on fair value of 50% increase . . . . . . . . . (510) (82) (115) (14)
(1) Represents the expected lifetime average.
These sensitivities are hypothetical and should be used with caution. As the table above demonstrates,the Company’s methodology for estimating the fair value of MSR is highly sensitive to changes inassumptions. For example, the Company’s determination of fair values uses anticipated prepaymentspeeds. Actual prepayment experience may differ and any difference may have a material effect on MSRfair value. Changes in fair value based on a variation in assumptions generally cannot be extrapolatedbecause the relationship of the change in assumption to the change in fair value may not be linear.Furthermore, the effect of a variation in a particular assumption on the fair value of the MSR is calculatedwithout changing any other assumption; in reality, changes in one factor may result in changes in another(for example, increases in market interest rates may result in lower prepayments, but credit losses mayincrease), which may magnify or counteract the sensitivities. Thus, any measurement of MSR fair value islimited by the conditions existing and assumptions made as of a particular point in time. The assumptionsused may not be appropriate if they are applied to a different point in time. Refer to Note 1 to theConsolidated Financial Statements—‘‘Summary of Significant Accounting Policies’’ for further discussionof how MSR impairment is measured.
102

WASHINGTON MUTUAL, INC. AND SUBSIDIARIES
NOTES TO CONSOLIDATED FINANCIAL STATEMENTS (Continued)
The table below summarizes certain cash flows received from and paid to securitization trusts, exceptas footnoted below:
Year Ended December 31,
2003 2002 2001
(in millions)
Proceeds from new securitization sales . . . . . . . . . . . . . . . . . . . . . . . $263,978 $167,106 $110,315Principal and interest received on retained interests . . . . . . . . . . . . . 2,353 1,925 1,633Servicing fees received(1) . . . . . . . . . . . . . . . . . . . . . . . . . . . . . . . . . 2,296 1,822 1,260Loan repurchases(1) . . . . . . . . . . . . . . . . . . . . . . . . . . . . . . . . . . . . . (8,014) (6,837) (1,502)
(1) Amounts include cash received/paid related to all transfers of loans, including securitizations accounted for as sales,securitizations retained and whole loan sales.
The tables below present quantitative information about delinquencies, net credit losses, andcomponents of securitized financial assets and other assets managed together with them (excludessecuritized assets that an entity continues to service but with which it has no other continuinginvolvement):
Year EndedDecember 31, 2003 December 31, 2003
Unpaid Principal Amount NetPrincipal of Loans on CreditBalance Nonaccrual Status(1) Losses
(in millions)Mortgage loans . . . . . . . . . . . . . . . . . . . . . . . . . . . . . . $150,083 $1,046 $246Specialty home loans . . . . . . . . . . . . . . . . . . . . . . . . . . 18,642 1,503 146
Total loans managed . . . . . . . . . . . . . . . . . . . . . . . $168,725 $2,549 $392
Consisting of:Loans sold, including securitizations . . . . . . . . . . . . . . $ 19,916Loans held for sale and held in portfolio . . . . . . . . . . . 138,962Loans securitized and retained . . . . . . . . . . . . . . . . . . 9,847
Total loans managed . . . . . . . . . . . . . . . . . . . . . . . $168,725
(1) Refer to Note 1 to the Consolidated Financial Statements—‘‘Summary of Significant Accounting Policies’’ for further discussionof loans on nonaccrual status.
103

WASHINGTON MUTUAL, INC. AND SUBSIDIARIES
NOTES TO CONSOLIDATED FINANCIAL STATEMENTS (Continued)
Year EndedDecember 31, 2002 December 31, 2002
Unpaid Principal Amount NetPrincipal of Loans on CreditBalance Nonaccrual Status(1) Losses
(in millions)Mortgage loans . . . . . . . . . . . . . . . . . . . . . . . . . . . . . . $162,225 $1,643 $142Specialty home loans . . . . . . . . . . . . . . . . . . . . . . . . . . 13,105 1,034 61
Total loans managed . . . . . . . . . . . . . . . . . . . . . . . $175,330 $2,677 $203
Consisting of:Loans sold, including securitizations . . . . . . . . . . . . . . $ 21,957Loans held for sale and held in portfolio . . . . . . . . . . . 136,731Loans securitized and retained . . . . . . . . . . . . . . . . . . 16,642
Total loans managed . . . . . . . . . . . . . . . . . . . . . . . $175,330
(1) Refer to Note 1 to the Consolidated Financial Statements—‘‘Summary of Significant Accounting Policies’’ for further discussionof loans on nonaccrual status.
Year EndedDecember 31, 2001 December 31, 2001
Unpaid Principal Amount NetPrincipal of Loans on CreditBalance Nonaccrual Status(1) Losses
(in millions)Mortgage loans . . . . . . . . . . . . . . . . . . . . . . . . . . . . . . $160,113 $1,727 $47Specialty home loans . . . . . . . . . . . . . . . . . . . . . . . . . . 8,051 614 21
Total loans managed . . . . . . . . . . . . . . . . . . . . . . . $168,164 $2,341 $68
Consisting of:Loans sold, including securitizations . . . . . . . . . . . . . . $ 22,124Loans held for sale and held in portfolio . . . . . . . . . . . 129,070Loans securitized and retained . . . . . . . . . . . . . . . . . . 16,970
Total loans managed . . . . . . . . . . . . . . . . . . . . . . . $168,164
(1) Refer to Note 1 to the Consolidated Financial Statements—‘‘Summary of Significant Accounting Policies’’ for further discussionof loans on nonaccrual status.
104

WASHINGTON MUTUAL, INC. AND SUBSIDIARIES
NOTES TO CONSOLIDATED FINANCIAL STATEMENTS (Continued)
Loan Servicing
Home loan mortgage banking income (expense) consisted of the following:
Year Ended December 31,
2003 2002 2001
(in millions)
Loan servicing fees . . . . . . . . . . . . . . . . . . . . . . . . . . . . . . . . . . . . . . . . . $2,273 $ 2,237 $ 1,375Amortization of MSR . . . . . . . . . . . . . . . . . . . . . . . . . . . . . . . . . . . . . . . (3,269) (2,616) (1,054)MSR recovery (impairment) . . . . . . . . . . . . . . . . . . . . . . . . . . . . . . . . . . 712 (3,219) (1,701)Other, net . . . . . . . . . . . . . . . . . . . . . . . . . . . . . . . . . . . . . . . . . . . . . . . (592) (271) (141)
Net home loan servicing expense . . . . . . . . . . . . . . . . . . . . . . . . . . . . . (876) (3,869) (1,521)Revaluation gain from derivatives . . . . . . . . . . . . . . . . . . . . . . . . . . . . . . 338 2,517 –Net settlement income from certain interest-rate swaps . . . . . . . . . . . . . . . 543 382 –Gain from mortgage loans . . . . . . . . . . . . . . . . . . . . . . . . . . . . . . . . . . . . 1,250 1,375 936Loan related income . . . . . . . . . . . . . . . . . . . . . . . . . . . . . . . . . . . . . . . . 399 268 156Gain on sale of originated mortgage-backed securities . . . . . . . . . . . . . . . 320 34 117
Total home loan mortgage banking income (expense) . . . . . . . . . . . . . . $1,974 $ 707 $ (312)
Changes in the balance of MSR, net of the valuation allowance, were as follows:
Year Ended December 31,
2003 2002 2001
(in millions)
Balance, beginning of year . . . . . . . . . . . . . . . . . . . . . . . . . . . . . . . . . . . $ 5,341 $ 6,241 $ 1,017Home loans:
Additions through acquisitions . . . . . . . . . . . . . . . . . . . . . . . . . . . . . – 1,888 4,818Other additions . . . . . . . . . . . . . . . . . . . . . . . . . . . . . . . . . . . . . . . 4,203 4,031 3,323Amortization . . . . . . . . . . . . . . . . . . . . . . . . . . . . . . . . . . . . . . . . . (3,269) (2,616) (1,054)Recovery (impairment) . . . . . . . . . . . . . . . . . . . . . . . . . . . . . . . . . . 712 (3,219) (1,701)Sales . . . . . . . . . . . . . . . . . . . . . . . . . . . . . . . . . . . . . . . . . . . . . . . (638) (997) (174)
Net change in commercial real estate MSR . . . . . . . . . . . . . . . . . . . . . 5 13 12
Balance, end of year(1) . . . . . . . . . . . . . . . . . . . . . . . . . . . . . . . . . . . . . . $ 6,354 $ 5,341 $ 6,241
(1) At December 31, 2003, 2002 and 2001, aggregate MSR fair value was $6.39 billion, $5.38 billion and $6.27 billion.
Changes in the valuation allowance for MSR were as follows:
Year Ended December 31,
2003 2002 2001
(in millions)
Balance, beginning of year . . . . . . . . . . . . . . . . . . . . . . . . . . . . . . . . . . . . $ 4,521 $1,714 $ 13(Recovery) impairment . . . . . . . . . . . . . . . . . . . . . . . . . . . . . . . . . . . . . (712) 3,219 1,701Other than temporary impairment . . . . . . . . . . . . . . . . . . . . . . . . . . . . . (1,115) – –Sales . . . . . . . . . . . . . . . . . . . . . . . . . . . . . . . . . . . . . . . . . . . . . . . . . . (259) (412) –
Balance, end of year . . . . . . . . . . . . . . . . . . . . . . . . . . . . . . . . . . . . . . . . $ 2,435 $4,521 $1,714
105

WASHINGTON MUTUAL, INC. AND SUBSIDIARIES
NOTES TO CONSOLIDATED FINANCIAL STATEMENTS (Continued)
At December 31, 2003, the expected weighted average life of the Company’s MSR was 3.8 years.Projected amortization expense for the gross carrying value of MSR at December 31, 2003 is estimated tobe as follows (in millions):
2004 . . . . . . . . . . . . . . . . . . . . . . . . . . . . . . . . . . . . . . . . . . . . . . . . . . . . $ 2,1472005 . . . . . . . . . . . . . . . . . . . . . . . . . . . . . . . . . . . . . . . . . . . . . . . . . . . . 1,4692006 . . . . . . . . . . . . . . . . . . . . . . . . . . . . . . . . . . . . . . . . . . . . . . . . . . . . 1,0602007 . . . . . . . . . . . . . . . . . . . . . . . . . . . . . . . . . . . . . . . . . . . . . . . . . . . . 8082008 . . . . . . . . . . . . . . . . . . . . . . . . . . . . . . . . . . . . . . . . . . . . . . . . . . . . 631After 2008 . . . . . . . . . . . . . . . . . . . . . . . . . . . . . . . . . . . . . . . . . . . . . . . 2,674
Gross carrying value of MSR . . . . . . . . . . . . . . . . . . . . . . . . . . . . . . . . . . 8,789Less: valuation allowance . . . . . . . . . . . . . . . . . . . . . . . . . . . . . . . . . . . . . (2,435)
Net carrying value of MSR . . . . . . . . . . . . . . . . . . . . . . . . . . . . . . . . . . $ 6,354
The projected amortization expense of MSR is an estimate and should be used with caution. Theamortization expense for future periods was calculated by applying the same quantitative factors, such asactual MSR prepayment experience and discount rates, as were used to determine amortization expense asof year end 2003. These factors are inherently subject to significant fluctuations, primarily due to the effectthat changes in mortgage rates have on loan prepayment experience. Accordingly, any projection of MSRamortization in future periods is limited by the conditions that existed at the time the calculations wereperformed, and may not be indicative of actual amortization expense that will be recorded in futureperiods.
Changes in the portfolio of loans serviced for others were as follows:
Year Ended December 31,
2003 2002
(in millions)
Balance, beginning of year . . . . . . . . . . . . . . . . . . . . . . . . . . . . . . . . . . . . . . . $ 604,504 $ 382,500Home loans:
Additions through acquisitions . . . . . . . . . . . . . . . . . . . . . . . . . . . . . . . . . – 178,884Other additions . . . . . . . . . . . . . . . . . . . . . . . . . . . . . . . . . . . . . . . . . . . 342,871 249,855Sales . . . . . . . . . . . . . . . . . . . . . . . . . . . . . . . . . . . . . . . . . . . . . . . . . . . (3,155) –Loan payments and other . . . . . . . . . . . . . . . . . . . . . . . . . . . . . . . . . . . . (362,319) (208,337)
Net change in commercial real estate loans serviced for others . . . . . . . . . . . 768 1,602
Balance, end of year . . . . . . . . . . . . . . . . . . . . . . . . . . . . . . . . . . . . . . . . . . . $ 582,669 $ 604,504
Washington Mutual Bank, FA (‘‘WMBFA’’) and Washington Mutual Bank (‘‘WMB’’), wholly ownedsubsidiaries of Washington Mutual, Inc., are approved GNMA issuers. WMBFA and WMB are required tocomply with the GNMA Mortgage-Backed Securities Guide (the ‘‘GNMA Guide’’), which includesminimum standards of net worth. Washington Mutual, Inc., WMBFA and WMB are required to ensurethey meet the minimum net worth requirements throughout the year and are required to submit annual networth calculations within 90 days after their fiscal year end. Because WMB’s consolidated financialstatements are not audited, the parent holding company of WMB, Washington Mutual, Inc., is also subjectto the minimum net worth requirements. The GNMA Guide establishes minimum net worth requirementsbased on the size of the GNMA commitment authority issued and the outstanding balance of all GNMAsecurities. The adjusted net worth of Washington Mutual, Inc., WMBFA and WMB is determined by
106

WASHINGTON MUTUAL, INC. AND SUBSIDIARIES
NOTES TO CONSOLIDATED FINANCIAL STATEMENTS (Continued)
reducing equity by the amount of unacceptable assets for purposes of the calculation, which includegoodwill, unrealized gains on securities available-for-sale and other unacceptable assets. If WashingtonMutual, Inc., WMBFA or WMB fail to comply with the minimum net worth requirements established bythe GNMA Guide, GNMA may suspend or terminate WMBFA’s and WMB’s status as an issuer if thedeficiency is not corrected in a timely manner.
Following are the GNMA net worth requirements and the adjusted net worth of WashingtonMutual, Inc., WMBFA and WMB as of December 31, 2003 and 2002.
Washington Mutual, Inc.Year Ended
December 31,
2003 2002
(in millions)
Required net worth . . . . . . . . . . . . . . . . . . . . . . . . . . . . . . . . . . $ 1 $ 1Adjusted net worth . . . . . . . . . . . . . . . . . . . . . . . . . . . . . . . . . . 10,820 6,927
Excess net worth . . . . . . . . . . . . . . . . . . . . . . . . . . . . . . . . . . . . $10,819 $6,926
WMBFAYear Ended
December 31,
2003 2002
(in millions)
Required net worth . . . . . . . . . . . . . . . . . . . . . . . . . . . . . . . . . . $ 141 $ 180Adjusted net worth . . . . . . . . . . . . . . . . . . . . . . . . . . . . . . . . . . 10,851 8,305
Excess net worth . . . . . . . . . . . . . . . . . . . . . . . . . . . . . . . . . . . . $10,710 $8,125
WMBYear Ended
December 31,
2003 2002
(in millions)
Required net worth . . . . . . . . . . . . . . . . . . . . . . . . . . . . . . . . . . . $ 1 $ 1Adjusted net worth . . . . . . . . . . . . . . . . . . . . . . . . . . . . . . . . . . . 1,645 1,939
Excess net worth . . . . . . . . . . . . . . . . . . . . . . . . . . . . . . . . . . . . . $1,644 $1,938
Note 8: Goodwill and Other Intangible Assets
The Company performs an impairment assessment in the third quarter of each year or morefrequently if circumstances necessitate. During the third quarter of 2002 and 2003, the Companyperformed its annual impairment test and concluded there was no impairment to the book value of theCompany’s goodwill. Absent any impairment indicators, the Company expects to perform its nextimpairment test during the third quarter of 2004.
Statement No. 147, Acquisitions of Certain Financial Institutions, requires that an unidentifiableintangible asset that is recognized in an acquisition of a financial institution, which is accounted for as abusiness combination, in which the liabilities assumed exceed the identifiable assets acquired, be recorded
107

WASHINGTON MUTUAL, INC. AND SUBSIDIARIES
NOTES TO CONSOLIDATED FINANCIAL STATEMENTS (Continued)
as goodwill and subject to the accounting standards set forth in Statement No. 142, Goodwill and OtherIntangible Assets.
Had the Company been accounting for its goodwill under Statement No. 142 for the year ending 2001,the effect on net income would have been an increase of $134 million, from the elimination of goodwillamortized in that year, which would increase both basic and diluted earnings per share by 14 cents, net oftax.
Changes in the carrying amount of goodwill for the years ended December 31, 2003 and 2002, byreporting unit were as follows:
Year Ended December 31, 2003
Consumer Group
Retail Banking and Mortgage CommercialFinancial Services Banking Group Total
(in millions)
Balance at January 1, 2003 . . . . . . $3,811 $1,528 $874 $6,213Adjustments related to the
acquisition of Dime Bancorp,Inc. . . . . . . . . . . . . . . . . . . . . (12) (4) (1) (17)
Balance at December 31, 2003 . . . . $3,799 $1,524 $873 $6,196
During the first quarter of 2003, the Company decreased goodwill associated with the Dimeacquisition by $17 million due to a fair value adjustment of certain available-for-sale securities.
Year Ended December 31, 2002
Consumer Group
Retail Banking and Mortgage CommercialFinancial Services Banking Group Total
(in millions)
Balance at January 1, 2002(1) . . . . . $ 980 $ 584 $552 $2,116Adjustments related to the
acquisition of Dime Bancorp,Inc. . . . . . . . . . . . . . . . . . . . . 2,797 925 322 4,044
Other . . . . . . . . . . . . . . . . . . . . 34 19 – 53
Balance at December 31, 2002 . . . . $3,811 $1,528 $874 $6,213
(1) The balance at January 1, 2002 has been restated to reflect the adoption of Statement No. 147.
During the first quarter of 2002, the Company acquired a $223 million core deposit intangible as aresult of the Dime acquisition. During the second quarter of 2002, the Company increased goodwillassociated with the Dime acquisition by $59 million due to various adjustments to the fair values assignedto the assets received and liabilities assumed and a $77 million adjustment of the total purchase pricerelated to the valuation of Dime stock options. During the third quarter of 2002, the Company increasedthe goodwill associated with the Dime acquisition by $32 million due to an adjustment of $17 millionrelated to the Dime auto-finance loan portfolio and an increase in the estimated accumulatedpost-retirement benefit obligation for Dime employees of $15 million.
108

WASHINGTON MUTUAL, INC. AND SUBSIDIARIES
NOTES TO CONSOLIDATED FINANCIAL STATEMENTS (Continued)
At December 31, 2003 and 2002, the Company’s core deposit intangible balances were $251 millionand $311 million, net of accumulated amortization of $382 million and $322 million. The Company has noidentifiable intangible assets with indefinite useful lives.
Amortization expense for the net carrying amount of the core deposit intangible at December 31,2003 is estimated to be approximately $50 million over each of the next five years.
Note 9: Other Assets
Other assets consisted of the following:
Year EndedDecember 31,
2003 2002
(in millions)
Premises and equipment . . . . . . . . . . . . . . . . . . . . . . . . . . . . . . $ 3,286 $ 2,840Investment in bank-owned life insurance . . . . . . . . . . . . . . . . . . 2,582 2,471Accrued interest receivable . . . . . . . . . . . . . . . . . . . . . . . . . . . . 1,558 1,439Foreclosed assets . . . . . . . . . . . . . . . . . . . . . . . . . . . . . . . . . . . 311 328Other intangible assets . . . . . . . . . . . . . . . . . . . . . . . . . . . . . . . 251 311Derivatives . . . . . . . . . . . . . . . . . . . . . . . . . . . . . . . . . . . . . . . . 1,457 4,105Trading securities . . . . . . . . . . . . . . . . . . . . . . . . . . . . . . . . . . . 1,381 336Accounts receivable . . . . . . . . . . . . . . . . . . . . . . . . . . . . . . . . . 4,309 1,698Other . . . . . . . . . . . . . . . . . . . . . . . . . . . . . . . . . . . . . . . . . . . 1,366 1,424
Total other assets . . . . . . . . . . . . . . . . . . . . . . . . . . . . . . . . $16,501 $14,952
Depreciation expense for 2003, 2002 and 2001 was $492 million, $355 million and $282 million.
The Company leases various financial center offices, office facilities and equipment under capital andnoncancelable operating leases which expire at various dates through 2036. Some leases contain escalationprovisions for adjustments in the consumer price index and provide for renewal options for five- toten-year periods. Rental expense, including amounts paid under month-to-month cancelable leases,amounted to $458 million, $348 million and $277 million in 2003, 2002 and 2001.
109

WASHINGTON MUTUAL, INC. AND SUBSIDIARIES
NOTES TO CONSOLIDATED FINANCIAL STATEMENTS (Continued)
Note 10: Deposits
Deposits consisted of the following:
Year EndedDecember 31,
2003 2002
(in millions)
Checking accounts:Noninterest bearing . . . . . . . . . . . . . . . . . . . . . . . . . . . . . . $ 27,906 $ 35,730Interest bearing . . . . . . . . . . . . . . . . . . . . . . . . . . . . . . . . . 68,318 56,132
Total checking accounts . . . . . . . . . . . . . . . . . . . . . . . . . 96,224 91,862Savings accounts . . . . . . . . . . . . . . . . . . . . . . . . . . . . . . . . . . 11,029 10,313Money market deposit accounts . . . . . . . . . . . . . . . . . . . . . . . 17,971 19,573Time deposit accounts:
Due within one year . . . . . . . . . . . . . . . . . . . . . . . . . . . . . 18,474 23,136After one year but within two years . . . . . . . . . . . . . . . . . . 4,111 4,383After two but within three years . . . . . . . . . . . . . . . . . . . . . 2,218 2,678After three but within four years . . . . . . . . . . . . . . . . . . . . 1,593 1,172After four but within five years . . . . . . . . . . . . . . . . . . . . . . 844 1,560After five years . . . . . . . . . . . . . . . . . . . . . . . . . . . . . . . . . 717 839
Total time deposit accounts . . . . . . . . . . . . . . . . . . . . . . . 27,957 33,768
Total deposits . . . . . . . . . . . . . . . . . . . . . . . . . . . . . . . $153,181 $155,516
Accrued but unpaid interest on deposits included in other liabilities totaled $27 million and$55 million at December 31, 2003 and 2002.
Time deposit accounts in amounts of $100,000 or more totaled $6.92 billion and $7.01 billion atDecember 31, 2003 and 2002. At December 31, 2003, $1.77 billion of these deposits mature within threemonths, $880 million mature in over three to six months, $1.19 billion mature in over six months to oneyear, and $3.08 billion mature after one year.
Note 11: Securities Sold Under Agreements to Repurchase
Scheduled maturities of securities sold under agreements to repurchase (‘‘repurchase agreements’’)were as follows:
December 31,
2003 2002
(in millions)
Due within 30 days . . . . . . . . . . . . . . . . . . . . . . . . . . . . . . . . . . $15,060 $ 751After 30 but within 90 days . . . . . . . . . . . . . . . . . . . . . . . . . . . . 1,469 200After 90 but within 180 days . . . . . . . . . . . . . . . . . . . . . . . . . . . – 101After 180 days but within one year . . . . . . . . . . . . . . . . . . . . . . 250 –After one year . . . . . . . . . . . . . . . . . . . . . . . . . . . . . . . . . . . . . 11,554 15,665
Total repurchase agreements . . . . . . . . . . . . . . . . . . . . . . . . . $28,333 $16,717
110

WASHINGTON MUTUAL, INC. AND SUBSIDIARIES
NOTES TO CONSOLIDATED FINANCIAL STATEMENTS (Continued)
Financial data pertaining to repurchase agreements were as follows:
Year Ended December 31,
2003 2002 2001
(dollars in millions)
Weighted average interest rate, end of year . . . . . . . . . . . . . . . . . . . . . . 1.23% 2.13% 1.74%Weighted average interest rate during the year . . . . . . . . . . . . . . . . . . . . 2.44 2.31 4.05Average balance of repurchase agreements . . . . . . . . . . . . . . . . . . . . . . $22,318 $34,830 $29,582Maximum amount outstanding at any month end . . . . . . . . . . . . . . . . . . 30,052 58,504 39,447
The total interest expense on repurchase agreements was $545 million, $804 million and$1,197 million for the years ended December 31, 2003, 2002 and 2001.
At December 31, 2003 interest rate caps, swaps, and swaptions embedded in repurchase agreementswere as follows:
WeightedWeighted Weighted Weighted Index at Average
Notional Average Average Average December 31, RemainingAmount Strike Rate Pay Rate Receive Rate Index 2003 Life
(dollars (inin months)
millions)
Caps . . . . . . . . . . . . . . $ 500 7.75% n/a n/a 3 month LIBOR 1.15% 10Swaps . . . . . . . . . . . . . . 2,500 n/a 4.09% 1.16% 3 month LIBOR 1.15 41Swaptions . . . . . . . . . . . 500 6.21 – – 3 month LIBOR 1.15 1
Note 12: Advances from FHLBs
As members of the FHLBs of San Francisco, Seattle, New York and Dallas, WMBFA, WMB andWashington Mutual Bank fsb (‘‘WMBfsb’’) maintain credit lines that are percentages of their totalregulatory assets, subject to collateralization requirements. Advances are collateralized in the aggregate byall stock owned of the FHLBs, by deposits with the FHLBs, and by certain mortgages or deeds of trust andsecurities of the U.S. Government and its agencies. The maximum amount of credit, which the FHLBs willextend for purposes other than meeting withdrawals, varies from time to time in accordance with theirpolicies. The interest rates charged by the FHLBs for advances vary depending upon maturity, the cost offunds of the individual FHLB and the purpose of the borrowing.
111

WASHINGTON MUTUAL, INC. AND SUBSIDIARIES
NOTES TO CONSOLIDATED FINANCIAL STATEMENTS (Continued)
Scheduled maturities of advances from FHLBs were as follows:
December 31,
2003 2002
Ranges of Ranges ofAmount Interest Rates Amount Interest Rates
(dollars in millions)
Due within one year . . . . . . . . . . . . . . . . . . . . . . . . . . $37,017 1.08 - 8.65% $29,067 1.25 - 7.07%After one but within two years . . . . . . . . . . . . . . . . . . 3,216 1.10 - 7.45 11,266 1.35 - 8.65After two but within three years . . . . . . . . . . . . . . . . . 4,211 1.11 - 5.32 3,228 1.35 - 7.45After three but within four years . . . . . . . . . . . . . . . . . 3,160 1.10 - 6.60 4,211 1.35 - 5.32After four but within five years . . . . . . . . . . . . . . . . . . 486 1.10 - 6.93 3,163 1.35 - 6.60After five years . . . . . . . . . . . . . . . . . . . . . . . . . . . . . 240 2.80 - 8.57 330 2.80 - 8.57
Total advances from FHLBs . . . . . . . . . . . . . . . . . $48,330 $51,265
Financial data pertaining to advances from FHLBs were as follows:
Year Ended December 31,
2003 2002 2001
(dollars in millions)
Weighted average interest rate, end of year . . . . . . . . . . . . . . . . . . . . . . 1.28% 1.91% 2.45%Weighted average interest rate during the year . . . . . . . . . . . . . . . . . . . . 2.62 2.82 4.58Average balance of advances from FHLBs . . . . . . . . . . . . . . . . . . . . . . . $49,441 $59,369 $63,732Maximum amount outstanding at any month end . . . . . . . . . . . . . . . . . . 61,323 66,103 67,128
The total interest expense on advances from FHLBs was $1,296 million, $1,676 million and$2,918 million for the years ended December 31, 2003, 2002 and 2001.
112

WASHINGTON MUTUAL, INC. AND SUBSIDIARIES
NOTES TO CONSOLIDATED FINANCIAL STATEMENTS (Continued)
Note 13: Other Borrowings
Other borrowings consisted of the following:
December 31,
2003 2002
Interest InterestAmount(2) Rate(s) Amount(2) Rate(s)
(dollars in millions)
Senior notes(1):Fixed rate:
Due in 2003 . . . . . . . . . . . . . . . . . . . . . . . . . . . . $ – –% $ 302 6.20 - 7.32%Due in 2004 . . . . . . . . . . . . . . . . . . . . . . . . . . . . 256 4.57 - 6.75 265 4.57 - 6.75Due in 2005 . . . . . . . . . . . . . . . . . . . . . . . . . . . . 399 2.40 - 7.25 150 7.25Due in 2006 . . . . . . . . . . . . . . . . . . . . . . . . . . . . 1,103 7.50 1,135 7.50Due in 2007 . . . . . . . . . . . . . . . . . . . . . . . . . . . . 996 5.63 995 5.63Due in 2008 . . . . . . . . . . . . . . . . . . . . . . . . . . . . 758 4.38 762 4.38Due in 2009 . . . . . . . . . . . . . . . . . . . . . . . . . . . . 995 4.00 – –
Floating rate:Due in 2003 . . . . . . . . . . . . . . . . . . . . . . . . . . . . – – 849 VariousDue in 2004 . . . . . . . . . . . . . . . . . . . . . . . . . . . . 1,450 Various 1,449 VariousDue in 2005 . . . . . . . . . . . . . . . . . . . . . . . . . . . . 399 Various – –Due in 2006 . . . . . . . . . . . . . . . . . . . . . . . . . . . . 823 Various 880 Various
Subordinated notes(1):Fixed rate:
Due in 2004 . . . . . . . . . . . . . . . . . . . . . . . . . . . . 250 6.50 - 7.88 250 6.50 - 7.88Due in 2006 . . . . . . . . . . . . . . . . . . . . . . . . . . . . 100 6.63 100 6.63Due in 2007 . . . . . . . . . . . . . . . . . . . . . . . . . . . . 233 8.88 236 8.88Due in 2009 . . . . . . . . . . . . . . . . . . . . . . . . . . . . 157 8.00 158 8.00Due in 2010 . . . . . . . . . . . . . . . . . . . . . . . . . . . . 600 8.25 621 8.25Due in 2011 . . . . . . . . . . . . . . . . . . . . . . . . . . . . 1,114 6.88 1,144 6.88Due in 2013 . . . . . . . . . . . . . . . . . . . . . . . . . . . . 742 5.50 757 5.50Due in 2026 . . . . . . . . . . . . . . . . . . . . . . . . . . . . 149 8.36 149 8.36Due in 2027 . . . . . . . . . . . . . . . . . . . . . . . . . . . . 900 8.21 - 9.33 913 8.21 - 9.33Due in 2041 . . . . . . . . . . . . . . . . . . . . . . . . . . . . 734 5.38 732 5.38
Secured lines of credit:Floating rate:
Due in 2003 . . . . . . . . . . . . . . . . . . . . . . . . . . . . – – 994 VariousDue in 2004 . . . . . . . . . . . . . . . . . . . . . . . . . . . . 2,717 Various – –
Other . . . . . . . . . . . . . . . . . . . . . . . . . . . . . . . . . . . . 608 – 1,871 –
Total other borrowings . . . . . . . . . . . . . . . . . . . . $15,483 $14,712
(1) Inclusive of capitalized issuance costs.(2) Maturities listed are based on contractual terms and do not include redemption or call dates.
At December 31, 2003, the Company had shelf registration statements under which the Company mayissue debt securities, preferred stock and depositary shares totaling $7 billion, of which $5.35 billionremains available for issuance.
113

WASHINGTON MUTUAL, INC. AND SUBSIDIARIES
NOTES TO CONSOLIDATED FINANCIAL STATEMENTS (Continued)
At December 31, 2003, the Company had a Global Bank Note Program under which the Company canissue senior and subordinated notes totaling $20 billion, of which the entire amount remains available forissuance.
At December 31, 2003, the Company had unused secured borrowing lines totaling $573 million withthe Federal Reserve Bank discount window.
At December 31, 2003, the Company, through Long Beach Mortgage, had revolving credit facilitieswith non-affiliated lenders totaling $4 billion, with a remaining availability of $1.3 billion.
On August 12, 2002, Washington Mutual, Inc. and Washington Mutual Finance entered into athree-year revolving credit facility totaling $800 million which provides back-up for certain commercialpaper programs as well as funds for general corporate purposes. In December 2003 this credit facility wasamended to exclude Washington Mutual Finance due to the sale of Washington Mutual Finance inJanuary 2004. At December 31, 2003, there was $333 million available under this facility for purposes otherthan back-up of commercial paper.
Note 14: Income Taxes
Income taxes (benefits) from continuing operations consisted of the following:
Year Ended December 31,
2003 2002 2001
(in millions)
Current:Federal . . . . . . . . . . . . . . . . . . . . . . . . . . . . . . . . . . . $1,417 $ 3,043 $1,636State and local . . . . . . . . . . . . . . . . . . . . . . . . . . . . . . 256 386 165Payments in lieu . . . . . . . . . . . . . . . . . . . . . . . . . . . . 32 38 58
Total current . . . . . . . . . . . . . . . . . . . . . . . . . . . . . 1,705 3,467 1,859Deferred:
Federal . . . . . . . . . . . . . . . . . . . . . . . . . . . . . . . . . . . 504 (1,042) 2State and local . . . . . . . . . . . . . . . . . . . . . . . . . . . . . . 55 (168) (12)Payments in lieu . . . . . . . . . . . . . . . . . . . . . . . . . . . . (28) (40) (66)
Total deferred . . . . . . . . . . . . . . . . . . . . . . . . . . . . 531 (1,250) (76)
Total income taxes . . . . . . . . . . . . . . . . . . . . . . . . $2,236 $ 2,217 $1,783
Provisions of the Small Business Job Protection Act of 1996 (the ‘‘Job Protection Act’’) significantlyaltered the Company’s tax bad debt deduction method and the circumstances that would require a tax baddebt reserve recapture. Prior to enactment of the Job Protection Act, savings institutions were permitted tocompute their tax bad debt deduction through use of either the reserve method or the percentage oftaxable income method. The Job Protection Act repealed both of these methods for large savingsinstitutions and allows bad debt deductions based only on actual current losses. While repealing thereserve method for computing tax bad debt deductions, the Job Protection Act allows thrifts to retain theirexisting base year bad debt reserves but requires that reserves in excess of the balance at December 31,1987 be recaptured into taxable income.
The base year reserve is recaptured into taxable income only in limited situations, such as in the eventof certain excess distributions or complete liquidation. None of the limited circumstances requiringrecapture are contemplated by the Company. The amount of the Company’s tax bad debt reserves subject
114

WASHINGTON MUTUAL, INC. AND SUBSIDIARIES
NOTES TO CONSOLIDATED FINANCIAL STATEMENTS (Continued)
to recapture in these circumstances approximates $2.22 billion at December 31, 2003 and December 31,2002. Due to the remote nature of events that may trigger the recapture provisions, no tax liability hasbeen established in the accompanying Consolidated Financial Statements.
In January 2002, the Company completed a settlement with the Internal Revenue Service for GreatWestern for tax years 1988 through 1992. In August 2003, the Company completed a settlement with theInternal Revenue Service for Washington Mutual for tax years 1994 through 1997. The amounts payableunder the settlement agreements were previously provided for in the accrual for income taxes payable.
The Internal Revenue Service has completed its examination of Ahmanson for 1990 through 1998. Allunresolved issues have been appealed to the Internal Revenue Service Appeals Division. As ofDecember 31, 2003, the Company’s accrual for income taxes payable is sufficient to cover any expectedliabilities arising from these examinations.
The significant components of the Company’s net deferred tax asset (liability) were as follows:
December 31,
2003 2002
(in millions)
Deferred tax assets:Provision for loan and lease losses and foreclosed assets . . . . . . . . . . . . . . . . . . . $ 665 $ 736Mortgage servicing rights . . . . . . . . . . . . . . . . . . . . . . . . . . . . . . . . . . . . . . . . . 861 554Net operating loss carryforwards . . . . . . . . . . . . . . . . . . . . . . . . . . . . . . . . . . . . 197 357Compensation differences . . . . . . . . . . . . . . . . . . . . . . . . . . . . . . . . . . . . . . . . . 96 221Merger costs . . . . . . . . . . . . . . . . . . . . . . . . . . . . . . . . . . . . . . . . . . . . . . . . . . 127 131State and local taxes . . . . . . . . . . . . . . . . . . . . . . . . . . . . . . . . . . . . . . . . . . . . . 11 45Unrealized loss from securities and cash flow hedging instruments . . . . . . . . . . . . 325 –Other . . . . . . . . . . . . . . . . . . . . . . . . . . . . . . . . . . . . . . . . . . . . . . . . . . . . . . . 424 429
Total deferred tax assets . . . . . . . . . . . . . . . . . . . . . . . . . . . . . . . . . . . . . . . . 2,706 2,473Payments in lieu . . . . . . . . . . . . . . . . . . . . . . . . . . . . . . . . . . . . . . . . . . . . . . . . . (72) (100)Valuation allowance . . . . . . . . . . . . . . . . . . . . . . . . . . . . . . . . . . . . . . . . . . . . . . . (111) (210)
Deferred tax asset, net of payments in lieu and valuation allowance . . . . . . . . . 2,523 2,163Deferred tax liabilities:
Stock dividends from FHLBs . . . . . . . . . . . . . . . . . . . . . . . . . . . . . . . . . . . . . . (700) (650)Loan fees . . . . . . . . . . . . . . . . . . . . . . . . . . . . . . . . . . . . . . . . . . . . . . . . . . . . . (532) (318)Basis difference on premises and equipment . . . . . . . . . . . . . . . . . . . . . . . . . . . (541) (280)Unrealized gain from securities and cash flow hedging instruments . . . . . . . . . . . – (87)Other . . . . . . . . . . . . . . . . . . . . . . . . . . . . . . . . . . . . . . . . . . . . . . . . . . . . . . . (67) (21)
Total deferred tax liabilities . . . . . . . . . . . . . . . . . . . . . . . . . . . . . . . . . . . . . . (1,840) (1,356)
Net deferred tax asset . . . . . . . . . . . . . . . . . . . . . . . . . . . . . . . . . . . . . . . . $ 683 $ 807
The Company establishes a valuation allowance if, based on the weight of available evidence, it ismore likely than not that some portion or all of the deferred tax asset will not be realized. The valuationallowance of $111 million and $210 million at December 31, 2003 and December 31, 2002 relates primarilyto net operating losses that are limited as a result of the acquisition of Keystone Holdings, Inc.
As a result of the Keystone acquisition, the Company and certain of its affiliates are parties to anagreement (the ‘‘Assistance Agreement’’) with a predecessor of the Federal Deposit Insurance
115

WASHINGTON MUTUAL, INC. AND SUBSIDIARIES
NOTES TO CONSOLIDATED FINANCIAL STATEMENTS (Continued)
Corporation (‘‘FDIC’’), which generally provides that 75% of most of the federal tax savings andapproximately 19.5% of most of the California tax savings (as computed in accordance with the AssistanceAgreement), attributable to the Company’s utilization of certain tax loss carryovers of New West FederalSavings and Loan Association, are to be paid by the Company to the Federal Savings and Loan InsuranceCorporation Resolution Fund (‘‘Resolution Fund’’). These amounts are considered payments in lieu. TheAssistance Agreement sets forth certain special adjustments to federal taxable income to arrive at ‘‘FederalSavings and Loan Insurance Corporation taxable income,’’ which is then offset by utilizable net operatinglosses to compute the benefit due to the Resolution Fund.
As a result of the acquisition of Bank United, the Company and certain of its affiliates are also partiesto another agreement with the Resolution Fund, which provides that one-third of the sum of federal andstate tax benefits (as computed in accordance with the original acquisition agreement), attributable to theCompany’s utilization of certain tax loss carryovers of Bank United are to be paid by the Company to theResolution Fund. The obligation to share tax benefit utilization expired in 2003.
Federal and state income tax net operating loss carryforwards due to expire under current law duringthe years indicated were as follows:
December 31, 2003
Federal State
(in millions)
Expiring in:2005 . . . . . . . . . . . . . . . . . . . . . . . . . . . . . . . . . . . . . . . . . . . . . . . . . . . . . . . . . $289 $2332006 . . . . . . . . . . . . . . . . . . . . . . . . . . . . . . . . . . . . . . . . . . . . . . . . . . . . . . . . . 33 –2008 . . . . . . . . . . . . . . . . . . . . . . . . . . . . . . . . . . . . . . . . . . . . . . . . . . . . . . . . . 23 –
Total . . . . . . . . . . . . . . . . . . . . . . . . . . . . . . . . . . . . . . . . . . . . . . . . . . . . . . . $345 $233
Reconciliations between income taxes computed at statutory rates and income taxes included in theConsolidated Statements of Income were as follows:
Year Ended December 31,
2003 2002 2001
As a As a As aPercentage Percentage Percentageof Pretax of Pretax of Pretax
Amount Income Amount Income Amount Income
(dollars in millions)
Income taxes computed at statutory rates . . . . . . . $2,110 35.00% $2,102 35.00% $1,689 35.00%Tax effect of:
State income tax, net of federal tax benefit . . . . 202 3.35 142 2.36 99 2.05Other . . . . . . . . . . . . . . . . . . . . . . . . . . . . . . . (76) (1.26) (27) (0.45) (5) (0.10)
Total . . . . . . . . . . . . . . . . . . . . . . . . . . . . . . $2,236 37.09 $2,217 36.91 $1,783 36.95
Note 15: Commitments, Guarantees and Contingencies
Commitments
Commitments to extend credit are agreements to lend to customers in accordance with predeterminedcontractual provisions. These commitments are for specific periods or contain termination clauses and mayrequire the payment of a fee. The total amounts of unused commitments do not necessarily represent
116

WASHINGTON MUTUAL, INC. AND SUBSIDIARIES
NOTES TO CONSOLIDATED FINANCIAL STATEMENTS (Continued)
future credit exposure or cash requirements, in that commitments often expire without being drawn upon.Unfunded commitments to extend credit totaled $52.64 billion and $53.06 billion, which excluded$379 million and $356 million reported as part of discontinued operations at December 31, 2003 and 2002.The Company reserved $33 million and $52 million as of December 31, 2003 and 2002 to cover its lossexposure to unfunded commitments.
In order to meet the needs of its customers, the Company also issues direct-pay, standby and otherletters of credit. Letters of credit are conditional commitments issued by the Company generally toguarantee the performance of a customer to a third party in borrowing arrangements, such as commercialpaper issuances, bond financing, construction and similar transactions. Collateral may be required tosupport letters of credit in accordance with management’s evaluation of the creditworthiness of eachcustomer. The credit risk involved in issuing standby letters of credit is essentially the same as that involvedin extending loan facilities to customers. At December 31, 2003 and 2002, outstanding letters of creditissued by Washington Mutual totaled $597 million and $492 million, which included $1 million and$9 million in participations sold to other institutions.
Future minimum net rental commitments, including maintenance and other associated costs, for allnoncancelable leases were as follows:
Operating Lease(1) Capital Lease
Land and Furniture and Land and Furniture andBuildings Equipment Buildings Equipment
(in millions)
Year ending December 31,2004 . . . . . . . . . . . . . . . . . . . . . . . . . . . . . . . . . . . $ 327 $115 $ 8 $22005 . . . . . . . . . . . . . . . . . . . . . . . . . . . . . . . . . . . 304 91 7 12006 . . . . . . . . . . . . . . . . . . . . . . . . . . . . . . . . . . . 271 22 6 12007 . . . . . . . . . . . . . . . . . . . . . . . . . . . . . . . . . . . 220 8 6 –2008 . . . . . . . . . . . . . . . . . . . . . . . . . . . . . . . . . . . 181 1 6 –
Thereafter . . . . . . . . . . . . . . . . . . . . . . . . . . . . . . . . 618 – 39 –
Total . . . . . . . . . . . . . . . . . . . . . . . . . . . . . . . . . $1,921 $237 $72 $4
(1) Excludes operating lease commitments of $16 million from discontinued operations.
Certain operating leases contain escalation clauses, which correspond with increased real estate taxesand other operating expenses, and renewal options calling for increased rents as the leases are renewed.No restrictions are imposed by any lease agreement regarding the payment of dividends, additional debtfinancing, or entering into further lease agreements.
Guarantees
In the ordinary course of business, the Company sells loans with recourse. For loans that have beensold with recourse, the recourse component is considered a guarantee. When the Company sells a loanwith recourse, it commits to stand ready to perform, if the loan defaults, and to make payments to remedythe default. As of December 31, 2003 and December 31, 2002, loans sold with recourse totaled$3.96 billion and $4.26 billion. The Company’s recourse reserve related to these loans totaled $27 millionand $11 million at December 31, 2003 and December 31, 2002.
The Company sells loans without recourse that may have to be subsequently repurchased if a defectthat occurred during the loan’s origination process results in a violation of a representation or warranty
117

WASHINGTON MUTUAL, INC. AND SUBSIDIARIES
NOTES TO CONSOLIDATED FINANCIAL STATEMENTS (Continued)
made in connection with the sale of the loan. When a loan sold to an investor without recourse fails toperform according to its contractual terms, the investor will typically review the loan file to determinewhether defects in the origination process occurred and if such defects give rise to a violation of arepresentation or warranty made to the investor in connection with the sale. If such a defect is identified,the Company may be required to either repurchase the loan or indemnify the investor for losses sustained.If there are no such defects, the Company has no commitment to repurchase the loan. As of December 31,2003 and December 31, 2002, the amount of loans sold without recourse totaled $578.71 billion and$600.25 billion, which substantially represents the unpaid principal balance of the Company’s loansserviced for others portfolio. The Company has reserved $112 million as of December 31, 2003 and$74 million as of December 31, 2002 to cover the estimated loss exposure related to the loan originationprocess defects that are inherent within this portfolio.
At December 31, 2003, the Company is the guarantor of five separate issues of trust preferredsecurities. The Company has issued subordinated debentures to wholly owned special purpose trusts. Eachspecial purpose trust has issued trust preferred securities. The sole assets of each special purpose trust arethe subordinated debentures issued by the Company. The Company guarantees the accumulated andunpaid distributions of each trust and as such would be required to perform if the trusts fail to fulfilldistribution requirements. Events and circumstances that would require the Company to perform underthe guarantee would be if the Company failed to fulfill its obligations under the issuance of subordinateddebentures to the special purpose trust. The maximum potential amount of future payments the Companycould be required to make under this guarantee is tantamount to the expected principal and interest eachtrust is obligated to remit under the issuance of trust preferred securities, which totaled $2.2 billion as ofDecember 31, 2003 and 2002.
Contingencies
In the ordinary course of business, the Company and its subsidiaries are routinely defendants in orparties to a number of pending and threatened legal actions and proceedings, including actions brought onbehalf of various classes of claimants. In certain of these actions and proceedings, claims for substantialmonetary damages are asserted against the Company and its subsidiaries. Certain of these actions andproceedings are based on alleged violations of consumer protection, banking and other laws.
In view of the inherent difficulty of predicting the outcome of such matters, the Company cannot statewhat the eventual outcome of pending matters will be. Based on current knowledge, management does notbelieve that liabilities, if any, arising from any single pending proceeding will have a material adverse effecton the consolidated financial condition, operations, results of operations or liquidity of the Company.However, the possibility of a material adverse impact on the Company’s operating results for a particularquarterly period exists in the event that an unfavorable outcome in multiple proceedings were to occurwithin the same quarterly reporting period, depending, among other factors, on the level of the Company’sincome for such period.
As part of the administration and oversight of the Assistance Agreement and other agreementsamong American Savings Bank, F.A., certain of its affiliates and a predecessor of the FDIC and similaragreements among affiliates of Bank United and a predecessor of the FDIC, the FDIC has a variety ofreview and audit rights, including the right to review and audit computations of payments in lieu of taxes.
The Company is a party to goodwill litigation that may result in a gain. The ultimate outcome isuncertain and there can be no assurance that the Company will benefit from the future results of thislitigation and no benefit has been recorded as of December 31, 2003.
118
WASHINGTON MUTUAL, INC. AND SUBSIDIARIES
NOTES TO CONSOLIDATED FINANCIAL STATEMENTS (Continued)
Note 16: Trust Preferred Securities
The Company had previously established special purpose trusts for the purpose of issuing trustpreferred securities. The proceeds from such issuances, together with the proceeds of the related issuancesof common securities of the trusts, were invested by the trusts in junior subordinated deferrable interestdebentures issued by Washington Mutual, Inc. Prior to FIN 46, these trusts were consolidated subsidiariesof the Company. As a result of the adoption of FIN 46, the Company deconsolidated all such specialpurpose trusts, as the Company is not considered to be the primary beneficiary under this accountingstandard. Accordingly, on the Company’s Consolidated Statements of Financial Condition, the trustpreferred securities that were issued by the trusts have been supplanted by the junior subordinateddeferrable interest debentures issued to the trusts by Washington Mutual, Inc. Financial data pertaining tothe previously consolidated special purpose trusts were as follows:
December 31, 2003
AggregateLiquidation Aggregate Aggregate PerAmount of Liquidation Principal Stated Annum
Trust Amount of Amount Maturity InterestPreferred Common of of Rate of Extension Redemption
Name of Trust Securities Securities Notes Notes Notes Period Option
(dollars in millions)Great Western Financial Trust II . . . . $ 300 $ 9 $ 309 2027 8.21% Ten consecutive On or after
semi-annual February 1,periods 2007
Washington Mutual Capital I . . . . . . . 400 12 412 2027 8.38 Ten consecutive On or aftersemi-annual June 1, 2007
periods
Ahmanson Trust I . . . . . . . . . . . . . . 150 5 155 2026 8.36 Ten consecutive On or aftersemi-annual December 1,
periods 2026
Washington Mutual Capital Trust 2001 . 1,150 35 1,185 2041 5.38 20 consecutive On or afterquarters May 3, 2006
Dime Capital Trust I . . . . . . . . . . . . 200 6 206 2027 9.33 Ten consecutive On or aftersemi-annual May 7, 2007
periods
Total trust preferred securities . . . . $2,200 $67 $2,267 6.87
119

WASHINGTON MUTUAL, INC. AND SUBSIDIARIES
NOTES TO CONSOLIDATED FINANCIAL STATEMENTS (Continued)
December 31, 2002
AggregateLiquidation Aggregate Aggregate PerAmount of Liquidation Principal Stated Annum
Trust Amount of Amount Maturity InterestPreferred Common of of Rate of Extension Redemption
Name of Trust Securities Securities Notes Notes Notes Period Option
(dollars in millions)Great Western Financial Trust II . . . . $ 300 $ 9 $ 309 2027 8.21% Ten consecutive On or after
semi-annual February 1,periods 2007
Washington Mutual Capital I . . . . . . . 400 12 412 2027 8.38 Ten consecutive On or aftersemi-annual June 1, 2007
periods
Ahmanson Trust I . . . . . . . . . . . . . . 150 5 155 2026 8.36 Ten consecutive On or aftersemi-annual December 1,
periods 2026
Washington Mutual Capital Trust 2001 . 1,150 35 1,185 2041 5.38 20 consecutive On or afterquarters May 3, 2006
Dime Capital Trust I . . . . . . . . . . . . 200 6 206 2027 9.33 Ten consecutive On or aftersemi-annual May 7, 2007
periods
Total trust preferred securities . . . . $2,200 $67 $2,267 6.87
In the second quarter of 2001, Washington Mutual Capital Trust 2001 issued 23 million units, totaling$1.15 billion, of Trust Preferred Income Equity Redeemable SecuritiesSM, through the issuance of$1.19 billion of 5.38% subordinated debentures, due in 2041. Each unit consists of a preferred securityhaving a stated liquidation amount of $50 and a current yield of 5.38%, and a warrant to purchase at anytime prior to the close of business on May 3, 2041, 1.2081 shares of common stock of Washington Mutual.At any time after issuance of the units, the preferred security and warrant components of each unit may beseparated by the holder and transferred separately. Thereafter, a separated preferred security and warrantmay be combined to form a unit.
The initial warrant exercise price was $32.33 and the warrant exercise price on the expiration date ofthe warrants will equal $50. As of December 31, 2003, the warrant exercise price was $32.49.
120

WASHINGTON MUTUAL, INC. AND SUBSIDIARIES
NOTES TO CONSOLIDATED FINANCIAL STATEMENTS (Continued)
Note 17: Earnings Per Share
Information used to calculate EPS was as follows:
Year Ended December 31,
2003 2002 2001
(dollars in millions, except pershare amounts)
Net incomeIncome from continuing operations, net of taxes . . . . . . . . . . . . . . . . . $ 3,793 $ 3,789 $ 3,043Income from discontinued operations, net of taxes . . . . . . . . . . . . . . . 87 72 61
Net Income . . . . . . . . . . . . . . . . . . . . . . . . . . . . . . . . . . . . . . . . . . . 3,880 3,861 3,104Accumulated dividends on preferred stock . . . . . . . . . . . . . . . . . . . . . – (5) (7)
Net income attributable to common stock . . . . . . . . . . . . . . . . . . . . . $ 3,880 $ 3,856 $ 3,097
Weighted average shares (in thousands)Basic weighted average number of common shares outstanding . . . . . . 903,666 943,905 850,245Dilutive effect of potential common shares from:
Stock options . . . . . . . . . . . . . . . . . . . . . . . . . . . . . . . . . . . . . . . . 9,411 8,626 8,469Premium Income Equity SecuritiesSM(1) . . . . . . . . . . . . . . . . . . . . . . – 951 1,346Trust Preferred Income Equity Redeemable SecuritiesSM . . . . . . . . . 8,680 6,670 4,598
Diluted weighted average number of common shares outstanding . . . . 921,757 960,152 864,658
Net income per common shareBasic earnings per common share:
Income from continuing operations . . . . . . . . . . . . . . . . . . . . . . . . $ 4.20 $ 4.01 $ 3.57Income from discontinued operations, net . . . . . . . . . . . . . . . . . . . . 0.09 0.08 0.07
Net income . . . . . . . . . . . . . . . . . . . . . . . . . . . . . . . . . . . . . . . . . . 4.29 4.09 3.64Diluted earnings per common share:
Income from continuing operations . . . . . . . . . . . . . . . . . . . . . . . . 4.12 3.94 3.51Income from discontinued operations, net . . . . . . . . . . . . . . . . . . . . 0.09 0.08 0.07
Net income . . . . . . . . . . . . . . . . . . . . . . . . . . . . . . . . . . . . . . . . . . 4.21 4.02 3.58
(1) Redeemed on August 16, 2002.
For the years ended December 31, 2003, 2002 and 2001, options to purchase an additional 9,831,974,13,789,940 and 3,712,976 shares of common stock were outstanding, but were not included in thecomputation of diluted EPS because their inclusion would have had an antidilutive effect.
Additionally, as part of the 1996 business combination with Keystone Holdings, Inc. (the parent ofAmerican Savings Bank, F.A.), 18 million shares of common stock, with an assigned value of $18.4944 pershare, were, as of the end of 2002 being held in escrow for the benefit of the investors in KeystoneHoldings, the FDIC as manager of the Federal Savings and Loan Insurance Corporation Resolution Fundand their transferees. During 2003, the FDIC transferred its interest in the escrow to Escrow Partners, L.P.,a partnership owned by investors in Keystone Holdings. As a result of a subsequent agreement among theparties to the escrow, 12 million shares were returned from the escrow to the Company during 2003,reducing the number of shares in the escrow to 6 million. The escrow will expire on December 20, 2008,subject to certain limited extensions. The conditions under which these shares can be released from escrow
121

WASHINGTON MUTUAL, INC. AND SUBSIDIARIES
NOTES TO CONSOLIDATED FINANCIAL STATEMENTS (Continued)
to the Keystone Holdings’ investors and Escrow Partners are related to the outcome of certain litigationand not based on future earnings or market prices. At December 31, 2003, the conditions for releasingshares to the Keystone Holdings’ investors and Escrow Partners had not occurred, and the 6 million shareswere still in the escrow. Therefore, none of the shares in the escrow were included in the abovecomputations.
Note 18: Comprehensive Income
The following table presents the components of other comprehensive income and the related taxeffect allocated to each component:
Before TaxAmount Tax Effect Net of Tax
(in millions)2001Unrealized loss from securities:
Net unrealized gain from securities available-for-sale arising during theyear(1) . . . . . . . . . . . . . . . . . . . . . . . . . . . . . . . . . . . . . . . . . . . . . . . $ 409 $ 156 $ 253
Reclassification of net gain from securities available-for-sale included in netincome . . . . . . . . . . . . . . . . . . . . . . . . . . . . . . . . . . . . . . . . . . . . . . (705) (268) (437)
Amortization of market adjustment for mortgage-backed securitiestransferred in 1997 from available-for-sale to held-to-maturity . . . . . . . . . (12) (5) (7)
Net unrealized loss from securities, net of reclassification adjustments . . . (308) (117) (191)Net unrealized gain from cash flow hedging instruments . . . . . . . . . . . . . . . . 5 2 3Minimum pension liability adjustment . . . . . . . . . . . . . . . . . . . . . . . . . . . . (2) (1) (1)
Other comprehensive loss . . . . . . . . . . . . . . . . . . . . . . . . . . . . . . . . $ (305) $(116) $ (189)
2002Unrealized gain from securities:
Net unrealized gain from securities available-for-sale arising during theyear(1) . . . . . . . . . . . . . . . . . . . . . . . . . . . . . . . . . . . . . . . . . . . . . . . $ 2,548 $ 966 $1,582
Reclassification of net gain from securities available-for-sale included in netincome . . . . . . . . . . . . . . . . . . . . . . . . . . . . . . . . . . . . . . . . . . . . . . (730) (277) (453)
Amortization of market adjustment for mortgage-backed securitiestransferred in 1997 from available-for-sale to held-to-maturity . . . . . . . . . (9) (3) (6)
Net unrealized gain from securities, net of reclassification adjustments . . . 1,809 686 1,123Net unrealized loss from cash flow hedging instruments . . . . . . . . . . . . . . . . (1,133) (430) (703)Minimum pension liability adjustment . . . . . . . . . . . . . . . . . . . . . . . . . . . . (3) (1) (2)
Other comprehensive income . . . . . . . . . . . . . . . . . . . . . . . . . . . . . $ 673 $ 255 $ 418
2003Unrealized loss from securities:
Net unrealized loss from securities available-for-sale arising during theyear(1) . . . . . . . . . . . . . . . . . . . . . . . . . . . . . . . . . . . . . . . . . . . . . . . $ (567) $(218) $ (349)
Reclassification of net gain from securities available-for-sale included in netincome . . . . . . . . . . . . . . . . . . . . . . . . . . . . . . . . . . . . . . . . . . . . . . (995) (383) (612)
Amortization of market adjustment for mortgage-backed securitiestransferred in 1997 from available-for-sale to held-to-maturity . . . . . . . . . (6) (2) (4)
Net unrealized loss from securities, net of reclassification adjustments . . . (1,568) (603) (965)Net unrealized gain from cash flow hedging instruments . . . . . . . . . . . . . . . . 439 169 270Minimum pension liability adjustment . . . . . . . . . . . . . . . . . . . . . . . . . . . . (7) (3) (4)
Other comprehensive loss . . . . . . . . . . . . . . . . . . . . . . . . . . . . . . . . $(1,136) $(437) $ (699)
(1) Includes net unrealized (loss) gain from securities available-for-sale arising during the year from discontinued operations, net oftax, of ($1) million for the years ended December 31, 2003 and 2002, and $3 million for the year ended December 31, 2001.
122

WASHINGTON MUTUAL, INC. AND SUBSIDIARIES
NOTES TO CONSOLIDATED FINANCIAL STATEMENTS (Continued)
The following table presents accumulated other comprehensive income (loss) balances:Net Unrealized Amortization
Net Unrealized Gain (Loss) Adjustment for Minimum AccumulatedGain (Loss) from Cash Mortgage-backed Pension Other
from Flow Hedging Securities Liability ComprehensiveSecurities(1) Instruments Transferred in 1997 Adjustment Income (Loss)
(in millions)
Balance, December 31, 2001 . . . . $ (263) $ 3 $21 $ (4) $(243)Net change . . . . . . . . . . . . . . . . 1,129 (703) (6) (2) 418
Balance, December 31, 2002 . . . . 866 (700) 15 (6) 175Net change . . . . . . . . . . . . . . . . (961) 270 (4) (4) (699)
Balance, December 31, 2003 . . . . $ (95) $(430) $11 $(10) $(524)
(1) Includes net unrealized gain from securities from discontinued operations of $1 million at December 31, 2003, $2 million atDecember 31, 2002, and $3 million at December 31, 2001.
Note 19: Regulatory Capital Requirements and Dividend RestrictionsWashington Mutual, Inc. is not subject to regulatory capital requirements. However, each of its
subsidiary depository institutions is subject to various regulatory capital requirements. WMB is subject toFDIC capital requirements while WMBFA and WMBfsb are subject to Office of Thrift Supervision(‘‘OTS’’) capital requirements.
The capital adequacy requirements are quantitative measures established by regulation that requireWMBFA, WMB and WMBfsb to maintain minimum amounts and ratios of capital. The FDIC requiresWMB to maintain minimum ratios of Tier 1 and total capital to risk-weighted assets as well as Tier 1capital to average assets. The OTS requires WMBFA and WMBfsb to maintain minimum ratios of Tier 1and total capital to risk-weighted assets, as well as Tier 1 capital to adjusted total assets and tangible capitalto adjusted total assets.
Federal law and regulations establish minimum capital standards, and under the OTS and FDICregulations, an institution (that is not in the most highly-rated category) is required to have a leverage ratioof at least 4.00%, a Tier 1 risk-based ratio of 4.00% and a total risk-based ratio of 8.00%. In addition, theCompany’s federal associations are required to have a tangible capital ratio of 1.50%. Federal law andregulations also establish five capital categories: well-capitalized, adequately capitalized, undercapitalized,significantly undercapitalized and critically undercapitalized. An institution is treated as well-capitalized ifits ratio of total capital to risk-weighted assets is 10.00% or more, its ratio of Tier 1 capital to risk-weightedassets is 6.00% or more, its leverage ratio is 5.00% or more, and it is not subject to any federal supervisoryorder or directive to meet a specific capital level. In order to be adequately capitalized, an institution musthave a total risk-based ratio of not less than 8.00%, a Tier 1 risk-based ratio of not less than 4.00%, and(unless it is in the most highly-rated category) a leverage ratio of not less than 4.00%. Any institution thatis neither well-capitalized nor adequately capitalized will be considered undercapitalized. Any institutionwith a tangible equity ratio of 2.00% or less will be considered critically undercapitalized.
Undercapitalized institutions are subject to certain prompt corrective action requirements, regulatorycontrols and restrictions, which become more extensive as an institution becomes more severelyundercapitalized. Failure by any of the Company’s depository institutions to comply with applicable capitalrequirements would, if unremedied, result in restrictions on its activities and lead to regulatoryenforcement actions against such institutions including, but not limited to, the issuance of a capitaldirective to ensure the maintenance of required capital levels. The Federal Deposit Insurance CorporationImprovement Act of 1991 requires the federal banking regulators to take prompt corrective action withrespect to depository institutions that do not meet minimum capital requirements. Additionally, FDIC orOTS approval of any regulatory application filed for their review may be dependent on compliance withcapital requirements.
123
WASHINGTON MUTUAL, INC. AND SUBSIDIARIES
NOTES TO CONSOLIDATED FINANCIAL STATEMENTS (Continued)
The regulatory capital ratios calculated for WMBFA, WMB and WMBfsb, along with the capitalamounts and ratios for the minimum regulatory requirement and the minimum amounts and ratiosrequired to be categorized as well-capitalized under the regulatory framework for prompt corrective actionwere as follows:
December 31, 2003
Minimum to beCategorized as
Well-Capitalized
Under PromptMinimum CorrectiveRegulatory Action
Actual Requirement Provisions
Amount Ratio Amount Ratio Amount Ratio
(dollars in millions)WMBFATotal risk-based capital to total risk-weighted assets . . . . . . . . . $15,444 10.80% $11,441 8.00% $14,302 10.00%Adjusted tier 1 capital to total risk-weighted assets . . . . . . . . . . 12,472 8.72 5,721 4.00 8,581 6.00Tier 1 capital to adjusted total assets (leverage) . . . . . . . . . . . . 12,531 5.50 9,116 4.00(1) 11,395 5.00Tangible capital to tangible assets (tangible equity) . . . . . . . . . . 12,531 5.50 3,419 1.50 n/a n/aWMBTotal risk-based capital to total risk-weighted assets . . . . . . . . . 2,219 11.23 1,581 8.00 1,976 10.00Adjusted tier 1 capital to total risk-weighted assets . . . . . . . . . . 1,798 9.10 790 4.00 1,186 6.00Tier 1 capital to average assets (leverage) . . . . . . . . . . . . . . . . 1,798 5.82 1,236 4.00(1) 1,545 5.00WMBfsbTotal risk-based capital to total risk-weighted assets . . . . . . . . . 82 17.04 38 8.00 48 10.00Adjusted tier 1 capital to total risk-weighted assets . . . . . . . . . . 79 16.36 19 4.00 29 6.00Tier 1 capital to adjusted total assets (leverage) . . . . . . . . . . . . 79 10.34 30 4.00(1) 38 5.00Tangible capital to tangible assets (tangible equity) . . . . . . . . . . 79 10.34 11 1.50 n/a n/a
December 31, 2002
Minimum to beCategorized as
Well-Capitalized
Under PromptMinimum CorrectiveRegulatory Action
Actual Requirement Provisions
Amount Ratio Amount Ratio Amount Ratio
(dollars in millions)WMBFATotal risk-based capital to total risk-weighted assets . . . . . . . . $16,072 11.33% $11,344 8.00% $14,180 10.00%Adjusted tier 1 capital to total risk-weighted assets . . . . . . . . . 13,064 9.21 5,672 4.00 8,508 6.00Tier 1 capital to adjusted total assets (leverage) . . . . . . . . . . . 13,112 5.75 9,118 4.00(1) 11,398 5.00Tangible capital to tangible assets (tangible equity) . . . . . . . . . 13,112 5.75 3,419 1.50 n/a n/aWMBTotal risk-based capital to total risk-weighted assets . . . . . . . . 2,387 11.40 1,675 8.00 2,094 10.00Adjusted tier 1 capital to total risk-weighted assets . . . . . . . . . 2,132 10.18 838 4.00 1,256 6.00Tier 1 capital to average assets (leverage) . . . . . . . . . . . . . . . 2,132 7.94 1,074 4.00(1) 1,342 5.00WMBfsbTotal risk-based capital to total risk-weighted assets . . . . . . . . 88 17.32 41 8.00 51 10.00Adjusted tier 1 capital to total risk-weighted assets . . . . . . . . . 82 16.07 20 4.00 30 6.00Tier 1 capital to adjusted total assets (leverage) . . . . . . . . . . . 82 8.87 37 4.00(1) 46 5.00Tangible capital to tangible assets (tangible equity) . . . . . . . . . 82 8.87 14 1.50 n/a n/a
(1) The minimum leverage ratio guideline is 3% for financial institutions that do not anticipate significant growth and that havewell-diversified risk, excellent asset quality, high liquidity, good earnings, effective management and monitoring of market riskand, in general, are considered top-rate, strong banking organizations.
124

WASHINGTON MUTUAL, INC. AND SUBSIDIARIES
NOTES TO CONSOLIDATED FINANCIAL STATEMENTS (Continued)
WMBFA, WMB and WMBfsb met all capital adequacy requirements as of December 31, 2003, towhich they were subject. Additionally, as of the most recent notifications from the FDIC (for WMB) andthe OTS (for WMBFA and WMBfsb), the FDIC and OTS individually categorized WMBFA, WMB andWMBfsb as well-capitalized under the regulatory framework for prompt corrective action. To becategorized as well-capitalized, a bank must maintain minimum total risk-based, Tier 1 risk-based andTier 1 or leverage ratios as set forth in the table above. There are no conditions or events since thosenotifications that management believes have changed the well-capitalized status of WMBFA, WMB andWMBfsb.
Washington Mutual, Inc.’s principal sources of funds are cash dividends received from its banking andother subsidiaries, investment income and borrowings. Washington Mutual, Inc.’s ability to pay dividends isalso predicated on the ability of its subsidiaries to declare and pay dividends to Washington Mutual, Inc.Federal and state law limits the ability of a depository institution, such as WMBFA, WMB or WMBfsb, topay dividends or make other capital distributions.
Washington state law prohibits WMB from declaring or paying a dividend greater than its retainedearnings if doing so would cause its net worth to be reduced below (i) the amount required for theprotection of preconversion depositors or (ii) the net worth requirements, if any, imposed by the Directorof Financial Institutions of the State of Washington.
OTS regulations limit the ability of savings associations such as WMBFA and WMBfsb to paydividends and make other capital distributions. WMBFA and WMBfsb must file notice with the OTS atleast 30 days before the proposed declaration of a dividend or approval of a proposed capital distributionby its board of directors. In addition, a savings association must obtain prior approval from the OTS if itfails to meet certain regulatory conditions, if, after giving effect to the proposed distribution, theassociation’s capital distributions in a calendar year would exceed its year-to-date net income plus retainednet income for the preceding two years or the association would not be at least adequately capitalized or ifthe distribution would violate a statute, regulation, regulatory agreement or a regulatory condition towhich the association is subject.
The Company’s retained earnings at December 31, 2003 included a pre-1988 thrift bad debt reservefor tax purposes of $2.22 billion for which no federal income taxes have been provided. In the future, if thethrift bad debt reserve is used for any purpose other than to absorb bad debt losses, or if any of the bankingsubsidiaries no longer qualifies as a bank, the Company will incur a federal income tax liability, at the thenprevailing corporate income tax rate, to the extent of such subsidiaries’ pre-1988 thrift bad debt reserve. Asa result, the Company’s ability to pay dividends in excess of current earnings may be limited.
Note 20: Stock-Based Compensation Plans and Shareholder Rights Plan
Washington Mutual maintains an equity incentive plan and an employee stock purchase plan. Thefollowing information is disclosed on a continuing and discontinued operations basis.
2003 Equity Incentive Plan
In February 2003 the Board of Directors adopted the 2003 Equity Incentive Plan (‘‘2003 EIP’’). OnApril 15, 2003 the shareholders approved the adoption of the 2003 EIP, which replaced the 1994 StockOption Plan (‘‘1994 Plan’’) and the Company’s Equity Incentive Plan. Under the 2003 EIP, all of theCompany’s employees, officers, directors and certain consultants, agents, advisors and independentcontractors are eligible to receive awards. Awards which may be granted under the 2003 EIP include stockoptions, stock appreciation rights, restricted stock and stock units, performance shares and performanceunits and other stock or cash-based awards. The 2003 EIP is generally similar to the 1994 Plan and the
125

WASHINGTON MUTUAL, INC. AND SUBSIDIARIES
NOTES TO CONSOLIDATED FINANCIAL STATEMENTS (Continued)
Equity Incentive Plan, and does not affect the terms of any option granted under the 1994 Plan or stock orshares awarded under the Equity Incentive Plan. The maximum number of shares of Washington Mutualcommon stock available for grant under the 2003 EIP is 44,919,426, which includes authorized shares notissued or subject to outstanding awards under the Company’s 1994 Plan or Equity Incentive Plan.
Under the 2003 EIP, the exercise price of the option must at least equal the fair market value ofWashington Mutual’s common stock on the date of the grant. The options generally vest on a phased-inschedule over one to three years, depending on the terms of the grant, and expire 10 years from the grantdate.
The 2003 EIP permits awards of restricted stock and stock units, and performance shares andperformance units with or without performance-based vesting restrictions. The maximum aggregatenumber of such shares that may be issued under the 2003 EIP (other than options and stock appreciationrights) is 13,000,000, and the maximum number of shares that may be issued under the 2003 EIP pursuantto awards (other than options and stock appreciation rights) that have no restrictions or have restrictionsbased solely on service for less than three years is 4,350,000.
In 2003, 2,912,134 restricted shares were granted under the 2003 EIP with a weighted-averagegrant-date per share fair value of $40.88. As of December 31, 2003, there were 2,886,818 restricted sharesoutstanding. Upon the grant of restricted stock awards, shares are issued to a trustee who releases them torecipients when the restrictions lapse. At the date of grant, unearned compensation is recorded as an offsetto stockholders’ equity and is amortized as compensation expense over the restricted period. The balanceof unearned compensation related to these restricted shares was $104 million at December 31, 2003.Restricted stock and stock units accrue or pay dividends. All canceled or forfeited shares become availablefor future grants.
Certain executives participate in the Company’s Performance Shares Program. Under this program,executives are notified of target awards and the performance criteria that determine actual awards at theend of the three-year measurement period. The actual awards may be between 0% and 250% of the targetaward, depending on the Company’s performance. After the three-year performance cycle has beencompleted, actual awards may be made in cash or in the Company’s common stock. Common stock awardswill be made from the 2003 EIP.
The total compensation expense recognized for the 2003 EIP was $18 million in 2003.
1994 Stock Option Plan
On April 19, 1994, the Company’s shareholders approved the adoption of the 1994 Stock Option Plan,which was subsequently amended and restated as of February 15, 2000. Under the 1994 Plan, options topurchase common stock of Washington Mutual were granted to officers, directors, consultants and advisorsof the Company. The 1994 Plan was generally similar to a plan adopted in 1983 that was terminatedaccording to its terms in 1993, however the 1994 Plan did not affect the terms of any options granted underthe 1983 plan. All options granted under the 1983 plan have been exercised as of December 31, 2003.Under the 1994 Plan, the exercise price of the option was equal to the fair market value of WashingtonMutual’s common stock on the date of the grant. The options generally vest on a phased-in schedule overone to three years, depending upon the terms of the grant, and expire five to ten years from the grant date.The 1994 Plan originally provided for the granting of options to purchase a maximum of 27,000,000 sharesof common stock. During 2000, the Board of Directors amended, and the Company’s shareholdersapproved, an increase in the maximum number of shares of common stock available for grant to45,000,000. The 1994 Plan was replaced on April 15, 2003 with the 2003 EIP. The total compensation
126

WASHINGTON MUTUAL, INC. AND SUBSIDIARIES
NOTES TO CONSOLIDATED FINANCIAL STATEMENTS (Continued)
expense recognized for the 1994 Plan resulting from the adoption of Statement No. 148 to prospectivelyapply the fair value method of accounting was $11 million in 2003.
WAMU Shares Stock Option Plans
From time to time, the Board of Directors approves grants of nonqualified stock options to certaingroups of employees. The grants have been made pursuant to a series of plans, collectively known as‘‘WAMU Shares.’’ In 1997, the Board of Directors approved a plan under which eligible employees weregranted nonqualified options to purchase the Company’s common stock. On December 15, 1998, theBoard adopted a new plan to grant additional nonqualified stock options to eligible employees (‘‘1999WAMU Shares’’). On February 13, 2001, the Board adopted a third plan and granted nonqualified optionsto eligible employees (‘‘2001 WAMU Shares’’). On September 17, 2002, the Board amended the 2001WAMU Shares Plan to provide for an additional grant of nonqualified options to eligible employeeseffective September 3, 2002. The aggregate number of shares authorized by the Board of Directors forgrants under the WAMU Shares Plans was 14,511,900. On October 16, 2002, the Board amended the 1999WAMU Shares and the 2001 WAMU Shares plans to allow grants to a broader group of employees,including management, so that some of the authorized but unissued options could be granted to eligibleemployees as part of the annual grant in December 2002. Generally, eligible full-time and part-timeemployees on the award dates were granted options to purchase shares of Washington Mutual commonstock. The exercise price for all grants is the fair market value of Washington Mutual’s common stock ondesignated dates, and all options vest one to three years after the award date and expire five to ten yearsfrom the award date.
The following table presents the status, and changes, of all plans at December 31, 2003, 2002 and 2001during the years then ended:
1983 1994 WAMU SharesStock Option Plan Stock Option Plan Stock Option Plan
Weighted Weighted WeightedAverage Average AverageExercise Exercise Exercise
Number Price Number Price Number Price
Outstanding at December 31, 2000 . . . . . . 361,125 $ 7.55 21,887,884 $24.79 4,030,925 $24.09Granted . . . . . . . . . . . . . . . . . . . . . . . . – – 11,969,887 31.15 4,744,200 34.00Exercised . . . . . . . . . . . . . . . . . . . . . . . (57,375) 4.88 (1,541,749) 21.01 (2,113,701) 24.16Forfeited . . . . . . . . . . . . . . . . . . . . . . . – – (814,985) 24.85 (863,815) 32.82
Outstanding at December 31, 2001 . . . . . . 303,750 8.06 31,501,037 27.38 5,797,609 30.80Granted . . . . . . . . . . . . . . . . . . . . . . . . – – 11,391,440 36.12 9,487,266 37.13Exercised . . . . . . . . . . . . . . . . . . . . . . . (178,875) 6.78 (1,735,344) 20.97 (869,324) 25.47Forfeited . . . . . . . . . . . . . . . . . . . . . . . – – (1,078,605) 30.51 (1,356,493) 33.18
Outstanding at December 31, 2002 . . . . . . 124,875 9.89 40,078,528 30.06 13,059,058 35.54Granted . . . . . . . . . . . . . . . . . . . . . . . . – – 105,093 35.08 22,088 36.53Exercised . . . . . . . . . . . . . . . . . . . . . . . (124,875) 9.89 (6,489,335) 25.12 (1,410,483) 29.82Forfeited . . . . . . . . . . . . . . . . . . . . . . . – – (1,281,776) 33.47 (1,494,478) 36.49
Outstanding at December 31, 2003 . . . . . . – – 32,412,510 30.94 10,176,185 36.20
127
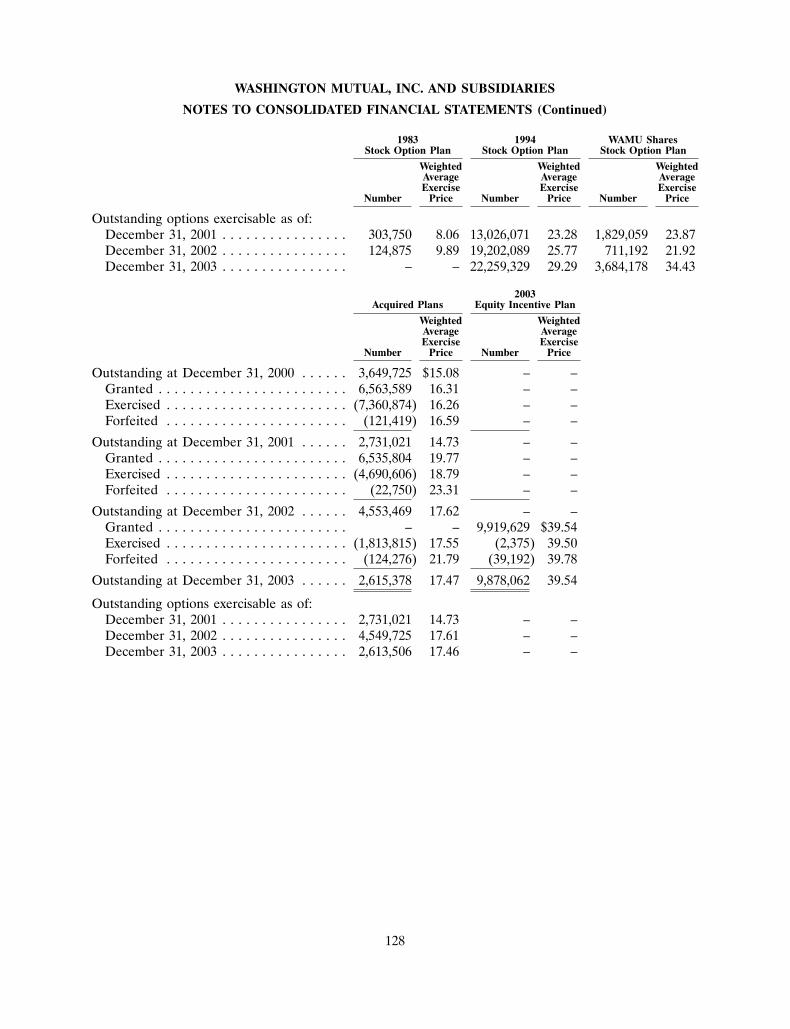
WASHINGTON MUTUAL, INC. AND SUBSIDIARIES
NOTES TO CONSOLIDATED FINANCIAL STATEMENTS (Continued)
1983 1994 WAMU SharesStock Option Plan Stock Option Plan Stock Option Plan
Weighted Weighted WeightedAverage Average AverageExercise Exercise Exercise
Number Price Number Price Number Price
Outstanding options exercisable as of:December 31, 2001 . . . . . . . . . . . . . . . . 303,750 8.06 13,026,071 23.28 1,829,059 23.87December 31, 2002 . . . . . . . . . . . . . . . . 124,875 9.89 19,202,089 25.77 711,192 21.92December 31, 2003 . . . . . . . . . . . . . . . . – – 22,259,329 29.29 3,684,178 34.43
2003Acquired Plans Equity Incentive Plan
Weighted WeightedAverage AverageExercise Exercise
Number Price Number Price
Outstanding at December 31, 2000 . . . . . . 3,649,725 $15.08 – –Granted . . . . . . . . . . . . . . . . . . . . . . . . 6,563,589 16.31 – –Exercised . . . . . . . . . . . . . . . . . . . . . . . (7,360,874) 16.26 – –Forfeited . . . . . . . . . . . . . . . . . . . . . . . (121,419) 16.59 – –
Outstanding at December 31, 2001 . . . . . . 2,731,021 14.73 – –Granted . . . . . . . . . . . . . . . . . . . . . . . . 6,535,804 19.77 – –Exercised . . . . . . . . . . . . . . . . . . . . . . . (4,690,606) 18.79 – –Forfeited . . . . . . . . . . . . . . . . . . . . . . . (22,750) 23.31 – –
Outstanding at December 31, 2002 . . . . . . 4,553,469 17.62 – –Granted . . . . . . . . . . . . . . . . . . . . . . . . – – 9,919,629 $39.54Exercised . . . . . . . . . . . . . . . . . . . . . . . (1,813,815) 17.55 (2,375) 39.50Forfeited . . . . . . . . . . . . . . . . . . . . . . . (124,276) 21.79 (39,192) 39.78
Outstanding at December 31, 2003 . . . . . . 2,615,378 17.47 9,878,062 39.54
Outstanding options exercisable as of:December 31, 2001 . . . . . . . . . . . . . . . . 2,731,021 14.73 – –December 31, 2002 . . . . . . . . . . . . . . . . 4,549,725 17.61 – –December 31, 2003 . . . . . . . . . . . . . . . . 2,613,506 17.46 – –
128

WASHINGTON MUTUAL, INC. AND SUBSIDIARIES
NOTES TO CONSOLIDATED FINANCIAL STATEMENTS (Continued)
Financial data pertaining to outstanding stock options were as follows:
December 31, 2003
Weighted Weighted Number of Weighted AverageNumber of Average Average Exercisable Exercise Price
Option Remaining Exercise Price of Option of ExercisableRanges of Exercise Prices Shares Years Option Shares Shares Option Shares
1994 Stock Option Plan$ 8.97 - $21.42 . . . . . . . . . . . . . . . . . 3,519,513 4.71 $16.25 3,519,513 $16.2521.92 - 29.94 . . . . . . . . . . . . . . . . . 3,474,427 4.57 25.21 3,472,760 25.2130.73 - 33.96 . . . . . . . . . . . . . . . . . 14,389,684 7.57 31.82 11,147,019 32.0834.00 - 42.08 . . . . . . . . . . . . . . . . . 11,028,886 8.77 36.27 4,120,037 36.31
WAMU Shares Stock Option Plan$21.92 - $26.11 . . . . . . . . . . . . . . . . . 191,035 0.01 21.92 191,035 21.9234.00 . . . . . . . . . . . . . . . . . . . . . . . 1,952,447 2.12 34.00 1,952,447 34.0036.53 . . . . . . . . . . . . . . . . . . . . . . . 4,638,253 8.96 36.53 1,535,646 36.5337.81 . . . . . . . . . . . . . . . . . . . . . . . 3,394,450 3.67 37.81 5,050 37.81
Acquired Plans$ 5.62 - $14.80 . . . . . . . . . . . . . . . . . 993,494 2.50 10.01 993,494 10.0115.13 - 23.72 . . . . . . . . . . . . . . . . . 963,310 3.88 19.39 963,310 19.3924.05 - 33.90 . . . . . . . . . . . . . . . . . 658,574 6.05 25.92 656,702 25.91
2003 Equity Incentive Plan$37.05 - $46.35 . . . . . . . . . . . . . . . . . 9,878,062 9.86 39.54 – –
Total . . . . . . . . . . . . . . . . . . . . . . . 55,082,135 32.81 28,557,013 28.87
Employee Stock Purchase Plan
Under the terms of the Company’s Employee Stock Purchase Plan (‘‘ESPP’’), an employee wasallowed to purchase the Company’s common stock at a 15% discount from the fair market value of thecommon stock at the beginning of a six month offering period or the end of the six month offering period,whichever price was lower, without paying brokerage fees or commissions on purchases. The Companypaid for the program’s administrative expenses. The plan was open to all employees who were at least18 years old, had completed at least one month of service, and worked at least 20 hours per week.Participation was through either payroll deductions or lump sum payments with a maximum annualcontribution of 10% of each employee’s eligible cash compensation. Under the ESPP, dividends wereautomatically reinvested. The Company sold 1,144,025 shares, 613,480 shares and 362,500 shares toemployees in 2003, 2002 and 2001. The total compensation expense recognized for the ESPP resultingfrom the adoption of Statement No. 148 to prospectively apply the fair value method of accounting was$11 million in 2003.
The ESPP was amended effective January 1, 2004, and the Plan Administrator exercised its discretionunder the Plan to change certain terms. The ESPP no longer permits lump sum contributions, excludesemployees who work for less than 5 months per year, has twelve monthly offering periods, and provides forpurchase of stock at a 5% discount from the price at the end of the offering period.
Equity Incentive Plan
The Equity Incentive Plan (previously named the Restricted Stock Plan) permitted grants of restrictedstock, and awards denominated in units of stock (‘‘performance units’’), with or without performance-
129

WASHINGTON MUTUAL, INC. AND SUBSIDIARIES
NOTES TO CONSOLIDATED FINANCIAL STATEMENTS (Continued)
based vesting restrictions, for the benefit of all employees, officers, directors, consultants and advisors ofthe Company. The Equity Incentive Plan was replaced on April 15, 2003 by the 2003 EIP, therefore, the2003 balances represent restricted stock and awards granted under the Equity Incentive Plan during theperiod January 1, 2003 to April 14, 2003. The 2003 EIP does not affect the terms of any shares grantedunder the Equity Incentive Plan. In 2003, 2002 and 2001, 59,953, 878,186 and 536,169 restricted shareswere granted with a weighted-average grant-date per share fair value of $34.51, $34.20 and $33.17. As ofDecember 31, 2003, 2002 and 2001, there were 720,347, 1,410,871 and 1,559,871 restricted sharesoutstanding. Restricted stock and units of stock accrue dividends. Upon the grant of restricted stockawards, shares are issued to a trustee who releases them to recipients when the restrictions lapse. At thedate of grant, unearned compensation is recorded as an offset to stockholders’ equity and is amortized ascompensation expense over the restricted period. The balance of unearned compensation related to theserestricted shares was $14 million at December 31, 2003, $29 million at December 31, 2002 and $22 millionat December 31, 2001.
The total compensation expense recognized for the Equity Incentive Plan was $52 million in 2003,$41 million in 2002 and $27 million in 2001.
Bank United Plans
In connection with the acquisition of Bank United, the Company assumed the Bank United Corp.1996 Stock Incentive Plan, 1999 Stock Incentive Plan and 2000 Stock Incentive Plan (collectively the ‘‘BankUnited Plans’’), under which incentive options and nonqualified options to purchase common stock,restricted common stock and other performance awards may be granted to officers, employees andconsultants. Options under the Bank United Plans generally expire ten years from the date of grant, andvest over varying periods that were determined at grant date. All options granted under the Bank UnitedPlans included a limited stock appreciation right, which entitles the holder to surrender the vested andexercisable option for cash following the closing of an acquisition. With the Company’s acquisition of BankUnited, the Company assumed approximately 6.6 million options to purchase Bank United common stock,which were converted into options to purchase Washington Mutual common stock. During 2002 and 2001,approximately 6.4 million of these options were exercised. As of December 31, 2003, options to purchaseapproximately 202,000 shares were remaining to be exercised.
Dime Savings Plans
In connection with the acquisition of Dime, the Company assumed the Dime Bancorp, Inc. 1991 StockIncentive Plan, 1997 Stock Incentive Plan and 1997 Stock Incentive Plan for Outside Directors (collectivelythe ‘‘Dime Savings Plans’’), under which incentive options and nonqualifed options to purchase commonstock, restricted common stock, stock appreciation rights and deferred common stock may be granted toofficers, employees and consultants. Options under the Dime Savings Plans generally expire ten or elevenyears from the date of the grant and vest over varying periods that were determined at the grant date.Certain options had a stock appreciation rights feature that was exercisable only for a period of 60 daysfollowing the occurrence of certain specified changes in ownership or control of Dime or certain of itssubsidiaries. These stock appreciation rights were converted to options to acquire Washington Mutualcommon stock or paid out in cash for their value.
Dime also issued options to purchase shares of common stock under the company’s Pride ShareProgram, a broad-based stock option plan adopted in 1997 and 1999. Under the program, all eligiblefull-time and part-time employees could receive options to purchase common stock which expire elevenyears from the date of grant. The vesting of these stock options generally occurred at the earlier of fiveyears after the date of grant or the date the common stock price reached a specified target price (as
130

WASHINGTON MUTUAL, INC. AND SUBSIDIARIES
NOTES TO CONSOLIDATED FINANCIAL STATEMENTS (Continued)
established on the grant date) and its closing price stayed at, or rose above, that target price for fiveconsecutive trading days.
With the Company’s acquisition of Dime, it assumed approximately 6.5 million options to purchaseDime common stock, which were converted into options to purchase Washington Mutual common stock.As of December 31, 2003, approximately 5.4 million of the options assumed were exercised leaving1 million options remaining to be exercised.
Shareholder Rights Plan
In October 2000, the 1994 Shareholder Rights Plan expired in accordance with its terms. OnDecember 19, 2000, the Company’s Board of Directors adopted a new Shareholder Rights Plan anddeclared a dividend of one right for each outstanding share of common stock to shareholders of record onJanuary 4, 2001. The rights have certain anti-takeover effects. They are intended to discourage coercive orunfair takeover tactics and to encourage any potential acquirer to negotiate a price fair to all shareholders.The rights may cause substantial dilution to an acquiring party that attempts to acquire the Company onterms not approved by the Board of Directors, but they will not interfere with any friendly merger or otherbusiness combination. The plan was not adopted in response to any specific effort to acquire control of theCompany.
Note 21: Employee Benefits Programs and Other Expense
Pension Plan
Washington Mutual maintains a noncontributory cash balance defined benefit pension plan (the‘‘Pension Plan’’) for substantially all eligible employees. As a result of the acquisition of Dime, theCompany acquired Dime’s noncontributory pension plan, which was merged into the Pension Plan onJuly 1, 2002. Benefits earned for each year of service are based primarily on the level of compensation inthat year plus a stipulated rate of return on the benefit balance. It is the Company’s policy to fund thePension Plan on a current basis to the extent deductible under federal income tax regulations.
Nonqualified Defined Benefit Plans and Other Postretirement Benefit Plans
The Company, as successor to previously acquired companies, has assumed responsibility fornonqualified, noncontributory, unfunded postretirement benefit plans, including retirement restorationplans for certain employees, a number of supplemental retirement plans for certain officers and multipleoutside directors’ retirement plans. Benefits under the retirement restoration plans are generallydetermined by the Company. Benefits under the supplemental retirement plans are generally based onyears of service. Benefits under the outside directors’ retirement plans generally are payable for a periodequal to the participants’ service on the Board of Directors, with a lifetime benefit payable to participantswith 15 or more years of service.
The Company, as successor to previously acquired companies, maintains unfunded defined benefitpostretirement plans that make medical and life insurance coverage available to eligible retired employeesand their beneficiaries and covered dependents. The expected cost of providing these benefits to retirees,their beneficiaries and covered dependents was accrued during the years each employee provided services.
Washington Mutual uses December 31 as the measurement date for a majority of its plans.
131

WASHINGTON MUTUAL, INC. AND SUBSIDIARIES
NOTES TO CONSOLIDATED FINANCIAL STATEMENTS (Continued)
Obligations and funded status for the Pension Plan, Nonqualified Defined Benefit Plans and OtherPostretirement Benefit Plans were as follows:
Year Ended December 31,
2003 2002
Nonqualified Other Nonqualified OtherPension Defined Postretirement Pension Defined Postretirement
Plan Benefit Plans Benefit Plans Plan Benefit Plans Benefit Plans
(in millions)
Change in benefit obligationBenefit obligation, beginning of year(1) $1,104 $ 128 $ 78 $ 798 $ 102 $ 29Interest cost . . . . . . . . . . . . . . . . . . . 73 8 4 67 9 5Service cost . . . . . . . . . . . . . . . . . . . 56 – 1 47 – 1Amendments . . . . . . . . . . . . . . . . . . – – (2) (16) – –Actuarial loss (gain) . . . . . . . . . . . . . 130 10 (8) 117 7 6Curtailment gain . . . . . . . . . . . . . . . . – – – – – (5)Special termination benefits . . . . . . . . – – – – 21 –Business combination . . . . . . . . . . . . – – – 163 34 48Benefits paid . . . . . . . . . . . . . . . . . . (80) (17) (5) (72) (45) (6)
Benefit obligation, end of year(1) . . . 1,283 129 68 1,104 128 78
Change in plan assets . . . . . . . . . . . .Fair value of plan assets, beginning of
year . . . . . . . . . . . . . . . . . . . . . . . 1,062 – – 754 – –Actual return on plan assets . . . . . . . 240 – – (73) – –Business combination . . . . . . . . . . . . – – – 172 – –Employer contributions . . . . . . . . . . . 85 17 5 281 45 6Benefits paid . . . . . . . . . . . . . . . . . . (80) (17) (5) (72) (45) (6)
Fair value of plan assets, end ofyear . . . . . . . . . . . . . . . . . . . . . . 1,307 – – 1,062 – –
Funded status . . . . . . . . . . . . . . . . . . 24 (129) (68) (42) (128) (78)Unrecognized net actuarial loss
(gain) . . . . . . . . . . . . . . . . . . . . . . 392 26 (11) 447 16 (4)Unrecognized prior service (benefit)
cost . . . . . . . . . . . . . . . . . . . . . . . (7) – (7) (12) – (6)Remaining unamortized, unrecognized
net asset . . . . . . . . . . . . . . . . . . . . – – 6 (1) – 7
Net amount recognized . . . . . . . . . $ 409 $(103) $(80) $ 392 $(112) $(81)
(1) The Pension Plan benefit obligation represents the projected benefit obligation. The accumulated benefit obligation was$1,157 million and $1,011 million at December 31, 2003 and 2002. The Nonqualified Defined Benefit Plans and OtherPostretirement Benefit Plans benefit obligation represents the accumulated benefit obligation.
132

WASHINGTON MUTUAL, INC. AND SUBSIDIARIES
NOTES TO CONSOLIDATED FINANCIAL STATEMENTS (Continued)
Amounts recognized in the Consolidated Statements of Financial Condition consist of:
Year Ended December 31,
2003 2002
Nonqualified Other Nonqualified OtherPension Defined Postretirement Pension Defined Postretirement
Plan Benefit Plans Benefit Plans Plan Benefit Plans Benefit Plans
(in millions)
Prepaid benefit cost . . . . . . . . . . . . . . $409 $(103) $(80) $392 $(112) $(81)Accrued benefit cost . . . . . . . . . . . . . – (26) – – (16) –Other comprehensive income . . . . . . . – 26 – – 16 –
Net amount recognized . . . . . . . . . $409 $(103) $(80) $392 $(112) $(81)
The accumulated benefit obligation for all defined benefit plans was $1,354 and $1,217 atDecember 31, 2003 and 2002.
Additional information due to the accumulated benefit obligation in excess of or (less than) planassets:
Year Ended December 31,
2003 2002
Nonqualified Other Nonqualified OtherPension Defined Postretirement Pension Defined Postretirement
Plan Benefit Plans Benefit Plans Plan Benefit Plans Benefit Plans
(in millions)
Projected benefit obligation . . . . . . . . $ (24) $129 $ 68 $ 42 $128 $ 78Accumulated benefit obligation . . . . . (150) 129 68 (51) 128 78Fair value of plan assets . . . . . . . . . . – n/a n/a – n/a n/a
Components of net periodic benefit cost for the Pension Plan, Nonqualified Defined Benefit Plansand Other Postretirement Benefit Plans were as follows:
Year Ended December 31,
2003 2002
Nonqualified Other Nonqualified OtherPension Defined Postretirement Pension Defined Postretirement
Plan Benefit Plans Benefit Plans Plan Benefit Plans Benefit Plans
(in millions)
Interest cost . . . . . . . . . . . . . . . . . . . $ 73 $8 $ 4 $ 67 $9 $ 5Service cost . . . . . . . . . . . . . . . . . . . 56 – 1 47 – 1Expected return on plan assets . . . . . . (83) – – (71) – –Curtailment gain . . . . . . . . . . . . . . . . – – – – – (5)Amortization of prior service credit . . (5) – (1) (5) – (1)Amortization of net (gain) loss . . . . . (1) – 1 – – 1Recognized net actuarial loss (gain) . . 28 1 (1) 8 – –
Net periodic benefit cost . . . . . . . . $ 68 $9 $ 4 $ 46 $9 $ 1
133

WASHINGTON MUTUAL, INC. AND SUBSIDIARIES
NOTES TO CONSOLIDATED FINANCIAL STATEMENTS (Continued)
Year Ended December 31,
2001
Nonqualified OtherPension Defined Postretirement
Plan Benefit Plans Benefit Plans
(in millions)
Interest cost . . . . . . . . . . . . . . . . . . . . . . . . . . . . . . . . . . . . . . . . $ 53 $8 $ 2Service cost . . . . . . . . . . . . . . . . . . . . . . . . . . . . . . . . . . . . . . . . 29 – 1Expected return on plan assets . . . . . . . . . . . . . . . . . . . . . . . . . . (55) – –Amortization of prior service credit . . . . . . . . . . . . . . . . . . . . . . . (4) – (1)Amortization of net loss . . . . . . . . . . . . . . . . . . . . . . . . . . . . . . . – – 1Recognized net actuarial loss (gain) . . . . . . . . . . . . . . . . . . . . . . . 1 – (1)
Net periodic benefit cost . . . . . . . . . . . . . . . . . . . . . . . . . . . . . $ 24 $8 $ 2
Additional information for the Pension Plan, Nonqualified Defined Benefit Plans and OtherPostretirement Benefit Plans was as follows:
Year Ended December 31,
2003 2002
Nonqualified Other Nonqualified OtherPension Defined Postretirement Pension Defined Postretirement
Plan Benefit Plans Benefit Plans Plan Benefit Plans Benefit Plans
(in millions)
Increase in minimum liability includedin other comprehensive income . . . . $ – $10 n/a $ – $6 n/a
Year Ended December 31,
2001
Nonqualified OtherPension Defined Postretirement
Plan Benefit Plans Benefit Plans
(in millions)
Increase in minimum liability included in other comprehensiveincome . . . . . . . . . . . . . . . . . . . . . . . . . . . . . . . . . . . . . . . . . . $ – $4 n/a
Weighted-average assumptions used to determine benefit obligations for the Pension Plan,Nonqualified Defined Benefit Plans and Other Postretirement Benefit Plans were as follows:
Year Ended December 31,
2003 2002
Nonqualified Other Nonqualified OtherPension Defined Postretirement Pension Defined Postretirement
Plan Benefit Plans Benefit Plans Plan Benefit Plans Benefit Plans
Discount rate . . . . . . . . . . . . . . . . . . 6.00% 6.00% 6.00% 6.50% 6.50% 6.50%Rate of compensation increase . . . . . . 5.50 n/a n/a 5.50 n/a n/a
134

WASHINGTON MUTUAL, INC. AND SUBSIDIARIES
NOTES TO CONSOLIDATED FINANCIAL STATEMENTS (Continued)
Weighted-average assumptions used to determine net periodic benefit cost for the Pension Plan,Nonqualified Defined Benefit Plans and Other Postretirement Benefit Plans were as follows:
Year Ended December 31,
2003 2002
Nonqualified Other Nonqualified OtherPension Defined Postretirement Pension Defined Postretirement
Plan Benefit Plans Benefit Plans Plan Benefit Plans Benefit Plans
Discount rate . . . . . . . . . . . . . . . . . . 6.50% 6.50% 6.50% 7.25% 7.25% 7.25%Rate of compensation increase . . . . . . 5.50 n/a n/a 5.50 n/a n/aExpected long-term return on plan
assets . . . . . . . . . . . . . . . . . . . . . . 8.00 n/a n/a 8.00 n/a n/a
Year Ended December 31,
2001
Nonqualified OtherPension Defined Postretirement
Plan Benefit Plans Benefit Plans
Discount rate . . . . . . . . . . . . . . . . . . . . . . . . . . . . . . . . . . . . . . . 7.75% 7.75% 7.75%Rate of compensation increase . . . . . . . . . . . . . . . . . . . . . . . . . . 5.50 n/a n/aExpected long-term return on plan assets . . . . . . . . . . . . . . . . . . . 8.00 n/a n/a
The expected long-term rate of return assumption was developed using a policy framework thatincludes an annual review of several factors including an analysis of historical asset returns, gauging marketconsensus, historical returns of the Pension Plan’s portfolio, reviewing longer term historical asset returnsand incorporating the results of asset return models.
It is policy that the asset return assumptions chosen for the upcoming year are maintained so long asthe actual long-term asset return experience is not significantly different from the past assumed asset rateof return and that there is no significant change in the targeted asset allocation or in the selection ofinvestment managers.
The review concluded with a recommendation to maintain the 8.00% expected long-term return onplan assets assumption for the Pension Plan.
135

WASHINGTON MUTUAL, INC. AND SUBSIDIARIES
NOTES TO CONSOLIDATED FINANCIAL STATEMENTS (Continued)
The Pension Plan’s weighted-average asset allocation at December 31, 2003 and 2002 by assetcategory was as follows:
Plan Assets at December 31,(1)
2003 2002Asset Category Pension Plan Pension Plan
Cash and equivalents . . . . . . . . . . . . . . . . . . . . . . . . . . . . . . . . . . . . . . . . 8% 2%Fixed income securities . . . . . . . . . . . . . . . . . . . . . . . . . . . . . . . . . . . . . . 27 35Domestic equities:
Large cap . . . . . . . . . . . . . . . . . . . . . . . . . . . . . . . . . . . . . . . . . . . . . . 46 47Small/mid cap . . . . . . . . . . . . . . . . . . . . . . . . . . . . . . . . . . . . . . . . . . . 8 6
International equities . . . . . . . . . . . . . . . . . . . . . . . . . . . . . . . . . . . . . . . 10 10Other . . . . . . . . . . . . . . . . . . . . . . . . . . . . . . . . . . . . . . . . . . . . . . . . . . . 1 –
Total . . . . . . . . . . . . . . . . . . . . . . . . . . . . . . . . . . . . . . . . . . . . . . . . 100% 100%
(1) The Nonqualified Defined Benefit Plans and Other Postretirement Benefit Plans had no plan assets at December 31, 2003 and2002.
The total portfolio will be managed on a balanced basis, with the primary asset categories to include:domestic large capitalization equities, domestic small/mid capitalization equities, fixed income (primarilyU.S.), and international equity investments.
It is the Company’s intention to allow the investment managers full discretion within the scope of theCompany’s Investment Policy Statement to allocate the Pension Plan assets within each of the asset classes.The Company’s Investment Policy Statement is established by the Company’s Plan Investment Committee.
The portfolio strategy will seek total return, defined as all income, gains, and losses, whether realizedor unrealized, over a long-term basis, defined as five years or more. At a minimum, the total returnobjective for each manager will be to exceed the Plan’s interest assumption.
Given the investment objectives of the Pension Plan and the Plan Investment Committee’s risktolerance, the Committee has set the following ‘‘target’’ asset allocation percentages:
Target Minimum Maximum
Domestic equities:Large cap . . . . . . . . . . . . . . . . . . . . . . . . . . . . . . . . . . . . . . . . . . . . . . 50% 40% 60%Small/mid cap . . . . . . . . . . . . . . . . . . . . . . . . . . . . . . . . . . . . . . . . . . . 8 4 12
Fixed income securities . . . . . . . . . . . . . . . . . . . . . . . . . . . . . . . . . . . . . 30 20 40International equities . . . . . . . . . . . . . . . . . . . . . . . . . . . . . . . . . . . . . . . 10 6 14Cash and equivalents . . . . . . . . . . . . . . . . . . . . . . . . . . . . . . . . . . . . . . . 2 1 10
It is anticipated that the overall allocation will stay within the target ranges noted above.
The Pension Plan assets include Washington Mutual, Inc.’s common stock and fixed income securitiesof $10 million, or 0.80% of total plan assets, and $8 million, or 0.73% of total plan assets at December 31,2003 and 2002.
Washington Mutual expects to contribute zero, $11 million and $6 million to the Pension Plan,Nonqualified Defined Benefit Plans and Other Postretirement Benefit Plans in 2004.
136

WASHINGTON MUTUAL, INC. AND SUBSIDIARIES
NOTES TO CONSOLIDATED FINANCIAL STATEMENTS (Continued)
The following benefit payments, which reflect expected future service, as appropriate, are expected tobe paid:
OtherNonqualified Postretirement
Defined BenefitPension Plan Benefit Plans Plans
(in millions)
2004 . . . . . . . . . . . . . . . . . . . . . . . . . . . . . . . . . . . . . . . . . . $ 58 $11 $ 62005 . . . . . . . . . . . . . . . . . . . . . . . . . . . . . . . . . . . . . . . . . . 62 11 62006 . . . . . . . . . . . . . . . . . . . . . . . . . . . . . . . . . . . . . . . . . . 64 10 62007 . . . . . . . . . . . . . . . . . . . . . . . . . . . . . . . . . . . . . . . . . . 67 11 62008 . . . . . . . . . . . . . . . . . . . . . . . . . . . . . . . . . . . . . . . . . . 71 11 52009-2013 . . . . . . . . . . . . . . . . . . . . . . . . . . . . . . . . . . . . . . . 443 54 26
Assumed health care cost trend rates were as follows:
Year Ended December 31,
2003 2002 2001
Health care cost trend rate assumed for next year . . . . . . . . . . . . . . . . . . . . . . 14.00% 14.00% 15.00%Rate to which the cost trend rate is assumed to decline (the ultimate trend
rate) . . . . . . . . . . . . . . . . . . . . . . . . . . . . . . . . . . . . . . . . . . . . . . . . . . . . . 5.00 5.00 5.00Year that the rate reaches the ultimate trend rate . . . . . . . . . . . . . . . . . . . . . . 2013 2012 2012
Assumed health care cost trend rates have a significant effect on the amounts reported for the OtherPostretirement Benefit Plans. A 1% change in assumed health care cost trend rates would not have amaterial impact on the service and interest cost or postretirement benefit obligation.
On December 8, 2003, the Medicare Prescription Drug, Improvement and Modernization Act of 2003(the ‘‘Act’’) was enacted into law. On January 12, 2004, the FASB issued Staff Position No. 106-1,Accounting and Disclosure Requirements Related to the Medicare Prescription Drug, Improvement andModernization Act of 2003 (‘‘FSP 106-1’’). FSP 106-1 permits employers that sponsor postretirementbenefit plans that provide prescription drug benefits to retirees to make a one-time election to defer theaccounting impact, if any, of the Act. The Company has elected to defer recognition of the provisions ofthe Act as permitted by FSP 106-1 pending issuance of final guidance and transition rules. The Company iscurrently reviewing the Act and the potential impact on its postretirement benefit plans. Changes topreviously reported information may be required depending on the transition rules under final guidance.
Account Balance Plans
Savings Plans. The Company sponsors a retirement savings and investment plan for all eligibleemployees that allows participants to make contributions by salary deduction equal to 50% or less of theirsalary pursuant to Section 401(k) of the Internal Revenue Code. Employee contributions vest immediately.Prior to January 1, 2004, the Company’s matching contributions and any profit sharing contributions madeto employees vested based on years of service. Company contributions made on or after January 1, 2004,vest immediately. In connection with the acquisition of Dime, the Company assumed Dime’s savings plan,which was available to substantially all employees, as well as Dime’s limited matching contributions.Dime’s saving plan was merged into the Company’s retirement savings and investment plan on July 1, 2002.
137

WASHINGTON MUTUAL, INC. AND SUBSIDIARIES
NOTES TO CONSOLIDATED FINANCIAL STATEMENTS (Continued)
Company contributions to savings plans were $114 million, $90 million and $65 million in 2003, 2002and 2001.
Other Account Balance Plans. The Company sponsors supplemental employee and executiveretirement plans for the benefit of certain officers. The plans are designed to supplement the benefits thatare accrued under the Pension Plans.
Other Expense
The following table shows expenses which exceeded 1% of total interest income and noninterestincome and which are not otherwise shown separately in the Consolidated Financial Statements or Notes.
Year Ended December 31,
2003 2002 2001
(in millions)
Postage . . . . . . . . . . . . . . . . . . . . . . . . . . . . . . . . . . . . . . . . . . . . . . . . . . . . $220 $192 $131Loan expense . . . . . . . . . . . . . . . . . . . . . . . . . . . . . . . . . . . . . . . . . . . . . . . . 253 211 126
Note 22: Derivative Financial Instruments
The Company uses a variety of derivative financial instruments to manage interest rate risk andreduce the effects that changing interest rates may have on net income. These instruments include interestrate swaps, interest rate caps, floors and corridors, swaptions, forward contracts, mortgage put options,interest rate futures and certain interest rate risk management contracts that are embedded within certainadjustable- and fixed-rate borrowings. The contract or notional amount of a derivative, along with theother terms of the derivative, is used to determine the amounts to be exchanged between the parties.Because the contract or notional amount does not represent amounts exchanged by the parties, it is not ameasure of loss exposure related to the use of derivatives nor of exposure to liquidity risk. Changes in fairvalue of derivative financial instruments affecting net income are recorded as operating activities withinthe Consolidated Statements of Cash Flows.
Fair value hedges
Interest rate swaps wherein the Company receives a fixed rate of interest (receive-fixed swaps) aredesignated as fair value hedges against fixed-rate borrowings. The fair value of these derivatives is reportedin other assets and other liabilities. Changes in the fair value of the hedging derivative and offsettingchanges in fair value attributable to the hedged risk of the hedged item are reported in interest expense onborrowings. For the years ended December 31, 2003, 2002 and 2001, the amounts recognized in earningsdue to hedge ineffectiveness of the fair value hedges of fixed-rate borrowings were immaterial.
The Company also mitigates the interest rate risks associated with the fixed-rate mortgage-backedsecurities with interest rate swap agreements where the Company pays a fixed rate of interest (pay-fixedswaps) and swaptions where the Company will enter into pay-fixed swaps if the swaptions are exercised.These pay-fixed swaps and swaptions are accounted for as fair value hedges of mortgage-backed securities.The fair value of these interest rate swaps and swaptions is reported in other assets and other liabilities.Changes in the fair value of the hedging derivative and offsetting changes in fair value attributable to thehedged risk of the hedged item are reported in other noninterest income. For the year endedDecember 31, 2003, the Company recognized a net loss of $3 million in earnings due to hedgeineffectiveness of fair value hedges of mortgage-backed securities.
138

WASHINGTON MUTUAL, INC. AND SUBSIDIARIES
NOTES TO CONSOLIDATED FINANCIAL STATEMENTS (Continued)
Home loans held for sale expose the Company to interest rate risk. The Company manages theinterest rate risk associated with home loans held for sale predominantly by entering into forward salesagreements and, to a lesser extent, interest rate swaps, swaptions and interest rate futures contracts.Certain of these forward sales agreements are accounted for as fair value hedges of loans held for sale. Thefair value of these forward sales agreements is reported in other assets and other liabilities. Changes in thefair value of the hedging derivative and offsetting changes in fair value attributable to the hedged risk ofthe hedged item are reported in gain from mortgage loans. Changes in the value of derivative instrumentsfor which hedge accounting treatment was not achieved are reported in revaluation gain from derivatives.For the years ended December 31, 2003 and 2002, the Company recognized net losses of $125 million and$184 million in earnings due to hedge ineffectiveness of fair value hedges of home loans held for sale. Forthe year ended December 31, 2001, the amount recognized in earnings due to hedge ineffectiveness of fairvalue hedges of home loans held for sale was immaterial.
The Company also originates fixed-rate multi-family and commercial real estate loans for sale in thesecondary market to investors. To mitigate the interest rate risks associated with this loan portfolio, theCompany enters into interest rate swap agreements where the Company pays a fixed rate of interest. Thesepay-fixed swaps are accounted for as fair value hedges of loans held for sale. The fair value of theseinterest rate swaps is reported in other assets and other liabilities. Changes in the fair value of the hedgingderivative and offsetting changes in fair value attributable to the hedged risk of the hedged item arereported in other noninterest income. For the years ended December 31, 2003, 2002 and 2001, theamounts recognized in earnings due to hedge ineffectiveness of fair value hedges of multi-family andcommercial real estate loans held for sale were immaterial.
All components of each derivative instrument’s gain or loss are included in the assessment of hedgeeffectiveness.
Cash flow hedges
The Company enters into interest rate swaps wherein the Company pays a fixed rate of interest andstand alone interest rate caps designated as cash flow hedges against adjustable-rate borrowings. TheCompany will also enter into cash flow hedges to hedge the forecasted sale of a portfolio of fixed-ratemulti-family loans using interest rate swaps. The fair value of these derivatives is reported in other assetsand other liabilities. For the hedges against adjustable-rate borrowings, amounts reported in accumulatedother comprehensive income are subsequently reclassified to interest expense on borrowings during thesame period in which the hedged item affects interest expense. For the hedges against the forecasted saleof loans, amounts recorded in accumulated other comprehensive income are subsequently reclassified intoother noninterest income, during the same period in which the hedged item affects earnings. For the yearsended December 31, 2003 and 2002, the Company recognized net losses of $5 million and $3 million inearnings due to hedge ineffectiveness of cash flow hedges. For the year ended December 31, 2001, theamount recognized in earnings due to hedge ineffectiveness of cash flow hedges was immaterial.
During 2002, the Company removed its cash flow hedge designation on certain payor swaptionsbecause it was probable that the underlying hedged items, which were interest payments on anticipatedissuances of certain long-term adjustable-rate borrowings, were not going to occur by the end of theoriginally specified time periods or within the additional periods of time allowed by Statement No. 133.Thus in accordance with Statement No. 133, the pretax accumulated loss of $112 million related to thesepayor swaptions was reclassified from accumulated other comprehensive income to other noninterestincome.
139

WASHINGTON MUTUAL, INC. AND SUBSIDIARIES
NOTES TO CONSOLIDATED FINANCIAL STATEMENTS (Continued)
As of December 31, 2003, accumulated other comprehensive income included $299 million ofdeferred after-tax net losses related to derivative instruments designated as cash flow hedges ofadjustable-rate liabilities that are expected to be reclassified into earnings during the next twelve months,as compared to $397 million of deferred after-tax net losses related to derivative instruments designated ascash flow hedges at December 31, 2002.
All components of each derivative instrument’s gain or loss are included in the assessment of hedgeeffectiveness.
Risk management derivatives
In addition to investment securities that are held for MSR risk management purposes, the Companyenters into a combination of derivatives to manage changes in fair value of its MSR. During 2003, 2002 and2001, the Company did not attempt to achieve hedge accounting treatment under Statement No. 133 forthese derivatives. These derivatives include interest rate swaps, swaptions, floors and forward purchasecommitments. The fair value of these derivatives is reported in other assets and other liabilities. Thechanges in the fair value of these derivatives are reported in revaluation gain from derivatives.
Occasionally, the Company utilizes derivative instruments for asset/liability interest rate riskmanagement which do not qualify for hedge accounting treatment. These risk management derivativesinclude interest rate swaps, swaptions, interest rate caps and corridors. The fair value of these derivatives isreported in other assets and other liabilities. The changes in the fair value of these derivatives are reportedin other noninterest income.
The Company occasionally purchases or originates financial instruments that contain an embeddedderivative instrument. At inception of the financial instrument, the Company determines whether anembedded derivative is required to be accounted for separately as a derivative. As of December 31, 2003and 2002, all of the Company’s embedded derivatives are considered clearly and closely related to the hostcontract and are not required to be separated from their host contracts.
Derivative Counterparty Credit Risk
Derivative financial instruments expose the Company to credit risk in the event of nonperformance bycounterparties to such agreements. This risk consists primarily of the termination value of agreementswhere the Company is in a favorable position. Credit risk related to derivative financial instruments isconsidered and provided for separately from the allowance for loan and lease losses. The Companymanages the credit risk associated with its various derivative agreements through counterparty creditreview, counterparty exposure limits and monitoring procedures. With the exception of forward purchaseand sale commitments, the Company obtains collateral from the counterparties for amounts in excess ofthe exposure limits and monitors its exposure and collateral requirements on a daily basis. The fair value ofcollateral received from a counterparty is continually monitored and the Company may request additionalcollateral from counterparties or return collateral pledged as deemed appropriate. The Company’sagreements generally include master netting agreements whereby the counterparties are entitled to settletheir positions ‘‘net’’. At December 31, 2003 and 2002, the gross positive fair value of the Company’sderivative financial instruments was $1.34 billion and $3.76 billion. The Company’s master nettingagreements at December 31, 2003 and 2002 reduced the Company’s derivative counterparty credit risk by$646 million and $1.10 billion. The Company’s collateral against derivative financial instruments was$323 million and $1.74 billion at December 31, 2003 and 2002.
140
WASHINGTON MUTUAL, INC. AND SUBSIDIARIES
NOTES TO CONSOLIDATED FINANCIAL STATEMENTS (Continued)
Note 23: Fair Value of Financial Instruments
The following estimated fair value amounts have been determined by the Company using availablemarket information and appropriate valuation methodologies. These estimates do not reflect any premiumor discount that could result from offering for sale at one time the Company’s entire holdings of aparticular financial instrument. Because an active secondary market does not exist for a portion of theCompany’s financial instruments, fair value estimates were based on management’s judgment concerningfuture expected loss experience, current economic conditions, risk characteristics of various financialinstruments and other factors. In addition, considerable judgment was required to interpret market data todevelop the estimates of fair value. Accordingly, the estimates presented herein are not necessarilyindicative of the amounts the Company could realize in a current market exchange. The use of differentmarket assumptions and/or estimation methodologies may have a material effect on the estimated fairvalue amounts.
Fair value estimates were determined for existing financial instruments, including derivativeinstruments, without attempting to estimate the value of anticipated future business and the value ofcertain assets and liabilities that were not considered financial instruments. Significant assets that were notconsidered financial instruments include premises and equipment, net tax assets, real estate held forinvestment, foreclosed assets and other intangible assets. In addition, the value of the servicing rights forloans sold in which the MSR has not been capitalized was excluded from the valuation. Finally, the taxramifications related to the realization of the unrealized gains and losses could have a significant effect onfair value estimates and have not been considered in any of the valuations.
Assets and liabilities whose carrying amounts approximate fair value include cash and cashequivalents, federal funds sold and securities purchased under resale agreements, available-for-salesecurities, investment in FHLBs, checking accounts, savings accounts and money market deposit accounts,federal funds purchased and commercial paper and derivative financial instruments.
The following methods and assumptions were used to estimate the fair value of each class of financialinstrument as of December 31, 2003 and 2002:
Federal funds sold and securities purchased under resale agreements—The carrying amountrepresented fair value. Federal funds sold and securities purchased under resale agreements areinvestments of high liquidity and have characteristics similar to cash.
Available-for-sale securities—Fair values were based on quoted market prices. If a quoted marketprice was not available, fair value was estimated using market prices for similar securities, as well asinternal analysis.
Investment in FHLBs—The carrying amount represented fair value. FHLB stock does not have areadily determinable fair value and is required to be sold back at its par value.
Loans held for sale—Fair values were derived from quoted market prices, internal estimates andpricing of similar instruments.
Loans held in portfolio—Loans were priced using an option-adjusted cash flow valuationmethodology. Fair values were derived from quoted market prices, internal estimates and the pricing ofsimilar instruments.
MSR—The fair value of MSR was estimated using projected cash flows, adjusted for the effects ofanticipated prepayments, using a market discount rate. The fair value estimates exclude the value of theservicing rights for loans sold in which the MSR has not been capitalized.
141
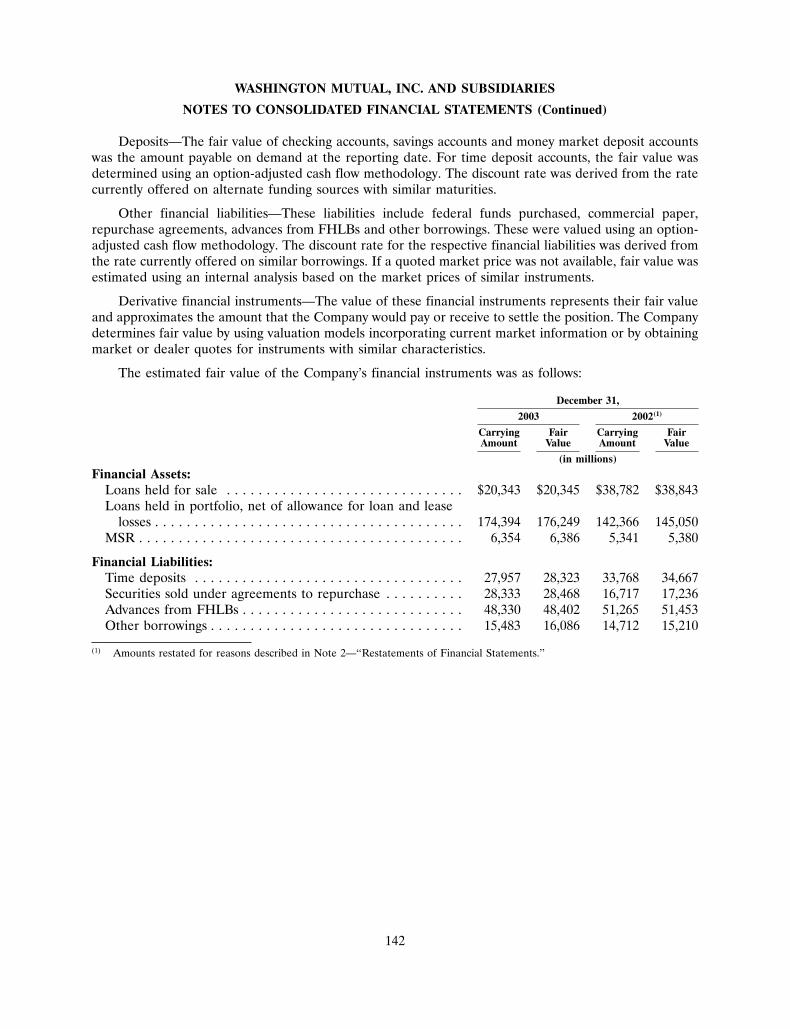
WASHINGTON MUTUAL, INC. AND SUBSIDIARIES
NOTES TO CONSOLIDATED FINANCIAL STATEMENTS (Continued)
Deposits—The fair value of checking accounts, savings accounts and money market deposit accountswas the amount payable on demand at the reporting date. For time deposit accounts, the fair value wasdetermined using an option-adjusted cash flow methodology. The discount rate was derived from the ratecurrently offered on alternate funding sources with similar maturities.
Other financial liabilities—These liabilities include federal funds purchased, commercial paper,repurchase agreements, advances from FHLBs and other borrowings. These were valued using an option-adjusted cash flow methodology. The discount rate for the respective financial liabilities was derived fromthe rate currently offered on similar borrowings. If a quoted market price was not available, fair value wasestimated using an internal analysis based on the market prices of similar instruments.
Derivative financial instruments—The value of these financial instruments represents their fair valueand approximates the amount that the Company would pay or receive to settle the position. The Companydetermines fair value by using valuation models incorporating current market information or by obtainingmarket or dealer quotes for instruments with similar characteristics.
The estimated fair value of the Company’s financial instruments was as follows:
December 31,
2003 2002(1)
Carrying Fair Carrying FairAmount Value Amount Value
(in millions)
Financial Assets:Loans held for sale . . . . . . . . . . . . . . . . . . . . . . . . . . . . . . $20,343 $20,345 $38,782 $38,843Loans held in portfolio, net of allowance for loan and lease
losses . . . . . . . . . . . . . . . . . . . . . . . . . . . . . . . . . . . . . . . 174,394 176,249 142,366 145,050MSR . . . . . . . . . . . . . . . . . . . . . . . . . . . . . . . . . . . . . . . . . 6,354 6,386 5,341 5,380
Financial Liabilities:Time deposits . . . . . . . . . . . . . . . . . . . . . . . . . . . . . . . . . . 27,957 28,323 33,768 34,667Securities sold under agreements to repurchase . . . . . . . . . . 28,333 28,468 16,717 17,236Advances from FHLBs . . . . . . . . . . . . . . . . . . . . . . . . . . . . 48,330 48,402 51,265 51,453Other borrowings . . . . . . . . . . . . . . . . . . . . . . . . . . . . . . . . 15,483 16,086 14,712 15,210
(1) Amounts restated for reasons described in Note 2—‘‘Restatements of Financial Statements.’’
142

WASHINGTON MUTUAL, INC. AND SUBSIDIARIES
NOTES TO CONSOLIDATED FINANCIAL STATEMENTS (Continued)
Note 24: Financial Information—Washington Mutual, Inc.
The following Washington Mutual, Inc. (parent only) financial information should be read inconjunction with the other Notes to Consolidated Financial Statements.
CONDENSED STATEMENTS OF INCOME
Year Ended December 31,
2003 2002(1) 2001(1)
(in millions)
Interest IncomeNotes receivable from subsidiaries . . . . . . . . . . . . . . . . . . . . . . . . . . . . . $ 13 $ 21 $ 38Other interest income . . . . . . . . . . . . . . . . . . . . . . . . . . . . . . . . . . . . . . 5 10 1
Total interest income . . . . . . . . . . . . . . . . . . . . . . . . . . . . . . . . . . . . . 18 31 39Interest Expense
Other borrowings . . . . . . . . . . . . . . . . . . . . . . . . . . . . . . . . . . . . . . . . . . 262 274 223
Total interest expense . . . . . . . . . . . . . . . . . . . . . . . . . . . . . . . . . . . . . 262 274 223
Net interest expense . . . . . . . . . . . . . . . . . . . . . . . . . . . . . . . . . . . . . . (244) (243) (184)Provision for loan and lease losses . . . . . . . . . . . . . . . . . . . . . . . . . . . . . – 1 1
Net interest expense after provision for loan and lease losses . . . . . . . . (244) (244) (185)Noninterest Income
Other income . . . . . . . . . . . . . . . . . . . . . . . . . . . . . . . . . . . . . . . . . . . . 13 6 6
Total noninterest income . . . . . . . . . . . . . . . . . . . . . . . . . . . . . . . . . . . 13 6 6Noninterest Expense
Compensation and benefits . . . . . . . . . . . . . . . . . . . . . . . . . . . . . . . . . . . 63 42 28Other expense . . . . . . . . . . . . . . . . . . . . . . . . . . . . . . . . . . . . . . . . . . . . 61 77 74
Total noninterest expense . . . . . . . . . . . . . . . . . . . . . . . . . . . . . . . . . . 124 119 102
Net loss before income tax benefit, dividends from subsidiaries andequity in undistributed (loss) income of subsidiaries . . . . . . . . . . . . . (355) (357) (281)
Income tax benefit . . . . . . . . . . . . . . . . . . . . . . . . . . . . . . . . . . . . . . . . . 184 147 111Dividends from subsidiaries . . . . . . . . . . . . . . . . . . . . . . . . . . . . . . . . . . 4,833 2,996 1,642Equity in undistributed (loss) income of subsidiaries . . . . . . . . . . . . . . . . (782) 1,075 1,632
Net Income . . . . . . . . . . . . . . . . . . . . . . . . . . . . . . . . . . . . . . . . . . . . . . . . $3,880 $3,861 $3,104
(1) Amounts restated for reasons described in Note 2—‘‘Restatements of Financial Statements.’’
143
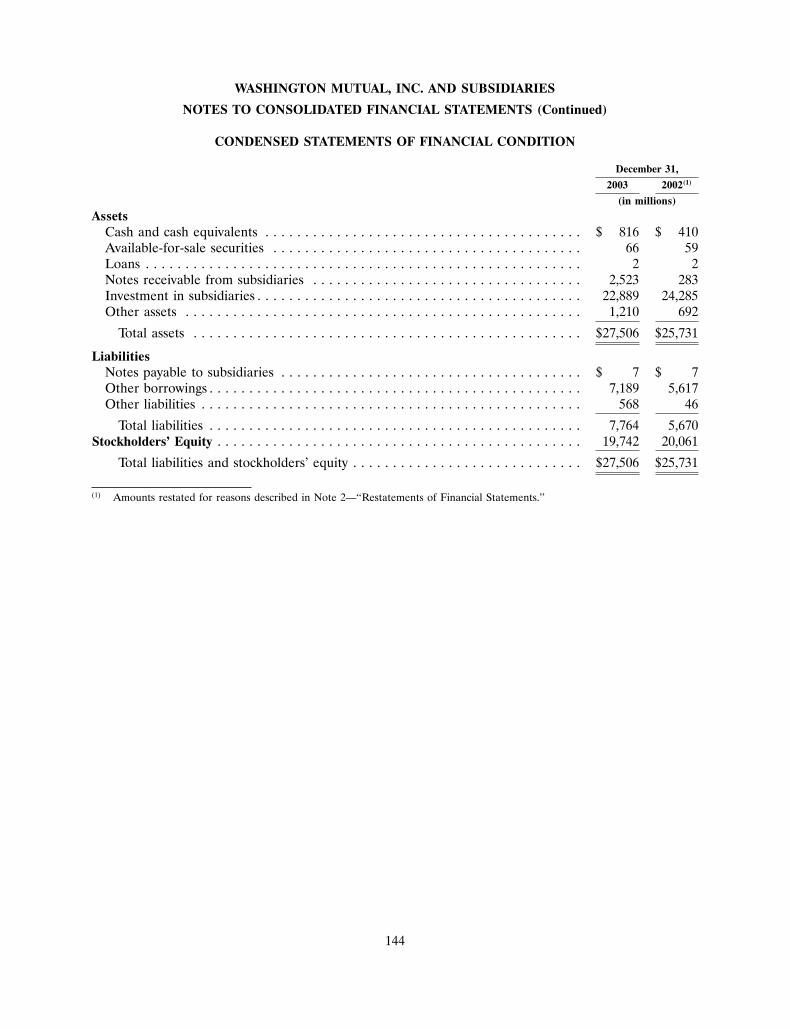
WASHINGTON MUTUAL, INC. AND SUBSIDIARIES
NOTES TO CONSOLIDATED FINANCIAL STATEMENTS (Continued)
CONDENSED STATEMENTS OF FINANCIAL CONDITION
December 31,
2003 2002(1)
(in millions)
AssetsCash and cash equivalents . . . . . . . . . . . . . . . . . . . . . . . . . . . . . . . . . . . . . . . . $ 816 $ 410Available-for-sale securities . . . . . . . . . . . . . . . . . . . . . . . . . . . . . . . . . . . . . . . 66 59Loans . . . . . . . . . . . . . . . . . . . . . . . . . . . . . . . . . . . . . . . . . . . . . . . . . . . . . . . 2 2Notes receivable from subsidiaries . . . . . . . . . . . . . . . . . . . . . . . . . . . . . . . . . . 2,523 283Investment in subsidiaries . . . . . . . . . . . . . . . . . . . . . . . . . . . . . . . . . . . . . . . . . 22,889 24,285Other assets . . . . . . . . . . . . . . . . . . . . . . . . . . . . . . . . . . . . . . . . . . . . . . . . . . 1,210 692
Total assets . . . . . . . . . . . . . . . . . . . . . . . . . . . . . . . . . . . . . . . . . . . . . . . . . $27,506 $25,731
LiabilitiesNotes payable to subsidiaries . . . . . . . . . . . . . . . . . . . . . . . . . . . . . . . . . . . . . . $ 7 $ 7Other borrowings . . . . . . . . . . . . . . . . . . . . . . . . . . . . . . . . . . . . . . . . . . . . . . . 7,189 5,617Other liabilities . . . . . . . . . . . . . . . . . . . . . . . . . . . . . . . . . . . . . . . . . . . . . . . . 568 46
Total liabilities . . . . . . . . . . . . . . . . . . . . . . . . . . . . . . . . . . . . . . . . . . . . . . . 7,764 5,670Stockholders’ Equity . . . . . . . . . . . . . . . . . . . . . . . . . . . . . . . . . . . . . . . . . . . . . . 19,742 20,061
Total liabilities and stockholders’ equity . . . . . . . . . . . . . . . . . . . . . . . . . . . . . $27,506 $25,731
(1) Amounts restated for reasons described in Note 2—‘‘Restatements of Financial Statements.’’
144

WASHINGTON MUTUAL, INC. AND SUBSIDIARIES
NOTES TO CONSOLIDATED FINANCIAL STATEMENTS (Continued)
CONDENSED STATEMENTS OF CASH FLOWS
Year Ended December 31,
2003 2002(1) 2001(1)
(in millions)
Cash Flows from Operating ActivitiesNet income . . . . . . . . . . . . . . . . . . . . . . . . . . . . . . . . . . . . . . . . . . . . . . $ 3,880 $ 3,861 $ 3,104Adjustments to reconcile net income to net cash provided by operating
activities:Provision for loan and lease losses . . . . . . . . . . . . . . . . . . . . . . . . . . . – 1 1(Gain) loss on sale of assets . . . . . . . . . . . . . . . . . . . . . . . . . . . . . . . . (3) 19 22Equity in undistributed loss (income) of subsidiaries . . . . . . . . . . . . . . 782 (1,075) (1,632)Increase in other assets . . . . . . . . . . . . . . . . . . . . . . . . . . . . . . . . . . . (143) (756) (96)Increase (decrease) in other liabilities . . . . . . . . . . . . . . . . . . . . . . . . . 564 (231) 191
Net cash provided by operating activities . . . . . . . . . . . . . . . . . . . . . 5,080 1,819 1,590Cash Flows from Investing Activities
Purchases of securities . . . . . . . . . . . . . . . . . . . . . . . . . . . . . . . . . . . . (3) (69) (30)Proceeds from sales and maturities of available-for-sale securities . . . . . 1 1 2Origination of loans, net of principal payments . . . . . . . . . . . . . . . . . . – 1 1(Increase) decrease in notes receivable from subsidiaries . . . . . . . . . . . (2,240) 481 (401)Investment in subsidiaries . . . . . . . . . . . . . . . . . . . . . . . . . . . . . . . . . . (520) (2,957) (645)
Net cash used by investing activities . . . . . . . . . . . . . . . . . . . . . . . . . (2,762) (2,543) (1,073)Cash Flows from Financing Activities
Proceeds from other borrowings . . . . . . . . . . . . . . . . . . . . . . . . . . . . . 1,573 1,854 903Cash dividends paid on preferred and common stock . . . . . . . . . . . . . . (1,274) (1,026) (781)Cash dividends returned . . . . . . . . . . . . . . . . . . . . . . . . . . . . . . . . . . . 68 – –Repurchase of common stock . . . . . . . . . . . . . . . . . . . . . . . . . . . . . . . (2,699) (1,303) (231)Common stock warrants issued . . . . . . . . . . . . . . . . . . . . . . . . . . . . . . – – 398Common stock issued . . . . . . . . . . . . . . . . . . . . . . . . . . . . . . . . . . . . . 420 218 197
Net cash (used) provided by financing activities . . . . . . . . . . . . . . . . (1,912) (257) 486
Increase (decrease) in cash and cash equivalents . . . . . . . . . . . . . . . . 406 (981) 1,003Cash and cash equivalents, beginning of year . . . . . . . . . . . . . . . . . . 410 1,391 388
Cash and cash equivalents, end of year . . . . . . . . . . . . . . . . . . . . . . $ 816 $ 410 $ 1,391
(1) Amounts restated for reasons described in Note 2—‘‘Restatements of Financial Statements.’’
Note 25: Operating Segments
The Company has grouped its products and services into two primary categories—those marketed toretail consumers and those marketed to commercial customers and has established three operatingsegments for the purpose of management reporting: Retail Banking and Financial Services, MortgageBanking and the Commercial Group. Unlike financial accounting, there is no comprehensive, authoritativeguidance for management reporting. The management reporting process measures the performance of theoperating segments based on the management structure of the Company and is not necessarily comparablewith similar information for any other financial institution. The Company’s operating segments are definedby the products and services they offer.
145

WASHINGTON MUTUAL, INC. AND SUBSIDIARIES
NOTES TO CONSOLIDATED FINANCIAL STATEMENTS (Continued)
The Company uses various methodologies, and continues to enhance those methodologies, to assigncertain balance sheet and income statement items to the responsible operating segment. Methodologiesthat are applied to the measurement of segment profitability include: (1) a funds transfer pricing system,which matches assets and liabilities with the approximate market benchmark of the Company’s cost offunds. It is based on the maturities and interest rate sensitivities of assets and liabilities and is designed toextract interest rate risk from the business units and concentrate it in the Treasury Division, where it ismanaged. This system measures the interest margin that is contributed by individual products, customersand organizational units. It captures historical interest rate sensitivity of the balance sheet, riskmanagement decisions within approved limits and the temporary divergence of funds transfer pricingassumptions from the actual duration of assets and liabilities. Certain basis and other residual risk remainsin the operating segments; (2) a calculation of the provision for loan and lease losses based onmanagement’s current assessment of the long-term, normalized net charge-off ratio for loan productswithin each segment, which differs from the ‘‘losses inherent in the loan portfolio’’ methodology that isused to measure the allowance for loan and lease losses under accounting principles generally accepted inthe United States of America. This methodology is used to provide segment management with provisioninformation for strategic decision making; (3) the utilization of an activity-based costing approach tomeasure allocations of certain operating expenses that were not directly charged to the segments; (4) theallocation of goodwill and other intangible assets to the operating segments based on benefits receivedfrom each acquisition; (5) capital charges for goodwill as a component of an internal measurement ofreturn on the goodwill allocated to the operating segment; and (6) an economic capital model which is theframework for assessing business performance on a risk-adjusted basis. Changing economic conditions,further research and new data may lead to the update of the capital allocation assumptions.
On September 30, 2003, the Company announced the realignment of its operating segment structure.As a result of this realignment, the Company’s products and services are now grouped into two primarycategories—those marketed to retail consumers and those marketed to commercial customers. Thefinancial information reported for the Company’s operating segments is presented under this recentlyrealigned structure. Historical periods have been restated to conform to this new presentation.
The Consumer Group provides access to customers through a wide range of channels, whichencompass a network of retail banking stores, retail and wholesale home loan centers and ATMs.Additionally, 24-hour service is provided through telephone call centers and online banking. TheConsumer Group consists of two distinct operating segments for which separate financial reports areprepared: the Retail Banking and Financial Services segment, and the Mortgage Banking segment.
The Retail Banking and Financial Services segment offers a diversified set of products and financialservices to individual consumers. These products and services include deposit products such as theCompany’s signature free checking and Platinum accounts, savings accounts, money market depositaccounts and time deposit accounts. Loan products include home loans, home equity loans and lines ofcredit and consumer loans. This segment also holds those home loans originated and serviced by theMortgage Banking segment for retention in the Company’s loan portfolio, and purchased subprime homeloans. Financial services offered by this segment include the Company’s mutual fund managementbusiness, WM Advisors, Inc., which provides investment advisory and mutual fund distribution services,and investment advisory and securities brokerage services that are offered by WM Financial Services, Inc.,a licensed broker-dealer. Fixed annuities are also offered to the public through licensed bankingemployees.
The Mortgage Banking segment originates and services home loans that are sold to secondary marketparticipants and loans that are held in portfolio by the Retail Banking and Financial Services segment.Costs incurred by the Mortgage Banking segment for servicing the Company’s home loan portfolio are
146

WASHINGTON MUTUAL, INC. AND SUBSIDIARIES
NOTES TO CONSOLIDATED FINANCIAL STATEMENTS (Continued)
charged to the Retail Banking and Financial Services segment. Insurance services that complement themortgage process, such as private mortgage insurance and property and casualty insurance policies, arealso offered by this segment. This segment also manages the Company’s captive reinsurance activities andoffers a variety of life insurance policies.
The Commercial Group’s activities are managed as one operating segment. This group’s products andservices include loans made to developers and investors of multi-family and other commercial real estateproperties, commercial real estate loan servicing, selling commercial real estate loans to secondary marketparticipants, mortgage banker financing and loans made to small- and mid-sized businesses. The Groupalso provides financing to builders for the construction of new homes. Through Long Beach Mortgage, awholly-owned subsidiary of the Company and a component of the Company’s specialty mortgage financeprogram, the Commercial Group originates and services home loans made to higher-risk borrowers thatare sold to private and other secondary market participants.
The Corporate Support/Treasury & Other category includes management of the Company’s interestrate risk, liquidity, capital, borrowings and investment securities and home loan mortgage-backed securitiesportfolios. To the extent not allocated to the business segments, this category also includes the costs of theCompany’s technology services, facilities, legal, accounting and finance, and human resources. Alsoreported in this category is the net impact of funds transfer pricing for loan and deposit balances includingthe effects of changes in interest rates on the Company’s net interest margin and the effects of inter-segment allocations of gains and losses related to interest rate risk management instruments.
147

WASHINGTON MUTUAL, INC. AND SUBSIDIARIES
NOTES TO CONSOLIDATED FINANCIAL STATEMENTS (Continued)
Financial highlights by operating segment were as follows:Year Ended December 31, 2003
Consumer Group
Retail CorporateBanking & Support/Financial Mortgage Commercial Treasury ReconcilingServices Banking Group & Other Adjustments Total
(dollars in millions)Condensed income statement:
Net interest income (expense) . . . . $ 4,018 $ 2,462 $ 1,323 $ (530) $ 356(1) $ 7,629Provision for loan and lease losses . 146 – 115 3 (222)(2) 42Noninterest income . . . . . . . . . . . 2,497 2,980 476 649 (752)(3) 5,850Inter-segment revenue (expense) . . 179 (179) – – – –Noninterest expense . . . . . . . . . . . 3,950 3,105 561 635 (843)(4) 7,408
Income (loss) from continuingoperations before income taxes . . 2,598 2,158 1,123 (519) 669 6,029
Income taxes (benefit) . . . . . . . . . 996 827 405 (192) 200(5) 2,236
Income (loss) from continuingoperations . . . . . . . . . . . . . . . . 1,602 1,331 718 (327) 469 3,793
Income from discontinuedoperations, net of taxes . . . . . . . – – 87 – – 87
Net income (loss) . . . . . . . . . . . . . $ 1,602 $ 1,331 $ 805 $ (327) $ 469 $ 3,880
Performance and other data:Efficiency ratio . . . . . . . . . . . . . . 51.27%(6) 55.03%(6) 24.68%(6) n/a n/a 54.96%(7)
Average loans . . . . . . . . . . . . . . . $121,119 $42,626 $35,695 $ (255) $(1,260)(8) $197,925Average assets . . . . . . . . . . . . . . . 133,004 69,900 44,376 37,920 (2,081)(8)(9) 283,119Average deposits . . . . . . . . . . . . . 125,440 27,112 5,407 5,626 n/a 163,585
(1) Represents the difference between home loan premium amortization recorded by the Retail Banking and Financial Servicessegment and the amount recognized in the Company’s Consolidated Statements of Income. For management reportingpurposes, loans that are held in portfolio by the Retail Banking and Financial Services segment are treated as if they arepurchased from the Mortgage Banking segment. Since the cost basis of these loans includes an assumed profit factor paid to theMortgage Banking segment, the amortization of loan premiums recorded by the Retail Banking and Financial Services segmentincludes this assumed profit factor and must therefore be eliminated as a reconciling adjustment.
(2) Represents the difference between the long-term, normalized net charge-off ratio used to assess expected loan and lease lossesfor the operating segments and the ‘‘losses inherent in the loan portfolio’’ methodology used by the Company.
(3) Represents the difference between gain from mortgage loans recorded by the Mortgage Banking segment and the gain frommortgage loans recognized in the Company’s Consolidated Statements of Income. As the Mortgage Banking segment holds noloans in portfolio, all loans originated or purchased by this segment are considered to be salable for management reportingpurposes.
(4) Represents the corporate offset for goodwill cost of capital allocated to segments.(5) Represents the tax effect of reconciling adjustments.(6) The efficiency ratio is defined as noninterest expense, excluding a cost of capital charge on goodwill, divided by total revenue
(net interest income and noninterest income).(7) The efficiency ratio is defined as noninterest expense divided by total revenue (net interest income and noninterest income).(8) Represents the inter-segment offset of $1,260 million for inter-segment loan premiums that Retail Banking and Financial
Services recognized from the transfer of portfolio loans from Mortgage Banking.(9) Represents the impact to the allowance for loan and lease losses of $821 million that results from the difference between the
long-term, normalized net charge-off ratio used to assess expected loan and lease losses for the operating segments and the‘‘losses inherent in the loan portfolio’’ methodology used by the Company.
148

WASHINGTON MUTUAL, INC. AND SUBSIDIARIES
NOTES TO CONSOLIDATED FINANCIAL STATEMENTS (Continued)
Year Ended December 31, 2002
Consumer Group
Retail CorporateBanking & Support/Financial Mortgage Commercial Treasury ReconcilingServices Banking Group & Other Adjustments Total
(dollars in millions)Condensed income statement:
Net interest income . . . . . . . . . . . $ 3,813 $ 1,774 $ 1,179 $ 1,068 $ 295(1) $ 8,129Provision for loan and lease losses . 282 – 202 3 (83)(2) 404Noninterest income (expense) . . . . 2,243 2,365 508 (76) (571)(3) 4,469Inter-segment revenue (expense) . . 96 (96) – – – –Noninterest expense . . . . . . . . . . . 3,562 2,293 514 635 (816)(4) 6,188
Income from continuing operationsbefore income taxes . . . . . . . . . 2,308 1,750 971 354 623 6,006
Income taxes . . . . . . . . . . . . . . . . 880 655 352 131 199(5) 2,217
Income from continuing operations . 1,428 1,095 619 223 424 3,789Income from discontinued
operations, net of taxes . . . . . . . – – 72 – – 72
Net income . . . . . . . . . . . . . . . . . $ 1,428 $ 1,095 $ 691 $ 223 $ 424 $ 3,861
Performance and other data:Efficiency ratio . . . . . . . . . . . . . . 49.79%(6) 51.67%(6) 23.76%(6) n/a n/a 49.12%(7)
Average loans . . . . . . . . . . . . . . . $114,149 $28,666 $33,106 $ (435) $ (957)(8) $174,529Average assets . . . . . . . . . . . . . . . 125,682 48,560 40,171 58,824 (1,817)(8)(9) 271,420Average deposits . . . . . . . . . . . . . 112,034 13,583 4,014 4,885 n/a 134,516
(1) Represents the difference between home loan premium amortization recorded by the Retail Banking and Financial Servicessegment and the amount recognized in the Company’s Consolidated Statements of Income. For management reportingpurposes, loans that are held in portfolio by the Retail Banking and Financial Services segment are treated as if they arepurchased from the Mortgage Banking segment. Since the cost basis of these loans includes an assumed profit factor paid to theMortgage Banking segment, the amortization of loan premiums recorded by the Retail Banking and Financial Services segmentincludes this assumed profit factor and must therefore be eliminated as a reconciling adjustment.
(2) Represents the difference between the long-term, normalized net charge-off ratio used to assess expected loan and lease lossesfor the operating segments and the ‘‘losses inherent in the loan portfolio’’ methodology used by the Company.
(3) Represents the difference between gain from mortgage loans recorded by the Mortgage Banking segment and the gain frommortgage loans recognized in the Company’s Consolidated Statements of Income. As the Mortgage Banking segment holds noloans in portfolio, all loans originated or purchased by this segment are considered to be salable for management reportingpurposes.
(4) Represents the corporate offset for goodwill cost of capital allocated to segments.(5) Represents the tax effect of reconciling adjustments.(6) The efficiency ratio is defined as noninterest expense, excluding a cost of capital charge on goodwill, divided by total revenue
(net interest income and noninterest income).(7) The efficiency ratio is defined as noninterest expense divided by total revenue (net interest income and noninterest income).(8) Represents the inter-segment offset of $957 million for inter-segment loan premiums that Retail Banking and Financial Services
recognized from the transfer of portfolio loans from Mortgage Banking.(9) Represents the impact to the allowance for loan and lease losses of $860 million that results from the difference between the
long-term, normalized net charge-off ratio used to assess expected loan and lease losses for the operating segments and the‘‘losses inherent in the loan portfolio’’ methodology used by the Company.
149

WASHINGTON MUTUAL, INC. AND SUBSIDIARIES
NOTES TO CONSOLIDATED FINANCIAL STATEMENTS (Continued)
Year Ended December 31, 2001
Consumer Group
Retail CorporateBanking & Support/Financial Mortgage Commercial Treasury ReconcilingServices Banking Group & Other Adjustments Total
(dollars in millions)Condensed income statement:
Net interest income . . . . . . . . . . . $ 2,743 $ 828 $ 892 $ 1,765 $ 264(1) $ 6,492Provision for loan and lease losses . 218 – 119 7 82(2) 426Noninterest income (expense) . . . . 1,817 1,288 429 (74) (284)(3) 3,176Inter-segment revenue (expense) . . 62 (62) – – – –Noninterest expense . . . . . . . . . . . 2,551 1,134 373 610 (252)(4) 4,416
Income from continuing operationsbefore income taxes . . . . . . . . . 1,853 920 829 1,074 150 4,826
Income taxes . . . . . . . . . . . . . . . . 694 357 302 397 33(5) 1,783
Income from continuing operations . 1,159 563 527 677 117 3,043Income from discontinued
operations, net of taxes . . . . . . . – – 61 – – 61
Net income . . . . . . . . . . . . . . . . . $ 1,159 $ 563 $ 588 $ 677 $ 117 $ 3,104
Performance and other data:Efficiency ratio . . . . . . . . . . . . . . 52.64%(6) 51.77%(6) 23.31%(6) n/a n/a 44.29%(7)
Average loans . . . . . . . . . . . . . . . $ 98,364 $18,169 $29,061 $ (20) $ (793)(8) $144,781Average assets . . . . . . . . . . . . . . . 107,556 26,356 35,176 57,875 (1,422)(8)(9) 225,541Average deposits . . . . . . . . . . . . . 81,194 7,591 3,855 3,665 n/a 96,305
(1) Represents the difference between home loan premium amortization recorded by the Retail Banking and Financial Servicessegment and the amount recognized in the Company’s Consolidated Statements of Income. For management reportingpurposes, loans that are held in portfolio by the Retail Banking and Financial Services segment are treated as if they arepurchased from the Mortgage Banking segment. Since the cost basis of these loans includes an assumed profit factor paid to theMortgage Banking segment, the amortization of loan premiums recorded by the Retail Banking and Financial Services segmentincludes this assumed profit factor and must therefore be eliminated as a reconciling adjustment.
(2) Represents the difference between the long-term, normalized net charge-off ratio used to assess expected loan and lease lossesfor the operating segments and the ‘‘losses inherent in the loan portfolio’’ methodology used by the Company.
(3) Represents the difference between gain from mortgage loans recorded by the Mortgage Banking segment and the gain frommortgage loans recognized in the Company’s Consolidated Statements of Income. As the Mortgage Banking segment holds noloans in portfolio, all loans originated or purchased by this segment are considered to be salable for management reportingpurposes.
(4) Represents the corporate offset for goodwill cost of capital allocated to segments.(5) Represents the tax effect of reconciling adjustments.(6) The efficiency ratio is defined as noninterest expense, excluding a cost of capital charge on goodwill, divided by total revenue
(net interest income and noninterest income).(7) The efficiency ratio is defined as noninterest expense divided by total revenue (net interest income and noninterest income).(8) Represents the inter-segment offset of $793 million for inter-segment loan premiums that Retail Banking and Financial Services
recognized from the transfer of portfolio loans from Mortgage Banking.(9) Represents the impact to the allowance for loan and lease losses of $629 million that results from the difference between the
long-term, normalized net charge-off ratio used to assess expected loan and lease losses for the operating segments and the‘‘losses inherent in the loan portfolio’’ methodology used by the Company.
150

WASHINGTON MUTUAL, INC. AND SUBSIDIARIES
SUPPLEMENTARY DATA
Quarterly Results of Operations (Unaudited)
Results of operations on a quarterly basis were as follows:
Year Ended December 31, 2003
Fourth Third Second FirstQuarter Quarter Quarter(1) Quarter(1)
(dollars in millions, except per shareamounts)
Interest income . . . . . . . . . . . . . . . . . . . . . . . . . . . . . . . . . . . $2,799 $2,998 $3,138 $3,228Interest expense . . . . . . . . . . . . . . . . . . . . . . . . . . . . . . . . . . . 1,056 1,089 1,152 1,235
Net interest income . . . . . . . . . . . . . . . . . . . . . . . . . . . . . . . . 1,743 1,909 1,986 1,993Provision (reversal of reserve) for loan and lease losses . . . . . . . (202) 76 81 88Noninterest income . . . . . . . . . . . . . . . . . . . . . . . . . . . . . . . . . 1,465 1,564 1,526 1,295Noninterest expense . . . . . . . . . . . . . . . . . . . . . . . . . . . . . . . . 2,101 1,810 1,850 1,647
Income from continuing operations before income taxes . . . . . . 1,309 1,587 1,581 1,553Income taxes . . . . . . . . . . . . . . . . . . . . . . . . . . . . . . . . . . . . . 488 588 586 575
Income from continuing operations . . . . . . . . . . . . . . . . . . . . . 821 999 995 978Income from discontinued operations, net of taxes . . . . . . . . . . 21 24 22 19
Net income . . . . . . . . . . . . . . . . . . . . . . . . . . . . . . . . . . . . . . $ 842 $1,023 $1,017 $ 997
Net income attributable to common stock . . . . . . . . . . . . . . . . $ 842 $1,023 $1,017 $ 997
Basic earnings per common share:Income from continuing operations . . . . . . . . . . . . . . . . . . . $ 0.93 $ 1.11 $ 1.09 $ 1.06Net income . . . . . . . . . . . . . . . . . . . . . . . . . . . . . . . . . . . . . 0.95 1.14 1.12 1.08
Diluted earnings per common share:Income from continuing operations . . . . . . . . . . . . . . . . . . . 0.91 1.09 1.07 1.05Net income . . . . . . . . . . . . . . . . . . . . . . . . . . . . . . . . . . . . . 0.93 1.11 1.09 1.07
Common stock price per share:High . . . . . . . . . . . . . . . . . . . . . . . . . . . . . . . . . . . . . . . . . . 46.55 42.75 43.90 36.60Low . . . . . . . . . . . . . . . . . . . . . . . . . . . . . . . . . . . . . . . . . . 38.57 36.92 35.68 32.98
Dividends declared per common share . . . . . . . . . . . . . . . . . . . 0.41 0.40 0.30 0.29
(1) Amounts restated for reasons described in Note 2 to the Consolidated Financial Statements—‘‘Restatements of FinancialStatements.’’ Previously reported net income for each quarter restated was $1,003 million for the first quarter and $1,020 millionfor the second quarter.
151

WASHINGTON MUTUAL, INC. AND SUBSIDIARIES
SUPPLEMENTARY DATA
Year Ended December 31, 2002
Fourth Third Second FirstQuarter(1) Quarter(1)(2) Quarter(1)(2) Quarter(1)(2)
(dollars in millions, except per share amounts)
Interest income . . . . . . . . . . . . . . . . . . . . . . . . . . . . . . $3,281 $3,327 $3,496 $3,750Interest expense . . . . . . . . . . . . . . . . . . . . . . . . . . . . . 1,400 1,448 1,439 1,439
Net interest income . . . . . . . . . . . . . . . . . . . . . . . . . . . 1,881 1,879 2,057 2,311Provision for loan and lease losses . . . . . . . . . . . . . . . . 67 85 117 135Noninterest income . . . . . . . . . . . . . . . . . . . . . . . . . . . 1,251 1,300 1,137 779Noninterest expense . . . . . . . . . . . . . . . . . . . . . . . . . . 1,603 1,569 1,541 1,473
Income from continuing operations before income taxes 1,462 1,525 1,536 1,482Income taxes . . . . . . . . . . . . . . . . . . . . . . . . . . . . . . . 551 559 563 544
Income from continuing operations . . . . . . . . . . . . . . . 911 966 973 938Income from discontinued operations, net of taxes . . . . 30 13 15 14
Net income . . . . . . . . . . . . . . . . . . . . . . . . . . . . . . . . $ 941 $ 979 $ 988 $ 952
Net income attributable to common stock . . . . . . . . . . $ 941 $ 978 $ 986 $ 950
Basic earnings per common share:Income from continuing operations . . . . . . . . . . . . . . $ 0.99 $ 1.02 $ 1.02 $ 0.99Net income . . . . . . . . . . . . . . . . . . . . . . . . . . . . . . . 1.02 1.03 1.03 1.00
Diluted earnings per common share:Income from continuing operations . . . . . . . . . . . . . . 0.97 1.00 1.00 0.97Net income . . . . . . . . . . . . . . . . . . . . . . . . . . . . . . . 1.00 1.02 1.01 0.99
Common stock price per share:High . . . . . . . . . . . . . . . . . . . . . . . . . . . . . . . . . . . . 36.65 38.50 39.45 35.39Low . . . . . . . . . . . . . . . . . . . . . . . . . . . . . . . . . . . . 28.41 30.98 33.00 31.60
Dividends declared per common share . . . . . . . . . . . . . 0.28 0.27 0.26 0.25
(1) Amounts restated for reasons described in Note 2 to the Consolidated Financial Statements—‘‘Restatements of FinancialStatements.’’ Previously reported net income for each quarter restated was $956 million for the first quarter, $990 million for thesecond quarter, $981 million for the third quarter and $969 million for the fourth quarter.
(2) Restated to reflect the adoption of Statement No. 147 as of October 1, 2002, thereby decreasing noninterest expense by$9 million for first quarter, second quarter, and third quarter of 2002.
152

WASHINGTON MUTUAL, INC.INDEX OF EXHIBITS
DESCRIPTION
EXHIBITNUMBER DESCRIPTION
3.1 Restated Articles of Incorporation of the Company, as amended. (Incorporated byreference to the Company’s Quarterly Report on Form 10-Q for the quarter endedSeptember 30, 1999. File No. 0-25188.)
3.2† Articles of Amendment to the Amended and Restated Articles of Incorporation ofWashington Mutual, Inc. creating a class of preferred stock, Series RP.
3.3 Restated Bylaws of the Company. (Incorporated by reference to the Company’s QuarterlyReport on Form 10-Q for the quarter ended September 30, 2003. File No. 1-14667.)
4.1 Rights Agreement dated December 20, 2000 between Washington Mutual, Inc. andMellon Investor Services, LLC. (Incorporated by reference to the Company’s CurrentReport on Form 8-K filed January 8, 2001. File No. 0-25188.)
4.2 The registrant will furnish upon request copies of all instruments defining the rights ofholders of long-term debt instruments of registrant and its consolidated subsidiaries.
4.3 Warrant Agreement dated as of April 30, 2001. (Incorporated by reference to theCompany’s Registration Statement on Form S-3. File No. 333-63976.)
4.4 2003 Amended and Restated Warrant Agreement, dated March 11, 2003 by and betweenWashington Mutual, Inc. and Mellon Investor Services LLC. (Incorporated by referenceto the Company’s Current Report on Form 8-K, dated March 12, 2003. File No. 1-14667.)
10.1* Lease Agreement between Third and University Limited Partnership and WashingtonMutual Savings Bank, dated September 1, 1988.
10.2††† Three-Year Credit Agreement dated as of August 12, 2002 between WashingtonMutual, Inc. and Washington Mutual Finance Corporation, as borrowers, the lendersparty thereto, and JPMorgan Chase Bank, as administrative agent.
10.2.1 Amendment No. 1 dated as of December 17, 2003 to Three-Year Credit Agreementbetween Washington Mutual, Inc. and Washington Mutual Finance Corporation, asborrowers, the lenders party thereto, and JPMorgan Chase Bank, as administrative agent(filed herewith).
Management Contracts and Compensatory Plans and Arrangements (Exhibits 10.3-10.44.3)
10.3 Washington Mutual, Inc. 2003 Equity Incentive Plan (filed herewith).
10.3.1 Amendment No. 1 to the Washington Mutual, Inc. 2003 Equity Incentive Plan (filedherewith).
10.4† Washington Mutual 1994 Stock Option Plan as Amended and Restated as of February 15,2000.
10.4.1† First Amendment to the Washington Mutual 1994 Stock Option Plan Amended andRestated as of February 15, 2000.
10.4.2†† Second Amendment to the Washington Mutual 1994 Stock Option Plan Amended andRestated as of February 15, 2000.
E-1

EXHIBITNUMBER DESCRIPTION
10.5†† Washington Mutual Equity Incentive Plan (formerly known as Washington MutualRestricted Stock Plan) as Amended and Restated as of January 16, 2001.
10.6 Amended and Restated 2002 Employee Stock Purchase Plan (filed herewith).
10.6.1 Amendment No. 1 to the Amended and Restated 2002 Employee Stock Purchase Plan(filed herewith).
10.6.2 Amendment No. 2 to the Amended and Restated 2002 Employee Stock Purchase Plan(filed herewith).
10.7 WaMu Savings Plan, formerly known as Washington Mutual, Inc. Retirement Savings andInvestment Plan amended and Restated Effective October 1, 1998. (Incorporated byreference to the Company’s Current Report on Form 8-K dated December 22, 1998. FileNo. 0-25188.)
10.7.1† Amendment to the WaMu Savings Plan, formerly known as Washington Mutual, Inc.Retirement Savings and Investment Plan Amended and Restated Effective October 1,1998.
10.7.2† Amendment to the WaMu Savings Plan, formerly known as Washington Mutual, Inc.Retirement Savings and Investment Plan Amended and Restated Effective October 1,1998.
10.7.3† Amendment to the WaMu Savings Plan, formerly known as Washington Mutual, Inc.Retirement Savings and Investment Plan Amended and Restated Effective October 1,1998.
10.7.4† Amendment to the WaMu Savings Plan, formerly known as Washington Mutual, Inc.Retirement Savings and Investment Plan Amended and Restated Effective October 1,1998.
10.7.5†† Amendment to the WaMu Savings Plan, formerly known as Washington Mutual, Inc.Retirement Savings and Investment Plan Amended and Restated Effective October 1,1998.
10.7.6††† Amendment to the WaMu Savings Plan, formerly known as Washington Mutual, Inc.Retirement Savings and Investment Plan Amended and Restated Effective October 1,1998.
10.7.7††† Amendment to the WaMu Savings Plan, formerly known as Washington Mutual, Inc.Retirement Savings and Investment Plan Amended and Restated Effective October 1,1998.
10.7.8 Amendment No. 6 to the WaMu Savings Plan, formerly known as WashingtonMutual, Inc. Retirement Savings and Investment Plan Amended and Restated EffectiveOctober 1, 1998 (filed herewith).
10.7.9 Amendment No. 9 to the WaMu Savings Plan, formerly known as WashingtonMutual, Inc. Retirement Savings and Investment Plan Amended and Restated EffectiveOctober 1, 1998 (filed herewith).
10.8* Washington Mutual Employee Service Award Plan.
10.9** Supplemental Employee’s Retirement Plan for Salaried Employees of Washington Mutual.
10.10** Washington Mutual Supplemental Executive Retirement Accumulation Plan.
E-2

EXHIBITNUMBER DESCRIPTION
10.11††† Washington Mutual Deferred Compensation Plan for Directors and Certain HighlyCompensated Employees as Amended and Restated Effective November 1, 2002.
10.11.1 Amendment No. 1 to the Washington Mutual, Inc. Deferred Compensation Plan forDirectors and Certain Highly Compensated Employees as Amended and RestatedEffective November 1, 2002 (filed herewith).
10.12 Washington Mutual Leadership Bonus Program (filed herewith).
10.13*** Employment Agreement of Kerry K. Killinger.
10.14*** Employment Agreement for Executive Officers.
10.15 Form of Employment Agreement for Senior Vice Presidents. (Incorporated by referenceto the Washington Mutual, Inc. Annual Report on Form 10-K for the year endedDecember 31, 1998. File No. 0-25188.)
10.16 The 1988 Stock Option and Incentive Plan (as amended effective July 26, 1994).(Incorporated by reference to the Quarterly Report of Great Western FinancialCorporation (‘‘Great Western’’), on Form 10-Q for the quarter ended September 30,1994. File No. 001-04075.)
10.16.1 Amendment No. 1996-1 to the Great Western Financial Corporation 1988 Stock Optionand Incentive Plan, effective December 10, 1996. (Incorporated by reference to GreatWestern’s Annual Report on Form 10-K for the year ended December 31, 1996. FileNo. 001-04075.)
10.16.2 Form of Director Stock Option Agreement. (Incorporated by reference to GreatWestern’s Registration Statement on Form S-8 Registration No. 33-21469 pertaining toGreat Western’s 1988 Stock Option and Incentive Plan.)
10.16.3 Form of Director Stock Option Agreement effective January 3, 1994. (Incorporated byreference to Great Western’s Annual Report on Form 10-K for the year endedDecember 31, 1993. File No. 001-04075.)
10.17 Great Western Financial Corporation Directors’ Deferred Compensation Plan (1992Restatement). (Incorporated by reference to Great Western’s Annual Report onForm 10-K for the year ended December 31, 1991. File No. 001-04075.)
10.17.1 Amendment to Great Western Financial Corporation Directors’ Senior Officers’ and basicDeferred Compensation Plans (1992 Restatement). (Incorporated by reference to GreatWestern’s Annual Report on Form 10-K for the year ended December 31, 1994. FileNo. 001-04075.)
10.17.2 Amendment No. 2 to Directors’ Deferred Compensation Plan (1992 Restatement).(Incorporated by reference to Great Western’s Quarterly Report on Form 10-Q for thequarter ended March 31, 1996. File No. 001-04075.)
10.17.3 Amendment No. 1996-2 to Directors’ Deferred Compensation Plan, dated December 10,1996. (Incorporated by reference to Great Western’s Annual Report on Form 10-K forthe year ended December 31, 1996. File No. 001-04075.)
10.18 Restated Retirement Plan for Directors. (Incorporated by reference to Great Western’sQuarterly Report on Form 10-Q for the quarter ended June 30, 1993. FileNo. 001-04075.)
E-3

EXHIBITNUMBER DESCRIPTION
10.19 Employee Home Loan Program. (Incorporated by reference to Great Western’s QuarterlyReport on Form 10-Q for the quarter ended June 30, 1993. File No. 001-04075.)
10.19.1 Amendment No. 1996-1 to Employee Home Loan Program, effective December 10, 1996.(Incorporated by reference to Great Western’s Annual Report on Form 10-K for the yearended December 31, 1996. File No. 001-04075.)
10.20 Omnibus Amendment 1997-1 amending the definition of change in control in the GreatWestern Financial Corporation 1988 Stock Option and Incentive Plan, as amendedDecember 10, 1996, the Great Western Financial Corporation Directors’ DeferredCompensation Plan (1992 Restatement), as amended December 10, 1996, and theEmployee Home Loan Program (revised and restated as of April 27, 1993), as amendedDecember 10, 1996. (Incorporated by reference to Great Western’s Annual Report onForm 10-K for the year ended December 31, 1996. File No. 001-04075.)
10.21 H.F. Ahmanson & Company 1993 Stock Incentive Plan as amended. (Incorporated byreference to Ahmanson’s Annual Report on Form 10-K for the year ended December 31,1996. File No. 1-08930.)
10.22 H.F. Ahmanson & Company 1996 Nonemployee Directors’ Stock Incentive Plan.(Incorporated by reference to Ahmanson’s Annual Report on Form 10-K for the yearended December 31, 1995. File No. 1-08930.)
10.23 Executive Life Insurance Plan of H.F. Ahmanson & Company. (Incorporated by referenceto Ahmanson’s Annual Report on Form 10-K for the year ended December 31, 1989. FileNo. 1-08930.)
10.23.1 First Amendment to Executive Life Insurance Plan of H.F. Ahmanson & Company.(Incorporated by reference to Ahmanson’s Annual Report on Form 10-K for the yearended December 31, 1995. File No. 1-08930.)
10.23.2 Second Amendment to Executive Life Insurance Plan of H.F. Ahmanson & Company.(Incorporated by reference to Ahmanson’s Annual Report on Form 10-K for the yearended December 31, 1996. File No. 1-08930.)
10.24 Senior Executive Life Insurance Plan of H.F. Ahmanson & Company, as amended andrestated. (Incorporated by reference to Ahmanson’s Annual Report on Form 10-K for theyear ended December 31, 1995. File No. 1-08930.)
10.25 H.F. Ahmanson & Company Supplemental Long Term Disability Plan. (Incorporated byreference to Ahmanson’s Annual Report on Form 10-K for the year ended December 31,1989. File No. 1-08930.)
10.26 Outside Directors’ Elective Deferred Compensation Plan of H.F. Ahmanson & Company.(Incorporated by reference to Ahmanson’s Quarterly Report on Form 10-Q for thequarter ended June 30, 1991. File No. 1-08930.)
10.26.1 First Amendment to Outside Directors’ Elective Deferred Compensation Plan of H.F.Ahmanson & Company. (Incorporated by reference to Ahmanson’s Annual Report onForm 10-K for the year ended December 31, 1995. File No. 1-08930.)
10.26.2 Second Amendment to Outside Directors’ Elective Deferred Compensation Plan of H.F.Ahmanson & Company. (Incorporated by reference to Ahmanson’s Annual Report onForm 10-K for the year ended December 31, 1996. File No. 1-08930.)
E-4

EXHIBITNUMBER DESCRIPTION
10.27 Outside Directors’ Capital Accumulation Plan of H.F. Ahmanson & Company.(Incorporated by reference to Ahmanson’s Annual Report on Form 10-K for the yearended December 31, 1996. File No. 1-08930.)
10.27.1 First Amendment to Outside Directors’ Capital Accumulation Plan of H.F. Ahmanson &Company. (Incorporated by reference to Ahmanson’s Annual Report on Form 10-K forthe year ended December 31, 1996. File No. 1-08930.)
10.28 Outside Director Retirement Plan of H.F. Ahmanson & Company, as amended andrestated. (Incorporated by reference to Ahmanson’s Quarterly Report on Form 10-Q forthe quarter ended June 30, 1991. File No. 1-08930.)
10.28.1 First Amendment to Outside Director Retirement Plan of H.F. Ahmanson & Company.(Incorporated by reference to Ahmanson’s Annual Report on Form 10-K for the yearended December 31, 1995. File No. 1-08930.)
10.29 Amended Form of Indemnity Agreement between H.F. Ahmanson & Company anddirectors and executive officers. (Incorporated by reference to Ahmanson’s AnnualReport on Form 10-K for the year ended December 31, 1989. File No. 1-08930.)
10.30 Board of Directors Retirement Plan of Coast. (Incorporated by reference to the CurrentReport of Coast Savings Financial Inc. (‘‘Coast’’) on Form 8-K dated September 1, 1989.File No. 1-10264.)
10.31 Form of Post-Retirement Compensation Arrangement of Coast. (Incorporated byreference to Coast’s Annual Report on Form 10-K for the year ended December 31, 1989.File No. 1-10264.)
10.32 Amended and Restated Executive Supplemental Retirement Plan of Coast, datedFebruary 28, 1996. (Incorporated by reference to Coast’s Annual Report on Form 10-Kfor the year ended December 31, 1995. File No. 1-10264.)
10.33 Long Beach Financial Corporation 1997 Stock Incentive Plan. (Incorporated by referenceto the Long Beach Financial Corporation’s Registration Statement on Form S-1. FileNo. 333-22013.)
10.34 Bank United Corp. (‘‘Bank United’’) 1996 Stock Incentive Plan. (Incorporated byreference to Bank United’s Registration Statement on Form S-1 dated July 25, 1996. FileNo. 333-06229.)
10.35†† Bank United 1999 Stock Incentive Plan.
10.36†† Bank United 2000 Stock Incentive Plan.
10.37 Bank United Director Stock Plan. (Incorporated by reference to Bank United’sRegistration Statement on Form S-1 dated July 25, 1996. File No. 333-06229.)
10.37.1 Bank United Director Stock Plan, Amended and Restated as of March 16, 2000.(Incorporated by reference to Bank United’s Quarterly Report on Form 10-Q for thequarter ended June 30, 2000. File No. 0-21017.)
10.38 Deferred Compensation Plan for Board Members of DSB (the ‘‘DSB Director DeferredCompensation Plan’’), as amended and restated effective as of July 24, 1997(Incorporated by reference to Dime’s 1997 10-K), as amended by an Amendment to theDSB Director Deferred Compensation Plan, effective May 18, 2000. (Incorporated byreference to the 14d-9 Amendment No. 11.)
E-5

EXHIBITNUMBER DESCRIPTION
10.39 Retainer Continuation Plan for Independent Directors of DSB (the ‘‘RetainerContinuation Plan’’) (Incorporated by reference to DSB’s Annual Report on Form 10-Kfor the fiscal year ended December 31, 1993, filed on September 16, 1994 as Exhibit A toDime’s Report on Form 8-K dated that date. File No. 001- 13094), as amended by (i) anAmendment, effective as of January 13, 1995, to the Retainer Continuation Plan(Incorporated by reference to Dime’s Annual Report on Form 10-K for the fiscal yearended December 31, 1995. File No. 001-13094), (ii) an Amendment, effective as ofDecember 31, 1996, to the Retainer Continuation Plan. (Incorporated by reference toDime’s 1996 10-K), (iii) an Amendment, effective March 1, 1997, to the RetainerContinuation Plan (Incorporated by reference to Dime’s 1996 10-K), (iv) an Amendment,effective July 24, 1997, to the Retainer Continuation Plan (Incorporated by reference toDime’s 1997 10-K), and (v) an Amendment to the Retainer Continuation Plan, effectiveMay 18, 2000. (Incorporated by reference to the 14d-9 Amendment No. 11)
10.40 Dime Voluntary Deferred Compensation Plan for Directors (the ‘‘Bancorp DirectorDeferred Compensation Plan’’), as amended and restated effective as of July 24, 1997(Incorporated by reference to Dime’s 1997 10-K), as amended by (i) an Amendment,effective March 26, 1998, to the Bancorp Director Deferred Compensation Plan(Incorporated by reference to Dime’s 1998 10-K), (ii) an Amendment, effectiveOctober 1, 1999, to the Bancorp Director Deferred Compensation Plan (Incorporated byreference to Dime’s 1999 10-K), and (iii) an Amendment to the Bancorp DirectorDeferred Compensation Plan, effective May 18, 2000. (Incorporated by reference to the14d-9 Amendment No. 11.)
10.41 Dime 1997 Stock Incentive Plan for Outside Directors, as amended and restated effectiveMarch 27, 1998 (the ‘‘1997 Outside Director Plan’’). (Incorporated by reference to Dime’s1998 10-K.)
10.41.1 Amendment to the Dime 1997 Outside Director Plan, effective December 12, 2000.(Incorporated by reference to Dime’s Annual Report on Form 10-K for the year endedDecember 31, 2000. File No. 1-13094.)
10.42††† Washington Mutual, Inc. WAMU Shares program.
10.43††† January 1999 WAMU Shares program.
10.43.1 Amendments to the January 1999 WAMU Shares Plan (See Exhibit 10.44.3).
10.44††† February 2001 WAMU Shares Plan.
10.44.1 Amendment No. 1 to February 2001 WAMU Shares Plan (filed herewith).
10.44.2 Amendment No. 3 to February 2001 WAMU Shares Plan (filed herewith).
10.44.3 Amendments to the January 1999 WAMU Shares Plan and the February 2001 WAMUShares Plan (collectively, the ‘‘Plans’’) (filed herewith).
12.1 Computation of Ratios of Earnings to Fixed Charges (filed herewith).
12.2 Computation of Ratios of Earnings to Fixed Charges and Preferred Dividends (filedherewith).
21 List of Subsidiaries of the Registrant (filed herewith).
23 Consent of Deloitte & Touche LLP (filed herewith).
E-6

EXHIBITNUMBER DESCRIPTION
31.1 Certification of the Chief Executive Officer pursuant to Section 302 of the Sarbanes-Oxley Act of 2002 (filed herewith).
31.2 Certification of the Chief Financial Officer pursuant to Section 302 of the Sarbanes-OxleyAct of 2002 (filed herewith).
32.1 Certification of the Chief Executive Officer pursuant to Section 906 of the Sarbanes-Oxley Act of 2002 (furnished herewith).
32.2 Certification of the Chief Financial Officer pursuant to Section 906 of the Sarbanes-OxleyAct of 2002 (furnished herewith).
* Incorporated by reference to the Company’s Current Report on Form 8-K dated November 29, 1994.File No. 0-25188.
** Incorporated by reference to the Company’s Annual Report on Form 10-K for the year endedDecember 31, 1996. File No. 0-25188.
*** Incorporated by reference to the Company’s Annual Report on Form 10-K for the year endedDecember 31, 1997. File No. 0-25188.
† Incorporated by reference to the Company’s Annual Report on Form 10-K for the year endedDecember 31, 2000. File No. 1-14667.
†† Incorporated by reference to the Company’s Annual Report on Form 10-K for the year endedDecember 31, 2001. File No. 1-14667.
††† Incorporated by reference to the Company’s Annual Report on Form 10-K for the year endedDecember 31, 2002. File No. 1-14667.
Exhibits followed by a parenthetical reference are incorporated by reference herein from thedocuments described therein. Documents relating to Ahmanson filed prior to May 1985 were filed byH.F. Ahmanson & Company, a California corporation, File No. 1-7108.
E-7

EXHIBIT 31.1
CERTIFICATION
I, Kerry K. Killinger, certify that:
1. I have reviewed this annual report on Form 10-K/A of Washington Mutual, Inc.;
2. Based on my knowledge, this annual report does not contain any untrue statement of a material factor omit to state a material fact necessary to make the statements made, in light of the circumstancesunder which such statements were made, not misleading with respect to the period covered by thisannual report;
3. Based on my knowledge, the financial statements, and other financial information included in thisannual report, fairly present in all material respects the financial condition, results of operations andcash flows of the registrant as of, and for, the periods presented in this annual report;
4. The registrant’s other certifying officers and I are responsible for establishing and maintainingdisclosure controls and procedures (as defined in Exchange Act Rules 13a-15(e) and 15d-15(e)) forthe registrant and have:
(a) Designed such disclosure controls and procedures, or caused such disclosure controls andprocedures to be designed under our supervision, to ensure that material information relating tothe registrant, including its consolidated subsidiaries, is made known to us by others within thoseentities, particularly during the period in which this annual report is being prepared;
(b) Evaluated the effectiveness of the registrant’s disclosure controls and procedures and presentedin this annual report our conclusions about the effectiveness of the disclosure controls andprocedures, as of the end of the period covered by this annual report based on such evaluation;and
(c) Disclosed in this annual report any change in the registrant’s internal control over financialreporting that occurred during the registrant’s most recent fiscal quarter (the registrant’s fourthfiscal quarter in the case of an annual report) that has materially affected, or is reasonably likelyto materially affect, the registrant’s internal control over financial reporting; and
5. The registrant’s other certifying officers and I have disclosed, based on our most recent evaluation ofinternal control over financial reporting, to the registrant’s auditors and the audit committee of theregistrant’s board of directors (or persons performing the equivalent functions):
(a) All significant deficiencies and material weaknesses in the design or operation of internal controlover financial reporting which are reasonably likely to adversely affect the registrant’s ability torecord, process, summarize and report financial information; and
(b) Any fraud, whether or not material, that involves management or other employees who have asignificant role in the registrant’s internal control over financial reporting.
Date: March 19, 2004 /s/ KERRY K. KILLINGER
Kerry K. KillingerChairman, President and Chief Executive Officer ofWashington Mutual, Inc.

EXHIBIT 31.2
CERTIFICATION
I, Thomas W. Casey, certify that:
1. I have reviewed this annual report on Form 10-K/A of Washington Mutual, Inc.;
2. Based on my knowledge, this annual report does not contain any untrue statement of a material factor omit to state a material fact necessary to make the statements made, in light of the circumstancesunder which such statements were made, not misleading with respect to the period covered by thisannual report;
3. Based on my knowledge, the financial statements, and other financial information included in thisannual report, fairly present in all material respects the financial condition, results of operations andcash flows of the registrant as of, and for, the periods presented in this annual report;
4. The registrant’s other certifying officers and I are responsible for establishing and maintainingdisclosure controls and procedures (as defined in Exchange Act Rules 13a-15(e) and 15d-15(e)) forthe registrant and have:
(a) Designed such disclosure controls and procedures, or caused such disclosure controls andprocedures to be designed under our supervision, to ensure that material information relating tothe registrant, including its consolidated subsidiaries, is made known to us by others within thoseentities, particularly during the period in which this annual report is being prepared;
(b) Evaluated the effectiveness of the registrant’s disclosure controls and procedures and presentedin this annual report our conclusions about the effectiveness of the disclosure controls andprocedures, as of the end of the period covered by this annual report based on such evaluation;and
(c) Disclosed in this annual report any change in the registrant’s internal control over financialreporting that occurred during the registrant’s most recent fiscal quarter (the registrant’s fourthfiscal quarter in the case of an annual report) that has materially affected, or is reasonably likelyto materially affect, the registrant’s internal control over financial reporting; and
5. The registrant’s other certifying officers and I have disclosed, based on our most recent evaluation ofinternal control over financial reporting, to the registrant’s auditors and the audit committee of theregistrant’s board of directors (or persons performing the equivalent functions):
(a) All significant deficiencies and material weaknesses in the design or operation of internal controlover financial reporting which are reasonably likely to adversely affect the registrant’s ability torecord, process, summarize and report financial information; and
(b) Any fraud, whether or not material, that involves management or other employees who have asignificant role in the registrant’s internal control over financial reporting.
Date: March 19, 2004 /s/ THOMAS W. CASEY
Thomas W. CaseyExecutive Vice President and Chief Financial Officer ofWashington Mutual, Inc.

EXHIBIT 32.1
WASHINGTON MUTUAL, INC.Certification of the Chief Executive Officer
Pursuant to 18 U.S.C. Section 1350, as adopted pursuant to Section 906 of the Sarbanes-Oxley Act of2002, Kerry K. Killinger, the Chief Executive Officer of Washington Mutual, Inc., does hereby certify thatthis report on Form 10-K/A fully complies with the requirements of Section 13(a) or 15(d) of the SecuritiesExchange Act of 1934 and that the information contained in this report fairly presents, in all materialrespects, the financial condition and results of operations of Washington Mutual, Inc.
Date: March 19, 2004 By: /s/ KERRY K. KILLINGER
Kerry K. KillingerChairman, President and Chief Executive Officer ofWashington Mutual, Inc.
A signed original of this written statement required by Section 906 has been provided to WashingtonMutual, Inc. and will be retained by Washington Mutual, Inc. and furnished to the Securities and ExchangeCommission or its staff upon request.

EXHIBIT 32.2
WASHINGTON MUTUAL, INC.Certification of the Chief Financial Officer
Pursuant to 18 U.S.C. Section 1350, as adopted pursuant to Section 906 of the Sarbanes-Oxley Act of2002, Thomas W. Casey, the Chief Financial Officer of Washington Mutual, Inc., does hereby certify thatthis report on Form 10-K/A fully complies with the requirements of Section 13(a) or 15(d) of the SecuritiesExchange Act of 1934 and that the information contained in this report fairly presents, in all materialrespects, the financial condition and results of operations of Washington Mutual, Inc.
Date: March 19, 2004 By: /s/ THOMAS W. CASEY
Thomas W. CaseyExecutive Vice President and Chief Financial Officer ofWashington Mutual, Inc.
A signed original of this written statement required by Section 906 has been provided to WashingtonMutual, Inc. and will be retained by Washington Mutual, Inc. and furnished to the Securities and ExchangeCommission or its staff upon request.