ANNUAL REPORT 'Kindle the light within to reach out' - St ...
Upload
khangminh22Category
view
0download
0
WAPATO REACH ASSESSMENT REPORT
P R E P A R E D F O R :
Yakama Nation Wildlife Resource Management P.O. Box 151 Toppenish, WA 98948 Contact: Tom Elliott, Riparian Ecologist 509.865.5121 ext. 6322
P R E P A R E D B Y :
ICF International 710 Second Avenue, Suite 550 Seattle, WA 98104 Contact: Torrey Luiting Project Manager 206.801.2824
In association with R2 Consultants 15250 NE 95th Street Redmond, WA 98052
Additional project support provided by Bruce Watson Consulting and Central Washington University
Final April 26, 2012

ICF International, in association with R2 Consultants. 2012. Wapato Reach Assessment Report. April 26. (ICF 00703.11.) Seattle, WA. Prepared for Yakama Nation, Toppenish, WA.

Wapato Reach Assessment ReportES‐1
April 2012ICF 00703.11
Executive Summary
The purpose of this Wapato Reach Assessment Report is to identify and prioritize river restoration opportunities in the Wapato Reach of the Yakima River, with an emphasis on habitat improvements for culturally important and ESA listed salmonid species. Results are reported in terms of a suite of recommended habitat protection, process‐based restoration, and habitat enhancement projects, following the hierarchical framework for process‐based restoration articulated by Roni et al. (2002). The conceptual framework, geomorphic and biological analysis, and resultant prioritized projects described herein have been designed to assist the Yakama Nation and the Technical Advisory Group (TAG) in pursuing immediate restoration and management goals, as well as to provide a foundation for long‐term restoration planning.
The Wapato Reach Assessment project progressed in two phases: In phase I, the Yakama Nation and its contractor compiled readily available data concerning key species, habitat condition, and river function in the reach. Phase 2 of the project (this report) entailed a synthesis of the compiled data and development of a conceptual framework describing the physical and biological functioning of the reach, particularly as it relates to target salmonid species and the potential for restorative actions and projects to benefit those species. Development of the conceptual framework included a fluvial geomorphic analysis provided by R2 Resource Consultants that describes the key watershed and reach‐scale physical processes that appear to be affecting physical and biological conditions in the reach. The output of the geomorphic analysis was integrated with a biological model (i.e., Ecosystem Diagnosis and Treatment [EDT]) of salmonid use of the reach and assessment of limiting factors specific to the Wapato Reach. The use of EDT enabled the Wapato Reach Assessment to focus on the specific salmonid species, races, and life‐history types that utilize the reach.
Integration of EDT with the geomorphic attributes of specific analysis segments along the reach ensures that the restoration objectives and recommended projects are compatible and consistent with the natural riverine processes shaping the reach and that they have specific biological benefits to the species, races, and life history stages using the reach. In addition, faculty at Central Washington University (CWU) also provided an analysis of potential riparian revegetation locations based on the geomorphic and spatial data developed by ICF International (ICF) and R2 and on their expertise and familiarity with the Wapato Reach.
The geomorphic assessment evaluated the vertical and planform stability of the channel, defined geomorphically significant sub‐reaches, and analyzed side channel and floodplain connectivity. Vertical (aggrading/degrading segments) and planform variability over time are concentrated in the sub‐reaches up stream of Zillah. Side channels and floodplain through the reach have been disconnected by levees and revetments. The geomorphic assessment also concluded that the alluvial channel subreaches approximately between Sunnyside Dam and Zillah have a slope, bankfull discharge, and substrate size empirically related to meandering, single channel types, rather than the braided/wandering channel planform currently observed. The current braided/wandering planform may be due to a pre flow regulation bank full discharge that was sufficiently large to maintain this braided/wandering channel planform, and/or to an effect of reduced spring and summer water levels such that riparian vegetation was lost causing the channel to transition to a braided/wandering planform. The geomorphic attributes of each analysis segment in the reach was used to guide the selection of appropriate restoration objectives and specific projects.

Yakama Nation Executive Summary
Wapato Reach Assessment ReportES‐2
April 2012ICF 00703.11
The biological assessment concluded that the key environmental attributes affecting salmon and steelhead survival in the reach were habitat quantity (affecting spring Chinook), habitat diversity (affecting summer steelhead), fine sediment/turbidity (affecting fall Chinook), and predation (affecting coho). These attributes are particularly affecting survival of juveniles and smolts in the reach. Low summer stream flow and increased water temperature was also a factor affecting summer Chinook migration, contributing to summer Chinook leaving the reach by June.
The biological analysis of avian and pikeminnow predation concluded that avian predators can be a substantial source of mortality in the reach, and that predation losses may be reduced by providing deeper habitats features, more of such features, and more in‐channel structure to allow juvenile salmonids to avoid predators. Reduction in pikeminnow predation may be most effectively accomplished through direct predator control programs, or modification of juvenile bypass facilities at Sunnyside and Wapato dams.
These conclusions were then used to formulate the following suite of specific protection, process‐based restoration, and habitat enhancement objectives consistent with increasing habitat quantity and diversity and reducing fine sediment/turbidity:
Protection Objectives
1. Protect parcels with moderate to high habitat value and potentially at risk for conversion, development or loss of function.
Processbased Restoration Objectives
2. Encourage the development of a meandering or mildly wandering planform by converting broad gravel bars to vegetated channel islands from Sunnyside Dam to Zillah.
3. Establish or promote engagement of side channels across a wide range of flows.
4. Establish or promote the engagement of floodplain channels across a wide range of flows.
5. Remove rip rap or bank hardening.
Habitat Enhancement Objectives
6. Install instream wood.
7. Conduct riparian revegetation.
None of these objectives are inconsistent or mutually exclusive with Yakama Nation and TAG goals for increasing flows in the reach.
The geomorphic attributes of each analysis segment of the reach were then used to identify a suite of potential locations appropriate for constructing specific projects that would meet these objectives. Potential project locations were further screened based on their relative biological benefits in the context of the specific degree and nature of salmonid use of each particular area, and based on their correspondence and synergy with CWU recommended areas for riparian revegetation. Project locations and concepts previously developed by the Yakama Nation and TAG based on their knowledge and history of working in the Wapato Reach were also integrated into the screening process.
Based on this screening process, seven of the ten high opportunity areas identified for process‐based restoration projects were then field verified (site conditions and private property access limitations prevented visiting all ten sites). Almost all of the seven sites visited had site conditions,

Yakama Nation Executive Summary
Wapato Reach Assessment ReportES‐3
April 2012ICF 00703.11
including construction access, conducive to meeting the restoration objectives identified for the site. One potential side channel restoration site was dropped from further consideration as a result of the field verification because it was already functioning well.
Based on the progressive process of geomorphic analysis, EDT analysis, additional screening, and field verification, a suite of recommended projects in each of the Roni et al. (2002) categories (protection, process‐based restoration, and habitat enhancement) were formulated. These recommended projects each address a specific restoration objective, are geomorphically appropriate for their location in the reach, and are expected to benefit the species and life‐history stages of the salmonids that use the Wapato Reach.
A total of 10 protection projects on Yakama Nation land, 10 protection projects on private parcels, 10 process‐based habitat restoration projects, and 6 riparian revegetation projects are recommended, complete with the specific anticipated biological benefits for the process‐based restoration projects, as derived from EDT analysis.
Top‐ranked protection projects encompassed large parcels of land that included large areas of riparian forest with numerous existing channels. Top‐ranked process‐based restoration projects fell mainly into three broad categories. One category was based on installing flood fences to convert the currently braided/wandering planform and related low‐flow channels (between approximately Sunnyside Dam and river mile 92) to a single, dominant meandering channel planform with secondary high‐flow channels and related floodplain habitats. Such projects would provide better main channel habitat conditions for juvenile salmonids. Secondary channels engaged at high flows would also promote riparian development and floodplain wetlands which also create habitat diversity and provide floodplain storage, water quality improvement and food web functions that benefit salmonids.
A second category of recommended process‐based restoration projects emphasized directly increasing habitat abundance and quality by installing ballasted woody debris in the relatively simply‐structured channels downstream of Zillah. The third category of process‐based restoration projects entailed breaching levees to re‐connect floodplains and side channels. Top‐ranked habitat enhancement projects were riparian restoration projects centered on geomorphically appropriate areas with reduced or compromised riparian cover.
The ten recommended process‐based restoration projects were then ranked by biological benefit, feasibility, and a suite of other criteria specific to the priorities of Yakama Nation and the TAG, both to guide planning efforts and to illustrate how such a prioritization could be applied to the types of projects identified herein, as well as to additional projects that might be developed over time as understanding of the reach deepens and refinement of the conceptual model occurs. A clear and transparent set of selection criteria and a methodology for prioritizing and sequencing actions are included as part of the project ranking matrix (Table ES‐1), including application of Roni’s hierarchical prioritization structure (2002) and elements adapted from the Beechie et al. (2008) “logic approach.” Shaded rows indicate the recommended process‐based restoration projects.

Yakama Nation Executive Summary
Wapato Reach Assessment Report ES‐4
April 2012ICF 00703.11
Table ES‐1. Recommended Projects and Related Restoration Objective, Presented in Descending Order by Subreach and River Mile
Stream Reach
River Mile
Restoration Objectives
Process‐Based Restoration
Habitat Enhancement
Encourage Meandering Planform by Establishing
Vegetated Channel Islands
Establish or Promote
Engagement of Side Channels across a Wide Range of Flows
Establish or Promote the Engagement of Floodplain
Channels across a Wide Range of
Flows
Remove Rip Rap or Bank
Hardening
Install Instream Wood
Enhance Riparian
Revegetation
5 105.2–102.9
X
5 105.0–103.0 X
5 102.9–102.2 X
5 102.3–100.7
X
5 102–101 X
5 98.6–98.0 X
4 96.9–96.3 X
4 95.4–95.1 X X
4 94.45–93.0
X
4 93.5 X
3 90.3
X
3 89.7–89.3 X X
3 87.7–85.9
X
3 81.7–80.5
X
3 80.1 X
2 80.5–78.2
X

Yakama Nation Executive Summary
Wapato Reach Assessment ReportES‐5
April 2012ICF 00703.11
This report also includes preliminary cost estimates for the 10 recommended restoration projects based on comparable projects in eastern Washington, as well as recommendations for monitoring and evaluation of the types of projects proposed. It is intended that the conceptual framework outlined in this report can serve as baseline management hypotheses to be tested by the selected restoration projects. Finally, this report describes the potential cumulative biological benefit to salmonids of implementing all ten recommended projects and concluded that the greatest potential benefits would be to fall and summer Chinook productivity and abundance. EDT model results indicate the potential for a 30% to 35% increase in productivity and a nearly 15% to 25% increase in abundance of fall and summer Chinook if all 10 recommended projects were implemented in the Wapato Reach. The currently low productivity of fall Chinook is the primary constraint affecting the population and projects in the Wapato Reach could significantly increase productivity. Summer Chinook are also constrained by low productivity. Wapato Reach projects could strongly support efforts to reintroduce summer Chinook to the basin and to establish a naturally sustainable fall Chinook population. EDT model results indicate the potential cumulative project benefits to the other modeled species are lower and are more complex.
The report concludes with a discussion of additional research and analysis priorities that could help alleviate data gaps and refine uncertainties in the physical and biological models. Prioritizing additional data such as sediment source and transport information could lead to additional project recommendations and/or further refinement of the recommended projects for the Wapato Reach.


Wapato Reach Assessment Reporti
April 2012ICF 00703.11
Contents
List of Tables .......................................................................................................................................... iv
List of Figures ......................................................................................................................................... vi
List of Acronyms and Abbreviations .................................................................................................... viii
Chapter 1 Goals and Scope ................................................................................................................ 1‐1
1.1 Goals ................................................................................................................................ 1‐1
1.2 Scope ................................................................................................................................ 1‐1
Chapter 2 Project Setting—the Middle Yakima River ......................................................................... 2‐1
2.1 Project Area ..................................................................................................................... 2‐1
2.2 Geologic/Geomorphic Setting ......................................................................................... 2‐1
2.3 Focal Salmonid Species .................................................................................................... 2‐2
2.3.1 Spring Chinook ................................................................................................................. 2‐4
2.3.2 Fall Chinook ...................................................................................................................... 2‐5
2.3.3 Summer Chinook .............................................................................................................. 2‐5
2.3.4 Steelhead ......................................................................................................................... 2‐6
2.3.5 Coho ................................................................................................................................. 2‐6
2.3.6 Sockeye ............................................................................................................................ 2‐7
Chapter 3 Conceptual Framework of Reach Function ........................................................................ 3‐1
3.1 Approach to Assessment of Current Conditions .............................................................. 3‐1
3.2 Subreach Definition ......................................................................................................... 3‐3
3.3 Assumptions ..................................................................................................................... 3‐3
3.4 Approach to Assessing Physical Processes ...................................................................... 3‐3
3.4.1 Longitudinal Profiles (Large‐Scale Streamwise Variation) ............................................... 3‐4
3.4.2 Hydrology/Hydraulics/Sediment Transport ..................................................................... 3‐5
3.4.3 Channel and Floodplain ................................................................................................... 3‐9
3.4.4 Approach to Assessing Riparian Conditions .................................................................. 3‐11
3.5 Approach to Salmonid Biological Assessment ............................................................... 3‐11
3.5.1 Patterns of use by Salmonid Species ............................................................................. 3‐12
3.5.2 Known and Predicted Salmonid Abundance and Survival by Species ........................... 3‐12
3.5.3 Evaluation of Conditions Affecting Salmonid Survival (Diagnosis) ................................ 3‐13
3.5.4 Predation Conditions Affecting Salmonid Survival ........................................................ 3‐14
3.5.5 Wapato and Sunnyside Dams Bypass Mortality Conditions Affecting
Salmonid Survival ........................................................................................................................ 3‐15
3.6 Integration of Physical and Biological Assessments ...................................................... 3‐15

Yakama Nation Contents
Wapato Reach Assessment Reportii
April 2012ICF 00703.11
3.7 Factors beyond the Scope of the Reach Assessment .................................................... 3‐16
Chapter 4 Geomorphic and Biological Assessment Results ................................................................ 4‐1
4.1 Results from Geomorphic Assessment ............................................................................ 4‐1
4.1.1 Longitudinal Profiles ........................................................................................................ 4‐1
4.1.2 Sediment Transport Modeling ......................................................................................... 4‐3
4.1.3 Channel Migration Patterns ............................................................................................. 4‐6
4.1.4 Floodplain and Side Channel Connectivity ...................................................................... 4‐9
4.2 Results from Biological Assessment............................................................................... 4‐10
4.2.1 Evaluation of Habitat Conditions Affecting Salmonid Survival ...................................... 4‐10
4.2.2 Evaluation of Predation Conditions Affecting Salmonid Survival .................................. 4‐17
4.2.3 Evaluation of Bypass Mortality Conditions Affecting Salmonid Survival ....................... 4‐19
Chapter 5 Restoration Objectives and Project Locations .................................................................... 5‐1
5.1 Restoration Objectives ..................................................................................................... 5‐1
5.2 Identification of Potential Locations to Meet the Objectives .......................................... 5‐2
5.2.1 Protection Locations ........................................................................................................ 5‐2
5.2.2 Process‐based Habitat Restoration Locations ................................................................. 5‐3
5.2.3 Habitat Enhancement Locations .................................................................................... 5‐12
5.3 Additional Screening and Field Assessment .................................................................. 5‐16
5.3.1 Process‐Based Habitat Restoration Locations ............................................................... 5‐18
5.3.2 Habitat Enhancement Locations .................................................................................... 5‐18
Chapter 6 Recommended Projects and Project Prioritization ............................................................. 6‐1
6.1 Recommended Projects ................................................................................................... 6‐1
6.2 Biological Benefits of the Recommended Process‐Based Restoration Projects .............. 6‐3
6.2.1 Install Channel Roughness Elements at SR5‐RM105.0 .................................................... 6‐4
6.2.2 Channel Reconstruction, Instream Wood, and Channel Roughness Elements
at SR5‐RM102.9 ............................................................................................................................ 6‐5
6.2.3 Channel Roughness Elements at SR5‐RM102 .................................................................. 6‐7
6.2.4 Channel Roughness Elements at SR5‐RM98.6 ................................................................. 6‐9
6.2.5 Levee Removal at SR4‐RM96.9 ...................................................................................... 6‐10
6.2.6 Channel Roughness Elements at SR4‐RM95.4 ............................................................... 6‐11
6.2.7 Channel Roughness Elements at SR4‐RM93.5 ............................................................... 6‐13
6.2.8 Install Instream Wood at SR3‐RM90.3 ........................................................................... 6‐15
6.2.9 Levee Removal at SR3‐RM89.7 ...................................................................................... 6‐16
6.2.10 Levee Removal at SR3‐RM80.1................................................................................ 6‐17
6.3 Development of Biological Benefits Scores for Project Prioritization ........................... 6‐21
6.4 Project Prioritization Framework ................................................................................... 6‐28
6.5 Restoration Project Prioritization .................................................................................. 6‐29

Yakama Nation Contents
Wapato Reach Assessment Reportiii
April 2012ICF 00703.11
6.5.1 Evaluation Criteria and Scoring ...................................................................................... 6‐30
6.5.2 Additional Ranking Criteria (for future consideration) .................................................. 6‐33
6.6 Enhancement Project Prioritization ............................................................................... 6‐35
6.6.1 Installation of Instream Wood ....................................................................................... 6‐35
6.6.2 Riparian Revegetation .................................................................................................... 6‐36
6.7 Cumulative Biological Benefits ...................................................................................... 6‐39
6.7.1 Cumulative Biological Benefits on Population Performance Parameters ..................... 6‐39
6.7.2 Cumulative Benefits to Productivity and Capacity ........................................................ 6‐41
6.7.3 Importance of Cumulative Wapato Reach Project Benefits .......................................... 6‐45
Chapter 7 Restoration Monitoring and Research Priorities ................................................................ 7‐1
7.1 Restoration Monitoring ................................................................................................... 7‐1
7.2 Additional Research and Analysis Priorities ..................................................................... 7‐6
Chapter 8 References ........................................................................................................................ 8‐1
8.1 Printed References ........................................................................................................... 8‐1
8.2 Unpublished Data and Personal Communications .......................................................... 8‐5
Appendix A. Maps
Appendix B. Predation Analysis
Appendix C. Geomorphic Attribute Tables
Appendix D. Salmonid Life‐History Stage Analysis
Appendix E. Project Descriptions

Yakama Nation Contents
Wapato Reach Assessment Reportiv
April 2012ICF 00703.11
Tables
Table 3‐1. Reach Boundaries Used in this Analysis ......................................................................................... 3‐3 Table 3‐2. Predicted Bed Elevation Change Rate and Sign Used to Classify Analysis Segments
According to Sediment Transport and Deposition Characteristics ..................................... 3‐9 Table 3‐3. River Channel Migration Rate Classifications for Assessing Channel Planform
Stability ...................................................................................................................................................... 3‐10 Table 4‐1. Simulation Flows Modeled in HEC‐RAS for the Sediment Transport Analysis .............. 4‐3 Table 4‐2. Representative Channel Planform Patterns Predicted for the Upper Subreaches
for the Wapato Reach by Empirical Relationship ....................................................................... 4‐8 Table 4‐3. Revised Dam Survival Rates for All Salmonid Species Analyzed in the EDT Model
for the Wapato Reach Assessment.................................................................................................. 4‐21 Table 5‐1. Analysis Segments with Geomorphic Attributes Suitable for Reducing Channel
Braiding by Establishing Vegetated Channel Islands ................................................................ 5‐5 Table 5‐2. Analysis Segments with Geomorphic Attributes Suitable for Reconnecting Side
Channels ...................................................................................................................................................... 5‐7 Table 5‐3. Analysis Segments with Geomorphic Attributes Suitable for Establishing or
Promoting the Engagement of Floodplain Channels across a Variety of Flows ............. 5‐9 Table 5‐4. Analysis Segments with Geomorphic Attributes Suitable for Removing Riprap or
Bank Hardening ...................................................................................................................................... 5‐11 Table 5‐5. Analysis Segments with Geomorphic Attributes Suitable for Installing Instream
Wood ........................................................................................................................................................... 5‐13 Table 5‐6. Areas with Attributes Appropriate for Riparian Revegetation ........................................... 5‐17 Table 6‐1. Recommended Projects and Related Restoration Objective, Presented in Descending
Order by Subreach and River Mile .................................................................................................... 6‐2 Table 6‐2. Anticipated Benefits of Channel Roughness Elements at SR5‐RM105 to Salmon
and Steelhead ............................................................................................................................................ 6‐6 Table 6‐3. Anticipated Benefits of Channel Reconstruction, Instream Wood, and Channel
Roughness Elements at SR5‐RM102.9 to Salmon and Steelhead ......................................... 6‐8 Table 6‐4. Anticipated Benefits of Channel Roughness Elements at SR5‐RM98.6 to Salmon
and Steelhead .......................................................................................................................................... 6‐10 Table 6‐5. Anticipated Benefits of Levee Removal at SR4‐RM96.9 to Salmon and Steelhead ..... 6‐12 Table 6‐6. Anticipated Benefits of Channel Roughness Elements at SR4‐RM95.4 to Salmon
and Steelhead .......................................................................................................................................... 6‐13 Table 6‐7. Anticipated Benefits of Channel Roughness Elements at SR4‐RM93.5 to Salmon
and Steelhead .......................................................................................................................................... 6‐14 Table 6‐8. Anticipated Benefits of Installing Instream Wood at SR3‐RM90.3 to Salmon and
Steelhead ................................................................................................................................................... 6‐16 Table 6‐9. Anticipated Benefits of Levee Removal at SR3‐RM89.7 to Salmon and Steelhead ..... 6‐18 Table 6‐10. Anticipated Benefits of Levee Removal at SR3‐RM80.1 to Salmon and Steelhead ..... 6‐20 Table 6‐11. Biological Benefits Scores ................................................................................................................... 6‐27 Table 6‐12. Hierarchical Framework Used for Project Prioritization ...................................................... 6‐29 Table 6‐13. Prioritized Matrix of Wapato Reach Process‐Based Restoration Projects ..................... 6‐34

Yakama Nation Contents
Wapato Reach Assessment Reportv
April 2012ICF 00703.11
Table 6‐14. Prioritization of Riparian Revegetation Locations Listed in Descending Order by River Mile within Each Priority Category .................................................................................... 6‐37
Table 7‐1. Recommended Projects, Restoration Objectives, and Hypothesized Mechanism of Benefit to Salmon and Steelhead in the Wapato Reach ........................................................... 7‐2

Yakama Nation Contents
Wapato Reach Assessment Reportvi
April 2012ICF 00703.11
Figures
Figure 1‐1. Quantitative Assessment and Project Prioritization Framework ........................................ 1‐3 Figure 2‐1. Juvenile and Adult Migration Timing Relative to the Wapato Reach ................................. 2‐3 Figure 3‐1. Location of HEC‐RAS Transects Established to Predict Flood Levels and Sediment
Transport Rates ........................................................................................................................................ 3‐6 Figure 3‐2. Flow Duration Curves Developed for the Analysis Reach and Corresponding
Discretization Employed to Approximate Flow Duration for the 50‐Year Bedload Transport Sediment Budget Analysis .............................................................................................. 3‐7
Figure 4‐1. Wapato Reach Longitudinal Thalweg and Water Surface Elevation Profiles (Top) and Variation in Selected Grain Size Distribution Percentiles (Bottom) .......................... 4‐2
Figure 4‐2. Modeled 10‐Year Flood Extent over the Floodplain along the Length of the Wapato Reach ............................................................................................................................................ 4‐4
Figure 4‐3. Wapato Reach Grain Size Distributions .......................................................................................... 4‐5 Figure 4‐4. Longitudinal Variation in Predicted Potential Bed Elevation Changes within
Analysis Segments of the Wapato Reach over a 50‐Year Period .......................................... 4‐6 Figure 4‐5. Annual Peak Flow Time Series Encompassing the Aerial Photography Date
Range—USGS Gage at Parker (#12505000)................................................................................. 4‐7 Figure 4‐6. Fall Chinook Survival Factors ........................................................................................................... 4‐12 Figure 4‐7. Summer Chinook Survival Factors ................................................................................................. 4‐13 Figure 4‐8. Summer Chinook Life‐History Performance across a Range of Sub‐Yearly
Timing at Prosser Dam (Downstream of the Wapato Reach) ............................................. 4‐14 Figure 4‐9. Spring Chinook Survival Factors ..................................................................................................... 4‐15 Figure 4‐10. Summer Steelhead Survival Factors .............................................................................................. 4‐16 Figure 4‐11. Coho Survival Factors .......................................................................................................................... 4‐17 Figure 6‐1. EDT Modeled Effect of Recommended Projects on Fall Chinook Population
Performance Parameters (Top) and Benefit Scores (Bottom) ............................................ 6‐22 Figure 6‐2. EDT Modeled Effect of Recommended Projects on Summer Chinook Population
Performance Parameters (Top) and Benefit Scores (Bottom) ............................................ 6‐23 Figure 6‐3. EDT Modeled Effect of Recommended Projects on Spring Chinook Population
Performance Parameters (Top) and Benefit Scores (Bottom) ............................................ 6‐24 Figure 6‐4. EDT Modeled Effect of Recommended Projects on Summer Steelhead Population
Performance Parameters (Top) and Benefit Scores (Bottom) ............................................ 6‐25 Figure 6‐5. EDT Modeled Effect of Recommended Projects on Coho Population Performance
Parameters (Top) and Benefit Scores (Bottom) ....................................................................... 6‐26 Figure 6‐6. EDT Modeled Effect of Combined Recommended Projects on Fall Chinook, Summer
Chinook, Spring Chinook, Steelhead and Coho Population Performance Parameters Diversity ............................................................................................................................ 6‐40
Figure 6‐7. EDT Modeled Current and Combined Recommended Projects Effect on Cumulative Productivity and Capacity of Fall Chinook .......................................................... 6‐42
Figure 6‐8. EDT Modeled Current and Combined Recommended Projects Effect on Cumulative Productivity and Capacity of Summer Chinook ................................................ 6‐42
Figure 6‐9. EDT Modeled Current and Combined Recommended Projects Effect on Cumulative Productivity and Capacity of Spring Chinook .................................................... 6‐43

Yakama Nation Contents
Wapato Reach Assessment Reportvii
April 2012ICF 00703.11
Figure 6‐10. EDT Modeled Current and Combined Recommended Projects Effect on Cumulative Productivity and Capacity of Summer Steelhead ............................................. 6‐44
Figure 6‐11. EDT Modeled Current and Combined Recommended Projects Effect on Cumulative Productivity and Capacity of Coho from Lower Ahtanum Creek ............... 6‐45

Yakama Nation Contents
Wapato Reach Assessment Reportviii
April 2012ICF 00703.11
Acronyms and Abbreviations
CJMF Chandler Juvenile Monitoring Facility CWU Central Washington University EDT Ecosystem Diagnosis and Treatment ICF ICF International LWD large woody debris NMFS National Marine Fisheries Service PIT passive integrated transponder RM river mile TAG Technical Advisory Group USGS U.S. Geological Survey YKFP Yakima/Klickitat Fisheries Project

Wapato Reach Assessment Report1‐1
April 2012ICF 00703.11
Chapter 1 Goals and Scope
1.1 Goals The goal of the Wapato Reach Assessment Project (project) is to identify and rank the opportunities for river restoration in the Wapato Reach in a defensible and transparent way. The project goal is accomplished by developing a conceptual model of the biological and physical characteristics of the reach and using that model to identify, formulate, and rank potential restoration actions appropriate to the Wapato Reach and beneficial to the specific salmonid species and life‐history strategies using the reach. The model includes identification of the specific environmental attributes most strongly affecting use of the reach by key life‐history stages sockeye, coho, summer steelhead, spring Chinook, summer Chinook, and fall Chinook.
The Yakama Nation and Technical Advisory Group (TAG) identified the following goals for the Wapato Reach, which served to guide the development of the reach assessment project.
8. Restore, to the extent practical in the modern landscape, the predevelopment form and function (process and structure) of the riverine ecosystem. The riverine ecosystem includes aquatic (channel and floodplain), riparian, and hyporheic habitats.
9. Restore habitat for culturally important fish, wildlife, and plants for use by the Yakama people, focusing on habitat for key life stages and life histories of culturally and economically important salmonid species. Includes all species and runs historically present in the basin.
10. Enhance or maintain the extent, vigor, and population dynamics of historic riparian vegetation communities, focusing on the black cottonwood community, but also including species such as Pinus ponderosa.
11. Protect floodplain lands from development and increase the connectivity and integrity of floodplain habitat.
1.2 Scope By integrating the physical characteristics and biological functions of the reach with the specific use by these salmonids, the reach assessment project identifies the types of restoration actions most beneficial to each species and life stage, and determines the geographic portion of the reach most appropriate for each type of restoration action (Figure 1‐1). The restoration actions and locations determined to be beneficial to the greatest number of species and life stages are then developed into conceptual projects with estimated costs. The projects are prioritized with a ranking matrix according to their relative benefit to the various species and according to feasibility factors (e.g., cost, landownership). Through integration of the physical characteristics and specific use of the reach by these salmonids, mechanisms of action linking environmental attributes with restoration actions and hypothesized species benefits is then formulated. The efficacy of these projected benefits can be tested in the future through project construction, monitoring targeted toward the hypothesized mechanisms of action, and adaptive management.

Yakama Nation Chapter 1
Goals and Scope
Wapato Reach Assessment Report1‐2
April 2012ICF 00703.11
The reach assessment project also identifies key physical and biological data gaps that could be addressed by future data collection, research, and monitoring in order to further refine the conceptual model and potential types of restoration projects appropriate to the Wapato Reach.

Classify Subreach Units by
Geomorphic Characteristics
Identify and Classify
Survival Factors by Species
and Life-History Stage
Establish Geomorphically and Biologically Beneficial Restoration Objectives
Longitudinal Profi les
• Identify variation in depositional patterns, hydraulics, and channel form in reach
• Identify subreach units
Hydrology, Hydraulics, And Sediment Transport Processes
• Compute cross section sediment transport rates, fi fty year sediment budget
• Classify segments by aggredation/ degradation potential
Channel and Floodplain Processes
• Compute channel migration rates
• Classify segment planform change
• Identify and classify side and fl oodplain channels
Salmonid Species and Life-History Patterns
• Identify species and life stages experiencing reach
• Identify seasons of use by species
Species/Life-Stage Survival Potential
• Characterize current reach conditions
• Compute survival factors based on conditions and species/life stage requirements (survival curves)
• Identify habitats used by species and life stage
Wapato Reach Limiting Factors Analysis
• Identify and classify environmental conditions by analysis segment
aff ecting species/life stage survival
• Compute species/life stage survival potential in reach
• Score survival conditions in reach
• Classify Wapato Reach relative to conditions experienced across species life history
Figure 1-1. Wapato Reach Quantitative Assessment and Project Prioritization Framework
PHYSICAL PROCESSES BIOLOGICAL PROCESSES
Identify Potential Protection, Process-Based Restoration, and
Habitat Enhancement Locations to Meet the Objectives
Additional Screening and Field Assessment
Recommended Projects
Determine Biological Benefits and Prioritize Projects
Prioritization Matrix
Monitoring Research Priorities


Wapato Reach Assessment Report2‐1
April 2012ICF 00703.11
Chapter 2 Project Setting—the Middle Yakima River
2.1 Project Area The assessment area encompasses the Wapato Reach portion of the Yakima River and its floodplain, beginning at Union Gap at river mile (RM) 110 and extending approximately 50 miles southeast to Mabton Bridge (RM 60) (Appendix A, Figure A‐1). The significant tributaries entering the Wapato Reach include Ahtanum Creek which enters at Union Gap RM 110, Toppenish Creek at RM 81.3, and Satus Creek at RM 70. The ‘Gap to Gap’ reach lies upstream and the lower river lies downstream of the Wapato Reach.
There are two major irrigation diversions at the upstream end of the reach, Wapato Dam at RM 109.2 and Sunnyside Diversion Dam at RM 106.6. Together these diversions remove on average 70% to over 80% of the Yakima River flow in July, August, and September (i.e., average percent diverted for years 2008 through 2011) (U.S. Bureau of Reclamation 2011). The diversions typically begin operation by mid‐ to late March and continue until mid‐ to late October. Our assessment of physical conditions and processes will focus on the portion of the reach from Wapato Dam to Mabton Bridge. The fisheries assessment will evaluate the effect of the two diversion dams and their associated fish bypass structures on the overall survival of juveniles through the reach.
The landscape surrounding the Wapato Reach is a mixture of agricultural and small urban areas; land ownership is a patchwork mixture of Yakama Nation, Washington Department of Fish and Wildlife, U.S. Fish and Wildlife Service, private property, and other state and federal lands (Appendix A, Figure A‐2).
2.2 Geologic/Geomorphic Setting The Wapato Reach geology and geomorphology can be described in the context of two general timeframes. Over the long term (thousands to millions of years), the region has been influenced by volcanic basalt flows, glacial floods from Lake Missoula, plate tectonics, and a long‐term migration of the river over the valley floor from the southwest to the northeast (Reichmuth et al. 2007). These processes have negligible effect on identification of suitable restoration projects, however.
Project success in the context of this reach assessment is dependent predominantly (if not exclusively) on geomorphic processes that occur over the decadal time scale, given that such projects tend to be effective and/or can be reasonably designed to last over the 5‐ to 50‐year timeframe. Over this timeframe, the area of interest can be delineated to lie within the geologic present channel migration zone. This area is almost certainly likely to lie within the boundaries of the channel that have been occupied over the last approximately 100 years, as illustrated starting with the Government Land Office maps up through present day aerial photos.
This zone is generally encompassed by the Federal Emergency Management Agency 100‐year floodplain and encompasses significant floods such as the 1996 and 1997 events. Within this zone, the composition and spatial distribution of surface geologic units, soil types, riparian vegetation communities, channel locations, grain size distribution, channel planform, and elevation gradient all

Yakama Nation Chapter 2
Project Setting—the Middle Yakima River
Wapato Reach Assessment Report2‐2
April 2012ICF 00703.11
influence the hydraulic and sediment transport processes. These processes result in channel form and location, forces acting during flood flows, and habitat accessibility, quality and function. These properties in turn influence the types and locations of the potential restoration projects that will be identified in this assessment. By describing and evaluating the geomorphic characteristics as they vary along the length of the reach, we can use that information to assist in identifying projects that are compatible and consistent with local reach scale processes.
The banks and floodplain terraces within the reach are composed of a gravel‐cobble substrate overlain by lenses of sand and silt of varying thickness (Reichmuth et al. 2007; Entrix no date). Floodplain terraces are populated by cottonwood galleries that appear to provide the dominant source of large woody debris (LWD) observed in the reach. Review of existing river centerline traces provided by the Yakama Nation indicates different subreaches have experienced varying channel migration patterns over the past 100 years (Appendix A, Figure A‐3).
General subreach patterns are evident in terms of channel slope and morphology. The subreach between Wapato and Sunnyside dams has been relatively stable. In contrast, the subreach below Sunnyside Dam, extending downstream to approximately RM 98 has exhibited a strong braiding tendency, with many active flood channels. From approximately RM 98 downstream to the slope break seen in the HEC‐RAS model longitudinal profile at approximately RM 91 (Hilldale and Mooney 2007), the channel exhibits more of a wandering planform, with one dominant channel and one or more smaller active side channels. Between approximately RM 91 and RM 83, the river is predominantly single channel and is controlled by the Touchet Beds formation along the northern side and a basalt bedrock grade control at the downstream end). Between approximately RM 83 and RM 60 at the Mabton Bridge, the river is predominately a single channel with an occasional split channel or avulsion. This broad partitioning based on channel migration patterns and slope will have a strong influence on the type of projects that are geomorphically appropriate and should be recommended for each subreach.
2.3 Focal Salmonid Species Based on the information that has been obtained thus far in the project, the following is a general overview for the salmonid species identified by the Yakama Nation and the TAG as of interest in the Yakima Basin and Wapato Reach specifically. Section 3.2, Subreach Definition, provides a more detailed diagnosis for each species by life stage specifically focusing on the Wapato Reach as part of the biological analysis. Figure 2‐1 summarizes the seasonal patterns of use of the Wapato Reach by each of the species considered in this report (i.e., the targeted species). Additional life‐history flow charts illustrating the complete Yakima River Basin portion of the life cycle for each species are presented in Appendix D). Juvenile and adult fish counts and abundance estimates at Prosser Dam and Roza Dam are from Yakama Nation data (Bosch pers. comm.).

Yakama Nation Chapter 2
Project Setting—the Middle Yakima River
Wapato Reach Assessment Report2‐3
April 2012ICF 00703.11
Figure 2‐1. Juvenile and Adult Migration Timing Relative to the Wapato Reach
Note: the question marks on the summer Chinook graphic reflect the fact water temperatures can reach lethal levels in July and August in the lower Yakima River. Figure illustrates percent of the total fish migration counted at each site, displayed by month.
Spring Chinook January February March April May June July August September October November December
Juvenile migrants at
Prosser Dam
Adults at Prosser Dam
Adults at Roza Dam
Summer Chinook January February March April May June July August September October November December
Hypothesis for Juvenile
migrants at Prosser Dam
Hypothesis for Adults at
Prosser
Fall Chinook January February March April May June July August September October November December
Juvenile migrants at
Prosser Dam
Adults at Prosser Dam
Summer Steelhead January February March April May June July August September October November December
Juvenile migrants at
Prosser Dam
Adults at Prosser Dam
Adults at Roza Dam
Coho January February March April May June July August September October November December
Juvenile migrants at
Prosser Dam
Adults at Prosser Dam
Adults at Roza Dam
Sockeye January February March April May June July August September October November December
Juvenile migrants at
Prosser Dam 2011
Adults at Priest Rapids
Dam (Columbia River)
Adults at Tumwater Dam
(Wenatchee River)
0%
25%
50%
75%
100%
0%
25%
50%
75%
100%
0%
25%
50%
75%
100%
0%
25%
50%
75%
100%
0%
25%
50%
75%
100%
0%
25%
50%
75%
100%
0%
25%
50%
75%
100%
0%
25%
50%
75%
100%
0%
25%
50%
75%
100%
0%
25%
50%
75%
100%
0%
25%
50%
75%
100%
0%
25%
50%
75%
100%
0%
25%
50%
75%
100%
0%
25%
50%
75%
100%
0%
25%
50%
75%
100%
0%
25%
50%
75%
100%
?
? ?
Winter migrants
Winter migrants
Spring Following Adult Migration

Yakama Nation Chapter 2
Project Setting—the Middle Yakima River
Wapato Reach Assessment Report2‐4
April 2012ICF 00703.11
Prosser Dam is located at RM 47, approximately 13 miles downstream of the lower extent of the Wapato Reach. Adult counts at Prosser Dam are based on video images of fish swimming through each of the three fish ladders in the dam. Juvenile counts at Prosser Dam are based on observations at the Chandler Juvenile Monitoring Facility (CJMF), which is located on the downstream end of the fish bypass system of Chandler Canal1. Roza Dam is located at RM 128, approximately 18 miles upstream of the upper extent of the Wapato Reach. Roza adult counts are based on video images of fish ascending the fish ladder there as well as on real‐time observations of fish passing through a counting and sorting flume at the upstream end of the fish ladder. Adult sockeye counts at Priest Rapids Dam on the Columbia River, Tumwater Dam on the Wenatchee River and Zosel Dam on the Okanogan River were obtained from the Data Access in Real Time web site (www.cbr.washington.edu/dart/) managed by the University of Washington. Priest Rapids Dam is located at RM 397.1, which is approximately 60 miles upstream of the Yakima River confluence. Tumwater Dam is located at RM 32 on the Wenatchee River or approximately 100 miles upstream of Priest Rapids Dam. Zosel Dam is located at RM 79 on the Okanogan River or approximately 200 miles upstream of Priest Rapids Dam.
Figure 2‐1 shows juvenile migration timing at Prosser Dam (RM 47) and adult timing at Prosser Dam and Roza Dam (RM 128) on the Yakima River. Summer Chinook timing is hypothetical and is based on an Ecosystem Diagnosis and Treatment (EDT) model analysis of potential juvenile survival in the lower Yakima River and adult timing observed in the upper Columbia River mainstem and Okanogan River. Sockeye juvenile timing reflects 1 year (2011) of observations in the Yakima River. The timing of adult sockeye migration in the Yakima River is hypothetical, reflecting the timing of sockeye observations at Priest Rapids Dam on the Columbia River and Tumwater Dam on the Wenatchee River.
2.3.1 Spring Chinook
Spring Chinook are the most abundant species and run of salmonid in the Yakima Basin. Management emphases include habitat restoration and improvements in bypass survival at diversion dams. The upper Yakima population includes a hatchery program to enhance the natural population and to support harvest of spring Chinook. This program also has the following strong research emphasis (Fast 2002):
…test the assumptions that artificial production can be used to increase harvest and natural production while maintaining the long‐term genetic fitness of the fish population being supplemented and keeping adverse genetic and ecological interactions with non‐target species or stocks within acceptable limits.
The hatchery program began with the first release of off‐station acclimated smolts in 1997.
At Prosser Dam, adult spring Chinook are first seen in early April, and the run is 75% completed by the end of May. Adults move quickly through the lower Yakima mainstem, with 75% of the adults passing Roza Dam by the middle of June.
Many juvenile spring Chinook migrate to the lower Yakima River mainstem during the late fall and winter. A fairly extensive time series of observations suggests that about 30% of brood‐year production passes Prosser Dam between November and February (Bosch pers. comm.). Many of the
1 Note that Prosser Dam diverts water into Chandler Canal, not into “Prosser Canal”. This inconsistency in facility names sometimes causes confusion.

Yakama Nation Chapter 2
Project Setting—the Middle Yakima River
Wapato Reach Assessment Report2‐5
April 2012ICF 00703.11
same observations cited in support of the existence of steelhead winter migrants also include observations of spring Chinook winter migrants. Smolt migration occurs primarily in April and May, with the majority observed at Prosser Dam in April.
2.3.2 Fall Chinook
Fall Chinook in the Yakima River basin are a combination of natural‐ and hatchery‐origin fish. In past years hatchery release was based on eggs collected from the Little White Salmon Hatchery just upstream of Bonneville Dam. In the future, Yakima hatchery fall Chinook will be the progeny of adults collected at Priest Rapids Dam and will all be released downstream of Prosser Dam. Fall Chinook spawn in the Yakima mainstem from Sunnyside Dam downstream almost to the Columbia confluence. In recent years the majority of fall Chinook spawning has occurred within the Wapato Reach, between RM 83 and RM 91, and the downstream limit of spawning has moved upstream. One of the reasons behind this change in spawning location is the proliferation of water stargrass (Heteranthera dubia) in the lower river. Wise et al. (2009) reported that the highest concentrations of this macrophyte occurred in the lower 47 miles of the Yakima River. The coverage of the streambed in stargrass‐affected areas appears to be so heavy as to discourage adult fall Chinook from spawning. Adult fall Chinook are first seen at Prosser Dam in late August. The run extends into early November, and 50% of the run has passed Prosser by mid‐October. The subyearling Chinook juveniles observed at CJMF (Prosser Dam) are nearly all fall Chinook smolts. Although the timing of fall Chinook outmigration is extremely variable, it generally occurs between late April and early July, with a peak in mid‐June.
2.3.3 Summer Chinook
Although Yakima summer Chinook were nearly extirpated in the 1930s (Lichatowich and Mobrand 1995), the last summer Chinook redds were observed just upstream of the Wapato Reach in 1970 (Bonneville Power Administration 1992). Of all Yakima anadromous salmonids, summer Chinook are the most affected by increased summer water temperature and unscreened irrigation diversions downstream of primary spawning locations. The Yakama Nation and cooperating agencies have just recently initiated a program to restore summer Chinook to the Yakima Basin. The first release of juveniles occurred in 2010 using the progeny of adults collected at Wells Dam. The reestablishment of summer Chinook in the Yakima River will be based on hatchery fish released above Prosser Dam. Potential summer Chinook spawning areas include the upper portion of the Wapato Reach, an area in which a limited proportion of fall Chinook spawning occurs at this time. The primary spawning location for summer Chinook, however, is expected to be upstream of the Wapato Reach in the Gap‐to‐Gap reach of the Yakima mainstem (roughly, the mainstem Yakima between Roza and Wapato Dams).
The success of the attempt to reestablish summer Chinook in the Yakima River depends heavily on conditions within the Wapato Reach because of its role as a migration corridor and in the provision of juvenile rearing habitat in the late spring and early summer. Information is not yet available to evaluate survival of adult summer Chinook through the Wapato Reach because a full life cycle of naturally produced summer Chinook has not yet been observed: adult returns from the hatchery smolts released in 2010 will not occur until 2012. It is, however, likely that summer temperatures in the lower Yakima River mainstem will be a significant migration barrier, and that summer Chinook will need to adopt a run timing that includes early‐ and late‐returning components, with the later component holding in the Columbia River until late summer or early fall (Figure 2‐1).

Yakama Nation Chapter 2
Project Setting—the Middle Yakima River
Wapato Reach Assessment Report2‐6
April 2012ICF 00703.11
2.3.4 Steelhead
Yakima summer steelhead is the only anadromous salmonid in the basin that is protected under the Endangered Species Act; its listing status is “threatened”). The Yakima subbasin supports four genetically and demographically distinct populations of summer steelhead: Satus Creek, Naches River, Toppenish Creek, and Upper Yakima.
The National Oceanic and Atmospheric Administration Interior Columbia Technical Recovery Team’s population delineation includes a Yakima mainstem spawning component of the Satus and Toppenish populations (i.e., a portion of the Wapato Reach). However, little is known about the mainstem components of these populations (Conley et al. 2009).
The number of adult steelhead estimated at Prosser Dam from 1985 through 2006 has ranged from 450 to 4,491 fish with an average of 1,764 fish (Conley et al. 2009). The Satus and Toppenish populations make up nearly half of the total.
Nearly all steelhead in the Yakima Basin are of natural origin; the few hatchery‐origin fish observed are strays from hatchery programs outside the Yakima basin.
Upstream migrating adult summer steelhead are first observed at Prosser dam in mid‐September, and migration continues through mid‐April. The date of median passage occurs in early November. Summer steelhead first appear at Roza Dam in October, but the median migration date does not occur until early April. Most of the run at Roza Dam occurs between early March and late April. Adult Steelhead reside quietly in a single spot for long periods before spawning. This “holding” behavior occurs in January and February primarily inside the Wapato Reach and in the slow‐moving reach just downstream. Steelhead enter spawning tributaries in late February and early March.
Much like spring Chinook in the Yakima Basin and elsewhere, steelhead juveniles redistribute downstream in the late fall and early winter. Substantial numbers of steelhead juveniles have been observed during the late fall and winter in traps on lower Satus Creek (Hubble pers. comm.), at the Wapatox trap on the lower Naches River (Fast et al. 1991), during electroshocking surveys in the lower Yakima (Porter pers. comm.) and in juvenile fish monitoring operations at Prosser Dam. Such fish have been termed “winter migrants”. Steelhead smolts pass Prosser Dam primarily in April and May, with the majority observed at Prosser Dam in May.
2.3.5 Coho
Coho were extirpated from the Yakima Basin by the 1980s due in part to over‐exploitation in ocean and lower river fisheries and the degradation of habitat and loss of instream flows in the Yakima Basin (Bosch et al. 2007).
The Yakama Nation and cooperating agencies initiated a coho restoration program in the Yakima Basin in the mid‐1990s. Coho were reintroduced into the Yakima Basin by the release of hatchery‐origin smolts. These fish originated from lower Columbia River hatchery populations. As return of coho to the Yakima Basin has increased over the years the Yakama Nation has successfully created a local hatchery broodstock program replacing the out‐of‐basin source. Smolt release sites are located in the Naches River and upper Yakima River upstream of Roza Dam. These locations were selected to emphasis restoration of natural spawning coho in the Naches River tributaries and tributaries to the upper Yakima River. The goal is to reestablish self‐sustaining, natural populations in the Naches and Upper Yakima drainages.

Yakama Nation Chapter 2
Project Setting—the Middle Yakima River
Wapato Reach Assessment Report2‐7
April 2012ICF 00703.11
The locations in which coho spawned historically are 100 river miles or more upstream of the Wapato Reach. Although the movement of juvenile coho from summer rearing areas to overwintering habitat 100 miles or more downstream has been documented (Lestelle 2007), the overwintering habits of Yakima coho are largely unknown. Juvenile coho observed at Prosser Dam are almost all outmigrating yearling smolts. Smolt migration occurs primarily in April and May, with the majority observed at Prosser Dam in May.
Coho salmon pass Prosser Dam between mid‐September and mid‐November, with a median passage date of mid‐October. Coho returning to the upper Yakima are observed at Roza Dam between late September and late December, with median passage occurring in late October. Information is not available to ascertain how much time coho spend in the Wapato Reach versus areas upstream of the Wapato Reach.
2.3.6 Sockeye
Sockeye were extirpated from the Yakima Basin in the early 1900s after permanent and temporary diversions blocked access to all nursery lakes. The National Marine Fisheries Service (NMFS) studied the feasibility of restoring sockeye to the Yakima Basin by releasing marked juveniles from 1987 to 1993 (Flagg et al. 2000). These releases showed that sockeye can survive to smolt stage and successfully return as to the Cle Elum River as adults. In recent years, the Yakama Nation and the U.S. Bureau of Reclamation (Reclamation) have developed a plan to restore sockeye to the Yakima Basin (Johnston et al. 2008). An effort to reestablish sockeye began in 2009 with the release of 1,000 adults collected at Priest Rapids Dam on the Columbia River. Sockeye collected at Priest Rapids comprise a mixture of fish returning to the Wenatchee and Okanogan subbasins. Subsequent releases of Priest Rapids adults occurred in 2010 (2,500 fish) and 2011 (4,100 fish). A total of 3,857 naturally‐produced sockeye smolts were observed in 2011 at the CJMF (Prosser Dam), but the means of expanding this raw catch into a total passage estimate has not yet been developed. Sockeye juveniles seen at CJMF have consisted exclusively of outmigrating smolts observed in April and May.
Because naturally produced sockeye have yet to return to the Yakima River, it is currently impossible to describe the run timing of a future population of naturalized Yakima sockeye; the first return of adults from the 2011 smolt outmigration will not occur until the fall of 2012. We can, however, speculate that the run timing of Yakima sockeye will be similar to that of sockeye returning to the upper Columbia River. Sockeye pass Priest Rapids Dam between late June and the end of July, with median passage occurring in early July. Adult sockeye observed at Priest Rapids Dam are a combination of fish returning to the Wenatchee and Okanagan subbasins. Because the distance from the mouth of the Columbia to Prosser and Priest Rapids Dams is comparable, we might assume that the run timing will also be comparable between sockeye adults passing Prosser and Priest Rapids Dams. Similar considerations may apply to sockeye run timing at Tumwater Dam and Roza Dam. Adult sockeye move quickly through the lower Wenatchee mainstem, with an average of 50% of the run having passed Tumwater Dam by late July and nearly 100% by mid‐August. To the degree that migration distance determines adult run timing, the run timing of adult sockeye at Roza Dam should be similar to that observed at Tumwater Dam. However, even though distance is much greater, timing of sockeye into the Okanogan River may be a better reflection of sockeye timing in the Yakima River as both rivers have similar temperature profiles during the summer. Most sockeye (95% percentile) pass Zosel Dam between early July and late August, with median passage occurring in mid‐July or approximately one to two weeks earlier than median timing at Tumwater Dam on the Wenatchee River. The earlier date of median timing at Zosel Dam

Yakama Nation Chapter 2
Project Setting—the Middle Yakima River
Wapato Reach Assessment Report2‐8
April 2012ICF 00703.11
compared to Tumwater Dam suggests that sockeye are adjusting their migration timing to avoid warmer periods in the Okanogan River and a similar adaption for early migration timing is likely to occur for Yakima River sockeye.

Wapato Reach Assessment Report3‐1
April 2012ICF 00703.11
Chapter 3 Conceptual Framework of Reach Function
3.1 Approach to Assessment of Current Conditions The evaluation of physical and biological processes for the current condition was based on a review and synthesis of existing information specific to the Wapato Reach and for the Yakima River Basin. The team received the compilation of existing information and data that was collected and organized during Phase I. This data was reviewed for specific sources of information regarding existing conditions, anthropomorphic alterations, important off channel floodplain habitats, riparian vegetation, and existing fisheries related data on salmon and steelhead populations. Habitat conditions and limiting factors information were also reviewed, as well as new fish monitoring data collected by the Yakama Nation specific to the Wapato Reach. The physical parameter data was integrated with the fisheries population and vegetation/habitat data to form the foundation of the conceptual framework for the reach that served as the foundation for subsequent detailed analysis, as described below.
The following information was used to evaluate physical processes.
Traces of existing and historic channel centerlines dating from 1947, 1973, 1996, and 2009 for analyses of channel migration rates and patterns.
Locations of channel banks traced from aerial imagery from 1971, 1996, and 2009 for portions of the reach to refine channel migration rate data.
LiDAR elevation data (2000) for delineating floodplain and side channels.
Reclamation (Hilldale and Mooney 2007) HEC‐RAS model for characterizing reach scale elevation and slope profiles, and for flood level and sediment transport modeling.
Pebble count & bulk sediment sample data obtained from Reclamation (Mooney 2008) for characterizing reach trends and use in sediment transport analysis.
GIS shapefile(s) delineating bank revetments.
Hydrologic estimates of flood frequency and flow duration curves, provided by Yakama Nation, for use in sediment transport analysis and in assessing floodplain connectivity frequency.
The following information was used to evaluate biological processes.
Juvenile fish use in the Wapato Reach and areas adjacent to the reach:
Estimates of abundance and timing of juvenile salmonids migrating downstream at Prosser Dam (Chandler Juvenile Fish Monitoring Facility).
Juvenile fish counts from the former Wapatox smolt trap in the lower Naches River (1983 to 1989) (Fast et al. 1991) and lower Satus Creek smolt trap (1991 and 1992).
Juvenile fish counts from screw traps operated in lower Toppenish and Ahtanum Creeks (1995 to present).

Yakama Nation Chapter 3
Conceptual Framework of Reach Function
Wapato Reach Assessment Report3‐2
April 2012ICF 00703.11
Back‐pack and boat electroshocking catch information from locations on the Yakima River mainstem in and near the Wapato Reach (2010 and 2011).
Survival studies of passive integrated transponder (PIT)‐tagged spring Chinook smolts through the Yakima River (multiple years).
Adult fish use in the Wapato reach and areas adjacent to the reach:
Estimates of abundance and timing of adult salmonids migrating upstream at Prosser Dam (2001 to present).
Estimates of abundance and timing of adult salmonids migrating upstream at Roza Dam (2001 to present).
Fall Chinook redd survey counts and distribution in the lower Yakima River (2001 to present).
A subset of applicable information describing mainstem habitat conditions in the Wapato reach:
Population descriptions and habitat updates completed by agencies for the Yakima Basin Integrated Water Resource Management Plan (2010).
Habitat modeling completed by the Reclamation for the Water Storage Study (2007).
Habitat characterizations completed for the Yakima Basin for subbasin planning (2004)
Detection ratios of PIT‐tagged smolts at mainstem Columbia Dams from fish released inside or below bypass corridors at Sunnyside Dam and other mainstem Yakima diversion dams to estimate survival through the bypass systems of Sunnyside and Wapato Dams.
Monthly abundances of piscivorous birds and fish in the Wapato reach, combined with bioenergetic estimates of consumption rates and smolt abundances approaching Prosser Dam, were used to estimate mean predation rates on smolts passing through the Wapato Reach. Annual reports by the Yakama Nation on the abundance of the dominant piscivorous birds (white pelicans, great blue herons, common mergansers and double‐crested cormorants) and fish (northern pikeminnow) in the Wapato Reach were the foundation of this analysis.
Thermal profiles completed by the U.S. Geological Survey (USGS) for the lower Yakima River mainstem (Vaccaro 2011).
Existing riparian vegetation GIS data layer.
The following information was used to evaluate anthropomorphic processes.
Land ownership
Parcel size
Levee locations
Irrigation Districts, drains, and laterals
The following GIS photos series were reviewed.
2009 NAIP imagery
2011 NAIP imagery for current conditions comparison

Yakama Nation Chapter 3
Conceptual Framework of Reach Function
Wapato Reach Assessment Report3‐3
April 2012ICF 00703.11
3.2 Subreach Definition The Wapato Reach was delineated into five subreach units (Table 3‐1) with characteristically different channel planform tendency, streamwise slope, and general bedform roughness for this analysis (Appendix A, Figure A‐4). The subreaches are described in more detail in Section 4.1, Results from Geomorphic Assessment.
Table 3‐1. Reach Boundaries Used in this Analysis
Subreach Boundary
1 RM 59.86 – 69.45
2 RM 69.46 –79.88
3 RM 79.89 – 91.40
4 RM 91.41 – 98.09
5 RM 98.10 ‐ end 109 (includes Sunnyside and Wapato Dams)
These subreaches were also used for the EDT analysis based on seasonal separation of species use (e.g., summer Chinook versus fall Chinook) (Appendix A, Figure A‐4). This provided a means to identify shorter lengths of river where a group of geomorphically appropriate and biologically beneficial restoration actions are likely to be similar and thus could be implemented in a comprehensive, integrated, and strategic manner.
3.3 Assumptions Based on input from the Yakama Nation and the TAG, the following assumptions were applied to the technical approach and analysis:
1. Future conditions will be at least as good as current conditions with regards to river flow and temperature. The potential impacts of climate change will be noted, but we will not explicitly evaluate projects with future flow or temperature scenarios.
2. For the purpose of this analysis, the extent of Wapato Reach is from Union Gap to Mabton Bridge, including the Wapato and Sunnyside Dams.
3. Property acquisitions and preservation will be included where appropriate as potential projects.
4. The reach assessment will recognize that the modern landscape has an altered hydrograph and irrigation diversions that affect the riverine ecosystem, but will not consider alterations to hydrograph/irrigation diversions as potential restoration objectives or actionable projects.
3.4 Approach to Assessing Physical Processes The geomorphic analysis focused on characterizing key reach scale processes because they influence restoration project function and performance. The geomorphic analysis involved the following elements.
1. Compilation of existing and collection of new pebble count data for analysis of long profile characteristics and for use in sediment transport analysis.

Yakama Nation Chapter 3
Conceptual Framework of Reach Function
Wapato Reach Assessment Report3‐4
April 2012ICF 00703.11
2. Utilization of the Reclamation HEC‐RAS model in hydraulic and sediment transport analyses aimed at characterizing aggradational versus degradation tendencies of river analysis segments and estimating general frequency of hydraulic connection with the floodplain by floods.
3. Utilization of available channel centerline traces digitized previously from aerial photographs for the entire reach to identify segments where channel migration has been most and least active. Main and side channel locations in the more active segments were subsequently digitized using selected available aerial photography up to and including 2009 to calculate left and right bank migration rates.
4. Delineation of potential floodplain and side channels from a LiDAR‐derived DEM and as available from the Reaches Study (Stanford et al. 2002), and comparison of the results with HEC‐RAS model predictions to classify relative level of floodplain connectivity and avulsion risk.
5. Review and synthesis of the sediment transport, channel migration rate, and floodplain channel connectivity data to develop classification ratings for each parameter for each analysis segment.
6. Identification of appropriate restoration project types for different analysis segments based on specific geomorphic and biologic characteristics.
The methods that were involved in each element of the geomorphic analysis are described in detail below. Integration of the geomorphic processes with the EDT analysis of the reach was accomplished with the use of an ACCESS database (Section 5.2.2, ProcessBased Habitat Restoration Locations) to ensure that proposed restoration objectives and projects are compatible and consistent with natural riverine processes.
3.4.1 Longitudinal Profiles (Large‐Scale Streamwise Variation)
Longitudinal profiles provide an indication of the potential influence of geologic and anthropogenic controls on channel grade, and the effects of large‐scale slope changes on sediment transport and deposition patterns. Longitudinal profiles were developed for water surface and thalweg elevations over the analysis reach using the HEC‐RAS model data and predictions for the 2‐yr flood event.
Seven pebble counts were sampled on October 19, 2011, to supplement seven grain size distribution data samples collected by Reclamation (Mooney 2008). The data from these 14 counts were used to characterize upstream‐downstream variation in grain size patterns in the reach, as input to the sediment transport analysis, and to compare spatial changes with the results of the channel migration analysis and with geologic surface unit map types. It was generally not feasible to collect data near the thalweg given channel size. Instead, a sample size of 100 stones was selected randomly by moving over the mid‐point of active depositional point bars between the water and floodplain and measuring the intermediate axis diameter of each stone. Sampling locations were selected to be geomorphically similar in terms of bar type and relative location on the bar, and not to reflect the influence of local sorting so that observed longitudinal variation in grain sizes would not reflect locally variable depositional processes, but rather larger scale geomorphic variation. Various percentile particle sizes including D50 (i.e., size for which 50% of stones were smaller) were computed for each sample and plotted against river mile.
Comparison of the upstream‐downstream scatter in D50 and D90 values with breaks in slope, locations of changes in general longitudinal irregularity of the bed profile (i.e., rugosity), and the general transitions in channel planform identified in Section 2.2, Geologic/Geomorphic Setting, was used to define subreaches with generally similar large‐scale geomorphology. Pebble count data were

Yakama Nation Chapter 3
Conceptual Framework of Reach Function
Wapato Reach Assessment Report3‐5
April 2012ICF 00703.11
subsequently pooled within each subreach to develop grain size distributions that were input to the sediment transport analyses (i.e., if four samples were pooled within a subreach, the grain size distribution was based on 400 stones). Grain size distributions for subreaches 1 and 2 were each based on one sample; distributions for subreach 3 were based on four samples; distributions for subreach 4 were based on five samples and subreach 5 distributions were based on three samples.
3.4.2 Hydrology/Hydraulics/Sediment Transport
Reclamation’s HEC‐RAS model (U.S. Bureau of Reclamation and Washington State Department of Ecology 2011) was used to predict sediment transport rates at each of the 109 cross‐sections (Figure 3‐1). The results were integrated over a 50‐year period characteristic of the present regulated hydrologic regime to calculate a net change in sediment volume within the analysis segment bounded by successive model transects. That information was used to characterize the corresponding analysis segment as having a net aggradational, degradational, or equilibrium tendency for sediment transport. The simulation flows were modeled in HEC‐RAS using the steady flow option, for a series of discharges equal to and greater than the 5% exceedance flow, up to the 50‐year flood. Relatively little bedload transport occurs in general in alluvial rivers when discharge is below the 5% exceedance flow (Schmidt and Potyondy 2004). A 50‐year period was simulated to predict the total volume of bedload transported at each HEC‐RAS transect to evaluate corresponding long‐term deposition and erosion trends in the reach over expected maximum potential project design life.
A flow duration curve was generated for the reach and discretized into a histogram approximating the duration of various simulation flow magnitudes as a percentage of the length of the record. The distribution of flows was determined based on matching total volume under the curve and total number of days over a 50‐year period while also approximating the curve shape. Flood flows were estimated for the 2‐, 10‐, 25‐, and 50‐year events at the Parker and Mabton gages (USGS stations 12505000 and 12508990, respectively; period of record was WY 1971–2011) by Tom Elliott of the Yakama Nation, and also assigned a duration, to convert them to an equivalent basis as the daily flow data (Figure 3‐2).

Yakama Nation Chapter 3
Conceptual Framework of Reach Function
Wapato Reach Assessment Report 3‐6
April 2012ICF 00703.11
Figure 3‐1. Location of HEC‐RAS Transects Established to Predict Flood Levels and Sediment Transport Rates

Yakama Nation Chapter 3
Conceptual Framework of Reach Function
Wapato Reach Assessment Report3‐7
April 2012ICF 00703.11
Figure 3‐2. Flow Duration Curves Developed for the Analysis Reach and Corresponding Discretization Employed to Approximate Flow Duration for the 50‐Year Bedload Transport Sediment Budget Analysis
The HEC‐RAS main channel shear stress predictions were input with grain size distribution data to a Fortran program to predict sediment transport rate per unit width based on Parker’s (1990) bedload transport equation. An approximate sediment budget was computed for each flow and analysis segment by estimating unit sediment transport rates at the bounding upstream and downstream HEC‐RAS cross‐sections, and a mass balance equation for bed elevation change
0
10000
20000
30000
40000
50000
60000
0% 1% 2% 3% 4% 5%
Mea
n D
aily
Flo
w (c
fs)
Percent Exceedance
Gage Data
Sediment Transport Calculations
Yakima River, Parker Gage
0
5000
10000
15000
20000
25000
30000
35000
40000
45000
50000
0% 1% 2% 3% 4% 5%
Mea
n D
aily
Flo
w (c
fs)
Percent Exceedance
Gage Data
Sediment Transport Calculations
Yakima River, Mabton Gage

Yakama Nation Chapter 3
Conceptual Framework of Reach Function
Wapato Reach Assessment Report3‐8
April 2012ICF 00703.11
between transects was applied as a function of estimated input and output bedload mass transport rates per unit width (qB), active width (W), distance between transects (L), sediment density (ρs), and porosity (P) (DeVries 2000).
tPWWL
WqWqdt
t
YY
t
tsoutin
inBoutBt
tT
2
1
2
1 )1()(5.0
)()(
(1)
In this mass balance equation, the incremental change in bed elevation (∂Y/∂t) was evaluated for each simulation flow and then multiplied by the histogram time increment (Δt) over which the modeled flow occurred during the 50‐year period. This was repeated for other flows and the results summed to estimate a net mean change in bed elevation YT between successive HEC‐RAS transects. A strongly positive value of the ∂Y/∂t sum was inferred as an indication of a strong tendency towards aggradation and a strongly negative value as an indication of a stronger tendency towards degradation.
The active width used in this equation was specified as the smaller of the wetted main channel width computed by HEC‐RAS and an active bottom width in the main channel as delineated in GIS from scaled aerial photographs taken in 2009. Length was set as the main channel distance between HEC‐RAS transects.
The resolution of the HEC‐RAS modeling and physical characteristics of the modeled reach were such that predictions of bed elevation change at several pairs of adjacent analysis segments were strongly negative for the upstream segment and strongly positive for the adjacent downstream segment. This phenomenon typically appears to reflect locations where the river flow was predicted to experience substantial energy losses due to channel expansion or contraction and directional changes in flow. To resolve this, the two analysis segment predictions of bed elevation change were combined and smoothed using the following weighted formula based on computing total volume between three successive transects consecutively numbered 1, 2, and 3:
)()(
)()(
32322121
32323221212131 WWLWWL
WWLYWWLYY TT
T
(2)
Seven aggradation/degradation potential classes were defined and used to characterize deposition trends based on the sign and magnitude of the predicted bed elevation change (Table 3‐2). The elevation change criteria in Table 3‐2 were developed and tested previously on other large rivers in western Washington, and were found to within the range of the majority of values computed for analysis segments in the Yakima River as well. Each analysis segment was classified accordingly and the results depicted graphically in ARC‐GIS (Appendix A, Figure A‐5).

Yakama Nation Chapter 3
Conceptual Framework of Reach Function
Wapato Reach Assessment Report3‐9
April 2012ICF 00703.11
Table 3‐2. Predicted Bed Elevation Change Rate and Sign Used to Classify Analysis Segments According to Sediment Transport and Deposition Characteristics
Aggradation/Degradation Potential Class Bed Elevation Change Rate (feet/year)
1 < −1.0 (extreme degradation potential)
2 −1.0 to −0.20 (high degradation potential)
3 −0.20 to −0.05 (moderate degradation potential)
4 ±0.05 (minor change)
5 0.05 to 0.20 (moderate aggradation potential)
6 0.20 to 1.0 (high aggradation potential)
7 > 1.0 (extreme aggradation potential)
3.4.3 Channel and Floodplain
Channel and floodplain processes were characterized in two ways: by evaluating channel migration rates over time using digitized channel and bank traces and by identifying side‐ and floodplain channels and classifying them according to general flood level at which they are predicted by the HEC‐RAS model to become engaged.
Spatial and temporal patterns in channel migration rate were derived from existing channel traces and aerial photographs to infer relative stability of specific analysis segments of the analysis reach associated with varying geomorphic activity levels. An existing set of channel centerline traces was reviewed (Appendix A, Figure A‐3) to identify analysis segments where relatively little movement has occurred over the past 50 years. Available aerial photographs encompassing parts of the reach span 1941, 1947, 1949, 1955, 1964, 1968, 1971, 1973, 1978, 1988, 1992, 1996, 1998, 2000, 2002, 2009, and 2011. In addition, channel traces are available for 1874, digitized by Yakama Nation staff based on Government Land Office survey maps and 1909, digitized by Yakama Nation staff based on 1909 Plane Table survey map.
The ICF team selected the aerial photo series from 1947, 1973, 1996, and 2009 for the channel centerline migration analysis because they were the only sets from which centerline traces were digitized along the entire reach, or most of the reach, and could be used to evaluate change on a roughly decadal time scale. Average annual migration rates were computed for the same analysis segments defined for the sediment transport analysis, to allow direct comparisons and post‐processing relational analyses in GIS. Using the HEC‐RAS transects gave a common framework for synthesizing the results from the various analyses. The average annual migration rate for each intervening period of the traced centerline was computed as the distance along perpendicular lines drawn across the floodplain in GIS, between traces from successive aerial photographs. The lines were derived using the interpolation feature in HEC‐RAS, with 100 foot spacing between interpolated cross‐sections, and the coordinates of the interpolated lines were then exported to GIS. The periodic average migration rate was computed in GIS for each analysis segment based on the downstream bounding HEC‐RAS cross‐section and the interpolated cross‐sections falling within the segment. Average annual migration rates were calculated for the 1947–1973, 1973‐1996 and 1996‐2009 periods. Each segment was classified according to the maximum average migration rate criteria (Table 3‐3) of each of the three periods. These criteria were developed previously for large rivers (DeVries and Huang 2010; DeVries 2010; DeVries 2009) and, as was the case for Table 3‐2, the criteria in Table 3‐3 appear to encompass the majority of values calculated for the Yakima River.

Yakama Nation Chapter 3
Conceptual Framework of Reach Function
Wapato Reach Assessment Report3‐10
April 2012ICF 00703.11
The results were then used to identify more active segments, particularly in the area upstream of RM83 where the channel has been most active. The more active segments were then revisited and the left and right bankfull edge of the dominant channel was digitized from aerial photographs from 1971, 1996, and 2009. This was done because bank erosion rates provide a more accurate and relevant assessment of planform stability than could be obtained via the centerline trace, which can change without any accompanying bank erosion. The average annual migration rate was calculated for each bank, and the riverbank with the greater average annual migration rate was used to classify each analysis segment in terms of the same planform stability index criteria in Table 3‐3.
Table 3‐3. River Channel Migration Rate Classifications for Assessing Channel Planform Stability
Planform Stability Index Average Migration Rate (feet/year, one or both banks)
1 < 15 (minor change/measurement error)
2 15–30 (small change)
3 30–80 (moderate change, wandering tendency)
4 >80 (severe change, braiding tendency)
Notes: These average migration rate categories (i.e., planform stability index) were used for both the centerline migration analysis and the bank migration analysis. Bank migration may be in the left or right direction.
The results were compared with existing maps of hydromodifications (e.g., levees) and with the floodplain channel connectivity results (Appendix A, Figure A‐6) to identify where channel migration may be currently restricted but could potentially be facilitated with removal of the modification based on adjacent analysis segment migration history and the results of the sediment transport analysis.
Floodplain connectivity and avulsion potential or risk was assessed using LiDAR topographic data and the HEC‐RAS flood modeling results. The key factors evaluated as contributing to the potential for avulsion included the presence of concentrated flow pathways evident on the topographic surface and the general flow level at which the upstream inlet would be inundated. The presence of infrastructure such as roads was used to moderate the risk classification as appropriate. Potential avulsion pathway segments were traced on 2‐foot contour maps generated from the 2000 LiDAR data as linear features with elevations that are clearly lower than the surrounding floodplain. Segments began and ended at the main river channel or junctions with other segments.
A GIS layer was constructed that depicted each potential pathway segment as a linear feature (Appendix A, Figure A‐6). The maximum elevation along floodplain channel segments branching from the river was compared with HEC‐RAS flood level predictions to estimate the general return interval event at which each segment and connected segments downstream and upstream would become wetted. Water surface elevations were predicted for the 2‐year, 10‐year, and 100‐year event at each inlet by the HEC‐RAS model. Segments below junctions with upstream segments were assumed to be connected at the same level as upstream segments as long as there was no significant break in slope evident on the map downstream. For example, if a downstream segment was connected to two upstream segments with one flowing at the 2‐year flood level and the other at the 10‐year flood level, the downstream segment was assigned a 2‐year flood level risk.

Yakama Nation Chapter 3
Conceptual Framework of Reach Function
Wapato Reach Assessment Report3‐11
April 2012ICF 00703.11
3.4.4 Approach to Assessing Riparian Conditions
The riparian zone is an important aspect of riverine systems as it integrates landscape‐level factors with very localized habitats that are important to salmon and steelhead. Riparian vegetation along the Yakima River is affected by channel migration and the seasonal timing and duration of river flow, particularly in terms of the cycle of germination, establishment, growth, and return to the river (as LWD) of black cottonwood trees. Riparian vegetation, including large trees, improves instream habitat for salmonids by contributing to the following habitat forming processes.
Shade to reduce stream temperatures.
Allochthonous organic material, which supports the benthic foodchain.
Terrestrial insect fall out, which directly supports salmonid foraging.
Increased biological and structural diversity.
Source of material for future LWD recruitment.
Natural bank stabilization, reduced erosion, and reduced fine sediment input to streams.
Increased bank roughness provided by smaller shrubs, which reduces streamflow velocities to reduce scour forces on the stream banks.
Increased channel complexity and cover.
Reduced pollutant input (for pollutants that are bound to sediments) by reducing the velocity of adjacent run‐off and causing sediment deposition prior the stream.
Consequently, the extent, character, and functions of the riparian and floodplain vegetation of the Wapato Reach were specifically analyzed by Central Washington University (CWU) faculty in the context of determining locations appropriate for riparian restoration. The riparian analysis was conducted to identify riparian vegetation restoration potential using a combination of the channel migration analysis results maps/tables based on annual average migration rates and net aggradation/degradation potential by analysis segment (delineated by HEC‐RAS analysis segments). In addition, other resources were then used to further delineate riparian restoration potential sites including orthophotography, levees locations, floodplain channel avulsion flows, property boundaries, and GIS layers used in the Reaches Study (Stanford et al. 2002) completed by CWU faculty.
3.5 Approach to Salmonid Biological Assessment EDT is a habitat‐based simulation model that predicts survival expectations of salmon and steelhead populations based on a set of environmental conditions (Blair et al. 2009; Mobrand et al. 1997). The model is used to help predict how populations are affected by existing environmental conditions, their potential under pristine conditions, and how they may respond to changes in the environment, such as changes related to habitat restoration activities. The existing EDT environmental characterization developed for the 2007 Water Storage Study for the Yakima River (U.S. Bureau Reclamation 2008) was developed to evaluate survival and population abundance for a series of water management scenarios being evaluated for the Yakima Basin. For this project, the characterization of the Wapato Reach in EDT was refined to include new information for existing

Yakama Nation Chapter 3
Conceptual Framework of Reach Function
Wapato Reach Assessment Report3‐12
April 2012ICF 00703.11
conditions. Application of the EDT model in this reach assessment involved the following modeling elements.
1. Summarized and synthesized juvenile and adult migration data specific to the Yakima River. This was used to help inform our refinement of life‐history patterns generated in EDT.
2. Reviewed and refined the existing EDT environmental characterization for the Wapato Reach. The original data characterization was developed for the Water Storage Study in 2007 and some portions were updated in 2010 for the Integrated Water Management Plan (U.S. Bureau of Reclamation and Washington State Department of Ecology 2011). Revisions were made to the EDT reach breaks to better correspond with the subreach breaks determined as a result of the geomorphic analysis.
3. Application of species/life‐stage survival relationships, some of which are general relationships developed for Pacific Northwest streams and some of which were developed specifically for the Yakima Basin (Lestelle et al. 2006).
4. Computation of species/life‐stage survival potential in the Wapato Reach and overall population survival and abundance using methods and formulas in the EDT Model (Blair et al. 2009).
3.5.1 Patterns of use by Salmonid Species
The first phase of the assessment necessarily focused on life histories of all Yakima Basin salmon and steelhead populations. The initial focus on life histories was necessary because the different salmonid species and populations spend variable time periods/life stages in the Wapato Reach. The first step was completed once we achieved a reasonably close congruence between an empirically based description of life histories (overall and especially in the Wapato Reach) and the life histories described by the EDT model.
The approach to capturing the juvenile portions of the life histories of Yakima River salmon and steelhead made use of quantitative estimates of juvenile migration observed at the Prosser Dam juvenile fish counting facility, as well as summaries of presence/absence and/or relative abundance timing at other sites such as the former Wapatox and lower Satus Creek smolt traps, screw trap observations on lower Toppenish and Ahtanum Creeks, and back‐pack and boat electroshocking surveys in and near the Wapato Reach.
Adult life‐history patterns were based largely on adult counts at Prosser and Roza Dams. Adult counts at these locations were used to determine the dates of daily and cumulative percent passage and were extrapolated to the Wapato Reach. Similar to our approach for juveniles, estimated species‐specific migration speeds and the distances between dams and various points in the Wapato Reach were used to estimate proportional percent passage into and/or through the reach. The migration timing of sockeye and summer Chinook will be inferred from mean dates of proportional passage at mainstem Columbia River dams and tributary passage counts (e.g., data from the Wenatchee River).
3.5.2 Known and Predicted Salmonid Abundance and Survival by Species
The EDT model used the Beverton‐Holt spawner‐recruit function to estimate survival. The parameters of this function are productivity (i.e., adult returns per spawner or smolts per spawner)

Yakama Nation Chapter 3
Conceptual Framework of Reach Function
Wapato Reach Assessment Report3‐13
April 2012ICF 00703.11
and capacity (i.e., maximum number of adults or smolts). Population abundance was estimated based on the productivity and capacity parameters for the function and represents average abundance potential of a population. When adult productivity of a population is less than 1.0, the population abundance is zero (i.e., the population is not self‐sustaining). Survival for a particular life stage is estimated based on the reach/life‐stage density independent survival parameter and capacity. A range of abundances were modeled to estimate survival because of how abundance affects survival through the density‐dependent Beverton‐Holt model.
The assumptions for assessing potential effects of current and future environmental conditions on salmonid survival are presented as a series of survival relationships (i.e., rules) that describe how characteristics of the Wapato Reach and potential restoration activities affect salmon and steelhead survival. The rules were developed over a period of several years by consulting with scientific experts in the habitat needs of the focal species and by referring to the scientific literature.
An important step when developing and applying the rules is determining how, and whether, they could be tied to empirical data specific to the Wapato Reach, thereby quantitatively linking survival to characteristics specific to the Wapato Reach. The Yakama Nation has collected reach specific information, for example indicating that Chinook are found in multiple channel types. This provides a partial picture of salmonid habitat use in the Wapato Reach. However, as typically occurs, data from salmon and steelhead studies throughout the west coast was used to supplement the available reach specific data regarding species use and habitat requirements (e.g., Lestelle et al. 2005).
3.5.3 Evaluation of Conditions Affecting Salmonid Survival (Diagnosis)
Environmental attributes that are influencing survival in the Wapato Reach were identified and classified by evaluating the potential survival response if that attribute were in optimal condition. While the historic condition is useful to help bound the diagnosis by the maximum reach potential, historic conditions may be unrealistic. The result of this analysis is a hypothesis of how aquatic conditions are affecting survival relative to the habitat requirements of the species. These conditions were analyzed during both periods of typical use of the Wapato Reach, as well as the ‘shoulder periods’ (i.e., early summer when river conditions are transitioning from favorable survival to less favorable and in late summer when river conditions transition back to favorable survival).
The following environmental factors were included in the EDT analysis of existing conditions affecting survival of salmon and steelhead in the reach:
Temperature
Sediment
Flow
Diversion structures
Predation
Habitat features such as LWD
In‐channel habitat composition
Floodplain connectivity

Yakama Nation Chapter 3
Conceptual Framework of Reach Function
Wapato Reach Assessment Report3‐14
April 2012ICF 00703.11
Those factors that are having the strongest influence on survival (Section 4.2.1, Evaluation of Habitat Conditions Affecting Salmonid Survival) were used to develop the restoration objectives (Chapter 5, Restoration Objectives and Project Locations).
However, since restoration objectives and specific projects also need to be actionable items that can be accomplished by the Yakama Nation and/or TAG agencies within the context of the Wapato Reach habitat action plan, some landscape‐scale factors fell outside the scope of this reach analysis. Factors not evaluated for their benefits to improving survival of salmon and steelhead in the Wapato Reach included: changes in the amount or timing of irrigation withdrawals at Wapato or Sunnyside dams, modifications of bypass systems at these dams, and predator management in the Lower Yakima River. That is not to say these are not important factors affecting survival in the reach. They are important factors. However, the purpose of this assessment was to analyze benefits of actionable habitat projects within the Wapato Reach and thus its scope was focused in that regard.
Survival conditions vary considerably across a life stage for some species. For example, subyearling Chinook out‐migrants extend well into the period of warm water and low flow in the lower portion of the Wapato Reach. Variability across life stages was assessed by modeling performance across a range of life‐history timing patterns for those life stages that potentially experience a range conditions. The results may suggest periods in which improved survival can benefit a species. However, the ability to ultimately affect survival back to adult for fish experiencing periods of poor survival may be limited by what the fish experience during the remainder of their life history (i.e., during periods when they are not in the Wapato Reach of the river). Using the life‐history patterns and trajectories in EDT, we can account for how subsequent survival may affect survival to adult.
Finally, the scope of the biological analysis was confined to the Wapato Reach and thus, the relative impact of potential Wapato Reach restoration actions on entire Yakima River Basin salmonid populations was not assessed.
3.5.4 Predation Conditions Affecting Salmonid Survival
The Yakima/Klickitat Fisheries Project (YKFP) monitoring program reports the primary avian predators on juvenile salmonids in the Wapato Reach are American white pelicans (Pelecanus erythrorhynchos), double crested cormorants (Phalacrocorax auritus), great blue herons (Ardea herodias) and common mergansers (Mergus merganser) (Yakima/Klickitat Fisheries Project 2011). Although nine other species of piscivorous birds reside in the reach from time to time, none are nearly as significant as these four in terms of the total impact of their abundance, size and caloric requirements and piscivorous diet.
The major fish species preying on juvenile salmonids in the Wapato Reach are is Northern pikeminnow (Pteichocheilus oregonensus). Since at least the late 1950s, the longitudinal distribution of major predatory fish in the mainstem Yakima River has been channel catfish (Ictalurus punctatus) dominating the area near the confluence of the Yakima and Columbia Rivers, smallmouth bass (Micropterus dolomieu) in the reach between Richland and Prosser Dam, and pikeminnow dominating the river above Prosser Dam (Patten et al. 1970; Ecological Interactions Team 1998).
Predation can be a major source of mortality when the ‘right conditions’ occur as a result of concentration of juvenile salmonids prey, concentration of predatory species during certain times of the year, or the alteration of habitat reducing or eliminating places for juvenile salmonids to avoid predators.

Yakama Nation Chapter 3
Conceptual Framework of Reach Function
Wapato Reach Assessment Report3‐15
April 2012ICF 00703.11
In this reach assessment, the EDT model was used to evaluate the effect of habitat structure and composition on predation loss with a general statement of predator abundance included in the model. However, we also wanted to better understand the types of predators, their timing, and to include an approximation of their potential predation rates and total predation related losses for the Wapato Reach.
This detailed information is presented in Appendix B and summarizes predator abundance, distribution, and patterns reported in the YKFP predator monitoring reports. We made estimates of predation rates by predator species based on their feeding ecology and approximations of prey consumption rates. These rates combined with abundance and timing were used to make rough approximations of total losses by predator species.
Ultimately, the analysis presented in Appendix B may lead to recommendations to manage predator species within the Wapato Reach. For this reach assessment, the analysis was used to better understand how habitat restoration objectives and projects may be developed to reduce predation risk in the Wapato Reach.
3.5.5 Wapato and Sunnyside Dams Bypass Mortality Conditions Affecting Salmonid Survival
Juvenile migrant mortality at bypass systems at the Wapato (RM 109.3) and Sunnyside (RM 106.5) diversion dams are another source of losses within the larger Wapato Reach. These dams are part of the larger Yakima Project to provide irrigation water along both sides of the Yakima River. During low flow in August and high irrigation demand, the combined diversions remove on average approximately 80% of the flow (average calculated for years 2008 through 2011). Water is diverted at each dam to a diversion canal and fish are screened and diverted back to the river via a bypass structure consisting of an outfall pipe downstream of the dam. Juvenile mortality can occur via physical trauma at the screens, within the outfall pile (e.g., a blockage was discovered in the outfall at the Wapato fish bypass in 2009), or predation in the river at the outfall location.
The juvenile mortality rates at Wapato and Sunnyside dams that were assumed in the EDT model were based on results of PIT‐tag studies reported by Watson (2011). Although bypass mortality is a significant issue and improvements there would result in noticeable improvements in fish production, it was beyond the scope of this reach assessment to evaluate projects to improve survival at these bypass structures.
3.6 Integration of Physical and Biological Assessments
As illustrated in Figure 1‐1, the information generated by the physical and biological assessments was ultimately used to formulate a suite of restoration objectives to improve the specific habitat conditions affecting survival and are likely to have a high benefit to the specific salmonid species and life‐history patterns that use the Wapato Reach (Chapter 5).
The EDT output/work products were used to help formulate hypotheses for reach‐scale conditions important to the survival of the specific salmonid species and life‐history strategies in the Wapato

Yakama Nation Chapter 3
Conceptual Framework of Reach Function
Wapato Reach Assessment Report3‐16
April 2012ICF 00703.11
Reach. The EDT output/work products were then used to identify a matrix of environmental features that restoration objectives and project types could address.
EDT was then used to identify broad restoration objectives by species based on how realizing these objectives might improve physical conditions in the Wapato Reach. The physical process assessment was used to identify which specific restoration objectives and project types are consistent with the geomorphic conditions in each of the five subreaches.
Ultimately, this diagnosis of current physical and biological conditions and assessment of restoration objectives and project priorities can be used by the Yakama Nation and TAG to support restoration grant applications to fund design and construction of the prioritized restoration projects.
3.7 Factors beyond the Scope of the Reach Assessment
The geomorphic, instream, and riparian habitat conditions of the Wapato Reach are influenced by several landscape‐scale factors that cannot be modified by the Yakama Nation and TAG agencies in the near term to create actionable restoration projects. Thus, it was agreed that, while important to an overall understanding of conditions in the Wapato Reach, these factors would not be specifically evaluated in this reach assessment. These factors included:
Regulated streamflow and irrigation returns.
Temperature conditions related to regulated streamflows.
Presence, depth, and connectivity of excavated ponds within the channel migration zone and/or riparian zone of the river.
An assessment of the degree, nature, and cause of substrate fine sediment.
Soil type, suitability for specific types of vegetation, and depth to water table were not specifically considered in the determination of revegetation potential.
Broader ecological effects of riparian revegetation such as benefits to wildlife species that breed or nest in riparian habitats.
Each of these factors significantly affects conditions in the Wapato Reach and subsequently affects survival of salmonids in the reach to varying degrees. Reduced spring flow during snow melt has an effect on channel geomorphic processes and floodplain connectivity during important early juvenile growth. Reduced low flow during the summer irrigation period greatly affects the types and quantity of habitat available to salmonids. Voss et al. (2008) constructed a water‐temperature model to evaluate potential effect of water management on water temperature in the lower Yakima River. The model did not predict a reduction in summer water temperature with increased flow through the lower Yakima River. The excavated ponds within the channel migration zone affects floodplain potential and is thought to contribute to localized warming of the mainstem during the summer (Vacarro 2011).
Uncertainty about the amount and sources of fine sediment was the topic of discussion among some of the TAG. From these discussions, we concluded that fine sediment remains high in the reach, but less than assumed in the 1990s. The data gap related to the sources of fine sediment and amount of

Yakama Nation Chapter 3
Conceptual Framework of Reach Function
Wapato Reach Assessment Report3‐17
April 2012ICF 00703.11
fine sediment in the substrate of the Wapato Reach affected our understanding of survival under current conditions and thus assumptions regarding potential restoration project benefits, but did not prevent formulation of restoration objectives and geomorphically appropriate project locations.


Wapato Reach Assessment Report4‐1
April 2012ICF 00703.11
Chapter 4 Geomorphic and Biological Assessment Results
4.1 Results from Geomorphic Assessment Appendix C presents the tabulation of each geomorphic attribute organized by reach and river mile and presents the attributes of each analysis segment. Additional discussion of the geomorphic character of the Wapato Reach is presented below.
4.1.1 Longitudinal Profiles
The five subreaches defined by the longitudinal variation in profile and grain size distribution will each have a characteristic planform tendency as inferred from inspection of the aerial photography record and indicated in Figure 4‐1. Projects requiring relative stability should not be implemented in the vicinity of the subreach breaks where geomorphic conditions tend to favor instability, as indicated by the longitudinal profiles. Reach scale slope and grain size distribution data provide an indication of the planform type that should be expected in each subreach based on alluvial channel classification methods (Section 4.1.3). Projects can be identified that are directed to restoring channel planform processes, either by converting from one planform to another, or by working with the dominant planform process, depending on the objectives and preferences of the Yakama Nation and the TAG.
The HEC‐RAS model of the Wapato Reach indicates the presence of three distinct large‐scale breaks in slope, and five distinct subreaches below Sunnyside Dam with relatively low vs. high frequency variability in thalweg depth (i.e., rugosity; Figure 4‐1). Breaks in slope in the upstream half of the Wapato Reach occur in the same general location as breaks in rugosity. The longitudinal elevation profile of the Wapato Reach is strongly concave upstream of about RM 69. The subreach between Wapato and Sunnyside dams is the most confined and has an average gradient equal to 0.0019, about 25% lower than downstream of Sunnyside Dam.
There is a distinct break point around RM 91.4, where the slope upstream is more than twice the slope downstream. Upstream of this location, the aerial photography record indicates visually that the channel exhibits a wandering to braiding behavior, whereas downstream the channel tends more to meander as a single thread. Below RM 75, the slope decreases by more than 75%, the grade levels out, and the channel generally migrates relatively little (see Section 4.1.3, Channel Migration Patterns). The break in slope around RM 98.0 is more subtle, and is distinguished more by the change in profile rugosity, from smoother upstream to rougher downstream. The slope break locations should be associated with locally increased deposition of bedload and increased potential for channel migration.
In general, the upstream‐downstream variation in bedload grain size distribution is consistent with the concavity of the reach, although there is an apparent coarsening in the downstream direction between approximately RM 92 and RM 89 (Figure 4‐1). This location corresponds to a region downstream of the substantial slope break observed at approximately RM 92. Substrates become finer again in the downstream direction, with the bedload composed of primarily sand and silt below approximately RM 70 in the low‐gradient subreach.

Yakama Nation Chapter 4
Geomorphic and Biological Assessment Results
Wapato Reach Assessment Report4‐2
April 2012ICF 00703.11
Figure 4‐1. Wapato Reach Longitudinal Thalweg and Water Surface Elevation Profiles (Top) and Variation in Selected Grain Size Distribution Percentiles (Bottom)
Notes: Subreach breaks are indicated as vertical dashed lines based on variation in the elevation and grain size distribution data. Locations of pebble counts collected in 2011 are indicated by the larger diameter circles; the smaller circles indicate U.S. Bureau of Reclamation data. Grain size measured on depositional bar surfaces.
0
20
40
60
80
100
120
140
160
180
60 65 70 75 80 85 90 95 100 105 110
Grain Size (m
m)
River Mile
D90
D50
Slope Breaks
Planform Transitions
Bed Rugosity Breaks
Sub‐reach 1 Sub‐reach 2
(Static/Meandering)
Sub‐reach 3
(Transitional:
Wandering/Confinedor Static/Meandering)
Sub‐reach 4
(Wandering
/ Confined)
Sub‐reach 5
(Braided)
600
650
700
750
800
850
900
950
60 65 70 75 80 85 90 95 100 105 110
Elevation (ft)
River Mile
Sunnyside Dam
Average Slope = 0.0002
Average Slope = 0.0009
Average Slope = 0.0022
Average Slope = 0.0025

Yakama Nation Chapter 4
Geomorphic and Biological Assessment Results
Wapato Reach Assessment Report4‐3
April 2012ICF 00703.11
4.1.2 Sediment Transport Modeling
Table 4‐1 summarizes the estimated magnitudes of flows at the Parker and Mabton gages, and their approximate duration for modeling as depicted in Figure 3‐2. Comparison of flood frequency with flow duration analysis results indicated an inconsistency existed between the two hydrologic characteristics at around the 2‐year flood level. For a given frequency of once every two years which corresponds to an exceedance frequency of approximately 0.14%, the estimated 2‐year peak flood magnitude is about 60% of the corresponding duration curve value. Typically, the maximum instantaneous discharge during a peak flow event should exceed the daily average value. The correspondence between flood magnitudes and flow duration‐based estimates for the 10‐, 25‐, and 50‐year events were more realistic in that context. The reason for the discrepancy at the 2‐year flood level was not determined; to do so would require additional, more extensive hydrologic analysis. It is suspected that the reason may reflect a manifestation of upriver flow regulation combined with potentially local floodplain connectivity effects, but more detailed analysis would be required to evaluate this hypothesis. To resolve this problem, the flow duration curve based value of the 2‐year event was used in the sediment transport modeling.
Table 4‐1. Simulation Flows Modeled in HEC‐RAS for the Sediment Transport Analysis
HEC‐RAS Profile Name Percent Exceedance Duration (days)
Flow at Parker (cfs)
Flow at Mabton (cfs)
PF1 5 478 8,170 9,350
PF2 1 300 13,600 15,100
PF3 0.5 44 16,000 17,200
PF4 0.4 30 16,600 17,700
PF5 0.3 16 17,500 18,500
PF6 0.2 14 19,100 19,800
PF7 0.14 (~2‐year flood) 12 22,100 21,800
PF8 0.1 11 23,600 24,000
PF9 0.03 (~10‐year flood) 5 33,200 28,700
PF10 0.01 (~25‐year flood) 2 45,000 37,400
PF11 0.005 (~50‐year flood) 1 54,300 44,000
cfs=cubic feet per second
The flood frequency analysis results for the Parker and Mabton gages indicated the existence of strong floodplain attenuation of floods within the reach, where for overbank floods greater than about the 2‐year event, the downriver peak discharge rates are substantially lower in magnitude than upriver (Table 4‐1). This observation led to definition of a flow change location within the HEC‐RAS model. Inspection of flood profiles predicted by the model indicated that the most significant storage occurred below approximately RM 80.0 (Figure 4‐2). Results are similar for the 100‐year flood event. There is a strong increase in overbank flooding predicted below about RM 80, within the subreach circled in Figure 4‐2. Thus the Parker gage‐based flows in Table 4‐1 were applied in the HEC‐RAS model upstream of there, and the Mabton gage‐based flows were applied downstream. This change in flows turned out to not affect the sediment transport modeling results, which indicated the analysis segments in the vicinity of this imposed flow break were roughly in equilibrium in terms of aggradation/degradation potential.

Yakama Nation Chapter 4
Geomorphic and Biological Assessment Results
Wapato Reach Assessment Report 4‐4
April 2012ICF 00703.11
Figure 4‐2. Modeled 10‐Year Flood Extent over the Floodplain along the Length of the Wapato Reach
Notes: Based on the HEC‐RAS model. Flow is from upper left to lower right.

Yakama Nation Chapter 4
Geomorphic and Biological Assessment Results
Wapato Reach Assessment Report4‐5
April 2012ICF 00703.11
Five geomorphic subreaches were identified based on the longitudinal profiles of bed elevation, slope, and grain size (Figure 4‐3). The pooled pebble count data were used to characterize grain size distributions for bedload transport modeling within each reach, which reflected a general coarsening in the upstream direction with a small reversal in trend in subreaches 3 and 4 (Figure 4‐3). Figure 4‐3 also depicts the range of Chinook salmon spawning habitat D50 values reported by Kondolf and Wolman (1993) in their review. The dominant bedload material appears suitable presently for Chinook salmon mainstem spawning in subreaches 2, 3, and 4.
Figure 4‐3. Wapato Reach Grain Size Distributions
Notes: Pebble counts collected on bedload bar deposits in the Wapato Reach of the Yakima River between Sunnyside Dam and the Mabton Bridge. Horizontal bar represents the range of D50 values reported by Kondolf and Wolman (1993) as suitable for mainstem spawning Chinook salmon (open bar).
The HEC‐RAS model shear stress predictions were associated with extreme variation in predicted bedload volume gains and losses across adjacent analysis segments at several locations. Smoothing using Equation (2) resulted in a more reasonable appearing plot of predicted bed elevation changes based on Parker’s (1990) bedload transport equation (Figure 4‐4). Figure A‐5 (Appendix A) depicts the corresponding spatial variation in aggradation and degradation potentials in the analysis reach. Streamwise variability in bedload transport potential is moderate to minor in most of the lower half of the Wapato Reach. Subreach 4 was associated with the greatest variability in upstream‐downstream imbalances in bedload transport potential (Figure 4‐4), whereas in subreach 5, the imbalances are highest near the upstream and downstream boundaries, and taper off near the lower end of the subreach.
0
10
20
30
40
50
60
70
80
90
100
0 50 100 150 200 250 300
Percent Finer
Grain Size (mm)
Sub‐reach 1
Sub‐reach 2
Sub‐reach 3
Sub‐reach 4
Sub‐reach 5

Yakama Nation Chapter 4
Geomorphic and Biological Assessment Results
Wapato Reach Assessment Report4‐6
April 2012ICF 00703.11
Figure 4‐4. Longitudinal Variation in Predicted Potential Bed Elevation Changes within Analysis Segments of the Wapato Reach over a 50‐Year Period
Notes: Potential bed elevation changes were determined by evaluation of HEC‐RAS hydraulic modeling output using Parker’s (1990) bedload transport equation.
To increase the likelihood of a success, restoration project types should be consistent with the general level of transport rate imbalances in each subreach or portion thereof. For example, instream wood structures could be concentrated in the lower half of the Wapato Reach and potentially in the lower third of subreach 5 where sediment transport imbalances and calculated channel migration rates are relatively low. Structures placed in the active channel would be more likely to function over a longer period and not be eroded away, filled in, or abandoned. Such projects should be avoided in subreach 4 where the risk of losing a structure or having its function rendered moot by sediment transport and channel migration processes. Conversely, side channel and floodplain channel connectivity projects should be concentrated in subreaches 4 and 5 where sediments are more likely to deposit and induce channel movement.
4.1.3 Channel Migration Patterns
The aerial photograph series used to digitize channel centerline and bank locations for the channel migration analysis (1947 [centerline only], 1971 [bank only], 1973 [centerline only], 1996, and 2009) provided a relatively periodic determination of channel location, with intervening periods associated with several large flood events occurring that exceeded the 2‐year event level (Figure 4‐5). Each aerial photograph can therefore be assumed to reflect the occurrence of at least one bar‐disturbing event after the preceding photographs were taken. The periods between each photo set are sufficiently long that long‐term trends in lateral channel stability may be reasonably inferred in the context of establishing geomorphic suitability for specific types of restoration projects. For example, projects that require relatively little channel migration in order to provide longer term benefits can be identified with greater confidence if there was little lateral erosion evident over a long period.
‐3
‐2
‐1
0
1
2
3
60 70 80 90 100 110
Net Potential Change in
Bed
Elevation
(ft/yr)
RM (Downstream Boundary of Analysis Segment)
Sub‐reach 1 Sub‐reach 2 Sub‐reach 3 Sub‐reach 4 Sub‐reach 5
Sunnyside Dam

Yakama Nation Chapter 4
Geomorphic and Biological Assessment Results
Wapato Reach Assessment Report4‐7
April 2012ICF 00703.11
Figure 4‐5. Annual Peak Flow Time Series Encompassing the Aerial Photography Date Range—USGS Gage at Parker (#12505000)
Note: Horizontal line denotes the approximate 2‐year flood level as determined using standard flood frequency analysis.
Much of the lower reach has exhibited relatively little channel migration (Appendix A, Figure A‐3). This trend is supported by the observation that the riparian vegetation along much of the river banks is composed of mature trees that appear to be relatively stable, especially lower in the reach, with a clear trend of progressively increasing cottonwood diameters with distance downstream (Elliott 2011). Subreaches and locations with greatest migration history generally coincide with analysis segments with greatest sediment transport rate imbalances.
Empirically based channel geometry relationships imply that the subreaches below Sunnyside Dam should follow mostly a single channel, meandering tendency rather than braided (Table 4‐2). This is based on relationships between estimates of the characteristic bankfull or channel forming discharge, slope and grain size. While potentially an over‐estimate (e.g., Leopold et al. 1995), using the 2‐year flood magnitude as a surrogate for the bankfull discharge only reinforces this implication (i.e., that a smaller magnitude flow is associated with increased tendency toward a single channel).
This implication is important, because it can then be inferred that the braided and wandering subreaches between Sunnyside Dam and RM 92 could be transformed to a single dominant channel with fewer active side channels depending on the restoration action. Such an approach would not eliminate side channels, but would rather seek to transform areas that currently have many low flow side channels into a planform with fewer, deeper channels engaged at higher flows. Such an approach could address potentially poor water quality and habitat conditions for juvenile salmonids in the shallow low flow side channels by converting them to deeper, presumably cooler channels with better habitat conditions.
0
10000
20000
30000
40000
50000
60000
1935 1945 1955 1965 1975 1985 1995 2005 2015
Peak Instan
taneo
us Flow (cfs)
Parker Gage
Mabton Gage
2‐yr Flood, Parker
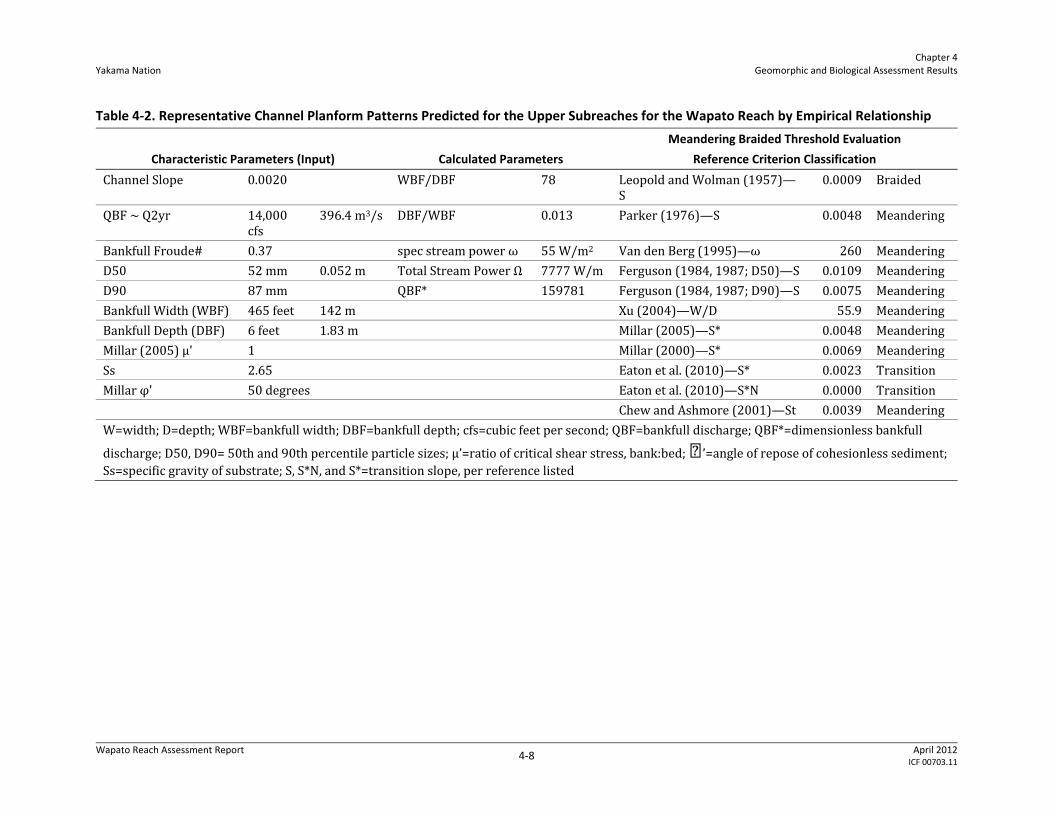
Yakama Nation Chapter 4
Geomorphic and Biological Assessment Results
Wapato Reach Assessment Report 4‐8
April 2012ICF 00703.11
Table 4‐2. Representative Channel Planform Patterns Predicted for the Upper Subreaches for the Wapato Reach by Empirical Relationship
Characteristic Parameters (Input) Calculated Parameters
Meandering Braided Threshold Evaluation
Reference Criterion Classification
Channel Slope 0.0020 WBF/DBF 78 Leopold and Wolman (1957)—S
0.0009 Braided
QBF ~ Q2yr 14,000 cfs
396.4 m3/s DBF/WBF 0.013 Parker (1976)—S 0.0048 Meandering
Bankfull Froude# 0.37 spec stream power ω 55 W/m2 Van den Berg (1995)—ω 260 Meandering
D50 52 mm 0.052 m Total Stream Power Ω 7777 W/m Ferguson (1984, 1987; D50)—S 0.0109 Meandering
D90 87 mm QBF* 159781 Ferguson (1984, 1987; D90)—S 0.0075 Meandering
Bankfull Width (WBF) 465 feet 142 m Xu (2004)—W/D 55.9 Meandering
Bankfull Depth (DBF) 6 feet 1.83 m Millar (2005)—S* 0.0048 Meandering
Millar (2005) μ' 1 Millar (2000)—S* 0.0069 Meandering
Ss 2.65 Eaton et al. (2010)—S* 0.0023 Transition
Millar φ' 50 degrees Eaton et al. (2010)—S*N 0.0000 Transition
Chew and Ashmore (2001)—St 0.0039 Meandering
W=width; D=depth; WBF=bankfull width; DBF=bankfull depth; cfs=cubic feet per second; QBF=bankfull discharge; QBF*=dimensionless bankfull
discharge; D50, D90= 50th and 90th percentile particle sizes; µ’=ratio of critical shear stress, bank:bed; ’=angle of repose of cohesionless sediment; Ss=specific gravity of substrate; S, S*N, and S*=transition slope, per reference listed

Yakama Nation Chapter 4
Geomorphic and Biological Assessment Results
Wapato Reach Assessment Report4‐9
April 2012ICF 00703.11
There are potentially two reasons for the current braided state.
1. The preflow regulation bankfull discharge magnitude was sufficiently large to maintain a braided or wandering channel form.
2. Flow regulation reduced spring and summer water levels to the extent that it affected riparian vegetation, which when removed or reduced in density can lead to a single thread channel transitioning to a braided one depending on slope and bankfull discharge (e.g., Millar 2000).
These observations need to be considered during restoration planning. For example, an institutional decision may need to be made as to whether to restore the upper subreaches according to present‐day flow regime, or to a desired future flow regime.
In either case, prescribing actions that facilitate stabilization and revegetation of braided gravel bars, and their conversion through fortification and deposition to more stable vegetated islands would be expected to change the river planform from a wide, shallow, and unstable braided channel to a more stable, deeper, and narrower dominant channel. (e.g., Leopold et al. 1995; Millar 2000). This would increase the suitability of the main channel as habitat for adult and juvenile salmon. An additional benefit that may be realized is where the resulting increased shear stresses in the main channel would be associated with increased sediment transport capacity. This increase would likely have the effect of flushing more fines from the bed. Their increased suspension in the water column would be expected to increase the opportunity for deposition over shallower surfaces with reduced shear stresses (i.e., on bars and the floodplain) Thus, conversion of the channel planform from a braided to a primary dominant channel would have the effect of redirecting fine sediments from the channel and storing them on the floodplain, with the potential benefit of improving spawning habitat quality downriver.
Additional implications of braided channel conditions and the potential biological benefits from restoration actions focused on altering the braided planform are described in Sections 4.2 and 6.2 respectively.
4.1.4 Floodplain and Side Channel Connectivity
Figure A‐6 (Appendix A) depicts the delineated floodplain and side channels and the associated general level of flood engagement based on inlet control elevation compared with predicted water surface elevation. The results are based on LiDAR data collected in 2000, and hydraulic data collected circa 2004 to 2005. Specific ratings may change in the future depending on flooding and future channel migration. It is not feasible to update the ratings each year after flooding for this project scope, however the ratings resulting from this analysis can still be used to assess general restoration potential (or, conversely, avulsion risk) as described below, and provide an indication of relative differences in avulsion potential for possibly the next 10 or more years.
The locations of mapped bank revetments and levees are also depicted in Figure A‐6 (Appendix A). Where an inlet channel crosses a levee, the depicted flood rating will generally be higher than it would be if the levee were to be removed. Field surveys at each such inlet should indicate the locations where the rating would change most significantly with levee removal or breaching. The flood level ratings cannot be used to predict exactly where the channel will move during future storm events, but can be used to prioritize floodplain connectivity alternatives or assess potential for avulsion in association with engineered in‐channel habitat structures. Channels that become engaged at the 2‐year flood level have a higher likelihood of providing higher quality off‐channel

Yakama Nation Chapter 4
Geomorphic and Biological Assessment Results
Wapato Reach Assessment Report4‐10
April 2012ICF 00703.11
habitat than ones that are become connected at the 10‐year flood level. They also have highest potential for avulsion. Channels that become engaged at the 100‐year flood level are not recommended for floodplain connectivity projects at this time because the cost of restoration would be expected to be very high.
However, such locations would probably be safe from avulsion if in‐channel structures are prescribed. Also, the farther a floodplain channel is situated from the main channel, and the longer the total flow path, the lower the long‐term avulsion risk.
4.2 Results from Biological Assessment
4.2.1 Evaluation of Habitat Conditions Affecting Salmonid Survival
The biological assessment focused on characterizing the key environmental attributes affecting salmon and steelhead survival in the Wapato Reach. The analysis used the EDT model to partition environmental effects into survival factors by species and life stages. The assessment was organized around species and life stages, because the effect of environmental conditions on survival differs depending on how and when the reach is used by a particular species.
A representative population from the Yakima EDT model was used for each species. Life‐history patterns were reviewed and modified as necessary to represent the patterns described in Section 2.3, Focal Salmonid Species, Figure 2‐1, and Appendix D. The following sections describe, by species and race, the primary life stages relevant to the Wapato Reach and the effect of current environmental conditions on survival. These results are a partial extraction of results from the EDT model for each life stage and the model reaches that make up the Wapato Reach. Survival factors reported are relative to benchmark conditions (i.e., the analysis compares current conditions to ideal conditions and does not attempt to compare to an assumed historic condition). Key habitat quantity is reported as the quantity of habitat used by the species and life stages affected by flow (i.e., wetted channel area) and change in habitat composition. In the case of key habitat, the comparison was to an assumed historical condition for the reach.
Predation was a common survival factor affecting juvenile survival in the reach. This predation loss is not the same as mortality assumed at the Wapato and Sunnyside Dam bypass systems. While that mortality includes a predation component, it was attributed to the dam and bypass structure in EDT and is discussed separately (Section 4.2.3, Evaluation of Bypass Mortality Conditions Affecting Salmonid Survival). Predation here is the consequence of the amount of habitat structure in the reach affecting the vulnerability of juvenile salmonids to predators.
Survival factors shown in Figures 4‐6 through 4‐9 and Figure 4‐11 encompass the full suite of detailed environmental attributes described through the EDT process. The factors represent the reductions to the benchmark survival due to local conditions along the life history trajectory for multivariate attributes such as sediment, temperature, and channel form. Survival factors are defined by multivariate relationships among the environmental attributes in EDT and species—life stage sensitivities. In other words, these factors are the result of assumptions relating environmental conditions as a series of relationships or “rules” describing how conditions affect life stage survival. For the Wapato Reach analysis, effect is measured as the percent change in the

Yakama Nation Chapter 4
Geomorphic and Biological Assessment Results
Wapato Reach Assessment Report4‐11
April 2012ICF 00703.11
survival factor relative to benchmark (i.e., optimal survival) conditions. Darker circles indicate a greater negative effect on survival due to environmental attributes describing that factor. For those factors describing habitat quality (i.e., channel stability through temperature), dark circles represent a loss of 5% or greater and light circles a loss less than 5%. Survival factors are multiplicative and the combination of multiple small (“light shaded”) effects can have a large effect on survival. The factor ‘Key Habitat Quantity’ represents the loss of habitat quantity relative to the historic condition through change in habitat composition, loss of floodplain habitat, and change in wetted area due to flow management. The same criteria were applied to distinguish dark and light circles. Finally, ‘Overall Survival Loss’ shown is the combination of all survival factors on species and life stage survival.
Figures 4‐6 through 4‐9 and Figure 4‐11 are intended to identify the extent that a combination of environmental attributes has been altered, and how this change is perceived by the species and life stage with respect to survival.
4.2.1.1 Fall Chinook
Fall Chinook are the most dependent on the Wapato Reach of all species. Spawning occurs throughout the reach, with peak spawning in late October and early November (Mueller and Child 2011). The highest redd count in 2010 was the section of river from Granger to Zillah (approximately subreach 3 in this assessment). The dominant bedload material appears to be presently more suitable for Chinook salmon mainstem spawning in subreaches 2, 3, and 4. Fall Chinook were also observed spawning in subreach 5 in 2010, but redd distribution is patchy suggesting that suitable spawning areas are available, but are not the dominant bedload material. Juvenile fall Chinook emerge from the gravel in March and April and this analysis assumes that all have left the reach by late June, thus avoiding warmer water temperatures in July and August.
Factors affecting survival of fall Chinook are fine sediment during egg incubation, and suspended sediment suspended sediment, loss of key habitat, predation, and flow affecting subyearling migrants (Figure 4‐6).

Yakama Nation Chapter 4
Geomorphic and Biological Assessment Results
Wapato Reach Assessment Report4‐12
April 2012ICF 00703.11
Figure 4‐6. Fall Chinook Survival Factors
4.2.1.2 Summer Chinook
Summer Chinook spawning includes the subreach 5 and extends upstream of Union Gap. The Wapato Reach is used primary for adult migration and juvenile rearing during seaward migration.
Temperature can be a significant factor affecting survival of adults and juveniles in the reach. The EDT analysis is based on a combination of life‐history patterns developed as part of planning for summer Chinook reintroduction to the Yakima River basin. These patterns assume that adult summer Chinook either enter the Yakima River by the end of June and move upstream to hold through the summer before spawning or hold in the mainstem Columbia River until September and then move rapidly upstream to spawn. Juvenile timing in the analysis was also constrained to force all fish to leave by the end of June.
Consequently, the EDT analysis summarized in Figure 4‐7 shows a moderate effect of temperature in the Wapato Reach on survival of adults and juveniles. The effect of temperature on survival in this scenario is minimized by the assumption that the population will adapt to a set of life‐history patterns that avoid the warmest months. In addition to temperature, fine sediment during egg incubation, suspended sediment affecting juveniles, and predation on juveniles are the primary factors affecting survival of subyearling migrants.
Fall Chinook ‐ Current Condition
Life Stage
Overall Survival Loss
Factors Effect on Life Stage Survival
Channel stability # # #
Chemicals # # #
Competition (w/ hatchery) # # #
Flow # # #
Food # # #
Habitat diversity # # #
Harassment/poaching # # #
Predation # # #
Fine Sediment & Turbidity # # #
Temperature # # #
Key habitat quantity # # #
Adult migrant/
prespwn Egg incubation
Subyearling
juvenile migrants

Yakama Nation Chapter 4
Geomorphic and Biological Assessment Results
Wapato Reach Assessment Report4‐13
April 2012ICF 00703.11
Figure 4‐7. Summer Chinook Survival Factors
We made an additional analysis extending juvenile migration into July and early August to evaluate survival conditions into the summer. This analysis was used primarily to evaluate the effects of low flow and summer temperatures on summer Chinook migrating downstream in July. As expected, survival indices of subyearling summer Chinook as computed at Prosser Dam were much lower for juveniles moving downstream in late June and July (Figure 4‐8). This is consistent with our assumptions that summer Chinook moving through the Wapato Reach must leave the system by June to survive.
Summer Chinook ‐ Current Condition
Life Stage
Overall Survival Loss
Factors Effect on Life Stage Survival
Channel stability # # #
Chemicals # # #
Competition (w/ hatchery) # # #
Flow # # #
Food # # #
Habitat diversity # # #
Harassment/poaching # # #
Predation # # #
Fine Sediment & Turbidity # # #
Temperature # # #
Key habitat quantity # # #
Adult migrant/
prespwn Egg incubation
Subyearling
juvenile migrants

Yakama Nation Chapter 4
Geomorphic and Biological Assessment Results
Wapato Reach Assessment Report4‐14
April 2012ICF 00703.11
Figure 4‐8. Summer Chinook Life‐History Performance across a Range of Sub‐Yearly Timing at Prosser Dam (Downstream of the Wapato Reach)
4.2.1.3 Spring Chinook
Spring Chinook primarily use the reach during the adult life stage during spring migration and as migrating smolts in the spring (Figure 4‐9). Adult holding occurs upstream of the Wapato Reach and generally spring Chinook are upstream of the Wapato Reach before temperatures are warm. The EDT model picked up a slight loss in adult survival from temperature, habitat diversity, and chemicals (i.e., toxicants not attributed to any particular source). The primary factor affecting smolt survival is predation. This is the effect of predator abundance and distribution in the reach and habitat conditions affecting smolt vulnerability to predators.
Juvenile spring Chinook also move downstream into the reach in the fall to overwinter or continue to migrate downstream past Prosser Dam as “winter migrants”. Multiple factors within the reach are affecting this life stage. The loss of habitat quantity is the most significant.
0.0
10.0
20.0
30.0
40.0
50.0
60.0
70.0
80.0
4/14 5/4 5/24 6/13 7/3 7/23 8/12 9/1
Perform
ance In
dex
Juvenile Timing @ Prosser Dam

Yakama Nation Chapter 4
Geomorphic and Biological Assessment Results
Wapato Reach Assessment Report4‐15
April 2012ICF 00703.11
Figure 4‐9. Spring Chinook Survival Factors
4.2.1.4 Summer Steelhead
Summer steelhead primarily use the reach as adults for migration and holding and as migrating smolts in the spring (Figure 4‐10). Adults enter the reach as temperatures are dropping in September. Environmental effects on adults are slight; the model included a slight effect of chemicals (i.e., toxicants not attributed to any particular source) and harassment while holding. Smolts are moving through the reach in late spring and temperature is starting to affect survival in the lower portion of the reach by May. Predation is another factor affecting smolt survival. Predation losses are the combination of predator abundance and behavior and habitat conditions affecting smolt vulnerability to predators. Suspended sediment during the spring is also affecting survival of smolts.
In addition to adult and smolt use of the reach, we evaluated survival conditions during juvenile summer residence in their second summer (fingerlings) and juvenile overwinter survival conditions (including winter migrants). Habitat diversity is a factor for both of these life stages. Habitat diversity effect is a combination of low amounts of instream wood in sections of the reach, poor riparian condition throughout, and channel bank hardening in places. Temperature did not play a large role during summer residence, because the model assumed summer rearing mostly occurs in the upper portion of the Wapato Reach where temperatures are not as warm as further downstream.
Spring Chinook ‐ Current Condition
Life Stage
Overall Survival Loss
Factors Effect on Life Stage Survival
Channel stability
Chemicals
Competition (w/ hatchery) #
Flow #
Food #
Habitat diversity #
Harassment/poaching #
Predation #
Fine Sediment & Turbidity #
Temperature #
Key habitat quantity #
Adult migrant/
prespwn
Juvenile
overwinter &
winter migrants Smolt migrants

Yakama Nation Chapter 4
Geomorphic and Biological Assessment Results
Wapato Reach Assessment Report4‐16
April 2012ICF 00703.11
Figure 4‐10. Summer Steelhead Survival Factors
4.2.1.5 Coho
Coho are likely the species in this assessment least dependent on the Wapato Reach. The YKFP is evaluating the reintroduction of coho into the Upper Yakima and Naches Rivers. These locations are well upstream of the Wapato Reach. Although the movement of juvenile coho from summer rearing areas to overwintering habitat 100 miles or more downstream has been documented (Lestelle 2007), the overwintering habits of Yakima River coho in the Wapato Reach are largely unknown. Our analysis of the current condition and projects (Section 6.1, Recommended Projects) included adults migrating through the reach, juvenile coho utilizing the Wapato Reach for overwinter residence, and yearling smolt outmigrants.
Not surprisingly, adult coho survival is largely unaffected by conditions in Wapato Reach (Figure 4‐11). Overwinter survival of juveniles is affected by the quantity of habitat, and habitat diversity. Other factors are affecting survival shown, but generally the effect is slight. The analysis assumes that predation is a factor affecting smolt survival. Suspended sediment also is affecting survival of smolts.
Summer Steelhead ‐ Current Condition
Life Stage
Overall Survival Loss
Factors Effect on Life Stage Survival
Channel stability
Chemicals
Competition (w/ hatchery) #
Flow #
Food #
Habitat diversity #
Harassment/poaching #
Predation #
Fine Sediment & Turbidity #
Temperature #
Key habitat quantity #
Adult migrant/
prespwn
Juvenile
summer
residence Smolt migrants
Juvenile
overwinter &
winter migrant

Yakama Nation Chapter 4
Geomorphic and Biological Assessment Results
Wapato Reach Assessment Report4‐17
April 2012ICF 00703.11
Figure 4‐11. Coho Survival Factors
4.2.1.6 Sockeye
NMFS studied the feasibility of restoring sockeye to the Yakima Basin by releasing marked juveniles from 1987 to 1993 (Flagg et al. 2000). In recent years the Yakama Nation and Reclamation have developed a plan to restore sockeye to the Yakima River Basin (Johnston et al. 2008). The first return of adults will be in 2012 from smolts that emigrated in 2011.
A version of the EDT model has not been developed for sockeye. Our analysis of conditions affecting sockeye is largely based on discussions with the TAG and a general understanding of sockeye life history. Sockeye use of the Wapato Reach is restricted to adults migrating in late spring and early summer and smolts in April. Temperature will likely have a moderate to strong effect on adult sockeye survival. Because sockeye migrate rapidly when conditions are favorable, it is unlikely other factors will be affecting survival. Smolt survival through the Wapato Reach will likely be affected by the same factors affecting coho and spring Chinook yearling smolts (i.e., predation and, to a lesser extent, turbidity).
4.2.2 Evaluation of Predation Conditions Affecting Salmonid Survival
The YKFP monitoring program is the main source for evaluating primary avian and fish predators on juvenile salmonids in the Yakima Basin. Appendix B provides a detailed presentation of our synthesis of information from these studies with a specific focus on the Wapato Reach and approximate estimates of predation rates and total salmonids consumed within the reach.
Coho ‐ Current Condition
Life Stage
Overall Survival Loss
Factors Effect on Life Stage Survival
Channel stability # # #
Chemicals # # #
Competition (w/ hatchery) # # #
Flow # # #
Food # # #
Habitat diversity # # #
Harassment/poaching # # #
Predation # # #
Fine Sediment & Turbidity # # #
Temperature # # #
Key habitat quantity # # #
Adult migrant/
prespwn
Juvenile
overwinter Smolt migrants

Yakama Nation Chapter 4
Geomorphic and Biological Assessment Results
Wapato Reach Assessment Report4‐18
April 2012ICF 00703.11
4.2.2.1 Avian Predators
The primary avian predators are American white pelicans (Pelecanus erythrorhynchos), double crested cormorants (Phalacrocorax auritus), great blue herons (Ardea herodias) and common mergansers (Mergus merganser) (Yakima/Klickitat Fisheries Project 2011). In virtually every year since white pelicans reentered the Yakima Basin in 2000, the Wapato Reach has supported more pelicans and herons, and a higher total number of piscivorous birds across all species, than any other reach in the Yakima Basin (Yakima/Klickitat Fisheries Project 2011). Data collected as part of the YKFP monitoring program from the Yakima Basin and the Wapato Reach specifically, suggests that piscivorous birds are capable of substantial impacts on juvenile salmonids.
The timing of pelican appearance in the Yakima River basin, as well as their abundance, is inversely correlated with river flow (Yakima/Klickitat Fisheries Project 2011). Furthermore, pelicans are more abundant in years of low flow. This relationship is probably based on an increase in foraging efficiency at low flows attributable to the exposure of mid‐river rocks for loafing/perching, increased water clarity and prey visibility, and concentration of prey in smaller volumes of shallower water. The decrease of stream depth may be especially important in directing pelican foraging to smolts, because white pelicans do not dive for their prey, but simply stick their heads under water and try to capture fish within striking range.
An inverse relationship between flow and predation rates also seems to be the pattern for herons based on consumption of PIT‐tagged smolts by herons in the Selah rookery and the consumption of PIT‐tagged steelhead by herons nesting in the Toppenish Wildlife Reserve (Yakima/Klickitat Fisheries Project 2010).
The diet of cormorants inside the Yakima River basin is basically unknown. In the Columbia River, they have been shown to feed intensively on hatchery fall Chinook, despite their small size (Sebring et al. 2009). There are one, and at times two, cormorant breeding colonies inside the Yakima River basin. One colony became established at the Satus Wildlife Area in 2008, and cormorants have periodically partially displaced herons at the Selah rookery over the past ten years. Since the late 1990s, cormorants have been frequently observed feeding in the Wapato Reach and the lower Yakima River (Yakima/Klickitat Fisheries Project 2009).
Although mergansers are the dominant piscivorous bird in the upper river, they are the fourth most abundant piscivorous bird in the Wapato Reach (Yakima/Klickitat Fisheries Project 2008). Common mergansers are known to feed on salmon smolts, to congregate in hatchery release areas (Wood 1985), and to take advantage of fish disoriented by dams (Timken and Anderson 1969).
Based on mean monthly bird densities (number per km) within the Wapato Reach reported in Yakama Nation river reach surveys, the total number of bird days2 for the top four piscivorous birds in the Wapato Reach has ranged from 13,428 (2007) to 89,232 (2005) over the years 2003‐2007 and 2009, and was dominated by pelicans. Assuming a 5% smolt composition in the diet of pelicans and herons, 11% for mergansers and 20% for cormorants, we calculate a range of total smolt morality due to avian predation between approximately 5% and slightly over 30% for the years 2003 to 2009 (analysis excluded incomplete data from 2008). This rate is calculated as the number
2 Bird days are a measure of the number of days a smolt is exposed to avian predation. The number of bird days was estimated by calculating the sum of the product of 1) the mean bird density (birds/km) in the two survey areas of the YKFP avian monitoring program within the Wapato Reach, 2) the length (in km) of each survey area, and 3) the number of days of the smolt outmigration.

Yakama Nation Chapter 4
Geomorphic and Biological Assessment Results
Wapato Reach Assessment Report4‐19
April 2012ICF 00703.11
of smolts consumed divided by the total of the number consumed and the number of smolts estimated to have passed Prosser Dam. The range in values is due to differences among years in the abundance of birds and the number of smolts estimated to have passed Prosser Dam.
Although these numbers are not definitive, they do suggest that avian predators can be a substantial source of mortality in the reach. More importantly for the purpose of this assessment, the data suggests that predation losses may be reduced by providing deeper habitat features, more of these features, and more in‐channel structure to allow salmonids to avoid predators.
4.2.2.2 Piscivorous Predators
Northern pikeminnow (Pteichocheilus oregonensus) is the dominant piscivorous fish species. The distribution of pikeminnow may be due to differences in habitat features. Dunnigan and Lamebull (2000) noted that larger pikeminnow were most numerous in reaches characterized by an abundance of “back‐eddy/shear type habitat.” They noted that pikeminnow have been shown to prefer low‐velocity habitat in close proximity to higher velocity habitat. Dunnigan and Lamebull (2000) also reported that the number pikeminnow per kilometer immediately below Sunnyside Dam was two to four times higher than was observed in downstream open‐river sites near Granger and Toppenish.
Using the same methods as Dunnigan and Lamebull (2000), we estimate mortality due to pikeminnow predation in the Wapato Reach to range between approximately 10% and 30% for the years 2006 through 2008. An effect of flow on pikeminnow predation rate has not been shown in the Yakima River.
The ability to affect pikeminnow predation via habitat restoration projects in the Wapato Reach is unlikely to be as effective as other, more direct methods. In fact, some of the projects evaluated in this assessment could increase the amount of deep water habitat potentially used by pikeminnow. A predator control program in the reach and at the dams or modification of the juvenile bypass systems at Sunnyside and Wapato Dams to reduce pikeminnow foraging efficiency at the bypass outfalls are methods likely to be more effective on pikeminnow predation.
4.2.3 Evaluation of Bypass Mortality Conditions Affecting Salmonid Survival
Bypass facilities at the Wapato and Sunnyside Diversion Dams have the same general layout: the dam and upstream pool, an irrigation diversion canal at one end of the dam, and a set of rotary drum screens diverting juvenile fish into a bypass pipe that returns them to the river in an outfall mixing zone downstream of the dam. At the peak of the irrigation season (July–September) and when flows are lowest, each facility diverts from 1,000 to 2,000 cubic feet per second, or from 70 to over 80% of the flow approaching the upstream dam.
In 2009 and 2010, the Yakama Nation conducted a study to estimate differential survival fish encountering traversing the bypass systems at Sunnyside Dam (Watson 2011). The study consisted of multiple paired releases of PIT‐tagged yearling and subyearling hatchery Chinook. In each paired release, one group of fish was released in the headgates of the diversion canal and another group released downstream of the dam in the bypass outfall. Bypass survival was estimated by the ratio of detection rates at McNary Dam of headgate and to outfall fish for each paired release. Differential survival was assumed to be the consequence of encountering passing through the bypass system.

Yakama Nation Chapter 4
Geomorphic and Biological Assessment Results
Wapato Reach Assessment Report4‐20
April 2012ICF 00703.11
The study assumed that fish from both release groups were comingled (i.e., “well‐mixed”) downstream of the dam at which they were released.
Results from this study were used to update survival rates in the EDT model at Sunnyside and Wapato Dam (bypass survival rates from Sunnyside Dam were assumed to also apply to Wapato Dam). Watson (2011) also provided estimates for bypass survival at Prosser and Roza Dams, and EDT assumptions parameters were revised for these dams as well. Survival rate assumptions in EDT are for all fish encountering the dam. The proportion of fish encountering the bypass system was based on the percent flow diverted for each dam. Fish not encountering the bypass system were assumed to have a dam survival of 1.0. Percent flow diverted was based on monthly averages was the month average in for 2009 and 2010.
For this assessment, the EDT model used the salmonid dam survival rates shown in Table 4‐3. Because a similar study has not been performed for coho and steelhead, smolt survival rates for those species were based on the yearling Chinook survival estimates.

Yakama Nation Chapter 4
Geomorphic and Biological Assessment Results
Wapato Reach Assessment Report 4‐21
April 2012ICF 00703.11
Table 4‐3. Revised Dam Survival Rates for All Salmonid Species Analyzed in the EDT Model for the Wapato Reach Assessment
Life‐History Stage Jan Feb Mar Apr May Jun Jul Aug Sep Oct Nov Dec
Roza Dam
Subyearling 1.000 1.000 1.000 1.000 0.970 0.984 0.971 0.963 1.000 1.000 1.000 1.000
Yearling 1.000 1.000 0.976 0.947 0.935 0.885 0.842 0.849 0.882 0.944 1.000 1.000
Wapato Dam
Subyearling 1.000 1.000 1.000 1.000 0.977 0.990 0.879 0.877 1.000 1.000 1.000 1.000
Yearling 1.000 1.000 1.000 1.000 0.952 0.859 0.740 0.733 0.852 0.949 1.000 1.000
Sunnyside Dam
Subyearling 1.000 1.000 1.000 1.000 0.976 0.988 0.766 0.742 0.916 1.000 1.000 1.000
Yearling 1.000 1.000 1.000 1.000 0.949 0.830 0.630 0.611 0.758 0.904 1.000 1.000
Prosser Dam
Subyearling 1.000 1.000 1.000 1.000 1.000 0.866 0.583 0.565 0.733 1.000 1.000 1.000
Yearling 1.000 1.000 1.000 0.941 0.903 0.750 0.504 0.489 0.660 0.858 1.000 1.000


Wapato Reach Assessment Report5‐1
April 2012ICF 00703.11
Chapter 5 Restoration Objectives and Project Locations
Restoration objectives and locations to realize these objectives are based on the physical and biological conditions as described in Chapter 4, Geomorphic and Biological Assessment Results. The geomorphic assessment of existing conditions, as presented in Section 4.1, concluded that the alluvial channel subreaches below Sunnyside Dam should generally be a meandering, single channel, rather than the braided/wandering channel observed. The current channel planform may be due to a preflow regulation bank full discharge that was sufficiently large to maintain this braided/wandering channel planform, and/or to an effect of reduced spring and summer water levels such that riparian vegetation was lost causing the channel to transition to a braided/wandering planform. The biological assessment (Section 4.2) concluded that the key environmental attributes affecting salmon and steelhead survival in the reach were habitat quantity, habitat diversity, fine sediment/turbidity, and predation. Water temperature during summer has a strong influence on life‐history expression, affecting our assumptions of timing patterns of adult summer Chinook and sockeye, and juvenile summer and fall Chinook. These attributes are particularly affecting survival of juveniles and smolts in the reach. Therefore, restoration objectives should address opportunities to improve the physical conditions in the project area that can positively affect juvenile and smolt survival.
5.1 Restoration Objectives A suite of seven objectives were formulated to provide salmon and steelhead juveniles and smolts with increased habitat quantity and diversity, reduced fine sediment/turbidity, and habitat conducive to avoiding predation. The suite of objectives (and ultimately the potential project locations) were based on the overall goal of transforming the currently braided/wandering planform and related low flow channels (between approximately Sunnyside Dam and RM 92) to a single, meandering channel planform with secondary high flow channels and related floodplain habitats. This would provide better and more diverse habitat for juvenile salmonids. Increased habitat diversity may also help juveniles avoid avian and pikeminnow predation and thus increase survival for juveniles to adults. Secondary channels engaged at high flows would also promote riparian development and floodplain wetlands which also create habitat diversity and provide floodplain storage, water quality improvement and food web functions that benefit salmonids.
These seven objectives were specifically designed to follow the Roni et al. (2002) hierarchical framework for project prioritization, which emphasizes protection and process‐based restoration as the highest priorities, followed by habitat enhancement efforts (e.g., placement of instream wood, riparian revegetation). This hierarchical framework has also been used to structure the presentation of potential project locations, additional screening and field evaluation, and recommended projects in the remainder of Chapter 5 and in Chapter 6 of this report.

Yakama Nation Chapter 5
Restoration Objectives and Project Locations
Wapato Reach Assessment Report5‐2
April 2012ICF 00703.11
The Wapato Reach restoration objectives used to identify potential project locations and project types are:
Protection objective:
1. Protect parcels with moderate to high habitat value and potentially at risk for conversion, development or loss of function.
Process‐based restoration objectives:
2. Encourage the development of a single, dominant meandering or mildly braided planform by converting broad gravel bars to vegetated channel islands.
3. Establish or promote engagement of side channels3 across a wide range of flows.
4. Establish or promote the engagement of floodplain4 channels across a wide range of flows.
5. Remove rip rap or bank hardening.
Habitat enhancement objectives:
6. Install instream wood.
7. Conduct riparian revegetation.
5.2 Identification of Potential Locations to Meet the Objectives
Once the seven restoration objectives outlined above were determined, the geomorphic attributes of each of the five subreaches (as summarized in Appendix C) were then used to determine locations where projects which would meet these restoration objectives could be located.
5.2.1 Protection Locations
Protection of parcels with moderate to high habitat value and potentially at risk of conversion was included as an objective, following the Roni et al. (2002) hierarchy of preserving and protecting areas where landscape or reach‐scale processes are functional and moderate to high habitat value exists.
Actions that support the protection objective include:
Direct purchase or fee acquisition of a property that exhibit the features and resources that meet the high priority restoration objectives, or of an area at risk of further degradation through development.
Obtaining a conservation easement from a landowner in order to eliminate agricultural uses or grazing within a riparian buffer zone.
3 A side channel is an active stream channel separated from the main channel by a vegetated or otherwise stable island. The islands tend to be large relative to the size of the channels. Some side channels carry surface water continuously, from the point of divergence to the point of return, at a given flow, while others become intermittent (are dry at some point(s) between divergence and return) at the same flow. 4 Floodplain channels are ponds, groundwater channels, overflow channels and seasonally flooded wetlands.

Yakama Nation Chapter 5
Restoration Objectives and Project Locations
Wapato Reach Assessment Report5‐3
April 2012ICF 00703.11
The purpose of including a protection objective is also to facilitate the identification (and ultimately protection) of areas that currently exhibit features and resources which support the other restoration objectives and that may be at risk of losing these features through land development or conversion. The process of identifying potential locations for protection focused on the three restoration objectives that would most benefit from protection of currently functional areas.
Establish or promote engagement of side channels across a wide range of flows.
Establish or promote the engagement of floodplain channels across a wide range of flows.
Conduct riparian revegetation.
Priority protection locations were identified through a GIS‐based evaluation using existing Wapato Reach data sources including the riparian vegetation maps digitized by CWU staff (Section 3.4.4, Approach to Assessing Riparian Conditions) and floodplain channels identified as part of the geomorphic assessment (Sections 4.1.3 and 4.1.4). Since the primary method used to protect and preserve property is land acquisition or conservation easements, county parcels were used as the primary unit of analysis. For each parcel within the Wapato Reach, a total habitat value was determined based on the total acreage of existing riparian vegetation and the length of floodplain channels that could be engaged at 2‐ or 10‐year flows were determined.
Analysis and results related to potential priority locations for protection are presented in a separate document.
5.2.2 Process‐based Habitat Restoration Locations The four process‐based habitat restoration objectives were used to determine project locations consistent with the riverine processes structuring the Wapato Reach.
Locations best suited for such projects were identified based on their geomorphic attributes through the “use queries” in an ACCESS database. The database queries were designed to identify the specific analysis segments (i.e., locations) along the reach that exhibited a specific suite of geomorphic attributes (e.g., channel migration rate, channel planform, channel bed stability) conducive to meeting each of the four restoration objectives. The specific suite of geomorphic attributes used in the ACCESS database to identify project locations consistent with accomplishing each objective are described below and presented in detail in Appendix C. Figure A‐7 (Appendix A) illustrates the locations identified through this process as potentially suited to each of the four process‐based habitat restoration objectives.
The ACCESS queries were structured based on geomorphic attributes, rather than survival factors, because of the spatial overlap in use of the reach by all the salmon and steelhead species and life‐history stages. However, the survival factors influencing the salmon and steelhead species and the consequent degree and mechanism of effect of each objective was considered when subsequently determining the opportunity each identified location presented (see Section 5.3.2, ProcessBased Habitat Restoration Locations).

Yakama Nation Chapter 5
Restoration Objectives and Project Locations
Wapato Reach Assessment Report5‐4
April 2012ICF 00703.11
5.2.2.1 Locations Appropriate for Reducing Braiding by Establishing Vegetated Channel Islands
Geomorphically Appropriate Attributes
Table 5‐1 presents the subreach and river mile of the 37 analysis segments which had geomorphically appropriate attributes to support the objective of reducing channel braiding by establishing vegetated channel islands.
Braided and wandering channels are characterized by multiple channels, expanses of frequently disturbed gravel substrate, and high rates of lateral channel movement. The condition may be natural, or may be induced through loss of bank stabilizing vegetation. The latter is believed to be the case the Wapato Reach where multiple active channels exist. Thus the channel migration pattern seen in the upper subreaches can result in low flows being split between several channels, creating conditions that can create sediment deposition and instream habitat conditions that can reduce salmonid survival.
Structures that protect the heads of bars and low profile islands will facilitate more successful revegetation efforts, which are needed to restore the bank stability needed for the channel to return to a narrower, deeper, single‐dominant active channel. Locations classified as having a braided or wandering planform will likely exhibit greatest success for this action where channel migration rates are small to moderate and the predicted net bed elevation change for the analysis segment is neutral to aggradational. Conversely, more geomorphically dynamic segments with high channel migration rates and/or a tendency to degradation have a greater risk of instability and thus loss of structures.
Biological Benefits and Project Types
Biological benefits of this restoration objective are the development of narrower and deeper channels, establishment of vegetated stream banks, and the capture and storage of silt and sand on islands and river banks (i.e., outside of the channel). Long‐term the restoration objectives are expected to reduce the amount of fine sediment in the stream bed, provide deeper in‐channel pools with woody structure, and provide potential localized thermal refuge for salmonids. Transitioning from a shifting, braided channel with unvegetated alluvial bars to a dominant main channel with stable secondary channels and vegetated banks will improve habitat diversity for juvenile fish.
Project types that support this objective include the following.
Installation of flood fences (large wood placed/anchored in strategic floodplain locations to capture river borne wood, debris, and sediment; see Appendix C, for detailed description). Flood fencing is a recommended technique to capture sediment and cut off flow to the low flow, wandering channels and convert them into secondary channels engaged at high flow.
Placement of a LWD jam where wood recruitment rates have been reduced to promote active lateral channel dynamics.

Yakama Nation Chapter 5
Restoration Objectives and Project Locations
Wapato Reach Assessment Report 5‐5
April 2012ICF 00703.11
Table 5‐1. Analysis Segments with Geomorphic Attributes Suitable for Reducing Channel Braiding by Establishing Vegetated Channel Islands
Subreach Upstream River
Mile Downstream River
Mile Channel Migration Rate Planform Bed Elevation Change Rate (feet/year)
3 80.33 80.17 Moderate Wandering ±0.05 (Minor Change)
3 80.80 80.71 Moderate Wandering ±0.05 (Minor Change)
3 80.90 80.80 Small Wandering ±0.05 (Minor Change)
3 81.00 80.90 Moderate Wandering ±0.05 (Minor Change)
3 84.67 84.56 Small Wandering ±0.05 (Minor Change)
3 84.68 84.67 Moderate Wandering ±0.05 (Minor Change)
3 84.69 84.68 Moderate Wandering ±0.05 (Minor Change)
3 84.72 84.69 Moderate Wandering ±0.05 (Minor Change)
3 84.77 84.72 Moderate Wandering ±0.05 (Minor Change)
3 84.85 84.77 Moderate Wandering ±0.05 (Minor Change)
3 84.95 84.85 Small Wandering ±0.05 (Minor Change)
3 85.02 84.95 Moderate Wandering ±0.05 (Minor Change)
3 85.12 85.02 Small Wandering ±0.05 (Minor Change)
3 86.92 86.81 Small Wandering/Confined −0.20 to −0.05 (Moderate Degradation Potential)
3 87.04 86.92 Moderate Wandering ±0.05 (Minor Change)
3 87.09 87.04 Moderate Wandering ±0.05 (Minor Change)
3 87.19 87.09 Moderate Wandering ±0.05 (Minor Change)
3 87.39 87.19 Small Wandering ±0.05 (Minor Change)
3 87.44 87.39 Small Wandering ±0.05 (Minor Change)
3 87.51 87.44 Moderate Wandering ±0.05 (Minor Change)
3 88.42 88.26 Small Wandering/Meandering ±0.05 (Minor Change)
3 89.26 89.14 Small Wandering/Static ±0.05 (Minor Change)
3 89.31 89.26 Small Wandering/Static ±0.05 (Minor Change)
3 90.51 90.40 Small Wandering/Confined ±0.05 (Minor Change)
3 90.60 90.51 Small Wandering/Confined ±0.05 (Minor Change)
4 92.09 91.94 Small Wandering/Confined ±0.05 (Minor Change)
4 92.18 92.09 Small Wandering/Confined ±0.05 (Minor Change)

Yakama Nation Chapter 5
Restoration Objectives and Project Locations
Wapato Reach Assessment Report 5‐6
April 2012ICF 00703.11
Subreach Upstream River
Mile Downstream River
Mile Channel Migration Rate Planform Bed Elevation Change Rate (feet/year)
4 92.83 92.76 Small Wandering/Confined ±0.05 (Minor Change)
5 98.56 98.38 Small Braiding ±0.05 (Minor Change)
5 98.67 98.56 Small Braiding ±0.05 (Minor Change)
5 101.09 100.91 Small Braiding ±0.05 (Minor Change)
5 101.36 101.09 Moderate Braiding ±0.05 (Minor Change)
5 102.09 101.90 Small Braiding ±0.05 (Minor Change)
5 103.54 103.41 Small Braiding ±0.05 (Minor Change)
5 104.57 104.45 Moderate Braiding ±0.05 (Minor Change)
5 105.20 104.92 Small Wandering ±0.05 (Minor Change)
5 108.41 108.36 Small Wandering/Confined ±0.05 (Minor Change)

Yakama Nation Chapter 5
Restoration Objectives and Project Locations
Wapato Reach Assessment Report5‐7
April 2012ICF 00703.11
5.2.2.2 Locations Appropriate for Establishing or Promoting Engagement of Side Channels across a Wide Range of Flows
Geomorphically Appropriate Criteria
Table 5‐2 presents the subreach and river mile of the two analysis segments which had geomorphically appropriate attributes to support the objective of establishing or promoting engagement of side channels across a wide range of flows.
Table 5‐2. Analysis Segments with Geomorphic Attributes Suitable for Reconnecting Side Channels
Subreach
Upstream
River
Mile
Downstream
River
Mile
Chan
nel M
igration
Rate
Planform
Bed Elevation
Chan
ge Rate
(feet/year)
Floodplain
Chan
nels
Revetm
ent or
Levee
5 100.42 100.15 Small Braiding 0.20 to 1.0 (High Aggradation Potential)
Potential 2‐year flow connection
Yes
5 100.7 100.42 Small Braiding 0.20 to 1.0 (High Aggradation Potential)
2‐year flow connection
Yes
Side channels are expected to have a greater likelihood of engagement where the inlet is located in analysis segments that are geomorphically active and the river thalweg can migrate readily. An increased likelihood of connectivity is accordingly expected in analysis segments with moderate to high channel migration rates, and/or a moderate aggradational tendency (i.e., +0.05 feet/year to <1.0 feet/year). The odds of connectivity are improved for segments with a braided or wandering planform which have characteristically higher migration rates than other channel planform types. Floodplain channels with greatest potential for becoming an active side channel are associated with analysis segments that are located adjacent to the upstream connection of a floodplain channel engaged at a 2‐year flow, and where the segment is associated with revetment preventing connection.
Biological Benefits and Project Types
Side channels can provide stable, low flow conditions for juvenile fish, can support higher densities of juvenile fish associated with instream wood and bank structure, and can provide places protected from bed scour during egg incubation or juvenile overwinter (e.g., steelhead). The development of stable, connected side channels will increase the quantity of habitat and improve habitat diversity for juvenile fish. However, preferences for water velocity and depth can vary substantially between juvenile coho and Chinook salmon and steelhead (Hampton 1988). Chinook and coho fry tend to prefer shallow and low velocity areas that can be associated with side channels. Larger Chinook and steelhead parr tend to prefer a wider range of depths and velocities compared to coho. Thus, smaller side channels may be more beneficial to coho than Chinook or steelhead parr.

Yakama Nation Chapter 5
Restoration Objectives and Project Locations
Wapato Reach Assessment Report5‐8
April 2012ICF 00703.11
Side channels with a stable log jam at the upstream end are expected to “meter” flow into the channel and thus are expected to provide more benefits during the spring‐run by providing accessible low velocity refuge for smaller fish.
Side channels can also reconnect with, or make accessible to salmon and steelhead, cooler groundwater sources and provide localized thermal refuge during the summer and winter. Groundwater sources can benefit juveniles and adults and may improve survival during the “shoulder” periods.
Project types that support this objective include the following.
Installation of flood fences.
Removal of levees that limits floodplain connectivity.
Removal of rip rap.
Placement of a LWD jam where wood recruitment rates have been reduced to promote active lateral channel dynamics, such as development of a multi‐thread channel system.
5.2.2.3 Locations Appropriate for Establishing or Promoting the Engagement of Floodplain Channels across a Variety of Flows
Geomorphically Appropriate Criteria
Table 5‐3 presents the subreach and river mile of the four analysis segments which had geomorphically appropriate attributes to support the objective of establishing or promoting the engagement of floodplain channels across a variety of flows.
Floodplain channels are expected to have a greater likelihood of engagement where the inlet is located in analysis segments that are geomorphically active and the river thalweg can migrate readily. An increased likelihood of connectivity is accordingly expected in analysis segments with moderate to high channel migration rates, and/or a moderate aggradational tendency (i.e., +0.05 feet/year to <1.0 feet/year). The odds of connectivity are improved for segments with a braided or wandering planform which have characteristically higher migration rates than other channel planform types. Floodplain channels with greatest potential for becoming engaged during floods are associated with analysis segments that are located adjacent to the upstream connection of a floodplain channel engaged at a 2‐year or 10‐year flow.
Biological Benefits and Project Types
Floodplain channels in the Wapato Reach consist of flood swales, relict mainstem channels and seasonally flooded wetlands. Floodplain channels are connected at their upstream end only during high flow events and their accessibility and use as habitat can be brief. However, also associated with floodplain channels are seasonal wetlands that can be accessible to juvenile fish during critical periods and can retain water for longer periods. These habitats provide critical habitat to newly emerged fry and larger fish during the spring critical growing period.

Yakama Nation Chapter 5
Restoration Objectives and Project Locations
Wapato Reach Assessment Report 5‐9
April 2012ICF 00703.11
Table 5‐3. Analysis Segments with Geomorphic Attributes Suitable for Establishing or Promoting the Engagement of Floodplain Channels across a Variety of Flows
Subreach Upstream River Mile
Downstream River Mile
Channel Migration Rate Planform
Bed Elevation Change Rate (feet/year) Floodplain Channels
Revetment or Levee
5 102.87 102.61 Minor to Negligible
Wandering > 1.0 (Extreme Aggradation Potential)
Potential connection to 10‐year flow
Yes
5 100.7 100.42 Small Braiding 0.20 to 1.0 (High Aggradation Potential)
Connection to 2‐year flow and Potential Connection
to 10‐year flow
Yes
5 100.42 100.15 Small Braiding 0.20 to 1.0 (High Aggradation Potential)
Connection to 10‐year flow and Potential connection
to 2‐year flow
Yes
5 101.76 101.63 Moderate Braiding 0.20 to 1.0 (High Aggradation Potential)
Potential connection to 10‐year flow
No

Yakama Nation Chapter 5
Restoration Objectives and Project Locations
Wapato Reach Assessment Report5‐10
April 2012ICF 00703.11
Fall Chinook likely passively use these habitats during periods of overbank flows, whereas coho will seek out these habitats to avoid high flows. In contrast, juveniles steelhead tend to prefer higher velocity main and side channel habitats are not found in wetlands, which are low velocity. A more through overview of floodplain habitat use by species and life stage can be found in Lestelle et al. (2005, 2006).
Establishing or promoting the engagement of floodplain channels will have a higher benefit to subyearling Chinook and coho and less beneficial to juvenile steelhead. Benefits are expected to be expanded habitat quantity and increased habitat diversity.
Project types that support this objective include the following
Installation of flood fences.
Removal of levees that limits floodplain connectivity.
Removal of rip rap.
Placement of a LWD jam where wood recruitment rates have been reduced to promote active lateral channel dynamics, such as development of a multi‐thread channel system.
5.2.2.4 Locations Appropriate for Removal of Riprap or Bank Hardening
Geomorphically Appropriate Criteria
Table 5‐4 presents the subreach and river mile of the 25 analysis segments which had geomorphically appropriate attributes to support the objective of removing riprap or bank hardening.
In wandering or meandering subreaches, the channel migration history does not provide an accurate indication of geomorphic activity in areas where revetments are present (precisely because of the presence of the revetment) and/or where riprap removal is desired to restore riparian vegetation Appropriate analysis segments for removal of riprap or bank hardening are thus likely to be those where the aggradation to degradation tendency is neutral to minor (i.e., predicted bed elevation change ‐0.2 feet/year to +0.2 feet/year), because the risks of scouring or avulsion are lower.
Removal of rip rap can eliminate the bank hardening and channelization that restricts channel migration, simplifies the channel, and compromises instream aquatic habitat quality and quantity. Detailed field assessment would be needed to confirm the extent, size, and type of presence of rip rap or bank hardening and to assess the potential for impacts to property and/or infrastructure from removal.
Biological Benefits and Project Types
The removal of riprap or bank hardening will promote the development of a pool/riffle structure in places that currently may be a single, long, high‐velocity lateral scour pool or glide. In should be noted that simply removing riprap may create a shallower channel, which may increase predation risk. Our analysis of benefits assumes that riprap remove will occur as part of other measures to restore natural in‐channel structure (i.e., wood), bank revegetation, and measures to reduce channel migration or establish a dominant channel away from the problem location.

Yakama Nation Chapter 5
Restoration Objectives and Project Locations
Wapato Reach Assessment Report 5‐11
April 2012ICF 00703.11
Table 5‐4. Analysis Segments with Geomorphic Attributes Suitable for Removing Riprap or Bank Hardening
Subreach Upstream River Mile Downstream River Mile Revetment or Levee Bed Elevation Change Rate (feet/year)
2 77.02 76.90 Y ±0.05 (Minor Change)
3 80.71 80.64 Y ±0.05 (Minor Change)
3 80.64 80.53 Y ±0.05 (Minor Change)
3 80.53 80.33 Y ±0.05 (Minor Change)
3 91.39 91.37 Y ±0.05 (Minor Change)
3 91.37 91.34 Y ±0.05 (Minor Change)
3 91.34 91.22 Y ±0.05 (Minor Change)
3 91.22 91.05 Y ±0.05 (Minor Change)
3 89.31 89.26 Y ±0.05 (Minor Change)
3 89.26 89.14 Y ±0.05 (Minor Change)
3 89.4 89.31 Y ±0.05 (Minor Change)
3 89.49 89.40 Y ±0.05 (Minor Change)
3 89.58 89.49 Y ±0.05 (Minor Change)
3 89.75 89.58 Y 0.05 to 0.20 (Moderate Aggradation Potential)
4 97.05 96.91 Y ±0.05 (Minor Change)
4 97.29 97.05 Y −0.20 to −0.05 (Moderate Degradation Potential)
4 94.00 93.92 Y ±0.05 (Minor Change)
5 108.41 108.36 Y ±0.05 (Minor Change)
5 106.99 106.89 Y ±0.05 (Minor Change)
5 108.49 108.41 Y ±0.05 (Minor Change)
5 99.03 98.90 Y ±0.05 (Minor Change)
5 108.57 108.49 Y ±0.05 (Minor Change)
5 98.90 98.80 Y ±0.05 (Minor Change)
5 98.67 98.56 Y ±0.05 (Minor Change)
5 98.56 98.38 Y ±0.05 (Minor Change)

Yakama Nation Chapter 5
Restoration Objectives and Project Locations
Wapato Reach Assessment Report5‐12
April 2012ICF 00703.11
Benefits to fish are an increase of shallow low velocity habitat used by fry and an increase in habitat diversity (i.e., wood and pool/riffle) for juvenile rearing.
Project types that support this objective include the following.
Removal and/or setback of levees.
Removal of rip rap.
Bioengineered bank stabilization.
5.2.3 Habitat Enhancement Locations
Figure A‐7 (Appendix A) illustrates the locations identified as potentially suited to each of the two habitat enhancement objectives (i.e., installation of instream wood or riparian revegetation).
5.2.3.1 Locations Appropriate for Installing Instream Wood
Locations best suited for installation of instream wood (e.g., engineered log jams) were identified through the ‘use queries’ in an ACCESS database. The database queries identified analysis segments within the Wapato Reach that exhibited a suite of geomorphic attributes (e.g., channel migration rate, channel planform, channel bed stability) conducive to meeting this habitat enhancement objective and the EDT analysis was used to determine the potential biological benefits.
Geomorphically Appropriate Criteria
Table 5‐6 presents the subreach and river mile of the 102 analysis segments which had geomorphically appropriate attributes to support the objective of installing instream wood. All analysis segments had a minor to negligible channel migration rate and a minor bed elevation change rate of ±0.05 feet per year.
Instream wood structures are most likely to provide habitat functions over the longest duration in analysis segments that are geomorphically inactive. Such segments are more likely to be associated with a static or meandering channel planform with minor to negligible channel migration rates, and a neutral aggradation to degradation tendency (±0.05 foot/year). If placed in more active segments, such structures are more likely to be either scoured out or abandoned by the channel.
Biological Benefits and Project Types
The biological benefits of instream wood are to provide microhabitats as cover for juvenile and adult fish. Survival benefits to juveniles are reduced vulnerability to predation, localized structurally complex habitat for residence, and organic substrate for aquatic invertebrates and nutrient inputs. The typical benefits of wood for creating scour pools in smaller and medium sized streams are not considered in this assessment because instream habitat structures in the Wapato Reach will be located in stable, preexisting pools.
Instream wood projects typically involve active restoration measures that either directly increase key habitat components or indirectly improve habitat through structural enhancements that restore habitat‐forming processes (e.g., pool scour from a LWD jam).
Project types that support this objective include the following.

Yakama Nation Chapter 5
Restoration Objectives and Project Locations
Wapato Reach Assessment Report5‐13
April 2012ICF 00703.11
Construction of an instream wood cluster or larger log‐jam to increase in‐channel habitat complexity.
Use of LWD and boulder structures to restore natural rates of channel migration.
Table 5‐5. Analysis Segments with Geomorphic Attributes Suitable for Installing Instream Wood
Subreach Upstream River Mile Downstream River Mile Planform
5 106.99 106.89 Effectively Static 5 107.04 106.99 Effectively Static 5 107.16 107.04 Effectively Static 5 109.08 108.97 Effectively Static 4 97.05 96.91 Meandering/Braiding 3 80.00 79.89 Effectively Static 3 81.42 81.29 Effectively Static 3 81.55 81.42 Effectively Static 3 81.69 81.55 Effectively Static 3 82.00 81.91 Effectively Static 3 82.07 82.00 Effectively Static 3 82.14 82.07 Effectively Static 3 82.22 82.14 Effectively Static 3 82.36 82.22 Effectively Static 3 82.46 82.36 Effectively Static 3 82.50 82.46 Effectively Static 3 82.61 82.50 Effectively Static 3 82.69 82.61 Effectively Static 3 82.78 82.69 Effectively Static 3 82.88 82.78 Effectively Static 3 83.00 82.88 Effectively Static 3 83.10 83.00 Effectively Static 3 83.20 83.10 Effectively Static 3 83.33 83.20 Effectively Static 3 83.45 83.41 Effectively Static 3 83.66 83.55 Effectively Static 3 83.84 83.78 Effectively Static 3 84.00 83.84 Effectively Static 3 84.08 84.00 Effectively Static 3 84.15 84.08 Effectively Static 3 84.23 84.15 Effectively Static 3 84.30 84.23 Effectively Static 3 84.38 84.30 Effectively Static 3 84.49 84.38 Effectively Static 3 84.56 84.49 Effectively Static 3 85.21 85.12 Meandering 3 85.49 85.36 Meandering 3 85.57 85.49 Meandering

Yakama Nation Chapter 5
Restoration Objectives and Project Locations
Wapato Reach Assessment Report5‐14
April 2012ICF 00703.11
Subreach Upstream River Mile Downstream River Mile Planform
3 85.72 85.57 Effectively Static 3 85.83 85.72 Effectively Static 3 85.93 85.83 Effectively Static 3 86.05 85.93 Effectively Static 3 86.14 86.05 Effectively Static 3 86.31 86.14 Effectively Static 3 86.39 86.31 Effectively Static 3 86.46 86.39 Effectively Static 3 86.53 86.46 Effectively Static 3 88.00 87.92 Effectively Static 3 88.11 88.00 Effectively Static 3 88.26 88.11 Wandering/Meandering 3 88.52 88.42 Effectively Static 3 88.95 88.85 Effectively Static 3 89.40 89.31 Wandering/Static 3 89.49 89.40 Wandering/Static 3 89.58 89.49 Effectively Static 3 89.95 89.88 Effectively Static 3 90.06 89.95 Effectively Static 3 90.25 90.06 Effectively Static 3 90.30 90.25 Effectively Static 3 90.40 90.30 Effectively Static 2 69.65 69.46 Meandering 2 71.45 70.83 Effectively Static 2 72.29 72.08 Effectively Static 2 72.58 72.29 Effectively Static 2 72.93 72.58 Effectively Static 2 73.49 72.93 Effectively Static 2 74.96 74.60 Effectively Static 2 75.49 75.19 Meandering 2 77.11 77.02 Meandering 2 77.34 77.11 Meandering 2 78.24 78.03 Effectively Static 2 78.37 78.24 Effectively Static 2 79.89 79.76 Effectively Static 1 59.93 59.86 Effectively Static 1 59.99 59.93 Effectively Static 1 60.05 59.99 Effectively Static 1 60.12 60.05 Effectively Static 1 60.30 60.21 Effectively Static 1 60.65 60.37 Effectively Static 1 60.77 60.65 Effectively Static 1 60.97 60.77 Effectively Static 1 61.18 60.97 Effectively Static

Yakama Nation Chapter 5
Restoration Objectives and Project Locations
Wapato Reach Assessment Report5‐15
April 2012ICF 00703.11
Subreach Upstream River Mile Downstream River Mile Planform
1 61.31 61.18 Effectively Static 1 61.51 61.31 Effectively Static 1 61.69 61.51 Effectively Static 1 61.85 61.69 Effectively Static 1 62.05 61.85 Effectively Static 1 62.24 62.05 Effectively Static 1 62.78 62.62 Effectively Static 1 63.02 62.78 Effectively Static 1 63.15 63.02 Effectively Static 1 63.30 63.15 Effectively Static 1 63.74 63.41 Effectively Static 1 64.25 63.93 Effectively Static 1 64.70 64.25 Effectively Static 1 65.30 64.70 Effectively Static 1 65.81 65.30 Effectively Static 1 67.02 65.81 Effectively Static 1 67.75 67.02 Effectively Static 1 68.02 67.75 Effectively Static 1 68.76 68.02 Effectively Static 1 69.46 68.76 Meandering
5.2.3.2 Riparian Revegetation Locations
CWU Assessment Methods
CWU faculty used geomorphic data and corresponding spatial data for analysis of locations appropriate for riparian revegetation. The bedload and channel migration data were combined and coded for each HEC‐RAS segment according to the identified geomorphic criteria (as described in Chapter 4). This spatial data, along with the avulsion flow ratings, a levee layer, land ownership information, orthophotography, and best professional judgment were then used to identify potential locations were riparian revegetation would be appropriate.
CWU faculty did not consider which plant species would be most appropriate for revegetation projects because site‐specific micro‐habitat suitability would need to be considered before a specific restoration plan could be developed. Micro‐habitat suitability cannot be identified from orthophotography and was outside the scope of this reach assessment.
Geomorphically Appropriate Criteria
Many HEC‐RAS segments were identified as conducive for riparian revegetation. In general, areas were identified as particularly conducive to riparian revegetation where there was a distinct lack of stream‐side vegetation and a neutral to aggrading bed. Because the geomorphic analysis focuses on the wetted‐width of the channels and excludes channels that engage in flows with 2‐year or longer recurrence intervals, most of the riparian recommendations are immediately adjacent to the river channel, making the effective riparian revegetation zone of about 75 meters. Specific project areas further away from this zone were considered where a site seemed conducive to reestablishing

Yakama Nation Chapter 5
Restoration Objectives and Project Locations
Wapato Reach Assessment Report5‐16
April 2012ICF 00703.11
overbank flow and promoting normative river‐floodplain interaction; such sites would also be expected to provide long‐term benefits for enhanced floodplain function and recruitment of riparian vegetation. These areas often had evidence of old channels, suggesting minimal effort required to enhance river‐floodplain interaction.
Table 5‐6 presents the subreach and river mile of the areas which had geomorphically appropriate attributes to support the objective of riparian revegetation.
Biological Benefits and Project Types
The biological benefits of riparian revegetation are longer‐term, but can be significant. Riparian vegetation will reduce bank erosion and increase habitat diversity through wood recruitment to the channel and provide root protected bank structure. Short‐term benefits of riparian revegetation are the trapping and storage of silt and sand originating from the channel and from overland sources, thereby reducing the quantity of fine sediment in the channel affecting survival at multiple life stages.
Riparian restoration projects are located in areas where there was a geomorphic potential for riparian restoration and where the riparian vegetation communities has been significantly impacted by anthropogenic activities such that riparian functions and connections with the stream are compromised. Restoration actions are focused on restoring native riparian vegetation communities in order to reestablish natural stream stability, stream shading, nutrient exchange, and LWD recruitment. Wood recruitment to the channel may be from single trees entering the channel or larger quantities following channel avulsions. Larger quantities of large pieces included can provide affect channel processes forming pools or “metering” flow through side channels. Project types that support this objective include the following.
Replanting a riparian buffer area with native forest vegetation.
Eliminating invasive plant species that are preventing the reestablishment of a native riparian forest community.
Fencing livestock out of a riparian zone to recover natural vegetation and bank stability.
5.3 Additional Screening and Field Assessment After the potential locations of projects to meet the restoration objectives were identified through the ACCESS database, these results were then reviewed by the entire project team in a collaborative project location screening meeting held on February 8, 2012 and were compared with the aerial photos for quality and consistency. During that effort, the relative benefits of each potential restoration location was considered in the context of the specific degree and nature of salmonid use of that particular area.
Potential project locations and concepts identified by members of the TAG based on their knowledge and history of working in the Wapato Reach were also considered during this meeting for correspondence with the potential restoration locations identified via ACCESS. Similarly, areas with a high concentration of riparian revegetation opportunities (as identified by CWU) were also discussed in this meeting for their correspondence and synergy with potential restoration locations.

Yakama Nation Chapter 5
Restoration Objectives and Project Locations
Wapato Reach Assessment Report 5‐17
April 2012ICF 00703.11
Table 5‐6. Areas with Attributes Appropriate for Riparian Revegetation
Subreach Upstream River Mile
Downstream River Mile Acres
Miles of Bank
Frontage Geomorphic Potential Description
5 105.20 102.87 29.6 & 7.2
1.8 Stable/minor change (3‐4) Side channel riparian revegetation along channel that originates at RM 105.2 and rejoins at RM
103.75 and 102.87.
5 102.33 100.70 467.9 3.3 Moderate to high aggradation potential (5‐6)
Riparian revegetation on right and Left bank.
4 98.10 97.95 8.9 0.1 Extreme to high degradation potential (1‐2)
Riparian revegetation on right bank. Denuded area. Low acreage, short bank frontage. Extreme to high degradation potential (1‐2) possibly due
to the bridge.
4 94.45 93.00 135.5 1.4 HEC‐RAS data gap Riparian revegetation on the right bank of the right channel to shade and stabilize; bedload potential unknown due to HEC‐RAS data gap.
3 90.25 89.26 97.2 1.0 Stable/minor change (3‐4) Riparian revegetation along left bank
3 87.67 85.93 89.2 1.8 Minor change to high aggradation potential (4‐6).
Riparian revegetation along left bank and right bank for 500 ft
3 85.21 84.95 13.2 0.3 Stable/minor change (4) Riparian revegetation along left bank.
3 82.88 82.69 8.4 0.4 Stable/minor change (4) Riparian revegetation along right bank.
3 81.69 80.53 261.7 1.2 Stable/minor change (4) Riparian revegetation on both banks.
2 80.53 78.24 78.2 2.3 Stable/minor change (4) Riparian revegetation along a side channel that originates at RM 80.53 and rejoins at RM 78.24.

Yakama Nation Chapter 5
Restoration Objectives and Project Locations
Wapato Reach Assessment Report5‐18
April 2012ICF 00703.11
In addition to locations identified through the ACCESS database process, the project team identified potential locations which seemed to meet the geomorphic criteria or which appeared from the aerial photographs and the team’s knowledge of field conditions to be appropriate candidates for restoration. In such cases, the best professional judgment and experience of the project team’s geomorphologist, fisheries biologist, hydraulic engineer, and restoration ecologists was also used to refine the ACCESS output and identify additional potential locations.
It should be noted that additional reach‐specific geomorphic data and additional data on fish use in each subreach would be necessary (and beneficial) to allow additional calibration and refinement of the database. Incorporating more reach‐specific data into the process would likely result in the identification of additional potential restoration locations which could be further vetted and considered by the Yakama Nation and TAG for actionable projects. More reach‐specific data would also increase the robustness of the database such that some locations identified as appropriate would be determined to be less valuable than originally thought and thus could be removed from further consideration for projects.
5.3.1 Process‐Based Habitat Restoration Locations
Figure A‐7 (Appendix A) illustrates the potential habitat restoration locations identified through this process. These locations were ranked as high, medium, and low opportunity during the February 8 screening meeting, based on the combination of accurate identification by the ACCESS process, degree of anticipated salmonid benefit, correspondence with TAG identified concepts, correspondence with CWU riparian revegetation opportunities, and the best professional judgment of the project team.
Ten high opportunity areas were then targeted for field verification during a one‐day site visit conducted on February 14, 2012. Of these ten sites, the team’s geomorphologist, lead fisheries biologist, ICF’s hydraulic engineer, and Tom Elliott of the Yakama Nation were able to access and visit seven sites during the field verification (site conditions and private property access limitations prevented visiting all ten sites). One additional area (SR4‐RM95.4) identified as a possible restoration location by the Yakama Nation and the TAG was ultimately included in the list of recommended projects (Section 6.1) after further discussion between the Yakama Nation and the team, but it was not visited on February 14.
The team was able to confirm that almost all of the seven sites visited had site conditions, including construction access, conducive to meeting the restoration objectives identified for the site. One side channel restoration site at SR3‐RM81 was dropped from further consideration as a result of the field verification because it was already functioning well.
5.3.2 Habitat Enhancement Locations
5.3.2.1 Instream Wood Locations
Figure A‐7 (Appendix A) also illustrates the 102 potential habitat enhancement locations identified through the process described in Section 5.2.3.1 as appropriate for installing instream wood projects. The project team did not further evaluate the relative benefits, site‐specific suitability, or priority of all 102 potential instream wood locations in this analysis. Rather, the project team identified the potential project location at SR3‐RM90 as an example of a project type that could be

Yakama Nation Chapter 5
Restoration Objectives and Project Locations
Wapato Reach Assessment Report5‐19
April 2012ICF 00703.11
appropriate at these locations. This site was selected because it is immediately upstream of a riffle known to be a spawning site for Chinook. Installing instream wood in this location could create holding habitat for adults preparing to spawn and could also provide cover for juveniles as they emerge from the gravel in the riffle. The channel in this location is also very deep and lacks wood recruitment potential (the Touchet bed outcrop is immediately adjacent to this location).
This location was field verified and a project description and cost estimate completed as an example of the type, extent, and estimated cost of this type of project for the Wapato Reach. Further analysis would be necessary to determine which specific locations would yield the greatest benefit for habitat enhancement through the addition of wood.
5.3.2.2 Riparian Revegetation Locations
Figure A‐7 (Appendix A) illustrates the locations identified as appropriate for riparian revegetation through the process described in Section 5.2.3.2 (i.e., using a GIS‐based evaluation and best professional judgment). Riparian revegetation locations were not specifically field verified. These recommended sites were then categorized by totaling the acres and linear miles of bank. Sites with the greatest amount of potential riparian acres or linear feet of denuded bank needing revegetation where placed in the highest priority category.
It should be noted that the segment identified at RM 94 was identified based on level of existing riparian vegetation and hardening on the right bank. This was the only segment in which there was no HEC‐RAS data related to aggradational/degradational tendency. Thus, this segment was identified for further consideration if such data could be acquired in the future.
The analysis segment identified between RM 87.7 and 85.9 was also identified based geomorphic attributes and lack of existing riparian vegetation, but further site specific analysis of elevations indicates the steep bluffs along this portion of the reach are likely not appropriate for revegetation.


Wapato Reach Assessment Report6‐1
April 2012ICF 00703.11
Chapter 6 Recommended Projects and Project Prioritization
6.1 Recommended Projects Based on the progressive process of geomorphic analysis, EDT analysis, additional screening, and field verification (where possible), a suite of recommended projects in each of the Roni et al. (2002) categories (protection, process‐based restoration, and habitat enhancement) were formulated.
A variety of specific types of projects could be implemented to meet the restoration objectives identified for the Wapato Reach. The recommended projects represent those determined to be good fits for the reach, based on a combination of the Access®‐based analysis, the access, logistics, and site conditions noted during the field verification site visit, and the best professional judgment and experience of the project team’s geomorphologist, fisheries biologist, and hydraulic engineer. These recommended projects each address a specific restoration objective, are geomorphically appropriate for their location in the reach, and are expected to benefit the species and life‐history stages of the salmonids that use the Wapato Reach.
As discussed with the Yakama Nation and TAG during development of the project, all possible project types were not evaluated in this assessment. Large‐scale infrastructure projects, for example, such as breaching the freeway prism to restore floodplain were not considered as actionable habitat restoration projects within the scope of this analysis. However, such projects may well have significant benefits to the Wapato Reach, but they would require specific, detailed analysis to determine their benefits, costs, and implementation process.
Ten process‐based habitat restoration projects and six riparian revegetation projects are recommended. Table 6‐1 presents these projects in descending order by subreach and river mile and identifies the restoration objective addressed with each project. The ten recommended process‐based restoration projects are indicated in Table 6‐1 as shaded rows. The specific anticipated biological benefits of the process‐based restoration projects, as derived from EDT analysis, are discussed in detail in Section 6.2.
Sections 6.3 through 6.6 present the prioritization of these recommended projects within the Roni et al. (2002) categories of protection, process‐based restoration, and habitat enhancement.
Appendix E presents the descriptions of the recommended projects and includes information on general biological benefit, construction methods, project cost estimate, other related projects, and any pertinent notes. Appendix E also presents project site photos for some of the projects and maps illustrating the location of the recommended protection, restoration, and enhancement projects.

Yakama Nation Chapter 6
Recommended Projects and Project Prioritization
Wapato Reach Assessment Report 6‐2
April 2012ICF 00703.11
Table 6‐1. Recommended Projects and Related Restoration Objective, Presented in Descending Order by Subreach and River Mile
Stream Reach River Mile
Restoration Objectives
Process‐Based Restoration
Habitat Enhancement
Encourage a Meandering Planform by Establishing
Vegetated Channel Islands
Establish or Promote
Engagement of Side Channels across a Wide Range of Flows
Establish or Promote the Engagement of Floodplain
Channels across a Wide Range of
Flows
Remove Rip Rap or Bank
Hardening
Install Instream Wood
Enhance Riparian
Revegetation
5 105.2–102.9
X
5 105.0–103.0 X
5 102.9–102.2 X
5 102.3–100.7
X
5 102–101 X
5 98.6–98.0 X
4 96.9–96.3 X
4 95.4–95.1 X X
4 94.45–93.0
X
4 93.5 X
3 90.3
X
3 89.7–89.3 X X
3 87.7–85.9
X
3 81.7–80.5
X
3 80.1 X
2 80.5–78.2
X

Yakama Nation Chapter 6
Recommended Projects and Project Prioritization
Wapato Reach Assessment Report6‐3
April 2012ICF 00703.11
6.2 Biological Benefits of the Recommended Process‐Based Restoration Projects
EDT was used to analyze the specific biological benefits of the 10 recommended restoration projects in order to compare and score the potential of each project to improve salmon and steelhead survival in the Wapato Reach. The procedure for characterizing actions in EDT involves hypothesizing their effects on the attributes used in the model to characterize the stream environment. Effectiveness ratings were entered into the EDT database for each project specific to a reach and attributes. It is important to remember that all effectiveness ratings used in this analysis are assumptions and that there will always be uncertainty about how effective the actions would be if implemented. This uncertainty does not diminish the usefulness of making these assumptions in the planning process. The great utility is to make these assumptions explicit and then to assess their corresponding effect on salmon population performance. Effectiveness assumptions are detailed in Appendix D, Table D.1.
Biological benefit is described by the percent change of three population performance parameters: diversity, productivity, and abundance. These parameters are characteristics of the ecosystem that describe distribution potential of a population, persistence, and size. They are the core performance measures used to describe population viability by NMFS (see McElhany et al. 2000). The algorithms used to calculate population parameters are based on the Beverton‐Holt survival function (Beverton and Holt 1957) and methods described in Blair et al. (2009). All of the estimates are made for steady state conditions.
Diversity. This parameter represents the multitude of pathways through space and time available to, and used by, a species in completing its life cycle. Populations that can sustain a wide variety of life‐history patterns are likely to be more resilient to the influences of environmental change. Thus a loss of life‐history diversity is an indication of declining health of a population (Lichatowich and Mobrand 1995) and perhaps its environment. The model computes an index of life‐history diversity as the percentage of possible life cycle pathways (i.e., life trajectories in space and time that members of a population might follow across the aquatic landscape) having a productivity (as defined below) greater than one.
Productivity. This parameter represents the relative success of the species to complete its life cycle within the environment it experiences. It determines resilience to mortality pressures, such as from fishing, dams, and further habitat degradation. Habitat quality (including water quality) is a major determinant of a population’s productivity. This element is especially important when efforts are being made to reverse long‐term downward trends in population abundance. The model estimates productivity for the population of interest under specific management scenarios, expressed as the average number of adult progeny produced per parent spawner (at low population density). A life cycle productivity of less than one—for any part of the population—is, by definition, unsustainable. As population productivity approaches one (e.g., values less than two), the population is clearly at risk.
Abundance. This parameter includes population capacity, which defines how large a population can grow within the environment it experiences, as a result of finite space and food resources. Capacity determines the effect of this upper limit on abundance to survival and distribution. Habitat quantity is a major determinant of the environmental capacity to support population

Yakama Nation Chapter 6
Recommended Projects and Project Prioritization
Wapato Reach Assessment Report6‐4
April 2012ICF 00703.11
abundance. Abundance is the equilibrium run size (or average abundance under steady state conditions), which highly correlates with capacity, but is also affected by productivity. We use abundance to evaluate project benefits because it better describes effect of projects on the number of fish likely to return. Abundance is more strongly affected by productivity when productivity is low. Capacity will have a stronger effect on abundance when productivity is high.
The productivity, abundance, and diversity parameters computed for each project are relative indices of population performance potential. Percent change reported by species for each project is to the tenth of a percent to provide a picture of relative differences among projects for a species and to enable scoring of the recommended projects based on biological benefit. However, these percent change results are for the most part raw model output numbers and thus do not imply a prediction of population performance to a tenth of a percent level of precision.
We also evaluated how each project could affect species life‐stage survival and contributing factors. Additional detailed charts of project benefits by species and life stages are presented in Appendix D.
Biological benefits use populations previously defined in the EDT model for the Yakima Basin. There is one population for fall Chinook and one population for summer Chinook in EDT. Multiple populations are available for spring Chinook, coho and steelhead. We selected the Upper Yakima spring Chinook population, the Ahtanum steelhead population, and the Ahtanum coho population to provide the best indicator of population response to projects in the Wapato Reach. The steelhead and coho populations were chosen because Ahtanum Creek enters the Yakima River just upstream of the Wapato Reach. Juveniles from Ahtanum Creek are most likely to encounter the Wapato Reach compared to other populations.
The consequence of choosing these populations is that the response reported for coho and steelhead may be greater from what might be expected for populations higher in the Yakima River Basin depending on the proportion of juveniles that move downstream to the Wapato Reach for residence prior to seaward migration. Conversely, population productivity and capacity for coho and steelhead originating from Ahtanum Creek are strongly influenced by poor conditions in the tributary watershed, and thus, projects in the Wapato Reach may not have a strong effect on population performance compared to fish originating from higher quality habitat. The problem is population results for other coho and steelhead populations upstream of the Wapato Reach are not much better than reported for Ahtanum Creek. Results for coho and steelhead are evaluated considering the effect of tributary conditions relative to benefits of improved conditions in the Wapato Reach.
A version of EDT has not been developed for sockeye. Potential benefits to sockeye are discussed by project, but are not as well developed as for other species.
6.2.1 Install Channel Roughness Elements at SR5‐RM105.0
6.2.1.1 Project Objective and Description
The objective of this project is to promote development of single dominant meandering channel instead of existing braided/branched planform. This project supports the restoration objective of encouraging the development of a meandering planform by establishing vegetated channel islands.
Deposition of sediment in selected channels would be encouraged by constructing approximately 20 channel roughness elements (also known as flood fences) at the head of existing channel splits, and revegetating adjacent islands and exposed channel margins downstream of the flood fences

Yakama Nation Chapter 6
Recommended Projects and Project Prioritization
Wapato Reach Assessment Report6‐5
April 2012ICF 00703.11
(Appendix E includes photos illustrating installed flood fences). Selected channels would function as secondary channels during high flow events (e.g., bankfull flow and greater) but would not convey flow during most of the year. This project would include 15 acres of riparian planting of cottonwoods and willows behind the flood fence structures and along the outer portions of the islands, as well as planting conifers where appropriate.
The riparian revegetation analysis identified the channel that originates at RM 105.2 and rejoins the river at RM 103.75 and RM 102.87 as an area that would benefit from riparian revegetation. CWU identified this area is part of the Wapato Wildlife Area, making it conducive to large‐scale restoration.
6.2.1.2 EDT Analysis of Project Benefits
This project would move the broad and shallow channel condition to a more narrowly defined channel and provide better instream habitat during low flow periods. In addition, this project would promote the retention of fine sediment into the floodplain, thereby reducing the amount of in‐channel fine sediment.
The greatest biological benefits to salmonids are derived from the removal of sediment in the bedload and suspended sediment. Additional biological benefits to salmonids are derived from creating a channel with a vegetated, root protected bank, and structure along the channel margins.
Table 6‐2 presents the anticipated benefits of this project to salmon and steelhead in terms of the EDT diversity index, productivity, and abundance parameters and details from the species life‐stage results reported in Appendix D.
6.2.2 Channel Reconstruction, Instream Wood, and Channel Roughness Elements at SR5‐RM102.9
6.2.2.1 Project Objective and Description
The objective of this project is to improve alignment of channel to better match the bridge opening at the upstream side, prevent erosion of the right bank upstream of the bridge, and better utilize capacity of bridge opening during flood flow conditions.
This project would reconstruct the meander of the dominant channel immediately upstream of the bridge (approximately 1,500 feet of channel) to have a larger radius and have a direct alignment with the bridge opening. The project would remove approximately 1,500 cubic yards of existing fill material near the center of the bridge to provide additional flood flow conveyance through the bridge and reduce factors leading to the current erosion of the right bank. Protection of the right bank upstream of the bridge from erosion would be accomplished by installing multiple large engineered log jams, or a continuous length of LWD revetment. Deposition of sediment in secondary channels would be encouraged by constructing five channel roughness elements (i.e., flood fences) at the head of the existing channel; this channel would continue to function as a high flow secondary channel but not as a secondary channel during lower flow conditions.

Yakama Nation Chapter 6
Recommended Projects and Project Prioritization
Wapato Reach Assessment Report6‐6
April 2012ICF 00703.11
Table 6‐2. Anticipated Benefits of Channel Roughness Elements at SR5‐RM105 to Salmon and Steelhead
Species Biological Benefits
Fall Chinook Diversity increased by approximately 2% due to improved survival for a few life‐history pathways originating from the project area.
Productivity increased by nearly 6% due primarily to improved survival during egg incubation from reduction in fine sediment.
Abundance increased by 3.2%. Abundance did not increase as much as productivity because improvements in survival during egg incubation are offset by capacity constraints in later life stages in downstream reaches. Project benefits could increase if combined with another project that increases habitat quantity during juvenile outmigration.
Summer Chinook Diversity increased by 6.6% due to improved survival of life‐history pathways originating from the project area and all pathways moving through the reach from upstream spawning locations.
Productivity increased by over 7% due primarily to improved survival during egg incubation from reduction in fine sediment.
Abundance increased by over 9%. The increase in abundance exceeded the increase in productivity in part because of low productivity and the shape of the Beverton‐Holt survival function, and an increase in reach capacity affecting pathways from upstream areas.
Spring Chinook Diversity increased by 0.2%. Diversity of spring Chinook life history is largely determined by conditions encountered outside of the Wapato Reach,
Productivity increased by 0.1%. The project had a slight effect on productivity across all life stages (adults, juveniles in the winter and smolt migrants) using the Wapato Reach by improving habitat diversity, reducing predation vulnerability, and reducing suspended sediment.
Abundance increased by 1.0%. This is in part a response to improved survival occurring during life stages after most capacity constraints. Most of the response was from increase in habitat quantity and quality for juvenile Chinook during the winter.
Summer Steelhead Diversity was not affected by this project. Diversity of summer steelhead life‐history pathways is largely determined by conditions encountered outside of the Wapato Reach. Diversity is low in all populations of steelhead upstream of the Wapato Reach due to tributary conditions.
Productivity increased by 0.1%. The project had a slight effect on productivity of life stages using the Wapato Reach, but tributary conditions have a stronger effect on productivity.
Abundance increased by nearly 2%. Similar to spring Chinook, this was a response to improving survival of life stages after most capacity constraints, particularly an increase in habitat quantity and quality for juvenile steelhead during the winter. The increase in abundance was in part because of low productivity and the shape of the Beverton‐Holt survival function.

Yakama Nation Chapter 6
Recommended Projects and Project Prioritization
Wapato Reach Assessment Report6‐7
April 2012ICF 00703.11
Species Biological Benefits
Coho Diversity was not affected by this project. Diversity of coho life‐history pathways is largely determined by conditions encountered outside of the Wapato Reach, Diversity is low in all populations of coho upstream of the Wapato Reach due to tributary conditions.
Productivity increased by 0.1%. The project had a slight effect on productivity of life stages using the Wapato Reach, but tributary conditions have a stronger effect on productivity
Abundance increased by nearly 5%. This was a response to improving survival during life stages after most capacity constraints and an increase in habitat quantity for juvenile coho during the winter.
Sockeye Benefits from this project would be through improved survival during smolt migration from reduced vulnerability to predators.
Adult survival may increase from increased channel depth and temperature refuge
6.2.2.2 EDT Analysis of Project Benefits
Recognizing the limitations at the site and the need to accommodate the built environment with the natural environment, this project would maximize the flow capacity through the bridge opening, establish a channel planform that matches the theoretically appropriate planform for this location (given the known/measured geomorphic parameters), stabilize the streambanks using habitat enhancing features (e.g., LWD structures, channel roughness) instead of riprap, and improve floodplain connectivity.
Biological benefits to salmonids are derived from restoring natural bank structure and improving habitat complexity. The project assumes that the amount of in‐channel sediment would not be reduced, because of the limited amount of floodplain habitat available for sediment retention,
Table 6‐3 presents the anticipated benefits of this project to salmon and steelhead in terms of the EDT diversity index, productivity, and abundance parameters. EDT results show a relatively small effect of this project on salmonids due to assumptions of size of the project.
6.2.3 Channel Roughness Elements at SR5‐RM102
6.2.3.1 Project Objective and Description
The objective of this project is to encourage the development of single dominant meandering planform instead of existing braided/and branched planform by establishing vegetated channel islands.
This project would encourage deposition of sediment in selected channels by constructing approximately 10 channel roughness elements (i.e., flood fences) at the head of existing channel splits, and revegetate adjacent islands and exposed channel margins downstream of the structures. Selected channels would function as secondary channels during high flow events (e.g., bankfull flow and greater) but would not convey flow during most of the year. The project would include approximately 20 acres of riparian plantings consisting of cottonwoods and willows behind the flood fence structures and along the outer portions of the islands, as well as planting conifers where appropriate.

Yakama Nation Chapter 6
Recommended Projects and Project Prioritization
Wapato Reach Assessment Report6‐8
April 2012ICF 00703.11
Table 6‐3. Anticipated Benefits of Channel Reconstruction, Instream Wood, and Channel Roughness Elements at SR5‐RM102.9 to Salmon and Steelhead
Species Biological Benefits
Fall Chinook Diversity did not increase in part because egg incubation survival did not increase enough to have a strong effect on productivity.
Productivity increased by 0.1% due primarily to improved survival during juvenile outmigration.
Abundance increased by 0.3%. The slight increase in abundance was from improved juvenile survival and better conditions affecting adult migration and prespawn holding.
Summer Chinook Diversity increased by 0.3% due to improved survival of life‐history pathways moving through the reach from upstream spawning locations.
Productivity increased by 0.1% due to an increase in juvenile survival resulting from improved habitat diversity and a small increase in habitat quantity. A slight effect on temperature was included by assuming a slight thermal heterogeneity associated with the LWD placement.
Abundance increased by 0.3%. This was a response to an increase in juvenile habitat quantity and quality.
Spring Chinook Diversity did not increase with this project. Effects of this project were localized and spring Chinook would briefly encounter this project as adults and juveniles during the winter and as smolts.
Productivity increased by 0.1%. The project had a slight effect on productivity across all life stages (adults, juveniles in the winter and smolt migrants) using the Wapato Reach.
Abundance increased by 0.5%. This was in part a response to improved productivity affecting juveniles in the winter and smolt migrants. There was also an assumed increase in the quantity of habitat for juveniles in the reach during the winter.
Summer Steelhead Diversity was not affected by this project. Productivity increased by 0.1%. There was a slight response to improved survival due to improved habitat diversity affecting juveniles in the summer and winter and smolt migrants. Effect of temperature during the summer affecting older juveniles was also assumed to slightly decrease.
Abundance increased by nearly 1.5%. This was a response to improved survival during life stages after most capacity constraints and an increase in habitat quantity for juvenile steelhead during the winter. Also, the increase in abundance was in part because of low productivity and the shape of the Beverton‐Holt survival function,
Coho Diversity was not affected by this project for reason stated earlier. Productivity increased by 0.1%. Abundance increased by 1.9%. There was a small increase in the amount of habitat affecting juveniles during the winter.
Sockeye Benefits from this project would be slight, primarily increased habitat diversity reducing vulnerability of smolt migrants to predators.
There may be a benefit of providing thermal refuge affecting adult survival as was modeled for summer Chinook.
6.2.3.2 EDT Analysis of Project Benefits
This project would move the broad and shallow channel condition to a more narrowly defined channel and provide better instream habitat during low flow periods. In addition, this project would

Yakama Nation Chapter 6
Recommended Projects and Project Prioritization
Wapato Reach Assessment Report6‐9
April 2012ICF 00703.11
promote the retention of fine sediment into the floodplain, thereby reducing the amount of in‐channel fine sediment.
The greatest biological benefits to salmonids are derived from the removal of fine sediment in the bedload and suspended sediment. Additional biological benefits to salmonids are derived from creating a channel with a vegetated, root protected bank, and structure along the channel margins.
Results of the EDT analysis of the anticipated benefits of this project to salmon and steelhead in terms of the EDT diversity index, productivity, and abundance parameters are identical to Flood Fencing at SR5‐RM105 (Table 6‐2). For the purpose of this analysis these projects were assumed to have identical effects on environmental attributes affecting survival. The projects also occur in the same subreach of the Wapato Reach.
6.2.4 Channel Roughness Elements at SR5‐RM98.6
6.2.4.1 Project Objective and Description
The objective of this project is to reduce channel migration towards existing ponds and protect pond levees from erosion. This project would also encourage the development of single dominant meandering planform at a desirable location instead of existing braided/and branched planform by establishing vegetated channel islands.
This project would encourage deposition of sediment in selected channels by constructing approximately 10 channel roughness elements (i.e., flood fences) at the head of existing channel splits, and would revegetate approximately 10 acres of adjacent islands and exposed channel margins downstream of the structures. Selected channels would function as secondary channels during high flow events (e.g., bankfull flow and greater) but would not convey flow during most of the year. The project would include planting cottonwoods and willows behind the flood fence structures and along the outer portions of the islands, as well as planting conifers where appropriate.
6.2.4.2 EDT Analysis of Project Benefits
This project would move the broad and shallow channel condition to a more narrowly defined channel and provide better instream habitat during low flow periods. In addition, this project would promote the retention of fine sediment into the floodplain, thereby reducing the amount of in‐channel fine sediment.
The greatest biological benefits to salmonids are derived from the removal of sediment in the bedload and suspended sediment. Additional biological benefits to salmonids are derived from creating a channel with a vegetated, root protected bank, and structure along the channel margins.
Table 6‐4 presents the anticipated benefits of this project to salmon and steelhead in terms of the EDT diversity index, productivity, and abundance parameters. This geographic scope of this project is not a large as the other flood fencing projects farther upstream, thus benefits are less. This project does differ in that the channel will be redirected away from the existing bank hardening associated with the pond levees This project addresses the critical factors affecting survival for salmonids (i.e., fine sediment and improving juvenile habitat, as detailed in Appendix D). The EDT results show low benefits because of the limited amount of the reach affected by the project.

Yakama Nation Chapter 6
Recommended Projects and Project Prioritization
Wapato Reach Assessment Report6‐10
April 2012ICF 00703.11
Table 6‐4. Anticipated Benefits of Channel Roughness Elements at SR5‐RM98.6 to Salmon and Steelhead
Species Biological Benefits
Fall Chinook Diversity increased by 0.7%. Productivity increased by 2.4% due primarily to improved survival during egg incubation from reduction in fine sediment.
Abundance increased by 1.4%.
Summer Chinook Diversity increased by 2.9% Productivity also increased by 2.9%. Abundance increased by 3.8%.
Spring Chinook Diversity did not increase from this project. Productivity increased by less than 0.1%. Abundance increased by 0.6%.
Summer Steelhead Diversity was not affected by this project. Productivity increased by 0.1%. Abundance increased by nearly 1.6%.
Coho Diversity was not affected by this project. Productivity increased by 0.1%. Abundance increased by nearly 2.5%.
Sockeye Benefits from this project would be through improved survival during smolt migration from reduced vulnerability to predators. Redirecting the channel away from the pond levee would increase habitat complexity and reduce predator losses.
Adult survival may increase from increased channel depth and temperature refuge.
This analysis does not include the potential benefits of lowering the levee of the downstream pond (Appendix E). Lowering the levee would allow flow to enter during peak flow events and fine sediments would deposit in the pond, preventing the sediments from being deposited downstream in the channel. In addition, temperature profile data from Vaccaro (2011) shows a localized warming of the mainstem just downstream of the ponds that may be a result of these ponds. This component was not included in the project because of the degree of additional information and analysis necessary to formulate a project for this location (e.g., data regarding the shape/depth of the pond; data regarding predators in the pond and potential that opening access to the pond may trap salmonids in the pond).
6.2.5 Levee Removal at SR4‐RM96.9
6.2.5.1 Project Objective and Description
The objective of this project is to increase floodplain flow conveyance, riparian habitat, and the extent of the channel migration zone by removing a levee/bank hardening.
The existing 3,000 foot levee is immediately adjacent to the main channel along the right bank and the project would move the levee away from the channel, creating access to approximately 30 acres of low elevation floodplain. An approximately 2,500 foot setback levee would be constructed to provide flood protection to area agricultural lands and buildings. The project would then revegetate approximately 30 acres of riparian floodplain that is currently agricultural land.

Yakama Nation Chapter 6
Recommended Projects and Project Prioritization
Wapato Reach Assessment Report6‐11
April 2012ICF 00703.11
The riparian revegetation analysis also identified this area for riparian restoration (in conjunction with levee setback) to encourage overbank flow and to increase river‐floodplain interaction.
6.2.5.2 EDT Analysis of Project Benefits
Biological benefits to salmonids are derived from restoring additional floodplain and improved riparian condition associated with the levee and immediately adjacent area and from the potential to reconnect the floodplain channel. Additional benefits are also derived from promoting the retention of fine sediment into the floodplain, thereby reducing the amount of in‐channel fine sediment.
Table 6‐5 presents the anticipated benefits of this project to salmon and steelhead in terms of the EDT diversity index, productivity, and abundance parameters. The assumed need to maintain adjacent agricultural lands and buildings constrains the amount of floodplain area that we assumed in this analysis would restored by the project. The levee setback and riparian revegetation is expected to restore a small amount of seasonally flooded wetland habitat, provide additional side channels habitat and improve in‐channel conditions for juvenile salmonids. The levee setback may result in establishing a small groundwater channel to provide localized thermal refuge beneficial to juveniles and adults. Additional biological benefits are derived from the deposition of fine sediment on the floodplain and the revegetation of riparian floodplain that is currently agricultural land.
6.2.6 Channel Roughness Elements at SR4‐RM95.4
6.2.6.1 Project Objective and Description
The objective of the project is to encourage the development of single dominant meandering planform instead of existing braided/and branched planform that developed after recent channel avulsion.
The project would encourage deposition of sediment in selected secondary channel by constructing 10 channel roughness elements (i.e., flood fences) at the head of existing channel split, and revegetate approximately 5 acres of the adjacent islands and exposed channel margins downstream of the structures. Selected channels would function as a secondary channel during high flow events (e.g., bankfull flow and greater) but would not convey flow during most of the year. The project would include planting cottonwoods and willows behind flood fence structures and along the outer portions of the islands, and planting conifers where appropriate

Yakama Nation Chapter 6
Recommended Projects and Project Prioritization
Wapato Reach Assessment Report6‐12
April 2012ICF 00703.11
Table 6‐5. Anticipated Benefits of Levee Removal at SR4‐RM96.9 to Salmon and Steelhead
Species Biological Benefits
Fall Chinook Diversity increased by 1.8%. Productivity increased by 3.7% due primarily to improved survival during egg incubation from reduction in fine sediment.
Abundance increased by 2.2%. Abundance did not increase as much as productivity because improvements in survival during egg incubation are offset by capacity constraints in later life stages. However, there was slightly better benefit from this project to capacity affecting abundance. This project combines improvements in productivity with increase in quantity of juvenile habitat.
Summer Chinook Diversity increased by 5.4%. Productivity increased by 4.7% due primarily to improved survival during egg incubation from reduction in fine sediment.
Abundance increased by nearly 6%. Project benefit to capacity was similar to predicted for fall Chinook. The greater increase in abundance of summer Chinook than fall Chinook was an effect of low initial productivity of summer Chinook and the higher effect on summer Chinook productivity.
Spring Chinook Diversity was not affected by this project., Productivity increased by 0.1%. Abundance increased by 0.7%. Spring Chinook abundance benefited by improvements in the quantity of juvenile habitat during the winter.
Summer Steelhead Diversity was not affected by this project. Productivity increased by 0.1%. Abundance increased by 1.2%. Summer steelhead abundance benefited by slight improvements in habitat quality and quantity affecting juveniles. Habitat created by this project is
Coho Diversity was not affected by this project. Productivity increased by 0.1%. Abundance increased by 1.8%. Improvements to habitat quantity affecting juvenile coho during the winter benefited abundance.
Sockeye Benefits from this project would be through improved survival during smolt migration from reduced vulnerability to predators.
Adult survival may increase if the project were to make available a groundwater channel to provide localized thermal refuge.
6.2.6.2 EDT Analysis of Project Benefits
Biological benefits to salmonids are derived from creating a channel with a vegetated, root protected bank, and structure along the channel margins.
The project would move the broad and shallow existing channel to a more narrowly defined channel and provide better instream habitat during low flow periods. In addition, this project will promote the retention of fine sediment into the floodplain, thereby reducing the amount of in‐channel fine sediment.
Table 6‐6 presents the anticipated benefits of this project to salmon and steelhead in terms of the EDT diversity index, productivity, and abundance parameters. This project is one the smallest of the flood fencing projects analyzed. The effect of this project on life‐stage survival is similar to previous projects.

Yakama Nation Chapter 6
Recommended Projects and Project Prioritization
Wapato Reach Assessment Report6‐13
April 2012ICF 00703.11
This project could be a component of a much larger project for this vicinity that includes removal of existing bank riprap and residences in the floodplain, and replacement of an existing highway bridge with a more appropriately sized structure. The larger project was not evaluated as part of this analysis (see Section 6.1, Recommended Projects), but the benefit of the larger project could be considerable through the reconnection of floodplain channels downstream of the bridge and retention of fine sediment into the floodplain.
Table 6‐6. Anticipated Benefits of Channel Roughness Elements at SR4‐RM95.4 to Salmon and Steelhead
Species Biological Benefits
Fall Chinook Diversity increased by 0.8%. Productivity increased by 1.6%. Abundance increased by 1.1%.
Summer Chinook Diversity increased by 2.1%. Productivity increased by 2.0%. Abundance increased by 2.7%.
Spring Chinook Diversity was not affected by this project., Productivity increased by 0.1%. Abundance increased by 0.4%.
Summer Steelhead Diversity was not affected by this project. Productivity increased by 0.1% Abundance increased by 1.1%.
Coho Diversity was not affected by this project. Productivity increased by 0.1%. Abundance increased by 1.1%.
Sockeye Benefits from this project would be through improved survival during smolt migration from reduced vulnerability to predators.
Adult survival may increase from increased channel depth, temperature refuge, and thus increased upstream passage survival. The larger project would benefit sockeye if a groundwater channel was developed to provide localized thermal refuge.
6.2.7 Channel Roughness Elements at SR4‐RM93.5
6.2.7.1 Project Objective and Description
The objective of the project is to encourage development of single dominant meandering planform instead of existing braided/and branched planform that developed after recent channel avulsion.
The project would encourage deposition of sediment in selected secondary channel by constructing 20 channel roughness elements (i.e., flood fences) at the head of existing channel split, and revegetate approximately 20 acres of the adjacent islands and exposed channel margins downstream of the structures. Selected channels would function as a secondary channel during high flow events (e.g., bankfull flow and greater) but would not convey flow during most of the year. The project would include planting cottonwoods and willows behind flood fence structures and along the outer portions of the islands, and planting conifers where appropriate.

Yakama Nation Chapter 6
Recommended Projects and Project Prioritization
Wapato Reach Assessment Report6‐14
April 2012ICF 00703.11
6.2.7.2 EDT Analysis of Project Benefits
Biological benefits to salmonids are derived from creating a channel with a vegetated, root protected bank, and structure along the channel margins.
The project would move the broad and shallow existing channel to a more narrowly defined channel and provide better instream habitat during low flow periods. In addition, this project will promote the retention of fine sediment into the floodplain, thereby reducing the amount of in‐channel fine sediment.
Table 6‐7 presents the anticipated benefits of this project to salmon and steelhead in terms of the EDT diversity index, productivity, and abundance parameters. This project is comparable in size to Flood Fencing at SR5‐RM105.0 and at SR5‐RM102 and the same project effectiveness assumptions were used. The project is lower in the Wapato Reach then the other flood fencing projects. Thus, fine sediment removed by this project affects a smaller proportion of the fall and summer Chinook populations, and life‐stage exposure differs for the other species. The consequence is a less degree of change in population parameters for this project.
Table 6‐7. Anticipated Benefits of Channel Roughness Elements at SR4‐RM93.5 to Salmon and Steelhead
Species Biological Benefits
Fall Chinook Diversity increased by 1.8%. Productivity increased by 3.7%. Abundance increased by 2.3%.
Summer Chinook Diversity increased by 5.6%. Productivity increased by 4.7%. Abundance increased by 6.0%.
Spring Chinook Diversity was not affected by this project, Productivity increased by 0.1%. Abundance increased by 0.7%.
Summer Steelhead Diversity was not affected by this project. Productivity increased by 0.1% Abundance increased by 1.2%.
Coho Diversity was not affected by this project. Productivity increased by 0.1%. Abundance increased by 2.0%. The benefit of this project to coho abundance was less than SR5‐RM105.0 because of being lower in the Yakima River and fewer life‐history pathways extending this far down for juvenile winter residence.
Sockeye Benefits from this project would be through improved survival during smolt migration from reduced vulnerability to predators.
Adult survival may increase from increased channel depth and temperature refuge.

Yakama Nation Chapter 6
Recommended Projects and Project Prioritization
Wapato Reach Assessment Report6‐15
April 2012ICF 00703.11
6.2.8 Install Instream Wood at SR3‐RM90.3
6.2.8.1 Project Objective and Description
The objective of this project is to add complexity and structure within the stream channel.
This project would place 20 individual trees or small clusters of two and three trees (with root wad and as much of the branches as possible) with boulders for anchors attached with hemp or manila rope along the length of the deep pools formed along the Touchet beds. Appendix E includes a schematic illustrating such a structure.
Access to site is easier from the left bank side if a crane can be used to lower log structures into river (left bank side is privately owned). Project assumes private landowner would be willing to allow construction access for a small access easement fee and that structures can be placed by large crane in actively flowing channel with no cofferdam required and a diver would be used to release rigging once placed.
6.2.8.2 EDT Analysis of Project Benefits
Biological benefits to salmonids are derived from the addition of instream wood structure to existing pools in a section of the river that does not have much structure and in which LWD recruitment is limited. LWD would provide structural complexity and cover for fish habitat. LWD can have a key function in the formation of channel habitat units. Survival factors assumed to be affected by this project were habitat diversity, predation, and cover from human harassment (e.g., intentional poaching or unintentional disturbance during recreational boating activities). Wood also provides a substrate and organic matter that supports the food chain and can also provide refuge during high flow. This project includes an assumption that the wood would eventually contribute to pool formation, but the effect was considered low because of the small amount of wood used and it size relative to the channel size.
Table 6‐8 presents the anticipated benefits of this project to salmon and steelhead in terms of the EDT diversity index, productivity, and abundance parameters. It is not unexpected that the placement of a 20 unit instream wood project in the Wapato Reach would have a low biological benefit. This project was included as an example of the type of project appropriate at a number of locations throughout the lower reach. Instream wood projects would likely be more beneficial when combined with, or occurring after projects to restore large‐scale processes that remove fine sediment from the channel (e.g., flood fencing) and increase floodplain connectivity (e.g., levee removal).

Yakama Nation Chapter 6
Recommended Projects and Project Prioritization
Wapato Reach Assessment Report6‐16
April 2012ICF 00703.11
Table 6‐8. Anticipated Benefits of Installing Instream Wood at SR3‐RM90.3 to Salmon and Steelhead
Species Biological Benefits
Fall Chinook Diversity increased by 0.3%. Productivity increased by 0.2%. This project did not affect the more significant effect of fine sediment on productivity.
Abundance increased by 0.5%. Abundance increased more than productivity because of life stages when benefits occurred (juveniles and adults) and the assumption that LWD will contribute to an increase in quantity and quality of habitat for these life stages.
Summer Chinook Diversity increased by 0.6%. Productivity increased by 0.5%. Abundance increased by 0.8%.
Spring Chinook Diversity was not affected by this project, Productivity increased slightly, <0.1%. Abundance increased by 0.3%. The increase was due to an increase in capacity and not productivity.
Summer Steelhead Diversity was not affected by this project. Productivity increased slightly, <0.1% Abundance increased by 0.4%. This project had the lowest benefit to steelhead of the ten recommended projects. This reflects a general assumption in the model that juvenile steelhead a lower affinity for LWD than other species, particularly during the winter when they are found in substrates with high amounts of interstitial space.
Coho Diversity was not affected by this project. Productivity increased slightly, <0.1%. Abundance increased by 0.3%. This project had the lowest benefit to coho of the ten recommended projects analyzed. In contrast to steelhead, juvenile coho have a strong affinity for wood. The amount of benefit for this project was affected by being located lower in the Yakima River and fewer life‐history pathways extending this far down during juvenile winter residence.
Sockeye Benefits from this project would be through improved survival during smolt migration from reduced vulnerability to predators.
It seems unlikely that this project will affect adult survival. Larger structures than those considered here might result in thermal gradients that could provide some thermal refuge benefiting sockeye.
6.2.9 Levee Removal at SR3‐RM89.7
6.2.9.1 Project Objective and Description
The objective of this project is to increase floodplain flow conveyance, riparian habitat, and the extent of the channel migration zone by removing a levee and related rip rap along the toe of the channel.
The existing 3,500 foot levee is immediately adjacent to the main channel along the right bank and the project would remove the entire levee, creating access to a vast area of low elevation floodplain and side channels that may be connected across a range of flows. The project would also revegetate approximately 10 acres of riparian floodplain that is currently agricultural land. The very upstream

Yakama Nation Chapter 6
Recommended Projects and Project Prioritization
Wapato Reach Assessment Report6‐17
April 2012ICF 00703.11
end of floodplain channel may only be connected during high flow, whereas the lower section objective is to connect over a wider range of flows to have fish use into mid‐ to late June.
The riparian revegetation analysis also identified this levee removal project to promote overbank flows that would reconnect the 100‐year channels in the floodplain during flood flows and to encourage river‐floodplain interaction. Encouraging river‐floodplain interaction would benefit riparian vegetation by reestablishing the flood flows that are required for natural riparian vegetation recruitment. CWU identified this property as part of the Meninick North Restoration Property, which is owned by the Yakama Nation, and thus is conducive to larger scale restoration.
Partial benefits would accrue with a levee breach, rather than full removal (e.g., if full removal was cost prohibitive or impractical). However, only full levee removal was recommended and analyzed for biological because it accomplishes process‐based restoration.
6.2.9.2 EDT Analysis of Project Benefits
Biological benefits to salmonids would be derived from improving connection to existing floodplain channel behind levee and establishing a side channel downstream of the levee that could be accessible throughout the winter and spring months and into mid‐June.
In addition, this project would promote the retention of fine sediment into the floodplain, thereby reducing the amount of in‐channel fine sediment. An additional benefit may be improved connection of groundwater sources to provide localized thermal refuge. Vaccaro (2011) noted several areas of localized cooling in this general section of the river.
Table 6‐9 presents the anticipated benefits of this project to salmon and steelhead in terms of the EDT diversity index, productivity, and abundance parameters. The area of low elevation floodplain that would be established is expected to restore a large amount of seasonally flooded wetland habitat. This project is also expected to provide additional side channels habitat and improve in‐channel conditions for juvenile salmonids. The project benefits assume side channels could be established to increase groundwater supply to the river and to provide localized thermal refuge beneficial to juveniles and adults. Additional biological benefits are derived from the deposition of fine sediment on the floodplain.
6.2.10 Levee Removal at SR3‐RM80.1
6.2.10.1 Project Objective and Description
The objective of this project is to increase floodplain flow conveyance, riparian habitat, and the extent of the channel migration zone by removing a levee.
The project would remove an existing 1,000‐foot long levee and riprap along the toe of year‐round side channel, thereby improving access to an existing side channel downstream of the levee and creating access to an area of low elevation floodplain and high flow channels. The existing levee appears to serve no purpose because it has been breached at the downstream end during a high flow event many years ago.

Yakama Nation Chapter 6
Recommended Projects and Project Prioritization
Wapato Reach Assessment Report6‐18
April 2012ICF 00703.11
Table 6‐9. Anticipated Benefits of Levee Removal at SR3‐RM89.7 to Salmon and Steelhead
Species Biological Benefits
Fall Chinook Diversity increased by 2.2%. This project results in the second highest response to diversity for fall Chinook. The project is located downstream of primary fall Chinook spawning areas and benefits are accrued to a high proportion of the population.
Productivity increased by 2.1% due primarily to improved habitat quality during subyearling juvenile rearing. Secondary effects were improved conditions during egg incubation from reduction in fine sediment. Project benefit to egg incubation was not as high as other projects upstream because of location downstream of primary spawning areas.
Abundance increased by 2.4%. Benefit to abundance was nearly as high as Flood Fencing at SR5‐RM105.0 and at SR5‐RM102.0. Those projects benefited fall Chinook because of improvements in egg incubation survival. This project increased abundance because of an increase in subyearling juvenile habitat quantity and quality.
Summer Chinook Diversity increased by 4.7%. Productivity increased by 3.1%. This project is at the very downstream end of possible summer Chinook spawning and effect on egg incubation is limited to a small proportion of the total population. Most of the benefit to productivity was because of improved juvenile habitat quality. There was an increase in adult and juvenile survival from the assumption that this project will improve access to groundwater thermal refuge.
Abundance increased by 4.8%. Summer Chinook abundance response was mostly due to the increase in productivity. The increase in capacity was low suggesting that capacity is constrained by factors upstream of this project.
Spring Chinook Diversity increased by 0.1%, Productivity increased by 0.2%. Abundance increased by 0.7%. This project is a long distance downstream of spring Chinook spawning areas and the benefit is affected by this distance. Benefits are mostly to winter migrants, smolts and adults.
Summer Steelhead Diversity was not affected by this project. Productivity increased by 0.1%. Abundance increased by 1.4%.
Coho Diversity was not affected by this project. Productivity increased by 0.1%. Abundance increased by 1.5%. This project provides habitat for winter residence of juvenile coho. The long distance between this project and upstream coho spawning areas suggests that benefits to coho abundance will be low.
Sockeye Benefits from this project would be through improved survival during smolt migration from reduced vulnerability to predators.
This project would benefit adult sockeye assuming groundwater channels can be developed to provide thermal refuge in close proximity to the main channel.

Yakama Nation Chapter 6
Recommended Projects and Project Prioritization
Wapato Reach Assessment Report6‐19
April 2012ICF 00703.11
The riparian revegetation analysis also identified the benefits of greater flood flows across this floodplain to reactive some older channels and diversify floodplain habitat by promoting the natural regeneration of riparian vegetation.
6.2.10.2 EDT Analysis of Project Benefits
Biological benefits to salmonids would be derived from improving connectivity to floodplain channels and side channels downstream of the levee. Removing the entire length of the levee will ensure the existing side channel remains connected and provide some overbank flow during floods. Removing the levee would likely allow more flood flow to the wetland habitat downstream.
In addition, this project will promote the retention of fine sediment into the floodplain, thereby reducing the amount of in‐channel fine sediment.
Table 6‐10 presents the anticipated benefits of this project to salmon and steelhead in terms of the EDT diversity index, productivity, and abundance parameters. The area of low elevation floodplain and floodplain channels that would be established is expected to restore a large amount of seasonally flooded wetland habitat. This project is expected to also improve conditions in the existing side channel and provide additional side channels habitat for juvenile salmonids. The project benefits assume side channels could be established to increase groundwater supply to the river and to provide localized thermal refuge beneficial to juveniles and adults. Additional biological benefits are derived from the deposition of fine sediment on the floodplain.

Yakama Nation Chapter 6
Recommended Projects and Project Prioritization
Wapato Reach Assessment Report6‐20
April 2012ICF 00703.11
Table 6‐10. Anticipated Benefits of Levee Removal at SR3‐RM80.1 to Salmon and Steelhead
Species Biological Benefits
Fall Chinook Diversity increased by 4.3%. This is the highest response to diversity for fall Chinook. The project is located downstream of primary fall Chinook spawning areas and benefits are accrued to a high proportion of the population.
Productivity increased by 2.0% due primarily to improved habitat quality during subyearling juvenile rearing. Secondary effects were improved conditions during egg incubation from reduction in fine sediment. Project benefit to egg incubation was not as high as other projects upstream because of location downstream of primary spawning areas.
Abundance increased by 3.3%. Benefit to abundance was highest of the recommended projects. This project increased abundance because of increase in subyearling juvenile habitat quantity and quality.
Summer Chinook Diversity increased by 0.9%. This project is downstream of possible summer Chinook spawning areas. The benefit to summer Chinook diversity was through increased survival of juveniles and adults.
Productivity increased by 0.3%. The benefit to productivity was because of improved juvenile habitat quality. There was an increase in adult and juvenile survival from the assumption that this project will improve access to groundwater thermal refuge.
Abundance increased by 1.5%. Summer Chinook abundance increase was mostly due to an increase in capacity. However, the increase was low compared to fall Chinook suggesting that summer Chinook capacity is constrained by factors upstream of this project.
Spring Chinook Diversity increased by 0.2%, Productivity increased by 0.2%. Abundance increased by 0.9%. This project is a long distance downstream of spring Chinook spawning areas and the benefit is affected by this distance. Benefits are mostly to winter migrants, smolts and adults.
Summer Steelhead Diversity was not affected by this project. Productivity increased by 0.1%. Abundance increased by 1.8%. This is the only project downstream of Toppenish Creek and benefits to Toppenish Creek steelhead may be higher because of close proximity to spawning areas. However, juvenile steelhead affinity for floodplain channels is low compared to other salmonids.
Coho Diversity was not affected by this project. Productivity increased by 0.1%. Abundance increased by 1.7%. This project provides habitat for winter residence of juvenile coho. The long distance between this project and upstream coho spawning areas suggests that benefits to coho abundance will be low.
Sockeye Benefits from this project would be through improved survival during smolt migration from reduced vulnerability to predators.
This project would benefit adult sockeye assuming groundwater channels can be developed to provide thermal refuge in close proximity to the main channel.

Yakama Nation Chapter 6
Recommended Projects and Project Prioritization
Wapato Reach Assessment Report6‐21
April 2012ICF 00703.11
6.3 Development of Biological Benefits Scores for Project Prioritization
The following section summarizes benefits across the 10 recommended projects by species. Figures 6‐1 through 6‐5 depict the percent change from current conditions in diversity index, productivity and abundance for each species. Also included are graphs showing how project benefits were categorized into high, moderate or low biological benefit score for each project and species.
Figures 6‐1 through 6‐5 include the thresholds for setting biological benefits scores. The projects were scored based on the percent change in abundance. Abundance was selected because it appears to best reflect differences among projects and includes effect of change in productivity and capacity. Projects with less than 1% change in abundance were ranked Low and received a score of 1. Projects with between 1% and 5% change in abundance were ranked Moderate and received a score of 2. Projects with greater than 5% change in abundance were ranked High and received a score of 3.
Sockeye benefits are not included as a version of EDT has not been developed for sockeye. Sockeye scores were based on a qualitative assessment of likely benefits described in the previous section by project.
Scores from Figures 6‐1 through 6‐5 are summarized in Table 6‐11. For this assessment we averaged scores across all six species to generate a single biological benefit score for salmon and steelhead since previous discussions with the Yakama Nation and TAG indicated no particular preference or “weight” to one species over the others. However, restoration priorities may evolve and ultimately differ between species. In such a case, the Yakama Nation and the TAG could use a weighted average or simply base decisions on scores by particular species of interest.

Yakama Nation Chapter 6
Recommended Projects and Project Prioritization
Wapato Reach Assessment Report6‐22
April 2012ICF 00703.11
Figure 6‐1. EDT Modeled Effect of Recommended Projects on Fall Chinook Population Performance Parameters (Top) and Benefit Scores (Bottom)
0.0%
1.0%
2.0%
3.0%
4.0%
5.0%
6.0%
7.0%
8.0%
9.0%
10.0%
Diversity Index Productivity Abundance
% chan
ge from currrent
SR5 RM 105.0, Rough Elements
SR5 RM 102.9, Bridge Channel
SR5 RM 102.0, Rough Elements
SR5 RM 98.6, Rough Elements
SR4 RM 96.9, Levee Removal
SR4 RM 95.4, Rough Elements
SR4 RM 93.5, Rough Elements
SR3 RM 90.3, Instream Wood
SR3 RM 89.7, Levee Removal
SR3 RM 80.1, Levee Removal
0.0%
1.0%
2.0%
3.0%
4.0%
5.0%
6.0%
7.0%
8.0%
9.0%
10.0%
SR5 RM105.0
SR5 RM102.9
SR5 RM102.0
SR5 RM98.6
SR4 RM96.9
SR4 RM95.4
SR4 RM93.5
SR3 RM90.3
SR3 RM89.7
SR3 RM80.1
% Chan
ge from current
Diversity Index
Productivity
Abundance
High
Moderate
Low

Yakama Nation Chapter 6
Recommended Projects and Project Prioritization
Wapato Reach Assessment Report6‐23
April 2012ICF 00703.11
Figure 6‐2. EDT Modeled Effect of Recommended Projects on Summer Chinook Population Performance Parameters (Top) and Benefit Scores (Bottom)
0.0%
1.0%
2.0%
3.0%
4.0%
5.0%
6.0%
7.0%
8.0%
9.0%
10.0%
Diversity Index Productivity Abundance
% Chan
ge from current
SR5 RM 105.0, Rough Elements
SR5 RM 102.9, Bridge Channel
SR5 RM 102.0, Rough Elements
SR5 RM 98.6, Rough Elements
SR4 RM 96.9, Levee Removal
SR4 RM 95.4, Rough Elements
SR4 RM 93.5, Rough Elements
SR3 RM 90.3, Instream Wood
SR3 RM 89.7, Levee Removal
SR3 RM 80.1, Levee Removal
0.0%
1.0%
2.0%
3.0%
4.0%
5.0%
6.0%
7.0%
8.0%
9.0%
10.0%
SR5 RM105.0
SR5 RM102.9
SR5 RM102.0
SR5 RM98.6
SR4 RM96.9
SR4 RM95.4
SR4 RM93.5
SR3 RM90.3
SR3 RM89.7
SR3 RM80.1
% Chan
ge from current
Diversity Index
Productivity
Abundance
High
Moderate
Low

Yakama Nation Chapter 6
Recommended Projects and Project Prioritization
Wapato Reach Assessment Report6‐24
April 2012ICF 00703.11
Figure 6‐3. EDT Modeled Effect of Recommended Projects on Spring Chinook Population Performance Parameters (Top) and Benefit Scores (Bottom)
0.0%
1.0%
2.0%
3.0%
4.0%
5.0%
6.0%
7.0%
8.0%
9.0%
10.0%
Diversity Index Productivity Abundance
% Chan
ge from current
SR5 RM 105.0, Rough Elements
SR5 RM 102.9, Bridge Channel
SR5 RM 102.0, Rough Elements
SR5 RM 98.6, Rough Elements
SR4 RM 96.9, Levee Removal
SR4 RM 95.4, Rough Elements
SR4 RM 93.5, Rough Elements
SR3 RM 90.3, Instream Wood
SR3 RM 89.7, Levee Removal
SR3 RM 80.1, Levee Removal
0.0%
1.0%
2.0%
3.0%
4.0%
5.0%
6.0%
7.0%
8.0%
9.0%
10.0%
SR5 RM105.0
SR5 RM102.9
SR5 RM102.0
SR5 RM98.6
SR4 RM96.9
SR4 RM95.4
SR4 RM93.5
SR3 RM90.3
SR3 RM89.7
SR3 RM80.1
% Chan
ge from current
Diversity Index
Productivity
Abundance
High
Moderate
Low

Yakama Nation Chapter 6
Recommended Projects and Project Prioritization
Wapato Reach Assessment Report?? PAGE \*
MERGEFORMAT 6
April 2012ICF 00703.11
Figure 6‐4. EDT Modeled Effect of Recommended Projects on Summer Steelhead Population Performance Parameters (Top) and Benefit Scores (Bottom)
0.0%
1.0%
2.0%
3.0%
4.0%
5.0%
6.0%
7.0%
8.0%
9.0%
10.0%
Diversity Index Productivity Abundance
% Chan
ge from current
SR5 RM 105.0, Rough Elements
SR5 RM 102.9, Bridge Channel
SR5 RM 102.0, Rough Elements
SR5 RM 98.6, Rough Elements
SR4 RM 96.9, Levee Removal
SR4 RM 95.4, Rough Elements
SR4 RM 93.5, Rough Elements
SR3 RM 90.3, Instream Wood
SR3 RM 89.7, Levee Removal
SR3 RM 80.1, Levee Removal
0.0%
1.0%
2.0%
3.0%
4.0%
5.0%
6.0%
7.0%
8.0%
9.0%
10.0%
SR5 RM105.0
SR5 RM102.9
SR5 RM102.0
SR5 RM98.6
SR4 RM96.9
SR4 RM95.4
SR4 RM93.5
SR3 RM90.3
SR3 RM89.7
SR3 RM80.1
% Chan
ge from current
Diversity Index
Productivity
Abundance
High
Moderate
Low

Yakama Nation Chapter 6
Recommended Projects and Project Prioritization
Wapato Reach Assessment Report6‐26
April 2012ICF 00703.11
Figure 6‐5. EDT Modeled Effect of Recommended Projects on Coho Population Performance Parameters (Top) and Benefit Scores (Bottom)
0.0%
1.0%
2.0%
3.0%
4.0%
5.0%
6.0%
7.0%
8.0%
9.0%
10.0%
Diversity Index Productivity Abundance
% Chan
ge from current
SR5 RM 105.0, Rough Elements
SR5 RM 102.9, Bridge Channel
SR5 RM 102.0, Rough Elements
SR5 RM 98.6, Rough Elements
SR4 RM 96.9, Levee Removal
SR4 RM 95.4, Rough Elements
SR4 RM 93.5, Rough Elements
SR3 RM 90.3, Instream Wood
SR3 RM 89.7, Levee Removal
SR3 RM 80.1, Levee Removal
0.0%
1.0%
2.0%
3.0%
4.0%
5.0%
6.0%
7.0%
8.0%
9.0%
10.0%
SR5 RM105.0
SR5 RM102.9
SR5 RM102.0
SR5 RM98.6
SR4 RM96.9
SR4 RM95.4
SR4 RM93.5
SR3 RM90.3
SR3 RM89.7
SR3 RM80.1
% Change from current
Diversity Index
Productivity
Abundance
High
Moderate
Low

Yakama Nation Chapter 6
Recommended Projects and Project Prioritization
Wapato Reach Assessment Report6‐27
April 2012ICF 00703.11
Table 6‐11. Biological Benefits Scores
Project Fall
Chinook Summer Chinook
Spring Chinook
Summer Steelhead Coho Sockeye
Average Across All Species
Channel roughness elements at SR5‐RM105.0
2 3 2 2 2 1 2.0
Channel reconstruction, instream wood, and flood fencing at SR5‐RM102.9
1 1 1 2 2 1 1.3
Channel roughness elements at SR5‐RM102.0
2 3 2 2 2 1 2.0
Channel roughness elements at SR5‐RM98.6
2 2 1 2 2 1 1.7
Channel roughness elements at SR4‐RM96.9
2 3 1 2 2 1 1.8
Channel roughness elements at SR4‐RM95.4
2 2 1 2 2 1 1.7
Channel roughness elements at SR4‐RM93.5
2 3 1 2 2 1 1.8
Instream wood at SR3‐RM90.3
1 1 1 1 1 1 1.0
Levee removal at SR3‐RM89.7
2 2 1 2 2 1 1.7
Levee removal at SR3‐RM80.1 2 2 1 2 2 1 1.7
The common themes explaining differences among projects by species were differences in attributes affected, project location relative to spawning areas, and size of project. Projects that affected egg incubation survival had a higher benefit to productivity (e.g., fall Chinook and summer Chinook). Location relative to spawning areas tended to reduce benefits (e.g., projects lower in the reach were not as beneficial to summer Chinook and coho). Finally, projects that affected a smaller portion of the overall reach had a lower benefit. Projects generally had a low effect on diversity index for coho, steelhead and spring Chinook because this parameter is largely determined by conditions encountered outside of the Wapato Reach.
The primary benefits of projects which would add channel roughness elements were the removal of bedload fine sediment which primarily benefited fall Chinook and summer Chinook egg incubation. The channel roughness elements proposed for SR5 at RM 105.0 and RM 102.0 had consistently the highest influence on abundance for all species. These projects influenced the amount fine sediment in the reach, provided habitat complexity, and reduced predation risk. The analysis assumed these two projects were similar in size and effect.

Yakama Nation Chapter 6
Recommended Projects and Project Prioritization
Wapato Reach Assessment Report6‐28
April 2012ICF 00703.11
SR3‐RM80.1 levee removal also scored high, but the effect varied among species. This project was the highest for fall Chinook diversity index and abundance. The project did not have a large effect on fine sediment affecting egg incubation as the project was downstream of primary fall Chinook spawning areas, so benefits to productivity were low. Levee removal projects generally benefited species with juvenile rearing in the Wapato Reach.
SR5‐RM102.9 bridge channel did not affect a large portion of the reach and thus benefits tended to be lower than for other projects.
The instream wood project (SR3‐RM90.3) consistently scored the lowest across species. The project evaluated in this assessment was fairly narrow in geographic scope and was included as an example of instream wood projects that could be constructed at a number of geomorphically appropriate locations in the reach. LWD projects would likely be more beneficial when combined with, or following projects to restore large‐scale process to remove fine sediment from the channel (flood fencing) and increase floodplain connectivity (levee removal).
Not surprisingly, none of the projects completely address “the one factor” affecting survival. Results suggest that multiple factors are affecting population performance at different life stages. This suggests that combinations of projects would result in benefits that exceed the simple sum of the project benefits reported in this analysis. For example, a combination of projects to improve egg incubation survival and juvenile habitat quantity and quality would likely result in synergistic benefits; increased survival at multiple life stages would accumulate through the life cycle.
6.4 Project Prioritization Framework The overarching hierarchical framework used in this reach assessment for recommending and prioritizing projects emphasizes protection and process‐based restoration as the highest priority, followed by habitat enhancement including instream wood and riparian revegetation (Figure 1‐1). This process‐based hierarchical framework follows that originally presented by Roni et al. (2002) and is based on three elements: 1) using the principles of watershed processes, 2) protecting and maintaining functional habitat to slowing or stop further degradation, and 3) utilizing current knowledge of the effectiveness of specific techniques.
Table 6‐12 illustrates how the Wapato Reach restoration objectives, identified using EDT, follows this type of hierarchical framework.

Yakama Nation Chapter 6
Recommended Projects and Project Prioritization
Wapato Reach Assessment Report6‐29
April 2012ICF 00703.11
Table 6‐12. Hierarchical Framework Used for Project Prioritization
Priority Hierarchical Prioritization
Framework Wapato Restoration Objectives
Highest Priority Protect and Maintain Processes
Protection
High Priority Reconnect or Reestablish Processes
Establish or promote the engagement of floodplain channels across a range of flows
Establish or promote the engagement of side channel across a wide range of flows
Encourage development of a meandering planform by establishing vegetated channel islands.
Rip rap removal
Moderate Priority
Habitat Enhancement Install instream wood Riparian revegetation
Protection projects were evaluated and ranked based on the preservation of areas that currently exhibit features and resources indicative of functional riverine processes, including extensive acres of riparian forest and extensive linear feet of channels engaged at 10‐year flows and/or at 2‐year flows (Section 5.2.1, Protection Locations). Protection results were delivered to the Yakama Nation as a separate document.
Process‐based restoration and habitat enhancement projects (e.g., installing instream wood and riparian revegetation) were evaluated and ranked according to the methods as described below.
6.5 Restoration Project Prioritization The 10 recommended restoration projects identified through the above screening process were prioritized using a project ranking matrix. The matrix combines a simple scoring system incorporating a variety of common evaluation criteria with the multispecies evaluation of population parameters in EDT (Section 6.3). This approach integrates the types of criteria that are typically considered when evaluating the relative merits of possible restoration projects with the relative degree of potential benefit to the particular salmon and steelhead species (and life history stages) using the Wapato Reach.
This type of scoring system allows projects to be compared based on total score and/or component scores (e.g., biological benefit or cost) and is considered a “logic approach” as described in Beechie et al. (2008). The advantages of this type of scoring system are 1) transparency because the criteria and scores used to rank the projects are clearly presented (Section 6.6.1) and 2) flexibility because the criteria can be modified to address changes in restoration goals, species needs or population status, socioeconomic conditions, or societal priorities.
The disadvantages of this type of scoring system are that there can be a high degree of subjectivity and professional judgment in choosing the criteria, developing equivalency across multiple criteria, determining if any criteria should be weighted and by how much, and assigning scores to projects. To counter these disadvantages, the project team internally vetted the EDT effects analysis and the criteria, scores, and project ranks to ensure the scores were logical and reflected a general consensus among the team. None of the scores were weighted, nor were the biological benefit scores

Yakama Nation Chapter 6
Recommended Projects and Project Prioritization
Wapato Reach Assessment Report6‐30
April 2012ICF 00703.11
weighted in favor of a particular species. The average biological benefit score for each project from Table 6‐11 was then incorporated into the prioritization matrix.
The 10 recommended restoration projects were ranked by their scores for biological benefit, project response time, cost, and complexity score, as described below. While this method does not explicitly “weight” the benefits to salmonids as a group or to any particular species using the Wapato Reach, there are many components to the biological benefit score (as described in Section 6.2 and 6.3) to reflect the Wapato Reach Assessment’s overall goal of restoring habitat for the variety of salmonid species and life‐history stages that are utilizing the reach.
6.5.1 Evaluation Criteria and Scoring
6.5.1.1 Biological Benefits Scores
Application of a biological benefit score was based on the percent change over existing conditions in the three EDT population performance metrics (diversity index, productivity, and abundance, as presented in Sections 6.2 and 6.3) of each recommended process‐based restoration project.
The biological benefit scores range from 1 to 3, with 3 reflecting the projects with the highest average percentage, as listed below.
3—Average of greater than 5% change in combined EDT population performance metrics (diversity index, productivity, and abundance) across the salmonid species.
2—Average of between 1% and 5% change in combined EDT population performance metrics across the salmonid species.
1—Average of less than 1% average change in combined EDT population performance metrics across the salmonid species.
6.5.1.2 Project Response Time Scores
Application of a project response time score was based on the relative time period until a biological benefit to the salmonid species would be expected based on the scale and nature of each recommended process‐based restoration project.
The project response time scores range from 1 to 3, with 3 reflecting the projects with the shortest anticipated response time, as listed below.
3—Short response time, species experience full benefit immediately following implementation.
2—Moderate response time, species experience benefits within 5 years following implementation.
1—Long response time, species experience benefits within 20 years following implementation.
6.5.1.3 Project Cost Score
The project cost score reflects the estimated cost for the project based on construction materials and techniques. Estimated project costs included estimated add‐on costs for design and permitting, construction management, and a contingency as percentages of the subtotal cost of the construction items. Costs assumed competitive bid with prevailing wages required. Lower costs could be

Yakama Nation Chapter 6
Recommended Projects and Project Prioritization
Wapato Reach Assessment Report6‐31
April 2012ICF 00703.11
achieved by utilizing in‐house labor for construction, but it was not possible to estimate the degree to which that could be achieved for particular projects at this phase of the process.
The cost scores range from 1 to 4, with 4 reflecting relatively lower cost projects with general characteristics, as listed below.
3—Low relative cost = less than $250,000
Uses low cost techniques
Minimal excavation and hauling distance of spoils
Little to no planting or weed control
No dewatering required
Easy access conditions
2—Moderate relative cost = $251,000 to $500,000
Uses moderate cost techniques (e.g., typical log jam structures)
Moderate to high excavation and hauling distance of spoils
Typical Planting or invasive weed control ranging from typical to complex
No dewatering requirements to standard requirements
Moderate access conditions
1—High relative cost = greater than $500,000
Uses high cost techniques (e.g., constructed banks, highly engineered log jams, extensive channel contouring)
Deep excavation or long distance hauling of spoils
Entails construction of additional new flood control or bank erosion features
Extensive planting or invasive weed control over several years
Intensive dewatering requirements
Limited, difficult, or remote access
6.5.1.4 Project Complexity Score
The project complexity score reflects the estimated complexity of the project based on the number, nature, and types of permits necessary for the project and the number and nature of property ownership at the project location and along access routes necessary for project construction.
The complexity score ranges from 1 to 3, with 3 reflecting relatively lower complexity projects with general characteristics, as listed below.
3—Low complexity
Relatively simple permitting
Yakama Nation property ownership
2—Moderate complexity

Yakama Nation Chapter 6
Recommended Projects and Project Prioritization
Wapato Reach Assessment Report6‐32
April 2012ICF 00703.11
Multiple land owners, but limited to Yakama Nation and Washington State government
More involved permitting, includes in‐water work
1—High complexity
Multiple land owners including private property owners
Complex permitting process involving multiple federal, state, and local government agencies
Complex design and construction
6.5.1.5 Roni’s Hierarchy Score
The Roni’s hierarchy score reflects the project prioritization framework emphasize on process‐based restoration objectives as the highest priority. A hierarchy score was applied to the projects as follows to reflect the higher priority of process‐based projects.
3—Reconnect or reestablish processes.
Reduce channel migration by establishing vegetated channel islands.
Establish or promote the engagement of floodplain channels across a range of flows.
Establish or promote the engagement of side channel across a wide range of flows.
Remove rip‐rap.
1—Habitat enhancement.
Install instream wood.
Riparian revegetation.
6.5.1.6 Effect Certainty Score
The effect certainty score reflects the estimated certainty of a project’s effectiveness to achieve its stated restoration objectives. The certainty score is based on the number of components of the project and the amount of information available from previous project implementation in the area. This score rated the levee removal projects as higher certainty of effect because the action is largely the removal of a human placed structure affecting natural riverine processes. Flood fences were rated as lower certainty of effect because they have several components that must work together (flood fencing structures, riparian planting, and flood flow) for the project to be effective and their effectiveness depends on sediment and debris supply (which are partial data gaps in the Wapato Reach).
The certainty score ranges from 1 to 3, with 3 reflecting relatively higher certainty of achieving project objectives. Effect certainty was scored based on the following characteristics:
3—Higher certainty of effect
Few components to the design and simple execution of the project to achieve desired effect
No data gaps for key components of project function
2— Moderate certainty of effect
Several components to the design

Yakama Nation Chapter 6
Recommended Projects and Project Prioritization
Wapato Reach Assessment Report6‐33
April 2012ICF 00703.11
More complex execution required
Few to no data gaps for key components of project function
1— Lower certainty of effect
Multiple components to the design and execution of the project, including biological components, and dependency of biological components of the design on river conditions (e.g., live poles that must sprout; recruitment, germination, and growth of plant propagules; river’s surface water elevation relative to ground elevation and effect on cottonwood seedling establishment)
Limited data for some key components of project function (e.g., sediment sources and load, debris sources and load)
6.5.2 Additional Ranking Criteria (for future consideration)
Additional ranking criteria, such as landowner acceptability, social feasibility, recreational benefit, or synergies with management plans could be added into this ranking matrix (Table 6‐13) by the Yakama Nation and the TAG if additional data specific to these criteria were developed. Additional biological criteria such as riparian recruitment potential, benefits to floodplain wetlands, and/or support for culturally valuable plant species could easily be included with additional biological data and input from the Yakama Nation on priority plant species.
Examples of the types of considerations which could be used in such criteria are described below for social and economic feasibility and for project sequencing because these are two of the more common criteria including in such ranking matrices.
6.5.2.1 Social Feasibility
A social designation could include the overall feasibility of being able to implement the project within a 10‐year timeframe, based on criteria such as community support, political support, and grant funding possibilities.
3—Higher feasibility: Few constraints that could affect project implementation
High community support
Meet objectives of existing management plans
Meets multiple tribal priorities
Has recreational benefits or does not impact recreation
2—Moderate feasibility: There are potential social feasibility constraints that could affect the likelihood of project implementation.
Limited community support
Partially meets objectives of existing management plans
Meets some tribal priorities
Likely to have some impacts on recreation

Yakama Nation Chapter 6
Recommended Projects and Project Prioritization
Wapato Reach Assessment Report 6‐34
April 2012ICF 00703.11
Table 6‐13. Prioritized Matrix of Wapato Reach Process‐Based Restoration Projects
Project ID Project Type(s)
Biological Benefit Score
Response Time Score
Project Cost Score
Project Complexity
Score
Roni’s Hierarchy Score
Effect Certainty Score
Social Feasibility
Project Sequencing
Total Score
SR3‐RM80.1 Levee removal 1.7 3 3 1 3 3 For example, not scored
For example, not scored
14.7
SR4‐RM96.9 Levee removal 1.8 3 2 1 3 3 ‐ ‐ 13.8
SR3‐RM89.7 Levee removal 1.7 3 2 1 3 3 ‐ ‐ 13.7
SR4‐RM95.4 Channel roughness elements
1.7 1 3 2 3 1 ‐ ‐ 11.7
SR5‐RM102.9 Channel reconstruction, instream wood, and flood fencing
1.3 3 1 1 3 2 ‐ ‐ 11.3
SR5‐RM102.0 Channel roughness elements
2.0 1 2 2 3 1 ‐ ‐ 11.0
SR5‐RM105.0 Channel roughness elements
2.0 1 2 2 3 1 ‐ ‐ 11.0
SR3‐RM90.3 Instream wood 1.0 2 3 2 1 2 ‐ ‐ 11.0
SR4‐RM93.5 Channel roughness elements
1.8 1 2 2 3 1 ‐ ‐ 10.8
SR5‐RM98.6 Channel roughness elements
1.7 1 2 2 3 1 ‐ ‐ 10.7

Yakama Nation Chapter 6
Recommended Projects and Project Prioritization
Wapato Reach Assessment Report6‐35
April 2012ICF 00703.11
1—Lower feasibility: There are known social feasibility constraints that would be expected to limit the ability to implement the project
Opposition from the community
Does not meet existing priorities in the management plans
Does not meet tribal priorities
Likely to have a significant impact on recreation
6.5.2.2 Project Sequencing
Project sequencing and dependence on other social, political, or physical actions is another factor that could be considered in future iterations of the project ranking matrix. The degree to which recommended actions could be dependent on larger scale actions could be incorporated into a sequencing criteria for ranking restoration actions, or could be considered separately as more of an over‐arching consideration. Key questions related to project sequencing could include the following.
Can the project be constructed as “stand alone?”
Will the project preclude a higher biological priority project that is not currently feasible?
Is the project part of a “cluster” of other projects that need to be addressed as a whole?
Does the project need to be constructed before other high priority projects to facilitate achievement of their benefits?
Does the project need to be constructed after other high priority projects because it is dependent on their processes to achieve its benefits?
6.6 Enhancement Project Prioritization
6.6.1 Installation of Instream Wood
Although the Roni et al. (2002) hierarchy considers habitat enhancement projects as lower priority than protection or process‐based restoration projects, the Wapato Reach has many areas appropriate for and which may benefit from the installation of instream wood.
Installation of instream wood at RM 90.3 is included in the prioritization matrix (and depicted in Appendix E) to illustrate how this type of project could compare in priority to the process‐based restoration projects. This instream wood project is a good example of appropriate type of location, cost, and description for instream wood projects in the Wapato Reach.
The identification of 102 geomorphically appropriate locations for this type of project (many in subreaches 1 and 2) creates the opportunity for creating a similar matrix focused on prioritizing instream wood projects. Such a matrix could be developed with additional information regarding the specific potential locations identified for instream wood (e.g., construction access, water velocities, and bank conditions).

Yakama Nation Chapter 6
Recommended Projects and Project Prioritization
Wapato Reach Assessment Report6‐36
April 2012ICF 00703.11
6.6.2 Riparian Revegetation
The benefits of projects focused solely on riparian revegetation and thus their priority relative to more process‐based restoration projects is difficult to determine without additional details on the specific locations identified as geomorphically appropriate. Consequently, the riparian revegetation projects were prioritized as a group, separate from the other recommended projects.
The recommended riparian revegetation sites were categorized into High, Medium and Low priority (Table 6‐14) by totaling the acres and linear miles of bank. Sites with the greatest amount of potential riparian acres or linear feet of denuded bank needing revegetation ranked the highest. Riparian revegetation projects near aggrading HEC‐RAS analysis segments were prioritized, while revegetation projects near degrading HEC‐RAS analysis segments were considered lower priority. Appendix E illustrates the location of the high priority riparian revegetation projects.
Riparian revegetation projects could also be considered (and could rise in comparative priority to other projects) where high water temperatures are a limiting factor for fish populations or in locations where bank stabilization is a major objective. It may also be beneficial to identify individual riparian restoration project sites and highlight opportunities for coupling several sites together for a reach‐based riparian project implementation. There are also opportunities to integrate additional project prioritization criteria into these riparian revegetation projects by adding cost and social criteria into a matrix specifically focused on riparian projects.
For some areas identified in Subreach 2 and 1, the data showed the possibility of riparian restoration actions. Much of these areas are set aside as wildlife habitat and are likely less affected by land use. Therefore, existing vegetation patterns probably reflect the vegetation communities possible in these areas. While labor‐intensive riparian planting is likely better focused on areas upstream of the lower reach with heavier land use impacts, these lower reach areas may serve as valuable reference sites. Reference sites can be used for determining species mixtures, spacing, viable canopy coverage, and understory densities that could be anticipated in upstream areas. Soil survey information such as soil type, suitability to specific plant species, and depth to water table should also be considered when designing specific revegetation sites.
Finally, it should be noted that restoring large‐scale functional attributes to the river‐floodplain system including over bank flow, floodplain aquifer recharge, channel formation, and wood recruitment would benefit natural riparian revegetation processes. For example, over bank flow reduces flood energy, which promotes alluvial deposition on the floodplain and seed dispersal. Floodplain aquifer recharge maintains higher water tables which encourages recruitment of seedlings. Channel formation diversifies floodplain flow paths and promotes microhabitat formation and vegetation diversity. Finally, wood recruitment from the floodplain to the channel will diversify fish habitat, and log jams also promote deposition of alluvial material which can serve as surfaces for recruitment of riparian vegetation. The types of process‐based restoration projects recommended herein support restoration of these types of functional attributes and thus are expected to benefit natural riparian revegetation processes within the reach.

Yakama Nation Chapter 6
Recommended Projects and Project Prioritization
Wapato Reach Assessment Report 6‐37
April 2012ICF 00703.11
Table 6‐14. Prioritization of Riparian Revegetation Locations Listed in Descending Order by River Mile within Each Priority Category
Subreach Upstream River Mile
Downstream River Mile Acres
Miles of Bank
Frontage Geomorphic Potential Priority Description
5 105.2 102.87 29.6& 7.2
1.8 Stable/minor change (3‐4)
High Side channel riparian revegetation along channel that originates at RM 105.2 and rejoins at RM 103.75 and 102.87. Low acreage along the side channel and low miles of river bank frontage, but side channel is fairly denuded. Prioritized because off‐channel habitat is a restoration objective.
4 94.45 93 135.5 1.4 HEC‐RAS data gap
High Riparian revegetation on the right bank of the right channel to shade and stabilize; moderate acreage and good bank frontage; bedload potential unknown due to HEC‐RAS data gap. Prioritize if the site is aggrading or is stable/minor change.
3 87.67 85.93 89.2 1.8 Minor change to high aggradation potential (4‐6)
High Riparian revegetation along left bank and right bank for 500 ft. Moderate acreage and high bank frontage.
3 81.69 80.53 261.7 1.2 Stable/minor change (4)
High Riparian revegetation on both banks. High acreage and high bank frontage.
2 80.53 78.24 78.24 2.3 Stable/minor change (4)
High Riparian revegetation along a side channel that originates at RM 80.53 and rejoins at RM 78.24. Moderate acreage, long bank frontage on side channel.
5 102.33 100.7 467.9 3.3 Moderate to high aggradation potential (5‐6)
Medium Riparian revegetation on right and Left bank. Large acreage and long bank frontage, but the area is already reasonably well vegetated.
4 98.1 97.95 8.9 0.1 Extreme to high degradation potential (1‐2)
Low Riparian revegetation on right bank. Denuded area. Low acreage, short bank frontage. Extreme to high degradation potential (1‐2) possibly due to the bridge. Construct as a part of a larger restoration action that involves improving the bridge structure.

Yakama Nation Chapter 6
Recommended Projects and Project Prioritization
Wapato Reach Assessment Report 6‐38
April 2012ICF 00703.11
Subreach Upstream River Mile
Downstream River Mile Acres
Miles of Bank
Frontage Geomorphic Potential Priority Description
3 90.25 89.26 97.2 1.0 Stable/minor change (3‐4)
Low Riparian revegetation along left bank Low acreage but high bank frontage.
3 85.21 84.95 13.2 0.3 Stable/minor change (4)
Low Riparian revegetation along left bank. Low acreage and low bank frontage.
3 82.88 82.69 8.4 0.4 Stable/minor change (4)
Low Riparian revegetation along right bank. Low acreage and low bank frontage.

Yakama Nation Chapter 6
Recommended Projects and Project Prioritization
Wapato Reach Assessment Report6‐39
April 2012ICF 00703.11
6.7 Cumulative Biological Benefits We fully anticipate that the resultant ranking criteria, scores, and prioritization matrix (Table 6‐13) will be a “living tool” and will be refined by the Yakama Nation and TAG over time as other projects and criteria are developed and through the addition of other factors (examples suggested above) to reflect social and tribal priorities. The prioritization matrix (in its current form or with additional refinements) can be used to support grant applications that require prioritization based on a watershed or reach assessment of habitat conditions.
EDT was used at the request of the TAG and Yakama Nation to analyze the potential cumulative biological benefits of implementing all ten recommended process‐based restoration projects (Figure 6‐6). Such analysis was requested to help reflect the context and importance of the Wapato Reach within the larger Yakima River basin and to illustrate the potential effects of projects such as levee removals and channel planform modifications on downstream habitats relative to projects being considered elsewhere in the basin as part of other restoration planning efforts.
6.7.1 Cumulative Biological Benefits on Population Performance Parameters
The cumulative analysis used the standard procedures in EDT to build a scenario that is comprised of multiple projects. Projects are combined in EDT using a formula that assumes that multiple projects operate on the remaining restoration potential. The combined effectiveness of a suite of projects affecting the same reach and attribute is calculated as follows:
N
iiR eE
1
11
Where e is the individual project effectiveness assumption and ER is the combined restoration effectiveness across all projects.
These results described below highlight the degree to which the same project can affect salmonid species differently. These results similarly highlight that understanding species life history is important, that the relationship between species life stage habitat requirements and conditions is important, and that project benefits are not likely uniform across all fish within a population. Models are important in that they can include these complexities without loss of clarity. EDT provides a useful tool for analyzing species‐specific benefits across a suite of potential restoration actions, particularly if biological, economic, social, and/or political factors prioritize one species (e.g., ESA‐listed species) or a particular set of constraints over others in a basin (e.g., flow regulation versus habitat restoration).

Yakama Nation Chapter 6
Recommended Projects and Project Prioritization
Wapato Reach Assessment Report6‐40
April 2012ICF 00703.11
Figure 6‐6. EDT Modeled Effect of Combined Recommended Projects on Fall Chinook, Summer Chinook, Spring Chinook, Steelhead and Coho Population Performance Parameters Diversity
Notes: Population Performance Parameters Diversity (top), Productivity (middle), and Abundance (bottom)
The potential combined benefit of implementing all 10 recommended projects (Figure 6‐6) is similar to the potential benefits of each individual project (Figures 6‐1 through 6‐5). Fall Chinook and summer Chinook would benefit the most from implementation of the recommended projects in large part because of the large spatial overlap of these populations and the Wapato Reach. Projected increases in productivity of fall and summer Chinook are a result of improvements to egg incubation survival through project effects that would remove in‐channel fine sediment. Fall Chinook benefited more because assumed distribution of spawners coincided with the Wapato Reach more than summer Chinook. Primary spawning locations for summer Chinook are assumed to be just upstream of the Wapato Reach. The greater increase in summer Chinook abundance relative to fall Chinook was a response improved habitat quality and quantity (both affecting abundance) affecting juvenile survival in the Wapato Reach.
0.0%
5.0%
10.0%
15.0%
20.0%
25.0%
30.0%
Fall Chinook Summer Chinook Spring Chinook SummerSteelhead
Coho
% Chan
ge from current
Diversity Index
0.0%
5.0%
10.0%
15.0%
20.0%
25.0%
30.0%
35.0%
40.0%
Fall Chinook Summer Chinook Spring Chinook SummerSteelhead
Coho
% Chan
ge from current
Productivity
0.0%
5.0%
10.0%
15.0%
20.0%
25.0%
30.0%
35.0%
40.0%
Fall Chinook Summer Chinook Spring Chinook SummerSteelhead
Coho
% Chan
ge from current
Abundance

Yakama Nation Chapter 6
Recommended Projects and Project Prioritization
Wapato Reach Assessment Report6‐41
April 2012ICF 00703.11
While there was not a projected benefit to diversity index for coho when evaluating the individual projects, the combined analysis positively affected the diversity index for coho by the cumulative improvements of all projects on productivity. However, under current conditions, the diversity index is very low for coho and thus any small increase will be reflected in this output as a large increase in percentage.
6.7.2 Cumulative Benefits to Productivity and Capacity
A more detailed analysis of the combined projects provided additional insight into the potential combined project benefits specifically on population productivity and abundance. EDT computes the productivity and abundance of an entire population from weighted mean productivity and capacity from several thousand computer‐generated life history trajectories (i.e., pathways through the environment [Mobrand et al. 1997]). These trajectories vary by spawning location and life history expression and each represents an independent estimate of the Beverton‐Holt productivity and capacity parameters. Patterns of change in these parameters can thus provide insight into project effects i.e., a shift in productivity is due to improvements in habitat quality such as reduction in fine sediment, a shift in capacity is largely due to improvements in habitat quantity, but also habitat quality depending on the life stage. A feature of the Beverton‐Holt function is that capacity is more strongly affected by habitat quality in later life stages.
Figures 6‐7 through 6‐11 present cumulative productivity and capacity across the several thousand life history trajectories modeled for fall Chinook, summer Chinook, spring Chinook, summer steelhead, and coho. Not all trajectories were plotted for each species. The fall Chinook figure only includes trajectories encountering the Wapato Reach. All trajectories are shown for summer Chinook, spring Chinook and summer steelhead. The coho figure only shows trajectories originating from the lower 19 miles of Ahtanum Creek. A linear regression line was overlaid for each species and scenario to help visualize the pattern of change in productivity and capacity among the trajectories.
6.7.2.1 Fall Chinook
The results for fall Chinook (Figure 6‐7) show the strong correlation between productivity and capacity inherent in the Beverton‐Holt function, but more importantly the trend is towards a greater increase in productivity among the trajectories as indicated by the steeper regression line slope for the combined projects. However, capacity also increased indicating that the combined projects benefited fall Chinook in terms of improved habitat quality and quantity, further reinforcing our conclusion that projects recommended for the Wapato Reach are of high value to improving conditions for fall Chinook. Figure 6‐7 only shows trajectories originating from the Wapato Reach, whereas population results reported for each individual project and the combined analysis included these trajectories and trajectories originating downstream of the reach that were not affected by the projects.

Yakama Nation Chapter 6
Recommended Projects and Project Prioritization
Wapato Reach Assessment Report6‐42
April 2012ICF 00703.11
Figure 6‐7. EDT Modeled Current and Combined Recommended Projects Effect on Cumulative Productivity and Capacity of Fall Chinook
6.7.2.2 Summer Chinook
A much more diverse set of life history trajectories was assumed for summer Chinook compared to fall Chinook. These trajectories included subyearling and yearling migrants of varying exposure to mainstem Yakima conditions. This diversity is reflected in the greater variation in productivity and capacity shown in Figure 6‐8. The results for summer Chinook also show an increase in productivity. Spawning distribution of summer Chinook includes subreach 5 (which includes four of the 10 recommended projects) and therefore a portion of summer Chinook life history trajectories are affected by the reduction in fine sediment during egg incubation. Summer Chinook results also include a broader shift towards increased capacity affecting all trajectories included in the model.
Figure 6‐8. EDT Modeled Current and Combined Recommended Projects Effect on Cumulative Productivity and Capacity of Summer Chinook
0.0
5.0
10.0
15.0
20.0
25.0
0.00 0.20 0.40 0.60 0.80 1.00 1.20 1.40 1.60 1.80
Productivity
Capacity Index
Current Combined Projects
0.0
2.0
4.0
6.0
8.0
10.0
12.0
14.0
16.0
0.00 0.10 0.20 0.30 0.40 0.50 0.60
Productivity
Capacity Index
Current Combined Projects

Yakama Nation Chapter 6
Recommended Projects and Project Prioritization
Wapato Reach Assessment Report6‐43
April 2012ICF 00703.11
6.7.2.3 Spring Chinook and Summer Steelhead
Spring Chinook and summer steelhead results show a slight increase in capacity and a very small increase in productivity (Figure 6‐9), similar to the pattern for summer steelhead (Figure 6‐10). These species are entering the Wapato Reach at older juvenile life stages and conditions affecting productivity are largely defined earlier in the life history.
There was a slightly greater shift in capacity for a subset of spring Chinook trajectories compared to summer steelhead reflecting differences in habitat preferences between the species. Specifically, spring Chinook are responding more to modeled changes in channel planform than steelhead. Because this response was only for a small subset of spring Chinook trajectories, it was not evident in the overall abundance effect of the combined projects on spring Chinook (Figure 6‐6). Thus, the combined projects are projected to have a greater effect on summer steelhead abundance than on spring Chinook abundance.
In contrast, the projected benefits seemed to be consistent across all trajectories for summer steelhead; there did not appear to be a subset of trajectories that responded much better to the new conditions than other trajectories. These results reflect an assumption in the steelhead life stage rules in EDT that channel planform in the Wapato Reach is generally not preferred juvenile steelhead habitat. This suggests that projects targeted toward benefits to summer steelhead should focus on directly reducing predation risk during smolt migration rather than on habitat improvements.
Figure 6‐9. EDT Modeled Current and Combined Recommended Projects Effect on Cumulative Productivity and Capacity of Spring Chinook
0.0
2.0
4.0
6.0
8.0
10.0
12.0
0.00 0.01 0.02 0.03 0.04 0.05 0.06 0.07 0.08 0.09 0.10
Productivity
Capacity Index
Current Combined Projects

Yakama Nation Chapter 6
Recommended Projects and Project Prioritization
Wapato Reach Assessment Report6‐44
April 2012ICF 00703.11
Figure 6‐10. EDT Modeled Current and Combined Recommended Projects Effect on Cumulative Productivity and Capacity of Summer Steelhead
6.7.2.4 Coho
In contrast to Chinook and steelhead, the projected cumulative biological benefit to coho was much smaller (<0.3% compared to 15‐20% for fall Chinook) and the model projects a greater increase in capacity than to productivity. Figure 6‐11 shows productivity and capacity for subset of trajectories originating from lower Ahtanum Creek. The two regression lines are nearly equal and the shift with the combined projects is more towards an increase in capacity, indicating a strong response to restoration of channel planform, side channel habitat and off‐channel habitat. Trajectories originating from higher in Ahtanum Creek did not show as distinct a pattern of increase in capacity, suggesting, not surprisingly, that conditions in the Wapato Reach are more important for coho low in the system, which are more likely to migrate into the Wapato Reach early in their juvenile life history.
0.0
0.2
0.4
0.6
0.8
1.0
1.2
0.00 0.01 0.01 0.02 0.02 0.03
Productivity
Capacity Index
Current Combined Projects

Yakama Nation Chapter 6
Recommended Projects and Project Prioritization
Wapato Reach Assessment Report6‐45
April 2012ICF 00703.11
Figure 6‐11. EDT Modeled Current and Combined Recommended Projects Effect on Cumulative Productivity and Capacity of Coho from Lower Ahtanum Creek
6.7.3 Importance of Cumulative Wapato Reach Project Benefits
EDT model results indicate the potential for a 30% to 35% increase in productivity and a nearly 15% to 25% increase in abundance of fall and summer Chinook if all 10 recommended projects were implemented in the Wapato Reach. The currently low productivity of fall Chinook is the primary constraint affecting the population and projects in the Wapato Reach could significantly increase productivity. Summer Chinook are also constrained by low productivity and projects in the Wapato Reach also positively affect summer Chinook productivity. However, summer Chinook are also dependent on mainstem habitat conditions upstream of the Wapato Reach and an analysis of restoration projects in these areas versus in the Wapato Reach would need to be completed before a definitive statement could be made as to relative restoration benefits between these areas. Nevertheless, Wapato Reach projects could strongly support efforts to reintroduce summer Chinook to the basin and to establish a naturally sustainable fall Chinook population.
EDT model results indicate the potential cumulative project benefits to the other modeled species are lower and are more complex. Wapato Reach projects could be important for coho for juvenile overwintering, but that benefit would only affect a subset of the population that may redistribute downstream in the fall. It appears that restoration efforts to improve tributary conditions are more important for coho.
Spring Chinook are the most abundant and productive of the species in the Yakima Basin. The cumulative EDT results indicate a portion of the population benefited from the 10 recommended projects. That benefit applied to spring Chinook originating from the Upper Yakima and Naches watershed would contribute to an increase in population life history diversity.
0.0
0.1
0.2
0.3
0.4
0.5
0.6
0.7
0.8
0.9
1.0
0.0000 0.0020 0.0040 0.0060 0.0080 0.0100 0.0120 0.0140 0.0160 0.0180 0.0200
Productivity
Capacity Index
Current Combined Projects

Yakama Nation Chapter 6
Recommended Projects and Project Prioritization
Wapato Reach Assessment Report6‐46
April 2012ICF 00703.11
For steelhead, as previously mentioned, a better understanding of predator effects and measures to directly reduce predation may be the best strategy based on lower projected benefits from Wapato Reach projects.
Sockeye make the least use of the Wapato Reach of the species evaluated; adults are moving rapidly upstream through the reach in early summer and smolts are leaving in the spring. Cumulative benefits to sockeye were not modeled because there is not an EDT model for sockeye in the Yakima basin. However, it is not likely that the 10 recommended projects would negatively affect sockeye migration survival. We would expect benefits to sockeye from projects that improve passage and reduce temperature effects, but, such projects are likely not central to sockeye reintroduction.

Wapato Reach Assessment Report7‐1
April 2012ICF 00703.11
Chapter 7 Restoration Monitoring and Research Priorities
7.1 Restoration Monitoring Existing conditions of the Wapato Reach as described by the physical and biological process assessments (Chapter 4) were used to help formulate a suite of restoration objectives (Chapter 5) and ultimately a variety of recommended projects (Chapter 6) that could improve the specific habitat conditions that are most beneficial to the particular salmonid species and life‐history patterns using the Wapato Reach (see Figure 2‐1 and Appendix D). The EDT biological assessment was utilized to identify how the recommended projects might improve physical conditions in the Wapato Reach. Hypotheses regarding how particular types of project could affect physical and biological parameters can then be formulated and monitoring programs developed to test the hypotheses. Such a deliberately scientific approach to the ‘plan, implement, monitor, and adaptively manage’ project life cycle can inform modifications to projects or changes in the type of locations selected for particular project types.
Table 7‐1 summarizes the correlation between the specific species and life‐history stages utilizing the Wapato Reach, the restoration objectives and recommended projects, and the hypothesized primary mechanisms of benefit that could be monitored. Baseline monitoring to establish existing conditions relative to the hypothesized mechanisms of benefit is also an important aspect of restoration monitoring that should be developed prior to project implementation.
For example, summer steelhead juveniles use the Wapato Reach for overwintering. Increased habitat diversity and a reduction in fine sediment are habitat attributes that can benefit summer steelhead juveniles during overwintering. Increased side channel complexity and distribution can trap sediments and reduce fine sediment and embeddedness. Thus a restoration objective of engaging side channels across a wide range of flows is hypothesized to improve habitat conditions for summer steelhead juveniles. Baseline monitoring would focus on grain size analysis and depth of sediment under existing conditions. Post‐construction monitoring of side channel projects could be designed to measure elevation and sediment accumulation, in conjunction with fish use monitoring targeted at winter use by juvenile steelhead. Monitoring sections of the reach that lack side channels for winter use by juvenile steelhead would provide a control against which to compare use in areas where side channel restoration was targeted.

Yakama Nation Chapter 7
Restoration Monitoring and Research Priorities
Wapato Reach Assessment Report 7‐2
April 2012ICF 00703.11
Table 7‐1. Recommended Projects, Restoration Objectives, and Hypothesized Mechanism of Benefit to Salmon and Steelhead in the Wapato Reach
Salmonid Species Life‐History Stage
Species‐Specific Hypothesized Mechanism of Benefit in the Wapato Reach
Restoration Objective
Process‐Based Restoration Habitat Enhancement
Encourage a Meandering Planform by Establishing Vegetated
Channel Islands
Establish or Promote
Engagement of Side Channels across a Wide Range of Flows
Establish or Promote the Engagement of Floodplain
Channels across a Wide Range of
Flows
Remove Rip Rap or Bank
Hardening Install Instream
Wood Riparian
Revegetation
Sockeye Adult migration and holding
Provide temperature heterogeneity and thermal refuge
Provide temperature heterogeneity and thermal refuge
Provide temperature heterogeneity and thermal refuge
Smolt migration Increase instream complexity and reduce vulnerability to predators
Increase instream complexity and reduce vulnerability to predators
Increase instream complexity and reduce vulnerability to predators
Increase instream complexity and reduce vulnerability to predators
Spring Chinook
Adult migration and holding
Provide temperature heterogeneity and thermal refuge
Provide temperature heterogeneity and thermal refuge
Provide temperature heterogeneity and thermal refuge
Juvenile overwintering and winter migrants
Increase instream channel complexity and reduce bedload fine sediment
Increase instream channel complexity and reduce bedload fine sediment
Increase instream complexity
Increase instream complexity
Smolt migrants Increase instream channel
Increase instream channel
Increase instream
Increase instream

Yakama Nation Chapter 7
Restoration Monitoring and Research Priorities
Wapato Reach Assessment Report 7‐3
April 2012ICF 00703.11
Salmonid Species Life‐History Stage
Species‐Specific Hypothesized Mechanism of Benefit in the Wapato Reach
Restoration Objective
Process‐Based Restoration Habitat Enhancement
Encourage a Meandering Planform by Establishing Vegetated
Channel Islands
Establish or Promote
Engagement of Side Channels across a Wide Range of Flows
Establish or Promote the Engagement of Floodplain
Channels across a Wide Range of
Flows
Remove Rip Rap or Bank
Hardening Install Instream
Wood Riparian
Revegetation
complexity and reduce vulnerability to predators
complexity and reduce vulnerability to predators
complexity and reduce vulnerability to predators
complexity and reduce vulnerability to predators
Summer Chinook
Adult migration and holding
Provide temperature heterogeneity and thermal refuge
Provide temperature heterogeneity and thermal refuge
Provide temperature heterogeneity and thermal refuge
Egg incubation Reduce bedload fine sediment
Reduce bedload fine sediment
Reduce bedload fine sediment
Reduce bedload fine sediment
Subyearling juvenile migrants
Increase instream channel complexity and reduce vulnerability to predators
Increase instream channel complexity, reduce vulnerability to predators, and food chain support
Increase instream channel complexity, reduce vulnerability to predators, and food chain support
Improve riparian condition, increase instream complexity, and reduce vulnerability to predators
Improve riparian condition and food chain support
Fall Chinook
Adult migration and holding
Egg incubation Reduce bedload fine sediment
Reduce bedload fine sediment
Reduce bedload fine sediment
Reduce bedload fine sediment
Subyearling Increase Increase Increase Improve riparian Improve

Yakama Nation Chapter 7
Restoration Monitoring and Research Priorities
Wapato Reach Assessment Report 7‐4
April 2012ICF 00703.11
Salmonid Species Life‐History Stage
Species‐Specific Hypothesized Mechanism of Benefit in the Wapato Reach
Restoration Objective
Process‐Based Restoration Habitat Enhancement
Encourage a Meandering Planform by Establishing Vegetated
Channel Islands
Establish or Promote
Engagement of Side Channels across a Wide Range of Flows
Establish or Promote the Engagement of Floodplain
Channels across a Wide Range of
Flows
Remove Rip Rap or Bank
Hardening Install Instream
Wood Riparian
Revegetation
juvenile migrants instream channel complexity and reduce vulnerability to predators
instream channel complexity, reduce vulnerability to predators, and food chain support
instream channel complexity, reduce vulnerability to predators and food chain support
condition, increase instream complexity, and reduce vulnerability to predators
riparian condition and food chain support
Summer steelhead
Adult migration and holding
Increase instream complexity for adult holding
Juvenile overwintering/ winter migrants
Increase instream channel complexity and reduce bedload fine sediment
Increase instream channel complexity and reduce bedload fine sediment
Increase instream channel complexity and reduce bedload fine sediment
Increase instream complexity
Improve riparian condition, reduce bedload fine sediment, and food chain support
Juvenile summer residents
ncrease instream channel complexity, temperature heterogeneity and thermal refuge
Increase instream channel complexity, temperature heterogeneity and thermal refuge
Increase instream complexity temperature heterogeneity and thermal refuge
Improve riparian condition and food chain support
Smolt migrants Increase instream channel
Increase instream channel
Increase instream channel
Increase instream
Increase instream
Improve riparian

Yakama Nation Chapter 7
Restoration Monitoring and Research Priorities
Wapato Reach Assessment Report 7‐5
April 2012ICF 00703.11
Salmonid Species Life‐History Stage
Species‐Specific Hypothesized Mechanism of Benefit in the Wapato Reach
Restoration Objective
Process‐Based Restoration Habitat Enhancement
Encourage a Meandering Planform by Establishing Vegetated
Channel Islands
Establish or Promote
Engagement of Side Channels across a Wide Range of Flows
Establish or Promote the Engagement of Floodplain
Channels across a Wide Range of
Flows
Remove Rip Rap or Bank
Hardening Install Instream
Wood Riparian
Revegetation
complexity and reduce vulnerability to predators
complexity and reduce vulnerability to predators
complexity and reduce vulnerability to predators
complexity and reduce vulnerability to predators
complexity and reduce vulnerability to predators
condition and food chain support
Coho Adult migration and holding
Juvenile overwintering
Increase instream channel complexity
Increase instream channel complexity
Increase instream complexity
Increase instream complexity
Smolt migrants Increase instream channel complexity and reduce vulnerability to predators
Increase instream channel complexity and reduce vulnerability to predators
Increase instream channel complexity and reduce vulnerability to predators
Increase instream complexity and reduce vulnerability to predators
Increase instream complexity and reduce vulnerability to predators

Yakama Nation Chapter 7
Restoration Monitoring and Research Priorities
Wapato Reach Assessment Report7‐6
April 2012ICF 00703.11
Similarly, species such as spring Chinook which benefit from thermal refuge during adult migration and holding in the Wapato Reach could benefit from projects that utilize flood fences to achieve the restoration objective of a single dominant meander channel. Such a channel is hypothesized to provide better in‐channel habitat during low flow periods, presumably with deeper pools to provide thermal refuge. Baseline monitoring would focus on water depth and temperature profiles under existing conditions. Post‐construction monitoring of such projects could be designed to measure number and depth of pools pre‐and post‐project, in conjunction with fish use monitoring targeted at use by migrating adult summer Chinook. Monitoring sections of the reach without flood fences for use by adult spring Chinook would provide a control against which to compare use in areas where flood fences were installed and a more defined channel was targeted.
Such targeted monitoring could be combined with estimates of total populations in the reach, particularly if projects to reduce bypass structure mortality and/or predation mortality were also being implemented.
7.2 Additional Research and Analysis Priorities As the ICF team completed the review and synthesis of existing data and began the process of analyzing the physical and biological conditions of the reach, data gaps were identified. Focused data collection in the following areas could provide information to further refine the hypothesized mechanisms of action in Table 7‐1. Such information could additionally help inform the process of locating specific parcels for protection, as well as the process of designing specific restoration projects throughout the Wapato Reach.
Additional research and analysis priorities are as follows.
Sediment budget for the reach to refine EDT benefits related to capacity of the recommended projects to store sediments.
Additional information describing juvenile salmonid presence, abundance, and habitats utilized in the Wapato Reach during the summer, fall and winter months, which could be used to better identify important fish habitats, predation impacts, and restoration benefits. This information would be used to update the EDT model species‐habitat rules.
Additional information describing the distribution, abundance, and predation rates of piscivorous fish species in the Wapato Reach, which could be used to help formulate strategies to reduce predator impacts on juvenile salmonids utilizing the reach for rearing and migration. The information could also be used to help with modifications of bypass facilities to reduce bypass mortalities.
Aerial photo coverage of the entire reach from the 1980s, 1960s, or earlier, which could be used to refine channel migration analysis and possibly create a data set to supplement the existing partial coverage (RM 60 to 85) from 1988, 1978, and 1984.
Additional information regarding water quality in the reach (expanded coverage across the entire reach), including temperature, dissolved oxygen, and chemical constituents that could affect salmonid survival, which could be used to update assumptions of water quality in the EDT model and help identify priority areas to create thermal refuge.

Yakama Nation Chapter 7
Restoration Monitoring and Research Priorities
Wapato Reach Assessment Report7‐7
April 2012ICF 00703.11
Measures of fine sediment in the streambed, factors affecting sediment sources to the reach, and estimates of multi‐year trends in fine sediment, which could be used to update assumptions in the EDT model for amount of fine sediment in the stream bed and identify measures to reduce sediment in the future.
Additional classification of land use and riparian vegetation classification using the 2000 Reclamation LIDAR and GIS analysis to provide more detailed riparian zone characterization, which would be used to better identify locations for riparian revegetation.
Additional information regarding programs and management of Yakama Nation wildlife management lands to determine areas and management techniques that might be compatible with recommended salmonid habitat restoration projects. This information could be used to identify activities that may be impacting habitat or fish use of habitat in the Wapato Reach, which could be used to develop recommendations for wildlife land management to enhance fish habitat and use.
Land use categories within lands identified as under Yakama Nation ownership and critical areas and zoning regulation restrictions which could be used to refine the level of development risk and further prioritize parcels recommended for protection.
While such additional information would have been beneficial to this reach assessment, these data gaps did not prevent formulation of restoration objectives and geomorphically appropriate projects with the potential to improve habitat conditions for salmonids using the Wapato Reach.
The collection of additional information to fill these data gaps in the future would help the Yakama Nation and the TAG further refine the understanding of conditions in the Wapato Reach. Such additional information could thus help refine the possible types and locations appropriate for habitat restoration projects beyond those identified in this assessment.


Wapato Reach Assessment Report8‐1
April 2012ICF 00703.11
Chapter 8 References
8.1 Printed References Beechie, T., G. Pess, P. Roni, and G. Giannico. 2008. Setting River Restoration Priorities: A Review of
Approaches and a General Protocol for Identifying and Prioritizing Actions. North American Journal of Fisheries Management. 28:891–905.
Beverton, R. J. H. and S. J. Holt. 1957. On the Dynamics of Exploited Fish Populations. Chapman & Hall, London.
Blair, G. R., L. C. Lestelle, and L. E. Mobrand. 2009. The Ecosystem Diagnosis and Treatment Model: A Tool for Assessing Salmonid Performance Potential Based on Habitat Conditions. Pages 289–309 in E. E. Knudsen, J. H. Michael, and C. S. Steward (eds.). Pacific salmon environment and life history models: advancing science for sustainable fisheries in the future. American Fisheries Society, Symposium 71. Bethesda, MD.
Bonneville Power Administration. 1992. Yakima Fisheries Project Draft Environmental Impact Statement. Available from Bonneville Power Administration, P.O. Box 3621, Portland, OR 97208‐3621.
Bosch, W. J., T. H. Newsome, J. L. Dunnigan, J. D. Hubble, D. Neeley, D. T. Lind, D. E. Fast, L. L. Lamebull, and J. W. Blodgett. 2007. Evaluating the Feasibility of Reestablishing a Coho Salmon Population in the Yakima River, Washington. North American Journal of Fisheries Management 27:198‐214
Chew, L.C., and Ashmore, P.E. 2001. Channel adjustment and a test of rational regime theory in a proglacial braided stream. Geomorphology, 37(1‐2): 43‐63. doi:10.1016/S0169‐555X(00)00062‐3.
Conley, A., J. Freudenthal, D. Lind, P. Mees, and R. Visser. 2009. Yakima Steelhead Recovery Plan, Extracted from the 2005 Yakima Subbasin Salmon Recovery Plan with Updates, Yakima Basin Fish & Wildlife Recovery Board, Yakima, Washington. p. 309.
DeVries, P. 2010. Results of Geomorphic Analysis of Hydraulic, Hydrologic, and Sediment Conditions in the Lower Skykomish River Below the Sultan River. R2 Resource Consultants, Inc. Technical Memorandum to Bob Aldrich, Snohomish County Surface Water Management. December 30.
———. 2009. Results of Geomorphic Analysis of Hydraulic, Hydrologic, Sediment, and Habitat Conditions in the Lower Sauk River Between the Suiattle River and the Lower Delta. R2 Resource Consultants, Inc. Technical Memorandum to Bob Aldrich, Snohomish County Surface Water Management. June 11.
———. 2000. Scour in Low Gradient Gravel Bed Streams: Patterns, Processes, and Implications for the Survival of Salmonid Embryos. Ph.D. dissertation, University of Washington, Seattle, Washington.

Yakama Nation Chapter 8
References
Wapato Reach Assessment Report8‐2
April 2012ICF 00703.11
DeVries, P., and C. Huang. 2010. Reach Scale Geomorphic Analysis of Hydraulic, Hydrologic, and Sediment Conditions in the Lower South Fork Stillaguamish River Below Canyon Creek. R2 Resource Consultants, Inc. Technical Memorandum to Bob Aldrich, Snohomish County Surface Water Management. July 6.
Dunnigan, J. and L. Lamebull. 2000. In Pearsons, Todd, Anthony Fritts, Kenneth Ham, Geoffrey McMichael, Eric Bartrand, Gabriel Temple and Charles W. Hopley ‐ Washington Department of Fish and Wildlife, Report to Bonneville Power Administration, Contract No. 1995BI64878, Project No. 199506402, 99 electronic pages (BPA Report DOE/BP‐64878‐7)Eaton, B.C., R.G. Millar, and S. Davidson. 2010. Channel patterns: Braided, anabranching, and single‐thread. Geomorphology 120:353‐364.
Ecological Interactions Team, WDFW. 1998. Development of a Bird Predation Index, Annual Report 1998. Report to Bonneville Power Administration, Contract No. 1998AT02689, Project No. 199506408, 133 electronic pages (BPA Report DOE/BP‐64878‐3).
Elliott, T. N., 2011. Sex Ratios of Black Cottonwoods on an Alluvial Floodplain. M.S. Thesis. Central Washington University, Ellensburg WA.
Entrix. no date. Geomorphic assessment of the water gaps of the Yakima River, Washington. Report prepared for Yakima County Public Services, Surface Water Management.
Fast, D. 2002. Design, operation, and monitoring of al production scale supplementation research facility. In Hatchery Reform: the Science and the Practice. Proceedings of the International Congress on the Biology of Fish, Congress 2002: Vancouver, Canada, 21‐26 July 2002, The University of British Columbia, Vancouver, B.C. Edited by E.L. Brannon and D. MacKinlay. pp. 23‐26.
Fast, D.E., J. Hubble, M. Kohn, and B. Watson. 1991. Yakima River spring Chinook enhancement study. Final report, DOE/BP‐39461‐9. Bonneville Power Administration, Portland, OR.
Ferguson, R.I. 1984. The threshold between meandering and braiding. pp. 6.15‐6.29 in: K.V.H. Smith (ed.), Proceeding of the 1st International Conference on Hydraulic Design. Springer. New York, NY.
Ferguson, R.I. 1987. Hydraulic and sedimentary controls on channel pattern. pp. 129‐158 in: K.S.
Flagg, T. A., T. E. Ruehle, L. W. Harrell, J. L. Mighell, C. R. Pasley, A. J. Novotny, E. Statick, C. W. Sims, D. B. Dey, Conrad V. W. Mahnken. 2000. National Marine Fisheries Service, Seattle, WA, Cle Elum Lake Anadromous Salmon Restoration Feasibility Study: Summary of Research, 2000 Final Report to Bonneville Power Administration, Portland, OR, Contract No. 86AI64840, Project No. 86‐045, 118 electronic pages (BPA Report DOE/BP‐64840‐4).
Hampton, M., 1988. Development of habitat preference criteria for anadromous salmonids of the Trinity River. U.S. Dept. Int., Fish Wildlife Serv., Div. Ecol. Serv., Sacramento, California.
Hilldale, R.C. and D. Mooney. 2007. One‐Dimensional Hydraulic Modeling of the Yakima Basin: A component of Yakima River Basin Water Storage Feasibility Study, Washington. Technical Series No. TS‐YSS‐14. U.S. Department of the Interior, Bureau of Reclamation. Denver, Colorado.
Johnston, M.V., D. E. Fast, B. Saluskin, W. J. Bosch, and S. J. Grabowski. 2008. Restoring sockeye salmon to the Yakima River Basin. American Fisheries Society Annual Meeting.

Yakama Nation Chapter 8
References
Wapato Reach Assessment Report8‐3
April 2012ICF 00703.11
Kondolf, G.M., and M.G. Wolman. 1993. The Sizes of Salmonid Spawning Gravels. Water Resources Research 29: 2275‐2285
Leopold, L. B. and Wolman, M. G., 1957. River channel patterns: braided, meandering and straight. U.S. Geological Survey Professional Paper 282B, pp. 39‐85.
Leopold, L.B., M.G. Wolman, and J.P. Miller. 1995. Fluvial processes in geomorphology. Republication. Dover Publications, Inc. New York, N.Y. 522 p.
Lestelle, L. C. 2007. Coho Salmon (Oncorhynchus kisutch) life history patterns in the Pacific Northwest and California. Final report to U.S. Bureau of Reclamation Klamath Area Office. 143 p.
Lestelle, L. C., W. E. McConnaha, G. R. Blair, and B. Watson. 2005. Chinook Salmon Use of Floodplain, Secondary Channel, and Non‐Natal Tributary Habitats in Rivers of Western North America. Report prepared for the Mid‐Willamette Valley Council of Governments, U.S. Army Corps of Engineers and Oregon Department of Fish and Wildlife, September 2005. 77 p.
Lestelle, L. C., B. Watson, G. R. Blair, and W. E. McConnaha. 2006. Species‐Habitat Rules: Supporting Documentation for Updated Rules with Expanded Habitat Types for Application in EDT. Final Report to the United States Bureau of Reclamation, March 2006. 118 p.
Lichatowich, J.A. and L.E. Mobrand. 1995. Analysis of chinook salmon in the Columbia River from an ecosystem perspective. Report for U.S. Department of Energy, Bonneville Power Administration, Contract No. DE‐AM79‐92BP25105, Portland, OR.
McElhany, P., M. H. Ruckleshaus, M. J. Ford, T. C. Wainwright, and E. P. Bjorkstedt. 2000. Viable salmonid populations and the recovery of evolutionarily significant units. U.S. Department of Commerce, Seattle, Washington.
Millar, R.G. 2005. Theoretical regime equations for mobile gravel‐bed rivers with stable banks. Geomorphology 64:207‐220.
———. 2000. Influence of bank vegetation on alluvial channel patterns. Water Resources Research 36(4): 1109‐1118
Mobrand, L. E., J. A. Lichatowich, L. C. Lestelle, and T. S. Vogel. 1997. An approach to describing ecosystem performance “through the eyes of salmon.” Canadian Journal of Fisheries and Aquatic Sciences 54:2964–2973.
Mooney, D. 2008. Sediment Transport Modeling of the Yakima Basin: A component of Yakima River Basin Water Storage Feasibility Study, Washington. Technical Series No. TS‐YSS‐17. U.S. Department of the Interior, Bureau of Reclamation, Denver, Colorado.
Mosley, P.M. 1981. Semi‐determinate hydraulic geometry of river channels, South Island, New Zealand. Earth Surface Processes and Landforms, 6(2): 127‐137. doi:10.1002/esp.3290060206.v
Mueller, R.P. and D.B. Child. 2011. Aerial assessment of the Lower Yakima River for fall Chinook salmon spawning areas, 2010. PNNL‐20183, Pacific Northwest National Laboratory, Richland, Washington. 27 p.
Parker, G. 1990. Surface‐based bedload transport relation for gravel rivers: Journal of Hydraulic Research, v. 28, no. 4, p. 417–436.

Yakama Nation Chapter 8
References
Wapato Reach Assessment Report8‐4
April 2012ICF 00703.11
———. 1976. On the cause and characteristic scales of meandering and braiding in rivers. Journal of Fluid Mechanics, 76(3): 457‐480. doi:10.1017/S0022112076000748.
Patten, B. G., R. B. Thompson, and W. D. Gronlund. 1970. Distribution and abundance of fish in the Yakima River, Wash., April 1957 to May 1958. United States Fish and Wildlife Service Special scientific report No. 603. Washington D.C.
Reichmuth, D.R., A.S. Potter, and M.G. Reichmuth. 2007. Toppenish basin geomorphology. PowerPoint file prepared for Yakama Nation, April. 195 slides.
Roni, P., T. Beechie, R. Bilby, F. Leonetti, M. Pollock, and G. Press. 2002. A review of river restoration techniques and a hierarchical strategy for prioritizing restoration in Pacific Northwest Watersheds. North American Journal of Fisheries Management 22:1–20.
Schmidt, L.J., and J.P. Potyondy. 2004. Quantifying channel maintenance instream flows: An approach for gravel‐bed streams in the western United States. USDA Forest Service, Rocky Mountain Research Station General Technical Report RMRS‐GTR‐128. May
Sebring, S. H., R. D. Ledgerwood, B. P. Sandford, A. Evans, and G. M. Matthews. 2009. Detection of Passive Integrated Transponder (PIT) tags on piscivorous avian colonies in the Columbia River Basin, 2007. U.S. Army Corps of Engineers, Walla Walla, Washington
Stanford, J.A., E. B. Snyder, M.N. Lorang, D.C. Whited, P.L. Matson, and J. L. Chaffin. 2002. The reaches project: ecological and geomorphic studies supporting normative flows in the Yakima River Basin, Washington. Final Report, 2002. BPA Report DOE/BP‐00005854‐1, Bonneville Power Administration, Portland, OR.
Timkin, R.L. and B.W. Anderson. 1969. Food habits of common mergansers in the northcentral United States. Journal of Wildlife Management 33:87‐91.U.S. Bureau of Reclamation. 2011. Hydromet System. Yakima River flow and diversion flow data. Available: <http://www.usbr.gov/pn/hydromet/yakima>. Accessed: October 2011.
———. 2008. Aquatic Ecosystem Evaluation for the Yakima River Basin, Technical Series No. TS‐YSS‐22. U.S. Department of the Interior, Bureau of Reclamation, Pacific Northwest Region, Upper Columbia Area Office, Yakima, Washington. 154 p.
U.S. Bureau of Reclamation and Washington State Department of Ecology. 2011. Yakima River Basin Study: Proposed Integrated Water Resource Management Plan, Volume 1. U.S. Department of the Interior, Bureau of Reclamation and Washington State Department of Ecology. 128 p.
Vaccaro, J.J. 2011. River‐aquifer exchanges in the Yakima River basin, Washington: U.S. Geological Survey Scientific Investigations Report 2011–5026, 98 p.
van den Berg, J.H. 1995. Prediction of alluvial channel pattern of perennial rivers. Geomorphology 12:259‐279.
Voss, F.D., Curran, C.A., and Mastin, M.C., 2008, Modeling water temperature in the Yakima River, Washington, from Roza Diversion Dam to Prosser dam, 2005–06: U.S. Geological Survey Scientific Investigations Report 2008‐5070, 42 p.
Watson, B. D. 2011. Yakima River Bypass Survival Study. Technical report for Yakima/Klickitat Fisheries Project. 38 p.

Yakama Nation Chapter 8
References
Wapato Reach Assessment Report8‐5
April 2012ICF 00703.11
Wise, D. R., M. L. Zuroske, K. D. Carpenter, and R. L. Kiesling. 2009. Assessment of eutrophication in the Lower Yakima River Basin, Washington, 2004–07: U.S. Geological Survey Scientific Investigations Report 2009–5078, 108 p.
Wood, C.C. 1985. Food searching behavior of the common merganser (Mergus merganser) II: Choice of foraging location. Canadian Journal of Zoology 63:1271‐1279.Xu, J Comparison of hydraulic geometry between sand‐ and gravel‐bed rivers in relation to channel pattern discrimination 2004 ESPL 29(5): 645‐657
Yakima/Klickitat Fisheries Project. 2011. Yakima/Klickitat Fisheries Project Monitoring and Evaluation, Project Number 1995‐063‐25, Contract Number 00042445, the Confederated Tribes and Bands of the Yakama Nation, Final Report for the performance period May 1, 2010 through April 30, 2011. Submitted: August 12, 2011. Prepared for COTR, Division of Fish and Wildlife, Portland, Oregon. Prepared by Yakama Nation, Yakima/Klickitat Fisheries Project: Melvin R. Sampson, Policy Advisor/Project Coordinator; Dr. David Fast, Research Manager; Bill Bosch, Editor.
———. 2010. Yakima/Klickitat Fisheries Project Monitoring and Evaluation, Project Number 1995‐063‐25, Contract Number 00042445, the Confederated Tribes and Bands of the Yakama Nation, Final Report for the performance period May 1, 2009 through April 30, 2010. Submitted: August 3, 2010. Prepared for: Patricia Smith, COTR, Division of Fish and Wildlife, P.O. Box 3621, Portland, Oregon 97208‐3621. Prepared By: Yakama Nation, Yakima/Klickitat Fisheries Project, Melvin R. Sampson, Policy Advisor/Project Coordinator, Dr. David Fast, Research Manager, Bill Bosch, Editor, P.O. Box 151, Toppenish, WA 98948
———. 2009. Yakima/Klickitat Fisheries Project Monitoring and Evaluation, Project Number 1995‐063‐25, Contract Number 00037822, the Confederated Tribes and Bands of the Yakama Nation, Final Report for the performance period May 1, 2008 through April 30, 2009. Submitted: July 31, 2009. Prepared for: Patricia Smith, COTR, Division of Fish and Wildlife, P.O. Box 3621, Portland, Oregon 97208‐3621. Prepared By: Yakama Nation, Yakima/Klickitat Fisheries Project, Melvin R. Sampson, Policy Advisor/Project Coordinator, Dr. David Fast, Research Manager, Bill Bosch, Editor, P.O. Box 151, Toppenish, WA 98948
———. 2008. Yakima/Klickitat Fisheries Project Monitoring and Evaluation, Project Number 1995‐063‐25, Contract Number 00035037, the Confederated Tribes and Bands of the Yakama Nation, Final Report for the performance period May 1, 2007 through April 30, 2008. Submitted July 31, 2008. Prepared for: Patricia Smith, COTR, Division of Fish and Wildlife, P.O. Box 3621, Portland, Oregon 97208‐3621. Prepared By: Yakama Nation, Yakima/Klickitat Fisheries Project: Melvin R. Sampson, Policy Advisor/Project Coordinator; Dr. David Fast, Research Manager; Bill Bosch, Editor; P.O. Box 151, Toppenish, WA 98948.
8.2 Unpublished Data and Personal Communications Hubble, Joel. U.S. Bureau of Reclamation. October 2011—Email correspondence between Joel
Hubble and Bruce Watson regarding tributary smolt trap operation years and observations.
Porter, Michael. Yakama Nation. October 2011— Database of Yakama Nation unpublished data for 2010 and 2011 Yakima River mainstem fish monitoring.

Yakama Nation Chapter 8
References
Wapato Reach Assessment Report8‐6
April 2012ICF 00703.11
Bosch, Bill. Yakama Nation. October 2011—Yakama Nation unpublished juvenile salmon and steelhead monitoring data from Prosser Dam/Chandler Juvenile Fish Monitoring Facility for 2001 to present and adult salmon and steelhead monitoring data for the same years from Prosser and Roza Dams.

Appendix A. Maps


!(
!(
!(
!(
!(
!(
!(!(
!(!(
!(
!(
!(
!(
!(
!(
!(
!(
!(!(
!(
!(
!(
!(
!(
!(
!(!(
!(
!(
!(
!(
!(
!(
!(
!(!(
!(
!(
!(
!(
!(
!(
!(
!(
!(
!(
!(
!(!(
!(
!(
!(
!(
!(
!(
99
98
9796
95
9493
92 91
9089
88
87
86
85
84
83 82
8180
79
78
7776
75 74
73
72
71
70
69 68
67
66
65 64
63 6261
60
5958
5756
110
109
108
107
106
105 104
103
102
101
100
Figure A-1Reach Overview
Wapato Reach Assessment - Phase 2
C:\U
sers
\194
35\D
ocum
ents
\Loc
al G
IS\0
0703
.11_
Wap
atoR
each
\Map
docs
\Rea
chAs
sess
men
tRep
ort\F
igA-
1_R
each
Ove
rvie
w.m
xd D
BS
4/1
7/20
12
±0 2
Miles
!( River Miles (2009)
Source: ESRI (Topographic, 2011)
!
!
!
!
Yakima
Wenatchee
Moses Lake
Kennewick
§̈¦82
§̈¦90
C o l u m b i a R i v e r
Y a k i m a R i v e r
Figure Extent
Yakima Basin


!(
!(
!(
!(
!(
!(
!(
!(
Yakima River
Wanity Slough
Sunnyside Canal
YAKIMA VALLEY HWY
PARKER B
RIDGE R
D
110
109
108
107
106
105
104
103
§̈¦82
£¤97
Figure A-2aProperty Ownership
Wapato Reach Assessment - Phase 2
C:\U
sers
\194
35\D
ocum
ents
\Loc
al G
IS\0
0703
.11_
Wap
atoR
each
\Map
docs
\Rea
chAs
sess
men
tRep
ort\F
igA-
2_La
ndO
wne
rshi
p.m
xd C
B 3
/12/
2012
"
0 2,000
Feet
!( River Miles (2009)
Wapato Reach Streams
CitiesLand Ownership
USFWS
WDFW
Yakama Nation
Private
Other Federal Agencies
Other State Agencies
Local Governments


!(
!(
!(
!(
!(
!(
!(
!(
Sunnyside Canal
Yakim
a River
Yakima River
Wanity Slough
YAKIMA VALLEY HWY
99
98
97
96
103
102
101
100
§̈¦82
£¤97
Figure A-2bProperty Ownership
Wapato Reach Assessment - Phase 2
C:\U
sers
\194
35\D
ocum
ents
\Loc
al G
IS\0
0703
.11_
Wap
atoR
each
\Map
docs
\Rea
chAs
sess
men
tRep
ort\F
igA-
2_La
ndO
wne
rshi
p.m
xd C
B 3
/12/
2012
"
0 2,000
Feet
!( River Miles (2009)
Wapato Reach Streams
CitiesLand Ownership
USFWS
WDFW
Yakama Nation
Private
Other Federal Agencies
Other State Agencies
Local Governments


!(!(
!(
!(
!(
!(
!(!(
NONE GIVEN
Zillah
Yakima River
Sunn
ysid
e Ca
nal
5TH ST
1ST AVE
2ND AVE
CHEYNE RD
TOPP
ENIS
H-Z
ILLA
H R
D
96 95
94
93
92
91
90 89
¬«22
§̈¦82
Figure A-2cProperty Ownership
Wapato Reach Assessment - Phase 2
C:\U
sers
\194
35\D
ocum
ents
\Loc
al G
IS\0
0703
.11_
Wap
atoR
each
\Map
docs
\Rea
chAs
sess
men
tRep
ort\F
igA-
2_La
ndO
wne
rshi
p.m
xd C
B 3
/12/
2012
"0 2,000
Feet
!( River Miles (2009)
Wapato Reach Streams
CitiesLand Ownership
USFWS
WDFW
Yakama Nation
Private
Other Federal Agencies
Other State Agencies
Local Governments


!(
!(
!(
!(
!(
!(
!(
!(
Granger
Yakima River
Mar
ion
Dra
in
Yakima River
E ST
INDIAN CHURCH RD
MAIN ST
ME
NTZ
ER A
VE
YAKIMA VALLEY HWY
SUN
NY
SID
E A
VE
88
87
86
85
84
83
82
81
¬«223
¬«22
§̈¦82
Figure A-2dProperty Ownership
Wapato Reach Assessment - Phase 2
C:\U
sers
\194
35\D
ocum
ents
\Loc
al G
IS\0
0703
.11_
Wap
atoR
each
\Map
docs
\Rea
chAs
sess
men
tRep
ort\F
igA-
2_La
ndO
wne
rshi
p.m
xd C
B 3
/12/
2012
"
0 2,000
Feet
!( River Miles (2009)
Wapato Reach Streams
CitiesLand Ownership
USFWS
WDFW
Yakama Nation
Private
Other Federal Agencies
Other State Agencies
Local Governments


!(
!(
!(
!(
!(
!(
!(
!(
!(
!(
!(
!(
!(
!(
Yakima River
Satus Creek
EMER
ALD
RD
GREEN VALLEY RD
81
80
79 78
77
7675
74
73
72
71
70
69
68
¬«22
§̈¦82
Figure A-2eProperty Ownership
Wapato Reach Assessment - Phase 2
C:\U
sers
\194
35\D
ocum
ents
\Loc
al G
IS\0
0703
.11_
Wap
atoR
each
\Map
docs
\Rea
chAs
sess
men
tRep
ort\F
igA-
2_La
ndO
wne
rshi
p.m
xd C
B 3
/12/
2012
"
0 2,000
Feet
!( River Miles (2009)
Wapato Reach Streams
CitiesLand Ownership
USFWS
WDFW
Yakama Nation
Private
Other Federal Agencies
Other State Agencies
Local Governments


!(
!(
!(
!(
!(
!(
!(
!(
!(
!(
!(
!(
!(
Yakima RiverSulphur C
reek Wastew
ay
GREEN VALLEY RD
72
71
70
69
68
67
66
65
64
63
62
61
60
¬«22
¬«241
Figure A-2fProperty Ownership
Wapato Reach Assessment - Phase 2
C:\U
sers
\194
35\D
ocum
ents
\Loc
al G
IS\0
0703
.11_
Wap
atoR
each
\Map
docs
\Rea
chAs
sess
men
tRep
ort\F
igA-
2_La
ndO
wne
rshi
p.m
xd C
B 3
/12/
2012
"0 2,000
Feet
!( River Miles (2009)
Wapato Reach Streams
CitiesLand Ownership
USFWS
WDFW
Yakama Nation
Private
Other Federal Agencies
Other State Agencies
Local Governments


!(
!(
!(
!(
RM110
RM109
RM108
RM107
Figure A-3aChannel Migration History
Wapato Reach Assessment - Phase 2
1909
1947
1973
1978/1979
1992
1995
1996
2000
2003
2005
2006
2009
§̈¦82
£¤97
UV241UV24
UV22
i j lfc kb d
g hea
C:\U
sers
\194
35\D
ocum
ents
\Loc
al G
IS\0
0703
.11_
Wap
atoR
each
\Map
docs
\Rea
chAs
sess
men
tRep
ort\F
igA-
3_C
hann
elM
igra
tion.
mxd
DB
S 4
/13/
2012
"0 1,000
Feet
Source: Aerial, NAIP 2009


!(
!(
!(
!(
RM106
RM105
RM104
RM103
Figure A-3bChannel Migration History
Wapato Reach Assessment - Phase 2
1909
1947
1973
1978/1979
1992
1995
1996
2000
2003
2005
2006
2009
§̈¦82
£¤97
UV241UV24
UV22
i j lfc kb d
g hea
C:\U
sers
\194
35\D
ocum
ents
\Loc
al G
IS\0
0703
.11_
Wap
atoR
each
\Map
docs
\Rea
chAs
sess
men
tRep
ort\F
igA-
3_C
hann
elM
igra
tion.
mxd
DB
S 4
/13/
2012
"0 1,000
Feet
Source: Aerial, NAIP 2009


!(
!(
!(
RM102
RM101RM100
Figure A-3cChannel Migration History
Wapato Reach Assessment - Phase 2
1909
1947
1973
1978/1979
1992
1995
1996
2000
2003
2005
2006
2009
§̈¦82
£¤97
UV241UV24
UV22
i j lfc kb d
g hea
C:\U
sers
\194
35\D
ocum
ents
\Loc
al G
IS\0
0703
.11_
Wap
atoR
each
\Map
docs
\Rea
chAs
sess
men
tRep
ort\F
igA-
3_C
hann
elM
igra
tion.
mxd
DB
S 4
/13/
2012
"0 1,000
Feet
Source: Aerial, NAIP 2009


!(
!(
!(
!(
RM99
RM98
RM97
RM96
Figure A-3dChannel Migration History
Wapato Reach Assessment - Phase 2
1909
1947
1973
1978/1979
1992
1995
1996
2000
2003
2005
2006
2009
§̈¦82
£¤97
UV241UV24
UV22
i j lfc kb d
g hea
C:\U
sers
\194
35\D
ocum
ents
\Loc
al G
IS\0
0703
.11_
Wap
atoR
each
\Map
docs
\Rea
chAs
sess
men
tRep
ort\F
igA-
3_C
hann
elM
igra
tion.
mxd
DB
S 4
/13/
2012
"0 1,000
Feet
Source: Aerial, NAIP 2009


!(
!(
!(
!(
RM95
RM94
RM93
RM92
Figure A-3eChannel Migration History
Wapato Reach Assessment - Phase 2
1909
1947
1973
1978/1979
1992
1995
1996
2000
2003
2005
2006
2009
§̈¦82
£¤97
UV241UV24
UV22
i j lfc kb d
g hea
C:\U
sers
\194
35\D
ocum
ents
\Loc
al G
IS\0
0703
.11_
Wap
atoR
each
\Map
docs
\Rea
chAs
sess
men
tRep
ort\F
igA-
3_C
hann
elM
igra
tion.
mxd
DB
S 4
/13/
2012
"0 1,000
Feet
Source: Aerial, NAIP 2009


!(
!(
!(
!(
RM92
RM91
RM90
RM89
Figure A-3fChannel Migration History
Wapato Reach Assessment - Phase 2
1909
1947
1973
1978/1979
1992
1995
1996
2000
2003
2005
2006
2009
§̈¦82
£¤97
UV241UV24
UV22
i j lfc kb d
g hea
C:\U
sers
\194
35\D
ocum
ents
\Loc
al G
IS\0
0703
.11_
Wap
atoR
each
\Map
docs
\Rea
chAs
sess
men
tRep
ort\F
igA-
3_C
hann
elM
igra
tion.
mxd
DB
S 4
/13/
2012
"0 1,000
Feet
Source: Aerial, NAIP 2009


!(
!(
!(
!(
!(
RM88
RM87
RM86
RM85
RM84
Figure A-3gChannel Migration History
Wapato Reach Assessment - Phase 2
1909
1947
1973
1978/1979
1992
1995
1996
2000
2003
2005
2006
2009
§̈¦82
£¤97
UV241UV24
UV22
i j lfc kb d
g hea
C:\U
sers
\194
35\D
ocum
ents
\Loc
al G
IS\0
0703
.11_
Wap
atoR
each
\Map
docs
\Rea
chAs
sess
men
tRep
ort\F
igA-
3_C
hann
elM
igra
tion.
mxd
DB
S 4
/13/
2012
"0 1,000
Feet
Source: Aerial, NAIP 2009


!(
!(
!(
!(
RM84
RM83
RM82
RM81
Figure A-3hChannel Migration History
Wapato Reach Assessment - Phase 2
1909
1947
1973
1978/1979
1992
1995
1996
2000
2003
2005
2006
2009
§̈¦82
£¤97
UV241UV24
UV22
i j lfc kb d
g hea
C:\U
sers
\194
35\D
ocum
ents
\Loc
al G
IS\0
0703
.11_
Wap
atoR
each
\Map
docs
\Rea
chAs
sess
men
tRep
ort\F
igA-
3_C
hann
elM
igra
tion.
mxd
DB
S 4
/13/
2012
"0 1,000
Feet
Source: Aerial, NAIP 2009


!(
!(
!(
!(
!(
RM80
RM79
RM78
RM77
RM76
Figure A-3iChannel Migration History
Wapato Reach Assessment - Phase 2
1909
1947
1973
1978/1979
1992
1995
1996
2000
2003
2005
2006
2009
§̈¦82
£¤97
UV241UV24
UV22
i j lfc kb d
g hea
C:\U
sers
\194
35\D
ocum
ents
\Loc
al G
IS\0
0703
.11_
Wap
atoR
each
\Map
docs
\Rea
chAs
sess
men
tRep
ort\F
igA-
3_C
hann
elM
igra
tion.
mxd
DB
S 4
/13/
2012
"0 1,000
Feet
Source: Aerial, NAIP 2009


!(
!(
!(
!(
!(!(
!(
!(
RM77
RM76
RM75
RM74
RM73
RM72
RM71
RM70
Figure A-3jChannel Migration History
Wapato Reach Assessment - Phase 2
1909
1947
1973
1978/1979
1992
1995
1996
2000
2003
2005
2006
2009
§̈¦82
£¤97
UV241UV24
UV22
i j lfc kb d
g hea
C:\U
sers
\194
35\D
ocum
ents
\Loc
al G
IS\0
0703
.11_
Wap
atoR
each
\Map
docs
\Rea
chAs
sess
men
tRep
ort\F
igA-
3_C
hann
elM
igra
tion.
mxd
DB
S 4
/13/
2012
"0 1,000
Feet
Source: Aerial, NAIP 2009


!(
!(
!(
!(
!(
!(
!(
!(
RM71
RM70
RM69
RM68
RM67
RM66
RM65
RM64
Figure A-3kChannel Migration History
Wapato Reach Assessment - Phase 2
1909
1947
1973
1978/1979
1992
1995
1996
2000
2003
2005
2006
2009
§̈¦82
£¤97
UV241UV24
UV22
i j lfc kb d
g hea
C:\U
sers
\194
35\D
ocum
ents
\Loc
al G
IS\0
0703
.11_
Wap
atoR
each
\Map
docs
\Rea
chAs
sess
men
tRep
ort\F
igA-
3_C
hann
elM
igra
tion.
mxd
DB
S 4
/13/
2012
"0 1,000
Feet
Source: Aerial, NAIP 2009


!(
!(
!(
!(
RM63
RM62
RM61
RM60
Figure A-3lChannel Migration History
Wapato Reach Assessment - Phase 2
1909
1947
1973
1978/1979
1992
1995
1996
2000
2003
2005
2006
2009
§̈¦82
£¤97
UV241UV24
UV22
i j lfc kb d
g hea
C:\U
sers
\194
35\D
ocum
ents
\Loc
al G
IS\0
0703
.11_
Wap
atoR
each
\Map
docs
\Rea
chAs
sess
men
tRep
ort\F
igA-
3_C
hann
elM
igra
tion.
mxd
DB
S 4
/13/
2012
"0 1,000
Feet
Source: Aerial, NAIP 2009


!
!
!
!
!
!
!!
!!
!
!
!
!
!
!
!
!
!!
!
!
!
!
!
!
!!
!
!
!
!
!
!
!
!!
!
!
!
!
!
!
!
!
!
!
!
!!
!
!
!
!
!
!
"/
"/
"/
"/
"/
"/
99
98
9796
95
9493
92 91
9089
88
87
8685
84
83 82
8180
79
78
7776
75 74
73
72
71
70
69 68
67
66
65 64
63 6261
60
5958
5756
110
109108
107
106
105 104
103
102
101
100
Figure A-4Subreach Breaks
Wapato Reach Assessment - Phase 2
C:\U
sers
\194
35\D
ocum
ents
\Loc
al G
IS\0
0703
.11_
Wap
atoR
each
\Map
docs
\Rea
chAs
sess
men
tRep
ort\F
igA-
4_Su
brea
che
Brea
ks.m
xd D
BS
3/12
/201
2
±0 2
Miles
! River Miles (2009)
"/ Subreach Breaks
Subreach 5
Subreach 4
Subreach 3
Subreach 2
Subreach 1


!(
!(
!(
!(
RM110
RM109
RM108
RM107
Figure A-5aAggradation/Degradation Potential
Wapato Reach Assessment - Phase 2
Aggradation/Degradation Potential Class (Bed Elevation Change Rate [feet/year])
1 < -1.0 (Extreme Degradation Potential)
2 -1.0 to -0.20 (High Degradation Potential)
3 -0.20 to -0.05 (Moderate Degradation Potential)
4 +/-0.05 (Minor Change)
5 0.05 to 0.20 (Moderate Aggradation Potential)
6 0.20 to 1.0 (High Aggradation Potential)
7 > 1.0 (Extreme Aggradation Potential)
§̈¦82
£¤97
UV241UV24
UV22
i j lfc kb d
g hea
C:\U
sers
\194
35\D
ocum
ents
\Loc
al G
IS\0
0703
.11_
Wap
atoR
each
\Map
docs
\Rea
chAs
sess
men
tRep
ort\F
igA-
5_Ag
gDeg
Pot
entia
l.mxd
DB
S 3/
12/2
012
"0 1,000
Feet
Source: Aerial, NAIP 2009


!(
!(
!(
!(
RM106
RM105
RM104
RM103
Figure A-5bAggradation/Degradation Potential
Wapato Reach Assessment - Phase 2
Aggradation/Degradation Potential Class (Bed Elevation Change Rate [feet/year])
1 < -1.0 (Extreme Degradation Potential)
2 -1.0 to -0.20 (High Degradation Potential)
3 -0.20 to -0.05 (Moderate Degradation Potential)
4 +/-0.05 (Minor Change)
5 0.05 to 0.20 (Moderate Aggradation Potential)
6 0.20 to 1.0 (High Aggradation Potential)
7 > 1.0 (Extreme Aggradation Potential)
§̈¦82
£¤97
UV241UV24
UV22
i j lfc kb d
g hea
C:\U
sers
\194
35\D
ocum
ents
\Loc
al G
IS\0
0703
.11_
Wap
atoR
each
\Map
docs
\Rea
chAs
sess
men
tRep
ort\F
igA-
5_Ag
gDeg
Pot
entia
l.mxd
DB
S 3/
12/2
012
"0 1,000
Feet
Source: Aerial, NAIP 2009


!(
!(
!(
RM102
RM101RM100
Figure A-5cAggradation/Degradation Potential
Wapato Reach Assessment - Phase 2
Aggradation/Degradation Potential Class (Bed Elevation Change Rate [feet/year])
1 < -1.0 (Extreme Degradation Potential)
2 -1.0 to -0.20 (High Degradation Potential)
3 -0.20 to -0.05 (Moderate Degradation Potential)
4 +/-0.05 (Minor Change)
5 0.05 to 0.20 (Moderate Aggradation Potential)
6 0.20 to 1.0 (High Aggradation Potential)
7 > 1.0 (Extreme Aggradation Potential)
§̈¦82
£¤97
UV241UV24
UV22
i j lfc kb d
g hea
C:\U
sers
\194
35\D
ocum
ents
\Loc
al G
IS\0
0703
.11_
Wap
atoR
each
\Map
docs
\Rea
chAs
sess
men
tRep
ort\F
igA-
5_Ag
gDeg
Pot
entia
l.mxd
DB
S 3/
12/2
012
"0 1,000
Feet
Source: Aerial, NAIP 2009


!(
!(
!(
!(
RM99
RM98
RM97
RM96
Figure A-5dAggradation/Degradation Potential
Wapato Reach Assessment - Phase 2
Aggradation/Degradation Potential Class (Bed Elevation Change Rate [feet/year])
1 < -1.0 (Extreme Degradation Potential)
2 -1.0 to -0.20 (High Degradation Potential)
3 -0.20 to -0.05 (Moderate Degradation Potential)
4 +/-0.05 (Minor Change)
5 0.05 to 0.20 (Moderate Aggradation Potential)
6 0.20 to 1.0 (High Aggradation Potential)
7 > 1.0 (Extreme Aggradation Potential)
§̈¦82
£¤97
UV241UV24
UV22
i j lfc kb d
g hea
C:\U
sers
\194
35\D
ocum
ents
\Loc
al G
IS\0
0703
.11_
Wap
atoR
each
\Map
docs
\Rea
chAs
sess
men
tRep
ort\F
igA-
5_Ag
gDeg
Pot
entia
l.mxd
DB
S 3/
12/2
012
"0 1,000
Feet
Source: Aerial, NAIP 2009


!(
!(
!(
!(
RM95
RM94
RM93
RM92
Figure A-5eAggradation/Degradation Potential
Wapato Reach Assessment - Phase 2
Aggradation/Degradation Potential Class (Bed Elevation Change Rate [feet/year])
1 < -1.0 (Extreme Degradation Potential)
2 -1.0 to -0.20 (High Degradation Potential)
3 -0.20 to -0.05 (Moderate Degradation Potential)
4 +/-0.05 (Minor Change)
5 0.05 to 0.20 (Moderate Aggradation Potential)
6 0.20 to 1.0 (High Aggradation Potential)
7 > 1.0 (Extreme Aggradation Potential)
§̈¦82
£¤97
UV241UV24
UV22
i j lfc kb d
g hea
C:\U
sers
\194
35\D
ocum
ents
\Loc
al G
IS\0
0703
.11_
Wap
atoR
each
\Map
docs
\Rea
chAs
sess
men
tRep
ort\F
igA-
5_Ag
gDeg
Pot
entia
l.mxd
DB
S 3/
12/2
012
"0 1,000
Feet
Source: Aerial, NAIP 2009


!(
!(
!(
!(
RM92
RM91
RM90
RM89
Figure A-5fAggradation/Degradation Potential
Wapato Reach Assessment - Phase 2
Aggradation/Degradation Potential Class (Bed Elevation Change Rate [feet/year])
1 < -1.0 (Extreme Degradation Potential)
2 -1.0 to -0.20 (High Degradation Potential)
3 -0.20 to -0.05 (Moderate Degradation Potential)
4 +/-0.05 (Minor Change)
5 0.05 to 0.20 (Moderate Aggradation Potential)
6 0.20 to 1.0 (High Aggradation Potential)
7 > 1.0 (Extreme Aggradation Potential)
§̈¦82
£¤97
UV241UV24
UV22
i j lfc kb d
g hea
C:\U
sers
\194
35\D
ocum
ents
\Loc
al G
IS\0
0703
.11_
Wap
atoR
each
\Map
docs
\Rea
chAs
sess
men
tRep
ort\F
igA-
5_Ag
gDeg
Pot
entia
l.mxd
DB
S 3/
12/2
012
"0 1,000
Feet
Source: Aerial, NAIP 2009


!(
!(
!(
!(
!(
RM88
RM87
RM86
RM85
RM84
Figure A-5gAggradation/Degradation Potential
Wapato Reach Assessment - Phase 2
Aggradation/Degradation Potential Class (Bed Elevation Change Rate [feet/year])
1 < -1.0 (Extreme Degradation Potential)
2 -1.0 to -0.20 (High Degradation Potential)
3 -0.20 to -0.05 (Moderate Degradation Potential)
4 +/-0.05 (Minor Change)
5 0.05 to 0.20 (Moderate Aggradation Potential)
6 0.20 to 1.0 (High Aggradation Potential)
7 > 1.0 (Extreme Aggradation Potential)
§̈¦82
£¤97
UV241UV24
UV22
i j lfc kb d
g hea
C:\U
sers
\194
35\D
ocum
ents
\Loc
al G
IS\0
0703
.11_
Wap
atoR
each
\Map
docs
\Rea
chAs
sess
men
tRep
ort\F
igA-
5_Ag
gDeg
Pot
entia
l.mxd
DB
S 3/
12/2
012
"0 1,000
Feet
Source: Aerial, NAIP 2009


!(
!(
!(
!(
RM84
RM83
RM82
RM81
Figure A-5hAggradation/Degradation Potential
Wapato Reach Assessment - Phase 2
Aggradation/Degradation Potential Class (Bed Elevation Change Rate [feet/year])
1 < -1.0 (Extreme Degradation Potential)
2 -1.0 to -0.20 (High Degradation Potential)
3 -0.20 to -0.05 (Moderate Degradation Potential)
4 +/-0.05 (Minor Change)
5 0.05 to 0.20 (Moderate Aggradation Potential)
6 0.20 to 1.0 (High Aggradation Potential)
7 > 1.0 (Extreme Aggradation Potential)
§̈¦82
£¤97
UV241UV24
UV22
i j lfc kb d
g hea
C:\U
sers
\194
35\D
ocum
ents
\Loc
al G
IS\0
0703
.11_
Wap
atoR
each
\Map
docs
\Rea
chAs
sess
men
tRep
ort\F
igA-
5_Ag
gDeg
Pot
entia
l.mxd
DB
S 3/
12/2
012
"0 1,000
Feet
Source: Aerial, NAIP 2009


!(
!(
!(
!(
!(
RM80
RM79
RM78
RM77
RM76
Figure A-5iAggradation/Degradation Potential
Wapato Reach Assessment - Phase 2
Aggradation/Degradation Potential Class (Bed Elevation Change Rate [feet/year])
1 < -1.0 (Extreme Degradation Potential)
2 -1.0 to -0.20 (High Degradation Potential)
3 -0.20 to -0.05 (Moderate Degradation Potential)
4 +/-0.05 (Minor Change)
5 0.05 to 0.20 (Moderate Aggradation Potential)
6 0.20 to 1.0 (High Aggradation Potential)
7 > 1.0 (Extreme Aggradation Potential)
§̈¦82
£¤97
UV241UV24
UV22
i j lfc kb d
g hea
C:\U
sers
\194
35\D
ocum
ents
\Loc
al G
IS\0
0703
.11_
Wap
atoR
each
\Map
docs
\Rea
chAs
sess
men
tRep
ort\F
igA-
5_Ag
gDeg
Pot
entia
l.mxd
DB
S 3/
12/2
012
"0 1,000
Feet
Source: Aerial, NAIP 2009


!(
!(
!(
!(
!(!(
!(
!(
RM77
RM76
RM75
RM74
RM73
RM72
RM71
RM70
Figure A-5jAggradation/Degradation Potential
Wapato Reach Assessment - Phase 2
Aggradation/Degradation Potential Class (Bed Elevation Change Rate [feet/year])
1 < -1.0 (Extreme Degradation Potential)
2 -1.0 to -0.20 (High Degradation Potential)
3 -0.20 to -0.05 (Moderate Degradation Potential)
4 +/-0.05 (Minor Change)
5 0.05 to 0.20 (Moderate Aggradation Potential)
6 0.20 to 1.0 (High Aggradation Potential)
7 > 1.0 (Extreme Aggradation Potential)
§̈¦82
£¤97
UV241UV24
UV22
i j lfc kb d
g hea
C:\U
sers
\194
35\D
ocum
ents
\Loc
al G
IS\0
0703
.11_
Wap
atoR
each
\Map
docs
\Rea
chAs
sess
men
tRep
ort\F
igA-
5_Ag
gDeg
Pot
entia
l.mxd
DB
S 3/
12/2
012
"0 1,000
Feet
Source: Aerial, NAIP 2009

!(
!(
!(
!(
!(
!(
!(
!(
RM71
RM70
RM69
RM68
RM67
RM66
RM65
RM64
Figure A-5kAggradation/Degradation Potential
Wapato Reach Assessment - Phase 2
Aggradation/Degradation Potential Class (Bed Elevation Change Rate [feet/year])
1 < -1.0 (Extreme Degradation Potential)
2 -1.0 to -0.20 (High Degradation Potential)
3 -0.20 to -0.05 (Moderate Degradation Potential)
4 +/-0.05 (Minor Change)
5 0.05 to 0.20 (Moderate Aggradation Potential)
6 0.20 to 1.0 (High Aggradation Potential)
7 > 1.0 (Extreme Aggradation Potential)
§̈¦82
£¤97
UV241UV24
UV22
i j lfc kb d
g hea
C:\U
sers
\194
35\D
ocum
ents
\Loc
al G
IS\0
0703
.11_
Wap
atoR
each
\Map
docs
\Rea
chAs
sess
men
tRep
ort\F
igA-
5_Ag
gDeg
Pot
entia
l.mxd
DB
S 3/
12/2
012
"0 1,000
Feet
Source: Aerial, NAIP 2009


!(
!(
!(
!(
RM63
RM62
RM61
RM60
Figure A-5lAggradation/Degradation Potential
Wapato Reach Assessment - Phase 2
Aggradation/Degradation Potential Class (Bed Elevation Change Rate [feet/year])
1 < -1.0 (Extreme Degradation Potential)
2 -1.0 to -0.20 (High Degradation Potential)
3 -0.20 to -0.05 (Moderate Degradation Potential)
4 +/-0.05 (Minor Change)
5 0.05 to 0.20 (Moderate Aggradation Potential)
6 0.20 to 1.0 (High Aggradation Potential)
7 > 1.0 (Extreme Aggradation Potential)
§̈¦82
£¤97
UV241UV24
UV22
i j lfc kb d
g hea
C:\U
sers
\194
35\D
ocum
ents
\Loc
al G
IS\0
0703
.11_
Wap
atoR
each
\Map
docs
\Rea
chAs
sess
men
tRep
ort\F
igA-
5_Ag
gDeg
Pot
entia
l.mxd
DB
S 3/
12/2
012
"0 1,000
Feet
Source: Aerial, NAIP 2009


!(
!(
!(
!(
OBJECTIVE 6
OBJECTIVE 6
OBJECTIVE 6
OBJECTIVE 5
OBJECTIVE 5 AND 6
OBJECTIVE 2 AND 5OBJECTIVE 2 AND 5
OBJECTIVE 2 AND 5
RM110
RM109
RM108
Figure A-7aPotential Habitat Restoration Locations
Wapato Reach Assessment - Phase 2
Levees/Revetments
Floodplain Channels
Valuation of Process-Based Restoration Locations
H
M
L
Valuation of Habitat Enhancement Locations
High
Medium
Low
C:\U
sers
\194
35\D
ocum
ents
\Loc
al G
IS\0
0703
.11_
Wap
atoR
each
\Map
docs
\Rea
chAs
sess
men
tRep
ort\F
igA-
7_Po
tent
ial_
Pro
ject
s.m
xd D
BS 4
/19/
2012
"0 1,000
Feet
WAPATO REACH RESTORATION OBJECTIVES
PROTECTION OBJECTIVE1. Protect parcels with moderate to high habitat value and potentially at risk for conversion, development or loss of function (Presented in a seperate document)
PROCESS-BASED RESTORATION OBJECTIVES2. Encourage the development of a meandering or mildly wandering planform by convertingbroad gravel bars to vegetated channel islands from Sunnyside Dam to Zillah3. Establish or promote engagement of side channels across a wide range of flows4. Establish or promote the engagement of floodplain channels across a wide range of flows5. Remove rip rap or bank hardening
HABITAT ENHANCEMENT OBJECTIVES6. Install instream wood7. Conduct riparian revegetation


!(
!(
!(
!(
OBJECTIVE 7
OBJECTIVE 7
OBJECTIVE 4
OBJECTIVE 2
OBJECTIVE 2
OBJECTIVE 2
OBJECTIVE 2
OBJECTIVE 2
OBJECTIVE 2
OBJECTIVE 2
OBJECTIVE 4
RM106
RM104
RM103
Figure A-7bPotential Habitat Restoration Locations
Wapato Reach Assessment - Phase 2
Levees/Revetments
Floodplain Channels
Valuation of Process-Based Restoration Locations
H
M
L
Valuation of Habitat Enhancement Locations
High
Medium
Low
C:\U
sers
\194
35\D
ocum
ents
\Loc
al G
IS\0
0703
.11_
Wap
atoR
each
\Map
docs
\Rea
chAs
sess
men
tRep
ort\F
igA-
7_Po
tent
ial_
Pro
ject
s.m
xd D
BS 4
/19/
2012
"0 1,000
Feet
WAPATO REACH RESTORATION OBJECTIVES
PROTECTION OBJECTIVE1. Protect parcels with moderate to high habitat value and potentially at risk for conversion, development or loss of function (Presented in a seperate document)
PROCESS-BASED RESTORATION OBJECTIVES2. Encourage the development of a meandering or mildly wandering planform by convertingbroad gravel bars to vegetated channel islands from Sunnyside Dam to Zillah3. Establish or promote engagement of side channels across a wide range of flows4. Establish or promote the engagement of floodplain channels across a wide range of flows5. Remove rip rap or bank hardening
HABITAT ENHANCEMENT OBJECTIVES6. Install instream wood7. Conduct riparian revegetation


!(
!(
!(
OBJECTIVE 7
OBJECTIVE 2
OBJECTIVE 3 AND 4
OBJECTIVE 4
OBJECTIVE 2
OBJECTIVE 4OBJECTIVE 4
OBJECTIVE 4
RM102
RM101
RM100
Figure A-7cPotential Habitat Restoration Locations
Wapato Reach Assessment - Phase 2
Levees/Revetments
Floodplain Channels
Valuation of Process-Based Restoration Locations
H
M
L
Valuation of Habitat Enhancement Locations
High
Medium
Low
C:\U
sers
\194
35\D
ocum
ents
\Loc
al G
IS\0
0703
.11_
Wap
atoR
each
\Map
docs
\Rea
chAs
sess
men
tRep
ort\F
igA-
7_Po
tent
ial_
Pro
ject
s.m
xd D
BS 4
/19/
2012
"0 1,000
Feet
WAPATO REACH RESTORATION OBJECTIVES
PROTECTION OBJECTIVE1. Protect parcels with moderate to high habitat value and potentially at risk for conversion, development or loss of function (Presented in a seperate document)
PROCESS-BASED RESTORATION OBJECTIVES2. Encourage the development of a meandering or mildly wandering planform by convertingbroad gravel bars to vegetated channel islands from Sunnyside Dam to Zillah3. Establish or promote engagement of side channels across a wide range of flows4. Establish or promote the engagement of floodplain channels across a wide range of flows5. Remove rip rap or bank hardening
HABITAT ENHANCEMENT OBJECTIVES6. Install instream wood7. Conduct riparian revegetation


!(
!(
!(
!(
OBJECTIVE 7
OBJECTIVE 5
OBJECTIVE 2 AND 5
OBJECTIVE 5
OBJECTIVE 5 AND 6
OBJECTIVE 5
RM99
RM98
RM96
Figure A-7dPotential Habitat Restoration Locations
Wapato Reach Assessment - Phase 2
Levees/Revetments
Floodplain Channels
Valuation of Process-Based Restoration Locations
H
M
L
Valuation of Habitat Enhancement Locations
High
Medium
Low
C:\U
sers
\194
35\D
ocum
ents
\Loc
al G
IS\0
0703
.11_
Wap
atoR
each
\Map
docs
\Rea
chAs
sess
men
tRep
ort\F
igA-
7_Po
tent
ial_
Pro
ject
s.m
xd D
BS 4
/19/
2012
"0 1,000
Feet
WAPATO REACH RESTORATION OBJECTIVES
PROTECTION OBJECTIVE1. Protect parcels with moderate to high habitat value and potentially at risk for conversion, development or loss of function (Presented in a seperate document)
PROCESS-BASED RESTORATION OBJECTIVES2. Encourage the development of a meandering or mildly wandering planform by convertingbroad gravel bars to vegetated channel islands from Sunnyside Dam to Zillah3. Establish or promote engagement of side channels across a wide range of flows4. Establish or promote the engagement of floodplain channels across a wide range of flows5. Remove rip rap or bank hardening
HABITAT ENHANCEMENT OBJECTIVES6. Install instream wood7. Conduct riparian revegetation


!(
!(
!(
!(
OBJECTIVE 7
OBJECTIVE 2
OBJECTIVE 2
OBJECTIVE 5
OBJECTIVE 2
OBJECTIVE 5
OBJECTIVE 2
RM95
RM94
RM93
Figure A-7ePotential Habitat Restoration Locations
Wapato Reach Assessment - Phase 2
Levees/Revetments
Floodplain Channels
Valuation of Process-Based Restoration Locations
H
M
L
Valuation of Habitat Enhancement Locations
High
Medium
Low
C:\U
sers
\194
35\D
ocum
ents
\Loc
al G
IS\0
0703
.11_
Wap
atoR
each
\Map
docs
\Rea
chAs
sess
men
tRep
ort\F
igA-
7_Po
tent
ial_
Pro
ject
s.m
xd D
BS 4
/19/
2012
"0 1,000
Feet
WAPATO REACH RESTORATION OBJECTIVES
PROTECTION OBJECTIVE1. Protect parcels with moderate to high habitat value and potentially at risk for conversion, development or loss of function (Presented in a seperate document)
PROCESS-BASED RESTORATION OBJECTIVES2. Encourage the development of a meandering or mildly wandering planform by convertingbroad gravel bars to vegetated channel islands from Sunnyside Dam to Zillah3. Establish or promote engagement of side channels across a wide range of flows4. Establish or promote the engagement of floodplain channels across a wide range of flows5. Remove rip rap or bank hardening
HABITAT ENHANCEMENT OBJECTIVES6. Install instream wood7. Conduct riparian revegetation


!(
!(
!(
!(
OBJECTIVE 7OBJECTIVE 6
OBJECTIVE 6
OBJECTIVE 6
OBJECTIVE 6
OBJECTIVE 6
OBJECTIVE 5
OBJECTIVE 2
OBJECTIVE 2
OBJECTIVE 5
OBJECTIVE 5OBJECTIVE 5 AND 6
OBJECTIVE 2 AND 5
OBJECTIVE 2OBJECTIVE 2
OBJECTIVE 2
OBJECTIVE 2
OBJECTIVE 5
OBJECTIVE 2
RM91RM89
Figure A-7fPotential Habitat Restoration Locations
Wapato Reach Assessment - Phase 2
Levees/Revetments
Floodplain Channels
Valuation of Process-Based Restoration Locations
H
M
L
Valuation of Habitat Enhancement Locations
High
Medium
Low
C:\U
sers
\194
35\D
ocum
ents
\Loc
al G
IS\0
0703
.11_
Wap
atoR
each
\Map
docs
\Rea
chAs
sess
men
tRep
ort\F
igA-
7_Po
tent
ial_
Pro
ject
s.m
xd D
BS 4
/19/
2012
"0 1,000
Feet
WAPATO REACH RESTORATION OBJECTIVES
PROTECTION OBJECTIVE1. Protect parcels with moderate to high habitat value and potentially at risk for conversion, development or loss of function (Presented in a seperate document)
PROCESS-BASED RESTORATION OBJECTIVES2. Encourage the development of a meandering or mildly wandering planform by convertingbroad gravel bars to vegetated channel islands from Sunnyside Dam to Zillah3. Establish or promote engagement of side channels across a wide range of flows4. Establish or promote the engagement of floodplain channels across a wide range of flows5. Remove rip rap or bank hardening
HABITAT ENHANCEMENT OBJECTIVES6. Install instream wood7. Conduct riparian revegetation


!(
!(
!(
!(
!(
OBJECTIVE 7
OBJECTIVE 7
OBJECTIVE 6
OBJECTIVE 6
OBJECTIVE 6
OBJECTIVE 6
OBJECTIVE 6
OBJECTIVE 6
OBJECTIVE 2
OBJECTIVE 2OBJECTIVE 2
OBJECTIVE 2
OBJECTIVE 2
RM84
Figure A-7gPotential Habitat Restoration Locations
Wapato Reach Assessment - Phase 2
Levees/Revetments
Floodplain Channels
Valuation of Process-Based Restoration Locations
H
M
L
Valuation of Habitat Enhancement Locations
High
Medium
Low
C:\U
sers
\194
35\D
ocum
ents
\Loc
al G
IS\0
0703
.11_
Wap
atoR
each
\Map
docs
\Rea
chAs
sess
men
tRep
ort\F
igA-
7_Po
tent
ial_
Pro
ject
s.m
xd D
BS 4
/19/
2012
"0 1,000
Feet
WAPATO REACH RESTORATION OBJECTIVES
PROTECTION OBJECTIVE1. Protect parcels with moderate to high habitat value and potentially at risk for conversion, development or loss of function (Presented in a seperate document)
PROCESS-BASED RESTORATION OBJECTIVES2. Encourage the development of a meandering or mildly wandering planform by convertingbroad gravel bars to vegetated channel islands from Sunnyside Dam to Zillah3. Establish or promote engagement of side channels across a wide range of flows4. Establish or promote the engagement of floodplain channels across a wide range of flows5. Remove rip rap or bank hardening
HABITAT ENHANCEMENT OBJECTIVES6. Install instream wood7. Conduct riparian revegetation


!(
!(
!(
!(
OBJECTIVE 7
OBJECTIVE 7
OBJECTIVE 7
OBJECTIVE 6
OBJECTIVE 6
OBJECTIVE 6
OBJECTIVE 6
OBJECTIVE 6
OBJECTIVE 6
OBJECTIVE 5
OBJECTIVE 2
OBJECTIVE 2OBJECTIVE 5
OBJECTIVE 2
RM81
Figure A-7hPotential Habitat Restoration Locations
Wapato Reach Assessment - Phase 2
Levees/Revetments
Floodplain Channels
Valuation of Process-Based Restoration Locations
H
M
L
Valuation of Habitat Enhancement Locations
High
Medium
Low
C:\U
sers
\194
35\D
ocum
ents
\Loc
al G
IS\0
0703
.11_
Wap
atoR
each
\Map
docs
\Rea
chAs
sess
men
tRep
ort\F
igA-
7_Po
tent
ial_
Pro
ject
s.m
xd D
BS 4
/19/
2012
"0 1,000
Feet
WAPATO REACH RESTORATION OBJECTIVES
PROTECTION OBJECTIVE1. Protect parcels with moderate to high habitat value and potentially at risk for conversion, development or loss of function (Presented in a seperate document)
PROCESS-BASED RESTORATION OBJECTIVES2. Encourage the development of a meandering or mildly wandering planform by convertingbroad gravel bars to vegetated channel islands from Sunnyside Dam to Zillah3. Establish or promote engagement of side channels across a wide range of flows4. Establish or promote the engagement of floodplain channels across a wide range of flows5. Remove rip rap or bank hardening
HABITAT ENHANCEMENT OBJECTIVES6. Install instream wood7. Conduct riparian revegetation


!(
!(
!(
!(
!(
OBJECTIVE 7
OBJECTIVE 6
OBJECTIVE 6
OBJECTIVE 6
OBJECTIVE 6
OBJECTIVE 6
OBJECTIVE 5OBJECTIVE 5
OBJECTIVE 2
OBJECTIVE 2
OBJECTIVE 2
OBJECTIVE 5
RM80
RM79
RM76
Figure A-7iPotential Habitat Restoration Locations
Wapato Reach Assessment - Phase 2
Levees/Revetments
Floodplain Channels
Valuation of Process-Based Restoration Locations
H
M
L
Valuation of Habitat Enhancement Locations
High
Medium
Low
C:\U
sers
\194
35\D
ocum
ents
\Loc
al G
IS\0
0703
.11_
Wap
atoR
each
\Map
docs
\Rea
chAs
sess
men
tRep
ort\F
igA-
7_Po
tent
ial_
Pro
ject
s.m
xd D
BS 4
/19/
2012
"0 1,000
Feet
WAPATO REACH RESTORATION OBJECTIVES
PROTECTION OBJECTIVE1. Protect parcels with moderate to high habitat value and potentially at risk for conversion, development or loss of function (Presented in a seperate document)
PROCESS-BASED RESTORATION OBJECTIVES2. Encourage the development of a meandering or mildly wandering planform by convertingbroad gravel bars to vegetated channel islands from Sunnyside Dam to Zillah3. Establish or promote engagement of side channels across a wide range of flows4. Establish or promote the engagement of floodplain channels across a wide range of flows5. Remove rip rap or bank hardening
HABITAT ENHANCEMENT OBJECTIVES6. Install instream wood7. Conduct riparian revegetation


!(
!(
!(
!(
!(!(
!(
!(
OBJECTIVE 6
OBJECTIVE 6
OBJECTIVE 6
OBJECTIVE 6
OBJECTIVE 6
OBJECTIVE 5
RM76
RM75
RM74
RM73RM72
RM70
Figure A-7jPotential Habitat Restoration Locations
Wapato Reach Assessment - Phase 2
Levees/Revetments
Floodplain Channels
Valuation of Process-Based Restoration Locations
H
M
L
Valuation of Habitat Enhancement Locations
High
Medium
Low
C:\U
sers
\194
35\D
ocum
ents
\Loc
al G
IS\0
0703
.11_
Wap
atoR
each
\Map
docs
\Rea
chAs
sess
men
tRep
ort\F
igA-
7_Po
tent
ial_
Pro
ject
s.m
xd D
BS 4
/19/
2012
"0 1,000
Feet
WAPATO REACH RESTORATION OBJECTIVES
PROTECTION OBJECTIVE1. Protect parcels with moderate to high habitat value and potentially at risk for conversion, development or loss of function (Presented in a seperate document)
PROCESS-BASED RESTORATION OBJECTIVES2. Encourage the development of a meandering or mildly wandering planform by convertingbroad gravel bars to vegetated channel islands from Sunnyside Dam to Zillah3. Establish or promote engagement of side channels across a wide range of flows4. Establish or promote the engagement of floodplain channels across a wide range of flows5. Remove rip rap or bank hardening
HABITAT ENHANCEMENT OBJECTIVES6. Install instream wood7. Conduct riparian revegetation


!(
!(
!(
!(
!(
!(
!(
!(
OBJECTIVE 6
OBJECTIVE 6
OBJECTIVE 6
OBJECTIVE 6
RM71
RM70
RM68
RM66RM64
Figure A-7kPotential Habitat Restoration Locations
Wapato Reach Assessment - Phase 2
Levees/Revetments
Floodplain Channels
Valuation of Process-Based Restoration Locations
H
M
L
Valuation of Habitat Enhancement Locations
High
Medium
Low
C:\U
sers
\194
35\D
ocum
ents
\Loc
al G
IS\0
0703
.11_
Wap
atoR
each
\Map
docs
\Rea
chAs
sess
men
tRep
ort\F
igA-
7_Po
tent
ial_
Pro
ject
s.m
xd D
BS 4
/19/
2012
"0 1,000
Feet
WAPATO REACH RESTORATION OBJECTIVES
PROTECTION OBJECTIVE1. Protect parcels with moderate to high habitat value and potentially at risk for conversion, development or loss of function (Presented in a seperate document)
PROCESS-BASED RESTORATION OBJECTIVES2. Encourage the development of a meandering or mildly wandering planform by convertingbroad gravel bars to vegetated channel islands from Sunnyside Dam to Zillah3. Establish or promote engagement of side channels across a wide range of flows4. Establish or promote the engagement of floodplain channels across a wide range of flows5. Remove rip rap or bank hardening
HABITAT ENHANCEMENT OBJECTIVES6. Install instream wood7. Conduct riparian revegetation


!(
!(
!(
!(
OBJECTIVE 6
OBJECTIVE 6
OBJECTIVE 6OBJECTIVE 6
RM63
RM62
RM61
RM60
Figure A-7lPotential Habitat Restoration Locations
Wapato Reach Assessment - Phase 2
Levees/Revetments
Floodplain Channels
Valuation of Process-Based Restoration Locations
H
M
L
Valuation of Habitat Enhancement Locations
High
Medium
Low
C:\U
sers
\194
35\D
ocum
ents
\Loc
al G
IS\0
0703
.11_
Wap
atoR
each
\Map
docs
\Rea
chAs
sess
men
tRep
ort\F
igA-
7_Po
tent
ial_
Pro
ject
s.m
xd D
BS 4
/19/
2012
"0 1,000
Feet
WAPATO REACH RESTORATION OBJECTIVES
PROTECTION OBJECTIVE1. Protect parcels with moderate to high habitat value and potentially at risk for conversion, development or loss of function (Presented in a seperate document)
PROCESS-BASED RESTORATION OBJECTIVES2. Encourage the development of a meandering or mildly wandering planform by convertingbroad gravel bars to vegetated channel islands from Sunnyside Dam to Zillah3. Establish or promote engagement of side channels across a wide range of flows4. Establish or promote the engagement of floodplain channels across a wide range of flows5. Remove rip rap or bank hardening
HABITAT ENHANCEMENT OBJECTIVES6. Install instream wood7. Conduct riparian revegetation


Appendix B. Predation Analysis


Wapato Reach Assessment Report B-1 March 2012 ICF 703.11
Smolt Predation in the Yakima River: Purpose and Overview
The purpose of this analysis of smolt predation in the Yakima River is two-fold: to fine-tune the EDT
estimate of mortality in the Wapato reach attributable to bird and fish predation, and to make
recommendations for research and/or management plans intended to reduce the impact of
predation in the Wapato reach on smolt production and the productivity of Yakima River salmon
and steelhead.
According to the avian predation portion of the YKFP Monitoring program, since roughly 2003 the
primary avian predators on juvenile salmonids in the Wapato Reach have been American white
pelicans (Pelecanus erythrorhynchos), double crested cormorants (Phalacrocorax auritus), great blue
herons (Ardea herodias) and common mergansers (Mergus merganser). Although nine other species
of piscivorous birds reside in the reach from time to time, none are nearly as significant as these
four in terms of the total impact of their abundance, size and caloric requirements and piscivorous
diet.
The major fish species preying on juvenile salmonids in the reach is the Northern pikeminnow
(Pteichocheilus oregonensus). Since at least the late 1950s, the major predatory fish have been
distributed longitudinally along the mainstem Yakima River (Patten et al. 1970; Pearsons et al.
1997), with channel catfish (Ictalurus punctatus) dominating the area near the confluence of the
Yakima and Columbia Rivers, smallmouth bass (Micropterus dolomieu) the reach between Richland
and Prosser Dam, and pikeminnow dominating the river above Prosser Dam.
Feeding Ecology of Piscivorous Birds in the Yakima American white pelicans (hereafter simply “pelicans”), great blue herons (hereafter “herons”) and
double-crested cormorants (hereafter cormorants) are all large birds with large appetites, a strong
preference for fish and very opportunistic foraging habits. Except for size, the same is true of
common mergansers (hereafter “mergansers”). In virtually every year since pelicans re-entered the
Yakima Basin in 2000, the Wapato reach has supported more pelicans and herons, and a higher total
number of piscivorous birds across all species, than any other reach in the Yakima Basin (YKFP
2011).
While pelicans, herons, and cormorants are extremely piscivorous, they usually feed on fish larger
than smolts: in the Yakima, such fish include chislemouth, sucker, carp, bullhead and northern
pikeminnow, typically 150-190 mm or more in length1. Usually, it is simply energetically more
efficient for these birds to target larger prey (YKFP 2007). It is, however, also quite clear that all of
1 Pelicans, however, will consume very large fish, as one documented instance of a pelican attempting (unsuccessfully) to consume an adult salmon at the Chandler outfall demonstrates.

Yakama Nation Appendix B
Wapato Reach Assessment Report B-2 March 2012 ICF 703.11
these bird species will feed heavily on juvenile trout and salmon species under the right conditions.
The details of “the right conditions” vary, but all entail a concentration of juvenile salmonid prey.
Such concentrations often reflect anthropogenic alteration of habitat, such as at hatchery release
points, inside or near hatcheries, in turbulent tailraces below dams or at juvenile bypass outfall
zones. Smolts can, however, be concentrated naturally, when low flows occur during the
outmigration season. Birds that nest in colonies, like pelicans, herons and cormorants, are especially
adept at utilizing cues from their neighbors to find the location of fish that, like smolts, are often
found in aggregations (Ward and Zahavi 1973).
As shown repeatedly by investigations throughout North America and Europe, avian predators can
consume large number of juvenile salmonids when appropriate conditions for bird/fish interactions
occur (Elson 1962; Feltham 1995a; Modde and Wasowicz 1996). The following examples are typical
of the literature:
Mace (1983) documented the consumption of 20-40% of the Chinook salmon juveniles released
from the Big Qualicum Hatchery on Vancouver Island;
Wood (1987) estimated that common mergansers consumed between 24 and 66% of the
production of wild coho smolts in the Big Qualicum River system on Vancouver Island, BC,
between June 10 and August 25 1980-1982;
Parkhurst et al. (1992) documented that seven species of piscivorous birds consumed between
1,550 and 773,530 fish at 10 trout hatcheries in central Pennsylvania;
Alexander (1979) found that various avian predators consumed 20-24% of the total annual
production of trout in the North Branch of the Au Sable River in Michigan; and
Kennedy and Greer (1998) found European cormorants (Phalacrocorax carbo) consumed at
least 51-66% of total wild Atlantic salmon run in the River Bush in northern Ireland.
There is also a growing body of evidence from inside the Yakima Basin and the Wapato reach
specifically that piscivorous birds are capable of substantial impacts on juvenile salmonids. As will
be shown in the Smolt Consumption Rate section, diets including even a very low proportion of
smolts for the four main avian piscivores in the Wapato reach result in smolt mortality rates ranging
from 5 to 32% (mean=19%) over recent years.
Feeding Ecology of Pelicans
The first observation in recent times of white pelicans in the Yakima River occurred in the mid to
late 1980s, and they have been increasing in areas upstream of Prosser since 1994 (Tracy Hames,
Yakama Nation Wildlife Resources Program, personal communication). Pelicans re-appeared as a
Washington breeder in 1994, when 50 birds nested on Crescent Island in the Columbia River, near
Burbank, WA. They were first observed at Chandler in 2000, and first counted in river reach surveys
of piscivorous birds in 2001. Pelicans displaced California and ring-billed gulls at Chandler in 2003,
and the density of gulls throughout the entire Wapato reach has dropped since the re-appearance of
pelicans.

Yakama Nation Appendix B
Wapato Reach Assessment Report B-3 March 2012 ICF 703.11
White pelicans are currently listed as a State endangered species, and their only existing breeding
site in Washington is on Badger Island on the Columbia River, between McNary Dam and the mouth
of the Yakima (YKFP 2003). The Badger Island colony currently consists of about 500 breeding pairs
(YKFP 2011). Nesting pelicans travel 50-80 km in search of food, and the recovery of non-Yakima
PIT-tags inside the Yakima at pelican roosting areas, as well as the recovery of Yakima PIT-tags on
Badger Island, indicates pelicans are moving about inside the Yakima Basin and between the Yakima
Basin and Badger Island (YKFP 2011). In 2010, 55% of the PIT-tags recovered on Badger Island
were from Yakima-released fish, suggesting the pelicans had consumed Yakima fish inside the
Yakima rather than in the mainstem Columbia, where Yakima tags would represent far less than
50% of the available tagged fish (YKFP 2011). There is some evidence that breeding pelicans from
Badger Island forage inside the Yakima in May, but that non-breeders from Eastern Montana, British
Columbia and the Klamath Reserve in Oregon are found inside the basin in June (YKFP 2003).
American white pelicans are not divers; they forage at or near the surface, targeting fish found
within the upper 4-5 feet of the water column. They often forage communally, in groups ranging
from 10 to 300 individuals, driving schools of fish toward the shore, sometimes at night (IDFG
2009). The pelicans foraging in the Yakima Basin do, contrary to earlier speculation, consume small
fall Chinook, as evidenced by the PIT-tags recovered on Badger Island, which were primarily from
“very small” fall and summer Chinook release groups (YKFP 2011).
Throughout their range, white pelicans are described as opportunistic piscivores that usually target
moderately large non-game fish such as carp, various species of minnow, suckers, and bullhead.
Under certain conditions, however, even so large a bird as the white pelican will include a
substantial proportion of relatively small salmonids in their diet. To take an example from a western
river, Derby and Lovvorn (1997) monitored the diet of white pelicans and double-crested
cormorants in the North Platte River in Wyoming before and after stocking with hatchery-reared
trout. Before stocking, trout comprised less than 0.1% by weight of the diet of white pelicans. After
stocking with rainbow and cutthroat trout (100 – 160mm), the proportion of trout in the diet of
pelicans increased to 14%. The response of cormorants was more pronounced, with the proportion
of trout in the diet increasing from 12% before stocking to 82% after stocking.
The timing of pelican appearance in the Yakima, as well as their daily abundance, is correlated with
river flow (YKFP 2007 - 2011). Specifically, pelican abundance is inversely correlated with flow; at
the Chandler outfall (and by inference at other points along the migration corridor), the correlation
coefficient between pelican abundance and flow is -0.456. This relationship is probably based on an
increase in foraging efficiency at low flows attributable to the exposure of mid-river rocks for
loafing/perching, increased water clarity and prey visibility, concentration of prey in smaller
volumes of shallower water, etc. The effect of the flow/abundance relationship is that total
consumption of fish by pelicans increases dramatically at lower flows and, in general, that the
abundance of pelicans within the Yakima Basin does not peak until later in the season, when flows
have fallen and most smolts have already emigrated. A rough rule of thumb applicable to pelican
numbers at the Chandler outfall is that abundance will be minimal until flows have fallen below
~4,000 cfs at Prosser Dam (YKFP 2007). Interestingly, this same relationship applied to gulls at the
Chandler outfall when they were the dominant avian piscivore there (Phinney et al. 1998). Daily
pelican abundance at the Chandler outfall is also directly correlated with estimated daily coho
passage at Prosser Dam. This relationship, however, may be confounded with flows, because coho

Yakama Nation Appendix B
Wapato Reach Assessment Report B-4 March 2012 ICF 703.11
passage typically occurs later in the spring (May and June), when flows in the Yakima mainstem are
falling.
It is appropriate at this point to mention that the daily abundance and fish consumption rates of
herons, gulls and perhaps all piscivorous birds are also inversely correlated with river flow in the
Yakima Basin. Based on PIT-tag recoveries by time period, the consumption of PIT-tagged smolts by
herons in the Selah rookery was seen to correlate inversely with the mean flow below Roza Dam and
the number of flushing flows (YKFP 2010), and the consumption of PIT-tagged steelhead by herons
nesting in the Toppenish Wildlife Reserve increased for fish migrating later in the spring, when
flows are lower (YKFP 2010). The daily abundance of gulls at Horn Rapids Dam is also directly
correlated with (lagged) coho abundance at Prosser Dam, and inversely correlated with flow in the
lower Yakima River (YKFP 2003-2011). Using the parameters of this report, Figures B-1 through B-3
show that the impact of piscivorous birds in the Wapato reach over the years 2003 through 2007
and 2009 are also inversely correlated with flow (note that the calculations behind these figures are
discussed in the next section). Figure B-1 shows that the total abundance (expressed as bird days) of
the four main avian piscivores in the Wapato reach was much greater in the years 2003 through
2005 than in the years 2006, 2007 and 2009. Mean monthly flows for the April – June outmigration
period at Grandview (Figure B-3), within the Wapato reach, were more than twice as high in the last
three years of this series than in the first three. As would be expected, total fish consumption was
also much greater during the three earlier, low-flow years than the three years of higher flows
(Figure B-2).
Figure B-1. Estimated bird-days of presence of American white pelicans, common mergansers, great blue herons and double-crested cormorants in the Wapato reach 2003-2007 and 2009. Bird density data from Stephenson and Fast 2004 and YKFP 2005–2008, and YKFP 2010.

Yakama Nation Appendix B
Wapato Reach Assessment Report B-5 March 2012 ICF 703.11
Figure B-2. Estimated consumption of fish in kg by the four major piscivorous birds in the Wapato reach during the outmigrations of 2003–2007 and 2009.
Figure B-3. Mean monthly flow of the Yakima River at Grandview, near the middle of the Wapato reach, for the years 2003–2007 and 2009.
Aerial surveys have shown that pelicans are found almost exclusively inside the Wapato reach,
usually in sloughs, oxbows, floodplain ponds, where they are presumed to be feeding on the suckers,
carp, and bullhead that inhabit such areas. Peak pelican abundance as estimated by aerial surveys
has varied from 731 in 2005 to 125 in 2007 (YKFP 2011).
The diet of pelicans inside the Yakima is basically unknown because, as a protected species, they
have not been lethally sampled, and because their pouch obscures the identity of fish they capture
from observers. Larger non-salmonids, such as chislemouth, sucker, carp, bullhead and pikeminnow
are believed to constitute the bulk of their prey when smolts are not concentrated by some natural
or anthropogenic factor (YKFP 2011). In 2005, a chiselmouth and a sucker were the only fish found
inside the stomachs of five pelicans found dead along the lower Yakima River (YKFP 2006).

Yakama Nation Appendix B
Wapato Reach Assessment Report B-6 March 2012 ICF 703.11
Feeding Ecology of Herons
Herons feed by ambushing fish, amphibians and larger invertebrates (e.g., dragonfly larvae) while
either standing still in shallow water, or very slowly stalking more active fish, amphibians and
invertebrates. Herons also forage on land, often in newly plowed fields, where they have been seen
to consume voles amounting to over two thirds of their diet (Collazo 1985).
The recovery of PIT-tags from a rookery near Selah in 2006 showed that herons consume more
smolts than had been previously thought. It was possible in 2006 to match recovered PIT-tags to
cormorants or herons in the Selah rookery, or to pelicans roosting on a sand bar near the Roza
Recreational Site above Roza Dam. The results of this analysis showed that cormorants consumed
41% of the tags from this section of the river, while pelicans consumed 30% and herons 26%. Most
of the tags were from hatchery spring Chinook and coho released in the upper Yakima. More to the
point for an analysis of predation in the Wapato reach, the consumption of salmon smolts by herons
and pelicans was considerably more than negligible.
As mentioned, the smolt consumption by herons at the Selah rookery varies inversely with river
flow below Roza Dam, the reach just upstream from the rookery. This reach lies immediately above
the Naches confluence and below the Roza Dam diversion, and instream flows can become quite low
in this reach before water is released from storage reservoirs.
The great bulk of herons nest in the Wapato reach and along lower Toppenish Creek, not in the Selah
area on the middle Yakima. Over 600 heron nests were counted in this area during an aerial survey
in 1993 (T. Hames personal communication cited in YKFP 2008). Herons also have been observed
foraging at Sunnyside and Prosser Dams, Roza Wasteway #3, and the Chandler bypass outfall. A
total of 29 herons were counted at Roza Wasteway in 1998, when coho smolts were being
acclimated there prior to release (Phinney et al. 1998). Herons are considered major predators at
fish hatcheries such similar facilities as acclimation ponds (Schafer 1992; Pitt and Conover 1996).
Feeding Ecology of Cormorants
Like mergansers, cormorants feed by chasing fish down underwater. In the Columbia River, they
have been shown to feed intensively on hatchery fall Chinook, despite their small size (Sebring et al.
2009). In the Columbia estuary, the proportion of smolts in cormorant diets ranges from 28% in
May to about 2 % in July (Bird Research Northwest, http://www.birdresearchnw.org/ ).
There is one and at times two cormorant breeding colonies inside the Yakima. One colony became
established at the Satus Wildlife Area in 2008, and cormorants have periodically partially displaced
herons at the Selah rookery over the past ten years. Since the late 1990s cormorants have been
frequently observed feeding in the Wapato reach and the lower Yakima River (YKFP 2009).
The diet of cormorants inside the Yakima is basically unknown except for such inferences as can be
drawn from the PIT-tags recovered at Selah and the Sunnyside Wildlife Reserve and the
observations of Phinney et al. 1998. Phinney et al. (1998) reported that the stomachs of three
cormorants shot in 1998 inside and below the Wapato reach contained a 190mm smallmouth bass, a
174mm sucker, and a 154mm chislemouth, as well as also bones from whitefish, pikeminnow and

Yakama Nation Appendix B
Wapato Reach Assessment Report B-7 March 2012 ICF 703.11
suckers. At Horn Rapids Dam, Phinney et al. (1998) observed cormorants making 231 feeding
attempts resulting in the capture of 15 fish, 3 of which were salmonids.
Feeding Ecology of Mergansers
Like cormorants, mergansers chase down fish under water, but unlike cormorants, they swallow
their prey under water, precluding direct observation of the species they consume.
Although mergansers are the dominant piscivorous bird in the upper river, they are still the fourth
most abundant piscivorous bird in the Wapato reach (YKFP 2008).
Common mergansers are known to feed on salmon smolts, to congregate in hatchery release areas
(Wood 1985) and to take advantage of fish disoriented by dams (Timken and Anderson 1969; Jones
et al 1996). Matthews and Phinney (1998) shot 20 mergansers in the fall/winter and spring of 1997-
98 and estimated the composition of the diet of Yakima mergansers by analyzing the stomach
contents these birds. Of the 9 birds collected in the fall/winter in the Yakima Canyon and Selah
reaches, 42.2% of the prey items were salmonids (15.8% Chinook, 21.1% rainbow trout (O. mykiss)
and 5.3% unidentified salmonid), along with sculpin (Cottus spp), smallmouth bass, northern
pikeminnow, redside shiner (Richardsonius balteatus), sucker (Castostomus spp) and crayfish.
Rainbow trout and unidentified salmonids made up 6.2% of the stomach items in the seven birds
collected in the spring in the Canyon and Selah reaches, along with sculpin spp. (alone making up
71.9%) , dace (Rhinichthys spp) and crayfish. Of the birds collected in the spring in the Granger
reach, unidentified salmonids made up 16.7% of the items, which included chislemouth (Acrocheilus
alutaceus) (alone making up 50%), dace and northern pikeminnow. The mean of the percent
salmonids seen in the stomachs from both spring samples (6.2% for Canyon/Selah, 16.7% Granger)
is ~11%, and this value was assumed to represent the proportion of smolts in the diet of
mergansers in this report.
The abundance of mergansers in the upper river has remained relatively constant since piscivorous
bird surveys began in 1997.
Estimated Smolt Consumption Rate Based on mean monthly bird densities (number per km) within the Wapato Reach reported in
Yakama Nation river reach surveys, the total number of bird days for the top four piscivorous birds
in the Wapato reach has ranged from 13,428 (2007) to 89,232 (2005) (Figure B-1) over the years
2003 through 2007 and 2009, and was dominated by pelicans (note: the years 2003 through 2007
and 2009 were chosen because of the completeness of the density data for all four species of
piscivorous bird). The food requirements of pelicans, herons, cormorants and mergansers (kg of fish
per day per bird), as estimated by Major et al. (2003) are 11.339, 0.415, 0.499 and 0.455,
respectively. Given these figures, the biomass of fish consumed over these same years is quite
substantial, ranging from 10,486 to 106,821 kg, 65 to 91% of which consists of the food
requirements of pelicans (Figure B-2). Using procedures described below, if the entire caloric
requirements of the top four piscivorous bird species in the Wapato were obtained exclusively from
smolts, the dietary requirement would be more than the entire wild and hatchery outmigration at

Yakama Nation Appendix B
Wapato Reach Assessment Report B-8 March 2012 ICF 703.11
Prosser for four of the six years analyzed (2003–2006, but not 2007 and 2009). Figure B-3 shows
that the three years of highest abundance of piscivorous birds were also the three years of lowest
flow during the outmigration.
The procedure employed in estimating the mortality rate incurred by Yakima River smolts as a
result of bird predation is relatively straightforward if computationally tedious. As seen in eq 1, the
first step consisted in estimating the overall magnitude of predation in the Wapato Reach by
computing the number of “bird days” for each of the four major piscivorous birds in the Wapato
Reach. A “bird day” is the number of birds present for a day, such that 5 birds being present on five
days represents 25 bird days. Equation 1 shows that the number of bird days was estimated by the
sum of the product of the mean bird density (birds/km) in two Survey Areas, the length in km of
each Survey Area, and the number of days of the outmigration. This calculation was done for each of
the four major predators in the reach, American white pelicans, double crested cormorants, great
blue herons and common mergansers. The bird predation data was taken from six annual YKFP
Monitoring and Evaluation reports (Stephenson and Fast 2004,YKFP 2005, YKFP 2006, YKFP 2007,
YKFP 2008 and YKFP 2010) in which avian predation was estimated in Survey Areas distributed
over the entire length of the Yakima River. Two of these Survey Areas occur within the Wapato
Reach: the 20.3 km Parker Survey Area2, and the 16.0 km Zillah Survey Area. The effective period of
smolt outmigration and predation exposure was assumed to be the 91 day period of between April 1
and June 30. If, for example, mean pelican density in the Zillah area in a given year was 1 bird/km,
the total bird days of predation assigned to that area would be 1*16*91 or 1,456 bird days.
Analogous computations were done for each of the four bird species for each of the six years for
which complete data was available.
∑(
)
Equation 2 shows that the number of bird days for each bird species was expanded to cover the
entire Wapato reach by simply multiplying the value for the two survey areas by the ratio of lengths
of the Wapato reach to the total length of the survey areas. The expanded bird day figures for each
species of piscivorous bird were then converted into season-long estimates of the biomass of smolts
consumed by multiplying the bird day total by the kg/day required by each bird species and the
percent of the diet of each species that consists of smolts.
The proportionate composition of the diet of piscivorous birds – specifically, the proportion of the
diet consisting of smolts -- in the Yakima is a crucial and problematic parameter. It is crucial
because, however large and voracious large predators like pelicans and herons might be, their
impact to salmon and steelhead is zero if, for whatever reason, only non-salmonids are consumed. It
is problematic because very little empirical data on specifically Yakima consumption rates exists,
and it is known that the dietary habits of some of the species in the Yakima – particularly pelicans
and herons – are sometimes atypical in their relatively high proportion of salmonids. The values for
2 Note that the Parker Survey Area was not monitored until 2006. To estimate Parker bird densities for 2003-2005, the mean ratio
of Parker-to-Zillah densities for the years 2006, 2007 and 2009 was applied to Zillah densities observed 2003-2005.

Yakama Nation Appendix B
Wapato Reach Assessment Report B-9 March 2012 ICF 703.11
smolt content that we used in this analysis are reasonable but definitely should not be considered
definitive. Phinney et al. (2000) examined the diets of a small number of piscivorous birds in the
Yakima Basin, including double crested cormorants and common mergansers. Three of 15 (20%)
prey items found in Yakima cormorants were salmonids, while an average of 11% of prey items
found in mergansers consisted of salmonids. No empirical estimates of the species composition of
the diets of Yakima herons and pelicans exist although, as is clear from PIT-tag recoveries, the
proportion of smolts is sometimes substantially greater than zero. In the interest of generating some
concrete estimates of the mortality rate that plausibly could be attributed to bird predation, this
analysis assumed a mean smolt composition of 5% for Yakima pelicans and herons.
( )
⁄
∑(
) ( ) ( )
The final two steps in the estimation process were to estimate the number of smolts consumed by
species, and then to express this number as a proportion of the number of fish estimated to have
passed Prosser Dam. This analysis assumed all smolts were equally likely to be consumed, such
that if a given species represented 20% in the outmigration they would also constitute 20% of the
smolt portion of their diet
( ) ( )
eq 4
( )
As seen in Table B-1, the total mortality smolts incur as a result of bird predation over the years
2003 through 2009 (exclusive of 2008) ranges from 4.7 to 31.8%, and averages 18.9%. These
figures are based on the bird densities reported by the YKFP for the respective years, the daily food
requirements reported for each piscivorous bird species reported by the YKFP, mean smolt weights
from Chandler data for 2000, and the proportion of smolts in the diets of the piscivorous birds
described above (11% smolts for mergansers, 5% smolts for pelicans and herons and 20% for
cormorants).

Yakama Nation Appendix B
Wapato Reach Assessment Report B-10 March 2012 ICF 703.11
Table B-1. Estimated consumption of smolts by the four major piscivorous birds in the Wapato Reach over the years 2003–2007 and 2009. Data from YKFP 2004-2008 and YKFP 2010.

Yakama Nation Appendix B
Wapato Reach Assessment Report B-11 March 2012 ICF 703.11
Piscivorous Fish As mentioned, the Yakima River supports a number of piscivorous fish species, including channel
catfish (Ictalurus punctatus), smallmouth bass (Micropterus dolomieu) and walleye (Stizostedian
vitreum), but the only species abundant in the Wapato reach is the northern pikeminnow
(Pteichocheilus oregonensus) (Patten 1970, Dunnigan and Lamebull 2000, Pearsons et al. 2000). The
pikeminnow population in the Yakima River, unlike the smallmouth bass population, seems to be
non-migratory. That is to say, they do not move from the Columbia into the Yakima River in June on
a spawning run, and leave some months later after spawning is completed. During the 1999 field
season, Dunnigan and Lamebull (2000) recaptured 152 pikeminnows tagged over the previous two
years. Only four of these fish were recaptured outside the reach in which they had originally been tagged
and released, and these fish were recaptured within 2 km of the section in which they were tagged. The
resident nature of the pikeminnow population is noteworthy in terms of its implications for a potential
predator control program.
Dunnigan and Lamebull found that 20 of 492 northern pikeminnow >200 mm (4.1%) contained
remains of salmonids. Salmonid consumption by northern pikeminnow was generally higher during
the May and June sampling periods than the April period at all sites. The Yakama Nation estimated
that smolt consumption rates among pikeminnow >200 mm were 12.2% and 14.3% in 2006 and
2007 (YKFP 2007, 2008). No smolt consumption rate was reported for 2008, so the mean of 2006
and 2007, 13.2%, was assumed in this analysis. Dunnigan and Lamebull examined 28 northern
pikeminnow between 150-200 mm FL, and found that none of the smaller fish had consumed
salmonids. Based on the predicted fork length of salmonids from regression relationships of
diagnostic bones, Dunnigan and Lamebull classified all salmonids observed in northern pikeminnow
as yearling smolts (spring Chinook, or coho smolts). This finding is somewhat anomalous, because
pikeminnow are generally considered to be inversely size selective, and are known to prey heavily
on smaller subyearling Chinook salmon in the lower Columbia River (Poe et al. 1991). Dunnigan and
Lamebull also found that fish in general were only a modest portion of the pikeminnow diet,
comprising 25% by count, while crayfish and other invertebrates represented a combined
proportion of 31% of the total prey items. Of the 11 species of fish found in pikeminnow stomachs,
Dunnigan and Lamebull found the four most abundant were dace Rhinichthys spp., sucker
Catostomus spp., salmon Oncorhynchus spp., and redside shiner Richardsonius balteatus.
Dunnigan and Lamebull noted that the total number of pikeminnow as well as the proportion of
larger, more piscivorous pikeminnow, were greater in the Toppenish than the Granger reach. They
attributed this greater abundance of larger pikeminnow in the Toppenish site to differences in
physical habitat between sites, and specifically to the greater frequency of “back-eddy/shear type
habitat” in the Toppenish site, compared to the more homogeneous habitat which characterizes the
Granger reach. Dunnigan and Lamebull noted that pikeminnow have been shown to prefer low-
velocity habitat in close proximity to higher velocity habitat, and that Mesa and Olson (1993) found
that northern pikeminnow (300 – 490 mm FL) were unable to maintain prolonged swimming
speeds at water velocities between 102-115 cm/s for periods longer than 15 to 30 minutes. Finally,
Dunnigan and Lamebull reported that the number of pikeminnow per km immediately below
Sunnyside Dam was 2 to 4 times higher than the densities observed in either open-river site. They

Yakama Nation Appendix B
Wapato Reach Assessment Report B-12 March 2012 ICF 703.11
suggested that the reason for the higher concentration below Sunnyside Dam was a feeding
aggregation targeting disoriented smolts similar to that found below mainstem Columbia and Snake
River hydro-projects (Poe et al. 1991).
This analysis used the same four step process employed by Dunnigan and Lamebull to estimate
pikeminnow consumption of smolts in the Wapato Reach for the years 1999 and 2006 through
2008. Our procedure accepted the Yakama Nation’s estimate of the total number of smolts
consumed over the years 2006 through 2008 between the Naches River and Prosser Dam, as well as
known water temperatures during the outmigrations in the Wapato reach, the approximate mean
weight of Yakima pikeminnow, the average monthly weight of Yakima smolts at Prosser (from the
2000 outmigration) and the reported proportion of pikeminnow by year that preyed on smolts. We
made our calculations of smolt consumption for the 91-day period from April 1 through June 30. In a
series of equations, we adjusted one parameter, the mean number of smolts per pikeminnow by
month, until our estimate of consumed smolts best matched the estimates of Dunnigan and
Lamebull (60, 583 for the period April 12 through June 7 for the reach between Roza Dam and
Prosser Dam), and the Yakama Nation (a total of 750,000 summed over 2006, 2007 and 2009 for the
period of April through June for the reach between Roza Dam and Prosser Dam). All other
parameters in the calculations were held constant (mean weight of pikeminnow, mean monthly
weight of a smolt at Chandler) or were set to values reported for the year in question (monthly
pikeminnow density in the Granger and Toppenish reaches for 1999, yearly April-June pikeminnow
abundance for reach between Roza and Prosser Dams, mean monthly water temperature3).
The precise computational sequence we used was as follows. Following Dunnigan and Lamebull
(2000) we estimated the time (hrs) to 90% digestion by month (DTmonth) for pikeminnow as a
function of the mean weight of smolt and pikeminnow (Wsmolt, Wpikeminnow, in g) and the mean
monthly temperature (T, in oC):
eq. 6
The mean monthly smolt weight was estimated from empirical data from the Chandler smolt trap
for the year 2000. Pikeminnow weight was assumed constant over months and years, and was
estimated from Dunnigan and Lamebull’s length frequency data and a length/weight relationship for
pikeminnow found in Poe et al. (1991).
We also followed Dunnigan and Lamebull in the way we estimated pikeminnow consumption rate
(Cmonth i ), expressed as smolts per pikeminnow per day. Daily smolt consumption rates were
estimated for each month of the outmigration separately because water temperature strongly
affects pikeminnow consumption rates. Month-specific pikeminnow consumption rates, Cmonth i,
were estimated as:
3 It should be noted that we were forced to characterize the April-May mean monthly water temperatures of the Wapato Reach by
mean monthly water temperatures at Prosser Dam, because temperature data was missing for both the Parker (Sunnyside Dam)
and Grandview Hydromet stations for the years investigated.

Yakama Nation Appendix B
Wapato Reach Assessment Report B-13 March 2012 ICF 703.11
eq. 7
Where
= the mean number of smolts per pikeminnow for those pikeminnow that
consume smolts. Note that a critical element of the estimation procedure is the assumption that only
a specified fraction of the pikeminnow population targets smolts. This assumption is corroborated
by many studies of pikeminnow predation in the Columbia River and Snake River (Parker et al.
1995; Ward et al. 1995).
Total pikeminnow abundance was estimated differently for 1999 and for 2006-2008. For 1999, we
estimated the number of pikeminnow in the Wapato reach separately for April, May and June (NNPM
1999, month i) as follows:
eq. 8
Where dGranger, month i is the monthly density of pikeminnow (number/km) reported by Dunnigan and
Lamebull for the Granger reach for April, May or June, and 39.8 is the number of Rkm in the Wapato
reach between Ahtanum Creek and the Granger Bridge; and dToppenish, month i is the monthly density of
pikeminnow (number/km) reported by Dunnigan and Lamebull for the Toppenish reach, and 40.1 is
the number of Rkm in the Wapato reach between Granger Bridge and the Mabton Bridge.
The mean number of pikeminnow in the reach between the mouth of the Naches River and Prosser
Dam over the entire April-June outmigration period was reported by the Yakama Nation for 2006 –
2008 (YKFP 2007, 2008, 2009). These year-specific figures were multiplied by 49.6/69.2, the ratio
of the length of the Wapato reach to the length of the reach between the Naches confluence and
Prosser Dam, to estimate pikeminnow abundance for 2006-2008 in the Wapato reach specifically.
Because month-specific densities or totals were not reported, abundance was assumed constant
over the three months of the outmigration.
The total number of smolts eaten over the outmigrations of 1999 and 2006-2008 (Neaten, year i) was
estimated as follows:
∑ eq. 9
where Fj is the proportion of pikeminnow targeting smolts in year j, considered constant over the
months of outmigration; NNPM, year j, month i is the number of pikeminnow in the Wapato reach in month
i of year j; Cyear j, month i is the consumption rate (smolts/pikeminnow/day) of pikeminnow in month i
of year j; and Dmonth i are the number of days in month i. Note that Fj was reported for all years except
2008, where it was estimated as the mean of the values reported for 2006 and 2007.
Smolt mortality rates were based on the total number of smolts estimated to pass Prosser Dam;
hatchery fish released at or below Prosser are irrelevant to a predation estimate for the Wapato
reach. Explicitly, the mortality rate to smolts moving through the Wapato reach attributable to
predation by pikeminnow was estimated as:
eq. 10

Yakama Nation Appendix B
Wapato Reach Assessment Report B-14 March 2012 ICF 703.11
where NProsser, year j is the estimate of all smolts, hatchery and wild, passing Prosser Dam in year j.
Table B-2, which summarizes the calculations just described, shows that pikeminnow-caused
mortality ranged from 10.4% to 33.7%, averaging 22.8%. The calculations in Table B-2 were based
on adjusting the number of smolts per smolt-eating pikeminnow until the number of smolts
consumed in 1999 and over the years 2006 through 2008 matched published estimates as closely as
possible. Adjusted for the smaller length of the Wapato reach relative to the reach between Roza and
Prosser Dams, as well as the longer period assumed in this report for the outmigration season
(Dunnigan and Lamebull assumed the 70-day period between April 12 and June 21 whereas this
report assumes the 91-day period between April 1 and June 30), Dunnigan and Lamebull estimated
50,588 smolts were consumed in 1999 in the Wapato reach April 1 through June 30, while this
report estimated 58,179 smolts consumed. The YKFP estimated (YKFP 2010) that 750,000 smolts
were consumed by pikeminnow over the years 2006 through 2008. By the procedures described
above, we estimated that 748,804 smolts were consumed from April through June over the years
2006 through 2008. Because of the close agreement between the estimates in this report and earlier
reports, as well as the consistency in the parameters used in each year of the analysis, it is likely that
the mean pikeminnow-caused mortality of 22.8% (77.2% survival) is probably as good an estimate
as can be made of the impact of piscivorous fish in the Wapato reach. It should be noted that this
estimate assumes pikeminnow are not selective among alternative prey species.

Yakama Nation Appendix B
Wapato Reach Assessment Report B-15 March 2012 ICF 703.11
Table B-2. Summary of input data and outputs of computations to estimate smolt consumption by northern pikeminnow in the Wapato Reach for the years 1999 and 2006–2008. Data from Dunnigan and Lamebull (2000) and YKFP (2007–2009)

Yakama Nation Appendix B
Wapato Reach Assessment Report B-1 March 2012 ICF 703.11
Combined Predation Mortality and Survival As a result of our re-analysis of Yakama Nation data, we estimate that the smolt mortality rate in the
Wapato Reach attributable to pikeminnow varied from 10.4% to 33.7%, with a mean of 22.8%. A
mean pikeminnow mortality rate of 22.8% corresponds to a survival rate of 77.2%. The mean
mortality estimate for piscivorous birds was 18.9%, corresponding to a survival rate of 81.1%. Thus,
our best estimate of the combined survival through the Wapato reach attributable to piscivorous
birds and fish is 0.772*0.811 or 62.2%.
Recommendations The main recommendation to managers hoping to reduce the level of predation on outmigrating
smolts in the Wapato reach is use refined versions of the relationships between flow and predation
by birds and pikeminnow to adjust the rules governing instream flows in the Wapato reach and
elsewhere. It is abundantly clear that avian predation on smolts is inversely related to flow, for a
number of obvious reasons (water clarity, concentration of prey in space, reduced depth, increased
frequency of perching rocks, etc.). The relationship between flow and pikeminnow predation has not
been so well studied in the Yakima as that between birds and smolt consumption, but Dunnigan and
Lamebull remark that it was their impression that during high flows Yakima pikeminnow adopt a
deeper distribution in the water column, making use of large substrate and lower velocities near the
streambed to reduce the energy necessary to maintain position. Such behavior is clearly inconsistent
with an active foraging strategy for surface-oriented smolts, particularly when adopted by a visual
predator during times of high turbidity.
The ongoing effort to recover PIT-tags from roosting areas of various species of piscivorous bird
might be re-structured such that various groups of tag numbers would identify fish released over a
range of flows intended to identify a series of thresholds for avian predation, such as the flow above
which birds vacate various areas, the flows under which predation rate increases most rapidly, and
so on. Such flow/consumption studies might be combined with a refined bioenergetic analysis of the
impact of bird predation on Yakima smolt production similar to the analysis that characterized avian
and pikeminnow predation in the lower Columbia (ICF Jones & Stokes 2009). Such an analysis could
be used to estimate the benefits of increasing flows in various reaches assuming specified predator
diets and threshold flows. An analysis similar to the ICF Jones & Stokes (2009) analysis would also
address the considerable additional number opf smolts that would have to be consumed by
piscivorous birds to provide for the growth of their young, an issue which has not been addressed in
this report or in any of the preceding reports on bird predation in the Yakima River. Finally, an
analysis similar to the ICF Jones & Stokes analysis would make use of observed or assumed

Yakama Nation Appendix B
Wapato Reach Assessment Report B-2 March 2012 ICF 703.11
electivities4 among the various predator populations, enabling the estimation of changes in overall
predation as a function of a seasonally shifting mix of prey.
It is unclear at this time whether pikeminnow predation could be so effectively controlled by
increased flow as avian predation. It is clear that reducing water temperature would reduce
consumption rate of a cold-blooded predator like the northern pikeminnow, but it is also unlikely
that reducing temperatures to the degree required would be feasible in the Wapato reach. It is,
however, true that the entire population of pikeminnow in the Yakima River is relatively small, with
existing estimates ranging from ~7,000 to ~11,000 for the Wapato reach, which Dunnigan and
Lamebull (2000) considered some of the best pikeminnow habitat in the Yakima Basin. Because the
Yakima population of pikeminnow is non-migratory, and is patchily distributed, with aggregations
of larger individuals foraging below the bypass outfalls of Wapato, Sunnyside and Prosser Dams, a
predator control program based on angling or electrofishing would seem feasible. Again, a
bioenergetic modeling analysis similar to that addressing pikeminnow predation in the lower
Columbia (ICF Jones & Stokes 2009) could be used to estimate the exploitation rates that would be
necessary to reduce pikeminnow impacts to some desired level.
Bibliography Alexander, G.R. 1979. Predators of fish in coldwater streams. Pages 153-170 in H. Clepper, ed.
Predator-prey systems in fisheries management. Sport Fishing Institute, Washington, D.C.
Collazo, J.A. 1985. Food habits of nesting great blue herons at Heyburn State Park, Idaho. Northwest
Science 59: 144-146.
Dunnigan, J. and L. Lamebull. 2000. In Pearsons, Todd, Anthony Fritts, Kenneth Ham, Geoffrey
McMichael, Eric Bartrand, Gabriel Temple and Charles W. Hopley - Washington Department of
Fish and Wildlife, Report to Bonneville Power Administration, Contract No. 1995BI64878,
Project No. 199506402, 99 electronic pages (BPA Report DOE/BP-64878-7)
Ecological Interactions Team, WDFW. 1998. Development of a Bird Predation Index, Annual Report
1998, Report to Bonneville Power Administration, Contract No. 1998AT02689, Project No.
199506408, 133 electronic pages (BPA Report DOE/BP-64878-3).
Elson, P.F. 1962. Predator-prey relationships between fish-eating birds and Atlantic salmon (with a
supplement on fundamentals of merganser control). Fisheries Research Board of Canada
Bulletin 133. 87pp.
Feltham, M.J. 1995. Consumption of Atlantic salmon smolts and parr by goosanders: estimates from
doubly-labeled water measurements of captive birds released on two Scottish rivers. Journal of
Fisheries Biology 46: 273-281.
4 An electivity is the ratio of the percent composition of a species in the diet of a predator to the percent composition of the prey species in the environment. In the ICF Jones & Stokes study, electivities for a given prey for a given predator were assumed to be constant over the period of an outmigration.

Yakama Nation Appendix B
Wapato Reach Assessment Report B-3 March 2012 ICF 703.11
Grassley, James, Christian Grue, Walter Major, III, Kristen Ryding. 2000. Development of an Index to
Bird Predation of Juvenile Salmonids within the Yakima River, Project No. 1995-06424, 39
electronic pages, (BPA Report DOE/BP-00004666-5).
ICF Jones & Stokes 2010. Evaluation of Effects of Extended Transport on Survival of Salmonid
Smolts: Impacts of Fish Predation in the Lower Columbia River. Prepared for: U.S. Army Corps of
Engineers Walla Walla District, 201 North Third Avenue Walla Walla, Washington 99362.
Contact: Anne Setter Prepared by: ICF Jones & Stokes9920 SW Bank Road, Vashon, WA 98070.
Contact: Greg Blair 206/463-5003.
Idaho Department of Fish and Game. 2009. Management of American White Pelicans in Idaho. A five-
year plan (2009–2013) to balance American white pelican and native cutthroat trout
conservation needs and manage impacts to recreational fisheries in southeast Idaho. Boise,
Idaho.
Kennedy, G.J. A. and J.E. Greer. 1988. Predation by cormorants, Phalacrocorax carbo, on the salmonid
population of an Irish river. Aquatic Fisheries Management 19:159-170
Mace, P.M. 1983. Bird predation on juvenile salmonids in the Big Qualicum estuary, Vancouver
Island. Canadian Technical Report Fisheries Aquatic Sciences No. 1176.
Major, III, Walter, Christian Grue, Kristen Ryding, James Grassle. 2001. Development of an Index to
Bird Predation of Juvenile Salmonids within the Yakima River, Project No. 1995-06424, 42
electronic pages, (BPA Report DOE/BP-00004666-6).
Modde, T. and A.F. Wasowicz. 1996. Cormorant and grebe predation on rainbow trout stocked in a
southern Utah reservoir. North American Journal of Fisheries Management 16:388-394.
Parker, R.M., M.P. Zimmerman and D.L. Ward, 1995. Variability in biological characteristics of
Northern Squawfish in the lower Columbia and Snake Rivers. Transactions of the American
Fisheries Society 124: 335-346.
Parkhurst, J. A., R.P. Brooks and D.E.Arnold. 1992. Assessment of predation at trout hatcheries in
central Pennsylvania. Wildlife Society Bulletin 20:411-419.
Patten, B. G., R. B. Thompson, and W. D. Gronlund. 1970. Distribution and abundance of fish in the
Yakima River, Wash., April 1957 to May 1958. United States Fish and Wildlife Service Special
scientific report No. 603. Washington D.C.
Phinney, D.D., S.B. Mathews and T.N. Pearsons 1998. Development of a Bird Predation Index, Annual
Report 1998. Report to Bonneville Power Administration, Contract No. 1998AT02689, Project
No. 199506408, (BPA Report DOE/BP-64878-3) 133 pp
Poe, Thomas P., Hal Hansel, Steven Vigg, Douglas Palmer and Linda Prendergast. 1991. Feeding of
Predaceous Fishes on Out-Migrating Juvenile Salmonids in John Day Reservoir, Columbia River.
Transactions of the American fisheries Society 120:405-420.

Yakama Nation Appendix B
Wapato Reach Assessment Report B-4 March 2012 ICF 703.11
Sebring, S. H., R. D. Ledgerwood, B. P. Sandford, A. Evans, and G. M. Matthews. 2009. Detection of
Passive Integrated Transponder (PIT) tags on piscivorous avian colonies in the Columbia River
Basin, 2007. U.S. Army Corps of Engineers, Walla Walla, Washington.
Stephenson, Ann, Walter Major, James Grassley and Kristen Ryding. 2002. Development of an Index
to Bird Predation of Juvenile Salmonids within the Yakima River. Annual Report 2002. Yakima
Klickitat Fisheries Project, Yakama Nation, 771 Pence Road, Yakima, WA 98902, Washington
Cooperative Fish and Wildlife Research Unit University of Washington, School of Aquatic and
Fishery Sciences, Box 355020, Seattle, WA 98195. Prepared for: U.S. Department of Energy
Bonneville Power Administration Environment, Fish & Wildlife, P.O. Box 3621 Portland, OR
97208 March 2003.
Stephenson, A. and D. Fast. 2003. Monitoring and evaluation of avian predation on juvenile
salmonids on the Yakima River, Washington. Annual Report 2003. Prepared by: Ann E.
Stephenson, Biologist, and David L. Fast, Research Manager, Yakima Klickitat Fisheries Project,
Yakama Nation Fisheries, 771 Pence Road, Yakima, WA 98908, and Yakama Nation Fisheries,
Confederated Tribes and Bands of the Yakama Nation, 151 Fort Road, Toppenish, WA 98948.
Prepared for: U.S. Department of Energy, Bonneville Power Administration, Environment, Fish &
Wildlife, P.O. Box 3621, Portland, OR 97208, June 2004.
Stephenson, A. and D. Fast. 2004. Monitoring and evaluation of avian predation on juvenile
salmonids on the Yakima River, Washington. Annual Report 2004. Prepared by: Ann E.
Stephenson, Biologist, and David L. Fast, Research Manager, Yakima Klickitat Fisheries Project,
Yakama Nation Fisheries, 771 Pence Road, Yakima, WA 98908, and Yakama Nation Fisheries,
Confederated Tribes and Bands of the Yakama Nation, 151 Fort Road, Toppenish, WA 98948.
Prepared for: U.S. Department of Energy, Bonneville Power Administration, Environment, Fish &
Wildlife, P.O. Box 3621, Portland, OR 97208, March 2005.
Timkin, R.L. and B.W. Anderson. 1969. Food habits of common mergansers in the northcentral
United States. Journal of Wildlife Management 33:87-91.
Ward, D. L., J. H. Petersen, and J. L. Loch. 1995. Index of predation on juvenile salmonids by northern
squawfish in the lower and middle Columbia River and in the lower Snake River. Transactions of
the American Fisheries Society 124: 321-334.
Wood, C.C. 1985. Food searching behavior of the common merganser (Mergus merganser) II: Choice
of foraging location. Canadian Journal of Zoology 63:1271-1279.
Wood, C.C. 1987. Predation of juvenile Pacific salmon by the common merganser (Mergus
merganser) on eastern Vancouver Island. I:Predation during the seaward migration. Canadian
Journal of Fisheries and Aquatic Science 44:941-949.
YKFP. 2005. Monitoring and Evaluation of Avian Predation on Juvenile Salmonids on the Yakima
River, Washington Annual Report 2005. Appendix I in Yakima/Klickitat Monitoring and
Evaluation Project (199506325) 2005-2006 Annual Report to Bonneville Power Administration.
YKFP. 2007. Yakima/Klickitat Fisheries Project Monitoring and Evaluation, Project Number 1995-
063-25, Contract Number 00027798, the Confederated Tribes and Bands of the Yakama Nation,

Yakama Nation Appendix B
Wapato Reach Assessment Report B-5 March 2012 ICF 703.11
Final Report for the performance period May 1, 2010 through April 30, 2011. Submitted: August
3, 2010. Prepared for Patricia Smith, COTR, Division of Fish and Wildlife, P.O. Box 3621,
Portland, Oregon 97208-3621. Prepared By: Yakama Nation, Yakima/Klickitat Fisheries Project,
Melvin R. Sampson, Policy Advisor/Project Coordinator, Dr. David Fast, Research Manager, Bill
Bosch, Editor, P.O. Box 151, Toppenish, WA 98948
YKFP. 2008. Yakima/Klickitat Fisheries Project Monitoring and Evaluation, Project Number 1995-
063-25, Contract Number 00035037, the Confederated Tribes and Bands of the Yakama Nation,
Final Report for the performance period May 1, 2007 through April 30, 2008. Submitted July 31,
2008. Prepared for: Patricia Smith, COTR, Division of Fish and Wildlife, P.O. Box 3621, Portland,
Oregon 97208-3621. Prepared By: Yakama Nation, Yakima/Klickitat Fisheries Project, Melvin R.
Sampson, Policy Advisor/Project Coordinator, Dr. David Fast, Research Manager, Bill Bosch,
Editor, P.O. Box 151, Toppenish, WA 98948.
YKFP. 2009. Yakima/Klickitat Fisheries Project Monitoring and Evaluation, Project Number 1995-
063-25, Contract Number 00037822, the Confederated Tribes and Bands of the Yakama Nation,
Final Report for the performance period May 1, 2008 through April 30, 2009. Submitted: July 31,
2009. Prepared for: Patricia Smith, COTR, Division of Fish and Wildlife, P.O. Box 3621, Portland,
Oregon 97208-3621. Prepared By: Yakama Nation, Yakima/Klickitat Fisheries Project, Melvin R.
Sampson, Policy Advisor/Project Coordinator, Dr. David Fast, Research Manager, Bill Bosch,
Editor, P.O. Box 151, Toppenish, WA 98948
YKFP. 2010. Yakima/Klickitat Fisheries Project Monitoring and Evaluation, Project Number 1995-
063-25, Contract Number 00042445, the Confederated Tribes and Bands of the Yakama Nation,
Final Report for the performance period May 1, 2009 through April 30, 2010. Submitted: August
3, 2010. Prepared for: Patricia Smith, COTR, Division of Fish and Wildlife, P.O. Box 3621,
Portland, Oregon 97208-3621. Prepared By: Yakama Nation, Yakima/Klickitat Fisheries Project,
Melvin R. Sampson, Policy Advisor/Project Coordinator, Dr. David Fast, Research Manager, Bill
Bosch, Editor, P.O. Box 151, Toppenish, WA 98948
YKFP. 2011. Yakima/Klickitat Fisheries Project Monitoring and Evaluation, Project Number 1995-
063-25, Contract Number 00042445, the Confederated Tribes and Bands of the Yakama Nation,
Final Report for the performance period May 1, 2010 through April 30, 2011. Submitted: August
12, 2011. PREPARED FOR: Patricia Smith, COTR, Division of Fish and Wildlife, P.O. Box 3621,
Portland, Oregon 97208-3621. Prepared By: Yakama Nation, Yakima/Klickitat Fisheries Project,
Melvin R. Sampson, Policy Advisor/Project Coordinator, Dr. David Fast, Research Manager, Bill
Bosch, Editor, P.O. Box 151, Toppenish, WA 98948.

Appendix C. Geomorphic Attribute Tables


Wapato Reach Assessment Report C-1 March 2012 ICF 703.11
Table C-1. Geomorphic Attributes of Analysis Segments
Table Key
Near = Near a segment with channel connection
Aggradation/ Degradation Potential Class
1 < −1.0 (Extreme Degradation Potential)
2 −1.0 to −0.20 (High Degradation Potential)
3 −0.20 to −0.05 (Moderate Degradation Potential)
4 ±0.05 (Minor Change)
5 0.05 to 0.20 (Moderate Aggradation Potential)
6 0.20 to 1.0 (High Aggradation Potential)
7 > 1.0 (Extreme Aggradation Potential)
Planform Stability Index
1 <15 (Minor change/Negligible)
2 15-30 (Small Change)
3 30-80 (Moderate Change, Wandering Tendency)
4 >80 (Severe Change, Braiding Tendency)
Planform
S Effectively Static
W Wandering
B Braiding
M/B Meandering/Braiding
W/C Wandering/Confined
W/S Wandering/Effectively Static
M(O) Meandering w/ Oxbow
Subreach Upstream River Mile
Downstream River Mile
Upstream End of Side Channel Engaged at
2-Year Flow
Upstream End of Floodplain Channel
Engaged at 10-Year Flow
Aggradation/ Degradation
Potential Class
Planform Stability
Index Planform
Adjacent to Revetment
or Levee
5 109.22 109.08
3 1 S
5 109.08 108.97
4 1 S
5 108.97 108.88
1 1 S
5 108.88 108.75
1 2 W/C Yes
5 108.75 108.57
6 1 W/C Yes
5 108.57 108.49
4 1 W/C Yes
5 108.49 108.41
4 1 W/C Yes
5 108.41 108.36
4 2 W/C Yes
5 108.36 108.31
1 2 W/C Yes
5 108.31 108.23
1 1 S Yes
5 108.23 108.14
1 1 S Yes
5 108.14 108.04
1 1 S Yes
5 108.04 107.93
7 1 S Yes
5 107.93 107.79 2 1 S Yes
5 107.79 107.71 6 1 S

Yakama Nation Appendix C
Wapato Reach Assessment Report C-2 March 2012 ICF 703.11
Subreach Upstream River Mile
Downstream River Mile
Upstream End of Side Channel Engaged at
2-Year Flow
Upstream End of Floodplain Channel
Engaged at 10-Year Flow
Aggradation/ Degradation
Potential Class
Planform Stability
Index Planform
Adjacent to Revetment
or Levee
5 107.71 107.64 6 1 S
5 107.64 107.54 6 1 S
5 107.54 107.43 3 1 S
5 107.43 107.33 5 1 S
5 107.33 107.23 6 1 S
5 107.23 107.16 5 1 S
5 107.16 107.04 4 1 S
5 107.04 106.99 4 1 S
5 106.99 106.89 4 1 S Yes
5 106.89 106.81 2 2 S Yes
5 106.81 106.76 6 2 S Yes
5 106.76 106.68 - 2 S Yes
5 106.68 106.54 - 1 S Yes
5 106.54 106.43 2 1 S Yes
5 106.43 106.28 6 1 S Yes
5 106.28 106.12 1 1 S Yes
5 106.12 105.99 Near Near 7 1 S Yes
5 105.99 105.83 Yes Yes 6 1 S
5 105.83 105.64 Near Yes 2 1 S
5 105.83 105.64 Near Yes 2 1 S
5 105.64 105.48 Yes 6 1 W/C
5 105.64 105.48 Yes 6 1 W/C
5 105.48 105.2 Yes Near 4 1 W
5 105.2 104.92 Yes 4 2 W
5 105.2 104.92 Yes 4 2 W
5 104.92 104.72 Yes Near 1 1 W
5 104.72 104.57 Near 7 2 W
5 104.57 104.45 Yes 4 3 B

Yakama Nation Appendix C
Wapato Reach Assessment Report C-3 March 2012 ICF 703.11
Subreach Upstream River Mile
Downstream River Mile
Upstream End of Side Channel Engaged at
2-Year Flow
Upstream End of Floodplain Channel
Engaged at 10-Year Flow
Aggradation/ Degradation
Potential Class
Planform Stability
Index Planform
Adjacent to Revetment
or Levee
5 104.57 104.45 Yes 4 3 B
5 104.45 104.06 Near Near 1 4 B
5 104.06 103.92 Yes 7 1 B
5 103.92 103.75 Near 3 1 B
5 103.75 103.54 Near 5 1 B
5 103.54 103.41 Yes 4 2 B
5 103.54 103.41 Yes 4 2 B
5 103.41 103.19 Near 2 1 B
5 103.19 102.98
6 1 B
5 102.98 102.87
2 1 W
5 102.87 102.61 Near 7 1 W Yes
5 102.61 102.33 Yes 2 1 W Yes
5 102.61 102.33 Yes 2 1 W Yes
5 102.33 102.19 Yes 6 1 W
5 102.19 102.09 Near 5 1 W
5 102.09 101.9 Near 4 2 B
5 101.9 101.76 Yes 2 3 B
5 101.76 101.63 Near 6 3 B
5 101.63 101.36 6 3 B
5 101.36 101.09 4 3 B
5 101.09 100.91 Near Near 4 2 B
5 100.91 100.7 Yes Yes 2 1 W
5 100.7 100.42 Yes Near 6 2 B Yes
5 100.42 100.15 Near Yes 6 2 B Yes
5 100.15 99.99
Near 3 1 B
5 99.99 99.92
Near 5 1 W
5 99.92 99.59 Near Yes 4 1 B
5 99.59 99.22 Yes Near 1 1 B

Yakama Nation Appendix C
Wapato Reach Assessment Report C-4 March 2012 ICF 703.11
Subreach Upstream River Mile
Downstream River Mile
Upstream End of Side Channel Engaged at
2-Year Flow
Upstream End of Floodplain Channel
Engaged at 10-Year Flow
Aggradation/ Degradation
Potential Class
Planform Stability
Index Planform
Adjacent to Revetment
or Levee
5 99.59 99.22 Yes Near 1 1 B
5 99.22 99.03 Near
1 1 B
5 99.03 98.9
4 4 B Yes
5 98.9 98.8
4 1 B Yes
5 98.8 98.67
4 1 B
5 98.67 98.56
4 2 B Yes
5 98.56 98.38 Near Near 4 2 B Yes
5 98.38 98.27 Yes Yes 2 3 B
5 98.38 98.27 Yes Yes 2 3 B Yes
5 98.27 98.1 Near Near 1 3 B
5 98.1 97.95
1 1 S
4 97.95 97.83
2 1 S Yes
4 97.83 97.56
1 1 M/B Yes
4 97.56 97.46
7 1 M/B
4 97.46 97.29
7 2 M/B
4 97.29 97.05
3 1 M/B Yes
4 97.05 96.91
4 1 M/B Yes
4 96.91 96.66
Near 2 1 M/B Yes
4 96.66 96.48
Yes 1 1 S Yes
4 96.48 96.39
Near 1 1 S
4 96.39 96.28
7 2 W/C
4 96.28 96.13
2 2 W/C
4 96.13 96
2 2 W/C
4 96 95.88
7 2 W/C
4 95.88 95.72
6 3 W
4 95.88 95.72
6 3 W
4 95.72 95.4
1 3 W
4 95.4 95.2
6 2 W/C

Yakama Nation Appendix C
Wapato Reach Assessment Report C-5 March 2012 ICF 703.11
Subreach Upstream River Mile
Downstream River Mile
Upstream End of Side Channel Engaged at
2-Year Flow
Upstream End of Floodplain Channel
Engaged at 10-Year Flow
Aggradation/ Degradation
Potential Class
Planform Stability
Index Planform
Adjacent to Revetment
or Levee
4 95.2 95.01
Near 6 1 W/C
4 95.01 94.89
Yes 1 1 W/C
4 94.89 94.79
Near 7 2 W/C
4 94.79 94.72
7 1 W/C
4 94.72 94.59
7 2 W/C
4 94.59 94.45
Near 1 2 W/C
4 94.45 94.25
Yes 1 2 W/C
4 93.35 93.22 Near Near 4 1 W/C
4 93.22 93.15 Yes Yes 1 2 W/C
4 93.22 93.15 Yes Yes 1 2 W/C
4 93.15 93.06 Near Near 7 1 W/C
4 93.06 92.93
1 2 W/C
4 92.93 92.83
7 1 W/C
4 92.83 92.76 Near
4 2 W/C
4 92.83 92.76 Near
4 2 W/C
4 92.76 92.64 Yes
4 1 W/C
4 92.76 92.64 Yes
4 1 W/C
4 92.64 92.55 Yes
2 1 W/C
4 92.64 92.55 Yes
2 1 W/C
4 92.55 92.51 Near
6 1 W/C
4 92.51 92.36
Near 2 1 W/C
4 92.36 92.18
Yes 6 1 W/C
4 92.18 92.09
Near 4 2 W/C
4 92.09 91.94
Yes 4 2 W/C
4 92.09 91.94
Yes 4 2 W/C
4 91.94 91.8
Near 3 1 W/C
4 91.8 91.69
Yes 1 1 W/C
4 91.69 91.41
Near 1 1 W/C

Yakama Nation Appendix C
Wapato Reach Assessment Report C-6 March 2012 ICF 703.11
Subreach Upstream River Mile
Downstream River Mile
Upstream End of Side Channel Engaged at
2-Year Flow
Upstream End of Floodplain Channel
Engaged at 10-Year Flow
Aggradation/ Degradation
Potential Class
Planform Stability
Index Planform
Adjacent to Revetment
or Levee
4 91.41 91.39
Yes 7 1 W/C
3 91.39 91.37
Near 4 1 W/C Yes
3 91.37 91.34
4 1 W/C Yes
3 91.34 91.22
4 1 W/C Yes
3 91.22 91.05 Near
4 1 W/C Yes
3 91.05 90.88 Yes
1 1 W/C Yes
3 90.88 90.75 Yes
6 1 W/C
3 90.75 90.66 Near
6 2 W/C
3 90.66 90.6
7 2 W/C
3 90.6 90.51
4 2 W/C
3 90.51 90.4
4 2 W/C
3 90.4 90.3
4 1 S
3 90.3 90.25
4 1 S
3 90.25 90.06
4 1 S
3 90.06 89.95
4 1 S
3 89.95 89.88
4 1 S
3 89.88 89.75
3 1 S
3 89.75 89.58
5 1 S Yes
3 89.58 89.49
4 1 S Yes
3 89.49 89.4
4 1 W/S Yes
3 89.4 89.31 Near Near 4 1 W/S Yes
3 89.31 89.26 Yes Yes 4 2 W/S Yes
3 89.26 89.14 Near Near 4 2 W/S Yes
3 89.14 89.06
3 1 S
3 89.06 88.95
5 1 S
3 88.95 88.85
4 1 S
3 88.85 88.72
2 1 S
3 88.72 88.62
2 1 S

Yakama Nation Appendix C
Wapato Reach Assessment Report C-7 March 2012 ICF 703.11
Subreach Upstream River Mile
Downstream River Mile
Upstream End of Side Channel Engaged at
2-Year Flow
Upstream End of Floodplain Channel
Engaged at 10-Year Flow
Aggradation/ Degradation
Potential Class
Planform Stability
Index Planform
Adjacent to Revetment
or Levee
3 88.62 88.52
6 1 S
3 88.52 88.42
Near 4 1 S
3 88.42 88.26
Yes 4 2 W/M
3 88.42 88.26
Yes 4 2 W/M
3 88.26 88.11
Near 4 1 W/M
3 88.11 88
4 1 S
3 88 87.92
4 1 S
3 87.92 87.78
2 1 S
3 87.78 87.67 Near
2 1 S
3 87.67 87.51 Yes
6 1 S
3 87.51 87.44 Near
4 3 W
3 87.44 87.39
4 2 W
3 87.39 87.19
4 2 W
3 87.19 87.09
4 3 W
3 87.09 87.04
Near 4 3 W
3 87.04 86.92
Yes 4 3 W
3 86.92 86.81
Near 3 2 W/C
3 86.81 86.74
5 1 S
3 86.74 86.6 Near
2 1 S
3 86.6 86.53 Yes
6 1 S
3 86.53 86.46 Near
4 1 S
3 86.46 86.39
Near 4 1 S
3 86.39 86.31
Yes 4 1 S
3 86.31 86.14
Near 4 1 S
3 86.14 86.05
Yes 4 1 S
3 86.05 85.93
Near 4 1 S
3 85.93 85.83 Near
4 1 S
3 85.83 85.72 Yes
4 1 S

Yakama Nation Appendix C
Wapato Reach Assessment Report C-8 March 2012 ICF 703.11
Subreach Upstream River Mile
Downstream River Mile
Upstream End of Side Channel Engaged at
2-Year Flow
Upstream End of Floodplain Channel
Engaged at 10-Year Flow
Aggradation/ Degradation
Potential Class
Planform Stability
Index Planform
Adjacent to Revetment
or Levee
3 85.72 85.57 Near
4 1 S
3 85.57 85.49
4 1 M
3 85.49 85.36
4 1 M
3 85.36 85.21
4 3 M
3 85.21 85.12
4 1 M
3 85.12 85.02
4 2 W
3 85.02 84.95
4 3 W
3 84.95 84.85
4 2 W
3 84.85 84.77
4 3 W
3 84.77 84.72
4 3 W
3 84.72 84.69
4 3 W
3 84.69 84.68
4 3 W
3 84.68 84.67
4 3 W
3 84.67 84.56
4 2 W
3 84.56 84.49
4 1 S
3 84.49 84.38
4 1 S
3 84.38 84.3
4 1 S
3 84.3 84.23
4 1 S
3 84.23 84.15
4 1 S
3 84.15 84.08
4 1 S
3 84.08 84
4 1 S
3 84 83.84
4 1 S
3 83.84 83.78
4 1 S
3 83.78 83.7
Near 3 1 S
3 83.7 83.66
Yes 5 1 S
3 83.66 83.55
Near 4 1 S
3 83.55 83.5
3 1 S
3 83.5 83.45
5 1 S

Yakama Nation Appendix C
Wapato Reach Assessment Report C-9 March 2012 ICF 703.11
Subreach Upstream River Mile
Downstream River Mile
Upstream End of Side Channel Engaged at
2-Year Flow
Upstream End of Floodplain Channel
Engaged at 10-Year Flow
Aggradation/ Degradation
Potential Class
Planform Stability
Index Planform
Adjacent to Revetment
or Levee
3 83.45 83.41
4 1 S
3 83.41 83.36
3 1 S
3 83.36 83.33
5 1 S
3 83.33 83.2 Near Near 4 1 S
3 83.2 83.1 Yes Yes 4 1 S
3 83.1 83 Near Near 4 1 S
3 83 82.88
4 1 S
3 82.88 82.78
4 1 S
3 82.78 82.69
Near 4 1 S
3 82.69 82.61
Yes 4 1 S
3 82.69 82.61
Yes 4 1 S
3 82.61 82.5
Near 4 1 S
3 82.5 82.46
4 1 S
3 82.46 82.36 Near
4 1 S
3 82.36 82.22 Yes
4 1 S
3 82.22 82.14 Near
4 1 S
3 82.14 82.07
4 1 S
3 82.07 82
4 1 S
3 82 81.91
4 1 S
3 81.91 81.81
3 1 S
3 81.81 81.69
5 1 S
3 81.69 81.55
4 1 S
3 81.55 81.42
4 1 S
3 81.42 81.29
4 1 S
3 81.29 81.19
4 1 W/C
3 81.19 81.1
4 1 W/C
3 81.1 81
4 1 W
3 81 80.9
4 3 W

Yakama Nation Appendix C
Wapato Reach Assessment Report C-10 March 2012 ICF 703.11
Subreach Upstream River Mile
Downstream River Mile
Upstream End of Side Channel Engaged at
2-Year Flow
Upstream End of Floodplain Channel
Engaged at 10-Year Flow
Aggradation/ Degradation
Potential Class
Planform Stability
Index Planform
Adjacent to Revetment
or Levee
3 80.9 80.8
4 2 W
3 80.8 80.71
4 3 W
3 80.71 80.64
4 4 W Yes
3 80.64 80.53
4 4 W
3 80.64 80.53
4 4 W Yes
3 80.53 80.33
4 4 W Yes
3 80.33 80.17
4 3 W
3 80.17 80
4 1 W
3 80 79.89
4 1 S
3 79.89 79.76
4 1 S
2 79.76 79.46
1 1 S
2 79.46 79.38
Near 7 1 S
2 79.38 79.25
Yes 2 1 S
2 79.25 79.02
Near 6 1 S
2 79.02 78.84
3 1 S
2 78.84 78.67
6 1 S
2 78.67 78.46
2 1 S
2 78.46 78.37
6 1 S
2 78.37 78.24
4 1 S
2 78.37 78.24
4 1 S
2 78.24 78.03
4 1 S
2 78.03 77.82
2 1 M
2 77.82 77.63
6 1 M
2 77.63 77.48
2 1 M
2 77.48 77.34
Near 6 2 M
2 77.34 77.11
Yes 4 1 M
2 77.11 77.02
Near 4 1 M
2 77.02 76.9
4 2 M Yes

Yakama Nation Appendix C
Wapato Reach Assessment Report C-11 March 2012 ICF 703.11
Subreach Upstream River Mile
Downstream River Mile
Upstream End of Side Channel Engaged at
2-Year Flow
Upstream End of Floodplain Channel
Engaged at 10-Year Flow
Aggradation/ Degradation
Potential Class
Planform Stability
Index Planform
Adjacent to Revetment
or Levee
2 76.9 75.9
6 2 M
2 75.9 75.49
4 2 M
2 75.49 75.19
4 1 M
2 75.19 74.96
Near 4 2 M
2 74.96 74.6
Yes 4 1 S
2 74.6 74.34
Near 2 1 S
2 74.34 73.49
5 1 S
2 73.49 72.93
4 1 S
2 72.93 72.58
4 1 S
2 72.58 72.29
4 1 S
2 72.29 72.08
Near 4 1 S
2 72.08 71.8
Yes 2 1 S
2 71.8 71.45
Near 6 1 S
2 71.45 70.83
Yes 4 1 S
2 70.83 70.32
Yes 4 3 M(O)
2 70.32 70.03
Near 4 4 S
2 70.03 69.65
4 4 M
2 69.65 69.46
4 1 M
2 69.46 68.76
Near 4 1 M
1 68.76 68.02
Yes 4 1 S
1 68.02 67.75
Near 4 1 S
1 67.75 67.02
Yes 4 1 S
1 67.02 65.81
Near 4 1 S
1 65.81 65.3
4 1 S
1 65.3 64.7
4 1 S
1 64.7 64.25
4 1 S
1 64.25 63.93
4 1 S
1 63.93 63.74
3 1 S

Yakama Nation Appendix C
Wapato Reach Assessment Report C-12 March 2012 ICF 703.11
Subreach Upstream River Mile
Downstream River Mile
Upstream End of Side Channel Engaged at
2-Year Flow
Upstream End of Floodplain Channel
Engaged at 10-Year Flow
Aggradation/ Degradation
Potential Class
Planform Stability
Index Planform
Adjacent to Revetment
or Levee
1 63.74 63.41
4 1 S
1 63.41 63.3
3 1 S
1 63.3 63.15
4 1 S
1 63.15 63.02
4 1 S
1 63.02 62.78
4 1 S
1 62.78 62.62
4 1 S
1 62.62 62.44
3 1 S
1 62.44 62.24
5 1 S
1 62.24 62.05
4 1 S
1 62.05 61.85
4 1 S
1 61.85 61.69
4 1 S
1 61.69 61.51
4 1 S
1 61.51 61.31
4 1 S
1 61.31 61.18
4 1 S
1 61.18 60.97
4 1 S
1 60.97 60.77
4 1 S
1 60.77 60.65
4 1 S
1 60.65 60.37
4 1 S
1 60.37 60.3
3 1 S
1 60.3 60.21
4 1 S
1 60.21 60.12
3 1 S
1 60.12 60.05
4 1 S
1 60.05 59.99
4 1 S
1 59.99 59.93
4 1 S
1 59.93 59.86
4 1 S

Appendix D. Salmonid Life‐History Stage Analysis


Wapato Reach Assessment Report D‐1 April 2012ICF 703.11
Species Life‐History Flow Charts Figures D.1 through D.6 present a general overview of life‐history flow charts illustrating the complete Yakima River Basin portion of the life cycle for each species identified by the Yakama Nation and the TAG as of interest in the Yakima Basin and Wapato Reach, specifically. Juvenile and adult fish counts and abundance estimates at Prosser Dam and Roza Dam are from Yakama Nation data provided by Bill (Bosch pers. comm.(Yakama Nation unpublished data, October 2011). Detailed descriptions of life‐history information and background information are presented in Section 2.3 of the report.
The solid vertical lines represent life stage progression for the species. The progression begins with adult migration at Prosser Dam and ends with juvenile seaward migration past Prosser Dam. The progression can include migration between habitats within a life stage (i.e., migration past Prosser Dam and Roza Dam) or simply a change in life stage with limited movement. Dashed horizontal lines represent the dispersal of a portion of fish to downstream areas within a life stage. Dispersal is generally in response to seasonal changes, but can also be in response to flow regulation (i.e., steelhead fry dispersal).
Life stage use within the Wapato Reach for several species is based on empirical data and extrapolation from observations at Prosser Dam. Several species, such as coho juvenile use for over winter residence, are based on expert judgments from discussions with the TAG. These discussions attempted to balance current management goals and potential historic use. In the case of coho spawning and juvenile summer residence, the charts do not include coho using the Wapato Reach. This was a decision to reflect management goals for coho distribution and not attempt to describe potential historic distribution.

Yakama Nation Appendix D
Wapato Reach Assessment Report D‐2 April 2012ICF 703.11
Figure D‐1. Fall Chinook Life History
Fall Chinook
Life Stages SeasonSeptember ‐
October
Adult
Migration/Holding September ‐
October
Spawning/ October ‐
Incubation April
Subyearling March ‐
Transient Rearing June
Subyearling April ‐
Outmigrants June
Adult or juvenile enumeration project
Life stages that fish have been observed or are
expected to be present in the Wapato Reach
Lower Tributary RifflesLower MainstemRiffles/Glides
Tributary Pools/GlidesLowerMainstem Pools/Glides
Prosser Dam
MainstemPools/Glides
Wapato Reach
Prosser Dam
Prosser/Roza

Yakama Nation Appendix D
Wapato Reach Assessment Report D‐3 April 2012ICF 703.11
Figure D‐2. Summer Chinook Life History
Summer Chinook
Life Stages SeasonJune ‐
September
Adult
Migration/Holding June ‐
September
Spawning/ September ‐
Incubation April
Subyearling March ‐
Transient Rearing July
Subyearling April ‐
Outmigrants July
Fall Subyearling July ‐
Transient Rearing October
Fall Subyearling September ‐
Outmigrants October
Adult or juvenile enumeration project
Life stages that fish have been observed or are
expected to be present in the Wapato Reach
Mid Tributary RifflesMid & Lower Mainstem
Riffles/Glides
Tributary Pools/GlidesMid& LowerMainstem
Pools/Glides
Prosser Dam
MainstemPools/Glides
Wapato Reach
Prosser Dam
Prosser/Roza
Mid& LowerMainstem Pools/Glides
Prosser Dam

Yakama Nation Appendix D
Wapato Reach Assessment Report D‐4 April 2012ICF 703.11
Figure D‐3. Spring Chinook Life History
Spring Chinook
Life Stages SeasonApril ‐
June
Adult April ‐
Migration June
May ‐
June
Adult Holding May ‐
August
Spawning/ Aug/Sept ‐
Incubation March/April
Fry Spring Snow melt April ‐
Dispersal May
Summer April ‐
Rearing & Transient October
Fall/Winter Cool temperature October ‐
Redistribution November
Overwinter Inactive November ‐
& Winter Migrants March
November ‐
March
Smolt March ‐
Outmigrants May
Adult or juvenile enumeration project
Life stages that fish have been observed or are
expected to be present in the Wapato Reach
Roza Dam (Up Yak)
Upper Tributary RifflesUpper Mainstem & Side
Channel Riffles
Tributary Pools/GlidesUp & Mid Mainstem
Pools/Glides
Tributary Pools, Cobble Substrate
Upper to Lower Main Pools, Cobble Substrate
Prosser Dam
MainstemPools/Thermal Refuge
Wapato Reach
Mid to Up Mainstem Pools/Thermal Refuge
Tributary Pools/Thermal Refuge
Prosser Dam (Winter Migrants)
Upper to LowerMainstem
Prosser Dam
Prosser/Roza

Yakama Nation Appendix D
Wapato Reach Assessment Report D‐5 April 2012ICF 703.11
Figure D‐4. Summer Steelhead Life History
Summer Steelhead
Life Stages SeasonSeptember ‐
April
Adult September ‐
Migration/Holding April
November ‐
May
Spawning/ March/April ‐
Incubation June/July
Fry Flow Regulation July ‐
Dispersal September
0 age Summer June ‐
Rearing October
Fall Cool Temperature
Redistribution
Overwinter Inactive November ‐
& Winter Migrants March
1 age Smolts November ‐
March
1 age Summer April ‐
Rearing October
Overwinter November ‐
Inactive March
1 and 2 Age Smolt
Outmigrants April ‐
May
Adult or juvenile enumeration project
Life stages that fish have been observed or are
expected to be present in the Wapato Reach
Roza Dam (Up Yak)
TributaryPools/Glides/Riffles
Up ‐Mid Mainstem Pools/Glides/Riffles
Tributary Cobble Substrate
Upper to Lower Mainstem Cobble
Substrate
Prosser Dam
Low & Mid MainstemPools/Glides
Wapato Reach
Mainstem & Side Channel RifflesTributary Riffles
Prosser Dam (Winter Migrants)
Upper to LowerMainstem
Prosser Dam
Prosser/Roza
TributaryPools/Glides/Riffles
Up to Low Mainstem Pools/Glides/Riffles
Tributary Cobble Substrate
Upper to Lower Mainstem Cobble
Substrate

Yakama Nation Appendix D
Wapato Reach Assessment Report D‐6 April 2012ICF 703.11
Figure D‐5. Coho Life History
Coho
Life Stages SeasonSeptember ‐
November
Adult September ‐
Migration December
September ‐
December
Spawning/ November ‐
Incubation April
Fry Spring Snow melt April ‐
Dispersal May
Summer May ‐
Rearing October
Fall Fall/Early Winter Freshets October ‐
Redistribution November
Overwinter November ‐
Inactive March
Smolt April ‐
Outmigrants June
Adult or juvenile enumeration project
Life stages that fish have been observed or are
expected to be present in the Wapato Reach
Roza Dam (Up Yak)
Tributary RifflesUp & Mid Side Channel
Riffles
Tributary Pools/GlidesUp & Mid Mainstem
Pools/Glides/Side Chan
Backwater/Pools/Off‐channel Pds
Mainstem Backwater/Off‐channel
Ponds
Prosser Dam
MainstemPools/Glides
Wapato Reach
Upper to LowerMainstem
Prosser Dam
Prosser/Roza

Yakama Nation Appendix D
Wapato Reach Assessment Report D‐7 April 2012ICF 703.11
Figure D‐6. Sockeye Life History
Sockeye
Life Stages Season
Adult June ‐
Migration September
Spawning/ August ‐
Incubation April
0 and 1 age May ‐
Juvenile Rearing April
Smolt April ‐
Outmigrants May
Adult or juvenile enumeration project
Life stages that fish have been observed or are
expected to be present in the Wapato Reach
Tributaries Upstream Nursery Lakes
Nursery Lakes
Upper to LowerMainstem
Prosser Dam
Low to Up MainstemPools/Glides
Wapato Reach
Prosser Dam
Prosser/Roza
Roza Dam

Yakama Nation Appendix D
Wapato Reach Assessment Report D‐8 April 2012ICF 703.11
Project Effect Profiles Table D.1 presents the project effectiveness assumptions made in EDT. The assumptions are presented in terms of percent change in habitat conditions with project implementation relative to current conditions.
Figures D.7 through D.11 then present the effect of each recommended process‐based restoration project by species and life stage as analyzed in EDT. Factors shown encompass the full suite of detailed environmental attributes described through the EDT process. Green circles indicate greater project effect on habitat quality relative to current survival conditions. The exception is the Key Habitat Quantity factor, which represents the increase of habitat quantity relative to the current condition through change in habitat composition and increase of floodplain habitat.
Multiple ‘light circles’ with lower effects on survival spread across several factors could equal or exceed the effect of a single ‘dark circle’ factor with a greater effect on survival. Open circles indicate a slight effect of the project on survival. These figures identify the extent that a combination of environmental attributes has been affected, and how this change is perceived by the species and life stage with respect to survival.

Yakama Nation Appendix D
Wapato Reach Assessment Report D‐9 April 2012ICF 703.11
Table D.1. Project Effectiveness EDT Assumptions in terms of Percent Change in Conditions with Project Implementation Relative to Current Conditions
Confinem
ent
Hydromodifications
Habitat type primary
pools
Habitat type pool
tailouts
Habitat type
backwater pools
Habitat type – side
channel
Habitat type w
etted
area of seasonally
flooded wetlands
Riparian function
Wood
Fine sediment
Embeddedness
Tem
perature daily
maximum (by month)
Tem
perature spatial
variation
Salmon Carcasses
Benthos diversity and
production
Fish com
munity
richness
Predation risk
Harassm
ent
Side channel
complexity
Side channel
connectivity
Obstructing littoral
vegetation (wetlands)
Passive Accessibility
(wetlands)
SR5 RM 105.0, Channel Roughness Elements
Yakima R5A 20.0% 20.0% 20.0% 20.0% 20.0% 20.0% 20.0% 20.0% 20.0% 10.0% 10.0% 10.0% 20.0% 20.0% 20.0%
Yakima R5 10.0% 10.0% 10.0%
Yakima R4A 2.5% 2.5%
Yakima R4
Yakima R3
Yakima R2D
SR5 RM 102.9, Instream wood and Channel Roughness Elements
Yakima R5A 20.0% 10.0% 10.0% 10.0% 10.0% 10.0% 10.0% 10.0% 2.5% 2.5% 10.0% 10.0%
Yakima R5
Yakima R4A
Yakima R4
Yakima R3
Yakima R2D
SR5 RM 102.0, Channel Roughness Elements
Yakima R5A 20.0% 20.0% 20.0% 20.0% 20.0% 20.0% 20.0% 20.0% 20.0% 10.0% 10.0% 10.0% 20.0% 20.0% 20.0%
Yakima R5 10.0% 10.0% 10.0%
Yakima R4A 2.5% 2.5%
Yakima R4
Yakima R3
Yakima R2D
SR5 RM 98.6, Channel Roughness Elements
Yakima R5A 10.0% 10.0% 10.0% 10.0% 10.0% 10.0% 10.0% 10.0% 10.0% 10.0% 2.5% 2.5% 2.5% 10.0% 10.0% 10.0%
Yakima R5 2.5% 2.5%
Yakima R4A
Yakima R4
Yakima R3
Yakima R2D
SR4 RM 96.9, Levee Removal
Yakima R5A
Yakima R5 20.0% 20.0% 20.0% 20.0% 20.0% 10.0% 20.0% 20.0% 20.0% 20.0% 10.0% 10.0% 10.0% 20.0% 20.0% 20.0% 10.0% 10.0%
Yakima R4A 10.0% 10.0%

Yakama Nation Appendix D
Wapato Reach Assessment Report D‐10 April 2012ICF 703.11
Confinem
ent
Hydromodifications
Habitat type primary
pools
Habitat type pool
tailouts
Habitat type
backwater pools
Habitat type – side
channel
Habitat type w
etted
area of seasonally
flooded wetlands
Riparian function
Wood
Fine sediment
Embeddedness
Tem
perature daily
maximum (by month)
Tem
perature spatial
variation
Salmon Carcasses
Benthos diversity and
production
Fish com
munity
richness
Predation risk
Harassm
ent
Side channel
complexity
Side channel
connectivity
Obstructing littoral
vegetation (wetlands)
Passive Accessibility
(wetlands)
Yakima R4 2.5% 2.5%
Yakima R3
Yakima R2D
SR4 RM 95.4,Channel Roughness Elements
Yakima R5A
Yakima R5 10.0% 10.0% 10.0% 10.0% 10.0% 10.0% 10.0% 10.0% 10.0% 2.5% 2.5% 2.5% 10.0% 10.0% 10.0%
Yakima R4A 2.5% 2.5%
Yakima R4 2.5% 2.5%
Yakima R3
Yakima R2D
SR4 RM 93.5, Channel Roughness Elements
Yakima R5A
Yakima R5 20.0% 20.0% 20.0% 20.0% 20.0% 20.0% 20.0% 20.0% 20.0% 10.0% 10.0% 10.0% 20.0% 20.0% 20.0%
Yakima R4A 10.0% 10.0% 10.0%
Yakima R4 2.5% 2.5%
Yakima R3
Yakima R2D
SR3 RM 90.3, Instream Wood
Yakima R5A
Yakima R5
Yakima R4A 10.0% 10.0% 20.0% 2.5% 2.5% 10.0% 2.5% 10.0% 20.0%
Yakima R4
Yakima R3
Yakima R2D
SR3 RM 89.7, Levee Removal
Yakima R5A
Yakima R5
Yakima R4A 40.0% 20.0% 20.0% 20.0% 20.0% 20.0% 20.0% 20.0% 20.0% 20.0% 10.0% 10.0% 10.0% 20.0% 20.0% 20.0% 20.0% 20.0%
Yakima R4 10.0% 10.0%
Yakima R3 2.5% 2.5%
Yakima R2D

Yakama Nation Appendix D
Wapato Reach Assessment Report D‐11 April 2012ICF 703.11
Figure D‐7. Fall Chinook Project Profiles
Life Stage
Overall Increase Survival
Factors Effect on Life Stage Survival
Channel stability
Chemicals
Competition (w/ hatchery)
Flow
Food
Habitat diversity
Harassment/poaching
Predation
Fine Sediment & Turbidity
Temperature
Key habitat quantity
Adult migrant/
prespwn Egg incubation
Subyearling
juvenile
migrants
Fall Chinook ‐ SR 5 RM 105.0, Flood Fencing
Life Stage
Overall Increase Survival
Factors Effect on Life Stage Survival
Channel stability
Chemicals
Competition (w/ hatchery)
Flow
Food
Habitat diversity
Harassment/poaching
Predation
Fine Sediment & Turbidity
Temperature
Key habitat quantity
Adult migrant/
prespwn Egg incubation
Subyearling
juvenile
migrants
Fall Chin ‐ SR 5 RM 102.9, Channel reconstruction, instream wood, & flood fencing

Yakama Nation Appendix D
Wapato Reach Assessment Report D‐12 April 2012ICF 703.11
Life Stage
Overall Increase Survival
Factors Effect on Life Stage Survival
Channel stability
Chemicals
Competition (w/ hatchery)
Flow
Food
Habitat diversity
Harassment/poaching
Predation
Fine Sediment & Turbidity
Temperature
Key habitat quantity
Adult migrant/
prespwn Egg incubation
Subyearling
juvenile
migrants
Fall Chinook ‐ SR 5 RM 102.0 Flood Fencing
Life Stage
Overall Increase Survival
Factors Effect on Life Stage Survival
Channel stability
Chemicals
Competition (w/ hatchery)
Flow
Food
Habitat diversity
Harassment/poaching
Predation
Fine Sediment & Turbidity
Temperature
Key habitat quantity
Adult migrant/
prespwn Egg incubation
Subyearling
juvenile
migrants
Fall Chinook ‐ SR 5 RM 98.6, Flood Fencing

Yakama Nation Appendix D
Wapato Reach Assessment Report D‐13 April 2012ICF 703.11
Life Stage
Overall Increase Survival
Factors Effect on Life Stage Survival
Channel stability
Chemicals
Competition (w/ hatchery)
Flow
Food
Habitat diversity
Harassment/poaching
Predation
Fine Sediment & Turbidity
Temperature
Key habitat quantity
Adult migrant/
prespwn Egg incubation
Subyearling
juvenile
migrants
Fall Chinook ‐ SR 4 RM 96.9, Levee Removal
Fall Chinook ‐ SR 4 RM 95.4, Flood Fencing
Life Stage
Overall Increase Survival
Factors Effect on Life Stage Survival
Channel stability
Chemicals
Competition (w/ hatchery)
Flow
Food
Habitat diversity
Harassment/poaching
Predation
Fine Sediment & Turbidity
Temperature
Key habitat quantity
Adult migrant/
prespwn Egg incubation
Subyearling
juvenile
migrants

Yakama Nation Appendix D
Wapato Reach Assessment Report D‐14 April 2012ICF 703.11
Fall Chinook ‐ SR 4 RM 93.5, Flood Fencing
Life Stage
Overall Increase Survival
Factors Effect on Life Stage Survival
Channel stability
Chemicals
Competition (w/ hatchery)
Flow
Food
Habitat diversity
Harassment/poaching
Predation
Fine Sediment & Turbidity
Temperature
Key habitat quantity
Adult migrant/
prespwn Egg incubation
Subyearling
juvenile
migrants
Fall Chinook ‐ SR 4 RM 90.3, Instream Wood
Life Stage
Overall Increase Survival
Factors Effect on Life Stage Survival
Channel stability
Chemicals
Competition (w/ hatchery)
Flow
Food
Habitat diversity
Harassment/poaching
Predation
Fine Sediment & Turbidity
Temperature
Key habitat quantity
Adult migrant/
prespwn Egg incubation
Subyearling
juvenile
migrants

Yakama Nation Appendix D
Wapato Reach Assessment Report D‐15 April 2012ICF 703.11
Fall Chinook ‐ SR 3 RM 89.7, Levee Removal
Life Stage
Overall Increase Survival
Factors Effect on Life Stage Survival
Channel stability
Chemicals
Competition (w/ hatchery)
Flow
Food
Habitat diversity
Harassment/poaching
Predation
Fine Sediment & Turbidity
Temperature
Key habitat quantity
Adult migrant/
prespwn Egg incubation
Subyearling
juvenile
migrants
Fall Chinook ‐ SR 3 RM 80.1, Levee Removal
Life Stage
Overall Increase Survival
Factors Effect on Life Stage Survival
Channel stability
Chemicals
Competition (w/ hatchery)
Flow
Food
Habitat diversity
Harassment/poaching
Predation
Fine Sediment & Turbidity
Temperature
Key habitat quantity
Adult migrant/
prespwn Egg incubation
Subyearling
juvenile
migrants

Yakama Nation Appendix D
Wapato Reach Assessment Report D‐16 April 2012ICF 703.11
Figure D‐8. Summer Chinook Project Profiles
Life Stage
Overall Increase Survival
Factors Effect on Life Stage Survival
Channel stability
Chemicals
Competition (w/ hatchery)
Flow
Food
Habitat diversity
Harassment/poaching
Predation
Fine Sediment & Turbidity
Temperature
Key habitat quantity
Adult migrant/
prespwn Egg incubation
Subyearling
juvenile
migrants
Summer Chinook ‐ SR 5 RM 105.0, Flood Fencing
Life Stage
Overall Increase Survival
Factors Effect on Life Stage Survival
Channel stability
Chemicals
Competition (w/ hatchery)
Flow
Food
Habitat diversity
Harassment/poaching
Predation
Fine Sediment & Turbidity
Temperature
Key habitat quantity
Adult migrant/
prespwn Egg incubation
Subyearling
juvenile
migrants
Sum Chin ‐ SR 5 RM 102.9, Channel reconstruction, instream wood, & flood fencing

Yakama Nation Appendix D
Wapato Reach Assessment Report D‐17 April 2012ICF 703.11
Life Stage
Overall Increase Survival
Factors Effect on Life Stage Survival
Channel stability
Chemicals
Competition (w/ hatchery)
Flow
Food
Habitat diversity
Harassment/poaching
Predation
Fine Sediment & Turbidity
Temperature
Key habitat quantity
Adult migrant/
prespwn Egg incubation
Subyearling
juvenile
migrants
Summer Chinook ‐ SR 5 RM 102.0 Flood Fencing
Life Stage
Overall Increase Survival
Factors Effect on Life Stage Survival
Channel stability
Chemicals
Competition (w/ hatchery)
Flow
Food
Habitat diversity
Harassment/poaching
Predation
Fine Sediment & Turbidity
Temperature
Key habitat quantity
Adult migrant/
prespwn Egg incubation
Subyearling
juvenile
migrants
Summer Chinook ‐ SR 5 RM 98.6, Flood Fencing

Yakama Nation Appendix D
Wapato Reach Assessment Report D‐18 April 2012ICF 703.11
Life Stage
Overall Increase Survival
Factors Effect on Life Stage Survival
Channel stability
Chemicals
Competition (w/ hatchery)
Flow
Food
Habitat diversity
Harassment/poaching
Predation
Fine Sediment & Turbidity
Temperature
Key habitat quantity
Adult migrant/
prespwn Egg incubation
Subyearling
juvenile
migrants
Summer Chinook ‐ SR 4 RM 96.9, Levee Removal
Summer Chinook ‐ SR 4 RM 95.4, Flood Fencing
Life Stage
Overall Increase Survival
Factors Effect on Life Stage Survival
Channel stability
Chemicals
Competition (w/ hatchery)
Flow
Food
Habitat diversity
Harassment/poaching
Predation
Fine Sediment & Turbidity
Temperature
Key habitat quantity
Adult migrant/
prespwn Egg incubation
Subyearling
juvenile
migrants

Yakama Nation Appendix D
Wapato Reach Assessment Report D‐19 April 2012ICF 703.11
Summer Chinook ‐ SR 4 RM 93.5, Flood Fencing
Life Stage
Overall Increase Survival
Factors Effect on Life Stage Survival
Channel stability
Chemicals
Competition (w/ hatchery)
Flow
Food
Habitat diversity
Harassment/poaching
Predation
Fine Sediment & Turbidity
Temperature
Key habitat quantity
Adult migrant/
prespwn Egg incubation
Subyearling
juvenile
migrants
Summer Chinook ‐ SR 4 RM 90.3, Instream Wood
Life Stage
Overall Increase Survival
Factors Effect on Life Stage Survival
Channel stability
Chemicals
Competition (w/ hatchery)
Flow
Food
Habitat diversity
Harassment/poaching
Predation
Fine Sediment & Turbidity
Temperature
Key habitat quantity
Adult migrant/
prespwn Egg incubation
Subyearling
juvenile
migrants

Yakama Nation Appendix D
Wapato Reach Assessment Report D‐20 April 2012ICF 703.11
Summer Chinook ‐ SR 3 RM 89.7, Levee Removal
Life Stage
Overall Increase Survival
Factors Effect on Life Stage Survival
Channel stability
Chemicals
Competition (w/ hatchery)
Flow
Food
Habitat diversity
Harassment/poaching
Predation
Fine Sediment & Turbidity
Temperature
Key habitat quantity
Adult migrant/
prespwn Egg incubation
Subyearling
juvenile
migrants
Summer Chinook ‐ SR 3 RM 80.1, Levee Removal
Life Stage
Overall Increase Survival
Factors Effect on Life Stage Survival
Channel stability
Chemicals
Competition (w/ hatchery)
Flow
Food
Habitat diversity
Harassment/poaching
Predation
Fine Sediment & Turbidity
Temperature
Key habitat quantity
Adult migrant/
prespwn Egg incubation
Subyearling
juvenile
migrants

Yakama Nation Appendix D
Wapato Reach Assessment Report D‐21 April 2012ICF 703.11
Figure D‐9. Spring Chinook Project Profiles
Life Stage
Overall Increase Survival
Factors Effect on Life Stage Survival
Channel stability
Chemicals
Competition (w/ hatchery)
Flow
Food
Habitat diversity
Harassment/poaching
Predation
Fine Sediment & Turbidity
Temperature
Key habitat quantity
Adult migrant/
prespwn
Juvenile
overwinter &
winter migrants Smolt migrants
Spring Chinook ‐ SR 5 RM 105.0, Flood Fencing
Life Stage
Overall Increase Survival
Factors Effect on Life Stage Survival
Channel stability
Chemicals
Competition (w/ hatchery)
Flow
Food
Habitat diversity
Harassment/poaching
Predation
Fine Sediment & Turbidity
Temperature
Key habitat quantity
Adult migrant/
prespwn
Juvenile
overwinter &
winter migrants Smolt migrants
Spr Chin ‐ SR 5 RM 102.9, Channel reconstruction, instream wood, and flood fencing

Yakama Nation Appendix D
Wapato Reach Assessment Report D‐22 April 2012ICF 703.11
Life Stage
Overall Increase Survival
Factors Effect on Life Stage Survival
Channel stability
Chemicals
Competition (w/ hatchery)
Flow
Food
Habitat diversity
Harassment/poaching
Predation
Fine Sediment & Turbidity
Temperature
Key habitat quantity
Adult migrant/
prespwn
Juvenile
overwinter &
winter migrants Smolt migrants
Spring Chinook ‐ SR 5 RM 102.0 Flood Fencing
Life Stage
Overall Increase Survival
Factors Effect on Life Stage Survival
Channel stability
Chemicals
Competition (w/ hatchery)
Flow
Food
Habitat diversity
Harassment/poaching
Predation
Fine Sediment & Turbidity
Temperature
Key habitat quantity #
Adult migrant/
prespwn
Juvenile
overwinter &
winter migrants Smolt migrants
Spring Chinook ‐ SR 5 RM 98.6, Flood Fencing

Yakama Nation Appendix D
Wapato Reach Assessment Report D‐23 April 2012ICF 703.11
Life Stage
Overall Increase Survival
Factors Effect on Life Stage Survival
Channel stability
Chemicals
Competition (w/ hatchery)
Flow
Food
Habitat diversity
Harassment/poaching
Predation
Fine Sediment & Turbidity
Temperature
Key habitat quantity #
Adult migrant/
prespwn
Juvenile
overwinter &
winter migrants Smolt migrants
Spring Chinook ‐ SR 4 RM 96.9, Levee Removal
Spring Chinook ‐ SR 4 RM 95.4, Flood Fencing
Life Stage
Overall Increase Survival
Factors Effect on Life Stage Survival
Channel stability
Chemicals
Competition (w/ hatchery)
Flow
Food
Habitat diversity
Harassment/poaching
Predation
Fine Sediment & Turbidity
Temperature
Key habitat quantity
Adult migrant/
prespwn
Juvenile
overwinter &
winter migrants Smolt migrants

Yakama Nation Appendix D
Wapato Reach Assessment Report D‐24 April 2012ICF 703.11
Spring Chinook ‐ SR 4 RM 93.5, Flood Fencing
Life Stage
Overall Increase Survival
Factors Effect on Life Stage Survival
Channel stability
Chemicals
Competition (w/ hatchery)
Flow
Food
Habitat diversity
Harassment/poaching
Predation
Fine Sediment & Turbidity
Temperature
Key habitat quantity
Adult migrant/
prespwn
Juvenile
overwinter &
winter migrants Smolt migrants
Spring Chinook ‐ SR 4 RM 90.3, Instream Wood
Life Stage
Overall Increase Survival
Factors Effect on Life Stage Survival
Channel stability
Chemicals
Competition (w/ hatchery)
Flow
Food
Habitat diversity
Harassment/poaching
Predation
Fine Sediment & Turbidity
Temperature
Key habitat quantity
Adult migrant/
prespwn
Juvenile
overwinter &
winter migrants Smolt migrants

Yakama Nation Appendix D
Wapato Reach Assessment Report D‐25 April 2012ICF 703.11
Spring Chinook ‐ SR 3 RM 89.7, Levee Removal
Life Stage
Overall Increase Survival
Factors Effect on Life Stage Survival
Channel stability
Chemicals
Competition (w/ hatchery)
Flow
Food
Habitat diversity
Harassment/poaching
Predation
Fine Sediment & Turbidity
Temperature
Key habitat quantity
Adult migrant/
prespwn
Juvenile
overwinter &
winter migrants Smolt migrants
Spring Chinook ‐ SR 3 RM 80.1, Levee Removal
Life Stage
Overall Increase Survival
Factors Effect on Life Stage Survival
Channel stability
Chemicals
Competition (w/ hatchery)
Flow
Food
Habitat diversity
Harassment/poaching
Predation
Fine Sediment & Turbidity
Temperature
Key habitat quantity
Adult migrant/
prespwn
Juvenile
overwinter &
winter migrants Smolt migrants

Yakama Nation Appendix D
Wapato Reach Assessment Report D‐26 April 2012ICF 703.11
Figure D‐10. Summer Steelhead Project Profiles
Summer Steelhead ‐ SR 5 RM 105.0, Flood Fencing
Life Stage
Overall Increase Survival
Factors Effect on Life Stage Survival
Channel stability
Chemicals
Competition (w/ hatchery)
Flow
Food
Habitat diversity
Harassment/poaching
Predation
Fine Sediment & Turbidity
Temperature
Key habitat quantity #
Adult migrant/
prespwn
Juvenile
summer
residence Smolt migrants
Juvenile
overwinter &
winter migrant
Summer Steelhead ‐ SR 5 RM 102.9, Channel reconstruction, instream wood, and flood fencing
Life Stage
Overall Increase Survival
Factors Effect on Life Stage Survival
Channel stability
Chemicals
Competition (w/ hatchery)
Flow
Food
Habitat diversity
Harassment/poaching
Predation
Fine Sediment & Turbidity
Temperature
Key habitat quantity #
Adult migrant/
prespwn
Juvenile
summer
residence
Juvenile
overwinter &
winter migrant Smolt migrants

Yakama Nation Appendix D
Wapato Reach Assessment Report D‐27 April 2012ICF 703.11
Summer Steelhead ‐ SR 5 RM 98.6, Flood Fencing
Life Stage
Overall Increase Survival
Factors Effect on Life Stage Survival
Channel stability
Chemicals
Competition (w/ hatchery)
Flow
Food
Habitat diversity
Harassment/poaching
Predation
Fine Sediment & Turbidity
Temperature
Key habitat quantity #
Adult migrant/
prespwn
Juvenile
summer
residence
Juvenile
overwinter &
winter migrant Smolt migrants
Summer Steelhead ‐ SR 4 RM 96.9, Levee Removal
Life Stage
Overall Increase Survival
Factors Effect on Life Stage Survival
Channel stability
Chemicals
Competition (w/ hatchery)
Flow
Food
Habitat diversity
Harassment/poaching
Predation
Fine Sediment & Turbidity
Temperature
Key habitat quantity #
Adult migrant/
prespwn
Juvenile
summer
residence
Juvenile
overwinter &
winter migrant Smolt migrants

Yakama Nation Appendix D
Wapato Reach Assessment Report D‐28 April 2012ICF 703.11
Summer Steelhead ‐ SR 4 RM 95.4, Flood Fencing
Life Stage
Overall Increase Survival
Factors Effect on Life Stage Survival
Channel stability
Chemicals
Competition (w/ hatchery)
Flow
Food
Habitat diversity
Harassment/poaching
Predation
Fine Sediment & Turbidity
Temperature
Key habitat quantity #
Adult migrant/
prespwn
Juvenile
summer
residence
Juvenile
overwinter &
winter migrant Smolt migrants
Summer Steelhead ‐ SR 4 RM 93.5, Flood Fencing
Life Stage
Overall Increase Survival
Factors Effect on Life Stage Survival
Channel stability
Chemicals
Competition (w/ hatchery)
Flow
Food
Habitat diversity
Harassment/poaching
Predation
Fine Sediment & Turbidity
Temperature
Key habitat quantity
Adult migrant/
prespwn
Juvenile
summer
residence
Juvenile
overwinter &
winter migrant Smolt migrants

Yakama Nation Appendix D
Wapato Reach Assessment Report D‐29 April 2012ICF 703.11
Summer Steelhead ‐ SR 4 RM 90.3, Instream Wood
Life Stage
Overall Increase Survival
Factors Effect on Life Stage Survival
Channel stability
Chemicals
Competition (w/ hatchery)
Flow
Food
Habitat diversity
Harassment/poaching
Predation
Fine Sediment & Turbidity
Temperature
Key habitat quantity #
Adult migrant/
prespwn
Juvenile
summer
residence
Juvenile
overwinter &
winter migrant Smolt migrants
Summer Steelhead ‐ SR 3 RM 89.7, Levee Removal
Life Stage
Overall Increase Survival
Factors Effect on Life Stage Survival
Channel stability
Chemicals
Competition (w/ hatchery)
Flow
Food
Habitat diversity
Harassment/poaching
Predation
Fine Sediment & Turbidity
Temperature
Key habitat quantity #
Adult migrant/
prespwn
Juvenile
summer
residence
Juvenile
overwinter &
winter migrant Smolt migrants

Yakama Nation Appendix D
Wapato Reach Assessment Report D‐30 April 2012ICF 703.11
Summer Steelhead ‐ SR 3 RM 80.1, Levee Removal
Life Stage
Overall Increase Survival
Factors Effect on Life Stage Survival
Channel stability
Chemicals
Competition (w/ hatchery)
Flow
Food
Habitat diversity
Harassment/poaching
Predation
Fine Sediment & Turbidity
Temperature
Key habitat quantity #
Adult migrant/
prespwn
Juvenile
summer
residence
Juvenile
overwinter &
winter migrant Smolt migrants

Yakama Nation Appendix D
Wapato Reach Assessment Report D‐31 April 2012ICF 703.11
Figure D‐11. Coho Project Profiles
Life Stage
Overall Increase Survival
Factors Effect on Life Stage Survival
Channel stability
Chemicals
Competition (w/ hatchery)
Flow
Food
Habitat diversity
Harassment/poaching
Predation
Fine Sediment & Turbidity
Temperature
Key habitat quantity
Adult migrant/
prespwn
Juvenile
overwinter Smolt migrants
Coho ‐ SR 5 RM 105.0, Flood Fencing
Life Stage
Overall Increase Survival
Factors Effect on Life Stage Survival
Channel stability
Chemicals
Competition (w/ hatchery)
Flow
Food
Habitat diversity
Harassment/poaching
Predation
Fine Sediment & Turbidity
Temperature
Key habitat quantity
Adult migrant/
prespwn
Juvenile
overwinter Smolt migrants
Coho ‐ SR 5 RM 102.9, Channel reconstruction, instream wood, and flood fencing

Yakama Nation Appendix D
Wapato Reach Assessment Report D‐32 April 2012ICF 703.11
Life Stage
Overall Increase Survival
Factors Effect on Life Stage Survival
Channel stability
Chemicals
Competition (w/ hatchery)
Flow
Food
Habitat diversity
Harassment/poaching
Predation
Fine Sediment & Turbidity
Temperature
Key habitat quantity
Adult migrant/
prespwn
Juvenile
overwinter Smolt migrants
Coho ‐ SR 5 RM 102.0 Flood Fencing
Life Stage
Overall Increase Survival
Factors Effect on Life Stage Survival
Channel stability
Chemicals
Competition (w/ hatchery)
Flow
Food
Habitat diversity
Harassment/poaching
Predation
Fine Sediment & Turbidity
Temperature
Key habitat quantity
Adult migrant/
prespwn
Juvenile
overwinter Smolt migrants
Coho ‐ SR 5 RM 98.6, Flood Fencing

Yakama Nation Appendix D
Wapato Reach Assessment Report D‐33 April 2012ICF 703.11
Life Stage
Overall Increase Survival
Factors Effect on Life Stage Survival
Channel stability
Chemicals
Competition (w/ hatchery)
Flow
Food
Habitat diversity
Harassment/poaching
Predation
Fine Sediment & Turbidity
Temperature
Key habitat quantity
Adult migrant/
prespwn
Juvenile
overwinter Smolt migrants
Coho ‐ SR 4 RM 96.9, Levee Removal
Coho ‐ SR 4 RM 95.4, Flood Fencing
Life Stage
Overall Increase Survival
Factors Effect on Life Stage Survival
Channel stability
Chemicals
Competition (w/ hatchery)
Flow
Food
Habitat diversity
Harassment/poaching
Predation
Fine Sediment & Turbidity
Temperature
Key habitat quantity
Adult migrant/
prespwn
Juvenile
overwinter Smolt migrants

Yakama Nation Appendix D
Wapato Reach Assessment Report D‐34 April 2012ICF 703.11
Coho ‐ SR 4 RM 90.3, Instream Wood
Life Stage
Overall Increase Survival
Factors Effect on Life Stage Survival
Channel stability
Chemicals
Competition (w/ hatchery)
Flow
Food
Habitat diversity
Harassment/poaching
Predation
Fine Sediment & Turbidity
Temperature
Key habitat quantity
Adult migrant/
prespwn
Juvenile
overwinter Smolt migrants
Coho ‐ SR 3 RM 89.7, Levee Removal
Life Stage
Overall Increase Survival
Factors Effect on Life Stage Survival
Channel stability
Chemicals
Competition (w/ hatchery)
Flow
Food
Habitat diversity
Harassment/poaching
Predation
Fine Sediment & Turbidity
Temperature
Key habitat quantity
Adult migrant/
prespwn
Juvenile
overwinter Smolt migrants

Yakama Nation Appendix D
Wapato Reach Assessment Report D‐35 April 2012ICF 703.11
Coho ‐ SR 3 RM 80.1, Levee Removal
Life Stage
Overall Increase Survival
Factors Effect on Life Stage Survival
Channel stability
Chemicals
Competition (w/ hatchery)
Flow
Food
Habitat diversity
Harassment/poaching
Predation
Fine Sediment & Turbidity
Temperature
Key habitat quantity
Adult migrant/
prespwn
Juvenile
overwinter Smolt migrants


Appendix E. Project Descriptions


Wapato Reach Assessment ReportE‐1
April 2012ICF 703.11
Restoration Projects
The following descriptions of recommended restoration projects are organized by subreach, starting at the upstream extent (Subreach 5) and moving downstream to Subreaches 4 and 3. While no specifically recommended projects were identified for Subreaches 2 and 1, these lower reaches were identified as potential locations for multiple instream wood projects (see Section 5.3.3).
Each project is identified by subreach (SR) and river mile (RM), with the approximate midpoint used as the project identifier for long projects (e.g., SR5 RM 105.2). The project location is provided by river miles, along with a description of right bank, left bank, or floodplain channel location. Reference to river‐left or river‐right is always oriented facing the downstream direction.
Subreach 5
Install Riparian Vegetation at River Mile 105.2
Project Type: Riparian Revegetation
Project ID: SR5 RM 105.2
Location: 105.2 to 102.9 floodplain channel
Project Objective: Riparian revegetation along floodplain channel
Description: Riparian revegetation along channel that originates at RM 105.2 and rejoins at 103.75 and 102.87. This site is part of the Wapato Wildlife Area, making it conducive to large‐scale restoration.
Biological Benefit: Riparian vegetation will reduce bank erosion and increase habitat diversity through wood recruitment to the channel and provide root protected bank structure. Short‐term benefits of riparian revegetation are the trapping and storage of silt and sand originating from the channel and from overland sources, thereby reducing the quantity of fine sediment in the channel affecting survival at multiple life stages. Wood recruitment to the channel may be from single trees entering the channel or larger quantities following channel avulsions. Larger quantities of large pieces included can provide affect channel processes forming pools or “metering” flow through side channels. These are longer term benefits.
Potentially Related Projects:
In the same area as habitat restoration site SR5 RM105.0 (flood fences to reduce channel migration by establishing vegetated islands).
Notes: Likely response time: 20 years

Yakama Nation Appendix E
Wapato Reach Assessment ReportE‐2
April 2012ICF 703.11
Install Channel Roughness Elements (flood fencing)1 at River Mile 105.0
Example of installed flood fencing
Example of installed flood fencing
1 Flood fencing was first developed in 2002, in Snohomish County, as a technique for addressing riparian management concerns on agricultural lands. It was conceived as a way to restore the riparian zone while reducing flood clean‐up costs. It mimics the function of a fully mature riparian forest, providing roughness for floodwaters to deposit large woody debris, sand, cobble, and coarse woody debris, as well as provide a suitable location for seed rain and propagules to become established. In initial applications, cottonwood posts were augured into the floodplain along the Snohomish and Skykomish Rivers. Monitoring indicated a high percentage of the boles had sprouted, which also provided a riparian vegetation function. The method was subsequently adapted in 2008 to applications in channel by the County and R2 to work with natural river deposition and erosion processes, protecting island splits, reducing avulsion potential, and guiding the river indirectly through deposition to increase connectivity with floodplain channels. The in‐channel method involves constructing arrays of vertical Douglas fir boles, with location, diameter, spacing, height, and burial depth reflecting anticipated geomorphic function, breakage, pull‐out, scouring, push‐over, and boater safety. The structures are designed to trap floating debris and/or promote local roughness that facilitates deposition of smaller size substrates. The method is inexpensive to design and construct, and has been found to cost roughly an order of magnitude less to design and build than an engineered log jam of comparable area of effect. There are also fewer attendant hazards after project completion in terms of risks to public safety, private property, and infrastructure. The method should work well in the Wapato Reach by creating hard points at the heads of islands, slowing overbank flows and promoting local deposition and vegetative colonization through hydraulic sheltering.

Yakama Nation Appendix E
Wapato Reach Assessment ReportE‐3
April 2012ICF 703.11
Example of installed flood fencing
Project Type: Channel Roughness Elements
Project ID: SR5 RM 105.0
Location: RM 105.0 to 103.0; channel
Project Objective: Encourage development of meandering/mildly wandering planform instead of existing braided/branched planform by converting broad gravel bars to vegetated channel islands.
Description: Encourage deposition of sediment in selected channels by constructing flood fence structures at the head of existing channel splits, and re‐vegetate adjacent islands and exposed channel margins downstream of the structures. Selected channels would function as secondary channels during high flow events (e.g., bankfull flow and greater) but would not convey flow during most of the year. Project includes planting cottonwoods and willows behind flood fence structures and along the outer portions of the islands and conifers where appropriate. Flood fencing structures and plantings will be done at multiple locations through this area.
Biological Benefit:
Fish biological benefits are from creating a channel with a vegetated, root protected bank, and structure along the channel margins. The action will move the broad and shallow existing conditions to a more narrowly defined channel and provide better in‐stream habitat during low flow periods. In addition, this project will promote the retention of fine sediment into the floodplain, thereby reducing the amount of in‐channel fine sediment.
Construction: Install 20 flood fence structures at various locations. Each flood fence consists of 26 to 34 logs that are 15 feet long and 12 inch dbh buried 2/3 into the channel bed or bar. Re‐vegetate 15 acres of former channel and unvegetated islands. Access assumes excavator is allowed to cross existing flowing channels and logs will be delivered from staging area to specific locations on the river with a helicopter. Assumes excavations will be allowed with no cofferdams required.
Cost Estimate $450,000 ‐ Cost estimate includes 5% for mobilization, 30% for design and permitting, 10% for construction management, and 30% contingency (of subtotal of construction items). Cost estimate assumes the project would be competitively bid and awarded to a private contractor who is required to pay Washington State prevailing wage rates. The construction cost could be reduced if Yakama Nation performed the work using in‐house labor and equipment.
Related Projects: In the same area as riparian revegetation site SR5 RM105.2
Notes: Likely response time: 20 years (all objectives); 5 years (effect on channel planform).

Yakama Nation Appendix E
Wapato Reach Assessment ReportE‐4
April 2012ICF 703.11
Channel Reconstruction, Instream Wood, and Channel Roughness Elements at River Mile 102.9
Project Type: Channel Reconstruction, Instream Wood, and Channel Roughness Elements
Project ID: SR5 RM 102.9
Location: RM 102.9 to 102.2
Project Objective: Improve alignment of channel to better match the bridge opening at the upstream side, prevent erosion of the right bank upstream of the bridge, and better utilize capacity of bridge opening during flood flow conditions. Recognizing the limitations at the site and the need to accommodate the built environment with the natural environment, this project would maximize the flow capacity through the bridge opening, establish a channel planform that matches the theoretically appropriate planform for this location, given the known/measured geomorphic parameters, stabilize the streambanks using habitat enhancing features (e.g., LWD structures, channel roughness) instead of using riprap, and improve floodplain connectivity.
Description: Reconstruct the meander of the dominant channel immediately upstream of the bridge to have a larger radius and have a direct alignment with the bridge opening. Remove existing fill material near the center of the bridge to provide additional flood flow conveyance through the bridge and reduce factors leading to the current erosion of the right bank. Protect the right bank upstream of the bridge from erosion by installing multiple large Engineered Log Jams, or a continuous length of Large Woody Debris revetment. Encourage deposition of sediment in secondary channel by constructing flood fence structures at the head of the existing channel, this channel would continue to function as a high flow secondary channel but not as a secondary channel during lower flow conditions.
Biological Benefit: Fish biological benefits are from restoring natural bank structure and promoting the retention of fine sediment into the floodplain, thereby reducing the amount of in‐channel fine sediment.
Construction Reconstruct 1,500 feet of channel upstream of the bridge by relocating soil from the bar to the eroding right bank, approximately 20,000 cubic yards of excavation and fill. Install ELJ or continuous LWD bank protection along right bank. Remove artificially high mound of soil from island near midspan of bridge, approximately 1,500 cubic yards of excavation and off‐haul. Install 5 flood fence structures. Re‐vegetate disturbed areas. All areas of work are easily accessed from road. Assumes channel relocation will require cofferdams to direct flowing river away from work site.
Cost Estimate $900,000 ‐ Cost estimate includes 5% for mobilization, 50% for design and permitting, 15% for construction management, and 30% contingency (of subtotal of construction items). Cost estimate assumes the project would be competitively bid and awarded to a private contractor who is required to pay Washington State prevailing wage rates. The construction cost could be reduced if Yakama Nation performed the work using in‐house labor and equipment. For approximately half the cost, this project could be altered to just stabilize the eroding bank with large wood structures and remove the excess soil/fill at the midspan of the bridge.
Notes: This site did not come out of the geomorphic analysis, but was in the TAG list as a problem site associated with the bridge. Response time: immediately after construction (all objectives).

Yakama Nation Appendix E
Wapato Reach Assessment ReportE‐5
April 2012ICF 703.11
Riparian Revegetation at River Mile 102.3, Left Bank
Failed barbs near habitat restoration project SR5 RM 102.9 taken on right bank facing downstream
Project Type: Riparian Revegetation
Project ID: SR5 RM 102.3
Location: 102.3 to 100.7 Left bank
Project Objective: Riparian revegetation of stream bank
Description: Plant riparian vegetation on left bank from 102.3 to 100.7
Biological Benefit: Riparian vegetation will reduce bank erosion and increase habitat diversity through wood recruitment to the channel and provide root protected bank structure. Short‐term benefits of riparian revegetation are the trapping and storage of silt and sand originating from the channel and from overland sources, thereby reducing the quantity of fine sediment in the channel affecting survival at multiple life stages. Wood recruitment to the channel may be from single trees entering the channel or larger quantities following channel avulsions. Larger quantities of large pieces included can provide affect channel processes forming pools or “metering” flow through side channels. These are longer term benefits.
Landowner Has segments associated with Yakama Nation Wildlife but much of the property is not under Yakama Nation ownership according to current records.
Related Projects: Riparian project site is in the same area as recommended habitat restoration site SR5 RM102.9 ‐channel reconstruction, instream wood, and flood fencing. This action is also near high priority protection area at RM 102.4‐100.8
Notes: Likely response time: 20 years (all objectives).

Yakama Nation Appendix E
Wapato Reach Assessment ReportE‐6
April 2012ICF 703.11
Channel Roughness Elements at River Mile 102.0
Habitat restoration project SR5 RM 102 side channel entrance viewed from right bank facing east
Project Type: Channel Roughness Elements, Riparian Planting
Project ID: SR5 RM 102.0
Location: RM 102 to 101
Project Objective:
Encourage development of a meandering or mildly wandering planform instead of existing braided/branched planform by converting broad gravel bars to vegetated channel islands.
Description: Encourage deposition of sediment in selected channels by constructing flood fence structures at the head of existing channel splits, and re‐vegetate adjacent islands and exposed channel margins downstream of the structures. Selected channels would function as secondary channels during high flow events (e.g., bankfull flow and greater) but would not convey flow during most of the year. Project includes planting cottonwoods and willows behind flood fence structures and along the outer portions of the islands and conifers where appropriate. Flood fencing structures and plantings will be done at multiple locations through this area.
Biological Benefit:
Fish biological benefits are from creating a channel with a vegetated, root protected bank, and structure along the channel margins. The action will move the broad and shallow existing conditions to a more narrowly defined channel and provide better in‐stream habitat during low flow periods. In addition, this project will promote the retention of fine sediment into the floodplain, thereby reducing the amount of in‐channel fine sediment.
Construction: Install 10 flood fence structures at various locations. Each flood fence consists of 26 to 34 logs that are 15 feet long and 12 inch dbh buried 2/3 into the channel bed or bar. Re‐vegetate 20 acres of former channel and unvegetated islands. Access may be through private property on left bank and assumes excavator is allowed to cross existing flowing channels. Assumes logs will be delivered from staging area to specific locations on the river with a helicopter. Assumes excavations will be allowed with no cofferdams required.
Cost Estimate
$350,000; Cost estimate includes 5% for mobilization, 30% for design and permitting, 10% for construction management, and 30% contingency (of subtotal of construction items). Cost estimate assumes the project would be competitively bid and awarded to a private contractor who is required to pay Washington State prevailing wage rates. The construction cost could be reduced if Yakama Nation performed the work using in‐house labor and equipment.
Notes: Likely response time: 20 years (all objectives); 5 years (effect on channel planform).

Yakama Nation Appendix E
Wapato Reach Assessment ReportE‐7
April 2012ICF 703.11
Channel Roughness Elements at River Mile 98.6
Habitat restoration project SR5 RM 98.6 facing upstream where main channel hits pond levee
Project Type: Channel Roughness Elements and Riparian Planting
Project ID: SR5 RM 98.6
Location: RM 98.6 to 98.0
Project Objective: Reduce channel migration towards existing ponds and protect pond levees from erosion. Promote development of single dominant meandering channel at a desirable location instead of existing braided/and branched planform.
Description: Reduce channel migration towards existing ponds and protect pond levees from erosion by directing a dominant flow channel away from the pond levees, and by establishing vegetated channel islands. Promote development of single dominant meandering channel at a desirable location instead of existing braided/and branched planform. Encourage deposition of sediment in selected channels by constructing flood fence structures at the head of existing channel splits, and re‐vegetate adjacent islands and exposed channel margins downstream of the structures. Selected channels would function as secondary channels during high flow events (e.g., bankfull flow and greater) but would not convey flow during most of the year. Project includes planting cottonwoods and willows behind flood fence structures and along the outer portions of the islands, and plant conifers where appropriate. Flood fencing structures and plantings will be done at multiple locations through this area.
Biological Benefit: Fish biological benefits are from creating a channel with a vegetated, root protected bank, and structure along the channel margins. The action will move the broad and shallow existing conditions to a more narrowly defined channel and provide better in‐stream habitat during low flow periods. In addition, this project will promote the retention of fine sediment into the floodplain, thereby reducing the amount of in‐channel fine sediment.
Construction: Install 10 flood fence structures at various locations. Each flood fence consists of 26 to

Yakama Nation Appendix E
Wapato Reach Assessment ReportE‐8
April 2012ICF 703.11
34 logs that are 15 feet long and 12 inch dbh buried 2/3 into the channel bed or bar. Re‐vegetate 10 acres of former channel and unvegetated islands. Access could be from pond levees, and assumes excavator is allowed to cross existing flowing channels. Assumes logs will be delivered from staging area to specific locations on the river with a helicopter. Assumes excavations will be allowed with no cofferdams required.
Cost Estimate $350,000 ‐ Cost estimate includes 5% for mobilization, 30% for design and permitting, 10% for construction management, and 30% contingency (of subtotal of construction items). Cost estimate assumes the project would be competitively bid and awarded to a private contractor who is required to pay Washington State prevailing wage rates. The construction cost could be reduced if Yakama Nation performed the work using in‐house labor and equipment.
Notes: Likely response time: 20 years (all objectives); 5 years (effect on channel planform). An additional item that could be included with this project would be to lower the levee of the downstream pond. This would allow flow to enter during peak flow events and fine grained sediments would deposit in the pond, preventing the sediments from being deposited downstream in the channel. Temperature profile data from Vaccaro (2011) shows a localized warming of the mainstem just downstream of the ponds that may be a result of these ponds.

Yakama Nation Appendix E
Wapato Reach Assessment ReportE‐9
April 2012ICF 703.11
Subreach 4
Levee Removal at River Mile 96.9
Project Type: Levee Removal
Project ID: SR4 RM 96.9
Location: RM 96.9 to 96.3
Project Objective: Increase floodplain flow conveyance, riparian habitat, and channel migration zone extents by removing levee/bank hardening.
Description: Increase floodplain flow conveyance, riparian habitat, and channel migration zone extents by relocating a levee. The existing levee is immediately adjacent to the main channel along the right bank and the project would move the levee away from the channel, creating access to approximately 30 acres of low elevation floodplain. A levee would be constructed at a setback location to provide flood protection to area agricultural lands and buildings.
Biological Benefit: Fish biological benefits are from the restoration of additional floodplain and improved riparian condition associated with the levee and immediately adjacent. Additional biological benefits are from the potential to reconnect floodplain channel. In addition, this project could promote the retention of fine sediment into the floodplain, thereby reducing the amount of in‐channel fine sediment.
Construction: Remove 3,000 linear feet of existing levee and construct 2,500 linear feet of levee at a setback location. Re‐vegetate 30 acres of riparian floodplain that is currently agricultural land. Assumes all work can be done above the ordinary high water line. Access is from adjacent roads. All material for new levee will come from existing levee; additional length of existing levee material will be used by making new levee slightly wider.
Cost Estimate: $400,000 ‐ Cost estimate includes 5% for mobilization, 40% for design and permitting, 15% for construction management, and 30% contingency (of subtotal of construction items). Cost does not include property acquisition due to uncertainties of current ownership. Cost estimate assumes the project would be competitively bid and awarded to a private contractor who is required to pay Washington State prevailing wage rates. The construction cost could be reduced if Yakama Nation performed the work using in‐house labor and equipment. Costs would increase significantly, easily triple, if existing levee material had to be hauled off‐site for disposal and material had to be hauled in for new levee.
Related Projects: This coincides with TAG project #20.
Notes: Would need to further evaluate the elevations of the channel downstream of the levee to evaluate ability to reconnect the historic channel shown in the aerial photo. Response time: immediate after construction (all objectives). Removal of riprap bank protection upstream of this site was determined to have minimal benefit due to high floodplain elevation at RM 97 and immediately upstream.

Yakama Nation Appendix E
Wapato Reach Assessment ReportE‐10
April 2012ICF 703.11
Channel Roughness Elements at River Mile 95.4
Project Type: Channel Roughness Elements and Riparian Planting
Project ID: SR4 RM 95.4
Location: RM 95.4 to 95.1
Project Objective: Encourage development of a meandering or mildly wandering planform instead of existing braided/branched planform by converting broad gravel bars to vegetated channel islands.
Description: Promote development of single dominant meandering channel instead of existing braided/and branched planform that developed after recent channel avulsion. Encourage deposition of sediment in selected secondary channel by constructing flood fence structures at the head of existing channel split, and re‐vegetate the adjacent islands and exposed channel margins downstream of the structures. Selected channels would function as a secondary channel during high flow events (e.g., bankfull flow and greater) but would not convey flow during most of the year. Project includes planting cottonwoods and willows behind flood fence structures and along the outer portions of the islands, and plant conifers where appropriate.
Biological Benefit: Fish biological benefits are from creating a channel with a vegetated, root protected bank, and structure along the channel margins. The action will move the broad and shallow existing conditions to a more narrowly defined channel and provide better in‐stream habitat during low flow periods. In addition, this project will promote the retention of fine sediment into the floodplain, thereby reducing the amount of in‐channel fine sediment.
Construction: Install 10 flood fence structures at various locations. Each flood fence consists of 26 to 34 logs that are 15 feet long and 12 inch dbh buried 2/3 into the channel bed or bar. Re‐vegetate 5 acres of former channel and unvegetated islands. Access will be from Evergreen Highway and Quick Lane on left bank and assumes excavator is allowed to cross existing flowing channels. Assumes logs will be delivered from staging area to specific locations on the river with a helicopter. Assumes excavations will be allowed with no cofferdams required.
Cost Estimate $200,000‐ Cost estimate includes 5% for mobilization, 30% for design and permitting, 10% for construction management, and 30% contingency (of subtotal of construction items). Cost estimate assumes the project would be competitively bid and awarded to a private contractor who is required to pay Washington State prevailing wage rates. The construction cost could be reduced if Yakama Nation performed the work using in‐house labor and equipment.
Related Projects This project is a component of a much larger project for this vicinity that includes removal of existing bank riprap and residences in floodplain, and replacement of an existing highway bridge with a more appropriately sized structure. See TAG projects #15 and 16. Due to multiple private property ownership and public works issues, the larger project was not evaluated as part of this analysis. But the value of further evaluation of the larger project is clearly recognized and encouraged for future work as the benefits to fish could be considerable through the reconnection of floodplain channels downstream of the bridge and retention of fine sediment into the floodplain.
Notes: More analysis is needed to determine which channel (existing or pre 2011) is the more appropriate to be the single dominant channel given overall river morphology. Likely response time: 20 years (all objectives)5 years (effect on channel planform).

Yakama Nation Appendix E
Wapato Reach Assessment ReportE‐11
April 2012ICF 703.11
Riparian Revegetation at River Mile 94.45
Project Type: Riparian Revegetation
Project ID: SR4 RM 94.45
Location: RM 94.45– 93.0 right bank
Project Objective: Riparian revegetation
Description: R2 model results indicated that this area would be conducive to stabilization. However, there is evidence of much scouring here that would make establishing vegetation difficult. It could be possible to plant riparian vegetation on the right bank of the right channel to shade and stabilize.
Biological Benefit: Riparian vegetation will reduce bank erosion and increase habitat diversity through wood recruitment to the channel and provide root protected bank structure. Short‐term benefits of riparian revegetation are the trapping and storage of silt and sand originating from the channel and from overland sources, thereby reducing the quantity of fine sediment in the channel affecting survival at multiple life stages. Wood recruitment to the channel may be from single trees entering the channel or larger quantities following channel avulsions. Larger quantities of large pieces included can provide affect channel processes forming pools or “metering” flow through side channels. These are longer term benefits.
Landowner Portions on Yakama Nation Wildlife and Buena
Related Projects: This project could be combination with recommended habitat restoration project SR4 RM 93.5 to promote development of single dominant meandering channel instead of existing braided/branched planform that developed after recent channel avulsion by constructing a flood fence structure at the head of existing channel splits and revegetating islands below them” Perhaps cottonwood along the outer portions and some conifers along the crest. This project would occur near areas identified as having a high priority for protection/preservation at RM 94.8 through 92.5.
Notes: Response time: 20 years (all objectives)

Yakama Nation Appendix E
Wapato Reach Assessment ReportE‐12
April 2012ICF 703.11
Channel Roughness Elements at River Mile 93.5
Project Type: Channel Roughness Elements and Riparian Planting
Project ID: SR4 RM 93.5
Location: RM 93.5 to 92.5
Project Objective: Encourage development of a meandering or mildly wandering planform instead of existing braided/branched planform by converting broad gravel bars to vegetated channel islands.
Description: Promote development of single dominant meandering channel instead of existing braided/and a branched planform. Encourage deposition of sediment in selected channels by constructing flood fence structures at the head of existing channel splits, and re‐vegetate adjacent islands and exposed channel margins downstream of the structures. Selected channels that would function as secondary channels during high flow events (e.g., bankfull flow and greater) but would not convey flow during most of the year. Project includes planting cottonwoods and willows behind flood fence structures and along the outer portions of the islands, and plant conifers where appropriate. Flood fencing structures and plantings will be done at multiple locations through this area.
Biological Benefits:
Fish biological benefits are from creating a channel with a vegetated, root protected bank, and structure along the channel margins. The action will move the broad and shallow existing conditions to a more narrowly defined channel and provide better in‐stream habitat during low flow periods. In addition, this project will promote the retention of fine sediment into the floodplain, thereby reducing the amount of in‐channel fine sediment.
Strategies: Install 20 flood fence structures at various locations. Each flood fence consists of 26 to 34 logs that are 15 feet long and 12 inch dbh buried 2/3 into the channel bed or bar. Re‐vegetate 20 acres of former channel and unvegetated islands. Access will be from road and then WDFW boat launch site on left bank and assumes excavator is allowed to cross existing flowing channels. Assumes logs will be delivered from staging area to specific locations on the river with a helicopter. Assumes excavations will be allowed with no cofferdams required.
Cost Estimate $450,000 ‐ Cost estimate includes 5% for mobilization, 30% for design and permitting, 10% for construction management, and 30% contingency (of subtotal of construction items). Cost estimate assumes the project would be competitively bid and awarded to a private contractor who is required to pay Washington State prevailing wage rates. The construction cost could be reduced if Yakama Nation performed the work using in‐house labor and equipment.
Notes: Likely response time: 20 years (all objectives); 5 years (effect on channel planform).

Yakama Nation Appendix E
Wapato Reach Assessment ReportE‐13
April 2012ICF 703.11
Subreach 3
Instream Wood at River Mile 90.3
Project Type: Instream Wood
Project ID: SR3 RM 90.3
Location: RM 90.3 to 90.1
Project Objective: Add complexity and structure within the channel
Description: Place individual trees and small clusters of 2 and 3 trees (with root wad and as much of the branches as possible and with boulders for anchors attached with hemp or manila rope) in the deep pools formed along the Touchet beds.
Biological Benefit: Fish biological benefits are the addition of in‐stream wood structure to existing pools in a section of the river that does not have much structure.
Construction: Install 20 individual trees or small clusters of trees along the length of the pool. Include boulder anchors attached by natural fiber rope. Access to site is difficult from right bank side, which is YN ownership. Access to site is easier from left bank side if a crane is used to lower log structures into river, but that side is privately owned. Assume private landowner is willing to allow construction access for a small access easement fee. Assume structures can be placed in actively flowing channel with no cofferdam required. Assume structures placed by large crane and diver required to release rigging when placed.
Cost Estimate: $100,000 ‐ Cost estimate includes 5% for mobilization, 30% for design and permitting, 10% for construction management, and 30% contingency (of subtotal of construction items). Cost estimate assumes the project would be competitively bid and awarded to a private contractor who is required to pay Washington State prevailing wage rates. The construction cost could be reduced if Yakama Nation performed the work using in‐house labor and equipment.
Notes: This project could occur in multiple locations along the river, see output from geomorphic and biological assessment for other identified sites. This site was selected as good initial LWD enhancement project because of proximity of spawning fall Chinook and the lack of existing wood. Response time: immediate after construction (all objectives).

Yakama Nation Appendix E
Wapato Reach Assessment ReportE‐14
April 2012ICF 703.11
Levee Removal at River Mile 89.7
Habitat restoration project SR5 RM 89.7 facing downstream toward levee
Project Type: Levee Removal
Project ID: SR3 RM 89.7
Location: RM 89.7 to 89.3
Project Objective: Increase floodplain flow conveyance, riparian habitat, and channel migration zone extents by removing a levee.
Description: The existing levee is immediately adjacent to the main channel along the right bank and the project would remove the levee, creating access to a vast area of low elevation floodplain and secondary channels that may be connected across a range of flows. The very upstream end of floodplain channel may only be connected during high flow whereas the lower section objective is to connect over a wider range of flows to have fish use into mid to late June.
Biological Benefit: Fish biological benefits are from improving connection to existing floodplain channel behind levee and establishing a secondary channel downstream of the levee that could be accessible throughout the winter and spring months and into mid‐June. In addition, this project will promote the retention of fine sediment into the floodplain, thereby reducing the amount of in‐channel fine sediment. An additional benefit may be improved connection of groundwater sources to provide localized thermal refuge. Vaccaro (2011) noted several cooling structures in this general section of the river.
Construction: Remove 3,500 linear feet of existing levee and riprap along the toe of channel. Re‐vegetate 10 acres of riparian floodplain that is currently agricultural land. Assumes all levee removal work can be done above the ordinary high water line. Assumes riprap removal below ordinary high water line will require cofferdams to isolate work from actively flowing channel. Access is from adjacent roads. Assumes all removed material can be disposed of on nearby agricultural land with no disposal fee.
Cost Estimate: $350,000 ‐ Cost estimate includes 5% for mobilization, 40% for design and permitting, 15% for construction management, and 30% contingency (of subtotal of

Yakama Nation Appendix E
Wapato Reach Assessment ReportE‐15
April 2012ICF 703.11
construction items). Cost estimate assumes the project would be competitively bid and awarded to a private contractor who is required to pay Washington State prevailing wage rates. The construction cost could be reduced if Yakama Nation performed the work using in‐house labor and equipment. Cost could be reduced by only breaching strategic parts of the levee instead of removing entire levee, but such an approach would not accomplish a process‐based restoration goal. Cost would increase significantly, possibly double, if excavated material had to be hauled to an off‐site disposal area.
Related Projects: This project coincides with TAG project #8.
Notes: Levee is old and serves no purpose. Land immediately behind levee is YN ownership. Response time: immediate after construction (all objectives).

Yakama Nation Appendix E
Wapato Reach Assessment ReportE‐16
April 2012ICF 703.11
Riparian Revegetation at River Mile 81.7
Project Type: Riparian Revegetation
Project ID: SR3 RM 81.7
Location: RM 81.7– 80.5 Right and left banks
Project Objective: Riparian revegetation
Description: Riparian revegetation on both banks
Biological Benefit: Riparian vegetation will reduce bank erosion and increase habitat diversity through wood recruitment to the channel and provide root protected bank structure. Short‐term benefits of riparian revegetation are the trapping and storage of silt and sand originating from the channel and from overland sources, thereby reducing the quantity of fine sediment in the channel affecting survival at multiple life stages. Wood recruitment to the channel may be from single trees entering the channel or larger quantities following channel avulsions. Larger quantities of large pieces included can provide affect channel processes forming pools or “metering” flow through side channels. These are longer term benefits.
Related Projects: This riparian work could be completed in combination with SR3 RM 80.1 ‐ Increase floodplain flow conveyance, riparian habitat, and channel migration zone extents by removing a levee.
Notes: Likely response time: 20 years (all objectives).

Yakama Nation Appendix E
Wapato Reach Assessment ReportE‐17
April 2012ICF 703.11
Levee Removal at River Mile 80.1
Habitat restoration project SR5 RM 80.1 facing downstream towards levee on right bank of river
Project Type: Levee Removal
Project ID: SR3 RM 80.1
Location: RM 80.1 to 80.0
Project Objective: Increase floodplain flow conveyance, riparian habitat, and channel migration zone extents by removing a levee.
Description: The project would remove an existing levee, thereby creating access to an area of low elevation floodplain and high flow secondary channels. The existing levee appears to serve no purpose because it has been breached at the downstream end during a high flow event many years ago.
Biological Benefit: Fish biological benefits are from improving connectivity to floodplain channels and downstream of the levee. Removing the entire length of the levee will ensure the existing secondary channel remains connected and provide some overbank flow during floods. Removing the levee would likely allow more flood flow to the wetland habitat downstream. In addition, this project will promote the retention of fine sediment into the floodplain, thereby reducing the amount of in‐channel fine sediment.
Construction: Remove 1,000 linear feet of existing levee and riprap along the toe of year‐round secondary channel. Assumes all levee removal work can be done above the ordinary high water line. Assumes riprap removal below ordinary high water line will require cofferdams to isolate work from actively flowing channel. Access is from adjacent roads. Assumes all removed material can be disposed of on nearby agricultural land with no disposal fee.

Yakama Nation Appendix E
Wapato Reach Assessment ReportE‐18
April 2012ICF 703.11
Cost Estimate: $200,000‐ Cost estimate includes 5% for mobilization, 40% for design and permitting, 10% for construction management, and 30% contingency (of subtotal of construction items). Cost estimate assumes the project would be competitively bid and awarded to a private contractor who is required to pay Washington State prevailing wage rates. The construction cost could be reduced if Yakama Nation performed the work using in‐house labor and equipment. Cost could be reduced by only breaching strategic parts of the levee instead of removing entire levee. Cost would increase significantly, possibly double, if excavated material had to be hauled to an off‐site disposal area.
Notes: Levee is located on a side channel that the top end joins to the river immediately downstream of the mouth of Toppenish Creek. The mouth of Toppenish Creek should be monitored to ensure that the side channel does not capture all flow from Toppenish Creek. Levee is old and serves no purpose. Land immediately behind levee is YN ownership and downstream end of levee is already breached. Response time: immediate after construction (all objectives).
Riparian Revegetation at River Mile 80.5
Project Type: Riparian Revegetation
Project ID: SR3 RM 80.5
Location: RM 80.5 ‐78.2
Project Objective: Riparian revegetation
Description: Riparian revegetation along open channel. This site is part of the Satus Wildlife Area which is owned by the Yakama Nation, making it appropriate for large‐scale restoration.
Biological Benefit: Riparian vegetation will reduce bank erosion and increase habitat diversity through wood recruitment to the channel and provide root protected bank structure. Short‐term benefits of riparian revegetation are the trapping and storage of silt and sand originating from the channel and from overland sources, thereby reducing the quantity of fine sediment in the channel affecting survival at multiple life stages. Wood recruitment to the channel may be from single trees entering the channel or larger quantities following channel avulsions. Larger quantities of large pieces included can provide affect channel processes forming pools or “metering” flow through side channels. These are longer term benefits.
Related Projects: This riparian work could occur in combination with recommended project # SR3 RM 80.1 to promote the engagement of side channel across a wide range of flows by removing the entire levee and add structure to provide overbank flows during spring. A levee here was breached in a recent flood, but this breach should be expanded to encourage greater river‐floodplain interaction. Greater flood flows across this floodplain would reactive some older channels and may also diversify floodplain habitat by promoting the natural regeneration of riparian vegetation.
Notes: Likely response time: 20 years (all objectives).

!(
!(
!(
!(
!(
!(
!(
!(
!(
!(
!(
!(
!(
!(
!(
!(
!(
!(
!(
!(
!(
!(
!(
!(
!(
!(
!(
!(
!(
!(
!(
!(
!(
!(
!(
!(
!(
!(
!(
!(
!(
!(
!(
!(
!(
!(
!(
!(
!(
!(
!(
!(
!(
!(
!(
!(
!(
!(
!(
!(
!(
!(
!(
!(
!(!(
!(
!(
!(
!(
!(
!(
!(
!(
!(
!(
!(
!(
!(
!(
!(
!(
!(
!(
!(
!(
!(
!(
!(
!(
!(
!(
!(
!(
!(
!(
!(
!(
!(
!(
!(
!(
!(
!(
!(
!(
!(
!(
!(
!(
!(
!(
!(
!(!(
!(
!(
!(
!(
!(
SR5 RM105.0B
SR5 RM105.0A
SR5 RM105.0CSR5 RM105.2A
SR5 RM105.2B
RM104
RM103
Figure E-1aRecommended Projects
Wapato Reach Assessment - Phase 2
C:\U
sers\
1943
5\Doc
umen
ts\Lo
cal G
IS\00
703.1
1_W
apato
Reac
h\Map
docs
\Rea
chAs
sess
mentR
eport
\FigE
1_Re
c_Pr
ojects
.mxd
DBS
4/13
/2012
"0 600Feet


!(
!(
!(
!(
!(
!(
!(
!(
!(
!(
!(
!(
!(
!(
!(
!(
!(
!(
!(
!(
!(
!(
!(
!(
!(
!(
!(
!(
!(
!(
!(
!(
!(
!(
!(
!(
!(
!(
!(
!(
!(
!(
!(
!(
!(
!(
!(
!(
!(
!(
!(
!(
!(
!(
!(
!(
!(
!(
!(
!(
!(
!(
!(
!(
!(!(
!(
!(
!(
!(
!(
!(
!(
!(
!(!(
!(
!(
!(
!(
!(
!(
!(
!(
!(
!(
!(
!(
!(
!(
!(
!(
!(
!(
!(
!(
!(
!(
!(
!(
!(
!(
!(
!(
!(
!(
!(
!(
!(
!(
!(
!(
!(
!(
!(
!(
!(
!(
!(
!(
SR5 RM102.9A
SR5 RM102.9B
SR5 RM102.0A
SR5 RM102.0B
SR5 RM102.0CSR5 RM102.3
SR5 RM105.2A
RM102
RM101
Figure E-1bRecommended Projects
Wapato Reach Assessment - Phase 2
C:\U
sers\
1943
5\Doc
umen
ts\Lo
cal G
IS\00
703.1
1_W
apato
Reac
h\Map
docs
\Rea
chAs
sess
mentR
eport
\FigE
1_Re
c_Pr
ojects
.mxd
DBS
4/13
/2012
"0 700
Feet


!(
!(
!(
!(
!(
!(
!(
!(
!(
!(
!(
!(
!(
!(
!(
!(
!(
!(
!(
!(
!(
!(
!(
!(
!(
!(
!(
!(
!(
!(
!(
!(
!(
!(
!(
!(
!(
!(
!(
!(
!(
!(
!(
!(
!(
!(
!(
!(
!(
!(
!(
!(
!(
!(
!(
!(
!(
!(
!(
!(
!(
!(
!(
!(
!(!(
!(
!(
!(
!(
!(
!(
!(
!(
!(
!(
!(
!(
!(
!(
!(
!(
!(
!(
!(
!(
!(
!(
!(
!(
!(
!(
!(
!(
!(
!(
!(
!(
!(
!(
!(
!(
!(
!(
!(
!(
!(
!(
!(
!(
!(
!(
!(
!(
!(
!(
!(
!(
!(
!(
SR5 RM 98.6A
SR5 RM 98.6B
RM98
Figure E-1cRecommended Projects
Wapato Reach Assessment - Phase 2
C:\U
sers\
1943
5\Doc
umen
ts\Lo
cal G
IS\00
703.1
1_W
apato
Reac
h\Map
docs
\Rea
chAs
sess
mentR
eport
\FigE
1_Re
c_Pr
ojects
.mxd
DBS
4/13
/2012
"0 600
Feet


!(
!(
!(
!(
!(
!(
!(
!(
!(
!(
!(
!(
!(
!(
!(
!(
!(
!(
!(
!(
!(
!(
!(
!(
!(
!(
!(
!(
!(
!(
!(
!(
!(
!(
!(
!(
!(
!(
!(
!(
!(
!(
!(
!(
!(
!(
!(
!(
!(
!(
!(
!(
!(
!(
!(
!(
!(
!(
!(
!(
!(
!(
!(
!(
!(!(
!(
!(
!(
!(
!(
!(
!(
!(
!(
!(
!(
!(
!(
!(
!(
!(
!(
!(
!(
!(
!(
!(
!(
!(
!(
!(
!(
!(
!(
!(
!(
!(
!(
!(
!(
!(
!(
!(
!(
!(
!(
!(
!(
!(
!(
!(
!(
!(
!(
!(
!(
!(
!(
!(
SR4 RM 96.9
SR4 RM 95.4
RM97
RM96
RM95
Figure E-1dRecommended Projects
Wapato Reach Assessment - Phase 2
C:\U
sers\
1943
5\Doc
umen
ts\Lo
cal G
IS\00
703.1
1_W
apato
Reac
h\Map
docs
\Rea
chAs
sess
mentR
eport
\FigE
1_Re
c_Pr
ojects
.mxd
DBS
4/13
/2012
"0 600
Feet


!(
!(
!(
!(
!(
!(
!(
!(
!(
!(
!(
!(
!(
!(
!(
!(
!(
!(
!(
!(
!(
!(
!(
!(
!(
!(
!(
!(
!(
!(
!(
!(
!(
!(
!(
!(
!(
!(
!(
!(
!(
!(
!(
!(
!(
!(
!(
!(
!(
!(
!(
!(
!(
!(
!(
!(
!(
!(
!(
!(
!(
!(
!(
!(
!(!(
!(
!(
!(
!(
!(
!(
!(
!(
!(
!(
!(
!(
!(
!(
!(
!(
!(
!(
!(
!(
!(
!(
!(
!(
!(
!(
!(
!(
!(
!(
!(
!(
!(
!(
!(
!(
!(
!(
!(
!(
!(
!(
!(
!(
!(
!(
!(
!(
!(
!(
!(
!(
!(
!(
SR4 RM 93.5A
SR4 RM 93.5BSR4 RM94.5RM94
RM93
Figure E-1eRecommended Projects
Wapato Reach Assessment - Phase 2
C:\U
sers\
1943
5\Doc
umen
ts\Lo
cal G
IS\00
703.1
1_W
apato
Reac
h\Map
docs
\Rea
chAs
sess
mentR
eport
\FigE
1_Re
c_Pr
ojects
.mxd
DBS
4/13
/2012
"0 600
Feet


!(
!(
!(
!(
!(
!(
!(
!(
!(
!(
!(
!(
!(
!(
!(
!(
!(
!(
!(
!(
!(
!(
!(
!(
!(
!(
!(
!(
!(
!(
!(
!(
!(
!(
!(
!(
!(
!(
!(
!(
!(
!(
!(
!(
!(
!(
!(
!(
!(
!(
!(
!(
!(
!(
!(
!(
!(
!(
!(
!(
!(
!(
!(
!(
!(!(
!(
!(
!(
!(
!(
!(
!(
!(
!(
!(
!(
!(
!(
!(
!(
!(
!(
!(
!(
!(
!(
!(
!(
!(
!(
!(
!(
!(
!(
!(
!(
!(
!(
!(
!(
!(
!(
!(
!(
!(
!(
!(
!(
!(
!(
!(
!(
!(
!(
!(
!(
!(
!(
!(
SR3 RM 90.3
SR3 RM 89.7
RM90
RM89
Figure E-1fRecommended Projects
Wapato Reach Assessment - Phase 2
C:\U
sers\
1943
5\Doc
umen
ts\Lo
cal G
IS\00
703.1
1_W
apato
Reac
h\Map
docs
\Rea
chAs
sess
mentR
eport
\FigE
1_Re
c_Pr
ojects
.mxd
DBS
4/13
/2012
"0 600
Feet


!(
!(
!(
!(
!(
!(
!(
!(
!(
!(
!(
!(
!(
!(
!(
!(
!(
!(
!(
!(
!(
!(
!(
!(
!(
!(
!(
!(
!(
!(
!(
!(
!(
!(
!(
!(
!(
!(
!(
!(
!(
!(
!(
!(
!(
!(
!(
!(
!(
!(
!(
!(
!(
!(
!(
!(
!(
!(
!(
!(
!(
!(
!(
!(
!(!(
!(
!(
!(
!(
!(
!(
!(
!(
!(
!(
!(
!(
!(
!(
!(
!(
!(
!(
!(
!(
!(
!(
!(
!(
!(
!(
!(
!(
!(
!(
!(
!(
!(
!(
!(
!(
!(
!(
!(
!(
!(
!(
!(
!(
!(
!(
!(
!(!(
!(
!(
!(
!(
!(
SR3 RM87.7
SR3 RM87.7 RM86
RM85
Figure E-1gRecommended Projects
Wapato Reach Assessment - Phase 2
C:\U
sers\
1943
5\Doc
umen
ts\Lo
cal G
IS\00
703.1
1_W
apato
Reac
h\Map
docs
\Rea
chAs
sess
mentR
eport
\FigE
1_Re
c_Pr
ojects
.mxd
DBS
4/13
/2012
"0 600Feet


!(
!(
!(
!(
!(
!(
!(
!(
!(
!(
!(
!(
!(
!(
!(
!(
!(
!(
!(
!(
!(
!(
!(
!(
!(
!(
!(
!(
!(
!(
!(
!(
!(
!(
!(
!(
!(
!(
!(
!(
!(
!(
!(
!(
!(
!(
!(
!(
!(
!(
!(
!(
!(
!(
!(
!(
!(
!(
!(
!(
!(
!(
!(
!(
!(!(
!(
!(
!(
!(
!(
!(
!(
!(
!(
!(
!(
!(
!(
!(
!(
!(
!(
!(
!(
!(
!(
!(
!(
!(
!(
!(
!(
!(
!(
!(
!(
!(
!(
!(
!(
!(
!(
!(
!(
!(
!(
!(
!(
!(
!(
!(
!(
!(
!(
!(
!(
!(
!(
!(
SR3 RM81.7A
SR3 RM81.7B
RM81
Figure E-1hRecommended Projects
Wapato Reach Assessment - Phase 2
C:\U
sers\
1943
5\Doc
umen
ts\Lo
cal G
IS\00
703.1
1_W
apato
Reac
h\Map
docs
\Rea
chAs
sess
mentR
eport
\FigE
1_Re
c_Pr
ojects
.mxd
DBS
4/13
/2012
"0 600
Feet


!(
!(
!(
!(
!(
!(
!(
!(
!(
!(
!(
!(
!(
!(
!(
!(
!(
!(
!(
!(
!(
!(
!(
!(
!(
!(
!(
!(
!(
!(
!(
!(
!(
!(
!(
!(
!(
!(
!(
!(
!(
!(
!(
!(
!(
!(
!(
!(
!(
!(
!(
!(
!(
!(
!(
!(
!(
!(
!(
!(
!(
!(
!(
!(
!(!(
!(
!(
!(
!(
!(
!(
!(
!(
!(
!(
!(
!(
!(
!(
!(
!(
!(
!(
!(
!(
!(
!(
!(
!(
!(
!(
!(
!(
!(
!(
!(
!(
!(
!(
!(
!(
!(
!(
!(
!(
!(
!(
!(
!(
!(
!(
!(
!(
!(
!(
!(
!(
!(
!(
SR3 RM 80.1
SR2 RM80.5
RM79
RM78
Figure E-1iRecommended Projects
Wapato Reach Assessment - Phase 2
C:\U
sers\
1943
5\Doc
umen
ts\Lo
cal G
IS\00
703.1
1_W
apato
Reac
h\Map
docs
\Rea
chAs
sess
mentR
eport
\FigE
1_Re
c_Pr
ojects
.mxd
DBS
4/13
/2012
"0 600
Feet

Copyright © 2022 FDOKUMEN