WALLAWAL.CDR from CorelDRAW! - Washington State ...
150
COUNTY PROFILE ON RISK AND PROTECTION FOR SUBSTANCE ABUSE PREVENTION PLANNING IN WALLA WALLA COUNTY Washington State Department of Social and Health Services Division of Alcohol and Substance Abuse Office of Research and Data Analysis October 1996
-
Upload
khangminh22 -
Category
Documents
-
view
5 -
download
0
Transcript of WALLAWAL.CDR from CorelDRAW! - Washington State ...
COUNTY PROFILE ON RISK AND PROTECTION
FOR SUBSTANCE ABUSE PREVENTION PLANNING
IN
WALLA WALLA COUNTY
Washington State Department ofSocial and Health Services
Division of Alcohol andSubstance Abuse
Office of Research andData Analysis
October 1996
Additional copies can be obtained from:
Research InvestigatorDivision of Alcohol and Substance AbuseDepartment of Social and Health Services
PO Box 45330Olympia, Washington 98504-5330
(360) 438-8765
COUNTY PROFILE FORSUBSTANCE ABUSE PREVENTION PLANNING
WALLA WALLA COUNTY
Joseph Kabel, Ph.D.Penelope P. Howards, M.S.
Elizabeth Kohlenberg, Ph. D.Robert Flewelling, Ph. D.Margaret Shaklee, B.A.Susanna Clarkson, M.S.
Office of Research and Data AnalysisDepartment of Social and Health Services
Olympia, Washington 98504-5204
Department of Social and Health ServicesLyle Quasim, Secretary
Research and Data AnalysisTimothy R. Brown, Ph.D., Director
in conjunction with
Division of Alcohol and Substance AbuseKenneth D. Stark, Director
Mary Ann LaFazia, M.S.W., Supervisor ofFamily and Prevention Services
Antoinette Krupski, Ph.D., Research Supervisor
Funding for this research was provided by theCenter for Substance Abuse Prevention,
Substance Abuse and Mental Health Services Administration,U.S. Department of Health and Human Services
Contract No. 277-94-1014-WA

TABLE OF CONTENTS
EXECUTIVE SUMMARY
CHAPTERS
1 INTRODUCTION........................................................................................ 1-1
2 RISK AND PROTECTIVE FACTORS IN THIS REPORT............................ 2-1
3 PLANNING FOR PREVENTION USING RISK AND PROTECTION .......... 3-1
4 UNDERSTANDING AND USING THE INFORMATION COLLECTED........ 4-1
5 INDICATOR DATA FOR RISK FACTORS.................................................. 5-1
6 INDICATOR DATA FOR PROTECTIVE FACTORS ................................... 6-1
7 ADDITIONAL INDICATORS FOR SUBSTANCE ABUSE AND
OTHER PROBLEM BEHAVIORS............................................................... 7-1
8 STANDARDIZED MEASURES................................................................... 8-1
APPENDICES
A SOURCES .................................................................................................A-1
B COUNTING AOD-RELATED DEATHS.......................................................B-1
C STUDIES IDENTIFYING RISK AND PROTECTIVE FACTORS FOR SUBSTANCE ABUSE.......................................................................C-1
D EMPIRICAL RESEARCH SHOWING THE EFFECTS OF PROTECTIVE FACTORS ..........................................................................D-1
E HISTORY OF SUBSTANCE ABUSE PREVENTION INWASHINGTON STATE ..............................................................................E-1
F LIST OF INDICATORS, YEARS OF AVAILABLE DATA, ANDGEOGRAPHIC LEVEL OF COLLECTION .................................................F-1
G REFERENCES.......................................................................................... G-1
H DETERMINING “COUNTIES LIKE US” ......................................................H-1
I COUNTIES FOR WHICH REPORTED ARREST RATES AREBASED ON LESS THAN 80 PERCENT OF THE POPULATION ................ I-1
J ANNUAL DATA TABLES ........................................................................... J-1
ACKNOWLEDGEMENTS
Many individuals have contributed to the successful completion of this report, includingproject staff and associates who worked on this report and representatives of otheragencies who provided data.
As researchers during the data collection phase of this project, Beverly Hemplemanand Brendan West shared in the work to track down and obtain data from manydifferent agencies. This often involved persistent contact with many different people,careful review of data obtained, and follow-up calls for additional clarity. As projectcoordinator for the first year and a half, Debbie Clegg provided excellent administrative,analytical, and production support. Angela Zechmann from the Department of Healthplayed a major role in collecting and publishing data for the Community Public Healthand Safety Networks. Since that state-funded project and this federally-funded projectwere joined for a year, her contributions are present in this report as well.
We appreciate the hard work by Michael Arthur and Tom Howze from the SocialDevelopment Research Group (SDRG) at the University of Washington. As technicalconsultants to the six-state federal contract that supported the development of thisreport, they have played a major role in the collection of consistent data across thestates and the validation of indicator data across risk factors. Dr. Arthur also providedthe average scale scores from the Washington State Survey of Adolescent Behaviorsfor all of the risk and protective factors where indicator data was not available.
Database designers and programmers Ken Krupski and Curtis Mack in the Office ofResearch and Data Analysis and Mike Mohrman from the Department of Health wereinstrumental in assimilating source data from over 30 different databases. Producingreliable county estimates of event and population totals from data that were provided ina variety of geographic configurations (zip codes, police jurisdictions, school districts,census tracts, etc.) was a monumental achievement.
We thank University of Washington professors J. David Hawkins and Richard Catalanofor their theoretical leadership in the prevention field and their strong commitment toapplication of their research in the field. Their untiring efforts to reduce the effects ofsubstance use among our youth are greatly respected.
Finally, without data there would be no report. We thank the following persons from allthe agencies and organizations that provided data to this project:
R. Peggy Smith and Helen ShreveDepartment of Corrections,Planning and Research
Sharon Estee and Laura HarmonDepartment of Health,Center for Health Statistics
Vicki HohnerDepartment of Health,Office of Hospital and Patient Data Systems
Dick HoskinsDepartment of Health,Geographic Information Systems
Leah Cochran and Gary BashuckDepartment of Health,Sexually Transmitted Disease Services
Steve BowmanDepartment of Health,Division of Community and Family Health

Cynthia Ellingson and John Ames,Department of Social and Health Services,Children’s Administration
Fritz WredeDepartment of Social and Health Services,Division of Alcohol and Substance Abuse
Valinda Scheibert, John Yoachim, and ChrisWilliamsDepartment of Social and Health Services,Office of Research and Data Analysis
Doug MahOffice of Financial Management,Statistical Analysis Center
Theresa LoweOffice of Financial Management,Forecasting Division
Tim Norris and Gary BodeutcshEmployment Security Department,Labor Market and Economic Analysis
Ken CrookerDepartment of Labor and Industries,Office of Crime Victim Compensation
Julie BakerDepartment of Community Trade andEconomic Development,Emergency Housing Services
Diana Harrington and Theresa BlaseLiquor Control Board
Michael L. CurtisOffice of the Administrator for the Courts
Steve Aos and Robert BarnoskiWashington Institute for Public Policy
Ramona Schultz and Betty MarcelynasOffice of Superintendent for PublicInstruction,Child Nutrition
Ed StrozykOffice of Superintendent for PublicInstruction,Information Services
Duncan McQuarrieOffice of the Superintendent for PublicInstruction,Instructional Programs
John SteigerSentencing Guidelines Commission
Lieutenant Kim Zanger, Joan Smith,and Doris PingelWashington State Patrol,Identification and Criminal History Section
Charlie Saibel and Phillip SalzbergWashington Traffic Safety Commission
Tracy ReynaudWashington Association of Sheriffs andPolice Chiefs
Glenn CrellinWashington Center for Real EstateResearch
Six State Archival Data Collaborators:Judy Donovan and Patty Martin, KansasSteve Harrison and Lynn McLeod, UtahLarry Didier and Clint Goff, OregonJamie Clough and Rachel Cyr-Henderson,MaineRebecca Boland, South Carolina
Youth Risk Assessment DatabaseWorkgroup (for the Community PublicHealth and Safety Networks)Lillian BensleyDavid BrennaTimothy BrownRobert FlewellingElizabeth KohlenbergRichard HoskinsDavid PavelchekJuliet Van EenwyckLinc WeaverAngela Zechmann
EXECUTIVE SUMMARY
This Report Provides:
• a presentation of the risk and protective factor framework for substance abuseprevention
• a discussion of some newer promising approaches to substance abuse prevention,
• graphic and numeric display of county data on risk and protective factors for alcoholand other drug abuse
• county comparisons to state numbers and numbers for a group of similar counties
• guidelines for interpreting and using county data for prevention planning
Context for Substance Abuse Research and the Need for PreventionServices
“...for every dollar spent inpreventing illicit drug use,there was a fifteen dollarsavings in dealing with theconsequences of drug useand addiction.”
Substance abuse costs money, causes harm and isincreasing among youth. National estimates of the directmonetary costs of alcohol and illicit drug use approach$200 billion (Rice, Kelman, and Miller, 1991; Harwood,1985). In Washington State, results from the 1995school-based Washington State Survey of AdolescentBehaviors show that rates of past month marijuana usedoubled between 1992 and 1995. During the sameperiod, binge drinking and the experimental use oftobacco, marijuana, and other illicit drugs also roseamong Washington students. The ongoing demand foreffective prevention programs that are well designed andproperly targeted is clear.
More positively, other forms of substance use havedeclined. Washington’s school survey showed that,between 1992 and 1995, greater numbers of youth areabstaining from inhalants and over-the-counter drugs.Abstention rates for alcohol have remained stable.Furthermore, levels of illicit drug use among youth are stillwell below levels encountered in the late 1970s and early1980s.
Such findings show that substance abuse can beimpacted and suggest that prevention efforts are animportant component in reducing the social and economiccosts of substance abuse. Substance abuse preventionis also cost-effective. Recent research suggests that“...for every dollar spent in preventing illicit drug use, therewas a fifteen dollar savings in dealing with theconsequences of drug use and addiction (Kim et al., 1995)."
Defining an Approach for Substance Abuse Prevention
”Risk factors” arecharacteristics which areassociated with increasesin substance abuse.
“Protective factors” arecharacteristics whichreduce or moderate theinfluence of risk factors.
DASA has adopted a riskand protective factor-based framework as thefoundation of its statewideprevention planning.
Choices for prevention approaches and specific strategies arenumerous and diverse. What is needed is a framework that canhelp prevention program planners make informed decisionsconcerning which strategies to implement and where preventionprograms are most needed. Recent developments in preventionscience have shown that there are characteristics of individualsand their familial and social environments that seem to affect thelikelihood of negative outcomes such as substance abuse. Justas in research on heart attacks, stroke and cancer, thesecharacteristics are divided into “risk” and “protective” factors.
Risk factors are characteristics of people or their family, schooland community environments which are empirically associatedwith increases in substance abuse. Other characteristicsfunction as protective factors, which serve to reduce ormoderate the influence of risk factors.
In the late 1980’s, Professors J. David Hawkins, RichardCatalano and their associates at the University of Washingtonreviewed and synthesized three decades of research on risk andprotective factors for adolescent substance abuse. Theapplication of this research-guided framework to substanceabuse prevention calls for interventions which are designed toreduce levels of risk and enhance levels of protection, particularlyfor those exposed to multiple risks. This framework has beenadopted by the Division of Alcohol and Substance Abuse (DASA)as the foundation of its statewide prevention planning approach.
Local Information Needs for Prevention Planning
Local prevention plannersneed local measures ofrisk and protective factors
In order to effectively develop and target prevention programsusing the risk and protective factor approach, local preventionplanners must be able to assess local levels of such factors. Ofcourse, local assessment of risk and protection requires localmeasures of risk and protection.
This report provides such local measures in the form ofindicators, or proxy measures. In total, 56 indicators of riskfactors and 10 additional indicators of substance abuse andother problem behaviors were identified and collected from overthirty different existing data sources. For risk and protectivefactors where county-level indicators could not be identified,regional measures from the 1995 school survey were obtained.
.
Content and Organization of this Report
Comprehensively, this report provides county-levelprevention planners with uniformly collected data on thecounty’s known risk factors for alcohol and drug abuseand the prevalence of other behavior problems related tosubstance abuse. The report also provides guidelines forinterpreting the data and a framework for applying thisinformation to the tasks of prevention program planningand needs assessment.
Chapter 1 provides a general overview of the context andcontent of the report. Chapter 2 reviews some of theresearch on risk and protective factors, and connects thatresearch to the indicators presented in this report.Chapter 3 reviews recent research on prevention planningand identifies some promising approaches which fit wellwith the risk and protective factor approach. Chapter 4explains how the data are presented, and presents someguidelines for interpretation. Chapters 5, 6, and 7 presentthe collected data on risk factors, protective factors andadditional outcomes, respectively. Chapter 8 presentsstandardized indicator and risk factor measures.
Examples of Information Presented in this Report
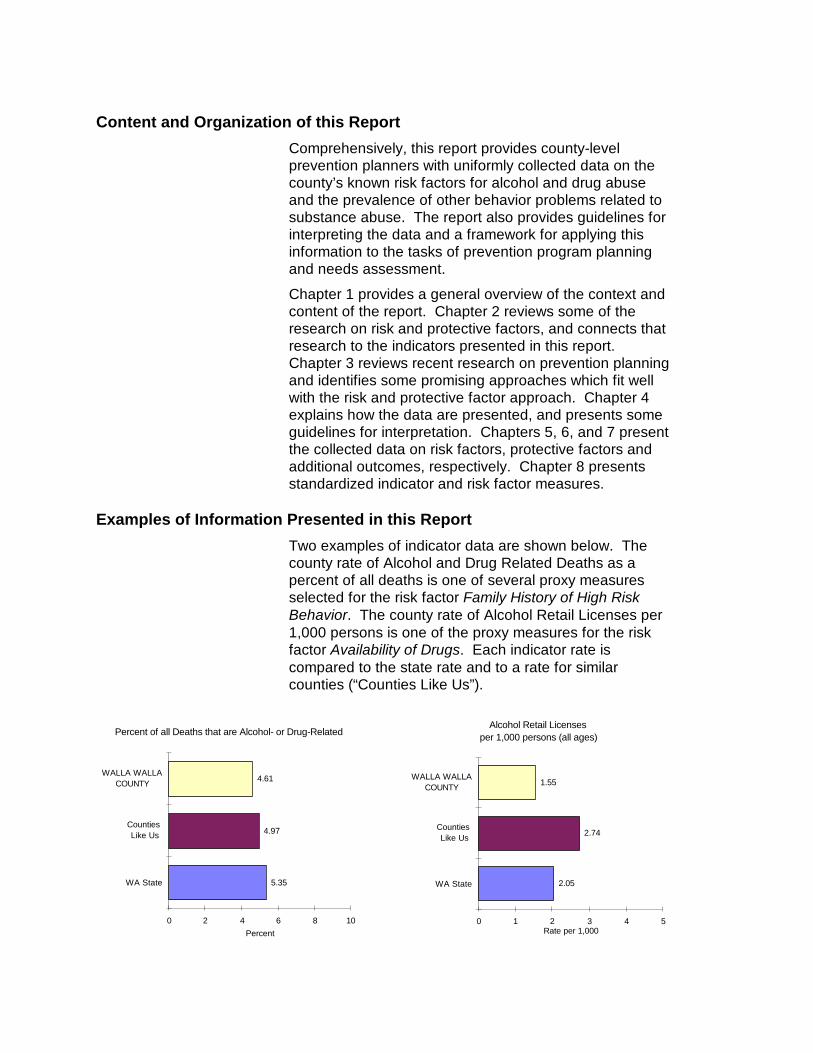
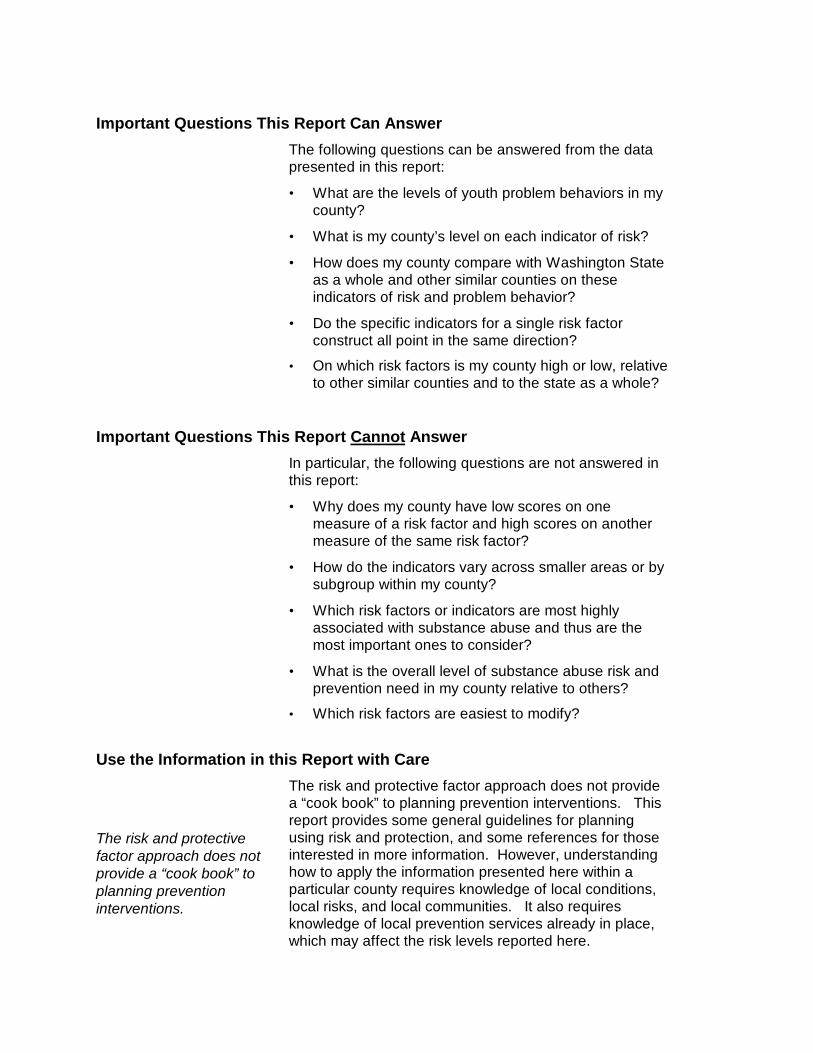
Two examples of indicator data are shown below. Thecounty rate of Alcohol and Drug Related Deaths as apercent of all deaths is one of several proxy measuresselected for the risk factor Family History of High RiskBehavior. The county rate of Alcohol Retail Licenses per1,000 persons is one of the proxy measures for the riskfactor Availability of Drugs. Each indicator rate iscompared to the state rate and to a rate for similarcounties (“Counties Like Us”).
107_p
5.35
4.97
4.61
0 2 4 6 8 10
WA State
Counties Like Us
WALLA WALLACOUNTY
Percent
Percent of all Deaths that are Alcohol- or Drug-Related 006p
2.05
2.74
1.55
0 1 2 3 4 5
WA State
Counties Like Us
WALLA WALLACOUNTY
Rate per 1,000
Alcohol Retail Licensesper 1,000 persons (all ages)
Important Questions This Report Can Answer
The following questions can be answered from the datapresented in this report:
• What are the levels of youth problem behaviors in mycounty?
• What is my county’s level on each indicator of risk?
• How does my county compare with Washington Stateas a whole and other similar counties on theseindicators of risk and problem behavior?
• Do the specific indicators for a single risk factorconstruct all point in the same direction?
• On which risk factors is my county high or low, relativeto other similar counties and to the state as a whole?
Important Questions This Report Cannot Answer
In particular, the following questions are not answered inthis report:
• Why does my county have low scores on onemeasure of a risk factor and high scores on anothermeasure of the same risk factor?
• How do the indicators vary across smaller areas or bysubgroup within my county?
• Which risk factors or indicators are most highlyassociated with substance abuse and thus are themost important ones to consider?
• What is the overall level of substance abuse risk andprevention need in my county relative to others?
• Which risk factors are easiest to modify?
Use the Information in this Report with Care
The risk and protectivefactor approach does notprovide a “cook book” toplanning preventioninterventions.
The risk and protective factor approach does not providea “cook book” to planning prevention interventions. Thisreport provides some general guidelines for planningusing risk and protection, and some references for thoseinterested in more information. However, understandinghow to apply the information presented here within aparticular county requires knowledge of local conditions,local risks, and local communities. It also requiresknowledge of local prevention services already in place,which may affect the risk levels reported here.
1-1
1 INTRODUCTION
Substance Abuse Costs Money, Causes Harm and Is Increasing Among Youth
The lives of many Washington State residents have beenimpacted by the misuse of alcohol, tobacco, or other drugs --either their own or that of a family member, close friend,neighbor, or co-worker. Even drug use by complete strangersholds the potential for affecting our own lives, indirectly as inhigher health care and insurance costs, or directly as in tragicsubstance use-related traffic injuries and fatalities.
Because substance abuse is either a direct or contributing factorin so many adverse social and health outcomes, it is difficult toestimate accurately the societal costs for which it is responsible.Somewhat conservative national estimates of the monetary costsof substance use include:
• $58.3 billion in illicit drug use in 1988 (Rice, Kelman, andMiller, 1991)
• $136.3 billion in alcohol use in 1990 (Harwood, 1985)
• $88 billion in cigarette use in 1995 (Harris, 1994)
The direct monetary costof alcohol, tobacco andillicit drug use is over$1,000 for every man,woman and child in thiscountry.
Adjusted for inflation, these figures translate to a direct monetarycost of over $1,000 attributable to the use of alcohol, tobacco,and other drugs for every man, woman, and child in the country.Added to that is the incalculable toll on the emotional andphysical suffering of those whose well-being and happiness arecompromised by the impact of substance abuse.
Progress in reducing the levels of substance abuse, and theharm that it causes, has been made on some fronts. Bothnationally and in Washington State, alcohol-related trafficfatalities have been reduced substantially over the past twodecades, and the overall prevalence of cigarette smokingcontinues to decline. National surveys have also indicateddeclining rates of illicit drug use among youth from the late1970's through about 1990.
Between 1992 and 1995,illicit drug use during thepast month more thandoubled among U.S. youthaged 12-17.
However, in recent years there has been an alarming increase inthe prevalence of illicit drug use among our nation's youth.Results from the National Survey on Drug Abuse show anincrease in past month use of any illicit drug among youth (ages12-17) from 5.3% in 1992 to 10.9% in 1995 (U.S. Department ofHealth and Human Services, 1996). The prevalence of use formarijuana, cocaine, and hallucinogens have all increasedsubstantially within this time span.
1-2
Between 1992 and 1995,the percent of studentswho had used marijuana atleast once during the pastmonth more than doubledfor 8th and almost doubledfor 12th graders.
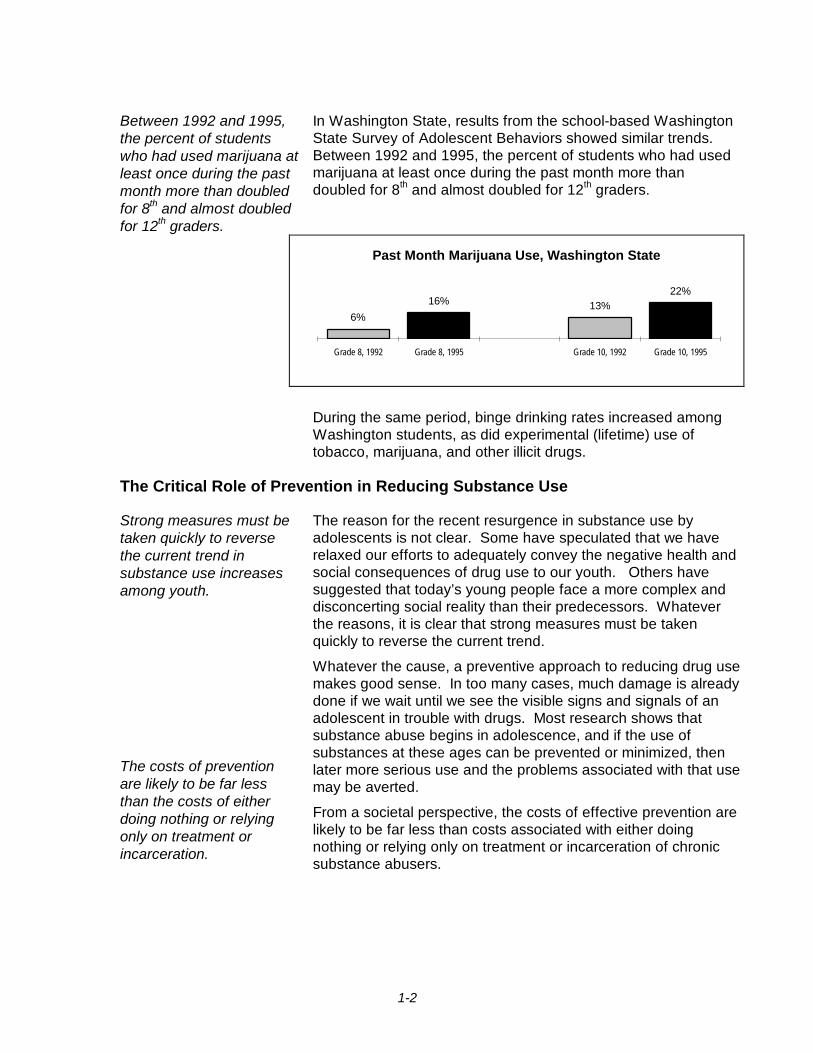
In Washington State, results from the school-based WashingtonState Survey of Adolescent Behaviors showed similar trends.Between 1992 and 1995, the percent of students who had usedmarijuana at least once during the past month more thandoubled for 8th and almost doubled for 12th graders.
Past Month Marijuana Use, Washington State
6%16% 13%
22%
Grade 8, 1992 Grade 8, 1995 Grade 10, 1992 Grade 10, 1995
During the same period, binge drinking rates increased amongWashington students, as did experimental (lifetime) use oftobacco, marijuana, and other illicit drugs.
The Critical Role of Prevention in Reducing Substance Use
Strong measures must betaken quickly to reversethe current trend insubstance use increasesamong youth.
The costs of preventionare likely to be far lessthan the costs of eitherdoing nothing or relyingonly on treatment orincarceration.
The reason for the recent resurgence in substance use byadolescents is not clear. Some have speculated that we haverelaxed our efforts to adequately convey the negative health andsocial consequences of drug use to our youth. Others havesuggested that today’s young people face a more complex anddisconcerting social reality than their predecessors. Whateverthe reasons, it is clear that strong measures must be takenquickly to reverse the current trend.
Whatever the cause, a preventive approach to reducing drug usemakes good sense. In too many cases, much damage is alreadydone if we wait until we see the visible signs and signals of anadolescent in trouble with drugs. Most research shows thatsubstance abuse begins in adolescence, and if the use ofsubstances at these ages can be prevented or minimized, thenlater more serious use and the problems associated with that usemay be averted.
From a societal perspective, the costs of effective prevention arelikely to be far less than costs associated with either doingnothing or relying only on treatment or incarceration of chronicsubstance abusers.
1-3
”Risk factors” arecharacteristics which areassociated with increasesin substance abuse.
“Protective factors” arecharacteristics whichreduce or moderate theinfluence of risk factors.
Choices for prevention approaches and specific strategies arenumerous and diverse. What is needed is a framework that canhelp prevention program planners make informed decisionsconcerning which strategies to implement and where preventionprograms are most needed. Recent developments in preventionscience have shown that there are characteristics of individualsand their familial and social environments that seem to affect thelikelihood of negative outcomes such as substance abuse. Justas in research on heart attacks, stroke and cancer, thesecharacteristics are divided into “risk” and “protective” factors.
Risk factors are characteristics of people or their family, schooland community environments which are empirically associatedwith increases in substance abuse. Other characteristicsfunction as protective factors, which serve to reduce ormoderate the influence of risk factors.
DASA has adopted a riskand protective factor-based framework as thefoundation of its statewideprevention planning.
In the late 1980’s, Professors J. David Hawkins, RichardCatalano and their associates at the University of Washingtonreviewed and synthesized three decades of research on risk andprotective factors for adolescent substance abuse. Theapplication of this research-guided framework to substanceabuse prevention calls for interventions which are designed toreduce levels of risk and enhance levels of protection, particularlyfor those exposed to multiple risks. This framework has beenadopted by the Division of Alcohol and Substance Abuse (DASA)as the foundation of its statewide prevention planning approach.
Implementing a Data-Driven Approach to Prevention PlanningTo implement theframework at the countylevel, the levels of specificrisk and protective factorsin each county need to beassessed.
In 1993, DASA changed its contracting practices with countiesand direct service providers (for a brief history of DASA andprevention planning in Washington State, see Appendix E). Thechange moved contractors from prioritizing programs andstrategies to prioritizing risk factors associated with adolescentsubstance abuse. Once the risk factors were prioritized, theproposed prevention strategies were required to address high-priority risk factors and also to include the enhancement ofprotective factors.
Research suggests that the pattern of risk and protection variesfrom county to county. Therefore, to implement the risk andprotective factor framework in prevention planning at the countylevel, the levels of specific risk and protective factors in eachcounty need to be assessed. This information can then beintegrated into the planning process along with the otherconsiderations and sources of information that drive programplanning activities. This approach will help to insure thatprevention planning will proceed in a rational and effectivemanner, leading to planning decisions that are empiricallyjustifiable and guided by the findings of scientific research.

1-4
During the past threeyears, Washington Statehas been involved in afederally funded researchproject to develop county-level measures of risk andprotective factors.
Over the past three years, DASA and the Office of Researchand Data Analysis (ORDA) have been involved in a projectfunded by the federal Center for Substance AbusePrevention (CSAP) to facilitate this process. In collaborationwith five other states plus Professors Hawkins and Catalanoand their colleagues at the University of Washington, a set of17 risk factor constructs and 7 protective factor constructsthat have been shown in the research literature to bepredictive of substance abuse were identified. For each riskand protective factor, two sorts of measurements weredefined: (1) indicators to be collected from existingdatabases at a county level were proposed, and (2)questions were added to existing school surveys in all sixstates.
The six states were responsible for implementing the schoolsurveys and collecting the indicator data. The universityresearchers have carried out preliminary analyses connectingthe information on the school surveys with the indicators, thus“validating” the indicators. As a result of these preliminaryinvestigations, some indicators were collected but are notreported here. Although the validation work continues, theindicators presented here are ready to use in planning andprevention assessment.
Major Purposes of This Report
To provide county data onrisk and protective factorsfor alcohol and other drugabuse.
To provide guidelines forinterpreting county data.
To provide a framework forapplying this data toprevention planning
The purpose of this report is to provide county-levelprevention planning efforts with uniformly collected data onthe county’s known risk factors for alcohol and drug abuseand the prevalence of substance abuse related problems inbehavior. The report also provides guidelines for interpretingthe data and a framework for applying this information to thetasks of prevention program planning and needsassessment.
Chapter 2 reviews some of the research on risk andprotective factors, and connects that research to theindicators presented in this report. Chapter 3 reviews recentresearch on prevention planning, to identify some promisingapproaches which fit well with the risk and protective factorapproach. Chapter 4 explains how the data are presented,and presents some guidelines for interpretation. Chapters 5,6, and 7 present the collected data on risk factors, protectivefactors and additional outcomes, respectively. Chapter 8presents standardized indicator and risk factor measures.
2-1
2 RISK AND PROTECTIVE FACTORS IN THIS REPORT
Research on Risk and Protection
Research suggeststhat a common coreof risk and protectivefactors underlies theinterrelatedadolescent problembehaviors ofsubstance abuse,violence,delinquency, suicide,teen parentage andschool failure.
The model of risk and protective factors used in this report isbased on the work of J. David Hawkins, Richard Catalanoand their team of researchers at the University ofWashington. Hawkins, Lishner, and Catalano, 1985;Hawkins, Catalano, and Miller, 1992; Hawkins, Arthur, andCatalano, 1995). Brief summaries of the particular risk andprotective factors discussed in their model, and their effectson substance abuse, are provided in Tables 1, 2 and 3.Findings from the research studies which identified thosefactors are summarized in Appendix C.
Hawkins and Catalano have also reviewed risk andprotective factors for delinquency (Hawkins, Lishner,Jenson, and Catalano, 1987). Other researchers, includingJoy Dryfoos (1990), Robert Slavin (1989), and RichardJessor (1986), have reviewed the literature on other problemoutcomes, including behavior problems, school dropouts andteen pregnancy, and identified risk factors for theseproblems.
Many of these researchers noted that a teenager who ishaving trouble in one of these areas is also likely to behaving trouble in another area (Jessor and Jessor, 1977;Jessor, 1991; Osgood, 1991). While there are some uniquefactors influencing each problem, there is a common core ofrisk and protective factors which seem to underlie theinterrelated adolescent problem behaviors of substanceabuse, violence, delinquency, suicide, teen parentage andschool failure.
This report concentrates upon providing information on riskand protective factors which are empirically related to earlyinitiation of substance use or to substance abuse in youngpeople. However, because these same risk factors alsoinfluence other problem behaviors, it also includes someindicators of other problem behaviors among young people(such as early pregnancy and violence). This informationmay be useful in joint planning for prevention interventionswhich affect multiple outcomes.
2-2
Human Development Within Nested Social Environments
Substance abuse risk is adevelopmental outcome,influenced by events andprocesses which happenmany years before thesubstance use or misuseoccurs.
Two basic structuring ideas are woven through the riskand protective factor model. First is the development overtime of the individual human being: from infant to toddlerto school age child to adolescent to adult. Substanceabuse risk is best understood as a developmentaloutcome, influenced by events and processes whichhappen many years before the substance use or misuseoccurs.
There are manyoverlapping socialenvironments wherepeople are exposed tocertain risks andprotections. Theseenvironmental domainsalso help define andinfluence smaller domainsthat are nested within.
Effective preventionplanning must take intoaccount risks andprotections built into allenvironments in whichyoung people participate.
Second is the notion of nested social environments. Thefamily, the neighborhood, the school, the church orsynagogue, the peer group, the tribe, and the communityare all social environments for young people. Eachenvironmental domain exposes those within it to certainrisks and protections and also helps to define andinfluence whatever smaller domains are nested within.Even risk and protective factors which pertain toindividuals (such as poor school performance) areinfluenced by features of the past and present school,family and community environments in which thoseindividuals live. Effective prevention planning must takeinto account risks and protections built into allenvironments in which young people participate.
In the past, much substance abuse prevention activity hasconcentrated on altering individual behavior and attitudesof young people in school settings, at the age just beforesubstance use begins (Emshoff, 1996). This is still animportant area for prevention planning, but the risk andprotective factor model suggests that there are otherimportant times and areas of intervention. Some may beaddressed to earlier stages in individual development(attempting to reduce early grade school failure rates, forexample). Others may be aimed directly at alteringenvironments (decreasing substance availability, forexample) rather than individuals.
It is the reality of nested environments which makes thecommunity level so important in prevention planning. Thislevel includes families, schools and neighborhoods, so itprovides the broadest and most inclusive platform fromwhich to mobilize prevention activities at multiple levels.Strategies targeted directly to individuals, families orschools must be cognizant of the broader communitycontext in which they operate and the importance ofaddressing risk factors through multiple levels andstrategies. Beginning with schools or families, it is muchmore difficult to move to communities.
2-3
Conceptual and Operational Risk Factors in This Report
Risk and protective factorconstructs were identifiedbased upon their empiricalrelationship with substanceabuse or early onset ofuse.
The conceptual and operational risk factors presented inthis report are defined in Table 1 on the following twopages. They are divided into four domains: Community,Family, School and Individual/Peer. Each risk factorpresented in this table has an empirically demonstratedrelationship to substance abuse or to early onset of use.Findings form the research studies which identified thesefactors are shown in Appendix C. More detaileddiscussion may be found in Hawkins, Lishner, andCatalano (1985), Hawkins, Catalano, and Miller (1992), areport by the Institute of Medicine edited by Mrazek andHaggerty (1994), and Hawkins, Arthur, and Catalano(1995).The empirical research on risk and protective factors hasstemmed from survey or longitudinal data on individuals.The best “match” between existing research and datawould be to collect survey data from a representativesample of the youth and adults in each county. However,such household surveys would be quite expensive toadminister and manage, especially on an ongoing basis.School surveys offer a potential and less expensivemethod of collecting individual data, but to offer reliablecounty estimates for all counties, more than half theschool districts in the state would need to participate.
This report provides eitherdirect or proxy measuresfor risk factor constructswhich are drawn fromexisting state and localarchival databases,collected by state agenciesas part of their on-goingbusiness.
The approach taken in this report is, wherever possible, toprovide either direct or proxy measures for risk factorsand problem outcomes which are drawn from existingstate and local archival databases, collected by stateagencies as part of their on-going business. Thesedatabases often directly count some event -- for example,“Number Of Children Reported As Abused Or NeglectedIn County X.” These events can be matched withpopulation-based data to produce a county rate – forexample, “Children Reported As Abused And NeglectedPer 1000 Children In County X.” The underlyingassumption in presenting these data is that people indifferent communities (or counties) experience differentlevels of risk, and that some of this risk can be measured,albeit imperfectly, with uniform data that are alreadyavailable.If no archival data source could be identified as areasonable proxy for a risk factor, then school survey datafor the appropriate region is presented. Note, however,that while each county within a school survey region mighthave quite different rates, the regional school surveymeasure is a weighted average of those differences.
2-4
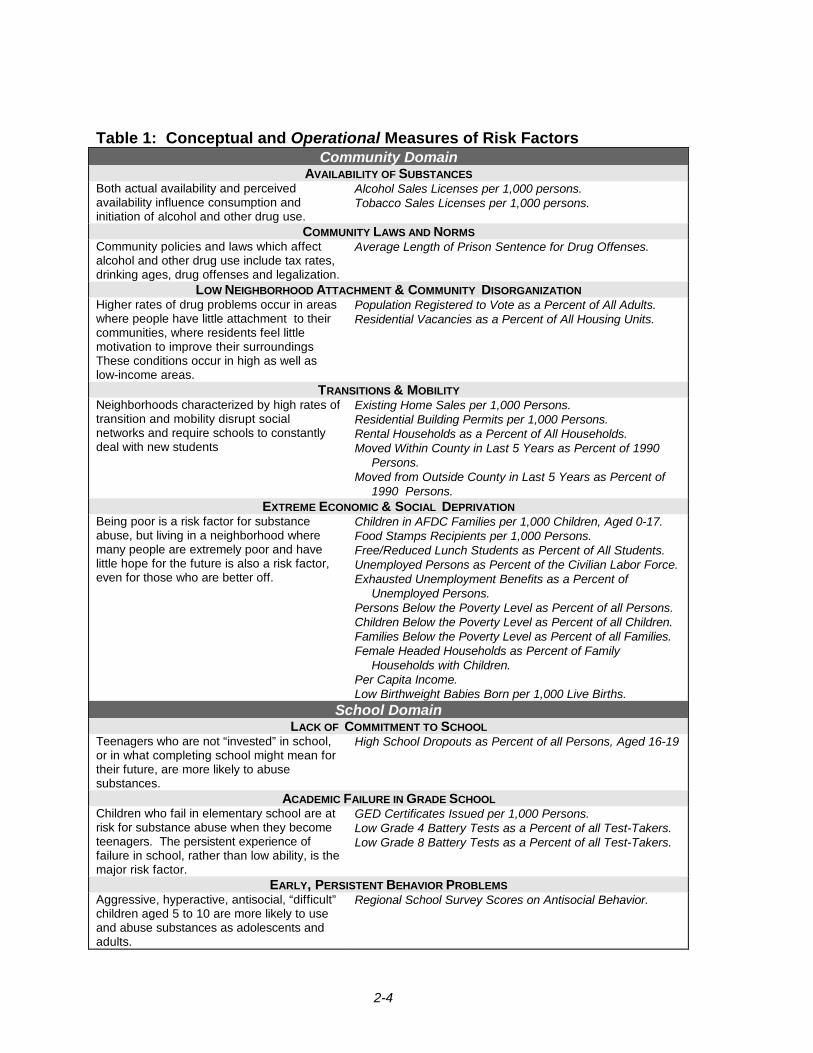
Table 1: Conceptual and Operational Measures of Risk FactorsCommunity Domain
AVAILABILITY OF SUBSTANCESBoth actual availability and perceivedavailability influence consumption andinitiation of alcohol and other drug use.
Alcohol Sales Licenses per 1,000 persons.Tobacco Sales Licenses per 1,000 persons.
COMMUNITY LAWS AND NORMSCommunity policies and laws which affectalcohol and other drug use include tax rates,drinking ages, drug offenses and legalization.
Average Length of Prison Sentence for Drug Offenses.
LOW NEIGHBORHOOD ATTACHMENT & COMMUNITY DISORGANIZATIONHigher rates of drug problems occur in areaswhere people have little attachment to theircommunities, where residents feel littlemotivation to improve their surroundingsThese conditions occur in high as well aslow-income areas.
Population Registered to Vote as a Percent of All Adults.Residential Vacancies as a Percent of All Housing Units.
TRANSITIONS & MOBILITYNeighborhoods characterized by high rates oftransition and mobility disrupt socialnetworks and require schools to constantlydeal with new students
Existing Home Sales per 1,000 Persons.Residential Building Permits per 1,000 Persons.Rental Households as a Percent of All Households.Moved Within County in Last 5 Years as Percent of 1990
Persons.Moved from Outside County in Last 5 Years as Percent of
1990 Persons.EXTREME ECONOMIC & SOCIAL DEPRIVATION
Being poor is a risk factor for substanceabuse, but living in a neighborhood wheremany people are extremely poor and havelittle hope for the future is also a risk factor,even for those who are better off.
Children in AFDC Families per 1,000 Children, Aged 0-17.Food Stamps Recipients per 1,000 Persons.Free/Reduced Lunch Students as Percent of All Students.Unemployed Persons as Percent of the Civilian Labor Force.Exhausted Unemployment Benefits as a Percent of
Unemployed Persons.Persons Below the Poverty Level as Percent of all Persons.Children Below the Poverty Level as Percent of all Children.Families Below the Poverty Level as Percent of all Families.Female Headed Households as Percent of Family
Households with Children.Per Capita Income.Low Birthweight Babies Born per 1,000 Live Births.
School DomainLACK OF COMMITMENT TO SCHOOL
Teenagers who are not “invested” in school,or in what completing school might mean fortheir future, are more likely to abusesubstances.
High School Dropouts as Percent of all Persons, Aged 16-19
ACADEMIC FAILURE IN GRADE SCHOOLChildren who fail in elementary school are atrisk for substance abuse when they becometeenagers. The persistent experience offailure in school, rather than low ability, is themajor risk factor.
GED Certificates Issued per 1,000 Persons.Low Grade 4 Battery Tests as a Percent of all Test-Takers.Low Grade 8 Battery Tests as a Percent of all Test-Takers.
EARLY, PERSISTENT BEHAVIOR PROBLEMSAggressive, hyperactive, antisocial, “difficult”children aged 5 to 10 are more likely to useand abuse substances as adolescents andadults.
Regional School Survey Scores on Antisocial Behavior.
2-5
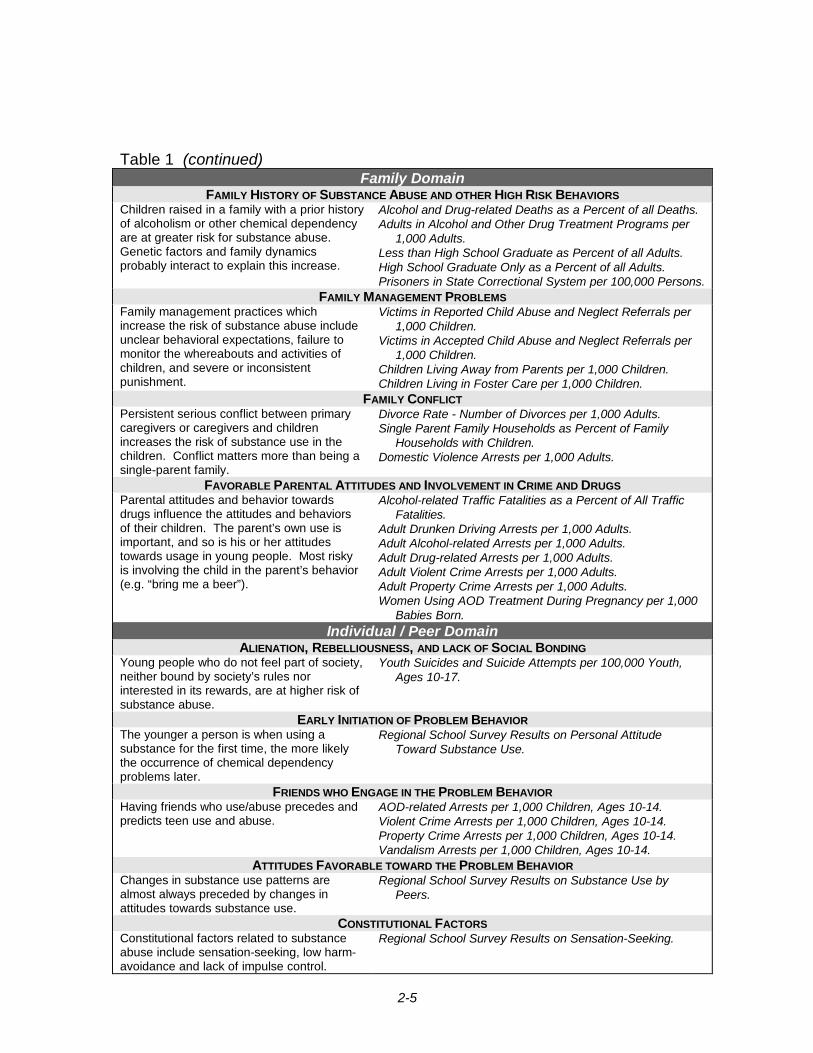
Table 1 (continued)Family Domain
FAMILY HISTORY OF SUBSTANCE ABUSE AND OTHER HIGH RISK BEHAVIORSChildren raised in a family with a prior historyof alcoholism or other chemical dependencyare at greater risk for substance abuse.Genetic factors and family dynamicsprobably interact to explain this increase.
Alcohol and Drug-related Deaths as a Percent of all Deaths.Adults in Alcohol and Other Drug Treatment Programs per
1,000 Adults.Less than High School Graduate as Percent of all Adults.High School Graduate Only as a Percent of all Adults.Prisoners in State Correctional System per 100,000 Persons.
FAMILY MANAGEMENT PROBLEMSFamily management practices whichincrease the risk of substance abuse includeunclear behavioral expectations, failure tomonitor the whereabouts and activities ofchildren, and severe or inconsistentpunishment.
Victims in Reported Child Abuse and Neglect Referrals per1,000 Children.
Victims in Accepted Child Abuse and Neglect Referrals per1,000 Children.
Children Living Away from Parents per 1,000 Children.Children Living in Foster Care per 1,000 Children.
FAMILY CONFLICTPersistent serious conflict between primarycaregivers or caregivers and childrenincreases the risk of substance use in thechildren. Conflict matters more than being asingle-parent family.
Divorce Rate - Number of Divorces per 1,000 Adults.Single Parent Family Households as Percent of Family
Households with Children.Domestic Violence Arrests per 1,000 Adults.
FAVORABLE PARENTAL ATTITUDES AND INVOLVEMENT IN CRIME AND DRUGSParental attitudes and behavior towardsdrugs influence the attitudes and behaviorsof their children. The parent’s own use isimportant, and so is his or her attitudestowards usage in young people. Most riskyis involving the child in the parent’s behavior(e.g. “bring me a beer”).
Alcohol-related Traffic Fatalities as a Percent of All TrafficFatalities.
Adult Drunken Driving Arrests per 1,000 Adults.Adult Alcohol-related Arrests per 1,000 Adults.Adult Drug-related Arrests per 1,000 Adults.Adult Violent Crime Arrests per 1,000 Adults.Adult Property Crime Arrests per 1,000 Adults.Women Using AOD Treatment During Pregnancy per 1,000
Babies Born.Individual / Peer Domain
ALIENATION, REBELLIOUSNESS, AND LACK OF SOCIAL BONDINGYoung people who do not feel part of society,neither bound by society’s rules norinterested in its rewards, are at higher risk ofsubstance abuse.
Youth Suicides and Suicide Attempts per 100,000 Youth,Ages 10-17.
EARLY INITIATION OF PROBLEM BEHAVIORThe younger a person is when using asubstance for the first time, the more likelythe occurrence of chemical dependencyproblems later.
Regional School Survey Results on Personal AttitudeToward Substance Use.
FRIENDS WHO ENGAGE IN THE PROBLEM BEHAVIORHaving friends who use/abuse precedes andpredicts teen use and abuse.
AOD-related Arrests per 1,000 Children, Ages 10-14.Violent Crime Arrests per 1,000 Children, Ages 10-14.Property Crime Arrests per 1,000 Children, Ages 10-14.Vandalism Arrests per 1,000 Children, Ages 10-14.
ATTITUDES FAVORABLE TOWARD THE PROBLEM BEHAVIORChanges in substance use patterns arealmost always preceded by changes inattitudes towards substance use.
Regional School Survey Results on Substance Use byPeers.
CONSTITUTIONAL FACTORSConstitutional factors related to substanceabuse include sensation-seeking, low harm-avoidance and lack of impulse control.
Regional School Survey Results on Sensation-Seeking.

2-6
What are the Protective Factors for Substance Use and Abuse?Some children seem to emerge unscathed from exposure tomultiple high risks. The research of Brook and her colleagues(1990); Werner (1989), Rutter (1987), Garmezy (1985) and othersidentified some protective factors operating at several levels: theindividual’s temperament and characteristics, the family, othersocial groups, and the individual’s attitudes and beliefs. Thesefactors are described below. The research which supports them issummarized in Appendix D.
• Individual Characteristics Several individual characteristics protect againstsubstance abuse: being female, having a resilienttemperament, and being generally positive and optimistic.
• Bonding To Family Having warm and supportive relationships with parents orother primary caregivers who expect the child to succeedin society protects against substance abuse.
• Bonding to Others who SupportNon-Drug Use
Bonding to teachers, other adults and peers who both (1)reinforce the individual’s competence by providingopportunities for positive involvement and (2) support notusing drugs was associated with lowered drug use. Thisis particularly important for children exposed to multiplerisks.
• Healthy Beliefs and ClearStandards
Norms, beliefs or standards which oppose the use ofillegal drugs or alcohol by teenagers were associated withless use.
How Can Prevention Interventions Modify Protective Factors? Some of these protective factors are relatively resistant to change.
Hawkins and Catalano concentrated upon defining protectivefactors which could be modified to provide more protection topersons at high levels of risk.
Research shows that when young people were attached(“bonded”) to other persons and groups who delivered clearmessages and standards opposing the use of illegal drugs oralcohol, the attitudes and behavior of those young people alsomoved away from substance use and other problem behaviors.They internalized and acted upon a clear moral standard.
Bonding takes place when people are given chances to participatein a group and are recognized by the group for their activities,efforts and successes. Increasing opportunities for conventionalsocial participation and recognition is an important preventionstrategy.
Research also showed that young people were better protected ifthey had the social skills to negotiate with friends who pressedthem to use drugs or alcohol or engage in other problembehaviors. Therefore, the groups and individuals to which youngpeople are bonded reinforce their moral standards, and that “socialskills and resistance” may need reinforcing, particularly for high risk
2-7
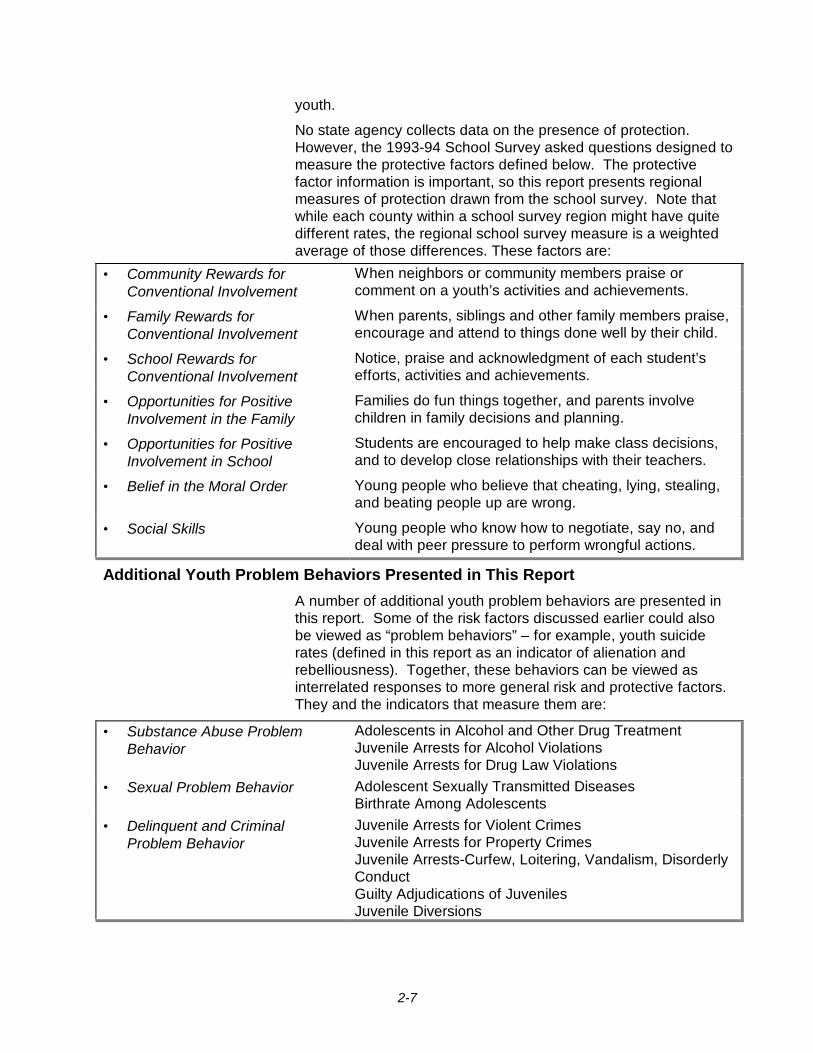
youth.
No state agency collects data on the presence of protection.However, the 1993-94 School Survey asked questions designed tomeasure the protective factors defined below. The protectivefactor information is important, so this report presents regionalmeasures of protection drawn from the school survey. Note thatwhile each county within a school survey region might have quitedifferent rates, the regional school survey measure is a weightedaverage of those differences. These factors are:
• Community Rewards forConventional Involvement
When neighbors or community members praise orcomment on a youth’s activities and achievements.
• Family Rewards forConventional Involvement
When parents, siblings and other family members praise,encourage and attend to things done well by their child.
• School Rewards forConventional Involvement
Notice, praise and acknowledgment of each student’sefforts, activities and achievements.
• Opportunities for PositiveInvolvement in the Family
Families do fun things together, and parents involvechildren in family decisions and planning.
• Opportunities for PositiveInvolvement in School
Students are encouraged to help make class decisions,and to develop close relationships with their teachers.
• Belief in the Moral Order Young people who believe that cheating, lying, stealing,and beating people up are wrong.
• Social Skills Young people who know how to negotiate, say no, anddeal with peer pressure to perform wrongful actions.
Additional Youth Problem Behaviors Presented in This Report A number of additional youth problem behaviors are presented in
this report. Some of the risk factors discussed earlier could alsobe viewed as “problem behaviors” – for example, youth suiciderates (defined in this report as an indicator of alienation andrebelliousness). Together, these behaviors can be viewed asinterrelated responses to more general risk and protective factors.They and the indicators that measure them are:
• Substance Abuse ProblemBehavior
Adolescents in Alcohol and Other Drug Treatment Juvenile Arrests for Alcohol Violations Juvenile Arrests for Drug Law Violations
• Sexual Problem Behavior Adolescent Sexually Transmitted Diseases Birthrate Among Adolescents
• Delinquent and CriminalProblem Behavior
Juvenile Arrests for Violent Crimes Juvenile Arrests for Property Crimes Juvenile Arrests-Curfew, Loitering, Vandalism, DisorderlyConduct Guilty Adjudications of Juveniles Juvenile Diversions

2-8
Important Questions This Report Can Answer
The following questions can be answered from the datapresented in this report:
• What are the levels of youth problem behaviors in mycounty?
• What is my county’s level on each indicator of risk?
• How does my county compare with Washington Stateas a whole and other similar counties on theseindicators of risk and problem behavior?
• Do the specific indicators for a single risk factorconstruct all point in the same direction?
• On which risk factors is my county high or low, relativeto other similar counties and to the state as a whole?
Important Questions This Report Cannot Answer In particular, the following questions are not answered in
this report:
• Why does my county have low scores on onemeasure of a risk factor and high scores on anothermeasure of the same risk factor?
• How do the indicators vary across smaller areas or bysubgroup within my county?
• Which risk factors or indicators are most highlyassociated with substance abuse and thus are themost important ones to consider?
• What is the overall level of substance abuse risk andprevention need in my county relative to others?
• Which risk factors are easiest to modify?
Use the Information in this Report with Care
The risk and protectivefactor approach does notprovide a “cook book” toplanning preventioninterventions.
The risk and protective factor approach does not providea “cook book” to planning prevention interventions. Thisreport provides some general guidelines for planningusing risk and protection, and some references for thoseinterested in more information. However, understandinghow to apply the information presented here to aparticularly county requires knowledge of local conditions,local risks and local communities. It also requiresknowledge of local prevention services already in place,which may affect the risk levels reported here
3-1
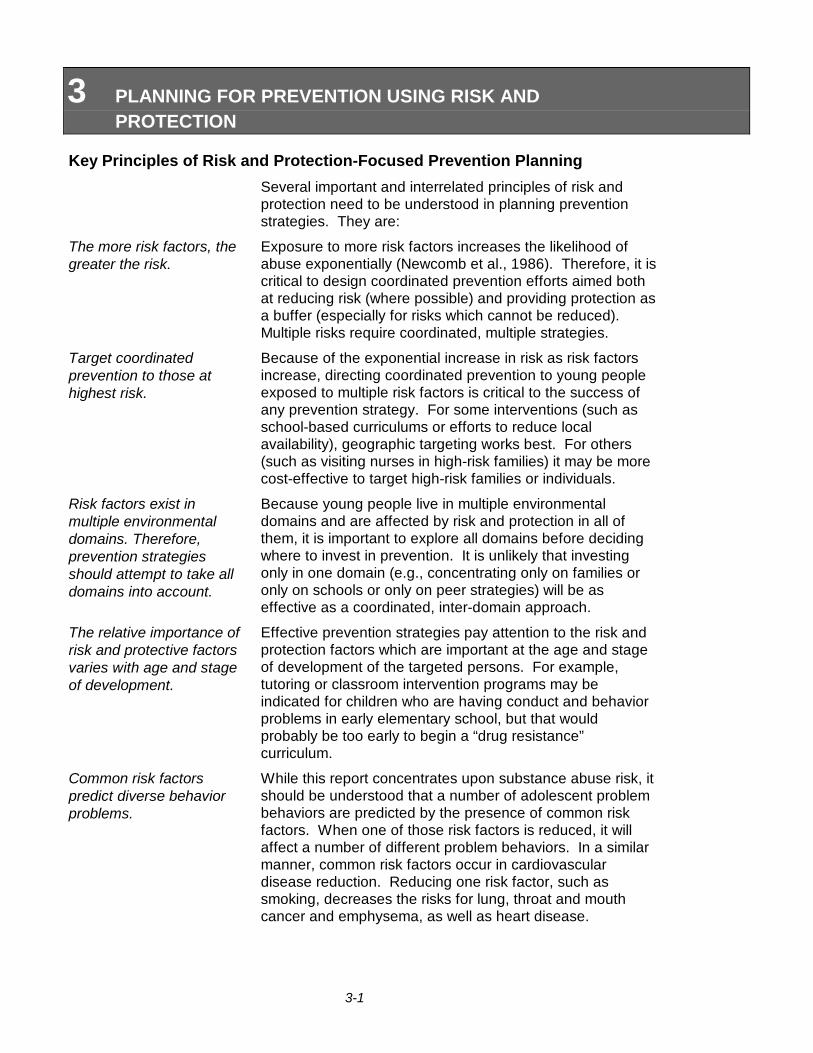
3 PLANNING FOR PREVENTION USING RISK ANDPROTECTION
Key Principles of Risk and Protection-Focused Prevention Planning
Several important and interrelated principles of risk andprotection need to be understood in planning preventionstrategies. They are:
The more risk factors, thegreater the risk.
Exposure to more risk factors increases the likelihood ofabuse exponentially (Newcomb et al., 1986). Therefore, it iscritical to design coordinated prevention efforts aimed bothat reducing risk (where possible) and providing protection asa buffer (especially for risks which cannot be reduced).Multiple risks require coordinated, multiple strategies.
Target coordinatedprevention to those athighest risk.
Because of the exponential increase in risk as risk factorsincrease, directing coordinated prevention to young peopleexposed to multiple risk factors is critical to the success ofany prevention strategy. For some interventions (such asschool-based curriculums or efforts to reduce localavailability), geographic targeting works best. For others(such as visiting nurses in high-risk families) it may be morecost-effective to target high-risk families or individuals.
Risk factors exist inmultiple environmentaldomains. Therefore,prevention strategiesshould attempt to take alldomains into account.
Because young people live in multiple environmentaldomains and are affected by risk and protection in all ofthem, it is important to explore all domains before decidingwhere to invest in prevention. It is unlikely that investingonly in one domain (e.g., concentrating only on families oronly on schools or only on peer strategies) will be aseffective as a coordinated, inter-domain approach.
The relative importance ofrisk and protective factorsvaries with age and stageof development.
Effective prevention strategies pay attention to the risk andprotection factors which are important at the age and stageof development of the targeted persons. For example,tutoring or classroom intervention programs may beindicated for children who are having conduct and behaviorproblems in early elementary school, but that wouldprobably be too early to begin a “drug resistance”curriculum.
Common risk factorspredict diverse behaviorproblems.
While this report concentrates upon substance abuse risk, itshould be understood that a number of adolescent problembehaviors are predicted by the presence of common riskfactors. When one of those risk factors is reduced, it willaffect a number of different problem behaviors. In a similarmanner, common risk factors occur in cardiovasculardisease reduction. Reducing one risk factor, such assmoking, decreases the risks for lung, throat and mouthcancer and emphysema, as well as heart disease.
3-2
Protective factors bufferexposure to risk.Therefore, preventionefforts should enhanceprotection among thoseexposed to greatest risk
The importance of protective factors cannot be overstated.Because many of the young people at greatest risk live inmultiple high-risk environments, the process of reducing their riskmay seem overpowering. However, strengthening protection inmore than one sphere provides a way to work with those youngpeople immediately, without feeling that the seemingly insolubleinterconnected risks in the environment must first be overcome.
Effective preventionprograms must be“culturally competent.”However, risk andprotective factors operatesimilarly in persons ofdifferent races, culturesand classes.
It appears that risk and protective factors operate similarly inpersons of differing classes, races and cultures. However, levelsof risk factors, ideas about appropriate parent-child behavior,reasonable expectations of citizenship, and attitudes towardsmiddle-class “success” vary across social and cultural groups.Therefore, any prevention strategy needs to be developed andimplemented in a culturally competent manner if it is to beeffective across groups.
Commonly Used Prevention Approaches and Their Effectiveness
The National StructuredEvaluation (NSE) Study ofPrevention reviewed 1,642prevention study reportsand evaluated 309 thatmet requirements forscientific rigor.
There are many substance abuse prevention interventions beingdeveloped, used and (sometimes) evaluated. The NationalStructured Evaluation (NSE) study, a recent Congressionallymandated prevention evaluation study (Emshoff, 1996), reviewed1,642 prevention study reports which had “sufficient detail topermit initial coding of activities, population served, andimplementation characteristics. However … only 309 of thoseinitiatives provided sufficiently rigorous evaluation reports to meetthe NSE’s analytical requirements” (pages 2-3)
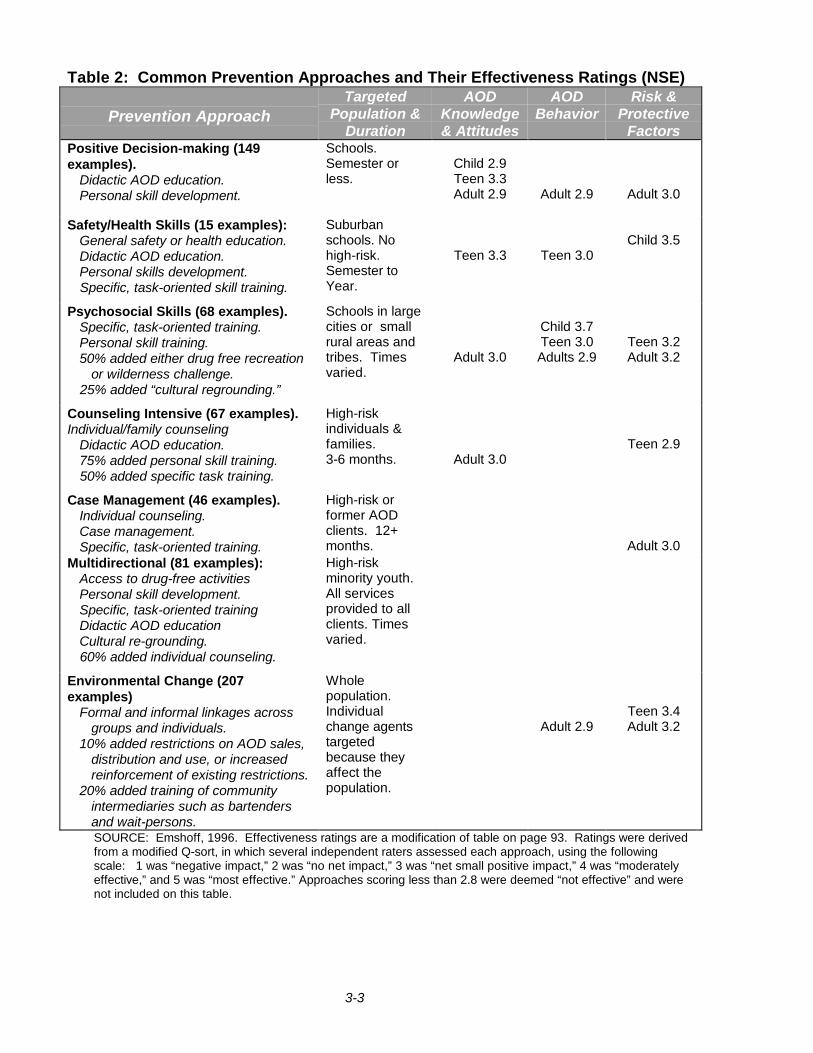
The NSE researchers used a cluster analysis to derive sevenoften-used prevention approaches from combinations of the1,642 interventions in their database, and used the 309 programswith rigorous evaluations to review the effectiveness of eachapproach across three dimensions: changes in AOD attitudes,changes in AOD outcomes, and changes in risk and protectivefactors.
The approaches described in the NSE are probably familiar tomost persons active in substance abuse prevention. Briefdescriptions and the overall assessments of effectiveness areshown in Table 2 on the following page.
3-3
Table 2: Common Prevention Approaches and Their Effectiveness Ratings (NSE)
Prevention ApproachTargeted
Population &Duration
AODKnowledge& Attitudes
AODBehavior
Risk &Protective
FactorsPositive Decision-making (149examples).
Didactic AOD education.Personal skill development.
Schools.Semester orless.
Child 2.9Teen 3.3Adult 2.9 Adult 2.9 Adult 3.0
Safety/Health Skills (15 examples):General safety or health education.Didactic AOD education.Personal skills development.Specific, task-oriented skill training.
Suburbanschools. Nohigh-risk.Semester toYear.
Teen 3.3 Teen 3.0Child 3.5
Psychosocial Skills (68 examples).Specific, task-oriented training.Personal skill training.50% added either drug free recreation
or wilderness challenge.25% added “cultural regrounding.”
Schools in largecities or smallrural areas andtribes. Timesvaried.
Adult 3.0
Child 3.7Teen 3.0Adults 2.9
Teen 3.2Adult 3.2
Counseling Intensive (67 examples).Individual/family counseling
Didactic AOD education.75% added personal skill training.50% added specific task training.
High-riskindividuals &families.3-6 months. Adult 3.0
Teen 2.9
Case Management (46 examples).Individual counseling.Case management.Specific, task-oriented training.
High-risk orformer AODclients. 12+months. Adult 3.0
Multidirectional (81 examples):Access to drug-free activitiesPersonal skill development.Specific, task-oriented trainingDidactic AOD educationCultural re-grounding.60% added individual counseling.
High-riskminority youth.All servicesprovided to allclients. Timesvaried.
Environmental Change (207examples)
Formal and informal linkages acrossgroups and individuals.
10% added restrictions on AOD sales,distribution and use, or increasedreinforcement of existing restrictions.
20% added training of communityintermediaries such as bartendersand wait-persons.
Wholepopulation.Individualchange agentstargetedbecause theyaffect thepopulation.
Adult 2.9Teen 3.4Adult 3.2
SOURCE: Emshoff, 1996. Effectiveness ratings are a modification of table on page 93. Ratings were derivedfrom a modified Q-sort, in which several independent raters assessed each approach, using the followingscale: 1 was “negative impact,” 2 was “no net impact,” 3 was “net small positive impact,” 4 was “moderatelyeffective,” and 5 was “most effective.” Approaches scoring less than 2.8 were deemed “not effective” and werenot included on this table.
3-4
Promising Interventions Which Reduce Risk and Enhance Protection
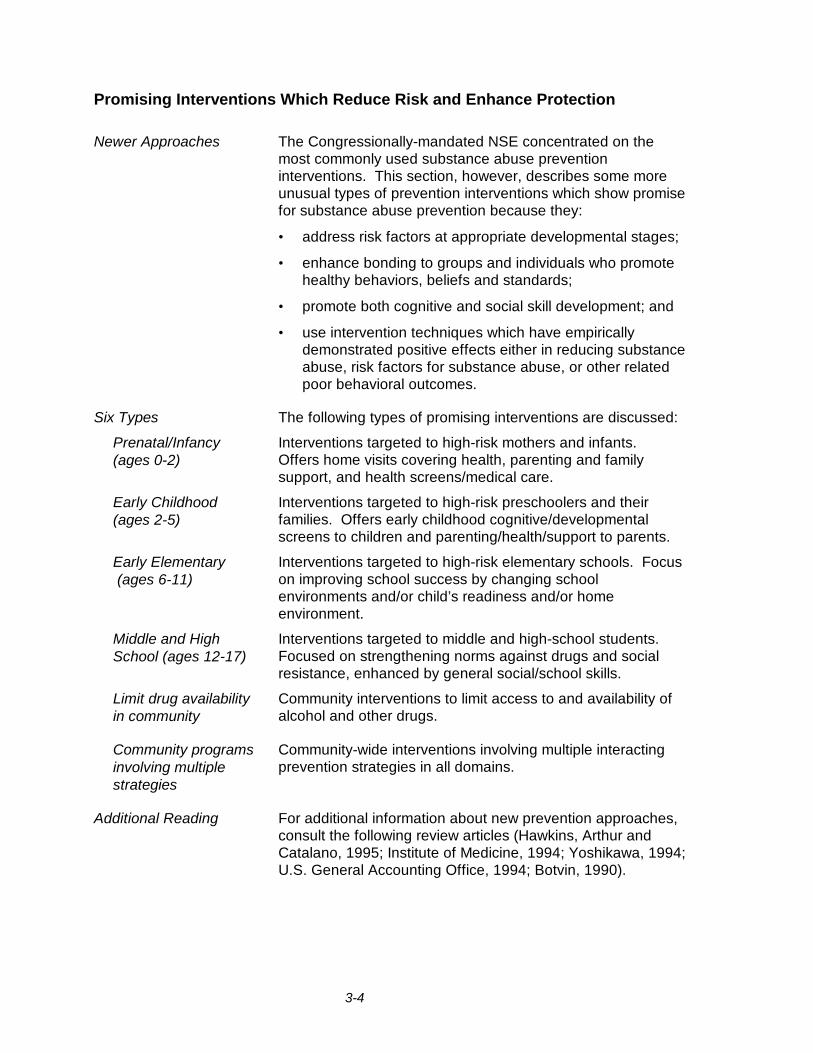
Newer Approaches The Congressionally-mandated NSE concentrated on themost commonly used substance abuse preventioninterventions. This section, however, describes some moreunusual types of prevention interventions which show promisefor substance abuse prevention because they:
• address risk factors at appropriate developmental stages;
• enhance bonding to groups and individuals who promotehealthy behaviors, beliefs and standards;
• promote both cognitive and social skill development; and
• use intervention techniques which have empiricallydemonstrated positive effects either in reducing substanceabuse, risk factors for substance abuse, or other relatedpoor behavioral outcomes.
Six Types The following types of promising interventions are discussed:
Prenatal/Infancy(ages 0-2)
Interventions targeted to high-risk mothers and infants.Offers home visits covering health, parenting and familysupport, and health screens/medical care.
Early Childhood(ages 2-5)
Interventions targeted to high-risk preschoolers and theirfamilies. Offers early childhood cognitive/developmentalscreens to children and parenting/health/support to parents.
Early Elementary (ages 6-11)
Interventions targeted to high-risk elementary schools. Focuson improving school success by changing schoolenvironments and/or child’s readiness and/or homeenvironment.
Middle and HighSchool (ages 12-17)
Interventions targeted to middle and high-school students.Focused on strengthening norms against drugs and socialresistance, enhanced by general social/school skills.
Limit drug availabilityin community
Community interventions to limit access to and availability ofalcohol and other drugs.
Community programsinvolving multiplestrategies
Community-wide interventions involving multiple interactingprevention strategies in all domains.
Additional Reading For additional information about new prevention approaches,consult the following review articles (Hawkins, Arthur andCatalano, 1995; Institute of Medicine, 1994; Yoshikawa, 1994;U.S. General Accounting Office, 1994; Botvin, 1990).
3-5
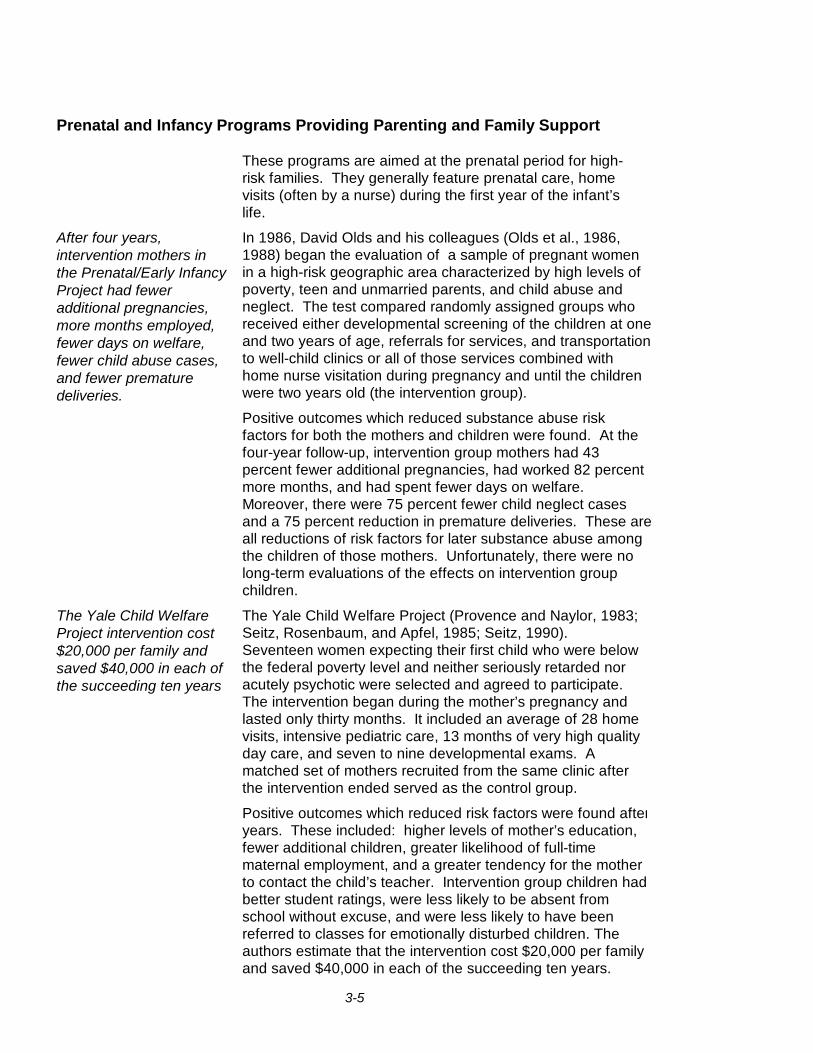
Prenatal and Infancy Programs Providing Parenting and Family Support
These programs are aimed at the prenatal period for high-risk families. They generally feature prenatal care, homevisits (often by a nurse) during the first year of the infant’slife.
After four years,intervention mothers inthe Prenatal/Early InfancyProject had feweradditional pregnancies,more months employed,fewer days on welfare,fewer child abuse cases,and fewer prematuredeliveries.
In 1986, David Olds and his colleagues (Olds et al., 1986,1988) began the evaluation of a sample of pregnant womenin a high-risk geographic area characterized by high levels ofpoverty, teen and unmarried parents, and child abuse andneglect. The test compared randomly assigned groups whoreceived either developmental screening of the children at oneand two years of age, referrals for services, and transportationto well-child clinics or all of those services combined withhome nurse visitation during pregnancy and until the childrenwere two years old (the intervention group).
Positive outcomes which reduced substance abuse riskfactors for both the mothers and children were found. At thefour-year follow-up, intervention group mothers had 43percent fewer additional pregnancies, had worked 82 percentmore months, and had spent fewer days on welfare.Moreover, there were 75 percent fewer child neglect casesand a 75 percent reduction in premature deliveries. These areall reductions of risk factors for later substance abuse amongthe children of those mothers. Unfortunately, there were nolong-term evaluations of the effects on intervention groupchildren.
The Yale Child WelfareProject intervention cost$20,000 per family andsaved $40,000 in each ofthe succeeding ten years
The Yale Child Welfare Project (Provence and Naylor, 1983;Seitz, Rosenbaum, and Apfel, 1985; Seitz, 1990).Seventeen women expecting their first child who were belowthe federal poverty level and neither seriously retarded noracutely psychotic were selected and agreed to participate.The intervention began during the mother’s pregnancy andlasted only thirty months. It included an average of 28 homevisits, intensive pediatric care, 13 months of very high qualityday care, and seven to nine developmental exams. Amatched set of mothers recruited from the same clinic afterthe intervention ended served as the control group.
Positive outcomes which reduced risk factors were found after tenyears. These included: higher levels of mother’s education,fewer additional children, greater likelihood of full-timematernal employment, and a greater tendency for the motherto contact the child’s teacher. Intervention group children hadbetter student ratings, were less likely to be absent fromschool without excuse, and were less likely to have beenreferred to classes for emotionally disturbed children. Theauthors estimate that the intervention cost $20,000 per familyand saved $40,000 in each of the succeeding ten years.

3-6
Early Childhood Programs Providing Education and Family Support
The next set of promising interventions begins with children atabout one year of age and works with them until they are three,addressing the major cognitive tasks of this age, which includepreparation for success in school, as well as modifying parentalbehavior in ways which support children’s school success.
In grades 2 through 5,intervention group childrenfrom the Houston Parent-Child Development Projecthad fewer behaviorproblems, were less likelyto have been referred forspecial services andscored higher on the IowaTest of Basic Skills.
The goal of the Houston Parent-Child Development Center(HPCDC) was to promote school competence among Mexican-American children from below-poverty families. Approximately100 families per year were recruited over an eight-year period,fully informed about the project, and then randomized into equal-sized control and intervention groups.
The intervention had two phases. During the first year, trainedfemale para-professionals visited the homes 25 times, coveringchild development issues and information about how the motherscould affect their child’s development. Workshops were providedfor fathers and siblings. Mothers were encouraged to attend ESLclasses, and additional social, health and referral services wereprovided as needed.
During the second year, the mothers and their children attendedfour-hour sessions four days a week at the center, where thechildren were taught cognitive and group skills while the motherscontinued to learn child management and developmental skills,as well as home management, human sexuality and driver’seducation classes. Fathers continued to be involved through amonthly parent council. Transportation and day care wasprovided for siblings and all teachers were bilingual. Even so,attrition was a serious problem and almost half of the familiesdropped out before the end of the intervention.
Despite the attrition, positive findings which reduced risk factorsfor substance abuse were reported. In grades 2 through 5,intervention group children had fewer behavior problems, wereonly one fourth as likely to have been referred for specialservices and scored higher on the Iowa Test of Basic Skills thancontrol group children (Johnson and Breckenridge, 1982;Johnson, 1988).
The Perry Preschool Project, based in a low-income, predominantlyAfrican-American neighborhood in Ypsilanti, Michigan, is a secondexample of a successful preschool intervention. The interventiontargeted three and four year olds and used the High/Scopecurriculum. Children were actively involved in planning theirclassroom activities, and met every weekday for thirty weeks eachyear. There were also weekly home visits to each child by one ofthe preschool teachers. Families participated for one to two years.
3-8
At age nineteen, PerryPreschool Project childrenwere less likely to havebeen arrested, to havebeen arrested five or moretimes, to have had specialeducation placements, tohave dropped out ofschool, or been on welfare.Intervention children hadhigher grade-pointaverages.
Perry preschool long-term follow-ups have been remarkable.During elementary school, the intervention children had lowerrates of aggressive, disobedient and disruptive behavior thanthe control group. At age nineteen, intervention children wereless likely to have been arrested, to have been arrested five ormore times, to have had special education placements, to havedropped out of school, or been on welfare. Interventionchildren had higher grade-point averages. These long-termfindings were related to teacher ratings of conduct inelementary school, suggesting that the effects on long-termoutcomes were through more successful grade schoolexperiences. The Perry Preschool Project did not evaluatesubstance abuse outcomes, but it did succeed in affectingmany of the risk factors leading to substance abuse.
Providing Academic and Social Skills for Early Elementary Children andEnhancing School Environments: Targeted to High-Risk Schools
Elementary school represents the first major domain in which achild must succeed or fail outside the family. New cognitive,social and impulse control skills are required to succeed inschool. Failure in elementary school has powerful effects onthe child’s future life. Risk reduction interventions during thisperiod typically focus on enhancing parenting and familyfunctioning to support children’s school success, enhancingthe child’s own social and academic competence, and changingthe school environment to be more supportive and inclusive ofchildren who are having difficulties.
The Seattle Social Development Project (Hawkins, Von Cleve,and Catalano, 1991; and Hawkins, Catalano, Morrison et al.,1992) began with first graders in eight Seattle schools whichwere selected based on high crime rates in their attendanceareas. One school was selected as treatment, and one ascontrol; first graders in the other six schools were randomlyassigned either to a treatment or control classroom.
The intervention continued for four years, following a cohort ofstudents from first through fourth grades, and combinedteacher training, parent training and social skills training for firstgraders in eight Seattle schools. Teachers were trained inproactive classroom management, interactive teaching, andcooperative learning techniques to increase opportunities forstudents to participate successfully, be involved, and berewarded for their involvement. First grade teachers were alsotrained in a social skills curriculum developed by Shure andSpivak (1988). Parents of first graders were offered training onmonitoring children’s behavior, using appropriate andconsistent rewards and discipline, and involving children infamily activities. Parents of second and third graders wereoffered a program which helped them foster a child’s schoolachievements.

3-9
By fifth grade, interventionstudents in the SeattleSocial DevelopmentProject reported higherbonding to family andschool and more proactivefamily management, andwere less likely thancontrols to have initiatedalcohol use or delinquentbehavior.
In Year 1, two schools inthe Yale SchoolDevelopment Programwere close to the bottom inthe community’s readingand mathematics scores.Twelve years later, with nochange in the populationdemographics, the sametwo schools were third andfourth in the city, scoringabove national averages.Truancy and disciplineproblems also decreased.
Positive effects were seen at the end of second and fifthgrades. By the start of fifth grade, students who hadparticipated in an intervention classroom for at least onesemester reported significantly higher bonding to family, schooland more proactive family management and communicationthan control students. Intervention group students were lesslikely to have initiated alcohol use or delinquent behavior byfifth grade than students in the control group.
A second intervention designed to change school environmentsto enhance the success of students is the School DevelopmentProgram created by Comer and his associates at the Yale ChildStudy Center (Comer, 1985, 1988). The intervention aims tocreate a positive school climate by involving a range ofstakeholders in the schools. Parents, teachers, schooladministrators and mental health professionals join to form aschool management team, a mental health team, and a parentinvolvement team. The management team meets weekly toaddress school issues; the mental health team also meetsweekly to consider student behavior problems in aninterdisciplinary perspective, to determine if the school iscontributing to the behavior problems, and to recommendchanges in the school functioning to improve school climateand student well-being. The parent group creates a parenthandbook describing opportunities for involvement in theschool.
Quasi-experimental evaluations of the School DevelopmentProgram applied to two inner city schools serving low-income,mostly African-American schools showed positive results. Atthe start of the intervention those two schools were close to thebottom in the community’s reading and mathematics scores.Twelve years later, with no change in the populationdemographics, the two schools were third and fourth in the city,scoring above national averages. Truancy and disciplineproblems also decreased (Comer, 1988). A follow-up studycomparing children in the schools to children in matchedschools without the intervention found higher achievement andsocial competence scores among the intervention students(Cauce, Comer, and Schwartz, 1987).
3-10
Middle and High School Programs Providing Normative Drug Education,Social Influence and Resistance Skills, and General Social Competence
Young people in middle and high school are struggling with:critical life decisions about educational and vocational goalsand lifestyles; intimate connections outside the family;developing autonomy from the family; and coping withemerging sexuality (Elliot and Feldman, 1990). In all thesetasks, the influence of peers is as or more important than theinfluence of parents. Research has also shown that early firstuse of substances is strongly associated with later problemuse (Kandel, Yamaguchi, and Chen, 1992). So delaying theage of initiation becomes an important prevention target,particularly during the teenage years when substance usebecomes most likely.
Therefore, risk interventions directed towards adolescentsfocus on delaying the early onset of use and problem use byaffecting social influences to use drugs, social normsregarding use, and attitudes favorable to use. Two types ofinterventions with demonstrated promise are: (1) programswhich focus on learning about social influences and changingsocial norms about use and (2) programs which focus onenhancing social competence.
The Adolescent AlcoholPrevention Trial showedthat normative educationhad the greatest effecton reducing drinking,marijuana use andsmoking.
The Adolescent Alcohol Prevention Trial (Hansen andGraham, 1991) examined the relative effects of socialinfluence and social norm change strategies in anexperimental study in twelve junior high schools. The schoolswere divided into groups defined by size, test scores, andethnic composition. Classrooms were randomly chosen toreceive one of four types of programs: (1) information aboutdrug use (2) training in skills to resist peer and advertisingpressure to use (3) a normative education program and (4) acombination of information, resistance skill training, andnormative education. The results indicated that the normativeeducation had the greatest effect on reducing drinking,marijuana use and smoking.
Results from anotherstudy suggest that theeffectiveness ofnormative education maybe reversed in youth athighest risk.
Other researchers have suggested that establishing clearsocial norms against use is an important part of substanceabuse prevention (Ellickson and Bell, 1990) and several havesuggested using peer leaders in teaching (Perry et al., 1989;Botvin et al., 1990). However, young people who are alreadyalienated from their peers and from school, and who havealready been exposed to multiple risks, may respond tonormative education by increasing their alcohol and other druguse. Specifically, Ellickson and Bell (1990) found that whiletheir curriculum was effective in delaying initiation amongthose 7th graders who had not yet begun smoking, theircurriculum increased tobacco use among those alreadysmoking.
3-11
Intervention students in thePositive YouthDevelopment Program hadhigher teacher ratings ofimpulse control and conflictresolution than controlstudents. Interventionstudents reported lowerrates of heavy alcohol usethan control students,though the two did notdiffer in self-reportedinitiation of alcohol,tobacco or marijuana.
Social competence strategies may be more effective with thishigh-risk group. These programs focus on teaching a broadarray of generic life skills, such as social problem-solving, stressreduction, self-regulation, social interaction, and assertiveness(Botvin, 1990). Some of the “psychosocial skill” preventionprograms discussed by Emshoff (1996) may represent theseapproaches.
The Positive Youth Development Program (Caplan andWeissberg et al., 1992) randomly assigned classrooms in oneurban and one suburban middle school to a “control” (nointervention) or “intervention” condition. The interventionconsisted of 20 sessions, two lessons per week. According totheir teachers, the students who received the intervention hadbetter impulse control and conflict resolution than controlstudents. The intervention students themselves reported lessintent to use alcohol and lower rates of heavy alcohol use thandid the controls, though the two groups did not differ in self-reported initiation of alcohol, tobacco or marijuana.
Several researchers have examined implementation issuesaround social competence strategies (Botvin et al., 1984; 1990;Botvin and Eng, 1990; Perry et al., 1989). These studies suggestthat peer-led programs may be more effective than teacher-ledprograms and that booster sessions are important for long-termimpacts.
Community-Wide Efforts to Reduce Availability or Restrict Access
Increasing drinking agesled to lower alcohol useand fewer alcohol-relatedcrashes.
Manipulating use through legalization, increasing costs orrestricting access are not new strategies, but there is somerecent evidence which suggests that such measures have bothshort-term and long-term impacts on use and harm reduction.
Increasing the drinking age to 21 years of age was associatedboth with lower levels of alcohol use among high school seniorsand recent graduates, and with lowered involvement in alcohol-related fatal crashes among drivers under 21 (O’Malley andWagenaar, 1991). These lower use levels persisted into theearly twenties, beyond the legal drinking age.
A study from the 1980s examining the effect of legislationpermitting patrons to buy distilled spirits by the drink showedincreases in both consumption and the frequency of alcohol-related car accidents (Holder and Blose, 1987).
3-12
Community-Wide Efforts with Multiple Components
These community-wide programs focus on involving theentire community and its multiple parts in an interconnectedprevention effort. These efforts are really the substanceabuse prevention frontier, since the evidence on multiplepathways to abuse suggests that no single risk reductionstrategy carried out in isolation can be very effective.Instead, multi-strategy approaches which address multiplerisks while enhancing protection hold the most promise.
The partial evaluation ofthe Midwestern PreventionProgram showed that thecomplete intervention wasmore effective than mediaexposure alone in reducingweekly use of cigarettes,alcohol and marijuanaafter the second year ofintervention, and monthlyuse of cigarettes andmarijuana three years afterthe intervention
An early example is provided by the Midwestern PreventionProgram, in which Pentz and her colleagues (1989) tested acurriculum change for students in grades 6 and 7 which alsoinvolved homework assignments with parents, boostersessions in the year after the intervention, organizational andtraining opportunities for parents in positive parent-childcommunication; training of community leaders to organizedrug abuse prevention task forces, and news coverage viaarticles, television clips, and a press conference. Thecomplete intervention was more effective than mediaexposure alone in reducing weekly use of cigarettes, alcoholand marijuana after the second year of intervention, andmonthly use of cigarettes and marijuana three years after theintervention (Johnson et al., 1990).
Because of its design, the Midwestern Prevention Programcannot answer questions about the relative contribution of thevarious components. Studies currently underway by CherylPerry and her colleagues at the University of Minnesota andDennis Ary and Tony Biglan at the Oregon Research Instituteare also using community mobilization and empowermentmodels to address substance abuse risks. They areexpected to provide important information on the effects ofthis strategy” (Hawkins, Arthur, and Catalano, 1995, page405).
Hawkins and Catalano and their colleagues are currentlyworking in collaboration with sixty communities in Washingtonand Oregon. Their program is designed to mobilizecommunities to achieve significant self-defined reductions inadolescent health and behavior problems. The mobilizationhas three phases:1) Establish an oversight board of key community leaders.2) Form and train a community prevention board responsible
for• gathering archival and survey data similar to that
presented in this report,• prioritizing risk factors for preventive action, and• designing a prevention strategy.
3) Implement, monitor and evaluate the prevention strategy,using subsequent years of archival and survey data.
3-13
Most Important Points to Remember In Planning Prevention Interventions
The next chapters present the data on risk and protectionwhich have been assembled to assist you in planningsubstance abuse prevention for your county. As you work tounderstand and use the data, keep these basic principles ofrisk and protection-focused prevention in mind:
• The more risk factors, the greater the risk. Therefore,prevention efforts must coordinated, and those at highest riskmust be an important target for prevention interventions.
• Risk factors exist in multiple environmental domains.Therefore, prevention strategies should attempt to take alldomains into account.
• Protective factors buffer exposure to risk. Therefore,prevention efforts should enhance protection, particularlyamong those exposed to greatest risk.
• The relative importance of risk and protective factorsvaries with age and stage of development. Therefore,prevention strategies should be designed around thedevelopmental stage of the target population.
• Common risk factors predict diverse behavior problems.Therefore, it may be cost-effective to share prevention effortsamong agencies.
• Risk and protective factors operate similarly acrossdifferent races, cultures and classes. However, to beeffective, prevention programs must be developed in aculturally competent way.

4-1
4 UNDERSTANDING AND USING THE INFORMATION COLLECTED
Presentation of Archival Indicator and School Survey Data in this Report
County indicator rates arecompared to the indicatorrate for a group of similarcounties and for the statein Chapters 5, 6, and 7.
In Chapters 5 through 8, archival indicator data and schoolsurvey data are presented in a logical sequence of increasingcomplexity and utility. Actual indicator rates, or school surveymeasures where no indicator data were available, arepresented for each risk factor (Chapter 5) and protective factor(Chapter 6). Actual rates for the additional indicators ofsubstance abuse and other problem behaviors follow (Chapter7). The bar graphs in these three chapters allow evaluation ofeach county-level indicator rate against the corresponding ratefor a set of similar counties and for the state.
Although information on actual rates provides for interestinganalysis indicator by indicator, it does little to help assess therelationship of different indicators to each other or therelationship of a group of indicators to a risk factor. Suchrelationships are critical to prevention planning, because riskand protective factors are actually the planning targets, ratherthan individual indicators.
Standardized measures ofcounty indicators andregional school surveymeasures, which allow thelevel of one indicator to becompared to the level ofanother, are provided inChapter 8.
Summary measures foreach risk factor which offera means for comparinglevels of risk factors arealso provided in Chapter 8.
To facilitate more comprehensive analysis of risk and protectivefactors, indicator rates and school survey measures have beenstandardized and are presented graphically (Chapter 8).Standardization transforms different measures to a commonscale so that indicators and survey measures may becompared to each other in terms of their relative distanceabove or below the state rate.
Standardized measures may also be averaged to form asummary measure for a group of related measures. Thus, asingle summary measure was calculated for every risk factorhaving more than one associated indicator. The risk factorsummary measures are presented together at the end ofChapter 8.
In total, this report presents actual and standardized indicatorrates or school survey average scores for:• 53 county-level indicators of risk,• 4 regional-level school survey measures of risk,• 7 regional-level school survey measures of protection,• 10 additional county-level indicators of substance abuse
and other problem behaviors, and• 17 summary measures of risk factor constructs
4-2
Where did the Data Come From?
Indicator data in this reportare drawn from the CORE-GIS database developedjointly between theDepartment of Social andHealth Services and TheDepartment of Health
Federal support from the Center for Substance AbusePrevention (CSAP) made possible the collection ofcounty-level risk and protective factor indicators and theproduction of this report by the Department of Social andHealth Services. The data collection effort was alsosupported by the Youth Violence Reductions ProgramsAct (ESHB 2319), which charged the Department ofHealth with providing an assortment of indicatorsempirically related to eight problem outcomes to the newlyorganizing Community Public Health and SafetyNetworks.
Since the CSAP-funded project had already beguncollecting data under a similar mandate, the two agenciesagreed to jointly develop a comprehensive indicatordatabase for youth problem behaviors, risks andprotection. The resulting database is called theCommunity Risk and Evaluation - Geographic InformationSystem (CORE-GIS). Reports for the networks containingdata drawn from the CORE-GIS were completed in 1994and 1995 (Flewelling, Kohlenberg, and Howards, 1994;Zechmann, Flewelling, and VanEenwyck, 1995).
Data from over thirty separate sources are now includedin CORE-GIS (a complete list of indicators, yearscollected, geographic level and sources may be found inAppendix F.) These data were requested at the finestavailable geographic level (such as test scores by schooldistrict or youth arrests by police jurisdiction) and withdemographic breakdowns if possible. Once received,data were transformed into county-level files using GISsoftware. Where source areas cross county boundaries,the events in question were “apportioned” to each countybased upon the geographic and demographic distributionof the population in the area of overlap.
Using Rates for ComparisonsInformation about one community is most useful when itcan be compared to other communities like itself or to alarger region of which it is a part, such as the state.Comparisons, of course, require the calculation of rateswhich show the extent of the problem within a populationand control for differences in population size.
Rates are calculated by dividing a numerator (the numberof events or occurrences) by a denominator (the totalpopulation or universe that is relevant to the numerator)and multiplying by a constant. Multiplying by 100 providesa rate per hundred, or percentage. Other multipliers are1,000 or 100,000, providing rates per 1,000 or 100,000.

4-4
Comparing County Rates to Rates for the State and “Counties Like Us”
Three urban and threerural groups of countieswere chosen to be“Counties Like Us” so thatcounties would have ameaningful rate other thanthe state rate forcomparison.
Having controlled for differences in population size byusing rates, counties may compare their rates to the ratesof other areas. Typically, counties compare themselvesto a state rate, even though the state rate is heavilyinfluenced by the large populations of a few largecounties - a bias that is important when urban rates differsubstantially from rural rates. Because of this limitation,this report provides an additional comparison group forcounties, the “Counties Like Us.” These countygroupings are as follows:
• Urban A. King County.
• Urban B. Pierce, Snohomish, and Spokane Counties.
• Urban C. Benton, Clark, Kitsap, Thurston, Whatcom,and Yakima Counties.
• Rural A. Ferry, Franklin, Grant, Klickitat, Okanogan,Pend Oreille, and Skamania Counties
• Rural B: Adams, Asotin, Chelan, Columbia, Douglas,Garfield, Kittitas, Lincoln, Stevens, Walla Walla, andWhitman Counties.
• Rural C: Clallam, Cowlitz, Grays Harbor, Island,Jefferson, Lewis, Mason, Pacific, San Juan, Skagit,and Wahkiakum Counties.
The county groupings for “Counties Like Us” used countycharacteristics that were related to the scope ofprevention planning. A variety of groupings wereexamined, but the one finally chosen was based uponthree distinguishing county attributes: population ofyoung persons, alcohol- and drug-related deaths as apercent of all deaths, and the geographicEastern/Western Washington split. Appendix H showshow those groups were determined.
Regions of Analysis for School Survey ResultsRegional school surveymeasures are provided forthe four risk factors with noarchival indicators and forall seven protectivefactors. However, suchregional estimatesgenerally mask variation inresponses at the countylevel.
Analysis regions in the school survey differ from thegroups of counties chosen as “Counties Like Us.”Regions for the school survey were designed to havesimilar student counts for sampling purposes whilebalancing urbanicity and geographic contiguity. Regionalgroupings of counties for analysis of school surveyinclude:
• Puget Sound: King, Kitsap, and Pierce Counties
• Northwest: Island, San Juan, San Juan, Snohomish,and Whatcom Counties
4-5
• Southwest: Clallam, Clark, Cowlitz, Grays Harbor,Jefferson, Lewis, Mason, Pacific, Skamania, Thurston,and Wahkiakum Counties
• Eastern: Adams, Asotin, Benton, Chelan, Columbia,Douglas, Ferry, Franklin, Garfield, Grant, Kittitas,Klickitat, Lincoln, Okanogan, Pend Oreille, Spokane,Stevens, Walla Walla, Whitman, and Yakima Counties
While measures based on the regional school survey datafor protective factors and four risk factor are included inthis report, it should be noted that these are not county-specific measures, but average measures across thecounties in the region, weighted by county enrollment.Indicator levels may vary substantially across the countiesused to create the regional estimates.
Small Numbers and Years of Data Used in Rate CalculationsIndicator rates based uponsmall numbers of events willresult in substantial year toyear variation and confoundcomparisons to other areas.
A primary consideration when developing comparativerates is which year, or years, of data to use in thecalculation. A first assumption might be to use only themost recent year of available data since the most recentyear would be more likely to reflect the current status ofthe community. However, the desire for recency must alsobe balanced with a desire for stable rates.
Indicator rates based upon small numbers of events willresult in substantial year to year variation and confoundcomparisons to other areas. Such instability is morepronounced in smaller counties where the number ofindicator events (such as felony drug arrests, adults oradolescents in drug treatment, violent crimes, births toteen mothers, and others) are often small in actualnumber. Rates among indicators collected for this reportappeared reasonably stable when there were at least 30events recorded in the numerator.
For this report, recency ofdata and the problem ofsmall numbers are balancedby basing all rates on datafrom 1990 forward.
In this report, if there are 30or fewer events over theyears of data used, the rateis considered unstable andis not reported. An ‘NR’ willappear in place of the rate.
For this report, recency of data and the problem of smallnumbers are balanced by basing all rates on data from1990 forward. Thus, if data are available from 1990through 1993, the rate presented is calculated by summingthe four annual numerators and dividing by the sum of thefour annual denominators. In a few situations, rates arenot available or not reliable for smaller counties:
Not Reported: While rates for most indicators can bereported reliably in most counties, there are still someindicators which have fewer than 30 total events over theyears of available data for that indicator. Since ratesbased on so few events are considered unstable, the rateis not reported and ‘NR’ appears in place of the rate.
4-6
Notes of Caution
Sometimes, increases inreporting of a problembehavior may be in part dueto an enhanced publicawareness of a problem.
There are some cautions which should be kept in mindwhen using these data for planning. They include:
Changes in Public Awareness of Problem Behavior.Sometimes, increases in reporting of a problem behaviormay be in part due to an enhanced public awareness of aproblem. For example, after a highly publicized childabuse death in 1986, calls to Child Protective Servicesincreased dramatically for six months, and then dropped topre-1986 levels. Similarly, a highly publicized domesticmurder often leads to increased reports of domesticviolence. These increases, however, probably do notsignal dramatic changes in the underlying rate of childabuse or domestic violence. Instead, increased reportingprobably reflects growing public awareness of theseproblems and an increased willingness to report them orask for help.
Supply of services maychange while the demandfor services stays the same.
There are likely to be someerrors in our data sources.
Other External Influences on Indicator Levels.Changes in the supply of services when services are indemand may also result in increased rates without actuallychanging problem levels. For example, in an area of highdemand for substance abuse treatment, a new orexpanded treatment facility would allow more persons tobe served. Although the number of persons served rises,the underlying need for treatment may not have changed.
Undetected Errors in the Source Data. Large volumesof information are included in the source databases fromwhich these data are drawn. Some errors in these dataare to be expected. Errors may include:
• events not reported and therefore not included in thedatabase;
• misclassification or incorrect coding of events; and
• errors incurred in the compilation and processing of thedata.
Because this report relies on data collected by others, it isnot possible to check and edit the source data. Theproject staff took steps to minimize the possibility of errorin compiling and processing source data and translation tocounty totals. First, state totals provided by the sourceswere matched with the state totals from the CORE-GISdatabase. Second, CORE-GIS county totals werecompared to county reports published by the source wherepossible.
4-7
Some police jurisdictions donot report arrest data.
Non-reporting of Arrest Data. The arrest data in thisreport were obtained from the Washington Association ofSheriffs and Police Chiefs (WASPC), which serves asthe reporting agency for the state to the FBI’s UniformCrime Reporting Program. Most, but not all, lawenforcement agencies report arrest data to WASPC.The list of non-reporting agencies may change from yearto year, and in some instances, agencies have reportedonly adult arrests or only juvenile arrests. Furthermore,there are some cases in which agencies reported forsome but not all months of the year.
Non-reporting of arrest datais significant in somecounties.
For most counties, non-reporting agencies only cover asmall percentage of the population and, therefore, arenot expected to significantly influence the reported arrestrates. However, there are some counties for which, incertain years, non-reporting agencies cover a significantpercentage of the county. For these counties, thereported arrest rates probably do not reflect the countyas a whole. Appendix I lists the counties where arrestrates are based on less than 80% of the population.
Two additional cautions concerning UCR data shouldalso be kept in mind. Arrests are reported according tothe location of the incident rather than the place ofresidence of the person arrested. Therefore, individualsarrested do not necessarily live within the jurisdiction oreven the county in which they were arrested. Counties inwhich there are a relatively large number of arrests ofnon-residents may tend to have higher arrest rates,because the rates are based on the resident population.Secondly, the number of arrests for the age groups aged10-14 and 10-17, by definition, does not include arrestsof children under age 10 and therefore will not matchexactly with published data on juvenile arrests, whichinclude all juveniles including those under age 10.
The indicator, AverageLength of Prison Sentence,cannot be calculated whenthere are no prisonsentencings. NE, for NoEvents, is displayed whenno sentencings occurred.
No Felony Drug Sentencings: If no persons weresentenced for felony drug offenses during a particularyear, the numerator, denominator, and rate for theindicator Average Length of Prison Sentence contain“NE” for No Events in the Annual Data Tables (AppendixJ). This occurs mostly in smaller counties. The 1990-95average value is based only on years when there weresentencings for drug offenses.
4-8
Guidelines for Interpreting the DataUnderstanding andassessing the individualindicators is the first step.
Pattern of Rates: A first interpretive step is to look at allindicators which represent a risk factor to see if there is apattern of falling above or below the rates for the state orfor “Counties Like Us”. If all the indicators for a particularrisk factor are greater than the state or similar countyaverages, one could assume that the risk factor has arelatively high level in the county. Likewise, lower thanaverage rates on all risk indicators would suggest that risklevels for that factor are lower in the county.
There are several counties where indicators for a singlerisk factor may point in different directions. Knowledge oflocal conditions is necessary to interpret these sorts offindings. For example, in several counties, overall povertyrates are low relative to the state average, but the rate ofpersons who have exhausted their unemploymentbenefits relative to all unemployed persons is high. Thisprobably means a generally good job market, but onewhich contains a concentration of people who lack theskills to find or keep work in that market.
Standardized measuresallow comparisons acrossindicators that aremeasured in very differentways.
Examine the Standardized Indicators and Factors: Forprevention planning, it is often important to compare allthe indicators in a county with each other, and determinewhich rates deviate most from the state measures.Standardized measures (presented in Chapter 8)transform the original absolute rates to a common scale ofmeasure, and allow indicators to be compared readily witheach other1.
The standardized measures used in this report representthe relative deviation from the state rate. For a particularindicator, the county having the highest rate for anindicator will have the highest standardized measure.The value of the standardized measure for a specificcounty is dependent upon how much the other countyrates deviate from the state rate. For example, if mostcounty rates are close to the state rate and a few deviatesubstantially, the few that deviate will have very largestandardized measures and the others rather small. If thevariation in county rates around a state rate is moreevenly distributed, standardized measures will also bemore evenly distributed for that indicator.
1 Creating a standardized measure involves subtracting an observed rate (a county rate or a “Counties Like Us” rate) from the rate to whichit is compared (the state rate) and then dividing that difference by a value that controls for the amount of variation in the indicator. Theformula used to standardize indicator values in this report appears below. This formula is similar to the commonly-used z-score. Calculationof a z-score would use the average of allcounties rather than the state rate forcomparison. It seems more meaningful,however, for counties to be able to comparethemselves to the state rate than an averagerate where counties of very different size aregiven equal weight.
std measurecounty state
county state
N
rate rate
rate i rate
i
N_
( )_
= −
−=∑ 2
1
, where N = 39 counties.
4-10
For the most part, standardized measures in this reportrange between -2 and 2. Some do extend beyond thisrange and are labeled as such in the appropriate graphs.The important point is that standardized measures allowindicators measured in very different ways to becompared.
Standardized values of risk indicators also may beaveraged to provide a summary measure for the riskfactor as a whole. When more than one indicator ispresent for a risk factor, such a summary measure iscreated.
Remember That School Surveys are Regional RatesRather than County Rates: In Washington State, theschool survey on drug use and other health-relatedbehaviors is designed only to produce estimates for fourregions consisting of combinations of counties. However,because no archival data sources for measuring four ofthe risk factors or any of the protective factors wereidentified, we have included in this report some regional-level risk and protective factor measures derived from the1993-94 school survey. Counties and smallercommunities could obtain individually based measures ofrisk and protection at the local level by encouragingparticipation of local schools in the biannual schoolsurvey.
Even if a risk factor isbelow average, it may stillbe unacceptably high tocounty planners.
Think About Comparative versus Absolute Rates:Comparisons to state and “Counties Like Us” arepresented together with the county rates in Chapters 5, 6,7, and 8. These comparisons help to flag indicators ratesthat are relatively high or low for any given county.
However, information about your county’s relativestanding on particular risk and protective factors need notbe the only criterion on which needs assessment andplanning decisions are made. Another consideration isthe absolute level of each risk factor. For example, evenif a county’s high school dropout rate is below average, itmay still be unacceptably high. To the extent that this riskfactor is known or believed to be a strong predictor offuture drug use and other problem behaviors, and affectsa significant number of individuals in a county, it may stillbe an appropriate target for prevention.

4-11
Overview of Graphic Displays of Indicator Data
In Chapter 5, bar graphs of actual, or absolute, rates forrisk indicators are grouped by domain and then risk factor.Protective factors are presented in Chapter 6, followed bythe additional indicators of problem behavior in Chapter 7.Detailed definitions of each indicator appear beside thesebar graphs including reference to their data sources.Sources are listed numerator first, followed bydenominator. If only one source is listed, all informationwas obtained or derived from the same source.
Chapter 8 contains bar graphs of standardized measuresof each indicator. A summary measure is also presentedfor each risk factor having more than one indicator. Thelast two graphs in this section show all the standardizedsummary measures together.

5 INDICATOR DATA FOR RISK FACTORS
Walla Walla County, Counties Like Us1,and Washington State
Community Domain
Availability of Drugs ........................................................................................... 5-3Community Laws and Norms............................................................................. 5-4Low Neighborhood Attachment & Community Disorganization ......................... 5-5Transitions and Mobility .................................................................................... 5-6Extreme Economic and Social Deprivation ....................................................... 5-8
Family Domain
Family History of High Risk Behavior .............................................................. 5-12Family Management Problems........................................................................ 5-14Family Conflict ................................................................................................. 5-16Favorable Parental Attitudes and Involvement in Crime & Drugs ................... 5-18
School Domain
Lack of Commitment to School........................................................................ 5-21Academic Failure............................................................................................. 5-22Early and Persistent Antisocial Behavior 2 ....................................................... 5-24
Individual / Peer Domain
Alienation, Rebelliousness, and Lack of Social Bonding ................................ 5-25Early Initiation of the Problem Behavior .......................................................... 5-26Friends Who Engage in the Problem Behavior 2.............................................. 5-28Favorable Attitudes Toward the Problem Behavior 2........................................ 5-29Constitutional Factors2 .................................................................................... 5-30
1 Adams, Asotin, Chelan, Columbia, Douglas, Garfield, Kittitas, Lincoln, Stevens, Walla Walla,and Whitman Counties
2 Regional school survey data are presented for these risk factors. Walla Walla County belongsto the East school survey region which includes: Adams, Asotin, Benton, Chelan, Columbia,Douglas, Ferry, Franklin, Garfield, Grant, Kittitas, Klickitat, Lincoln, Okanogan, Pend Oreille,Spokane Stevens, Walla Walla, Whitman, and Yakima Counties
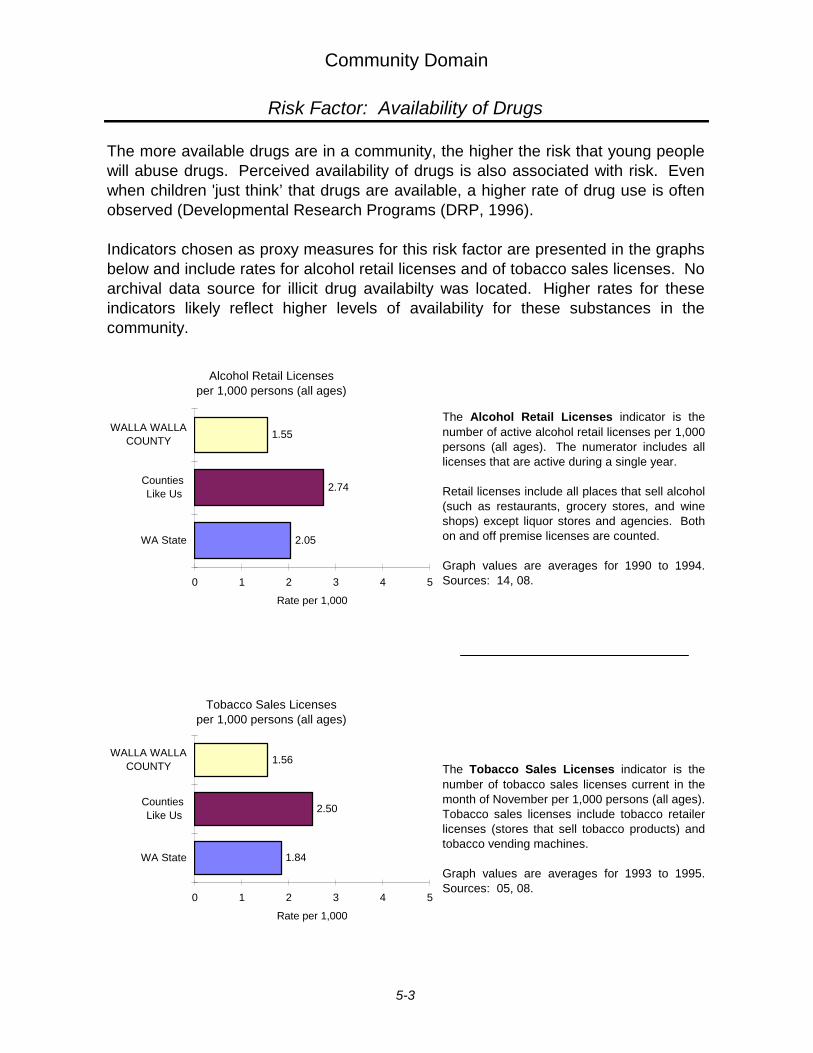
Community Domain
Risk Factor: Availability of Drugs
The more available drugs are in a community, the higher the risk that young peoplewill abuse drugs. Perceived availability of drugs is also associated with risk. Evenwhen children 'just think’that drugs are available, a higher rate of drug use is oftenobserved (Developmental Research Programs (DRP, 1996).
Indicators chosen as proxy measures for this risk factor are presented in the graphsbelow and include rates for alcohol retail licenses and of tobacco sales licenses. Noarchival data source for illicit drug availabilty was located. Higher rates for theseindicators likely reflect higher levels of availability for these substances in thecommunity.
The Alcohol Retail Licenses indicator is thenumber of active alcohol retail licenses per 1,000persons (all ages). The numerator includes alllicenses that are active during a single year.
Retail licenses include all places that sell alcohol(such as restaurants, grocery stores, and wineshops) except liquor stores and agencies. Bothon and off premise licenses are counted.
Graph values are averages for 1990 to 1994.Sources: 14, 08.
The Tobacco Sales Licenses indicator is thenumber of tobacco sales licenses current in themonth of November per 1,000 persons (all ages).Tobacco sales licenses include tobacco retailerlicenses (stores that sell tobacco products) andtobacco vending machines.
Graph values are averages for 1993 to 1995.Sources: 05, 08.
006p
2.05
2.74
1.55
0 1 2 3 4 5
WA State
Counties Like Us
WALLA WALLACOUNTY
Rate per 1,000
Alcohol Retail Licensesper 1,000 persons (all ages)
008a_p
1.84
2.50
1.56
0 1 2 3 4 5
WA State
Counties Like Us
WALLA WALLACOUNTY
Rate per 1,000
Tobacco Sales Licensesper 1,000 persons (all ages)
5-3
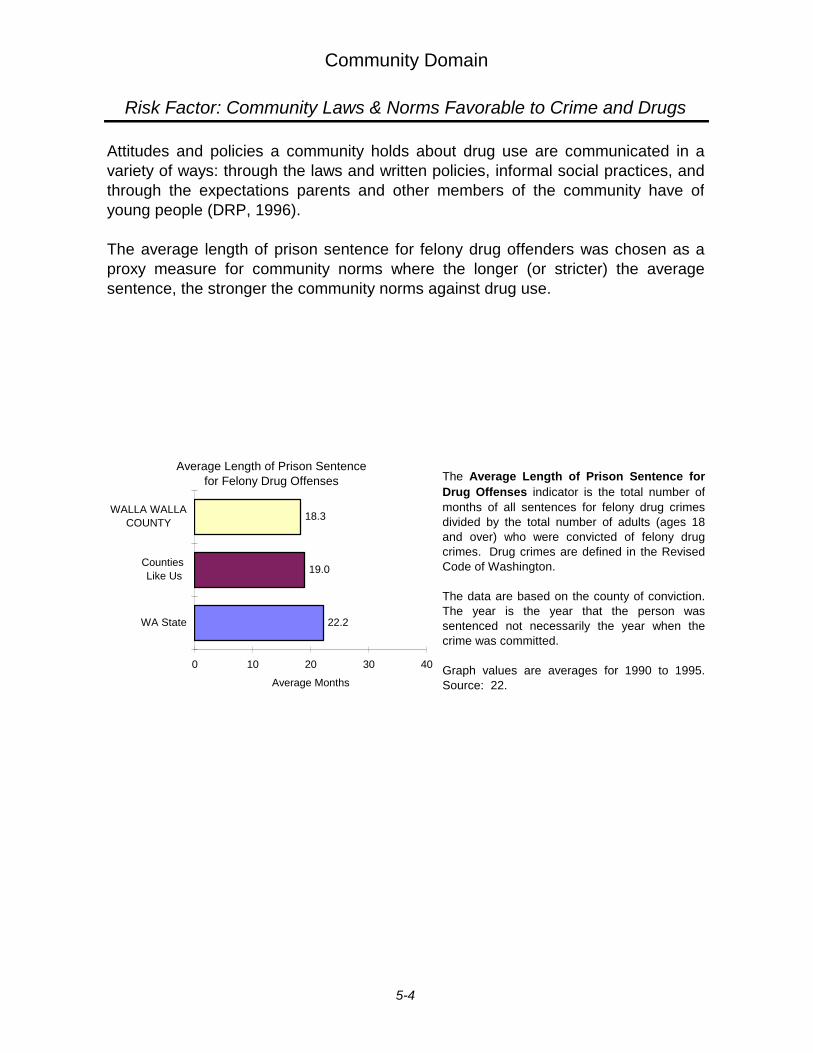
Community Domain
Risk Factor: Community Laws & Norms Favorable to Crime and Drugs
Attitudes and policies a community holds about drug use are communicated in avariety of ways: through the laws and written policies, informal social practices, andthrough the expectations parents and other members of the community have ofyoung people (DRP, 1996).
The average length of prison sentence for felony drug offenders was chosen as aproxy measure for community norms where the longer (or stricter) the averagesentence, the stronger the community norms against drug use.
The Average Length of Prison Sentence forDrug Offenses indicator is the total number ofmonths of all sentences for felony drug crimesdivided by the total number of adults (ages 18and over) who were convicted of felony drugcrimes. Drug crimes are defined in the RevisedCode of Washington.
The data are based on the county of conviction.The year is the year that the person wassentenced not necessarily the year when thecrime was committed.
Graph values are averages for 1990 to 1995.Source: 22.
016b
22.2
19.0
18.3
0 10 20 30 40
WA State
Counties Like Us
WALLA WALLACOUNTY
Average Months
Average Length of Prison Sentence for Felony Drug Offenses
5-4
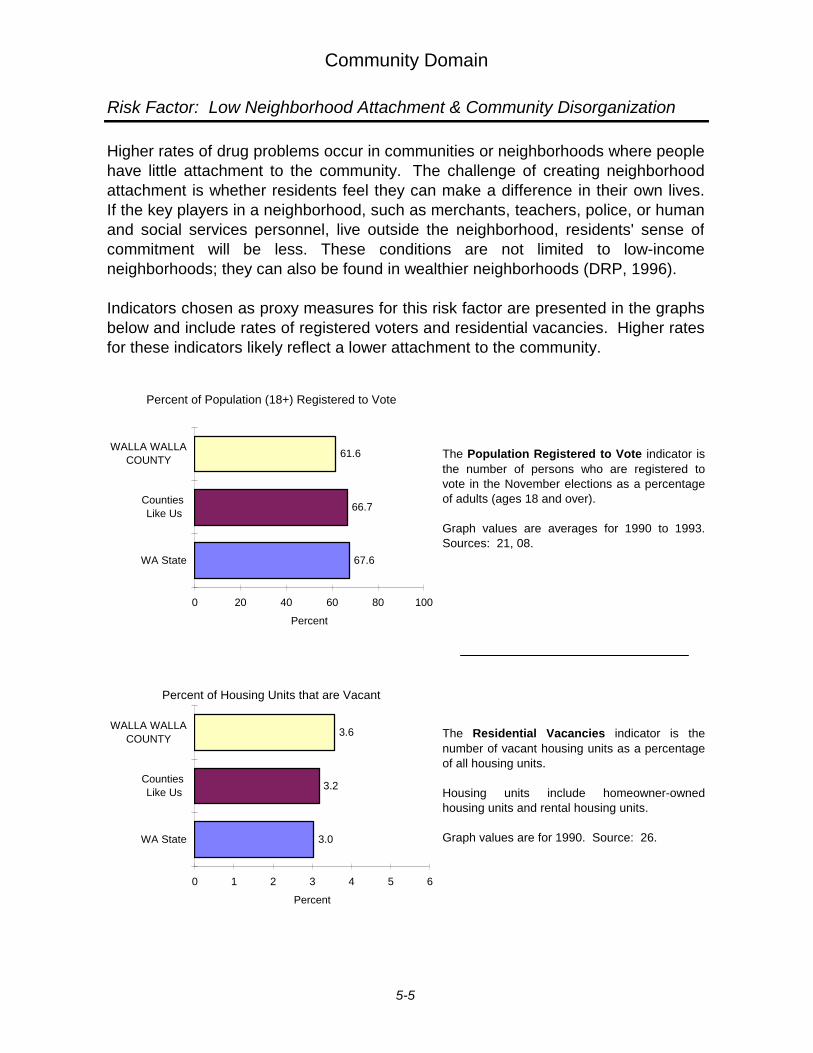
Community Domain
Risk Factor: Low Neighborhood Attachment & Community Disorganization
Higher rates of drug problems occur in communities or neighborhoods where peoplehave little attachment to the community. The challenge of creating neighborhoodattachment is whether residents feel they can make a difference in their own lives.If the key players in a neighborhood, such as merchants, teachers, police, or humanand social services personnel, live outside the neighborhood, residents' sense ofcommitment will be less. These conditions are not limited to low-incomeneighborhoods; they can also be found in wealthier neighborhoods (DRP, 1996).
Indicators chosen as proxy measures for this risk factor are presented in the graphsbelow and include rates of registered voters and residential vacancies. Higher ratesfor these indicators likely reflect a lower attachment to the community.
The Population Registered to Vote indicator isthe number of persons who are registered tovote in the November elections as a percentageof adults (ages 18 and over).
Graph values are averages for 1990 to 1993.Sources: 21, 08.
The Residential Vacancies indicator is thenumber of vacant housing units as a percentageof all housing units.
Housing units include homeowner-ownedhousing units and rental housing units.
Graph values are for 1990. Source: 26.
32
67.6
66.7
61.6
0 20 40 60 80 100
WA State
Counties Like Us
WALLA WALLACOUNTY
Percent
Percent of Population (18+) Registered to Vote
33_34
3.0
3.2
3.6
0 1 2 3 4 5 6
WA State
Counties Like Us
WALLA WALLACOUNTY
Percent
Percent of Housing Units that are Vacant
5-5
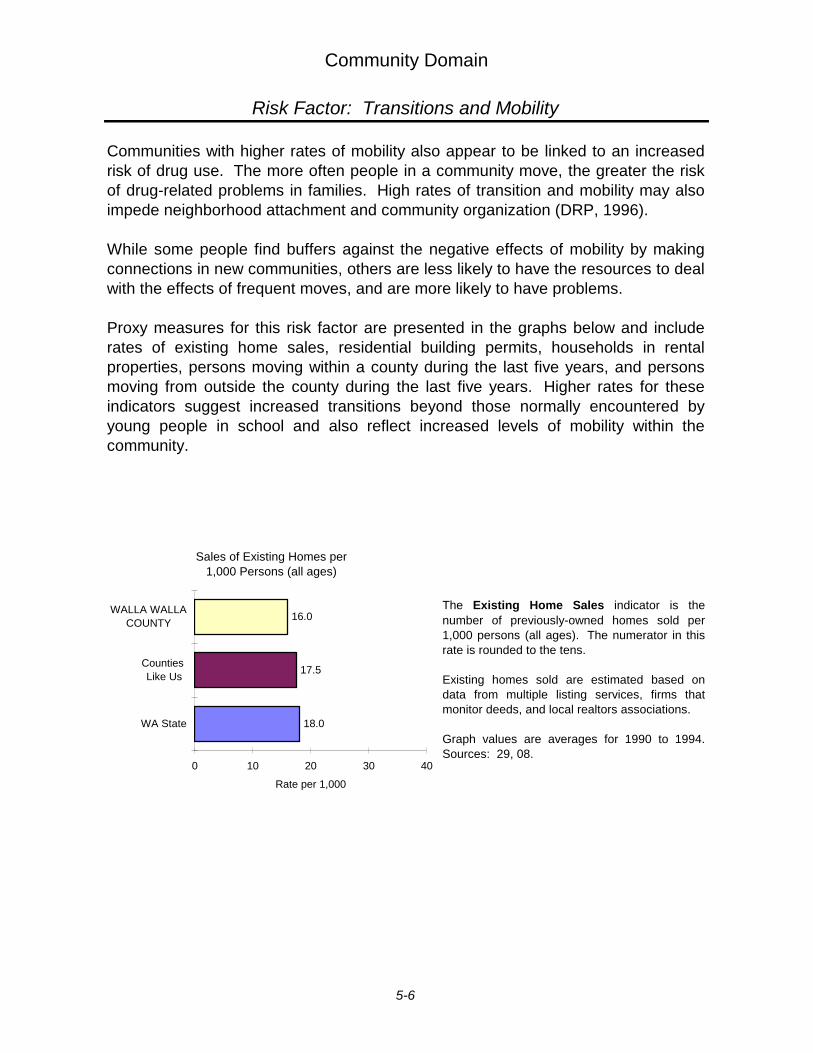
Community Domain
Risk Factor: Transitions and Mobility
Communities with higher rates of mobility also appear to be linked to an increasedrisk of drug use. The more often people in a community move, the greater the riskof drug-related problems in families. High rates of transition and mobility may alsoimpede neighborhood attachment and community organization (DRP, 1996).
While some people find buffers against the negative effects of mobility by makingconnections in new communities, others are less likely to have the resources to dealwith the effects of frequent moves, and are more likely to have problems.
Proxy measures for this risk factor are presented in the graphs below and includerates of existing home sales, residential building permits, households in rentalproperties, persons moving within a county during the last five years, and personsmoving from outside the county during the last five years. Higher rates for theseindicators suggest increased transitions beyond those normally encountered byyoung people in school and also reflect increased levels of mobility within thecommunity.
The Existing Home Sales indicator is thenumber of previously-owned homes sold per1,000 persons (all ages). The numerator in thisrate is rounded to the tens.
Existing homes sold are estimated based ondata from multiple listing services, firms thatmonitor deeds, and local realtors associations.
Graph values are averages for 1990 to 1994.Sources: 29, 08.
22
18.0
17.5
16.0
0 10 20 30 40
WA State
Counties Like Us
WALLA WALLACOUNTY
Rate per 1,000
Sales of Existing Homes per 1,000 Persons (all ages)
5-6

Community Domain
Risk Factor: Transitions and Mobility
The Residential Building Permits indicator isthe number of building permits for single andmulti-family dwellings per 1,000 persons (allages).
Each unit in a multi-family dwelling (for example,each apartment in a building) has a separatebuilding permit.
Graph values are averages for 1990 to 1993.Sources: 29, 08.
The Households in Rental Properties indicator is the number of rental households as apercentage of all households.
For this indicator, a household is defined as anoccupied residential housing unit.
Graph values are for 1990. Source: 26.
The Moved Within County During Last 5 Yearsindicator is the number of persons (ages 5 andover) who moved within the county between1985 and 1990 as a percentage of all persons(ages 5 and over).
The Moved From Outside County During Last5 Years indicator is the number of persons (ages5 and over) who moved from outside the countybetween 1985 and 1990 as a percentage of allpersons (ages 5 and over). Moving from outsidethe county includes moving from a differentcounty, state, or country.
Graph values are for 1990. Source: 27.
23
7.75
5.41
3.15
0 5 10 15
WA State
Counties Like Us
WALLA WALLACOUNTY
Rate per 1,000
Residential Building Permits Issued per 1,000 Persons (all ages)
25
37.4
37.2
37.7
0 25 50 75
WA State
Counties Like Us
WALLA WALLACOUNTY
Percent
Percent of Households in Rental Properties
Chart Title
25.8
30.5
28.3
21.8
28.5
24.8
0 25 50 75
WA State
Counties Like Us
WALLA WALLACOUNTY
Percent
2
1moved within county
moved from outside county
2
1
2
1
2
1
Percent of Persons Moving Within and From Outside the County, between 1985 and 1990
5-7
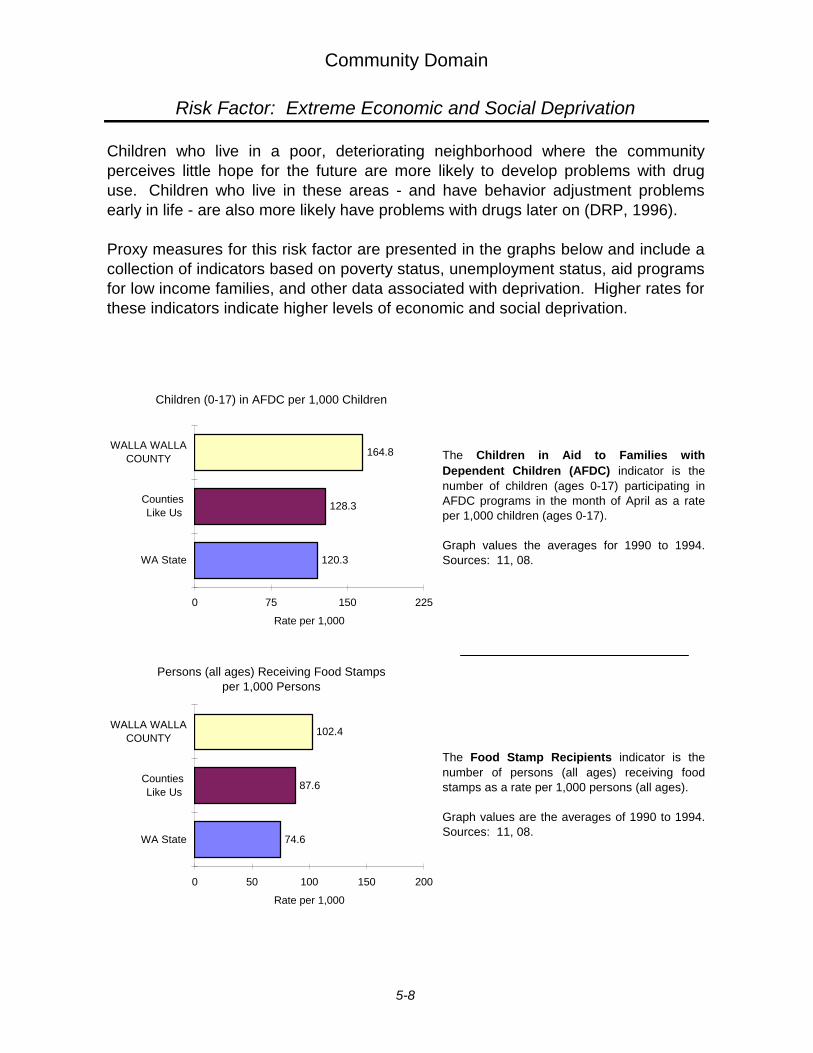
Community Domain
Risk Factor: Extreme Economic and Social Deprivation
Children who live in a poor, deteriorating neighborhood where the communityperceives little hope for the future are more likely to develop problems with druguse. Children who live in these areas - and have behavior adjustment problemsearly in life - are also more likely have problems with drugs later on (DRP, 1996).
Proxy measures for this risk factor are presented in the graphs below and include acollection of indicators based on poverty status, unemployment status, aid programsfor low income families, and other data associated with deprivation. Higher rates forthese indicators indicate higher levels of economic and social deprivation.
The Children in Aid to Families withDependent Children (AFDC) indicator is thenumber of children (ages 0-17) participating inAFDC programs in the month of April as a rateper 1,000 children (ages 0-17).
Graph values the averages for 1990 to 1994.Sources: 11, 08.
The Food Stamp Recipients indicator is thenumber of persons (all ages) receiving foodstamps as a rate per 1,000 persons (all ages).
Graph values are the averages of 1990 to 1994.Sources: 11, 08.
042b
120.3
128.3
164.8
0 75 150 225
WA State
Counties Like Us
WALLA WALLACOUNTY
Rate per 1,000
Children (0-17) in AFDC per 1,000 Children
43
74.6
87.6
102.4
0 50 100 150 200
WA State
Counties Like Us
WALLA WALLACOUNTY
Rate per 1,000
Persons (all ages) Receiving Food Stamps per 1,000 Persons
5-8
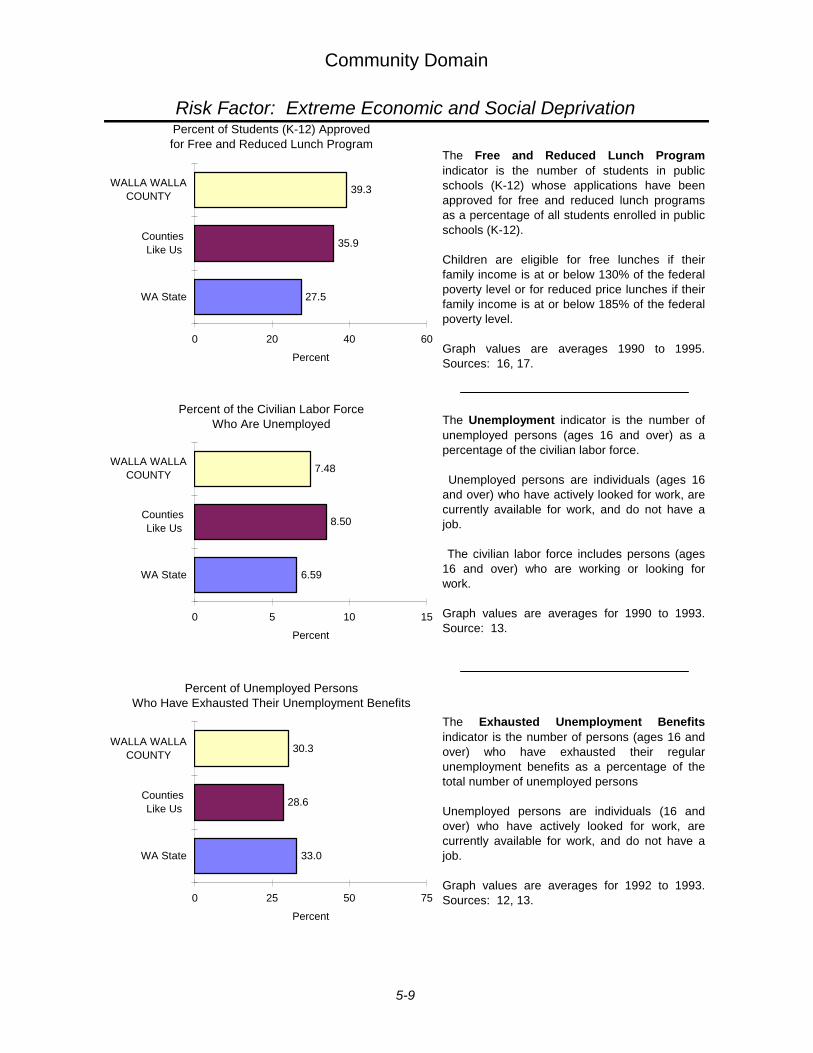
Community Domain
Risk Factor: Extreme Economic and Social Deprivation
The Unemployment indicator is the number ofunemployed persons (ages 16 and over) as apercentage of the civilian labor force.
Unemployed persons are individuals (ages 16and over) who have actively looked for work, arecurrently available for work, and do not have ajob.
The civilian labor force includes persons (ages16 and over) who are working or looking forwork.
Graph values are averages for 1990 to 1993.Source: 13.
The Exhausted Unemployment Benefitsindicator is the number of persons (ages 16 andover) who have exhausted their regularunemployment benefits as a percentage of thetotal number of unemployed persons
Unemployed persons are individuals (16 andover) who have actively looked for work, arecurrently available for work, and do not have ajob.
Graph values are averages for 1992 to 1993.Sources: 12, 13.
The Free and Reduced Lunch Programindicator is the number of students in publicschools (K-12) whose applications have beenapproved for free and reduced lunch programsas a percentage of all students enrolled in publicschools (K-12).
Children are eligible for free lunches if theirfamily income is at or below 130% of the federalpoverty level or for reduced price lunches if theirfamily income is at or below 185% of the federalpoverty level.
Graph values are averages 1990 to 1995.Sources: 16, 17.
39
6.59
8.50
7.48
0 5 10 15
WA State
Counties Like Us
WALLA WALLACOUNTY
Percent
Percent of the Civilian Labor Force Who Are Unemployed
33.0
28.6
30.3
0 25 50 75
WA State
Counties Like Us
WALLA WALLACOUNTY
Percent
Percent of Unemployed PersonsWho Have Exhausted Their Unemployment Benefits
41
27.5
35.9
39.3
0 20 40 60
WA State
Counties Like Us
WALLA WALLACOUNTY
Percent
Percent of Students (K-12) Approved for Free and Reduced Lunch Program
5-9
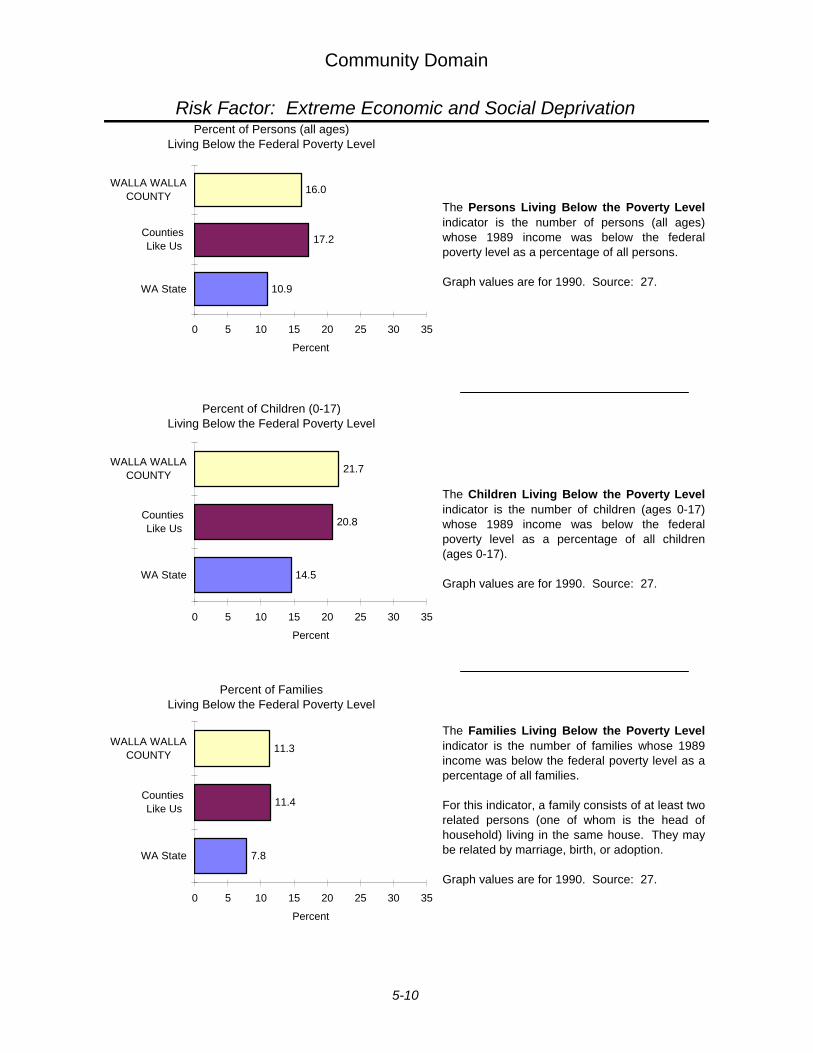
Community Domain
Risk Factor: Extreme Economic and Social Deprivation
The Persons Living Below the Poverty Levelindicator is the number of persons (all ages)whose 1989 income was below the federalpoverty level as a percentage of all persons.
Graph values are for 1990. Source: 27.
The Children Living Below the Poverty Levelindicator is the number of children (ages 0-17)whose 1989 income was below the federalpoverty level as a percentage of all children(ages 0-17).
Graph values are for 1990. Source: 27.
The Families Living Below the Poverty Levelindicator is the number of families whose 1989income was below the federal poverty level as apercentage of all families.
For this indicator, a family consists of at least tworelated persons (one of whom is the head ofhousehold) living in the same house. They maybe related by marriage, birth, or adoption.
Graph values are for 1990. Source: 27.
036a
10.9
17.2
16.0
0 5 10 15 20 25 30 35
WA State
Counties Like Us
WALLA WALLACOUNTY
Percent
Percent of Persons (all ages) Living Below the Federal Poverty Level
037a
14.5
20.8
21.7
0 5 10 15 20 25 30 35
WA State
Counties Like Us
WALLA WALLACOUNTY
Percent
Percent of Children (0-17) Living Below the Federal Poverty Level
038a
7.8
11.4
11.3
0 5 10 15 20 25 30 35
WA State
Counties Like Us
WALLA WALLACOUNTY
Percent
Percent of Families Living Below the Federal Poverty Level
5-10
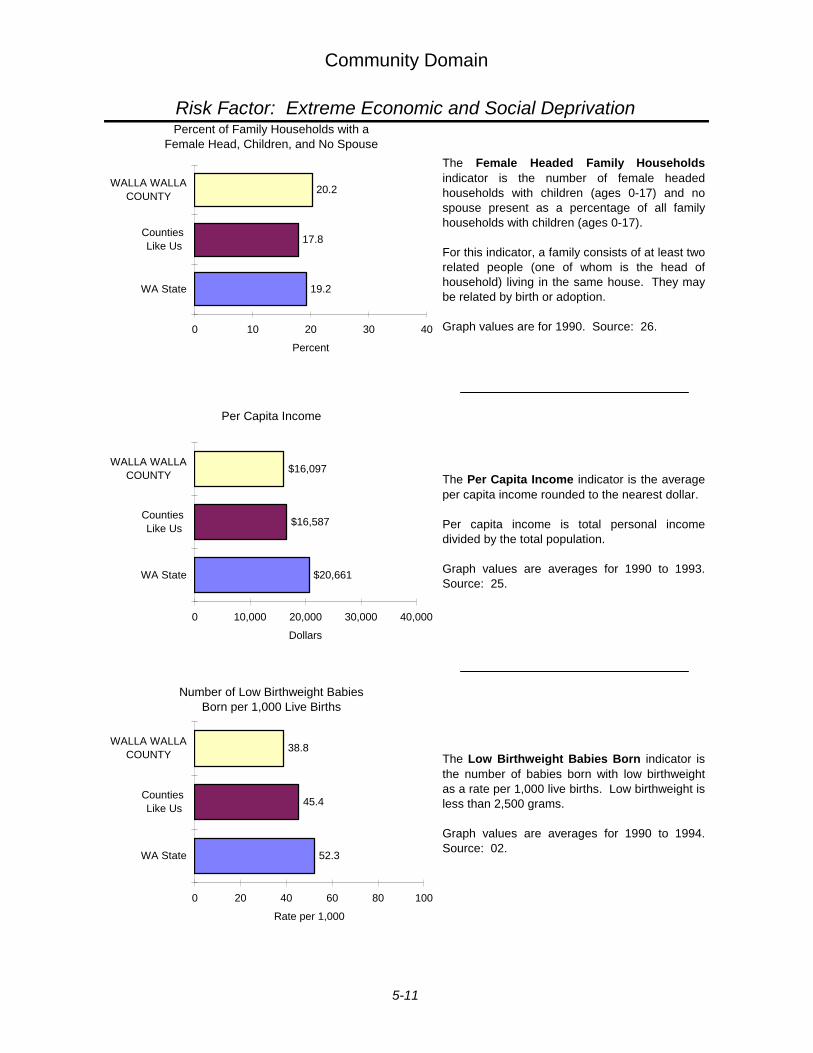
Community Domain
Risk Factor: Extreme Economic and Social Deprivation
The Female Headed Family Householdsindicator is the number of female headedhouseholds with children (ages 0-17) and nospouse present as a percentage of all familyhouseholds with children (ages 0-17).
For this indicator, a family consists of at least tworelated people (one of whom is the head ofhousehold) living in the same house. They maybe related by birth or adoption.
Graph values are for 1990. Source: 26.
The Per Capita Income indicator is the averageper capita income rounded to the nearest dollar.
Per capita income is total personal incomedivided by the total population.
Graph values are averages for 1990 to 1993.Source: 25.
The Low Birthweight Babies Born indicator isthe number of babies born with low birthweightas a rate per 1,000 live births. Low birthweight isless than 2,500 grams.
Graph values are averages for 1990 to 1994.Source: 02.
44
19.2
17.8
20.2
0 10 20 30 40
WA State
Counties Like Us
WALLA WALLACOUNTY
Percent
Percent of Family Households with a Female Head, Children, and No Spouse
45
$20,661
$16,587
$16,097
0 10,000 20,000 30,000 40,000
WA State
Counties Like Us
WALLA WALLACOUNTY
Dollars
Per Capita Income
46
52.3
45.4
38.8
0 20 40 60 80 100
WA State
Counties Like Us
WALLA WALLACOUNTY
Rate per 1,000
Number of Low Birthweight Babies Born per 1,000 Live Births
5-11
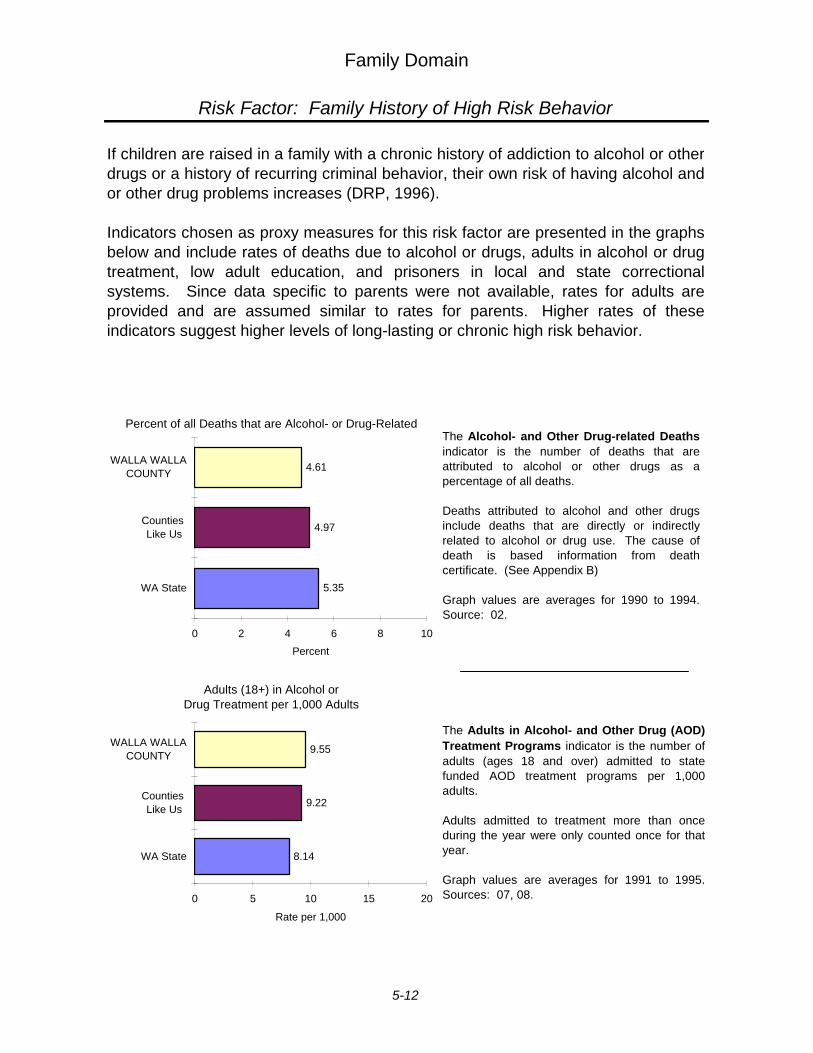
Family Domain
Risk Factor: Family History of High Risk Behavior
If children are raised in a family with a chronic history of addiction to alcohol or otherdrugs or a history of recurring criminal behavior, their own risk of having alcohol andor other drug problems increases (DRP, 1996).
Indicators chosen as proxy measures for this risk factor are presented in the graphsbelow and include rates of deaths due to alcohol or drugs, adults in alcohol or drugtreatment, low adult education, and prisoners in local and state correctionalsystems. Since data specific to parents were not available, rates for adults areprovided and are assumed similar to rates for parents. Higher rates of theseindicators suggest higher levels of long-lasting or chronic high risk behavior.
The Adults in Alcohol- and Other Drug (AOD)Treatment Programs indicator is the number ofadults (ages 18 and over) admitted to statefunded AOD treatment programs per 1,000adults.
Adults admitted to treatment more than onceduring the year were only counted once for thatyear.
Graph values are averages for 1991 to 1995.Sources: 07, 08.
The Alcohol- and Other Drug-related Deathsindicator is the number of deaths that areattributed to alcohol or other drugs as apercentage of all deaths.
Deaths attributed to alcohol and other drugsinclude deaths that are directly or indirectlyrelated to alcohol or drug use. The cause ofdeath is based information from deathcertificate. (See Appendix B)
Graph values are averages for 1990 to 1994.Source: 02.
107_p
5.35
4.97
4.61
0 2 4 6 8 10
WA State
Counties Like Us
WALLA WALLACOUNTY
Percent
Percent of all Deaths that are Alcohol- or Drug-Related
49
8.14
9.22
9.55
0 5 10 15 20
WA State
Counties Like Us
WALLA WALLACOUNTY
Rate per 1,000
Adults (18+) in Alcohol or Drug Treatment per 1,000 Adults
5-12
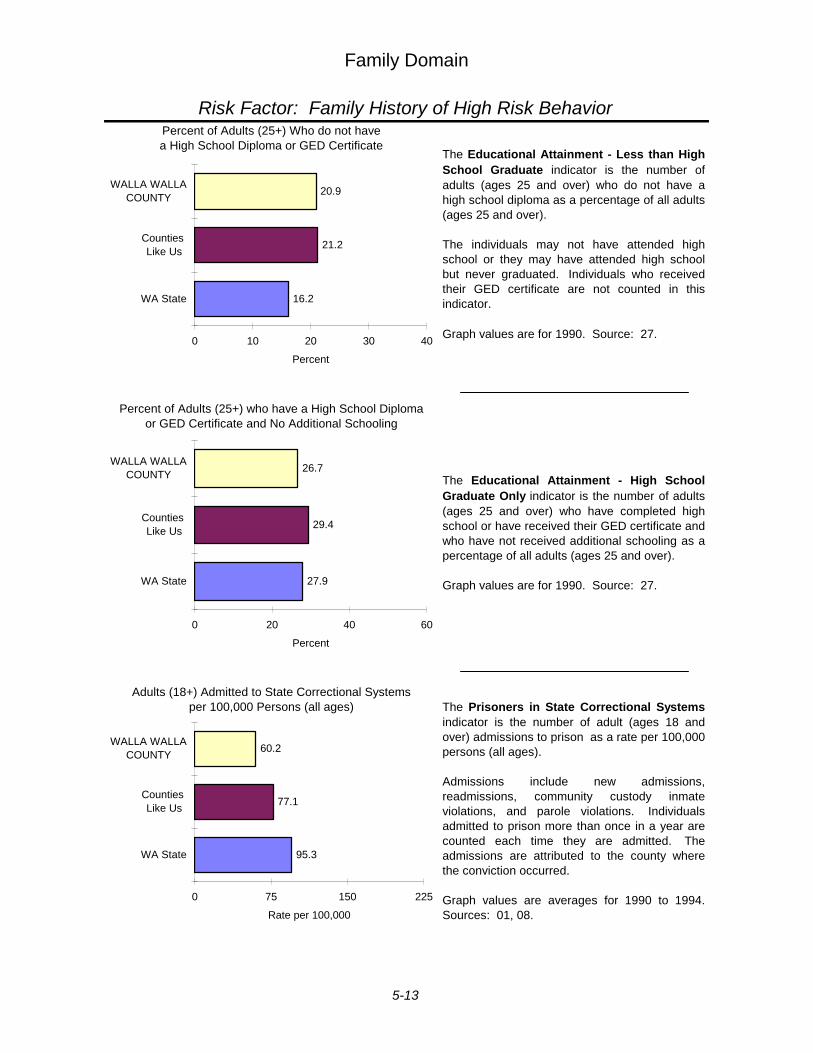
Family Domain
Risk Factor: Family History of High Risk Behavior
The Educational Attainment - Less than HighSchool Graduate indicator is the number ofadults (ages 25 and over) who do not have ahigh school diploma as a percentage of all adults(ages 25 and over).
The individuals may not have attended highschool or they may have attended high schoolbut never graduated. Individuals who receivedtheir GED certificate are not counted in thisindicator.
Graph values are for 1990. Source: 27.
The Educational Attainment - High SchoolGraduate Only indicator is the number of adults(ages 25 and over) who have completed highschool or have received their GED certificate andwho have not received additional schooling as apercentage of all adults (ages 25 and over).
Graph values are for 1990. Source: 27.
The Prisoners in State Correctional Systemsindicator is the number of adult (ages 18 andover) admissions to prison as a rate per 100,000persons (all ages).
Admissions include new admissions,readmissions, community custody inmateviolations, and parole violations. Individualsadmitted to prison more than once in a year arecounted each time they are admitted. Theadmissions are attributed to the county wherethe conviction occurred.
Graph values are averages for 1990 to 1994.Sources: 01, 08.
051_12
16.2
21.2
20.9
0 10 20 30 40
WA State
Counties Like Us
WALLA WALLACOUNTY
Percent
Percent of Adults (25+) Who do not havea High School Diploma or GED Certificate
51.03
27.9
29.4
26.7
0 20 40 60
WA State
Counties Like Us
WALLA WALLACOUNTY
Percent
Percent of Adults (25+) who have a High School Diploma or GED Certificate and No Additional Schooling
52
95.3
77.1
60.2
0 75 150 225
WA State
Counties Like Us
WALLA WALLACOUNTY
Rate per 100,000
Adults (18+) Admitted to State Correctional Systems per 100,000 Persons (all ages)
5-13
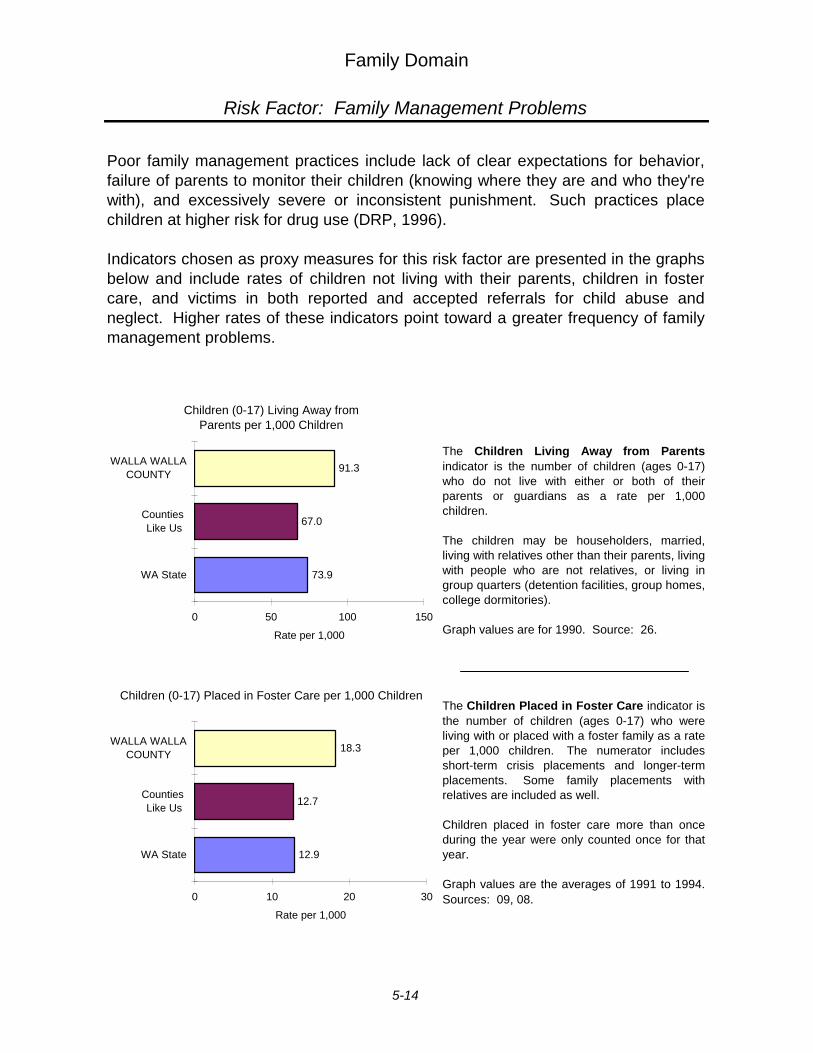
Family Domain
Risk Factor: Family Management Problems
Poor family management practices include lack of clear expectations for behavior,failure of parents to monitor their children (knowing where they are and who they'rewith), and excessively severe or inconsistent punishment. Such practices placechildren at higher risk for drug use (DRP, 1996).
Indicators chosen as proxy measures for this risk factor are presented in the graphsbelow and include rates of children not living with their parents, children in fostercare, and victims in both reported and accepted referrals for child abuse andneglect. Higher rates of these indicators point toward a greater frequency of familymanagement problems.
The Children Living Away from Parentsindicator is the number of children (ages 0-17)who do not live with either or both of theirparents or guardians as a rate per 1,000children.
The children may be householders, married,living with relatives other than their parents, livingwith people who are not relatives, or living ingroup quarters (detention facilities, group homes,college dormitories).
Graph values are for 1990. Source: 26.
The Children Placed in Foster Care indicator isthe number of children (ages 0-17) who wereliving with or placed with a foster family as a rateper 1,000 children. The numerator includesshort-term crisis placements and longer-termplacements. Some family placements withrelatives are included as well.
Children placed in foster care more than onceduring the year were only counted once for thatyear.
Graph values are the averages of 1991 to 1994.Sources: 09, 08.
56
73.9
67.0
91.3
0 50 100 150
WA State
Counties Like Us
WALLA WALLACOUNTY
Rate per 1,000
Children (0-17) Living Away fromParents per 1,000 Children
058a
12.9
12.7
18.3
0 10 20 30
WA State
Counties Like Us
WALLA WALLACOUNTY
Rate per 1,000
Children (0-17) Placed in Foster Care per 1,000 Children
5-14
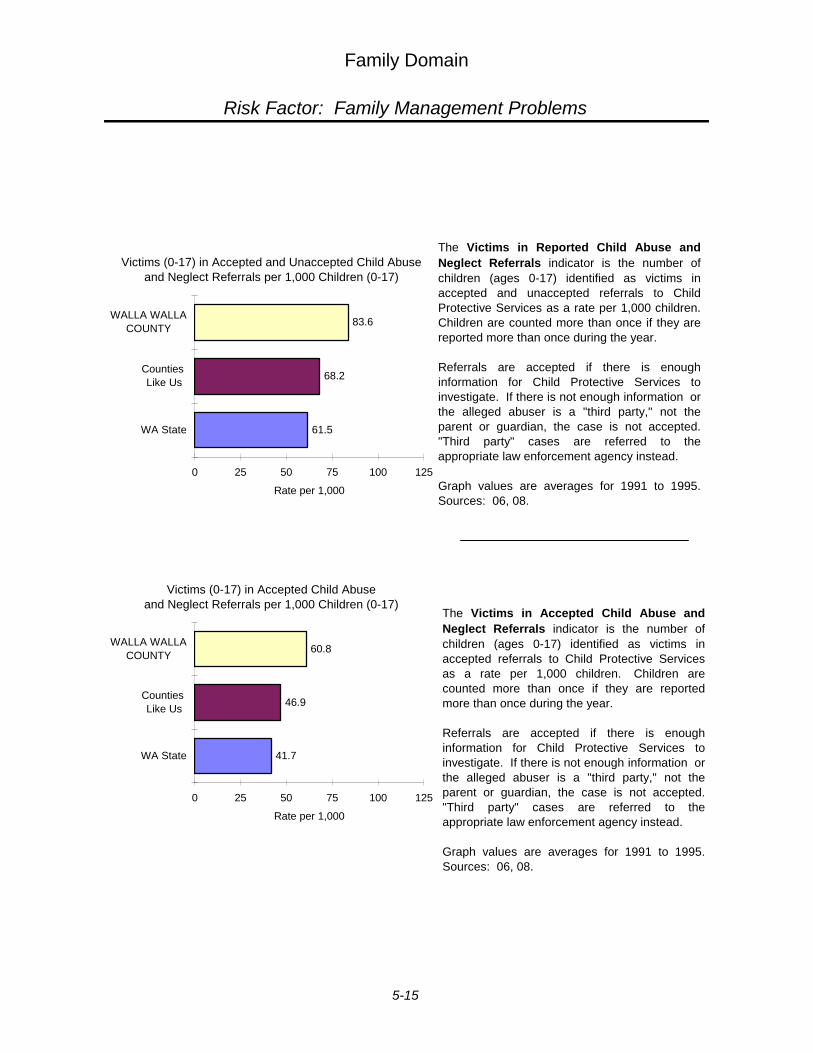
Family Domain
Risk Factor: Family Management Problems
The Victims in Reported Child Abuse andNeglect Referrals indicator is the number ofchildren (ages 0-17) identified as victims inaccepted and unaccepted referrals to ChildProtective Services as a rate per 1,000 children.Children are counted more than once if they arereported more than once during the year.
Referrals are accepted if there is enoughinformation for Child Protective Services toinvestigate. If there is not enough information orthe alleged abuser is a "third party," not theparent or guardian, the case is not accepted."Third party" cases are referred to theappropriate law enforcement agency instead.
Graph values are averages for 1991 to 1995.Sources: 06, 08.
The Victims in Accepted Child Abuse andNeglect Referrals indicator is the number ofchildren (ages 0-17) identified as victims inaccepted referrals to Child Protective Servicesas a rate per 1,000 children. Children arecounted more than once if they are reportedmore than once during the year.
Referrals are accepted if there is enoughinformation for Child Protective Services toinvestigate. If there is not enough information orthe alleged abuser is a "third party," not theparent or guardian, the case is not accepted."Third party" cases are referred to theappropriate law enforcement agency instead.
Graph values are averages for 1991 to 1995.Sources: 06, 08.
055a
61.5
68.2
83.6
0 25 50 75 100 125
WA State
Counties Like Us
WALLA WALLACOUNTY
Rate per 1,000
Victims (0-17) in Accepted and Unaccepted Child Abuse and Neglect Referrals per 1,000 Children (0-17)
055b
41.7
46.9
60.8
0 25 50 75 100 125
WA State
Counties Like Us
WALLA WALLACOUNTY
Rate per 1,000
Victims (0-17) in Accepted Child Abuse and Neglect Referrals per 1,000 Children (0-17)
5-15
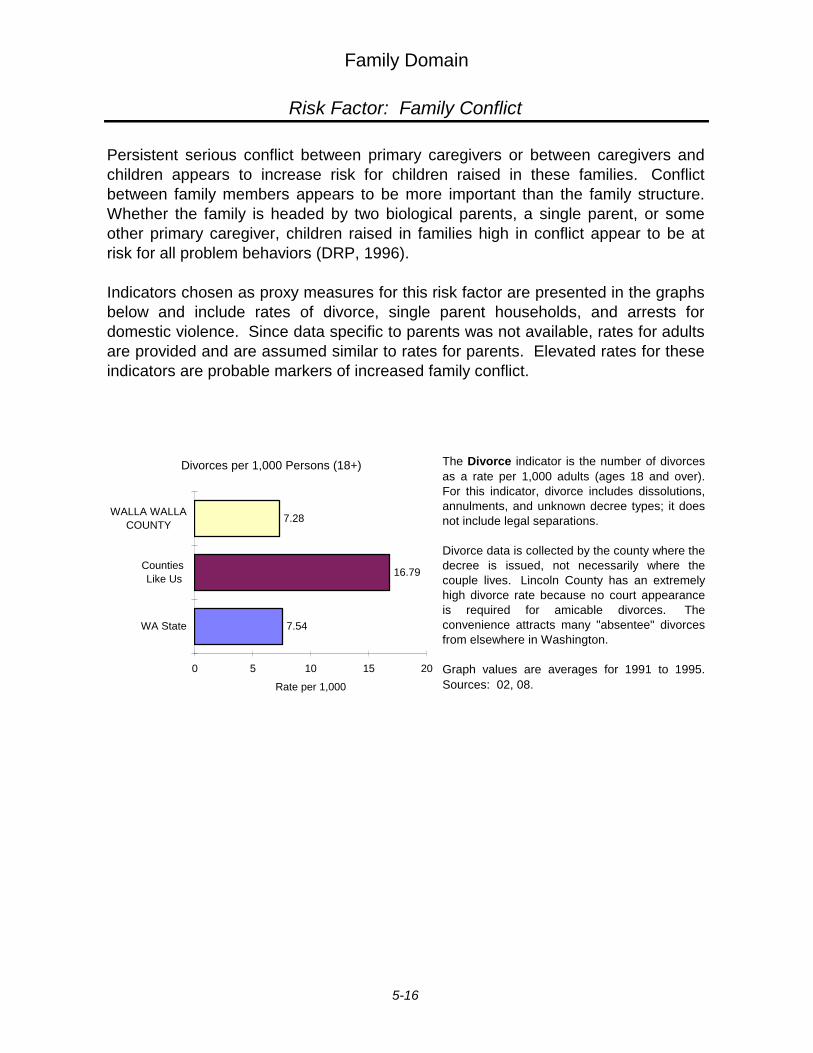
Family Domain
Risk Factor: Family Conflict
Persistent serious conflict between primary caregivers or between caregivers andchildren appears to increase risk for children raised in these families. Conflictbetween family members appears to be more important than the family structure.Whether the family is headed by two biological parents, a single parent, or someother primary caregiver, children raised in families high in conflict appear to be atrisk for all problem behaviors (DRP, 1996).
Indicators chosen as proxy measures for this risk factor are presented in the graphsbelow and include rates of divorce, single parent households, and arrests fordomestic violence. Since data specific to parents was not available, rates for adultsare provided and are assumed similar to rates for parents. Elevated rates for theseindicators are probable markers of increased family conflict.
The Divorce indicator is the number of divorcesas a rate per 1,000 adults (ages 18 and over).For this indicator, divorce includes dissolutions,annulments, and unknown decree types; it doesnot include legal separations.
Divorce data is collected by the county where thedecree is issued, not necessarily where thecouple lives. Lincoln County has an extremelyhigh divorce rate because no court appearanceis required for amicable divorces. Theconvenience attracts many "absentee" divorcesfrom elsewhere in Washington.
Graph values are averages for 1991 to 1995.Sources: 02, 08.
63
7.54
16.79
7.28
0 5 10 15 20
WA State
Counties Like Us
WALLA WALLACOUNTY
Rate per 1,000
Divorces per 1,000 Persons (18+)
5-16
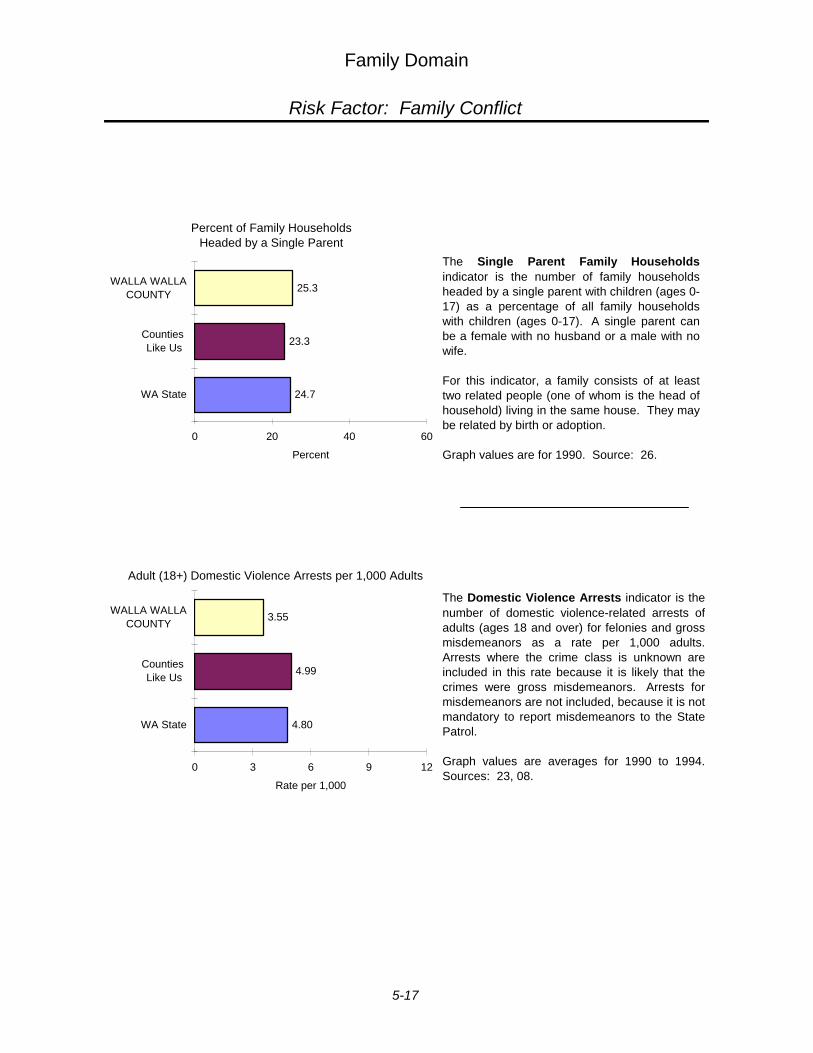
Family Domain
Risk Factor: Family Conflict
The Domestic Violence Arrests indicator is thenumber of domestic violence-related arrests ofadults (ages 18 and over) for felonies and grossmisdemeanors as a rate per 1,000 adults.Arrests where the crime class is unknown areincluded in this rate because it is likely that thecrimes were gross misdemeanors. Arrests formisdemeanors are not included, because it is notmandatory to report misdemeanors to the StatePatrol.
Graph values are averages for 1990 to 1994.Sources: 23, 08.
The Single Parent Family Householdsindicator is the number of family householdsheaded by a single parent with children (ages 0-17) as a percentage of all family householdswith children (ages 0-17). A single parent canbe a female with no husband or a male with nowife.
For this indicator, a family consists of at leasttwo related people (one of whom is the head ofhousehold) living in the same house. They maybe related by birth or adoption.
Graph values are for 1990. Source: 26.
62
24.7
23.3
25.3
0 20 40 60
WA State
Counties Like Us
WALLA WALLACOUNTY
Percent
Percent of Family Households Headed by a Single Parent
63
4.80
4.99
3.55
0 3 6 9 12
WA State
Counties Like Us
WALLA WALLACOUNTY
Rate per 1,000
Adult (18+) Domestic Violence Arrests per 1,000 Adults
5-17
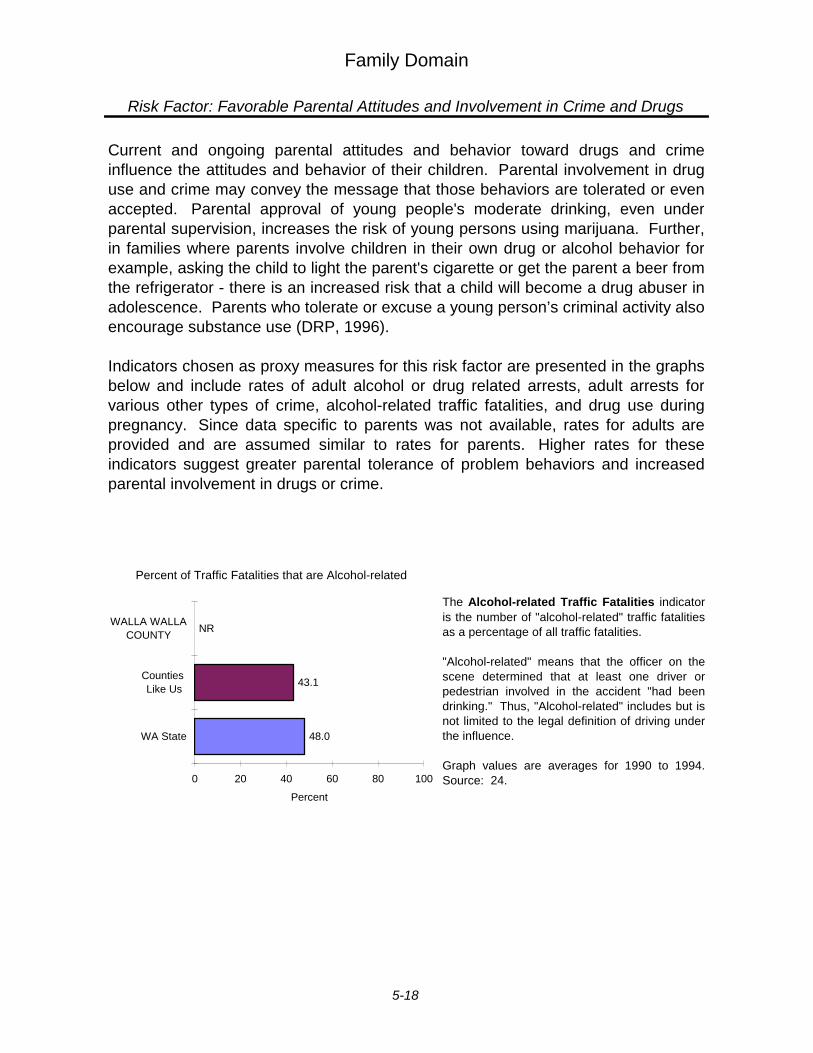
Family Domain
Risk Factor: Favorable Parental Attitudes and Involvement in Crime and Drugs
Current and ongoing parental attitudes and behavior toward drugs and crimeinfluence the attitudes and behavior of their children. Parental involvement in druguse and crime may convey the message that those behaviors are tolerated or evenaccepted. Parental approval of young people's moderate drinking, even underparental supervision, increases the risk of young persons using marijuana. Further,in families where parents involve children in their own drug or alcohol behavior forexample, asking the child to light the parent's cigarette or get the parent a beer fromthe refrigerator - there is an increased risk that a child will become a drug abuser inadolescence. Parents who tolerate or excuse a young person’s criminal activity also encourage substance use (DRP, 1996).
Indicators chosen as proxy measures for this risk factor are presented in the graphsbelow and include rates of adult alcohol or drug related arrests, adult arrests forvarious other types of crime, alcohol-related traffic fatalities, and drug use duringpregnancy. Since data specific to parents was not available, rates for adults areprovided and are assumed similar to rates for parents. Higher rates for theseindicators suggest greater parental tolerance of problem behaviors and increasedparental involvement in drugs or crime.
The Alcohol-related Traffic Fatalities indicatoris the number of "alcohol-related" traffic fatalitiesas a percentage of all traffic fatalities.
"Alcohol-related" means that the officer on thescene determined that at least one driver orpedestrian involved in the accident "had beendrinking." Thus, "Alcohol-related" includes but isnot limited to the legal definition of driving underthe influence.
Graph values are averages for 1990 to 1994.Source: 24.
105
48.0
43.1
NR
0 20 40 60 80 100
WA State
Counties Like Us
WALLA WALLACOUNTY
Percent
Percent of Traffic Fatalities that are Alcohol-related
5-18
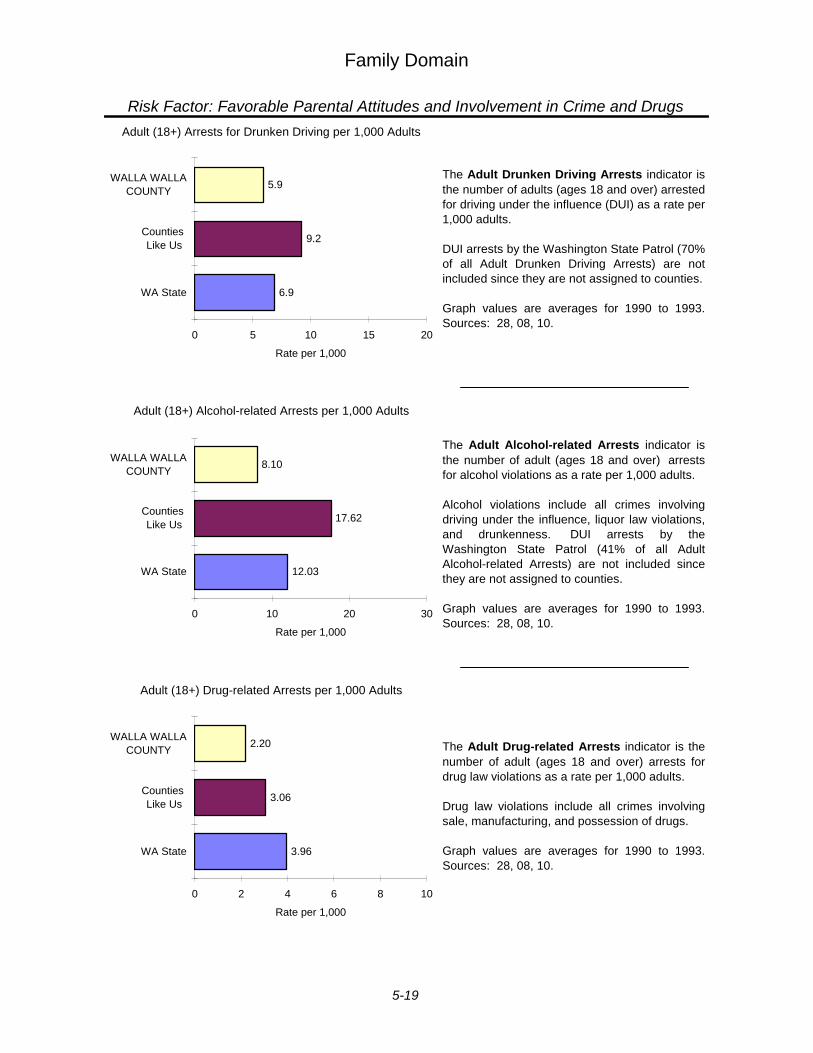
Family Domain
Risk Factor: Favorable Parental Attitudes and Involvement in Crime and Drugs
The Adult Drug-related Arrests indicator is thenumber of adult (ages 18 and over) arrests fordrug law violations as a rate per 1,000 adults.
Drug law violations include all crimes involvingsale, manufacturing, and possession of drugs.
Graph values are averages for 1990 to 1993.Sources: 28, 08, 10.
The Adult Drunken Driving Arrests indicator isthe number of adults (ages 18 and over) arrestedfor driving under the influence (DUI) as a rate per1,000 adults.
DUI arrests by the Washington State Patrol (70%of all Adult Drunken Driving Arrests) are notincluded since they are not assigned to counties.
Graph values are averages for 1990 to 1993.Sources: 28, 08, 10.
The Adult Alcohol-related Arrests indicator isthe number of adult (ages 18 and over) arrestsfor alcohol violations as a rate per 1,000 adults.
Alcohol violations include all crimes involvingdriving under the influence, liquor law violations,and drunkenness. DUI arrests by theWashington State Patrol (41% of all AdultAlcohol-related Arrests) are not included sincethey are not assigned to counties.
Graph values are averages for 1990 to 1993.Sources: 28, 08, 10.
14
6.9
9.2
5.9
0 5 10 15 20
WA State
Counties Like Us
WALLA WALLACOUNTY
Rate per 1,000
Adult (18+) Arrests for Drunken Driving per 1,000 Adults
066b
12.03
17.62
8.10
0 10 20 30
WA State
Counties Like Us
WALLA WALLACOUNTY
Rate per 1,000
Adult (18+) Alcohol-related Arrests per 1,000 Adults
066c
3.96
3.06
2.20
0 2 4 6 8 10
WA State
Counties Like Us
WALLA WALLACOUNTY
Rate per 1,000
Adult (18+) Drug-related Arrests per 1,000 Adults
5-19
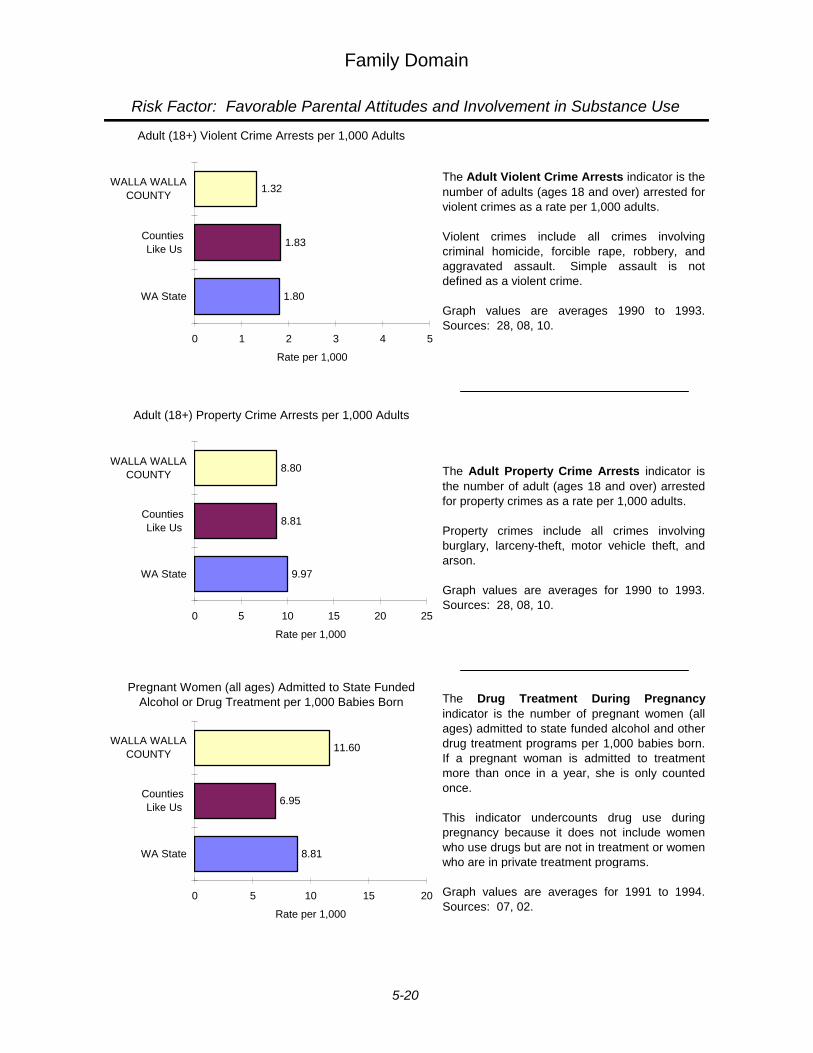
Family Domain
Risk Factor: Favorable Parental Attitudes and Involvement in Substance Use
The Adult Violent Crime Arrests indicator is thenumber of adults (ages 18 and over) arrested forviolent crimes as a rate per 1,000 adults.
Violent crimes include all crimes involvingcriminal homicide, forcible rape, robbery, andaggravated assault. Simple assault is notdefined as a violent crime.
Graph values are averages 1990 to 1993.Sources: 28, 08, 10.
The Adult Property Crime Arrests indicator isthe number of adult (ages 18 and over) arrestedfor property crimes as a rate per 1,000 adults.
Property crimes include all crimes involvingburglary, larceny-theft, motor vehicle theft, andarson.
Graph values are averages for 1990 to 1993.Sources: 28, 08, 10.
The Drug Treatment During Pregnancyindicator is the number of pregnant women (allages) admitted to state funded alcohol and otherdrug treatment programs per 1,000 babies born.If a pregnant woman is admitted to treatmentmore than once in a year, she is only countedonce.
This indicator undercounts drug use duringpregnancy because it does not include womenwho use drugs but are not in treatment or womenwho are in private treatment programs.
Graph values are averages for 1991 to 1994.Sources: 07, 02.
64
1.80
1.83
1.32
0 1 2 3 4 5
WA State
Counties Like Us
WALLA WALLACOUNTY
Rate per 1,000
Adult (18+) Violent Crime Arrests per 1,000 Adults
65
9.97
8.81
8.80
0 5 10 15 20 25
WA State
Counties Like Us
WALLA WALLACOUNTY
Rate per 1,000
Adult (18+) Property Crime Arrests per 1,000 Adults
68
8.81
6.95
11.60
0 5 10 15 20
WA State
Counties Like Us
WALLA WALLACOUNTY
Rate per 1,000
Pregnant Women (all ages) Admitted to State Funded Alcohol or Drug Treatment per 1,000 Babies Born
5-20
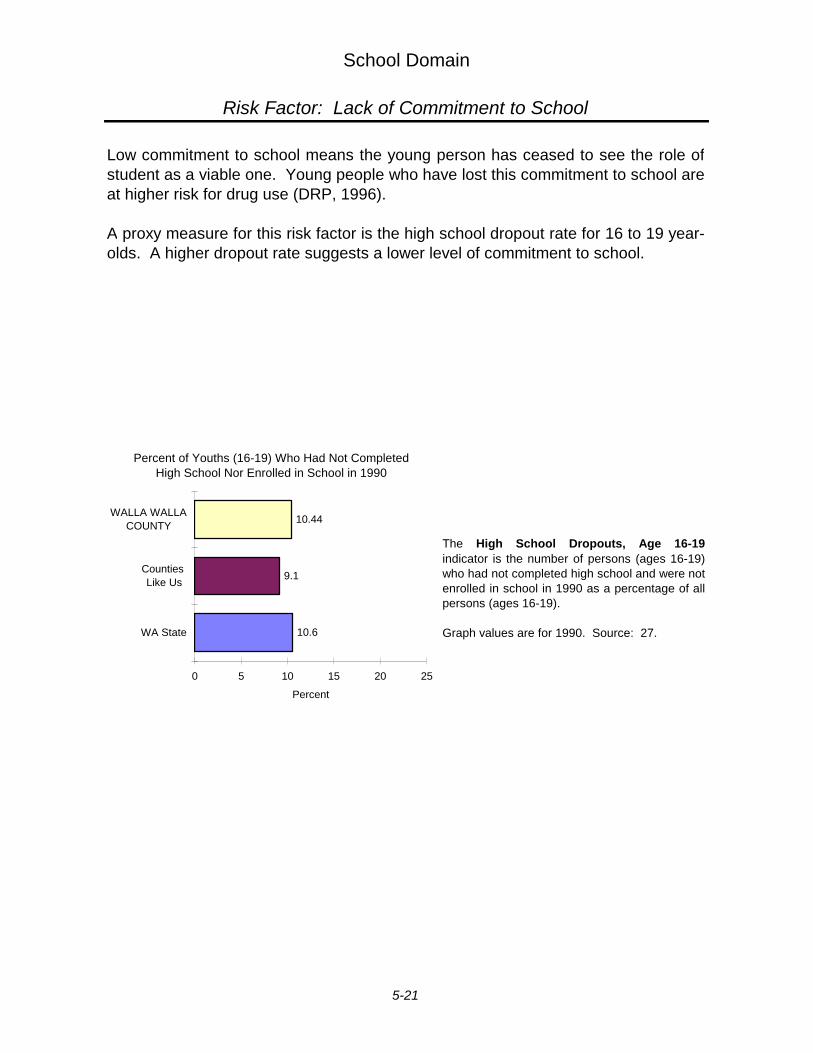
School Domain
Risk Factor: Lack of Commitment to School
Low commitment to school means the young person has ceased to see the role ofstudent as a viable one. Young people who have lost this commitment to school areat higher risk for drug use (DRP, 1996).
A proxy measure for this risk factor is the high school dropout rate for 16 to 19 year-olds. A higher dropout rate suggests a lower level of commitment to school.
The High School Dropouts, Age 16-19indicator is the number of persons (ages 16-19)who had not completed high school and were notenrolled in school in 1990 as a percentage of allpersons (ages 16-19).
Graph values are for 1990. Source: 27.
112
10.6
9.1
10.44
0 5 10 15 20 25
WA State
Counties Like Us
WALLA WALLACOUNTY
Percent
Percent of Youths (16-19) Who Had Not Completed High School Nor Enrolled in School in 1990
5-21
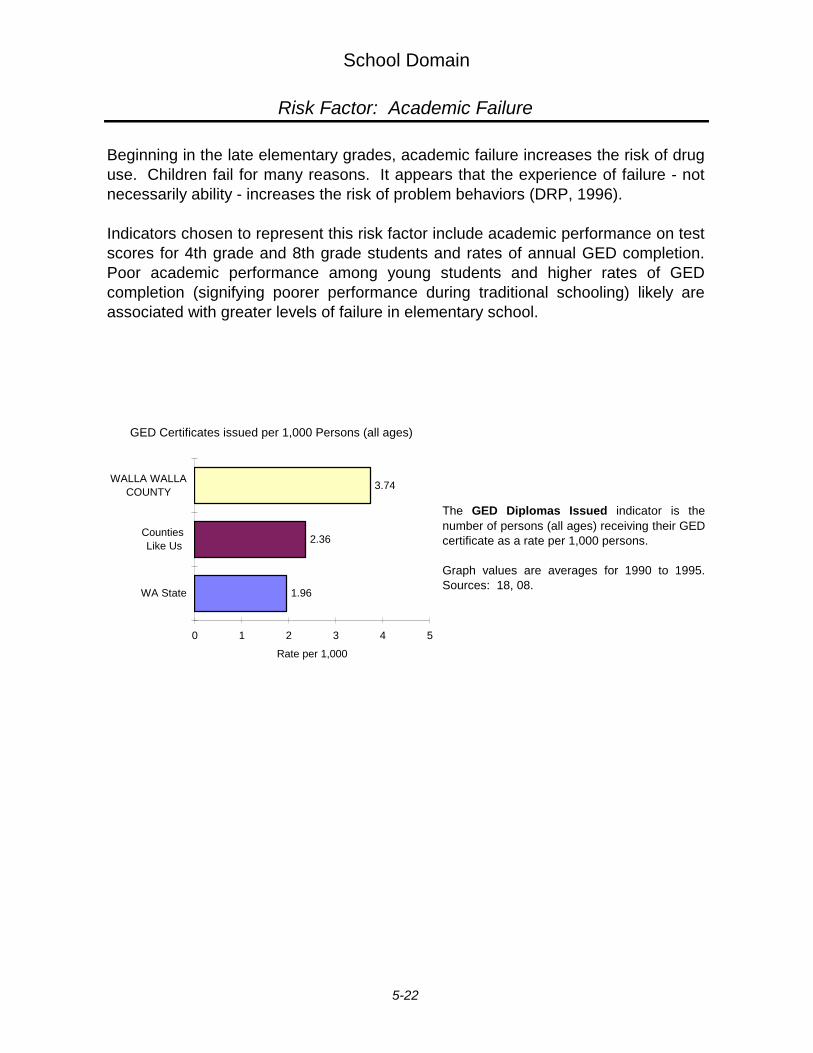
School Domain
Risk Factor: Academic Failure
Beginning in the late elementary grades, academic failure increases the risk of druguse. Children fail for many reasons. It appears that the experience of failure - notnecessarily ability - increases the risk of problem behaviors (DRP, 1996).
Indicators chosen to represent this risk factor include academic performance on testscores for 4th grade and 8th grade students and rates of annual GED completion.Poor academic performance among young students and higher rates of GEDcompletion (signifying poorer performance during traditional schooling) likely areassociated with greater levels of failure in elementary school.
The GED Diplomas Issued indicator is thenumber of persons (all ages) receiving their GEDcertificate as a rate per 1,000 persons.
Graph values are averages for 1990 to 1995.Sources: 18, 08.
74
1.96
2.36
3.74
0 1 2 3 4 5
WA State
Counties Like Us
WALLA WALLACOUNTY
Rate per 1,000
GED Certificates issued per 1,000 Persons (all ages)
5-22
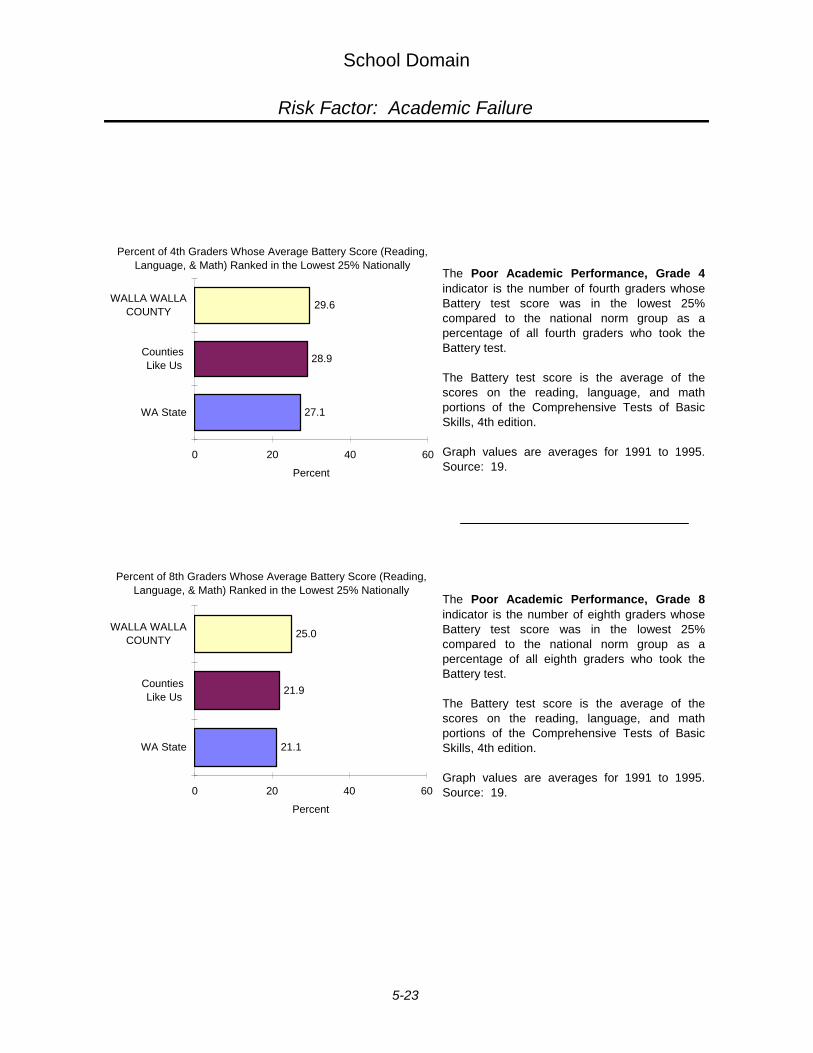
School Domain
Risk Factor: Academic Failure
The Poor Academic Performance, Grade 4indicator is the number of fourth graders whoseBattery test score was in the lowest 25%compared to the national norm group as apercentage of all fourth graders who took theBattery test.
The Battery test score is the average of thescores on the reading, language, and mathportions of the Comprehensive Tests of BasicSkills, 4th edition.
Graph values are averages for 1991 to 1995.Source: 19.
The Poor Academic Performance, Grade 8indicator is the number of eighth graders whoseBattery test score was in the lowest 25%compared to the national norm group as apercentage of all eighth graders who took theBattery test.
The Battery test score is the average of thescores on the reading, language, and mathportions of the Comprehensive Tests of BasicSkills, 4th edition.
Graph values are averages for 1991 to 1995.Source: 19.
07x_4p
27.1
28.9
29.6
0 20 40 60
WA State
Counties Like Us
WALLA WALLACOUNTY
Percent
Percent of 4th Graders Whose Average Battery Score (Reading, Language, & Math) Ranked in the Lowest 25% Nationally
07x_8p
21.1
21.9
25.0
0 20 40 60
WA State
Counties Like Us
WALLA WALLACOUNTY
Percent
Percent of 8th Graders Whose Average Battery Score (Reading, Language, & Math) Ranked in the Lowest 25% Nationally
5-23
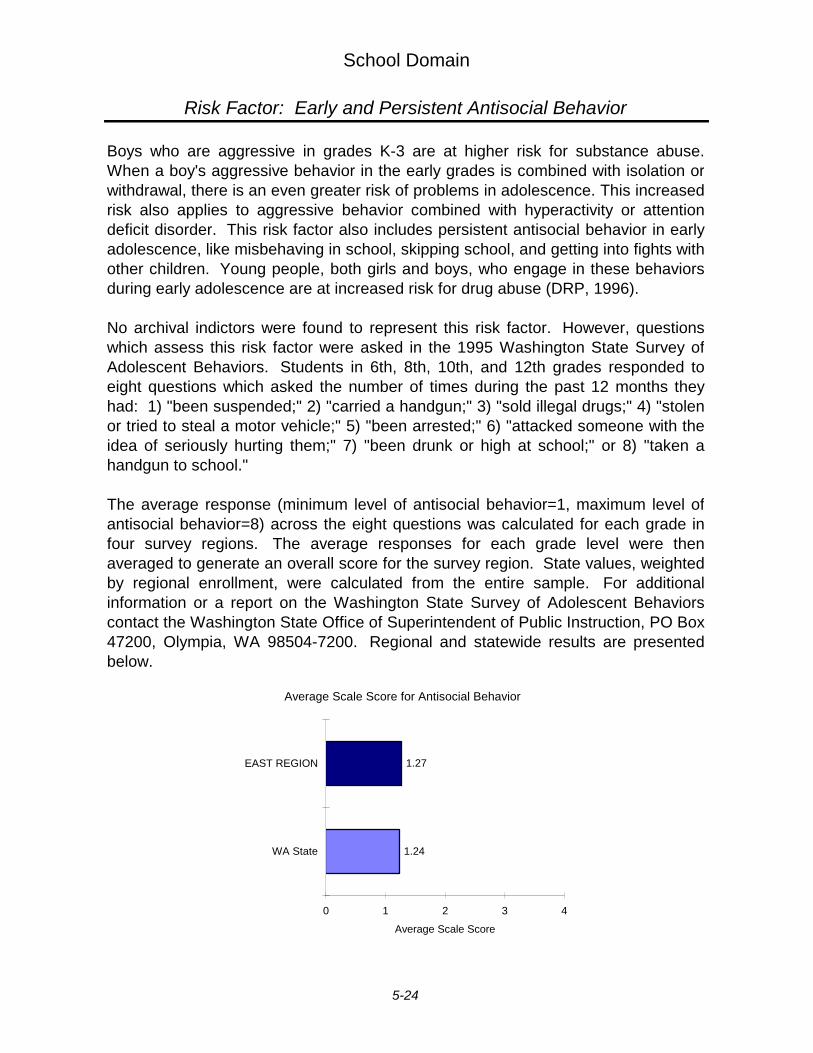
School Domain
Risk Factor: Early and Persistent Antisocial Behavior
Boys who are aggressive in grades K-3 are at higher risk for substance abuse.When a boy's aggressive behavior in the early grades is combined with isolation orwithdrawal, there is an even greater risk of problems in adolescence. This increasedrisk also applies to aggressive behavior combined with hyperactivity or attentiondeficit disorder. This risk factor also includes persistent antisocial behavior in earlyadolescence, like misbehaving in school, skipping school, and getting into fights withother children. Young people, both girls and boys, who engage in these behaviorsduring early adolescence are at increased risk for drug abuse (DRP, 1996).
No archival indictors were found to represent this risk factor. However, questionswhich assess this risk factor were asked in the 1995 Washington State Survey ofAdolescent Behaviors. Students in 6th, 8th, 10th, and 12th grades responded toeight questions which asked the number of times during the past 12 months theyhad: 1) "been suspended;" 2) "carried a handgun;" 3) "sold illegal drugs;" 4) "stolenor tried to steal a motor vehicle;" 5) "been arrested;" 6) "attacked someone with theidea of seriously hurting them;" 7) "been drunk or high at school;" or 8) "taken ahandgun to school."
The average response (minimum level of antisocial behavior=1, maximum level ofantisocial behavior=8) across the eight questions was calculated for each grade infour survey regions. The average responses for each grade level were thenaveraged to generate an overall score for the survey region. State values, weightedby regional enrollment, were calculated from the entire sample. For additionalinformation or a report on the Washington State Survey of Adolescent Behaviorscontact the Washington State Office of Superintendent of Public Instruction, PO Box47200, Olympia, WA 98504-7200. Regional and statewide results are presentedbelow.
Antisocial Behavior
1.24
1.27
0 1 2 3 4
WA State
EAST REGION
Average Scale Score
Average Scale Score for Antisocial Behavior
5-24
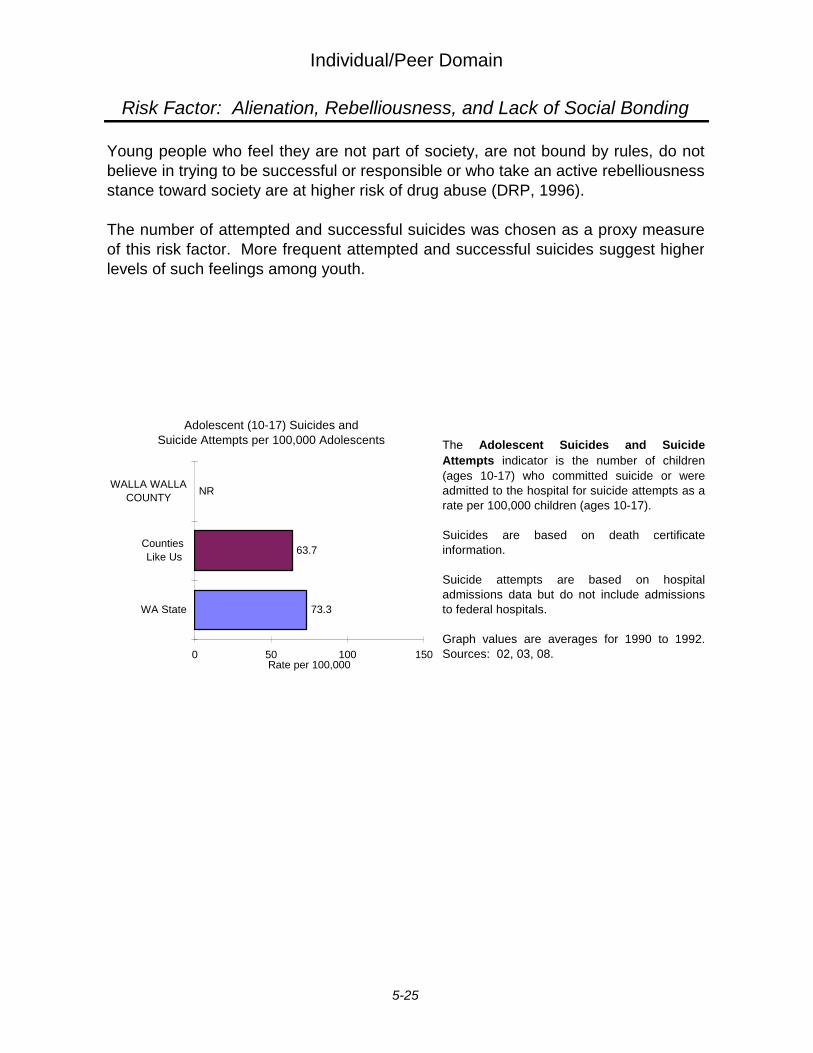
Individual/Peer Domain
Risk Factor: Alienation, Rebelliousness, and Lack of Social Bonding
Young people who feel they are not part of society, are not bound by rules, do notbelieve in trying to be successful or responsible or who take an active rebelliousness stance toward society are at higher risk of drug abuse (DRP, 1996).
The number of attempted and successful suicides was chosen as a proxy measureof this risk factor. More frequent attempted and successful suicides suggest higherlevels of such feelings among youth.
The Adolescent Suicides and SuicideAttempts indicator is the number of children(ages 10-17) who committed suicide or wereadmitted to the hospital for suicide attempts as arate per 100,000 children (ages 10-17).
Suicides are based on death certificateinformation.
Suicide attempts are based on hospitaladmissions data but do not include admissionsto federal hospitals.
Graph values are averages for 1990 to 1992.Sources: 02, 03, 08.
98_99
73.3
63.7
NR
0 50 100 150
WA State
Counties Like Us
WALLA WALLACOUNTY
Rate per 100,000
Adolescent (10-17) Suicides and Suicide Attempts per 100,000 Adolescents
5-25
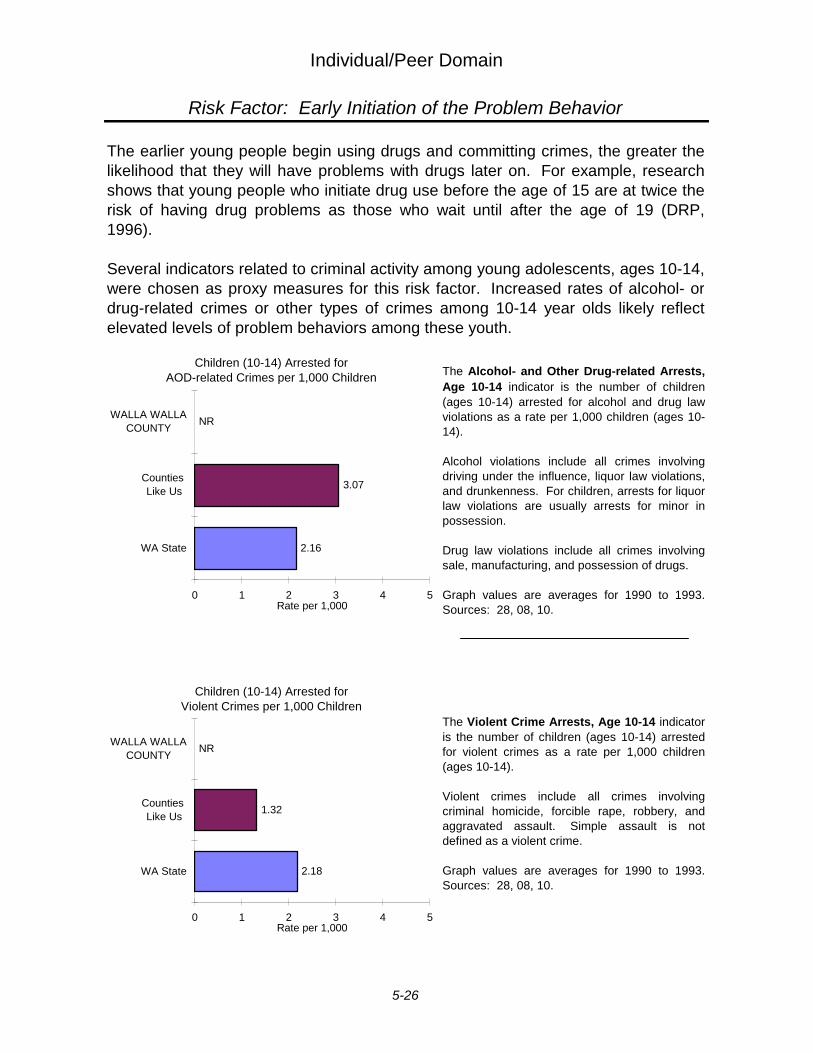
Individual/Peer Domain
Risk Factor: Early Initiation of the Problem Behavior
The earlier young people begin using drugs and committing crimes, the greater thelikelihood that they will have problems with drugs later on. For example, researchshows that young people who initiate drug use before the age of 15 are at twice therisk of having drug problems as those who wait until after the age of 19 (DRP,1996).
Several indicators related to criminal activity among young adolescents, ages 10-14,were chosen as proxy measures for this risk factor. Increased rates of alcohol- ordrug-related crimes or other types of crimes among 10-14 year olds likely reflectelevated levels of problem behaviors among these youth.
The Violent Crime Arrests, Age 10-14 indicator is the number of children (ages 10-14) arrestedfor violent crimes as a rate per 1,000 children(ages 10-14).
Violent crimes include all crimes involvingcriminal homicide, forcible rape, robbery, andaggravated assault. Simple assault is notdefined as a violent crime.
Graph values are averages for 1990 to 1993.Sources: 28, 08, 10.
096a
2.16
3.07
NR
0 1 2 3 4 5
WA State
Counties Like Us
WALLA WALLACOUNTY
Rate per 1,000
Children (10-14) Arrested for AOD-related Crimes per 1,000 Children
097b
2.18
1.32
NR
0 1 2 3 4 5
WA State
Counties Like Us
WALLA WALLACOUNTY
Rate per 1,000
Children (10-14) Arrested for Violent Crimes per 1,000 Children
The Alcohol- and Other Drug-related Arrests,Age 10-14 indicator is the number of children(ages 10-14) arrested for alcohol and drug lawviolations as a rate per 1,000 children (ages 10-14).
Alcohol violations include all crimes involvingdriving under the influence, liquor law violations,and drunkenness. For children, arrests for liquorlaw violations are usually arrests for minor inpossession.
Drug law violations include all crimes involvingsale, manufacturing, and possession of drugs.
Graph values are averages for 1990 to 1993.Sources: 28, 08, 10.
5-26
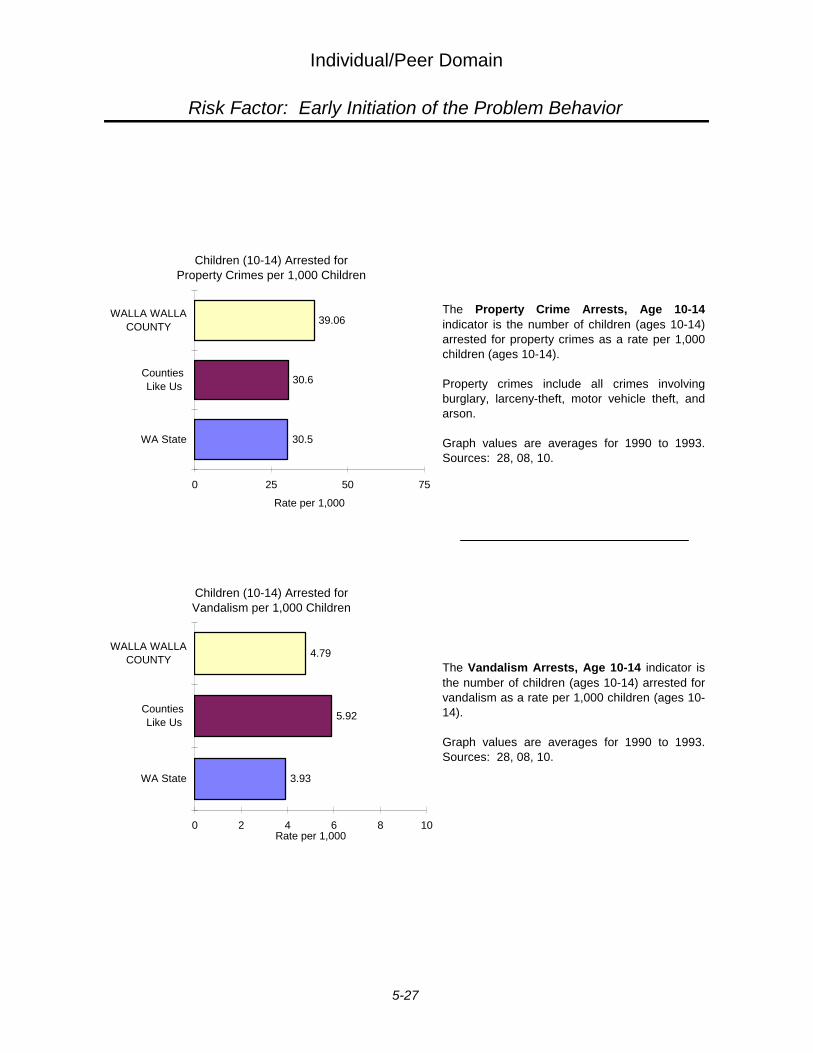
Individual/Peer Domain
Risk Factor: Early Initiation of the Problem Behavior
The Vandalism Arrests, Age 10-14 indicator isthe number of children (ages 10-14) arrested forvandalism as a rate per 1,000 children (ages 10-14).
Graph values are averages for 1990 to 1993.Sources: 28, 08, 10.
The Property Crime Arrests, Age 10-14indicator is the number of children (ages 10-14)arrested for property crimes as a rate per 1,000children (ages 10-14).
Property crimes include all crimes involvingburglary, larceny-theft, motor vehicle theft, andarson.
Graph values are averages for 1990 to 1993.Sources: 28, 08, 10.
95
3.93
5.92
4.79
0 2 4 6 8 10
WA State
Counties Like Us
WALLA WALLACOUNTY
Rate per 1,000
Children (10-14) Arrested for Vandalism per 1,000 Children
097c
30.5
30.6
39.06
0 25 50 75
WA State
Counties Like Us
WALLA WALLACOUNTY
Rate per 1,000
Children (10-14) Arrested for Property Crimes per 1,000 Children
5-27
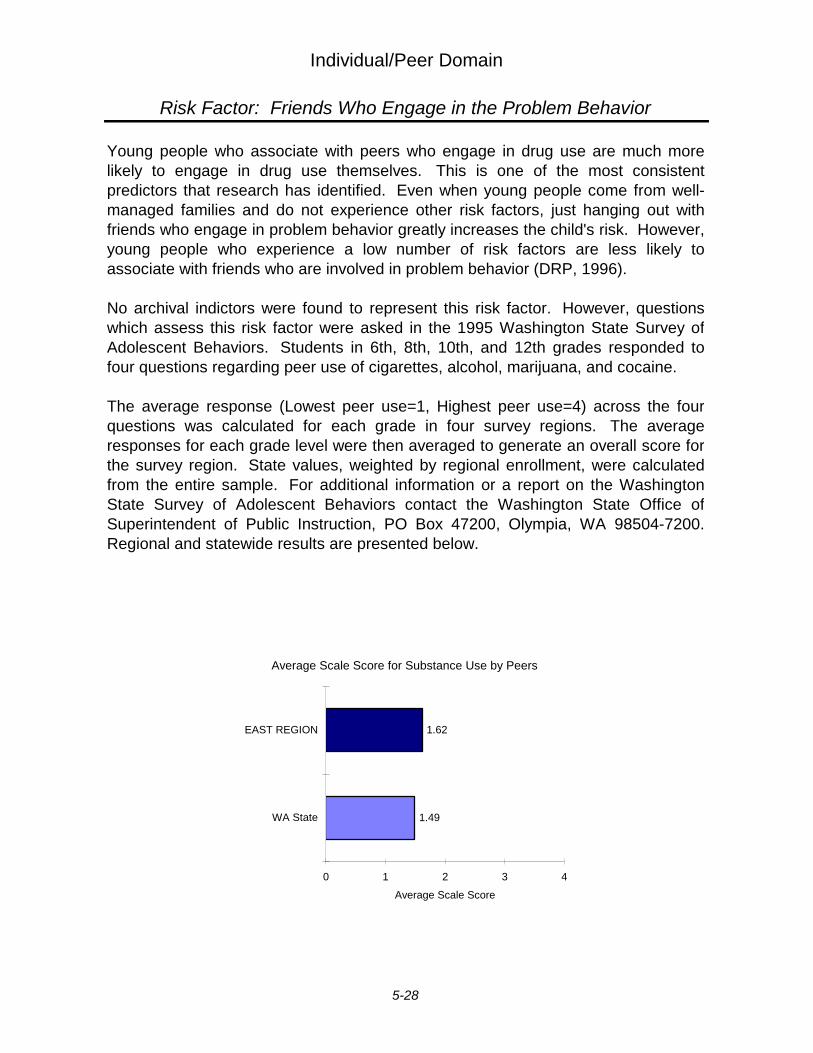
Individual/Peer Domain
Risk Factor: Friends Who Engage in the Problem Behavior
Young people who associate with peers who engage in drug use are much morelikely to engage in drug use themselves. This is one of the most consistentpredictors that research has identified. Even when young people come from well-managed families and do not experience other risk factors, just hanging out withfriends who engage in problem behavior greatly increases the child's risk. However,young people who experience a low number of risk factors are less likely toassociate with friends who are involved in problem behavior (DRP, 1996).
No archival indictors were found to represent this risk factor. However, questionswhich assess this risk factor were asked in the 1995 Washington State Survey ofAdolescent Behaviors. Students in 6th, 8th, 10th, and 12th grades responded tofour questions regarding peer use of cigarettes, alcohol, marijuana, and cocaine.
The average response (Lowest peer use=1, Highest peer use=4) across the fourquestions was calculated for each grade in four survey regions. The averageresponses for each grade level were then averaged to generate an overall score forthe survey region. State values, weighted by regional enrollment, were calculatedfrom the entire sample. For additional information or a report on the WashingtonState Survey of Adolescent Behaviors contact the Washington State Office ofSuperintendent of Public Instruction, PO Box 47200, Olympia, WA 98504-7200.Regional and statewide results are presented below.
Substance Use by Peers
1.49
1.62
0 1 2 3 4
WA State
EAST REGION
Average Scale Score
Average Scale Score for Substance Use by Peers
5-28

Individual/Peer Domain
Risk Factor: Favorable Attitudes Toward the Problem Behavior
During the elementary school years, children usually express anti-drug attitudes.They have difficulty imagining why people use drugs. However, in middle school, asothers they know participate in such activities, their attitudes often shift towardgreater acceptance of these behaviors. This acceptance places them at higher risk(DRP, 1996).
No archival indictors were found to represent this risk factor. However, questionswhich assess this risk factor were asked in the 1995 Washington State Survey ofAdolescent Behaviors. Students in 6th, 8th, 10th, and 12th grades responded tofour questions asking, "How wrong do you think it is for someone your age to: [1]drink beer, wine, or hard liquor regularly, [2] smoke cigarettes, [3] smoke marijuana,[and 4] use LSD, cocaine, amphetamines, or another illegal drug."
The average response (Very wrong=1, Not wrong at all=4) across the four questionswas calculated for each grade in four survey regions. The average responses foreach grade level were then averaged to generate an overall score for the surveyregion. State values, weighted by regional enrollment, were calculated from theentire sample. For additional information or a report on the Washington StateSurvey of Adolescent Behaviors contact the Washington State Office ofSuperintendent of Public Instruction, PO Box 47200, Olympia, WA 98504-7200.Regional and statewide results are presented below.
Personal AttitudeFavorable towards
Substance Use
1.82
1.86
0 1 2 3 4
WA State
EAST REGION
Average Scale Score
Average Scale Score for Personal Attitude Favorable toward Substance Use
5-29
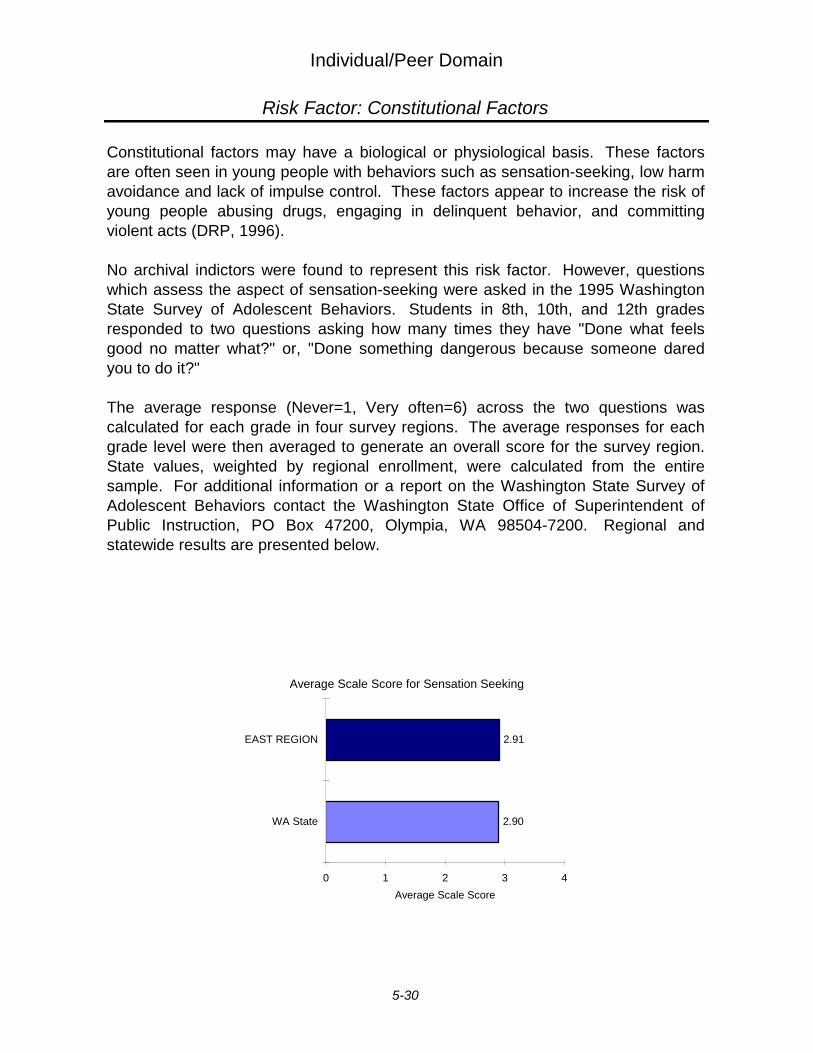
Individual/Peer Domain
Risk Factor: Constitutional Factors
Constitutional factors may have a biological or physiological basis. These factorsare often seen in young people with behaviors such as sensation-seeking, low harm-avoidance and lack of impulse control. These factors appear to increase the risk ofyoung people abusing drugs, engaging in delinquent behavior, and committingviolent acts (DRP, 1996).
No archival indictors were found to represent this risk factor. However, questionswhich assess the aspect of sensation-seeking were asked in the 1995 WashingtonState Survey of Adolescent Behaviors. Students in 8th, 10th, and 12th gradesresponded to two questions asking how many times they have "Done what feelsgood no matter what?" or, "Done something dangerous because someone daredyou to do it?"
The average response (Never=1, Very often=6) across the two questions wascalculated for each grade in four survey regions. The average responses for eachgrade level were then averaged to generate an overall score for the survey region.State values, weighted by regional enrollment, were calculated from the entiresample. For additional information or a report on the Washington State Survey ofAdolescent Behaviors contact the Washington State Office of Superintendent ofPublic Instruction, PO Box 47200, Olympia, WA 98504-7200. Regional andstatewide results are presented below.
Sensation Seeking
2.90
2.91
0 1 2 3 4
WA State
EAST REGION
Average Scale Score
Average Scale Score for Sensation Seeking
5-30
6 INDICATOR DATA FOR PROTECTIVE FACTORS
East School Survey Region 1
and Washington State
No archival indicators were found to represent any of the protective factors.However, questions which assess these protective factors were asked in the1995 Washington State Survey of Adolescent Behaviors and are describedbelow where appropriate. For additional information or a report on theWashington State Survey of Adolescent Behaviors contact the WashingtonState Office of Superintendent of Public Instruction, PO Box 47200, Olympia,WA 98504-7200.
Protective Factors
Community Rewards for Conventional Involvement .......................................... 6-2Family Rewards for Conventional Involvement ................................................. 6-3School Rewards for Conventional Involvement ................................................. 6-3Opportunities for Positive Involvement in the Family ........................................ 6-5Opportunities for Positive Involvement in the School ........................................ 6-5Belief in the Moral Order ................................................................................... 6-6Social Skills ....................................................................................................... 6-7
1East school survey region includes Adams, Asotin, Benton, Chelan, Columbia, Douglas, Ferry,Franklin, Garfield, Grant, Kittitas, Klickitat, Lincoln, Okanogan, Pend Oreille, Spokane Stevens,Walla Walla, Whitman, and Yakima Counties

Protective Factors
Protective Factor: Community, Family, and School, Rewards for Conventional Involvement
Community Rewards for Conventional Involvement
2.22
2.33
0 1 2 3 4
WA State
EAST REGION
Average Scale Score
When young people are rewarded for positive participation in activities that areimportant in their development, it is less likely that they will engage in high riskhealth behaviors (DRP, 1996).
In the school survey, community rewards for conventional involvement wereassessed among 8th, 10th, and 12th grade students using three questionsconcerning neighbors’ acknowledgment, encouragement, and pride for things donewell by the child. Family rewards were assessed using two questions on parentalacknowledgment and pride for things well done by a child and two additionalquestions on positive interactions with one’s mother and one’s father. Schoolrewards were also assessed using two questions on acknowledgment by teachersand on the school’s communication of positive activities to the student’s parent.
The average response (least rewards=1, most rewards=4) in each reward-relatedprotective factor was calculated for each grade in four survey regions. For eachfactor, the average responses for each grade level were then averaged to generatean overall score for the survey region. State values, weighted by regionalenrollment, were calculated from the entire sample. Regional and statewide resultsare presented below.
Average Scale Score for Community Rewards for Conventional Involvement
6-2
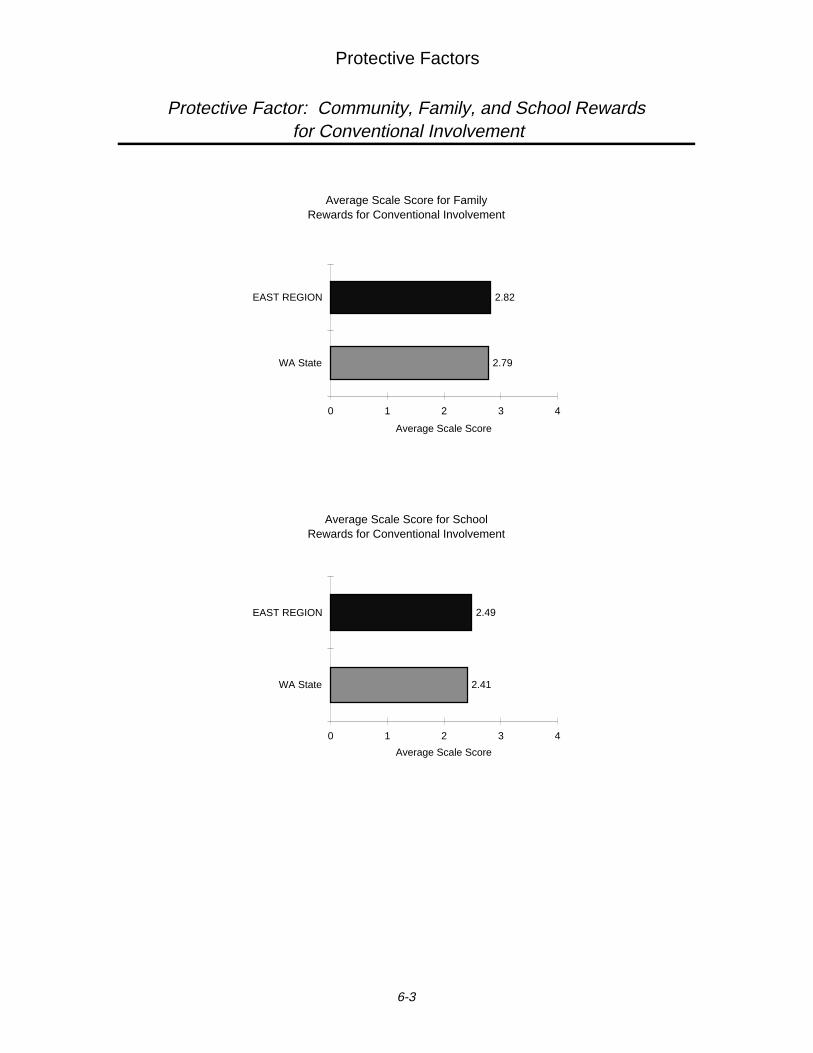
Protective Factors
Protective Factor: Community, Family, and School Rewards for Conventional Involvement
Family Rewards for Conventional Involvement
2.79
2.82
0 1 2 3 4
WA State
EAST REGION
Average Scale Score
Average Scale Score for FamilyRewards for Conventional Involvement
School Rewards forConventional Involvement
2.41
2.49
0 1 2 3 4
WA State
EAST REGION
Average Scale Score
Average Scale Score for SchoolRewards for Conventional Involvement
6-3
Protective Factors
Protective Factor: Opportunities for Positive Involvement in Families and School
Young people who are given more opportunities to participate meaningfully inimportant activities at school or in the responsibilities and activities of their familiesare less likely to engage in drug use (DRP, 1996).
In the school survey, opportunities for positive involvement in school were assessedamong 8th, 10th, and 12th grade students using two questions, one concerning theopportunities "... to help decide things like class activities and rules," and the otheron "... chances for students to talk with a teacher one-on-one." Opportunities forpositive involvement in the family were assessed using three questions, the first onopportunities to do fun things with parents, the second on inclusion in familydecisions, and third, the likelihood of approaching a parent with a personal problem.
The average response (least opportunities=1, most opportunities=4) in eachopportunity-related protective factor was calculated for each grade in four surveyregions. For each factor, the average responses for each grade level were thenaveraged to generate an overall score for the survey region. State values, weightedby regional enrollment, were calculated from the entire sample. Regional andstatewide results are presented on the following page.
6-4
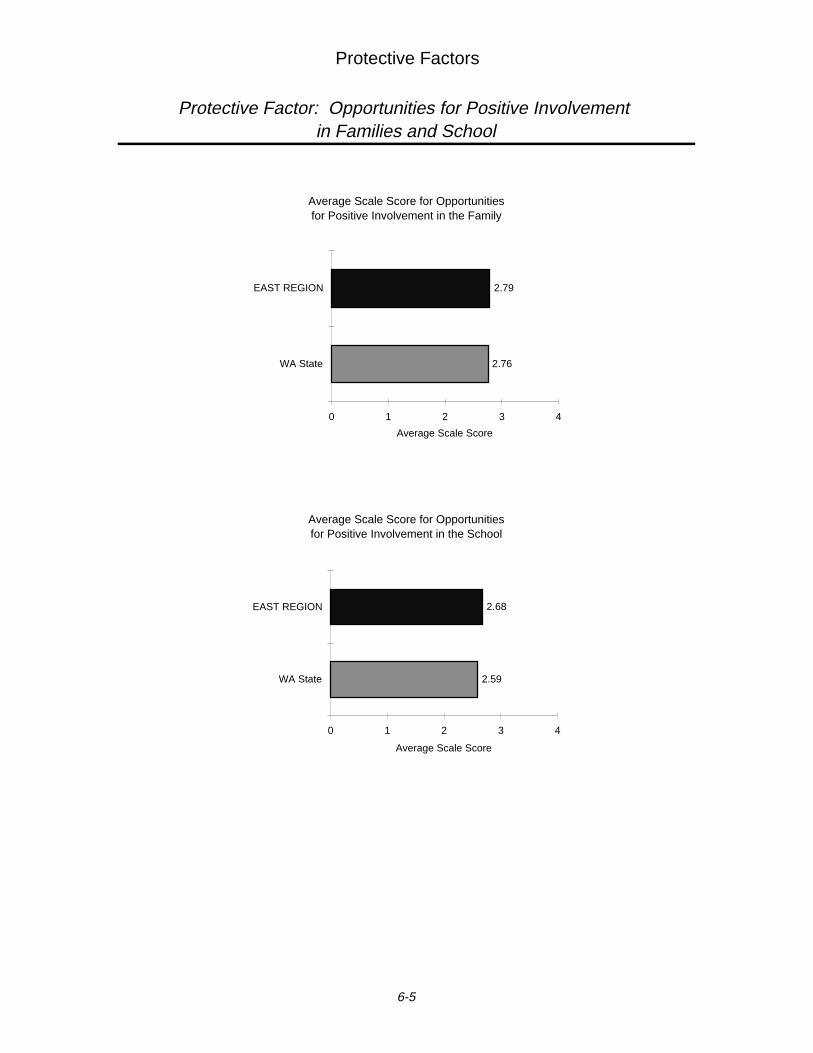
Protective Factors
Protective Factor: Opportunities for Positive Involvement in Families and School
Opportunities for Positive Involvement
in the School
2.59
2.68
0 1 2 3 4
WA State
EAST REGION
Average Scale Score
Average Scale Score for Opportunities for Positive Involvement in the School
Opportunities for Positive Involvement
in the Family
2.76
2.79
0 1 2 3 4
WA State
EAST REGION
Average Scale Score
Average Scale Score for Opportunities for Positive Involvement in the Family
6-5
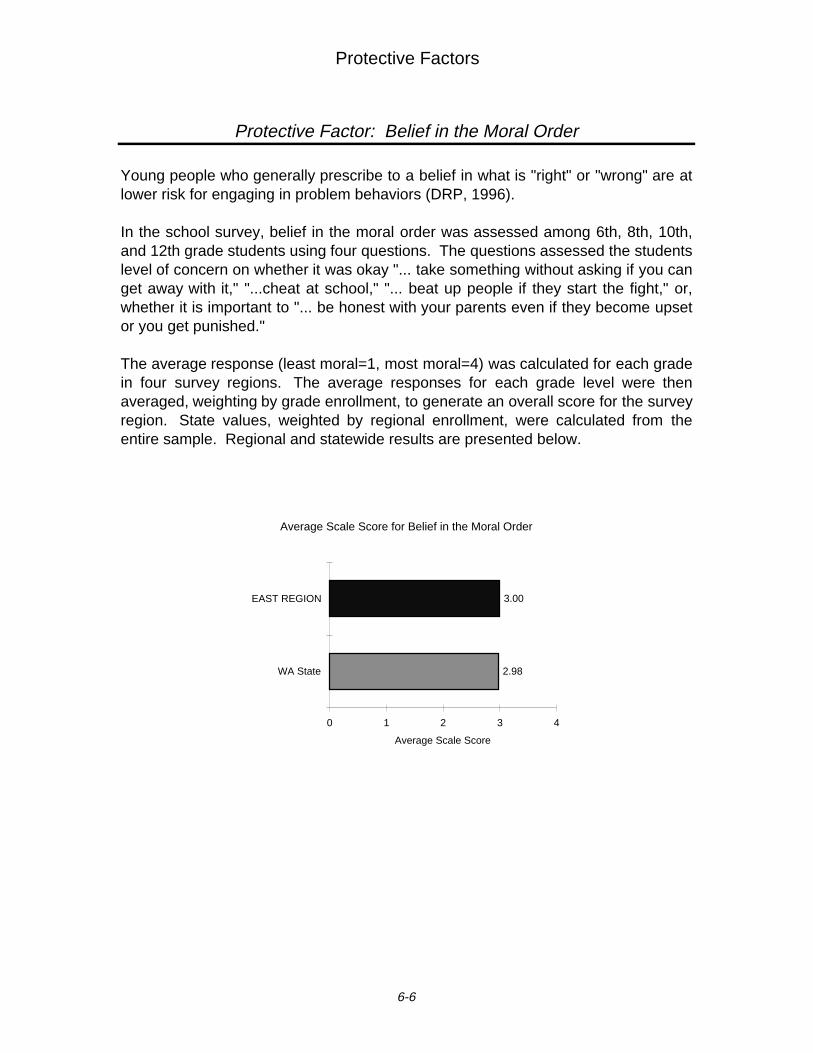
Protective Factors
Protective Factor: Belief in the Moral Order
Belief in the Moral Order
2.98
3.00
0 1 2 3 4
WA State
EAST REGION
Average Scale Score
Young people who generally prescribe to a belief in what is "right" or "wrong" are atlower risk for engaging in problem behaviors (DRP, 1996).
In the school survey, belief in the moral order was assessed among 6th, 8th, 10th,and 12th grade students using four questions. The questions assessed the studentslevel of concern on whether it was okay "... take something without asking if you canget away with it," "...cheat at school," "... beat up people if they start the fight," or,whether it is important to "... be honest with your parents even if they become upsetor you get punished."
The average response (least moral=1, most moral=4) was calculated for each gradein four survey regions. The average responses for each grade level were thenaveraged, weighting by grade enrollment, to generate an overall score for the surveyregion. State values, weighted by regional enrollment, were calculated from theentire sample. Regional and statewide results are presented below.
Average Scale Score for Belief in the Moral Order
6-6
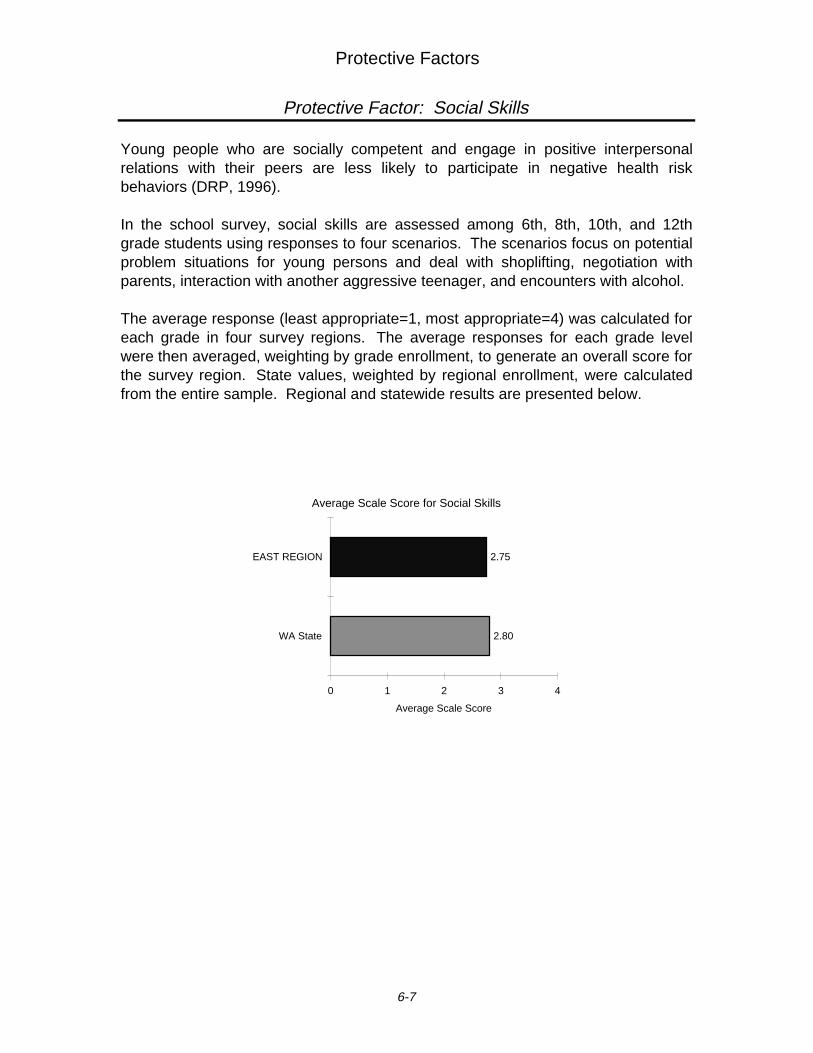
Protective Factors
Protective Factor: Social Skills
Social Skills
2.80
2.75
0 1 2 3 4
WA State
EAST REGION
Average Scale Score
Young people who are socially competent and engage in positive interpersonalrelations with their peers are less likely to participate in negative health riskbehaviors (DRP, 1996).
In the school survey, social skills are assessed among 6th, 8th, 10th, and 12thgrade students using responses to four scenarios. The scenarios focus on potentialproblem situations for young persons and deal with shoplifting, negotiation withparents, interaction with another aggressive teenager, and encounters with alcohol.
The average response (least appropriate=1, most appropriate=4) was calculated foreach grade in four survey regions. The average responses for each grade levelwere then averaged, weighting by grade enrollment, to generate an overall score forthe survey region. State values, weighted by regional enrollment, were calculatedfrom the entire sample. Regional and statewide results are presented below.
Average Scale Score for Social Skills
6-7
7 ADDITIONAL INDICATORS FOR SUBSTANCE ABUSE ANDOTHER PROBLEM BEHAVIORS
Walla Walla County, Counties Like Us1,and Washington State
In the process of collecting archival data, a number of indicators relating to druguse, criminal activity, and sexual activity could not be neatly tied to specific riskor protective factors. However, research (as well as an obvious relationship insome cases) suggests that elevated levels of these indicators correspond toelevated levels of substance abuse in the community. Evaluation of theseindicator levels may aid or further the understanding of community successes orproblems regarding substance abuse and other interrelated problem behaviors.Higher levels of these indicators likely correspond to higher rates of substanceabuse and problems often related to substance abuse.
1 Adams, Asotin, Chelan, Columbia, Douglas, Garfield, Kittitas, Lincoln, Stevens, Walla Walla,and Whitman Counties
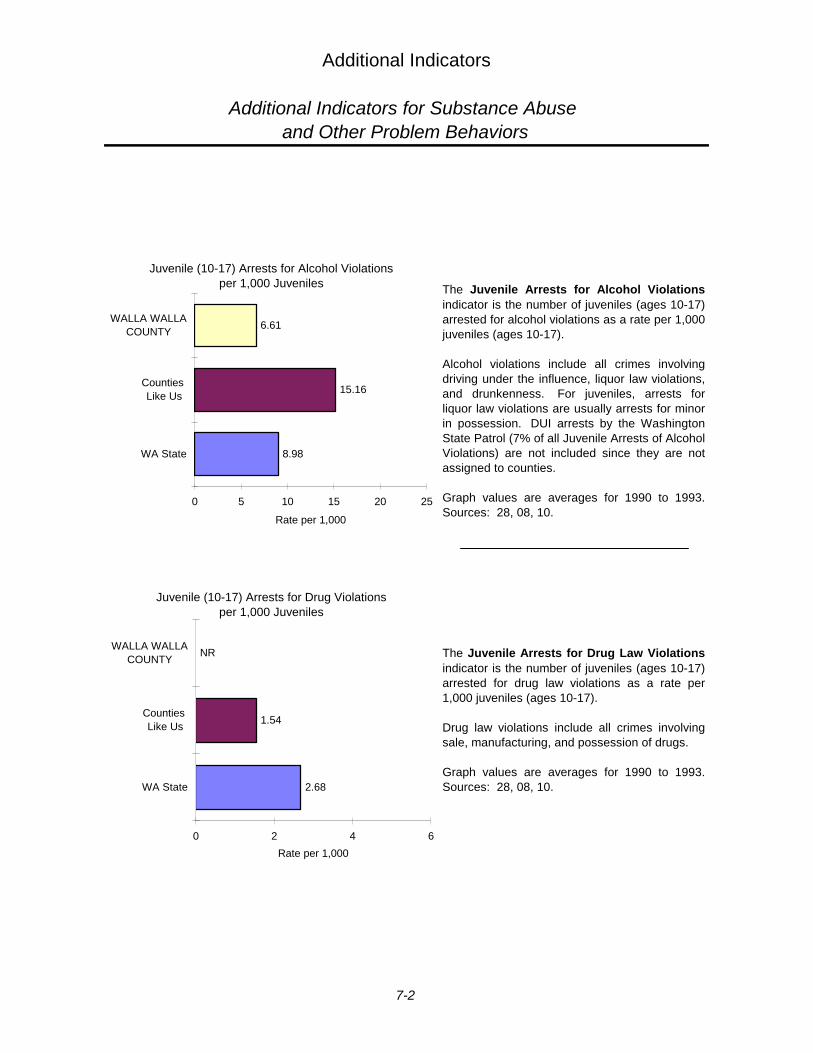
Additional Indicators
Additional Indicators for Substance Abuse and Other Problem Behaviors
The Juvenile Arrests for Drug Law Violationsindicator is the number of juveniles (ages 10-17)arrested for drug law violations as a rate per1,000 juveniles (ages 10-17).
Drug law violations include all crimes involvingsale, manufacturing, and possession of drugs.
Graph values are averages for 1990 to 1993.Sources: 28, 08, 10.
The Juvenile Arrests for Alcohol Violationsindicator is the number of juveniles (ages 10-17)arrested for alcohol violations as a rate per 1,000juveniles (ages 10-17).
Alcohol violations include all crimes involvingdriving under the influence, liquor law violations,and drunkenness. For juveniles, arrests forliquor law violations are usually arrests for minorin possession. DUI arrests by the WashingtonState Patrol (7% of all Juvenile Arrests of AlcoholViolations) are not included since they are notassigned to counties.
Graph values are averages for 1990 to 1993.Sources: 28, 08, 10.
10
2.68
1.54
NR
0 2 4 6
WA State
Counties Like Us
WALLA WALLACOUNTY
Rate per 1,000
Juvenile (10-17) Arrests for Drug Violations per 1,000 Juveniles
012a
8.98
15.16
6.61
0 5 10 15 20 25
WA State
Counties Like Us
WALLA WALLACOUNTY
Rate per 1,000
Juvenile (10-17) Arrests for Alcohol Violations per 1,000 Juveniles
7-2
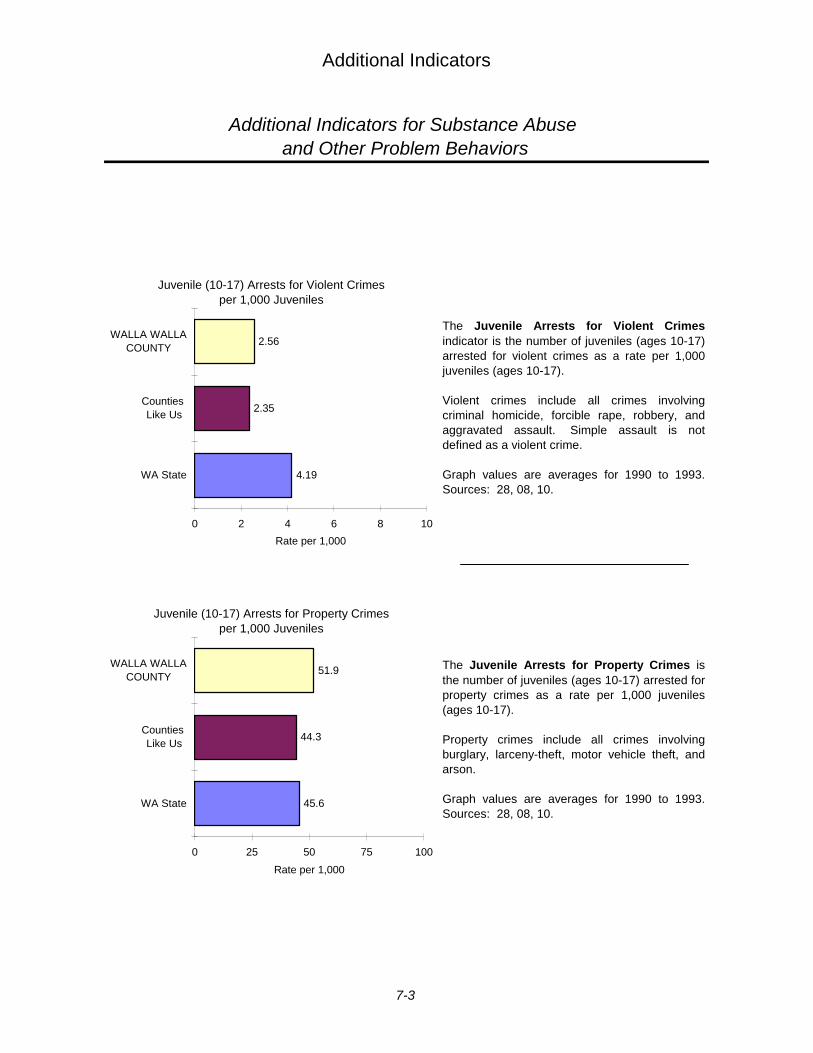
Additional Indicators
Additional Indicators for Substance Abuse and Other Problem Behaviors
The Juvenile Arrests for Violent Crimesindicator is the number of juveniles (ages 10-17)arrested for violent crimes as a rate per 1,000juveniles (ages 10-17).
Violent crimes include all crimes involvingcriminal homicide, forcible rape, robbery, andaggravated assault. Simple assault is notdefined as a violent crime.
Graph values are averages for 1990 to 1993.Sources: 28, 08, 10.
The Juvenile Arrests for Property Crimes is the number of juveniles (ages 10-17) arrested forproperty crimes as a rate per 1,000 juveniles(ages 10-17).
Property crimes include all crimes involvingburglary, larceny-theft, motor vehicle theft, andarson.
Graph values are averages for 1990 to 1993.Sources: 28, 08, 10.
009b
4.19
2.35
2.56
0 2 4 6 8 10
WA State
Counties Like Us
WALLA WALLACOUNTY
Rate per 1,000
Juvenile (10-17) Arrests for Violent Crimes per 1,000 Juveniles
009c
45.6
44.3
51.9
0 25 50 75 100
WA State
Counties Like Us
WALLA WALLACOUNTY
Rate per 1,000
Juvenile (10-17) Arrests for Property Crimesper 1,000 Juveniles
7-3
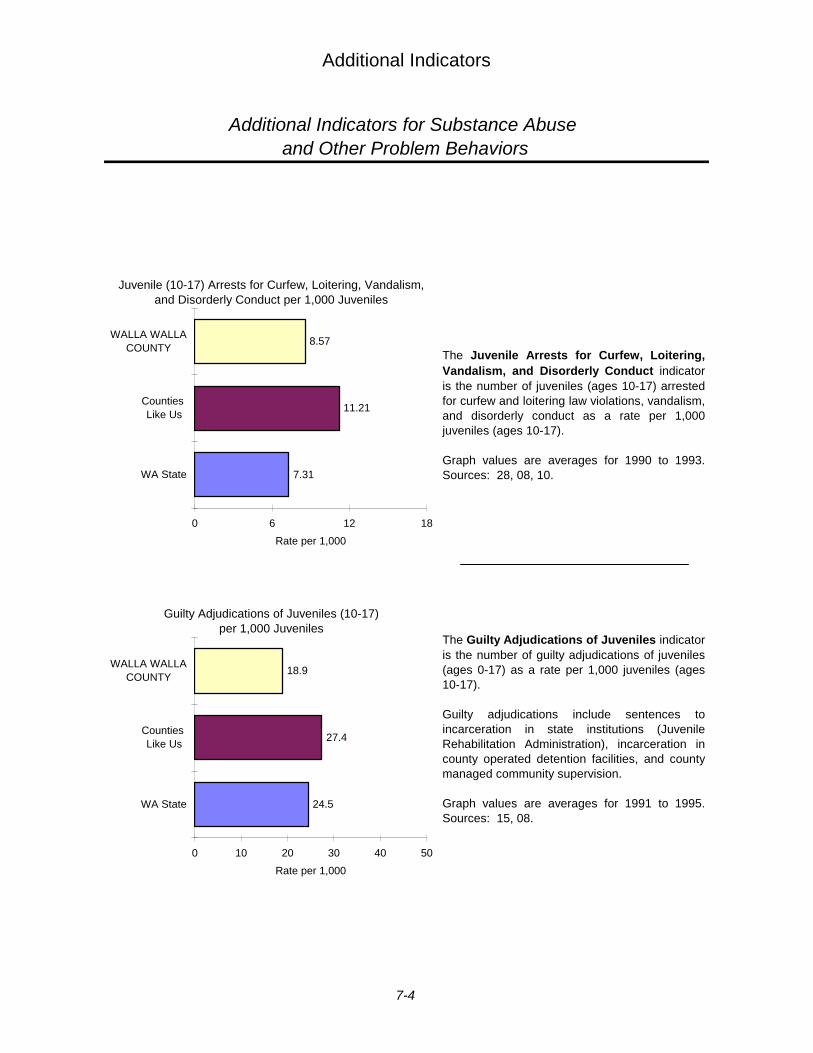
Additional Indicators
Additional Indicators for Substance Abuse and Other Problem Behaviors
The Juvenile Arrests for Curfew, Loitering,Vandalism, and Disorderly Conduct indicator is the number of juveniles (ages 10-17) arrestedfor curfew and loitering law violations, vandalism,and disorderly conduct as a rate per 1,000juveniles (ages 10-17).
Graph values are averages for 1990 to 1993.Sources: 28, 08, 10.
The Guilty Adjudications of Juveniles indicator is the number of guilty adjudications of juveniles(ages 0-17) as a rate per 1,000 juveniles (ages10-17).
Guilty adjudications include sentences toincarceration in state institutions (JuvenileRehabilitation Administration), incarceration incounty operated detention facilities, and countymanaged community supervision.
Graph values are averages for 1991 to 1995.Sources: 15, 08.
011a
7.31
11.21
8.57
0 6 12 18
WA State
Counties Like Us
WALLA WALLACOUNTY
Rate per 1,000
Juvenile (10-17) Arrests for Curfew, Loitering, Vandalism, and Disorderly Conduct per 1,000 Juveniles
084abc
24.5
27.4
18.9
0 10 20 30 40 50
WA State
Counties Like Us
WALLA WALLACOUNTY
Rate per 1,000
Guilty Adjudications of Juveniles (10-17) per 1,000 Juveniles
7-4
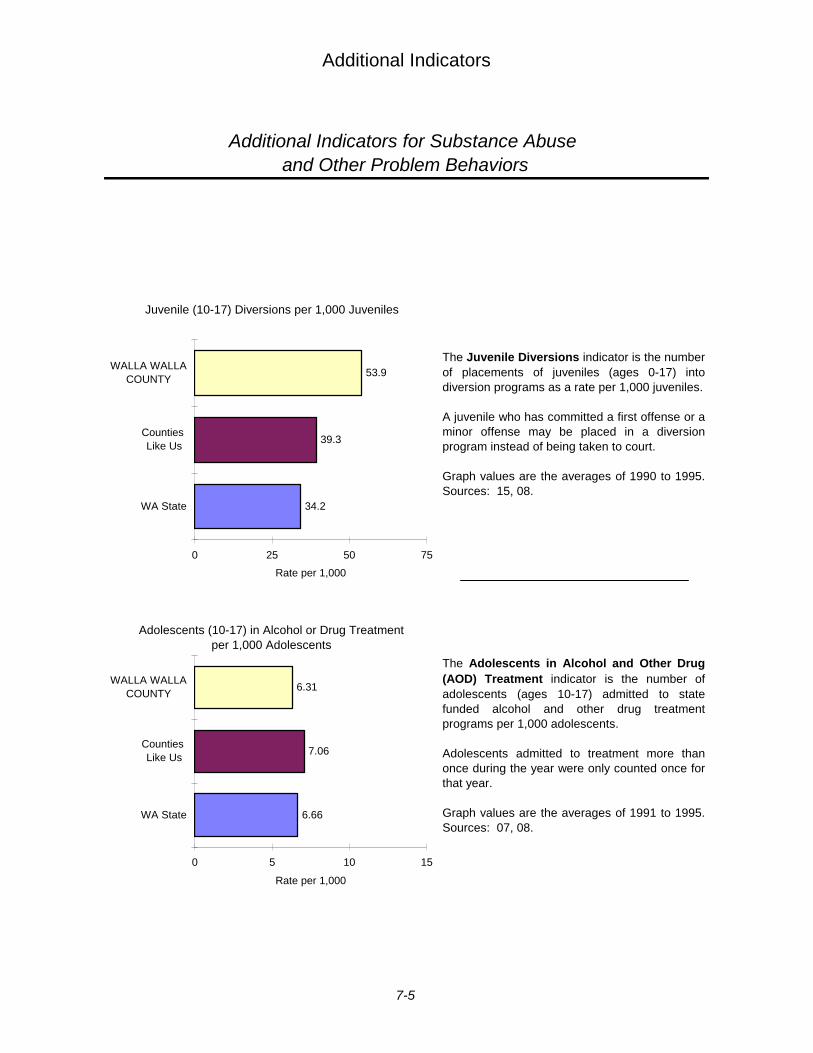
Additional Indicators
Additional Indicators for Substance Abuse and Other Problem Behaviors
The Juvenile Diversions indicator is the numberof placements of juveniles (ages 0-17) intodiversion programs as a rate per 1,000 juveniles.
A juvenile who has committed a first offense or aminor offense may be placed in a diversionprogram instead of being taken to court.
Graph values are the averages of 1990 to 1995.Sources: 15, 08.
The Adolescents in Alcohol and Other Drug(AOD) Treatment indicator is the number ofadolescents (ages 10-17) admitted to statefunded alcohol and other drug treatmentprograms per 1,000 adolescents.
Adolescents admitted to treatment more thanonce during the year were only counted once forthat year.
Graph values are the averages of 1991 to 1995.Sources: 07, 08.
084d
34.2
39.3
53.9
0 25 50 75
WA State
Counties Like Us
WALLA WALLACOUNTY
Rate per 1,000
Juvenile (10-17) Diversions per 1,000 Juveniles
86
6.66
7.06
6.31
0 5 10 15
WA State
Counties Like Us
WALLA WALLACOUNTY
Rate per 1,000
Adolescents (10-17) in Alcohol or Drug Treatment per 1,000 Adolescents
7-5
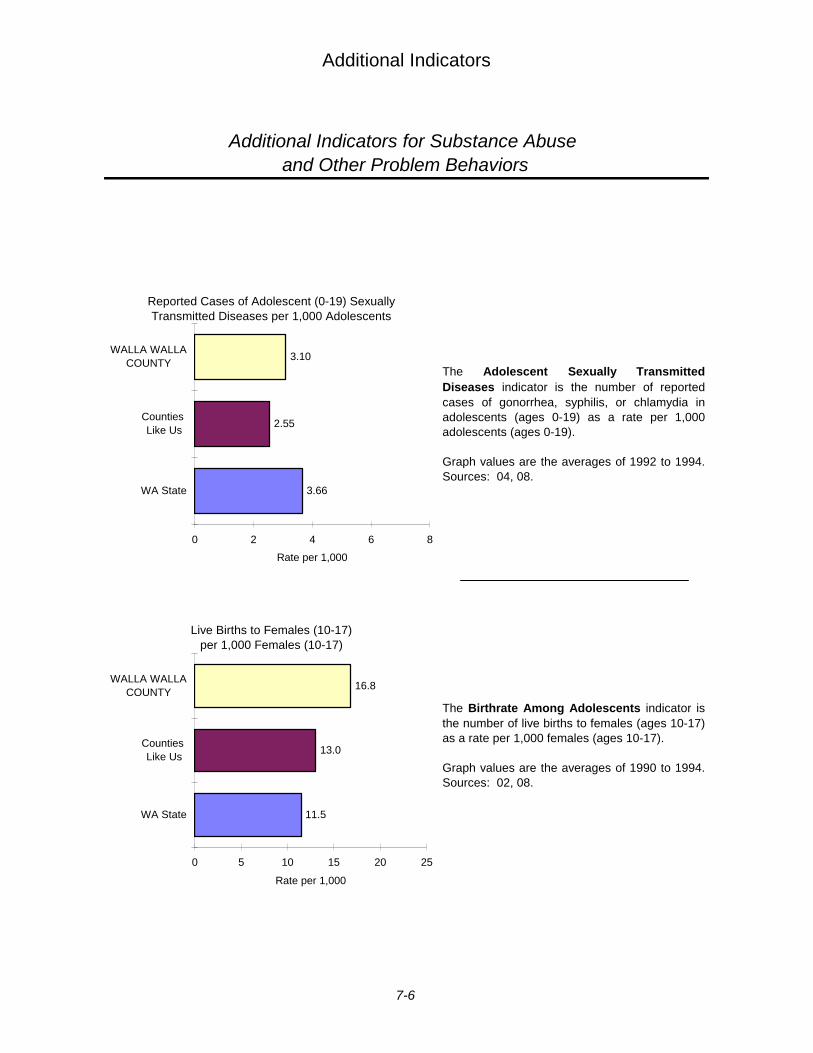
Additional Indicators
Additional Indicators for Substance Abuse and Other Problem Behaviors
The Adolescent Sexually TransmittedDiseases indicator is the number of reportedcases of gonorrhea, syphilis, or chlamydia inadolescents (ages 0-19) as a rate per 1,000adolescents (ages 0-19).
Graph values are the averages of 1992 to 1994.Sources: 04, 08.
The Birthrate Among Adolescents indicator isthe number of live births to females (ages 10-17)as a rate per 1,000 females (ages 10-17).
Graph values are the averages of 1990 to 1994.Sources: 02, 08.
087a
3.66
2.55
3.10
0 2 4 6 8
WA State
Counties Like Us
WALLA WALLACOUNTY
Rate per 1,000
Reported Cases of Adolescent (0-19) Sexually Transmitted Diseases per 1,000 Adolescents
108
11.5
13.0
16.8
0 5 10 15 20 25
WA State
Counties Like Us
WALLA WALLACOUNTY
Rate per 1,000
Live Births to Females (10-17) per 1,000 Females (10-17)
7-6

8 STANDARDIZED MEASURES
Walla Walla County, Counties Like Us1,East School Survey Region 2, and Washington State
Standardized Risk Indicators .........................................................8-2
Standardized Protective Factors....................................................8-8
Standardized Indicators of Substance Use and Other ProblemBehaviors..........................................................................................8-9
Standardized Summary Measures ............................................... 8-10
Individual Indicators. In the following graphs, indicator rates are standardized to permit comparisonsbetween indicators. Standardized values appear on the graph if they are between -2 and +2. Standardizedvalues outside of this range are labeled.
Where county indicator rates are reliable (thirty or more total events over the years of available data),standardized values are presented for both the county and for Counties Like Us. If the county indicatorrate is not reliable (less than thirty total events over the years of available data) or a “Counties Like Us”rate is unreliable, an NR appears instead of a bar or a star as appropriate. A star will always appear for“Counties Like Us” indicators that are reliable even if the county rate is unreliable.
Summary Measures of Risk Factors. Standardization also allows the calculation of a risk factorsummary measure across all indicators of a particular risk factor. The risk factor summary measure is theaverage of the standardized indicator values within a risk factor. As such, every indicator is weightedequally and of no greater or less importance than any other indicator in creating the summary measure.
Since no standardized measure is calculated for indicators where the underlying data is not reliable, suchindicators cannot be included in the calculation of the risk factor summary measure. For example, if two offour indicators associated with a risk factor are not reliable, the county summary measure of the risk factorwill be the average of the two indicators that are reliable.
In addition, “Counties Like Us” summary measures are calculated using the same indicators used tocalculate the county summary measures. Thus, when the standardized indicator value for “Counties LikeUs” is shown and the county indicator value is unreliable and not shown, the “Counties Like Us” value isnot included in the calculation of the “Counties Like Us” summary measure. This provides a comparablecalculation of summary measures for the county and its “Counties Like Us”.
1 Adams, Asotin, Chelan, Columbia, Douglas, Garfield, Kittitas, Lincoln, Stevens, Walla Walla,and Whitman Counties
2 East school survey region includes Adams, Asotin, Benton, Chelan, Columbia, Douglas, Ferry,Franklin, Garfield, Grant, Kittitas, Klickitat, Lincoln, Okanogan, Pend Oreille, Spokane Stevens,Walla Walla, Whitman, and Yakima Counties
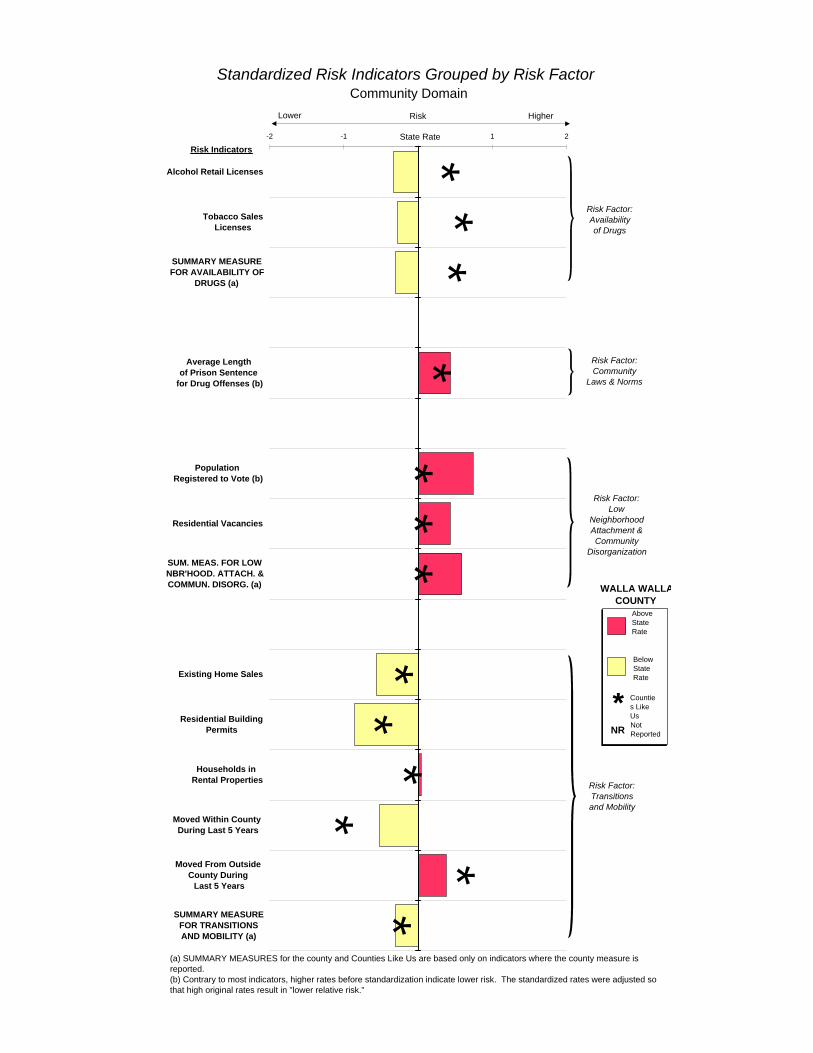
**
**
**
**
**
*
**
Risk Indicators
-2 -1 0 1 2
Alcohol Retail Licenses
Tobacco SalesLicenses
SUMMARY MEASUREFOR AVAILABILITY OF
DRUGS (a)
Average Length of Prison Sentence
for Drug Offenses (b)
Population Registered to Vote (b)
Residential Vacancies
SUM. MEAS. FOR LOWNBR'HOOD. ATTACH. &COMMUN. DISORG. (a)
Existing Home Sales
Residential BuildingPermits
Households in Rental Properties
Moved Within County During Last 5 Years
Moved From Outside County During
Last 5 Years
SUMMARY MEASUREFOR TRANSITIONSAND MOBILITY (a)
State Rate
Standardized Risk Indicators Grouped by Risk FactorCommunity Domain
Risk Factor:Community
Laws & Norms
Risk Factor:Transitions and Mobility
Risk Factor: Availability of Drugs
Risk Factor:Low
Neighborhood Attachment &Community
Disorganization
(a) SUMMARY MEASURES for the county and Counties Like Us are based only on indicators where the county measure is reported.(b) Contrary to most indicators, higher rates before standardization indicate lower risk. The standardized rates were adjusted so that high original rates result in "lower relative risk."
RiskLower Higher
WALLA WALLA COUNTY
BelowState Rate
AboveState Rate
Counties Like Us
*Not ReportedNR
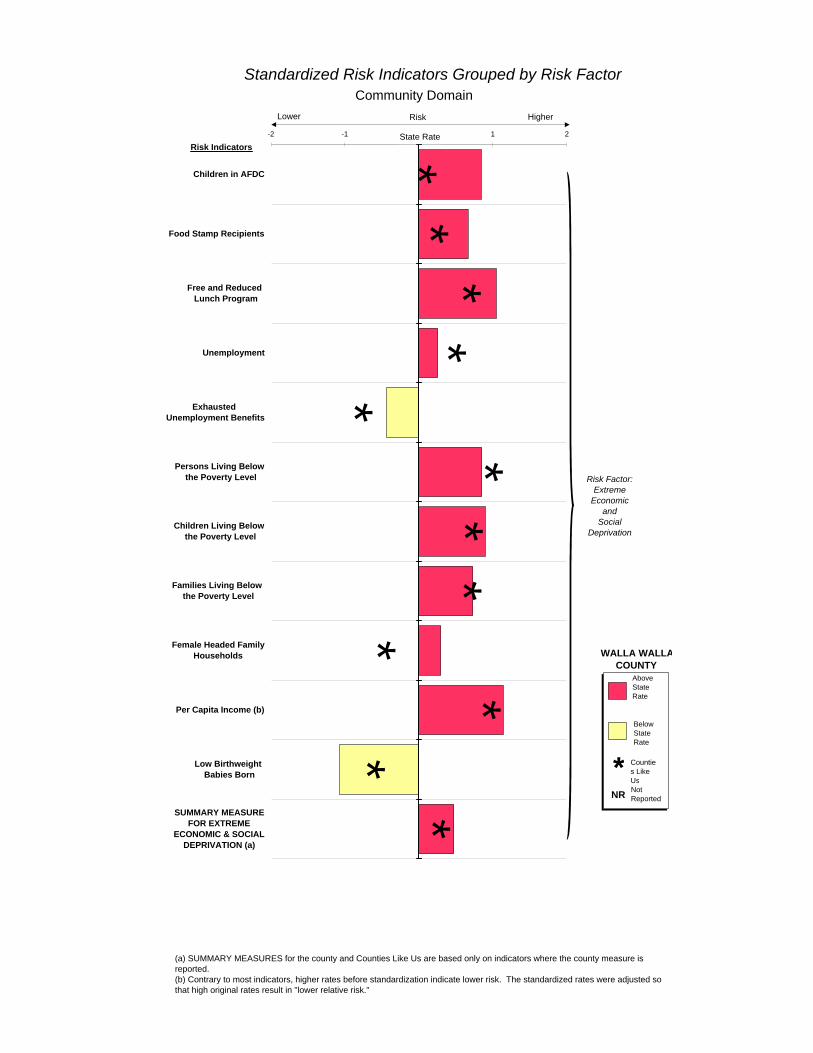
**
**
*
**
*
*
*
**
Risk Indicators-2 -1 0 1 2
Children in AFDC
Food Stamp Recipients
Free and Reduced Lunch Program
Unemployment
Exhausted Unemployment Benefits
Persons Living Below the Poverty Level
Children Living Below the Poverty Level
Families Living Below the Poverty Level
Female Headed FamilyHouseholds
Per Capita Income (b)
Low Birthweight Babies Born
SUMMARY MEASUREFOR EXTREME
ECONOMIC & SOCIALDEPRIVATION (a)
State Rate
Standardized Risk Indicators Grouped by Risk FactorCommunity Domain
Risk Factor:Extreme
Economicand
Social Deprivation
(a) SUMMARY MEASURES for the county and Counties Like Us are based only on indicators where the county measure is reported.(b) Contrary to most indicators, higher rates before standardization indicate lower risk. The standardized rates were adjusted so that high original rates result in "lower relative risk."
RiskLower Higher
WALLA WALLA COUNTY
BelowState Rate
AboveState Rate
Counties Like Us
*Not ReportedNR
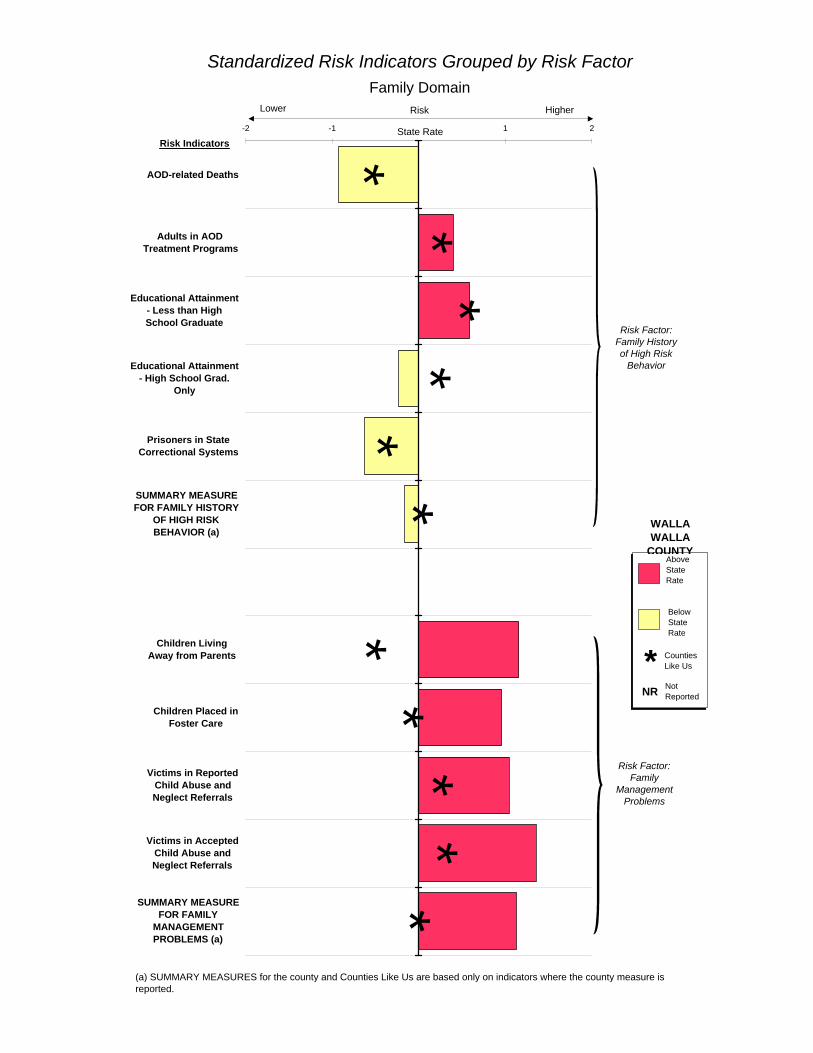
**
**
**
**
**
*
Risk Indicators
-2 -1 0 1 2
AOD-related Deaths
Adults in AOD Treatment Programs
Educational Attainment- Less than HighSchool Graduate
Educational Attainment- High School Grad.
Only
Prisoners in StateCorrectional Systems
SUMMARY MEASUREFOR FAMILY HISTORY
OF HIGH RISKBEHAVIOR (a)
Children Living Away from Parents
Children Placed inFoster Care
Victims in ReportedChild Abuse andNeglect Referrals
Victims in AcceptedChild Abuse andNeglect Referrals
SUMMARY MEASUREFOR FAMILY
MANAGEMENTPROBLEMS (a)
State Rate
Standardized Risk Indicators Grouped by Risk FactorFamily Domain
Risk Factor:Family
Management Problems
Risk Factor: Family History of High Risk
Behavior
RiskLower Higher
WALLA WALLA
COUNTY
BelowState Rate
AboveState Rate
Counties Like Us*Not ReportedNR
(a) SUMMARY MEASURES for the county and Counties Like Us are based only on indicators where the county measure is reported.
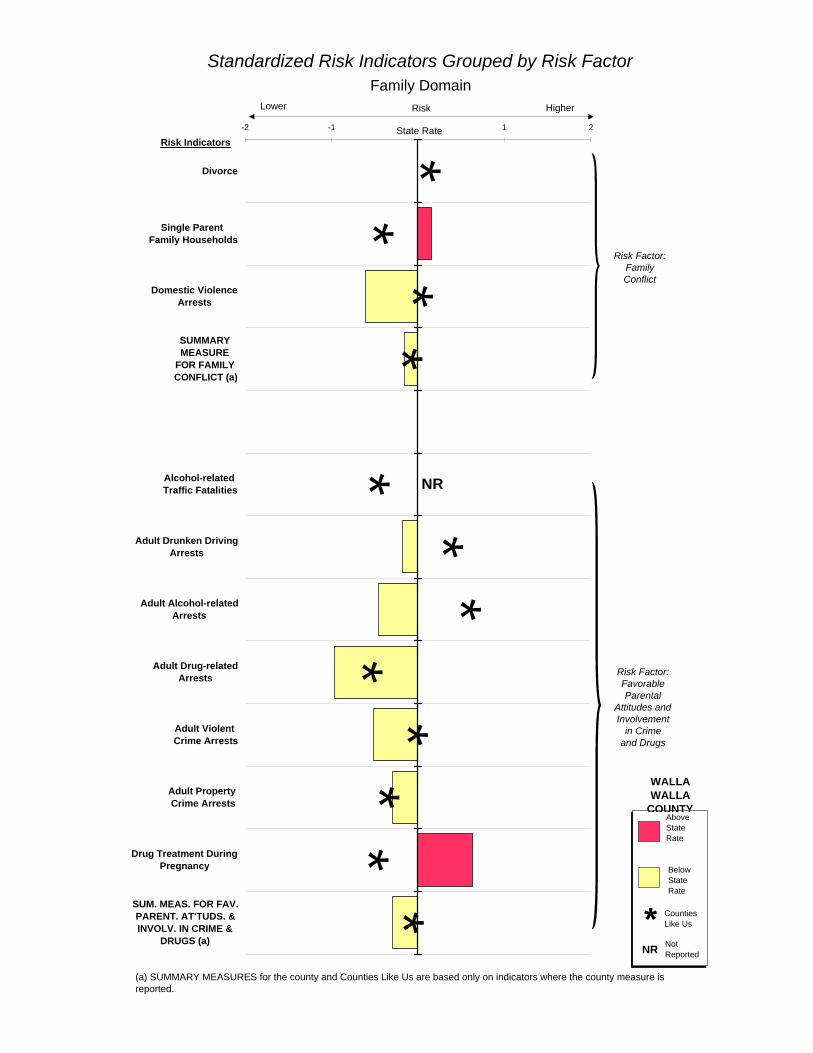
**
**
**
*
**
**
*
Risk Indicators
NR
-2 -1 0 1 2
Divorce
Single Parent Family Households
Domestic ViolenceArrests
SUMMARY MEASURE
FOR FAMILY CONFLICT (a)
Alcohol-related Traffic Fatalities
Adult Drunken DrivingArrests
Adult Alcohol-relatedArrests
Adult Drug-relatedArrests
Adult Violent Crime Arrests
Adult Property Crime Arrests
Drug Treatment DuringPregnancy
SUM. MEAS. FOR FAV.PARENT. AT'TUDS. &INVOLV. IN CRIME &
DRUGS (a)
State Rate
Risk Factor:Family Conflict
Risk Factor:Favorable Parental
Attitudes and Involvement
in Crimeand Drugs
Standardized Risk Indicators Grouped by Risk FactorFamily Domain
RiskLower Higher
(a) SUMMARY MEASURES for the county and Counties Like Us are based only on indicators where the county measure is reported.
WALLA WALLA
COUNTY
BelowState Rate
AboveState Rate
Counties Like Us*Not ReportedNR
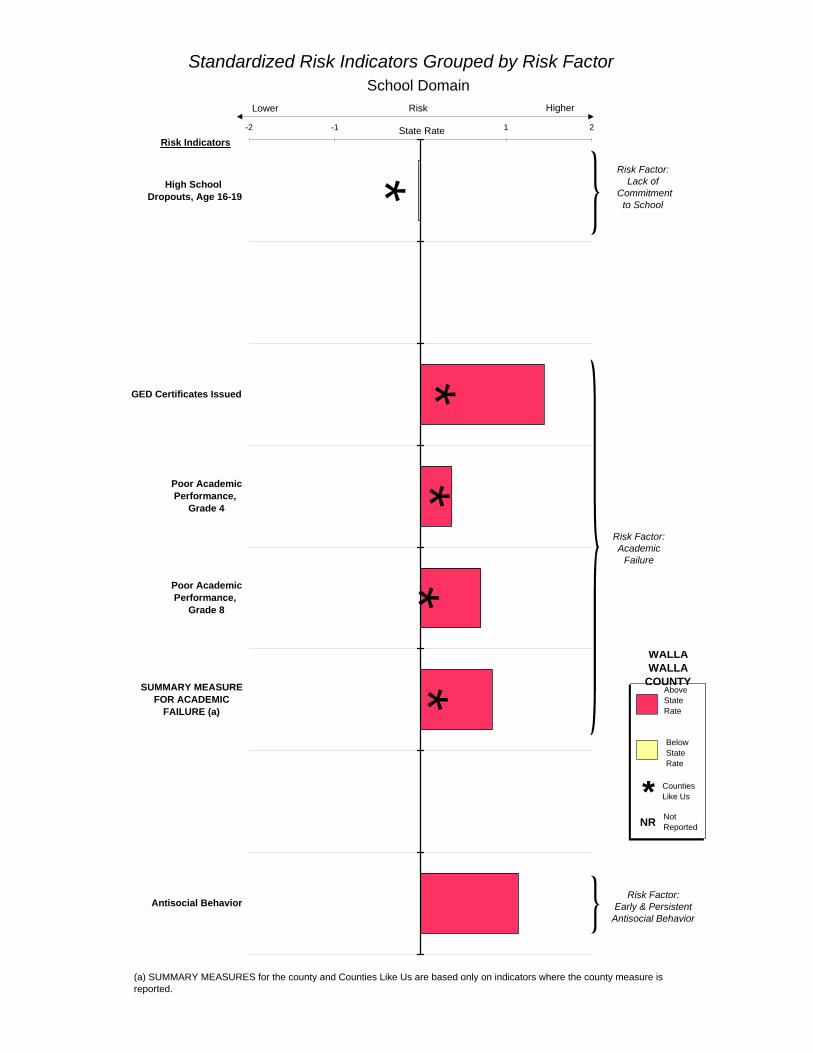
**
**
*
Risk Indicators
-2 -1 0 1 2
High School Dropouts, Age 16-19
GED Certificates Issued
Poor AcademicPerformance,
Grade 4
Poor AcademicPerformance,
Grade 8
SUMMARY MEASUREFOR ACADEMIC
FAILURE (a)
Antisocial Behavior
State Rate
Standardized Risk Indicators Grouped by Risk FactorSchool Domain
Risk Factor: Academic
Failure
Risk Factor:Lack of
Commitment to School
Risk Factor:Early & Persistent
Antisocial Behavior
RiskLower Higher
WALLA WALLA
COUNTY
BelowState Rate
AboveState Rate
Counties Like Us*Not ReportedNR
(a) SUMMARY MEASURES for the county and Counties Like Us are based only on indicators where the county measure is reported.
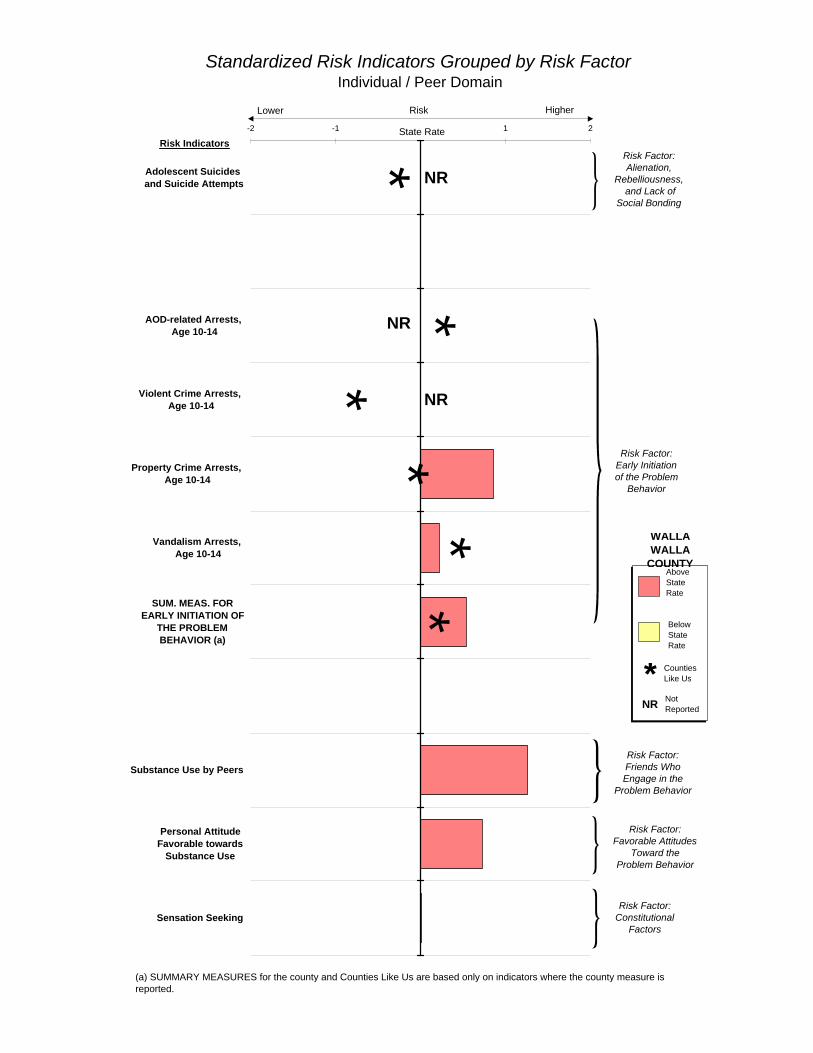
**
**
**
Risk Indicators
NR
NR
NR
-2 -1 0 1 2
Adolescent Suicides and Suicide Attempts
AOD-related Arrests, Age 10-14
Violent Crime Arrests, Age 10-14
Property Crime Arrests, Age 10-14
Vandalism Arrests, Age 10-14
SUM. MEAS. FOREARLY INITIATION OF
THE PROBLEMBEHAVIOR (a)
Substance Use by Peers
Personal AttitudeFavorable towards
Substance Use
Sensation Seeking
State Rate
Standardized Risk Indicators Grouped by Risk FactorIndividual / Peer Domain
Risk Factor: Friends Who Engage in the
Problem Behavior
Risk Factor:Early Initiation of the Problem
Behavior
Risk Factor:Alienation,
Rebelliousness, and Lack of
Social Bonding
Risk Factor: Favorable Attitudes
Toward the Problem Behavior
Risk Factor: Constitutional
Factors
RiskLower Higher
(a) SUMMARY MEASURES for the county and Counties Like Us are based only on indicators where the county measure is reported.
WALLA WALLA
COUNTY
BelowState Rate
AboveState Rate
Counties Like Us*Not ReportedNR
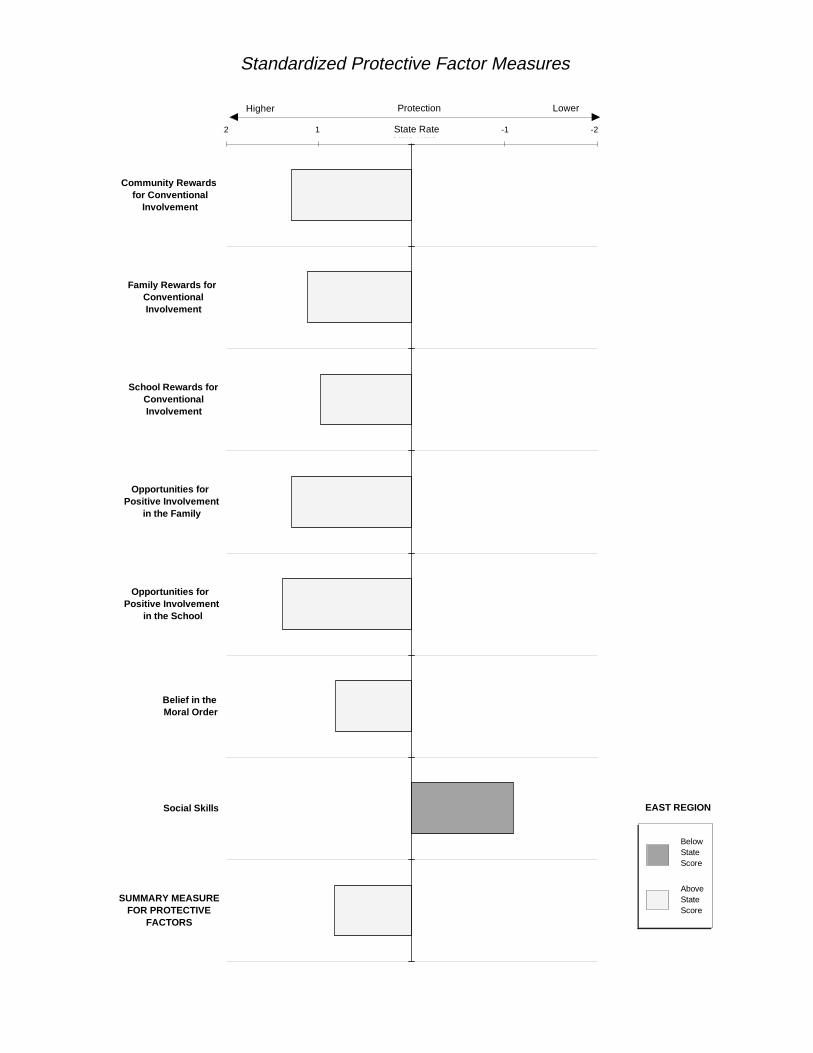
Standardized Protective Factor Measures
-2 -1 0 1 2
Community Rewards for Conventional
Involvement
Family Rewards for ConventionalInvolvement
School Rewards forConventionalInvolvement
Opportunities for Positive Involvement
in the Family
Opportunities for Positive Involvement
in the School
Belief in the Moral Order
Social Skills
SUMMARY MEASUREFOR PROTECTIVE
FACTORS
State Rate
AboveState Score
BelowState Score
EAST REGION
ProtectionHigher Lower
2 -2-11 State Rate
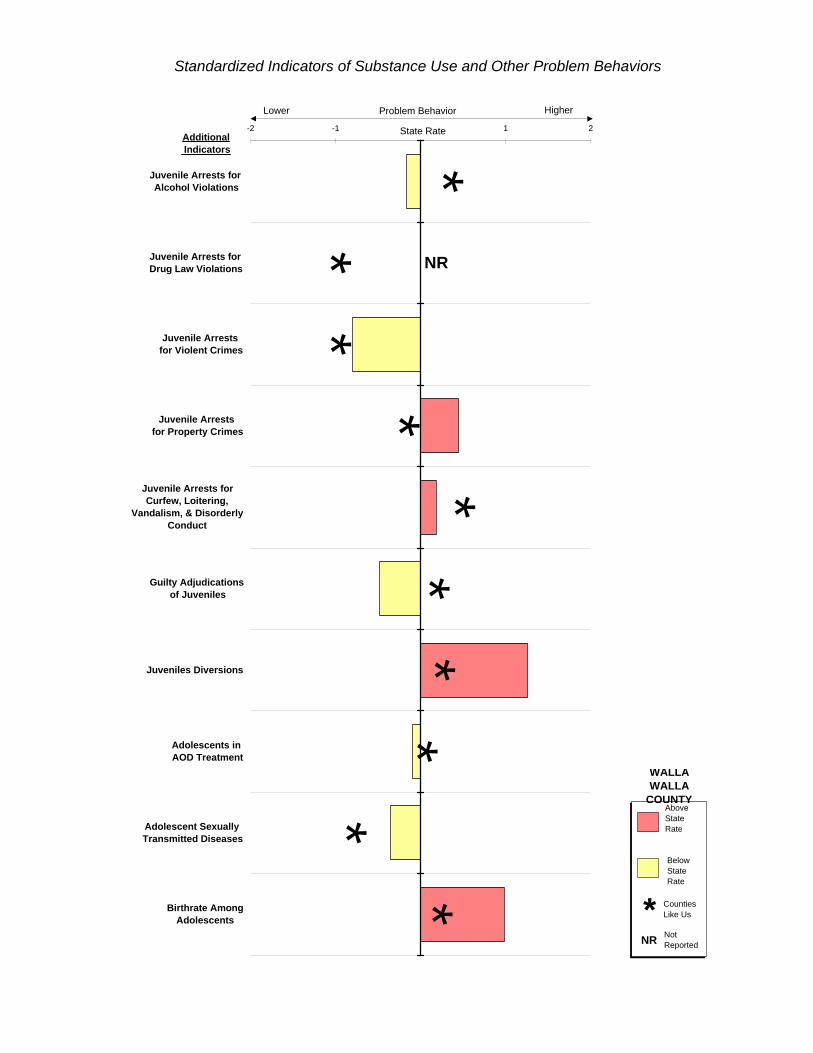
*
**
**
**
**
*
Additional Indicators
NR
-2 -1 0 1 2
Juvenile Arrests for Alcohol Violations
Juvenile Arrests for Drug Law Violations
Juvenile Arrests for Violent Crimes
Juvenile Arrests for Property Crimes
Juvenile Arrests forCurfew, Loitering,
Vandalism, & DisorderlyConduct
Guilty Adjudications of Juveniles
Juveniles Diversions
Adolescents in AOD Treatment
Adolescent Sexually Transmitted Diseases
Birthrate AmongAdolescents
State Rate
Standardized Indicators of Substance Use and Other Problem Behaviors
Problem BehaviorLower Higher
WALLA WALLA
COUNTY
BelowState Rate
AboveState Rate
Counties Like Us*Not ReportedNR

**
**
**
**
*
Risk Factors
-2 -1 0 1 2
Availability of Drugs
Community Laws &Norms Favorable to
Crime & Drugs
Low NeighborhoodAttachment &Community
Disorganization
Transitions and Mobility
Extreme Economic andSocial Deprivation
Family History of HighRisk Behavior
Family ManagementProblems
Family Conflict
Favorable ParentalAttitudes and
Involvement in Crimeand Drugs
State Rate
Standardized Summary Measures for Risk Factors Grouped by Domain (a)
FamilyDomain
CommunityDomain
RiskLower Higher
WALLA WALLA
COUNTY
BelowState Rate
AboveState Rate
Counties Like Us*Not ReportedNR
(a) SUMMARY MEASURES for the county and Counties Like Us are based only on indicators where the county measure is reported.

**
*
Risk Factors
NR
-2 -1 0 1 2
Lack of Commitment toSchool
Academic Failure
Early and PersistentAntisocial Behavior
Alienation,Rebelliousness, and
Lack of Social Bonding
Early Initiation of theProblem Behavior
Friends Who Engage inthe Problem Behavior
Favorable AttitudesToward the Problem
Behavior
Constitutional Factors
State Rate
School Domain
Individual / PeerDomain
Standardized Summary Measures for Risk Factors Grouped by Domain (a)
RiskLower Higher
WALLA WALLA
COUNTY
BelowState Rate
AboveState Rate
Counties Like Us*Not ReportedNR
(a) SUMMARY MEASURES for the county and Counties Like Us are based only on indicators where the county measure is reported.
A-1
APPENDIX A: DATA SOURCES WASHINGTON STATE AGENCIES
01 Department of Corrections, Offender Based Tracking System.
The Department of Corrections maintains the Offender Based Tracking System tomanage information on offenders in state prisons. Prisoners are felons who havebeen convicted in a Washington State Superior Court. Most of the prisoners areadults although there are a few juveniles (less than two percent of prisonadmissions), most of whom were sentenced as adults. This report does not includedata for juveniles in prison even if they were sentenced as adults.
The Offender Based Tracking System contains historical and current data at theindividual level. Annual data are based on state fiscal year (i.e. data for state fiscalyear 1995 are data for the year starting on July 1, 1994 and ending June 30, 1995).The record of each individual includes the county of conviction. The county ofconviction is the county where the felon was sentenced. In the case of multiplecrimes, the county of conviction is the county where the most serious crime wassentenced.
02 Department of Health, Center for Health Statistics, Vital Statistics RegistrationSystem (Death Certificate, Birth Certificate, and Divorce).
The Department of Health, Center for Health Statistics is mandated by the RevisedCode of Washington to maintain the state registry of vital statistics. Vital statisticsinclude birth, death, marriage, and divorce. The Vital Statistics Registration Systemincludes historical and current individual level records for the state of Washington.
Birth Certificate: The information for Certificates of Live Birth is reported bymidwives, birthing centers, hospitals, and birth attendants. In this report, each birthis assigned to a county based on the mother’s zip code and county of residence asreported on the birth certificate. Washington participates in an interstate dataexchange agreement which provides the Vital Statistics Registration System withdata for Washington residents born in others states (i.e. if a mother lives inWashington, but goes to Oregon to have her baby, the baby is a Washingtonresident and the birth is allocated to a county based on the residence of themother). Washington also receives data on Washington residents born in Canada.
Death Certificate: Physicians, medical examiners, and coroners certify the cause ofdeath on Certificates of Death; the certificates are then filed by funeral directors. Inthis report, each death is assigned to a county based on the zip code and county ofresidence reported on the death certificate. The county of residence is notnecessarily the county where the death occurred. Washington participates in aninterstate data exchange agreement which provides the Vital Statistics RegistrationSystem with data for Washington residents who die in others states. Washingtonalso receives data on Washington residents who die in Canada.
A-2
A single underlying cause of death is reported on every death certificate. Theunderlying cause of death is coded in accordance with the InternationalClassification of Diseases, Ninth Revision. See Appendix B for more information onhow the underlying cause of death is used for the indicator AOD-related Death. Forthe indicator Adolescent Suicides and Suicide Attempts, the suicide data include alldeaths where the underlying cause of death was coded as E950-E959. Data onattempted suicides come from the Comprehensive Hospital Abstract ReportingSystem (see source 03).
Divorce: Certificates of Dissolution, Declarations of Invalidity of Marriage, or LegalSeparation are completed by the clerk of the court, the attorneys, or the petitioners;then the information on the certificate is forwarded by the clerk to the StateRegistrar. Unlike births and deaths, each divorce in this report is assigned to thecounty where the legal certificate was issued, not the county of residence. Also,there is no interstate data agreement for divorces, so Washington residents whoget married in other states or in Canada are not included in the registry.
Lincoln County does not require Washington couples to appear in court foramicable divorces, which attracts many absentee divorces of couples livingelsewhere in Washington. As a result, Lincoln County has an extremely highdivorce rate.
The data in this report only include dissolutions and annulments. Legal separations(one to two percent of total dissolutions) are not included because they are not finaldissolutions of marriages. In a few cases from 1992 to 1995, the decree type wasunknown (only 19 for all four years). These cases were included in the data for thisreport. Some of the unknown decrees could be legal separations, but the impact oftheir inclusion is probably small for those years. In 1991, a large number of recordswere of unknown decrees. As a result, an estimated 300 to 400 legal separations(about one percent of total dissolutions) were included in the count of divorcesacross the state.
03 Department of Health, Office of Hospital and Patient Data Systems,Comprehensive Hospital Abstract Reporting System (CHARS).
The Department of Health, Office of Hospital and Patient Data Systems usesCHARS to keep track of patient discharges from nonfederal hospitals inWashington. CHARS also has records for Washington residents who weredischarged from Oregon hospitals (except in 1992); records from other states andCanada are not included in CHARS.
CHARS only captures data for individuals who were admitted and later dischargedfrom nonfederal hospitals. It does not include data on individuals who were treatedin outpatient facilities or who were treated in an emergency room but neveradmitted to the hospital.
CHARS has both historical and current data at the individual level. Each CHARSrecord includes the patient’s zip code and county of residence and describes thereason the patient was admitted to the hospital through diagnosis codes and
A-3
external cause codes (E-codes). The codes are in accordance with theInternational Classification of Diseases, Ninth Revision -- Clinical Modification.Attempted suicides are coded as E950-E959. Data on suicides come from the VitalStatistics Registration System (see source 02), not from CHARS.
04 Department of Health, Sexually Transmitted Disease (STD) Services.
The Department of Health, STD Services is mandated by the Revised Code ofWashington to maintain the state registry of sexually transmitted diseases. Knowncases are reported to STD Services by doctors, laboratories, clinics, hospitals,health departments, and family planning centers.
The database contains historical and current data at the individual level. Eachrecord includes the zip code and county of residence of the individual.
05 Department of Licensing, Master License Service (data received fromDepartment of Health, Division of Community and Family Health, TobaccoPrevention Program).
The Department of Licensing maintains the Master License Service to keep track oftobacco licenses issued by Washington State. Tobacco shops on reservations andmilitary bases are not licensed by Washington State and therefore are not includedin the database. The database is constantly updated; historical records are notsaved.
The Department of Licensing sends the Department of Health monthly summariesof the number of tobacco licenses. The summaries contain data aggregated bycounty. A license is attributed to a county based on the location of the tobaccobusiness. This report uses the monthly summaries for November. Using data forthe same month each year provides comparable “snapshots” of tobacco licensesissued. November represents an average month in the year.
06 Department of Social and Health Services, Children’s Administration,Administrative Services, Case And Management Information System (CAMIS).
The Department of Social and Health Services, Children’s Administration, maintainsCAMIS to manage data for Child Protective Services, Family ReconciliationServices, Child Welfare System, and case load information. The database containshistorical and current data. Zip code and county of residence data are available foreach child.
Mandated reporters, such as doctors, nurses, psychologists, pharmacists, teachers,child care providers, social service counselors, employees of the Department ofSocial and Health Services, and juvenile probation officers, are required by theRevised Code of Washington to notify Child Protective Services if they suspect achild is in danger of negligent treatment, physical abuse, sexual abuse, or othermaltreatment. In addition, other concerned individuals may report suspected childabuse cases to Child Protective Services.
A-4
A report of suspected child abuse is a referral. If the information provided meetsthe sufficiency screen, the referral is accepted for intervention. Referrals are notaccepted if the referral has no legal basis for complaint, the child cannot be located,the child cannot be identified, or the perpetrator does not live with or care for thechild (third party case). Third party cases are referred to the appropriate lawenforcement agency.
A referral (or an accepted referral) may have one or more children identified asvictims. The data in this report are based on the total number of victims reported inChild Protective Services referrals.
The data in this report only include information taken at the time of the referral.Information on intervention taken was not easily available. As a result, theproportion of the victims identified in accepted referrals that are actual victims ofchild abuse is unknown.
07 Department of Social and Health Services, Division of Alcohol and SubstanceAbuse, Client Tracking System, Treatment and Assessment Report GenerationTool (TARGET).
The Department of Social and Health Services, Division of Alcohol and SubstanceAbuse maintains TARGET to manage data on individuals admitted to state fundedalcohol and other drug treatment programs. Admissions to both residential andoutpatient programs are included. Individuals admitted to private alcohol and drugtreatment programs are not included.
TARGET contains historical and current data at the individual level. The record ofeach individual includes the zip code of residence.
08 Department of Social and Health Services, Office of Research and DataAnalysis, County Population Estimates (controlled to Office of FinancialManagement County Population Data).
The Department of Social and Health Services, Office of Research and DataAnalysis developed yearly County Population Estimates to serve as denominatorsfor rates. The Office of Research and Data Analysis purchased populationestimates at the block group level for 1990, 1995, and 2000 from Claritas, a privatedemographic marketing firm. These estimates were stratified by race, Hispanicethnicity, gender, and single year of age. The Office of Financial Management hascounty level population estimates for every year from 1990 to 1994 and state levelpopulation estimates for every year from 1995 through 2020. These estimates arereported by race and Hispanic ethnicity, gender, and single years of age forpersons birth to 24 and five year age ranges for persons over 24. Both sets ofestimates use the 1990 U.S. Census as a benchmark.
The Office of Research and Data Analysis estimated annual block group levelpopulations by subgroup, using an interpolation process on the Claritas data, whilecontrolling to the Office of Financial Management county and state level estimates.
A-5
The annual block group population estimates are aggregated to county levelestimates stratified by race, Hispanic ethnicity, gender, and single year of age.
09 Department of Social and Health Services, Office of Research and DataAnalysis, Needs Assessment Database (NADB).
The Department of Social and Health Services, Office of Research and DataAnalysis, maintains NADB to keep track of clients of the Department of Social andHealth Services. The Office of Research and Data Analysis constructs NADB bycombining extracts from 15 different Department of Social and Health Servicesautomated administrative systems into a single client-centered database. Annualdata are based on state fiscal year (i.e. data for state fiscal year 1995 are data forthe year starting on July 1, 1994 and ending June 30, 1995).
Clients using more than one service in a state fiscal year are matched andunduplicated using automated rules. Therefore, each client and each service theclient received are only recorded once. Foster care data in NADB is extracted fromthe Social Service Payment Systems (SSPS). Each SSPS record includes data onthe location of the field office involved with the child in foster care; the record doesnot include the residential zip code of the child. NADB uses an automated processto assign the child to a county based on the best geographic information availablefor that child. In addition to the field office, NADB examines records for all servicesthe child received to determine the best geographic information. Records forservices extracted from other databases may include residential zip code data.
In this report, foster care includes both short term crisis placements and longer-termplacements with foster families. Some family placements with relatives are alsoincluded. No group care placements are included.
10 Department of Social and Health Services, Office of Research and DataAnalysis, Population Adjustments for Non-reporting Police Agencies.
The Department of Social and Health Services, Office of Research and DataAnalysis, developed population adjustments to compensate for police agencies thatdid not report arrest data to the Washington Association of Sheriffs and PoliceChiefs (see source 28). For each police agency that did not report in a specificyear, a population estimate of the number of people served by that agency thatyear was developed. Police departments serve municipalities (cities and towns)and county sheriff offices serve the unincorporated parts of counties andmunicipalities without police departments. The estimates of populations servedwere based on population data from the U.S. Census and from city, town, andcounty population estimates of the Office of Financial Management. Populationestimates were created in age ranges that corresponded to the age ranges used inthe arrest data.
The estimate of the population served for each non-reporting police agency wassubtracted from the total population of the appropriate county and from the statepopulation. If a police agency reported for part of a year (at least one month, butnot 12 months), an appropriate portion of the population served by that agency was

A-6
subtracted from the county and state populations. In other words, if a police agencyreported three months of data, three-fourths of the population served by thatagency would be subtracted from the county and state populations. One-fourth ofthe served population would remain in the new county and state populationsbecause the agency reported for a quarter of the year.
11 Department of Social and Health Services, Office of Research and DataAnalysis, Warrant Roll.
The Department of Social and Health Services uses the Warrant Roll to determinewho is eligible for benefits (cash, medical coupons, food stamps) each month andto issue the benefits. The Office of Research and Data Analysis extracted data forthe month of April from the Warrant Roll for this report. Although the number ofbenefits issued varies from month to month, April represents an average month inthe year.
The Warrant Roll contains historical and current data at the individual level. Therecord of each individual includes a zip code of residence. In this report, individualsare unduplicated; each member of a family receiving welfare is counted separately.
There are two types of Aid to Families with Dependent Children (AFDC) grants,regular and employable. Clients who receive regular grants come from poorfamilies with children under 18 (or between 18 and 19 and finishing high school) orlow-income single women in the third trimester of pregnancy. The clients are eithersingle-parent families or two-parent families where one parent is unemployable dueto disability.
Clients who receive employable grants come from poor two-parent families withchildren under 18 (or between 18 and 19 and finishing high school) or from familieswith a woman in the third trimester of pregnancy, in which one or both parents areunemployed. At least one of the parents must have worked recently to qualify thefamily for this assistance.
In 1988, the Family Independence Program (FIP) was introduced to simplify theapplication process for AFDC; the program continued until 1993. FIP included bothregular and employable grants. In this report, the indicator Children in AFDCincludes regular and employable AFDC clients and regular and employable FIPclients where appropriate. Because FIP allowed people to participate in AFDC whowould not normally have participated and because the program was implemented indifferent regions at different times, caution should be used when comparing AFDCdata over time or across space.
Clients who receive food assistance (Food Stamps and FIP food cash) are low-income individuals. Food stamps are coupons which can be redeemed for food.FIP grant recipients receive cash instead of coupons. In this report, both foodstamps and FIP food cash, where appropriate, are included in the indicator FoodStamp Recipients.
A-7
Caution should be used when comparing food stamps data across time or acrossspace. From 1988 to 1993, FIP may have increased the number of participants infood assistance. FIP did not change the eligibility criteria for food assistance, butthe program may have encouraged people to participate who would not normallyhave participated. Also, FIP was implemented in different regions at different times.
Data in this report are different from data published in the Blue Book because thedata in the Blue Book are from the Average Grant Reporting System, not from theWarrant Roll. The data from the Average Grant Reporting System include somecorrections that are not available when the Warrant Roll is generated. This reportuses Warrant Roll data because the Average Grant data do not include individuallevel detail at the level needed for the CORE-GIS.
12 Employment Security Department, Labor Market and Economic Analysis,Benefits Automated System (BAS).
The Employment Security Department uses BAS to determine who is eligible forbenefits and the amount of benefits the applicant is eligible for. BAS containsinformation about several types of claims such as initial, continued, and exhausted.Both historical and current data are available at the claimant level. Annual data arebased on state fiscal year (i.e. data for state fiscal year 1995 are data for the yearstarting on July 1, 1994 and ending June 30, 1995).
This report uses summarized data extracted from BAS. For each state fiscal year,people with exhausted unemployment benefits were allocated to counties based onresidential zip codes. Thus, the county is the county of residence, not necessarilythe county of employment.
Unemployed persons are age 16 and over, actively looking for work, currentlyavailable for work, and not working. In this report, exhausted refers to clients whohave used up their unemployment benefits.
13 Employment Security Department, Labor Market and Economic Analysis, LocalArea Unemployment Statistics (LAUS) Unit.
The Employment Security Department uses LAUS to develop estimates of totalemployment and unemployment by county. LAUS is based on data from a regularnational survey of households supplemented by additional state data (for example,unemployment insurance claims and surveys of business establishments).
Unemployed persons are age 16 and over, actively looked for work, currentlyavailable for work, and not working. The civilian labor force includes persons ages16 and over who are working or are actively looking for work (employed personsplus unemployed persons).
14 Liquor Control Board, Report of Operations.
The Liquor Control Board publishes summary data on retail alcohol licenses issuedin the state of Washington in the Report of Operations. The data come from the
A-8
financial system of the Liquor Control Board and are annual summaries based onthe state fiscal year (i.e. data for state fiscal year 1995 are data for the year startingon July 1, 1994 and ending June 30, 1995). Historical records are not savedelectronically. Each license is assigned to a county based on the location of thebusiness. Retail alcohol facilities on reservations and military bases are notlicensed by Washington State and, therefore, are not included in the data.
15 Office of the Administrator for the Courts, Juvenile Information System(JUVIS).
The Office of the Administrator for the Courts maintains JUVIS to manageinformation on juvenile offenders. JUVIS contains historical and current data at theindividual level. The county of adjudication is recorded in JUVIS for eachadjudication.
The data in this report is unduplicated by guilty adjudication incident. A single guiltyadjudication can pertain to multiple crimes. In this report, a single guilty incidentwould be counted once regardless of how many crimes were involved. If a juvenileis adjudicated more than once during a year each guilty incident is countedseparately.
This report includes adjudications for all juveniles (ages 0 to 17). However, thedenominator for Guilty Adjudications of Juveniles is juveniles ages 10 to 17because the vast majority of guilty adjudications are for juveniles ages 10 to 17.
16 Office of Superintendent of Public Instruction, Child Nutrition, Free andReduced Price Eligibility.
The Office of Superintendent of Public Instruction, Child Nutrition, maintains recordson Free and Reduced Price Eligibility for a federally funded program that providesfree and reduced price lunches to students. Children are eligible for free lunches iftheir family income is at or below 130% of the federal poverty level or for reducedprice lunches if their family income is at or below 185% of the federal poverty level.The data files contain counts of the number of students in public school whoapplied and were accepted for free and reduced price lunch by school district.Public school students who are accepted through letters of direct certification arealso included. Annual data are based on the school year (i.e. 1995 data are datafor the school year starting in the fall of 1995).
A few school districts do not participate in the federal free and reduced lunchprogram. In counties where school districts do not participate, low rates for theindicator Free and Reduced Lunch Program may underestimate the eligibility rate ofstudents in that county.
17 Office of Superintendent of Public Instruction, Information Services.
The Office of Superint endent of Public Instruction, Information Services maintainsdata on enrollment. In October, each school in Washington State submitsenrollment data to the Office of Superintendent of Public Instruction. The data

A-9
record the unduplicated number of students enrolled in each grade on the first ofOctober. The data are available aggregated by school district. This report uses thepublic school October enrollment data. The annual data are based on the schoolyear (i.e. 1995 data are data for the school year starting in the fall of 1995).
18 Office of Superintendent of Public Instruction, Information Services (in thefuture contact Washington State Board for Community & Technical Colleges).
This report received data on the number of people receiving their GeneralEducational Development (GED) certificate from the Office of Superintendent ofPublic Instruction, Information Services, but in the future, all data inquires should bedirected to the Washington State Board for Community & Technical Colleges.
The GED testing centers report data on individuals who qualify to receive GEDcertificates (passed five tests: writing, literature and arts, social studies, science,and math) to the Board for Community & Technical Colleges. The Board’sdatabase contains historical and current data at the individual level. The record ofeach individual includes a residential zip code.
19 Office of Superintendent of Public Instruction, Instructional Programs,Curriculum and Assessment, Washington State Assessment Program.
The Office of Superintendent of Public Instruction, Instructional Programs,Curriculum and Assessment maintains data for the Washington State AssessmentProgram. Each fall, the Washington State Assessment Program collectsinformation about student achievement in fourth and eighth grade through theComprehensive Tests of Basic Skills, 4th edition. Most students take the testalthough some students may not take it because of absence, enrollment in SpecialEducation, limited English skills, or other special circumstances.
The database includes both current and historical data. The data for this reportwere provided aggregated by school district for each school year (i.e. 1995 data aredata for the school year starting in the fall of 1995). Some school districts do nothave any students enrolled in one or both grades. The “Battery” test includes thereading, language, and math subtests.
20 Office of Superintendent of Public Instruction with Department of Health andDepartment of Social and Health Services, Washington State Survey ofAdolescent Health Behaviors (WSSAHB), December 1995 (school survey).
The 1995 WSSAHB, which has evolved since 1988, was the fourth biennial surveyof health risk behaviors among Washington students. The contractor, RMCResearch Corporation worked with the Office of Superintendent of PublicInstruction, the Department of Health, and the Department of Social and HealthServices on the development of the survey. The University of Washington SocialDevelopment Research Group provided consultation on the risk and protectivefactor portion of the survey.
A-10
A random sample of schools, stratified by district size and region, was selected ateach grade level to constitute a representative sample of students in grades 6, 8,10, and 12. Some schools refused to participate in the survey. If a school refusedto participate, a comparable school was asked to participate in its place. Thesurvey was designed to produce estimates of risk and protective factors at the stateand the regional level (see Chapter 4), not at the county or school district level. Thestudents in the sixth grade participate in a shorter survey. They were excluded fromthis report because they did not receive all of the questions needed to develop therisk and protective factor measures.
21 Office of the Secretary of State, Elections Division, Certified Election Results.
The Office of the Secretary of State, Elections Division maintains data on CertifiedElection Results. Both historical and current data are available for the NovemberWashington State General Elections. Data on registered voters and on votes castare available aggregated by county.
22 Sentencing Guidelines Commission, Adult Felony Database. Data provided bythe Washington State Sentencing Guidelines Commission. Analysis andinterpretation of the data are the sole responsibility of the authors.
The Sentencing Guidelines Commission maintains the Adult Felony Database tomonitor adult felony sentences. There are a few juveniles, most of whom weresentenced as adults, included in the Adult Felony Database. This report does notinclude juveniles in sentencing data even if they were sentenced as adults.
The Adult Felony Database contains historical and current data at the individuallevel. The record of each individual includes a county of conviction. The county ofconviction is the county where the felon was sentenced.
23 State Patrol, Identification and Criminal History Section, Criminal HistoryDatabase.
The State Patrol is mandated by the Revised Code of Washington (RCW) tomanage a Criminal History Database. The database contains historical and currentdata at the individual level. Any adult arrested in Washington for a grossmisdemeanor or a felony should be included in the database if the person wasbooked and fingerprinted. The State Patrol is not mandated to maintain data onjuveniles or data on individuals arrested for misdemeanors, but the database doesinclude some of these type of records. Because the database does not include alljuvenile arrests or all arrests for misdemeanors, juvenile arrests and arrests formisdemeanors are not included in this report. For some arrests in the database,the crime was identified, but the crime class (felony, gross misdemeanor,misdemeanor) was not. Most of these crimes are probably gross misdemeanors, sothey are included in this report.
Each arrest record includes an arresting or booking agency. An agency can be apolice department, which serves a municipality (city or town), or a county sheriff’sdepartment, which serves the unincorporated parts of a county and the
A-11
municipalities without police departments. In some counties, the county sheriff’soffice is responsible for reporting all data to the State Patrol and is recorded as thebooking agency regardless of where the initial arrest occurred. In other counties,each arresting agency forwards the data to the State Patrol and is recorded as thearresting agency. As a result, the data cannot be easily reported at geographiclevels below the county, but data from arresting and booking agencies are easilyaggregated to the county level.
If a crime is associated with domestic violence, then it is coded as a domesticviolence crime in the Criminal History Database. In other words, a domesticviolence-related assault is coded differently from an assault that is not related todomestic violence. Domestic violence is defined in the RCW and includes anyviolence by one family member against another family member. Family can includespouses, former spouses, parents who have a child in common regardless of theirmarital status, adults who live in the same household, and parents and children.
The Office of Research and Data Analysis unduplicated the data from theWashington State Patrol by “arrest incident.” Thus, if a person appeared in theCriminal History Database more than once on a single day, the person was countedonly once (one arrest incident). If a person was arrested on more than one day,then the person was counted each time (two or more arrest incidents).
24 State Patrol, Records Section, Accident Records Database (data received fromTraffic Safety Commission, Traffic Records Data Center, Traffic Collisions inWashington State: Data Summary and Highway Safety Problem Analysis).
The Revised Code of Washington mandates that the State Patrol maintain anAccident Record Database which includes all collisions on public trafficways thatresult in an injury, death, or property damage over $500. Each accident recordincludes the city and county where the collision occurred. In this report, thefatalities are allocated to a county based on the location of the accident not theresidence of the individuals involved.
Fatal accidents are a subset of all traffic accidents, and alcohol-related fatalaccidents are a subset of fatal accidents. Alcohol-related fatalities include fatalitieswhere a driver (not necessarily the victim) involved in the accident “had beendrinking,” as determined by the officer on the scene. An individual does not have tobe legally drunk (have a blood alcohol level of .01) to be counted as “had beendrinking.”
This report used data from Traffic Collisions in Washington State: Data Summaryand Highway Safety Problem Analysis , a report published by the Traffic SafetyCommission, Traffic Records Data Center. The report contains data on trafficfatalities and alcohol-related traffic fatalities summarized at the county level.

A-12
OTHER SOURCES
25 U.S. Bureau of Economic Analysis, Regional Economic Information System(REIS).
The U.S. Bureau of Economic Analysis publishes data on personal income andemployment through the Regional Economic Information System. The data areavailable for the entire country and are updated annually. The data in this reportwere downloaded from a Regional Economic Information System site on theinternet.
26 U.S. Census, Summary Tape File (STF) 1A.
STF1A provides data and statistics based on the short form or the 100-percent formof the 1990 U.S. Census. Questions on the short form were asked of all personsand housing units in the United States; the questions related to basic demographicand housing information (for example, race, age, marital status, housing value, orrent). STF1A data are available aggregated to the census block or the county level.
27 U.S. Census, Summary Tape File (STF) 3A.
STF3A provides data and statistics based on the long form or the sample form ofthe 1990 U.S. Census. Questions on the long form were asked of a sample of thepopulation and housing units. Additional questions provided more detail than theshort form and pertained to income, occupation, and housing costs in addition tothe basic demographic and housing information. The STF3A data are estimates ofthe actual figures that would have been obtained if all persons and housing unitshad responded to the long form. STF3A data are available aggregated to thecensus block group level.
28 Washington Association of Sheriffs and Police Chiefs (WASPC), Uniform CrimeReporting (UCR) Database and Seattle Police Department Annual UCR Data.
The UCR Program was initially developed to help the Federal Bureau ofInvestigation (FBI) collect national statistics on crime. Law enforcement agenciesthroughout the country voluntarily submit crime data to the FBI; the FBI providesinstructions and report forms to ensure the data are recorded in a uniform manner.UCR data included data on offenses, arrests, homicides, and law enforcementofficers killed or assaulted.
In Washington, law enforcement agencies voluntarily submit UCR data to WASPC.WASPC then forwards the data to the FBI. Law enforcement agencies includepolice departments for municipalities and county sheriff offices for unincorporatedparts of counties and for municipalities without police departments. Most agenciesthat submit data, do so monthly; the Seattle Police Department submits annualsummaries instead. Some agencies do not provide any data to WASPC or provideless than a full year’s worth of data. Agency participation varies from year to year.

A-13
Non-reporting affects the data in this report. Numerators (the number of arrests)are not comparable across time because the police agencies that report within in acounty may not be the same from year to year. In other words, if all the policeagencies in a county report a full year of data in 1990, but one agency does notreport any data in 1991, then the 1990 and the 1991 arrests cannot be comparedbecause the 1991 arrests are missing the arrests of one agency.
In this report, the population denominators were adjusted to compensate for non-reporting. If a police agency did not report any data, then the population under thejurisdiction of that agency was removed from the denominators (see source 10) ofboth the county and the state. This adjustment makes it possible to compare therates of arrests from year to year. Nevertheless, extreme caution should be usedwhen interpreting the arrest data. Comparison of the rates from year to yearassumes that the data of the reporting agencies are representative of the data forthe county as a whole. If a large percentage of the population of a county is underthe jurisdiction of non-reporting agencies, then the data of the reporting agenciesmay not be representative of the population of the entire county. Appendix I showscounties for which reported arrest rates were based on less than 80 percent of thepopulation of the county.
Most reservations have tribal police departments. A few tribal police departmentsreport to WASPC, but most do not. Some tribal police departments work closelywith the sheriff’s office and report data through the sheriff’s office, but some do not.There was no easy way to determine which tribal police departments reported dataindirectly (through another law enforcement agency) to WASPC from 1990 to 1993.As a result, the reservation population was subtracted from the denominator for anytribal police department that did not report to WASPC, except for the PuyallupReservation. The vast majority of people who reside on the Puyallup Reservationare under the jurisdiction of local city and county police agencies, so they were notremoved from the denominator. If a town on a reservation had its own policedepartment that reported, but the tribal police did not report, the town was includedin the denominator, but the rest of the reservation was removed from thedenominator.
If a person is arrested once for multiple crimes, only the most serious crime iscounted for UCR data. If a person is arrested multiple times, each arrest is countedunder the most serious crime for that arrest. If two or more people are arrested forone crime, each person is counted as an arrest. Arrest data are reported by thelocation of the arrest, not the residence of the person arrested. The arrest data area measure of the number of people arrested; they are not a measure of the numberof crimes committed or the number of charges lodged.
The Seattle Police Department does not report juvenile arrests for Driving Under theInfluence (DUI). For the indicator Juvenile Arrests for Alcohol Violations, the Seattlejuvenile population was removed from the denominator. The Seattle juvenilepopulation was not removed from any other arrest denominators.
Arrests by the State Patrol cannot be allocated to counties. A significantpercentage of Washington arrests for DUI (41 percent of adult DUI arrests) arereported by the State Patrol. The State Patrol DUI arrests are not included in the

A-14
state total in this report because all county comparisons to the state rate wouldappear too low. This affects three indicators: Adult Drunken Driving Arrests, AdultAlcohol-related Arrests, and Juvenile Arrests for Alcohol Violations. The StatePatrol does not report a significant percentage of Washington arrests for any othercrime. Therefore, for all other crimes, any arrest made by the State Patrol isincluded in the state data.
29 Washington Center for Real Estate Research, Washington State University,Washington State’s Housing Market: A Supply/Demand Assessment .
The Washington Center for Real Estate Research publishes Washington State’sHousing Market: A Supply/Demand Assessment quarterly. The report containsdata regarding home sales, housing affordability, residential building permits, andhousing inventories aggregated by county.
The data on existing home sales are estimates of the number of homes that arebeing resold (i.e. new homes are not included). The data are based on informationfrom multiple listing services, firms that monitor deeds, and local realtorsassociations. The Washington Center for Real Estate Research collects data onthe number of residential building permits from the U.S. Department of Commerce,C-40 Reports. A separate building permit is issued for each unit in a multifamilycomplex (ex. each apartment in an apartment building). Thus, permits for largemultifamily complexes can cause a huge swings in the number of residentialbuilding permits issued from year to year.

B-1
APPENDIX B: COUNTING AOD-RELATED DEATHS
Alcohol- or drug-related deaths are identified by matching the underlying cause of death fromdeath certificate records to a list of causes that are considered AOD-related. The deathsidentified as AOD-related then may be summed to provide county and state totals. Dividingthe total AOD-related deaths by all deaths in a county or state gives the percent of all deathsthat are alcohol and drug related.
Lists of underlying causes of death that are AOD-related have been developed in severalstudies (see first three in list below). AOD-related deaths used in this report are determinedusing a comprehensive assembly of disease, accident, and injury codes identified in thosestudies. The codes are based upon the International Classification of Diseases , NinthRevision (ICD-9).
The identified AOD-related causes of death may be either fully attributable or sometimesattributable to alcohol or drugs. Some underlying causes of death are explicit in their mentionof alcohol or drugs. Examples include alcoholic cirrhosis of the liver (ICD-9 code 571.2),alcohol and drug dependence syndromes (ICD-9 codes 303 and 304, respectively), and drugpoisonings (ICD-9 codes E850 through E859). All deaths of this sort are fully, or 100%,attributable to alcohol or drug abuse and are considered AOD-related deaths.
Other underlying causes of death are related only sometimes to alcohol or drugs. Forexample, epidemiological studies have shown that, among persons over 35 years of age, 60%of deaths due to chronic pancreatitis (ICD-9 code 577.1) and 75% of malignant neoplasms ofthe esophagus (ICD-9 code 150) are alcohol-related. For persons of all ages, 42% of motorvehicle traffic and nontraffic deaths (ICD-9 codes E810 through E825) are alcohol-related.The appropriate percentage of such indirectly attributable deaths are also counted towardtotals for AOD-related deaths.
Table B-1 on the following page characterizes the different diseases, injuries, and accidentsby: name, ICD-9 code, percent attributable to alcohol or drugs, age of inclusion, percent of allAOD-related deaths, and source of information. Information sources are listed according tothe numbers given below.
1. Schultz J, Rice D, & Parker D. 1990. Alcohol-related mortality and years of potentiallife lost - United States, 1987. Morbidity and Mortality Weekly Report , 39, 173-178.
2. Rice D, et al. 1990. The Economic Costs of Alcohol and Drug Abuse and MentalIllness: 1985. Report submitted to the Office of Financing and Coverage Policy of theAlcohol, Drug Abuse, and mental health Administration, U.S. Department of Health andHuman Services. San Francisco, CA: Institute for Health and Aging, University ofCalifornia.
3. Fox K, Merrill J, Chang H, & Califano J. 1995. Es timating the Costs of SubstanceAbuse to the Medicaid Hospital Care Program. American Journal of Public Health ,85(1), 48-54.
4. Seattle-King County HIV/AIDS Epidemiology Unit and Washington State Office ofHIV/AIDS Epidemiology and Evaluation. 1994. Washington State/Seattle-King CountyHIV/AIDS Epidemiology Report (2nd Quarter, 1994) , p. 4.
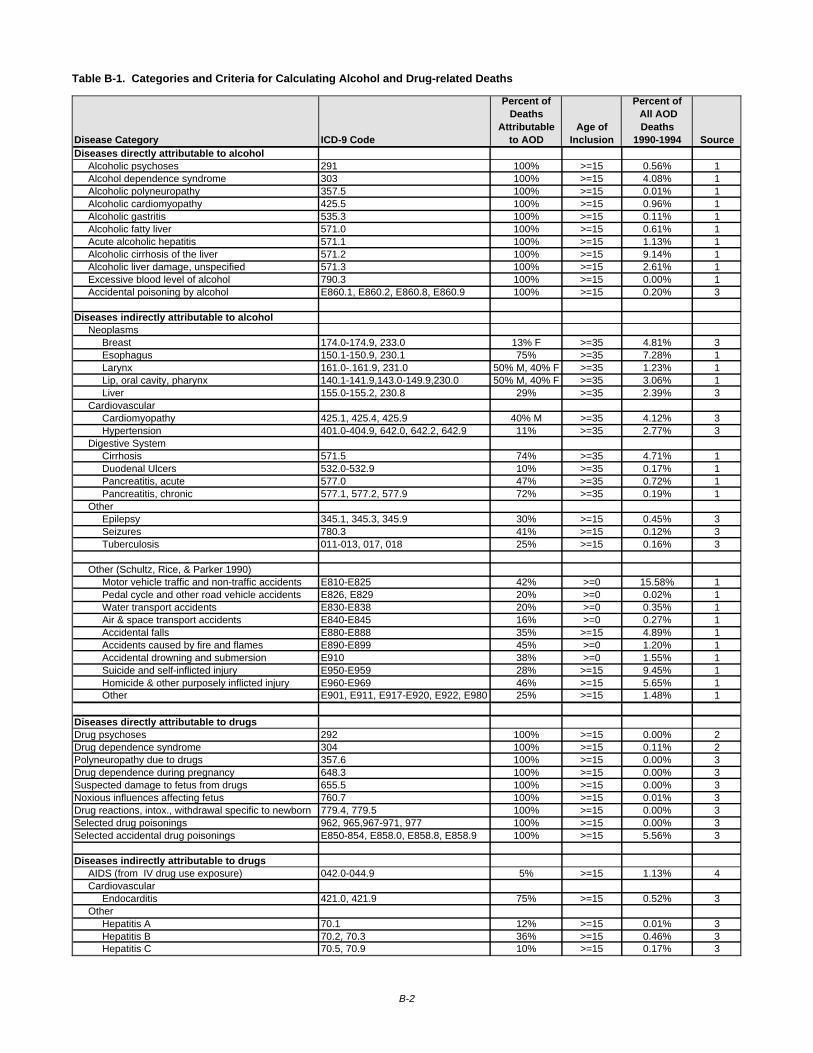
Table B-1. Categories and Criteria for Calculating Alcohol and Drug-related Deaths
Disease Category ICD-9 Code
Percent of Deaths
Attributable to AOD
Age ofInclusion
Percent of All AOD Deaths
1990-1994 SourceDiseases directly attributable to alcohol Alcoholic psychoses 291 100% >=15 0.56% 1 Alcohol dependence syndrome 303 100% >=15 4.08% 1 Alcoholic polyneuropathy 357.5 100% >=15 0.01% 1 Alcoholic cardiomyopathy 425.5 100% >=15 0.96% 1 Alcoholic gastritis 535.3 100% >=15 0.11% 1 Alcoholic fatty liver 571.0 100% >=15 0.61% 1 Acute alcoholic hepatitis 571.1 100% >=15 1.13% 1 Alcoholic cirrhosis of the liver 571.2 100% >=15 9.14% 1 Alcoholic liver damage, unspecified 571.3 100% >=15 2.61% 1 Excessive blood level of alcohol 790.3 100% >=15 0.00% 1 Accidental poisoning by alcohol E860.1, E860.2, E860.8, E860.9 100% >=15 0.20% 3
Diseases indirectly attributable to alcohol Neoplasms Breast 174.0-174.9, 233.0 13% F >=35 4.81% 3 Esophagus 150.1-150.9, 230.1 75% >=35 7.28% 1 Larynx 161.0-.161.9, 231.0 50% M, 40% F >=35 1.23% 1 Lip, oral cavity, pharynx 140.1-141.9,143.0-149.9,230.0 50% M, 40% F >=35 3.06% 1 Liver 155.0-155.2, 230.8 29% >=35 2.39% 3 Cardiovascular Cardiomyopathy 425.1, 425.4, 425.9 40% M >=35 4.12% 3 Hypertension 401.0-404.9, 642.0, 642.2, 642.9 11% >=35 2.77% 3 Digestive System Cirrhosis 571.5 74% >=35 4.71% 1 Duodenal Ulcers 532.0-532.9 10% >=35 0.17% 1 Pancreatitis, acute 577.0 47% >=35 0.72% 1 Pancreatitis, chronic 577.1, 577.2, 577.9 72% >=35 0.19% 1 Other Epilepsy 345.1, 345.3, 345.9 30% >=15 0.45% 3 Seizures 780.3 41% >=15 0.12% 3 Tuberculosis 011-013, 017, 018 25% >=15 0.16% 3
Other (Schultz, Rice, & Parker 1990) Motor vehicle traffic and non-traffic accidents E810-E825 42% >=0 15.58% 1 Pedal cycle and other road vehicle accidents E826, E829 20% >=0 0.02% 1 Water transport accidents E830-E838 20% >=0 0.35% 1 Air & space transport accidents E840-E845 16% >=0 0.27% 1 Accidental falls E880-E888 35% >=15 4.89% 1 Accidents caused by fire and flames E890-E899 45% >=0 1.20% 1 Accidental drowning and submersion E910 38% >=0 1.55% 1 Suicide and self-inflicted injury E950-E959 28% >=15 9.45% 1 Homicide & other purposely inflicted injury E960-E969 46% >=15 5.65% 1 Other E901, E911, E917-E920, E922, E980 25% >=15 1.48% 1
Diseases directly attributable to drugs Drug psychoses 292 100% >=15 0.00% 2Drug dependence syndrome 304 100% >=15 0.11% 2Polyneuropathy due to drugs 357.6 100% >=15 0.00% 3Drug dependence during pregnancy 648.3 100% >=15 0.00% 3Suspected damage to fetus from drugs 655.5 100% >=15 0.00% 3Noxious influences affecting fetus 760.7 100% >=15 0.01% 3Drug reactions, intox., withdrawal specific to newborn 779.4, 779.5 100% >=15 0.00% 3Selected drug poisonings 962, 965,967-971, 977 100% >=15 0.00% 3Selected accidental drug poisonings E850-854, E858.0, E858.8, E858.9 100% >=15 5.56% 3
Diseases indirectly attributable to drugs AIDS (from IV drug use exposure) 042.0-044.9 5% >=15 1.13% 4 Cardiovascular Endocarditis 421.0, 421.9 75% >=15 0.52% 3 Other Hepatitis A 70.1 12% >=15 0.01% 3 Hepatitis B 70.2, 70.3 36% >=15 0.46% 3 Hepatitis C 70.5, 70.9 10% >=15 0.17% 3
B-2

C-1
APPENDIX C: SELECTED STUDIES IDENTIFYING RISK FACTORSFOR SUBSTANCE ABUSE
The model of risk and protective factors for chemical dependency prevention presented in thisseries of reports is based on the work of J. David Hawkins, Richard Catalano and their team ofresearchers at the University of Washington. In the early 1980s, they reviewed and organizedthirty years of research on factors influencing adolescent drug abuse (Hawkins, Lishner andCatalano 1985) and delinquency (Hawkins, Lishner, Jenson and Catalano (1987). The teamhas conducted subsequent research on risk factors for violence, and has periodicallypublished new reviews in which they have incorporated new research and refined theirorganizing framework (Hawkins, Catalano and Miller 1992; Hawkins, Arthur and Catalano1995). The table below briefly presents some of their research.
RISK FACTOR STUDY FINDINGSIndividual and Peer DomainALIENATION AND
REBELLIOUSNESS
Jessor & Jessor,1977; Kandel, 1982;Jessor et al., 1980;Robins, 1980; Penning& Barnes, 1982
Alienation from dominant societal values and lowreligiousity were positively associated with druguse.
Smith & Fogg, 1978;Bachman, Johnson, &O’Malley, 1981;Kandel, 1982
Rebelliousness and resistance to traditionalauthority were positively associated with druguse.
Jessor, 1976; Jessor& Jessor, 1977; Paton& Kandel, 1978
High toleration of deviance, resistance toauthority, strong need for independence, and“normlessness” were associated with drug use.
Shedler & Block, 1990 Interpersonal alienation at age 7 predictedfrequent marijuana use at age 18.
FRIENDS WHO USE Kandel, 1978, 1986;Jessor et al., 1980;Barnes & Welte, 1986;Kandel & Andrews,1987; Brook et al.,1990
Peer use of substances was among the strongestfactors associated with substance use amongyouth.
Newcomb & Bentler,1986; Gillmore et al.,1990
Influence of peers on drug use was stronger thanthat of parents for non-Hispanic Whites, African-Americans, Asians, and Hispanics.
Harford, 1985 Non-drinking African-American youths reportedfewer drinking friends than did African-Americanyouth who drank.
Brook et al., 1990,1992
The most powerful linkage in the causal pathwayto marijuana non-use was association with non-drug-using peers.
ATTITUDES FAVORABLE
TO DRUG USE
Kandel et al., 1978;Smith & Fogg, 1978;Krosnick & Judd,1982; Johnston, 1991
Initiation into substance use was preceded byvalues favorable to its use.
EARLY ONSET OF
DRUG USE
Rachal et al., 1982;Kandel, 1982; Robins& Pryzbeck, 1985
Problem drinkers began drinking earlier thanusers; earlier onset of drug use was associatedwith greater and more persistent use of moredangerous drugs.
Kandel et al., 1976 Later onset of drug use predicted lower druginvolvement and higher probability ofdiscontinuation of use.
CONSTITUTIONAL
FACTORS
Cloniger et al., 1988;Zuckerman 1987
Sensation-seeing & low-harm avoidance predictearly-onset alcoholism.
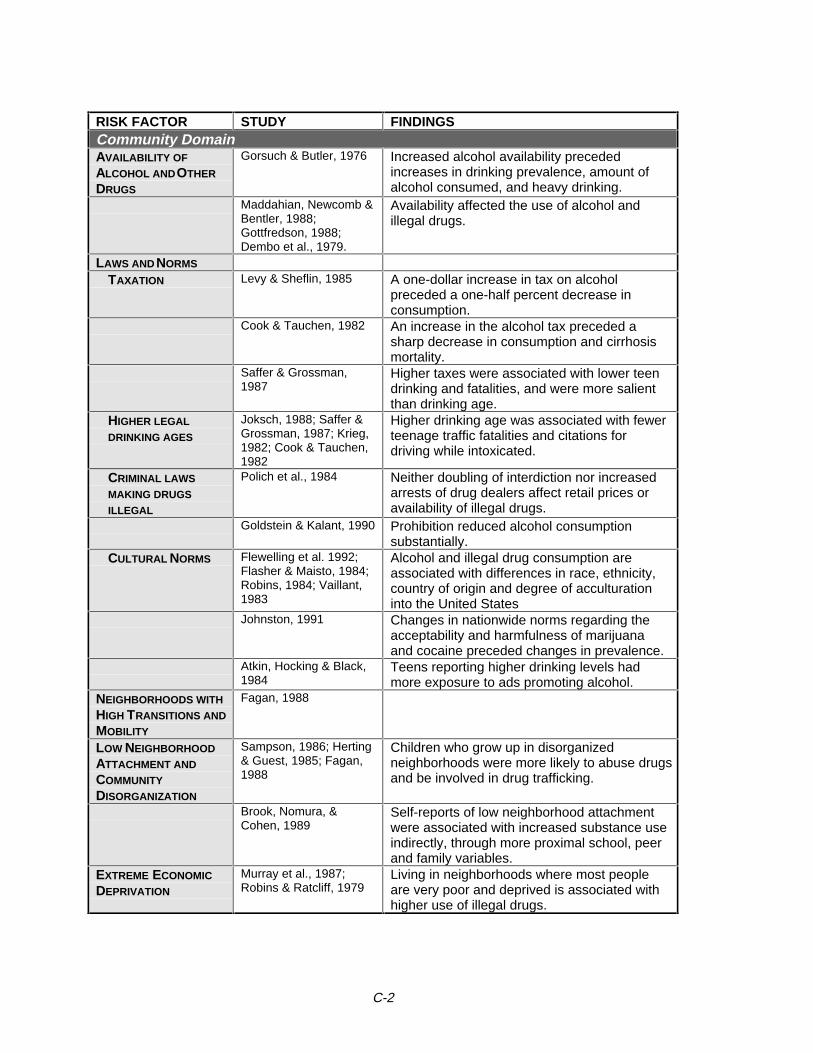
C-2
RISK FACTOR STUDY FINDINGSCommunity DomainAVAILABILITY OF
ALCOHOL AND OTHER
DRUGS
Gorsuch & Butler, 1976 Increased alcohol availability precededincreases in drinking prevalence, amount ofalcohol consumed, and heavy drinking.
Maddahian, Newcomb &Bentler, 1988;Gottfredson, 1988;Dembo et al., 1979.
Availability affected the use of alcohol andillegal drugs.
LAWS AND NORMS
TAXATION Levy & Sheflin, 1985 A one-dollar increase in tax on alcoholpreceded a one-half percent decrease inconsumption.
Cook & Tauchen, 1982 An increase in the alcohol tax preceded asharp decrease in consumption and cirrhosismortality.
Saffer & Grossman,1987
Higher taxes were associated with lower teendrinking and fatalities, and were more salientthan drinking age.
HIGHER LEGAL
DRINKING AGES
Joksch, 1988; Saffer &Grossman, 1987; Krieg,1982; Cook & Tauchen,1982
Higher drinking age was associated with fewerteenage traffic fatalities and citations fordriving while intoxicated.
CRIMINAL LAWS
MAKING DRUGS
ILLEGAL
Polich et al., 1984 Neither doubling of interdiction nor increasedarrests of drug dealers affect retail prices oravailability of illegal drugs.
Goldstein & Kalant, 1990 Prohibition reduced alcohol consumptionsubstantially.
CULTURAL NORMS Flewelling et al. 1992;Flasher & Maisto, 1984;Robins, 1984; Vaillant,1983
Alcohol and illegal drug consumption areassociated with differences in race, ethnicity,country of origin and degree of acculturationinto the United States
Johnston, 1991 Changes in nationwide norms regarding theacceptability and harmfulness of marijuanaand cocaine preceded changes in prevalence.
Atkin, Hocking & Black,1984
Teens reporting higher drinking levels hadmore exposure to ads promoting alcohol.
NEIGHBORHOODS WITH
HIGH TRANSITIONS AND
MOBILITY
Fagan, 1988
LOW NEIGHBORHOOD
ATTACHMENT AND
COMMUNITY
DISORGANIZATION
Sampson, 1986; Herting& Guest, 1985; Fagan,1988
Children who grow up in disorganizedneighborhoods were more likely to abuse drugsand be involved in drug trafficking.
Brook, Nomura, &Cohen, 1989
Self-reports of low neighborhood attachmentwere associated with increased substance useindirectly, through more proximal school, peerand family variables.
EXTREME ECONOMIC
DEPRIVATION
Murray et al., 1987;Robins & Ratcliff, 1979
Living in neighborhoods where most peopleare very poor and deprived is associated withhigher use of illegal drugs.
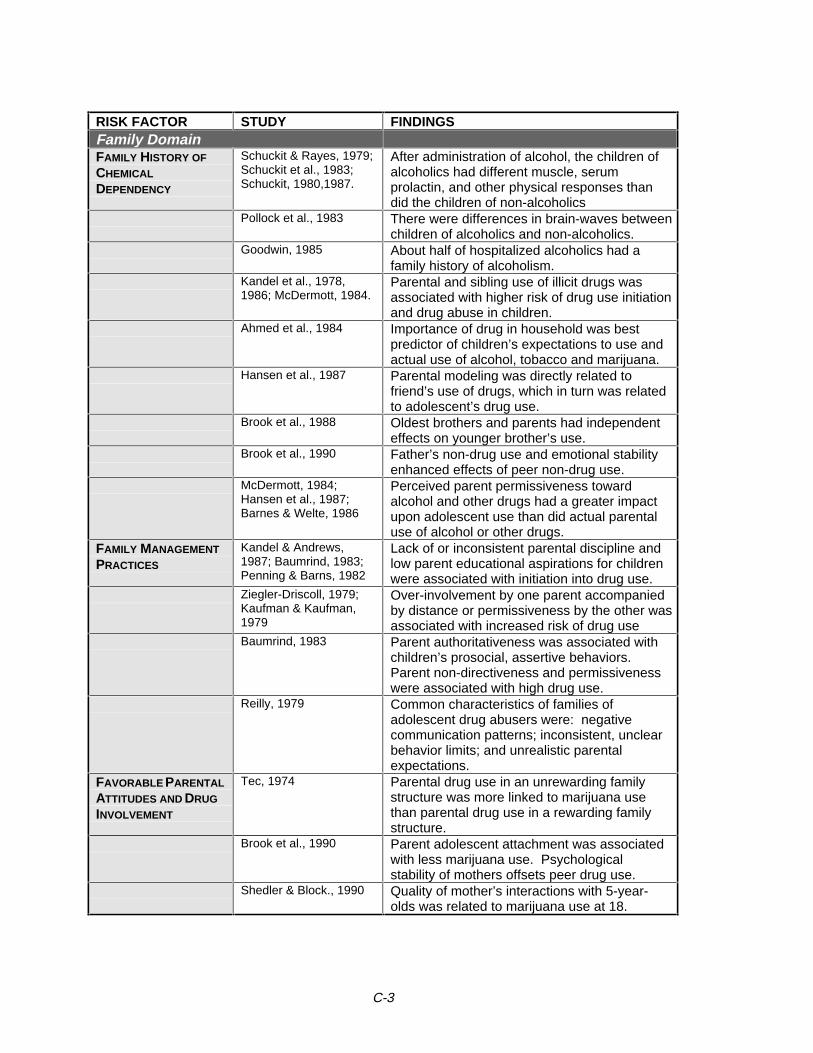
C-3
RISK FACTOR STUDY FINDINGSFamily DomainFAMILY HISTORY OF
CHEMICAL
DEPENDENCY
Schuckit & Rayes, 1979;Schuckit et al., 1983;Schuckit, 1980,1987.
After administration of alcohol, the children ofalcoholics had different muscle, serumprolactin, and other physical responses thandid the children of non-alcoholics
Pollock et al., 1983 There were differences in brain-waves betweenchildren of alcoholics and non-alcoholics.
Goodwin, 1985 About half of hospitalized alcoholics had afamily history of alcoholism.
Kandel et al., 1978,1986; McDermott, 1984.
Parental and sibling use of illicit drugs wasassociated with higher risk of drug use initiationand drug abuse in children.
Ahmed et al., 1984 Importance of drug in household was bestpredictor of children’s expectations to use andactual use of alcohol, tobacco and marijuana.
Hansen et al., 1987 Parental modeling was directly related tofriend’s use of drugs, which in turn was relatedto adolescent’s drug use.
Brook et al., 1988 Oldest brothers and parents had independenteffects on younger brother’s use.
Brook et al., 1990 Father’s non-drug use and emotional stabilityenhanced effects of peer non-drug use.
McDermott, 1984;Hansen et al., 1987;Barnes & Welte, 1986
Perceived parent permissiveness towardalcohol and other drugs had a greater impactupon adolescent use than did actual parentaluse of alcohol or other drugs.
FAMILY MANAGEMENT
PRACTICES
Kandel & Andrews,1987; Baumrind, 1983;Penning & Barns, 1982
Lack of or inconsistent parental discipline andlow parent educational aspirations for childrenwere associated with initiation into drug use.
Ziegler-Driscoll, 1979;Kaufman & Kaufman,1979
Over-involvement by one parent accompaniedby distance or permissiveness by the other wasassociated with increased risk of drug use
Baumrind, 1983 Parent authoritativeness was associated withchildren’s prosocial, assertive behaviors.Parent non-directiveness and permissivenesswere associated with high drug use.
Reilly, 1979 Common characteristics of families ofadolescent drug abusers were: negativecommunication patterns; inconsistent, unclearbehavior limits; and unrealistic parentalexpectations.
FAVORABLE PARENTAL
ATTITUDES AND DRUG
INVOLVEMENT
Tec, 1974 Parental drug use in an unrewarding familystructure was more linked to marijuana usethan parental drug use in a rewarding familystructure.
Brook et al., 1990 Parent adolescent attachment was associatedwith less marijuana use. Psychologicalstability of mothers offsets peer drug use.
Shedler & Block., 1990 Quality of mother’s interactions with 5-year-olds was related to marijuana use at 18.
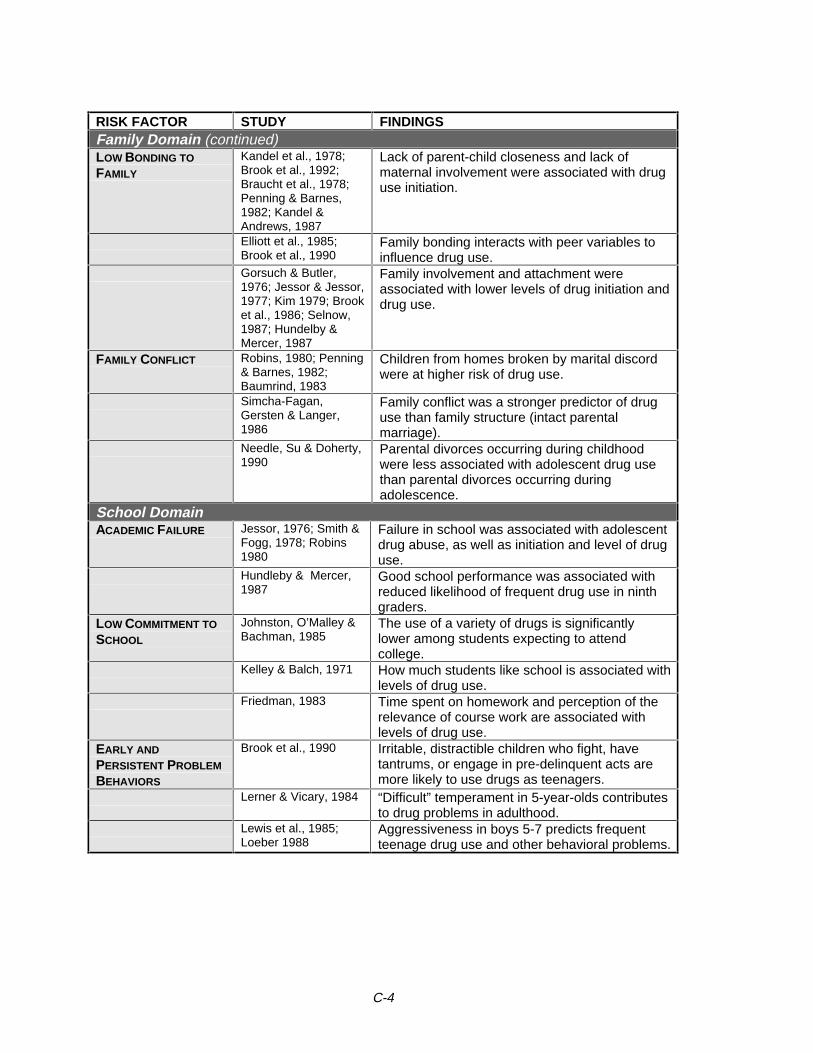
C-4
RISK FACTOR STUDY FINDINGSFamily Domain (continued)LOW BONDING TO
FAMILY
Kandel et al., 1978;Brook et al., 1992;Braucht et al., 1978;Penning & Barnes,1982; Kandel &Andrews, 1987
Lack of parent-child closeness and lack ofmaternal involvement were associated with druguse initiation.
Elliott et al., 1985;Brook et al., 1990
Family bonding interacts with peer variables toinfluence drug use.
Gorsuch & Butler,1976; Jessor & Jessor,1977; Kim 1979; Brooket al., 1986; Selnow,1987; Hundelby &Mercer, 1987
Family involvement and attachment wereassociated with lower levels of drug initiation anddrug use.
FAMILY CONFLICT Robins, 1980; Penning& Barnes, 1982;Baumrind, 1983
Children from homes broken by marital discordwere at higher risk of drug use.
Simcha-Fagan,Gersten & Langer,1986
Family conflict was a stronger predictor of druguse than family structure (intact parentalmarriage).
Needle, Su & Doherty,1990
Parental divorces occurring during childhoodwere less associated with adolescent drug usethan parental divorces occurring duringadolescence.
School DomainACADEMIC FAILURE Jessor, 1976; Smith &
Fogg, 1978; Robins1980
Failure in school was associated with adolescentdrug abuse, as well as initiation and level of druguse.
Hundleby & Mercer,1987
Good school performance was associated withreduced likelihood of frequent drug use in ninthgraders.
LOW COMMITMENT TO
SCHOOL
Johnston, O’Malley &Bachman, 1985
The use of a variety of drugs is significantlylower among students expecting to attendcollege.
Kelley & Balch, 1971 How much students like school is associated withlevels of drug use.
Friedman, 1983 Time spent on homework and perception of therelevance of course work are associated withlevels of drug use.
EARLY AND
PERSISTENT PROBLEM
BEHAVIORS
Brook et al., 1990 Irritable, distractible children who fight, havetantrums, or engage in pre-delinquent acts aremore likely to use drugs as teenagers.
Lerner & Vicary, 1984 “Difficult” temperament in 5-year-olds contributesto drug problems in adulthood.
Lewis et al., 1985;Loeber 1988
Aggressiveness in boys 5-7 predicts frequentteenage drug use and other behavioral problems.
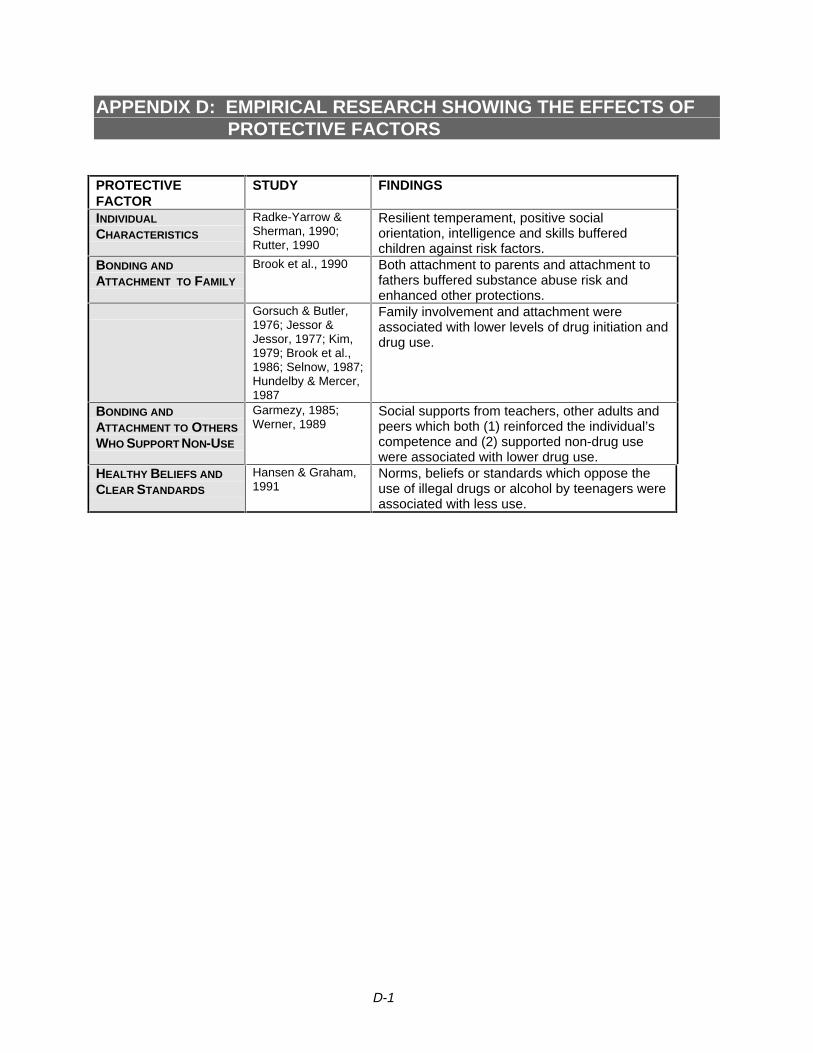
D-1
APPENDIX D: EMPIRICAL RESEARCH SHOWING THE EFFECTS OFPROTECTIVE FACTORS
PROTECTIVEFACTOR
STUDY FINDINGS
INDIVIDUAL
CHARACTERISTICS
Radke-Yarrow &Sherman, 1990;Rutter, 1990
Resilient temperament, positive socialorientation, intelligence and skills bufferedchildren against risk factors.
BONDING AND
ATTACHMENT TO FAMILY
Brook et al., 1990 Both attachment to parents and attachment tofathers buffered substance abuse risk andenhanced other protections.
Gorsuch & Butler,1976; Jessor &Jessor, 1977; Kim,1979; Brook et al.,1986; Selnow, 1987;Hundelby & Mercer,1987
Family involvement and attachment wereassociated with lower levels of drug initiation anddrug use.
BONDING AND
ATTACHMENT TO OTHERS
WHO SUPPORT NON-USE
Garmezy, 1985;Werner, 1989
Social supports from teachers, other adults andpeers which both (1) reinforced the individual’scompetence and (2) supported non-drug usewere associated with lower drug use.
HEALTHY BELIEFS AND
CLEAR STANDARDS
Hansen & Graham,1991
Norms, beliefs or standards which oppose theuse of illegal drugs or alcohol by teenagers wereassociated with less use.
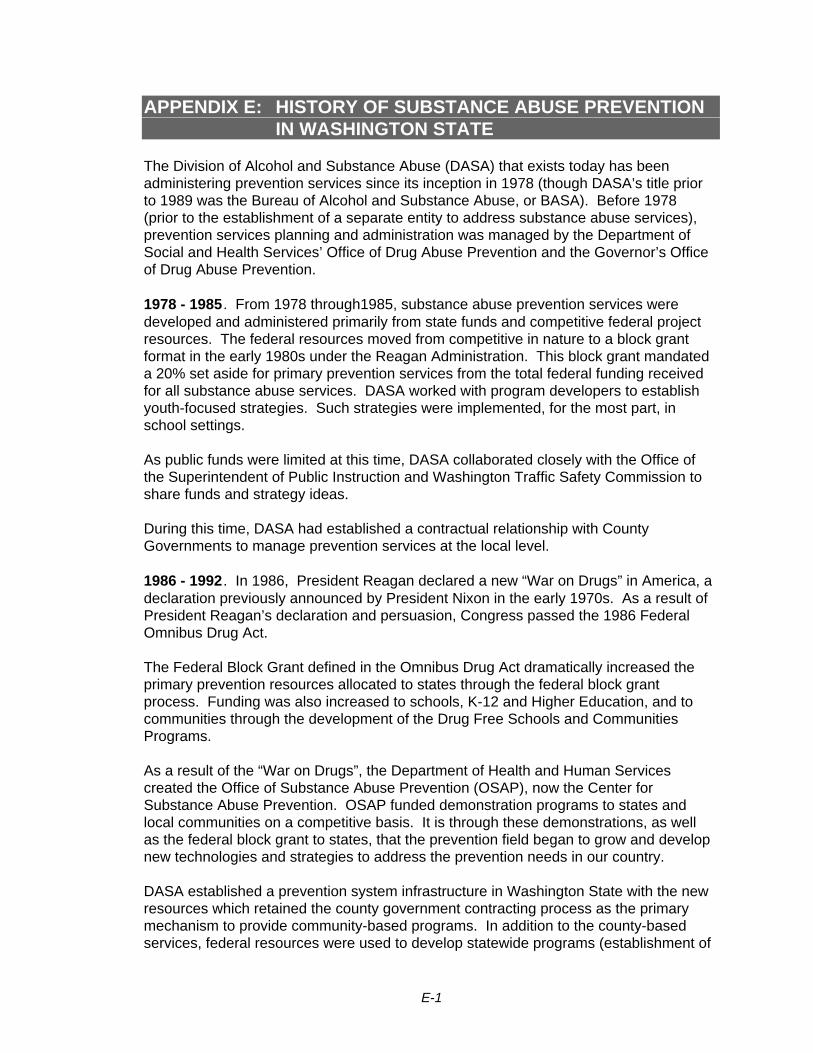
E-1
APPENDIX E: HISTORY OF SUBSTANCE ABUSE PREVENTIONIN WASHINGTON STATE
The Division of Alcohol and Substance Abuse (DASA) that exists today has beenadministering prevention services since its inception in 1978 (though DASA’s title priorto 1989 was the Bureau of Alcohol and Substance Abuse, or BASA). Before 1978(prior to the establishment of a separate entity to address substance abuse services),prevention services planning and administration was managed by the Department ofSocial and Health Services’ Office of Drug Abuse Prevention and the Governor’s Officeof Drug Abuse Prevention.
1978 - 1985. From 1978 through1985, substance abuse prevention services weredeveloped and administered primarily from state funds and competitive federal projectresources. The federal resources moved from competitive in nature to a block grantformat in the early 1980s under the Reagan Administration. This block grant mandateda 20% set aside for primary prevention services from the total federal funding receivedfor all substance abuse services. DASA worked with program developers to establishyouth-focused strategies. Such strategies were implemented, for the most part, inschool settings.
As public funds were limited at this time, DASA collaborated closely with the Office ofthe Superintendent of Public Instruction and Washington Traffic Safety Commission toshare funds and strategy ideas.
During this time, DASA had established a contractual relationship with CountyGovernments to manage prevention services at the local level.
1986 - 1992. In 1986, President Reagan declared a new “War on Drugs” in America, adeclaration previously announced by President Nixon in the early 1970s. As a result ofPresident Reagan’s declaration and persuasion, Congress passed the 1986 FederalOmnibus Drug Act.
The Federal Block Grant defined in the Omnibus Drug Act dramatically increased theprimary prevention resources allocated to states through the federal block grantprocess. Funding was also increased to schools, K-12 and Higher Education, and tocommunities through the development of the Drug Free Schools and CommunitiesPrograms.
As a result of the “War on Drugs”, the Department of Health and Human Servicescreated the Office of Substance Abuse Prevention (OSAP), now the Center forSubstance Abuse Prevention. OSAP funded demonstration programs to states andlocal communities on a competitive basis. It is through these demonstrations, as wellas the federal block grant to states, that the prevention field began to grow and developnew technologies and strategies to address the prevention needs in our country.
DASA established a prevention system infrastructure in Washington State with the newresources which retained the county government contracting process as the primarymechanism to provide community-based programs. In addition to the county-basedservices, federal resources were used to develop statewide programs (establishment of

E-2
a clearinghouse, conferences, training, and newsletters) which supported the countyprograms.
In order to support the infrastructure created, DASA encouraged county governmentsto hire county prevention specialists to manage the resources. DASA then was in aposition to provide technical assistance and training to the local prevention specialists,and encourage them to mobilize their communities to prevent substance abuseproblems. Most of the efforts at this time were focused on community organization andyouth education.
In the late 1980s, a review and synthesis of research examining risk and protectivefactors for adolescent substance abuse and other problem behaviors was compiled byProfessors J. David Hawkins and Richard Catalano at the University of Washington.Based upon the success and promise of this research, DASA began to adopt a risk andprotective factor framework for primary prevention planning in the early 1990’s.Complementing the new direction, a federal demonstration grant was secured fromCSAP to pilot a planning process throughout the state.
1993 - Present. In 1993, DASA changed their contracting practices with counties anddirect service providers. The change moved contractors from prioritizing programs andstrategies to prioritizing risk factors associated with adolescent substance abuse. Oncethe risk factors were prioritized, the proposed prevention strategies were required toaddress high-priority risk factors and to also include the enhancement of protectivefactors. Counties were also asked to evaluate their strategies to address the questionof “What Works?”
During the 1995-97 biennium, DASA began to prepare the county preventionspecialists for the development of a county prevention action plan, grounded in the riskand protective factor framework and conducive to conducting viable outcome andprocess evaluation.

ConstructIndicator Source
Lowest Geographic Level
Start Year
End Year
Availability of DrugsAlcohol retail licenses WSLCB - Annual Operations Report Alcohol Outlet Data County 1988 1994
Tobacco retailer licensesDOL - (Master License Service) Tobacco Statistics (from DOH(DCFH/TPP)) County 1993 1995
Tobacco vending machine licensesDOL - (Master License Service) Tobacco Statistics (from DOH(DCFH/TPP)) County 1993 1995
Community Laws & Norms Favorable to Crime & DrugsAverage sentence (prison and service) for adult felony drug offenders SGC - (Adult Felony Database) Length of prison sentence data County 1988 1995
Low Neighborhood Attachment & Community Disorganization
People registered to voteOSS(Election Division) - (Certified Election Results) Registered Voters Tables County 1988 1993
Number of vacant owned housing units U.S. Census 1990 - STF1A County 1990 1990Number of vacant rental housing units U.S. Census 1990 - STF1A County 1990 1990
Transitions and MobilityExisting home sales WCRER(WSU) - Housing Market Reports County 1989 1994Residential building permits WCRER(WSU) - Housing Market Reports County 1988 1993Households in rental housing units U.S. Census 1990 - STF1A County 1990 1990Housholds in owned housing units U.S. Census 1990 - STF1A County 1990 1990Persons who moved within the same county during the last five years U.S. Census 1990 - STF3A Block Group 1990 1990Persons who moved from outside the county during the last five years U.S. Census 1990 - STF3A Block Group 1990 1990
Extreme Economic and Social DeprivationAid to Families with Dependent Children (AFDC) DSHS(ORDA) - Warrant Role Data Files Zip Code 1988 1994Food stamps recipients DSHS(ORDA) - Warrant Role Data Files Zip Code 1988 1994Accepted applicatins for free and reduced lunch OSPI(Child Nutrition) - Free and Reduced Price Eligibility School District 1989 1995Unemployment ESD(LMEA/LAUS Unit) - County Unemployment File County 1988 1993Civilians in the labor force ESD(LMEA/LAUS Unit) - County Unemployment File County 1988 1993
Exhausted unemployment ESD(LMEA) - (BAS) County level exhausted employment benefits County 1992 1995All persons living below the poverty level U.S. Census 1990 - STF3A Block Group 1990 1990All children living below the poverty level U.S. Census 1990 - STF3A Block Group 1990 1990All families living below the poverty level U.S. Census 1990 - STF3A Block Group 1990 1990Families U.S. Census 1990 - STF3A Block Group 1990 1990
APPENDIX F - COMMUNITY OUTCOME AND RISK EVALUATION INDICATORS (CORE-GIS)
NOTE: Acronyms are defined on the last page of this appendix.
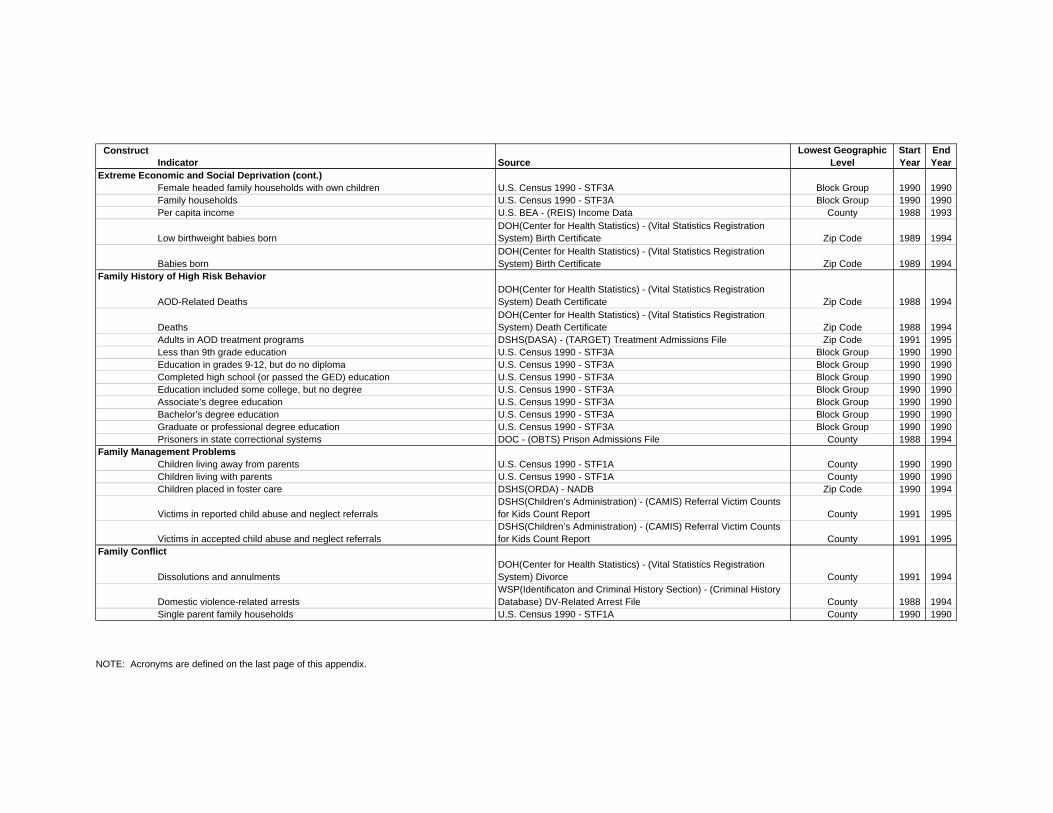
ConstructIndicator Source
Lowest Geographic Level
Start Year
End Year
Extreme Economic and Social Deprivation (cont.)Female headed family households with own children U.S. Census 1990 - STF3A Block Group 1990 1990Family households U.S. Census 1990 - STF3A Block Group 1990 1990Per capita income U.S. BEA - (REIS) Income Data County 1988 1993
Low birthweight babies bornDOH(Center for Health Statistics) - (Vital Statistics Registration System) Birth Certificate Zip Code 1989 1994
Babies bornDOH(Center for Health Statistics) - (Vital Statistics Registration System) Birth Certificate Zip Code 1989 1994
Family History of High Risk Behavior
AOD-Related DeathsDOH(Center for Health Statistics) - (Vital Statistics Registration System) Death Certificate Zip Code 1988 1994
DeathsDOH(Center for Health Statistics) - (Vital Statistics Registration System) Death Certificate Zip Code 1988 1994
Adults in AOD treatment programs DSHS(DASA) - (TARGET) Treatment Admissions File Zip Code 1991 1995Less than 9th grade education U.S. Census 1990 - STF3A Block Group 1990 1990Education in grades 9-12, but do no diploma U.S. Census 1990 - STF3A Block Group 1990 1990Completed high school (or passed the GED) education U.S. Census 1990 - STF3A Block Group 1990 1990Education included some college, but no degree U.S. Census 1990 - STF3A Block Group 1990 1990Associate’s degree education U.S. Census 1990 - STF3A Block Group 1990 1990Bachelor’s degree education U.S. Census 1990 - STF3A Block Group 1990 1990Graduate or professional degree education U.S. Census 1990 - STF3A Block Group 1990 1990Prisoners in state correctional systems DOC - (OBTS) Prison Admissions File County 1988 1994
Family Management ProblemsChildren living away from parents U.S. Census 1990 - STF1A County 1990 1990Children living with parents U.S. Census 1990 - STF1A County 1990 1990Children placed in foster care DSHS(ORDA) - NADB Zip Code 1990 1994
Victims in reported child abuse and neglect referralsDSHS(Children’s Administration) - (CAMIS) Referral Victim Counts for Kids Count Report County 1991 1995
Victims in accepted child abuse and neglect referralsDSHS(Children’s Administration) - (CAMIS) Referral Victim Counts for Kids Count Report County 1991 1995
Family Conflict
Dissolutions and annulmentsDOH(Center for Health Statistics) - (Vital Statistics Registration System) Divorce County 1991 1994
Domestic violence-related arrestsWSP(Identificaton and Criminal History Section) - (Criminal History Database) DV-Related Arrest File County 1988 1994
Single parent family households U.S. Census 1990 - STF1A County 1990 1990
NOTE: Acronyms are defined on the last page of this appendix.
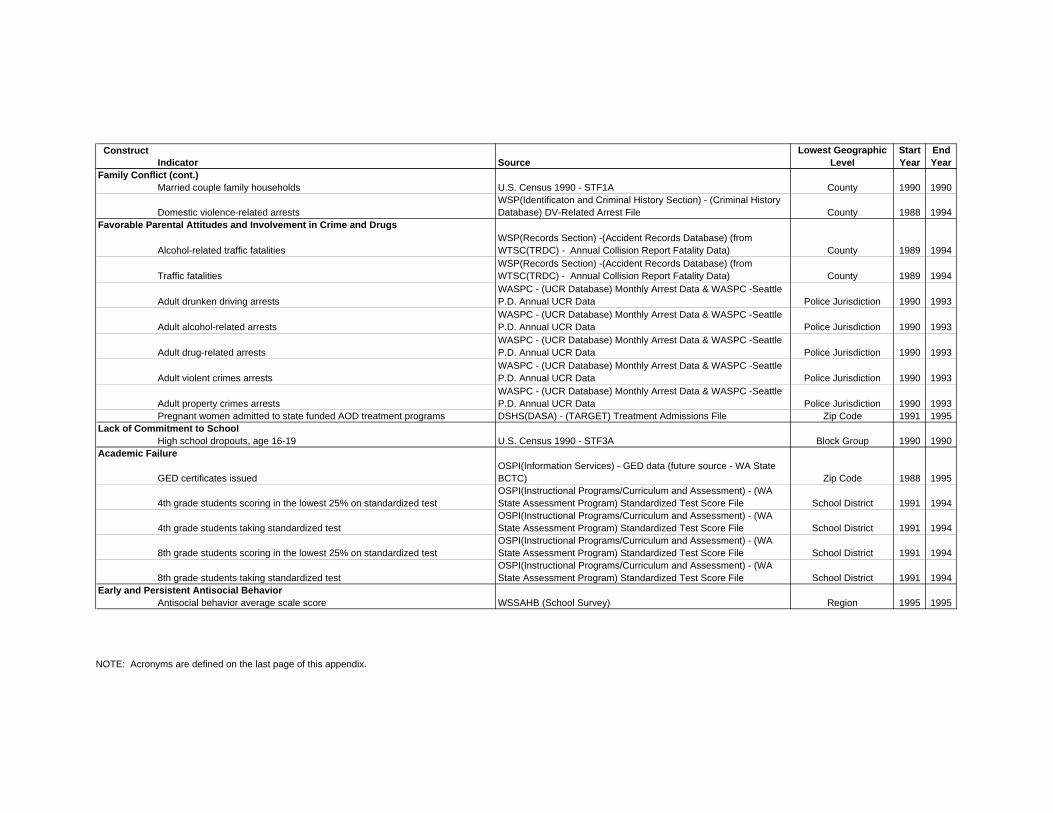
ConstructIndicator Source
Lowest Geographic Level
Start Year
End Year
Family Conflict (cont.)Married couple family households U.S. Census 1990 - STF1A County 1990 1990
Domestic violence-related arrestsWSP(Identificaton and Criminal History Section) - (Criminal History Database) DV-Related Arrest File County 1988 1994
Favorable Parental Attitudes and Involvement in Crime and Drugs
Alcohol-related traffic fatalitiesWSP(Records Section) -(Accident Records Database) (from WTSC(TRDC) - Annual Collision Report Fatality Data) County 1989 1994
Traffic fatalitiesWSP(Records Section) -(Accident Records Database) (from WTSC(TRDC) - Annual Collision Report Fatality Data) County 1989 1994
Adult drunken driving arrestsWASPC - (UCR Database) Monthly Arrest Data & WASPC -Seattle P.D. Annual UCR Data Police Jurisdiction 1990 1993
Adult alcohol-related arrestsWASPC - (UCR Database) Monthly Arrest Data & WASPC -Seattle P.D. Annual UCR Data Police Jurisdiction 1990 1993
Adult drug-related arrestsWASPC - (UCR Database) Monthly Arrest Data & WASPC -Seattle P.D. Annual UCR Data Police Jurisdiction 1990 1993
Adult violent crimes arrestsWASPC - (UCR Database) Monthly Arrest Data & WASPC -Seattle P.D. Annual UCR Data Police Jurisdiction 1990 1993
Adult property crimes arrestsWASPC - (UCR Database) Monthly Arrest Data & WASPC -Seattle P.D. Annual UCR Data Police Jurisdiction 1990 1993
Pregnant women admitted to state funded AOD treatment programs DSHS(DASA) - (TARGET) Treatment Admissions File Zip Code 1991 1995Lack of Commitment to School
High school dropouts, age 16-19 U.S. Census 1990 - STF3A Block Group 1990 1990Academic Failure
GED certificates issuedOSPI(Information Services) - GED data (future source - WA State BCTC) Zip Code 1988 1995
4th grade students scoring in the lowest 25% on standardized testOSPI(Instructional Programs/Curriculum and Assessment) - (WA State Assessment Program) Standardized Test Score File School District 1991 1994
4th grade students taking standardized testOSPI(Instructional Programs/Curriculum and Assessment) - (WA State Assessment Program) Standardized Test Score File School District 1991 1994
8th grade students scoring in the lowest 25% on standardized testOSPI(Instructional Programs/Curriculum and Assessment) - (WA State Assessment Program) Standardized Test Score File School District 1991 1994
8th grade students taking standardized testOSPI(Instructional Programs/Curriculum and Assessment) - (WA State Assessment Program) Standardized Test Score File School District 1991 1994
Early and Persistent Antisocial BehaviorAntisocial behavior average scale score WSSAHB (School Survey) Region 1995 1995
NOTE: Acronyms are defined on the last page of this appendix.

ConstructIndicator Source
Lowest Geographic Level
Start Year
End Year
Alienation, Rebelliousness, and Lack of Social Bonding
Adolescent suicidesDOH(Center for Health Statistics) - (Vital Statistics Registration System) Death Certificate Zip Code 1988 1994
Adolescent attempted suicides DOH(OHPDS) - CHARS Zip Code 1988 1992Early Initiation of the Problem Behavior
Juvenile arrests for alcohol violations WASPC - (UCR Database) Monthly Arrest Data & WASPC -Seattle P.D. Annual UCR Data Police Jurisdiction 1990 1993
Juvenile arrests for drug law violations WASPC - (UCR Database) Monthly Arrest Data & WASPC -Seattle P.D. Annual UCR Data Police Jurisdiction 1990 1993
Juvenile arrests for violent crimes WASPC - (UCR Database) Monthly Arrest Data & WASPC -Seattle P.D. Annual UCR Data Police Jurisdiction 1990 1993
Juvenile arrests for property crimes WASPC - (UCR Database) Monthly Arrest Data & WASPC -Seattle P.D. Annual UCR Data Police Jurisdiction 1990 1993
Juvenile arrests for vandalism WASPC - (UCR Database) Monthly Arrest Data & WASPC -Seattle P.D. Annual UCR Data Police Jurisdiction 1990 1993
Friends Who Engage in the Problem BehaviorSubstance use by peers average scale score WSSAHB (School Survey) Region 1995 1995
Favorable Attitudes Toward the Problem BehaviorPersonal attitude favorable towards substance use average scale score WSSAHB (School Survey) Region 1995 1995
Constitutional FactorsSensation seeking average scale score WSSAHB (School Survey) Region 1995 1995
Protective FactorsCommunity rewards for conventional involvement average scale score WSSAHB (School Survey) Region 1995 1995Family rewards for conventional involvement average scale score WSSAHB (School Survey) Region 1995 1995School rewards for conventional involvement average scale score WSSAHB (School Survey) Region 1995 1995Opportunitites for positive involvement in the family average scale score WSSAHB (School Survey) Region 1995 1995Opportunities for positive involvement in the school average scale score WSSAHB (School Survey) Region 1995 1995Belief in the moral order average scale score WSSAHB (School Survey) Region 1995 1995Social skills average scale score WSSAHB (School Survey) Region 1995 1995
Additional Indicators of Substance Abuse and Other Problem Behavior
Juvenile arrests for driving under the influence WASPC - (UCR Database) Monthly Arrest Data & WASPC -Seattle P.D. Annual UCR Data Police Jurisdiction 1990 1993
Juvenile arrests for liquor law violations WASPC - (UCR Database) Monthly Arrest Data & WASPC -Seattle P.D. Annual UCR Data Police Jurisdiction 1990 1993
Juvenile arrests for alcohol violations drunkenness WASPC - (UCR Database) Monthly Arrest Data & WASPC -Seattle P.D. Annual UCR Data Police Jurisdiction 1990 1993
NOTE: Acronyms are defined on the last page of this appendix.
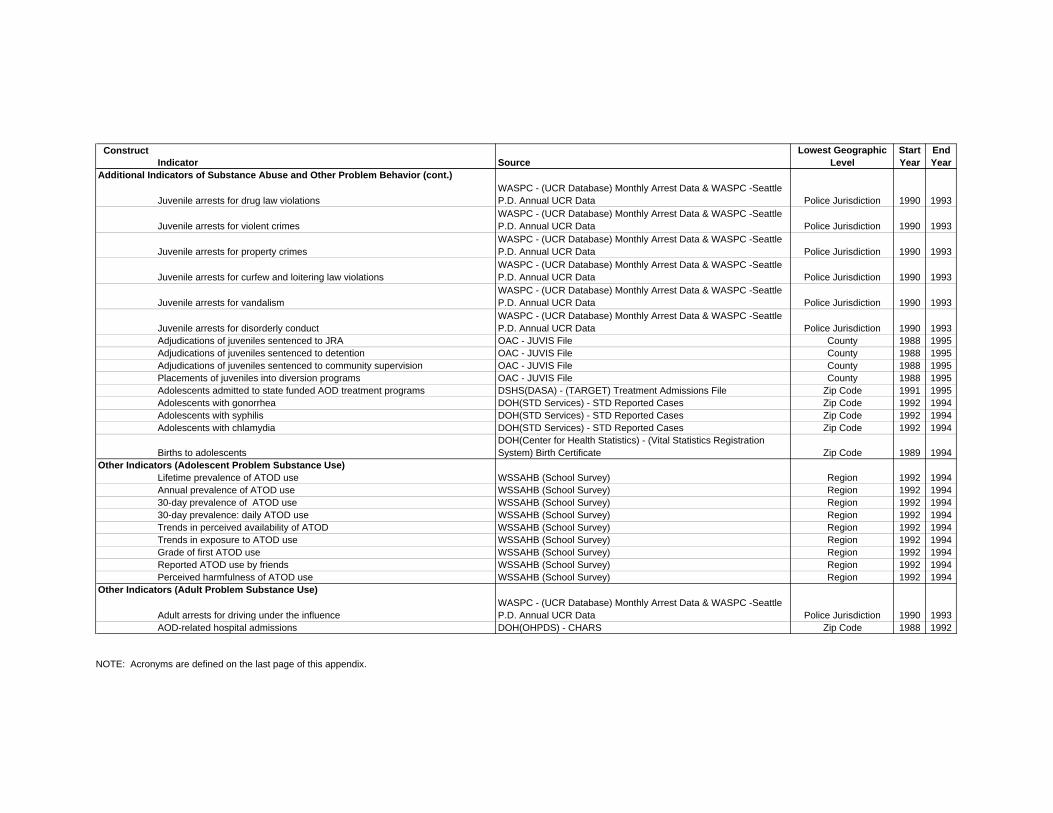
ConstructIndicator Source
Lowest Geographic Level
Start Year
End Year
Additional Indicators of Substance Abuse and Other Problem Behavior (cont.)
Juvenile arrests for drug law violationsWASPC - (UCR Database) Monthly Arrest Data & WASPC -Seattle P.D. Annual UCR Data Police Jurisdiction 1990 1993
Juvenile arrests for violent crimesWASPC - (UCR Database) Monthly Arrest Data & WASPC -Seattle P.D. Annual UCR Data Police Jurisdiction 1990 1993
Juvenile arrests for property crimesWASPC - (UCR Database) Monthly Arrest Data & WASPC -Seattle P.D. Annual UCR Data Police Jurisdiction 1990 1993
Juvenile arrests for curfew and loitering law violations WASPC - (UCR Database) Monthly Arrest Data & WASPC -Seattle P.D. Annual UCR Data Police Jurisdiction 1990 1993
Juvenile arrests for vandalism WASPC - (UCR Database) Monthly Arrest Data & WASPC -Seattle P.D. Annual UCR Data Police Jurisdiction 1990 1993
Juvenile arrests for disorderly conduct WASPC - (UCR Database) Monthly Arrest Data & WASPC -Seattle P.D. Annual UCR Data Police Jurisdiction 1990 1993
Adjudications of juveniles sentenced to JRA OAC - JUVIS File County 1988 1995Adjudications of juveniles sentenced to detention OAC - JUVIS File County 1988 1995Adjudications of juveniles sentenced to community supervision OAC - JUVIS File County 1988 1995Placements of juveniles into diversion programs OAC - JUVIS File County 1988 1995Adolescents admitted to state funded AOD treatment programs DSHS(DASA) - (TARGET) Treatment Admissions File Zip Code 1991 1995Adolescents with gonorrhea DOH(STD Services) - STD Reported Cases Zip Code 1992 1994Adolescents with syphilis DOH(STD Services) - STD Reported Cases Zip Code 1992 1994Adolescents with chlamydia DOH(STD Services) - STD Reported Cases Zip Code 1992 1994
Births to adolescentsDOH(Center for Health Statistics) - (Vital Statistics Registration System) Birth Certificate Zip Code 1989 1994
Other Indicators (Adolescent Problem Substance Use)Lifetime prevalence of ATOD use WSSAHB (School Survey) Region 1992 1994Annual prevalence of ATOD use WSSAHB (School Survey) Region 1992 199430-day prevalence of ATOD use WSSAHB (School Survey) Region 1992 199430-day prevalence: daily ATOD use WSSAHB (School Survey) Region 1992 1994Trends in perceived availability of ATOD WSSAHB (School Survey) Region 1992 1994Trends in exposure to ATOD use WSSAHB (School Survey) Region 1992 1994Grade of first ATOD use WSSAHB (School Survey) Region 1992 1994Reported ATOD use by friends WSSAHB (School Survey) Region 1992 1994Perceived harmfulness of ATOD use WSSAHB (School Survey) Region 1992 1994
Other Indicators (Adult Problem Substance Use)
Adult arrests for driving under the influenceWASPC - (UCR Database) Monthly Arrest Data & WASPC -Seattle P.D. Annual UCR Data Police Jurisdiction 1990 1993
AOD-related hospital admissions DOH(OHPDS) - CHARS Zip Code 1988 1992
NOTE: Acronyms are defined on the last page of this appendix.
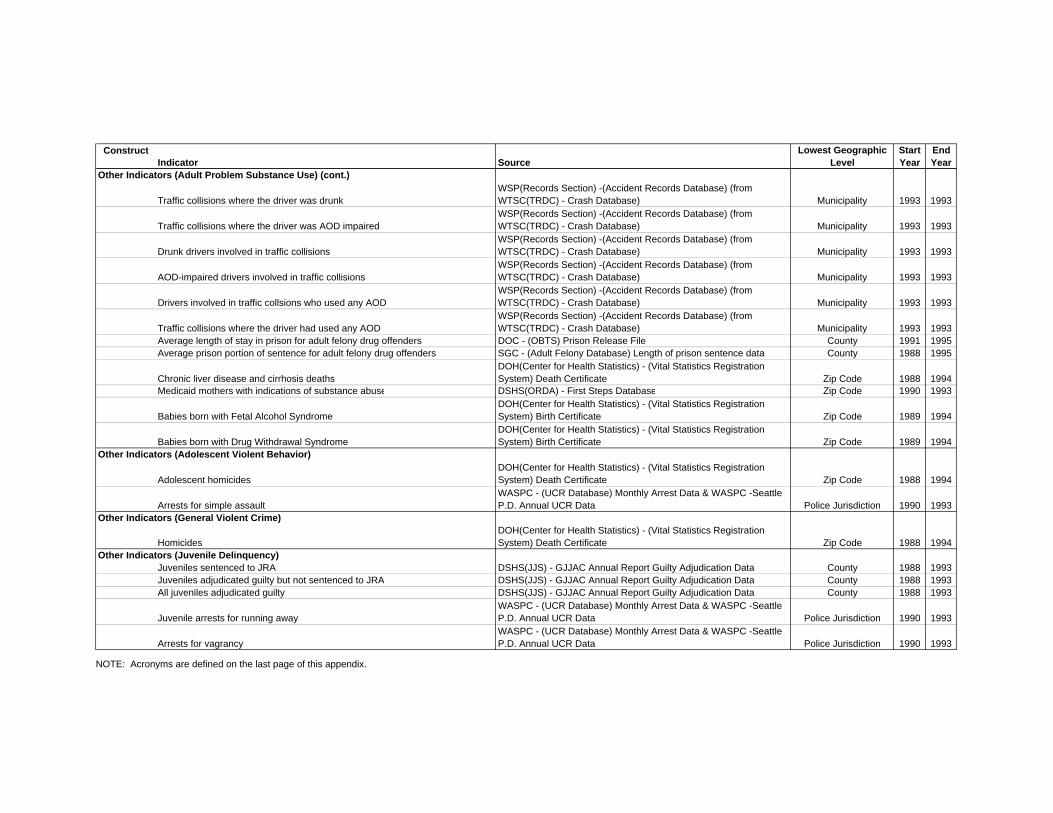
ConstructIndicator Source
Lowest Geographic Level
Start Year
End Year
Other Indicators (Adult Problem Substance Use) (cont.)
Traffic collisions where the driver was drunkWSP(Records Section) -(Accident Records Database) (from WTSC(TRDC) - Crash Database) Municipality 1993 1993
Traffic collisions where the driver was AOD impairedWSP(Records Section) -(Accident Records Database) (from WTSC(TRDC) - Crash Database) Municipality 1993 1993
Drunk drivers involved in traffic collisionsWSP(Records Section) -(Accident Records Database) (from WTSC(TRDC) - Crash Database) Municipality 1993 1993
AOD-impaired drivers involved in traffic collisionsWSP(Records Section) -(Accident Records Database) (from WTSC(TRDC) - Crash Database) Municipality 1993 1993
Drivers involved in traffic collsions who used any AODWSP(Records Section) -(Accident Records Database) (from WTSC(TRDC) - Crash Database) Municipality 1993 1993
Traffic collisions where the driver had used any AODWSP(Records Section) -(Accident Records Database) (from WTSC(TRDC) - Crash Database) Municipality 1993 1993
Average length of stay in prison for adult felony drug offenders DOC - (OBTS) Prison Release File County 1991 1995Average prison portion of sentence for adult felony drug offenders SGC - (Adult Felony Database) Length of prison sentence data County 1988 1995
Chronic liver disease and cirrhosis deathsDOH(Center for Health Statistics) - (Vital Statistics Registration System) Death Certificate Zip Code 1988 1994
Medicaid mothers with indications of substance abuse DSHS(ORDA) - First Steps Database Zip Code 1990 1993
Babies born with Fetal Alcohol SyndromeDOH(Center for Health Statistics) - (Vital Statistics Registration System) Birth Certificate Zip Code 1989 1994
Babies born with Drug Withdrawal SyndromeDOH(Center for Health Statistics) - (Vital Statistics Registration System) Birth Certificate Zip Code 1989 1994
Other Indicators (Adolescent Violent Behavior)
Adolescent homicidesDOH(Center for Health Statistics) - (Vital Statistics Registration System) Death Certificate Zip Code 1988 1994
Arrests for simple assaultWASPC - (UCR Database) Monthly Arrest Data & WASPC -Seattle P.D. Annual UCR Data Police Jurisdiction 1990 1993
Other Indicators (General Violent Crime)
HomicidesDOH(Center for Health Statistics) - (Vital Statistics Registration System) Death Certificate Zip Code 1988 1994
Other Indicators (Juvenile Delinquency)Juveniles sentenced to JRA DSHS(JJS) - GJJAC Annual Report Guilty Adjudication Data County 1988 1993Juveniles adjudicated guilty but not sentenced to JRA DSHS(JJS) - GJJAC Annual Report Guilty Adjudication Data County 1988 1993All juveniles adjudicated guilty DSHS(JJS) - GJJAC Annual Report Guilty Adjudication Data County 1988 1993
Juvenile arrests for running awayWASPC - (UCR Database) Monthly Arrest Data & WASPC -Seattle P.D. Annual UCR Data Police Jurisdiction 1990 1993
Arrests for vagrancyWASPC - (UCR Database) Monthly Arrest Data & WASPC -Seattle P.D. Annual UCR Data Police Jurisdiction 1990 1993
NOTE: Acronyms are defined on the last page of this appendix.
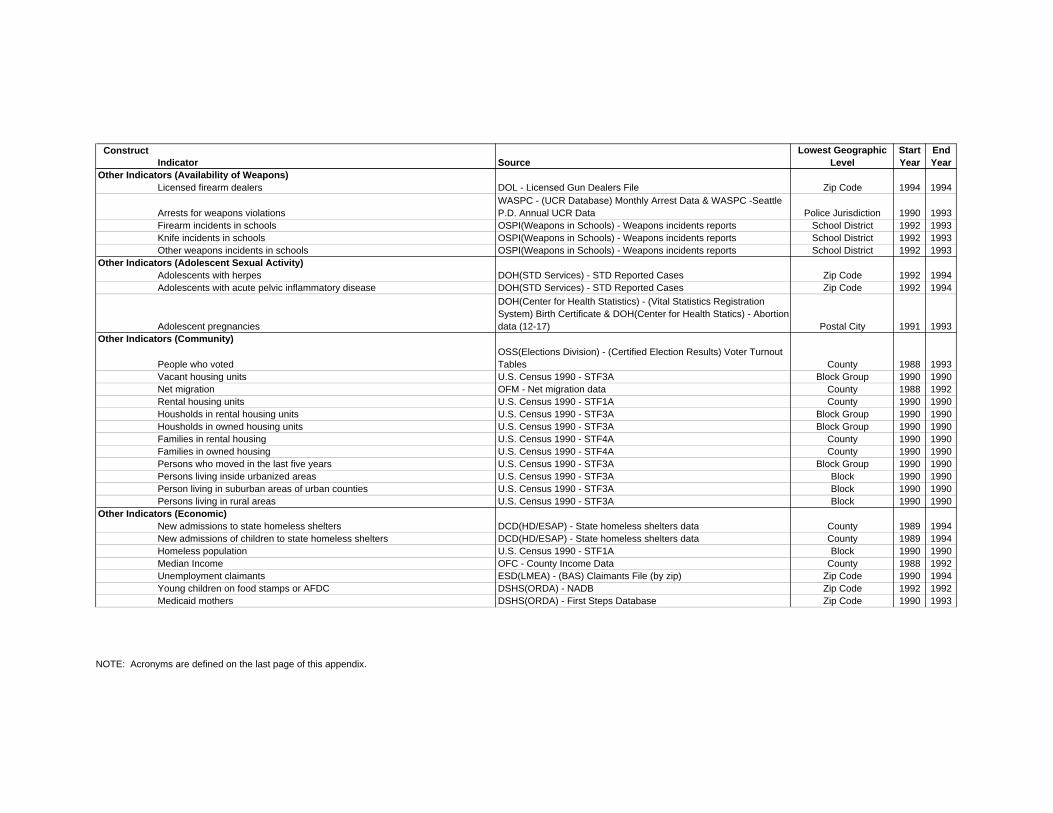
ConstructIndicator Source
Lowest Geographic Level
Start Year
End Year
Other Indicators (Availability of Weapons)Licensed firearm dealers DOL - Licensed Gun Dealers File Zip Code 1994 1994
Arrests for weapons violationsWASPC - (UCR Database) Monthly Arrest Data & WASPC -Seattle P.D. Annual UCR Data Police Jurisdiction 1990 1993
Firearm incidents in schools OSPI(Weapons in Schools) - Weapons incidents reports School District 1992 1993Knife incidents in schools OSPI(Weapons in Schools) - Weapons incidents reports School District 1992 1993Other weapons incidents in schools OSPI(Weapons in Schools) - Weapons incidents reports School District 1992 1993
Other Indicators (Adolescent Sexual Activity)Adolescents with herpes DOH(STD Services) - STD Reported Cases Zip Code 1992 1994Adolescents with acute pelvic inflammatory disease DOH(STD Services) - STD Reported Cases Zip Code 1992 1994
Adolescent pregnancies
DOH(Center for Health Statistics) - (Vital Statistics Registration System) Birth Certificate & DOH(Center for Health Statics) - Abortion data (12-17) Postal City 1991 1993
Other Indicators (Community)
People who votedOSS(Elections Division) - (Certified Election Results) Voter Turnout Tables County 1988 1993
Vacant housing units U.S. Census 1990 - STF3A Block Group 1990 1990Net migration OFM - Net migration data County 1988 1992Rental housing units U.S. Census 1990 - STF1A County 1990 1990Housholds in rental housing units U.S. Census 1990 - STF3A Block Group 1990 1990Housholds in owned housing units U.S. Census 1990 - STF3A Block Group 1990 1990Families in rental housing U.S. Census 1990 - STF4A County 1990 1990Families in owned housing U.S. Census 1990 - STF4A County 1990 1990Persons who moved in the last five years U.S. Census 1990 - STF3A Block Group 1990 1990Persons living inside urbanized areas U.S. Census 1990 - STF3A Block 1990 1990Person living in suburban areas of urban counties U.S. Census 1990 - STF3A Block 1990 1990Persons living in rural areas U.S. Census 1990 - STF3A Block 1990 1990
Other Indicators (Economic)New admissions to state homeless shelters DCD(HD/ESAP) - State homeless shelters data County 1989 1994New admissions of children to state homeless shelters DCD(HD/ESAP) - State homeless shelters data County 1989 1994Homeless population U.S. Census 1990 - STF1A Block 1990 1990Median Income OFC - County Income Data County 1988 1992Unemployment claimants ESD(LMEA) - (BAS) Claimants File (by zip) Zip Code 1990 1994Young children on food stamps or AFDC DSHS(ORDA) - NADB Zip Code 1992 1992Medicaid mothers DSHS(ORDA) - First Steps Database Zip Code 1990 1993
NOTE: Acronyms are defined on the last page of this appendix.
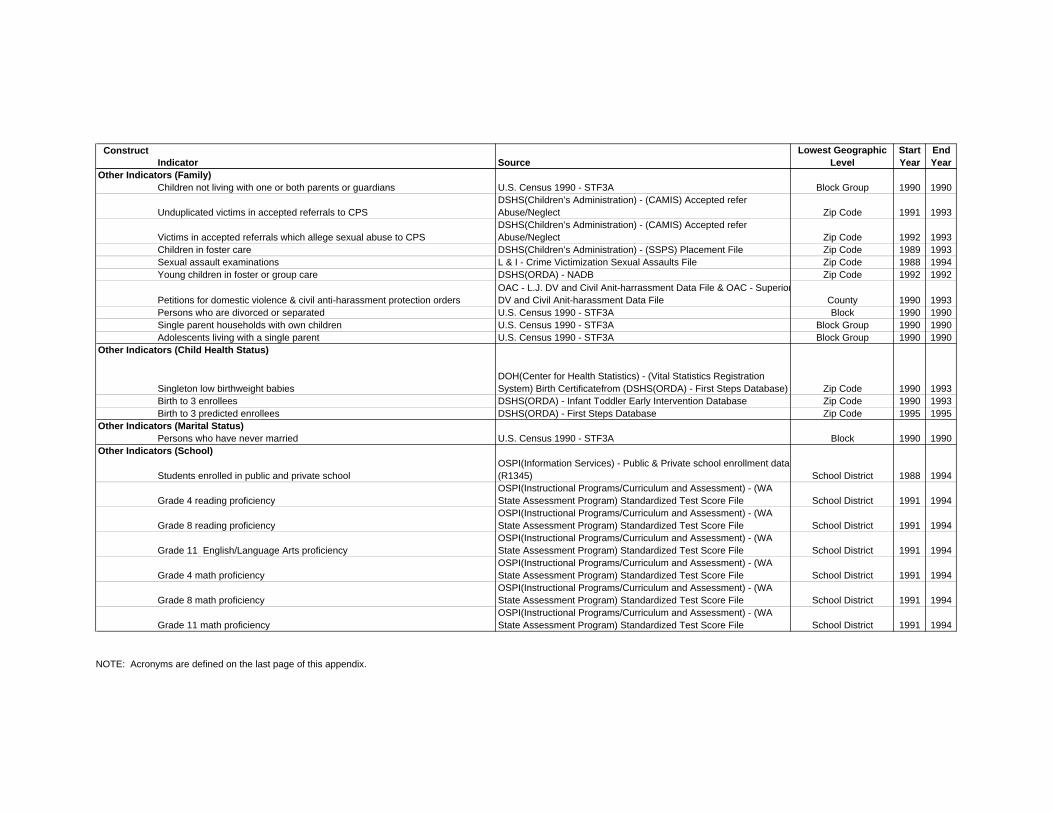
ConstructIndicator Source
Lowest Geographic Level
Start Year
End Year
Other Indicators (Family)Children not living with one or both parents or guardians U.S. Census 1990 - STF3A Block Group 1990 1990
Unduplicated victims in accepted referrals to CPSDSHS(Children’s Administration) - (CAMIS) Accepted refer Abuse/Neglect Zip Code 1991 1993
Victims in accepted referrals which allege sexual abuse to CPSDSHS(Children’s Administration) - (CAMIS) Accepted refer Abuse/Neglect Zip Code 1992 1993
Children in foster care DSHS(Children’s Administration) - (SSPS) Placement File Zip Code 1989 1993Sexual assault examinations L & I - Crime Victimization Sexual Assaults File Zip Code 1988 1994Young children in foster or group care DSHS(ORDA) - NADB Zip Code 1992 1992
Petitions for domestic violence & civil anti-harassment protection ordersOAC - L.J. DV and Civil Anit-harrassment Data File & OAC - SuperiorDV and Civil Anit-harassment Data File County 1990 1993
Persons who are divorced or separated U.S. Census 1990 - STF3A Block 1990 1990Single parent households with own children U.S. Census 1990 - STF3A Block Group 1990 1990Adolescents living with a single parent U.S. Census 1990 - STF3A Block Group 1990 1990
Other Indicators (Child Health Status)
Singleton low birthweight babiesDOH(Center for Health Statistics) - (Vital Statistics Registration System) Birth Certificatefrom (DSHS(ORDA) - First Steps Database) Zip Code 1990 1993
Birth to 3 enrollees DSHS(ORDA) - Infant Toddler Early Intervention Database Zip Code 1990 1993Birth to 3 predicted enrollees DSHS(ORDA) - First Steps Database Zip Code 1995 1995
Other Indicators (Marital Status)Persons who have never married U.S. Census 1990 - STF3A Block 1990 1990
Other Indicators (School)
Students enrolled in public and private schoolOSPI(Information Services) - Public & Private school enrollment data (R1345) School District 1988 1994
Grade 4 reading proficiencyOSPI(Instructional Programs/Curriculum and Assessment) - (WA State Assessment Program) Standardized Test Score File School District 1991 1994
Grade 8 reading proficiencyOSPI(Instructional Programs/Curriculum and Assessment) - (WA State Assessment Program) Standardized Test Score File School District 1991 1994
Grade 11 English/Language Arts proficiencyOSPI(Instructional Programs/Curriculum and Assessment) - (WA State Assessment Program) Standardized Test Score File School District 1991 1994
Grade 4 math proficiencyOSPI(Instructional Programs/Curriculum and Assessment) - (WA State Assessment Program) Standardized Test Score File School District 1991 1994
Grade 8 math proficiencyOSPI(Instructional Programs/Curriculum and Assessment) - (WA State Assessment Program) Standardized Test Score File School District 1991 1994
Grade 11 math proficiencyOSPI(Instructional Programs/Curriculum and Assessment) - (WA State Assessment Program) Standardized Test Score File School District 1991 1994
NOTE: Acronyms are defined on the last page of this appendix.
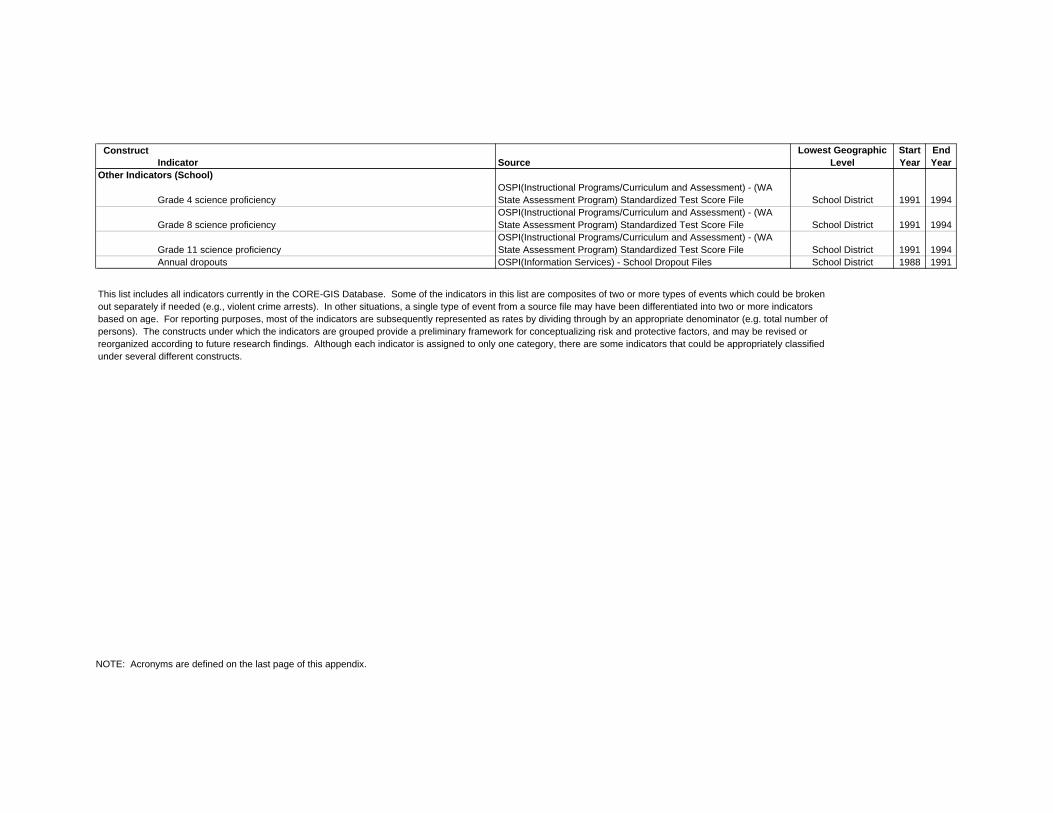
ConstructIndicator Source
Lowest Geographic Level
Start Year
End Year
Other Indicators (School)
Grade 4 science proficiencyOSPI(Instructional Programs/Curriculum and Assessment) - (WA State Assessment Program) Standardized Test Score File School District 1991 1994
Grade 8 science proficiencyOSPI(Instructional Programs/Curriculum and Assessment) - (WA State Assessment Program) Standardized Test Score File School District 1991 1994
Grade 11 science proficiencyOSPI(Instructional Programs/Curriculum and Assessment) - (WA State Assessment Program) Standardized Test Score File School District 1991 1994
Annual dropouts OSPI(Information Services) - School Dropout Files School District 1988 1991
This list includes all indicators currently in the CORE-GIS Database. Some of the indicators in this list are composites of two or more types of events which could be broken out separately if needed (e.g., violent crime arrests). In other situations, a single type of event from a source file may have been differentiated into two or more indicators based on age. For reporting purposes, most of the indicators are subsequently represented as rates by dividing through by an appropriate denominator (e.g. total number of persons). The constructs under which the indicators are grouped provide a preliminary framework for conceptualizing risk and protective factors, and may be revised or reorganized according to future research findings. Although each indicator is assigned to only one category, there are some indicators that could be appropriately classified under several different constructs.
NOTE: Acronyms are defined on the last page of this appendix.
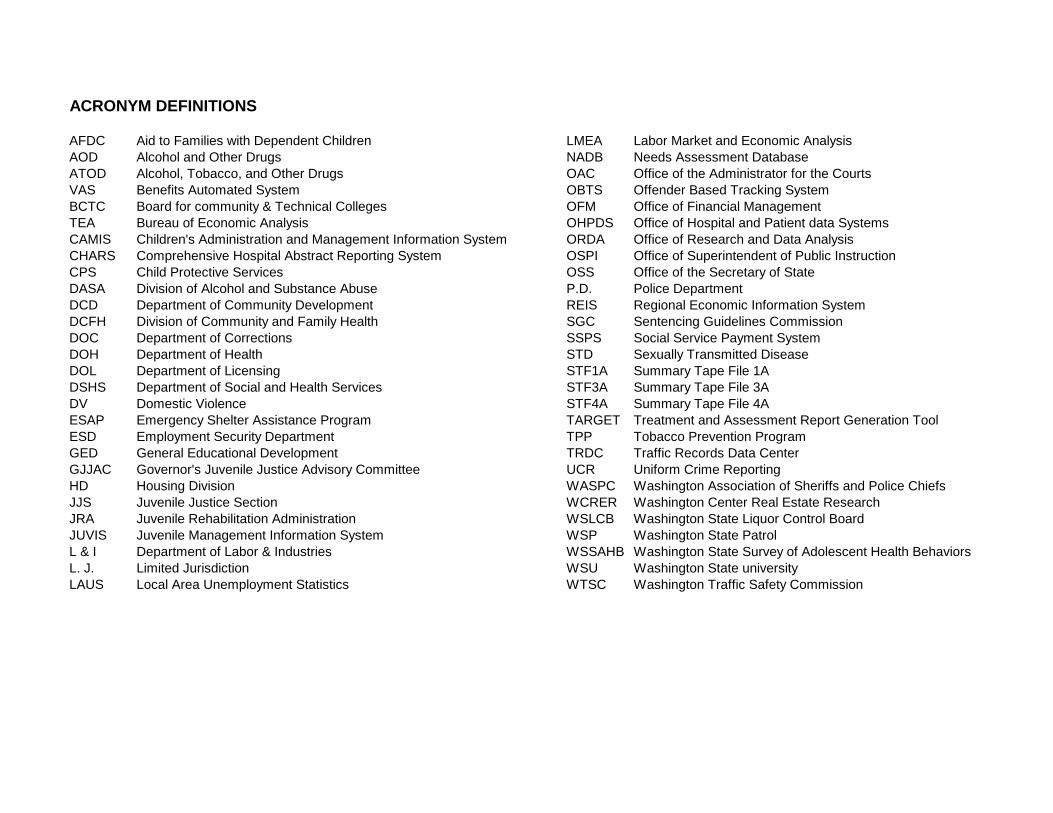
ACRONYM DEFINITIONS
AFDC Aid to Families with Dependent Children LMEA Labor Market and Economic AnalysisAOD Alcohol and Other Drugs NADB Needs Assessment DatabaseATOD Alcohol, Tobacco, and Other Drugs OAC Office of the Administrator for the CourtsVAS Benefits Automated System OBTS Offender Based Tracking SystemBCTC Board for community & Technical Colleges OFM Office of Financial ManagementTEA Bureau of Economic Analysis OHPDS Office of Hospital and Patient data SystemsCAMIS Children's Administration and Management Information System ORDA Office of Research and Data AnalysisCHARS Comprehensive Hospital Abstract Reporting System OSPI Office of Superintendent of Public InstructionCPS Child Protective Services OSS Office of the Secretary of StateDASA Division of Alcohol and Substance Abuse P.D. Police DepartmentDCD Department of Community Development REIS Regional Economic Information SystemDCFH Division of Community and Family Health SGC Sentencing Guidelines CommissionDOC Department of Corrections SSPS Social Service Payment SystemDOH Department of Health STD Sexually Transmitted DiseaseDOL Department of Licensing STF1A Summary Tape File 1ADSHS Department of Social and Health Services STF3A Summary Tape File 3ADV Domestic Violence STF4A Summary Tape File 4AESAP Emergency Shelter Assistance Program TARGET Treatment and Assessment Report Generation ToolESD Employment Security Department TPP Tobacco Prevention ProgramGED General Educational Development TRDC Traffic Records Data CenterGJJAC Governor's Juvenile Justice Advisory Committee UCR Uniform Crime ReportingHD Housing Division WASPC Washington Association of Sheriffs and Police ChiefsJJS Juvenile Justice Section WCRER Washington Center Real Estate ResearchJRA Juvenile Rehabilitation Administration WSLCB Washington State Liquor Control BoardJUVIS Juvenile Management Information System WSP Washington State PatrolL & I Department of Labor & Industries WSSAHB Washington State Survey of Adolescent Health BehaviorsL. J. Limited Jurisdiction WSU Washington State universityLAUS Local Area Unemployment Statistics WTSC Washington Traffic Safety Commission
G-1
APPENDIX G: REFERENCES
Ahmed, S.W., Bush, P.J., Davidson, F.R., & Iannotti, R.J. (1984). Predicting children’suse and intentions to use abusable substances. Presented at the annualmeeting of the American Public Health Association, Anaheim, CA, November.
Atkin, C., Hocking, J., & Block, M. (1984). Teenage drinking: Does advertising make adifference? Journal of Communication, 34, 157-167.
Bachman, J.G., Johnston, L.D., & O’Malley, P.M. (1981). Monitoring the Future:Questionnaire Responses from the Nation’s High School Seniors. Ann Arbor MI,Survey Research Center.
Barnes, G.M. & Welte, J.W. (1986). Patterns and predictors of alcohol use among 7-12th grade students in New York State. Journal of Studies on Alcohol, 47, 53-62.
Baumrind, D. (1983). Why Adolescents Take Chances and Why They Don’t. Invitedaddress for the National Institute for Child Health and Human Development.Bethesda, MD, October.
Botvin, G.J. (1990). Substance Abuse Prevention Theory, Practice, and Effectiveness.In: M. Tonry & J.Q. Wilson (Eds.) Drugs and Crime. Vol. 13. (Series Eds.: M.Tonry & N. Morris. Crime and Justice: A Review of Research.) Chicago:University of Chicago Press.
Botvin, G.J., Baker, E., Dusenbury, L., Tortu, S., & Botvin, E.M. (1990). Preventingadolescent drug abuse through a multimodal cognitive-behavioral approach:Results of a 3-year study. Journal of Consulting and Clinical Psychology, 58,437-446.
Botvin, G.J., Baker, E., Renick, N.L., Filazzola, A.D., & Botvin, E.M. (1984). A cognitivebehavioral approach to substance abuse prevention. Addictive Behaviors, 9,137-147.
Botvin, G.J. & Eng, A. (1982). The efficacy of a multicomponent approach to theprevention of cigarette smoking. Preventive Medicine, 11, 199-211.
Braucht, G.N., Kirby, M.W., & Berry, G.J. (1978). Psychosocial correlates of empiricaltypes of multiple drug abusers. Journal of Consulting and Clinical Psychology,46, 1463-1475.
Brook, J.S., Brook, D.W., Gordon, A.S., Whiteman, M., & Cohen, P. (1990). Thepsychosocial etiology of adolescent drug use: A family interactional approach.Genetic, Social, and General Psychology Monographs , 116, whole issue no. 2.
Brook, J.S., Cohen, P., Whiteman, M., & Gordon, A.S. (1992). Psychosocial RiskFactors in the Transition from Moderate to Heavy Use or Abuse of Drugs. In: M.Glantz & R. Pickens (Eds.) Vulnerability to Abuse. Washington, DC: AmericanPsychological Association.
Brook, J.S., Gordon, A.S., Whiteman, M., & Cohen, P. (1986). Some models andmechanisms for explaining the impact of maternal and adolescentcharacteristics on adolescent stage of drug use. Developmental Psychology, 22,460-467.
G-2
Brook, J.S., Nomura, C., & Cohen, P. (1989). A network of influences on adolescentdrug involvement: Neighborhood, school, peer and family. Genetic, Social, andGeneral Psychology Monographs , 115, 125-145.
Brook, J.S., Whiteman, M., Gordon, A.S., & Brook, D.W. (1988). The role of olderbrothers in younger brothers’ drug use viewed in the context of parent and peerinfluences. Journal of Genetic Psychology , 151, 59-75.
Caplan, M., Weissberg, R.P., Grober, J.S., Sivo, P.J., Grady, K., & Jacoby, C. (1992).Social competence promotion with inner-city and suburban young adolescents:Effects on social adjustment and alcohol use. Journal of Consulting and ClinicalPsychology, 60, 56-63.
Cauce, A.M., Comer, J.P., & Schwartz, D. (1987). Long-term effects of a systems-oriented school prevention program. American Journal of Orthopsychiatry, 57,127-131.
Cloninger, C.R., Sigvardsson, S., & Bohman, M. (1988). Childhood personality predictsalcohol abuse in young adults. Alcoholism: Clinical and Experimental Research,12, 494-505.
Comer, J.P. (1985). The Yale-New Haven Primary Prevention Project: A follow-upstudy. Journal American Academy of Child and Adolescent Psychiatry, 24, 154-160.
Comer, J.P. (1988). Educating poor minority children. Scientific American, 259, 42-48.
Cook, P.J. & Tauchen, G. (1982). The effect of liquor taxes on heavy drinking. BellJournal of Economics, 13, 379-390.
Dembo, R., Farrow, D., Schmeidler, J., & Burgos, W. (1979). Testing a causal model ofenvironmental influences on early drug involvement of inner city junior highschool youths. American Journal of Drug and Alcohol Abuse , 6, 313-336.
Developmental Research Programs (1996). Communities That Care Planning Kit.Seattle, Washington, Telephone 1-800-736-2630.
Dryfoos, J.G. (1990). Adolescents at Risk: Prevalence and Prevention. New York:Oxford University Press.
Ellickson, P.L. & Bell, R.M. (1990). Drug prevention in junior high: A multi-sitelongitudinal test. Science, 247, 1299-1305.
Elliott, D.S., Huizinga, D., & Ageton, S.S. (1985). Explaining Delinquency and DrugUse. Beverly Hills, CA: Sage.
Elliott, G.R. & Feldman, S.S. (1990). Capturing the Adolescent Experience. In: S.S.Feldman & G.R. Elliott (Eds.) At the Threshold: The Developing Adolescent.Cambridge, MA: Harvard University Press.
Emshoff, J. (1996). Alcohol and Other Drug Abuse Prevention: The NationalStructured Evaluation. Washington, DC: U.S. Department of Health and HumanServices.
Fagan, J. (1988). The Social Organization of Drug Use and Drug Dealing amongUrban Gangs. New York: John Jay College of Criminal Justice.
G-3
Flasher, L.V. & Maisto, S.A. (1984). A review of theory and research on drinkingpatterns among Jews. The Journal of Nervous and Mental Disease, 172, 596-603.
Flewelling, R., Kohlenberg, E., & Howards, P. (1994). Youth Risk AssessmentDatabase: Preliminary Report for Community Networks. October ed. Olympia,WA: Washington State Department of Health and Department of Social andHealth Services. 218 pages.
Flewelling, R.L., Rachal, J.V., & Marsden, M.E. (1992). Socioeconomic anddemographic correlates of drug and alcohol use: Findings from the 1988 and1990 National Household Surveys on Drug Abuse. (DHHS Publication, No. ADM92-1906.) Rockville, MD: National Institute on Drug Abuse.
Fox, K., Merrill, J., Chang, H., & Califano, J. (1995). Estimating the Costs of SubstanceAbuse to the Medicaid Hospital Care Program. American Journal of PublicHealth, 85 (1), 48-54.
Friedman, A.S. (1983). High School Drug Abuse Clients. In: Treatment ResearchNotes. Rockville, MD: National Institute on Drug Abuse, Division of ClinicalResearch.
Garmezy, N. (1985). Stress Resistant Children: The Search for Protective Factors. In:J. Stevenson (Ed.) Recent Research in Developmental Psychopathology.Oxford: Pergamon.
Gillmore, M.R., Catalano, R.F., Morrison, D.M., Wells, E.A., Iritani, B., & Hawkins, J.D.(1990). Racial differences in acceptability and availability of drugs and earlyinitiation of substance abuse. American Journal of Drug and Alcohol Abuse, 16,185-206.
Goldstein, A. & Kalant, H. (1990). Drug policy: Striking the right balance. Science, 249,1513-1521.
Goodwin, D.W. (1985). Alcoholism and genetics: The sins of the fathers. Archives ofGeneral Psychiatry, 42, 171-174.
Gorsuch, R.C. & Butler, M.C. (1976). Initial drug abuse: A review of predisposing socialpsychological factors. Psychological Bulletin, 83, 120-137.
Gottfredson, G.D. (1988). Issues in Adolescent Drug Use. Unpublished final report tothe U.S. Department of Justice. Baltimore: Johns Hopkins University, Center forResearch on Elementary and Middle Schools.
Hansen, W.B. & Graham, J.W. (1991). Preventing alcohol, marijuana, and cigaretteuse among adolescents: Peer pressure resistance training versus establishingconservative norms. Preventive Medicine, 20, 414-430.
Hansen, W.B., Graham, J.W., Sobel, J.L., Shelton, D.R., Flay, B.R., & Johnson, C.A.(1987). The consistency of peer and parent influences on tobacco, alcohol, andmarijuana use among young adolescents. Journal of Behavioral Medicine, 10,559-579.
Harford, T.C. (1985). Drinking Patterns Among Black and Nonblack Adolescents:Results of a National Survey. In: R. Wright & T.D. Watts (Eds.) Prevention ofBlack Alcoholism: Issues and Strategies . Springfield, IL: Charles C. Thomas.
G-4
Harris, J.E. (1994). Testimony to the U.S. House Ways and Means Committee. Journalof the American Medical Association , 271, 644-645.
Harwood, H.J., Kristiansen, P., & Rachal, J.V. (1985). Social and Economic Costs ofAlcohol Abuse and Alcoholism. (No. 2) Research Triangle Park, NC: ResearchTriangle Institute.
Hawkins, J.D., Arthur, M.W., & Catalano, R.F. (1995). Preventing Substance Abuse.In: M. Tonry & D. Farrington (Eds.) Building a Safer Society: StrategicApproaches to Crime Prevention. Vol. 19. (Series Eds.: M. Tonry & N. Morris.Crime and Justice: A Review of Research.) Chicago, IL: The University ofChicago, 343-427.
Hawkins, J.D., Catalano, R.F., & Miller, J.Y. (1992). Risk and Protective Factors forAlcohol and Other Drug Problems in Adolescence and Early Adulthood:Implications for Substance Abuse Prevention. Psychological Bulletin, 112, No.1, 64-105.
Hawkins, J.D., Catalano, R.F., Morrison, D.M., O’Donnell, J., Abbott, R.D., & Day, L.E.(1992). The Seattle Social Development Project: Effects of the first four yearson protective factors and problem behaviors. In: J. McCord & R. Tremblay (Eds.)The Prevention of Antisocial Behavior in Children . New York: Guilford.
Hawkins, J.D., Lishner, D., & Catalano, R.F. (1985). Childhood Predictors and thePrevention of Adolescent Substance Abuse. In: C.L. Jones & R.J. Battjes (Eds.)Etiology of Drug Abuse: Implications for Prevention. (Research Monograph no.56.) Washington, DC: National Institute on Drug Abuse.
Hawkins, J.D., Lishner, D.M., Jenson, J.M., & Catalano, R.F. (1987). Delinquents andDrugs: What the evidence suggests about prevention and treatmentprogramming. In: B.S. Brown & A.R. Mills (Eds.) Youth at High Risk forSubstance Abuse. Washington, DC: U.S. Government Printing Office.
Hawkins, J.D., Von Cleve, E., & Catalano, R.F. (1991). Reducing Early ChildhoodAgression: Results of a primary prevention program. Journal AmericanAcademy of Child and Adolescent Psychiatry , 30, 208-217.
Herting, J.R. & Guest, A.M. (1985). components of satisfaction with local areas in themetropolis. The Sociological Quarterly, 26, 99-115.
Holder, H.D. & Blose, J.O. (1987). Impact of changes in distilled spirits availability onapparent consumption: A time series analysis of liquor-by-the-drink. BritishJournal of Addiction, 82, 623-631.
Hundleby, J.D. & Mercer, G.W. (1987). Family and friends as social environments andtheir relationship to young adolescents’ use of alcohol, tobacco, and marijuana.Journal of Clinical Psychology, 44, 125-134.
Institute of Medicine (IOM) Committee on Prevention of Mental Disorders (1994).Reducing Risks for Mental Disorders: Frontiers for Prevention InterventionResearch. (Series Eds.: P.J. Mrazek & R.J. Haggerty.) Washington, DC:National Academy Press.
Jessor, R. (1976). Predicting time of onset of marijuana use: A developmental study ofhigh school youth. Journal of Consulting and Clinical Psychology , 44, 125-134.
G-5
Jessor, R. (1991). Risk Behavior in Adolescence: A Psychosocial Framework forUnderstanding and Action. Journal of Adolescent Health , 12, 597-605.
Jessor, R., Donovan, J.E., & Windmer, K. (1980). Psychosocial factors in adolescentalcohol and drug use: The 1980 National Sample Study, and the 1974-78 PanelStudy. Unpublished final report. Boulder: University of Colorado, Institute ofBehavioral Science.
Jessor, R., Donovan, J.E., & Costa, F. (Eds.) (1991). Beyond Adolescence: ProblemBehavior and Young Adult Development. Cambridge University Press: NewYork.
Jessor, R. & Jessor, S.L. (1977). Problem Behavior and Psychosocial Development: ALongitudinal Study of Youth . New York, NY: Academic Press.
Johnson, C.A., Pentz, M.A., Wever, M.D., Dwyer, J.H., MacKinnon, D.P., Flay, B.R.,Baer, N.A., & Hansen, W.B. (1990). Relative effectiveness of comprehensivecommunity programming for drug abuse prevention with high-risk and low-riskadolescents. Journal of Consulting and Clinical Psychology , 58, 447-456.
Johnson, D.L. & Breckenridge, J.N. (1982). The Houston Parent-Child DevelopmentCenter and the primary prevention of behavior problems in young children.American Journal of Community Psychology , 10, 305-316.
Johnson, D.L. (1988). Primary Prevention of Behavior Problems in Young Children:The Houston Parent-Child Development Center. In: R.H. Price, E.L. Cowen,R.P. Lorion, & J. Ramos-McKay (Eds.) 14 Ounces of Prevention. Washington,DC: American Psychological Association.
Johnston, L.D. (1991). Toward a Theory of Drug Epidemics. In: L. Donohew, H.E.Sypher, & W.J. Bukoski (Eds.) Persuasive Communication and Drug AbusePrevention. Hillsdale, NJ: Erlbaum.
Johnston, L.D., O’Malley, P.M., & Bachman, J.G. (1985). Drug Use, Drinking, andSmoking: National Survey Results from High School, College, and Young AdultPopulations. Washington, DC: U.S. Government Printing Office.
Joksch, H.C. (1988). The impact of severe penalties on drinking and driving. AAAFoundation for Traffic Safety, Washington, DC.
Kandel, D.B. (1978). Convergences in Prospective Longitudinal Surveys of Drug Usein Normal Populations. In: D.B. Kandel (Ed.) Longitudinal research on drug use.Empirical findings and methodological issues. Washington, DC: Hemisphere-John Witen.
Kandel, D.B. (1982). Epidemiological and psychosocial perspectives on adolescentdrug use. Journal of the American Academy of Clinical Psychiatry , 21, 328-347.
Kandel, D.B. (1986). Processes of Peer Influence in Adolescence. In: R. Silberstein(Ed.) Development as Action in Context: Problem Behavior and Normal YouthDevelopment. New York: Springer-Verlag.
Kandel, D.B. & Andrews, K. (1987). Processes of adolescent socialization by parentsand peers. The International Journal of the Addictions , 22, 319-342.
G-6
Kandel, D.B. & Davies, M. (1992). Progression to Regular Marijuana Involvement:Phenomenology and Risk Factors for Near-daily Use. In: M. Glantz & R. Pickens(Eds.) Vulnerability to Abuse. Washington, DC: American PsychologicalAssociation.
Kandel, D.B., Kessler, R.C., & Margulies, R.S. (1978). Antecedents of adolescentinitiation into stages of drug use: A developmental analysis. Journal of Youthand Adolescence, 7, 13-40.
Kandel, D.B., Simcha-Fagan, O., & Davies, M. (1986). Risk factors for delinquency andillicit drug use from adolescence to young adulthood. The Journal of DrugIssues, 16, 67-90.
Kandel, D.B., Single, B.E., & Kessler, R. (1976). The epidemiology of drug use amongNew York State high school students: Distribution, trends, and change in ratesof use. American Journal of Public Health , 66, 43-53.
Kandel, D.B., Yamaguchi, K., & Chen, K. (1992). Stages of progression in druginvolvement from adolescence to adulthood: Further evidence for the GatewayTheory. Journal of Studies on Alcohol , September, 447-457.
Kaufman, E. & Kaufman, P.N. (1979). Family Therapy of Drug and Alcohol Abuse.New York: Gardner Press.
Kelly, D. & Balch, R.W. (1971). Social origins and school failure: A re-examination ofCohen’s Theory of Working-Class Delinquency. Pacific Sociological Review, 14,413-430.
Kim, S. (1979). An Evaluation of Ombudsman Primary Prevention Program on StudentDrug Abuse. Charlotte, NC: Charlotte Drug Education Center.
Kim, S., Coletti, S., Crutchfield, C., Williams, C., & Helper, N. (1995). Benefit-costanalysis of drug abuse prevention programs: A macroscopic approach. Journalof Drug Education, 25 (2), 111-127.
Krieg, T.L. (1982). Is raising the legal drinking age warranted? Police Chief, December,32-34.
Krosnick, J.A. & Judd, C.M. (1982). Transitions in social influence at adolescence:Who induces cigarette smoking? Developmental Psychology, 18, 359-368.
Lerner, J.V. & Vicary, J.R. (1984). Difficult temperament and drug use: Analyses fromthe New York Longitudinal Study. Journal of Drug Education, 14, 1-8.
Levy, D. & Sheflin, N. (1985). The demand for alcoholic beverages: An aggregatetime-series analysis. Journal of Public Policy and Marketing , 4, 47-54.
Lewis, C.E., Robins, L., & Rice, J. (1985). Association of alcoholism with antisocialpersonality in urban men. The Journal of Nervous and Mental Disorders, 173,166-174.
Loeber, R. (1988). Natural Histories of conduct Problems, Delinquency, andAssociated Substance Use: Evidence for Developmental Progressions. In: B.B.Lahey & E. Kazdin (Eds.) Advances in Clinical Child Psychology. Vol. 11. NewYork: Plenum.
G-7
Maddahian, E., Newcomb, M.D., & Bentler, P.M. (1988). Adolescent drug use andintention to use drugs: Concurrent and longitudinal analyses of four ethnicgroups. Addictive Behaviors, 13, 191-195.
McDermott, D. (1984). The relationship of parental drug use and parent’s attitudeconcerning adolescent drug use to adolescent drug use. Adolescence, 19, 89-97.
Murray, D.M., Richards, P.S., Luepker, R.V., & Johnson, C.A. (1987). The preventionof cigarette smoking in children: Two- and three-year follow-up comparisons offour prevention strategies. Journal of Behavioral Medicine, 10, 595-611.
Needle, R.H., Su, S.S., & Doherty, W.J. (1990). Divorce, remarriage, and adolescentsubstance use: A prospective longitudinal study. Journal of Marriage and theFamily, 52, 157-169.
Newcomb, M.D. & Bentler, P.M. (1986). Substance Use and Ethnicity: Differentialimpact of peer and adult models. Journal of Psychology, 120, 83-95.
Newcomb, M.D., Maddahian, E., & Bentler, P.M. (1986). Risk factors for drug useamong adolescents: Concurrent and longitudinal analysis. American Journal ofPublic Health, 76 (5), 525-531.
Olds, D.L., Henderson, C.R., Chamberlain, R., & Tatelbaum, R. (1986). Preventingchild abuse and neglect: A randomized trial of nurse home visitation. Pediatrics,78 (1), 65-78.
Olds, D.L., Henderson, C.R., Tatelbaum, R., & Chamberlain, R. (1988). Improving thelife-course development of socially disadvantaged mothers: A randomized trialof nurse home visitation. American Journal of Public Health , 78 (11), 1436-1444.
O’Malley, P.M. & Wagenaar, A.C. (1991). Effects of minimum drinking age laws onalcohol use, related behaviors and traffic crash involvement among Americanyouth: 1976-1987. Journal of Studies on Alcohol , 52, 478-491.
Osgood, D.W. (1991). Covariation Among Health Problems in Adolescence. Office ofTechnology Assessment: Washington, DC.
Paton, S. & Kandel, D.B. (1978). Psychological factors and adolescent illicit drug use:Ethnicity and sex differences. Adolescence, 13, 187-200.
Penning, M. & Barnes, G.E. (1982). Adolescent marijuana use: A review. TheInternational Journal of the Addictions , 17, 749-791.
Pentz, M.A., MacKinnon, D.P., Flay, B.R., Hansen, W.B., Johnson, C.A., & Dwyer, J.H.(1989). Primary prevention of chronic diseases in adolescence: Effects of theMidwestern Prevention Project on Tobacco Use. American Journal ofEpidemiology, 130, 713-724.
Perry, C.I., Grant, M., Ernberg, G., Florenzano, R.U., Langdon, M.C., Myeni, A.D.,Washlberg, R., Berg, S., Andersson, K., Fisher, K.J., Blaze-Temple, D., Cross,D., Saunders, B., Jacobs, D.R., & Schmid, T. (1989). WHO collaborative studyon alcohol education and young people: Outcomes of a four-country pilot study.The International Journal of the Addictions , 24, 1145-1171.
Polich, J.M., Ellickson, P.L., Reuter, P., & Kahan, J.P. (1984). Strategies for ControllingAdolescent Drug Use. Santa Monica, CA: RAND.
G-8
Pollock, V.E., Volavka, J., Goodwin, D.W., Mednick, S.A., Gabrielli, W.F., Knop, J., &Schulsinger, F. (1983). The EEG after alcohol administration in men at risk foralcoholism. Archives of General Psychiatry, 40, 857-861.
Provence, S. & Naylor, A. (1983). Working with Disadvantaged Parents and Children:Scientific Issues and Practice. New Haven,CT: Yale University Press.
Rachal, J.V., Guess, L.L., Hubbard, R.L., Maisto, S.A., Cavanaugh, E.R., Waddell, R.,& Benrud, C.H. (1982). Facts for planning no. 4: Alcohol misuse byadolescents. Alcohol Health and Research World , 61-68.
Radke-Yarrow, M. & Sherman, T. (1990). Children born at medical risk: Factorsaffecting vulnerability and resilience. In: J. Rolf, A.S. Masten, D. Cicchetti, K.H.Nuechterlein, & S. Weintraub (Eds.) Risk and Protective Factors in theDevelopment of Psychopathology. Cambridge: Cambridge University Press.
Reilly, D.M. (1979). Family factors in the etiology and treatment of youthful drug abuse.Family Therapy, 11, 149-171.
Rice, D.P., Kelman, S., & Miller, L. (1991). Economic Costs of Drug Abuse. (ResearchMonograph No. 113.) Rockville, MD: National Institute on Drug Abuse.
Rice, D.P., Kelman, S., Miller, L.S., & Dunmeyer, S. (1990). The economic costs ofalcohol and drug abuse and mental illness (Contract No. 283-87-0007). SanFrancisco: Office of Financing and Coverage Policy of the Alcohol, Drug Abuse,and Mental Health Administration. US Department of Health and HumanServices.
Robins, L.N. & Przybeck, T.R. (1985). Age of onset of drug use as a factor in drug andother disorders. In: C.L. Jones & R.J. Battjes (Eds.) Etiology of Drug Abuse:Implications for Prevention. National Institute on Drug Abuse ResearchMonograph ed. Vol. 56. Washington, DC: US Government Printing Office.
Robins, L.N. & Ratcliff, D.S. (1979). Risk factors in the continuation of childhoodantisocial behavior into adulthood. International Journal of Mental Health, 7, 76-116.
Robins, L.N. (1980). The natural history of drug abuse. Acta PsychiatricaScandinavica, 62 (Suppl. 284), 7-20.
Robins, L.N. (1984). The natural history of adolescent drug use. American Journal ofPublic Health, 74, 656-657.
Rutter, M. (1987). Psychosocial resilience and protective mechanisms. AmericanJournal of Orthopsychiatry, 57, 316-331.
Rutter, M. (1990). Psychosocial resilience and protective mechanisms. In: J. Rolf, A.D.Masten, D. Cicchetti, K.H. Nuechterlein, & S. Weintraub (Eds.) Risk andProtective Factors in the Development of Psychopathology. Cambridge:Cambridge University Press.
Saffer, H. & Grossman, M. (1987). Beer taxes, the legal drinking age, and youth motorvehicle fatalities. Journal of Legal Studies , 16, 351-374.
G-9
Sampson, R.J. (1986). Crime in cities: The effects of formal and informal social control.In: J. Reiss AJ & M. Tonry (Eds.) Communities and Crime. Vol. 8. (Series Eds.:M. Tonry & N. Morris. Crime and Justice: A Review of Research.) Chicago:University of Chicago Press.
Schuckit, M.A. & Rayes, V. (1979). Ethanol ingestion: Differences in bloodacetaldehyde concentrations in relatives of alcoholics and controls. Science,203, 54-55.
Schuckit, M.A. (1980). Biological markers: Metabolism and acute reactions to alcohol insons of alcoholics. Pharmacology, Biochemistry, and Behavior , 13, 9-16.
Schuckit, M.A. (1987). Biological vulnerability to alcoholism. Journal of Consulting andClinical Psychology, 55, 301-309.
Schuckit, M.A., Parker, D.C., & Rossman, L.R. (1983). Ethanol-related prolactinresponses and risk for alcoholism. Biological Psychiatry, 18, 1153-1159.
Schultz, J., Rice, D., & Parker, D. (1990). Alcohol-related mortality and years ofpotential life lost - United States, 1987. Morbidity and Mortality Weekly Report,39, 173-178.
Seattle-King County HIV/AIDS Epidemiology Unit & Washington State Office ofHIV/AIDS Epidemiology and Evaluation (1994). Washington State/Seattle-KingCounty HIV/AIDS Epidemiology Report. Seattle, WA: State of Washington, (2ndQuarter, 1994), p. 4.
Seitz, V. (1990). Intervention programs for impoverished children: A comparison ofeducational and family support models. Annals of Child Development, 7, 73-103.
Seitz, V., Rosenbaum, L.K., & Apfel, N.H. (1985). Effects of family supportintervention: A ten-year follow-up. Child Development, 56, 376-391.
Selnow, G.W. (1987). Parent-child relationships in single and two parent families:implications for substance usage. Journal of Drug Education, 17, 315-326.
Shedler, J. & Block, J. (1990). Adolescent drug use and psychological health: Alongitudinal inquiry. American Psychologist, 45, 612-630.
Shure, M.B. & Spivack, G. (1988). Interpersonal Cognitive Problem Solving. In: R.H.Price, E.I. Cowen, R.P. Lorion, & J. Ramos-McKay (Eds.) 14 Ounces ofPrevention: A Casebook for Practitioners. Washington, DC: AmericanPsychological Association.
Sincha-Fagan, O., Gersten, J.C., & Langner, T.S. (1986). Early precursors andconcurrent correlates of patterns of illicit drug use in adolescence. The Journalof Drug Issues, 16, 7-28.
Slavin, R.E. (1990). Cooperative Learning Theory, Research, and Practice. EnglewoodCliffs, NJ: Prentice Hall.
Smith, G.M. & Fogg, C.P. (1978). Psychological Predictors of Early Use, Late Use, andNon-use of Marijuana among Teenage Students. In: D.B. Kandel (Ed.)Longitudinal Research on Drug Use: Empirical Findings and MethodologicalIssues. Washington, DC: Hemisphere- Wiley.
G-10
Tec, N. (1974). Parent-child drug abuse: Generational continuity or adolescentdeviancy? Adolescence, 9, 350-364.
U.S. Department of Health and Human Services (1996). Preliminary estimates from the1995 National Household Survey on Drug Abuse. Advance Report Number 18.Rockville, MD: Substance Abuse and Mental Health Services Administration,Office of Applied Studies.
U.S. General Accounting Office (USGAO) (1994). Drug use among youth: no simpleanswers to guide prevention. Report to the Chairman, Subcommittee onChildren, Family, Drugs, and Alcoholism, Committee on Labor and HumanResources, US Senate. US General Accounting Office. Washington, DC.
Vaillant, G. (1983). The Natural History of Alcoholism. Cambridge, MA: HarvardUniversity Press.
Werner, E.E. (1989). High risk children in young adulthood: A longitudinal study frombirth to 32 years. American Journal of Orthopsychiatry, 59, 72-81.
Yoshikawa, H. (1994). Prevention as cumulative protection: Effects of early familysupport and education on chronic delinquency and its risks. PsychologicalBulletin, 115, 28-54.
Zechmann, A., Flewelling, R., & VanEenwyk, J. (1995). Youth Risk AssessmentDatabase. A Comprehensive Report. June ed. Olympia, WA: Washington StateDepartments of Health, and Social and Health Services. 282 pages.
Ziegler-Driscoll, G. (1979). The Similarities in Families of Drug Dependents andAlcoholics. In: E. Kaufman & P. Kaufman (Eds.) Family Therapy of Drug andAlcohol Abuse. New York: Gardner Press.
Zuckerman, M. (1987). Biological Connection between Sensation Seeking and DrugAbuse. In: J. Engel & L. Oreland (Eds.) Brain Reward Systems and Abuse. NewYork: Raven.
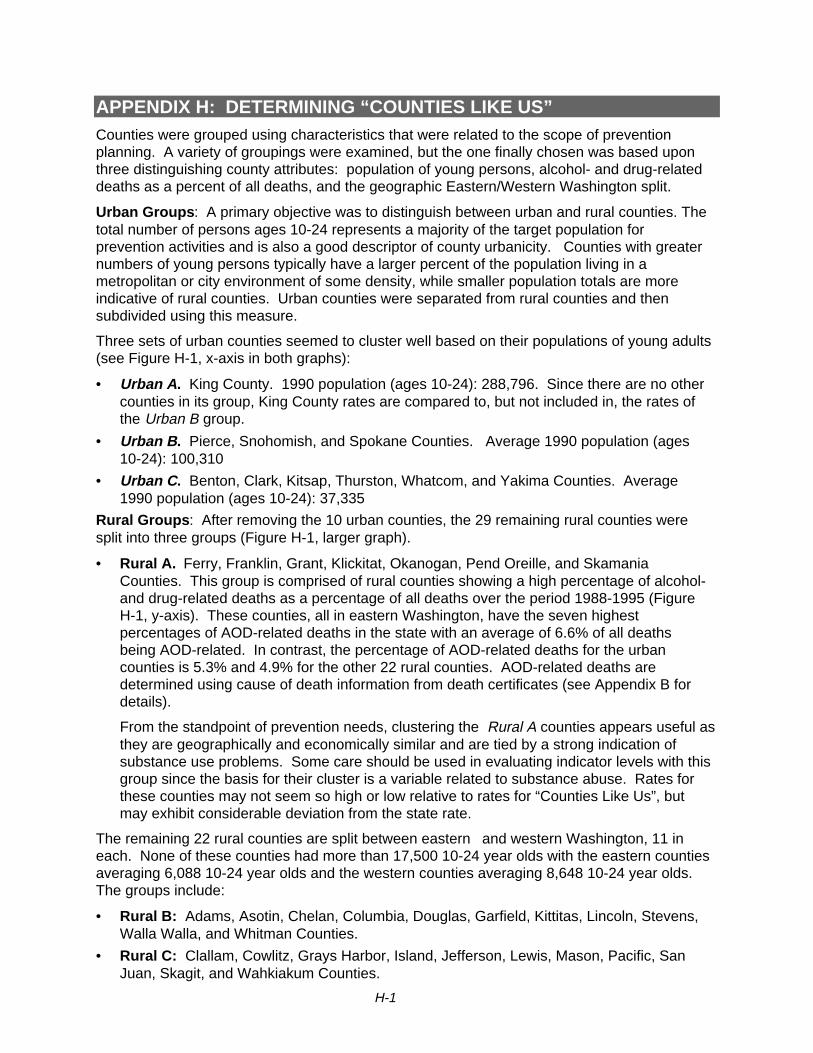
H-1
APPENDIX H: DETERMINING “COUNTIES LIKE US”Counties were grouped using characteristics that were related to the scope of preventionplanning. A variety of groupings were examined, but the one finally chosen was based uponthree distinguishing county attributes: population of young persons, alcohol- and drug-relateddeaths as a percent of all deaths, and the geographic Eastern/Western Washington split.
Urban Groups: A primary objective was to distinguish between urban and rural counties. Thetotal number of persons ages 10-24 represents a majority of the target population forprevention activities and is also a good descriptor of county urbanicity. Counties with greaternumbers of young persons typically have a larger percent of the population living in ametropolitan or city environment of some density, while smaller population totals are moreindicative of rural counties. Urban counties were separated from rural counties and thensubdivided using this measure.
Three sets of urban counties seemed to cluster well based on their populations of young adults(see Figure H-1, x-axis in both graphs):
• Urban A. King County. 1990 population (ages 10-24): 288,796. Since there are no othercounties in its group, King County rates are compared to, but not included in, the rates ofthe Urban B group.
• Urban B. Pierce, Snohomish, and Spokane Counties. Average 1990 population (ages10-24): 100,310
• Urban C. Benton, Clark, Kitsap, Thurston, Whatcom, and Yakima Counties. Average1990 population (ages 10-24): 37,335
Rural Groups: After removing the 10 urban counties, the 29 remaining rural counties weresplit into three groups (Figure H-1, larger graph).
• Rural A. Ferry, Franklin, Grant, Klickitat, Okanogan, Pend Oreille, and SkamaniaCounties. This group is comprised of rural counties showing a high percentage of alcohol-and drug-related deaths as a percentage of all deaths over the period 1988-1995 (FigureH-1, y-axis). These counties, all in eastern Washington, have the seven highestpercentages of AOD-related deaths in the state with an average of 6.6% of all deathsbeing AOD-related. In contrast, the percentage of AOD-related deaths for the urbancounties is 5.3% and 4.9% for the other 22 rural counties. AOD-related deaths aredetermined using cause of death information from death certificates (see Appendix B fordetails).
From the standpoint of prevention needs, clustering the Rural A counties appears useful asthey are geographically and economically similar and are tied by a strong indication ofsubstance use problems. Some care should be used in evaluating indicator levels with thisgroup since the basis for their cluster is a variable related to substance abuse. Rates forthese counties may not seem so high or low relative to rates for “Counties Like Us”, butmay exhibit considerable deviation from the state rate.
The remaining 22 rural counties are split between eastern and western Washington, 11 ineach. None of these counties had more than 17,500 10-24 year olds with the eastern countiesaveraging 6,088 10-24 year olds and the western counties averaging 8,648 10-24 year olds.The groups include:
• Rural B: Adams, Asotin, Chelan, Columbia, Douglas, Garfield, Kittitas, Lincoln, Stevens,Walla Walla, and Whitman Counties.
• Rural C: Clallam, Cowlitz, Grays Harbor, Island, Jefferson, Lewis, Mason, Pacific, SanJuan, Skagit, and Wahkiakum Counties.

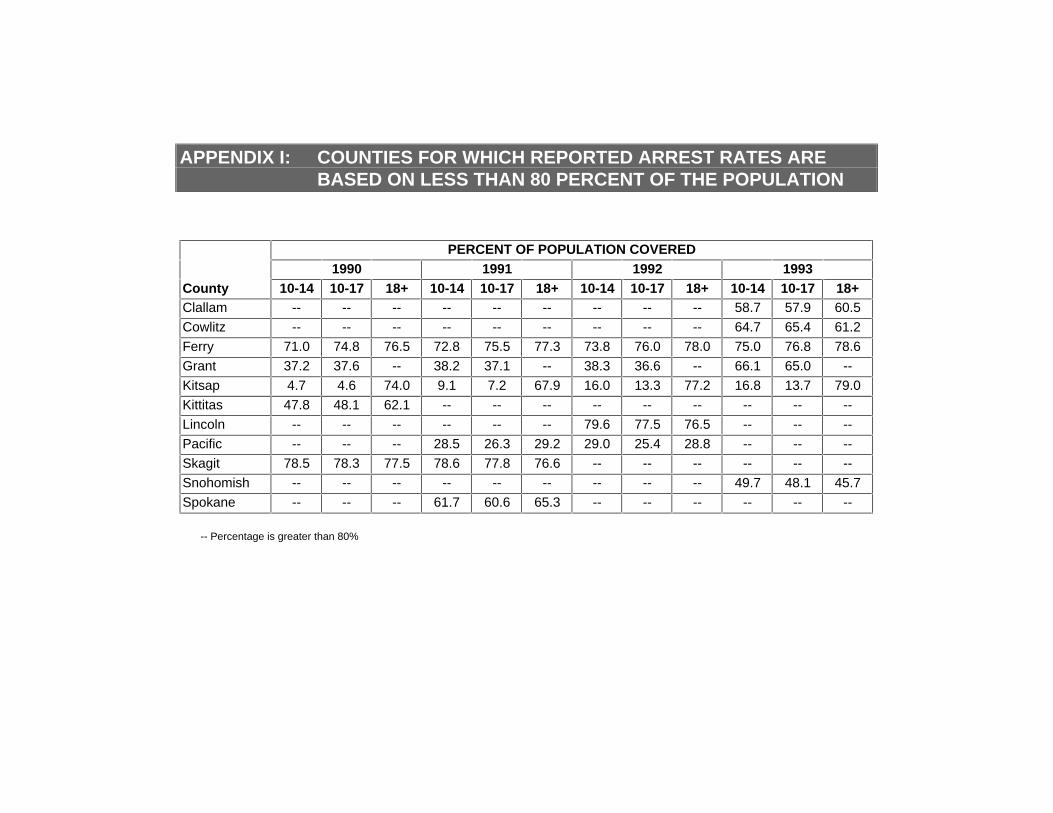
APPENDIX I: COUNTIES FOR WHICH REPORTED ARREST RATES AREBASED ON LESS THAN 80 PERCENT OF THE POPULATION
PERCENT OF POPULATION COVERED1990 1991 1992 1993
County 10-14 10-17 18+ 10-14 10-17 18+ 10-14 10-17 18+ 10-14 10-17 18+Clallam -- -- -- -- -- -- -- -- -- 58.7 57.9 60.5
Cowlitz -- -- -- -- -- -- -- -- -- 64.7 65.4 61.2
Ferry 71.0 74.8 76.5 72.8 75.5 77.3 73.8 76.0 78.0 75.0 76.8 78.6
Grant 37.2 37.6 -- 38.2 37.1 -- 38.3 36.6 -- 66.1 65.0 --
Kitsap 4.7 4.6 74.0 9.1 7.2 67.9 16.0 13.3 77.2 16.8 13.7 79.0
Kittitas 47.8 48.1 62.1 -- -- -- -- -- -- -- -- --
Lincoln -- -- -- -- -- -- 79.6 77.5 76.5 -- -- --
Pacific -- -- -- 28.5 26.3 29.2 29.0 25.4 28.8 -- -- --
Skagit 78.5 78.3 77.5 78.6 77.8 76.6 -- -- -- -- -- --
Snohomish -- -- -- -- -- -- -- -- -- 49.7 48.1 45.7
Spokane -- -- -- 61.7 60.6 65.3 -- -- -- -- -- --
-- Percentage is greater than 80%

APPENDIX J: ANNUAL DATA TABLES
WALLA WALLA COUNTY
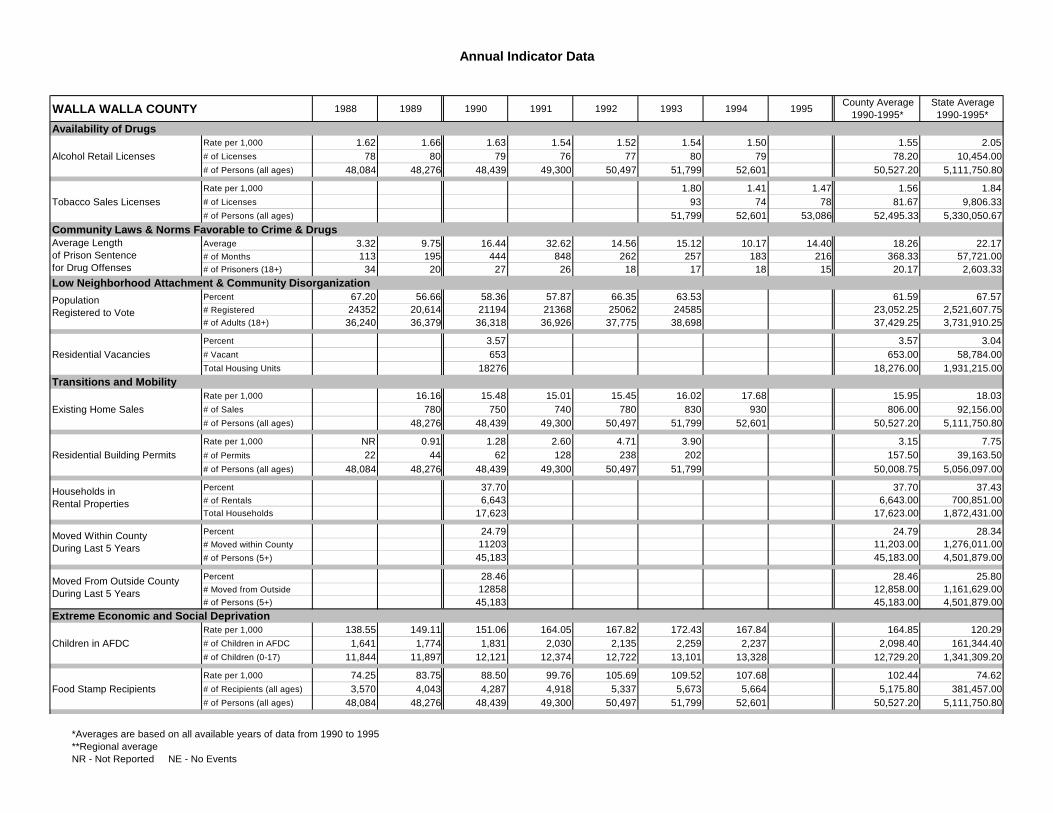
Annual Indicator Data
WALLA WALLA COUNTY 1988 1989 1990 1991 1992 1993 1994 1995County Average
1990-1995*State Average1990-1995*
Availability of DrugsRate per 1,000 1.62 1.66 1.63 1.54 1.52 1.54 1.50 1.55 2.05
Alcohol Retail Licenses # of Licenses 78 80 79 76 77 80 79 78.20 10,454.00# of Persons (all ages) 48,084 48,276 48,439 49,300 50,497 51,799 52,601 50,527.20 5,111,750.80
Rate per 1,000 1.80 1.41 1.47 1.56 1.84Tobacco Sales Licenses # of Licenses 93 74 78 81.67 9,806.33
# of Persons (all ages) 51,799 52,601 53,086 52,495.33 5,330,050.67Community Laws & Norms Favorable to Crime & Drugs
Average 3.32 9.75 16.44 32.62 14.56 15.12 10.17 14.40 18.26 22.17Average Length # of Months 113 195 444 848 262 257 183 216 368.33 57,721.00
# of Prisoners (18+) 34 20 27 26 18 17 18 15 20.17 2,603.33Low Neighborhood Attachment & Community Disorganization
Percent 67.20 56.66 58.36 57.87 66.35 63.53 61.59 67.57Population # Registered 24352 20,614 21194 21368 25062 24585 23,052.25 2,521,607.75
# of Adults (18+) 36,240 36,379 36,318 36,926 37,775 38,698 37,429.25 3,731,910.25
Percent 3.57 3.57 3.04Residential Vacancies # Vacant 653 653.00 58,784.00
Total Housing Units 18276 18,276.00 1,931,215.00Transitions and Mobility
Rate per 1,000 16.16 15.48 15.01 15.45 16.02 17.68 15.95 18.03Existing Home Sales # of Sales 780 750 740 780 830 930 806.00 92,156.00
# of Persons (all ages) 48,276 48,439 49,300 50,497 51,799 52,601 50,527.20 5,111,750.80
Rate per 1,000 NR 0.91 1.28 2.60 4.71 3.90 3.15 7.75Residential Building Permits # of Permits 22 44 62 128 238 202 157.50 39,163.50
# of Persons (all ages) 48,084 48,276 48,439 49,300 50,497 51,799 50,008.75 5,056,097.00
Percent 37.70 37.70 37.43Households in # of Rentals 6,643 6,643.00 700,851.00
Total Households 17,623 17,623.00 1,872,431.00
Percent 24.79 24.79 28.34Moved Within County # Moved within County 11203 11,203.00 1,276,011.00
# of Persons (5+) 45,183 45,183.00 4,501,879.00
Percent 28.46 28.46 25.80Moved From Outside County # Moved from Outside 12858 12,858.00 1,161,629.00
# of Persons (5+) 45,183 45,183.00 4,501,879.00Extreme Economic and Social Deprivation
Rate per 1,000 138.55 149.11 151.06 164.05 167.82 172.43 167.84 164.85 120.29Children in AFDC # of Children in AFDC 1,641 1,774 1,831 2,030 2,135 2,259 2,237 2,098.40 161,344.40
# of Children (0-17) 11,844 11,897 12,121 12,374 12,722 13,101 13,328 12,729.20 1,341,309.20
Rate per 1,000 74.25 83.75 88.50 99.76 105.69 109.52 107.68 102.44 74.62Food Stamp Recipients # of Recipients (all ages) 3,570 4,043 4,287 4,918 5,337 5,673 5,664 5,175.80 381,457.00
# of Persons (all ages) 48,084 48,276 48,439 49,300 50,497 51,799 52,601 50,527.20 5,111,750.80
Average Length of Prison Sentence for Drug Offenses
Population Registered to Vote
Households in Rental Properties
Moved Within County During Last 5 Years
Moved From Outside County During Last 5 Years
*Averages are based on all available years of data from 1990 to 1995**Regional averageNR - Not Reported NE - No Events
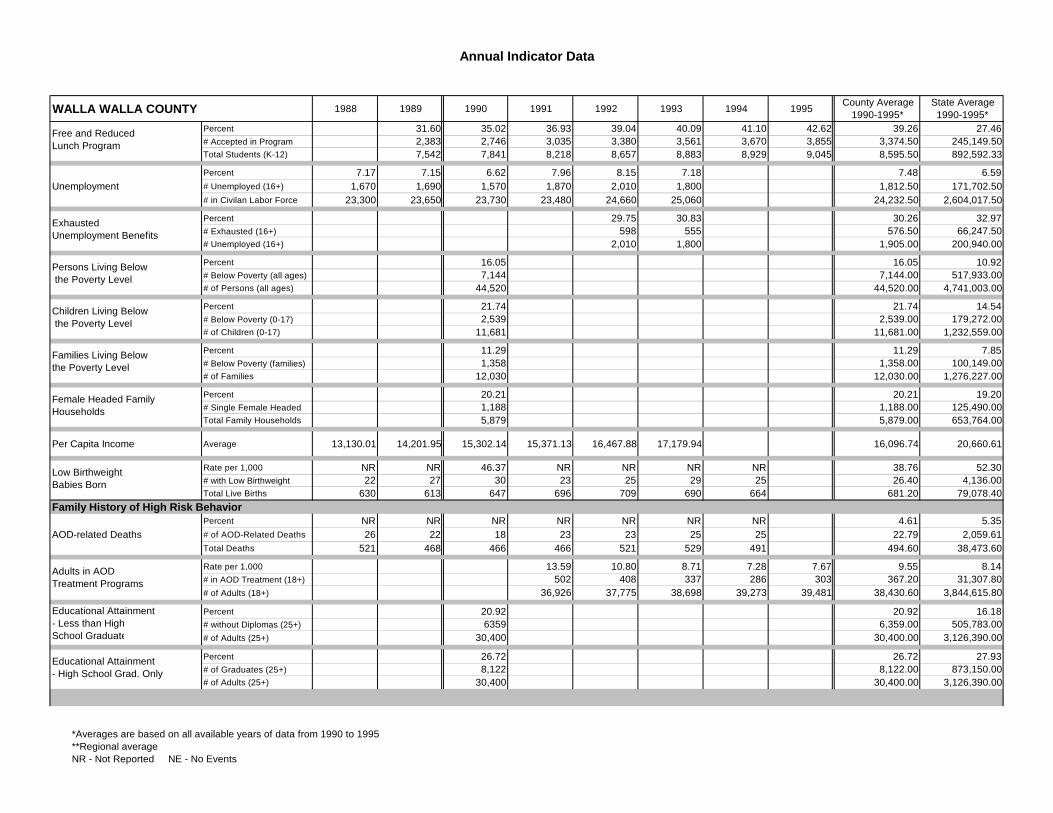
Annual Indicator Data
WALLA WALLA COUNTY 1988 1989 1990 1991 1992 1993 1994 1995County Average
1990-1995*State Average1990-1995*
Percent 31.60 35.02 36.93 39.04 40.09 41.10 42.62 39.26 27.46Free and Reduced # Accepted in Program 2,383 2,746 3,035 3,380 3,561 3,670 3,855 3,374.50 245,149.50
Total Students (K-12) 7,542 7,841 8,218 8,657 8,883 8,929 9,045 8,595.50 892,592.33
Percent 7.17 7.15 6.62 7.96 8.15 7.18 7.48 6.59Unemployment # Unemployed (16+) 1,670 1,690 1,570 1,870 2,010 1,800 1,812.50 171,702.50
# in Civilan Labor Force 23,300 23,650 23,730 23,480 24,660 25,060 24,232.50 2,604,017.50
Percent 29.75 30.83 30.26 32.97Exhausted # Exhausted (16+) 598 555 576.50 66,247.50
# Unemployed (16+) 2,010 1,800 1,905.00 200,940.00
Percent 16.05 16.05 10.92Persons Living Below # Below Poverty (all ages) 7,144 7,144.00 517,933.00
# of Persons (all ages) 44,520 44,520.00 4,741,003.00
Percent 21.74 21.74 14.54Children Living Below # Below Poverty (0-17) 2,539 2,539.00 179,272.00
# of Children (0-17) 11,681 11,681.00 1,232,559.00
Percent 11.29 11.29 7.85Families Living Below # Below Poverty (families) 1,358 1,358.00 100,149.00
# of Families 12,030 12,030.00 1,276,227.00
Percent 20.21 20.21 19.20Female Headed Family # Single Female Headed 1,188 1,188.00 125,490.00
Total Family Households 5,879 5,879.00 653,764.00
Per Capita Income Average 13,130.01 14,201.95 15,302.14 15,371.13 16,467.88 17,179.94 16,096.74 20,660.61
Rate per 1,000 NR NR 46.37 NR NR NR NR 38.76 52.30Low Birthweight # with Low Birthweight 22 27 30 23 25 29 25 26.40 4,136.00
Total Live Births 630 613 647 696 709 690 664 681.20 79,078.40Family History of High Risk Behavior
Percent NR NR NR NR NR NR NR 4.61 5.35AOD-related Deaths # of AOD-Related Deaths 26 22 18 23 23 25 25 22.79 2,059.61
Total Deaths 521 468 466 466 521 529 491 494.60 38,473.60
Rate per 1,000 13.59 10.80 8.71 7.28 7.67 9.55 8.14Adults in AOD # in AOD Treatment (18+) 502 408 337 286 303 367.20 31,307.80
# of Adults (18+) 36,926 37,775 38,698 39,273 39,481 38,430.60 3,844,615.80
Percent 20.92 20.92 16.18Educational Attainment # without Diplomas (25+) 6359 6,359.00 505,783.00
# of Adults (25+) 30,400 30,400.00 3,126,390.00
Percent 26.72 26.72 27.93Educational Attainment # of Graduates (25+) 8,122 8,122.00 873,150.00
# of Adults (25+) 30,400 30,400.00 3,126,390.00
Free and Reduced Lunch Program
Exhausted Unemployment Benefits
Persons Living Below the Poverty Level
Children Living Below the Poverty Level
Families Living Below the Poverty Level
Female Headed Family Households
Low Birthweight Babies Born
Adults in AOD Treatment Programs
Educational Attainment- Less than HighSchool Graduate
Educational Attainment- High School Grad. Only
*Averages are based on all available years of data from 1990 to 1995**Regional averageNR - Not Reported NE - No Events

Annual Indicator Data
WALLA WALLA COUNTY 1988 1989 1990 1991 1992 1993 1994 1995County Average
1990-1995*State Average1990-1995*
Rate per 100,000 NR NR 74.32 77.08 NR NR NR 60.17 95.31Prisoners in State Correctional # of Admissions (18+) 17 26 36 38 23 28 27 30.40 4,872.00
# of Persons (all ages) 48,084 48,276 48,439 49,300 50,497 51,799 52,601 50,527.20 5,111,750.80Family Management Problems
Rate per 1,000 91.35 91.35 73.90Children Living # Living Away (0-17) 1,098 1,098.00 93,219.00
# of Children (0-17) 12,020 12,020.00 1,261,387.00
Rate per 1,000 23.15 19.60 17.69 16.72 14.71 18.27 12.87Children Placed in Foster Care # with Foster Family (0-17) 278 242 225 219 196 232.16 17,242.87
# of Children (0-17) 12,020 12,374 12,722 13,101 13,328 12,709.00 1,340,123.60
Rate per 1,000 59.96 90.39 94.34 81.78 90.33 83.63 61.54Victims in Reported # of Reported Victims 742 1,150 1,236 1,090 1,229 1,089.40 84,726.40
# of Children (0-17) 12,374 12,722 13,101 13,328 13,605 13,026.00 1,376,796.40
Rate per 1,000 44.93 75.77 64.35 53.65 64.98 60.83 41.74Victims in Accepted # of Accepted Victims 556 964 843 715 884 792.40 57,470.40
# of Children (0-17) 12,374 12,722 13,101 13,328 13,605 13,026.00 1,376,796.40Family Conflict
Rate per 1,000 7.26 8.07 7.62 7.18 6.28 7.28 7.54Divorce # of Divorces 268 305 295 282 248 279.60 28,978.80
# of Persons (18+) 36,926 37,775 38,698 39,273 39,481 38,430.60 3,844,615.80
Percent 25.33 25.33 24.72Single Parent # Single Parent Headed 1,489 1,489.00 161,603.00
Total Family Households 5,879 5,879.00 653,764.00
Rate per 1,000 1.60 3.24 2.81 3.79 3.39 3.75 3.97 3.55 4.80Domestic Violence Arrests # of Arrests 58 118 102 140 128 145 156 134.20 18,110.00
# of Adults (18+) 36,240 36,379 36,318 36,926 37,775 38,698 39,273 37,798.00 3,770,441.60Favorable Parental Attitudes and Involvement in Crime and Drugs
Percent NR NR NR NR NR NR NR 48.02Alcohol-related # Alcohol-related 3 2 7 4 8 8 5.80 332.20
Total Traffic Fatalities 8 7 14 8 15 12 11.20 691.80
Rate per 1,000 4.52 4.23 6.67 8.09 5.93 6.89Adult Drunken Driving Arrests # of Arrests (18+) 160 153 247 313 218.25 23,857.75
# of Adults (18+) 35,404 36,201 37,036 38,698 36,834.75 3,461,385.50
Rate per 1,000 6.69 6.22 9.18 10.10 8.10 12.03Adult Alcohol-related Arrests # of Arrests (18+) 237 225 340 391 298.25 41,646.25
# of Adults (18+) 35,404 36,201 37,036 38,698 36,834.75 3,461,385.50
Rate per 1,000 2.40 1.60 2.11 2.66 2.20 3.96Adult Drug-related Arrests # of Arrests (18+) 85 58 78 103 81.00 13,701.25
# of Adults (18+) 35,404 36,201 37,036 38,698 36,834.75 3,461,385.50
Prisoners in State Correctional Systems
Victims in ReportedChild Abuse andNeglect Referrals
Victims in AcceptedChild Abuse andNeglect Referrals
Children Living Away from Parents
Single Parent Family Households
Alcohol-related Traffic Fatalities
*Averages are based on all available years of data from 1990 to 1995**Regional averageNR - Not Reported NE - No Events
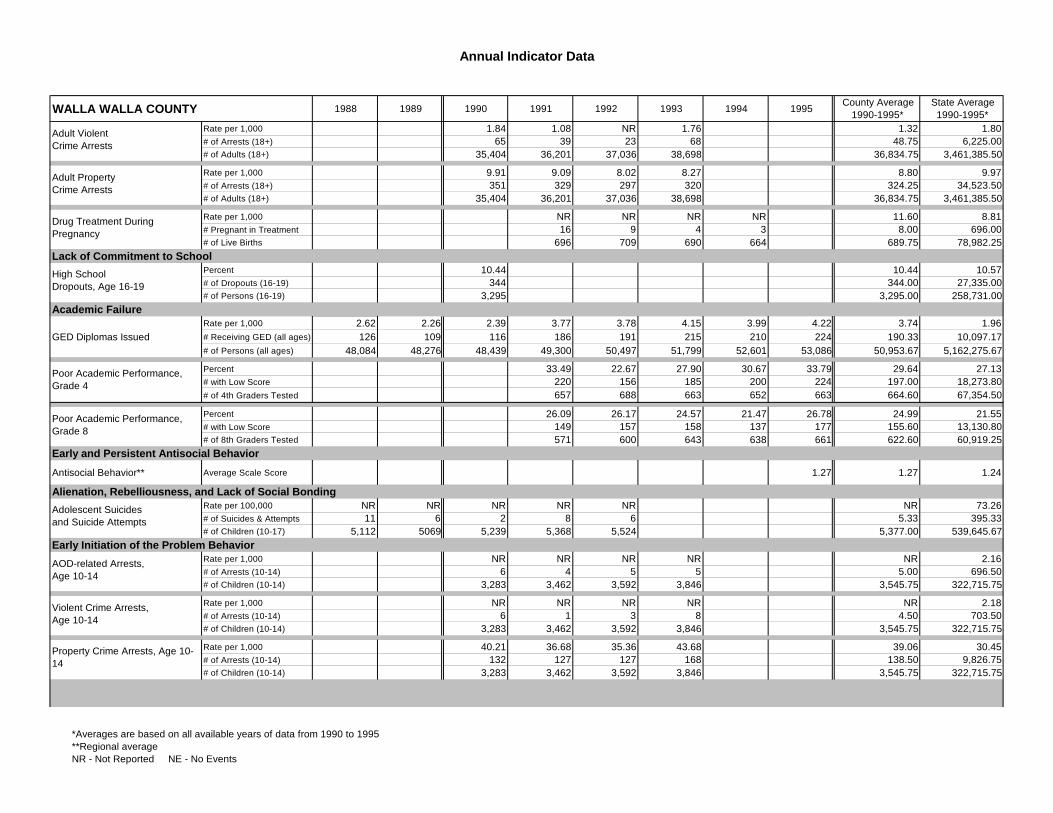
Annual Indicator Data
WALLA WALLA COUNTY 1988 1989 1990 1991 1992 1993 1994 1995County Average
1990-1995*State Average1990-1995*
Rate per 1,000 1.84 1.08 NR 1.76 1.32 1.80Adult Violent # of Arrests (18+) 65 39 23 68 48.75 6,225.00
# of Adults (18+) 35,404 36,201 37,036 38,698 36,834.75 3,461,385.50
Rate per 1,000 9.91 9.09 8.02 8.27 8.80 9.97Adult Property # of Arrests (18+) 351 329 297 320 324.25 34,523.50
# of Adults (18+) 35,404 36,201 37,036 38,698 36,834.75 3,461,385.50
Rate per 1,000 NR NR NR NR 11.60 8.81Drug Treatment During # Pregnant in Treatment 16 9 4 3 8.00 696.00
# of Live Births 696 709 690 664 689.75 78,982.25Lack of Commitment to School
Percent 10.44 10.44 10.57High School # of Dropouts (16-19) 344 344.00 27,335.00
# of Persons (16-19) 3,295 3,295.00 258,731.00Academic Failure
Rate per 1,000 2.62 2.26 2.39 3.77 3.78 4.15 3.99 4.22 3.74 1.96GED Diplomas Issued # Receiving GED (all ages) 126 109 116 186 191 215 210 224 190.33 10,097.17
# of Persons (all ages) 48,084 48,276 48,439 49,300 50,497 51,799 52,601 53,086 50,953.67 5,162,275.67
Percent 33.49 22.67 27.90 30.67 33.79 29.64 27.13Poor Academic Performance, # with Low Score 220 156 185 200 224 197.00 18,273.80
# of 4th Graders Tested 657 688 663 652 663 664.60 67,354.50
Percent 26.09 26.17 24.57 21.47 26.78 24.99 21.55Poor Academic Performance, # with Low Score 149 157 158 137 177 155.60 13,130.80
# of 8th Graders Tested 571 600 643 638 661 622.60 60,919.25Early and Persistent Antisocial Behavior
Antisocial Behavior** Average Scale Score 1.27 1.27 1.24
Alienation, Rebelliousness, and Lack of Social Bonding Rate per 100,000 NR NR NR NR NR NR 73.26Adolescent Suicides # of Suicides & Attempts 11 6 2 8 6 5.33 395.33
# of Children (10-17) 5,112 5069 5,239 5,368 5,524 5,377.00 539,645.67Early Initiation of the Problem Behavior
Rate per 1,000 NR NR NR NR NR 2.16AOD-related Arrests, # of Arrests (10-14) 6 4 5 5 5.00 696.50
# of Children (10-14) 3,283 3,462 3,592 3,846 3,545.75 322,715.75
Rate per 1,000 NR NR NR NR NR 2.18Violent Crime Arrests, # of Arrests (10-14) 6 1 3 8 4.50 703.50
# of Children (10-14) 3,283 3,462 3,592 3,846 3,545.75 322,715.75
Rate per 1,000 40.21 36.68 35.36 43.68 39.06 30.45Property Crime Arrests, # of Arrests (10-14) 132 127 127 168 138.50 9,826.75
# of Children (10-14) 3,283 3,462 3,592 3,846 3,545.75 322,715.75
Adult Violent Crime Arrests
Adult Property Crime Arrests
Drug Treatment During Pregnancy
High School Dropouts, Age 16-19
Poor Academic Performance, Grade 4
Poor Academic Performance, Grade 8
AOD-related Arrests, Age 10-14
Violent Crime Arrests, Age 10-14
Property Crime Arrests, Age 10-14
Adolescent Suicides and Suicide Attempts
*Averages are based on all available years of data from 1990 to 1995**Regional averageNR - Not Reported NE - No Events
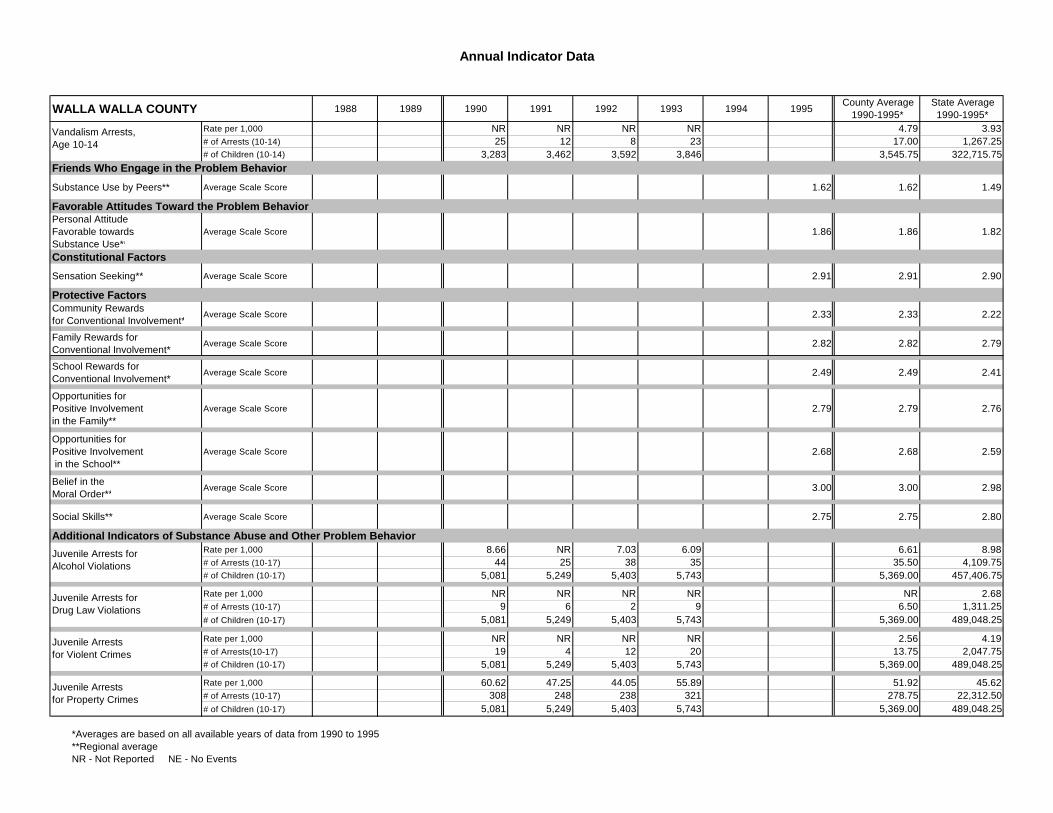
Annual Indicator Data
WALLA WALLA COUNTY 1988 1989 1990 1991 1992 1993 1994 1995County Average
1990-1995*State Average1990-1995*
Rate per 1,000 NR NR NR NR 4.79 3.93Vandalism Arrests, # of Arrests (10-14) 25 12 8 23 17.00 1,267.25
# of Children (10-14) 3,283 3,462 3,592 3,846 3,545.75 322,715.75Friends Who Engage in the Problem Behavior
Substance Use by Peers** Average Scale Score 1.62 1.62 1.49
Favorable Attitudes Toward the Problem BehaviorPersonal AttitudeFavorable towardsSubstance Use**
Average Scale Score 1.86 1.86 1.82
Constitutional Factors
Sensation Seeking** Average Scale Score 2.91 2.91 2.90
Protective FactorsCommunity Rewards for Conventional Involvement**
Average Scale Score 2.33 2.33 2.22
Family Rewards for Conventional Involvement**
Average Scale Score 2.82 2.82 2.79
School Rewards forConventional Involvement**
Average Scale Score 2.49 2.49 2.41
Opportunities for Positive Involvementin the Family**
Average Scale Score 2.79 2.79 2.76
Opportunities for Positive Involvement in the School**
Average Scale Score 2.68 2.68 2.59
Belief in the Moral Order**
Average Scale Score 3.00 3.00 2.98
Social Skills** Average Scale Score 2.75 2.75 2.80
Additional Indicators of Substance Abuse and Other Problem BehaviorRate per 1,000 8.66 NR 7.03 6.09 6.61 8.98
Juvenile Arrests for # of Arrests (10-17) 44 25 38 35 35.50 4,109.75# of Children (10-17) 5,081 5,249 5,403 5,743 5,369.00 457,406.75
Rate per 1,000 NR NR NR NR NR 2.68Juvenile Arrests for # of Arrests (10-17) 9 6 2 9 6.50 1,311.25
# of Children (10-17) 5,081 5,249 5,403 5,743 5,369.00 489,048.25
Rate per 1,000 NR NR NR NR 2.56 4.19Juvenile Arrests # of Arrests(10-17) 19 4 12 20 13.75 2,047.75
# of Children (10-17) 5,081 5,249 5,403 5,743 5,369.00 489,048.25
Rate per 1,000 60.62 47.25 44.05 55.89 51.92 45.62Juvenile Arrests # of Arrests (10-17) 308 248 238 321 278.75 22,312.50
# of Children (10-17) 5,081 5,249 5,403 5,743 5,369.00 489,048.25
Vandalism Arrests, Age 10-14
Juvenile Arrests for Alcohol Violations
Juvenile Arrests for Drug Law Violations
Juvenile Arrests for Violent Crimes
Juvenile Arrests for Property Crimes
*Averages are based on all available years of data from 1990 to 1995**Regional averageNR - Not Reported NE - No Events

Annual Indicator Data
WALLA WALLA COUNTY 1988 1989 1990 1991 1992 1993 1994 1995County Average
1990-1995*State Average1990-1995*
Rate per 1,000 12.40 8.19 NR 9.40 8.57 7.31Juvenile Arrests for # of Arrests (10-17) 63 43 24 54 46.00 3,573.25
# of Children (10-17) 5,081 5,249 5,403 5,743 5,369.00 489,048.25
Rate per 1,000 19.37 17.75 13.55 20.86 19.91 25.07 16.63 17.52 18.95 24.47Guilty Adjudications # of Adjudications (0-17) 99 90 71 112 110 144 98 108 107.17 13,949.67
# of Children (10-17) 5,112 5,069 5,239 5,368 5,524 5,743 5,894 6,166 5,655.67 569,980.17
Rate per 1,000 44.01 36.10 48.29 56.45 44.90 53.80 47.85 70.55 53.93 34.19Juveniles Diversions # of Placements (0-17) 225 183 253 303 248 309 282 435 305.00 19,484.83
# of Children (10-17) 5,112 5,069 5,239 5,368 5,524 5,743 5,894 6,166 5,655.67 569,980.17
Rate per 1,000 11.18 5.97 7.14 NR NR 6.31 6.66Adolescents in # in Treatment (10-17) 60 33 41 23 24 36.20 3,859.00
# of Children (10-17) 5,368 5,524 5,743 5,894 6,166 5,739.00 579,509.40
Rate per 1,000 3.46 2.76 3.10 3.10 3.66Adolescent Sexually # of Cases (0-19) 51 42 48 47.00 5,562.00
# of Persons (0-19) 14,758 15,203 15,500 15,153.67 1,520,142.67
Rate per 1,000 13.30 12.24 14.94 17.67 17.58 15.84 17.90 16.81 11.45Birthrate Among Adolescents # of Births 33 30 38 46 47 44 51 45.20 3,106.20
# of Females (10-17) 2,482 2,451 2,544 2,603 2,674 2,777 2,849 2,689.40 271,209.60
Guilty Adjudications of Juveniles
Adolescents in AOD Treatment
Juvenile Arrests forCurfew, Loitering,Vandalism, & Disorderly
Adolescent Sexually Transmitted Diseases
*Averages are based on all available years of data from 1990 to 1995**Regional averageNR - Not Reported NE - No Events